Occupational prestige and the 1980 U.S. labor force
32
SOCIAL SCIENCE RESEARCH 16, 74-105 (1987) Occupational Prestige and the 1980 U.S. Labor Force GILLIAN STEVENS AND ELIZABETH HOISINGTON Department of Sociology, University of Illinois, Urbana-Champaign Between 1970 and 1980, there was a large increase in the proportion of female workers, a modest decline in occupational sex segregation, and radical changes in the sex composition of particular occupations. In this paper, we investigate whether or not these changes have been accompanied by changes in the occupational prestige characteristics of male vis-a-vis female workers in the U.S. labor force. Because the U.S. census bureau changed its occupational coding scheme between 1970 and 1980, we first reconcile the occupational prestige measures available for 1970 occupational codes with 1980 occupational codes. The results show that occupations dominated by women largely remain confined to the lower two- thirds of the occupational prestige hierarchy. However, because of the tendency of women to be employed in the more prestigious of the female-dominated occupations and men to be employed in the less prestigious of the male-dominated occupations, the prestige characteristics of men and women in the 1980 labor force are ahOSt eqUktkUt. 0 1987 Academic Press, Inc. Because occupations are the primary source of earnings, power, and other forms of ranked social privileges, the occupational hierarchy is a major basis of social stratification in modern societies. As a result, per- ceptions of the positions of occupations in the occupational hierarchy, whether fully based on objective characteristics or not, have real con- sequences for how persons perceive themselves, and perceive and treat others. Agreement about occupations’ relative prestige rankings is generally considered to be high within the general population and relative levels of occupational prestige appear to be quite stable over time and across country (Hodge et al., 1964; Treiman, 1977; but see Haller and Bills, 1979). Measures of occupational prestige and its derivative, socioeconomic status, which are based on subjective evaluations of occupations, are We thank Barbara Reskin, Gray Swicegood, and two anonymous reviewers for helpful comments, Joo Hyun Cho for preliminary work on the appendix, and the University of Illinois Research Board for research support. Address requests for reprints and correspondence to Gillian Stevens, Department of Sociology, University of Illinois, 702 S. Wright St., Urbana, IL 61801. 74 0049-089x/87 $3 .OO Copyi& @ 1987 by Academic F’ress, Inc. All rights of reproduction in any form reserved.
-
Upload
independent -
Category
Documents
-
view
2 -
download
0
Transcript of Occupational prestige and the 1980 U.S. labor force

SOCIAL SCIENCE RESEARCH 16, 74-105 (1987)
Occupational Prestige and the 1980 U.S. Labor Force
GILLIAN STEVENS AND ELIZABETH HOISINGTON
Department of Sociology, University of Illinois, Urbana-Champaign
Between 1970 and 1980, there was a large increase in the proportion of female workers, a modest decline in occupational sex segregation, and radical changes in the sex composition of particular occupations. In this paper, we investigate whether or not these changes have been accompanied by changes in the occupational prestige characteristics of male vis-a-vis female workers in the U.S. labor force. Because the U.S. census bureau changed its occupational coding scheme between 1970 and 1980, we first reconcile the occupational prestige measures available for 1970 occupational codes with 1980 occupational codes. The results show that occupations dominated by women largely remain confined to the lower two- thirds of the occupational prestige hierarchy. However, because of the tendency of women to be employed in the more prestigious of the female-dominated occupations and men to be employed in the less prestigious of the male-dominated occupations, the prestige characteristics of men and women in the 1980 labor force are ahOSt eqUktkUt. 0 1987 Academic Press, Inc.
Because occupations are the primary source of earnings, power, and other forms of ranked social privileges, the occupational hierarchy is a major basis of social stratification in modern societies. As a result, per- ceptions of the positions of occupations in the occupational hierarchy, whether fully based on objective characteristics or not, have real con- sequences for how persons perceive themselves, and perceive and treat others. Agreement about occupations’ relative prestige rankings is generally considered to be high within the general population and relative levels of occupational prestige appear to be quite stable over time and across country (Hodge et al., 1964; Treiman, 1977; but see Haller and Bills, 1979). Measures of occupational prestige and its derivative, socioeconomic status, which are based on subjective evaluations of occupations, are
We thank Barbara Reskin, Gray Swicegood, and two anonymous reviewers for helpful comments, Joo Hyun Cho for preliminary work on the appendix, and the University of Illinois Research Board for research support. Address requests for reprints and correspondence to Gillian Stevens, Department of Sociology, University of Illinois, 702 S. Wright St., Urbana, IL 61801.
74 0049-089x/87 $3 .OO Copyi& @ 1987 by Academic F’ress, Inc. All rights of reproduction in any form reserved.

OCCUPATIONAL PRESTIGE 75
thus widely used measures of workers’ relative positions in the occupational structure and thus in society.
Despite high levels of occupational sex segregation in the early 1970s (e.g., England, 1981), the occupational prestige of female workers was, on average, equivalent to that of male workers (England, 1979). Yet the prestige characteristics of occupations differed according to whether the occupation was dominated by male or female workers and furthermore, there were no female-dominated occupations found in the higher portion of the occupational prestige hierarchy (Bose and Rossi, 1983). It thus appears that patterns of occupational sex segregation in the early 1970s operated to distribute men and women among male-dominated and female- dominated occupations of varying prestige in such a way as to produce an apparent equality between the sexes with respect to occupational prestige.
During the last decade, the character of the U.S. labor force has changed markedly. The percentage of female workers increased (U.S. Department of Commerce, 1984), the number of male-dominated occu- pations declined (Rytina and Bianchi, 1984), and there was a modest decline in overall levels of sex segregation (Beller, 1984; Bianchi and Rytina, 1986) accompanied by some radical changes in the sex composition of particular occupations (Reskin and Roos, 1987). The major purpose of this paper is to assess whether these changes were accompanied by changes in the relative prestige of male and female workers and of male- dominated and female-dominated occupations. Because the U.S. census bureau radically changed its occupational coding scheme between 1970 and 1980, measures of occupational prestige currently available for 1970 occupational titles cannot be applied directly to 1980 occupational titles. We therefore also describe the procedures used to reconcile prestige scores for 1970 occupational titles with 1980 census occupational titles.
THE MEASUREMENT OF OCCUPATIONAL PRESTIGE
Measures of occupational prestige assume that the general public per- ceives the occupation structure as having at least one vertical dimension. Occupational prestige is thus often measured by having respondents rank or rate a sample of occupational titles with respect to the occupation’s “general standing” (e.g., Reiss, 1961), “social standing” (e.g., Bose, 1973; Jacobs and Powell, 1985), or some close variant thereof. Exactly what or how many distinct vertical dimensions respondents use in these ranking tasks is, however, still unclear. Treiman (1977) argues, for example, that occupational prestige rankings reflect the differing social privileges accruing to each occupation as the result of the division of labor. Thus “occupational prestige” and “social standing” are synonymous terms. Others argue that prestige rankings reflect synthetic or averaged judgments about the “general goodness” or “social desirability” of occupations

76 STEVENS AND HOISINGTON
(e.g., Featherman and Hauser, 1976) and that these judgments are not only averaged over respondents but also over varying criteria, e.g., the occupation’s value to society (Grasmick, 1976) or functional importance (Siegel, 1971); complexity of job tasks (Parcel and Mueller, 1983); its rewards, in particular, earnings (Hope, 1982); and the workers’ qualifi- cations, standard of living, and power rankings (Goldthorpe and Hope, 1974). Despite the lack of consensus among social scientists about the dimensions underlying occupational prestige, prestige rankings are, for the most part, remarkably stable across respondents in surveys fielded in various countries and U. S. regions and at various times (Hodge et al., 1965; Reiss, 1961; Siegel, 1971; Treiman, 1977; for exceptions see Bose and Rossi, 1983; Haller and Bills, 1979; Guppy and Goyder, 1984).
Although occupational prestige rankings are ultimately comparative in nature, it is impossible for respondents to rank more than a relatively small subset of occupations at any one time because of respondent fatigue. For example, Bose’s (1973) study of the effects of the sex of both raters and occupational incumbents on occupations’ prestige ratings included only 108 occupations-the maximum number ever used. There have been two major ways of dealing with the problem of generating comparative prestige rankings for a more complete set of occupations. The first is to construct proxy prestige scores-or socioeconomic scores-on the basis of the high correlations between occupational prestige and occupations’ objective characteristics, in particular, the incumbents’ education and earnings. Duncan (1961), for example, regressed prestige ratings on the proportion of male incumbents with more than a certain level of income and of education for a selected set of occupations with prestige ratings. He then used the regression weights to generate estimated prestige scores, commonly referred to as socioeconomic scores, for all 1960 census oc- cupational titles. Stevens and Featherman (1981) used a similar approach with more recent data on levels of occupational prestige, education, and earnings to generate socioeconomic scores for 1970 census occupational titles. These socioeconomic scores were subsequently reconciled with 1980 census occupational titles (Stevens and Cho, 1985).
A second way to generate prestige rankings for a more complete set of occupations is to combine information from several distinct prestige surveys. Siegel (1971), for example, transformed prestige ratings from three national surveys fielded by the National Opinion Research Center in 1%3, 1964, and 1965 into a common metric by using regression techniques to establish the relationship between prestige rankings for the occupations ranked in more than one of the surveys. These NORC prestige ratings were subsequently reconciled with 1970 census occupational titles (Hauser and Featherman, 1977).
Although the intent of these two approaches is the same-the con- struction Of occupational status scores for a complete set of occupation-

OCCUPATIONAL PRESTIGE 77
and the correlation between prestige and socioeconomic scales is very high (Stevens and Feather-man, 1981: Table 2), prestige and socioeconomic scales differ in some major respects. Socioeconomic scores for “Farm Managers” and “Farm Owners,” for example, are generally much lower than the prestige ratings for these occupations. Because of such dis- crepancies, prestige and socioeconomic scales often yield differing con- clusions in studies of occupational status attainment (e.g., Stevens and Featherman, 1981; Treas and Tyree, 1979). As a result, occupational socioeconomic scales cannot be regarded as a substitute for occupational prestige scales (Hodge, 1981).’ In this study we therefore rely on the NORC prestige scale, which was constructed by linking together oc- cupational prestige ratings from several prestige surveys. However, the currently available NORC prestige ratings pertain to 1970 census oc- cupational titles. Because the U.S. census bureau changed its occupational classification scheme between 1970 and 1980, it is first necessary to reconcile these prestige scores with 1980 census occupational titles before it is possible to investigate the prestige characteristics of men and women and of male-dominated and female-dominated occupations in the 1980 U.S. labor force.
THE RECONCILIATION OF PRESTIGE RANKINGS FOR 1970 OCCUPATIONAL TITLES WITH 1980 TITLES
The census occupational classificatory scheme was changed between 1970 and 1980 to facilitate comparability in occupational data generated by governmental agencies (Priebe, 1980). Previous intercensual revisions were primarily motivated by interest in greater detail, thus allowing, for the most part, relatively easy intercensual comparisons. But the 1980 census occupational classification scheme is a radical departure from the 1970 classification scheme. Not only is there a larger number of detailed occupations (503 versus 440) and a larger number of occupational groupings (13 versus 12), but the major occupational groupings differ in composition. Many occupational categories were disaggregated such that the segments appear in different major groupings. For example, the 1970 title “computer programmers” in the 1970 major group “professional” reappears in the 1980 scheme as “computer systems analysts and scientists” in the major group “managerial and professional specialty” and as “computer pro-
’ In studies of intergenerational occupational mobility, occupational socioeconomic scales explain more variance than prestige scales (e.g., Stevens and Featherman, 1981; Tress and Tyree, 1979). However, this empirical advantage of socioeconomic scales is accompanied by some disadvantages. For example, socioeconomic scales are, by construction, dependent on incumbents’ characteristics, and choices concerning what characteristics and how to measure them are guided by a mixture of precedent and empirical criteria. Furthermore, it is unclear exactly what socioeconomic scales actually measure: “estimated” occupational prestige is not the only alternative (Hodge, 1981).

78 STEVENS AND HOISINGTON
grammers” in the major group “technical, sales, and administrative support.”
A link between the 1970 and 1980 occupational classificatory schemes is provided by a sex-specific cross classification of 1970 by 1980 codes for the occupational activities of a sample of approximately 114,000 persons in the 1970 experienced civilian labor force (U.S. Department of Commerce, 1982). In this matrix, each of the 1980 occupational codes has a specific number of 1970 occupational component codes with nonzero frequencies.’ For example, 1980 Code 006 (Administrators, protective service), has two components: 1970 Code %I (Firemen and fire protection) and 1970 code 964 (Policemen and detectives).3
In this matrix, about 33% of the 1980 occupational titles correspond to a single 1970 code (although not necessarily vice versa) and in about two-thirds of the 1980 codes, over 90% of the workers can be traced to a single 1970 category. However, only 71 of the 1970 and 1980 codes bear a one-to-one correspondence, i.e., only 14% of the 1980 codes are direct and sole carry-overs from the 1970 occupational scheme. As a result, we could not directly assign prestige ratings from 1970 occupational codes to 1980 occupational codes. Instead, we estimated the prestige ratings for each of its 1970 components weighted by the size of the 1970 component category:
PRESTIGEi = Zj PRESTIGEj X Pij
The prestige ratings for 1970 occupational codes (PRESTIGEJ are from Siegel’s (1971) study as reported in Featherman et al. (1975). Pij refers to the proportion of workers in 1980 category “i” whose occupational activities were coded in 1970 occupational code “j”.
For seven of the eight “missing” 1980 occupational codes, we estimated prestige ratings by averaging the prestige ratings for 1980 occupational codes in the same minor category. (The codes used in this averaging are noted in the appendix.) For the eighth missing 1980 occupation (code 004), we assigned the prestige rating for 1970 code 222 because Bianchi and Rytina (1984) indicated that this code was the sole 1970 component.
* Obtained from J. Priebe, Labor Force Statistics Branch, Bureau of the Census. See Bianchi and Rytina (1984) for a full listing of the principal components for each 1980 code and Rytina and Bianchi (1984) and Stevens and Cho (1985) for a fuller discussion of the attributes of this matrix.
3 Some 1970 and 1980 codes were not present. Most of the 1970 “allocated” categories were reassigned to a 1970 code, and most of the “apprentice” categories were reassigned to the appropriate trade. In addition, six other 1970 codes, mostly “miscellaneous” and “not elsewhere classified,” do not appear in the matrix. Presumably they were recoded into other 1970 categories or were omitted because they were not represented in the sample data. Eight 1980 codes are also not represented. All of these are, however, numericzdly very small and represent less than 1% of the 1980 labor force (U.S. Department of Commerce, 1984). See Stevens and Cho (1985) for a listing of the missing codes.

OCCUPATIONAL PRESTIGE 79
Prestige ratings for all 1980 occupational codes are provided in the Appendix.
PRESTIGE RATINGS FOR 1980 OCCUPATIONAL TITLES
Summary characteristics of prestige ratings for all 1980 occupations are presented in Table 1. Because of the weighted averaging used to reconcile the original prestige ratings with 1980 codes, the range of prestige scores has been slightly truncated: 14.7-81.1 for all 1980 occupations versus 9.3-81.2 for all 1970 occupations.4 Nevertheless, the standard deviations of the 1970 and 1980 prestige ratings are comparable: 15.4 versus 16.0.
The American labor force is, however, highly segregated by sex. Women are heavily overrepresented in certain occupations (Bianchi and Rytina, 1986) and major occupational groupings (U.S. Department of Commerce, 1984). Table 1 thus also shows the means, standard deviations, and ranges of prestige ratings for occupations in which one or the other sex is over-represented using two different criteria. Occupations were first des- ignated as “male” or “female” occupations if over 90% of the workers in 1980 were male or female, respectively. Occupations were then des- ignated “sex-neutral” if the percentage of female workers was within 10 percentage points of 42.7% (the overall percentage of female workers in the employed labor force); ‘ ‘female-dominated” if the percentage of female workers was greater than 52.7%; or as “male-dominated” if the percentage of female workers was less than 32.7%.
When considering the prestige characteristics of “female” or “male” occupations, i.e., the subset of occupations very heavily dominated by one or the other sex, it is evident that there is a much lower ceiling on the prestige of women’s occupations than on men’s occupations. With a prestige scale that runs from about 15 to 80, women’s occupations are confined to the lower two-thirds of the scale: 19 to 61. Men’s occupations, on the other hand, are found throughout almost the entire range. This particular result parallels one of the major results in Bose and Rossi’s (1983) study based on earlier data. In contrast to Bose and Rossi’s (1983) conclusions, however, the mean prestige ratings of occupations heavily dominated by men or women are about the same, This discrepancy may be attributable to their smaller sample of occupations, in particular, of male-dominated occupations.
When considering the prestige characteristics of occupations classified as “female-dominated,” “sex-neutral,” or “male-dominated,” Table 1 shows that femaledominated occupations are, on average, less prestigious than male-dominated or sex-neutral occupations. The range of prestige
4 Characteristics of the 1970 prestige ratings are from Stevens and Featherman (1981, Table 2).

80 STEVENS AND HOISINGTON
TABLE 1 Prestige Characteristics of Female-Dominated, Sex-Neutral, and Male-Dominated
Occupations, 1980
Prestige ratings
Percentage Standard female n Mean deviation Range
I. Female occupations HO.0 22 41.37 12.63 18.50-61.00 I. Male occupations <lO.O 162 39.53 12.85 17.49-78.03
II. Female dominated >.52.5 124 38.16 13.24 16.10-78.30 II. Sex neutral -42.5 84 44.55 17.22 14.69-78.30 II. Male dominated c32.5 295 41.83 15.66 15.31-81.09 All Occupations 42.5 503 41.38 15.57 14.69-81.09
Note. Occupations are defined as sex-neutral if the percentage of female workers is within 10% of 42.5% (the overall percentage of female workers in the 1980 labor force). Data on occupations’ sex composition is from U.S. Department of Commerce (1983).
for female-dominated occupations, however, appears to be much wider than when considering occupations that were very heavily dominated by women. But the apparent removal of the ceiling on the prestige of women’s occupations is attributable to a very small cluster of occupations comprised of postsecondary teachers of various subjects, e.g., Social Work teachers. This small cluster can be clearly seen near the top of Fig. 1, which graphs the prestige levels of male-dominated and female-dominated occupations. It is also easy to see from Fig. 1 that apart from this small cluster, the 123 female-dominated occupations, like the 22 female occupations, are still confined to the bottom two-thirds of the prestige hierarchy.
THE OCCUPATIONAL PRESTIGE OF MEN AND WOMEN IN THE 1980 U.S. LABOR FORCE
The occupational prestige characteristics of men and women are a product of the occupational-specific prestige ratings, the sex composition of occupations, and the relative sizes of the occupations. Several of the female-dominated occupations are quite large. About 9% of women in the 1980 labor force, for example, are employed as secretaries; about 3% are employed as registered nurses (U.S. Department of Commerce, 1984). Because these two occupations have relatively high prestige ratings, 45.8 and 59.9, respectively, the mean prestige of women workers is slightly higher than the mean (unweighted) prestige of female-dominated occupations (see Table 2). The larger male-dominated occupations, on the other hand, tend to be characterized by relatively low prestige ratings. The occupations “Truck Drivers, Heavy” and “Carpenters,” which jointly employ about 5.2% of the male labor force, have prestige ratings of 32.1 and 35.6, respectively. As a result, the mean prestige of working men

OCCUPATIONAL PRESTIGE 81
80-84
75-79
60-64
55-59
P 50-54
‘G E
8l 45-49
‘ij z Li 40-44
35-39
30-34
25-29
20-24
15-19
0 5 10 15 20 25 30
Percentages of male- and female-dominated occupations
FIG. 1. Occupational prestige ratings of male-dominated and female-dominated occu- pations: U.S. labor force, 1980.
and women are almost equal, although the mean prestige of male-dominated and female-dominated occupations differs. Women remain, however, un- derrepresented in the most prestigious occupations-as they were in 1970 (England, 1979)-but these occupations are relatively small. Thus, because of the tendency of women to be employed in the more prestigious of the female-dominated occupations and men to be employed in the less prestigious of the male-dominated occupations, the overall prestige dis- tributions of men and women are quite similar (see Fig. 2).
The overall equivalence between men’s and women’s occupational prestige characteristics portrayed in Fig. 2 is the result of patterns of sex segregation within various parts of the occupational structure. In three major occupational groupings, “Professional Specialty,” “Sales,” and “Protective Service,” women’s prestige scores are, on average,

82 STEVENS AND HOISINGTON
TABLE 2 Means and Standard Deviations of Occupational Prestige by Major Occupational
Grouping: Men and Women in the 1980 Labor Force
A. Managerial and professional specialty occupations I. Executive, administrative, and managerial
II. Professional specialty
B. Technical, sales, and administrative support occupations III. Technicians and related support
IV. Sales occupations
V. Administrative support occupations (including clerical)
C. Service occupations VI. Private household occupations
VII. Protective service occupations
VIII. Service occupations except private household and protective
D. Farming, forestry, and fishing occupations IX. Farming, forestry and fishing occupations
E. Precision production, craft and repair occupations X. Precision production, craft and repair
occupations F. Operators, fabricators, and laborers
XI. Machine operators, assemblers, and inspectors
XII. Transportation and material moving occupations
XIII. Handlers, equipment cleaners, helpers, and laborers
All occupations
Men Women
54.00 54.75 4.15 4.26
62.88 58.00 10.54 7.50
51.26 49.36 5.41 7.37
41.42 34.26 10.64 8.65 37.16 42.16 6.74 5.33
19.59 20.32 2.19 2.45
36.06 28.61 11.99 10.68 22.47 26.86 6.22 8.89
31.06 21.43 10.31 10.03
38.87 37.46 6.41 7.41
31.06 28.47 5.24 4.28
31.33 30.36 4.48 3.98
19.99 20.27 2.47 1.82
39.48 39.50 14.14 13.13
Mean SD
Note. Labor force data are from U.S. Department of Commerce (1983). Prestige scores are in the Appendix.
about 5 points less than men’s (Table 2). In these three groupings, the gap occurs because of women’s heavy overrepresentation in certkn minor groupings. In “Professional Specialty” occupations, the gap is attributable to women’s concentration in nursing, a relatively prestigious occupation among female-dominated occupations but one of the less prestigious

OCCUPATIONAL PRESTIGE 83
80-84
75-79
65-69
60-64
W Men q women
55-59
P 50-54
‘ii 2 k% 45-49
.2= I li 40-44
35-39
30-34
25-29
20-24
15-19
d ; lb 1; 2;
Percentages ofmen andwomen
FIG. 2. Occupational prestige distributions of the sexes: U.S. labor force, 1980.
among professional-specialty occupations. In “Sales” occupations, about 74% of the women but only 54% of the men are employed in the least prestigious “Retail and Personal Services” category. And in the “Protective Service” occupations, about 72% of the women are employed in the category Guards (e.g., Crossing guards) while the men engaged in protective service occupations are much more likely to be employed as Police, Detectives, or in a Fire Prevention occupation.
In two major categories, however, sex segregation results in women having higher prestige. Women in “Administrative Support” occupations tend to be employed as Secretaries or Stenographers and thus have, on average, higher prestige than men who are more likely to be in the less prestigious Records Processing or Material Recording, Scheduling, and Distribution occupations. And in the nonprivate “Service Occupations” grouping, men are likely to be employed in Building and Cleaning Service

84 STEVENS AND HOISINGTON
occupations, unlike the women who are more apt to be in one of the more prestigious-for this major occupational grouping-Health Service occupations, e.g., Dental Assistants.
SUMMARY AND DISCUSSION
In spite of the large increase in the percentage of female workers (U.S. Department of Commerce, 1984), a modest decline in occupational sex segregation (Rytina and Bianchi, 1984), and some radical changes in the sex composition of particular occupations (Reskin and Roos, 1987), the prestige characteristics of men and women, and of occupations dominated by men or women, appear to have remained largely unaltered since the early 1970s. Women’s occupations largely remain confined to the lower two-thirds of the prestige hierarchy while men’s occupations are distributed throughout almost the entire range. And, with the continued exception of an underrepresentation of women at the upper end of the prestige hierarchy, the overall distributions of men’s and women’s occupational prestige also remain parallel (cf. England, 1979). This overall equivalence occurs because of the offsetting effects of patterns of occupational sex segregation. For example, within several major occupational groupings, women are more likely than men to be employed in the relatively more prestigious occupations while in several other groupings, the reverse is true.
The relative stability of men’s vis-a-vis women’s prestige characteristics over time thus implies that while women may be moving into previously male-dominated occupations, they are moving sideways in the occupational prestige hierarchy into occupations of lower or middling prestige. The persistence of only male-dominated occupations at the upper end of the prestige hierarchy also implies that the most prestigious occupations are more resistant to changes in their sex composition than occupations found in the lower reaches of the prestige hierarchy.
These conclusions rest, however, on several assumptions. First, the reconciliation of the 1970 code prestige ratings with 1980 occupational codes, and the application of these reconciled ratings to 1980 labor force data rest on the assumption that occupational prestige ratings are stable over time. Other research has demonstrated that, on the whole, the relative prestige ratings of occupations are fairly constant over time. However, there are almost certainly exceptions. For example, the nature of the job duties, environmental conditions, and occupational rewards associated with the occupation “pharmacist” changed between 1970 and 1980 (Reskin and Hartmann, 1986) and it is reasonable to expect that such changes may have been accompanied by changes in the occupation’s relative prestige ranking. Our study may thus be misstating the degree of stability of the prestige characteristics of men’s and women’s occupations and of male and female workers if the occupations that have undergone

OCCUPATIONAL PRESTIGE 85
new developments in their work duties and environmental characteristics are either dominated by one or the other sex or have experienced a shift in their sex composition.
The validity of the comparison of the prestige characteristics of men and women and of men’s and women’s occupations also rests on the assumption that occupational prestige ratings are not sex-specific. Jacobs and Powell (1985) argue, for example, that raters evaluate occupations’ prestige with sex-typical workers in mind because the prestige ratings of occupations are best predicted by the prestige ratings of sex-typical workers (e.g., women in an occupation dominated by women). Thus supposedly sex-neutral occupational prestige scales are, in fact, sex- biased. Bose and Rossi (1983) argue, on the other hand, that the traditional NORC prestige scale (the basis of that used in this study) is male biased because of the manner in which it was constructed: the prestige ratings of many female-dominated occupations are the composite scores of male- dominated occupations in the same minor grouping (Siegel, 1971).
However, one of the major analytical advantages of prestige scales versus, for example, socioeconomic scales, is that the concept underlying occupational prestige reflects the public’s evaluations of the occupation’s attributes such as its value to society rather than the attributes of the workers (Hodge, 1981). Thus an occupation’s prestige presumably affects the prestige or esteem of its incumbents rather than vice versa. Although the incumbents accrue prestige or esteem from at least one major common source-their occupation-the overall prestige or social standing of each individual is free to vary according to their other important social char- acteristics, e.g., sex. While it is probably true that there has never been a “pure” prestige scale, i.e., one that is completely independent of incumbents’ attributes, Bose and Rossi’s (1983) detailed study shows only small (although statistically significant) effects of an incumbent’s sex on an occupation’s prestige. We also have some additional evidence, although admittedly sketchy, that the male bias in the NORC prestige scale is small. Between 1970 and 1980, seven occupations switched from being predominantly male to predominately female.5 If the prestige measures were severely male biased, the estimated prestige ratings of these oc- cupations would be more typical of male-dominated occupations, but they are more typical of female-dominated occupations: their mean is 38.5 with a standard deviation of 10.88 (refer to Table 1).
Although it appears, on the whole, that occupational-specific prestige ratings can be regarded as being relatively stable over time and not particularly sensitive to the occupation’s sex composition, these as-
’ The seven occupations and their percentages of female workers in 1970 and 1980 are management-related occupations, NEC (20.1-53.5); inhalation therapists (28.6-56.5); insurance adjusters, examiners, and investigators (29.6-60.2); guides (32.9-57.2); animal caretakers except farm (30.7-59.0); typesetters and compositors (16.8-55.7); and miscellaneous printing machine operators (23.8-52.9) (U.S. Department of Commerce, 1984).

86 STEVENS AND HOISINGTON
sumptions may be questionable when considering occupations that are heavily dominated by one or the other sex, have experienced changes in their sex composition, and/or have experienced recent changes in their job duties and rewards. Our comparison thus falls short of a full comparison of the general prestige characteristics of male and female workers; it is a comparison only of the presumably common prestige accruing to men and women on the basis of their occupation. However, by not allowing for the possibility that the prestige rankings of occupations may have changed during the 1970s the only room in our analysis for the observation of change or stability in the prestige characteristics of male- or female-dominated occupations lies in the change or stability in the sex-specific patterns of employment in the prestige hierarchy. Our results thus suggest that a major part of the explanation of why female- dominated occupations continue to be marked by certain characteristics vis-a-vis men’s occupations lies not in the vageries of prestige scales but in why women prefer or are channeled into occupations with certain prestige characteristics.
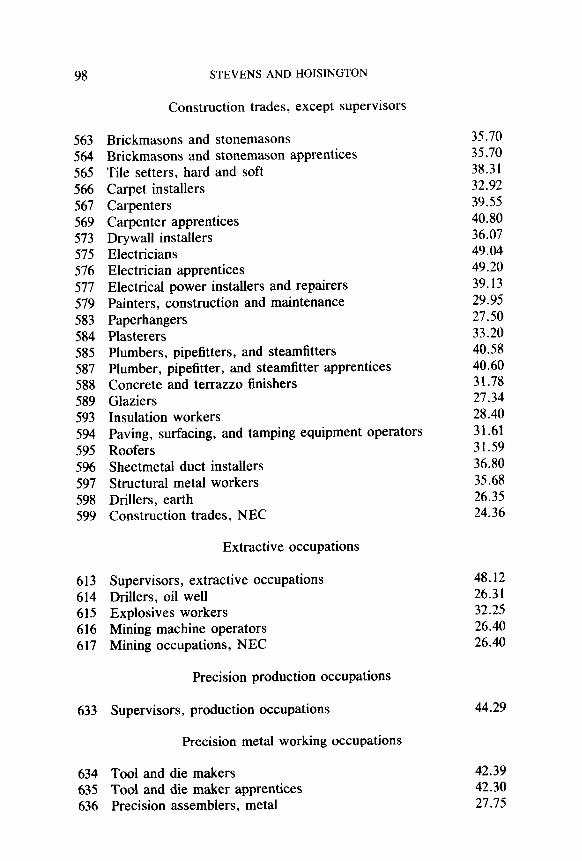
APPENDIX: PRESTIGE SCORES FOR 1980 CENSUS OCCUPATIONAL CODES
Occupation Code Occupational category Prestige
I. Executive, Administrative and Managerial Occupations
003 004
005 Administrators and officials, public administration Administrators, protective services Financial managers Personnel and labor relations managers Purchasing managers
013 014 015 016 017 018 019
Managers, marketing, advertising and public relations Administrators, education and related fields Managers, medicine and health Managers, properties and real estate Postmasters and mail superintendents Funeral directors Managers and administrators, NEC
54.81 59.25 45.80 60.74 55.40 50.90 52.23 62.83 59.31 41.79 58.30 52.20 53.45
Management related occupations
023 Accountants and auditors 55.88 024 Underwriters 47.00
Legislators Chief executives and general administrators, public
administration
60.30

025 026 027 028 029 033 034 035 036 037
Other financial officers 61.98 Management analysts 55.12 Personnel, training, and labor relations specialists 55.15 Purchasing agents and buyers, farm products 43.09 Buyers, wholesale and retail trade, except farm products 50.00 Purchasing agents and buyers, NEC 46.53 Business and promotion agents 52.20 Construction inspectors 36.76 Inspectors and compliance officers, ext. construction 41.75 Management related occupations, NEC 56.91
II. Professional Specialty Occupations
Engineers, architects, and surveyors
043
044 045 046 047 048 049 053 054 055 056 057 058 059 063
Architects Engineers
Aerospace engineers Metallurgical and materials engineers Mining engineers Petroleum engineers Chemical engineers Nuclear engineers Civil engineers Agricultural engineers Electrical and electronic engineers Industrial engineers Mechanical engineers Marine engineers and naval architects Engineers, NEC
Surveyors and mapping scientists
66.41
71.10 63.08 61.60 57.10 67.20 71.60 67.77 64.55 69.37 55.14 61.92 63.12 65.64 53.10
Mathematical and computer scientists
064 Computer systems analysts and scientists 50.60 065 Operations and systems researchers and analysts 50.80
066 Actuaries 55.40
067 Statisticians 55.40 068 Mathematical scientists, NEC 65.00
Natural scientists
069 Physicists and astronomers 73.80 073 Chemists, except biochemists 67.30 074 Atmospheric and space scientists 47.00 075 Geologists and geodeseists 67.21
076 Physical scientists, NEC 65.10
OCCUPATIONAL PRESTIGE 87

88 STEVENS AND HOISINGTON
077 Agricultural and food scientists 59.83
078 Biological and life scientists 67.92
079 Forestry and conservation scientists 53.90
083 Medical scientists 67.70
Health diagnosing occupations
084 Physicians 085 Dentists 086 Veterinarians 087 Optometrists 088 Podiatrists 089 Health diagnosing practitioners, NEC
095 096 097
098 099 103 104 105 106
113 Earth, environmental, and marine science teachers 78.30
114 Biological science teachers 78.30
115 Chemistry teachers 78.30
116 Physics teachers 78.30
117 Natural science teachers, NEC 78.30
118 Psychology teachers 78.30
119 Economics teachers 78.30
123 History teachers 78.30
124 Political science teachers 78.30
125 Sociology teachers 78.30
126 Social science teachers, NEC 78.30
127 Engineering teachers 78.30
128 Mathematical science teachers 78.30
129 Computer science teachers 78.30
133 Medical science teachers 78.30
134 Health specialties teachers 78.30
Health assessment and treating occupations
Registered nurses Pharmacists Dietitians Therapists
Inhalation therapists Occupational therapists Physical therapists Speech therapists Therapists, NEC
Physicians’ assistants
Teachers, postsecondary
81.09 73.60 59.70 61.89 36.70 58.34
59.87 60.30 52.10
38.50 38.50 38.50 38.50 38.50 45.60

135 Business, commerce, and marketing teachers 78.30 136 Agriculture and forestry teachers 78.30 137 Art, drama, and music teachers 78.30 138 Physical education teachers 53.20 139 Education teachers 78.30 143 English teachers 78.30 144 Foreign language teachers 78.30 145 Law teachers 78.30 146 Social work teachers 78.30 147 Theology teachers 78.30 148 Trade and industrial teachers 78.30 149 Home economics teachers 53.20 153 Teachers, postsecondary, NEC 78.30 154 Postsecondary teachers, subject not specified 78.30
Teachers, except postsecondary
155 Teachers, prekindergarten and kindergarten 56.10 156 Teachers, elementary school 59.20 157 Teachers, secondary school 60.10 158 Teachers, special education 44.90 159 Teachers, NEC 45.83 163 Counselors, educational and vocational 50.28
164 Librarians 54.60 165 Archivists and curators 59.60
166 Economists 54.13 167 Psychologists 71.40 168 Sociologists 71.40 169 Social scientists, NEC 64.00 173 Urban planners 50.60
174 Social workers 52.33 175 Recreation workers 48.60 176 Clergy 69.00 177 Religious workers, NEC 54.60
OCCUPATIONAL PRESTIGE
Librarians, archivists, and curators
Social scientists and urban planners
Social, recreation, and religious workers
89

90 STEVENS AND HOISlNGTON
178 Lawyers 75.10
179 Judges 73.60
Writers, artists, entertainers, and athletes
183 Authors 59.80 184 Technical writers 44.53
185 Designers 49.54
186 Musicians and composers 46.00 187 Actors and directors 54.42 188 Painters, sculptors, craft-artists, and artist printmakers 56.02
189 Photographers 41.13
193 Dancers 37.60
194 Artists, performers, and related workers, NEC 42.01
195 Editors and reporters 51.12 197 Public relations specialists 56.65 198 Announcers 49.68 199 Athletes 52.28
III. Technicians and Related Support Occupations
Health technologists and technicians
203 204 205 206 207 208
Clinical laboratory technologists and technicians Dental hygienists Health record technologists and technicians Radiologic technicians Licensed practical nurses Health technologists and technicians, NEC
61.00 61.00 54.60 61.00 42.13 49.83
Technologists and technicians, except health, engineering, and related technologists and technicians
213 Electrical and electronic technicians 51.20
214 Industrial engineering technicians 49.17 215 Mechanical engineering technicians 47.07 216 Engineering technicians, NEC 46.07 217 Drafting occupations 56.10 218 Surveying and mapping technician 53.10
Lawyers and judges

223 Biological technicians 47.20 224 Chemical technicians 48.08 225 Science technicians, NEC 48.29
Technicians, except health, engineering, and science
226 Airplane pilots and navigators 66.75 227 Air traffic controllers 42.80 228 Broadcast equipment operators 44.11 229 Computer programmers 50.60 233 Tool programmers, numerical control 47.00 234 Legal assistants 39.66 235 Technicians, NEC 48.71
IV. Sales Occupations
243 Supervisors and proprietors, sales occupations 55.28
Sales representatives, finance and business services
253 Insurance sales occupations 46.80 254 Real estate sales occupations 43.98 255 Securities and financial services sales occupations 51.41 256 Advertising and related sales occupations 42.30 257 Sales occupations, other business services 39.33
Sales representatives, commodities except retail
258 259
Sales engineers 50.60 Sales representatives, mining, manufacturing, and wholesale42.77
Sales workers, retail and personal services
263 Sales workers, motor vehicles and boats 29.38 264 Sales workers, apparel 28.60 265 Sales workers, shoes 28.60 266 Sales workers, furniture and home furnishings 28.60 267 Sales workers; radio, television, hi-fi, and appliances 28.81 268 Sales workers, hardware and building supplies 28.62 269 Sales workers, parts 37.41 274 Sales workers, other commodities 29.13 275 Sales counter clerks 36.18 276 Cashiers 30.86
OCCUPATIONAL PRESTIGE 91
Science technicians

92 STEVENS AND HOISINGTON
277 Street and door-to-door sales workers 24.68 278 News vendors 15.84
283 Demonstrators, promoters, and models, sales 30.60 284 Auctioneers 31.90 285 Sales support occupations, NEC 28.60
303 Supervisors, general office 40.41 304 Supervisors, computer equipment operators 43.46 305 Supervisors, financial records processing 45.43 306 Chief communications operators 42.33 307 Supervisors; distribution, scheduling, and adjusting clerks 37.11
308 Computer operators 44.79 309 Peripheral equipment operators 44.90
313 Secretaries 314 Stenographers 315 Typists
316 317 318 319 323
325 326 327 328 329
Sales related occupations
V. Administrative Support Occupations, Including Clerical
Supervisors, administrative support occupations
Computer equipment operators
Secretaries, stenographers, and typists
Information clerks
45.80 43.27 41.11
Interviewers Hotel clerks Transportation ticket and reservation agents Receptionists Information clerks, NEC
Records processing occupations, except financial
Classified-ad clerks Correspondence clerks Order clerks Personnel clerks, except payroll and timekeeping Library clerks
36.81 36.20 35.45 38.90 36.63
36.20 36.50 36.63 36.14 39.61

335 File clerks 336 Records clerks
93
30.87 36.32
Financial records processing occupations
337 338 339 343 344
Bookkeepers, accounting, and auditing clerks Payroll and timekeeping clerks Billing clerks Cost and rate clerks Billing, posting, and calculating machine operators
47.48 41.30 36.60 36.35 44.34
Duplicating, mail, and other office machine operators
345 Duplicating machine operators 44.90 346 Mail preparing and paper handling machine operators 44.90 347 Office machine operators, NEC 44.68
Communications equipment operators
348 349 353
Telephone operators Telegraphers Communications equipment operators, NEC
40.40 43.50 41.95
Mail and message distributing occupations
354 Postal clerks, except mail carriers 42.40 355 Mail carriers, postal service 42.30 356 Mail clerks, except postal service 35.50 357 Messengers 19.30
Material recording, scheduling, and distributing clerks, NEC
359 363 364 365 366 368 369 373 374
Dispatchers Production coordinators Traffic, shipping, and receiving clerks Stock and inventory clerks Meter readers Weighers, measurers, and checkers Samplers Expediters Material recording, scheduling, and distributing clerks,
NEC Adjusters and investigators
35.40 35.00 30.31 25.21 36.20 33.90 36.20 36.14
36.50
375 Insurance adjusters, examiners, and investigators 47.42 376 Investigators and adjusters, except insurance 41.28
OCCUPATIONAL PRESTIGE

94 STEVENS AND HOISINGTON
377 Eligibility clerks, social welfare 31.40 378 Bill and account collectors 29.23
Miscellaneous administrative support occupations
379 General office clerks 36.83 383 Bank tellers 49.88 384 Proofreaders 36.20 385 Data-entry keyers 44.20 386 Statistical clerks 36.13 387 Teachers’ aides 48.75 389 Administrative support occupations, NEC 36.81
VI. Private Household Occupations
403 Launderers and ironers 17.60 404 Cooks, private household 18.00 405 Housekeepers and butlers 24.70 406 Childcare workers, private household 22.90 407 Private household cleaners and servants 18.49
VII. Protective Service Occupations
Supervisors, protective service occupations
4 13 Supervisors, firefighting and fire prevention occupations 44.01 414 Supervisors, police and detectives 47.35 415 Supervisors, guards 32.27
Firefighting and fire prevention occupations
416 Fire inspection and fire prevention occupations 46.90 417 Firefighting occupations 44.08
Police and detectives
418 Police and detectives, public service 47.68 423 Sheriffs, bailiffs, and other law enforcement officers 53.77 424 Correctional institution officers 22.30
Guards
425 Crossing guards 426 Guards and police, except public service 427 Protective service occupations, NEC
24.50 23.40 18.67

433 Supervisors, food preparation and service occupations 28.42 434 Bartenders 19.90 435 Waiters and waitresses 20.30 436 Cooks, except short order 26.47 437 Short-order cooks 26.40 438 Food counter, fountain, and related occupations 17.24 439 Kitchen workers, food preparation 21.90 443 Waiters’/waitresses’ assistants 14.69 444 Miscellaneous food preparation occupations 21.33
Health service occupations
445 Dental assistants 47.80 446 Health aides, except nursing 41.09 447 Nursing aides, orderlies, and attendants 39.95
Cleaning and building service occupations, except household
448 Supervisors, cleaning and building service workers 22.87 449 Maids and housemen 16.08 453 Janitors and cleaners 19.00 454 Elevator operators 20.90 455 Pest control occupations 28.90
Personal service occupations
456 457 458 459 463 464 465 466 467 468
Supervisors, personal service occupations Barbers Hairdressers and cosmetologists Attendants, amusement and recreation facilities Guides Ushers Public transportation attendants Baggage porters and bellhops Welfare service aides Childcare workers, except private household -
31.09 37.89 33.23 17.81 23.89 15.31 34.55 17.50 18.43 22.47 28.57
OCCUPATIONAL PRESTIGE 95
VIII. Service Occupations, Except Protective and Household
Food preparation and service occupations
469 Personal service occupations, NEC

96 STEVENS AND HOISINGTON
IX. Farm Operators and Managers
473 Farmers, except horticultural 40.70 474 Horticultural specialty farmers 38.51 475 Managers, farms, except horticultural 44.63 476 Managers, horticultural specialty farms 56.00
477 Supervisors, farm workers 34.96 479 Farm workers 18.85 483 Marine life cultivation workers 24.20 484 Nursery workers 18.79
485 Supervisors, related agricultural occupations 32.06 486 Groundskeepers and gardeners, except farm 22.08 487 Animal caretakers, except farm 30.19 488 Graders and sorters, agricultural products 18.80 489 Inspectors, agricultural products 25.78
494 Supervisors, forestry and logging workers 41.57 495 Forestry workers, except logging 39.40 4% Timber cutting and logging occupations 26.33
497 498 499
503 Supervisors, mechanics, and repairers
505 Automobile mechanics 36.69 506 Automobile mechanic apprentices 36.70
Other agricultural and related occupations Farm occupations, except managerial
Related agricultural occupations
Forestry and logging occupations
Fishers, hunters, and trappers
Captains and other officers, fishing vessels Fishers Hunters and trappers
X. Mechanics and Repairers
50.83 32.09 30.30
41.86
Mechanics and repairers, except supervisors Vehicle and mobile equipment mechanics, and repairers

OCCUPATIONAL PRESTIGE 97
507 Bus, truck, and stationary engine mechanics 35.20 508 Aircraft engine mechanics 46.65 509 Small engine repairers 40.80 514 Automobile body and related repairers 36.09 515 Aircraft mechanics, except engine 47.31 516 Heavy equipment mechanics 33.69 517 Farm equipment mechanics 32.62 518 Industrial machinery repairers 32.88 519 Machinery maintenance occupations 24.92
523 Electronic repairers, communications, and industrial
525 526 527 529 533 534
535 536 538 539 543 544 547 549
553 Supervisors; brickmasons, stonemasons, and tile setters 35.93 554 Supervisors, carpenters and related workers 39.73 555 Supervisors, electricians and power transmission installers 46.54 556 Supervisors; painters, paperhangers, and plasterers 30.40 557 Supervisors; plumbers, pipefitters, and steamfitters 40.71 558 Supervisors, NEC 50.23
Electrical and electronic equipment repairers
equipment 35.32 Data processing equipment repairers 40.89 Household appliance and power tool repairers 33.08 Telephone line installers and repairers 39.28 Telephone installers and repairers 39.10 Miscellaneous electrical and electronic equipment repairers 42.60 Heating, air conditioning, and refrigeration mechanics 36.70
Miscellaneous mechanics and repairers
Camera, watch, and musical instrument repairers Locksmiths and safe repairers Office machine repairers Mechanical controls and valve repairers Elevator installers and repairers Millwrights Specified mechanics and repairers, NEC Not specified mechanics and repairers
Construction trades Supervisors, construction occupations
36.83 40.80 34.97 33.97 32.80 37.77 36.91 32.68
98 STEVENS AND HOISINGTON
Construction trades, except supervisors
563 Brickmasons and stonemasons 35.70
564 Brickmasons and stonemason apprentices 35.70
565 Tile setters, hard and soft 38.31
566 Carpet installers 32.92
567 Carpenters 39.55
569 Carpenter apprentices 40.80
573 Drywall installers 36.07
575 Electricians 49.04
576 Electrician apprentices 49.20
577 Electrical power installers and repairers 39.13
579 Painters, construction and maintenance 29.95
583 Paperhangers 27.50
584 Plasterers 33.20
585 Plumbers, pipefitters, and steamfitters 40.58
587 Plumber, pipefitter, and steamfitter apprentices 40.60
588 Concrete and terrazzo finishers 31.78
589 Glaziers 27.34
593 Insulation workers 28.40
594 Paving, surfacing, and tamping equipment operators 31.61
595 Roofers 31.59
596 Sheetmetal duct installers 36.80
597 Structural metal workers 35.68
598 Drillers, earth 26.35
599 Construction trades, NEC 24.36
Extractive occupations
613 Supervisors, extractive occupations 48.12
614 Drillers, oil well 26.31
615 Explosives workers 32.25
616 Mining machine operators 26.40 617 Mining occupations, NEC 26.40
633
634 635
Precision production occupations
Supervisors, production occupations
Precision metal working occupations
Tool and die makers Tool and die maker apprentices
44.29
42.39 42.30 27.75 636 Precision assemblers, metal

OCCUPATIONAL PRESTIGE 99
637 639 643 644 645 646 647 649 653 654 655
Machinists Machinist apprentices Boilermakers Precision grinders, fitters, and tool sharpeners Pattern makers and model makers, metal Layout workers Precious stones and metals workers (jewelers) Engravers, metal Sheet metal workers Sheet metal worker apprentices Miscellaneous precision metal workers
45.66 47.70 30.78 20.15 38.59 35.19 36.59 40.70 37.11 36.80 42.30
Precision woodworking occupations
656 Pattern makers and model makers, wood 38.00 657 Cabinet makers and bench carpenters 38.13 658 Furniture and wood finishers 28.72 659 Miscellaneous precision woodworkers 34.95
Precision textile, apparel, and furnishings machine workers
666 Dressmakers 30.88 667 Tailors 33.89 668 Upholsterers 30.11 669 Shoe repairers 33.04 673 Apparel and fabric patternmakers 28.65 674 Miscellaneous precision apparel and fabric workers 32.75
Precision workers, assorted materials
675 Hand molders and shapers, except jewelers 38.29 676 Patternmakers, layout workers, and cutters 44.42 677 Optical goods workers 50.96 678 Dental laboratory and medical appliance technicians 61.00 679 Bookbinders 31.37 683 Electrical and electronic equipment assemblers 27.51 684 Miscellaneous precision workers, NEC 31.10
Precision food production occupations
686 Butchers and meat cutters 687 Bakers 688 Food batchmakers
29.98 33.81 28.50

100 STEVENS AND HOISINGTON
Precision inspectors, testers, and related workers
689 Inspectors, testers, and graders 693 Adjusters and calibrators
Plant and system operators
36.85 27.50
694 Water and sewage treatment plant operators 695 Power plant operators 696 Stationary engineers 699 Miscellaneous plant and system operators
XI. Machine Operators, Assemblers, and Inspectors
32.65 38.39 32.87 29.16
Machine operators and tenders, except precision metalworking
703 Lathe and turning machine setup operators 704 Lathe and turning machine operators 705 Milling and planing machine operators 706 Punching and stamping press machine operators 707 Rolling machine operators 708 Drilling and boring machine operators 709 Grinding, abrading, buffing, and polishing machine
46.13 31.66 31.59 30.18 35.00 31.38
operators 713 714 715
717
Forging machine operators Numerical control machine operators Miscellaneous metal, plastic, stone, and glass working
machine operators Fabricating machine operators, NEC
21.22 34.28 28.90
36.14 29.72
Metal and plastic processing machine operators
719 Molding and casting machine operators 723 Metal plating machine operators 724 Heat treating equipment operators 725 Miscellaneous metal and plastic processing machine
29.76 30.05 35.07
operators 28.14
Woodworking machine operators
726 Wood lathe, routing, and planing machine operators 30.93 727 Sawing machine operators 27.71 728 Shaping and joining machine operators 28.58
and plastic working machine operators

729 Mailing and tacking machine operators 31.50 733 Miscellaneous woodworking machine operators 28.75
Printing machine operators
734 Printing machine operators 38.62 735 Photoengravers and lithographers 38.93 736 Typesetters and compositors 38.06 737 Miscellaneous printing machine operators 34.71
Textile, apparel, and furnishings machine operators
738 739 743 744 745 747 748 749
Winding and twisting machine operators Knitting, looping, taping, and weaving machine operators Textile cutting machine operators Textile sewing machine operators Shoe machine operators Pressing machine operators Laundering and dry cleaning machine operators Miscellaneous textile machine operators
28.20 26.76 28.58 25.15 28.99 20.70 18.67 28.55
Machine operators, assorted materials
753 Cementing and gluing machine operators 28.67 754 Packaging and filling machine operators 23.99 755 Extruding and forming machine operators 28.50 756 Mixing and blending machine operators 27.69 757 Separating, filtering, and clarifying machine operators 30.46 758 Compressing and compacting machine operators 27.66 759 Painting and paint spraying machine operators 28.87 763 Roasting and baking machine operators, food 32.39 764 Washing, cleaning, and pickling machine operators 27.76 765 Folding machine operators 28.52 766 Furnace, kiln, and oven operators, except food 31.86 768 Crushing and grinding machine operators 26.76 769 Slicing and cutting machine operators 28.88 773 Motion picture projectionists 33.90 774 Photographic process machine operators 36.04 777 Miscellaneous machine operators, NEC 29.20 779 Machine operators, not specified 29.04
Fabricators, assemblers, and hand-working occupations
783 784
Welders and cutters 40.09 Solderers and brazers 36.00
OCCUPATIONALPRESTIGE 101

102 STEVENS AND HOISINGTON
785 Assemblers 27.73 786 Hand-cutting and trimming occupations 28.83 787 Hand-molding, casting, and forming occupations 29.05 789 Hand-painting, coating, and decorating occupations 31.48 793 Hand-engraving and printing occupations 28.66 794 Hand-grinding and poiishing occupations 19.00 795 Miscellaneous hand-working occupations 28.55
Production inspectors, testers, samplers, and weighers
796 Production inspectors, checkers, and examiners 35.72 797 Production testers 35.86 798 Production samplers and weighers 28.41 799 Graders and sorters, except agricultural 28.67
XII. Transportation and Material Moving Occupations
Motor vehicle operators
803 Supervisors, motor vehicle operators 804 Truck drivers, heavy 805 Truck drivers, light 806 Driver-sales workers 808 Bus drivers 809 Taxicab drivers and chauffeurs 813 Parking lot attendants 814 Motor transportation occupations, NEC
Transportation occupations, except motor vehicles Rail transportation occupations
823 Railroad conductors and yardmasters 43.69 824 Locomotive operating occupations 43.99 825 Railroad brake, signal, and switch operators 33.60 826 Rail vehicle operators, NEC 32.80
Water transportation occupations
828 Ship captains and mates, except fishing boats 53.38 829 Sailors and deckhands 33.70 833 Marine engineers 37.19 834 Bridge, lock, and lighthouse tenders 24.50
45.77 32.10 28.54 28.33 32.40 21.50 22.00 32.10

843 844 845 848 849 853 855 856 859
Supervisors, material moving equipment operators 42.86 Operating engineers 31.86 Longshore equipment operators 24.40 Hoist and winch operators 32.78 Crane and tower operators 38.70 Excavating and loading machine operators 30.94 Grader, dozer, and scraper operators 31.92 Industrial truck and tractor equipment operators 29.08 Miscellaneous material moving equipment operators 24.63
XIII. Handlers, Equipment Cleaners, Helpers, and Laborers
863 Supervisors; handlers, equipment cleaners, and laborers, NEC
864 Helpers, mechanics and repairers 45.30 27.90
Helpers, construction and extractive occupations
865 Helpers, construction trades 17.49 866 Helpers, surveyor 39.40 867 Helpers, extractive occupations 26.31 869 Construction laborers 18.00 873 Production helpers 27.96
Freight, stock, and material handlers
875 876 877 878 883 885 887 888 889
Garbage collectors Stevedores Stock handlers and baggers Machine feeders and offbearers Freight, stock, and material handlers, NEC Garage and service station related occupations Vehicle washers and equipment cleaners Hand packers and packagers Laborers, except construction
17.30 24.40 20.72 22.55 19.23 21.22 18.87 19.76 20.04
103 OCCUPATIONAL PRESTIGE
Material moving equipment operators
Note. Prestige scores were estimated for the seven occupational codes below by averaging scores for the other occupational codes in the same minor category. The occupational codes and the corresponding minor categories are Agricultural engineers (054), Engineers (044-059); Physicians’ assistants (106), Health assessment and treating occupations (095-106); Communications equipment operators, NEC (353), Communications

104 STEVENS AND HOISINGTON
equipment operators (348-353); Marine life cultivation workers (483), Farm occupations, except managerial (477-484); Inspectors, agricultural products (489), Related agricultural occupations (485-489); Miscellaneous precision woodworkers (659), Precision woodworking occupations (656- 659); Marine engineers (833), Water transportation occupations (828- 834).
REFERENCES Bianchi, S. M., and Rytina, N. R. (1986). “The decline in occupational sex segregation
during the 1970’s: Census and CPS comparisons,” Demography 23, 79-86. Bianchi, S. M., and Rytina, N. R. (1984). Occupational Change, 1970-1980, paper presented
at the annual meetings of the Population Association of America, Minneapolis, Minn. Beller, A. H. (1984). “Trends in occupational segregation by sex and race, 1960-1981,”
in Sex Segregation in the Workplace (B. F. Reskin, Ed.), pp. 1 l-26, National Academy Press, Washington, D.C.
Bose, C. E. (1973). Jobs and Gender: Sex and Occupational Prestige, Johns Hopkins University Center for Metropolitan Planning and Research, Baltimore.
Bose, C. E., and Rossi, P. H. (1983). “Prestige standings of occupations as affected by gender,” American Sociological Review 48, 316-330.
Duncan, 0. D. (l%l). “A socioeconomic index for all occupations,” in Occupations and Social Status (A. J. Reiss, Jr., Ed.), pp. 139-161, Free Press, New York.
England, P. (1979). “Women and occupational prestige: a case of vacuous sex equality,” Signs 5, 252-265.
England, P. (1981). “Assessing trends in occupational sex segregation, 1900-1976,” in Sociological Perspectives on Labor Markets (Ivar E. Berg, Ed.), pp. 273-295, Academic Press, New York.
Featherman, D. L., and Hauser, R. M. (1976). “Prestige or socioeconomic scales in the study of occupational achievement. 7” Sociological Methods and Research 4, 403-422.
Featherman, D. L., Sobel, M., and Dickens, D. (1975). A Manual for Coding Occupations and Industries into Detailed 1970 Categories and a Listing of 1970-Basis Duncan Socioeconomic and NORC Prestige Scores, Working Paper 75-1, Center for Demography and Ecology, Madison, Wise.
Goldthorpe, J., and Hope, K. (1974). The Social Grading of Occupations, a New Approach and Scale, Oxford Univ. Press (Clarendon), London/New York.
Grasmick, H. (1976). “The occupational prestige structure: a multi-dimensional scaling approach,” Sociological Quarterly 17, 90-108
Guppy, N., and Goyder, J. C. (1984). “Consensus on occupational prestige: a reassessment of the evidence,” Social Forces 62, 709-725.
Haller, A. O., and Bills, D. B. (1979). “Occupational prestige in comparative perspective,” Contemporary Sociology 8, 721-734.
Hauser, R. M., and Featherman, D. L. (1977). The Process of Stratification, Academic Press, New York.
Hodge, R. W. (1981). “The measurement of occupational status,” Social Science Research 10, 3%-415.
Hodge, R. W., Siegel, P. M., and Rossi, P. H. (1964). “Occupational prestige in the United States, 1925-1963,” American Journal of Sociology 70, 286-302.
Hope, K. (1982). “A liberal theory of prestige,” American Journal of Sociology, 87, 101 l- 1031.
Jacobs, J. A., and Powell, B. (1985). “Occupational prestige: a sex-neutral concept?” Sex Roles 12, 1061-1071.
Parcel, T. L., and Mueller, C. W. (1983). “Occupational differentiation, prestige and socioeconomic status,” Work and Occupations 10, 49-80.

OCCUPATIONAL PRESTIGE 105
Powell, B., and Jacobs, J. (1984). “Gender differences in the evaluation of prestige,” Sociological Quarterly, Spring, 173-190.
Priebe, J. (1980). Occupational Classification in the 198Os, paper presented at the annual meetings of the Southern Sociological Association, Knoxville, Tenn.
Reiss, A. J. (l%l). Occupations and Social Status, Free Press of Glencoe, New York. Reskin, B. F., and Hartmann, H. (1986). Women’s Work, Men’s Work: Sex Segregation
on the Job. National Academy Press, Washington, D.C. Reskin, B. F., and Roos, P. (1987). “Status hierarchies and sex segregation,” in Ingredients
for Women’s Employment Policy (C. E. Bose and G. Spitze, Eds.), SUNY Univ. Press, Albany, N.Y.
Rytina, N. F., and Bianchi, S. M. (1984). “Occupational reclassification and change in distribution by gender,” Monthly Labor Review 107, 11-17.
Siegel, P., M. (1971). Prestige in the American Occupational Structure, Unpublished Ph.D. dissertation, University of Chicago.
Stevens, G., and Cho, J. H. (1985). “Socioeconomic indexes and the new 1980 census occupational classification scheme,” Social Science Research 14, 142-168.
Stevens, G., and Featherman, D. L. (1981). “A revised socioeconomic index of occupational status,” Social Science Research 10, 364-395.
Treiman, D. J. (1977). Occupational Prestige in Comparative Perspective, Academic Press, New York.
Treas, J., and Tyree, A. (1979). “Prestige versus socioeconomic status in the attainment processes of American men and women,” Social Science Research 8, 201-221.
U.S. Department of Commerce (1982). “1970-1980 Census comparability,” U.S. Bureau of the Census, Washington, D.C.
U.S. Department of Commerce (1983). Detailed occupation and years of schooling completed by age for the civilian labor force by sex, race, and Spanish origin: 1980,” Suppl. Rep. PC 81-Sl-B, U.S. Bureau of the Census, Washington, D.C.
U.S. Department of Commerce (1984). “Detailed occupation of the experienced civilian labor force by sex for the United States and regions 1980 and 1970,” Suppl. Rep. PC80-Sl-15, U.S. Bureau of the Census, Washington, D.C.