DISSERTATION PRESTIGE: CONCEPT, MEASUREMENT, AND ...
187
DISSERTATION PRESTIGE: CONCEPT, MEASUREMENT, AND THE TRANSMISSION OF CULTURE Submitted by Richard E.W. Berl III Department of Human Dimensions of Natural Resources In partial fulfillment of the requirements For the Degree of Doctor of Philosophy Colorado State University Fort Collins, Colorado Summer 2019 Doctoral Committee: Advisor: Michael C. Gavin Fiona M. Jordan Jerry J. Vaske Jeffrey G. Snodgrass
-
Upload
khangminh22 -
Category
Documents
-
view
3 -
download
0
Transcript of DISSERTATION PRESTIGE: CONCEPT, MEASUREMENT, AND ...

DISSERTATION
PRESTIGE: CONCEPT, MEASUREMENT,
AND THE TRANSMISSION OF CULTURE
Submitted by
Richard E.W. Berl III
Department of Human Dimensions of Natural Resources
In partial fulfillment of the requirements
For the Degree of Doctor of Philosophy
Colorado State University
Fort Collins, Colorado
Summer 2019
Doctoral Committee:
Advisor: Michael C. Gavin
Fiona M. Jordan Jerry J. Vaske Jeffrey G. Snodgrass

Copyright by Richard E.W. Berl III 2019
All Rights Reserved

ii
ABSTRACT
PRESTIGE: CONCEPT, MEASUREMENT,
AND THE TRANSMISSION OF CULTURE
Cultural transmission influences how we learn, what we learn, and from whom we learn. Factors
such as prestige can influence this process, leading to broader evolutionary dynamics that shape cultural
diversity. In this dissertation, I describe three studies designed to elucidate the role that prestige and other
transmission biases play in determining the course of cultural transmission and cultural evolution.
In the first study, we conduct a systematic review of the academic literature on prestige to
determine how the concept of prestige has been defined within different academic traditions, and what
potential determinants and consequences of prestige have been proposed. We find that the academic
literature on prestige is highly fragmented and inconsistent, and we integrate the diversity of prestige
concepts from the literature into a unified framework that represents prestige as an outcome of
contributions from all levels of social structure and from individual performance in a social role. We then
systematically sample and code the ethnographic literature using the unified framework to determine the
variability of prestige concepts across non-Western cultures, and find that different societies show
significant differences in how prestige is perceived and operationalized. Using the results of both reviews,
we offer an integrative definition of prestige and comment on the utility and implications of the unified
prestige framework and definition across disciplines.
In the second study, we develop and validate a common scale to measure individual prestige in
Western societies. Drawing from participants in the United States and United Kingdom, we elicit terms
related to prestige and evaluate additional terms from the literature. We pare down this pool of terms using
attitudinal ratings of speech from a separate group of participants to find which are most closely related to
a generalized Western prestige concept and to determine their structure with an exploratory factor analysis
framework. Using confirmatory factor analysis and cluster analyses, we obtain a 7-item scale with 3 factors
contributing to prestige that we term position, reputation, and information (or “PRI”). Finally, we perform

iii
checks to ensure that the scale exhibits good fit, scale validity, and scale reliability. We provide guidance for
using the scale and for extending it to other cultural contexts.
In the third study, we conduct a transmission experiment to compare the effects of prestige bias (a
model-based context bias in cultural transmission) against the effects of different content biases
represented in a narrative. We use locally calibrated regional accents of English as proxies for prestige, their
relative levels of prestige having been established using the PRI scale of individual prestige and an
application of the scale to a variety of accents in the United States and United Kingdom. For the content of
the narratives, we craft artificial creation stories to resemble real creation stories in their form and in the
proportions of each content type suggested in the literature to influence transmission, which were social,
survival, emotional, moral, rational, and counterintuitive information. We asked participants to listen to
the stories read by a high- or low-prestige speaker, complete a visual memory-based distraction task, and
recall the stories to us. Following coding and analysis of the data, we find that prestige does have a
significant effect on participants’ recall. However, the effect of prestige is small compared to those of social,
survival, negative emotional, and biological counterintuitive information. Our results suggest that content
biases may play a much more important role in cultural transmission than previously thought, and that the
effects of prestige bias are largely limited to information that is free of content biases. As this study is the
first to test all of these biases simultaneously, we discuss its implications for our understanding of the
complexity of cultural transmission and cultural evolution.
In these three studies, I provide a comprehensive, interdisciplinary account of prestige in which we
explore and integrate its diversity of concepts, develop a scale by which prestige can be reliably measured,
and report the results of an experimental test of the effects of prestige on cultural transmission relative to
content biases. As a whole, this research constitutes a substantial contribution to our collective knowledge
of the nature and function of prestige and its variability. This improved understanding of prestige, and in
particular the effects of prestige on the process of cultural transmission, has implications for cultural
evolution, human dimensions and conservation social science research, and other disciplines across the
social sciences.

iv
ACKNOWLEDGEMENTS
Though my name is the sole entry on the authorship line of this document, that attribution
represents a terrible falsehood. From start to finish, all of the work described in this dissertation was only
possible because of the efforts of numerous other people, and I recognize and express my gratitude for the
contributions of all those that have helped me along the way, in no particular order:
I thank my advisor, Michael Gavin, for being an ever-supportive presence, a kind and constructive
mentor, and a staunch advocate for me and my work during every moment of my doctoral training. I could
not imagine a better advisor to have invited me in, guided me, and collaborated with me on this work.
Thank you, Mike.
I thank Fiona Jordan, Jerry Vaske, and Jeff Snodgrass for their service on my committee. They have
each provided invaluable feedback that has substantially improved this work, and have given selflessly of
their time to ensure my success. I thank Fiona Jordan for her role in developing this project and for her
constant transatlantic support, feedback, and patience in all aspects in the development and progress of
this collaborative work.
I thank my additional co-authors and collaborators, Alarna Samarasinghe and Seán Roberts, for
their substantial and thoughtful contributions to the design, analyses, interpretation, and writing of the
work described herein.
I thank my parents, Rick and Sheree Berl, for their love and support of my intellectual development
and pursuits throughout my childhood and into my academic career, even though they still have no idea
what it is I actually do.
I thank my family—my wife Robin, my daughter Juniper, and my son Harlan—for their boundless
love, patience, and support over the course of the arduous process of obtaining not one but two graduate
degrees, and for riding along with me on this adventure. Robin, you have made so many sacrifices of
yourself, in your life and of your well-being, so that we could see this goal through together, and for that I
could never thank you enough—but I promise I will try. I love you. Juniper and Harlan, thanks for playing
with me. Everybody should take more breaks for play time.

v
I thank the fellow members of the Biocultural Diversity and Conservation Research Group at
Colorado State University over the years—Dominique David-Chavez, Kristin Hoelting, Patrick Kavanagh,
Hannah Haynie, Marco Túlio Coelho, and Katie Powlen—for their camaraderie, friendship, and feedback. I
thank my lab-mate Dominique David-Chavez for her constant moral support and for allowing me the
opportunity to learn so much from her and from her own journey to decolonize academia and explore
diverse ways of knowing. I also thank the other graduate students and faculty in the Department of Natural
Resources for making it such a great home to work, learn, and grow as a scholar.
I thank Russell Gray and the Max Planck Institute for the Science of Human History for funding
this work and making possible the conduct of committed, high-quality research.
I thank the D-PLACE team for including me in their innovative work and thoughtful discussions of
cultural diversity and evolution, and for all the laughs and learning along the way.
I thank all of the participants in our research for their efforts to contribute to the body of scientific
knowledge and our collective journey towards truth.
I acknowledge that that the land on which I lived and worked in my time here is the traditional and
ancestral homelands of the Arapaho, Cheyenne, and Ute Nations and peoples, and was a site of trade,
gathering, and healing for numerous other Native tribes. I recognize the Indigenous peoples as original
stewards of this land and all the relatives within it. I accept that the founding of this institution came at a
dire cost to Native Nations and peoples whose land this university was built upon. As these words of
acknowledgment are written and read, the ties Nations have to their traditional homelands are renewed
and reaffirmed.1
I thank all the family, friends, and colleagues not otherwise named above for their contributions to
my growth and success.
Finally, I thank caffeine, synthwave, and the combined efforts of Gary Gygax and Dave Arneson,
without which this dissertation may never have been completed.
1 This statement was adapted from the official Land Acknowledgement at CSU, available here: https://president.colostate.edu/speeches-and-writing/land-acknowledgment-at-csu-december-11-2018/

vi
TABLE OF CONTENTS
ABSTRACT .................................................................................................................................................................. ii
ACKNOWLEDGEMENTS .......................................................................................................................................... iv
1. INTRODUCTION ..................................................................................................................................................... 2
1.1 THEORETICAL BACKGROUND ................................................................................................................. 2
1.1.1 A VERY BRIEF HISTORY OF CULTURE THEORY AND EVOLUTIONARY CULTURAL THOUGHT ...................................................................................................................................... 2
1.1.2 MECHANISMS OF CULTURAL TRANSMISSION ...................................................................... 5
1.1.3 CONTENT AND CONTEXT BIASES IN CULTURAL TRANSMISSION ................................... 6
1.2 RESEARCH GAPS ADDRESSED BY DISSERTATION ............................................................................. 10
1.2.1 RESEARCH GAP #1: DEFINING PRESTIGE ............................................................................... 10
1.2.2 RESEARCH GAP #2: MEASURING PRESTIGE ........................................................................... 11
1.2.3 RESEARCH GAP #3: EXAMINING PRESTIGE IN CULTURAL TRANSMISSION ................... 11
1.3 CONNECTIONS TO HUMAN DIMENSIONS OF NATURAL RESOURCES ........................................ 12
2. A UNIFIED FRAMEWORK OF PRESTIGE: BRIDGING CONCEPTS FROM THEORY, EXPERIMENT, AND CROSS-CULTURAL RESEARCH .............................................................................................................................. 15
2.1 INTRODUCTION ........................................................................................................................................ 15
2.2 LITERATURE REVIEW ............................................................................................................................... 17
2.2.1 METHODS ..................................................................................................................................... 17
2.2.2 RESULTS AND DISCUSSION ...................................................................................................... 22
2.3 ETHNOGRAPHIC REVIEW ........................................................................................................................ 31
2.3.1 METHODS ...................................................................................................................................... 31
2.3.2 RESULTS AND DISCUSSION ...................................................................................................... 34
2.4 CONCLUSIONS ........................................................................................................................................... 43
3. THE POSITION-REPUTATION-INFORMATION (PRI) SCALE OF INDIVIDUAL PRESTIGE ................... 48
3.1 INTRODUCTION ....................................................................................................................................... 48
3.2 RESULTS ...................................................................................................................................................... 51
3.2.1 STUDY 1: SCALE CONSTRUCTION ........................................................................................... 51
3.2.2 STUDY 2: SCALE EVALUATION ................................................................................................ 53
3.2.3 SCALE VALIDITY AND RELIABILITY ........................................................................................ 55
3.3 DISCUSSION ............................................................................................................................................... 56
3.4 METHODS .................................................................................................................................................. 60
3.4.1 STUDY 1: SCALE CONSTRUCTION .......................................................................................... 60
3.4.2 STUDY 2: SCALE EVALUATION ................................................................................................ 73
4. PRESTIGE AND CONTENT BIASES IN THE EXPERIMENTAL TRANSMISSION OF NARRATIVES ........ 86
4.1 INTRODUCTION ....................................................................................................................................... 86
4.2 RESULTS ..................................................................................................................................................... 89
4.3 DISCUSSION .............................................................................................................................................. 96

vii
4.4 METHODS ................................................................................................................................................. 102
5. CONCLUSION ..................................................................................................................................................... 108
5.1 EMERGENT THEMES ............................................................................................................................... 108
5.2 LIMITATIONS AND FUTURE DIRECTIONS.......................................................................................... 110
REFERENCES ............................................................................................................................................................ 116
APPENDIX 1. ETHNOGRAPHIC DATA FOR SOCIETIES IN A UNIFIED FRAMEWORK OF PRESTIGE: BRIDGING CONCEPTS FROM THEORY, EXPERIMENT, AND CROSS-CULTURAL RESEARCH ............... 154
APPENDIX 2. SUPPLEMENTARY INFORMATION FOR A UNIFIED FRAMEWORK OF PRESTIGE: BRIDGING CONCEPTS FROM THEORY, EXPERIMENT, AND CROSS-CULTURAL RESEARCH ............... 156
APPENDIX 3. SUPPLEMENTARY INFORMATION FOR PRESTIGE AND CONTENT BIASES IN THE EXPERIMENTAL TRANSMISSION OF NARRATIVES ........................................................................................ 165
APPENDIX 4. ADDENDUM TO PRESTIGE AND CONTENT BIASES IN THE EXPERIMENTAL TRANSMISSION OF NARRATIVES: INFLUENCE OF PRESTIGE FACTORS ON RECALL .............................172
A4.1 BACKGROUND ............................................................................................................................172
A4.2 METHODS AND RESULTS ......................................................................................................... 173
A4.3 DISCUSSION ............................................................................................................................... 178

1
“It's my estimation that every man ever got a statue made of him was one kind of sumbitch or another.”
— Malcolm Reynolds, Firefly

2
1. INTRODUCTION
1.1 Theoretical Background
Culture is the conceptual fabric that underlays much of the complexity of human behavior. Though the
term culture has had many and varied definitions, I choose to define culture here as “the geographic and
temporal patterning of behavioral variation that owes its existence to social learning” (adapted from Perry
2009, p. 247; Fragaszy and Perry 2008, p. xiii). The core of this definition of culture, and of many others, is
the spread of behavior—or, more precisely, the information, values, beliefs, and other traits that affect
behavioral variation—through the mechanisms of social learning. Social learning, in turn, is “any
modification of behaviour that is acquired, at least to some extent, by paying attention to the behaviour of
another animal or animals” (Box 1984, p. 213), typically in reference to the behavior of conspecifics or to the
products of their behavior (Galef 1988; Heyes 1994). An array of factors are thought to shape the course of
social learning (or “cultural transmission,” see below), one of the most prominent of which is the relative
prestige of the model from whom one chooses to learn (Henrich and Gil-White 2001). Prestige and its role
in human cultural learning is the central topic of this dissertation, and will be described in detail later in
this introduction and in each chapter. First, however, some background detail on culture, cultural
evolution, and the transmission of cultural information is necessary to frame the discussion and clarify
these definitions.
1.1.1 A Very Brief History of Culture Theory and Evolutionary Cultural Thought
The concept of culture in the anthropological sense dates to well before the foundation of anthropology as a
field, from an agricultural metaphor written by Roman orator Cicero following the loss of his daughter and
shortly before the assassination of Julius Caesar and his own subsequent death; that is: “cultura animi,” or
the cultivation of the human soul (Cicero 45BC). From there, the English term “culture” has taken on many
varied meanings and its interpretation has been the focus of lasting debate within different schools of
American, British, and French anthropology. Kroeber and Kluckhohn (1952) classified the 162 definitions
available at the time as “descriptive” (based on content), “normative” (rules, ideals, values, and behavior),

3
“psychological” (adjustment, learning, or habit), “structural” (organization), or “genetic” (culture as
product, ideas, or symbols). One of the most popular and enduring definitions originated from founding
cultural anthropologist Edward Tylor: “that complex whole which includes knowledge, belief, art, morals,
law, custom, and any other capabilities and habits acquired by man as a member of society” (1871, p. 1).
Together with Lewis Henry Morgan, Tylor introduced cultural evolutionary thought in anthropology. Their
theories were rooted in the popularity of the brand of evolutionary Darwinism of the time, but they, along
with some of their peers (such as Francis Galton), took on the mantle of what is today called “social
Darwinism,” or, more directly, scientific racism. Tylor and Morgan saw cultural evolution as a unilineal
process of development from “savagery” to “barbarism” to “civilization,” each accompanied by levels of
progress in subsistence and technology until reaching the pinnacle of modern civilization which, they
argued, was exemplified by the Anglo-American society of their time (Morgan 1877). Though the notion of
unilineal cultural evolution has today been replaced by a more integrative and cross-culturally grounded
understanding, these biased beliefs continue to influence ideas about the nature of cultural variation and
cultural evolution and are reflected in the language used to describe them (e.g. “Stone Age hunter-
gatherers,” “modernization,” and “international development”).
The central tenet of the modern interdisciplinary field of cultural evolution is that the cultural
material of a society, like the biological material of a species, changes over time in response to evolutionary
forces and constitutes a second inheritance system that can be studied using methods originally developed
in population genetics, epidemiology, and other related fields (Cavalli-Sforza and Feldman 1981; Boyd and
Richerson 1985; Henrich and McElreath 2003; Whiten et al. 2011; Whiten 2017). However, researchers
today are also aware of the strengths and limitations of the evolutionary analogy for cultural change
(Mesoudi et al. 2004; Mesoudi, Whiten, and Laland 2006; O’Brien et al. 2010). For instance, concepts such
as vertical inheritance, competition, selection, and mutation of cultural traits all have close parallels in
biological evolution; however, additional challenges are presented by the sometimes-nebulous “units” of
cultural transmission and the high frequency with which cultural transmission occurs horizontally and
obliquely (see below for definitions of these terms) compared to their rarity in genetic inheritance (Cavalli-
Sforza and Feldman 1973, 1981; Atran 2001; Mesoudi 2007; Henrich et al. 2008). Differences between

4
biological evolution and cultural evolution are important to recognize, not to invalidate cultural
evolutionary approaches, but instead to motivate the development of new methods that are more suitable
for modeling and analyzing data that result from these cultural processes (Gray et al. 2007; Greenhill et al.
2009; Currie et al. 2010).
The study of cultural evolution today can be broadly split into two scales of differing resolution.
First, there is macro-level cultural evolution, which studies large-scale, long-term changes in language,
material culture, or other cultural traits often using phylogenetic methods, large within- and cross-cultural
databases or assemblages, and historical or environmental data (Mace and Holden 2005; Borgerhoff Mulder
et al. 2006; Gray et al. 2010; Mace and Jordan 2011; Kirby et al. 2016; Gray and Watts 2017). Second is
micro-level cultural evolution, which studies the fine-grained details of cultural transmission and the
questions of when, what, from whom, and how people learn (Cavalli-Sforza and Feldman 1981; Cavalli-
Sforza et al. 1982; Hewlett and Cavalli-Sforza 1986; Henrich 2001; Eerkens and Lipo 2005; Mesoudi and
Whiten 2008). “When” questions about cultural transmission are addressed by research into social learning
strategies, or the conditions under which individuals switch from asocial to social learning (Laland 2004;
Rendell et al. 2010, 2011). Choices about “what” and “from whom” people learn appear to be largely
structured by internal cognitive biases that direct preferences for certain types of knowledge and cultural
models (Boyd and Richerson 1985; Richerson and Boyd 2005; and see later discussion on transmission
biases). “How” questions involve the “mode” of transmission, which is made up of its direction (i.e. vertical,
from parent to child; horizontal, from peer to peer; or oblique, from non-parental elders to younger
generations) and its form (e.g. one-to-one or one-to-many; Cavalli-Sforza and Feldman 1981; Cavalli-Sforza
et al. 1982; Hewlett and Cavalli-Sforza 1986; Guglielmino et al. 1995; Hewlett et al. 2002). The specific
copying mechanism used (e.g. imitation versus emulation) also has effects on the “how” of transmission and
on broader cultural dynamics (Whiten et al. 2009; Csibra and Gergely 2009; Schillinger et al. 2015).
Studies of both micro- and macro-level processes are necessary for a complete theoretical
understanding of cultural evolution, as micro-level processes drive the macro-level variation we see within
and between cultures. In this dissertation, I focus on micro-level cultural transmission, but also note the
implications of our results for understanding macro-scale patterns of cultural diversity.

5
1.1.2 Mechanisms of Cultural Transmission
Throughout this document, I refer to the central mechanisms by which information is learned as
“cultural transmission” in humans and as “social learning” in non-human animals, but historically there is
little real distinction between the two terms (Heyes 2017). Cultural transmission is social learning, with the
added implication that the information being learned is cultural (as above, geographically and temporally
patterned between groups), and thus would generally be synonymous with social learning for humans.
Social learning itself is ubiquitous across social animals (Heyes 2012a), including insects (Leadbeater and
Chittka 2007a), and has even been shown in some solitary species such as bumblebees (Leadbeater and
Chittka 2007b) and tortoises (Wilkinson et al. 2010). However, researchers have typically been much more
resistant to ascribe culture to any non-human animals (Tomasello et al. 1993; Boesch and Tomasello 1998;
Herrmann et al. 2007; Tennie et al. 2009). Cultural capacities are undeniably most strongly developed in
humans, but it is my belief that we should maintain a definition of culture—like the one cited at the
beginning of this document—that is maximally inclusive and does not dismiss outright the evolved
capabilities of other human animals. As such, my use of the term cultural transmission rather than social
learning throughout the body of this dissertation is solely for reasons of conformity with common
terminology in the field of cultural evolution, not as an endorsement for human uniqueness.
General social learning mechanisms are theorized to have evolved due to the advantages granted
over purely “trial-and-error” learning that uses classical or operant conditioning, which is referred to in the
literature as individual or asocial learning (Heyes 1994). Specifically, in a social group where everyone learns
individually, a lone social learner can avoid the costs associated with individual learning by freely observing
and copying the strategies used by others, thereby increasing their own relative fitness and contributing to
the eventual spread of social learning through the group (Enquist et al. 2007; Franz and Nunn 2009). In
structured populations (meaning, populations made up of stable subgroups), this can lead to the rise or
fixation of a majority of social learners, even when there is such a high proportion of social learners that
individual learning would have greater fitness (Rendell et al. 2009). Maladaptation can also arise and

6
persist due to the cultural traits that are learned, because learning from the information available in one’s
group does not necessarily result in learning the optimal solution to a given problem, particularly if the
learned information is outdated in relation to rapidly changing social or environmental conditions, or if a
trait is favored for reasons other than its direct fitness benefits (e.g. recreational drug use), or if potentially
better variants were lost to random drift-like processes (Feldman et al. 1996; Laland and Williams 1998;
Henrich 2004a; Lehmann and Feldman 2009). Social learning is not always optimal; however, we do see
that it is ubiquitous in humans and common across many other species, as outlined previously. Therefore,
social learning likely provides a fitness benefit relative to individual learning more often than not. Under
the argument for “cultural group selection,” the increase in fitness need only be true for the group as a
whole, if social learning allows the group to outcompete other groups that do not learn socially (Henrich
2004b; Boyd and Richerson 2010; Richerson et al. 2015). For cultural transmission in humans, we
additionally find that, if learning is selective—i.e. that there is some cognitive bias that aids learners in
finding more highly successful cultural variants—the relative benefits of cultural transmission are enhanced
significantly (Boyd and Richerson 1995; Henrich and Boyd 2002; Enquist et al. 2007; Morgan et al. 2012).
Much research effort has been devoted to exploring these proposed cognitive biases in the context of
cultural transmission, including the effects of prestige.
1.1.3 Content and Context Biases in Cultural Transmission
Formal theory on cultural transmission biases dates back to foundational works in cultural
evolution (e.g. Boyd and Richerson 1985). Boyd and Richerson distinguished between three types of
transmission biases: “direct,” “indirect,” and “frequency-dependent” (1985, pp. 134–136). Today, terminology
has shifted such that direct biases are referred to as “content-based,” indirect are “model-based,” and both
indirect and frequency-dependent biases fall under a broader category of “context-based” biases (Figure 1.1;
Rendell et al. 2011). Though often phrased as “strategies” or “choices” in the literature—in the game theory
sense of the words (Taylor and Jonker 1978)—cultural transmission biases are not suggested to be fully

7
conscious decisions in most cases; rather, they are the result of internal, evolved cognitive processes (Heyes
2016).
Figure 1.1. Partial taxonomy of cultural transmission biases. Includes context-based and content-based biases proposed by Boyd and Richerson (1985) and others, and draws from those compiled by Rendell et al. (2011). Content-based transmission biases refer to some inherent quality of the information that aids its
transmission, or “judgments about the properties of the variants themselves” (Boyd and Richerson 1985, p.
10). This could relate to the inherent attractiveness of the information in a specific cultural context, or to
different types of information that are more salient to human cognition. Some of the content types
proposed in the literature are: emotional information that a elicits a strong negative response (Heath et al.
2001; Eriksson and Coultas 2014; Fessler et al. 2014; Stubbersfield et al. 2017), social information that
relates to interactions between people or survival information about fitness-relevant aspects of the
environment (Mesoudi, Whiten, and Dunbar 2006; Nairne et al. 2007; Otgaar and Smeets 2010;
Stubbersfield et al. 2014), and moral information regarding social norms and rules of behavior (Heath et al.
2001; Baumard and Boyer 2013). Content biases, which represent the information independent of the model
providing it, have received less attention in the cultural evolution literature, but could potentially have

8
major effects on transmission processes (Mesoudi and Whiten 2008). Further details on content-based
biases are given in Chapter 4 of this document, where we explore the effects of content in an experimental
transmission context.
Context-based transmission biases have something to do with either “the observable attributes of
the individuals who exhibit the variant” (model-based biases; Richerson and Boyd 2005, p. 69)—with
“variant” here referring to alternatives for a particular cultural trait, similar to the relationship between
alleles and genes—or the frequency or rarity of the variant in the population (conformity or anti-conformity
biases, respectively; Richerson and Boyd 2005, p. 69). Specifically, there are a number of qualities of the
cultural model that could influence a learner’s choice of from whom to learn or what to learn from that
individual. For instance, the prestige (Henrich and Gil-White 2001), success (Mesoudi 2008), or familiarity
(Wood et al. 2013) of an individual, or their degree of similarity to the learner (McElreath et al. 2003) could
all lead to a preference for that individual as a cultural model. In terms of trait frequency in the overall
population, researchers presume that conformity—copying the most frequent variant—has a low cognitive
requirement and a relatively high payoff and therefore is likely to be a common strategy in humans and in
other animals (Laland et al. 2011). Context-based biases have received a great deal of attention in the
literature, particularly conformity bias (Henrich and Boyd 1998, 2001; Kohler et al. 2004; Eriksson et al.
2007; Efferson et al. 2008; Kendal et al. 2009; Morgan et al. 2012; Muthukrishna et al. 2016) and prestige
bias (Henrich and Gil-White 2001; Henrich and Boyd 2002; Chudek et al. 2012; Atkisson et al. 2012; Bell
2013; Henrich et al. 2015; Jiménez and Mesoudi 2019).
Under prestige-biased transmission, individuals are theorized to show a preference to learn from
“the most highly skilled and competent” cultural models (Cheng and Tracy 2013; but see later discussions
on the definitions, determinants, and consequences of prestige). In their original conceptualization of
prestige bias and other model-based biases, Boyd and Richerson (1985, pp. 241–279) propose that learners
should be expected to use “indicator traits” such as wealth or skill to evaluate the quality of a potential
behavioral model in situations where individual learning is costly and where it is difficult to determine the
specific traits that led to the model’s success. This reliance on prestige as a shortcut for evaluating models,

9
and the benefits gained, can lead to a runaway process wherein individuals pursue traits that emphasize
their prestige at the possible cost of actual reproductive fitness (Bliege Bird and Smith 2005; Ihara 2008).
One model for understanding prestige and evaluating prestige-biased transmission, proposed by
Henrich and Gil-White (2001), has addressed the use of prestige as a proxy for quality and the possible
context of its evolution. In the 2001 paper and subsequent publications by Henrich and colleagues (Henrich
and Boyd 2002; Henrich and McElreath 2003; Henrich 2009; Cheng et al. 2010; Chudek et al. 2012; Cheng
et al. 2013; Cheng and Tracy 2013, 2014; Henrich et al. 2015), the authors argue that prestige is an evolved
mechanism for attaining status in a social hierarchy, one that is unique to humans. Further, they propose
that prestige-based hierarchies are distinct from ones based upon dominance, which are more common in
other animals than in humans. Prestige evolved to be a desirable trait, according to Henrich and colleagues,
because of the benefits gained through the “deference” granted by competing potential cultural learners,
given in exchange for the opportunity to maintain proximity and learn from the prestigious individual. This
deference then began to be used as a signal of the most successful individuals in the group, aiding the
identification of ideal models for cultural transmission. However, the exact determinants that lead to an
individual gaining prestige and the consequences encompassed by the term “deference” are not clearly laid
out in this model, and some of the empirical work investigating prestige has not supported the model’s
predictions (Jiménez and Mesoudi 2019). Nonetheless, the Henrich and Gil-White (2001) model continues
to be highly influential in the literature.
In this dissertation, I focus specifically on the term “prestige” due to its importance in the cultural
evolution literature and its proposed causal effects in cultural transmission, in which it has a meaning
distinct from related terms such as “status” (see Henrich and Gil-White 2001). The relationships between
prestige and these other concepts are explored in Chapter 2 and Chapter 3, where we attempt to define and
develop measures of prestige. By doing so, we can more clearly distinguish prestige from other related
terms and clarify its usage in cultural evolution and in other disciplines.
Prestige-biased cultural transmission has been investigated using a number of different
methodological approaches (Jiménez and Mesoudi 2019), using the Henrich and Gil-White (2001) model or
more general definitions in the cultural evolution literature, that provide theoretical predictions and

10
empirical data of its effects on cultural transmission and its expected impacts on cultural macroevolution.
However, three key questions remain regarding prestige and its role in cultural learning and cultural
change. These three research gaps form the core focus of this dissertation, and I outline each below.
1.2 Research Gaps Addressed by Dissertation
1.2.1 Research Gap #1: Defining Prestige
In human societies, prestige contributes to social stratification and inequality, and therefore is a concept of
central importance to many disciplines in the social sciences and beyond (Weber 1922; Trudgill 1972;
Wegener 1992; Harbaugh 1998; Smidts et al. 2001). In addition, prestige impacts many other aspects of
daily life, from cultural learning (Boyd and Richerson 1985; Henrich and Gil-White 2001) to purchasing
behavior (Vigneron and Johnson 1999). However, the precise meaning of prestige is often ambiguous in the
academic literature, with multiple coexisting and competing concepts within each discipline.
Accompanying this breadth of definitions, many possible determinants and consequences of prestige have
been proposed. Further, prior research on prestige has overwhelmingly focused on the perceptions of
people in Western societies, without considering ways in which prestige concepts could vary cross-
culturally. In Chapter 2, we address these questions in and of the academic literature on prestige, using an
integrative and transdisciplinary perspective. First, we conducted a systematic review of the Western
academic literature, with a specific focus on how different authors define prestige, and on the proposed
determinants and consequences of prestige, and find that the prestige literature is highly fragmented and
inconsistent. We then brought together the common elements of the literature, with components from
systems theory and social role theory, to construct a unified framework in which we integrate previous
ideas on prestige into a more holistic and comprehensive prestige concept. Finally, we conducted a separate
systematic review of the ethnographic literature for a diverse set of non-Western societies to explore cross-
cultural variation in prestige concepts, and to evaluate the utility of the unified framework for future
research. We found that a great deal of cross-cultural variability exists in how societies perceive and
operationalize prestige, not only between Western and non-Western societies, but also among non-

11
Western societies. We conclude by offering an integrative definition of prestige and exploring the
implications of this definition and the unified framework of prestige for future research on prestige across
disciplines.
1.2.2 Research Gap #2: Measuring Prestige
A number of scales currently exist that quantify prestige based on occupations (Duncan 1961; Nakao and
Treas 1992; Ganzeboom et al. 1992), organizations (Mael and Ashforth 1992; Smidts et al. 2001), brands
(Deeter-Schmelz et al. 2000; Vigneron and Johnson 2004), and other assessments (Blaikie 1977; Wegener
1992). However, these existing scales fail to account for the full breadth of potential determinants of
prestige or focus only on the prestige of collective social institutions rather than the individual-level
perceptions that underpin everyday social interactions. In Chapter 3, we use open, extensible methods to
unite diverse theoretical ideas into a common measurement tool for individual prestige. Participants
evaluated the perceived prestige of regional variations in accented speech using a pool of candidate scale
items generated from free-listing tasks and a review of published scales. Through exploratory and
confirmatory factor analyses, we find that our resulting 7-item scale, composed of dimensions we term
position, reputation, and information, or “PRI,” exhibits good model fit, scale validity, and scale reliability.
The PRI scale of individual prestige contributes to the integration of existing lines of theory on the concept
of prestige, and the scale’s application in Western contexts and extensibility to other cultures serves as a
foundation for new theoretical and experimental trajectories across the social and behavioral sciences.
1.2.3 Research Gap #3: Examining Prestige in Cultural Transmission
Context-based cultural transmission biases such as prestige are thought to have been a primary driver in
shaping the dynamics of cultural evolution and behavior change (Henrich and Gil-White 2001; Henrich and
Boyd 2002; Henrich et al. 2015). However, few empirical studies have measured the importance of prestige
relative to other effects such as those of content biases, which are inherent to the information being
transmitted (Heath et al. 2001; Atkisson et al. 2012; Morgan et al. 2012; Stubbersfield et al. 2015; Acerbi and

12
Tehrani 2018). In Chapter 4, we report the findings of an experimental study of cultural transmission
designed to compare the simultaneous effects of high- or low-prestige models and the presence of content
containing social, survival, emotional, moral, rational, and counterintuitive information. Our results reveal
that prestige is a significant factor in determining informational salience and recall, but that several content
biases, including social, survival, negative emotional, and biological counterintuitive information, are
significantly more influential. Further, we find that prestige is utilized as a conditional bias in determining
the transmission of unbiased information when no content cues are available. We demonstrate that no
single bias fully explains variation in recall in the transmission of narratives, but that content biases serve a
vital and underappreciated role in realistic transmission settings where multiple biases are simultaneously
present. This work presents a novel experimental framework that has implications for the experimental
study of cultural transmission and for the application of cultural evolutionary theory to real-world
problems, as well as emphasizing the value of storytelling as a cross-culturally relevant model for cultural
transmission.
1.3 Connections to Human Dimensions of Natural Resources
Research on cultural evolution, and specifically cultural transmission, intersects in many ways with the
study of human dimensions of natural resources and conservation social science. Conservation and
management are ultimately efforts to solve a problem of human behavior (Schultz 2011); they are “initiated
by humans, designed by humans, and intended to modify human behavior” (Mascia et al. 2003). The
human dimensions approach represents the application of social science theory to solve management
issues, using the best information possible (Manfredo et al. 1995). Therefore, an understanding of human
behavior and of how variation in behavior is driven by cultural learning are critical to reaching better
outcomes in conservation conflicts (Redpath et al. 2013). I will highlight two ways that cultural
transmission research can contribute to human dimensions and conservation social science, specifically
through its connections to environmental behavior and communication and the role it plays in shaping
diverse knowledge systems.

13
Human dimensions and conservation social science are highly interdisciplinary endeavors,
incorporating perspectives from diverse fields including environmental psychology, human geography,
environmental anthropology, and human ecology (Bennett et al. 2017). One branch has focused on the
application of theory from social psychology (Fulton et al. 1996; Vaske and Donnelly 1999; Teel et al. 2015;
Bennett et al. 2017). In classic models such as the theory of reasoned action (Fishbein and Ajzen 1975) and
planned behavior (Ajzen 1985) and the value-attitude-behavior model (Homer and Kahle 1988), knowledge
is linked to behavior through the attitudes that one holds. Values serve as the foundation upon which
attitudes and beliefs are built, and their degree of homogeneity or heterogeneity within a culture is shaped
by cultural transmission (Bisin and Verdier 2000; Schultz 2002). Recent models of behavior are more
complex and acknowledge that behavior is driven by a range of additional internal and external factors
(Kollmuss and Agyeman 2002), including social norms and economic motives (McKenzie-Mohr 2000),
which are also culturally based and transmitted. Cultural evolution thus links easily into human dimensions
research by providing context on the learning and spread of concepts like values, attitudes, and norms that
are already well-established in human dimensions theory, and can provide a deeper level of understanding
on how these concepts affect behavior. A major goal of human dimensions and conservation social science
research is to use persuasive communication campaigns and environmental education as mechanisms to
drive behavior change (McKenzie-Mohr 2000). However, this literature has not engaged much at all with
research on cultural evolution and cultural transmission, representing a major gap that this dissertation can
begin to address. A better understanding of cultural evolution and the effects of cognitive transmission
biases can inform work to shape more effective and impactful messages that motivate pro-environmental
behavior change.
In human dimensions and in social ecological systems research more broadly (Ostrom et al. 2007),
there has been a focus on the value of traditional ecological knowledge (“TEK,” or Indigenous ecological
knowledge, “IEK”) in broadening the capacity and representation of solutions to problems based in human-
environment interactions (McCarter et al. 2014). Cultural transmission is important to the maintenance of
traditional knowledge and, indeed, the common definition of TEK references it directly: “a cumulative body
of knowledge, belief and practice, evolving by adaptive processes and handed down through generations by

14
cultural transmission” (Berkes 2012, p. 7). Preserving the specialized knowledge of a local ecology, the
cultural beliefs and practices that have adapted to and coevolved with that ecology, and the means by
which they are transmitted and maintained is a critical part of biocultural conservation efforts and crafting
management decisions that benefit local stakeholders (McCarter et al. 2014; Gavin et al. 2015). In particular,
the pathways of TEK (cultural) transmission are eroding and shifting for many societies across the world
due to a number of social and cultural factors, including the impacts of Western-style schooling, which
differs markedly from traditional experiential and observational ways of learning (Gómez-Baggethun et al.
2013; Tang and Gavin 2016; Berl and Hewlett 2015). A better understanding of these cultural transmission
pathways and future research that integrates a cultural evolutionary approach are vital for preserving TEK
by mitigating or adapting to these widespread changes in knowledge systems (McCarter et al. 2014).
Aside from the two primary contributions above, which come from cultural transmission work on
humans, we can also consider the impacts of social learning in non-human species. As humans transmit
information, so too does the wildlife that natural resources and human dimensions practitioners seek to
manage (Whittaker and Knight 1998). As mentioned in earlier theoretical discussions, a number of
threatened and endangered animal species learn in a way that many researchers consider cultural,
including chimpanzees, orangutans, and orcas (including endangered southern residents: Riesch et al.
2006). Other species that are commonly impacted by management efforts also show evidence of social
learning of local ecological information, including North American ungulates (Jesmer et al. 2018) and large
carnivores (Macdonald 1983). Management of these species calls for special consideration of factors such as
the spread of information within and between groups, including patterns of adaptive and maladaptive
behaviors, and the isolation or loss of cultural knowledge (Whitehead et al. 2004; Ryan 2006; Whitehead
2010).
Culture underlies and shapes human behavior, including our behavior towards the environment.
Through a better understanding of the process of cultural transmission, and the cognitive biases such as
prestige that affect what people learn and from whom they learn it, we can craft more effective, more
enduring, and more inclusive solutions to the diversity of issues in conservation and management.

15
2. A UNIFIED FRAMEWORK OF PRESTIGE: BRIDGING CONCEPTS FROM
THEORY, EXPERIMENT, AND CROSS-CULTURAL RESEARCH
2.1 Introduction
Across human history and the breadth of human cultures, the idea of status has served to structure our
societies, our behavior, and the courses of our lives. Status indicates one’s position in a social hierarchy, and
that position affords privileges that lead to material inequalities in access to resources of various kinds,
from food to wealth to reproductive opportunities. We are not alone in our reliance on status hierarchies;
dominance-based hierarchies are common among other animals, particularly primates (Smith et al. 2016).
However, in human societies, social stratification is typically built upon the concept of prestige, rather than
dominance (Barkow 1975; Henrich et al. 2015). Research points to the concept of prestige being rare outside
of humans (Horner et al. 2010), ingrained early in development (Mascaro and Csibra 2012, 2014; Enright et
al. 2017), and present across the range of human cultures (Anderson et al. 2015), even in small-scale
societies that have less stratification (von Rueden et al. 2010; von Rueden and Jaeggi 2016; Garfield et al.
2019).
Because prestige forms the foundation of social stratification and structural inequalities in human
societies, it has become a concept of central importance to the theory of many disciplines, particularly in
the social sciences. In sociology, for instance, prestige has been a foundational part of theory since the time
of Weber (1922), where—as “occupational prestige” or as a component of socioeconomic status—prestige is
closely associated with an array of social factors and outcomes, including education, income, identity, and
physical and mental health (Zhou 2005; Rivas-Drake et al. 2009; Fujishiro et al. 2010). In business and
economics, perceptions of “organizational prestige” and “brand prestige” affect identity and morale within
companies, negotiations between companies, public reputation and image, and the valuation of products
and services (Perrow 1961; Ashforth et al. 2008; Highhouse et al. 2009; Baek et al. 2010). In political science
and international relations, “national prestige” is seen as a critical factor in determining the course of
diplomacy and the outbreak of warfare between states, and is leveraged in the enforcement of national
security and global stability (O’Neill 2006; Kennedy 2010; Wood 2013; Dafoe et al. 2014). Cultural

16
anthropology, archaeology, and marketing share an interest in the presence, material qualities, and
conspicuous display of “prestige goods” in daily life, burial, ritual, and other contexts that provide crucial
insights into the differentiation, connectivity, and behavior of present and past societies (Corneo and
Jeanne 1997; Plourde 2009; Bentley et al. 2012). Further examples exist across almost every academic field,
including the study of prestige in academia itself (Keith and Babchuk 1998; Burris 2004).
Recently, with the development of cultural evolution as an established interdisciplinary field
(Henrich and McElreath 2003; Mesoudi, Whiten, and Laland 2006; Brewer et al. 2017), prestige has been a
topic of renewed interest in studies of social learning and cultural transmission (Jiménez and Mesoudi
2019). Prestige appears to have the potential to powerfully influence people’s choice of from whom they
learn different types of information, which in turn shapes the broader dynamics of cultural change (Boyd
and Richerson 1985; Henrich and Gil-White 2001; Henrich and Boyd 2002).
However, in this line of research on prestige-biased transmission and in other work across
disciplines—including the examples given above—the precise meaning of “prestige” is often left ambiguous
(Morin 2016a, pp. 115–119, 2016b) and is operationalized using disparate methods from study to study
(Jiménez and Mesoudi 2019), such that it is unclear whether studies from different academic traditions are
measuring the same concept (for example, occupational prestige: Blaikie 1977; Guppy and Goyder 1984;
Wegener 1992). As a corollary problem, authors have proposed a vast assortment of possible determinants
of prestige—from respect, esteem, or skill, to “an inherent, unique know-how” (Dubois and Czellar 2002),
among many others—as well as many potential consequences and benefits that result from having
prestige—such as deference, attention, and reproductive fitness. Moreover, prior research on prestige has
predominantly focused on societies that are Western, educated, industrialized, rich, and democratic
(“WEIRD”: Henrich et al. 2010), without considering ways in which prestige could vary cross-culturally
(with a few notable exceptions, see: Reyes-García et al. 2008, 2009; von Rueden et al. 2008, 2010; von
Rueden and Jaeggi 2016). If not addressed, this Western bias could lead to deeply flawed generalizations of
how prestige operates across diverse human societies, based on conclusions from studying only a small
percentage of the world’s population (Arnett 2008).

17
In the present synthesis, we aim to resolve some of these critical questions in and of the literature,
using an integrative perspective that cuts across traditional disciplinary lines. First, we conduct a systematic
review of the Western academic literature, with a specific focus on how prestige is defined and on proposed
determinants and consequences of prestige. We then explore the variation in prestige definitions,
determinants, and consequences across fields and bring together common elements to construct a
framework by which previous theories can be integrated into a more holistic and comprehensive prestige
concept. Finally, we conduct a separate systematic review of the ethnographic literature for a diverse set of
non-Western societies to explore cross-cultural variation in prestige concepts, and to evaluate the utility of
the unified framework for future research. By doing so, we hope to clarify the state of the literature
regarding prestige and establish a cross-disciplinary understanding that can serve as a foundation to further
illuminate the function of prestige in human culture and cultural change.
2.2 Literature Review
2.2.1 Methods
2.2.1.1 Eligibility Criteria
We deemed all published, peer-reviewed journal articles, books, or book chapters focused on the concept of
prestige from any discipline as eligible for review. Works must have been written primarily in English and
have made an attempt to explicitly define or measure prestige in some way. Given our own research
interests in the relevance of prestige to cultural evolution, we also included studies that made specific
reference to the role of prestige in the cultural evolutionary mechanisms of social learning or cultural
transmission.
2.2.1.2 Information Sources
We identified studies through Google Scholar (n = 953) and Web of Science (n = 305). We conducted the
first search on July 6th, 2016, and the last on July 8th, 2016.

18
2.2.1.3 Search
Due to the widespread use of the term “prestige” with varied meanings in diverse contexts and the desire to
capture works focused narrowly on the concept of prestige itself, we specifically required that the word
“prestige” appear in the title of each work. We included additional search terms to restrict the scope to
works wherein prestige or its determinants or consequences were explicitly defined or measured, or were
related to social learning or cultural transmission, as mentioned above.
Search strings used for Google Scholar took the general form: “intitle:prestige AND (“define
prestige” OR “defining prestige” OR “defined prestige” OR “definition of prestige” OR “prestige * defined”)”.
Eleven additional searches used variations on this structure to capture differences in word choice
(specifically: describe, characterize/se, measure, and quantify), alternate sentence forms, or specific types of
prestige (using a wild card operator between words, e.g. “define * prestige”). One final search, for a total of
13 Google Scholar searches, included terms related to social learning and cultural transmission:
“intitle:prestige AND ("social learning" OR “socially learned” OR “cultural learning” OR “culturally learned”
OR "social transmission" OR “socially transmitted” OR "cultural transmission" OR “culturally
transmitted”)”.
Web of Science allowed for more flexible construction of searches, including word stemming, and
yielded substantially fewer matches, so only two searches were necessary: “TI=prestige AND TS=(defin* OR
descri* OR characteri* OR measur* OR quantif*)” and “TI=prestige AND TS=(social OR socially OR cultural
OR culturally) AND TS=(learning OR learned OR transmission OR transmitted)”.
2.2.1.4 Study Selection
Given the volume of studies returned across all searches (n = 1,258), we pared down the pool of matches
using a number of criteria. First, we removed duplicate matches across searches and any works not
matching the stated eligibility criteria. This included removing studies that matched the search terms but
were unrelated to the topic of the present review (e.g. those related to the sinking of the oil tanker MV
Prestige). We excluded gray literature, theses and dissertations, conference proceedings, book reviews,

19
unpublished manuscripts, and studies published in journals that were not peer-reviewed or were known to
be predatory2.
We then made two additional cuts to the full pool of matches. The first, for reasons of
manageability, was to remove all full books (retaining book chapters), except for those deemed “influential.”
The criterion we used to label a work as “influential” was that its citation count be above the third quartile
plus 1.5 times the interquartile range (Tukey’s (1977) classification of an outlier). For determining influential
books, the set of citation counts being compared included all matching books and was not restricted by
subject area. In the second cut, we eliminated journal articles that had no citations and were more than 3
years old (published prior to 2014) to remove works that were not actively contributing to the broader
discourse.
The above selection methods resulted in a pool of 443 works. As we deemed this too large for full
manual review, we elected to take a stratified sample of these studies. To ensure a breadth of representation
across disciplines, including those not typically included in theoretical discussions of prestige, we
constructed the sample to include a minimum of 25 studies (or as many as were available up to 25)
randomly selected from each subject area (based on journal categorization by Scopus). We also randomly
selected half of the book chapters (12/25) for inclusion, as well as the 2 “influential” books, defined using
the same criterion as above. After this, we selected one study at random from each remaining subject area
in sequence until the sample reached a total of 200 works. Lastly, we included any remaining “influential”
book chapters, as well as any remaining “influential” journal articles within each subject area. The final
sample, thus constructed, consisted of 226 studies.
Relevant studies that did not fulfill all of these criteria or were not selected as part of the sample for
full review were still considered in the interpretation and discussion of the results of the review.
2 This was assessed using Beall’s List of Predatory Journals and Publishers (Beall 2016), which was withdrawn in January 2017.

20
2.2.1.5 Data Items and Collection
From each study in the sample, in addition to standard reference information, we manually collected data
on: 1) the study type; 2) the prestige concept being referenced by the study, if any; 2) the text, concept, and
cited source of any definitions given for prestige; 3) the text of any prestige determinants suggested by the
author(s); 4) the text of any prestige consequences suggested by the author(s); and 5) whether the study
took an explicitly evolutionary perspective on prestige.
The study type variable classifies each study by the methods used, split broadly into empirical,
theoretical, review, commentary, or applied works, with nested levels of finer distinctions within these
types. The concept variables refer to traditional prestige concepts that are regularly referred to as topics of
academic study, for example: occupational prestige, brand prestige, linguistic prestige, and prestige-biased
transmission (Appendix 2, Table A2.1).
The two variables for prestige determinants and consequences were used to differentiate the stated
or implied causal placement of terms related to prestige, as either contributing to the accumulation of
prestige or resulting from the accumulation of prestige. These terms were drawn from the studies by
searching within a 1- to 2-paragraph vicinity of any appearance of the word prestige (or its derivatives, e.g.
“prestigious”), as well as related tables, sidebars, and any other relevant sections of the text, and were
recorded as written (with extraneous “stop words” removed). These terms were included if they were
mentioned by the author in any context as being associated with high prestige (rather than low), regardless
of whether a causal relationship was supported by evidence. Each term was noted only once for each
category per study, in order of first mention. A note was made for any sources or terms that referred
exclusively to men, to women, and/or to individuals in a non-Western culture, to enable finer analyses of
these terms and exclude non-Western examples from characterizations of prestige in “Western” society.
Lastly, an evolutionary perspective was evidenced by the use of population-level thinking and
references to evolutionary concepts such as selection, fitness, and transmission. We noted this to track
sources that were relevant to discussions to prestige-biased transmission in cultural evolution, an active
theme in our research (Berl et al. [in prep.]; Samarasinghe et al. [in prep.]; Berl [this document]).

21
We retrieved article-level citation counts from Google Scholar using the Publish or Perish software
(Harzing 2016). We retrieved journal-level metrics, rankings, countries of publication, and subject areas
from Scimago and Scopus and manually matched them with studies in the sample. We also retrieved
citation counts for books and book chapters, and assigned subject areas based on their catalogue data.
2.2.1.6 Risk of Bias
Efforts were made to reduce bias in the sample by allowing published works from any academic field and by
constructing a stratified subsample to ensure all fields were represented. However, sources of potential bias
still exist. Citation count was used as a screening mechanism to focus on literature that is representative of
the current discourse, but citation count is not necessarily an indicator of quality. Similarly, restrictions on
English-language and peer-reviewed works are exclusive by nature and may lead to uneven representation
of ideas. This risk may also be spread unevenly across fields, as some disciplines—for instance, computer
science or natural resource management—are more likely than others to present results in formats such as
conference proceedings or gray literature rather than in peer-reviewed academic publications. The
publication process itself also introduces a level of bias that we are unable to account for in our sample.
Perspectives on prestige likely change over time, so transitions could have occurred over the span
of time represented by the range of publication dates in the sample. The aggregation of results from across
studies means that the “Western prestige concept” examined here should only be regarded as a general
representation of views over that time period.
2.2.1.7 Analyses
We tabulated the number of studies in each subject area and calculated the proportion of studies using
each prestige concept. Using the citation data for prestige definitions collected during the review, we
constructed a bibliometric network by representing citations as directed edges from the citing study to the
cited study. We then visualized this network and calculated the descriptive statistics that apply for a
network with disconnected components.

22
Using the full list of unique terms or phrases used to describe determinants and consequences of
prestige, we constructed a list of synonyms by which terms with common meaning could be grouped.
Generally, this procedure consisted of replacing multi-word phrases with a single-word synonym and
converting words to the form of an adjective, when used as a description, or a noun, when referring to a
domain of knowledge or expertise (e.g. “influence” to “influential” and “experience serving military” to
“military”). We took into account the intention and connotations used for these terms in the original texts
in determining these groupings. Following this procedure, we reduced the list of unique terms to 459.
Using the levels of social stratification or stages in role processes assigned to each prestige determinant and
consequence (see Results and Discussion), we then tabulated the proportion of terms that fell within each
level or stage, which terms were most or least common, and tested how the distributions of terms within
levels and stages differed between the determinants and consequences of prestige.
2.2.2 Results and Discussion
In terms of general statistics, the literature review sample exhibited a wide spread of attributes and
perspectives. The year of publication for the studies in the sample ranged from 1938 to 2016 (Median =
2005, Q1 = 1985, Q3 = 2012). Citation counts ranged from 0 (for 19 studies) to 1,953 (for 1 study; M = 99, SD
= 245). The majority of the sample consisted of empirical studies (n = 114; 76.5%), and theoretical papers (n
= 27; 18.1%), with the remaining 5.4% split between reviews and commentary articles. There were no
applied studies in the sample.
In examining the connections between studies in the form of prestige definitions and concepts, we
find that the literature discussing prestige is highly fragmented and inconsistent. A network diagram of the
studies in the sample and their connections to the sources of the definitions that they cite shows a
disconnected network (Figure 2.1), with 34 isolated components delineating particular schools of thought
within different disciplines. Of the definitions represented, Henrich and Gil-White (2001) is the most-cited,
with 18 incoming connections (“indegree”), and it has 36 other studies connected within its component,
making it the largest in the network. In turn, aside from dictionary entries, Henrich and Gil-White (2001)

23
only cited one other definition (Miller and Dollard 1941), and does not seem to have had a major influence
on other isolated disciplinary prestige concepts aside from prestige bias and particularly evolutionarily-
minded studies in prestige goods and historical sociolinguistics. General definitions were most common in
the network overall (n = 59), with occupational prestige the most common non-general concept (n = 40).
Additionally, though the search and eligibility criteria were designed to locate studies that explicitly defined
or measured prestige, 98 of the 226 studies examined (43.4%), while focused on the concept of prestige,
failed to define it themselves or cite another work that defined prestige.
Figure 2.1. Network diagram of prestige definitions citations. Connections are depicted as arrows (edges) from the citing paper to the cited paper (nodes), each represented by first author and year. The colors of nodes indicate the prestige concept referenced in the citing paper or cited definition. The relative size of nodes depicts their number of citations (indegree).
We see from these analyses that there is very little cross-disciplinary conversation on prestige, in
terms of theory or experiment. Academic networks are highly isolated and cultivate their own prestige
concepts with minimal cross-pollination of ideas, even within particular fields of study. Likewise, it is clear
that there is no single universal definition of prestige, but a broad collection of definitions (over 150, not
including minor variations) that vary broadly in focus and scope. When prestige is defined at all, the

24
definitions cited tend to be tied to influential studies focused on specific prestige concepts that have been
passed down within traditions of research. The few studies that have taken a general, cross-disciplinary
perspective on prestige (e.g. Henrich and Gil-White 2001) have been the most successful at making
connections and are among the most highly cited studies in the sample, but have thus far not served to
unify the disparate lines of prestige research. The results as a whole demonstrate that the study of prestige
is not a cohesive body of knowledge and lacks a unified framework.
Across the literature sample, we collected a total of 2,780 proposed determinants of prestige (1,970
unique) and 1,179 proposed consequences (903 unique). Following synonym replacement (as described in
the Methods), this was reduced to 425 unique determinants and 211 unique consequences. For these terms,
we calculated an accumulation curve (Appendix 2, Figure A2.1) using the exact sample-based rarefaction
method (Chiarucci et al. 2008) that shows that the number of unique terms (after grouping by synonyms)
approached saturation from this sample. This indicates that enlarging the sample size beyond the 226
studies included would not contribute much additional information as the majority of unique terms were
acquired within the first 100 studies, regardless of the order in which they were sampled.
The most commonly implicated determinants of prestige were skilled and educated (n = 50 each),
followed by status (n = 39), reputable and knowledgeable (n = 38 each), powerful, occupation, income,
important, and gender (n = 36 each), wealthy and respected (n = 34 each), valued (n = 33), quality (n = 32),
and influential and academic (n = 27 each). For proposed consequences of prestige, the most frequent in the
sample were influential (n = 42), deference (n = 38), status (n = 35), signaling (n = 32), attractive (n = 31),
powerful (n = 26), social learning (n = 20), respected (n = 19), self-esteem and admired (n = 18 each), wealthy
(n = 16), satisfaction and (reproductive) fitness (n = 15 each), employment (n = 14) and imitation (n = 13).
Based on our descriptive examination of these proposed determinants and consequences, we saw there was
a need for a more fine-grained qualitative analysis but, at this stage, lacked a framework to do so.
From the initial results obtained over the course of conducting this review, it became clear to us
that different fields seem not to be talking about different types of prestige, but of different elements of
prestige. There is occupational prestige, and national prestige, and linguistic prestige, but, in reality,
individuals are not perceived by one another as exemplars of only their occupation, their nation, or their

25
language (or any other trait implicated in this review, such as ethnicity, age, or gender). Rather, in the
words of philosopher Lewis R. Gordon, “we (human beings) don’t ‘see’ race, gender, class, or sexual
orientation walking around; we exemplify, coextensively, all of these, all the time, in different ways” (2018,
pp. 30–31). The suite of traits that contribute to or result from prestige are embodied in multifaceted
individual people that inherit or attain these qualities and the prestige (or lack thereof) associated with
them from their parents, their ethnolinguistic affiliations, their institutional memberships, and the full
array of other cultural constructs, as well as their own behavior. All levels of a stratified social system
contribute to individual prestige, and the prestige associated with these identities are in turn shaped by
people.
These realizations led us to construct a relatively simple framework that represents the idea of
prestige as a holistic system with contributions from all levels of social structure: from external
environmental conditions, to cultural, institutional, collective, relational, individual, and symbolic factors
(Figure 2.2). Individuals are the foundation of this model in that individual people acquire and use prestige
and have belongings (both material and immaterial) that may confer prestige, while also themselves
belonging to larger social structures. The overall structure reflected in the framework was defined based on
ideas of the development of structure from social behavior and relationships (Hinde 1976) and from
applications of systems theory to social structure (Parsons and Smelser 1956; Bronfenbrenner 1979; Holling
2001; Ostrom 2005, 2007), and should be recognizable in general form and function to a researchers across
fields. To maximize the applicability of our model across the social sciences, we derived our definitions of
each level of stratification (Table 2.1) from standard reference materials (Calhoun 2002; Outhwaite 2003).

26
Figure 2.2. Unified framework of prestige. Depicts social structure as a stratified multilevel system that, in combination with the outcomes of social role processes, determines perceptions of individual prestige. See Table 2.1 for the definitions used for each term.

27
Table 2.1. Glossary of terms used to describe levels of social structure and stages in social role processes. Levels and stages were used in building the framework of prestige and in categorizing the determinants and consequences of prestige.
Level of Social Structure
Definition
Environmental conditions or features of physical, chemical, or ecological systems that are relatively unchanged by culture
Cultural
value judgments related to systems of learned and inherited knowledge, meaning, and significance that shape individual perceptions and behavior; here, excluding those that are specific to one social group or evaluations of individuals
Institutional established societal structures, systems, practices, or organizations that are not limited to members of one social group
Collective shared identities, histories, experiences, or qualities of more than two individuals that define them as members of a bounded, exclusive group
Relational coordinated behavior, connections, or patterns of interaction between pairs of individuals that influence each other; relationships
Individual characteristics, traits, thoughts, knowledges, skills, or behaviors of a single being, or labels assigned to a single being as sociocultural constructs or evaluations, excluding those that identify group membership
Symbolic material or immaterial symbols or possessions, or the display of these as signals of meaning
Stage in Social Role Process
Definition
Role determinants, expectations, tasks, special rights, or responsibilities of an individual’s position or identity in society
Competence knowledge and behavior displayed by an individual in fulfillment of their role
Products social outcomes, judgments, sanctions, or material or immaterial rewards that result from an individual’s role fulfillment
However, we found that representing prestige solely in the context of social structure did not fully
describe prestige; but rather gave the impression that prestige is a static property determined only by one’s
social position, instead of a characteristic that experiences ongoing dynamic revision while also being
influenced by individual action. We therefore integrated the concept of role performance (Biddle and
Thomas 1966)—the fulfillment of the responsibilities and expectations of an individual’s position or
identity in society—into our framework (Figure 2.2; Table 2.1). Across the social sciences, the development
of foundational ideas of social status has gone hand-in-hand with our understanding of roles and role
theory (Mead 1934; Moreno 1934; Linton 1936; Merton 1949; Parsons 1977). Therefore, an examination of

28
prestige would be incomplete without considering the potential contributions of role performance
processes, and integrating them into our framework encourages us and others to test these ideas. Role
performance provides one well-studied mechanism by which individual traits can lead to prestige benefits
(Goode 1960; Turner 1978); however, other such mechanisms may exist and could be further explored in
future applications and extensions of this framework.
When categorized by their level of social stratification, the proportions of terms in each level were
similar across determinants and consequences (Figure 2.3A), but with some significant differences (Χ2 [7, N
= 3238] = 172.963, p << 0.001), the most notable of which being larger proportions of collective,
institutional, and cultural determinants relative to consequences and larger proportions of relational and
status consequences relative to determinants. In addition, beneath the apparent similarities, the particular
terms used within each level contrast sharply between those used to describe determinants and those for
consequences (Appendix 2, Table A2.2A). For example, individual traits are most important in determining
prestige and individuals also benefit the most from gaining prestige, but the most frequent individual-level
determinant is that a person is skilled while the most frequent individual-level consequence is that a person
becomes more attractive. Some terms, such as an individual being respected, are present in high frequencies
in both lists, indicating that they contribute to prestige and are also enhanced by having prestige. A number
of terms in the sample exhibit this circular nature.

29
Figure 2.3. Proportions of determinants and consequences of prestige within each level of social stratification (A) and stage in role processes (B). All terms were assigned a level; only applicable terms were assigned a stage.
(A)
(B)

30
Similar patterns to the level of social structure are seen for each term’s stage in the role
performance process (Table 2.1; Figure 2.3B), but there is a clearer distinction between the proportions at
each stage (Χ2 [3, N = 2447] = 147.750, p << 0.001), with competence being more of a contributor to prestige
than a result, and with the products of the process being primarily consequences rather than determinants.
Those products of successful role performance that also contribute to prestige, such as an individual being
reputable and important and earning a high income, make good intuitive sense in that position, as do the
competence-based consequences of prestige, represented primarily by the signaling value of success
(Appendix 2, Table A2.2B). Likewise, there is logic to the terms present on both lists (e.g. status, powerful,
and authority) as circular traits that influence and are influenced by prestige, as seen in the previous
analysis on stratification level. Overall these results indicate the validity of this pathway to prestige and its
explanatory utility as an addition to a multilevel framework based on social stratification.
The results of using our framework to categorize and analyze the determinants and consequences
of prestige provides insights into how prestige is represented in the academic literature on Western
societies. According to their frequency in the literature, individual-level traits are indeed most important in
determining prestige—at least, in the perception of Western researchers—and individuals gain the largest
proportion of the benefits. A substantial proportion of the benefits of prestige are in the relational sphere,
with influence (as influential) and deference being the most frequent consequences noted in the literature
across all levels of both social stratification and role performance. Collective benefits were less frequent
than any other level of consequence (aside from environmental, which had no terms), and the institutional
benefits seen (such as powerful and employment) also seemed to primarily aid the individual. In short,
prestige in the generalized “Western society” represented by the academic literature is highly
individualistic, and contributions to individual prestige from collective and institutional factors are usually
cashed in for individual-level benefits.
Given the emphasis in the literature on prestige in Western societies and the relative paucity of cross-
cultural research across many disciplines (Boyacigiller and Adler 1991; Myers and Tan 2002; Arnett 2008;
Henrich et al. 2010; Kirmayer 2012; Nielsen et al. 2017), it is difficult to know from this review alone
whether these trends are reflective of broader human social patterns. We therefore undertook a systematic

31
review of the ethnographic literature to gain a cross-cultural understanding of prestige, its determinants,
and its consequences.
2.3 Ethnographic Review
2.3.1 Methods
2.3.1.1 Eligibility Criteria
Ethnographic sources that explicitly mentioned the word prestige or its derivatives were eligible for review.
For this study, we restricted our sample of societies to only those that appeared in all three of: the
Ethnographic Atlas (“EA”; Murdock 1967; Gray 1999), the Standard Cross-Cultural Sample (“SCCS”;
Murdock and White 1969), and the Probability Sample File (“PSF”; a stratified random sample from eHRAF
World Cultures, below). We did this to reduce the breadth of the world’s cultures to a manageable and
reasonably representative sample, to enable comparisons with other data available for the societies in these
three collections, as well as to provide flexibility for any future expansion of the sample.
2.3.1.2 Information Sources
We used the eHRAF World Cultures database (“eHRAF”; Human Relations Area Files n.d.) to identify
ethnographic sources for the 32 societies that met the eligibility criteria (see Appendix 1).
2.3.1.3 Search
While the subject areas from the Outline of Cultural Materials (“OCM”; Murdock 1961) were coded at the
paragraph level for sources in eHRAF, the most applicable code, “Status, role, and prestige” (OCM 554), did
not include every mention of the word “prestige” and, in an initial screen, missed some instances that
would be relevant for this study. Therefore, we instead searched across all subject areas using the stemmed
keyword “prestig*” to capture all instances in which any form of the word “prestige” was used.

32
2.3.1.4 Study Selection
We obtained all matching sources from eHRAF, consisting of 2,377 paragraphs across 363 documents. We
then reduced this sample by excluding sources that were not noted as full or partial matches to the EA or
SCCS and had coverage dates greater than 10 years distant from the focal dates of the EA and SCCS. We did
this to ensure the sources were representative of these societies at the time and place foci at which they
were studied, which were generally the earliest and most complete descriptions available. The final sample
consisted of 1,477 paragraphs across 187 documents by 128 sets of authors. This sample covered 30 societies,
since 2 societies (the Andamanese [“Andamans”] and the Chukchi [“Chukchee”]) had no sources matching
the criteria. Not all of the paragraphs that did match the criteria provided relevant information (see Results
and Discussion).
2.3.1.5 Data Items and Collection
For consistency and comparability between data sets, we collected data from the ethnographic review in as
similar a fashion to that of the literature review as possible. We randomized the order of societies prior to
data collection to avoid any systematic bias that could have been introduced by sequentially sampling
related societies. Aside from reference information on each document and paragraph, including OCM
subject tags, we noted all terms used to refer to a determinant or consequence of high prestige, as in the
literature review. We noted each unique term only once for each category per paragraph, in order of first
mention. Afterwards, we grouped terms by synonyms in a manner identical to that of the literature review,
using the literature review’s list of synonyms as a starting point and adding additional synonyms as needed
for new concepts. We also noted terms that referred exclusively to males or females. We did not collect
terms from any sections of matching documents that dealt with postcolonial practices or changes that
occurred due to colonialism or modern westernization.

33
2.3.1.6 Risk of Bias
The sources of potential bias in a sample as diverse as this one are numerous. Firstly, the earliest sources
used were published in the late 1800’s to early 1900’s and the latest in the 1990’s. Many sources, particularly
the earliest ones, were written by foreign, white anthropologists with distinctly colonial viewpoints. For
example, titles included The sexual life of savages in northwestern Melanesia (Malinowski 1929) and
Primitive Polynesian economy (Firth 1939) and many passages from these and other works were written in a
similarly pejorative tone. As in the literature review, perspectives on prestige are likely to change over time.
Since many of the ethnographic sources are now several decades old and sections dealing with postcolonial
practices were excluded, the prestige concepts depicted for each society represent traditional practices
specific to a specific historical time and place and should not be generalized beyond that context, or to
these societies in modern times.
Some potential bias has been introduced by the perspectives of ethnographers: book-length sources
mentioned prestige by name only once or twice, while others had over 50 instances, so the degree of
interest and word choice by the ethnographer is not necessarily indicative of its importance within the
society. Nor is the accuracy of the ethnographer’s information guaranteed to be accurate. All ethnographic
sources, no matter how objective the observer endeavors to be, will have some degree of bias in their
description of cultural values and practices that are not their own. However, in sampling as many different
authors and documents as were available for each society, individual differences between ethnographers
were minimized to the extent possible for this study. Other studies have previously shown that eHRAF and
the EA, SCCS, and PSF collections are relatively robust to various other types of bias (Gray 1996; Ember and
Ember 2009; Bahrami-Rad et al. [in prep.]).
2.3.1.7 Analyses
Using the levels of social stratification and stages in the role process developed from the synthesis of the
literature review, we similarly assigned each term from the ethnographies a social stratification level and, as
applicable, a role process stage. We were then able to tabulate the proportion of terms that fell within each

34
level for each society, which terms were most or least common, and test how the distributions of terms
within levels differed between the determinants and consequences of prestige and between different
societies. In addition, we perform a cluster analysis (using chi-square distances of the counts in each level
or stage and a k-medoids clustering algorithm) to visualize any clusters of similar societies in terms of their
determinants and consequences of prestige.
2.3.2 Results and Discussion
Following data collection, of the 30 societies selected for ethnographic review, we deemed 15 to have
sufficient relevant material and detail to be used for analyses based on paragraph count and content.
Though this led to a much smaller sample than intended in terms of the number of societies covered, it
ensured that the data set within each society was larger, more richly detailed, and more likely to yield
meaningful results (M number of paragraphs = 64, SD = 27). The retained societies covered 6 language
families (and 1 isolate) across a range of latitudes, regions, and biomes (Figure 2.4).
Figure 2.4. Societies examined in the systematic ethnographic review. Geographic points for each society (from latitude and longitude in the Standard Cross-Cultural Sample) are colored by language family; societies retained for full analysis are shown as filled points, while excluded societies are shown as outlines only.

35
On average, each of the 15 societies had relevant ethnographic information from 8 different
documents (Median; Q1 = 7, Q3 = 12.5) by 6 different sets of authors (Median; Q1 = 3, Q3 = 8). This alleviates
to some degree the concern of bias due to the perspective of any one ethnographer. Sources on the same
society generally shared consistent sets of terms related to prestige, but occasionally placed different
degrees of emphasis on certain terms depending on their perspectives and research foci.
We collected a total of 1,482 prestige determinants (1,041 unique) and 293 proposed consequences
(216 unique) from the selected ethnographic sources. Following synonym replacement, the number of
unique terms or phrases was reduced to 192 determinants and 85 consequences.
Societies showed significant differences in the proportions of prestige determinants in each level of
social stratification (Figure 2.5A; Fisher’s exact test, p < 0.001) and of prestige consequences by level
(Figure 2.5B; Fisher’s exact test, p < 0.001). This finding remained true whether the results of the literature
review were included (as “Western”: Figure 2.5A) or not, indicating that there are differences between non-
Western societies, not only between “Western” societies and non-Western societies. Tests of independence
adjusted for multiple comparisons revealed a number of pairwise differences between societies (Appendix
2, Table A2.3), and proportions from the Western literature are generally different from those drawn from
ethnographies of other societies. However, in contrast to the shared ancestry represented by shared
language family, societies that speak languages within the same family were not necessarily more similar to
each other in these proportions than they were to societies in other families; for example, Austronesian
speakers shared a high degree of similarity with one another, while Afro-Asiatic speakers had very little. An
examination of the most frequent terms within each level of stratification complements the proportions by
showing which traits are most influential in determining prestige for each society (Appendix 2, Table
A2.4A). For instance, though they differed in proportions, the three Afro-Asiatic societies in the sample all
place high importance on the institutional value of religion as a route toward gaining prestige, along with
material and immaterial possessions of various kinds.
Results from categorizing terms as prestige consequences in the ethnographic data were less clear
than those from prestige determinants, as there were much fewer terms given (272 consequences spread
across 15 societies, compared to 1,381 determinants). Hence, we present results for these variables but

36
choose not to speculate on any apparent trends. Later, the results of cluster analyses on the consequences
of prestige by level of social structure display the tentative nature of these data.

37
Figure 2.5. Determinants (A) and consequences (B) of prestige from Western sources and ethnographic sources on non-Western societies, classified by level of social structure. Data from “Western” sources are from the literature review of the present study. Societies are grouped by language family (see Figure 2.4) and are, in order: Indo-European (in this instance, given literature in English only), Niger-Congo, Austronesian, Trans-New Guinea, Afro-Asiatic, Algic, Chibchan, and language isolates.
(A)
(B)

38
Patterns in the proportions of terms at each stage in the role performance process were similar to
those seen in social stratification for both determinants (Figure 2.6A) and consequences (Figure 2.6B).
Significant differences between societies were found in the proportions of determinants (Fisher’s exact test,
p < 0.001) and consequences (Fisher’s exact test, p < 0.001) at each stage, and groupings from pairwise
comparisons showed similar trends to those found from the proportions by social stratification level
(Appendix 2, Table A2.3). As with social structure, the most frequent terms in each stage of the role process
provide additional insight into how prestige is gained within each society (Appendix 2, Table A2.4B).
Positions of leadership, along with those having to do with religion and ceremonial or cultural practices, are
common across the sample, and nearly all gain in prestige from having obtained wealth as a result of
successful role performance. As with the level of social structure, there were too few terms for the
consequences of prestige in each society (85 terms across 15 societies) to conduct a meaningful analysis.

39
Figure 2.6. Determinants (A) and consequences (B) of prestige from Western sources and ethnographic sources on non-Western societies, classified by stage in social role processes. Data from “Western” sources are from the literature review of the present study. Societies are grouped by language family (see Figure 2.4) and are, in order: Indo-European (in this instance, given literature in English only), Niger-Congo, Austronesian, Trans-New Guinea, Afro-Asiatic, Algic, Chibchan, and language isolates.
(A)
(B)

40
Cluster analyses reveal that the non-Western societies generally divide into two clusters in terms of
the proportions of prestige determinants in each level of social structure, consequences in each level,
determinants in each stage of role processes, and consequences in each stage (Figure 2.7A-D). The
proportions of variance explained by the first two clustering components displayed for each of these four
sources of data are 69.4%, 62.6%, 80.8%, and 83.3%, respectively. Our results suggest that the Ifugao, Mee,
and Northern Saulteaux are consistently distinct from other non-Western societies in their perceptions of
the determinants of prestige, and that these clusters are relatively well-supported, but that clustering by
prestige consequences yields less reliable results (at least when categorized by level of social structure). This
inconsistency is explained by the small sample sizes mentioned previously; the consequences by stage of
role process had fewer categories and therefore gave more reliable clustering results.

41
Figure 2.7. Clustering of non-Western societies according to determinants of prestige by level of social structure (A), consequences by level of social structure (B), determinants by stage in social role processes (C), and consequences by stage in social role processes (D). Optimal clusters are indicated by ellipses around groups of points, which show warmer colors with increasing density.
(A) (B)
(C) (D)

42
Much has been made of the need to move beyond the WEIRD research paradigm in modern social
science research, and our findings demonstrate that cultural variability exists in how prestige is defined and
operationalized in real societies. The societies in this ethnographic review differ substantially from Western
perceptions of prestige. In particular, compared to the Western literature sample, many of the non-Western
societies show a much higher contribution from traits such as perceived generosity (as generous), religiosity
(religious as an individual-level trait, and institutional religion), and leadership (as leader) toward prestige.
In many of these societies—particularly the Amhara, Koreans, Trobriands, and Ashanti—less emphasis is
placed on individual-level prestige contributions and outcomes, with comparably higher frequencies of
social factors in the relational, collective, institutional, and cultural levels.
However, we also stress that it would be inappropriate to generalize across non-Western societies
regarding their conceptions of prestige, because our results show substantial variation between societies—
as we might expect, given the diversity of cultural histories and values in our sample. We find that some
societies—the Tikopia, Trobriands, Trukese, and Northern Saulteaux—have broad similarities to the
proportions of terms in the Western sample, while other non-Western societies are more similar to one
another. In our cluster analyses, the Ifugao, Mee, and Northern Saulteaux formed a cluster apart from other
non-Western societies. The reasons behind these surface-level similarities between societies in how prestige
is conceptualized are unclear without finer analyses and, indeed, the diversity within our sample is likely
understated, as these analyses were based only on the proportions of each level or stage and do not
incorporate the additional layer of nuance given by the specific terms within them. We also must note that
these analyses are not phylogenetically controlled, and so must remain inconclusive on whether similarities
can be attributed primarily to shared history, to similarity in environments, or to cultural diffusion. This is a
question that remains open to potentially highly impactful future research. It is clear, however, that there is
a great deal of cross-cultural variation in prestige, even within our relatively small sample.
Prestige as a general concept was present across all of the cultures we sampled, including those
with insufficient data for full analysis; there were no societies that do not recognize prestige or for whom
prestige is unimportant. Rather, our results demonstrate substantial differences in the degree to which
different traits are valued for their contributions to prestige, and in the personal and societal consequences

43
of prestige. This illustrates the importance—in studies of prestige and other inherently cultural concepts—
of sampling cross-cultural ethnography in a systematic way, rather than picking out instances that support
a particular hypothesis or generalizing cultural traits or values across regions, language families, or modes
of subsistence (e.g. sweeping statements about hunter-gatherers across time or space). Most importantly, it
shows the necessity of a unifying framework of prestige that can adequately represent this variation.
Isolated prestige concepts such as occupational prestige or national prestige are clearly insufficient to
describe the nuances of prestige in the cultures we sampled.
Over the course of the ethnographic review, we found that the framework developed for our
literature review was highly suitable for accurate classification, analysis, and synthesis of perceptions of
prestige cross-culturally. Additional terms were added as needed for concepts that did not appear in the
literature review—such as midwifery, magic, and trapping—but we did not encounter any circumstances
where the framework could not adequately represent the context of the terms used. We do acknowledge
that there are limitations to this ethnographic review, largely due to its tightly defined scale and scope. This
study is a general overview of how prestige is represented in these societies within the available
ethnographic literature, and is not a substitute for a targeted study of prestige in any one society in
particular. Our results paint a broad picture of cross-cultural diversity in prestige concepts, and form the
basis for studying the cultural nuances of prestige with increased resolution in future research.
2.4 Conclusions
Our broad syntheses of the academic literature, spanning a diversity of fields with over 150 unique
definitions of prestige, as well as the perspectives of a sample of non-Western cultures across the world and
the creation of a new framework to represent the components of prestige, returns us to the primary
question asked by this study, which is: What is prestige? Our distillation of the results of both studies leads
us to recommend the following definition: prestige is a positive attitude that reflects a collective
assessment of relative inequalities within a social structure.

44
We arrived at this definition by bringing together its three core elements—attitudes, inequalities,
and social structures—that allow it to encompass the diversity of ideas across all of the academic fields and
world cultures we examined, while maintaining precise delineations between prestige and related concepts.
One of the primary distinctions that needs to be made is that between prestige and status, and we do so by
emphasizing that prestige is an attitude, as in the tradition of social psychology (Goldthorpe and Hope 1972,
pp. 19–20). Prestige is not status, but reflects explicit and implicit thoughts, beliefs, and values about status.
Status, in its original definition, is “a position in a particular pattern” (or “with relation to the total society”)
that is constituted of “a collection of rights and duties” (Linton 1936, p. 113). Thus, status is a relative
position and the differential privileges and benefits associated with that position (inequalities) within a
social structure, and prestige is the attitudinal perception of that status by others. Our definition is flexible
on the particular structure being referenced and the inequalities that it carries because, as Linton first
noted (1936, p. 113), an individual has “many statuses” and likewise can have different perceived levels of
prestige in different social spaces and contexts. This may explain some of the confusion around whether
prestige is domain-specific or domain-general (Henrich and Gil-White 2001; Chudek et al. 2012), in that
these perceptions may be variable across individuals and cultures, as well as being context-dependent.
Along with the multiple statuses of an individual, in daily life and across varying fields, abstract entities
such as corporations, brands, and nations are regarded as having status, with rights and duties that are
somewhat different from those expected of individual people, and their prestige is evaluated on those bases.
Regardless of the entity it applies to, prestige, as an attitude, is held in the minds of individual people.
Similar to this distinction between prestige and status, prestige is not behavior, though, as an
attitude, it influences behavior. Some behavior can be “prestige-seeking” (Vigneron and Johnson 1999; Ihara
2008), but the behavior itself is not equivalent to prestige; rather, it is an attempt to improve one’s own
status and prestige perceptions. As is the case with any other attitude, prestige attitudes are formed and
influenced by social learning. This is a significant point when we consider the implications for cultural
transmission, as theory suggests that learners preferentially attend to and copy high-prestige models (Boyd
and Richerson 1985; Henrich and Gil-White 2001; Henrich and Boyd 2002). Thus, prestige is learned but
also affects learning, and prestige is acquired through the copying of behavior but also influences behavior.

45
This feedback echoes the circular nature of many of the prestige determinants and consequences found in
these studies.
Why do people pursue prestige? What is gained? As we have seen with other aspects of prestige,
the answers to these questions vary significantly across cultures. Some researchers have suggested that
prestige leads to increased reproductive success (Smith 2004; von Rueden et al. 2010; Price and van Vugt
2014), but others dispute this claim (Hill 1984) or have found mixed or nuanced results (Perusse 1993; Ihara
2008; Smith et al. 2016; von Rueden and Jaeggi 2016). We find that the most persistent consequence of
prestige across cultures is as a route to power (and various means of exercising and displaying power, such
as wealth, influence, leadership, and authority). The status associated with a position means little if the
perceived prestige of that position does not afford access to some measure of control over others or over
resources. Thus, it makes sense for individuals to pursue positions, traits, behaviors, and affiliations that
grant power (in whatever form is appropriate in the context of their culture) to improve their own
circumstances or the circumstances of their family, lineage, institution, and so on, whether these
consequences are ultimately fitness-enhancing or not. In turn, the cultural benefits of prestige lead to the
motivation for those in positions of prestige and power to maintain and enhance the systems that brought
them to that state.
One example of the structural consequences of this reification of prestige systems is the depiction
in our sample of prestige as a quality largely exclusive to men. In the studies and ethnographies we
examined, the question considered was often not whether women have high or low prestige, but whether
the concept of prestige can be applied to women at all. Only roughly 3% of the literature sample and 2% of
the ethnographic sample specifically mentioned determinants or consequences of prestige for women; the
vast majority of the remainder either referred explicitly to men and used male pronouns, talked about
cultural positions, roles, or traits that could only apply to men, or passively assumed that the occupants of
high-prestige positions were men. Very few sources used gender-neutral or inclusive language to state that
the traits listed could also apply to women (and non-binary genders were never mentioned, even in the
ethnographic literature). In cases where the prestige of women was addressed, the determinants by which
they are evaluated and the consequences of obtaining prestige are distinct from those for men and often

46
revolve around attractiveness, marriage, and childbearing (Kaplan 1985; McLaren and Godley 2009; Price
and van Vugt 2014). Studies in the Western literature have found that women tend to be rated much lower
in a prestige hierarchy (Touhey 1974; Bose and Rossi 1983; Powell and Jacobs 1984), or do not obtain
comparable benefits from prestige (England 1979), or occupy a hierarchy entirely separate from that of men
(Wegener 1992). These results extend to other demographic categories such as race but, within the bounds
of our review, race and ethnicity were often mentioned explicitly as factors that affected prestige, while
views on sex and gender were more implicitly embedded in the texts themselves. We posit that this
pervasive bias in the literature is reflective of historical top-down social pressures to reinforce systems and
qualities that preferentially grant prestige and power to men, and the perspectives of authors from cultures
that have annealed these biases within institutions and practices.
There are limitations to describing prestige concepts at the societal level, both from the Western
literature and ethnographic depictions of societies, in that it may obscure differing perspectives on a
general social prestige hierarchy. An individual’s perspective on prestige depends upon their position in the
hierarchy (Alexander Jr 1972; Wegener 1992) and a variety of other demographic factors, so a degree of
variation from the normative view is expected. An individual may hold more than one of these views
simultaneously, given that one person can belong to a number of groups and have multiple identities.
Additionally, as an individual can have “many statuses” (Linton 1936), they may also have “many prestiges”
in different spaces and contexts. These questions are finer in scope than the general perspectives examined
in these reviews, and present opportunities for future research using the integrative framework established
here.
In summary, the implications of a better understanding of prestige stretch across all disciplines
concerned with human society and culture. Prestige has a multitude of effects on the lives and success of
individuals and cascades through social strata to have impacts on collective social groups, institutions, and
cultures, which then feed back to shape individual perceptions of prestige. To have a truly integrative
understanding of human sociality, stratification, and inequality, we must have a common ground to stand
upon, which can be provided by an integrative concept of prestige that ensures different researchers can
measure, study, and communicate about the same ideas. Many questions remain regarding how prestige is

47
operationalized in day-to-day life, to what degree the relative importance of different prestige determinants
and consequences vary across cultures, and under which circumstances prestige can influence the
transmission and evolution of culture. We regard this synthesis of the academic and ethnographic
literatures, as well as the unified framework and generalized definition of prestige that we have produced as
a result, to be a foundation for future research, in the hope that these studies will inspire a thriving cross-
disciplinary discourse on the concept of prestige and its outcomes on the many and varied social lives of our
species.

48
3. THE POSITION-REPUTATION-INFORMATION (PRI) SCALE OF INDIVIDUAL PRESTIGE
3.1 Introduction
Prestige is a key concept for many disciplines in the social and behavioral sciences, including psychology
(Asch 1948), sociology (Wegener 1992), anthropology (Barkow 1975), and economics (Harbaugh 1998).
Through its influence on the cultural transmission of knowledge and the dynamics that shape cultural
diversity, prestige has been implicated as a crucial component in the evolution of our highly social species
(Boyd and Richerson 1985; Henrich 2001; Henrich and Boyd 2002; Richerson and Boyd 2005). These
cultural evolutionary dynamics ultimately arise from social interactions between individuals at the
microevolutionary level. Therefore, we can consider the individual as the unit that acquires, holds, and
benefits from prestige in day-to-day life. Despite the theoretical and practical importance of the prestige
concept, it is surprising that no satisfactory tool currently exists for measuring individual prestige.
A scale of individual prestige that is theoretically and practically meaningful must have validity
(e.g. it measures what it is intended to measure) and reliability (e.g. it is consistent in those measurements).
When quantifying prestige, the scale must measure perceptions of the traits that constitute prestige and the
relative influence these traits have on the general prestige construct. The scale should also assist
researchers in accounting for differences in perceptions between groups of respondents—by culture,
demographics, or otherwise—in order to avoid being misled by results from inappropriately aggregating
across these groups (Guppy and Goyder 1984; Goyder 2005; Crawley 2014). In addition, the scale should be
developed using replicable methods to allow for adaptations for use with new groups that may hold
different values. Lastly, in developing the scale, researchers should endeavor to be data-driven and theory-
neutral (Kitchin 2014; Mazzocchi 2015) to minimize the potential bias posed by researchers’ expectations
and to maximize the real-world utility and validity of the scale.
Rather than individual prestige, existing prestige scales focus on the prestige of collective social
institutions or constructs, such as organizational prestige (regard for an institution, e.g. Mael and Ashforth
1992; Smidts et al. 2001), brand prestige (status associated with products, e.g. Deeter-Schmelz et al. 2000;
Vigneron and Johnson 2004), and occupational prestige (standing of professions, e.g. Duncan 1961; Nakao

49
and Treas 1992; Ganzeboom et al. 1992), that are not directly derived from or attributable to individual-
level traits. Some of the most widely-used “scales” of occupational prestige—including the NORC Duncan
Socioeconomic Index (Duncan 1961), the Nakao-Treas Prestige Score (Nakao and Treas 1992), and the
International Socio-Economic Index of Occupational Status (Ganzeboom et al. 1992) (and its predecessors,
e.g. Treiman 1977)—are not measurement tools, but rather lists of prior composite ratings for each
occupation. Researchers obtained some of these existing prestige “scales” (and others, e.g. Kaufman 1945;
Steenkamp et al. 2003) by directly asking participants to rank others by their own internal concept of
prestige, left undefined, or by how participants think society in general would or should rank them. These
ambiguities in previous indices of prestige leave findings open to theoretically-biased interpretations
(Blaikie 1977; Gusfield and Schwartz 1963).
The distinction between data-driven and theory-driven research is also relevant when considering
the suitability of another published scale for measuring individual prestige: the prestige-dominance scale
developed by Cheng et al. (2010). This scale was built to conform to a specific theoretical framework
(Henrich and Gil-White 2001) and contrasts “prestige” and “dominance” as opposing unidimensional
constructs. To maintain theoretical soundness, Cheng and colleagues chose to retain multiple scale items
that did not meet their stated inclusion criteria and contributed to a poorly-fitting final model (CFI < 0.95,
GFI < 0.90, RMSEA > 0.05) (Cheng et al. 2010). Here, for the purpose of developing an accurate
measurement tool, we consider that the characteristics of an individual that may contribute to prestige
could also overlap with those that contribute to dominance, rather than belonging to either of two fully
discrete avenues to status. Previous research (Goldthorpe and Hope 1972; Seligson 1977; Reyes-García et al.
2008; von Rueden et al. 2008) suggests that peoples’ mental models for one or both of these constructs
may also be multidimensional rather than unidimensional. Importantly, these hypotheses can be assessed
using an empirical, theory-neutral approach.
The purpose of our work is to construct a valid and reliable scale of individual prestige, as defined
by participants within two broadly “Western” societies—the United States and the United Kingdom—using
replicable methods that we intend to be extensible to other contexts and cultures. We take a minimal
theoretical approach, elements of which have been suggested in disparate parts of the literature but never

50
explored together in one measurement tool. Our approach makes only three fundamental assumptions
about prestige:
1) Prestige can be seen as a trait possessed and used by an individual in the course of everyday social
life, distinct from but not independent of the prestige accorded to the societal institutions and
constructs of which they may be a part (Blaikie 1977; Davis and Moore 1945; Wegener 1992);
2) Prestige is based upon the subjective assessments of others, through the lens of their individually,
socially, and culturally acquired beliefs, values, attitudes, and experiences (Inkeles and Rossi 1956;
Svalastoga 1959; Goldthorpe and Hope 1972; Barkow 1975; Blaikie 1977; Wegener 1992); and
3) Prestige may be composed of multiple dimensions (Goldthorpe and Hope 1972; Seligson 1977;
D’Aveni 1990; Wegener 1992; Vigneron and Johnson 1999; Reyes-García et al. 2008; von Rueden et
al. 2008), each representing differential contributions from individual, social, or cultural domains.
We made no further assumptions about what constitutes prestige or of its specific societal mechanisms and
consequences, as our goal was to obtain the necessary information from respondents’ own views of prestige
in the real world (Blaikie 1977). Our approach was driven to a large degree by the responses of participants,
rather than relying on any specific, theoretically-entrenched prestige concept.
One methodological challenge of our approach involved finding a valid, widely-recognized signal of
prestige that could be presented to participants to evaluate the pool of prospective prestige scale items.
Ideally, this instrument would also avoid pre-defining for participants what prestige means. For this
purpose, and because this is one component of a larger study on prestige and the transmission of spoken
information, we chose to use accented regional variation in speech to highlight differences in individual
prestige. Work by sociolinguists has consistently shown that linguistic characteristics such as dialect and
accent can index macro-social categories related to prestige (such as class) in the perceptions of listeners, as
well as acquiring socially significant meanings of their own. Accents and regional varieties are therefore
perceived as strong indicators of prestige and tend to be stable over time (Giles 1970; Bishop et al. 2005;
Coupland and Bishop 2007; Fuertes et al. 2012). Accents are hard-to-fake signals (Cronk 2005) and because
accents that are regarded as locally “standard” or associated with desirable upper class membership tend to
be evaluated highly by a majority of listeners, they often serve as an index of membership in a high-status

51
group (Giles 1970; Kroch 1978; Kahane 1986). Naturally, some disagreement will exist between different
demographic groups on the evaluation of particular accents (Labov 1966; Giles 1970). However, our focus is
not on how respondents rate specific accents but on the relationships between the items used in the
evaluation of prestige.
The development of a valid and reliable scale will enable researchers from diverse disciplinary
backgrounds to measure individual prestige using a shared prestige concept. The scale can thus contribute
to the evaluation and reconciliation of competing theories on prestige and serve as a foundation for the
development of new theoretical and experimental trajectories across the social and behavioral sciences.
3.2 Results
The scale development process involved first constructing the prospective scale by collecting items and
determining their structure through exploratory factor analysis, then evaluating the fit of the model using
confirmatory factor analysis with a separate data set, and finally assessing the validity and reliability of the
scale using a mixture of qualitative and quantitative criteria.
3.2.1 Study 1: Scale construction
We began by conducting a study to generate a pool of words or phrases (“items”) related to prestige,
reducing the items to those most indicative of prestige, and constructing the scale by establishing the factor
structure of those items using exploratory factor analysis (“EFA”). We collected items from three sources:
the most salient terms in a free-listing task completed by participants; a previously unpublished pilot study
on sociolinguistic prestige; and a review of published scales that measure language attitudes and
incorporated a prestige or status dimension. We also collected items from two contrasting domains—
“solidarity” and “dynamism”—from published sources, to ensure that scale items adequately discriminated
between prestige and other unrelated concepts with positive connotations. We used the resulting list of
items (Table 3.1) for this study and for the follow-up scale evaluation study.

52
Table 3.1. Pool of attitudinal items retained and used in the scale construction and scale evaluation studies. Reversed items used in the scale evaluation study are noted parenthetically.
PRESTIGE SOLIDARITY DYNAMISM
prestigious friendly aggressive
wealthy kind (unkind) active
high social status good-natured confident
powerful warm enthusiastic
respected comforting educated hardworking successful intelligent (unintelligent) reputable ambitious (unambitious)
We recruited participants from the US (n = 153) and UK (n = 155) to complete an online survey
using these items to evaluate the characteristics of four speakers with varying regional accents of English.
As a second complementary source of data on perceptions of association between items without involving
accents, participants were also asked to group the prestige domain items into like and unlike categories
using a triad test.
By sequentially applying EFA and eliminating items that failed to reach the predetermined
acceptance criteria (see Methods), we obtained the best-supported factor structure for the attitudinal items
across all three domains (Table 3.2a and Figure 3.4), as well as the internal factor structure of the
attitudinal and triad items in the prestige domain (Figure 3.1; Table 3.2b and 2c). Using EFA, items within
the prestige domain were partitioned into three factors: wealthy, powerful, and high social status in the first
factor, hereafter referred to as “position”; reputable and respected in the second factor, referred to as
“reputation”; and educated and intelligent in the third factor, referred to as “information.” We therefore
denote the resulting factor structure as Position-Reputation-Information, or “PRI.” Subsequent cluster
analyses on the same data generated clusters that matched the three PRI factors (Figure 3.6A), as did
results from comparable analyses of the triad data (Figure 3.6B), supporting the robustness of this
structure.

53
Figure 3.1. Prestige domain item loadings from exploratory factor analysis of attitudinal data. Position, reputation, and information items are shown in light blue, gold, and pink, respectively.
3.2.2 Study 2: Scale evaluation
We then conducted a second study with an independent data set to validate the findings of the scale
construction study using confirmatory factor analysis (“CFA”). The validation step evaluates the fit of the
structural model proposed by EFA and examines any potential systematic variance due to sampling (Hair et
al. 2010). We used the full set of relevant items from the scale construction study in the CFA, with three

54
items presented in reversed form to reduce potential response bias (but this was found to be ineffective, see
Methods).
For this study, we recruited a new, independent sample of participants from the US (n = 151) and
UK (n = 144) to provide attitudinal ratings for a greater variety of accented speakers than in the previous
study (n = 8 in each country, 4 of which were presented to participants in both countries; see Table 3.3),
again using an online survey.
After controlling for potential differences between participant demographics, we found that the
PRI model exhibited good fit (CFI = 0.959, TLI = 0.983, RMSEA = 0.031 [90% CI: 0.026, 0.036], SRMR =
0.023). Following this validation by CFA, we obtained the complete PRI scale (Figure 3.2).

55
Figure 3.2. Path diagram and estimates from confirmatory factor analysis of the Position-
Reputation-Information scale model. Standardized parameter estimates are shown as weighted edges. Residual variances are shown as self-loops. Dotted lines indicate that the loadings of the first indicator of each factor were fixed to 1.0 for estimation.
3.2.3 Scale validity and reliability
The PRI scale displayed both validity and reliability in the context of our samples. Using predetermined
criteria to judge the acceptability of each index (see Methods), we found support for the components of
construct validity: convergent validity measures exceeded the criterion for all subscales (average variance

56
explained, or “AVE”: position = 0.670, reputation = 0.629, information = 0.696) and discriminant validity
measures (heterotrait-monotrait ratio, or “HTMT”: Table 3.6) remained below the threshold in all cases
except in one comparison between internal position and information subscales. Reliability measures of
internal consistency (coefficients alpha and omega: Table 3.7) were high within each PRI subscale (M =
0.813, SD = 0.036) and for the scale as a whole (M = 0.892, SD = 0.018). Criterion validity was
demonstrated by high correlations between scale items and a separate prestigious item (M = 0.692, SD =
0.097). As added support for the criterion validity of the PRI scale, in a comparative data set the factor
scores predicted by the PRI scale were highly correlated with those of the prestige factor of the Cheng et al.
(2010) prestige-dominance scale (PRI overall: 0.850, position: 0.805, reputation: 0.861, information: 0.828)
and the PRI scale displayed better model fit overall (ΔCFI = 0.025, ΔTLI = 0.029, ΔRMSEA = -0.045,
ΔSRMR = -0.064; see Methods).
These assessments demonstrate that the PRI scale adequately represents the prestige construct and
that it is distinct from the other positive traits tested (i.e. solidarity and dynamism). The three subscales
(position, reputation, and information) represent cohesive parts of a whole while being relatively distinct
from one another. Additionally, perceptions of the PRI structure were consistent across respondents and
the scale compares well with existing prestige concepts. We take these results as support for the PRI scale
as the most accurate and realistic reflection of our participants’ internal views on the content and structure
of the individual prestige construct.
3.3 Discussion
In the process of developing the PRI scale, we intentionally minimized the role of theory and allowed the
structure inherent in the data—structure provided by participants’ own internal conceptions of prestige
and revealed through exploratory factor analysis—to dictate what was most relevant. However, in
examining this structure and the constituent items of the scale after its formation, we found that the PRI
prestige construct is highly consistent with different streams of prior research on prestige. The terms
57
chosen to represent the three subscales, “position,” “reputation,” and “information,” characterize three
relatively distinct axes of individual prestige, and we examine each in turn.
The position components of the scale signify an individual’s relative place in the social hierarchy,
determined to a large extent by the circumstances of birth, family, and inheritance. Max Weber, in his
classic theory of social stratification, argued that one’s social position can be attributed to three dimensions:
economic “class,” or wealth; “status,” or honour gained through prestige; and “party,” or political power and
influence (Weber 1922, 1946). These closely mirror the three items found in the position subscale (wealthy,
high social status, and powerful) and this finding reflects the continuing utility of Weber’s ideas in
sociological theory and practice (Rhoads 2010).
The items in the reputation subscale (reputable and respected) relate to social opinion and esteem
and are terms frequently used to describe prestige (e.g. Henrich and Gil-White 2001; Mael and Ashforth
1992; Smidts et al. 2001), and are even used synonymously with it (e.g. Shenkar and Yuchtman-Yaar 1997).
In the sociological literature on prestige, reputation and respect have the connotation of a collective
judgment of character independent of individual variation in judgments (Wegener 1992). Reputation and
respect represent the general societal evaluation of an individual in a certain position or role, subjectively
interpreted through social and cultural values. By contrast, the items in the position subscale may be
established through privilege without necessarily undergoing the same degree of collective evaluation
(Weber 1922, 1946).
The third subscale, information, and its items (educated and intelligent) represent the value placed
by society on the holders of wisdom, expertise, and learning. These constructs are supported by the
occupational prestige literature, which emphasizes that—in a stratified society with specialized
occupations—an individual’s educational background and achievement are highly predictive of their future
occupational class which, in turn, contributes significantly to individual prestige (e.g. Bajema 1968; Sewell
et al. 1969; Cheng and Furnham 2012). The salience of this subscale and its focus on information holders
could also indicate support for arguments from information theory about the evolution of prestige and its
role in cultural transmission. The information theory-based account, presented alongside (but not integral
to) the dichotomous prestige-dominance distinction by Henrich & Gil-White (2001), asserts that

58
individuals gain prestige by having desirable skills and knowledge that others compete within a social group
for the opportunity to learn. Alternatively, an occupation attained through greater education could be
another avenue to wealth and power. This question, and to what extent—if any—some form of the
information subscale would be relevant to prestige across the diversity of non-Western or non-
industrialized societies remains open to future study.
Indeed, there is a great need to explore concepts of prestige cross-culturally to reach beyond the
perspectives given by Western and westernized participants. Many existing prestige indices have been
explicitly promoted for their universality, in spite of having been developed using data almost exclusively
from “WEIRD” (Western, Educated, Industrialized, Rich, and Democratic) societies (Henrich et al. 2010) in
the 1960s, ‘70s, and ‘80s. The utility of these indices across cultures and over the significant span of time
and sociocultural change that has occurred since they were developed has been called into question
(Goldthorpe and Hope 1972; Guppy and Goyder 1984; Hauser and Warren 1997; Goyder 2005; Crawley
2014).
The concept of prestige, the individual components that comprise prestige, the degree of
importance attached to each component, and the relationships between components are all—to some
degree—culturally constructed and malleable through cultural evolutionary processes. Therefore, we
recognize that the PRI scale is not universally applicable, as this is an unrealistic expectation. We developed
the PRI scale using data collected from adults in the highly WEIRD societies of the United States and
United Kingdom and it should not be generalized beyond that context without adequate validation. The
high degree of consistency in the PRI structure across our representative samples of demographically
diverse participants in the US and UK suggests that the PRI scale should function well across other highly
Westernized, English-speaking societies. However, distinct demographic or cultural groups within these
societies may hold different values and have substantially different internal models of prestige. For these
reasons, and in the interest of following best practices in psychometrics (Haynes et al. 1995), we strongly
recommend testing the validity and reliability of the PRI scale with each application and testing for
invariance across as many demographic variables as may be potentially relevant.

59
We have made the process of constructing and validating the PRI scale extensible to any additional
population for which a scale of individual prestige is needed, through the emphasis on the participants in
the item generation and evaluation stages, the use of straightforward and appropriate methods and criteria,
the use of open-source analytical tools, and the open sharing of all data and code used to run analyses. A
new variant of the PRI scale can be constructed by repeating these methods in a new group, with awareness
and care for local cultural norms and power structures. Examining systematic differences in responses and
extending the PRI scale to other contexts and cultures can further improve the representation and inclusion
of minority and non-Western perspectives on prestige, and we argue is the most important avenue for
future research presented by this study.
The PRI scale for the measurement of individual prestige fills a crucial niche by establishing a
measurement tool driven by the real-world perceptions of individuals across two Western societies. The PRI
scale enables the study of prestige—a central yet divisive concept throughout the social and behavioral
sciences—using a common foundation, which we hope will encourage fruitful engagement, conversation,
and collaboration that spans across disciplinary boundaries. We have shown the broad utility of this scale
for conducting research by finding support for the PRI structure in both of two separate sources of data:
attitudinal responses to variations in accented speech, and triadic conceptual associations absent the
sociolinguistic context.
Future research should endeavor to untangle the complex and varied patterns in how prestige is
perceived and how it operates in the practice of real social interactions across the breadth of human
experience. The availability of the PRI scale allows researchers to explore in greater detail the relationships
between different aspects of prestige, dominance, status, and success. Some of these relationships may be
quite complex, or even circular, as suggested by the presence of high social status as an indicator of prestige
within the position subscale (whereas scholars would normally consider prestige to be a contributor to
status) or by the possible contributions of specific indicators like educated toward other indicators like
wealthy. Additionally, there may be some degree of overlap between the construct of prestige, as measured
by the PRI scale and the prestige factor of the Cheng et al. (2010) prestige-dominance scale, and other
related concepts like dominance and leadership. Many questions remain about the breadth and

60
interconnectedness of the varied routes to the acquisition of social status. We view the establishment of the
PRI scale as a necessary step toward a more integrated and comprehensive understanding of prestige,
through the clarification of preceding debates and the beginning of new lines of inquiry into the core
concepts that shape interactions, relationships, social structure and inequality, and the evolution of culture.
3.4 Methods
3.4.1 Study 1: Scale construction
3.4.1.1 Item generation
In the development of this scale, we used a combination of deductive and inductive methods to collect the
items most relevant to the concept of individual prestige. This methodological approach incorporated emic,
operational determinants of prestige from a real-world Western context, as well as shared items from
previous scales, in order to evaluate all possible components of a prestige scale concurrently. We sampled
items from a salience analysis of responses to a free listing task, from existing attitudinal scales in the
literature, and from responses to a pilot study investigating sociolinguistic prestige. We favoured the use of
inductive methods, specifically the free listing task, because they are generalizable and facilitate replication
and extension to other contexts and cultures.
Free listing is a tool from cultural domain analysis used to elicit responses on a particular
classification of knowledge (Bernard 2011, pp. 224–228; Quinlan 2005; Weller 2015). The task conducted as
part of this study consisted of a survey in which participants responded to the following three prompts, in
order:
1. List all of the words or phrases that you can think of that are related to “prestige.”
2. List all of the words or phrases that you can think of that describe “prestigious” people.
3. List all of the characteristics that you can think of that make a person “prestigious.”
Responses were limited to 2 minutes per question. We allowed repetition of terms from prior questions, but
participants could not refer back to previous responses. We recruited participants for this task through
advertisements in local undergraduate courses (n = 6 US) and social media networks (n = 42 US, 20 UK),

61
for a final sample of 68 participants. We compensated undergraduate students for their participation and
social media participants engaged voluntarily. Participants ranged in age from 18 to 50 (M = 28.9, SD = 7.3),
with 18 that identified as male and 50 that identified as female. All participants were native English
speakers. All participants self-identified as white, except for one person of mixed ethnicity from the US and
one person of colour from the UK. Participants came from a variety of backgrounds with respect to the size
of their childhood settlement and educational attainment, but for occupation most were either students
(25.0%) or were in management or professional positions (26.5%), with others in service (11.8%) and sales
(5.9%) positions.
After obtaining the three free lists of items from each participant, we grouped items for common
meaning, reducing the pool of unique items from 717 to 303. Generally, this procedure consisted of
replacing multi-word phrases with single-word synonyms and converting words to adjective form (e.g. “lots
of education” to “educated” and “influence” to “influential”). We left given terms as-is if their intended
meaning was ambiguous. On the whole, groupings were done with the intent of minimal replacement, so as
to allow participants to speak for themselves, and all co-authors verified the groupings. We then calculated
a salience value for each of the 303 items using Smith’s S (Smith and Borgatti 1997), which takes into
account both the frequency of an item’s occurrence across lists and order of occurrence within lists. From a
scree plot of the items by their salience values, we chose the cutoff near the inflection point at the highest
local proportional drop in salience (0.0148) to capture the set of most salient items (Figure 3.3) (Bernard
2011). The items retained from this exercise were: wealthy, high social status, powerful, respected, educated,
hardworking, and successful.

62
Figure 3.3. Scree plot of free list items by salience value. Chosen cutoff includes successful (S = 0.1185) and items of higher salience and excludes famous (S = 0.1037) and items of lower salience.
Given the use of attitudes toward regional accents as a measurement tool in this study, and in the
interest of full coverage of the domain of interest (i.e. content validity), we chose to supplement the pool of
potential scale items by reviewing items used in established scales of language attitudes that incorporated a
prestige or status dimension. The two scales we selected for this purpose were the Speech Dialect
Attitudinal Scale (“SDAS”: Mulac 1975) and its revised version (“SDAS-R”: Mulac 1976) and the Speech

63
Evaluation Instrument (“SEI”: Zahn and Hopper 1985) and its short form version (“SEI-S,” as used by
Gundersen and Perrill 1989). The following items were represented in some form within both scales under a
dimension of “prestige,” “status,” or “competence” and were therefore retained: wealthy, high social status,
educated, and intelligent (as a note, we collapsed upper class into the broader high social status and literate
into educated). These items agreed closely with those used in other sociolinguistic studies for these
dimensions (Fuertes et al. 2012), and therefore can be regarded as representative of the literature. We also
collected items from the selected scales to represent two other domains commonly used in speech
evaluation studies (Fuertes et al. 2012; Giles 1970): “solidarity” and “dynamism.” We included these
domains, which are unrelated to prestige but similarly positively valenced, to assess the ability of prestige
items to represent prestige itself and not merely a positive evaluation of the speaker (i.e. discriminant
validity). The additional items we selected were: friendly, kind, good natured, warm, and comforting for the
“solidarity” dimension, and aggressive, active, confident, and enthusiastic for the “dynamism” dimension.
One item, clear, was also initially included within “dynamism,” but we later removed it from analyses due it
clustering more closely with items in other dimensions.
A third and final source of items was a previously unpublished pilot study that we conducted on
speech, accent, and prestige in October and November of 2015. The sample of this pilot study consisted of
100 US and 44 UK participants (undergraduate and graduate/postgraduate students) ranging in age from 18
to 64 years (M = 21.8, SD = 5.3). Of the participants, 47 identified as male and 95 as female. The majority of
participants, 141, identified as native English speakers, with 2 non-native speakers. Participants were asked
to rate two speakers—one with a locally standard accent (US or UK) and the other with a nonstandard
accent—on 15 attitudinal items using a 7-point Likert-type scale. The items in this pilot study were also
drawn from prior linguistic studies. Following exploratory factor analysis and the sequential elimination of
items following the same criteria described below for the present study, as well as examining inter-item
correlations with a prestigious item to find the most closely associated items, we retained the following
items from the pilot study: hardworking, reputable, intelligent, and ambitious.
The combined pool of items retained from all three sources (Table 3.1) were then used in the scale
construction and scale evaluation studies to establish and verify the scale.

64
3.4.1.2 Questionnaire construction and administration
We developed an online questionnaire for use in the United States and United Kingdom using the pool of
attitudinal items retained from the item generation stage.
For the stimulus, we presented each participant with four audio recordings of the same short
passage (approximately 30 seconds in length), each read by a speaker with a different regional accent of
English, and asked them to rate each speaker on all 20 attitudinal items using a 7-point Likert-type scale
from low (1) to neutral (4) to high (7). All recordings consisted of the first paragraph of Comma Gets a Cure
(see Acknowledgements), a passage which uses the Wells Standard Lexical Sets for English (Wells 1982) to
highlight the most differentiable elements of accents.
We selected accents from the dialect regions defined by Labov et al. (2005) for the United States
and Shackleton (2007) for the United Kingdom. The US-based accents in this study were American West
and Inland South and the UK-based accents were Received Pronunciation (“RP”) and Northwest England.
We recorded a speaker from urban Colorado to represent the American West accent, and for the other
three accents we used recordings under license from the International Dialects of English Archive (“IDEA”;
see Acknowledgements).
The IDEA data sources predominately represented white male speakers. As a result of controlling
for speaker demographics and audio quality from the available recordings, our speakers all self-identified as
white males ranging from 42 to 59 years old. In the sociolinguistic sense, American West (which
phonologically is in the spectrum of the “General American” accent) and Received Pronunciation represent
standard or “high-prestige” variants within the US and UK, respectively, and Inland South and Northwest
England are nonstandard “low-prestige” variants (Giles 1970; Milroy 2000; Bishop et al. 2005). The
American West and RP speakers used for this study held university degrees and the Inland South and
Northwest England speakers did not. The American West and RP speakers were employed in professional
teaching occupations and the Northwest England and Inland South speakers were employed in skilled
trades. Therefore, their educational and occupational attainment matched the indexical class and status

65
associated with their accents. We presented all participants with all four recordings, regardless of their
location.
Prior to being presented with the recordings or giving attitudinal responses, participants each
completed a triad test (Bernard 2011, pp. 230–233) with a lambda-3 balanced incomplete block design
(Burton and Nerlove 1976) for the 11 prestige domain items, resulting in 55 triadic comparisons per
participant. In each comparison, participants chose which of the three items was perceived to be least like
the others, thereby creating a pair of like items. This could be used to assess whether the perception of the
structure of prestige items was consistent beyond the sociolinguistic context of the prestige of regional
accents.
We collected a number of demographic variables from participants, to be able to examine any
systematic differences in responses. The demographic variables chosen were: country, age, gender,
ethnicity, locality size, English proficiency, education, occupation, and income. The distributions of each
variable within the sample are displayed in Figure 3.7 in comparison with those of the subsequent scale
evaluation study.
We collected data in May and June 2016 using online surveys implemented on SurveyMonkey and
distributed using social media (n = 5 US, 2 UK), the Amazon Mechanical Turk and TurkPrime (Litman et al.
2017) platforms (n = 148 US), and the Prolific platform (n = 153 UK), for a final sample of 308 (153 US, 155
UK). There were 5 participants (4 US, 1 UK) that completed the triad test but not the attitudinal speech
evaluation, so the final sample for the attitudinal data was 303 (149 US, 154 UK). There were otherwise no
missing attitudinal or triad data, as we required participants to complete every item in order to receive
payment.
3.4.1.3 Exploratory factor analysis
First, we checked the data for conformity to the assumptions of exploratory factor analysis (“EFA”). Though
strict multivariate normality is not required for exploratory or confirmatory methods using categorical
models, and violations are allowable under continuous models (i.e. maximum likelihood) if measurement

66
invariance is established (Lubke and Muthén 2004), we found that the distribution of responses to the
attitudinal items was not multivariate normal, with p ≅ 0 for Mardia’s test (Mardia 1970, 1974), the Henze-
Zirkler test (Henze and Zirkler 1990), and Royston’s test (Royston 1982, 1983). We identified multivariate
outliers using adjusted chi-square quantile-quantile plots of Mahalanobis distances and removed one
participant (from the US sample) with extreme outlier values.
We then assessed the distributions of attitudinal items for approximate univariate normality, as
well as for acceptable values of skewness and kurtosis. Following Bulmer (1979), absolute values of
skewness below 0.5 indicated an approximately symmetric distribution, values between 0.5 and 1.0 were
considered moderately skewed, and values above 1.0 were highly skewed. According to the findings of West
et al. (1995) and Curran et al. (1996), issues of bias due to non-normality may result from the analysis of
data distributed with absolute skewness values above 2.0 or kurtosis values above 7.0. We found individual
variables to be approximately normal and values of skewness (M = -0.242, SD = 0.407) and kurtosis (M = -
0.536, SD = 0.476) to be within acceptable ranges.
We evaluated linear relationships between items and their factorability by examining inter-item
correlations, using the Kaiser-Meyer-Olkin (“KMO”) test of sampling adequacy (Kaiser and Rice 1974), with
values greater than or equal to 0.50 considered suitable (Nunnally 1978; Tabachnick et al. 2001; Hair et al.
2010), and using Bartlett’s test of sphericity (Bartlett 1937) to test whether the correlation matrix was
factorable. We calculated a polychoric correlation matrix because attitudinal items were measured using an
ordinal scale (Holgado-Tello et al. 2010). Following Savalei (2011), no adjustments were made to zero
frequency cells in the bivariate tables. A large proportion of inter-item correlations (73/210, or 34.8%) were
above 0.50, indicating the presence of linear relationships. KMO values were well above 0.50 for all
variables (overall = 0.946, M = 0.935, SD = 0.039) and the result of the Bartlett’s test was highly significant
(p ≅ 0), together indicating suitable factorability.
Lastly, we evaluated whether our sample sizes were adequate, using the guidelines of having a total
sample size of at least 𝑝𝑝(𝑝𝑝−1)2 (Jöreskog and Sörbom 1996, p. 171), where 𝑝𝑝 is the number of items or variables,
and a subjects-to-variables ratio of at least 10:1 (Nunnally 1978, p. 276) or 20:1 (Hair et al. 2010). The sample

67
size for this study (after outlier removal) was 302, which (at 𝑝𝑝 = 20) exceeds the suggested minimum of
190, and the subjects-to-variables ratio was 15.1:1, which lies above the recommendation of 10:1 and below
20:1.
We then conducted exploratory factor analysis for the purpose of exploring the structure and
dimensionality of the prestige construct. Our analyses used a three-stage robust diagonally weighted least
squares estimation technique (weighted least squares, mean and variance adjusted, or “WLSMV”) due to its
suitability for use on ordinal data with an adequate number of categories (Jöreskog and Sörbom 1996, pp.
23–24; Rhemtulla et al. 2012; DiStefano and Morgan 2014). We used a conservative oblimin (oblique) factor
rotation method to allow for potential intercorrelations between factors, which may be expected in real-
world attitudinal data (Kline 1991, pp. 19–20).
We eliminated items sequentially, first to remove items that had poor value in discriminating the
prestige domain from the other two domains included—solidarity and dynamism—and then to determine
the most parsimonious structure within the prestige domain. Items needed to meet all of the following
acceptance criteria to be retained: a) primary factor loading with an absolute value > 0.32; b) cross-loadings
with absolute values < 0.32; c) gap between primary and cross-loadings > 0.2; and d) communality > 0.4
(Costello and Osborne 2005). We re-evaluated the optimal number of factors at each step using the parallel
analysis with comparison data method of Ruscio & Roche (2012).
Through this process, we obtained the overall factor structure for the attitudinal items across all
three domains (Table 3.2a; Figure 3.4), as well as the internal factor structure of the prestige domain items
(Table 3.2b; Figure 3.1). Using EFA, items within the prestige domain were partitioned into three factors:
wealthy, powerful, and high social status in the first factor, hereafter referred to as “position”; reputable and
respected in the second factor, referred to as “reputation”; and educated and intelligent in the third factor,
referred to as “information.” We therefore denote the resulting factor structure as Position-Reputation-
Information, or “PRI.”
After completing EFA using the attitudinal data, we then repeated the process using the data from
the triad test as a second, parallel source of information on the structure of the prestige construct absent
the embedded sociolinguistic context. Since the pairings in the triad data are represented as a series of

68
dichotomous observations, we calculated a tetrachoric correlation matrix (Hershberger 2005), using a
correction of 0.5 for empty bivariate cells (following Savalei 2011) and eigenvector smoothing to ensure the
matrix was positive definite. We chose related methods to maximize comparability between the attitudinal
and triad data sources. We used a non-robust weighted least squares (“WLS”) estimator with standard
parallel analysis and identical acceptance criteria to those used for the EFA of the attitudinal data described
above.
The inter-item correlations between triad items had 4/55 (7.3%) above 0.50. The overall KMO
value was 0.364 (M = 0.368, SD = 0.160), with the lowest individual values being successful at 0.075 and
powerful at 0.157, and the highest being wealthy at 0.585. While the result of the Bartlett’s test was highly
significant (p ≅ 0), it is also dependent upon sample size, which was reasonably large (n = 308). Taken
together, these results suggested that factorability could be poor due to the nature of how the data were
represented; specifically, the triadic comparisons generated a matrix with a large amount of “missing” data,
as only 3 items in each observation (out of 11 total) had values. The sample size for the triad data was much
higher than the suggested minimum of 45 in this case (given the lower number of items), and the subjects-
to-variables ratio was 30.8:1, which is above both recommended values. We obtained the internal factor
structure for the prestige domain items in the triad data (Table 3.2c) using the EFA methods described.
The structure closely resembled the attitudinal results in all respects except that powerful was dropped from
the position factor due to negative loadings and low communality.

69
Table 3.2. Factor loadings and communalities from exploratory factor analysis of attitudinal and triad data. Values are from analyses of: (a) all items from attitudinal data over the three domains; (b) internal prestige domain items from attitudinal data; and (c) internal prestige domain items from triad data. All cases show the items remaining after eliminating prestige domain items that failed to meet acceptance criteria, and after removing prestigious from (b) and (c). Note: Factor loadings with absolute value < 0.20 are suppressed.
(a)
PRESTIGE SOLIDARITY DYNAMISM communality
educated 0.962 -0.201 0.852
intelligent 0.921 0.806
high social status 0.893 0.862
successful 0.880 0.805
prestigious 0.861 0.781 wealthy 0.847 0.818
respected 0.736 0.237 0.638
powerful 0.734 0.260 0.727
reputable 0.694 0.278 0.573
warm 0.893 0.787
friendly 0.890 0.795
kind 0.865 0.749
good-natured 0.837 0.705
comforting 0.808 0.660
enthusiastic 0.278 0.442 0.383 0.460
aggressive -0.441 0.409 0.394
active 0.341 0.394 0.364
(b)
Position Reputation Information communality
wealthy 0.935 0.862
powerful 0.819 0.688
high social status 0.771 0.872
reputable 0.824 0.729
respected 0.238 0.590 0.668
educated 0.893 0.880
intelligent 0.845 0.826
(c)
Position Reputation Information communality
wealthy 0.776 0.571 high social status 0.657 0.497
reputable 0.820 0.655
respected 0.705 0.532
intelligent 0.962 0.891 educated 0.832 0.749

70
Figure 3.4. Factor loadings from exploratory factor analysis of attitudinal data. Visual display of the values in Table 3.2a. Position, reputation, and information items are shown in light blue, gold, and pink, respectively. Other prestige items are shown in black (prestigious, not used in scale) and grey (later dropped from internal prestige structure, shown in Figure 3.1). Solidarity items are in green. Dynamism items are in purple.
5.4.1.4 Cluster analysis
Following the EFA for both the attitudinal data and the triad data, we also elected to conduct cluster
analysis on the items in both data sets to compare results with the EFA findings on the internal structure of

71
the prestige construct. Though the outputs of EFA and cluster analysis are qualitatively similar, the two
methods have substantively different goals (dimensionality reduction to latent constructs versus
classification to subgroups, respectively) and algorithms. We chose the Partitioning Around Medoids
(“PAM”) method (Kaufman and Rousseeuw 1990), a type of k-medoids algorithm in the k-means family, due
to its flexibility in accommodating various dissimilarity measures and its robustness against outliers. For
the attitudinal data, we used Manhattan distances rather than Euclidean due to their suitability for ordinal
data (Kaufman and Rousseeuw 1990). Visual examination of the Manhattan distance matrix using
multidimensional scaling suggested that the attitudinal data were amenable to cluster analysis.
We eliminated items sequentially to remove items with poor discriminant value and to determine
the internal prestige structure, retaining items which had a positive silhouette width of at least 0.1 and the
removal of which did not substantially improve the overall clustering structure (as measured by average
silhouette width of the solution). The silhouette width of an item represents the relative consistency of that
item within its cluster. At each step, we used the Duda-Hart test (Duda et al. 1973) to determine whether
more than one cluster was supported and the number of clusters was determined by the highest average
silhouette width.
The PAM method resulted in a 2-cluster solution for all attitudinal items (Figure 3.5) and a 3-
cluster solution for the internal prestige domain items (Figure 3.6A). The average silhouette width of the 2-
cluster solution for all items was 0.428, while the next highest, at 4 clusters, was 0.294. For the internal
prestige domain items, the average silhouette width of the 3-cluster solution was 0.282, with 0.300 for 2
clusters. However, the Dunn index, or the ratio of minimum inter-cluster distance to maximum intra-
cluster distance (Dunn 1974), was 1.052 for the 3-cluster internal solution and 0.882 for the 2-cluster
internal solution, indicating that the 3-cluster solution has better validity. These results support the 3-
cluster solution for the internal prestige domain items and this solution matches exactly the PRI structure
found through EFA.
Applying the PAM method to the triad data gave similar results, with the highest average silhouette
width overall (0.388) found for a 3-cluster solution that matched the PRI structure (Figure 3.6B). However,
we reached this solution by eliminating the hardworking and ambitious items based on information from

72
the EFA showing their poor fit within the prestige domain. The triadic comparisons included only prestige
domain items so, within the context of the triad data alone, this information about the ability to
discriminate from other domains would be unavailable. Additionally, the Dunn index suggested better
support for this 3-cluster solution (1.112) than for a 4-cluster solution that included hardworking and
ambitious (1.051). These results are consistent with what we found from the attitudinal data and replicate
the PRI structure in the best-fitting solution.
Figure 3.5. Silhouette and multidimensional scaling plots of the clustering of prestige, solidarity, and dynamism attitudinal items. Position, reputation, and information items are shown in light blue, gold, and light red, respectively. Other prestige items are shown in black (prestigious, not used in scale) and grey (later dropped from internal prestige structure, shown in Figure 3.6A). Solidarity items are in green. The remaining dynamism item (active) is in purple. To the right of each cluster is the number of items in that cluster and its average silhouette width. Silhouette width values represent the relative consistency of each item within its cluster.

73
Figure 3.6. Silhouette plots and multidimensional scaling plots of the clustering of prestige domain items. Plots depict clustering of: (A) internal prestige domain attitudinal items, after eliminating items that failed to meet acceptance criteria; and (B) prestige domain triad items, after eliminating items that failed to meet acceptance criteria as well as hardworking and ambitious (see text). Position, reputation, and information items are shown in light blue, gold, and light red, respectively. To the right of each cluster is the number of items in that cluster and its average silhouette width. Silhouette width values represent the relative consistency of each item within its cluster. Multidimensional scaling was done using Manhattan distances for attitudinal items and tetrachoric correlations for triad items.
3.4.2 Study 2: Scale evaluation
3.4.2.1 Item generation
We used the full set of items generated for the previous scale construction study (Table 3.1) for evaluation
and validation of the scale. We selected three additional prestige items (talented, driven, and skilled) from
those generated by the free listing exercise to explore whether the inclusion of additional terms would have
any effect on the PRI structure or provide additional explanatory power. As a number of the existing terms
could be interpreted as measures of “ascribed” prestige (i.e. traits that are largely assigned or fixed based on

74
the circumstances of one’s birth), we chose these terms as representative of the concept of “achieved”
prestige (i.e. traits that can be earned or acquired; Linton 1936; Svalastoga 1959, p. 16).
We also reverse-scored three items (intelligent-unintelligent, ambitious-unambitious, and kind-
unkind) to reduce potential bias in responses (Schriesheim and Hill 1981), selected intentionally to avoid
potentially ambiguous reversals. However, during exploratory analyses, we found that the distributions of
responses to the reversed items were significantly skewed toward higher values than for the same items in
the scale construction study. This suggests that participants were less likely to agree with a negative
assessment of a speaker (i.e. unintelligent) than they were to disagree with its opposite positive assessment
(intelligent). These differences caused issues with the consistency of responses and negatively affected
model fit, similar to the problems seen later with reversed items in the Cheng et al. (2010) scale (see
Criterion validity) but to a lesser degree. Due to these issues, we do not recommend reversal for future
studies using attitudinal items scored on a Likert-type scale (cf. Harrison and McLaughlin 1993).
3.4.2.2 Questionnaire construction and administration
In the online questionnaire for the scale evaluation study, we presented each participant with 10 audio
recordings of the same passage used in the scale construction study: the first paragraph of Comma Gets a
Cure. Each recording used a speaker with a different regional accent of English, and we asked participants
to rate each speaker on all 23 attitudinal items (Table 3.1, plus talented, driven, and skilled under prestige)
using a 7-point Likert-type scale from strongly disagree (1) to strongly agree (7).
We presented participants in the US with 8 US-based accents and 2 UK-based accents, while
participants in the UK were presented with 8 UK-based accents and 2 US-based accents, for a total of 16
different accents across the entire sample, 4 of which were cross-tested in both countries (Table 3.3). The
recordings for the 4 cross-tested accents were identical to those used in the scale construction study. All
recordings were used under license from IDEA (see Acknowledgements) except for American West (Urban)
and Wales, which we recruited from local contacts and recorded.

75
Table 3.3. Regional accents and the participants to which they were presented in the scale evaluation study.
United States All Participants United Kingdom
American West (Rural) American West (Urban) Southwest England
Midland American Inland South (Blue-Collar) Southeast England
Inland North Received Pronunciation Yorkshire
American Inland South (White-Collar) Northwest England Scotland
Mid-Atlantic Ireland
New York City Wales
As in the scale construction study, we selected speakers for consistency from the recordings
available. All speakers self-identified as white men and ranged in age from 31 to 59 years. Speakers varied in
their level of education, occupation, and settlement size during childhood. The speaker from Wales was 45
years old at the time of recording, held an advanced degree, and was employed in an academic profession.
We collected data in June 2016 using online surveys implemented on SurveyMonkey and
distributed using Amazon Mechanical Turk and TurkPrime (Litman et al. 2017) (n = 151 US) and Prolific (n
= 144 UK), for a sample size of 295. We excluded participants from the prior scale construction study to
ensure an independent sample. The results did not contain any missing data for attitudinal items.
3.4.2.3 Demographic comparisons
Demographic characteristics of the scale evaluation sample were similar to the scale construction sample
(Figure 3.7). Permutation tests of independence (Hothorn et al. 2006), adjusted for multiple comparisons
to control for the false discovery rate, confirmed that significant differences were present only in the
distributions of the age (p < 0.001) and occupation (p < 0.001) variables between the two studies, as a result
of a larger proportion of relatively younger students in the scale evaluation sample. Given the similarity
across all other variables, we considered this to be a relatively minor issue, and one that could be checked
analytically by examining measurement invariance (see Confirmatory factor analysis).

76
Figure 3.7. Demographic comparisons of the samples from the scale construction and scale evaluation studies. Vertical axes display counts of participants for each variable. Teal bars represent participants in the first (scale construction) study and orange bars represent participants in the second (scale evaluation) study.
3.4.2.4 Exploratory factor analysis
Following checks of assumptions, outliers, item relationships, item factorability, and sample size, we
conducted EFA on the scale evaluation data using methods and criteria identical to those used in the scale
construction study, to address the question of whether the items generated adequately represented the

77
breadth and structure of the individual prestige concept. The items that were previously eliminated in the
EFA of the scale construction study were eliminated again in the process of conducting this EFA, due to
violations of acceptance criteria. All three additional “achieved” prestige items—talented, driven, and
skilled—were also eliminated, particularly because of high cross-loadings or primary loadings on other
factors. We therefore made no changes to the structure of the model or the items included and found the
scope of the existing PRI model to be adequate for use in CFA.
3.4.2.5 Confirmatory factor analysis
The distribution of responses to the attitudinal items was not multivariate normal (p ≅ 0 for all tests). We
removed four participants with six extreme outlier values (all from the US sample) as a result of examining
Mahalanobis distances, leaving a final sample size of 291. The individual variables were approximately
normal, and values of skewness (M = -0.209, SD = 0.369) and kurtosis (M = -0.617, SD = 0.279) were within
acceptable ranges.
We then performed measurement invariance testing (Putnick and Bornstein 2016), to ensure that
the relationships between indicators and latent variables within the prestige construct were consistent
across participant demographic groups by country, age, gender, ethnicity, locality size, educational
attainment, occupation, and income. The sample contained an insufficient number of non-native English
speakers to test for invariance by native English proficiency; therefore, we excluded this variable. We tested
five increasingly constrained models in sequence: configural invariance (Model 1), metric or “weak”
invariance (Model 2), scalar or “strong” invariance (Model 3), residual or “strict” invariance (Model 4), and
residual invariance with constrained means (Model 5). We established configural invariance using the
permutation method proposed by Jorgensen et al. (2016). We looked at changes in two noncentrality-based
fit indices, the Comparative Fit Index (“CFI”) and the Root Mean Square Error of Approximation
(“RMSEA”), to evaluate the relative fit of each successive nested model, with ΔCFI values less than or equal
to 0.010 and ΔRMSEA values less than or equal to 0.015 indicating invariance (Chen 2007). Fulfilment of

78
scalar invariance was considered sufficient to proceed with confirmatory factor analysis (Putnick and
Bornstein 2016).
Measurement invariance of the model was upheld across the demographic variables of country,
age, gender, occupation, and income. We found metric non-invariance by locality size (ΔCFI = 0.011,
ΔRMSEA = 0.030), and ethnicity and educational attainment were borderline metric non-invariant (ΔCFI =
0.007, ΔRMSEA = 0.022; and ΔCFI = 0.009, ΔRMSEA = 0.026, respectively). Given these results, we
defined a complex survey design which re-fit the model using pseudo-maximum likelihood and provided
adjusted point and variance estimates (Lumley 2011; Oberski 2014). In this design, the potentially non-
invariant demographic variables were incorporated as weighted sampling strata using weights
approximated from US (United States Census Bureau and American FactFinder 2010, 2016a, 2016b) and UK
census data (Department for Environment, Food & Rural Affairs 2012; Office for National Statistics and
Nomis 2011a, 2011b).
We then performed confirmatory factor analysis (“CFA”) to assess the fit of this model to the scale
evaluation data. As the WLSMV estimation method used in previous analyses could not be applied to a
complex survey design, we used maximum likelihood with robust standard errors (mean and variance
adjusted using the Satterthwaite approach: Satorra and Bentler 1994; “MLMVS”) for the CFA based on the
complex survey design. Equivalent results should be obtained from either method, as the two perform
comparably for 7-point ordinal data (Rhemtulla et al. 2012).
We assessed the goodness of fit of confirmatory models with and without the complex survey
design using two incremental fit indices (the CFI, as above, and the Tucker-Lewis Index, or “TLI”) and two
absolute fit indices (the RMSEA, as above, and the Standardized Root Mean Square Residual, or “SRMR”).
We drew cutoff criteria from Hu & Bentler (1999) and adjusted them to the recommendations of Yu (2002)
as follows: CFI > 0.95; TLI > 0.96; RMSEA < 0.05; and SRMR < 0.07. We obtained parameter estimates
using both robust maximum likelihood and robust weighted least squares methods, and compared fit
indices for the models using MLMVS estimation, MLMVS estimation with a complex survey design, and
WLSMV estimation (Table 3.4).

79
Table 3.4. Goodness of fit indices for the Position-Reputation-Information scale model. Robust indicators were estimated using: maximum likelihood methods, maximum likelihood methods with fit adjustments from a complex survey design to account for demographic non-invariance, and weighted least squares methods. Bounds for 90% confidence intervals are provided for RMSEA.
Model CFI TLI RMSEA [90% CI] SRMR
MLMVS 0.948 0.983 0.056 [0.048, 0.064] 0.020
MLMVS with Complex Survey Design 0.959 0.983 0.031 [0.026, 0.036] 0.023
WLSMV 0.994 0.989 0.094 [0.085, 0.104] 0.022
All three models shared the identical PRI structure and had comparable fit indices. We selected the
model using MLMVS with adjustments from the complex survey design as the preferred model (Figure 3.2)
because it fulfilled the cutoff criteria for all fit indices and properly incorporated information on all
potentially non-invariant demographic variables.
3.4.3 Scale validity and reliability
3.4.3.1 Content validity
Content validity is the assessment of whether the scale adequately represents the extent of the domain of
interest. As content validity is essentially a qualitative judgment rather than a statistical one (Haynes et al.
1995), we worked to establish and report the content validity of the PRI scale through the methods used to
generate the items and those used to construct and verify the scale.
As mentioned previously, items were generated in part by participants through an inductive,
endogenous process in the free listing task, which produced a broad but consistent sample of items. We
supplemented this with more traditional deductive sampling of terms from previous literature and a pilot
study. Rather than consulting external subject matter experts (cf. Lawshe 1975), we valued more highly the
validity of judgments by the study participants in generating and associating items.
Additionally, we included three “achieved” prestige items (talented, driven, and skilled), drawn from
the free listed terms, to confirm the content validity of the model being tested. These items (and all of the
same items dropped previously from the scale construction study) were dropped due to failure to meet the

80
acceptance criteria, which lends support to the validity of the PRI scale and the sufficiency of its domain
breadth.
Finally, we considered that the relative lack of demographic diversity among free listing
participants in the initial scale construction study (compared to that of our other samples) could have
negatively impacted the breadth of items generated and hence the content validity of the scale. However,
we found no specific evidence to suggest this was the case, aside from potential issues of measurement non-
invariance (see Confirmatory factor analysis) which could have occurred regardless. We therefore do not
consider this to have been a point of concern for the present study but would recommend future studies
endeavor to recruit a maximally diverse and representative sample from the population of interest for item
generation.
3.4.3.2 Construct validity
Construct validity is the property that the scale measures what it is intended to measure, which is generally
confirmed by showing correlations among elements expected to be similar (“convergent validity”) and a
lack of correlation among elements expected to be dissimilar (“discriminant validity”). The construct
validity of the PRI scale was established by examining the convergent validity of scale items, the
discriminant validity between PRI subscales (position, reputation, and information), and the discriminant
validity between the prestige scale and the other two domains included in the data (solidarity and
dynamism).
We assessed convergent validity within the scale by examining the polychoric correlation matrices
of the scale items in both studies and the average variance explained (“AVE”) of the scale items in the scale
evaluation study. Following common practice, correlation coefficients between 0.10 and 0.30 were
considered small, between 0.30 and 0.50 were moderate, and greater than 0.50 were large (Cohen 1988).
AVE values greater than 0.50 were deemed acceptable, as they indicate sufficient variance attributed to the
construct as opposed to measurement error (Fornell and Larcker 1981).

81
We found polychoric correlations (ρ) between all PRI scale items to be high (M = 0.631, SD =
0.094) and correlations were higher between items within the same subscale than between items in
different subscales (Table 3.5). The AVE values for each of the three subscales—position, reputation, and
information—were 0.675, 0.630, and 0.699, respectively; all were above the criterion of 0.50, supporting
convergent validity.
Table 3.5. Polychoric correlations between Position-Reputation-Information scale items. Mean (and standard deviation) polychoric correlations between Position-Reputation-Information items within the same subscale are shown on the main diagonal and those for items between different factors are shown below the main diagonal. Values were calculated using the combined scale construction and scale evaluation data sets. Correlations within 2-item factors have no mean or standard deviation because they consist of only one measurement.
Position Reputation Information
Position
0.733 (0.097)
Reputation
0.580 (0.043)
0.707
Information
0.625 (0.118)
0.594 (0.054)
0.733
The discriminant validity of constructs, which naturally opposes convergent validity, was assessed
using the heterotrait-monotrait ratio of correlations criterion (“HTMT”), a method developed to avoid the
potential issues of other indices (Henseler et al. 2015). For this criterion, lower values indicate greater
discriminant validity. HTMT values between the prestige PRI subscales and the other two constructs—
solidarity and dynamism—were all below the cutoff of 0.85 advised by Voorhees et al. (2016), verifying
discriminant validity of the prestige construct (Table 3.6). Similarly, HTMT values showed good
discriminant validity between the three PRI subscales. This shows that the three PRI subscales, along with
showing good convergent validity (as their items are all measuring elements of the same prestige
construct), also exhibit substantial discriminant validity from other constructs and from one another. We
consider these results to be support for the PRI scale’s overall construct validity and simple structure.

82
Table 3.6. Heterotrait-monotrait ratio of correlations between items from Position-Reputation-
Information subscales and solidarity and dynamism constructs. HTMT values between each Position-Reputation-Information subscale and the solidarity and dynamism constructs are shown below the main diagonal. Lower HTMT values indicate greater discriminant validity. Values were calculated using the scale evaluation data set.
PRESTIGE SOLIDARITY
Position Reputation Information
PRESTIGE Position Reputation 0.818 Information 0.841 0.835
SOLIDARITY 0.086 0.442 0.246
DYNAMISM 0.727 0.773 0.735 0.670
3.4.3.3 Criterion validity
The criterion validity of a scale relates to its ability to be used as a measurement tool for the construct of
interest, either assessed concurrently with a direct measure of that construct, in comparison with other
available tests, or as a predictive indicator of independent or future outcomes. Predictive validity could not
be assessed in this instance, as we did not have any future measurements or any independent prestige-
related traits that were not already used in scale construction and evaluation, so we assessed the concurrent
criterion validity of the scale through the other two avenues.
We first compared each item’s polychoric correlation with the prestigious item. The prestigious
item was included in the surveys but excluded from the scale, and was used as a direct representative of the
general construct of prestige that we intended to measure. In the scale evaluation data set, polychoric
correlations between scale items and the prestigious item were high overall (M = 0.678, SD = 0.104), as
were mean correlations with prestigious within each of the PRI factors (position: M = 0.748, SD = 0.096;
reputation: M = 0.626, SD = 0.026; information: M = 0.627, SD = 0.143). Estimated factor scores for each
PRI factor (using the Empirical Bayes Modal approach of Skrondal and Rabe-Hesketh 2009 for ordinal
variables and the MLMVS model with adjustments from the complex survey design) were even more highly
correlated with prestigious than the raw item scores (PRI individual prestige: ρ = 0.815; position: ρ = 0.844;
reputation: ρ = 0.764; information: ρ = 0.745).

83
Secondly, to compare with another test of prestige, we asked a new set of participants (n = 91 US, 53
UK; again recruited through Amazon Mechanical Turk and Prolific) to rate two new speakers (having the
Inland South and Received Pronunciation accents) using the present scale alongside the prestige-
dominance scale of Cheng et al. (2010; as detailed in the Electronic Supplementary Material). We modified
the text of the items in the Cheng et al. scale (from “members of your/the group” to “people”) to better fit
the context of our study. We removed outliers from the data and, using the same methods as above (with
WLSMV estimation for the Cheng et al. scale data as the previous estimation method was not specified;
Cheng et al. 2010), calculated factor scores for the PRI subscales, the solidarity and dynamism dimensions,
and the prestige and dominance factors from the Cheng et al. prestige-dominance scale. We calculated
polychoric correlations to examine the level of agreement between these measures.
In this additional comparative data set, we found substantial correlations between factor scores of
the PRI scale and the prestige factor of the Cheng et al. scale (PRI overall: ρ = 0.850, position: ρ = 0.805,
reputation: ρ = 0.861, information: ρ = 0.828) and, in general, we found that the individual prestige items of
each scale were correlated (M = 0.567, SD = 0.221). However, one item in particular from the Cheng et al.
scale (item 17: “Other people do NOT enjoy hanging out with him”) was relatively uncorrelated with PRI
items and with the other Cheng et al. prestige items. Notably, this is one of the three reversed items in the
Cheng et al. prestige factor, the other two of which (items 2 and 6: “People do NOT want to be like him”
and “People do NOT value his opinion”) had only moderate correlations with PRI items and other Cheng et
al. prestige items. The removal of all three reversed items had little effect on correlations between the
Cheng et al. prestige factor and the PRI subscales (PRI overall: ρ = 0.856, position: ρ = 0.810, reputation: ρ =
0.867, information: ρ = 0.832) but improved the mean correlation between individual items (M = 0.690, SD
= 0.066).
The reversed items contributed to the poor fit of the Cheng et al. scale overall in this data set (CFI =
0.875, TLI = 0.856, RMSEA = 0.229 [90% CI: 0.219, 0.238], SRMR = 0.154; using WLSMV estimation). The
model fit improved with the removal of all reversed items (CFI = 0.973, TLI = 0.966, RMSEA = 0.151 [90%
CI: 0.137, 0.165], SRMR = 0.083), but remained unacceptable under criteria for the two absolute fit indices,
RMSEA and SRMR. We found the fit of the PRI scale using the same data and estimation method (WLSMV)

84
met the cutoffs for all indices except RMSEA (CFI = 0.998, TLI = 0.995, RMSEA = 0.106 [90% CI: 0.075,
0.139], SRMR = 0.019). Notably, polychoric correlations between—first—the factor scores for dominance in
the Cheng et al. scale (reversed items removed) and—second—the Cheng et al. prestige factor scores, the
prestigious item, and the PRI factor scores, were all moderate to high (Cheng et al. prestige: ρ = 0.449,
prestigious: ρ = 0.561, PRI prestige overall: ρ = 0.533, position: ρ = 0.569, reputation: ρ = 0.489, information:
ρ = 0.501), which may indicate issues with the validity of the dominance construct.
3.4.3.4 Interrater reliability
In these studies, we did not expect participants to rate each speaker identically for each item, nor is such
agreement required to obtain a reliable scale of individual prestige. As mentioned in the Introduction, prior
work has shown that different demographic groups will evaluate accents differently. By testing and
adjusting the fit of the confirmatory model, we already incorporated information on patterns of variation in
item ratings, both by individual and between demographic groups. Our results showed that participants
displayed a consistent understanding of the overall prestige construct regardless of disagreements about
particular speakers. This being said, measures of interrater reliability can be obtained and so we provide
them here for completeness.
We calculated Krippendorff’s alpha coefficient (Krippendorff 2012, pp. 221–250) using ordinal
weights, as well as the intraclass correlation coefficient (“ICC,” specifically ICC(C,1) of McGraw and Wong
1996). The level of Krippendorff’s alpha indicating agreement was 0.8, with values between 0.667 and
0.800 allowing for “tentative conclusions” (Krippendorff 2012, p. 241). For the ICC, values less than 0.40
were considered to be poor, between 0.40 and 0.60 were fair, between 0.60 and 0.75 were good, and
greater than 0.75 were excellent (Fleiss and Fleiss 1986). The reliability values of Krippendorff’s alpha
obtained for the scale construction and scale evaluation data sets were 0.414 and 0.383, respectively. ICC
values for the two data sets were 0.473 [95% CI: 0.359, 0.625] and 0.459 [95% CI: 0.346, 0.612], using only
the ratings of speakers that were cross-tested in both countries.

85
3.4.3.5 Internal consistency
Lastly, the internal consistency of a scale measures the similarity of results across scale items. We examined
this by calculating Cronbach’s alpha (Cronbach 1951) as well as three variations of the omega coefficient
(Raykov, Bentler, and McDonald, as described in Revelle and Zinbarg 2009). The criterion used for
acceptable values of internal consistency measures, given that this study is basic research for the purpose of
developing a scale, was 0.80 (Lance et al. 2006; Nunnally 1978, pp. 245–246).
Using the fitted MLMVS model with adjustments from the complex survey design, internal
consistency measures were well above the cutoff for the overall scale, and above or slightly below it for the
three PRI latent factors (Table 3.7). Analyses showed that these values would only decrease we removed
any individual scale item, suggesting that they are all vital to the structure of the scale.
Table 3.7. Internal consistency measures for the Position-Reputation-Information scale and its subscales.
Cronbach's alpha Omega
PRESTIGE 0.892 0.918
Raykov Bentler McDonald
Position 0.844 0.858 0.858 0.859
Reputation 0.772 0.773 0.773 0.773
Information 0.794 0.818 0.818 0.818

86
4. PRESTIGE AND CONTENT BIASES IN THE EXPERIMENTAL
TRANSMISSION OF NARRATIVES
4.1 Introduction
Storytelling is a powerful and universal tool that humans use to know and understand the world (Bruner
1991, 2009), to preserve history and traditional knowledge (Vansina 1985; Lejano et al. 2013), to educate
(Cajete 1994; Piquemal 2003), to persuade (Chang 2009; Delgadillo and Escalas 2004), and to heal
(Struthers et al. 2004; White et al. 1990). Stories encode complex cultural and ecological information, and
have the capability to endure for at least 7,000 years (da Silva and Tehrani 2016; Nunn and Reid 2016), and
possibly much longer (Tehrani and d’Huy 2017). In addition, skilled storytelling may increase an
individual’s reproductive fitness (Scalise Sugiyama 1996) and social value, and promote cooperation within
groups (Smith et al. 2017). Stories are an efficient and effective vector for information transfer (Boyd 2009),
and a body of established literature in the interdisciplinary field of cultural evolution suggests that the
success or failure of a story is determined by the mechanisms of biased cultural transmission (Barrett and
Nyhof 2001; Bebbington et al. 2017; Heath et al. 2001; Mesoudi, Whiten, and Dunbar 2006; Stubbersfield et
al. 2015; Stubbersfield and Tehrani 2013).
The extent to which cultural selection, by way of biased transmission, is the primary factor
responsible for cultural change is a central and enduring debate within cultural evolution (Henrich et al.
2008; Claidière et al. 2014; Acerbi and Mesoudi 2015; Morin 2016b). Cultural selection theory argues that
cultural diversity is largely shaped by direct and indirect cognitive biases that unconsciously drive the
selection of cultural variants over successive transmission events (Cavalli-Sforza and Feldman 1981; Boyd
and Richerson 1985; Henrich 2001). Without some sort of biased selection, cultural learning is unlikely to
be more advantageous than individual learning (Enquist et al. 2007; Rendell et al. 2009; Rogers 1988). In
this study, we provide a novel and realistic approach to studying cultural change through investigating the
relative effects of an array of competing biases within the transmission of narrative stories. This framework
allows us to gain a better understanding of the microevolutionary processes that have shaped and continue
to shape human culture.
87
Despite the critical role that transmission biases appear to play in driving cultural evolution, critical
gaps exist in our understanding of the relative strengths of these biases (Acerbi and Mesoudi 2015;
McElreath et al. 2008; Kendal et al. 2018; Jiménez and Mesoudi 2019). In particular, prior studies have
tended to focus on individual biases, yet multiple biases are always present simultaneously (Heath et al.
2001; Atkisson et al. 2012; Morgan et al. 2012; Stubbersfield et al. 2015; Acerbi and Tehrani 2018).
Narratives are especially dense in information that contains a number of proposed content-based or “direct”
biases (Boyd and Richerson 1985) that have been shown to aid in the salience and retention of information
(Mesoudi, Whiten, and Dunbar 2006; Boyer and Ramble 2001; Eriksson and Coultas 2014; Nairne et al.
2007; Norenzayan and Atran 2004).
Content biases influence transmission through some inherent properties of the variant itself that
make it more appealing and memorable (Boyd and Richerson 1985). These preferences can vary between
individuals and across cultures, but some have been seen to be remarkably consistent (Barrett and Broesch
2012). Here, we conduct the first simultaneous test of the relative effects of the most frequently cited
content biases from the cultural evolution literature. This includes content linked to the following types of
information: social, either in the sense of everyday basic social interaction or of “gossip” about third parties
(Mesoudi, Whiten, and Dunbar 2006; Stubbersfield et al. 2015); survival, for fitness-relevant ecological
situations (Stubbersfield et al. 2015; Nairne et al. 2007; Otgaar and Smeets 2010); emotional, that elicits
strong positive or negative responses such as disgust (Heath et al. 2001; Eriksson and Coultas 2014; Fessler
et al. 2014; Stubbersfield et al. 2017); moral, regarding acceptable behavior and social norms (Heath et al.
2001; Baumard and Boyer 2013), which has not been previously studied explicitly using transmission
experiments; rational, cause-and-effect connections (Glenn 1980); and counterintuintuive, which defies
ontological expectations in biological, physical, mental, and other domains (Barrett 2008; Boyer and
Ramble 2001). Additionally, counterintuitive information can influence transmission in different ways:
singly, counterintuitive elements can be more salient than other types of information (Boyer and Ramble
2001); or a minority of counterintuitive elements can lead to a minimally counterintuitive (“MCI”) bias that
enhances overall recollection of a story (Norenzayan et al. 2006; Stubbersfield and Tehrani 2013). We
crafted the narratives used in this study to resemble real-world creation stories in both form and the

88
aforementioned types of content biases. Creation stories have each individually been subject to many
generations of transmission and transformation and tend to contain biased content at high frequencies.
Beyond the types of information included in a story, learners are also sensitive to the identity and
reputation of the storyteller. These transmission biases are referred to as context-based biases, and include
model-based or “indirect” (Boyd and Richerson 1985) biases such as prestige (Henrich and Gil-White 2001),
success (Mesoudi 2008), and similarity (Mahajan and Wynn 2012; McElreath et al. 2003), and the
frequency-dependent conformity and anti-conformity biases (Henrich and Boyd 1998). In this study, we
specifically examine prestige bias, which involves a preference to learn from individuals of high social
position, reputation, and knowledge (Berl et al. [in prep.]). Prestige bias is one of the most commonly cited
transmission biases (Jiménez and Mesoudi 2019), and has been implicated as one of the predominant forces
in cultural change (Henrich and Gil-White 2001; Henrich and Boyd 2002; Henrich et al. 2015). However,
the limited empirical work on prestige bias to date has shown mixed support regarding the extent to which
prestige actually affects the adoption of particular variants or behaviors (Acerbi and Tehrani 2018; Reyes-
García et al. 2008; Chudek et al. 2016; Garfield et al. 2019) (see Jiménez and Mesoudi 2019 for a recent
general review on the topic).
In this study, we use regional accents of speech as a novel experimental cue for prestige
information. As has been established within the field of sociolinguistics (Labov 1966; Giles 1970; Bishop et
al. 2005; Coupland and Bishop 2007; Fuertes et al. 2012) and verified by two previous studies using accent
in this context (Berl et al. [in prep.]; Samarasinghe et al. [in prep.]), accents are perceived as strong
indicators of prestige. Accents are hard-to-fake signals (Cronk 2005) and tend to be stable over time;
because of this, some varieties become associated with desirable upper class membership and index
membership in high-status groups (Giles 1970; Kahane 1986; Kroch 1978). These perceptions of accent are
consistent with how prestige is understood in cultural evolution studies and provide a methodological
alternative to the traditional use of attention, gaze, or group consensus to represent prestige, which
potentially suffer from a number of flaws (Morin 2016b; Ohlsen et al. 2013; Barkow 2014; Roberts et al.
2019). In our experiment, we present stories aurally and ask for oral recall rather than written responses, to
limit the number of cognitive domains involved.

89
Humans are highly attuned to the biases present in the information we consume and to the
identities of potential cultural models that hold that information. Here, we address multiple gaps in the
literature by explicitly quantifying learners’ recall of multiple distinct types of content, transmitted by
speakers with varying levels of prestige. By testing content and context biases together in the experimental
transmission of a narrative, we can examine the relative effects of a large suite of biases: biases that theory
suggests shape the spread of information and the evolution of human culture.
4.2 Results
Participants showed preferential recall of biased information. Of the final data set consisting of
87,420 narrative propositions presented to participants in total, 12,492 (6.998%) were recalled (Appendix 3,
Table A3.1). A significant difference was found between the proportions of content types presented and
those recalled (z = -2.036, p = 0.042), showing that participants recalled some types of biased information
more frequently than other types, including unbiased information (i.e. propositions that did not contain
any of the examined content biases; Figure 4.1).
(A)

90
Figure 4.1. Color matrices of the presence or absence of propositions in recalled stories. Each row represents one participant’s recall, sorted by hierarchical clustering using McQuitty’s complete linkage method. Each column is a proposition from the Muki (A) and Taka & Toro (B) artificial creation stories, in the order in which they appeared in the stories, from left to right. The first two rows of each matrix, separated by a white line, show the full set of propositions contained in the original stories. Within each panel, rows above the black horizontal line were read by a high-prestige speaker, while rows below the black line were read by a low-prestige speaker. Dark gray propositions were not recalled (absent). Recalled propositions (present) are each represented by a color that indicates the content biases they contained: social information is yellow, survival is green, positive emotional is light blue, negative emotional is dark purple, moral is pink, rational is magenta, counterintuitive is teal, and propositions containing more than one bias are gold. Unbiased propositions, those that did not contain any biased information, are shown as black.
Recall for each type of content bias ranged from a mean proportion of 0.066 of the propositions
presented (moral) to 0.338 (biological counterintuitive). In general, small but non-significant differences
were observed in the recall of content biases in high- versus low-prestige speaker conditions (Figure 4.2).
However, corrected pairwise comparisons of proportions (Appendix 3, Table A3.2) showed that prestige had
a significant impact on the recall of unbiased information (p < 0.001) and basic social information (p =
0.001). Additionally, unbiased information was recalled significantly less often than biased information
under the same prestige condition, except for positive emotional, moral, rational, and physical and mental
(B)

91
counterintuitive information. Of these, positive emotional, moral, and mental counterintuitive information
were recalled significantly less frequently than unbiased information.
Figure 4.2. Mean proportion of propositions recalled from artificial creation stories by type of content bias and by speaker prestige. Error bars represent 95% confidence intervals. Propositions containing more than one type of content bias are excluded. Content biases were more influential than prestige bias. To explain the variance in recall of specific
propositions, we fit a total of 58 proposed models (Appendix 3, Table A3.3) incorporating story-based,
transmission bias, and demographic variables using maximum likelihood estimation. Eleven of the best-
fitting models had a resulting ∆AIC score < 2, indicating no single “best” model exists. The majority of the
best-fitting models included variables for story presentation order, for prestige, social, survival, negative
emotional, and counterintuitive biases, and for gender and working memory (Table 4.1).

92
Table 4.1. Twenty best-supported models of proposition recall. Degrees of freedom (df) and log likelihood (logLik) and Akaike Information Criterion (AIC) values are provided for each model fit. ∆AIC is the change in AIC relative to the best-supported model. Akaike weights (w) were used in weighted model averaging and represent the relative likelihood of each model.
Name Model df logLik AIC ∆AIC w
Significant variables from full model without income (“A”), with gender
present ~ firstStory + prestige + social + survival + emotionalNegative + counterintuitiveDomain + gender + memory
14 -26399.56 52827.13 0.00 0.117
A with gender and line number
present ~ firstStory + line + prestige + social + survival + emotionalNegative + counterintuitiveDomain + gender + memory
15 -26398.58 52827.15 0.02 0.116
A with gender and moral present ~ firstStory + prestige + social + survival + emotionalNegative + moral + counterintuitiveDomain + gender + memory
15 -26398.72 52827.44 0.31 0.100
A with gender and positive emotional
present ~ firstStory + prestige + social + survival + emotionalPositive + emotionalNegative + counterintuitiveDomain + gender + memory
15 -26398.79 52827.58 0.45 0.093
A with gender and quadratic line number
present ~ firstStory + line + line^2 + prestige + social + survival + emotionalNegative + counterintuitiveDomain + gender + memory
16 -26398.19 52828.37 1.24 0.063
A with gender and country present ~ firstStory + prestige + social + survival + emotionalNegative + counterintuitiveDomain + country + gender + memory
15 -26399.48 52828.96 1.83 0.047
Significant variables from full model without income (“A”)
present ~ firstStory + prestige + social + survival + emotionalNegative + counterintuitiveDomain + memory
13 -26401.49 52828.98 1.85 0.046
A with line number present ~ firstStory + line + prestige + social + survival + emotionalNegative + counterintuitiveDomain + memory
14 -26400.50 52829.00 1.87 0.046
A with gender and town low prestige
present ~ firstStory + prestige + social + survival + emotionalNegative + counterintuitiveDomain + gender + townLowP + memory
15 -26399.51 52829.02 1.89 0.045
A with gender and story present ~ story + firstStory + prestige + social + survival + emotionalNegative + counterintuitiveDomain + gender + memory
15 -26399.55 52829.10 1.97 0.044
A with gender and rational present ~ firstStory + prestige + social + survival + emotionalNegative + rational + counterintuitiveDomain + gender + memory
15 -26399.56 52829.12 1.99 0.043
A with moral present ~ firstStory + prestige + social + survival + emotionalNegative + moral + counterintuitiveDomain + memory
14 -26400.65 52829.29 2.16 0.040
A with positive emotional present ~ firstStory + prestige + social + survival + emotionalPositive + emotionalNegative + counterintuitiveDomain + memory
14 -26400.72 52829.43 2.30 0.037
A with gender and education
present ~ firstStory + prestige + social + survival + emotionalNegative + counterintuitiveDomain + gender + education + memory
17 -26398.09 52830.19 3.06 0.025
A with quadratic line number
present ~ firstStory + line + line^2 + prestige + social + survival + emotionalNegative + counterintuitiveDomain + memory
15 -26400.11 52830.23 3.10 0.025
A with gender and ethnicity present ~ firstStory + prestige + social + survival + emotionalNegative + counterintuitiveDomain + gender + ethnicity + memory
16 -26399.31 52830.63 3.50 0.020
A with town low prestige present ~ firstStory + prestige + social + survival + emotionalNegative + counterintuitiveDomain + townLowP + memory
14 -26401.35 52830.70 3.57 0.020
A with country present ~ firstStory + prestige + social + survival + emotionalNegative + counterintuitiveDomain + country + memory
14 -26401.47 52830.95 3.82 0.017
A with story present ~ story + firstStory + prestige + social + survival + emotionalNegative + counterintuitiveDomain + memory
14 -26401.48 52830.96 3.83 0.017
A with rational present ~ firstStory + prestige + social + survival + emotionalNegative + rational + counterintuitiveDomain + memory
14 -26401.49 52830.97 3.84 0.017

93
Our results (Figure 4.3; Table 4.2) show that the transmission biases with the greatest effect on
recall were, in descending order: counterintuitive (but only for biological violations), negative emotional,
social, survival, and prestige. All other biases had negligible effects according to their model-averaged
coefficients and confidence intervals and their relative variable importance values. Though we did find a
significant effect for prestige, it was the weakest of the transmission biases, with an odds ratio of 1.163 (95%
CI [1.118, 1.216]) compared to the next lowest, survival, with 1.855 (95% CI [1.214, 2.836]) and the strongest
effect, biological counterintuitive, with 7.525 (95% CI [3.895, 14.537]). For story effects, participants had
better recall for the second story they were presented, regardless of which story it was. The placement of
propositions within the story had no effect on recall. For demographic variables, only working memory had
a significant positive effect.

94
Figure 4.3. Forest plot of odds ratios from full model-averaged coefficients for fixed effects. Odds ratios and 95% confidence intervals are depicted such that variables for which confidence intervals do not overlap with 1 have a significant positive (above 1; blue) or negative (below 1; red) effect on proposition recall. Binary and categorical variables are represented relative to the reference level (false/not present unless specified otherwise). For ordinal variables (townChildhoodSize, education, and income), only linear contrasts are shown.
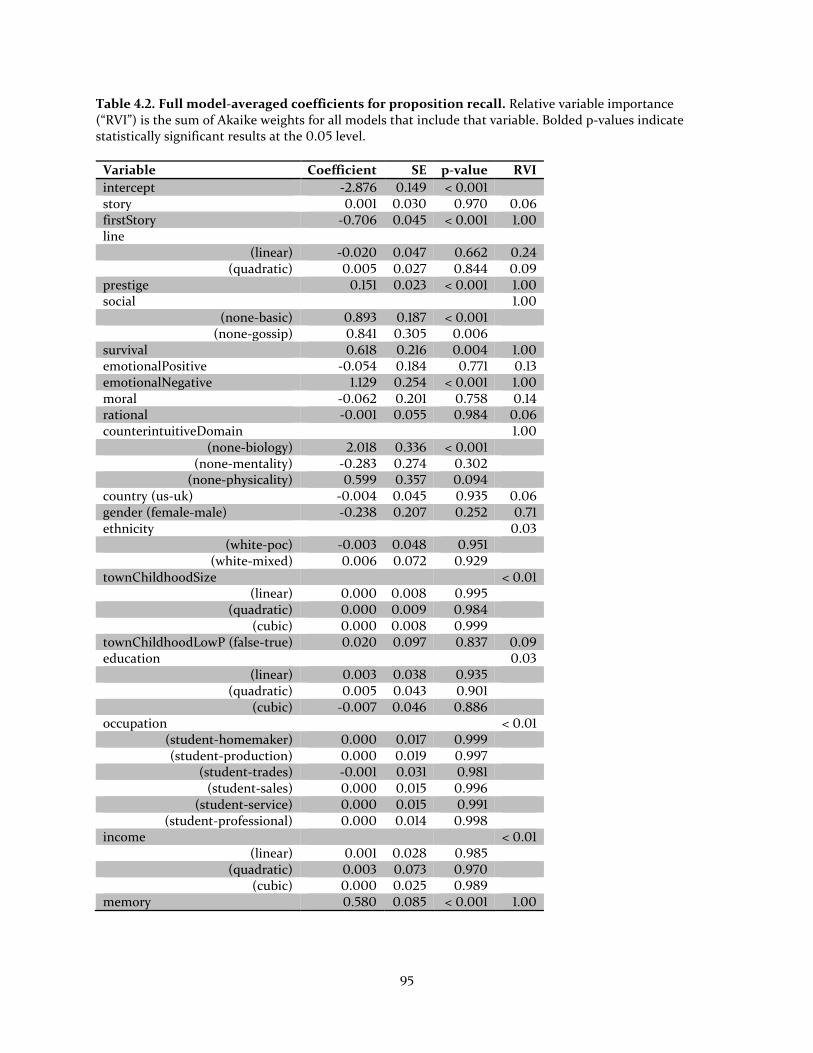
95
Table 4.2. Full model-averaged coefficients for proposition recall. Relative variable importance (“RVI”) is the sum of Akaike weights for all models that include that variable. Bolded p-values indicate statistically significant results at the 0.05 level.
Variable Coefficient SE p-value RVI
intercept -2.876 0.149 < 0.001 story 0.001 0.030 0.970 0.06 firstStory -0.706 0.045 < 0.001 1.00 line
(linear) -0.020 0.047 0.662 0.24 (quadratic) 0.005 0.027 0.844 0.09
prestige 0.151 0.023 < 0.001 1.00 social 1.00
(none-basic) 0.893 0.187 < 0.001 (none-gossip) 0.841 0.305 0.006
survival 0.618 0.216 0.004 1.00 emotionalPositive -0.054 0.184 0.771 0.13 emotionalNegative 1.129 0.254 < 0.001 1.00 moral -0.062 0.201 0.758 0.14 rational -0.001 0.055 0.984 0.06 counterintuitiveDomain 1.00
(none-biology) 2.018 0.336 < 0.001 (none-mentality) -0.283 0.274 0.302
(none-physicality) 0.599 0.357 0.094 country (us-uk) -0.004 0.045 0.935 0.06 gender (female-male) -0.238 0.207 0.252 0.71 ethnicity 0.03
(white-poc) -0.003 0.048 0.951 (white-mixed) 0.006 0.072 0.929
townChildhoodSize < 0.01 (linear) 0.000 0.008 0.995
(quadratic) 0.000 0.009 0.984 (cubic) 0.000 0.008 0.999
townChildhoodLowP (false-true) 0.020 0.097 0.837 0.09 education 0.03
(linear) 0.003 0.038 0.935 (quadratic) 0.005 0.043 0.901
(cubic) -0.007 0.046 0.886 occupation < 0.01
(student-homemaker) 0.000 0.017 0.999 (student-production) 0.000 0.019 0.997
(student-trades) -0.001 0.031 0.981 (student-sales) 0.000 0.015 0.996
(student-service) 0.000 0.015 0.991 (student-professional) 0.000 0.014 0.998
income < 0.01 (linear) 0.001 0.028 0.985
(quadratic) 0.003 0.073 0.970 (cubic) 0.000 0.025 0.989
memory 0.580 0.085 < 0.001 1.00

96
Transmission biases explain little variance in recall. The set of best-fitting models (ΔAIC < 2) had
relatively high mean conditional R2GLMM values at 0.524 (SD < 0.001), but a lower marginal R2
GLMM at 0.106
(SD = 0.002). The difference between the two values represents the proportion of the variance explained by
the random effects of the model, which were the participant ID (i.e. individual differences) and proposition
number. Comparisons of the lowest-AIC model with ones excluding either random effect were both
significant (participantID X2 [1] = 6516.1; proposition X2 [1] = 9718.2; both p << 0.001), indicating that the
individual participant and proposition effects were both influential. These results tell us that there is a great
deal of variance in our responses that is not accounted for by the transmission biases and other fixed effects
included in the models, and that this variance includes both individual variation and the stories themselves.
4.3 Discussion
Prestige bias has a minor effect on transmission. We asked participants in two countries to orally recall
stories told by speakers with accents of different status, and we found significant effects for prestige, social,
survival, negative emotional, and biological counterintuitive biases (see Table 4.2, Figure 4.3). Prestige-
biased transmission has been prominent in the cultural evolution literature (Boyd and Richerson 1985;
Jiménez and Mesoudi 2019; Atkisson et al. 2012; Henrich and Gil-White 2001; Henrich and McElreath
2003; Richerson and Boyd 2005; Chudek et al. 2012; Cheng et al. 2013). However, prestige bias as proxied
by accent had the smallest effect on transmission, increasing the likelihood of a proposition’s recall by only
15%. One possible explanation for the secondary importance of prestige concerns the nature of the
narratives transmitted. Transmission biases can lead to the development of group markers and ingroup
cooperation (Boyd et al. 2011; Boyd and Richerson 2009; McElreath et al. 2003), and creation stories
themselves are representative of a shared group identity (Smith et al. 2017). If the audience does not
perceive some cultural relationship between themselves and the storyteller or narrative, prestige may be a
less pertinent cue for social learning. Indeed, prestige itself often exists as an ingroup hierarchy with less
relevance to outgroup individuals (Halevy et al. 2012; Henrich et al. 2015).

97
Assuming that shared identity could be a factor mediating the efficacy of prestige bias—in effect, a
similarity bias (McElreath et al. 2003)—we examined links between participant and storyteller
demographics. We would predict from this argument that participants should better recall a narrative read
by a speaker whose accent they could personally identify with. However, our results show no effect on recall
from matching participants’ childhood location with the region of the low-prestige speaker’s accent
(townChildhoodLowP; see Figure 4.3). Other potential effects of similarity bias were represented through
standardization of speaker demographics and inclusion of participants’ demographics in the models;
however, no significant associations were found between participants’ identities and those of the speakers.
Prestige is unconsciously employed as a secondary bias. Another potential explanation for the low
importance of prestige in determining recall is that participants may adjust their social learning strategies
depending on which biases are present in different parts of the narrative (McElreath et al. 2008; Morgan et
al. 2012; Rendell et al. 2011). We see clearly that when content biases were present participants largely
ignored prestige cues, but tended to recall unbiased propositions more frequently when the narrative was
told by a speaker with a high-prestige accent (Figure 4.2).
The finding that prestige takes a secondary role to content supports the conclusion of the only
other study we know to have compared prestige and content (Acerbi and Tehrani 2018). In that study, the
authors found that the effects of prestige were minimal compared to content effects (in the form of
“inspiration” or general likability rather than specific biases) when rating their preference for quotations
from famous or unknown authors. We suggest that, together, the results of the previous study and our own
demonstrate the importance of content biases in directing cultural transmission. These content cues can be
more nuanced than general context-based copying rules such as prestige, but our results show that content
biases can take a primary role over context. The next step is to understand how the relative importance of
content versus context biases may vary across different sociocultural contexts and the potential interactive
effects between different forms of biases (for example, one character feeding another encoding both social
and survival information).

98
Content biases have distinct effects. As previously noted, we found that the effects of content types on
information transmission varied widely (Figure 4.3). Although we might have expected a greater attention
to “gossip” over basic social interactions (Mesoudi, Whiten, and Dunbar 2006), the lack of a significant
difference between the two in our results (Figure 4.2) could be due to variation in how gossip was defined.
In this study, gossip was qualified by the presence of third parties in social interactions and not by the
“intensity” of interaction as has been done previously (Mesoudi, Whiten, and Dunbar 2006). Furthermore,
as entire narratives have been ascribed as gossip in previous work (Mesoudi, Whiten, and Dunbar 2006),
any recall was attributed to this bias, whereas we coded specific propositions with social interaction as basic
or gossip. The advantageous impact of social “gossip” on transmission also may have been tempered by the
cognitive load of processing multiple levels of theory of mind in these interactions (Dunbar 1998, 2004).
Our results also support multiple prior empirical studies that found strong positive effects on
transmission for survival information (Nairne et al. 2007; Nairne and Pandeirada 2010; Otgaar and Smeets
2010; Stubbersfield et al. 2015), and for negative emotional information but not positive emotional
information (Bebbington et al. 2017; Heath et al. 2001; Kensinger and Corkin 2003). Indeed, negative
emotional information was found to be one of the most powerful biases in our stories (Figure 4.2). As
negative information arouses strong emotional responses such as fear, disgust, and anger, it has been
theorized that humans evolved broad cognitive domains receptive to negative information as a survival
response to predators and toxic food sources (Al-Shawaf et al. 2016; Al-Shawaf and Lewis 2017; Barrett 2015;
Boyer and Barrett 2015; Tooby and Cosmides 2008), which may explain why both survival and negative
emotional information are particularly salient.
We did not find evidence to support a preference for moral, rational, or most counterintuitive
information. Moral and mental counterintuitive information (as well as positive emotional, above) were
actually recalled less often than unbiased information (Figure 4.2), though not enough to lead to negative
odds ratios when other variables were accounted for (Figure 4.3). However, there has been very little prior
work to test these biases in an experimental transmission paradigm. For instance, previous evidence of a
bias for “rational” or causal information in this context has been anecdotal (Bartlett 1920), though there has
been related work on causal reasoning and imitation (Berl and Hewlett 2015; Buchsbaum et al. 2011; Hoehl

99
et al. 2019; e.g. Horner and Whiten 2005). The transmission of rational information relies upon the
retention of a predicate, hence, rational bias may affect the recall of surrounding information but may not
be reliably recorded. Further, we defined successful transmission of rational information as requiring the
retention of the subordinating conjunction (“because,” “so that,” “when,” etc.; the proposition coded as
having rational content), which may explain the lack of an effect. Hence, rational bias may have had a
proximity effect on the recall of surrounding information, without being recalled itself, that was not
detected by our analyses.
For moral information, according to social norm theory individuals should be expected to retain
and transmit moral information depending, firstly, on the strength of the social norm and, secondly, on the
extent to which they identify with the social group to which it applies (Cialdini and Trost 1998; McDonald
and Crandall 2015). That participants did not recall moral information is less surprising if they recognized
that the creation stories did not describe their own society’s origins or rules of accepted behavior.
Narrative structural features may aid transmission. To the best of our knowledge, no existing theory
addresses why particular counterintuitive domains should be recalled more frequently than others;
however, our data demonstrates that biologically counterintuitive information was significantly more likely
to be transmitted. This is not necessarily due to biased content per se, but rather could be a consequence of
narrative construction. Many of the biological counterintuitive propositions in our stories were repetitive in
structure (for example, in “Muki,” spiders were transformed into other animals four times in sequence), and
recollection may be affected by what Jakobson (1960) called the “poetic function” of language (Waugh
1980), or the artistic quality of the message itself. In our study design, we credit a causal role to linguistic
factors in social learning through our use of accent-based prestige; however, narrative theory itself remains
a rich and largely untapped resource in cultural evolutionary accounts of information transmission (Rivkin
and Ryan 2004).
For stories to be impactful, the content must engage the audience (Busselle and Bilandzic 2009;
Duranti 1986; Graesser et al. 2002) and compete for space in working memory (Graesser et al. 2003;
Kormos and Trebits 2011; Montgomery et al. 2009; Ward et al. 2016). To this end, stories (and their tellers)

100
employ a suite of features to enhance their salience, including elements that evoke emotional arousal
(Andringa 1996; Hänninen 2007; Komeda et al. 2009; Benelli et al. 2012) and the use of familiar narrative
devices such as rich encoding and repetition (Genter 1976; Thorndyke 1977). As such, there are multiple
factors influencing the success of story transmission and the data demonstrate that transmission biases
alone do not capture this variation.
Implications for the understanding of transmission. The overall fit of our model is high (R2GLMMc =
0.524), but fixed effects only explain a small portion of this (R2GLMMm = 0.106). One possible explanation for
this result is that some as-yet unidentified biases exist in the characteristics of the models or in the content
of the stories, and this drives the variation in proposition transmission. However, our methodological
approach included every type of content bias supported in the literature, and we could not test the
remaining well-documented context biases, such as conformity bias (Efferson et al. 2008) and success bias
(Baldini 2012), because they do not apply to the one-to-one transmission context of this experiment. In the
future, if additional content biases are identified in the literature, it would be possible for researchers to re-
code our data to test them.
Instead, the substantial explanatory power of the random effects in our models may represent the
noise of individual variation. The trade-off for gaining real-world experimental validity is typically a greater
amount of noise due to uncontrolled circumstances. Our methodological approach did not allow us to
control the testing environments, including levels of distraction, participant’s levels of attention, or
participant’s personal short and long-term histories. In this way the experiment mimics real-world cultural
transmission, which tends to be filled with random noise that can lead to low fidelity in one-off
transmission events (Efferson et al. 2007; Strimling et al. 2009). Much debate exists regarding the degree of
transmission fidelity required for cumulative culture. Some argue that high-fidelity transmission is required
(Tomasello et al. 1993; Tennie et al. 2009; Lewis and Laland 2012; Dean et al. 2014; Caldwell et al. 2018),
while others counter that low-fidelity transmission is sufficient (Sperber 1996; Sasaki and Biro 2017; Zwirner
and Thornton 2015; McElreath et al. 2018; Miton and Charbonneau 2018; Truskanov and Prat 2018; Miu et
al. 2018) and that weak biases can be amplified over repeated rounds of transmission to create strong

101
universal patterns (Strimling et al. 2009; Kirby et al. 2007; Thompson et al. 2016). We found that
participants’ responses to identical stimuli varied significantly and transmission fidelity was often low.
Participants knew they would need to retain and recite the information, but on average they recalled only
14% of the propositions presented (SD = 10%). In the context of a single-shot experimental transmission
event, however, participants have no real incentive to retain information. Furthermore, there is evidence to
suggest that repeated exposure to a story increases comprehension (Dennis and Walter 1995), and
narratives that particularly define a group such as creation stories are often told multiple times (Norrick
2007) or are collaborative, with opportunities for audience engagement that allowing audience members to
transform and take ownership of the narrative (Lawrence and Thomas 1999; Norrick 1997). Future work,
both theoretical and empirical, should consider how models of transmission processes can accurately
incorporate individual variation in cultural transmission and responses to content.
Our novel methodological and analytical framework provides a template for future tests of the
simultaneous effects of context and content biases. We have performed the first experimental study that
tests the relative effects of multiple types of cultural transmission biases presented within a realistic
package of narrative information, while also incorporating linguistic factors that have, until now, gone
unexplored in the cultural evolution literature. Although we found that prestige was the least important
transmission bias, it was still a significant factor in participants’ choices of what information to retain and
recall, especially for information lacking any internal biases. Our results suggest that the prominent role of
prestige-biased transmission models in cultural evolution studies should be scrutinized more heavily and
qualified by the presence or absence of other biases, which may have stronger effects under certain
conditions. The experimental framework presented here sets the stage for future research to test
longstanding questions in cultural evolution, such as: which biases are necessary or sufficient for the
development of cumulative culture (Tomasello et al. 1993), which conditions cause learners to favor one
type of bias over another (Rendell et al. 2011), whether and how the effects of different biases differ cross-
culturally (Efferson et al. 2007; Mesoudi et al. 2015; Eriksson et al. 2016; Leeuwen et al. 2018), how micro-
level transmission processes lead to macro-level cultural change (Mesoudi, Whiten, and Dunbar 2006;
Schwartz and Mead 1961), and how we can identify the bias or biases responsible for a post hoc distribution

102
of traits (Kandler and Powell 2015). The results of this study go beyond academic discourse in cultural
evolution to impact other disciplines that rely on the theory and application of communication as a means
of disseminating information and motivating behavioral change, including education, marketing,
conservation, public health, and political science. Storytelling persists as a powerful and enduring tool,
dense in cultural information, and utilized across the world to share knowledge and shape the diversity of
human culture.
4.4 Methods
Story Production. We selected creation stories, which often pertain to the origins of life, death, ecology,
and human society, as the narrative form to be used for this study because they are rich in the types of
content proposed to be relevant to cultural transmission. Further, creation stories are a familiar pattern
cross-culturally for the transmission of knowledge, values, and meaning, and have each individually been
subject to many generations of transmission and transformation.
We undertook a survey of creation stories using ethnographic data from the electronic Human
Relations Area Files (eHRAF) World Cultures database (see Acknowledgements). We conducted the survey
by searching for “creation” (and its derivatives) or “origin” within texts indexed under the “mythology”
subject code (#773). We performed the search in the Probability Sample Files (PSF) subset, which is a
stratified random sample of 60 cultures, each representative of a different “culture area.” Our search
returned 100 story extracts from 35 cultures, and from this we selected 4 texts for analysis on the basis of
appropriate length (~300-800 words) and being written and shared by in-group authors (rather than
foreign ethnographers). The stories selected belonged to the A·chik Mande (referred to in eHRAF as
“Garo”), Baganda (“Ganda”), Kainai (“Blackfoot”), and Kānaka Maoli (“Hawaiian”) peoples. We also included
the Genesis creation story (from the ancient Israelites), as presented in the New Revised Standard Version
Bible (Coogan et al. 2010, Gen. 1.1-2.3). We coded the resulting 5 ethnographic creation stories at the level
of propositions (word clusters consisting of “a predicate plus a series of ordered arguments”; Mesoudi,
Whiten, and Dunbar 2006, p. 411) for the presence of social, survival, emotional, moral, rational, and

103
counterintuitive content biases. Definitions of these biases as used for coding are listed in Appendix 3
(Table A3.4). We carried out propositional analysis under the protocol established by Turner and Greene
(Turner and Greene 1977).
For the experiments, we commissioned two written artificial creation stories (see
Acknowledgements). We did this rather than using the ethnographic stories we sampled in order to avoid
issues of cultural appropriation surrounding the use of stories from real societies and to ensure that our
participants would all be equally unfamiliar with the stories. The first story, “Muki,” explains how a rugged
landscape and its varieties of life-forms were shaped by the actions of a child abandoned by its parents. The
second story, “Taka & Toro,” describes two jealous seafaring siblings and their competition over the
friendship of the people they created. Over many iterations, we edited the texts of these artificial creation
stories to ensure the proportions of each type of biased proposition in each story matched one another, and
also fell within 90% confidence intervals of the proportions seen in the coded ethnographic creation stories
(Appendix 3, Table A3.5). We tuned both stories to be approximately 850 words (Muki 887, Taka & Toro
835) and 270 propositions (Muki 265, Taka & Toro 273) to avoid ceiling effects for recall and to be of
roughly equal complexity. Readability scores for these artificial stories were roughly equivalent and used
simpler language than the ethnographic stories they were modeled after (Flesch-Kincaid grade level: Muki
4.91, Taka & Toro 5.03, Ethnographic Mean 8.22 [90% CI: 6.42, 10.02]; Flesch reading ease: Muki 84.5,
Taka & Toro 81.9, Ethnographic Mean 71.24 [90% CI: 62.24, 80.24]).
Recordings. We used language accent to index prestige, in line with findings from sociolinguistics (Giles
1970; Fuertes et al. 2012; Garrett 2007; Labov 1964, 1972). Language attitude studies have demonstrated
that non-localized “standard” accents are associated with high prestige (Giles 1973; Milroy 2007; Milroy and
Milroy 1999; Stewart et al. 1985) based on ideological values (Coupland 2003; Coupland and Bishop 2007),
although regional non-standard accents demonstrate differential prestige (Giles 1970; Bishop et al. 2005;
Coupland and Bishop 2007; Giles 1971). We recorded self-identified middle-aged white male speakers with
high- and low-prestige accents calibrated for the participants’ locations telling the two stories (“Muki” and
“Taka & Toro”). The high- and low-prestige accents were selected based on the results of a previous study

104
(Samarasinghe et al. [in prep.]). For both the UK and USA participants, the high-prestige accent used was
Received Pronunciation (“RP”). For the UK sample, the low-prestige accent was West Country, from South
West England; and for the US sample, the low-prestige accent was Inland South, spanning the southern
Appalachian, Ozark, and Ouachita mountain ranges. We standardized the recordings for volume and
length (5 min, 19 s).
For an independent assessment of accent prestige, we also recorded our speakers reading the first
paragraph of the Comma Gets a Cure passage (see Acknowledgements). This passage contains words from
Wells’s lexical set, designed to highlight phonological variation between different accents of English (Wells
1982). We presented these recordings (range 35 s to 39 s) to participants to confirm that their perceptions
of the prestige of each speaker matched what was expected (see Experimental Protocol).
Participants. We recruited UK participants on the Prolific Academic platform (n = 96), and US
participants on Amazon Mechanical Turk (n = 100) using TurkPrime (Litman et al. 2017). Participants were
eligible to take part in this study if they: had not taken part in any previous studies by the researchers; had
taken part in and had successfully completed over 95% of at least 100 studies on Prolific Academic or over
98% of at least 5,000 tasks on Amazon Mechanical Turk; and were native English speakers.
We excluded data from 23 participants due to technical recording errors or external interference
(e.g. a second person contributing to a story). We compensated participants for their time at rates above
local minimum wages based upon the time taken to complete the tasks.
Experimental Protocol. The experiment was administered through a custom web browser application
using the SurveyJS library (source code available in the state it was used for the experiment at:
https://github.com/seannyD/StoryTransmission/tree/a8a1a995dd0ce000222435bf70741ec2df237b29).
Participants were directed from their respective recruitment platforms to the web application on University
of Bristol servers. Participants first selected their location, which determined which of the locally-calibrated
accent recordings they would hear. Participants were instructed to listen once to a recording of the first

105
artificial creation story and were told that they would be asked to recall the story in as much detail as
possible.
After listening to a creation story, participants took part in a working memory distraction task
based on the Visual Spatial Learning Test (Malec et al. 1991). This task involved playing three rounds of a
game where participants had to recall symbols and their positions on a grid. For the symbols, we used the 9
most dissimilar characters from the “BACS-1” artificial character set (Vidal et al. 2017). This distraction task
took approximately 5 minutes to complete and provided a measure of unbiased working memory, which we
calculated as the number of cards placed on the grid that matched the positions displayed (regardless of the
symbol), plus the number of cards placed on the grid that matched both the positions and symbols
displayed, averaged across all trials (equivalent to the Position Learning Index, or “PLI” score, of Malec et al.
1991).
Once this task had been completed, participants recorded their oral recollection of the creation
story. They were given the opportunity to pause and continue recording, but were not allowed to return or
re-record after advancing to the next task. This process, including the working memory distraction task,
was then repeated for the second story and with the accent of opposite prestige. Story order and accent
were both randomized for presentation in the experiment. Each participant heard “Muki” in one accent
condition and “Taka & Toro” in the alternate accent condition.
After recording their recollections of both stories, participants listened to recordings of the Comma
Gets a Cure passage read by the speakers providing the stories. To test that the accents were indexing
prestige and these cues were differentiated across accents, participants rated the speakers using the items
for the PRI scale of individual prestige (Berl et al. [in prep.]) as well as additional solidarity and dynamism
domains (Fuertes et al. 2012). Finally, participants completed a demographic questionnaire including
participants’ residence history and self-reported accents of English. Data pertaining to gender and ethnicity
were collected in line with local and ethical guidelines.
Data Coding and Transcription. We transcribed the audio files containing participants’ story recordings,
and coded each for the presence or absence of each proposition from the original texts. Because

106
participants were instructed that they did not need to recall the stories verbatim, we counted the presence
of a proposition if a participant used different word choices or constructions if the meaning remained
constant, e.g. we accepted synonyms and we did not penalize the order of recall. If an error in the retellings
was carried forward in the story, we only marked it absent in the first instance. We only counted biased
propositions as present if the retelling retained the biased element (e.g. social interaction, counterintuitive
properties, etc.).
To assess intercoder reliability, a second researcher re-coded a subset of 33 recordings
(representing approximately 10% of the sample). We found substantial agreement between the coders
(Cohen’s κ = 0.737, p < 0.01), and coders discussed any disagreements until reaching consensus.
Data Analysis. We used a set of generalized linear mixed models (GLMMs) to model the presence or
absence of a particular proposition. Here, we tested the effects of eight different transmission biases by
fitting a set of 58 candidate models that account for the potential effects of these biases in isolation and in
combination with one another (Appendix 3, Table A3.3). For these models, the fixed effects we examined
can be broken down into three categories of: 1) story-based effects (story, presentation order, and line
number and quadratic line number representing primacy or recency effects); 2) transmission biases
(prestige, social, survival, positive emotional, negative emotional, moral, rational, and counterintuitive
domain); and 3) demographic effects (country, gender, ethnicity, accent matching low-prestige speaker,
childhood town size, childhood town matching region of low-prestige speaker, education, occupation,
income, and working memory score). Age was excluded from the demographic variables because of a lack of
any predictive theory for its effects on recall beyond those of working memory. We also included random
effects for participant and proposition number in all models to capture the remaining variance from these
sources.
After model fitting, model comparisons were made on the basis of each model’s Akaike Information
Criterion (AIC) score. Due to the lack of a single dominant model with a weight greater than 0.95, we
averaged the parameters of all models according to their Akaike weights (Burnham and Anderson 2002). As
our main interest was in determining which factors had the strongest effects (Nakagawa and Freckleton
107
2011), we determined full model-averaged parameter estimates using the “zero method” (Burnham and
Anderson 2002; Grueber et al. 2011). This substitutes a value of zero for parameter estimates and errors in
models where the parameter does not appear and computes a weighted average for each parameter using
the models’ Akaike weights.
We re-fit the full set of models using a continuous measure of the participants’ perceptions of the
speaker’s prestige—as factor scores from the PRI scale of individual prestige (Berl et al. [in prep.])—rather
than the binary high-low prestige variable, for the subset of participants that provided this information
(roughly two thirds of the full data set). Results were qualitatively similar; however, direct comparisons
cannot be made due to these analyses being performed on a nonrandom subset of the data.
We used the R statistical environment, version 3.5.1 (2018-07-02), for all analyses (R Core Team
2018).

108
5. CONCLUSION
5.1 Emergent Themes
Several common threads run through the three distinct studies described here. First, we find that
prestige is a complex and ubiquitous cultural concept that affects and is affected by all levels of social
structure. Additionally, in the Western contexts we sampled, we found that people of varying demographic
groups had a consistent idea of the components that constitute prestige. Prestige-based status is a central
aspect of human social life, and one that has taken a prominent role across the social sciences and in many
other disciplines, including the interdisciplinary field of cultural evolution. However, we should be cautious
about ascribing too much importance to prestige as a factor in the cultural transmission process. Our
experimental results show that, at least in this context, its effects were minimal and were contingent upon
whether sources of biased content were present. This finding is surprising in that it contradicts decades of
theory in cultural evolution that have promoted prestige-biased transmission as one of the predominant
forces that has shaped human evolution (Henrich and Gil-White 2001; Henrich and Boyd 2002; Henrich et
al. 2015). However, these previous decades of theory were relatively light on the empirical verification of
mathematical models of cultural transmission, and very rarely considered the influence of multiple biases
simultaneously, as we did in our experimental design. These findings should motivate additional work in
this area to investigate the details of when prestige bias is favored over other, potentially more powerful
biases such as the particularly salient content biases we examined.
Within the field of cultural evolution, the research outlined in this dissertation should also spur a
re-examination of the Henrich and Gil-White (2001) model of prestige versus dominance and the feasibility
of its evolutionary explanation, which relied on prestige being an important enough factor in transmission
that learners would take on negative fitness consequences simply to have access to a particular cultural
model. We did not design our studies with the intent to directly evaluate the Henrich and Gil-White (2001)
model, but our findings often contradicted its predictions. For instance, as mentioned above, the results of
our transmission experiment showed that prestige was not a powerful effect in motivating the recall of
realistic narratives in comparison to some content effects. Further, the comparison of our prestige scale

109
with that of Cheng et al. (2010), which was built to measure the prestige-dominance dichotomy, showed
that the Cheng et al. (2010) scale did not have a great deal of validity and did not differentiate well between
prestige and dominance. Instead, dominance exhibited a good deal of covariation with prestige both in the
Cheng et al. (2010) scale and in our own (correlations of ρ = 0.449 and ρ = 0.533, respectively),
contradicting the account that prestige and dominance are fully distinct routes to status (Cheng et al. 2013).
Lastly, in our literature review, terms from the Henrich and Gil-White (2001) model such as deference,
attention, and social learning appeared often in the Western academic literature as purported consequences
of prestige, but were hardly ever mentioned in the ethnographic accounts of other societies. Similarly,
skilled and knowledgeable were not the most important determinants of prestige in non-Western societies.
This could indicate that the importance of terms related to social learning as a causal factor in prestige is
overstated by academics due to the popularity of the Henrich and Gil-White (2001) model and that benefits
related to deference are less relevant in real societies. Alternatively, the frequencies of these terms could be
an artifact of sampling and the interests of researchers and ethnographers. Further work is needed to clarify
these potential issues with the Henrich and Gil-White (2001) model, and to explore alternative models that
may better fit the present observations.
A second, related theme that was raised in all three studies described here is the undue reliance
upon Western samples in research on cultural transmission biases. Researchers should be cautious about
drawing general conclusions from studies restricted to Western participants, including our own work. In
cultural evolution, many classic theoretical predictions have only been validated against empirical data in
limited laboratory-based studies (Mesoudi and Whiten 2008), and nearly all empirical work on
transmission biases has taken place in Western, educated, industrialized, rich, and democratic (“WEIRD”:
Henrich et al. 2010) societies (but see: Reyes-García et al. 2008, 2009; Henrich and Henrich 2010; Henrich
and Broesch 2011). The poor representation of cross-cultural research potentially limits the conclusions that
can be drawn about the general processes that shape human cultural evolution, and about the
generalizability of findings about transmission dynamics in an artificial setting with WEIRD participants.
Importantly, recent evidence suggests that, in addition to receiving the intended information over the
course of cultural transmission, we also learn about the cultural transmission process, and recent research

110
shows notable cross-cultural differences in learning preferences (Heyes 2012b; Berl and Hewlett 2015;
Mesoudi et al. 2015; Eriksson et al. 2016; Mesoudi, Magid, et al. 2016; Mesoudi, Chang, et al. 2016; Legare
and Harris 2016). In other words, we learn how to learn, and the process of cultural transmission is shaped
in turn by its cultural context, such that the cultural transmission process is not invariant across
individuals. Adding a cross-cultural component to any study adds an additional layer of complexity, but
confronting the complexity of cultural variation is necessary for the development of accurate conclusions
regarding both the basic mechanisms of cultural transmission and the broader trends seen in the biological
and cultural evolution of our species as a whole.
5.2 Limitations and Future Directions
Each of our studies had important limitations that we must consider, and each of these limitations
presents an opportunity to expand upon the novel methods and outputs we have produced, or to attempt to
replicate our findings and test their validity and reliability in other contexts. Many of these limitations were
discussed within the content of each chapter, but I expand upon them here.
The literature review and ethnographic review described in Chapter 2 were both conducted on
samples that were limited as a matter of necessity. In an effort to sample broadly across disciplines in the
academic literature on prestige, we made the choice to deliberately undersample the social sciences and
oversample other subject areas such as business, medicine, and computer science. Though these other
fields did provide very different ideas on prestige than the realm of social science literature more
traditionally associated with prestige (for example, algorithms for ranking the prestige of pages in a web
search, and the prestige of specific diseases and the medical specialties that work on them), there could be
potential deficiencies in the sample because of the social science literature that was not fully reviewed. In
our analyses, we saw that the terms we sampled for prestige determinants and consequences approached
saturation, and we did not see any indication that there were major ideas or bodies of theory in the social
sciences that we overlooked, but we must still acknowledge that limited sampling introduces this as a
possibility.

111
In a similar vein, we limited our ethnographic sample to 15 of the original 32 that matched our
criteria. The coverage of the eHRAF World Cultures database is variable, even within some of its more
highly-studied subsets such as the Standard Cross-Cultural Sample (Gray 1996), and we additionally found
that individual sources and authors varied in their use of the term “prestige” and their theoretical interest in
the concept of prestige. As a result, 2 of the eligible societies had no matches with variations of “prestige” at
all, and we chose to eliminate 15 others due to low numbers of matching paragraphs from comparably few
sources. The 15 societies we did sample were, in our opinion, sufficient to illustrate the point that ideas on
prestige vary cross-culturally; however, greater sampling would have allowed us to make more detailed
comparisons between cultures. For instance, only 3 language families were represented by more than 1
society, and greater sampling would have allowed us to look more closely at within-family versus between-
family distinctions in prestige. An ideal opportunity for extending this study would be to sample more
broadly within well-represented language families, such as Niger-Congo and Austronesian, to gather data
that would be suitable for phylogenetic analyses of prestige across cultures. A phylogenetic comparative
analysis of the presence of specific prestige determinants and consequences across a linguistic tree would
provide insight into the evolution of prestige over time and, in combination with the microevolutionary
results from prestige-biased transmission studies, would build a bridge between the micro- and
macroevolutionary scales of cultural evolution.
The primary limitation of the study described in Chapter 3, which constructed a scale of individual
prestige, is that it was conducted entirely with WEIRD participants in the United States and United
Kingdom. We noted this in the study itself and echoed the warning above about generalizing results across
cultural contexts from which we had no data. To extend the PRI scale to additional samples, we emphasized
that it would be necessary to test the validity and reliability of the scale, at a minimum, or to build a
localized version of the scale using the tools and methods we described. With these concerns in mind, we
provided the full details of how the scale was constructed and all of the materials used to construct it. An
important future direction of all three studies described here is to extend the methods we developed to
other cultures and social contexts, and we have worked to provide the tools necessary to do so as part of the
conduct and reporting of each study.

112
We built the framework for the final study, the transmission experiment (described in Chapter 4),
over the course of conducting our other studies: first, we built the prestige scale (Chapter 3) to validate the
use of regional accents of English as proxies for prestige in the context of oral narration; next, we conducted
a separate study (Samarasinghe et al. [in prep.]) to identify the accents that participants perceived as having
the highest and lowest prestige in local contexts; lastly, the experiments were conducted while reviewing
the literature and ethnographies on prestige (Chapter 2) and we used the initial findings of these reviews to
inform our experimental design. Nevertheless, even with these preliminary steps established, our results
have limitations. Firstly, the order of the studies themselves could have influenced the outcome, in that we
constructed the scale prior to the completion of the literature and ethnographic reviews. We therefore were
not able to take into consideration the prestige concepts examined in the reviews or the integrative
framework we developed. The development of the scale was driven largely by participant responses and we
make the point that it would need to be re-examined in different cultural contexts, so this is not a major
concern, but it presents the opportunity for future work to measure the concept of prestige in the
multilevel, integrative sense rather than only using a list of uncategorized terms generated through free
listing.
One important challenge for the experimental study is our inability to distinguish other possible
reasons for the lack of strong support for prestige as a factor in the results. For instance, one possible
explanation could be that there are untested interaction effects between prestige conditions and the
presence of certain content biases (such as social, survival, or moral information). We are unable to test this
possibility because we did not design our experiment with this in mind: the artificial creation stories we
used had proportions of biased content that were roughly equivalent to each other (designed to match the
distributions of frequencies in stories from real cultures), but the proportions of different biases were not
equal to one another. This prevents us from having a fully crossed experimental design with the high-or
low-prestige condition variable. A future extension of this study could be designed to test the possibility of
interactions between content and context biases.
In a broader sense, there could be conditions under which prestige matters comparatively more or
less depending on the domain of knowledge being discussed, or due to narrative structural effects. It could

113
be that features of creation stories tend to be salient, with less importance placed on the identity of the
speaker; whereas, if one were seeking information on an academic topic (the history of the Second Punic
War, for instance), someone speaking with Received Pronunciation may be assumed to have more scholarly
authority. There could also be circumstances where there is actually a preference for traditionally lower-
prestige individuals: for instance, if someone were seeking local knowledge (e.g. directions to a landmark)
in a rural area, they may prefer information from someone with a local accent; or, if someone needed help
with a trade skill (e.g. auto repair), they may trust the information more if it comes from someone with an
accent associated with a blue-collar working class.
Our sample pool for the transmission experiment, as with the prestige scale, was drawn entirely
from WEIRD cultures in the United States and United Kingdom. For the ability to make broader
generalizations about the relative roles of prestige and content in cultural transmission, future work is
needed to replicate this experimental study in a variety of other cultures. We have established the
framework for doing so with our study, and the results of the ethnographic study suggest non-Western
cultures that would be good candidates for investigating the power of prestige to influence cultural
transmission in cultures with prestige concepts that differ significantly from Western perceptions.
There are a number of theoretical concerns that our studies do not address directly, but that may
affect the interpretation of our results under different models of social collectivities, institutions, and
cultures (D’Andrade 2006; de Munck and Bennardo 2019). Across our studies, we attempted to elicit a
singular concept of prestige within a society, one that has been collectively agreed upon and enshrined in
social institutions, and that is held and enforced by individuals. However, presuming that only one such
prestige concept exists within a society is a theoretical simplification of a more complex reality (as all
models are). Though there may be one (or more) collectively-held attitudes prestige concepts, there may
also be individual attitudes that conflict with these collective views, or concepts that coexist with or replace
the consensus in different spaces. Similar to the linguistic concepts of covert and overt prestige, private and
public concepts of prestige that are based upon distinct hierarchies with differing determinants and
consequences can both exist, and individuals may belong to many of these systems simultaneously. Thus, in

114
future studies, there are opportunities to examine in finer detail the prestige systems of different types of
collectivities within a society.
With the limitations of these three studies in mind, the practical utility of our results extends
beyond theoretical arguments in cultural evolution and the social sciences. All instances of human
communication are inherently transmission processes, and many elements of society are concerned with
the efficacy and retention of transmitted information. There has already been a recognition of the role of
transmission in diverse fields, from education (Lubeck 1984; Nash 1990) to marketing (Colarelli and
Dettmann 2003; Colbert and Courchesne 2012) to graphic design (Frascara 1988; Fuad-Luke 2013).
Knowledge of cultural transmission, and of the biases that affect transmission in various ways depending on
context and content, are crucial in crafting messages that are heard, retained, and recalled, and that have
the desired downstream effects on values, attitudes, and behaviors. Organizations already carefully select
the content of their messaging and utilize prestigious individuals in an attempt to enhance their reach and
influence (Kaikati 1987; Stone et al. 2003; Fleck et al. 2012). Our studies lay the foundation for bridges to be
built to these different fields, in that our results could help to explain and evaluate the outcomes of
communication efforts and to craft more successful campaigns in the future.
A primary goal of human dimensions and conservation social science research is to understand the
factors that influence human behavior and to shape the processes that motivate behavior for shared social
and environmental benefit. Cultural transmission is directly responsible for the success or failure of this
process. Applied conservation and management efforts such as environmental communication and
education, outreach, and awareness campaigns all draw upon knowledge about human values, attitudes,
behavior, and learning, and—similar to other organizations—sometimes leverage the influence of
prominent individuals to make those attempts more successful (Brockington 2008; Duthie et al. 2017).
Environmental behavior itself can serve as a signal of prestige (Griskevicius et al. 2010), and could therefore
potentially have a multiplying effect on motivating further behavior change. Knowledge of prestige and
cultural transmission could likewise aid efforts to preserve traditional or Indigenous ecological knowledge,
beliefs and practices, as the pathways by which these are learned are inherently cultural, and should thus be
subject to the same transmission mechanisms as any other type of culturally transmitted information

115
(though these could vary cross-culturally, as we have noted). An improved understanding of cultural
transmission and the effects of prestige, in addition to being valuable for the sake of basic scientific
research, can assist in the design of effective, inclusive, and lasting solutions to the world’s most pressing
social and environmental problems.

116
REFERENCES
Acerbi, A., & Mesoudi, A. (2015). If we are all cultural Darwinians what’s the fuss about? Clarifying recent
disagreements in the field of cultural evolution. Biology & Philosophy, 30(4), 481–503.
doi:10.1007/s10539-015-9490-2
Acerbi, A., & Tehrani, J. (2018). Did Einstein really say that? Testing content versus context in the cultural
selection of quotations. Journal of Cognition and Culture.
Ajzen, I. (1985). From intentions to actions: A theory of planned behavior. In J. Kuhl & J. Beckmann (Eds.),
Action control: From cognition to behavior (pp. 11–39). New York: Springer-Verlag.
Alexander Jr, C. N. (1972). Status perceptions. American Sociological Review, 767–773.
Al-Shawaf, L., Conroy-Beam, D., Asao, K., & Buss, D. M. (2016). Human Emotions: An Evolutionary
Psychological Perspective. Emotion Review, 8(2), 173–186. doi:10.1177/1754073914565518
Al-Shawaf, L., & Lewis, D. M. G. (2017). Evolutionary psychology and the emotions. In V. Zeigler-Hill & T. K.
Shackelford (Eds.), Encyclopedia of personality and individual differences (pp. 1–10). Cham: Springer
International Publishing. doi:10.1007/978-3-319-28099-8_516-1
Anderson, C., Hildreth, J. A. D., & Howland, L. (2015). Is the desire for status a fundamental human motive?
A review of the empirical literature. Psychological Bulletin, 141(3), 574.
Andringa, E. (1996). Effects of ‘narrative distance’ on readers’ emotional involvement and response. Poetics,
23(6), 431–452. doi:10.1016/0304-422X(95)00009-9
Arnett, J. J. (2008). The neglected 95%: Why American psychology needs to become less American.
American Psychologist, 63(7), 602–614. doi:10.1037/0003-066X.63.7.602
Asch, S. E. (1948). The doctrine of suggestion, prestige and imitation in social psychology. Psychological
Review, 55(5), 250–276. doi:10.1037/h0057270
Ashforth, B. E., Harrison, S. H., & Corley, K. G. (2008). Identification in organizations: An examination of
four fundamental questions. Journal of Management, 34(3), 325–374.
Atkisson, C., Mesoudi, A., & O’Brien, M. J. (2012). Adult learners in a novel environment use prestige-biased
social learning. Evolutionary Psychology, 10(3), 519–537.

117
Atran, S. (2001). The trouble with memes. Human Nature, 12(4), 351–381. doi:10.1007/s12110-001-1003-0
Baek, T. H., Kim, J., & Yu, J. H. (2010). The differential roles of brand credibility and brand prestige in
consumer brand choice. Psychology & Marketing, 27(7), 662–678.
Bahrami-Rad, D., Becker, A., & Henrich, J. ([in prep.]). Tabulated Nonsense? Testing the Validity of the
Ethnographic Atlas and the Persistence of Culture.
Bajema, C. J. (1968). A note on the interrelations among intellectual ability, educational attainment, and
occupational achievement: A follow-up study of a male Kalamazoo public school population.
Sociology of Education, 41(3), 317–319. doi:10.2307/2111879
Baldini, R. (2012). Success-biased social learning: Cultural and evolutionary dynamics. Theoretical
Population Biology, 82(3), 222–228. doi:10.1016/j.tpb.2012.06.005
Barkow, J. H. (1975). Prestige and culture: A biosocial interpretation. Current Anthropology, 16(4), 553–572.
doi:10.1086/201619
Barkow, P. J. H. (2014). Prestige and the ongoing process of culture revision. In J. T. Cheng, J. L. Tracy, & C.
Anderson (Eds.), The psychology of social status (pp. 29–45). New York: Springer.
Barrett, H. C. (2015). Adaptations to predators and prey. In D. M. Buss (Ed.) The handbook of evolutionary
psychology (pp. 1–18). Hoboken, NJ, USA: John Wiley & Sons, Inc.
doi:10.1002/9781119125563.evpsych109
Barrett, H. C., & Broesch, J. (2012). Prepared social learning about dangerous animals in children. Evolution
and Human Behavior, 33(5), 499–508.
Barrett, J. L. (2008). Coding and quantifying counterintuitiveness in religious concepts: Theoretical and
methodological reflections. Method & Theory in the Study of Religion, 20(4), 308–338.
Barrett, J. L., & Nyhof, M. A. (2001). Spreading non-natural concepts: The role of intuitive conceptual
structures in memory and transmission of cultural materials. Journal of Cognition and Culture, 1(1),
69–100.
Bartlett, F. C. (1920). Some experiments on the reproduction of folk-stories. Folklore, 31(1), 30–47.
Bartlett, M. S. (1937). Properties of sufficiency and statistical tests. Proceedings of the Royal Society A,
160(901), 268–282. doi:10.1098/rspa.1937.0109

118
Baumard, N., & Boyer, P. (2013). Explaining moral religions. Trends in Cognitive Sciences, 17(6), 272–280.
Beall, J. (2016). Scholarly open access: Critical analysis of scholarly open-access publishing.
http://web.archive.org/web/20161230053202/https://scholarlyoa.com/ (Archived)
Bebbington, K., MacLeod, C., Ellison, T. M., & Fay, N. (2017). The sky is falling: Evidence of a negativity bias
in the social transmission of information. Evolution and Human Behavior, 38(1), 92–101.
doi:10.1016/j.evolhumbehav.2016.07.004
Bell, A. V. (2013). Evolutionary thinking in microeconomic models: Prestige bias and market bubbles. PLOS
ONE, 8(3), e59805.
Benelli, E., Mergenthaler, E., Walter, S., Messina, I., Sambin, M., Buchheim, A., et al. (2012). Emotional and
cognitive processing of narratives and individual appraisal styles: Recruitment of cognitive control
networks vs. modulation of deactivations. Frontiers in Human Neuroscience, 6.
doi:10.3389/fnhum.2012.00239
Benjamini, Y., & Hochberg, Y. (1995). Controlling the false discovery rate: A practical and powerful
approach to multiple testing. Journal of the Royal Statistical Society Series B, 289–300.
Bennett, N. J., Roth, R., Klain, S. C., Chan, K., Christie, P., Clark, D. A., et al. (2017). Conservation social
science: Understanding and integrating human dimensions to improve conservation. Biological
Conservation, 205, 93–108. doi:10.1016/j.biocon.2016.10.006
Bentley, R. A., Bickle, P., Fibiger, L., Nowell, G. M., Dale, C. W., Hedges, R. E. M., et al. (2012). Community
differentiation and kinship among Europe’s first farmers. Proceedings of the National Academy of
Sciences, 109(24), 9326–9330. doi:10.1073/pnas.1113710109
Berkes, F. (2012). Sacred ecology (3rd ed.). London: Taylor & Francis.
Berl, R. E. W. ([this document]). Prestige and content biases in the experimental transmission of narratives.
Berl, R. E. W., & Gavin, M. C. ([in prep.]). A unified framework of prestige: Bridging concepts from theory,
experiment, and cross-cultural research.
Berl, R. E. W., & Hewlett, B. S. (2015). Cultural variation in the use of overimitation by the Aka and Ngandu
of the Congo Basin. PLOS ONE. doi:10.1371/journal.pone.0120180

119
Berl, R. E. W., Samarasinghe, A. N., Jordan, F. M., & Gavin, M. C. ([in prep.]). The Position-Reputation-
Information (PRI) scale of individual prestige.
Bernard, H. R. (2011). Research methods in anthropology: Qualitative and quantitative approaches (5th ed.).
Rowman Altamira.
Biddle, B. J., & Thomas, E. J. (Eds.). (1966). Role theory: Concepts and research. New York: John Wiley &
Sons.
Bishop, H., Coupland, N., & Garrett, P. (2005). Conceptual accent evaluation: Thirty years of accent
prejudice in the UK. Acta Linguistica Hafniensia, 37(1), 131–154.
doi:10.1080/03740463.2005.10416087
Bisin, A., & Verdier, T. (2000). “Beyond the melting pot”: Cultural transmission, marriage, and the
evolution of ethnic and religious traits. The Quarterly Journal of Economics, 115(3), 955–988.
doi:10.1162/003355300554953
Blaikie, N. W. (1977). The meaning and measurement of occupational prestige. Australian & New Zealand
Journal of Sociology, 13(2). doi:10.1177/144078337701300202
Bliege Bird, R., & Smith, E. A. (2005). Signaling theory, strategic interaction, and symbolic capital. Current
Anthropology, 46(2), 221–248.
Boesch, C., & Tomasello, M. (1998). Chimpanzee and human cultures. Current Anthropology, 39(5), 591–614.
Borgerhoff Mulder, M., Nunn, C. L., & Towner, M. C. (2006). Cultural macroevolution and the transmission
of traits. Evolutionary Anthropology, 15, 52–64.
Bose, C. E., & Rossi, P. H. (1983). Gender and jobs: Prestige standings of occupations as affected by gender.
American Sociological Review, 316–330.
Box, H. O. (1984). Primate behaviour and social ecology. London: Chapman & Hall.
Boyacigiller, N. A., & Adler, N. J. (1991). The parochial dinosaur: Organizational science in a global context.
Academy of Management Review, 16(2), 262–290.
Boyd, B. (2009). On the origin of stories. Harvard University Press.
Boyd, R., & Richerson, P. J. (1985). Culture and the evolutionary process. University of Chicago Press.

120
Boyd, R., & Richerson, P. J. (1995). Why does culture increase human adaptability? Ethology and
Sociobiology, 16(2), 125–143.
Boyd, R., & Richerson, P. J. (2009). Culture and the evolution of human cooperation. Philosophical
Transactions of the Royal Society B: Biological Sciences, 364(1533), 3281–3288.
Boyd, R., & Richerson, P. J. (2010). Transmission coupling mechanisms: Cultural group selection.
Philosophical Transactions of the Royal Society B: Biological Sciences, 365(1559), 3787.
Boyd, R., Richerson, P. J., & Henrich, J. (2011). Rapid cultural adaptation can facilitate the evolution of large-
scale cooperation. Behavioral Ecology and Sociobiology, 65(3), 431–444.
Boyer, P., & Barrett, H. C. (2015). Domain specificity and intuitive ontology. In D. M. Buss (Ed.), The
handbook of evolutionary psychology (pp. 96–118). Hoboken, NJ, USA: John Wiley & Sons, Inc.
doi:10.1002/9780470939376.ch3
Boyer, P., & Ramble, C. (2001). Cognitive templates for religious concepts: Cross-cultural evidence for recall
of counter-intuitive representations. Cognitive Science, 25(4), 535–564.
Brewer, J., Gelfand, M., Jackson, J. C., MacDonald, I. F., Peregrine, P. N., Richerson, P. J., et al. (2017). Grand
challenges for the study of cultural evolution. Nature Ecology & Evolution, 1, 0070.
doi:10.1038/s41559-017-0070
Brockington, D. (2008). Powerful environmentalisms: Conservation, celebrity and capitalism. Media,
Culture & Society, 30(4), 551–568.
Bronfenbrenner, U. (1979). The ecology of human development. Harvard university press.
Bruner, J. S. (1991). The narrative construction of reality. Critical Inquiry, 18(1), 1–21.
Bruner, J. S. (2009). Actual minds, possible worlds. Harvard University Press.
Buchsbaum, D., Gopnik, A., Griffiths, T. L., & Shafto, P. (2011). Children’s imitation of causal action
sequences is influenced by statistical and pedagogical evidence. Cognition, 120(3), 331–340.
Bulmer, M. G. (1979). Principles of statistics. Courier Corporation.
Burnham, K. P., & Anderson, D. R. (2002). Model selection and multimodel inference. New York: Springer.
Burris, V. (2004). The academic caste system: Prestige hierarchies in PhD exchange networks. American
Sociological Review, 69(2), 239–264.

121
Burton, M. L., & Nerlove, S. B. (1976). Balanced designs for triads tests: Two examples from English. Social
Science Research, 5(3), 247–267. doi:10.1016/0049-089X(76)90002-8
Busselle, R., & Bilandzic, H. (2009). Measuring narrative engagement. Media Psychology, 12(4), 321–347.
doi:10.1080/15213260903287259
Cajete, G. (1994). Look to the mountain: An ecology of indigenous education. ERIC.
Caldwell, C. A., Renner, E., & Atkinson, M. (2018). Human teaching and cumulative cultural evolution.
Review of Philosophy and Psychology, 9(4), 751–770. doi:10.1007/s13164-017-0346-3
Calhoun, C. (Ed.). (2002). Dictionary of the social sciences. New York: Oxford University Press.
Cavalli-Sforza, L. L., & Feldman, M. W. (1973). Cultural versus biological inheritance: Phenotypic
transmission from parents to children (A theory of the effect of parental phenotypes on children’s
phenotypes). American Journal of Human Genetics, 25(6), 618.
Cavalli-Sforza, L. L., & Feldman, M. W. (1981). Cultural transmission and evolution: A quantitative approach.
Princeton University Press.
Cavalli-Sforza, L. L., Feldman, M. W., Chen, K. H., & Dornbusch, S. M. (1982). Theory and observation in
cultural transmission. Science, 218(4567), 19.
Chang, C. (2009). “Being hooked” by editorial content: The implications for processing narrative
advertising. Journal of Advertising, 38(1), 21–34. doi:10.2753/JOA0091-3367380102
Chen, F. F. (2007). Sensitivity of goodness of fit indexes to lack of measurement invariance. Structural
Equation Modeling, 14(3), 464–504. doi:10.1080/10705510701301834
Cheng, H., & Furnham, A. (2012). Childhood cognitive ability, education, and personality traits predict
attainment in adult occupational prestige over 17 years. Journal of Vocational Behavior, 81(2), 218–
226. doi:10.1016/j.jvb.2012.07.005
Cheng, J. T., & Tracy, J. L. (2013). The impact of wealth on prestige and dominance rank relationships.
Psychological Inquiry, 24(2), 102–108.
Cheng, J. T., & Tracy, J. L. (2014). Toward a unified science of hierarchy: Dominance and prestige are two
fundamental pathways to human social rank. In The psychology of social status (pp. 3–27).
Springer.

122
Cheng, J. T., Tracy, J. L., Foulsham, T., Kingstone, A., & Henrich, J. (2013). Two ways to the top: Evidence
that dominance and prestige are distinct yet viable avenues to social rank and influence. Journal of
Personality and Social Psychology, 104(1), 103–125.
Cheng, J. T., Tracy, J. L., & Henrich, J. (2010). Pride, personality, and the evolutionary foundations of human
social status. Evolution and Human Behavior, 31(5), 334–347.
doi:10.1016/j.evolhumbehav.2010.02.004
Chiarucci, A., Bacaro, G., Rocchini, D., & Fattorini, L. (2008). Discovering and rediscovering the sample-
based rarefaction formula in the ecological literature. Community Ecology, 9(1), 121–123.
Chudek, M., Baron, A. S., & Birch, S. (2016). Unselective overimitators: The evolutionary implications of
children’s indiscriminate copying of successful and prestigious models. Child Development, 87(3),
782–794.
Chudek, M., Heller, S., Birch, S., & Henrich, J. (2012). Prestige-biased cultural learning: Bystander’s
differential attention to potential models influences children’s learning. Evolution and Human
Behavior, 33(1), 46–56.
Cialdini, R. B., & Trost, M. R. (1998). Social influence: Social norms, conformity, and compliance. In D. T.
Gilbert, S. T. Fiske, & G. Lindzey (Eds.), The handbook of social psychology (pp. 151–192). New York,
NY: McGraw-Hill.
Cicero, M. T. (45BC). Tusculanae disputationes.
Claidière, N., Scott-Phillips, T. C., & Sperber, D. (2014). How Darwinian is cultural evolution? Philosophical
Transactions of the Royal Society B: Biological Sciences, 369(1642), 20130368.
doi:10.1098/rstb.2013.0368
Cohen, J. (1988). Statistical power analysis for the behavioral sciences (2nd ed.). New Jersey: Lawrence
Erlbaum Associates.
Colarelli, S. M., & Dettmann, J. R. (2003). Intuitive evolutionary perspectives in marketing practices.
Psychology & Marketing, 20(9), 837–865.
Colbert, F., & Courchesne, A. (2012). Critical issues in the marketing of cultural goods: The decisive
influence of cultural transmission. City, Culture and Society, 3(4), 275–280.

123
Coogan, M. D., Brettler, M. Z., Newsom, C. A., & Perkins, P. (Eds.). (2010). The new Oxford annotated Bible:
New Revised Standard Version with the Apocrypha: An ecumenical study Bible (4th ed.). Oxford
University Press.
Corneo, G., & Jeanne, O. (1997). Conspicuous consumption, snobbism and conformism. Journal of Public
Economics, 66(1), 55–71.
Costello, A. B., & Osborne, J. W. (2005). Best practices in exploratory factor analysis: Four
recommendations for getting the most from your analysis. Practical Assessment, Research &
Evaluation, 10(7), 1–9.
Coupland, N. (2003). Sociolinguistic authenticities. Journal of Sociolinguistics, 7(3), 417–431.
doi:10.1111/1467-9481.00233
Coupland, N., & Bishop, H. (2007). Ideologised values for British accents. Journal of Sociolinguistics, 11(1),
74–93.
Crawley, D. (2014). Gender and perceptions of occupational prestige. SAGE Open, 4(1), 1–11.
doi:10.1177/2158244013518923
Cronbach, L. J. (1951). Coefficient alpha and the internal structure of tests. Psychometrika, 16(3), 297–334.
doi:10.1007/BF02310555
Cronk, L. (2005). The application of animal signaling theory to human phenomena: Some thoughts and
clarifications. Social Science Information, 44(4), 603–620. doi:10.1177/0539018405058203
Csibra, G., & Gergely, G. (2009). Natural pedagogy. Trends in Cognitive Sciences, 13(4), 148–153.
doi:10.1016/j.tics.2009.01.005
Curran, P. J., West, S. G., & Finch, J. F. (1996). The robustness of test statistics to nonnormality and
specification error in confirmatory factor analysis. Psychological Methods, 1(1), 16–29.
doi:10.1037/1082-989X.1.1.16
Currie, T. E., Greenhill, S. J., & Mace, R. (2010). Is horizontal transmission really a problem for phylogenetic
comparative methods? A simulation study using continuous cultural traits. Philosophical
Transactions of the Royal Society B: Biological Sciences, 365(1559), 3903.

124
da Silva, S. G., & Tehrani, J. J. (2016). Comparative phylogenetic analyses uncover the ancient roots of Indo-
European folktales. Royal Society Open Science, 3(1), 150645. doi:10.1098/rsos.150645
Dafoe, A., Renshon, J., & Huth, P. (2014). Reputation and status as motives for war. Annual Review of
Political Science, 17(1), 371–393. doi:10.1146/annurev-polisci-071112-213421
D’Andrade, R. (2006). Commentary on Searle’s ‘Social ontology: Some basic principles.’ Anthropological
Theory, 6(1), 30–39.
D’Aveni, R. A. (1990). Top managerial prestige and organizational bankruptcy. Organization Science, 1(2),
121–142. doi:10.1287/orsc.1.2.121
Davis, K., & Moore, W. E. (1945). Some principles of stratification. American Sociological Review, 10(2), 242–
249. doi:10.2307/2085643
de Munck, V. C., & Bennardo, G. (2019). Disciplining culture. Current Anthropology, 60(2), 174–193.
Dean, L. G., Vale, G. L., Laland, K. N., Flynn, E., & Kendal, R. L. (2014). Human cumulative culture: A
comparative perspective. Biological Reviews, 89(2), 284–301. doi:10.1111/brv.12053
Deeter-Schmelz, D. R., Moore, J. N., & Goebel, D. J. (2000). Prestige clothing shopping by consumers: A
confirmatory assessment and refinement of the PRECON scale with managerial implications.
Journal of Marketing Theory and Practice, 8(4), 43–58. doi:10.1080/10696679.2000.11501879
Delgadillo, Y., & Escalas, J. E. (2004). Narrative word-of-mouth communication: Exploring memory and
attitude effects of consumer storytelling. Advances in Consumer Research, 31(1), 186–192.
Dennis, G., & Walter, E. (1995). The effects of repeated read-alouds on story comprehension as assessed
through story retellings. Reading Improvement, 32(3), 140.
Department for Environment, Food & Rural Affairs. (2012). Rural population 2014/15. UK Rural Population
and Migration Statistics. https://www.gov.uk/government/publications/rural-population-and-
migration/rural-population-201415. Accessed 20 September 2017
DiStefano, C., & Morgan, G. B. (2014). A comparison of diagonal weighted least squares robust estimation
techniques for ordinal data. Structural Equation Modeling, 21(3), 425–438.
doi:10.1080/10705511.2014.915373
125
Dubois, B., & Czellar, S. (2002). Prestige brands or luxury brands? An exploratory inquiry on consumer
perceptions. In Proceedings of the European Marketing Academy 31st Conference. Portugal:
University of Minho.
Duda, R. O., Hart, P. E., & Stork, D. G. (1973). Pattern classification and scene analysis. New York: Wiley.
Dunbar, R. (1998). Theory of mind and the evolution of language. In J. R. Hurford, M. Studdert-Kennedy, &
C. Knight (Eds.), Approaches to the evolution of language (pp. 92–110). Cambridge: Cambridge
University Press.
Dunbar, R. I. M. (2004). Gossip in evolutionary perspective. Review of General Psychology, 8(2), 100–110.
doi:10.1037/1089-2680.8.2.100
Duncan, O. D. (1961). A socioeconomic index for all occupations. In A. J. Reiss, O. D. Duncan, P. K. Hatt, &
C. C. North (Eds.), Occupations and social status (pp. 109–138). New York: Free Press.
Dunn, J. C. (1974). Well-separated clusters and optimal fuzzy partitions. Journal of Cybernetics, 4(1), 95–104.
doi:10.1080/01969727408546059
Duranti, A. (1986). The audience as co-author: An introduction. Text, 6(3), 239–247.
Duthie, E., Veríssimo, D., Keane, A., & Knight, A. T. (2017). The effectiveness of celebrities in conservation
marketing. PLOS ONE, 12(7), e0180027.
Eerkens, J. W., & Lipo, C. P. (2005). Cultural transmission, copying errors, and the generation of variation
in material culture and the archaeological record. Journal of Anthropological Archaeology, 24(4),
316–334.
Efferson, C., Lalive, R., Richerson, P. J., McElreath, R., & Lubell, M. (2008). Conformists and mavericks: The
empirics of frequency-dependent cultural transmission. Evolution and Human Behavior, 29(1), 56–
64.
Efferson, C., Richerson, P. J., McElreath, R., Lubell, M., Edsten, E., Waring, T. M., et al. (2007). Learning,
productivity, and noise: An experimental study of cultural transmission on the Bolivian Altiplano.
Evolution and Human Behavior, 28(1), 11–17.
Ember, C. R., & Ember, M. (2009). Cross-cultural research methods (2nd ed.). Lanham, MD: Rowman
Altamira.

126
England, P. (1979). Women and occupational prestige: A case of vacuous sex equality. Signs, 5(2), 252–265.
Enquist, M., Eriksson, K., & Ghirlanda, S. (2007). Critical social learning: A solution to Rogers’s paradox of
nonadaptive culture. American Anthropologist, 109(4), 727–734.
Enright, E. A., Gweon, H., & Sommerville, J. A. (2017). ‘To the victor go the spoils’: Infants expect resources
to align with dominance structures. Cognition, 164, 8–21. doi:10.1016/j.cognition.2017.03.008
Eriksson, K., & Coultas, J. C. (2014). Corpses, maggots, poodles and rats: Emotional selection operating in
three phases of cultural transmission of urban legends. Journal of Cognition and Culture, 14(1–2), 1–
26.
Eriksson, K., Coultas, J. C., & Barra, M. de. (2016). Cross-cultural differences in emotional selection on
transmission of information. Journal of Cognition and Culture, 16(1–2), 122–143.
doi:10.1163/15685373-12342171
Eriksson, K., Enquist, M., & Ghirlanda, S. (2007). Critical points in current theory of conformist social
learning. Journal of Evolutionary Psychology, 5(1), 67–87.
Feldman, M. W., Aoki, K., & Komm, J. (1996). Individual versus social learning: Evolutionary analysis in a
fluctuating environment. Anthropological Science, 104, 209–232.
Fessler, D. M., Pisor, A. C., & Navarrete, C. D. (2014). Negatively-biased credulity and the cultural evolution
of beliefs. PLOS ONE, 9(4), e95167.
Firth, R. (1939). Primitive Polynesian economy. London: Routledge.
http://ehrafworldcultures.yale.edu/document?id=ot11-001
Fishbein, M., & Ajzen, I. (1975). Belief, attitude, intention and behavior: An introduction to theory and
research. Reading, MA: Addison-Wesley.
Fleck, N., Korchia, M., & Le Roy, I. (2012). Celebrities in advertising: Looking for congruence or likability?
Psychology & Marketing, 29(9), 651–662.
Fleiss, J. L., & Fleiss, J. L. (1986). Reliability of measurement. In Design and analysis of clinical experiments
(pp. 1–32). John Wiley & Sons.
Fornell, C., & Larcker, D. F. (1981). Evaluating structural equation models with unobservable variables and
measurement error. Journal of Marketing Research, 18(1), 39–50. doi:10.2307/3151312

127
Fragaszy, D. M., & Perry, S. (2008). The biology of traditions: Models and evidence. Cambridge University
Press.
Franz, M., & Nunn, C. L. (2009). Rapid evolution of social learning. Journal of Evolutionary Biology, 22(9),
1914–1922.
Frascara, J. (1988). Graphic design: Fine art or social science? Design Issues, 5(1), 18–29.
Fuad-Luke, A. (2013). Design activism: Beautiful strangeness for a sustainable world. Routledge.
Fuertes, J. N., Gottdiener, W. H., Martin, H., Gilbert, T. C., & Giles, H. (2012). A meta-analysis of the effects
of speakers’ accents on interpersonal evaluations: Effects of speakers’ accents. European Journal of
Social Psychology, 42(1), 120–133. doi:10.1002/ejsp.862
Fujishiro, K., Xu, J., & Gong, F. (2010). What does “occupation” represent as an indicator of socioeconomic
status?: Exploring occupational prestige and health. Social Science & Medicine, 71(12), 2100–2107.
Fulton, D. C., Manfredo, M. J., & Lipscomb, J. (1996). Wildlife value orientations: A conceptual and
measurement approach. Human Dimensions of Wildlife, 1(2), 24–47.
Galef, B. G. (1988). Imitation in animals: History, definition, and interpretation of data from the
psychological laboratory. In T. R. Zentall & B. G. Galef, Jr. (Eds.), Social learning: Psychological and
biological perspectives, 3–27. Hillsdale, New Jersey: Lawrence Erlbaum.
Ganzeboom, H. B., De Graaf, P. M., & Treiman, D. J. (1992). A standard international socio-economic index
of occupational status. Social Science Research, 21(1), 1–56. doi:10.1016/0049-089X(92)90017-B
Garfield, Z. H., Hubbard, R. L., & Hagen, E. H. (2019). Evolutionary models of leadership. Human Nature.
doi:10.1007/s12110-019-09338-4
Garrett, P. (2007). Language attitudes. In C. Llamas, L. Mullany, & P. Stockwell (Eds.), The Routledge
companion to sociolinguistics (p. 116). Taylor & Francis.
Gavin, M. C., McCarter, J., Mead, A., Berkes, F., Stepp, J. R., Peterson, D., & Tang, R. (2015). Defining
biocultural approaches to conservation. Trends in Ecology & Evolution, 30(3), 140–145.
Genter, D. R. (1976). The structure and recall of narrative prose. Journal of Verbal Learning and Verbal
Behavior, 15, 411–418.

128
Giles, H. (1970). Evaluative Reactions to Accents. Educational Review, 22(3), 211–227.
doi:10.1080/0013191700220301
Giles, H. (1971). Patterns of evaluation to RP, South Welsh and Somerset accented speech. British Journal of
Social and Clinical Psychology, 10(3), 280–281.
Giles, H. (1973). Communicative effectiveness as a function of accented speech. Speech Monographs, 40(4),
330-331.
Glenn, C. G. (1980). Relationship between story content and structure. Journal of Educational Psychology,
72(4), 550.
Goldthorpe, J. H., & Hope, K. (1972). Occupational grading and occupational prestige. In K. Hope (Ed.), The
analysis of social mobility: Methods and approaches (pp. 19–80). Oxford: Clarendon Press.
Gómez-Baggethun, E., Corbera, E., & Reyes-García, V. (2013). Traditional ecological knowledge and global
environmental change: Research findings and policy implications. Ecology and Society, 18(4).
doi:10.5751/ES-06288-180472
Goode, W. J. (1960). A theory of role strain. American Sociological Review, 483–496.
Gordon, L. R. (2018). Thoughts on two recent decades of studying race and racism. Social Identities, 24(1),
29–38. doi:10.1080/13504630.2017.1314924
Goyder, J. (2005). The dynamics of occupational prestige: 1975-2000. Canadian Review of Sociology and
Anthropology, 42(1), 1–23. doi:10.1111/j.1755-618X.2005.tb00788.x
Graesser, A. C., McNamara, D. S., & Louwerse, M. M. (2003). What do readers need to learn in order to
process coherence relations in narrative and expository text? In A. P. Sweet & C. E. Snow (Eds.),
Rethinking reading comprehension (pp. 82–98). New York: Guilford Press.
Graesser, A. C., Olde, B., & Klettke, B. (2002). How does the mind construct and represent stories? In M. C.
Green, J. J. Strange, & T. C. Brock (Eds.), Narrative impact: Social and cognitive foundations (pp.
229–262). Mahweh, NJ: Lawrence Erlbaum.
Gray, J. P. (1996). Is the standard cross-cultural sample biased? A simulation study. Cross-Cultural Research,
30(4), 301–315.
Gray, J. P. (1999). A corrected ethnographic atlas. World Cultures, 10(1), 24–136.

129
Gray, R. D., Bryant, D., & Greenhill, S. J. (2010). On the shape and fabric of human history. Philosophical
Transactions of the Royal Society B: Biological Sciences, 365(1559), 3923–3933.
Gray, R. D., Greenhill, S. J., & Ross, R. M. (2007). The pleasures and perils of Darwinizing culture (with
phylogenies). Biological Theory, 2(4).
Gray, R. D., & Watts, J. (2017). Cultural macroevolution matters. Proceedings of the National Academy of
Sciences, 114(30), 7846–7852.
Greenhill, S. J., Currie, T. E., & Gray, R. D. (2009). Does horizontal transmission invalidate cultural
phylogenies? Proceedings of the Royal Society B: Biological Sciences, 276(1665), 2299–2306.
Griskevicius, V., Tybur, J. M., & Van den Bergh, B. (2010). Going green to be seen: Status, reputation, and
conspicuous conservation. Journal of Personality and Social Psychology, 98(3), 392.
Grueber, C. E., Nakagawa, S., Laws, R. J., & Jamieson, I. G. (2011). Multimodel inference in ecology and
evolution: challenges and solutions: Multimodel inference. Journal of Evolutionary Biology, 24(4),
699–711. doi:10.1111/j.1420-9101.2010.02210.x
Guglielmino, C. R., Viganotti, C., Hewlett, B. S., & Cavalli-Sforza, L. L. (1995). Cultural variation in Africa:
Role of mechanisms of transmission and adaptation. Proceedings of the National Academy of
Sciences, 92(16), 7585.
Gundersen, D. F., & Perrill, N. K. (1989). Extending the “Speech Evaluation Instrument” to public speaking
settings. Journal of Language and Social Psychology, 8(1), 59–61. doi:10.1177/0261927X8900800105
Guppy, N., & Goyder, J. C. (1984). Consensus on occupational prestige: A reassessment of the evidence.
Social Forces, 62(3), 709–725. doi:10.1093/sf/62.3.709
Gusfield, J. R., & Schwartz, M. (1963). The meanings of occupational prestige: Reconsideration of the NORC
scale. American Sociological Review, 28(2), 265–271. doi:10.2307/2090613
Hair, J. F., Black, W. C., Babin, B. J., & Anderson, R. E. (2010). Multivariate data analysis (10th ed.). Upper
Saddle River, NJ: Prentice Hall.
Halevy, N., Chou, E. Y., Cohen, T. R., & Livingston, R. W. (2012). Status conferral in intergroup social
dilemmas: Behavioral antecedents and consequences of prestige and dominance. Journal of
Personality and Social Psychology, 102(2), 351.

130
Hänninen, K. (2007). Perspectives on the narrative construction of emotions. Elore, 14(1), 1–9.
Harbaugh, W. T. (1998). The prestige motive for making charitable transfers. The American Economic
Review, 88(2), 277–282.
Harrison, D. A., & McLaughlin, M. E. (1993). Cognitive processes in self-report responses: Tests of item
context effects in work attitude measures. Journal of Applied Psychology, 78(1), 129–140.
doi:10.1037/0021-9010.78.1.129
Harzing, A.-W. (2016). Publish or Perish [version 4.26.2.5994]. http://www.harzing.com/pop.htm
Hauser, R. M., & Warren, J. R. (1997). Socioeconomic indexes for occupations: A review, update, and
critique. Sociological Methodology, 27(1), 177–298. doi:10.1111/1467-9531.271028
Haynes, S. N., Richard, D., & Kubany, E. S. (1995). Content validity in psychological assessment: A
functional approach to concepts and methods. Psychological Assessment, 7(3), 238.
doi:10.1037/1040-3590.7.3.238
Heath, C., Bell, C., & Sternberg, E. (2001). Emotional selection in memes: The case of urban legends. Journal
of Personality and Social Psychology, 81(6), 1028.
Henrich, J. (2001). Cultural transmission and the diffusion of innovations: Adoption dynamics indicate that
biased cultural transmission is the predominate force in behavioral change. American
Anthropologist, 103(4), 992–1013. doi:10.1525/aa.2001.103.4.992
Henrich, J. (2004a). Demography and cultural evolution: How adaptive cultural processes can produce
maladaptive losses - The Tasmanian case. American Antiquity, 69(2), 197–214. doi:10.2307/4128416
Henrich, J. (2004b). Cultural group selection, coevolutionary processes and large-scale cooperation. Journal
of Economic Behavior & Organization, 53(1), 3–35. doi:10.1016/s0167-2681(03)00094-5
Henrich, J. (2009). The evolution of costly displays, cooperation and religion: Credibility enhancing
displays and their implications for cultural evolution. Evolution and Human Behavior, 30(4), 244–
260.
Henrich, J., & Boyd, R. (1998). The evolution of conformist transmission and the emergence of between-
group differences. Evolution and Human Behavior, 19(4), 215–241.

131
Henrich, J., & Boyd, R. (2001). Why people punish defectors: Weak conformist transmission can stabilize
costly enforcement of norms in cooperative dilemmas. Journal of Theoretical Biology, 208(1), 79–89.
doi:10.1006/jtbi.2000.2202
Henrich, J., & Boyd, R. (2002). On modeling cognition and culture. Journal of Cognition and Culture, 2(2),
87–112. doi:10.1163/156853702320281836
Henrich, J., Boyd, R., & Richerson, P. J. (2008). Five misunderstandings about cultural evolution. Human
Nature, 19(2), 119–137.
Henrich, J., & Broesch, J. (2011). On the nature of cultural transmission networks: Evidence from Fijian
villages for adaptive learning biases. Philosophical Transactions of the Royal Society B-Biological
Sciences, 366(1567), 1139–1148. doi:10.1098/rstb.2010.0323
Henrich, J., Chudek, M., & Boyd, R. (2015). The big man mechanism: How prestige fosters cooperation and
creates prosocial leaders. Philosophical Transactions of the Royal Society B, 370(1683).
Henrich, J., & Gil-White, F. J. (2001). The evolution of prestige: Freely conferred deference as a mechanism
for enhancing the benefits of cultural transmission. Evolution and Human Behavior, 22(3), 165–196.
doi:10.1016/S1090-5138(00)00071-4
Henrich, J., Heine, S. J., & Norenzayan, A. (2010). The weirdest people in the world? Behavioral and Brain
Sciences, 33(2–3), 61–83. doi:10.1017/S0140525X0999152X
Henrich, J., & Henrich, N. (2010). The evolution of cultural adaptations: Fijian food taboos protect against
dangerous marine toxins. Proceedings of the Royal Society B-Biological Sciences, 277(1701), 3715–
3724. doi:10.1098/rspb.2010.1191
Henrich, J., & McElreath, R. (2003). The evolution of cultural evolution. Evolutionary Anthropology, 12, 123–
135.
Henseler, J., Ringle, C. M., & Sarstedt, M. (2015). A new criterion for assessing discriminant validity in
variance-based structural equation modeling. Journal of the Academy of Marketing Science, 43(1),
115–135. doi:10.1007/s11747-014-0403-8

132
Henze, N., & Zirkler, B. (1990). A class of invariant consistent tests for multivariate normality.
Communications in Statistics - Theory and Methods, 19(10), 3595–3617.
doi:10.1080/03610929008830400
Herrmann, E., Call, J., Hernandez-Lloreda, M. V., Hare, B., & Tomasello, M. (2007). Humans have evolved
specialized skills of social cognition: The cultural intelligence hypothesis. Science, 317, 1360–1366.
Hershberger, S. L. (2005). Tetrachoric correlation. In Encyclopedia of statistics in behavioral science. John
Wiley & Sons, Ltd. doi:10.1002/0470013192.bsa676
Hewlett, B. S., & Cavalli-Sforza, L. L. (1986). Cultural transmission among Aka pygmies. American
Anthropologist, 88(4), 922–934.
Hewlett, B. S., De Silvestri, A., & Guglielmino, C. R. (2002). Semes and genes in Africa. Current
Anthropology, 43, 313–321.
Heyes, C. (2012a). What’s social about social learning? Journal of Comparative Psychology, 126(2), 193.
Heyes, C. (2012b). Grist and mills: On the cultural origins of cultural learning. Philosophical Transactions of
the Royal Society B: Biological Sciences, 367(1599), 2181–2191.
Heyes, C. (2016). Who knows? Metacognitive social learning strategies. Trends in Cognitive Sciences, 20(3),
204-213.
Heyes, C. M. (1994). Social learning in animals: Categories and mechanisms. Biological Reviews, 69(2), 207–
231.
Heyes, C. M. (2017). When does social learning become cultural learning? Developmental Science, 20(2).
Highhouse, S., Brooks, M. E., & Gregarus, G. (2009). An organizational impression management perspective
on the formation of corporate reputations. Journal of Management, 35(6), 1481–1493.
Hill, J. (1984). Prestige and reproductive success in man. Ethology and Sociobiology, 5(2), 77–95.
Hinde, R. A. (1976). Interactions, relationships and social structure. Man, 1–17.
Hoehl, S., Keupp, S., Schleihauf, H., McGuigan, N., Buttelmann, D., & Whiten, A. (2019). ‘Over-imitation’: A
review and appraisal of a decade of research. Developmental Review, 51, 90–108.
133
Holgado-Tello, F. P., Chacón-Moscoso, S., Barbero-García, I., & Vila-Abad, E. (2010). Polychoric versus
Pearson correlations in exploratory and confirmatory factor analysis of ordinal variables. Quality &
Quantity, 44(1), 153–166. doi:10.1007/s11135-008-9190-y
Holling, C. S. (2001). Understanding the complexity of economic, ecological, and social systems.
Ecosystems, 4(5), 390–405.
Homer, P. M., & Kahle, L. R. (1988). A structural equation test of the value-attitude-behavior hierarchy.
Journal of Personality and Social Psychology, 54(4), 638.
Horner, V., Proctor, D., Bonnie, K. E., Whiten, A., & de Waal, F. B. M. (2010). Prestige affects cultural
learning in chimpanzees. PLOS ONE, 5(5), e10625.
Horner, V., & Whiten, A. (2005). Causal knowledge and imitation/emulation switching in chimpanzees
(Pan troglodytes) and children (Homo sapiens). Animal Cognition, 8, 164–181. doi:10.1007/s10071-
004-0239-6
Hothorn, T., Hornik, K., Van De Wiel, M. A., & Zeileis, A. (2006). A Lego system for conditional inference.
The American Statistician, 60(3), 257–263. doi:10.1198/000313006X118430
Hu, L., & Bentler, P. M. (1999). Cutoff criteria for fit indexes in covariance structure analysis: Conventional
criteria versus new alternatives. Structural Equation Modeling, 6(1), 1–55.
doi:10.1080/10705519909540118
Human Relations Area Files. (n.d.). eHRAF World Cultures Database.
Ihara, Y. (2008). Spread of costly prestige-seeking behavior by social learning. Theoretical Population
Biology, 73(1), 148–157. doi:10.1016/j.tpb.2007.10.002
Inkeles, A., & Rossi, P. H. (1956). National comparisons of occupational prestige. American Journal of
Sociology, 61(4), 329–339. doi:10.2307/2773534
Jakobson, R. (1960). Linguistics and Poetics. In Style in Language (pp. 350–377). MIT Press.
Jesmer, B. R., Merkle, J. A., Goheen, J. R., Aikens, E. O., Beck, J. L., Courtemanch, A. B., et al. (2018). Is
ungulate migration culturally transmitted? Evidence of social learning from translocated animals.
Science, 361(6406), 1023–1025. doi:10.1126/science.aat0985

134
Jiménez, Á. V., & Mesoudi, A. (2019). Prestige-biased social learning: Current evidence and outstanding
questions. Palgrave Communications, 5(1), 20.
Jöreskog, K. G., & Sörbom, D. (1996). PRELIS 2 user’s reference guide: A program for multivariate data
screening and data summarization: A preprocessor for LISREL. Scientific Software International.
Jorgensen, T. D., Kite, B. A., Chen, P.-Y., & Short, S. D. (2016). Finally! A valid test of configural invariance
using permutation in multigroup CFA. In The Annual Meeting of the Psychometric Society (pp. 93–
103). Springer. doi:10.1007/978-3-319-56294-0_9
Kahane, H. (1986). A typology of the prestige language. Language, 62(3), 495–508. doi:10.2307/415474
Kaikati, J. G. (1987). Celebrity advertising: A review and synthesis. International Journal of Advertising, 6(2),
93–105.
Kaiser, H. F., & Rice, J. (1974). Little jiffy, mark IV. Educational and Psychological Measurement, 34(1), 111–
117. doi:10.1177/001316447403400115
Kandler, A., & Powell, A. (2015). Inferring learning strategies from cultural frequency data. In Learning
strategies and cultural evolution during the Palaeolithic (pp. 85–101). Springer.
Kaplan, H. (1985). Prestige and reproductive success in man: A commentary. Ethology and Sociobiology,
6(2), 115–118.
Kaufman, H. F. (1945). Defining prestige rank in a rural community. Sociometry, 8(2), 199–207.
doi:10.2307/2785239
Kaufman, L., & Rousseeuw, P. J. (1990). Partitioning around medoids (Program PAM). In Finding groups in
data: An introduction to cluster analysis (pp. 68–125). New York: John Wiley & Sons.
doi:10.1002/9780470316801.ch2
Keith, B., & Babchuk, N. (1998). The quest for institutional recognition: A longitudinal analysis of scholarly
productivity and academic prestige among sociology departments. Social Forces, 76(4), 1495–1533.
Kendal, J., Giraldeau, L.-A., & Laland, K. N. (2009). The evolution of social learning rules: Payoff-biased and
frequency-dependent biased transmission. Journal of Theoretical Biology, 260(2), 210–219.
doi:10.1016/j.jtbi.2009.05.029

135
Kendal, R. L., Boogert, N. J., Rendell, L., Laland, K. N., Webster, M., & Jones, P. L. (2018). Social learning
strategies: Bridge-building between fields. Trends in Cognitive Sciences, 22(7), 651–665.
doi:10.1016/j.tics.2018.04.003
Kennedy, P. (2010). The rise and fall of the great powers. Vintage.
Kensinger, E. A., & Corkin, S. (2003). Memory enhancement for emotional words: Are emotional words
more vividly remembered than neutral words? Memory & Cognition, 31(8), 1169–1180.
doi:10.3758/BF03195800
Kirby, K. R., Gray, R. D., Greenhill, S. J., Jordan, F. M., Gomes-Ng, S., Bibiko, H.-J., et al. (2016). D-PLACE: A
global database of cultural, linguistic and environmental diversity. PLOS One, 11(7), e0158391.
Kirby, S., Dowman, M., & Griffiths, T. L. (2007). Innateness and culture in the evolution of language.
Proceedings of the National Academy of Sciences, 104(12), 5241–5245.
Kirmayer, L. J. (2012). Cultural competence and evidence-based practice in mental health: Epistemic
communities and the politics of pluralism. Social Science & Medicine, 75(2), 249–256.
Kitchin, R. (2014). Big data, new epistemologies and paradigm shifts. Big Data & Society, 1(1),
2053951714528481. doi:10.1177/2053951714528481
Kline, P. (1991). Intelligence: The psychometric view. Florence, KY: Taylor & Frances/Routledge.
Kohler, T. A., VanBuskirk, S., & Ruscavage-Barz, S. (2004). Vessels and villages: Evidence for conformist
transmission in early village aggregations on the Pajarito Plateau, New Mexico. Journal of
Anthropological Archaeology, 23(1), 100–118.
Kollmuss, A., & Agyeman, J. (2002). Mind the gap: Why do people act environmentally and what are the
barriers to pro-environmental behavior? Environmental Education Research, 8(3), 239–260.
Komeda, H., Kawasaki, M., Tsunemi, K., & Kusumi, T. (2009). Differences between estimating protagonists’
emotions and evaluating readers’ emotions in narrative comprehension. Cognition & Emotion,
23(1), 135–151. doi:10.1080/02699930801949116
Kormos, J., & Trebits, A. (2011). Chapter 10. Working memory capacity and narrative task performance. In P.
Robinson (Ed.), Task-based language teaching (Vol. 2, pp. 267–286). Amsterdam: John Benjamins
Publishing Company. doi:10.1075/tblt.2.17ch10

136
Krippendorff, K. (2012). Content analysis: An introduction to its methodology (3rd ed.). Thousand Oaks, CA:
Sage.
Kroch, A. S. (1978). Toward a theory of social dialect variation. Language in Society, 7(1), 17–36.
doi:10.1017/S0047404500005315
Kroeber, A. L., & Kluckhohn, C. (1952). Culture: A critical review of concepts and definitions. Papers.
Peabody Museum of Archaeology & Ethnology, Harvard University.
Labov, W. (1964). Phonological correlates of social stratification. American Anthropologist, 66(6.2), 164–176.
Labov, W. (1966). The social stratification of English in New York City. Washington, D.C.: Center for Applied
Linguistics.
Labov, W. (1972). The social stratification of (r) in New York City department stores. In Sociolinguistic
patterns (pp. 43–52). Philadelphia: University of Pennsylvania Press.
Labov, W., Ash, S., & Boberg, C. (2005). The atlas of North American English: Phonetics, phonology and
sound change. Walter de Gruyter.
Laland, K. N. (2004). Social learning strategies. Learning & Behavior, 32(1), 4–14.
Laland, K. N., Atton, N., & Webster, M. M. (2011). From fish to fashion: Experimental and theoretical
insights into the evolution of culture. Philosophical Transactions of the Royal Society B: Biological
Sciences, 366(1567), 958.
Laland, K. N., & Williams, K. (1998). Social transmission of maladaptive information in the guppy.
Behavioral Ecology, 9(5), 493.
Lance, C. E., Butts, M. M., & Michels, L. C. (2006). The sources of four commonly reported cutoff criteria:
What did they really say? Organizational Research Methods, 9(2), 202–220.
doi:10.1177/1094428105284919
Lawrence, D., & Thomas, J. C. (1999). Social dynamics of storytelling: Implications for story-base design
(Technical Report No. FS-99-01) (p. 4). AAAI.
Lawshe, C. H. (1975). A quantitative approach to content validity. Personnel Psychology, 28(4), 563–575.
doi:10.1111/j.1744-6570.1975.tb01393.x

137
Leadbeater, E., & Chittka, L. (2007a). Social learning in insects – From miniature brains to consensus
building. Current Biology, 17(16), R703–R713.
Leadbeater, E., & Chittka, L. (2007b). The dynamics of social learning in an insect model, the bumblebee
(Bombus terrestris). Behavioral Ecology and Sociobiology, 61, 1789-1796.
Leeuwen, E. J., Cohen, E., Collier-Baker, E., Rapold, C. J., Schäfer, M., Schütte, S., & Haun, D. B. (2018). The
development of human social learning across seven societies. Nature Communications, 9(1), 2076.
Legare, C. H., & Harris, P. L. (2016). The ontogeny of cultural learning. Child Development, 87(3), 633–642.
Lehmann, L., & Feldman, M. W. (2009). Coevolution of adaptive technology, maladaptive culture and
population size in a producer–scrounger game. Proceedings of the Royal Society B: Biological
Sciences, 276(1674), 3853.
Lejano, R. P., Tavares-Reager, J., & Berkes, F. (2013). Climate and narrative: Environmental knowledge in
everyday life. Environmental Science & Policy, 31, 61–70.
Lewis, H. M., & Laland, K. N. (2012). Transmission fidelity is the key to the build-up of cumulative culture.
Philosophical Transactions of the Royal Society B: Biological Sciences, 367(1599), 2171–2180.
Linton, R. (1936). The study of man. New York: Appleton-Century-Crofts.
Litman, L., Robinson, J., & Abberbock, T. (2017). TurkPrime.com: A versatile crowdsourcing data
acquisition platform for the behavioral sciences. Behavior Research Methods, 49(2), 433–442.
doi:10.3758/s13428-016-0727-z
Lubeck, S. (1984). Kinship and classrooms: An ethnographic perspective on education as cultural
transmission. Sociology of Education, 57(4), 219–232.
Lubke, G. H., & Muthén, B. O. (2004). Applying multigroup confirmatory factor models for continuous
outcomes to Likert scale data complicates meaningful group comparisons. Structural Equation
Modeling, 11(4), 514–534. doi:10.1207/s15328007sem1104_2
Lumley, T. (2011). Complex surveys: A guide to analysis using R (Vol. 565). John Wiley & Sons.
Macdonald, D. W. (1983). The ecology of carnivore social behaviour. Nature, 301(5899), 379–384.
Mace, R., & Holden, C. (2005). A phylogenetic approach to cultural evolution. Trends in Ecology &
Evolution, 20, 116–121.

138
Mace, R., & Jordan, F. M. (2011). Macro-evolutionary studies of cultural diversity: A review of empirical
studies of cultural transmission and cultural adaptation. Philosophical Transactions of the Royal
Society B: Biological Sciences, 366(1563), 402.
Mael, F., & Ashforth, B. E. (1992). Alumni and their alma mater: A partial test of the reformulated model of
organizational identification. Journal of Organizational Behavior, 13(2), 103–123.
doi:10.1002/job.4030130202
Mahajan, N., & Wynn, K. (2012). Origins of “us” versus “them”: Prelinguistic infants prefer similar others.
Cognition, 124(2), 227–233.
Malec, J. E., Ivnik, R. J., & Hinkeldey, N. S. (1991). Visual Spatial Learning Test. Psychological Assessment,
3(1), 82–88.
Malinowski, B. (1929). The sexual life of savages in northwestern Melanesia: An ethnographic account of
courtship, marriage, and family life among the native of the Trobriand Islands, British New Guinea
(Vol. 1 and 2). New York: Horace Liveright. http://ehrafworldcultures.yale.edu/document?id=ol06-
005
Manfredo, M. J., Vaske, J. J., & Decker, D. J. (1995). Human dimensions of wildlife management: Basic
concepts. Wildlife and recreationists: Coexistence through management and research. Island Press,
Washington, DC, USA, 17–31.
Mardia, K. V. (1970). Measures of multivariate skewness and kurtosis with applications. Biometrika, 57(3),
519–530. doi:10.1093/biomet/57.3.519
Mardia, K. V. (1974). Applications of some measures of multivariate skewness and kurtosis in testing
normality and robustness studies. Sankhyā: The Indian Journal of Statistics, Series B, 36(2), 115–128.
Mascaro, O., & Csibra, G. (2012). Representation of stable social dominance relations by human infants.
Proceedings of the National Academy of Sciences, 109(18), 6862–6867. doi:10.1073/pnas.1113194109
Mascaro, O., & Csibra, G. (2014). Human infants’ learning of social structures: The case of dominance
hierarchy. Psychological Science, 25(1), 250–255. doi:10.1177/0956797613500509

139
Mascia, M. B., Brosius, J. P., Dobson, T. A., Forbes, B. C., Horowitz, L., McKean, M. A., & Turner, N. J.
(2003). Conservation and the social sciences. Conservation Biology, 17(3), 649–650.
doi:10.1046/j.1523-1739.2003.01738.x
Mazzocchi, F. (2015). Could big data be the end of theory in science? EMBO reports, 16(10), e201541001.
doi:10.15252/embr.201541001
McCarter, J., Gavin, M. C., Baereleo, S., & Love, M. (2014). The challenges of maintaining indigenous
ecological knowledge. Ecology and Society, 19(3).
McDonald, R. I., & Crandall, C. S. (2015). Social norms and social influence. Current Opinion in Behavioral
Sciences, 3, 147–151. doi:10.1016/j.cobeha.2015.04.006
McElreath, M. B., Boesch, C., Kuehl, H., & McElreath, R. (2018). Complex dynamics from simple cognition:
The primary ratchet effect in animal culture. Evolutionary Behavioral Sciences, 12(3), 191.
McElreath, R., Bell, A. V., Efferson, C., Lubell, M., Richerson, P. J., & Waring, T. (2008). Beyond existence
and aiming outside the laboratory: Estimating frequency-dependent and pay-off-biased social
learning strategies. Philosophical Transactions of the Royal Society B: Biological Sciences, 363, 3515–
3528.
McElreath, R., Boyd, R., & Richerson, P. J. (2003). Shared norms and the evolution of ethnic markers.
Current Anthropology, 44(1), 122–130.
McGraw, K. O., & Wong, S. P. (1996). Forming inferences about some intraclass correlation coefficients.
Psychological Methods, 1(1), 30–46. doi:10.1037/1082-989X.1.1.30
McKenzie-Mohr, D. (2000). Promoting sustainable behavior: An introduction to community-based social
marketing. Journal of Social Issues, 56(3), 543–554.
McLaren, L., & Godley, J. (2009). Social class and BMI among Canadian adults: A focus on occupational
prestige. Obesity, 17(2), 290–299.
Mead, G. H. (1934). Mind, self and society. University of Chicago Press.
Merton, R. K. (1949). Social theory and social structure. New York: Free Press.
Mesoudi, A. (2007). Biological and cultural evolution: Similar but different. Biological Theory, 2(2), 119–123.

140
Mesoudi, A. (2008). An experimental simulation of the “copy-successful-individuals” cultural learning
strategy: Adaptive landscapes, producer–scrounger dynamics, and informational access costs.
Evolution and Human Behavior, 29(5), 350–363. doi:10.1016/j.evolhumbehav.2008.04.005
Mesoudi, A., Chang, L., Dall, S. R. X., & Thornton, A. (2016). The evolution of individual and cultural
variation in social learning. Trends in Ecology & Evolution, 31(3), 215–225.
doi:10.1016/j.tree.2015.12.012
Mesoudi, A., Chang, L., Murray, K., & Lu, H. J. (2015). Higher frequency of social learning in China than in
the West shows cultural variation in the dynamics of cultural evolution. Proceedings of the Royal
Society B: Biological Sciences, 282(1798), 20142209.
Mesoudi, A., Magid, K., & Hussain, D. (2016). How do people become WEIRD? Migration reveals the
cultural transmission mechanisms underlying variation in psychological processes. PLOS ONE,
11(1), e0147162.
Mesoudi, A., & Whiten, A. (2008). The multiple roles of cultural transmission experiments in
understanding human cultural evolution. Philosophical Transactions of the Royal Society B:
Biological Sciences, 363(1509), 3489–3501.
Mesoudi, A., Whiten, A., & Dunbar, R. (2006). A bias for social information in human cultural
transmission. British Journal of Psychology, 97(3), 405–423. doi:10.1348/000712605X85871
Mesoudi, A., Whiten, A., & Laland, K. N. (2004). Is human cultural evolution Darwinian? Evidence
reviewed from the perspective of The Origin of Species. Evolution, 58(1), 1–11.
Mesoudi, A., Whiten, A., & Laland, K. N. (2006). Towards a unified science of cultural evolution. Behavioral
and Brain Sciences, 29(4), 329–346.
Miller, N. E., & Dollard, J. (1941). Social learning and imitation. Yale Univ. Press.
Milroy, J. (Ed.). (2007). The ideology of the standard language. In The Routledge companion to
sociolinguistics (pp. 133–139). New York: Routledge.
Milroy, J., & Milroy, L. (1999). Authority in language: Investigating standard English. Psychology Press.
Milroy, L. (2000). Britain and the United States: Two nations divided by the same language (and different
language ideologies). Journal of Linguistic Anthropology, 10(1), 56–89. doi:10.1525/jlin.2000.10.1.56

141
Miton, H., & Charbonneau, M. (2018). Cumulative culture in the laboratory: Methodological and theoretical
challenges. Proceedings of the Royal Society B: Biological Sciences, 285(1879), 20180677.
doi:10.1098/rspb.2018.0677
Miu, E., Gulley, N., Laland, K. N., & Rendell, L. (2018). Innovation and cumulative culture through tweaks
and leaps in online programming contests. Nature Communications, 9.
Montgomery, J. W., Polunenko, A., & Marinellie, S. A. (2009). Role of working memory in children’s
understanding spoken narrative: A preliminary investigation. Applied Psycholinguistics, 30(03),
485. doi:10.1017/S0142716409090249
Moreno, J. L. (1934). Who shall survive?: A new approach to the problem of human interrelations.
Washington, DC: Nervous and Mental Disease Publishing Co.
Morgan, L. H. (1877). Ancient society; or, Researches in the lines of human progress from savagery through
barbarism to civilization. Henry Holt.
Morgan, T. J. H., Rendell, L., Ehn, M., Hoppitt, W. J. E., & Laland, K. N. (2012). The evolutionary basis of
human social learning. Proceedings of the Royal Society B: Biological Sciences, 279(1729), 653–662.
Morin, O. (2016a). How traditions live and die. Oxford University Press.
Morin, O. (2016b). Reasons to be fussy about cultural evolution. Biology & Philosophy, 31(3), 447–458.
Mulac, A. (1975). Evaluation of the speech dialect attitudinal scale. Speech Monographs, 42(3), 184–189.
doi:10.1080/03637757509375893
Mulac, A. (1976). Assessment and application of the Revised Speech Dialect Attitudinal Scale.
Communication Monographs, 43(3), 238. doi:10.1080/03637757609375935
Murdock, G. P. (1961). Outline of cultural materials (Vol. 4th). New Haven: Human Relations Area Files.
Murdock, G. P. (1967). Ethnographic atlas: A summary. Ethnology, 6(2), 109–236.
Murdock, G. P., & White, D. R. (1969). Standard cross-cultural sample. Ethnology, 8(4), 329–369.
Muthukrishna, M., Morgan, T. J. H., & Henrich, J. (2016). The when and who of social learning and
conformist transmission. Evolution and Human Behavior, 37(1), 10–20.
Myers, M. D., & Tan, F. B. (2002). Beyond models of national culture in information systems research. In
Human factors in information systems (pp. 1–19). IGI Global.

142
Nairne, J. S., & Pandeirada, J. N. (2010). Adaptive memory: Ancestral priorities and the mnemonic value of
survival processing. Cognitive Psychology, 61(1), 1–22.
Nairne, J. S., Thompson, S. R., & Pandeirada, J. N. (2007). Adaptive memory: Survival processing enhances
retention. Journal of Experimental Psychology, 33(2), 263.
Nakagawa, S., & Freckleton, R. P. (2011). Model averaging, missing data and multiple imputation: A case
study for behavioural ecology. Behavioral Ecology and Sociobiology, 65(1), 103–116.
doi:10.1007/s00265-010-1044-7
Nakao, K., & Treas, J. (1992). The 1989 socioeconomic index of occupations: Construction from the 1989
occupational prestige scores. Chicago: National Opinion Research Center.
Nash, R. (1990). Bourdieu on education and social and cultural reproduction. British Journal of Sociology of
Education, 11(4), 431–447.
Nielsen, M., Haun, D., Kärtner, J., & Legare, C. H. (2017). The persistent sampling bias in developmental
psychology: A call to action. Journal of Experimental Child Psychology, 162, 31–38.
Norenzayan, A., & Atran, S. (2004). Cognitive and emotional processes in the cultural transmission of
natural and nonnatural beliefs. In The psychological foundations of culture (pp. 149–169).
Psychology Press.
Norenzayan, A., Atran, S., Faulkner, J., & Schaller, M. (2006). Memory and mystery: The cultural selection
of minimally counterintuitive narratives. Cognitive Science, 30(3), 531–553.
Norrick, N. R. (1997). Twice-told tales: Collaborative narration of familiar stories. Language in Society,
26(02), 199–220. doi:10.1017/S004740450002090X
Norrick, N. R. (2007). Conversational storytelling. In The Cambridge companion to narrative (pp. 127–141).
Nunn, P. D., & Reid, N. J. (2016). Aboriginal memories of inundation of the Australian coast dating from
more than 7000 years ago. Australian Geographer, 47(1), 11–47. doi:10.1080/00049182.2015.1077539
Nunnally, J. C. (1978). Psychometric theory (2nd ed.). New York: McGraw-Hill.
Oberski, D. L. (2014). lavaan.survey: An R package for complex survey analysis of structural equation
models. Journal of Statistical Software, 57(1), 1–27. doi:10.18637/jss.v057.i01

143
O’Brien, M. J., Lyman, R. L., Mesoudi, A., & VanPool, T. L. (2010). Cultural traits as units of analysis.
Philosophical Transactions of the Royal Society B: Biological Sciences, 365(1559), 3797.
Office for National Statistics, & Nomis. (2011a). KS201UK: Ethnic group. 2011 UK Census.
https://www.nomisweb.co.uk/. Accessed 20 September 2017
Office for National Statistics, & Nomis. (2011b). QS501UK: Highest level of qualification. 2011 UK Census.
https://www.nomisweb.co.uk/. Accessed 7 December 2017
Ohlsen, G., van Zoest, W., & van Vugt, M. (2013). Gender and facial dominance in gaze cuing: Emotional
context matters in the eyes that we follow. PLOS ONE, 8(4), e59471.
O’Neill, B. (2006). Nuclear weapons and national prestige. Cowles Foundation Discussion Paper No. 1560.
Ostrom, E. (2005). Understanding institutional diversity. Princeton University Press.
Ostrom, E. (2007). A diagnostic approach for going beyond panaceas. Proceedings of the National Academy
of Sciences, 104(39), 15181–15187.
Ostrom, E., Janssen, M. A., & Anderies, J. M. (2007). Going beyond panaceas. Proceedings of the National
Academy of Sciences, 104(39), 15176–15178.
Otgaar, H., & Smeets, T. (2010). Adaptive memory: Survival processing increases both true and false
memory in adults and children. Journal of Experimental Psychology, 36(4), 1010.
Outhwaite, W. (Ed.). (2003). The Blackwell dictionary of modern social thought (2nd ed.). Malden, MA:
Blackwell Publishers.
Parsons, T. (1977). Social systems and the evolution of action theory. New York: Free Press.
Parsons, T., & Smelser, N. J. (1956). Economy and society. London: Routledge & Kegan Paul.
Perrow, C. (1961). Organizational prestige: Some functions and dysfunctions. American Journal of Sociology,
66(4), 335–341.
Perry, S. (2009). Are nonhuman primates likely to exhibit cultural capacities like those of humans? In K. N.
Laland & B. G. Galef, Jr. (Eds.), The question of animal culture (pp. 247–268). Harvard University
Press.
Perusse, D. (1993). Cultural and reproductive success in industrial societies: Testing the relationship at the
proximate and ultimate levels. Behavioral and Brain Sciences, 16(2), 267–283.

144
Piquemal, N. (2003). From Native North American oral traditions to Western literacy: Storytelling in
education. Alberta Journal of Educational Research, 49(2), 113–122.
Plourde, A. M. (2009). Prestige goods and the formation of political hierarchy: A costly signaling model. In
S. Shennan (Ed.), Pattern and process in cultural evolution (pp. 265–276). Univ of California Press.
Powell, B., & Jacobs, J. A. (1984). The prestige gap: Differential evaluations of male and female workers.
Work and Occupations, 11(3), 283–308.
Price, M. E., & van Vugt, M. (2014). The evolution of leader-follower reciprocity: The theory of service-for-
prestige. Frontiers in Human Neuroscience, 8, 363. doi:10.3389/fnhum.2014.00363
Putnick, D. L., & Bornstein, M. H. (2016). Measurement invariance conventions and reporting: The state of
the art and future directions for psychological research. Developmental Review, 41, 71–90.
doi:10.1016/j.dr.2016.06.004
Quinlan, M. (2005). Considerations for collecting freelists in the field: Examples from ethobotany. Field
Methods, 17(3), 219–234. doi:10.1177/1525822X05277460
R Core Team. (2018). R: A language and environment for statistical computing. Vienna, Austria: R
Foundation for Statistical Computing (https://www.R-project.org/). https://www.R-project.org/
Redpath, S. M., Young, J., Evely, A., Adams, W. M., Sutherland, W. J., Whitehouse, A., et al. (2013).
Understanding and managing conservation conflicts. Trends in Ecology & Evolution, 28(2), 100–
109. doi:10.1016/j.tree.2012.08.021
Rendell, L., Boyd, R., Cownden, D., Enquist, M., Eriksson, K., Feldman, M. W., et al. (2010). Why copy
others? Insights from the social learning strategies tournament. Science, 328, 208–213.
doi:10.1126/science.1184719
Rendell, L., Fogarty, L., Hoppitt, W. J. E., Morgan, T. J. H., Webster, M. M., & Laland, K. N. (2011). Cognitive
culture: Theoretical and empirical insights into social learning strategies. Trends in Cognitive
Sciences, 15(2), 68–76.
Rendell, L., Fogarty, L., & Laland, K. N. (2009). Rogers’ paradox recast and resolved: Population structure
and the evolution of social learning strategies. Evolution, 64(2), 534–548.

145
Revelle, W., & Zinbarg, R. E. (2009). Coefficients alpha, beta, omega, and the glb: Comments on Sijtsma.
Psychometrika, 74(1), 145–154. doi:10.1007/s11336-008-9102-z
Reyes-García, V., Broesch, J., Calvet-Mir, L., Fuentes-Peláez, N., McDade, T. W., Parsa, S., et al. (2009).
Cultural transmission of ethnobotanical knowledge and skills: An empirical analysis from an
Amerindian society. Evolution and Human Behavior, 30(4), 274–285.
Reyes-García, V., Molina, J. L., Broesch, J., Calvet, L., Huanca, T., Saus, J., et al. (2008). Do the aged and
knowledgeable men enjoy more prestige? A test of predictions from the prestige-bias model of
cultural transmission. Evolution and Human Behavior, 29(4), 275–281.
doi:10.1016/j.evolhumbehav.2008.02.002
Rhemtulla, M., Brosseau-Liard, P. É., & Savalei, V. (2012). When can categorical variables be treated as
continuous? A comparison of robust continuous and categorical SEM estimation methods under
suboptimal conditions. Psychological Methods, 17(3), 354. doi:10.1037/a0029315
Rhoads, J. K. (2010). Critical issues in social theory. University Park, PA: Penn State Press.
Richerson, P., Baldini, R., Bell, A., Demps, K., Frost, K., Hillis, V., et al. (2015). Cultural group selection plays
an essential role in explaining human cooperation: A sketch of the evidence. Behavioral and Brain
Sciences, 1–71.
Richerson, P. J., & Boyd, R. (2005). Not by genes alone: How culture transformed human evolution.
University of Chicago Press.
Riesch, R., Ford, J. K. B., & Thomsen, F. (2006). Stability and group specificity of stereotyped whistles in
resident killer whales, Orcinus orca, off British Columbia. Animal Behaviour, 71(1), 79–91.
Rivas-Drake, D., Hughes, D., & Way, N. (2009). A preliminary analysis of associations among ethnic–racial
socialization, ethnic discrimination, and ethnic identity among urban sixth graders. Journal of
Research on Adolescence, 19(3), 558–584.
Rivkin, J., & Ryan, M. (Eds.). (2004). Literary theory: An anthology (2nd ed.). Malden, MA: Blackwell Pub.
Roberts, A., Palermo, R., & Visser, T. A. (2019). Effects of dominance and prestige based social status on
competition for attentional resources. Scientific Reports, 9(1), 2473.
Rogers, A. R. (1988). Does biology constrain culture? American Anthropologist, 90(4), 819–831.

146
Royston, J. P. (1982). An extension of Shapiro and Wilk’s W test for normality to large samples. Applied
Statistics, 31(2), 115–124. doi:10.2307/2347973
Royston, J. P. (1983). Some techniques for assessing multivarate normality based on the Shapiro-Wilk W.
Applied Statistics, 32(2), 121–133. doi:10.2307/2347291
Ruscio, J., & Roche, B. (2012). Determining the number of factors to retain in an exploratory factor analysis
using comparison data of known factorial structure. Psychological Assessment, 24(2), 282.
doi:10.1037/a0025697
Ryan, S. (2006). The role of culture in conservation planning for small or endangered populations.
Conservation Biology, 20(4), 1321–1324.
Samarasinghe, A. N., Berl, R. E. W., Gavin, M. C., & Jordan, F. M. ([in prep.]). Prestige-accent study [Title
TBD].
Sasaki, T., & Biro, D. (2017). Cumulative culture can emerge from collective intelligence in animal groups.
Nature Communications, 8, 15049. doi:10.1038/ncomms15049
Satorra, A., & Bentler, P. M. (1994). Corrections to test statistics and standard errors in covariance structure
analysis. In A. von Eye & C. C. Clogg (Eds.), Latent variables analysis: Applications to developmental
research (pp. 399–419). Thousand Oaks, CA: SAGE Publications, Inc.
Savalei, V. (2011). What to do about zero frequency cells when estimating polychoric correlations.
Structural Equation Modeling, 18(2), 253–273. doi:10.1080/10705511.2011.557339
Scalise Sugiyama, M. (1996). On the origins of narrative: Storyteller bias as a fitness-enhancing strategy.
Human Nature, 7(4), 403–425.
Schillinger, K., Mesoudi, A., & Lycett, S. J. (2015). The impact of imitative versus emulative learning
mechanisms on artifactual variation: Implications for the evolution of material culture. Evolution
and Human Behavior, 36(6), 446–455. doi:10.1016/j.evolhumbehav.2015.04.003
Schriesheim, C. A., & Hill, K. D. (1981). Controlling acquiescence response bias by item reversals: The effect
on questionnaire validity. Educational and Psychological Measurement, 41(4), 1101–1114.
doi:10.1177/001316448104100420

147
Schultz, P. (2002). Environmental attitudes and behaviors across cultures. Online Readings in Psychology
and Culture, 8(1), 4.
Schultz, P. W. (2011). Conservation means behavior. Conservation Biology, 25(6), 1080–1083.
doi:10.1111/j.1523-1739.2011.01766.x
Schwartz, T., & Mead, M. (1961). Micro- and macro-cultural models for cultural evolution. Anthropological
Linguistics, 3(1), 1–7.
Seligson, M. A. (1977). Prestige among peasants: A multidimensional analysis of preference data. American
Journal of Sociology, 83(3), 632–652. doi:10.1086/226597
Sewell, W. H., Haller, A. O., & Portes, A. (1969). The educational and early occupational attainment process.
American Sociological Review, 34(1), 82–92. doi:10.2307/2092789
Shackleton, R. G. (2007). Phonetic variation in the traditional English dialects: A computational analysis.
Journal of English Linguistics, 35(1), 30–102. doi:10.1177/0075424206297857
Shenkar, O., & Yuchtman-Yaar, E. (1997). Reputation, image, prestige, and goodwill: An interdisciplinary
approach to organizational standing. Human Relations, 50(11), 1361–1381.
doi:10.1177/001872679705001102
Skrondal, A., & Rabe-Hesketh, S. (2009). Prediction in multilevel generalized linear models. Journal of the
Royal Statistical Society: Series A, 172(3), 659–687. doi:10.1111/j.1467-985X.2009.00587.x
Smidts, A., Pruyn, A. T. H., & van Riel, C. B. M. (2001). The impact of employee communication and
perceived external prestige on organizational identification. Academy of Management Journal,
44(5), 1051–1062. doi:10.2307/3069448
Smith, D., Schlaepfer, P., Major, K., Dyble, M., Page, A. E., Thompson, J., et al. (2017). Cooperation and the
evolution of hunter-gatherer storytelling. Nature Communications, 8(1). doi:10.1038/s41467-017-
02036-8
Smith, E. A. (2004). Why do good hunters have higher reproductive success? Human Nature, 15(4), 343–
364. doi:10.1007/s12110-004-1013-9

148
Smith, J. E., Gavrilets, S., Mulder, M. B., Hooper, P. L., El Mouden, C., Nettle, D., et al. (2016). Leadership in
mammalian societies: Emergence, distribution, power, and payoff. Trends in Ecology & Evolution,
31(1), 54–66.
Smith, J. J., & Borgatti, S. P. (1997). Salience counts-and so does accuracy: Correcting and updating a
measure for free-list-item salience. Journal of Linguistic Anthropology, 7, 208–209.
doi:10.1525/jlin.1997.7.2.208
Sperber, D. (1996). Explaining culture: A naturalistic approach. Oxford: Blackwell Publishers Ltd.
Steenkamp, J. B. E., Batra, R., & Alden, D. L. (2003). How perceived brand globalness creates brand value.
Journal of International Business Studies, 34(1), 53–65. doi:10.1057/palgrave.jibs.8400002
Stewart, M. A., Ryan, E. B., & Giles, H. (1985). Accent and social class effects on status and solidarity
evaluations. Personality and Social Psychology Bulletin, 11(1), 98–105.
Stone, G., Joseph, M., & Jones, M. (2003). An exploratory study on the use of sports celebrities in
advertising: A content analysis. Sport Marketing Quarterly, 12(2).
Strimling, P., Enquist, M., & Eriksson, K. (2009). Repeated learning makes cultural evolution unique.
Proceedings of the National Academy of Sciences, 106(33), 13870–13874.
doi:10.1073/pnas.0903180106
Struthers, R., Eschiti, V. S., & Patchell, B. (2004). Traditional indigenous healing: Part I. Complementary
Therapies in Nursing and Midwifery, 10(3), 141–149.
Stubbersfield, J. M., & Tehrani, J. (2013). Expect the unexpected? Testing for minimally counterintuitive
(MCI) bias in the transmission of contemporary legends: A computational phylogenetic approach.
Social Science Computer Review, 31(1), 90–102.
Stubbersfield, J. M., Tehrani, J. J., & Flynn, E. G. (2014). Serial killers, spiders and cybersex: Social and
survival information bias in the transmission of urban legends. British Journal of Psychology, 288–
307. doi:10.1111/bjop.12073
Stubbersfield, J. M., Tehrani, J. J., & Flynn, E. G. (2015). Serial killers, spiders and cybersex: Social and
survival information bias in the transmission of urban legends. British Journal of Psychology, 288–
307. doi:10.1111/bjop.12073

149
Stubbersfield, J. M., Tehrani, J. J., & Flynn, E. G. (2017). Chicken tumours and a fishy revenge: Evidence for
emotional content bias in the cumulative recall of urban legends. Journal of Cognition and Culture,
17(1–2), 12–26.
Svalastoga, K. (1959). Prestige, class, and mobility. Scandinavian University Books.
Tabachnick, B. G., Fidell, L. S., & Osterlind, S. J. (2001). Using multivariate statistics. Allyn & Bacon/Pearson
Education.
Tang, R., & Gavin, M. C. (2016). A classification of threats to traditional ecological knowledge and
conservation responses. Conservation and Society, 14(1), 57.
Taylor, P. D., & Jonker, L. B. (1978). Evolutionary stable strategies and game dynamics. Mathematical
Biosciences, 40(1–2), 145–156.
Teel, T. L., Dietsch, A. M., & Manfredo, M. J. (2015). A (social) psychology approach in conservation. In The
conservation social sciences: What?, How? and Why? (pp. 21–25). Vancouver, BC: Canadian Wildlife
Federation and Institute for Resources, Environment and Sustainability, University of British
Columbia.
Tehrani, J. J., & d’Huy, J. (2017). Phylogenetics meets folklore: Bioinformatics approaches to the study of
international folktales. In Maths meets myths: Quantitative approaches to ancient narratives (pp.
91–114). Springer.
Tennie, C., Call, J., & Tomasello, M. (2009). Ratcheting up the ratchet: On the evolution of cumulative
culture. Philosophical Transactions of the Royal Society B: Biological Sciences, 364(1528), 2405.
Thompson, B., Kirby, S., & Smith, K. (2016). Culture shapes the evolution of cognition. Proceedings of the
National Academy of Sciences, 113(16), 4530–4535. doi:10.1073/pnas.1523631113
Thorndyke, P. W. (1977). Cognitive structures in comprehension and memory of narrative discourse.
Cognitive Psychology, 9, 77–110.
Tomasello, M., Kruger, A. C., & Ratner, H. H. (1993). Cultural learning. Behavioral and Brain Sciences, 4, 101–
143.

150
Tooby, J., & Cosmides, L. (2008). The evolutionary psychology of the emotions and their relationship to
internal regulatory variables. In M. Lewis, J. M. Haviland-Jones, & L. F. Barrett (Eds.), Handbook of
emotions (3rd ed., pp. 114–137). New York: Guilford Press.
Touhey, J. C. (1974). Effects of additional women professionals on ratings of occupational prestige and
desirability. Journal of Personality and Social Psychology, 29(1), 86.
Treiman, D. J. (1977). Occupational prestige in comparative perspective. New York: Academic Press.
Trudgill, P. (1972). Sex, covert prestige and linguistic change in the urban British English of Norwich.
Language in Society, 1(2), 179–195.
Truskanov, N., & Prat, Y. (2018). Cultural transmission in an ever-changing world: Trial-and-error copying
may be more robust than precise imitation. Philosophical Transactions of the Royal Society B:
Biological Sciences, 373(1743), 20170050. doi:10.1098/rstb.2017.0050
Tukey, J. W. (1977). Exploratory data analysis. Reading, MA: Addison-Wesley.
Turner, A., & Greene, E. (1977). The construction and use of a propositional text base. Institute for the Study
of Intellectual Behavior, University of Colorado Boulder, Colorado.
Turner, R. H. (1978). The role and the person. American journal of Sociology, 84(1), 1–23.
Tylor, E. B. (1871). Primitive culture: Researches into the development of mythology, philosophy, religion, art,
and custom (Vol. 1). London: John Murray.
United States Census Bureau, & American FactFinder. (2010). P2: Urban and rural. 2010 US Census.
https://factfinder.census.gov/. Accessed 20 September 2017
United States Census Bureau, & American FactFinder. (2016a). B02001: Race. 2012-2016 American
Community Survey. https://factfinder.census.gov/. Accessed 7 December 2017
United States Census Bureau, & American FactFinder. (2016b). S1501: Educational attainment. 2012-2016
American Community Survey. https://factfinder.census.gov/. Accessed 7 December 2017
Vansina, J. M. (1985). Oral tradition as history. Univ of Wisconsin Press.
Vaske, J. J., & Donnelly, M. P. (1999). A value-attitude-behavior model predicting wildland preservation
voting intentions. Society & Natural Resources, 12(6), 523–537.

151
Vidal, C., Content, A., & Chetail, F. (2017). BACS: The Brussels Artificial Character Sets for studies in
cognitive psychology and neuroscience. Behavior Research Methods, 49(6), 2093–2112.
Vigneron, F., & Johnson, L. W. (1999). A review and a conceptual framework of prestige-seeking consumer
behavior. Academy of Marketing Science Review, 1(1), 1–15.
Vigneron, F., & Johnson, L. W. (2004). Measuring perceptions of brand luxury. Journal of Brand
Management, 11(6), 484–506. doi:10.1057/palgrave.bm.2540194
von Rueden, C., Gurven, M., & Kaplan, H. (2008). The multiple dimensions of male social status in an
Amazonian society. Evolution and Human Behavior, 29(6), 402–415.
doi:10.1016/j.evolhumbehav.2008.05.001
von Rueden, C., Gurven, M., & Kaplan, H. (2010). Why do men seek status? Fitness payoffs to dominance
and prestige. Proceedings of the Royal Society B-Biological Sciences, 278(1715), 2223–2232.
doi:10.1098/rspb.2010.2145
von Rueden, C. R., & Jaeggi, A. V. (2016). Men’s status and reproductive success in 33 nonindustrial
societies: Effects of subsistence, marriage system, and reproductive strategy. Proceedings of the
National Academy of Sciences, 113(39), 10824–10829.
Voorhees, C. M., Brady, M. K., Calantone, R., & Ramirez, E. (2016). Discriminant validity testing in
marketing: An analysis, causes for concern, and proposed remedies. Journal of the Academy of
Marketing Science, 44(1), 119–134. doi:10.1007/s11747-015-0455-4
Ward, C. M., Rogers, C. S., Van Engen, K. J., & Peelle, J. E. (2016). Effects of age, acoustic challenge, and
verbal working memory on recall of narrative speech. Experimental Aging Research, 42(1), 97–111.
doi:10.1080/0361073X.2016.1108785
Waugh, L. R. (1980). The poetic function in the theory of Roman Jakobson. Poetics Today, 2(1a), 57–82.
doi:10.2307/1772352
Weber, M. (1922). Wirtschaft und gesellschaft: Grundriss der verstehenden soziologie. (M. Weber, Ed.).
Tübingen: Mohr Siebeck.
Weber, M. (1946). From Max Weber: Essays in sociology. (H. H. Gerth & C. W. Mills, Eds. & Trans.). New
York: Oxford University Press.

152
Wegener, B. (1992). Concepts and measurement of prestige. Annual Review of Sociology, 18, 253–280.
doi:10.1146/annurev.so.18.080192.001345
Weller, S. C. (2015). Structured interviewing and questionnaire construction. In H. R. Bernard & C. C.
Gravlee (Eds.), Handbook of methods in cultural anthropology (2nd ed., pp. 343–390). Rowman &
Littlefield.
Wells, J. C. (1982). Accents of English. Cambridge University Press.
West, S. G., Finch, J. F., & Curran, P. J. (1995). Structural equation models with nonnormal variables:
Problems and remedies. In R. H. Hoyle (Ed.), Structural equation modeling: Concepts, issues, and
applications (pp. 56–75). Thousand Oaks, CA: Sage Publications.
White, M., White, M. K., Wijaya, M., & Epston, D. (1990). Narrative means to therapeutic ends. WW Norton
& Company.
Whitehead, H. (2010). Conserving and managing animals that learn socially and share cultures. Learning &
Behavior, 38(3), 329–336.
Whitehead, H., Rendell, L., Osborne, R. W., & Wursig, B. (2004). Culture and conservation of non-humans
with reference to whales and dolphins: Review and new directions. Biological Conservation, 120(3),
427–437.
Whiten, A. (2017). A second inheritance system: The extension of biology through culture. Interface Focus,
7(5), 20160142. doi:10.1098/rsfs.2016.0142
Whiten, A., Hinde, R. A., Laland, K. N., & Stringer, C. B. (2011). Culture evolves. Philosophical Transactions
of the Royal Society B: Biological Sciences, 366, 938–948.
Whiten, A., McGuigan, N., Marshall-Pescini, S., & Hopper, L. M. (2009). Emulation, imitation, over-
imitation and the scope of culture for child and chimpanzee. Philosophical Transactions of the
Royal Society B: Biological Sciences, 364, 2417–2428. doi:10.1098/rstb.2009.0069
Whittaker, D., & Knight, R. L. (1998). Understanding wildlife responses to humans. Wildlife Society Bulletin,
26, 312–317.
Wilkinson, A., Kuenstner, K., Mueller, J., & Huber, L. (2010). Social learning in a non-social reptile
(Geochelone carbonaria). Biology Letters, 6(5), 614–616.

153
Wood, L. A., Kendal, R. L., & Flynn, E. G. (2013). Whom do children copy? Model-based biases in social
learning. Developmental Review, 33(4), 341–356.
Wood, S. (2013). Prestige in world politics: History, theory, expression. International Politics, 50(3), 387–411.
Yu, C.-Y. (2002). Evaluating cutoff criteria of model fit indices for latent variable models with binary and
continuous outcomes. University of California, Los Angeles.
Zahn, C. J., & Hopper, R. (1985). Measuring language attitudes: The Speech Evaluation Instrument. Journal
of Language and Social Psychology, 4(2), 113–123. doi:10.1177/0261927X8500400203
Zhou, X. (2005). The institutional logic of occupational prestige ranking: Reconceptualization and
reanalyses. American Journal of Sociology, 111(1), 90–140.
Zwirner, E., & Thornton, A. (2015). Cognitive requirements of cumulative culture: Teaching is useful but not
essential. Scientific Reports, 5, 16781. doi:10.1038/srep16781

154
APPENDIX 1. ETHNOGRAPHIC DATA FOR SOCIETIES IN
A UNIFIED FRAMEWORK OF PRESTIGE: BRIDGING CONCEPTS FROM
THEORY, EXPERIMENT, AND CROSS-CULTURAL RESEARCH
OWC EA SCCS eHRAF Name EA Date
SCCS
Date Language Family
Number of
Matching
Documents
Number of
Matching
Paragraphs
AA01 Ed01 116 Korea 1950 1947 Language isolate 27 187
AW42 Ef01 62 Santal 1940 1940 Austro-Asiatic 8 36
AZ02 Eh01 79 Andamans 1870 1860 Great Andamanese 2 2
EP04 Cg04 52 Saami 1950 1950 Uralic 12 62
FE12 Af03 19 Akan 1900 1895 Niger-Congo, Atlantic-Congo 18 111
FF57 Ah03 16 Tiv 1920 1920 Niger-Congo, Atlantic-Congo 15 179
FK07 Ad07 12 Ganda 1880 1875 Niger-Congo, Atlantic-Congo 21 100
FL12 Aj02 34 Maasai 1900 1900 Nilo-Saharan, Eastern Sudanic 5 26
FO04 Aa05 13 Mbuti 1930 1950 Nilo-Saharan, Central Sudanic 4 9
FQ05 Ac03 7 Bemba 1900 1897 Niger-Congo, Atlantic-Congo 7 29
FQ09 Ab03 4 Lozi 1890 1900 Niger-Congo, Atlantic-Congo 6 23
MO04 Ca02 36 Somali 1950 1900 Afro-Asiatic 13 102
MP05 Ca07 37 Amhara 1950 1953 Afro-Asiatic 10 118
MS12 Cb26 26 Hausa 1950 1900 Afro-Asiatic 16 210
MS30 Cb02 21 Wolof 1950 1950 Niger-Congo, Atlantic-Congo 19 72
ND08 Na03 124 Copper Inuit 1920 1915 Eskimo-Aleut 6 14
NG06 Na33 127 Ojibwa 1870 1930 Algic 18 113
NQ18 Nf06 142 Pawnee 1867 1867 Caddoan 8 13
NR10 Nc08 138 Klamath 1860 1860 Language isolate 7 30
OA19 Ia03 112 Ifugao 1920 1910 Austronesian 12 120

155
OWC EA SCCS eHRAF Name EA Date
SCCS
Date Language Family
Number of
Matching
Documents
Number of
Matching
Paragraphs
OC06 Ib01 85 Iban 1950 1950 Austronesian 21 202
OG11 Ic05 87 Eastern Toraja 1910 1910 Austronesian 3 7
OI08 Id01 91 Aranda 1900 1896 Pama-Nyungan 5 8
OJ29 Ie01 94 Kapauku 1950 1955 Trans-New Guinea 8 86
OL06 Ig02 98 Trobriands 1910 1914 Austronesian 33 135
OR19 If02 109 Chuuk 1940 1947 Austronesian 14 44
OT11 Ii02 100 Tikopia 1930 1930 Austronesian 13 78
RY02 Ec03 121 Chukchee 1900 1900 Chukotko-Kamchatkan 1 1
SB05 Sa01 158 Kuna 1940 1927 Chibchan 9 89
SF05 Sf02 172 Aymara 1940 1940 Aymaran 8 71
SQ18 Sd09 163 Yanoama 1965 1965 Yanomaman 4 9
SQ19 Se05 167 Tukano 1940 1939 Tucanoan 10 91
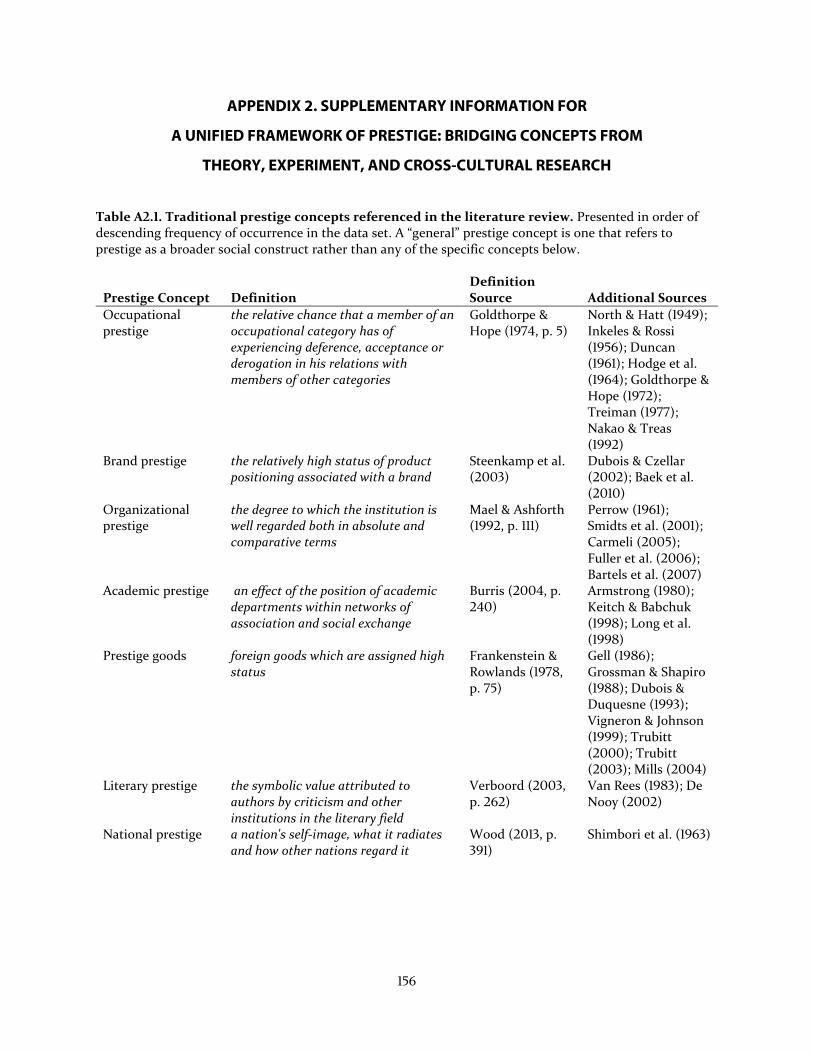
156
APPENDIX 2. SUPPLEMENTARY INFORMATION FOR
A UNIFIED FRAMEWORK OF PRESTIGE: BRIDGING CONCEPTS FROM
THEORY, EXPERIMENT, AND CROSS-CULTURAL RESEARCH
Table A2.1. Traditional prestige concepts referenced in the literature review. Presented in order of descending frequency of occurrence in the data set. A “general” prestige concept is one that refers to prestige as a broader social construct rather than any of the specific concepts below.
Prestige Concept Definition
Definition Source Additional Sources
Occupational prestige
the relative chance that a member of an occupational category has of experiencing deference, acceptance or derogation in his relations with members of other categories
Goldthorpe & Hope (1974, p. 5)
North & Hatt (1949); Inkeles & Rossi (1956); Duncan (1961); Hodge et al. (1964); Goldthorpe & Hope (1972); Treiman (1977); Nakao & Treas (1992)
Brand prestige the relatively high status of product positioning associated with a brand
Steenkamp et al. (2003)
Dubois & Czellar (2002); Baek et al. (2010)
Organizational prestige
the degree to which the institution is well regarded both in absolute and comparative terms
Mael & Ashforth (1992, p. 111)
Perrow (1961); Smidts et al. (2001); Carmeli (2005); Fuller et al. (2006); Bartels et al. (2007)
Academic prestige an effect of the position of academic departments within networks of association and social exchange
Burris (2004, p. 240)
Armstrong (1980); Keitch & Babchuk (1998); Long et al. (1998)
Prestige goods foreign goods which are assigned high status
Frankenstein & Rowlands (1978, p. 75)
Gell (1986); Grossman & Shapiro (1988); Dubois & Duquesne (1993); Vigneron & Johnson (1999); Trubitt (2000); Trubitt (2003); Mills (2004)
Literary prestige the symbolic value attributed to authors by criticism and other institutions in the literary field
Verboord (2003, p. 262)
Van Rees (1983); De Nooy (2002)
National prestige a nation's self-image, what it radiates and how other nations regard it
Wood (2013, p. 391)
Shimbori et al. (1963)

157
Prestige Concept Definition Definition Source Additional Sources
Prestige bias the tendency to learn from and imitate the most highly skilled and competent (i.e., prestigious) individuals in one’s social group
Cheng et al. (2013, p. 104)
Boyd & Richerson (1985); Henrich & Gil-White (2001)
Network prestige visibility based on the extensive relations directed at them
Knoke & Burt (1983)
Russo & Koesten (2005); Rusinowska et al. (2011)
Linguistic prestige the social evaluations that speakers attach to a language rather than to the characteristics of the language system as such
Sairio & Palander-Collin (2012, p. 626)
Labov (1964); Labov (1966); Giles (1970); Labov (1972); Trudgill (1972); Kroch (1978); Kahane (1986); Ibrahim (1986); Gordon (1997)

158
Figure A2.1. Accumulation curve of unique prestige determinant and consequence terms, following grouping by synonyms, by number of studies. Expected (mean) values and 95% confidence intervals are depicted.

159
Table A2.2. Most frequent terms for prestige determinants and consequences in literature review, by level of social structure (A) and stages in social role processes (B).
DETERMINANTS CONSEQUENCES
Level Term Count Level Term Count
Environmental place 5 Environmental <none> <n/a>
Cultural important 36 Cultural valued 12
valued 33 legitimate 6
quality 32 quality 6
moral 14 important 4
culture 10 culture 3
Institutional educated 50 Institutional powerful 26
occupation 36 employment 14
powerful 36 leader 9
academic 27 politics 9
trained 20 privilege 8
Collective centrality 14 Collective group 4
history 14 secure 4
ethnicity 12 conflict resolution 3
exclusive 10 conformity 2
department 9 Relational influential 42
Relational influential 27 deference 38
well-connected 19 social learning 20
cited 17 imitation 13
network 12 attention 12
associations 10 Individual attractive 31
relationships 10 respected 19
Individual skilled 50 admired 18
knowledgeable 38 self-esteem 18
reputable 38 fitness 15
gender 36 satisfaction 15
respected 34 Symbolic signaling 32
Symbolic income 36 wealthy 16
wealthy 34 profitable 10
expensive 13 income 8
technology 13 funded 6
goods 11
(A)

160
DETERMINANTS CONSEQUENCES
Stage Term Count Stage Term Count
Role status 39 Role status 35
occupation 36 powerful 26
powerful 36 employment 14
authority 22 authority 12
elder 22 image 12
Competence educated 50 Competence signaling 32
skilled 50 committed 9
knowledgeable 38 loyal 8
academic 27 cooperative 5
intelligent 21 proud 5
Products reputable 38 Products influential 42
important 36 deference 38
income 36 social learning 20
respected 34 respected 19
wealthy 34 admired 18
self-esteem 18
(B)

161
Table A2.3. Results of pairwise tests of independence of proportions of terms in each level of social structure or stage in social role processes by society. Shared letters indicate a lack of significant difference between those societies (at alpha = 0.05 level); lack of a shared letter indicates a significant difference in proportions between societies. p-values were adjusted for multiple comparisons to control the false discovery rate using the Benjamini and Hochberg (1995) method.
Determinants Consequences
Level Stage Level Stage
Western ab a n n
Ashanti cdef b nopqr nopqr
Ganda c e g cde o q o q
Tiv h f p p
Iban ij ghij nopqr nopqr
Ifugao i k g no q no q
Tikopia j l a h k nopqr nopq
Trobriands a d l hi o q o q
Trukese ab d f j l g i nopqr nopqr
Mee k j o o
Amhara c bcd k r r
Somali m c kl nopqr nopqr
Zazzagawa Hausa efg de nopqr nopqr
Northern Saulteaux b i nopqr nopqr
Guna g e nopqr nopqr
Koreans m l pq pq

162
Table A2.4. Most frequent terms for prestige determinants in each society of the ethnographic review, by level of social structure (A) and stages in social role processes (B). The environmental level is not depicted, as most societies had no terms under this level. Levels for which there
were no terms that occurred more than once are left blank. If multiple terms were equally at the highest frequency, all are shown. Prestige
consequences are not shown due to sparsity of data.
Western Ashanti Ganda Tiv Iban Ifugao Tikopia Trobriands Trukese Mee
Cultural important culture ceremony resistance
ritual ritual culture tradition ceremony
Institutional educated leader
religion leader marriage leader
marriage
religion leader leader leader religion
Collective centrality
history community warfare warfare language
community
family
kinship
lineage warfare
Relational influential supported associations influential transactions influential
Individual skilled elder
brave
deceptive
performance
generous travel generous generous generous knowledgeable generous
Symbolic income goods landowner animals goods
wealthy wealthy goods signaling
goods
wealthy wealthy
(A)

163
Amhara Somali
Zazzagawa
Hausa
Northern
Saulteaux Guna Koreans
Cultural resistance culture ritual ritual ritual
Institutional religion religion religion medical leader university
Collective lineage lineage lineage language lineage
Relational alliance relationships associations influential
Individual medicine religious religious generous
trapping knowledgeable
famous
knowledgeable
respectful
Symbolic landowner animals titled goods inheritance
(A cont.)

164
Western Ashanti Ganda Tiv Iban Ifugao Tikopia Trobriands Trukese Mee
Role status elder leader ceremony ritual ritual leader leader leader religion
Competence educated
skilled
educated
trading
educated
warfare generous travel generous generous transactions knowledge generous
Products reputable goods animals animals
accomplished
goods
wealthy
wealthy goods wealthy goods
wealthy wealthy
Amhara Somali
Zazzagawa
Hausa
Northern
Saulteaux Guna Koreans
Role religion religion religion medical leader ritual
Competence medicine religious religious generous
trapping
educated
knowledgeable
knowledgeable
respectful
Products animals animals titled goods famous
influential
(B)

165
APPENDIX 3. SUPPLEMENTARY INFORMATION FOR
PRESTIGE AND CONTENT BIASES IN THE EXPERIMENTAL
TRANSMISSION OF NARRATIVES
Table A3.1. Three-way table of biases present in artificial story propositions. The first row within each bias gives the number of propositions (and percentage of the total) presented to each participant across both stories (N = 537 propositions), while the second row within each bias gives the number (and percentage) of propositions recalled across all participants (N = 12,492 propositions). Columns indicate an additional type of bias present in the same proposition, such that numbers on the diagonal (e.g. Social-Social) represent propositions with only the single indicated bias, while off-diagonals (e.g. Social-Moral) represent propositions that contained both indicated biases. Only one proposition in the original stories (at 0.2% of the total) contained three biases (Social, Survival, and Negative Emotional) and this proposition was recalled 51 times (0.4%). This proposition is not depicted in the table but was included in analyses and the calculated percentages reflect its inclusion. The last two rows and column indicate unbiased propositions, or those that did not contain any of the content biases examined.
Social Survival Emotional (Positive)
Emotional (Negative)
Moral Rational Counter-intuitive
Unbiased
Social Presented 58 (10.8%)
5 (0.9%)
4 (0.7%)
4 (0.7%)
2 (0.4%)
14 (2.6%)
Recalled 1841 (14.7%)
269 (2.2%)
85 (0.7%)
246 (2.0%)
70 (0.6%)
269 (2.2%)
Survival Presented 31 (5.8%)
2 (0.4%)
3 (0.6%)
2 (0.4%)
Recalled 715 (5.7%)
42 (0.3%)
80 (0.6%)
102 (0.8%)
Emotional (Positive)
Presented 11 (2.0%)
1 (0.2%)
2 (0.4%)
Recalled 119 (1.0%)
4 (< 0.1%)
41 (0.3 %)
Emotional (Negative)
Presented 18 (3.4%)
1 (0.2%)
1 (0.2%)
3 (0.6%)
Recalled 788 (6.3%)
20 (0.2%)
6 (< 0.1%)
130 (1.0%)
Moral Presented 11 (2.0%)
2 (0.4%)
Recalled 118 (0.9%)
38 (0.3%)
Rational Presented 30 (5.6%)
5 (0.9%)
Recalled 521 (4.2%)
184 (1.5%)
Counter-intuitive
Presented 35 (6.5%)
Recalled 1123 (9.0%)
Unbiased Presented 291 (54.2%)
Recalled 5630 (45.1%)
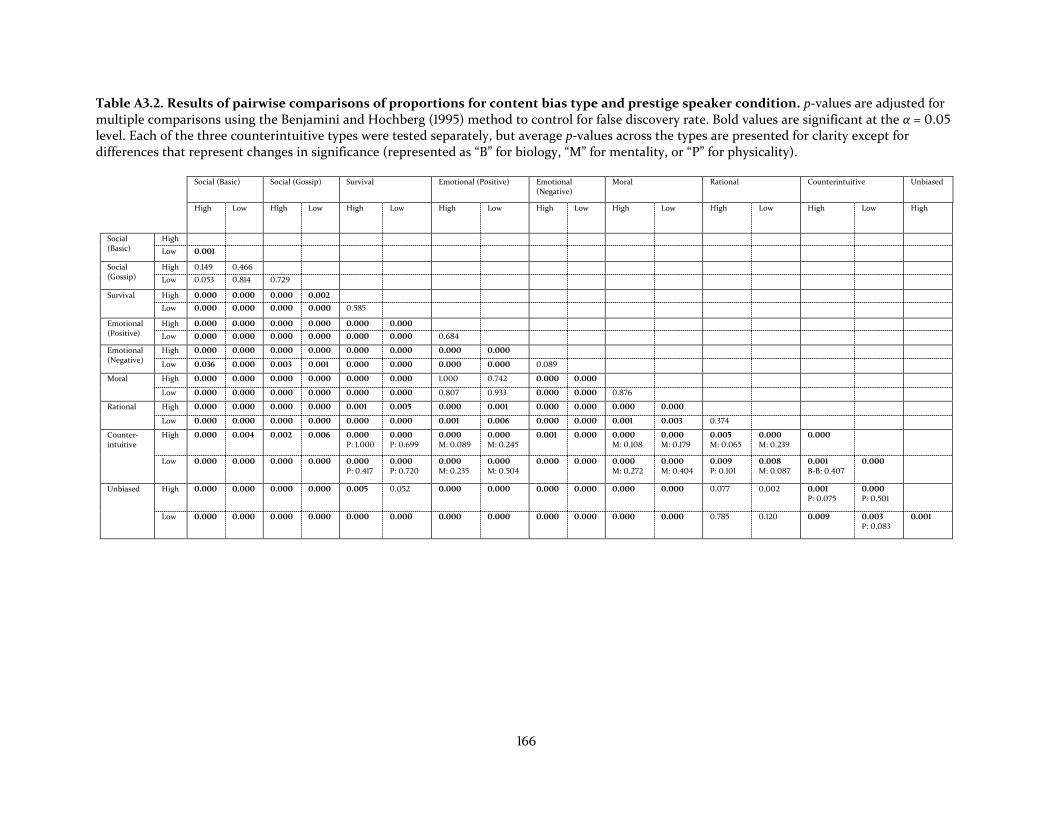
166
Table A3.2. Results of pairwise comparisons of proportions for content bias type and prestige speaker condition. p-values are adjusted for multiple comparisons using the Benjamini and Hochberg (1995) method to control for false discovery rate. Bold values are significant at the α = 0.05 level. Each of the three counterintuitive types were tested separately, but average p-values across the types are presented for clarity except for differences that represent changes in significance (represented as “B” for biology, “M” for mentality, or “P” for physicality).
Social (Basic) Social (Gossip) Survival Emotional (Positive) Emotional (Negative)
Moral Rational Counterintuitive Unbiased
High Low High Low High Low High Low High Low High Low High Low High Low High
Social (Basic)
High
Low 0.001
Social (Gossip)
High 0.149 0.466
Low 0.053 0.814 0.729
Survival High 0.000 0.000 0.000 0.002
Low 0.000 0.000 0.000 0.000 0.585
Emotional (Positive)
High 0.000 0.000 0.000 0.000 0.000 0.000
Low 0.000 0.000 0.000 0.000 0.000 0.000 0.684
Emotional (Negative)
High 0.000 0.000 0.000 0.000 0.000 0.000 0.000 0.000
Low 0.036 0.000 0.003 0.001 0.000 0.000 0.000 0.000 0.089
Moral High 0.000 0.000 0.000 0.000 0.000 0.000 1.000 0.742 0.000 0.000
Low 0.000 0.000 0.000 0.000 0.000 0.000 0.807 0.933 0.000 0.000 0.876
Rational High 0.000 0.000 0.000 0.000 0.001 0.005 0.000 0.001 0.000 0.000 0.000 0.000
Low 0.000 0.000 0.000 0.000 0.000 0.000 0.001 0.006 0.000 0.000 0.001 0.003 0.374
Counter-intuitive
High 0.000 0.004 0.002 0.006 0.000
P: 1.000 0.000 P: 0.699
0.000
M: 0.089 0.000
M: 0.245 0.001 0.000 0.000
M: 0.108 0.000
M: 0.179 0.005 M: 0.065
0.000 M: 0.239
0.000
Low 0.000 0.000 0.000 0.000 0.000
P: 0.417 0.000 P: 0.720
0.000
M: 0.235 0.000
M: 0.504 0.000 0.000 0.000
M: 0.272 0.000 M: 0.404
0.009 P: 0.101
0.008 M: 0.087
0.001
B-B: 0.407 0.000
Unbiased High 0.000 0.000 0.000 0.000 0.005 0.052 0.000 0.000 0.000 0.000 0.000 0.000 0.077 0.002 0.001
P: 0.075 0.000
P: 0.501
Low 0.000 0.000 0.000 0.000 0.000 0.000 0.000 0.000 0.000 0.000 0.000 0.000 0.785 0.120 0.009 0.003
P: 0.083 0.001

167
Table A3.3. Full set of candidate generalized linear mixed models tested. A plus sign indicates that a variable was included in the specified model. Random effects of participant and proposition number were included in all models.
Number Name sto
ry
firs
t st
ory
lin
e
lin
e^2
pre
stig
e
soci
al
surv
ival
emo
tio
nal
p
osi
tive
emo
tio
nal
n
egat
ive
mo
ral
rati
on
al
cou
nte
rin
tuit
ive
do
mai
n
cou
ntr
y
gen
der
eth
nic
ity
chil
dh
oo
d t
ow
n
size
chil
dh
oo
d t
ow
n
low
pre
stig
e
edu
cati
on
occ
up
atio
n
inco
me
mem
ory
1 Null
2 Full + + + + + + + + + + + + + + + + + + + + +
3 Story effects + + + +
4 Story +
5 First story +
6 Line number +
7 Quadratic line number + +
8 Biases + + + + + + + +
9 Prestige +
10 Content + + + + + + +
11 Social +
12 Survival +
13 Emotional + +
14 Emotional (positive) +
15 Emotional (negative) +
16 Moral +
17 Rational +
18 Counterintuitive +
19 Demographics + + + + + + + + +
20 Country +
21 Gender +
22 Ethnicity +
23 Town size +

168
Number Name sto
ry
firs
t st
ory
lin
e
lin
e^2
pre
stig
e
soci
al
surv
ival
emo
tio
nal
p
osi
tive
emo
tio
nal
n
egat
ive
mo
ral
rati
on
al
cou
nte
rin
tuit
ive
do
mai
n
cou
ntr
y
gen
der
eth
nic
ity
chil
dh
oo
d t
ow
n
size
chil
dh
oo
d t
ow
n
low
pre
stig
e
edu
cati
on
occ
up
atio
n
inco
me
mem
ory
24 Town low prestige +
25 Education +
26 Occupation +
27 Income +
28 Memory +
29 Story effects and biases + + + + + + + + + + + +
30 Story effects and demographics
+ + + + + + + + + + + + +
31 Biases and demographics
+ + + + + + + + + + + + + + + + +
32 Significant variables from full model
+ + + + + + + +
33 Significant variables from full model without income (“A”)
+ + + + + + +
34 A with story + + + + + + + +
35 A with line number + + + + + + + +
36 A with quadratic line number
+ + + + + + + + +
37 A with positive emotional
+ + + + + + + +
38 A with moral + + + + + + + +
39 A with rational + + + + + + + +
40 A with country + + + + + + + +
41 A with gender (“B”) + + + + + + + +
42 A with ethnicity + + + + + + + +
43 A with town size + + + + + + + +
44 A with town low prestige
+ + + + + + + +
45 A with education + + + + + + + +
46 A with occupation + + + + + + + +

169
Number Name sto
ry
firs
t st
ory
lin
e
lin
e^2
pre
stig
e
soci
al
surv
ival
emo
tio
nal
p
osi
tive
emo
tio
nal
n
egat
ive
mo
ral
rati
on
al
cou
nte
rin
tuit
ive
do
mai
n
cou
ntr
y
gen
der
eth
nic
ity
chil
dh
oo
d t
ow
n
size
chil
dh
oo
d t
ow
n
low
pre
stig
e
edu
cati
on
occ
up
atio
n
inco
me
mem
ory
47 B with story + + + + + + + + +
48 B with line number + + + + + + + + +
49 B with quadratic line number
+ + + + + + + + + +
50 B with positive emotional
+ + + + + + + + +
51 B with moral + + + + + + + + +
52 B with rational + + + + + + + + +
53 B with country + + + + + + + + +
54 B with ethnicity + + + + + + + + +
55 B with town size + + + + + + + + +
56 B with town low prestige
+ + + + + + + + +
57 B with education + + + + + + + + +
58 B with occupation + + + + + + + + +

170
Table A3.4. Definitions of content biases used in coding propositions.
Content Bias Definition
Social (Basic) Interactions or relationships between individuals or groups
Social (Gossip) Interactions or relationships between individuals or groups concerning third parties, or references to reputation or reputational costs, or the literal act of gossiping about other individuals
Survival Explicit references to food, water, clothing, shelter, tools, predators, natural threats and disasters, seasonal cycles, reproduction, death, or disease in a survival context
Emotional (Positive)
Explicit displays or expressions of, or reference or reaction to, a positive emotional response beyond baseline, or an event that is expected to evoke a strong basic positive emotional response in the audience
Emotional (Negative)
Explicit displays or expressions of, or reference or reaction to, a negative emotional response beyond baseline, or an event that is expected to evoke a strong basic negative emotional response in the audience
Moral Deals with social norms, taboos, and values, deviation from social norms, and rewards for adherence or punishment for deviance
Rational Concerns cause-and-effect relationships or employing causal reasoning
Counterintuitive Violations of ontological properties of folk-biology, folk-psychology or folk-physics
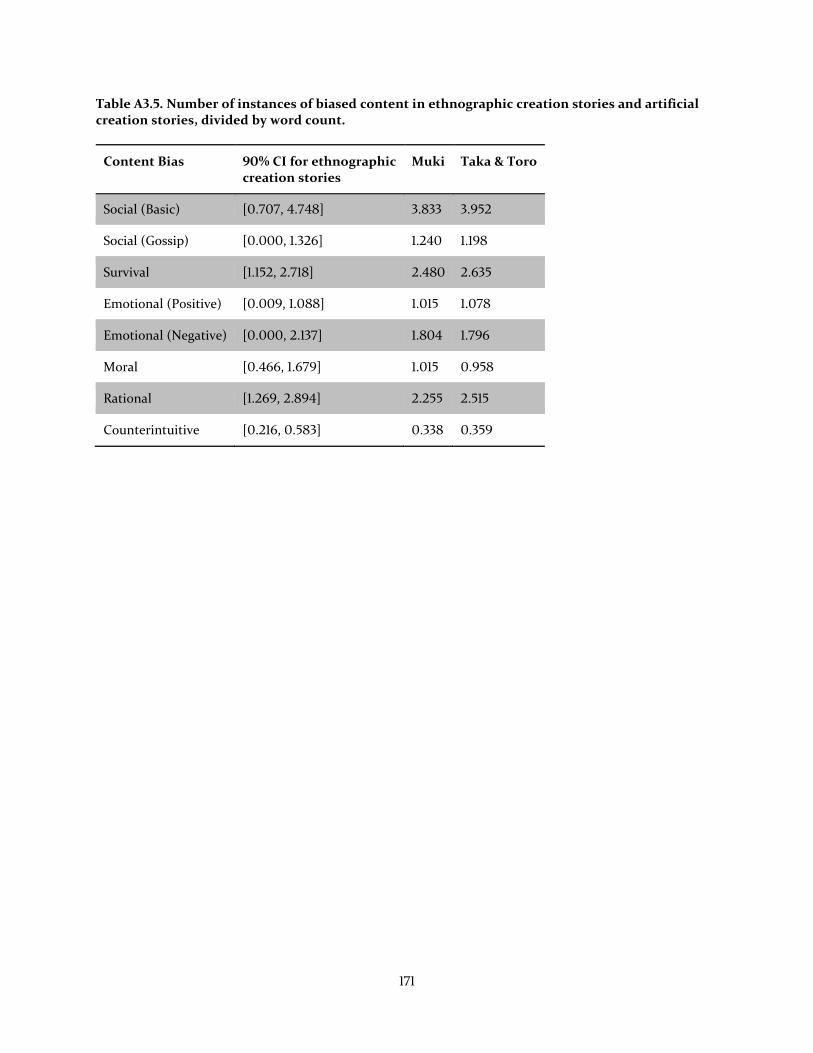
171
Table A3.5. Number of instances of biased content in ethnographic creation stories and artificial creation stories, divided by word count.
Content Bias 90% CI for ethnographic creation stories
Muki Taka & Toro
Social (Basic) [0.707, 4.748] 3.833 3.952
Social (Gossip) [0.000, 1.326] 1.240 1.198
Survival [1.152, 2.718] 2.480 2.635
Emotional (Positive) [0.009, 1.088] 1.015 1.078
Emotional (Negative) [0.000, 2.137] 1.804 1.796
Moral [0.466, 1.679] 1.015 0.958
Rational [1.269, 2.894] 2.255 2.515
Counterintuitive [0.216, 0.583] 0.338 0.359

172
APPENDIX 4. ADDENDUM TO
PRESTIGE AND CONTENT BIASES IN THE EXPERIMENTAL
TRANSMISSION OF NARRATIVES:
INFLUENCE OF PRESTIGE FACTORS ON RECALL
A4.1 Background
As noted in the Results of the main experimental study exploring the transmission of narratives, the
primary variable we used to represent prestige was a binary high prestige-low prestige distinction made on
the basis of the accent of the story’s speaker. We established the validity of this distinction through the
results of two prior studies (Berl et al. [in prep.]; Samarasinghe et al. [in prep.]) that showed significant
differences in perceptions of the prestige of these pairs of accents.
For this experiment, roughly two thirds of the participants (n = 111/163), most of which were located
in the U.S. (n = 77/111), also provided Likert-type scale speech evaluations of the speakers using the
Position-Reputation-Information (“PRI”) scale of individual prestige (Berl et al. [in prep.]) after the
experiment was concluded. The remaining participants also responded to the scale, but the data were not
recorded due to a programming issue with the web application used for the survey and were lost. We
elected not to use the scale ratings in the main study due to this sample size restriction; however, the
continuous measurements could, in theory, be a more accurate representation of the influence of prestige
on recall than a binary variable, and could yield finer-detail results. It is therefore important to evaluate the
PRI scale and its components in comparison with the binary prestige variable.
Here, we present the results of additional assessments that explore the use of the PRI scale and its
component subscales in predicting proposition recall. First, we evaluate the validity of the scale for this data
set, which is a necessary prerequisite to its use (Berl et al. [in prep.]). Second, we see whether—by using the
PRI variables—we obtain results comparable to the findings of the main study. This would tell us whether
there are any differences that could be attributed to the use of a nonrandom subset of the data, or to one or
more of the scale factors. Third, we determine whether the continuous scores determined by the scale are
better predictors of differences in proposition recall than the binary high-low prestige variable. Lastly, we

173
examine which of the PRI subscales (position, reputation, or information) is most influential in determining
recall.
A4.2 Methods and Results
To assess the fit of the PRI scale model to our speech evaluation data, we performed confirmatory factor
analysis (“CFA”), using a three-stage robust diagonally weighted least squares estimation technique
(weighted least squares, mean and variance adjusted, or “WLSMV”) that has been shown to perform well for
these types of data (Jöreskog and Sörbom 1996, pp. 23–24; DiStefano and Morgan 2014; Rhemtulla et al.
2012). We used the same fit criteria as those given in Berl et al. ([in prep.]), which were drawn from Hu &
Bentler (1999) and Yu (2002): Comparative Fit Index (“CFI”) > 0.95; Tucker-Lewis Index (“TLI”) > 0.96;
Root Mean Square Error of Approximation (“RMSEA”) < 0.05; and Standardized Root Mean Square
Residual (“SRMR”) < 0.07. We found that the model displayed good fit according to every criterion except
RMSEA (CFI = 0.998, TLI = 0.996, RMSEA = 0.100 [90% CI: 0.070, 0.133], SRMR = 0.018). This result is
similar to that found in the evaluation of the criterion validity of the scale itself (Berl et al. [in prep.]) and
we therefore interpret this as an adequate demonstration of the scale’s fit.
We then replicated the analytical procedure described in the main study, in which we ran a set of
candidate generalized linear mixed models (“GLMMs”) and used an information theoretic approach to
obtain a consensus result. In this case, we repeated the full set of GLMMs previously tested (SI Appendix,
Table S2) using the reduced data set, both with the binary prestige variable as in the main study, and with
the PRI factor score and each of its component scores (position, reputation, and information) each
substituted in turn for the binary prestige variable. The resulting set, excluding duplicate models that did
not contain a prestige variable and were thus unaffected, included 186 candidate models. We then
computed full model averages, following the method described in the main study, for the set of all models
(including those with the binary variable) and separately for the 154 models that exclude the binary variable
to examine the PRI variables alone.

174
The results of the complete set of 186 models are qualitatively similar to those of the main study
(Figure A4.1; compare with Figure 4.3), in that the same set of variables were found to be significant, with
nearly identical odds ratios. Interestingly, the PRI prestige variables were not significant when the binary
variable was included, and had very low relative variable importance (“RVI”) values (PRI < 0.01, Position =
0.01, Reputation < 0.01, Information < 0.01). This was likely due to the continuous nature of these variables
giving them less predictive power for a binary outcome (proposition recalled or not) than a binary predictor
variable.
Figure A4.1. Forest plot of odds ratios from full model-averaged coefficients for fixed effects, including binary, PRI, Position, Reputation, and Information variables representing prestige. Odds ratios and 95% confidence intervals are depicted such that variables for which confidence intervals do not overlap with 1 have a significant positive (above 1; blue) or negative (below 1; red) effect on proposition recall. Binary and categorical variables are represented relative to the reference level (false/not present unless specified otherwise). For ordinal variables (townChildhoodSize, education, and income), only linear contrasts are shown.

175
For the set of models that excluded the binary prestige variable, the PRI score was, surprisingly, not
the most influential prestige measure; rather, the score for the position subscale provided the best fit. All of
the models with substantial support—represented by a ΔAIC < 2 (Burnham and Anderson 2002, p. 70)—
include the position variable (Table A4.1), and the results of multimodel averaging give the position
variable a relative variable importance (“RVI”) value of 0.94 (the sum of its Akaike weights), while the
prestige variable with the next highest value is the full PRI score with an importance of 0.04 (Table A4.2).

176
Table A4.1. Twenty best-supported models of proposition recall, using PRI scale indices of prestige. Degrees of freedom (df) and log likelihood (logLik) and Akaike Information Criterion (AIC) values are provided for each model fit. ∆AIC is the change in AIC relative to the best-supported model. Akaike weights (w) were used in weighted model averaging and represent the relative likelihood of each model.
Name Prestige Variable
Model df logLik AIC ∆AIC w
Significant variables from full model without income (“A”) with moral
Position present ~ firstStory + positionPRI + social + survival + emotionalNegative + moral + counterintuitiveDomain + memory
14 -18666.43 37360.85 0.00 0.141
Significant variables from full model without income (“A”)
Position present ~ firstStory + positionPRI + social + survival + emotionalNegative + counterintuitiveDomain + memory
13 -18667.62 37361.23 0.38 0.116
A with line number Position present ~ firstStory + line + positionPRI + social + survival + emotionalNegative + counterintuitiveDomain + memory
14 -18666.84 37361.68 0.83 0.093
A with positive emotional
Position present ~ firstStory + positionPRI + social + survival + emotionalNegative + counterintuitiveDomain + gender + memory
14 -18666.99 37361.97 1.12 0.080
A with gender and moral
Position present ~ firstStory + positionPRI + social + survival + emotionalNegative + moral + counterintuitiveDomain + gender + memory
15 -18666.32 37362.63 1.78 0.058
A with quadratic line number
Position present ~ firstStory + line + line^2 + positionPRI + social + survival + emotionalNegative + counterintuitiveDomain + memory
15 -18666.33 37362.66 1.81 0.057
A with country Position present ~ firstStory + positionPRI + social + survival + emotionalNegative + counterintuitiveDomain + country + memory
14 -18667.39 37362.79 1.94 0.053
A with gender Position present ~ firstStory + positionPRI + social + survival + emotionalNegative + counterintuitiveDomain + gender + memory
14 -18667.51 37363.01 2.16 0.048
A with rational Position present ~ firstStory + positionPRI + social + survival + emotionalNegative + rational + counterintuitiveDomain + memory
14 -18667.59 37363.18 2.33 0.044
A with town low prestige
Position present ~ firstStory + positionPRI + social + survival + emotionalNegative + counterintuitiveDomain + townLowP + memory
14 -18667.59 37363.18 2.33 0.044
A with story Position present ~ story + firstStory + positionPRI + social + survival + emotionalNegative + counterintuitiveDomain + memory
14 -18667.61 37363.23 2.38 0.043
A with gender and line number
Position present ~ firstStory + line + positionPRI + social + survival + emotionalNegative + counterintuitiveDomain + gender + memory
15 -18666.73 37363.46 2.61 0.038
A with gender and positive emotional
Position present ~ firstStory + positionPRI + social + survival + emotionalPositive + emotionalNegative + counterintuitiveDomain + gender + memory
15 -18666.88 37363.75 2.90 0.033
A with ethnicity Position present ~ firstStory + positionPRI + social + survival + emotionalNegative + counterintuitiveDomain + ethnicity + memory
15 -18666.99 37363.98 3.13 0.029
A with education Position present ~ firstStory + positionPRI + social + survival + emotionalNegative + counterintuitiveDomain + education + memory
16 -18666.13 37364.25 3.40 0.026
A with gender and quadratic line number
Position present ~ firstStory + line + line^2 + positionPRI + social + survival + emotionalNegative + counterintuitiveDomain + gender + memory
16 -18666.22 37364.44 3.59 0.023
A with gender and country
Position present ~ firstStory + positionPRI + social + survival + emotionalNegative + counterintuitiveDomain + country + gender + memory
15 -18667.31 37364.61 3.76 0.021
A with gender and rational
Position present ~ firstStory + positionPRI + social + survival + emotionalNegative + rational + counterintuitiveDomain + gender + memory
15 -18667.48 37364.95 4.10 0.018
A with gender and town low prestige
Position present ~ firstStory + positionPRI + social + survival + emotionalNegative + counterintuitiveDomain + gender + townLowP + memory
15 -18667.49 37364.99 4.14 0.018
A with gender and story
Position present ~ story + firstStory + positionPRI + social + survival + emotionalNegative + counterintuitiveDomain + gender + memory
15 -18667.5 37365.01 4.16 0.018

177
Table A4.2. Full model-averaged coefficients for proposition recall, using PRI scale indices of prestige. Relative variable importance (“RVI”) is the sum of Akaike weights for all models that include that variable. Bolded p-values indicate statistically significant results at the 0.05 level.
Variable Coefficient SE p-value RVI
intercept -2.832 0.144 < 0.001 story 0.000 0.030 0.990 0.06 firstStory -0.732 0.053 < 0.001 1.00 line
(linear) -0.015 0.040 0.707 0.21 (quadratic) 0.005 0.027 0.839 0.08
prestigePRI 0.002 0.011 0.843 0.04 positionPRI 0.059 0.021 0.004 0.94 reputationPRI 0.000 0.005 0.931 0.01 informationPRI 0.000 0.005 0.924 0.01 social 1.00
(none-basic) 0.852 0.185 < 0.001 (none-gossip) 0.806 0.302 0.008
survival 0.644 0.215 0.003 1.00 emotionalPositive -0.042 0.162 0.798 0.11 emotionalNegative 1.200 0.251 < 0.001 1.00 moral -0.104 0.262 0.690 0.19 rational -0.003 0.057 0.954 0.06 counterintuitiveDomain 1.00
(none-biology) 2.086 0.333 < 0.001 (none-mentality) -0.219 0.273 0.423
(none-physicality) 0.581 0.356 0.103 country (us-uk) -0.010 0.069 0.880 0.07 gender (female-male) -0.027 0.117 0.817 0.29 ethnicity 0.04
(white-poc) -0.007 0.072 0.920 (white-mixed) 0.014 0.102 0.893
townChildhoodSize < 0.01 (linear) 0.000 0.010 0.999
(quadratic) 0.000 0.011 0.989 (cubic) -0.000 0.011 0.993
townChildhoodLowP (false-true) 0.004 0.075 0.961 0.06 education 0.04
(linear) -0.005 0.049 0.925 (quadratic) 0.001 0.040 0.980
(cubic) -0.011 0.069 0.870 occupation < 0.01
(student-homemaker) 0.002 0.046 0.973 (student-production) 0.001 0.036 0.979
(student-trades) -0.002 0.054 0.977 (student-sales) -0.001 0.031 0.979
(student-service) -0.001 0.033 0.976 (student-professional) -0.001 0.028 0.981
income < 0.01 (linear) -0.000 0.007 0.996
(quadratic) 0.000 0.009 0.994 (cubic) -0.000 0.008 0.994
memory 0.578 0.099 < 0.001 1.00
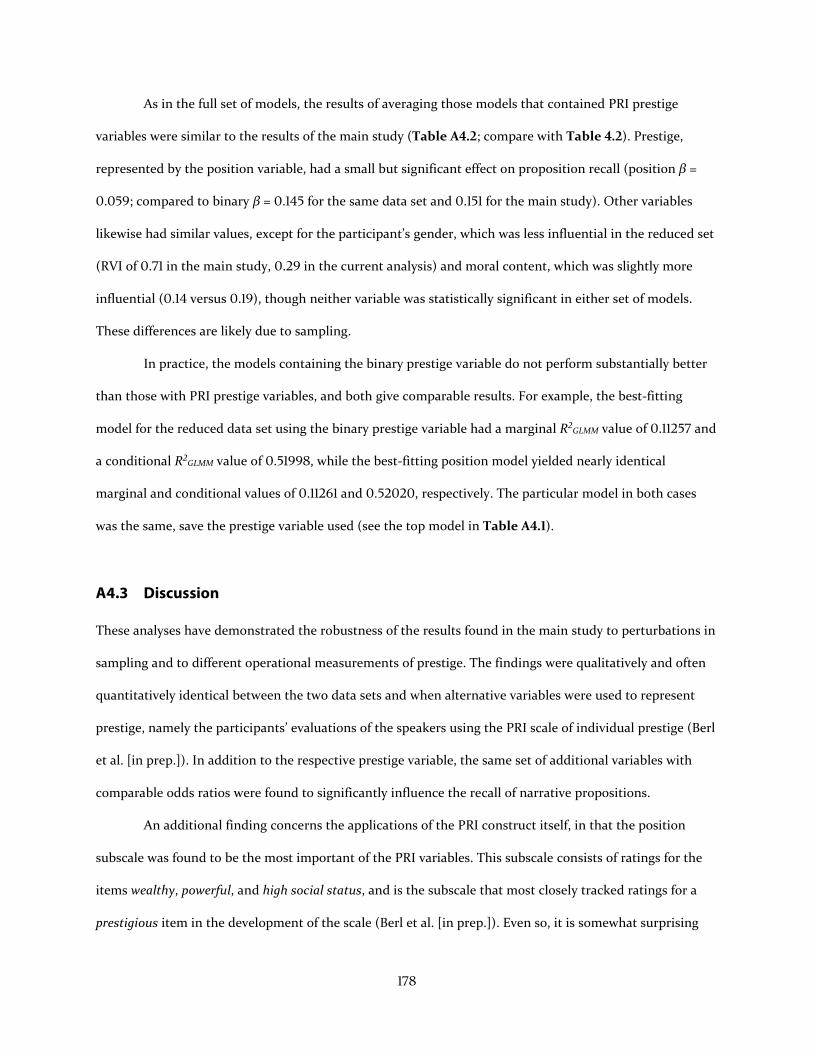
178
As in the full set of models, the results of averaging those models that contained PRI prestige
variables were similar to the results of the main study (Table A4.2; compare with Table 4.2). Prestige,
represented by the position variable, had a small but significant effect on proposition recall (position β =
0.059; compared to binary β = 0.145 for the same data set and 0.151 for the main study). Other variables
likewise had similar values, except for the participant’s gender, which was less influential in the reduced set
(RVI of 0.71 in the main study, 0.29 in the current analysis) and moral content, which was slightly more
influential (0.14 versus 0.19), though neither variable was statistically significant in either set of models.
These differences are likely due to sampling.
In practice, the models containing the binary prestige variable do not perform substantially better
than those with PRI prestige variables, and both give comparable results. For example, the best-fitting
model for the reduced data set using the binary prestige variable had a marginal R2GLMM value of 0.11257 and
a conditional R2GLMM value of 0.51998, while the best-fitting position model yielded nearly identical
marginal and conditional values of 0.11261 and 0.52020, respectively. The particular model in both cases
was the same, save the prestige variable used (see the top model in Table A4.1).
A4.3 Discussion
These analyses have demonstrated the robustness of the results found in the main study to perturbations in
sampling and to different operational measurements of prestige. The findings were qualitatively and often
quantitatively identical between the two data sets and when alternative variables were used to represent
prestige, namely the participants’ evaluations of the speakers using the PRI scale of individual prestige (Berl
et al. [in prep.]). In addition to the respective prestige variable, the same set of additional variables with
comparable odds ratios were found to significantly influence the recall of narrative propositions.
An additional finding concerns the applications of the PRI construct itself, in that the position
subscale was found to be the most important of the PRI variables. This subscale consists of ratings for the
items wealthy, powerful, and high social status, and is the subscale that most closely tracked ratings for a
prestigious item in the development of the scale (Berl et al. [in prep.]). Even so, it is somewhat surprising

179
that, although participants consistently perceive prestige as a multidimensional construct composed of
these three subscales (shown in Berl et al. [in prep.]), they showed greater recall for speakers that displayed
specifically these properties rather than others, such as the educated and intelligent items of the
information subscale, and that it was more predictive of recall than the single integrative value of the scale.
This could indicate that—in spite of the general perception of a multidimensional prestige concept—when
people are placed in a transmission context they tend to cue in on the importance of an individual’s status
and relative position in a social hierarchy more than other aspects of prestige, including third-party views
on their value (reputation) and their wealth of knowledge (information). This has potentially important
implications for cultural evolutionary theory and for future empirical studies that operationalize and
evaluate the role of prestige in cultural transmission.
We must also note that the binary prestige variable used in the main study performed better than
any of the PRI variables in this reduced data set, but not to a large degree (see discussion of the R2 values in
Methods and Results). As we mentioned previously, this was likely the result of a poorer fit for a noisy
continuous variable to a binary outcome than a binary predictor that depicts the same relationship. Using
an established scale of individual prestige to break down participants’ perceptions beyond a rough high-low
distinction allowed us to gain insights into the finer details of the transmission process, such as the
importance of the position subscale. Though not as important in terms of statistical fit, these distinctions
were clearly important to our participants (at least in terms of their subconscious biases), judging by the
influence of the position variable relative to other PRI variables.
In sum, these additional analyses have granted insights into the cultural transmission process and
the intricate role that prestige plays in determining the salience of information. Prestige is a
multidimensional concept, at least among participants that come from a WEIRD background (Henrich et
al. 2010), and we have discovered that an individual’s position in society was the most influential dimension
when it came to the transmission and recall of artificial creation stories. Further work will be needed to
investigate the nuances of prestige-biased transmission, to support or qualify the results found here, and to
extend these lines of cultural evolutionary inquiry to other, non-Western societies with diverse perceptions
of prestige (Berl and Gavin [in prep.]).