Institutional Prestige and Reputation among Research Universities and Liberal Arts Colleges*
20
INSTITUTIONAL PRESTIGE AND REPUTATION AMONG RESEARCH UNIVERSITIES AND LIBERAL ARTS COLLEGES w J. Fredericks Volkwein* , ** and Kyle V. Sweitzer* ................................................................................................ ................................................................................................ This study examines the variables that are the most strongly associated with institutional prestige and reputation and presents an exploratory model. This research expands earlier efforts by including more recent data on larger populations of public and private universities, as well as on liberal arts colleges. The analysis draws upon data from U.S. News & World Report (USNWR), the Institute for Scientific Information Web of Knowledge, IPEDS, AAUP, and four college guidebooks: Barron’s, Peterson’s, the Princeton Review, and the Fiske Guide. Finding general support for the model, the robust regression results explain about 90% of the variance in USNWR peer reputation score. ................................................................................................ ................................................................................................ KEY WORDS: rankings; reputation ratings; prestige; research universities; liberal arts colleges; US News. THE RESEARCH AND POLICY PROBLEM What institutional characteristics and faculty and student outcomes are most strongly associated with institutional prestige? This research project examines the correlates of undergraduate reputation as measured by the U.S. News & World Report (USNWR) annual survey of college presidents, provosts, and deans/directors of admissions. Although a great deal of scholarly attention has been directed toward analyzing the reputational ratings of graduate programs at major uni- versities, fewer analytical studies have examined reputation at the w This manuscript is a revised version of a research paper delivered at the 45th Annual Forum of the Association for Institutional Research, San Diego, CA, May 30, 2005. *Center for the Study of Higher Education, Pennsylvania State University, State College, PA 16802, USA. **Address correspondence to: J. Fredericks Volkwein, Center for the Study of Higher Education, Pennsylvania State University, State College, PA 16802, USA. E-mail: Volkwein @psu.edu 129 0361-0365 ⁄ 06 ⁄ 0300-0129 ⁄ 0 Ó 2006 Springer Science+Business Media, Inc. Research in Higher Education, Vol. 47, No. 2, March 2006 (Ó 2006) DOI: 10.1007/s11162-005-8883-5
-
Upload
michiganstate -
Category
Documents
-
view
0 -
download
0
Transcript of Institutional Prestige and Reputation among Research Universities and Liberal Arts Colleges*
INSTITUTIONAL PRESTIGE AND REPUTATIONAMONG RESEARCH UNIVERSITIES AND LIBERALARTS COLLEGESw
J. Fredericks Volkwein*,** and Kyle V. Sweitzer*
................................................................................................................................................................................................
This study examines the variables that are the most strongly associated withinstitutional prestige and reputation and presents an exploratory model. Thisresearch expands earlier efforts by including more recent data on largerpopulations of public and private universities, as well as on liberal arts colleges.The analysis draws upon data from U.S. News & World Report (USNWR), theInstitute for Scientific Information Web of Knowledge, IPEDS, AAUP, and fourcollege guidebooks: Barron’s, Peterson’s, the Princeton Review, and the FiskeGuide. Finding general support for the model, the robust regression results explainabout 90% of the variance in USNWR peer reputation score.
................................................................................................................................................................................................KEY WORDS: rankings; reputation ratings; prestige; research universities; liberal artscolleges; US News.
THE RESEARCH AND POLICY PROBLEM
What institutional characteristics and faculty and student outcomesare most strongly associated with institutional prestige? This researchproject examines the correlates of undergraduate reputation as measuredby the U.S. News & World Report (USNWR) annual survey of collegepresidents, provosts, and deans/directors of admissions.Although a great deal of scholarly attention has been directed toward
analyzing the reputational ratings of graduate programs at major uni-versities, fewer analytical studies have examined reputation at the
wThis manuscript is a revised version of a research paper delivered at the 45th Annual Forumof the Association for Institutional Research, San Diego, CA, May 30, 2005.
*Center for the Study of Higher Education, Pennsylvania State University, State College, PA
16802, USA.
**Address correspondence to: J. Fredericks Volkwein, Center for the Study of Higher
Education, Pennsylvania State University, State College, PA 16802, USA. E-mail: Volkwein
@psu.edu
129
0361-0365 ⁄ 06 ⁄ 0300-0129 ⁄ 0 � 2006 Springer Science+Business Media, Inc.
Research in Higher Education, Vol. 47, No. 2, March 2006 (� 2006)DOI: 10.1007/s11162-005-8883-5
undergraduate level. We found a handful of studies concluding that two‘‘inputs’’—institutional size and selectivity—are the primary drivers ofreputation (Astin, 1970; Astin and Lee, 1972; Astin and Solomon, 1981;Grunig, 1997; Porter and Toutkoushian, 2002; Schmitz, 1993; Solomonand Astin, 1981; Volkwein, 1989). The earliest of these studies by Astinand his colleagues indicate that institutions with large enrollments andhigh SAT/ACT averages for entering freshmen receive the greatest pres-tige. The more recent studies have generally confirmed these findingsand expanded them by additionally finding that reputational ratingscorrelate significantly with the following variables: average high schoolclass standing of entering freshmen, admissions acceptance rates,instructional budget per student, percentage of faculty possessingPh.D.’s, faculty publication rates, average cost of tuition, room, andboard, and retention/graduation rates. Generally, these variables explainmore than half of the variance in undergraduate reputational ratings.We began this study by examining some of the salient features of the
best-known college guidebooks and USNWR, the information they con-tain, and the nature of the ratings they use to classify colleges. Manypublishers collect and print a good deal of information about collegesand universities but stop short of trying to reduce the facts down to asingle rating category—the College Board’s Handbook and the YaleDaily News’ Insider’s Guide being perhaps the most prominent exam-ples. Barron’s, Peterson’s, and Rugg’s rightly describe themselves asgrouping colleges into admissions categories. Fiske and the PrincetonReview (2003) correctly claim to engage in describing and rating col-leges in multiple categories. Dozens of specialty guides serve particularpopulations of students—the most-wired colleges, disability friendly,conservative, faith-based, Hispanic-serving, etc. Although the number ofguidebook publications has proliferated in recent years, a few of thenation’s most venerable guides, like Cass and Birnbaum’s andLovejoy’s, appear to be no longer publishing.For this study, we assembled information from USNWR plus four
leading guidebooks—Barron’s, Peterson’s, Fiske, and the PrincetonReview. Barron’s and Peterson’s share roughly similar institutional cov-erage and classify colleges by admissions selectivity. Barron’s gathersinformation on nearly all accredited four-year colleges and constructs anine-category grouping of admissions ‘‘competitiveness.’’ Peterson’s alsogathers information on almost all of the four-year institutions and askseach college to place itself into one of five categories of admissions‘‘difficulty.’’ Fiske uses a five-star rating system for rating the academic,social, and student life at each campus. The Princeton Review assigns a60–99 rating to colleges in each of four categories—admissions,
130 VOLKWEIN AND SWEITZER

academic, quality of life, and financial aid. Among the research univer-sities and liberal arts colleges in our sample (N ¼ 447), we find that theinter-correlations among the various ratings in these four guidebookrange from .69 to .83. Thus, there is considerable, but far from perfectoverlap in the guidebook ratings for the leading research universitiesand liberal arts colleges.Competition among the guidebook publishers escalated in the 1980s
whenUSNWR began publishing its annual rankings of undergraduatecolleges. Now its fall issue each year, described by many as its ‘‘swim-suit issue,’’ is a hot seller, and attracts considerable media coverage.Robert Morse and his colleagues at USNWR not only use the largestarray of measures, but also openly describe their ranking methodology.Although the variables and assigned weights have changed over theyears, partly in response to criticisms from the academic profession,USNWR now assigns explicit weights to seven indicators and 15 sub-factors in order to rank about 1400 institutions. Currently and histori-cally, the heaviest weighting in the USNWR rankings is the measure of‘‘academic reputation’’ or ‘‘peer assessment’’ by presidents, provosts,and admissions directors. Thus, the most heavily rated measure in therankings is based upon responses by those who may have a vested inter-est in the outcome. Although USNWR is examining their data for evi-dence of such bias, and has not yet found much, we wanted to examinefor ourselves the factors associated with prestige in the eyes of thesethree important judges. An analysis of 1990s data by Volkwein andGrunig (2005) shows not only that graduate and undergraduate reputa-tion are highly correlated with similar sets of variables, but also that theaverage NRC and USNWR ratings are highly correlated with eachother, at least among a population of research universities (see Table 1).This study seeks to update that earlier analysis by including more recentdata on larger populations of public and private research and doctoraluniversities, as well as liberal arts colleges. What are the correlates ofprestige among the nation’s leading colleges and universities?
CONCEPTUAL FRAMEWORK
In order to design the study, we developed an explanatory model ofhypothetical correlates with institutional prestige. We started with asimple input-process-output (IPO) model and enhanced it with systemsconcepts from a recent doctoral dissertation by Szelest (2003). Based onthe organizational systems and higher education literature, we proposethat an institution’s mission, control, governance, size, history, andwealth influence how an institution deploys its resources and recruits
INSTITUTIONAL PRESTIGE AND REPUTATION 131

faculty and students. In particular, endowment and enrollment-drivenrevenue enable the institution to invest in faculty instructional andresearch resources, as well as in student financial aid, support services,and other activities (e.g., advisement, mentoring, honors programs,tutoring). These faculty activities and support services exert influencesnot only on current students (via student retention and student success),but also on future students by influencing institutional attractiveness.The model in Figure 1 assumes that more resources enable the institu-
tion both to buy more faculty (thus lowering the student/faculty ratio)and to pay them higher salaries (thus raising faculty quality by hiringthe best full-time and adjunct faculty that are available in the market-place). In theory, a lower student/faculty ratio has a positive impact oninstructional quality, and higher faculty compensation has a positiveimpact on research and scholarship. Thus, several authors have usedaverage faculty salaries as foundational indicators of faculty talent andinstitutional quality (Adams and Krislov, 1978; Brown, 1967; Grunig,1997). Other authors have used faculty publications and research activ-ity as indicators, but an array of studies have demonstrated that the
TABLE 1. Graduate and Undergraduate Reputation Correlations with Indicators of
Faculty Strength and Freshman Selectivity at Research and Doctoral Universities
(N ¼ 128)
Indicators of Faculty Strength
and Freshman Selectivity
*Correlations with
1993 Average NRC
Faculty Reputation
Ratings
*Correlations with
1994 US News
Academic Reputation
Ratings
Total faculty publications .84 .84
Publications per faculty .81 .73
Total citations .87 .84
Citations per faculty .81 .75
Total R&D expenditures .79 .78
R&D expenditures per faculty .70 .67
Average Salaries for Professors .72 .62
Total Faculty Size .60 .67
Total Enrollment Size .53 .58
% Freshmen in top 10% of class .61 .66
Frosh SAT scores 75th % .66 .77
Frosh SAT scores 25th % .54 .64
Admissions Acceptance rate ).53 ).42Barron’s 1993 ‘‘Competitiveness’’ .54 .63
*Correlation between these two reputation ratings = .91.
132 VOLKWEIN AND SWEITZER
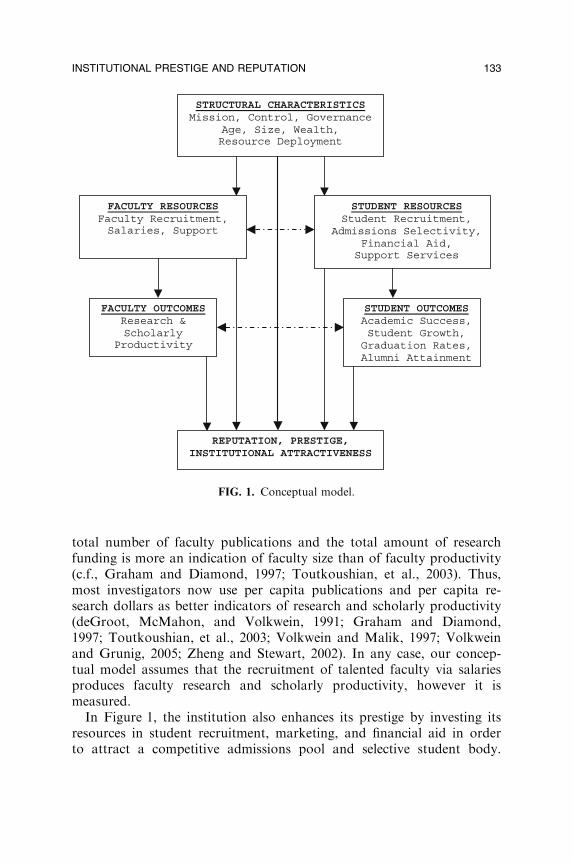
total number of faculty publications and the total amount of researchfunding is more an indication of faculty size than of faculty productivity(c.f., Graham and Diamond, 1997; Toutkoushian, et al., 2003). Thus,most investigators now use per capita publications and per capita re-search dollars as better indicators of research and scholarly productivity(deGroot, McMahon, and Volkwein, 1991; Graham and Diamond,1997; Toutkoushian, et al., 2003; Volkwein and Malik, 1997; Volkweinand Grunig, 2005; Zheng and Stewart, 2002). In any case, our concep-tual model assumes that the recruitment of talented faculty via salariesproduces faculty research and scholarly productivity, however it ismeasured.In Figure 1, the institution also enhances its prestige by investing its
resources in student recruitment, marketing, and financial aid in orderto attract a competitive admissions pool and selective student body.
FIG. 1. Conceptual model.
INSTITUTIONAL PRESTIGE AND REPUTATION 133
Admissions selectivity is indicated by measures such as median ACT/SAT score, freshmen in the top 10% of high school class, and admis-sions acceptance rate. Spending on student recruitment activity and sup-port services positively influences the relative attractiveness of theinstitution to prospective students (Szelest, 2003).In his book, The Organization of Academic Work, Blau (1994) pro-
vides evidence that talented faculty attract talented students. Therefore,successful faculty recruitment and student recruitment interact with eachother. It is likely that faculty instructional and academic service activityexerts a great influence on current students; and faculty research andscholarship exerts a great influence on perceived faculty quality and aca-demic reputation. Both sets of faculty activity increase the attractivenessof the institution to prospective students, eventually strengtheningenrollment and financial resources. It follows that faculty talent andeffort combine with student talent and effort to produce student andalumni outcomes. Although we do not have measures for all possibleindicators of undergraduate outcomes, we do have graduation rates, thenumber and types of degrees awarded, per capita degree productivity,and alumni giving rates as indicators.
METHODOLOGY, DATA SOURCES AND VARIABLES
This study drew upon data from a wide array of sources, then en-gaged in a variety of data reduction steps to arrive at the most robustindicators. Sources of data included USNWR America’s Best Colleges2004 (Sklaroff, 2003), the 2003 Integrated Post-Secondary EducationDatabase System (IPEDS), the AAUP salary survey, the Institute forScientific Information Web of Knowledge Citation Indices, and four col-lege guidebooks. The guidebooks include Barron’s Profiles of AmericanColleges 2003, Peterson’s Four-Year Colleges 2004, The PrincetonReview’s Complete Book of Colleges 2004 Edition, and The Fiske Guideto Colleges 2004 (Fiske and Logue, 2004). We obtained enrollment datausing Peterson’s Four-Year Colleges 2004, because it had the mostrecent enrollment figures. In addition, we assembled the measures ofgovernance and regulatory control developed by Zumeta (1996) for pri-vate institutions and by Volkwein for public universities (Volkwein andMalik, 1997). Although we could not obtain all the data from the sameyear, the institutional characteristics represented in the study do notchange dramatically from year to year, especially not in relative terms.Only those institutions categorized by USNWR as ‘‘National Universi-ties—Doctoral’’ and ‘‘Liberal Arts Colleges—Bachelor’s’’ are includedin our study. Our study includes 242 institutions that fall into the
134 VOLKWEIN AND SWEITZER

TABLE 2. Descriptive Statistics for Analytical Variables
Variable Name
Res. Univ.
mean
N=242
Res. Univ.
Std. Dev.
Lib. Arts
Mean
N=205
Lib. Arts
Std. Dev.
Data
source
Dependent variable
USNWR peer Score 3.03 0.71 2.85 0.76 USNWR
Independent variables
Age of institution 123 52 133 48 Barrons
Public control 0.67 0.47 0.09 0.29 Directory
Religious control/affiliation 0.12 0.32 0.47 0.50 Directory
Private sector control
(Zumeta)
3.36 1.31 3.46 1.11 JHE 1996
Financial regulation
(Volkwein)
2.0 0.83 1.95 0.85 RHE 1997
Academic regulation
(Volkwein)
1.86 0.81 1.95 0.91 RHE 1997
Combined control measure 4.48 1.37 4.06 1.26 Computed
FT undergraduate enrollment 10,932 7,225 1,474 796 Petersons
PT undergraduate enrollment 2,000 2,114 116 234 Petersons
Graduate enrollment 4,592 3,131 94 248 Petersons
Total enrollment 17,523 10,354 1685 955 Computed
Full-time faculty 1,112 850 116 62 IPEDS
Part-time faculty 380 419 42 40 IPEDS
Total faculty 1,492 1,121 158 81 IPEDS
Bachelor’s degrees awarded 2,454 1,750 328 198 IPEDS
Master’s degrees awarded 1,017 741 24 66 IPEDS
Doctoral degrees awarded 152 154 1 7 IPEDS
Total degrees award
(incl Assoc.)
3,845 2,469 360 218 IPEDS
Instructional expenditures 156 M 142 M 16 M 15 M IPEDS
Research expenditures 91 M 120 M 1.3 M 10 M IPEDS
Academic support expenditures 44 M 54 M 4.1 M 4.4 M IPEDS
Student services expenditures 19 M 17 M 5.5 M 3.5 M IPEDS
Institutional support
expenditures
39 M 37 M 7.4 M 5.1 M IPEDS
Total expenditures 350 M 333 M 34 M 33 M Computed
Total revenue (less hospit rev) 530 M 534 M 43 M 51 M IPEDS
Revenues less expenditures 180 M 272 M 8.6 M 26 M Computed
Expenditures per student 23,981 27,739 22,701 32,488 Computed
Revenues per student 36,234 57,423 28,665 51,753 Computed
Adjusted(FTE) stu/fac ratio 15.7 5.8 13.1 3.5 Computed
Professor salary 88,001 16,210 70,794 14,798 AAUP
Assistant professor salary 54,206 7,455 44,829 6,184 AAUP
INSTITUTIONAL PRESTIGE AND REPUTATION 135
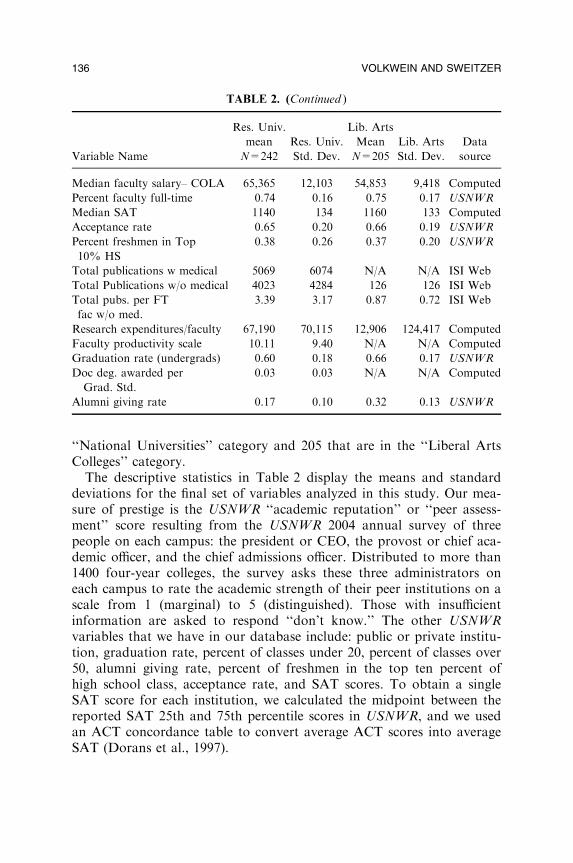
‘‘National Universities’’ category and 205 that are in the ‘‘Liberal ArtsColleges’’ category.The descriptive statistics in Table 2 display the means and standard
deviations for the final set of variables analyzed in this study. Our mea-sure of prestige is the USNWR ‘‘academic reputation’’ or ‘‘peer assess-ment’’ score resulting from the USNWR 2004 annual survey of threepeople on each campus: the president or CEO, the provost or chief aca-demic officer, and the chief admissions officer. Distributed to more than1400 four-year colleges, the survey asks these three administrators oneach campus to rate the academic strength of their peer institutions on ascale from 1 (marginal) to 5 (distinguished). Those with insufficientinformation are asked to respond ‘‘don’t know.’’ The other USNWRvariables that we have in our database include: public or private institu-tion, graduation rate, percent of classes under 20, percent of classes over50, alumni giving rate, percent of freshmen in the top ten percent ofhigh school class, acceptance rate, and SAT scores. To obtain a singleSAT score for each institution, we calculated the midpoint between thereported SAT 25th and 75th percentile scores in USNWR, and we usedan ACT concordance table to convert average ACT scores into averageSAT (Dorans et al., 1997).
TABLE 2. (Continued )
Variable Name
Res. Univ.
mean
N=242
Res. Univ.
Std. Dev.
Lib. Arts
Mean
N=205
Lib. Arts
Std. Dev.
Data
source
Median faculty salary– COLA 65,365 12,103 54,853 9,418 Computed
Percent faculty full-time 0.74 0.16 0.75 0.17 USNWR
Median SAT 1140 134 1160 133 Computed
Acceptance rate 0.65 0.20 0.66 0.19 USNWR
Percent freshmen in Top
10% HS
0.38 0.26 0.37 0.20 USNWR
Total publications w medical 5069 6074 N/A N/A ISI Web
Total Publications w/o medical 4023 4284 126 126 ISI Web
Total pubs. per FT
fac w/o med.
3.39 3.17 0.87 0.72 ISI Web
Research expenditures/faculty 67,190 70,115 12,906 124,417 Computed
Faculty productivity scale 10.11 9.40 N/A N/A Computed
Graduation rate (undergrads) 0.60 0.18 0.66 0.17 USNWR
Doc deg. awarded per
Grad. Std.
0.03 0.03 N/A N/A Computed
Alumni giving rate 0.17 0.10 0.32 0.13 USNWR
136 VOLKWEIN AND SWEITZER

The degree of control and regulation experienced by our 447 institu-tions was measured separately for public and private institutions andthen combined into a single metric. For private institutions, we drewupon Zumeta’s (1996) measure of state policy towards private highereducation. Zumeta places each state into one of five categories withregard to regulation over private institutions. Institutions located instates categorized by Zumeta as ‘‘Laissez-Faire’’ were assigned a one(least centralized) and those located in states categorized as ‘‘CentralPlanning’’ were assigned a five (most centralized). Then we added onepoint to the scale score for each college or university that is controlledor affiliated with a religious denomination, as identified in the 2004Higher Education Directory. This combined measure of control forprivate institutions ranges from one to six.For public institutions, we gave each university a base of one to indi-
cate its greater degree of external control. Then we drew upon the tricho-tomized measures of academic and financial regulation developed byVolkwein (see Volkwein and Malik, 1997). Each of these two measuresare on a scale from one to three, with one indicating low state regulationand three indicating high regulation. We combined the financial measureand the academic measure with the base score to create a single scale ofregulatory control for public institutions ranging from four to seven.Thus, each institution in the analysis received a combined governance/control measure ranging from a low of 1 (for non-church affiliated pri-vates in the least-regulatory states) to a high of 7 (for public institutionsin states with the highest levels of financial and academic regulation).We obtained 2003 data from IPEDS, including revenue and expendi-
ture data, number of full-time and part-time faculty, and number andtype of degrees awarded. We engaged in data reduction and avoidedcollinearity by combining some variables, and in other cases by pickingthe strongest indicator from each set. For example, the measures oforganizational size (student enrollment, number of faculty, and degreesawarded) are highly correlated with each other. Initially, we found thatthe number of full-time faculty is a positive indicator of prestige, andthe number of part-time students is a negative indicator. But after anal-ysis, we selected total headcount enrollment as the best indicator of size.Similarly, we examined several different measures of organizationalwealth, and the measure that appeared the most robust was per capitaexpenditures rather than revenues. The expenditure data includes sepa-rate variables for instruction, research, academic support, student ser-vices, and institutional support. The revenue and expenditure data fromIPEDS are highly correlated, so after analysis we used E&G expendi-tures-per-student and research expenditures-per-full-time faculty as
INSTITUTIONAL PRESTIGE AND REPUTATION 137

variables that contribute separately to reputation. Because large medicaloperations skew the data at their institutions, we separated out hospitalrevenue and expenditures, and then computed revenues per student,expenditures per student, and revenues less expenditures (as a measureof financial health). For each institution, we also calculated a student/faculty ratio and adjusted student/faculty ratio, which countedeach part-time student as one-third of an FTE (Geiger, 2004) and eachpart-time faculty member as one-fourth of an FTE.In our data reduction procedures, we also added guidebook ratings to
the database but found that they are highly redundant both with eachother and with the admissions selectivity indicators. In addition, foreach institution in our study we included faculty salary data from theAAUP (2002), both at the professor level and the assistant professorlevel. These two figures were averaged to create ‘‘median faculty salary’’that we adjusted for cost-of-living based on the geographic location ofthe institution according to U.S. Bureau of the Census (2002). However,we found that the non-COLA-adjusted average salary for full professorshas the most robust correlation with institutional prestige.As noted earlier, studies increasingly measure scholarly publications
and research dollars as indicators of faculty quality and productivity(Ehrenberg and Hurst, 1998; Porter and Umbach, 2001; Porter andToutkoushian, 2002; Toutkoushian, et al., 2003; Volkwein and Grunig,2005; Volkwein and Malik, 1997; Zheng and Stewart, 2002). For thisstudy, we captured measures of both research funding and faculty schol-arship. In order to measure per capita faculty productivity, we assem-bled a five-year record of faculty publications for each institution usingthe ISI Web of Knowledge for the sciences, social sciences, and arts andhumanities for the period 1999–2003, encompassing the years just priorto the 2004 USNWR ratings. Although the ISI publication databasedoes not include every article for every institution, nor does it includebooks, it nevertheless captures the articles in thousands of journals(8700) across all academic fields and constitutes perhaps the best avail-able measure of faculty productivity, particularly when aggregated tothe institutional level and used comparatively. After combining publica-tions in the three broad areas listed above for each institution, we thencomputed publications per full-time faculty following the methods ofother researchers like Graham and Diamond (1997), Toutkoushian,et al. (2003), and Volkwein and Malik (1997). For the research universi-ties, we also computed research revenues and expenditures per facultyusing similar techniques. For all faculty, publications, and researchvariables, we used non-medical, non-hospital calculations to avoid thedramatic outliers that otherwise would have resulted. Thus, the measure
138 VOLKWEIN AND SWEITZER
of faculty productivity for research universities includes publications perfaculty as well as research funding per faculty, but for the liberal artscolleges, faculty productivity includes only publications per faculty.Based on our understanding of their separate missions and markets,
we decided to construct separate models for research universities andliberal arts colleges. We employed hierarchical set-wise (blocked) regres-sion, with the USNWR peer score as the dependent variable, and usedall other variables in our database as potential indicators. The corre-sponding faculty and student variable groups were entered as singleblocks in the set-wise regression, recognizing the nearly simultaneoustiming of these events in the systems chain, and simplifying the numberof models in the analysis.
RESULTS
Research Universities
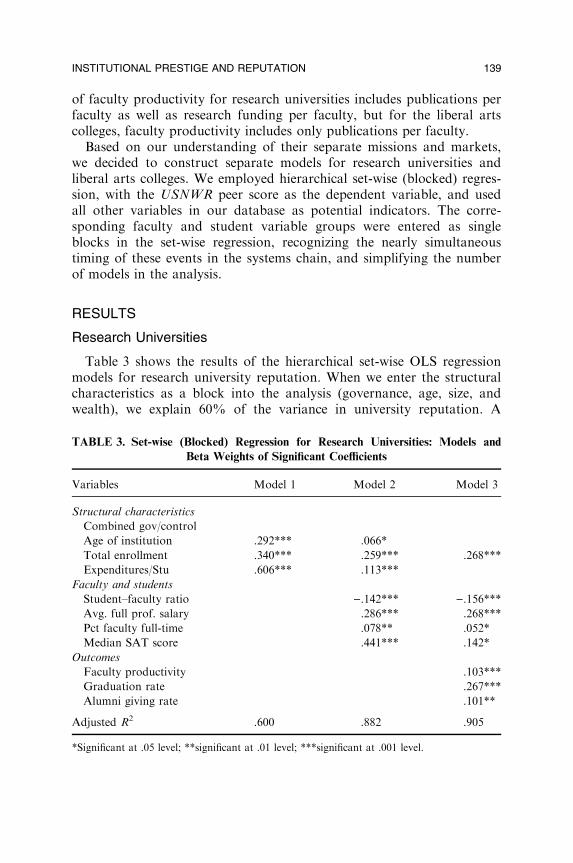
Table 3 shows the results of the hierarchical set-wise OLS regressionmodels for research university reputation. When we enter the structuralcharacteristics as a block into the analysis (governance, age, size, andwealth), we explain 60% of the variance in university reputation. A
TABLE 3. Set-wise (Blocked) Regression for Research Universities: Models and
Beta Weights of Significant Coefficients
Variables Model 1 Model 2 Model 3
Structural characteristics
Combined gov/control
Age of institution .292*** .066*
Total enrollment .340*** .259*** .268***
Expenditures/Stu .606*** .113***
Faculty and students
Student–faculty ratio ).142*** ).156***Avg. full prof. salary .286*** .268***
Pct faculty full-time .078** .052*
Median SAT score .441*** .142*
Outcomes
Faculty productivity .103***
Graduation rate .267***
Alumni giving rate .101**
Adjusted R2 .600 .882 .905
*Significant at .05 level; **significant at .01 level; ***significant at .001 level.
INSTITUTIONAL PRESTIGE AND REPUTATION 139
significant increase in explained variance (to 88%) is achieved by addingthe faculty and student variables (Model 2). In Model 3, the faculty andstudent outcomes, including alumni giving, add less than three percentto the additional explained variance in reputation scores. The final mod-el shows eight variables that are significant at the .05 level. These in-clude only the size measure from Model 1, four faculty and studentmeasures from Model 2, and three outcomes measures. The variables inthis final model explain over 90 percent of the variance in USNWR peerreputation scores among research universities.Consistent with the framework in Figure 1, the age and wealth of the
institution are initially powerful indicators of prestige in Model 1 buttheir importance subsequently diminishes and disappears with the intro-duction of the faculty and student and outcomes variables. This sug-gests that institutional age, size and wealth provide the foundations forwhat follows. The importance of institutional size as a determinant ofuniversity reputation is strengthened by the fact that the size variablehad the largest beta weight in the regression model, regardless of howsize was measured. For example, we tried using total faculty and totaldegrees awarded in place of total enrollment. The results were similar.Although Median SAT Score is the strongest variable in the analysiswhen it is entered in Model 2, it becomes less important once the out-comes are entered in Model 3. In the final analysis, three measures arealmost equally important contributors to the measure of academic repu-tation among research universities: total enrollment, average full profes-sor salary, and graduation rate. When cost-of-living adjusted salarieswere tried in the model in place of non-adjusted salaries, the resultswere not as robust. Faculty productivity and alumni giving also contrib-ute significantly and positively to the variance in reputation. Thestudent–faculty ratio is a consistent negative contributor.
Liberal Arts Colleges
Table 4 shows the results of the hierarchical set-wise OLS regressionmodels for liberal arts college reputation. The first group of variablesentered into the model (control, age, size, and wealth) explains 30% ofthe variance in institutional reputation scores. Adding faculty and stu-dent variables (Model 2) results in a large increase in explained variancein college reputation to almost 87%. Similar to the research universitymodels, adding faculty productivity and student outcomes variables(Model 3) adds little to the explained variance in reputation scores ofliberal arts colleges. The final model shows seven variables that aresignificant at the .05 level, in contrast to eight in the final research
140 VOLKWEIN AND SWEITZER
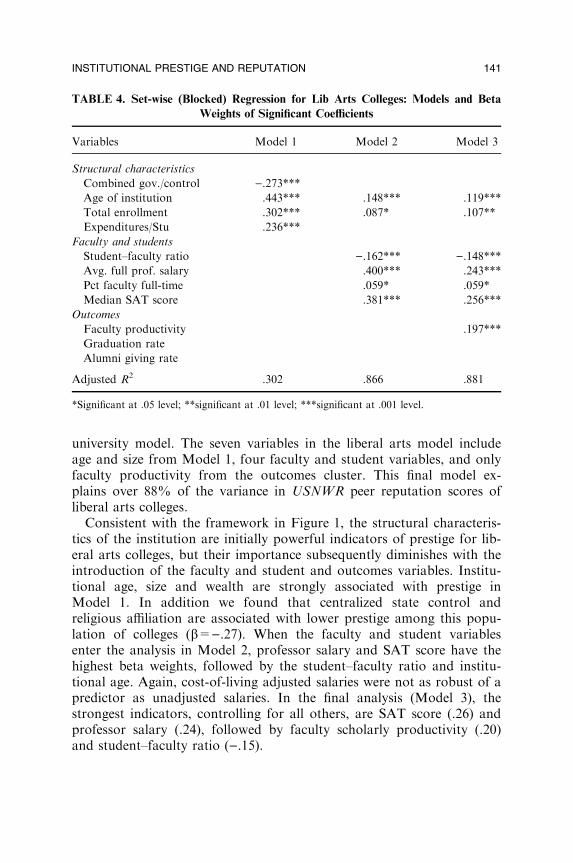
university model. The seven variables in the liberal arts model includeage and size from Model 1, four faculty and student variables, and onlyfaculty productivity from the outcomes cluster. This final model ex-plains over 88% of the variance in USNWR peer reputation scores ofliberal arts colleges.Consistent with the framework in Figure 1, the structural characteris-
tics of the institution are initially powerful indicators of prestige for lib-eral arts colleges, but their importance subsequently diminishes with theintroduction of the faculty and student and outcomes variables. Institu-tional age, size and wealth are strongly associated with prestige inModel 1. In addition we found that centralized state control andreligious affiliation are associated with lower prestige among this popu-lation of colleges (b=).27). When the faculty and student variablesenter the analysis in Model 2, professor salary and SAT score have thehighest beta weights, followed by the student–faculty ratio and institu-tional age. Again, cost-of-living adjusted salaries were not as robust of apredictor as unadjusted salaries. In the final analysis (Model 3), thestrongest indicators, controlling for all others, are SAT score (.26) andprofessor salary (.24), followed by faculty scholarly productivity (.20)and student–faculty ratio ().15).
TABLE 4. Set-wise (Blocked) Regression for Lib Arts Colleges: Models and Beta
Weights of Significant Coefficients
Variables Model 1 Model 2 Model 3
Structural characteristics
Combined gov./control ).273***Age of institution .443*** .148*** .119***
Total enrollment .302*** .087* .107**
Expenditures/Stu .236***
Faculty and students
Student–faculty ratio ).162*** ).148***Avg. full prof. salary .400*** .243***
Pct faculty full-time .059* .059*
Median SAT score .381*** .256***
Outcomes
Faculty productivity .197***
Graduation rate
Alumni giving rate
Adjusted R2 .302 .866 .881
*Significant at .05 level; **significant at .01 level; ***significant at .001 level.
INSTITUTIONAL PRESTIGE AND REPUTATION 141

This analysis of prestige among liberal arts colleges suggests thatstructural characteristics serve as foundations for the faculty and stu-dent variables that follow. College age and size remain as significantindicators throughout the analysis, but average professor salary, SATscores, faculty productivity and student–faculty ratio become moreimportant contributors to institutional reputation. These results holdtrue regardless of how size and salary are measured.In sum, the Tables 3 and 4 results for both universities and colleges
suggest the accuracy of our conceptual model, which assumes that theinstitutional governance, age, size, and resource variables serve as foun-dations for faculty and student recruitment, then faculty productivityand student outcomes that come later and combine to produce institu-tional reputation.
DISCUSSION AND LIMITATIONS
This study develops a conceptual model of hypothetical influences oninstitutional prestige among American colleges and universities. Weexamine the empirical support for this model using a larger collection ofmeasures at a larger array of institutions than any earlier studies. Ourregression models for predicting the USNWR reputation score appearextremely robust, not only for the 242 public and private research uni-versities, but also for the 205 liberal arts colleges. Recognizing thattogether they represent only about one-third of the nation’s bachelor’sdegree-granting institutions of higher education, we nevertheless con-clude that the results of the USNWR survey are highly predictable fromknowing the faculty salaries, enrollments, and student admissions pro-files of these institutions. Disappointingly, the power of prediction is notgreatly increased by knowing something about student and facultyoutcomes.Although we used a systems model to guide our research, our results
are very congruent with a resource dependence perspective. Colleges anduniversities interact with their environments in ways that enhance theacquisition of human and financial resources. They compete in themarket place for talented students and talented faculty by investing infaculty and student recruitment, as well as in the services and activitiesthat make the institution more attractive. The budgets of public andprivate institutions alike are substantially enrollment driven, thusproviding incentives to raise enrollment, rather than lower it. As everyadmissions director knows, success in the competition for studentsdepends on institutional attractiveness, admissions selectivity, and high
142 VOLKWEIN AND SWEITZER

SAT scores. As every president and provost knows, success in the com-petition for faculty depends on high salaries and favorable working con-ditions. Our analysis suggests that older, larger, and wealthierinstitutions have an edge in the competition for faculty, students, andprestige.The results of Tables 3 and 4 suggest that prestige has a slightly dif-
ferent set of dynamics among liberal arts colleges versus research uni-versities. For both types of institutions, age and wealth serve asimportant foundations for the student–faculty ratio, freshman selectiv-ity, and faculty salaries. Among all 447 institutions, median SAT scoreand compensation for full professors, not adjusted for cost-of-living,appear as strong indicators of prestige. However, enrollment size,expenditures per student, and graduation rates appear to be moreimportant shapers of prestige among research universities, while institu-tional age, governance, admission’s selectivity, and faculty per capitapublications productivity appear to be more important among liberalarts colleges. In part, these are interesting discoveries because weexpected regulatory control and faculty productivity to be more stronglyassociated with research universities. Instead, we found for liberal artscolleges that control is associated negatively with prestige and publica-tions per full-time faculty is associated positively. This might beexpected for research universities, but not for the teaching-oriented,mostly private liberal arts colleges. Evidently, non-church relatedcolleges in more laissez-faire states receive higher prestige ratings.Regarding faculty productivity, we noticed that there is more variabilityin per capita publications among liberal arts colleges than amongresearch universities. Faculty at the higher ranked liberal arts collegespublish many more journal articles than those at their lower rankedpeers, despite the emphasis on the teaching mission at liberal arts insti-tutions. Thus, the variability of faculty productivity is higher at the 205colleges than at the 242 universities.Another interesting finding is the importance of size for both types of
institutions, despite their dramatic differences. Studies of research uni-versities have long suggested that bigger is better, but our findings sug-gest that the larger liberal arts colleges also enjoy more robustreputations than their smaller counterparts. Also, as mentioned above,institutional size is an important determinant of reputation regardless ofthe measure of size. Whether measured by enrollment, by the number offaculty, or by the number of degrees awarded, the size variableappeared in the same order of significance in all three models in bothpopulations.
INSTITUTIONAL PRESTIGE AND REPUTATION 143
The importance of graduation rate also varies between the two cate-gories of institutions. Among research universities, graduation rate issignificantly associated with the reputational measure, whereas amongliberal arts colleges it is not. This may be in part due to the greatervariability in graduation rates among universities.Our study is not without its limitations. Our measure of prestige is
rather narrow, consisting of the shared judgments of a maximum ofthree people on each of 1400 campuses—the president or CEO, the pro-vost or chief academic officer, and the chief admissions officer.Although US News collects the ‘‘peer assessment’’ from thousands ofadministrative officials each year, and although these ratings have exhib-ited a high degree of stability over time, these assessments do notinclude the more public perceptions of students, parents, trustees, andthe media. We do not know exactly how presidents and provosts andadmissions directors obtain the information that determines their rat-ings, but it seems obvious that they are sensitive to the market withinwhich each institution is competing, and that faculty salaries and fresh-man SAT scores are prominent hallmarks of success in each market.Examining how these three groups of respondents form their impres-sions constitutes a fruitful area for further research. The high correla-tions we found among the USNWR peer score, professor’s salaries,freshman SAT scores, and the various guidebook ratings suggests thatthe whole process may be mutually reinforcing. Geiger (2004) refers tothis as the selectivity sweepstakes.Another limitation is that we include only national universities and
liberal arts colleges in our analyses, and there is a wide array of otherregional and local institutions of higher education. Moreover, we arenot able to collect data from the same year. The vast majority of ourindicators are from 2003, the year before the 2004 ratings werepublished. However, we relied on information from the 1990s for theregulatory control measures, and the scholarly productivity variablesaggregate the faculty publications from 1999 to 2003. To undertake thestudy, we assumed that most institutional, faculty, and studentcharacteristics represented in the study do not change dramatically fromyear-to-year, especially not in relative terms.Readers should not assume that prestige equals educational quality. A
stream of research now indicates that what happens to students afterthey arrive on campus is much more important to their educational out-comes than the backgrounds they bring with them, the resources onhand, and the prestige of the institution (Pascarella and Terenzini, 1991,2005; Strauss and Volkwein 2002, 2004; Terenzini and Pascarella 1994;Volkwein, 2003). In fact, the studies summarized by Pascarella and
144 VOLKWEIN AND SWEITZER
Terenzini suggest that prestige and educational effectiveness may berelatively independent of each other.Nevertheless, an institution’s prestige can be measured, and it does
influence the behavior of administrators, faculty, students, and parents(Monks and Ehrenberg, 1999; Volkwein and Grunig, 2005). Theinstitution’s attractiveness has an impact on enrollments and resources(Szelest, 2003), and sometimes this encourages an array of questionableinstitutional behaviors that scholars have documented. Although therankings influence decisions by students and parents, the USNWRrankings appear to have an even more powerful influence on trustees,alumni, faculty, large donors, and college presidents, provosts, anddeans (Ehrenberg 2000, 2003; Hossler, 2000; Hossler and Foley, 1995;Litten and Hall, 1989; Machung, 1998; McGuire, 1995; Monks andEhrenberg, 1999; Walleri and Moss, 1995).We conclude from this study that the findings generally support the
accuracy of our model. Institutional control, age, size, and resourcesserve as foundations for faculty and student recruitment and support.Talented faculty and students interact, producing instructional andscholarly outcomes that combine to shape institutional attractivenessand prestige.Our model and research should be expanded in several directions. We
would like to explore better measures of faculty talent and effort, andstudent talent and effort, at a more complete range of institutions. Thestudent experiences and educational outcomes of community college andtransfer and adult students have been greatly under-examined in mostof the research on this topic. Nothing in our study assesses the educa-tional experiences of individual students, although there are a numberof instruments now designed to do that. Examples of such instrumentsare the College Student Experiences Questionnaire, the National Surveyof Student Engagement, the College Student Survey, and the CollegeResults Instrument. Such instruments, among others, have the potentialto eventually replace the reputation and resources approach to the rat-ings game, especially if they are used to identify and describe effectiveinstitutions, rather than to rank them.Significant change in academic organizations takes three to four years
to become visible, so yearly surveys and annual published rankings seemto be produced solely for the purpose of boosting sales. Colleges changeglacially, not year-to-year, so the less frequent collection andpublication of these reputational indicators is a practice that should beencouraged.
INSTITUTIONAL PRESTIGE AND REPUTATION 145
REFERENCES
Adams, A., and Krislov, J. (1978). Evaluating the quality of American universities: A new
approach. Research in Higher Education 8(2): 97–109.
American Association of University Professors. (2002). Facts and Figures, Faculty Salaries,
2001–02. Retrieved on Feb. 2, 2004 from http://chronicle.com.ezproxy.libraries.psu.edu/
stats/aaup/2002/.
Astin, A. W. (1970). How colleges are rated. Change 2(1): 11–86.
Astin, A. W., and Lee, C. B. T. (1972). The Invisible Colleges, McGraw-Hill, New York.
Astin, A. W., and Solomon, L. C. (1981). Are reputational ratings needed to measure quality?.
Change 13(2): 14–19.
Barron’s Profiles of American Colleges (25th ed.). (2003). Hauppauge, NY: Barron’s
Educational Series.
Blau, P. M. (1994). The Organization of Academic Work, (2nd ed.) Transaction Publishers, New
Brunswick, NJ.
Brown, D. (1967). The Mobile Professors, The American Council on Education, Washington,
D.C.
Burke, J. M. (ed.) (2004). 2004 Higher Education Directory, Higher Education Publications,
Inc, Falls Church, VA.
de Groot, H., McMahon, W., and Volkwein, J. F. (1991). The cost structure of American
research universities. Review of Economics and Statistics 73(3): 424–431.
Dorans, N. J., Lyu, C. F., Pommerich, M., and Houston, W. M. (1997). Concordance between
ACT assessment and recentered SAT I sum scores. College and University 73(2): 24–35.
Ehrenberg, R. G. (2000). Tuition Rising: Why College Costs so Much, Harvard University Press,
Cambridge, MA.
Ehrenberg, R. G. (2003). Reaching for the brass ring: The U.S. News & World Report rankings
competition. The Review of Higher Education 26(2): 145–62.
Ehrenberg, R., and Hurst, P. (1998). The 1995 NRC ratings of doctoral programs: A hedonic
model. Economics of Education Review 17(2): 137–148.
Fiske, E. B., and Logue, R. (2003). The Fiske Guide to Colleges 2004, Sourcebooks, Inc,
Naperville, IL.
Geiger, R. L. (2004). Knowledge and Money: Research Universities and the Paradox of the
Marketplace, Stanford University Press, Stanford, CA.
Graham, H. D., and Diamond, N. A. (1997). The Rise of American Research Universities: Elites
and Challengers in the Postwar Era, Johns Hopkins University Press, Baltimore, MD.
Grunig, S. D. (1997). Research, reputation, and resources: The effect of research activity on
perceptions of undergraduate education and institutional resource acquisition. Journal of
Higher Education 68(1): 17–52.
Hossler, D. (2000). The problem with college rankings. About Campus 5(1): 20–24.
Hossler, D., and Foley, E. M. (1995). Reducing the noise in the college choice process: The use
of college guidebooks and ratings. In: Walleri, R. D., and Moss, M. K. (eds.), Evaluating and
Responding to College Guidebooks and Rankings, New Directions for Institutional Research,
Vol. 88, Jossey-Bass, San Francisco, pp. 21–30.
Litten, L. H., and Hall, A. E. (1989 July/August). In the eyes of our beholders: Some evidence
on how high school students and their parents view quality in colleges. Journal of Higher
Education 60(3): 302–324.
Machung, A. (1998 July/August). Playing the rankings game. Change 30(4): 12–16.
146 VOLKWEIN AND SWEITZER

McGuire, M. D. (1995). Validity issues for reputational studies. In: Walleri, R. D., and Moss,
M. K. (eds.), Evaluating and Responding to College Guidebooks and Rankings, New Directions
for Institutional Research, Jossey-Bass, San Francisco, CA, pp. 45–60.
Monks, J., and Ehrenberg, R. G. (1999). U. S. News & World Report’s college rankings: Why
they do matter. Change 31(6): 42–51.
Pascarella, E. T., and Terenzini, P. T. (1991). How college affects students: Findings and insights
from twenty years of research, Jossey-Bass, San Francisco, CA.
Pascarella, E. T., and Terenzini, P. T. (2005). How College Affects Students: A Third Decade of
Research, Vol. 2, Jossey-Bass, San Francisco, CA.
Peterson’s. (2003). Four-year Colleges 2004, (34nd ed.) Thomson-Peterson’s, Princeton, NJ.
Porter, S. R., and Toutkoushian, R. K. (2002). Institutional research productivity and the
connection to average student quality and overall reputation. Paper presented at the 2002
annual meetings of the Western Economic Association, Seattle, WA.
Porter, S. R., and Umbach, P. D. (2001). Analyzing faculty workload using multilevel
modeling. Research in Higher Education 42(2): 171–196.
Schmitz, C. C. (1993). Assessing the validity of higher education indicators. Journal of Higher
Education 64(5): 503–521.
Sklaroff, S. (ed.) (2003). America’s Best Colleges 2004 Edition., U.S. News & World Report,
Washington, D.C.
Solomon, L. C., and Astin, A. W. (1981 April). A new study of excellence in undergraduate
education – Part one: Departments without distinguished graduate programs. Change 13(1):
22–28.
Strauss, L. C., and Volkwein, J. F. (2002 April). Comparing student performance and growth in
two-year and four-year institutions. Research in Higher Education 43(2): 133–161.
Strauss, L. C., and Volkwein, J. F. (2004 March/April). Predictors of student commitment at
two-year and four-year institutions. Journal of Higher Education 75(2): 203–227.
Szelest, B. P. (2003). A systems dynamic assessment of organization strategic goal realization:
Case study of a public research university, Dissertation, State University of New York at
Albany.
Terenzini, P. T., and Pascarella, E. T. (1994, Jan/Feb). Living with myths: Undergraduate
education in America. Change 26(1): 28–32.
The Princeton Review (2003). Complete Book of Colleges 2004 Edition, Princeton Review
Publishing, New York.
Toutkoushian, R. T., Porter, S. R., Danielson, C., and Hollis, P. (2003). Using publications
counts to measure an institution’s research productivity. Research in Higher Education 44(2):
121–48.
United States Bureau of the Census. (2002). Cost of living index – selected metropolitan areas:
Fourth quarter 2001, Statistical abstract of the United States, 2002.
Volkwein, J. F. (1989). Changes in quality among public universities. Journal of Higher
Education 60(2): 136–151.
Volkwein, J. F. (2003). Using and enhancing existing data to respond to campus challenges. In:
Stage, Francis K., and Manning, Kathleen (eds.), Chap 12 in Research in the College Context:
Approaches and Methods, Brunner-Routledge, New York, pp. 183–207.
Volkwein, J. F., and Grunig, S. D. (2005). Reputation ratings in higher education: double,
double, toil and trouble. In: Joseph, Burke (ed.) Achieving Accountability In Higher
Education: Balancing Public, Academic, and Market Demands, Chapter 11, Jossey-Bass, San
Francisco, CA, pp. 246–274.
Volkwein, J. F., and Malik, S. (1997). State regulation and administrative flexibility at public
universities. Research in Higher Education 38(1): 17–42.
INSTITUTIONAL PRESTIGE AND REPUTATION 147

Walleri, R. D., and Moss, M. K. (ed). (1995). Evaluating and responding to college guidebooks
and rankings. New Directions for Institutional Research, 88, Jossey-Bass, San Francisco, CA.
Zheng, H. Y., and Stewart, A. A. (2002). Assessing the performance of public research
universities using NSF/NCES data and data envelopment analysis technique. AIR
Professional File 83: 1–21.
Zumeta, W. (1996). Meeting the demand for higher education without breaking the bank: A
framework for the design of state higher education policies for an era of increasing demand.
Journal of Higher Education 67(4): 367–425.
Received June 6, 2005.
148 VOLKWEIN AND SWEITZER