Colleges Mathematical Literacy - Via Afrika
128
OBE for FET Colleges Mathematical Literacy Level 3 Lecturer’s Guide nc edition R Mahlobo M Mlangeni M Molusi LVL 3MATHSa.indb i LVL 3MATHSa.indb i 12/14/2007 2:26:01 PM 12/14/2007 2:26:01 PM
-
Upload
khangminh22 -
Category
Documents
-
view
1 -
download
0
Transcript of Colleges Mathematical Literacy - Via Afrika

OBE for FET
Colleges Mathematical Literacy
Level 3 Lecturer’s Guide
nc edition
R Mahlobo
M Mlangeni
M Molusi
LVL 3MATHSa.indb iLVL 3MATHSa.indb i 12/14/2007 2:26:01 PM12/14/2007 2:26:01 PM

40 Heerengracht, Cape Town, 8001PO Box 5197, Cape Town, 8000
Website: http://www.nasou-viaafrika.com
Cover design by Nasou Via Afrika
Printed and bound by Paarl Print, Oosterland Street,
Paarl, South Africa
ISBN-13: 978-141-540-309-9
First published 2007
© All rights reserved
No part of this book may be reproduced or transmitted in any form or by any means, electronic or mechanical, including photocopying, recording, or any information storage and retrieval system, without permission in writing from the publisher.
Other books available in this series for the Vocational Programme for the Other books available in this series for the Vocational Programme for the National Certificate Level 2 and 3: are:National Certificate Level 2 and 3: are:
9781415402436 OBE for FET Colleges English Langauge Level 2 SB
9781415402443 OBE for FET Colleges English Langauge Level 2 LG
9781415406168 OBE for FET Colleges English Langauge L3 SB
9781415402467 OBE for FET Colleges Physical Sciences Level 2 SB
9781415407066 OBE for FET Colleges Physical Sciences L3 SB
9781770048904 OBE for FET Colleges Mathematical Literacy Level 2 SB
9781770048911 OBE for FET Colleges Mathematical Literacy Level 2 LG
9781770048928 OBE for FET Colleges Mathematics L2 SB
9781770048935 OBE for FET Colleges Mathematicss L2 LG
9781415403044 OBE for FET Colleges Mathematics L3 SB
9781415403051 OBE for FET Colleges Mathematics L3 LG
9781415403082 OBE for FET Colleges Mathematical Literacy L3 SB
9781415403099 OBE for FET Colleges Mathematical Literacy L3 LG
9781415401767 OBE for FET Colleges Science of Tourism Level 2 Student’s Guide
LVL 3MATHSa.indb iiLVL 3MATHSa.indb ii 12/14/2007 2:26:39 PM12/14/2007 2:26:39 PM

mathlit lvl3 tg pre intro.indd iiimathlit lvl3 tg pre intro.indd iii 12/14/2007 3:38:25 PM12/14/2007 3:38:25 PM
9781415401781 OBE for FET Colleges Science of Tourism Level 2 Educator’s Guide
9781415401859 OBE for FET Colleges Sustainable Tourism in SA Level 2 Student’s Guide
9781415401873 OBE for FET Colleges Sustainable Tourism in SA Level 2 Educator’s Guide
9781415401941 OBE for FET Colleges Tourism Operations & Technology Level 2 Student’s Guide
9781415401965 OBE for FET Colleges Tourism Operations & Technology Level 2 Educator’s Guide
9781770049826 OBE for FET Colleges Financial Management Level 2 Student’s Guide
9781770049987 OBE for FET Colleges Financial Management Level 2 Educator’s Guide
9781415402948 OBE for FET Colleges Financial Management Level 2 Workbook
9781770049987 OBE for FET Colleges Financial Management Level 2 Educator’s Guide
9781415401224 OBE for FET Colleges Economic Environment Level 2 Student’s Guide
9781415401248 OBE for FET Colleges Economic Environment Level 2 Educator’s Guide
9781415401583 OBE for FET Colleges Client Services and Human Relations Level 2 Student’s Book
9781415401606 OBE for FET Colleges Client Services and Human Relations Level 2 Lecturer’s Guide
9781415401491 OBE for FET Colleges Food Preparation Level 2 Student’s Book
9781415401514 OBE for FET Colleges Food Preparation Level 2 Lecturer’s Guide
9781415401675 OBE for FET Colleges Hospitality Services Level 2 Student’s Book
9781415401699 OBE for FET Colleges Hospitality Services Level 2 Lecturer’s Guide
9781415401439 OBE for FET Colleges Hospitality Generics Level 3 Student’s Book
9781415401453 OBE for FET Colleges Hospitality Generics Level 3 Lecturer’s Guide
9781415401408 OBE for FET Colleges Hospitality Generics Level 2 Student’s Guide
9781415401422 OBE for FET Colleges Hospitality Generics Level 2 Student’s Guid
9781415401521 OBE for FET Colleges Food Preparation Level 3 Student’s Book
9781415401545 OBE for FET Colleges Food Preparation Level 3 Lecturer’s Guide
9781415401613 OBE for FET Colleges Client Services and Human Relations Level 3 Student’s Book
9781415401637 OBE for FET Colleges Client Services and Human Relations Level 3 Lecturer’s Guide
9781415401705 OBE for FET Colleges Hospitality Services Level 3 Student’s Book
9781415401729 OBE for FET Colleges Hospitality Services Level 3 Lecturer’s Guide
9781415401255 OBE for FET Colleges Economic Environment Level 3 Student’s Book
9781415401279 OBE for FET Colleges Economic Environment Level 3 Lecturer’s Guide
9781415402955 OBE for FET Colleges Financial Management Level 3 Workbook

LVL 3MATHSa.indb ivLVL 3MATHSa.indb iv 12/14/2007 2:26:39 PM12/14/2007 2:26:39 PM
9781415400012 OBE for FET Colleges Financial Management Level 3 Student’s Book
9781415400036 OBE for FET Colleges Financial Management Level 3 Lecturer’s Guide
9781770048942 OBE for FET Colleges Afritech Electronics Level 2 LB
9781770048959 OBE for FET Colleges Afritech Electronics Level 2 LG
9781770048966 OBE for FET Colleges Afritech Electrical Principles and Practice Level 2 SB
9781770048973 OBE for FET Colleges Afritech Electrical Principles and Practice Level 2 LG
9781415405062 OBE for FET Colleges Business Practice Level 2 Student’s Book
9781415405079 OBE for FET Colleges Office Practice Level 2 Student’s Book
9781415404232 OBE for FET Colleges Business Practice L3 SB
9781415404249 OBE for FET Colleges Business Practice L3 LG
9781415400081 OBE for FET Colleges Entrepreneurship Level 2 Student’s Book
9781415404218 OBE for FET Colleges Office Practice L3 SB
9781415404225 OBE for FET Colleges Office Practice L3 LG
9781415405086 OBE for FET Colleges Office Data Processing Level 2 Student’s Book
9781415404256 OBE for FET Colleges Office Data Processing L3 SB
9781415404263 OBE for FET Colleges Office Data Processing L3 LG
9781415405093 OBE for FET Colleges Management Practice Level 2 Student’s Book
9781415404270 OBE for FET Colleges Management Practice L3 SB
9781415404287 OBE for FET Colleges Management Practice L3 LG
9781415405109 OBE for FET Colleges Operations Management Level 2 Student’s Book
9781415404294 OBE for FET Colleges Operations Management L3 SB
9781415404300 OBE for FET Colleges Operations Management L3 LG
9781415404317 OBE for FET Colleges Project Management L3 SB
9781415404324 OBE for FET Colleges Project Management L3 LG
9781415402030 OBE for FET Colleges Life Orientation Level 2 Student’s Guide
9781415402054 OBE for FET Colleges Life Orientation Level 2 Educator’s Guide
9781415401316 OBE for FET Colleges New Venture Creation Level 2 Student’s Guide
9781415401330 OBE for FET Colleges New Venture Creation Level 2 Educator’s Guide
9781415401798 OBE for FET Colleges Science of Tourism Level 3 Student’s Guide
9781415401811 OBE for FET Colleges Science of Tourism Level 3 Educator’s Guide
9781415401880 OBE for FET Colleges Sustainable Tourism in SA and Regional Travel Level 3 Student’s Guide
9781415401903 OBE for FET Colleges Sustainable Tourism in SA and Regional Travel Level 3 Educator’s Guide

Contents
Module 1: Numbers are a part of our lives!Module 1: Numbers are a part of our lives! 1
Unit 1: Counting numbers, integers, fractions, percentages
and time notations 1
Unit 2: Why are patterns so important in our lives? 11
Unit 3: Focus on finance 23
Unit 4: Space, Shape and orientation vocabulary and calculation 26
Module 2: All forms of pattern around us!Module 2: All forms of pattern around us! 32
Unit 5: Calculations and measuring techniques 32
Unit 6: Identifying and using information from patterns to solve
workplace problem 39
Unit 7: Solving workplace-based problems and using
representations 55
Unit 8: Collecting and representation information 58
Module 3: Representing solutions of real life problems!Module 3: Representing solutions of real life problems! 65
Unit 9: Using different representations of relationships to solve
problems involving patterns in real life 65
Unit 10: Financial knowledge power! 79
Unit 11: Information presented and misrepresented 82
Module 4: Integrated module!Module 4: Integrated module! 88
Unit 12: Integrated unit 88
Unit 13: Integrated unit 91
LVL 3MATHSa.indb vLVL 3MATHSa.indb v 12/14/2007 2:26:39 PM12/14/2007 2:26:39 PM

LVL 3MATHSa.indb viLVL 3MATHSa.indb vi 12/14/2007 2:26:39 PM12/14/2007 2:26:39 PM
Commonly used acronymsAG Assessment Guideline
CCO Critical Cross-field Outcomes
DoE Department of Education
EMS Economic and Management Sciences
FET Further Education and Training
GET General Education and Training
HET Higher Education and Training
HIV/Aids Human Immunodeficiency Virus/Acquired Immune Deficiency Syndrome
ICASS Internal Continuous Assessment
IKS Indigenous Knowledge Systems
LB Student’s Book
LO Learning Outcome
LP Learning Programme
LSEN Students with Special Education Needs
LSM Student Support Material
LTSM Learning and teaching support materials
NC National Certificate
NCS National Curriculum Statement
NSC National Senior Certificate
NQF National Qualifications Framework
OBE Outcomes-based Education
SAG Subject Assessment Guideline
SO Subject Outcome
TG Lecturer’s Guide

i
IntroductionThis series for the subject Mathematical literacy offers a Lecturer’s guide and a Student’s Book Level 3 in the Further Education and Training (FET) Colleges. The content of the Lecturer’s Guide and the Student’s Book has been integrated for better teaching and learning where all topics are covered in a module within a term.
How to use this Lecturer’s GuideHow to use this Lecturer’s Guide
Every topic in the Lecturer’s Guide includes guidance and additional information.
Solutions and teaching tipsSolutions and teaching tips
The sections on guidance and additional information offer useful suggestions on how to present the learning material, how to prepare and how to conduct each activity. Ideas for individual, pair, group, class and Portfolio of Evidence activities have been designed to cover the LOs
Possible solutions to questions in the Lecturer’s Guide are also provided for most of the activities. Although you will find these suggestions useful when preparing a lesson, you can choose to adapt these methods or to use your own, since you know what will work best for your students. Additional information is intended to serve as background for the lecturer is supplied for some of the activities.
Assessment should be continuous. At the end of each unit in the Student’s Book, there is an opportunity for self-assessment by the students or peer-/lecturer-assessment as well as cumulative assessment at end of the topic which can be used as a test or examination should a lecturer wishes to do so.. These formative assessment questions are directly linked to the LOs of each unit.
In each unit in this Lecturer’s Guide, guidance has been given regarding assessment for the activities in the Student’s Book. Some additional assessment opportunities are also included. Rubrics and checklists have been prepared to assist you with assessment (You can choose to use these assessment tools as they are, or adapt them to suit your specific needs. At the end of each topic in this Lecturers Guide, there is a grid summarising the assessment for each activity. This could be used or adapted for Portfolio of Evidence assessment purposes for each student.
Using this Lecturer’s Guide with the Student’s BookUsing this Lecturer’s Guide with the Student’s Book
Icons have been used throughout the Student’s Book to consolidate and facilitate the learning process, and to adopt an interactive approach between the student and the text. The icons indicate different types of activity - for example, a group or a question or feedback activity. The icons are also used to indicate what is being dealt with - for example, outcomes, assessment, career links or a cross reference to something else.
LVL 3MATHSa.indb Sec1:iLVL 3MATHSa.indb Sec1:i 12/14/2007 2:26:40 PM12/14/2007 2:26:40 PM

ii
Cross reference Cross reference This icon shows forward or backward links or references to other sec-tions in the book.
OutcomesOutcomes Outcomes appear in the outcomes table at the beginning of each unit. The students should achieve these unit outcomes, which are derived from the Subject Outcomes and the Learning Outcomes in the National Certificate (‘Finance, Economics & Accounting) Mathematical literacy Subject Guidelines.
IndividualIndividual This icon indicates that students should work on their own.
Pair workPair work This icon indicates that the students should work in pairs.
Group work Group work This icon indicates that the students should works in groups. Groups of four or five students are usually ideal, but depend on the type of activity.
Minds This icon indicates knowledge outcomes that students should have acquired.
HandsHands This icon shows skills-based outcomes or activities developed for students to apply knowledge (and values) that they have acquired.
HeartsHearts This icon shows values-based outcomes that assist the students to express or develop particular values (or attitudes) to the issues raised.
The new curriculumThe new curriculum
A process of transforming education and training to realise the aims of our democratic society and of the Constitution has been underway since 1994. As part of this process, the outcomes-based curriculum (OBE) was developed as one united curriculum for all school students in the General Education and Training (GET) and Further Education and Training (FET) bands.
The OBE curriculum was designed to be student-centred, integrated and holistic, relevant to students’ lives and the needs of the country, and to promote critical and creative thinking.
What has changed?
The table below outlines some of the changes and compares terms used in the pre-OBE and OBE stages.
LVL 3MATHSa.indb Sec1:iiLVL 3MATHSa.indb Sec1:ii 12/14/2007 2:26:40 PM12/14/2007 2:26:40 PM

iii
Pre-OBE OBE
Old terms/phrases New terms/phrases.
Core syllabus Subject Guidelines
Scheme of work A Learning Programme consists of 3 stages of planning1. Subject Framework (3 year plan or Band plan per Subject)2. Work Schedule per level per subject3. Lesson Plans
Aims/themes/topics Subject outcomes (SOs)
Objectives /content Assessment standards (ASs)
Lesson plan Lesson plan
Text books Learning and Teaching Support Materials (LTSM) – includes various learning and teaching resources like CDs, videos, text books, etc.
Learning/syllabus is content-driven.Rote learning takes place.
Learning is outcomes-based. The curriculum is relevant, communica-tive, connected to real-life situations and provides for the develop-ment of knowledge, skills , values and attitudes in an integrated way.
Traditional teaching methods may have included learning being textbook-driven.
Traditional teaching methods are enhanced through methods that require the students to be actively involved.
Lecturer-centred Student-centred and lecturer plays a facilitator/mediator role.
Students’ work is assessed by the lecturer
A variety of assessment methods is used (self-assessment, peer as-sessment, group assessment, lecturer assessment, etc.).
Test-based assessment Observation, Test and Task-based assessment takes place.
Lecturer is responsible for learn-ing – motivation depends on the personality of the lecturer.
Students take responsibility for their own learning – students are motivated by constant feedback and affirmation.
Purpose of Mathematical literacyPurpose of Mathematical literacy
• Why is the subject important?
In order to be a more effective: self-managing individuals; contributing workers; life-long students; and critical citizens in the modern world people need to be able to engage with the numbers, numerically-based arguments and data represented (and misrepresented) in a large variety of ways that confront them on a day-to-day basis. Mathematical Literacy develops the knowledge, skills, attitudes and values that enable people to do so.
• The link between the learning outcomes and the critical and developmental outcomes
Mathematical Literacy aims to:
• Develop logical thought processes
• Develop analytical ability
• Encourage systematic approach to solving problems
• Lead students to identify and solve problems
LVL 3MATHSa.indb Sec1:iiiLVL 3MATHSa.indb Sec1:iii 12/14/2007 2:26:40 PM12/14/2007 2:26:40 PM
iv
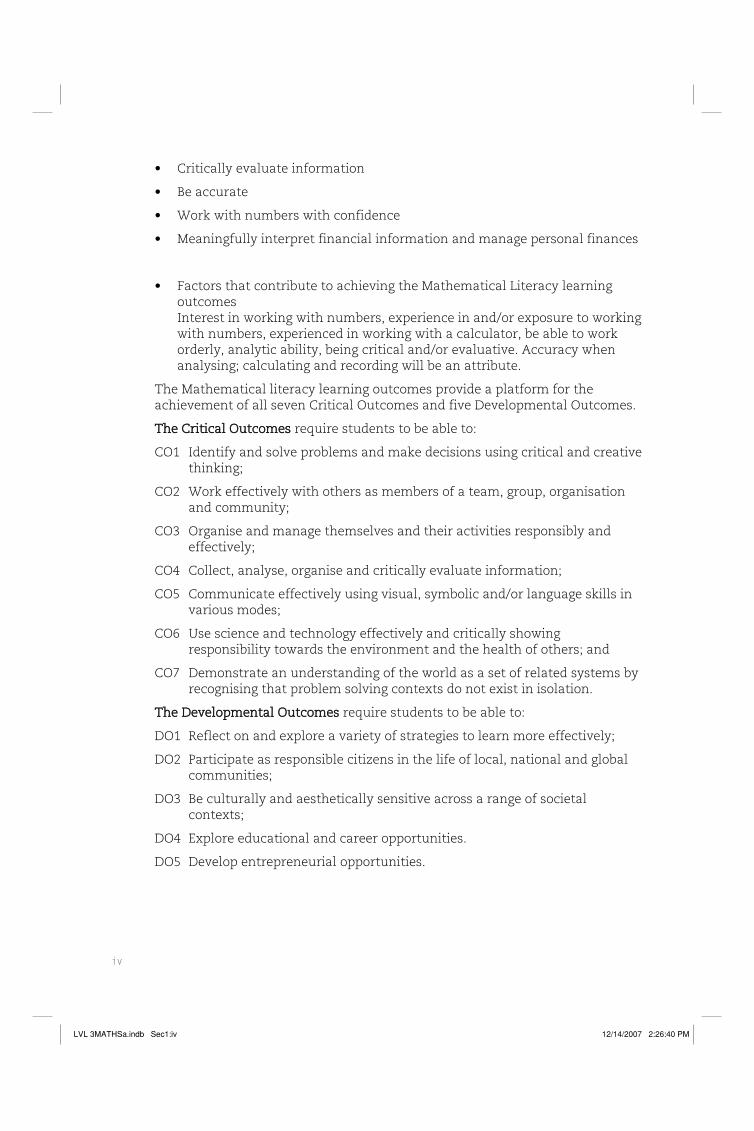
• Critically evaluate information
• Be accurate
• Work with numbers with confidence
• Meaningfully interpret financial information and manage personal finances
• Factors that contribute to achieving the Mathematical Literacy learning outcomes Interest in working with numbers, experience in and/or exposure to working with numbers, experienced in working with a calculator, be able to work orderly, analytic ability, being critical and/or evaluative. Accuracy when analysing; calculating and recording will be an attribute.
The Mathematical literacy learning outcomes provide a platform for the achievement of all seven Critical Outcomes and five Developmental Outcomes.
The Critical Outcomes The Critical Outcomes require students to be able to:
CO1 Identify and solve problems and make decisions using critical and creative thinking;
CO2 Work effectively with others as members of a team, group, organisation and community;
CO3 Organise and manage themselves and their activities responsibly and effectively;
CO4 Collect, analyse, organise and critically evaluate information;
CO5 Communicate effectively using visual, symbolic and/or language skills in various modes;
CO6 Use science and technology effectively and critically showing responsibility towards the environment and the health of others; and
CO7 Demonstrate an understanding of the world as a set of related systems by recognising that problem solving contexts do not exist in isolation.
The Developmental OutcomesThe Developmental Outcomes require students to be able to:
DO1 Reflect on and explore a variety of strategies to learn more effectively;
DO2 Participate as responsible citizens in the life of local, national and global communities;
DO3 Be culturally and aesthetically sensitive across a range of societal contexts;
DO4 Explore educational and career opportunities.
DO5 Develop entrepreneurial opportunities.
LVL 3MATHSa.indb Sec1:ivLVL 3MATHSa.indb Sec1:iv 12/14/2007 2:26:40 PM12/14/2007 2:26:40 PM

v
InclusivityInclusivity
Students with special needs should not be excluded from any activities. These students should get the opportunity to decide at which point to stop or take up different tasks. Students with special needs are not only students who need more time to complete an activity or who complete work very quickly, but any student who may have a barrier to learning, such as a medical condition (e.g. epilepsy, asthma, wheelchair-bound, and so on), visual impairment, speech impediment or language difference.
Adapting the curriculum to include students at all levels is not an easy task. Breaking a lesson down into simpler and shorter tasks can go a long way towards serving special needs of students.
When you introduce an activity to the class, the aims should stay the same for all students, but you can present new concepts at different levels to include any students with special needs.
How to present work at different levels:
• simplify your instructions and vocabulary;
• where necessary, make pictures and flashcards large and bold;
• give clear instructions;
• let students work in groups;
• break up work into smaller tasks;
• make use of demonstrations, role-play, drama and repetition;
• present work in different ways to ensure consolidation; and
• make use of a multimedia approach, e.g. use pictures, books, calculators, tape recorders, videos and computers where available.
Recommended alternative methods of assessment for students with special needs:
Visu
al
Bar
riers
Hea
ring
Bar
riers
Dea
fnes
s an
d B
lindn
ess
Phys
ical
B
arrie
rs
Lear
ning
D
isab
ility
Tapes
Braille
Enlarged print
Dictaphone
Video
Sign-language interpreter
Computer typewriting
Alternative questions and tasks
Additional time
LVL 3MATHSa.indb Sec1:vLVL 3MATHSa.indb Sec1:v 12/14/2007 2:26:41 PM12/14/2007 2:26:41 PM

vi
Amanuensis(scribe reads questions to student and writes down Student’s spoken answers)
Oral presentation to lecturer
Assessment in Mathematical literacyAssessment in Mathematical literacy
Assessment requirements
INTERNAL ASSESSMENT (25%)
Internal Assessment requirement
All internal assessments must be finalised by an assessor with at least a certificate of competence.
Processing of Internal assessment mark for the year
A year mark out of 100 is calculated by adding the marks of the internal continuous assessment.
Moderation of internal assessment mark
(To be consulted with National Exams and Assessments)
EXTERNAL ASSESSMENT (75%)
National examinationNational examination
A formal examination is conducted in October/November each year by means of two papers set externally and marked and moderated externally (level 4) and internally (levels 3 and 2). The examination will be structured as follows:
Knowing30%
Applying routine proce-dures in familiar contexts30%
Applying multi-step procedures in a variety of contexts20%
Reasoning and reflect-ing20%
Numbers20%
Paper 1(150 marks)
Paper 1 is intended to be a basic know-ing and routine applications paper
Paper 2(150 marks)
Paper 2 is intended to be an applications and reasoning and reflecting paper
Patterns and relationships20%
Finances20%
Space, Shape and Orienta-tion20%
Information communicated…20%
LVL 3MATHSa.indb Sec1:viLVL 3MATHSa.indb Sec1:vi 12/14/2007 2:26:41 PM12/14/2007 2:26:41 PM

vii
Nature of paper : External
Number of papers : 2
Duration : 3 hours each
Total mark allocation : 300
Compulsory sections : all
WEIGHTED VALUES OF TOPICS/THEMES/SPECIFIC OUTCOMESWEIGHTED VALUES OF TOPICS/THEMES/SPECIFIC OUTCOMES
TOPICS/THEMES WEIGHTED VALUE
Numbers 20%
Patterns and Relationships 20%
Finance 20%
Space, Shape and Orientation 20%
Information communicated through numbers, graphs and tables
20%
TOTAL 100%
CALCULATION OF THE FINAL MARKCALCULATION OF THE FINAL MARK
Continuous Assessment
Mark out of 100 ÷ 4 = a mark out of 25 (a)
Examination Mark
Mark out of 300 ÷ 4 = a mark out of 75 (b)
Final Mark
(a) + (b) = a mark out of 100
All marks are systematically processed and accurately recorded to be available as hard copy evidence for, amongst others, purposes of moderation and verification.
Note:Note:
Assessment should be done by assessors with the correct credentials as required by the government. An assessor should be a subject specialist and should be declared competent against standards set by the ETDP SETA
GUIDELINES FOR ASSESSMENT OF PRACTICAL WORKGUIDELINES FOR ASSESSMENT OF PRACTICAL WORK
The question or hypothesis given for research should be as straight forward as possible to avoid ambiguity and collection of wrong information to complete the task. Enough time equal to the task must provided. Practical work maybe an assignment, an investigation. Remember that home works and other activities that are formally assessed form part of the practical component.
LVL 3MATHSa.indb Sec1:viiLVL 3MATHSa.indb Sec1:vii 12/14/2007 2:26:42 PM12/14/2007 2:26:42 PM

viii
You may assess students on the following:
What to assess description Possible points
Knowledge and under-standing
This element covers facts, skills and concepts needed to solve a mathematical problem. It includes the following• Correct use of mathematical language• Correct use of notations and symbols
Reasoning and applica-tion
This element assesses the Student’s understanding and ability to make decisions about solutions. This will include:• Student’s ability to show originality and presentation
of the best possible solution to a given mathematical problem
Investigation skills This reflects the use of important mathematical activities like the collection of data and the exploration of patterns, making conjectures and generating a solution or making a mathematical model from the results. This will include:• The Student’s ability to integrate knowledge learned
from other themes except for the theme where the task was given
• Student’s ability to write a report on the findings
The meanings of the most frequently used verbs in questioning are listed below.
Knowledge and understanding
Define Give the exact meaning of a term or concept using words or mathematical symbols. (e.g. Define assets)
Describe Give an account. (e.g. Describe the double entry principle.)
Identify Single out from other information. (e.g Identify the assets, liabilities, expenses and income from the following list of items.)
Illustrate Use examples to explain a point. (e.g. Illustrate by means of an example the double entry principle .)
List State briefly. (e.g. List three possible sources of capital for a new business)
Outline Give a short description of the main aspects or features. (e.g. Outline by means of a diagram the 8 steps in the accounting cycle.)
State Give or say. (e.g. State three reasons why the bank can dishonour a cheque.)
Summarise Bring out the main points from a complex set of data (e.g. Draw a mind map that summarise the nine different types of businesses.)
What Clarify a point. (e.g. What are the main characteristics of a company?)
Application
Apply Use knowledge of Mathematical literacy to understand an issue or to solve a problem. (e.g. Apply your knowledge on equity to identify whether the follow-ing transactions would have a positive or a negative effect on equity.).)
Calculate Use mathematical literacy to work out an answer. (e.g. Calculate the cost price of a T-shirt if the selling price is R150 and the profit mark-up is 25%.)
LVL 3MATHSa.indb Sec1:viiiLVL 3MATHSa.indb Sec1:viii 12/14/2007 2:26:42 PM12/14/2007 2:26:42 PM

ix
Distinguish between Identify the characteristics that make two or more ideas, concepts, issues, etc. different. (e.g. Distinguish between the characteristics of a Partnership and a Close Corporation.)
Explain Make clear. (e.g. Explain the two main sections that the General Ledger is divided into.)
Suggest Give possible reasons or ideas that are plausible but not necessarily correct. ‘Suggest’ may require candidates to analyse a problem and not just apply Mathematical literacy problems. (e.g. Suggest reasons why a business would sell to customers on credit)
Analysis
Analyse Break down into constituent parts in order to be able to understand an issue or problem. Analysis involves recognising what is important, and applying knowl-edge and understanding of Mathematical literacy. (e.g. Analyse the following transactions using the basic accounting equation.)
Compare and contrast Show similarities and differences between two or more ideas or problems (e.g. Compare by tabulating the similarities and differences between a partnership and a close corporation.)
Examine Break down an issue or problem to understand it. (e.g. Examine the following ledger account and point out the possible errors.)
Investigate Look for evidence to explain and analyse. (e.g. Investigate the initial problems when starting a business by interviewing the owner of a mall business and present your findings in a report)
Evaluation
Assess Analyse an accounting issue or problem, and then weigh up the relative impor-tance of different strands. (e.g. Assess the success of the different methods used by the business to encourage debtors to pay their accounts on time.)
Comment on Invites students to make judgements based upon the evidence they have presented. (e.g. Comment on why good management is the key to a successful business .)
Critically analyse Analyse an issue/problem and weigh up the relative importance. (e.g. Critically analyse the three options to obtain capital to start a new business.)
Do you think Invites students to give their own opinions about an issue or problem. How-ever, marks will always be awarded for the quality of the argument and not for any individual opinions. (e.g. Do you think it is better for a business to sell credit that only cash?)
Discuss Compare a number of possible views about an issue and weigh up their rela-tive importance. A conclusion is essential. (e.g. Discuss the importance of screening customers before allowing them to buy on credit.)
Evaluate Similar to discuss; to compare a number of possible views. A final judgement is essential. (e.g. Evaluate the advantages and disadvantages of buying on credit.)
To what extent Explain and analyse and then comment upon the relative importance of the arguments. (e.g. To what extent should a owner make use of loans to finance his/her business?)
LVL 3MATHSa.indb Sec1:ixLVL 3MATHSa.indb Sec1:ix 12/14/2007 2:26:42 PM12/14/2007 2:26:42 PM

x
Types of assessmentTypes of assessment
• Summative assessment
It gives an overall picture of the Student’s performance at a given time. This is a form of assessment that is used to judge the Student’s readiness to progress to the next level
• Formative assessment
Formative assessment informs the lecturer and the student of the Student’s progress. It contributes towards the formation and the development of the Student’s formative years. The formative component of college-based assessment comprises 50% of the total for the year. The formative component of ICASS must include various activities. For example:
• research and monitoring of relevant, contemporary economic issues
• other ongoing tasks to develop skills that are necessary for successful functioning within the subject
• creative responses to problems within the subject field
• more informal assessment of day-to-day knowledge and skills acquired through creative class tests, presentations of the previous day’s work, class quizzes, etc.
The formative component should cater for the multiple intelligences (i.e. verbal-linguistic, interpersonal, intra-personal, musical-rhythmic, bodily-kinaesthetic, mathematical/logical, spatial) of students in an inclusive education context.
Assessment Tools (Rubrics and Checklists)
RubricsRubrics are a combination of rating codes and descriptions of standard. They consist of a hierarchy of standards with benchmarks that describe the range of acceptable performance in each code band. Rubrics require lecturers to know exactly what is required by the outcome. Rubrics can be holistic, giving a global picture of the standard required, or analytic, giving a clear picture of the distinct features that make up the criteria, or can combine both.
Holistic rubrics score the overall process, while analytic rubrics score the individual parts. It is important to note that:
• the student is only assessed once for each criterion within a rubric
• the comments column should be completed as this makes the moderation process easier
• rubrics can be used individually or combined with others
• rubrics may be joined together for ease of marking
• lecturers are encouraged to formulate rubrics in consultation with other lecturers at cluster or school level
• working in clusters and setting up collaborative rubrics would bring about comparable standards.
LVL 3MATHSa.indb Sec1:xLVL 3MATHSa.indb Sec1:x 12/14/2007 2:26:42 PM12/14/2007 2:26:42 PM

xi
The following steps may help you in drawing up a rubric:
Step 1: Examine the AS that describes the task.
Step 2: Specify the skills, knowledge and attitudes to be evaluated.
Step 3: Identify the observable attributes.
Step 4: Identify the attributes that you do not wish to see.
Step 5: Brainstorm the characteristics that describe each attribute and how they can be described so that they can be classified into average, above average and below average.
Step 6: Write descriptions for excellent and poor performances.
Step 7: Write descriptions for other levels.
Step 8: Collect samples of work that represent each level.
RUBRIC: Student’s own experience when doing a project
This rubric could be used as a journal entry for students. It is your duty as their lecture to check on this so that you know the Student’s attitude on the task given or completed.
Amount of time spent on project(time scale to be determined)
less than
1 2 3 4 5or more
Number of family members spoken to
Do you feel you learned anything about your-self when doing this project?
yes no
Comment:
Do you feel the project helped you under-stand yourself?
yes no
Comment:
Did you think you expressed this information about yourself in an interesting and exciting way?
yes no
Comment:
Do you think you put a lot of effort into this project?
yes no
LVL 3MATHSa.indb Sec1:xiLVL 3MATHSa.indb Sec1:xi 12/14/2007 2:26:42 PM12/14/2007 2:26:42 PM
xii
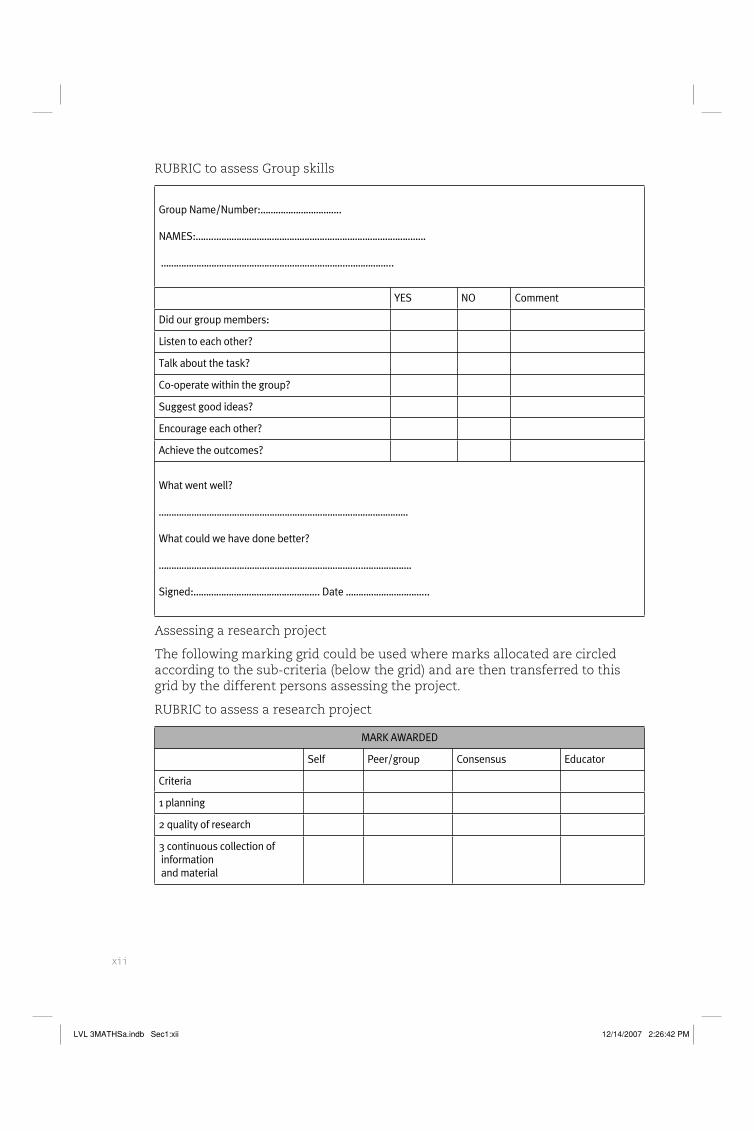
RUBRIC to assess Group skills
Group Name/Number:…………………………..
NAMES:……..…………………………………………………………………….….
………………………………………………………………..……………...
YES NO Comment
Did our group members:
Listen to each other?
Talk about the task?
Co-operate within the group?
Suggest good ideas?
Encourage each other?
Achieve the outcomes?
What went well?
………………………………………………………………………………………
What could we have done better?
……………………………………………………………………...……………….
Signed:………………………………………….. Date …………………………...
Assessing a research project
The following marking grid could be used where marks allocated are circled according to the sub-criteria (below the grid) and are then transferred to this grid by the different persons assessing the project.
RUBRIC to assess a research project
MARK AWARDED
Self Peer/group Consensus Educator
Criteria
1 planning
2 quality of research
3 continuous collection of information and material
LVL 3MATHSa.indb Sec1:xiiLVL 3MATHSa.indb Sec1:xii 12/14/2007 2:26:42 PM12/14/2007 2:26:42 PM

xiii
4 final product: creativity
5 final product: quality of contents
6 technical quality
7 oral presentation
8 individual / group role
Converted to
General guideline
5 Excellent
4 Exceeds the requirement
3 Meets the requirement
2 Does not meet the requirement – student needs support
1 Made very little effort – student needs substantial support
0 Student made no / almost no effort – student needs substantial support and guidance
Planning
5 Most practicable planning schedule, independently drawn up by student
4 Very good, practicable planning schedule, with only minor adjustments by educator needed
3 Good planning schedule, with a only a number of small adjustments by educator needed
2 Planning schedule not totally practicable - a substantial degree of adjustments needed
1 Planning schedule totally impracticable - totally new planning necessary
0 Planning schedule not handed in at all
Quality of research
5 Wide variety of sources used
4 More than required number of sources used
3 Adequate number of sources used
2 Less than adequate number of sources used
1 No recognised resources used; no research done
Continuous collection of information and material
5 A lot of information collected continuously / submitted before due dates
LVL 3MATHSa.indb Sec1:xiiiLVL 3MATHSa.indb Sec1:xiii 12/14/2007 2:26:43 PM12/14/2007 2:26:43 PM

xiv
4 More than adequate information collected / submitted before/on due dates
3. Adequate information collected continuously / submitted on due dates
2 Less than adequate information collected / some due dates missed
1. Very little information collected/seldom met due dates; no information collected or handed in at all
Final project: originality / creativity
5 Unique presentation of extremely high quality
4 Original presentation – however, based upon existing ideas
3 Standard presentation - content is relevant and interesting
2 Requirements have been met, and no more
1 Content entirely / almost entirely copied directly from sources; no effort made
Final project: quality of content
5 In-depth presentation pertaining to real-world practice / evidence is shown of insight into relationship between subject theory and real-world practice
4 Relevant and well-researched presentation - Student demonstrates very good insight
3 Relevant content shows good insight, area of research well covered.
2 Some part of content is relevant - partly copied directly from sources - insight lacking
1 Very little effort made - content largely copied directly from sources; content only slightly in line with topic – copied directly from sources
Technical quality
5 Proof of pride and very hard work - impressive final product
4 Excellent presentation - made full use of available sources/technology
3 Good final project
2 Minimal effort made – presentation still acceptable.
1. Very little trouble taken - untidy, shabby presentation; project not handed in / unacceptable presentation and/or appearance of content
LVL 3MATHSa.indb Sec1:xivLVL 3MATHSa.indb Sec1:xiv 12/14/2007 2:26:43 PM12/14/2007 2:26:43 PM

xv
APPENDIX B
LEV
EL 3
: WO
RK
SCH
EDU
LE F
OR
TH
E YE
AR
TERM
1:
MO
DU
LE 1
NU
MB
ERS
ARE
A PA
RT O
F O
UR
LIVE
S!
Wee
k 1
Wee
k 2
Wee
k 3
Wee
k 4
Wee
k 5
Wee
k 6
Wee
k 7
Wee
k 8
Wee
k 9
Wee
k 10
sess
men
t
Mon
day
Regi
stra
-tio
n an
d or
gani
satio
n of
cla
sses
Uni
t 1Co
untin
g nu
mbe
rs
inte
gers
, fr
actio
ns,
perc
enta
ges
and
time
nota
tions
Uni
t 1Co
untin
g nu
mbe
rs
inte
gers
, fr
actio
ns,
perc
enta
ges
and
time
nota
tions
: Uni
t 2W
hy a
re
patt
erns
so
impo
rtan
t in
our l
ives
Uni
t 2W
hy a
re
patt
erns
so
impo
rtan
t in
our l
ives
Uni
t as-
sess
men
t/
sum
mat
ive
asse
ssm
ent
Uni
t 3 F
ocus
on
Fin
ance
Uni
t 4 S
pace
, sh
ape
and
orie
ntat
ion
voca
bula
ry
and
calc
ula-
tions
Uni
t 4 S
pace
, sh
ape
and
orie
ntat
ion
voca
bula
ry
and
calc
ula-
tions
Mod
ule
1se
ssm
ent
Tues
day
Regi
stra
-tio
n an
d O
rgan
isat
ion
of c
lass
es
Uni
t 1Co
untin
g nu
mbe
rs
inte
gers
, fr
actio
ns,
perc
enta
ges
and
time
nota
tions
Uni
t 1Po
sitiv
e an
d ne
gativ
e nu
mbe
rs
used
as
dire
ctio
nal
num
bers
U
nit 1
Coun
ting
num
bers
in
tege
rs,
frac
tions
, pe
rcen
tage
s an
d tim
e no
tatio
ns
Uni
t 2W
hy a
re
patt
erns
so
impo
rtan
t in
our l
ives
Uni
t 2W
hy a
re
patt
erns
so
impo
rtan
t in
our l
ives
Uni
t 3 F
ocus
on
Fin
ance
Uni
t 3 F
ocus
on
Fin
ance
Uni
t 4 S
pace
, sh
ape
and
orie
ntat
ion
voca
bula
ry
and
calc
ula-
tions
: Uni
t 4 S
pace
, sh
ape
and
orie
ntat
ion
voca
bula
ry
and
calc
ula-
tions
Inte
rven
tion
afte
r ass
ess-
men
t and
re
med
ial
LVL 3MATHSa.indb xvLVL 3MATHSa.indb xv 12/14/2007 2:26:43 PM12/14/2007 2:26:43 PM

xvi
Wed
nesd
ayRe
gist
ra-
tion
and
Org
anis
atio
n of
cla
sses
Uni
t 1Co
untin
g nu
mbe
rs
inte
gers
, fr
actio
ns,
perc
enta
ges
and
time
nota
tions
Uni
t 1Co
untin
g nu
mbe
rs
inte
gers
, fr
actio
ns,
perc
enta
ges
and
time
nota
tions
Uni
t 2W
hy a
re
patt
erns
so
impo
rtan
t in
our l
ives
Uni
t 2W
hy a
re
patt
erns
so
impo
rtan
t in
our l
ives
Uni
t 3 F
ocus
on
Fin
ance
Uni
t 3 F
ocus
on
Fin
ance
Uni
t 4 S
pace
, sh
ape
and
orie
ntat
ion
voca
bula
ry
and
calc
ula-
tions
: Uni
t 4 S
pace
, sh
ape
and
orie
ntat
ion
voca
bula
ry
and
calc
ula-
tions
Exam
pre
pa-
ratio
n
Thur
sday
Dia
gnos
tic
test
Uni
t 1Co
untin
g nu
mbe
rs
inte
gers
, fr
actio
ns,
perc
enta
ges
and
time
nota
tions
Uni
t 1Co
untin
g nu
mbe
rs
inte
gers
, fr
actio
ns,
perc
enta
ges
and
time
nota
tions
Uni
t 2W
hy a
re
patt
erns
so
impo
rtan
t in
our l
ives
Uni
t 2W
hy a
re
patt
erns
so
impo
rtan
t in
our l
ives
Uni
t 3 F
ocus
on
Fin
ance
Sum
mat
ive
asse
ssm
ent
Uni
t 4 S
pace
, sh
ape
and
orie
ntat
ion
voca
bula
ry
and
calc
ula-
tions
Uni
t 4 S
pace
, sh
ape
and
orie
ntat
ion
voca
bula
ry
and
calc
ula-
tions
exam
s
Frid
ayG
roup
ing
stud
ents
ac
cord
ing
to
diag
nost
ic
test
resu
lts
Uni
t 1Co
untin
g nu
mbe
rs
inte
gers
, fr
actio
ns,
perc
enta
ges
and
time
nota
tions
Uni
t ass
ess-
men
t: U
nit 2
Why
are
pa
tter
ns s
o im
port
ant i
n ou
r liv
es
Uni
t 2W
hy a
re
patt
erns
so
impo
rtan
t in
our l
ives
Uni
t 3 F
ocus
on
Fin
ance
Proj
ect/
In
vest
igat
ion
/ as
sign
men
t
Uni
t 4 S
pace
, sh
ape
and
orie
ntat
ion
voca
bula
ry
and
calc
ula-
tions
Sum
mat
ive
asse
ssm
ent/
Te
st
exam
s
Not
esD
iagn
ostic
test
mus
t hav
e al
l the
mes
/top
ics
and
shou
ld b
e us
ed to
iden
tify
lear
ning
nee
ds a
nd a
bilit
ies.
Dec
ide
whe
ther
yo u
wan
t hom
ogen
eous
or
hete
roge
neou
s gr
oups
in te
rms
of le
arni
ng a
bilit
ies
and
use
your
dia
gnos
tic te
st s
uch.
Rem
ark:
R
emar
k: I
nte
grat
ion
of
top
ics
has
bee
n d
one
her
e fo
r yo
u. Y
ou c
an u
se t
he
test
s p
rovi
ded
or
you
can
dev
elop
you
r ow
n
test
s.
LVL 3MATHSa.indb xviLVL 3MATHSa.indb xvi 12/14/2007 2:26:43 PM12/14/2007 2:26:43 PM

xvii
TERM
2:
MO
DU
LE 2
ALL
FO
RMS
OF
PATT
ERN
S AR
OU
ND
US
!
Wee
k 1
Wee
k 2
Wee
k 3
Wee
k 4
Wee
k 5
Wee
k 6
Wee
k 7
Wee
k 8
Wee
k 9
Wee
k 10
Mon
day
Uni
t 5ca
lcul
a-tio
ns a
nd
mea
surin
g te
chni
ques
Uni
t 5ca
lcul
a-tio
ns a
nd
mea
surin
g te
chni
ques
Uni
t 6
iden
tifyi
ng
and
usin
g in
form
atio
n fr
om p
atte
rns
to s
olve
w
orkp
lace
pr
oble
ms
Uni
t 6
iden
tifyi
ng
and
usin
g in
form
atio
n fr
om p
atte
rns
to s
olve
w
orkp
lace
pr
oble
ms
Uni
t 7 S
olv-
ing
wor
k-pl
ace
base
d pr
oble
ms
Usi
ng re
pre-
sent
atio
ns
Uni
t 7 S
olv-
ing
wor
k-pl
ace
base
d pr
oble
ms
Usi
ng re
pre-
sent
atio
ns
Uni
t 8 C
ol-
lect
ing
and
repr
esen
ting
info
rmat
ion
Uni
t 8 C
ol-
lect
ing
and
repr
esen
ting
info
rmat
ion
Mod
ule
2se
ssm
ent
Test
s /
Exam
s
Tues
day
Uni
t 5ca
lcul
a-tio
ns a
nd
mea
surin
g te
chni
ques
Uni
t 5ca
lcul
a-tio
ns a
nd
mea
surin
g te
chni
ques
Uni
t 6
iden
tifyi
ng
and
usin
g in
form
atio
n fr
om p
atte
rns
to s
olve
w
orkp
lace
pr
oble
ms
Uni
t 6
iden
tifyi
ng
and
usin
g in
form
atio
n fr
om p
atte
rns
to s
olve
w
orkp
lace
pr
oble
ms
Uni
t 7 S
olv-
ing
wor
k-pl
ace
base
d pr
oble
ms
Usi
ng re
pre-
sent
atio
ns
Uni
t 7 S
olv-
ing
wor
k-pl
ace
base
d pr
oble
ms
Usi
ng re
pre-
sent
atio
ns
Uni
t 8 C
ol-
lect
ing
and
repr
esen
ting
info
rmat
ion
Uni
t 8 C
ol-
lect
ing
and
repr
esen
ting
info
rmat
ion
Inte
rven
tion
afte
r ass
ess-
men
t
Test
s /
Exam
s
Wed
nesd
ayU
nit 5
calc
ula-
tions
and
m
easu
ring
tech
niqu
es
Uni
t 5ca
lcul
a-tio
ns a
nd
mea
surin
g te
chni
ques
Uni
t 6
iden
tifyi
ng
and
usin
g in
form
atio
n fr
om p
atte
rns
to s
olve
w
orkp
lace
pr
oble
ms
Uni
t 6
iden
tifyi
ng
and
usin
g in
form
atio
n fr
om p
atte
rns
to s
olve
w
orkp
lace
pr
oble
ms
Uni
t 7 S
olv-
ing
wor
k-pl
ace
base
d pr
oble
ms
Usi
ng re
pre-
sent
atio
ns
Uni
t 7 S
olv-
ing
wor
k-pl
ace
base
d pr
oble
ms
Usi
ng re
pre-
sent
atio
ns
Uni
t 8 C
ol-
lect
ing
and
repr
esen
ting
info
rmat
ion
Uni
t 8 C
ol-
lect
ing
and
repr
esen
ting
info
rmat
ion
Test
s /
Exam
sTe
sts
/ Ex
ams
Thur
sday
Uni
t 5ca
lcul
a-tio
ns a
nd
mea
surin
g te
chni
ques
Uni
t 5ca
lcul
a-tio
ns a
nd
mea
surin
g te
chni
ques
Uni
t 6
iden
tifyi
ng
and
usin
g in
form
atio
n fr
om p
atte
rns
to s
olve
w
orkp
lace
pr
oble
ms
Uni
t 6
iden
tifyi
ng
and
usin
g in
form
atio
n fr
om p
atte
rns
to s
olve
w
orkp
lace
pr
oble
ms
Uni
t 7 S
olv-
ing
wor
k-pl
ace
base
d pr
oble
ms
Usi
ng re
pre-
sent
atio
ns
Uni
t 7 S
olv-
ing
wor
k-pl
ace
base
d pr
oble
ms
Usi
ng re
pre-
sent
atio
ns
Uni
t 8 C
ol-
lect
ing
and
repr
esen
ting
info
rmat
ion
Sum
mat
ive
asse
ssm
ent/
unit
asse
ss-
men
t
Test
s /
Exam
s
LVL 3MATHSa.indb xviiLVL 3MATHSa.indb xvii 12/14/2007 2:26:43 PM12/14/2007 2:26:43 PM

xviii
Frid
ayU
nit 5
calc
ula-
tions
and
m
easu
ring
tech
niqu
es
Asse
ssm
ent
Uni
t 6
iden
tifyi
ng
and
usin
g in
form
atio
n fr
om p
atte
rns
to s
olve
w
orkp
lace
pr
oble
ms
asse
ssm
ent
Uni
t 7 S
olv-
ing
wor
k-pl
ace
base
d pr
oble
ms
Usi
ng re
pre-
sent
atio
ns
Uni
t ass
ess-
men
t
Uni
t 8 C
ol-
lect
ing
and
repr
esen
ting
info
rmat
ion
Proj
ects
/as-
sign
men
ts
for p
ortf
olio
s
Test
s /
Exam
s
Not
es
TERM
3:
MO
DU
LE 3
REP
RESE
NTI
NG
SO
LUTI
ON
S O
F RE
AL L
IFE
PRO
BLE
MS;
MO
DU
LE 4
MAT
HEM
ATIC
S AT
WO
RK!
Wee
k 1
Wee
k 2
Wee
k 3
Wee
k 4
Wee
k 5
Wee
k 6
Wee
k 7
Wee
k 8
Wee
k 9
Wee
k 10
Mon
day
Uni
t 9 u
sing
re
pres
enta
-tio
ns o
f re
latio
nshi
ps
to s
olve
pr
oble
ms
invo
lvin
g pa
tter
ns
Uni
t 9 u
sing
re
pres
enta
-tio
ns o
f re
latio
nshi
ps
to s
olve
pr
oble
ms
invo
lvin
g pa
tter
ns
Test
/ un
it as
sess
men
tU
nit 1
0 Fi
nanc
ial
know
ledg
e is
po
wer
!
Sum
mat
ive
asse
ssm
ent
Uni
t 11
info
rmat
ion
pres
enta
-tio
ns a
nd
mis
repr
e-se
nted
Asse
ssm
ent/
te
stU
nit 1
2 tim
e ta
blin
g an
d gr
aphs
Ch
arac
ter-
istic
s of
pe
rspe
ctiv
e dr
awin
gs
Uni
t 12
time
tabl
ing
and
grap
hs
Char
acte
r-is
tics
of
pers
pect
ive
draw
ings
Mod
ule
3 an
d 4
asse
ssm
ent
Tues
day
Uni
t 9 u
sing
re
pres
enta
-tio
ns o
f re
latio
nshi
ps
to s
olve
pr
oble
ms
invo
lvin
g pa
tter
ns
Uni
t 9 u
sing
re
pres
enta
-tio
ns o
f re
latio
nshi
ps
to s
olve
pr
oble
ms
invo
lvin
g pa
tter
ns
Uni
t 10
Fina
ncia
l kn
owle
dge
is
pow
er!
Uni
t 10
Fina
ncia
l kn
owle
dge
is
pow
er!
Uni
t 11
info
rmat
ion
pres
enta
-tio
ns a
nd
mis
repr
e-se
nted
Uni
t 11
info
rmat
ion
pres
enta
-tio
ns a
nd
mis
repr
e-se
nted
Uni
t 12
time
tabl
ing
and
grap
hs
Char
acte
r-is
tics
of
pers
pect
ive
draw
ings
Uni
t 12
time
tabl
ing
and
grap
hs
Char
acte
r-is
tics
of
pers
pect
ive
draw
ings
Uni
t 12
time
tabl
ing
and
grap
hs
Char
acte
r-is
tics
of
pers
pect
ive
draw
ings
Inte
rven
tion
afte
r ass
ess-
men
t
LVL 3MATHSa.indb xviiiLVL 3MATHSa.indb xviii 12/14/2007 2:26:44 PM12/14/2007 2:26:44 PM

xix
Wed
nesd
ayU
nit 9
usi
ng
repr
esen
ta-
tions
of
rela
tions
hips
to
sol
ve
prob
lem
s in
volv
ing
patt
erns
Uni
t 9 u
sing
re
pres
enta
-tio
ns o
f re
latio
nshi
ps
to s
olve
pr
oble
ms
invo
lvin
g pa
tter
ns
Uni
t 10
Fina
ncia
l kn
owle
dge
is
pow
er!
Uni
t 10
Fina
ncia
l kn
owle
dge
is
pow
er!
Uni
t 11
info
rmat
ion
pres
enta
-tio
ns a
nd
mis
repr
e-se
nted
Uni
t 11
info
rmat
ion
pres
enta
-tio
ns a
nd
mis
repr
e-se
nted
Uni
t 12
time
tabl
ing
and
grap
hs
Char
acte
r-is
tics
of
pers
pect
ive
draw
ings
Uni
t 12
time
tabl
ing
and
grap
hs
Char
acte
r-is
tics
of
pers
pect
ive
draw
ings
Uni
t 12
time
tabl
ing
and
grap
hs
Char
acte
r-is
tics
of
pers
pect
ive
draw
ings
Inte
rven
tion
afte
r ses
s-m
ent
Thur
sday
Uni
t 9 u
sing
re
pres
enta
-tio
ns o
f re
latio
nshi
ps
to s
olve
pr
oble
ms
invo
lvin
g pa
tter
ns
Uni
t 9 u
sing
re
pres
enta
-tio
ns o
f re
latio
nshi
ps
to s
olve
pr
oble
ms
invo
lvin
g pa
tter
ns
Uni
t 10
Fina
ncia
l kn
owle
dge
is
pow
er!
Uni
t 10
Fina
ncia
l kn
owle
dge
is
pow
er!
Uni
t 11
info
rmat
ion
pres
enta
-tio
ns a
nd
mis
repr
e-se
nted
Uni
t 11
info
rmat
ion
pres
enta
-tio
ns a
nd
mis
repr
e-se
nted
Uni
t 12
time
tabl
ing
and
grap
hs
Char
acte
r-is
tics
of
pers
pect
ive
draw
ings
Uni
t 12
time
tabl
ing
and
grap
hs
Char
acte
r-is
tics
of
pers
pect
ive
draw
ings
Proj
ects
/as-
sign
men
t for
po
rtfo
lios
Inte
rven
tion
afte
r ses
s-m
ent
Frid
ayU
nit 9
usi
ng
repr
esen
ta-
tions
of
rela
tions
hips
to
sol
ve
prob
lem
s in
volv
ing
patt
erns
Uni
t 9 u
sing
re
pres
enta
-tio
ns o
f re
latio
nshi
ps
to s
olve
pr
oble
ms
invo
lvin
g pa
tter
ns
Uni
t 10
Fina
ncia
l kn
owle
dge
is
pow
er!
Uni
t 10
Fina
ncia
l kn
owle
dge
is
pow
er!
Uni
t 11
info
rmat
ion
pres
enta
-tio
ns a
nd
mis
repr
e-se
nted
Uni
t 11
info
rmat
ion
pres
enta
-tio
ns a
nd
mis
repr
e-se
nted
Uni
t 12
time
tabl
ing
and
grap
hs
Char
acte
r-is
tics
of
pers
pect
ive
draw
ings
Uni
t 12
time
tabl
ing
and
grap
hs
Char
acte
r-is
tics
of
pers
pect
ive
draw
ings
Uni
t 3U
nit a
sses
s-m
ent
Not
es
Rem
ark:
R
emar
k: T
he
Proc
ess
and
Th
inki
ng
skil
ls, V
alu
es a
nd
Att
itu
des
, w
ell
th
e C
riti
cal
Ou
tcom
es m
ust
be
inte
grat
ed in
to e
ach
le
sson
pla
n.
LVL 3MATHSa.indb xixLVL 3MATHSa.indb xix 12/14/2007 2:26:44 PM12/14/2007 2:26:44 PM

xx
TERM
4:
MO
DU
LE 5
INTE
GRA
TED
MO
DU
LE
Wee
k 1
Wee
k 2
Wee
k 3
Wee
k 4
Wee
k 5
Wee
k 6
Wee
k 7
Wee
k 8
Wee
k 9
Form
ativ
e an
d su
mm
ativ
e as
sess
men
t
Mon
day
Uni
t 13
inte
-gr
ated
uni
tU
nit 1
3 in
te-
grat
ed u
nit
Uni
t 13
inte
-gr
ated
uni
tU
nit 1
4 In
tegr
ated
uni
t U
nit 1
4 In
tegr
ated
uni
tU
nit 1
4 In
tegr
ated
uni
tM
odul
e 4
asse
ssm
ent
Revi
sion
Test
s an
d ex
ams
Tues
day
Uni
t 13
inte
-gr
ated
uni
tU
nit 1
3 in
te-
grat
ed u
nit
Uni
t 13
inte
-gr
ated
uni
tU
nit 1
4 In
tegr
ated
uni
tU
nit 1
4 In
tegr
ated
uni
tU
nit 1
4 In
tegr
ated
uni
tIn
terv
entio
n af
ter a
sses
s-m
ent
Revi
sion
Test
s an
d ex
ams
Wed
nesd
ayU
nit 1
3 in
te-
grat
ed u
nit
Uni
t 13
inte
-gr
ated
uni
tU
nit 1
Gra
phic
al re
p-re
sent
atio
n of
in
form
atio
n
Uni
t 14
Inte
grat
ed u
nit
Uni
t 14
Inte
grat
ed u
nit
Uni
t 14
Inte
grat
ed u
nit
Inte
rven
tion
afte
r ass
ess-
men
t
Test
s an
d ex
ams
Test
s an
d ex
ams
Thur
sday
Uni
t 13
inte
-gr
ated
uni
tU
nit 1
3 in
te-
grat
ed u
nit
Uni
t 13
Asse
ssm
ent
Uni
t 14
Inte
grat
ed u
nit
Uni
t 14
Inte
grat
ed u
nit
Uni
t 14
Inte
grat
ed u
nit
Revi
sion
Test
s an
d ex
ams
Test
s an
d ex
ams
Frid
ayU
nit 1
3 in
te-
grat
ed u
nit
Uni
t 13
inte
-gr
ated
uni
tU
nit 1
3U
nit a
sses
s-m
ent
Uni
t 14
Inte
grat
ed u
nit
Uni
t 14
Inte
grat
ed u
nit
Uni
t ass
ess-
men
t
Revi
sion
Test
s an
d ex
ams
Not
es
LVL 3MATHSa.indb xxLVL 3MATHSa.indb xx 12/14/2007 2:26:44 PM12/14/2007 2:26:44 PM

xxi
Less
on
Pla
nTe
ache
r: M
r. Ap
ollis
D
ate
to s
tart
: D
ate
to e
nd:
Mat
hem
atic
al T
opic
: Per
cent
ages
in d
aily
life
Le
vel:
2Le
arni
ng o
utco
mes
: AS
1.1,
1.2,
LO
1.1.
b; L
O1.
2.b
Criti
cal a
nd D
evel
opm
enta
l Out
com
es: I
dent
ify a
nd s
olve
pro
blem
s an
d m
ake
deci
sion
s; W
ork
effe
ctiv
ely
with
oth
ers
as a
team
; Com
mun
icat
e ef
fect
ivel
yTe
ache
r’s A
ctio
nsLe
arne
r’s A
ctiv
ities
Asse
ssm
ent
(met
hods
,in
stru
men
ts)
Reso
urce
sEx
pand
ed
Opp
ortu
nitie
sD
urat
ion
1.
Solv
ing
two
prob
lem
s in
volv
ing
com
mis
sion
• Re
ads
thro
ugh
the
activ
ity in
the
text
book
, id
entif
ying
the
conc
epts
and
ski
lls in
volv
ed.
• Re
ads
the
Teac
her’s
Gui
de c
omm
ents
on
the
activ
ity.
• M
akes
sur
e th
e cl
ass
unde
rsta
nds
conc
epts
lik
e “c
omm
issi
on”,
“tr
ansa
ctio
n”.
• En
sure
s th
at a
ll le
arne
rs h
ave
calc
ulat
ors.
• Fa
cilit
ates
dis
cuss
ion
of le
arne
rs’ r
espo
nses
to
pro
blem
s 1
and
2.
1.
Solv
ing
two
prob
lem
s in
volv
ing
com
mis
sion
• So
lve
2 pr
oble
ms
invo
lvin
g co
mm
issi
on.
• D
iscu
ss fi
ndin
gs in
thei
r gr
oups
.•
Part
icip
ate
in c
lass
di
scus
sion
.
• In
form
al•
Calc
ulat
ors
• D
iscu
ss th
e im
plic
atio
ns
of c
omm
issi
on
and
whe
ther
the
publ
ic is
abl
e to
ca
lcul
ate
and
com
pare
diff
eren
t pe
rcen
tage
s of
co
mm
issi
on.
30 m
in
2. S
olvi
ng p
robl
ems
in L
earn
er’s
Boo
k in
volv
ing
perc
enta
ge in
crea
ses
in e
very
day
life
• Re
ads
thro
ugh
the
activ
ity id
entif
ying
the
conc
epts
and
ski
lls in
volv
ed.
• Re
ads
the
Teac
her’s
Gui
de c
omm
ents
on
the
activ
ity.
• M
akes
sur
e th
e cl
ass
unde
rsta
nds
conc
epts
lik
e “r
aise
”, “
inve
sted
”, a
nd “
infla
tion”
.•
Ensu
res
that
all
lear
ners
hav
e ca
lcul
ator
s.•
Mov
es a
roun
d th
e cl
assr
oom
, mak
ing
sure
th
at a
ll le
arne
rs b
ecom
e in
volv
ed w
ith th
e pr
oble
ms
and
can
part
icip
ate
in th
e di
scus
-si
ons.
• Pu
lls to
geth
er th
e di
scus
sion
s to
ens
ure
that
th
e co
rrec
t mat
hem
atic
al c
oncl
usio
ns a
re
reac
hed
2. S
olvi
ng p
robl
ems
in
Lear
ner’s
Boo
k in
volv
ing
perc
enta
ge in
crea
ses
in
ever
yday
life
• En
gage
in th
e pr
oble
ms
pose
d, ta
lkin
g ab
out
them
and
then
sol
ving
th
em, u
sing
cal
cula
tors
w
here
nec
essa
ry.
• D
iscu
ss th
eir f
indi
ngs
in
thei
r gro
ups.
• Ea
ch le
arne
r pro
vide
s a
writ
ten
reco
rd o
f his
/her
w
orki
ng.
• Pa
rtic
ipat
e in
cla
ss
disc
ussi
on.
• Ru
bric
for t
ask
list a
sses
smen
t•
Obs
erva
tion
• Ca
lcul
ator
s•
Serio
us d
iscu
s-si
ons
on�
the
effe
cts
of s
alar
y in
crea
ses
� i
nfla
tion
� i
nves
tmen
t
1 1 _ 2 h
LVL 3MATHSa.indb xxiLVL 3MATHSa.indb xxi 12/14/2007 2:26:45 PM12/14/2007 2:26:45 PM

xxii
Rubric for Task List AssessmentThis is an example of a rubric to assess problems 3-8 of the activity described in the previous lesson plan.
TASK SCORE WEIGHT MARKS
Unit 20, activity 2, questions 3-8, LO1 ASS 2,4
Understands “raise”Observe no. 3
1 2 3 4 5 6.7 1
Calculates raise correctlyObserve no. 3
1 2 3 4.6.7 2
Understands “increase”Observe no. 3, 4, 8
1 2 3 4 5 6.7 1
Calculates increasesObserve no. 3, 4, 5
1 2 3 4 5 6.7 2
Compares increasesObserve no. 4, 5
1 2 3 4 5 6.7 3
Calculates % increaseObserve no. 4, 5
1 2 3 4 5 6.7 2
Understands investmentObserve no. 6,7
1 2 3 4 5 6.7 1
Understands interest rateObserve no. 6,7
1 2 3 4 5 6.7 1
Compares and makes informed choices of different investment optionsObserve no. 7
1 2 3 4 5 6.7 3
Understands “inflation”Observe no. 8
1 2 3 4 5 6.7 1
Calculates the effect of inflation correctlyObserve no. 8
1 2 3 4 5 6.7 2
TOTAL SCORE MAX: 7x 19 19
LVL 3MATHSa.indb xxiiLVL 3MATHSa.indb xxii 12/14/2007 2:26:45 PM12/14/2007 2:26:45 PM

xxiii
How to score:How to score: Grading Marks % Descriptors
7 80–100 Outstanding
6 70–79 Meritorious
5 60–69 Substantial
4 50–59 Adequate
3 40–49 Moderate
2 30-39 Elementary
1 0–29 Not achieved
• Encircle the learner’s mark.• Encircle the learner’s mark.
• Multiply mark by weighting to get final score for that Learning Outcome.• Multiply mark by weighting to get final score for that Learning Outcome.
• Add marks for each outcome to get your Total Score.• Add marks for each outcome to get your Total Score.
TASK LIST ASSESSMENT TEMPLATE (for you to use)
TASK SCORE WEIGHT MARKS
1 2 3 4 5 6.7
1 2 3 4 5 6.7
1 2 3 4 5 6.7
1 2 3 4 5 6.7
1 2 3 4 5 6.7
1 2 3 4 5 6.7
1 2 3 4 5 6.7
1 2 3 4 5 6.7
TOTAL SCORE
LVL 3MATHSa.indb xxiiiLVL 3MATHSa.indb xxiii 12/14/2007 2:26:45 PM12/14/2007 2:26:45 PM

LVL 3MATHSa.indb xxivLVL 3MATHSa.indb xxiv 12/14/2007 2:26:45 PM12/14/2007 2:26:45 PM

1
Mo
dule
1
Module 1Numbers are a part of our lives!
Unit 1
Counting numbers, integers, frac-tions, percentages and time notations
SB page 10
Topic 1: LO 1.1.a ; LO 2.2.a
Activity 1 Numbers
1.1 a) Volume of juice bought Volume of diluted juice Number of household days
10 litres 50 litres 50 days
It took Lesego’s household 50 days to finish 2 × 5–litre juices.
b) Number of days Volume of diluted juice drunk by household
Number of 5–litre juices
Cost price of the juices
120 120 litres 24 R960
c) Volume of undiluted juice
Volume of diluted juice
Cost of undi-luted juice
Selling price of diluted juice
Cost of empty 1- litre bottles
Profit
150 litres 750 litres R1 050 R3 000 R750 R2 250
1.1 (d) 1 person = 125ml
1 person x 1 000ml
______________ 125ml
= 1 000ml
= 8 people
1.2 Leonard is correct
(f) (i) 4 __ 20 = 1 _ 5
(ii) 20 __ 4 = 5 _ 1
(iii) 20 __ 5 = 4 _ 1
LVL 3MATHSa.indb 1LVL 3MATHSa.indb 1 12/14/2007 2:26:45 PM12/14/2007 2:26:45 PM
2
Mo
dule 1
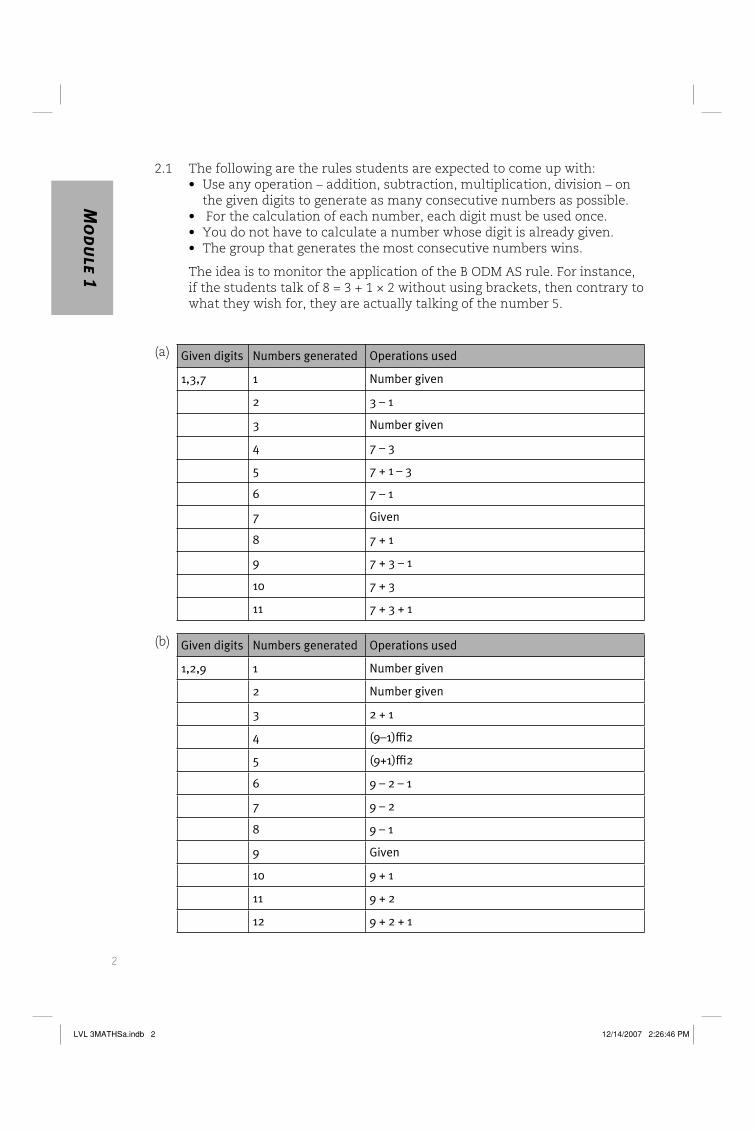
2.1 The following are the rules students are expected to come up with:• Use any operation – addition, subtraction, multiplication, division – on the given digits to generate as many consecutive numbers as possible.• For the calculation of each number, each digit must be used once.• You do not have to calculate a number whose digit is already given.• The group that generates the most consecutive numbers wins.
The idea is to monitor the application of the B ODM AS rule. For instance, if the students talk of 8 = 3 + 1 × 2 without using brackets, then contrary to what they wish for, they are actually talking of the number 5.
(a) Given digits Numbers generated Operations used
1,3,7 1 Number given
2 3 – 1
3 Number given
4 7 – 3
5 7 + 1 – 3
6 7 – 1
7 Given
8 7 + 1
9 7 + 3 – 1
10 7 + 3
11 7 + 3 + 1
(b) Given digits Numbers generated Operations used
1,2,9 1 Number given
2 Number given
3 2 + 1
4 (9–1)÷2
5 (9+1)÷2
6 9 – 2 – 1
7 9 – 2
8 9 – 1
9 Given
10 9 + 1
11 9 + 2
12 9 + 2 + 1
LVL 3MATHSa.indb 2LVL 3MATHSa.indb 2 12/14/2007 2:26:46 PM12/14/2007 2:26:46 PM

3
Mo
dule
1
SB page 12
Topic 1: LO 1.1.a, LO 1.1.b
Activity 5 How much?
1.1. Month Loss
January 2007
1. Material for foundation: R3 0002. Bricks for the broken wall: R250.3. Days wasted: 3days 2 hours = 3,25 × R1000 = R3250
TOTAL LOSS R 6 500
Profit of R 30 000 – R6 500 – R10 000 = R13 500 .
1.2. This is an estimate because it would be difficult to quantify the time it takes to break down and remove the rubble from the foundation and part of the wall, before they are restarted.
SB page 16
Topic 1: LO 1.1.a, LO 1.1.b
Activity 6 Numbers in context
Month Anomalies Expenditure / Loss Income/ Gain Net Income
Single storey
Double storey
Single storey
Double storey
January 6 days went with-out any job done because of delay in delivery of material by Y3
–R16 500 –R69 000 +R30 000 +R16 000 –R39 500
February Had to wait for three months for ecoslab for the double–sto-rey house
–R20 000 –R60 000 +R60 000 R0 –R20 000
March –R20 000 –R60 000 +R60 000 R0 –R20 000
April –R20 000 –R60 000 +R60 000 R0 –R20 000
May Ecoslab delivered.
–R20 000 –R60 000 +R60 000 +R66 000 +R46 000
TOTAL –R96 500 –R309 000 +R270 000 R82 000 –R53 500
1.1 We use negative to indicate money “money owing” or “taken out of pocket”, and positive to indicate “money received”.
LVL 3MATHSa.indb 3LVL 3MATHSa.indb 3 12/14/2007 2:26:46 PM12/14/2007 2:26:46 PM

4
Mo
dule 1
1.2 (a) +R13 500 (b) –R53 000 (c) +R40 000 (d) +R6 000
SB page 25
Topic 1: LO 1.1.c; LO 1.2.a; LO 1.2.b
Activity 9 Fractions in context
1.1 Khumo is incorrect. The fact that she is involved twice – once with each
group means that her assertion that her contribution of 1 _ 4 is not correct.
1.2 The students should be facilitated to put 1 _ 2 , 1 _ 3 and 1 _ 5 in order from smallest
to biggest. The fraction template should be sufficient to show the students
that 1 _ 5 is the smallest of the three, with the result that the sum of 1 _ 2 and 1 _ 3
cannot be 1 _ 5 . Sum of two positive bigger numbers cannot be a smallest
number.
1.3 Using the above fraction template, the two fractions that 1 _ 2 and 1 _ 3 , put side–
by–side, will be exactly of the same length as are respectively 5 _ 6 and 10 __ 12 . This
means that 1 _ 2 + 1 _ 3 = 5 _ 6 or 1 _ 2 + 1 _ 3 = 10 __ 12 .
1.4 1 _ 3 and 2 _ 6 , 1 _ 3 and 4 __ 12 , 2 _ 6 and 4 __ 12 , 1 _ 2 and 6 __ 12 , 3 _ 6 and 6 __ 12
• Two fractions are said to be equivalent if the numerator and
denominator of one are the constant multiple of the numerator and
denominator of the other. 1 _ 3 and 4 __ 12 are equivalent because 4 and 12 are
constant multiples of 1 and 3 (4 = 1 × 4 and 12 = 3 × 4) In this case 4 is
the constant multiple.
• In terms of what has so far happened, you find the equivalent fraction
whose denominator is the common multiple of the denominators of the
fractions you add.
• 1 _ 3 = 4 __ 12
1 _ 4 = 3 __ 12
1 _ 3 + 1 _ 4 = 4 __ 12 + 3 __ 12 = 7 __ 12
• It will always work.
2. Student’s answers
3. Student’s own answers
4. The prefix “deci” refers to 10. A decimal number is any number in which any digit represents number of powers of 10. For instance, 213,5213,523 = 2 × 10 2 + 1 × 10 1 + 3 × 10 0 + 5 × 10 –1 + 2 × 10 –2 + 3 × 10 –3
5. Thabo is correct. For instance, 1 ___ 100 × 100% = 1%. 100% = 100 ___ 100 = 1, so that
LVL 3MATHSa.indb 4LVL 3MATHSa.indb 4 12/14/2007 2:26:46 PM12/14/2007 2:26:46 PM

5
Mo
dule
1
multiplying by 100% does not change the value of the original fraction.
SB page 47
Topic 1: LO 1.3.aActivity 13 What time!
2. Elsie: Lunch: 1pm – 1:30pmThomas: Lunch: 13:40 –14:10
3. Departure time from home Arrival time at work
Eslie’s watch Thomas’s watch
Monday 06:25 6:55am 06:55
Tuesday 07:10 8:20am 08:20
Wednesday 06:35 7:45am 07:45
Thursday: 06:00 6:30am 06:30
Friday: 07:45 8:55am 08:55
4. Paris Jhb Miami Hong Kong Tokyo Wellington
3pm;15:00 5pm; 17:00 9pm; 21:00 11pm;23:00 1am;01:00 3am;03:00
5. Paris Jhb Miami Hong Kong Tokyo Wellington
11pm;23:00 1pm;13:00 3am; 03:00 11pm; 23:00 11am; 11:00
SB page 47
Topic 1: LO 1.3.aActivity 14 Time Zones
Measurement, Level 4Measurement, Level 4
Overview of the unitOverview of the unit
In this unit we introduce and explore time zones and international Date Line.
Relevant Achievement Objectives
• read and construct a variety of scales, timetables and charts
• perform calculations with time, including 24-hour clock times
Specific Learning OutcomesSpecific Learning Outcomes
The children will be able to:
• read and use a variety of timetables and charts
• perform calculations with time, including 24-hour clock times and time zones
A description of the mathematics explored in the unit
This unit introduces the ideas of time zones and the International Date Line. These are very important concepts that the students will probably have to bear in mind more in their lifetime than we have in ours. This will be for reasons of
Measurement, Level 4M
Overview of the unitO
I
R
•
•
Specific Learning OutcomesS
T
•
•
A
TitidEt
ObstI
If
ResourcesR
•
•
•
•
•
•
•
Teaching SequenceT
Session 1S
Ip
1
2LVL 3MATHSa.indb 5LVL 3MATHSa.indb 5 12/14/2007 2:26:47 PM12/14/2007 2:26:47 PM

6
Mo
dule 1
both work and pleasure. We know someone in England who has a computer that makes a noise when email arrives. So we don’t email him during the English night or he may be wakened by the noise. This requires a knowledge of the English time zone. In the same way, if we wanted to phone him, then we would also need to know the time difference between us.
On the pleasure front, nowadays it appears that a flight from Auckland to Los Angeles arrives before it departs. This is again a time zone problem. Further, viewing difficulties arise when sporting events, such as the Olympics, occur elsewhere in the world and are broadcast live. So the concepts of time zone and International Date Line have important consequences for our lives. Indeed the students may well have been affected by these already.
In this unit we use the 24 hour clock as well as timetables. Consequently the unit draws on skills from the unit 24 hours, Level 4. This unit should therefore follow that one.
ResourcesResources
• globe and a torch
• map of Australia and the world
• Copymaster for Time and Place game
• Copymaster for International Date Line Time and Place game
• international and domestic airline timetables (Qantas NZ and Air New Zealand)
• www.aimz.co.za
• www.worldtimeserver.com
Teaching SequenceTeaching Sequence
Session 1Session 1
In the first session we introduce the idea of time zones using a globe and possibly by making a phone call.
1. If it possible to darken the room then do so. Have someone hold the globe and another child shine the torch on it. Discuss what you can see. Out of this should come the idea that when we are in daylight there are some places in the dark.What does this mean for the time in other places?If it is 1200 hours here, what time will it be in England? How about India? America, etcIf it’s 22:00 here what times will it be there? (Approximate answers will do so long as the students get times in the right ballpark. The important thing is that they realise that different places on Earth have different times.)
2. Tell them that this difference is recognised by what are called time zones. Two places in the same time zone have the same time. New Zealand has one time zone. So everywhere in New Zealand has the same time.
LVL 3MATHSa.indb 6LVL 3MATHSa.indb 6 12/14/2007 2:26:47 PM12/14/2007 2:26:47 PM

7
Mo
dule
1
3. Have you ever tried phoning someone in Australia?Let’s do it.Using a mobile phone ring someone in Melbourne. (We can organise a school for you to contact if you would like us to. We will need to have at least two weeks notice.) No matter what else you say, be sure to ask them the time.
4. After the phone call, askWhat was the time in Melbourne? So what is the difference between their time and ours?What do you think the time in Sydney is? Why?
5. Explain that Sydney and Melbourne are in the same time zone. In fact the whole of the East Coast of Australia plus Tasmania is in the Eastern Time Zone. Show them this on the globe or on a map of the world. (There will be a problem with Queensland at certain times of the year. When the rest of Australia goes into daylight saving time, Queensland doesn’t.)
6. How many time zones do you think Australia has?Let them guess. Ask them to explain why they guessed the way they did. In fact Australia has three time zones. After the Eastern Time Zone there is the Central Time Zone and the Western Time Zone. The Central Time Zone includes Adelaide and Alice Springs (show these on a map or globe). This zone is half an hour behind Eastern Standard Time. Put this information on the board.So what time is it in Adelaide when it is 12:00 in Melbourne?What time is it in Sydney when it is 13:00 in Adelaide?
7. Is Perth (show this on the map) behind or ahead of Melbourne? (Behind.)By how much do you think they are behind? Let the class guess. (5 hours.) Write this on the board.So what is the time in Perth when it’s 8:00 in Melbourne? 3:00am (8:00 – 5:00)What is the time in Melbourne when it is 13:30 in Perth? 18h30 in Melbourne (13:30 + 5:00)
8. Get them to write the key information in their books for use in the next lesson. We summarise this information below:
New ZealandNew Zealand Eastern Standard TimeEastern Standard Time Central TimeCentral Time Western Standard TimeWestern Standard Time
0 - 2 hours - 2 hours 30 minutes - 5 hours
10:00 8:00 7:30 5:00
23:30 21:30 21:00 18:30
LVL 3MATHSa.indb 7LVL 3MATHSa.indb 7 12/14/2007 2:26:47 PM12/14/2007 2:26:47 PM

8
Mo
dule 1
* Note that the times given here will vary from time to time depending on Daylight Saving. New Zealand and Australian Daylight Saving does not always begin and end on the same date. In addition, not all Australian States always go on Daylight Saving.
Session 2Session 2
In this section we do time zone calculations by playing the game Time and Place.
First Time First Place Second Time Second Place
1. If you have access to the internet in your class you could introduce the class to the web-site www.wordtimeserver.com. The site tells you the current time in countries and major cities in the world.
2. The class plays Time and Place in pairs. The time cards are put face down in one pile and the place cards are put face down in another. Students draw a Time card, put the time in the left-hand column of the table and place the card on the bottom of the deck. They then draw a Place card and put the name of the city in the next (First place) column and place the card on the bottom of the deck. They then draw another Place card put this in the ‘Second place’ column of the table and place the card on the bottom of the deck. If this card is in the same time zone as the last card, they put the Place card on the bottom of the pack and take another Place card. They then calculate what time it is at the Second place when it is the first time at the First place. They put their answer in the last column of the table.
3. Check that the children understand the task and are carrying it out correctly.
4. When the table is filled, get the class to report on what it has done.
Session 3Session 3
In this session the class practice using timetables and their knowledge of time zones to plan a trip to Perth from where they live. You will need to provide your class with domestic and international flight timetables that are freely available from Air New Zealand and Qantas New Zealand. If you are unable to access the complete timetables we have provided Copymasters of the relevant pages from the timetables with this unit.
1. You are going to have a two-week holiday in Perth. I want you to plan the trip. Because of your parents’ work, you can’t leave before June 4th and you can’t get backafter June 17th. Plan the transport that will give you the longest possible time actually in Perth.
2. Get the children to report back with their results. Who was able to get the longest time in Perth?
LVL 3MATHSa.indb 8LVL 3MATHSa.indb 8 12/14/2007 2:26:48 PM12/14/2007 2:26:48 PM

9
Mo
dule
1
3. If you have access to the internet in your classroom you could log onto www.aimz.co.nz to be provided with an itinerary for the trip.
Session 4Session 4
In this session we are going to talk about the International Date Line and perform calculations around it.
1. Tell them that when the New Year comes, New Zealand is always the first place to see it. Discuss with them why they think that this might be. Don’t necessarily come to any conclusion.
2. Get out the globe and the torch again. Arrange things so that the torch (i.e. the Sun) is shining on New Zealand. Assume that the time in New Zealand is 10:00. Go West around the world and guess what the times are in the various places. Help them realise that some places not only have different times they are have different days!
3. Use these two situations to explain the concept of the International Date Line.
4. Make up a table showing the times and dates at different places in the world, when it is 9:00 on 24th January in New Zealand.
place time date
New Zealand 9:00 24th January
Sydney 7:00 24th January
Adelaide
Perth
New Delhi
Cape Town
Rome
London
New York
Los Angeles
Honolulu
Nadi
1. Now play International Date Line Time and Place.
2. The class plays International Date Line Time and Place in pairs in a similar way to Time and Place. Again, the Time cards are put face down in one pile and the place cards are put face down in another. Students draw a Time card, put the time and date in the left-hand (First time and date) column of the table and place the card on the bottom of the deck. They then draw a Place card and put the name of the city in the ‘First place’ column and place the card on the bottom of the deck. They then draw another Place card and put this in the ‘Second place’ column of the table and place the card on the bottom of the deck. If this card is in the same time zone as the last card, they put the Place card on the bottom of the pack and take another Place card. They then calculate what time and date it is at the Second place when
LVL 3MATHSa.indb 9LVL 3MATHSa.indb 9 12/14/2007 2:26:48 PM12/14/2007 2:26:48 PM

10
Mo
dule 1
it is the first time and date at the First place. They put their answer in the last column of the table.
3. Check that the children understand the task and are carrying it out correctly.
4. When the table is filled, get the class to report on what it has done.
Session 5Session 5
In this session the class practice using timetables and their knowledge of time zones to plan a trip to London from where they live.
1. You are going to have a three-week holiday in London. I want you to plan the trip. Because of your parents’ work, you can’t leave before December 6th and you can’t get back after December 26th. Plan the transport that will give you the longest possible time actually in London.
2. Get the children to report back with their results. Who was able to get the longest time in London? The children might like to think of some of the things that they might do while they are there.
3. If you have access to the internet in your classroom you could log onto www.aimz.co.nz and any other airline’s web site, to be provided with an itinerary for the trip.
HomelinksHomelinks
At home this week we work out the times in different cities around the world.
Are you about to make an International long distance phone call? Are you planning a trip to a foreign destination? Are you preparing for a web cast or online meeting? Are you looking for a free clock for your own web site or blog? With the Internet bringing everyone closer together, we still have to deal with our different locations having different times. World Time Server is here to help!
In 2007, the U.S. will move daylight-saving time to March 11th, the second Sunday of the month. While not on the scale of Y2K, this change could generate problems that modestly disrupt business operations, irritate customers and tarnish professional
Vendors are coming up with initial patches and fixes...[but] there’s more complications involving multiple time zones.”
Matthew W. Cain, Research VP
Get more information on this on:
http://www.gartner.com/it/products/podcasting/asset_167848_2575.jsp
Time is a measure but it is a different from the other measures in that it cannot be seen or touched. However, we are surrounded by the effect of time passing, for example, day to night and one season to another. There are two aspects of time children must develop:
• time as an instant which can be named, for example, 6:15;
LVL 3MATHSa.indb 10LVL 3MATHSa.indb 10 12/14/2007 2:26:48 PM12/14/2007 2:26:48 PM

11
Mo
dule
1
Unit 2
Why are patterns so important in our lives?
Use the following problems to teach your students arithmetic sequences and series before they explore the contents of activity 11 (a) T1; T2; T3; T4; T5
5; 9; 13; 17; 21This is an arithmetic series with 5 terms. The first term of this sequence is 5 and the last term 21.An arithmetic sequence has a common difference (d) that is calculated from:d = T2 − T1 = T3 − T2 = T4 − T3 = T5 − T4 = …If we denote the first term by a, then this sequence becomes: T1; T2; T3; T4; T5
a; a + d; a + 2d; a + 3d; a + 4d 5; 9; 13; 17; 21
This sequence has a common difference of 4.Any term of arithmetic sequence can be obtained from the formula:Tn = a + (n − 1)dThis term is called the general term of the sequence.
(b) If we change the above sequence to: 5 + 9 + 13 + 17 + 21it becomes an arithmetic series. What applies for a general term in terms of the common difference and the general term also applies for an arithmetic series. Moreover the sum of the terms of a series to any number of terms can be calculated from: Sn = n __ 2 [ 2a + (n − 1)d5; 9; 13; 17; 21; … is an infinite sequence and5 + 9 + 13 + 17 + 21 + … an infinite series
ExamplesExamples
1. Find the (a) tenth term of the sequence given above (b) the sum of the series given above to ten terms
SolutionsSolutions
(a) Tn = a + (n − 1)d
T10 = 5 + (10 − 1)4
= 41
The tenth term of this sequence is 41
(b) Sn = n __ 2 [ 2a + (n − 1)d ]
= 7 _ 2 [ 2(5) + (10 − 1)4 ]
= 230The sum of the terms of this series to ten terms is 230After this presentation your students can tackle activity 1 and activity 1(c) with confidence.
LVL 3MATHSa.indb 11LVL 3MATHSa.indb 11 12/14/2007 2:26:48 PM12/14/2007 2:26:48 PM

12
Mo
dule 1
LB page 59
SO 1, AS 1.1, LO 1.1a
Activity 1 Constant ratio
This is an example of an arithmetic sequence.
1. The first term here is 60 000 and d = 35 000.The sequence is: a 60 000a + d 60 000 + 35 000 = 95 000a + 2d 60 000 + 2(35 000) = 130 000a + 3d 60 000 + 3(35 000) = 165 000a + 4d 60 000 + 4(35 000) = 200 000a + 5d 60 000 + 5(35 000) = 235 000a + 6d 60 000 + 6(35 000) = 270 000
2. Sn = n __ 2 [ 2a + (n −1)d
= 7 _ 2 [ 2(60 000) + (7 −1)35 000]
= 1 155 000
3.1 a + 11d = 60 000 + 11(35 000) = 445 000
3.2 a + 9d = 60 000 + 9(35 000) = 375 000
3.3 a + 10d = 60 000 + 10(35 000) = 410 000
3.4 a + 12d = 60 000 + 12(35 000) = 480 000
3.5 a + 8d = 60 000 + 8(35 000) = 340 000
4. No. Visit: www.housing.gov.za to find out why.
5. a + (n − 1)d = Tn
60 000 + (n − 1)35 000 = 410 000
(n − 1)35 000 = 410 000 − 60 000
n − 1 = 350 000 ______ 35 000
n = 10 + 1
n = 11
A geometric sequence has a common ratio that is obtained from:
r = T2 __ T1 = T3 __ T2 = T4 __ T3 = …
Use the following sequence to present an example of a geometric sequence/
series (a) 1; 7; 49; 343; … (b) 1 + 7 + 49 + 343 + …
Find the eighth term and the sum to five termsTn = arn − 1
= (1)(78 −1 )= 823 543
LVL 3MATHSa.indb 12LVL 3MATHSa.indb 12 12/14/2007 2:26:49 PM12/14/2007 2:26:49 PM

13
Mo
dule
1
The eighth term of this sequence is 823 543
Sn = a(rn – 1)
______ r – 1
1(75 – 1)
______ 7 – 1
= 2801The sum of the first five terms of this series is 2801Your students can now do rest of the activities of this unit.
LB page 60
SO 1, AS 1.1, LO 1.1a
Activity 3 Number sequences
1. T1; T2; T3; T4; T5
1; 2; 4; 8; 16
2. T1 + T2 + T3 + T4 + T5
1 + 2 + 4 + 8 + 16
3.1 T2 __ T1
= 2 _ 1 = 2
3.2 T3 __ T2
= 4 _ 2 = 2
3.3 T4 __ T3
= 8 _ 4 = 2
3.4 T5 __ T4
= 16 __ 8 = 2
3.5 They give the same answer. The quotient is 2
4.1 Tn = arn − 1
T8 = (1)(28 − 1) = 128
4.2 Tn = arn − 1
T11 = (1)(211− 1) = 1024
4.3 Tn = arn − 1
T14 = (1)(214 −1) = 8 192
5. Sn = a(rn − 1)
______ r − 1
Sn = 1{(25 − 1)
______ 2 − 1
= 31
6. arn − 1 = Tn
(1)(2n −1) = 512
2n − 1 = 29
n − 1 = 9
n = 9 − 1
n = 8
512 is term number 8 of this sequence.
LVL 3MATHSa.indb 13LVL 3MATHSa.indb 13 12/14/2007 2:26:49 PM12/14/2007 2:26:49 PM

14
Mo
dule 1
LB page 61
SO 1, AS 1.1, LO 1.1a
Activity 4 Direct proportion in patterns
1. 2;3;4;5 1 _ 5 ; 1 __ 25 ; 1 ___ 125 ; 1 ___ 625
2. 1;3;9;37
3. arithmetic 3;2;1;0
4. Each of these will be calculated from:Tn = a + (n−1)d where Tn is the term a is the first term n is the term’s position d is the common difference
5.1 NeliTn = a + (n −1)dT9 = 10 + (9 −1)10= 90
MichaelTn = a + (n−1)dT9 = 8 + (9−1)8= 72
NancyTn = a + (n−1)dT9 = 5 + (9−1)5= 45
5.2 NeliTn = a + (n −1)dT11 = 10 + (11 −1)10= 110
MichaelTn = a + (n −1)dT11 = 8 + (11 −1)8= 88
NancyTn = a + (n −1)dT11 = 5 + (11 −1)5= 55
LVL 3MATHSa.indb 14LVL 3MATHSa.indb 14 12/14/2007 2:26:49 PM12/14/2007 2:26:49 PM

15
Mo
dule
1
LB page 62
SO 1, AS 1.1, LO 1.1a
Activity 5 Inverse proportions of patterns
1. Note that for each learner to 36 learners that enroll in a school, a teaching post becomes available to the school. For this reason, rounding up approach to the nearest natural number is the way out here.
(a) Number of teaching posts = 1234 ÷ 36 = 34,3 = 35
(b) Number of teaching posts = 925 ÷ 36 = 25,7 = 26
(c) Number of teaching posts = 715 ÷ 36 = 19,9 = 20
(d) Number of teaching posts = 631 ÷ 36 = 17,5 = 18
(e) Number of teaching posts = 511 ÷ 36 = 14,2 = 15
(f) Number of teaching posts = 326 ÷ 36 = 9,1 = 10
(g) Number of teaching posts = 251÷ 36 = 7,0 = 7
2. The way out here is to subtract the number of educators the school was entitled to in the previous year from the number of educators the school is entitled to in that year. The difference here is the number of educators that are in excess in that year.
(a) Number of educators in excess = 35 − 26 = 9 (b) Number of educators in excess = 26 − 20 = 6 (c) Number of educators in excess = 20 − 18 = 2 (d) Number of educators in excess = 18 − 15 = 3 (e) Number of educators in excess = 15 − 10 = 5 (f) Number of educators in excess = 10 − 7 = 33. (a) ± 5 (b) ± 3 (c) ± 2
4. Yes :− There will be learners who will be in the neighborhood of the whose parents will not have money to pay for transport for their children to be transported to distant schools. According to our Bill of Rights these children are entitled to receive education as well. If the department closes this school their right to receive education at a public institution of their choice will be violated.
LVL 3MATHSa.indb 15LVL 3MATHSa.indb 15 12/14/2007 2:26:49 PM12/14/2007 2:26:49 PM

16
Mo
dule 1
No :− Running this school will be a huge expense to the Department of Education and hence to the tax payers.
5. − Negative impact by educators of the school − Negative impact by the community − Not enough support from department officials − Not enough support from the Department of Education in terms of
equipping the school with the required infrastructure. The example here are children who are receiving education under trees
− Not enough support from the government in terms of developing the required infrastructure of the community. It will be difficult for such a school to attract properly qualified and dedicated educatorsThe list is endless
6. You will receive different responses from students for this one.
LB page 64
SO 1, AS 1.1, LO 1.1a
Activity 6 Dependent and independent variables
Students are NOT expected to give you problems in this one
LB page 65
SO 1, AS 1.1, LO 1.1a
Activity 7 Descriptions of patterns
1. A geometric sequence. It has a common ratio
2. 5Obtained from: r =
T2 __ T1
= T3 __ T2
= T4 __ T3
= T5 __ T4
= 5
3. An increasing sequence. Each following camp has more buffalos than the previous one
4. Camp 1
5. Camp 5
LB page 65
SO 1, AS 1.1, LO 1.1a
Activity 8 Application
1. Speed = distance covered ____________ time taken
= 45 __ 15
= 3 km/h
2. Increase in average speed = 0,5 × 10 = 5 km/hHis average speed in the marathon race = 3 + 5 = 8 km/h
LVL 3MATHSa.indb 16LVL 3MATHSa.indb 16 12/14/2007 2:26:49 PM12/14/2007 2:26:49 PM

17
Mo
dule
1
3. Arithmetic
4. It decreases
5. An inverse proportion
6. No. Distance is a continuous physical quantity
7. No. Speed is a continuous physical quantity
8. No. Time is a continuous physical quantity.
LB page 67
SO 1, AS 1.1, LO 1.1a
Activity 9 Trends in patterns
1. 25 m
2.1 Increases
2.2 Decreases
LB page 69
SO 1, AS 1.1, LO 1.1a
Activity 10 Application
1. (a) Maximum value: 8
(b) Critical value: 2
(c) Interval of increase: −1 to 2 Interval of decrease: 2 to 5
2. (a) Minimum value: −5
(b) Critical value: −1
(c) Interval of increase: −1 to 5 Interval of decrease: −3 to −1
3. (a) Minimum value: −6 Maximum value: 9
(b) Critical values: 2 and 4
(c) Intervals of increase: – 3 _ 2 to 2 and 4 to 7 Interval of decrease: 2 to 4
4. (a) Minimum value: −8 Maximum value: 9
(b) Critical values: −5 and −2
(c) Interval of increase: −5 to −2Intervals of decrease: −9 to −5 and −2 to 1
LVL 3MATHSa.indb 17LVL 3MATHSa.indb 17 12/14/2007 2:26:50 PM12/14/2007 2:26:50 PM

18
Mo
dule 1
LB page 45
SO 1, AS 1.1, LO 1.1a
Activity 11 Arithmetic and geometric patterns from formulae
1. A geometric sequence. It has a common ratio
2. 5Obtained from: r =
T2 __ T1
= T3 __ T2
= T4 __ T3
= T5 __ T4
= 5
3. An increasing sequence. Each following camp has more buffalos than the previous one
4. Camp 1
5. Camp 5
LB page 70
SO 1, AS 1.1, LO 1.1a
Activity 12 Application
1. Figure 1 2 3 4 5 6 7 8 9 10
Number of lines
1 3 5 7 9 11 13 15 17 19
2. (a) 29
(b) 43
(c) 213
(d) 6 915
(e) 19 999
3. (a) 50
(b) 29
(c) 519
(d) 168
(e) 221
LB page 71
SO 1, AS 1.1, LO 1.1a
Activity 13 Unit assessment
1.1 (a) 531441 = 3 12 177147 = 3 11 59049 = 3 10 19683 = 3 9 6561 = 3 8
LVL 3MATHSa.indb 18LVL 3MATHSa.indb 18 12/14/2007 2:26:50 PM12/14/2007 2:26:50 PM

19
Mo
dule
1
(b) Year 1 2 3 4 5
Number of ants
3 12 3 11 3 10 3 9 3 8
(c) 3 12 ; 3 11 ; 3 10 ; 3 9 ; 3 8 . This is a geometric sequence.
(d) 1 _ 3
(e) It is a decreasing sequence. Each following term is lesser than the preceding one
(f) In the 14th year.
1.2 (i) 3; 6; 10; 15; 21; 28; 36; 45; 55; 66; 78 ; 91
(ii) 72; 56; 42; 30; 20; 12; 6; 2
(v) 2; 5; 10; 17; 26; 37; 50; 65 ; 82
1.3 (a) 1015
(b) 1450
(c) (i) 1993: Classes used: 13 Classes not used: 161994: Classes used: 19 Classes not used: 101995: Classes used: 27 Classes not used: 2
(ii) Classes used: 29
Number of students short of space: 70
(iii) Number of classeswith 37 students: 17
Number of classeswith 38 students: 12
(iv) Number of classeswith 41 students: 16
Number of classeswith 42 students: 13
(vi) The number of unused classes decreases with an increase in student enrolment and increases with a decrease in student enrolment. This is undoubtedly an inverse proportion relationship.
(vii) The number of classes that are used in any given year increases with an increase in student enrolment and vice versa. This is a direct proportion relationship.
LVL 3MATHSa.indb 19LVL 3MATHSa.indb 19 12/14/2007 2:26:50 PM12/14/2007 2:26:50 PM

20
Mo
dule 1
(viii) 1993: 131994: 181995: 261996: 311997: 34
1.4 Student’s answers.
1.5) (a) 1 000 km(b) 3 000 km(c) 1 000 km(d) 1 500 km(e) From 0 km to 1 500 km(f) From 1 500 km to 3 000 km(g) This is a continuous relationship. The distance moved by the dummy missile can not be counted like coins in a wallet.
Class test 1Time: 42 min Total: 35Time: 42 min Total: 35
1.1 In her effort to increase the sales of her home based business, Matilda bought 41 layers in order to avoid continuing buying eggs from a local farmer.
1.1.1 Given that each layer lays one egg per day, make a sequence of Matilda’s eggs if the first 41 eggs laid on the first day added to 29 eggs she had bought from the local farmer. Take note that the first term will be 29 here. (2)
1.1.2 Is this an arithmetic or geometric sequence? (1)
1.1.3 What is the common difference or ratio of the sequence? (1)
1.1.4 Find the seventh term of the sequence: (2)
1.1.5 What term of the sequence is 1259? (2)
1.1.6 Find the sum of the series that will be formed from this sequence to twenty one terms. (4)
1.2 An HIV infected person can infect another person if they engage themselves in unprotected sex. If these two people separate and find themselves new partners each of them will be infecting his or her new partner if they engage themselves in unprotected sex. The following sequence can be formed from these infections:1; 2; 4; 8; 16; 32; …
1.2.1 Is this an arithmetic or geometric sequence? (1)
1.2.2 What is the common difference or ratio of the sequence? (1)
1.2.3 Find the fifteenth term of the sequence (2)
LVL 3MATHSa.indb 20LVL 3MATHSa.indb 20 12/14/2007 2:26:51 PM12/14/2007 2:26:51 PM

21
Mo
dule
1
1.2.4 What term of the sequence is 33 554 432? (2)
1.2.5 Find the sum of the series made from this sequence to sixteen terms (4)
1.3 Classify the following relationships as direct, inverse or no mathematical relationship
(a) A steady increase in enrolment in schools if properly managed and attract properly qualified and dedicated educators. (1)
(b) An increase in the number of children benefiting from child support grants over the years with an increase in the number of parents who are retrenched over the same years (1)
(c) A decrease in income over a given time interval with a decrease in the number of items sold over that same time interval. (1)
(d) An increase in the number of rows with a decrease in the number of columns for the same number of items (1)
(e) A decrease in the volume of water in a tank with an increase in time if the tap is opened (1)
1.4 Classify each of the data in relationships in 1.3 as discreet or continuous. (4)
1.5 Give one example of a relationship with continuous data. (2)
1.6 Generate the first five terms of each sequence from each of the following general terms:
(a) Tn = n + 2 (1) (b) Tk = 2 k + 2 (1)
Test solutions1.1.1 29; 111; 152; …
Note that each successive term is obtained by adding 41 to the preceding term.
1.1.2 An arithmetic sequence
1.1.3 41 Note that d = T2 − T1 = T3 − T2 = T4 − T3 = …
1.1.4 (a) Tn = a + (n −1)dT7 = 29 + (7 −1)41= 275
(b) Tn = a + (n −1)dT12 = 29 + (12 −1)41= 480
1.1.5 a + (n −1)d = Tn29 + (n −1)41 = 1259(n − 1)41 = 1259 − 29
LVL 3MATHSa.indb 21LVL 3MATHSa.indb 21 12/14/2007 2:26:51 PM12/14/2007 2:26:51 PM

22
Mo
dule 1
n − 1 = 1230 ____ 41 n = 30 + 1= 31
1.1.6 Sn = n __ 2 [ 2a + (n −1)d]
= 21 __ 2 [ 2(29) + (21 −1)41]
= 9 219
1.2.1 Geometric sequence
1.2.2 r = T2 __ T1
= T3 __ T2
= T4 __ T3
= 2
1.2.3 Tn = arn − 1
T15 = (1)(2 15 −1)= 16384
1.2.4 arn − 1 = Tn
(1)(2n −1) = 33 554 4322n −1 = 2 25
n − 1 = 25n = 26
1.2.5 Sn = arn − 1 ____ r − 1
= (1)2 16 − 1
_______ 2 − 1
= 65 535
1.3 Classify the following relationships as direct, inverse or no mathematical relationship
(a) No mathematical relationship
(b) Direct
(c) Direct
(d) Inverse
(e) Inverse
1.4 (a) Discreet
(b) Discreet
(c) Discreet
(d) Discreet
(e) Continuous
1.5 Increase in height of a tree with an increase in the number of months
1.6 Generate the first five terms of each sequence from each of the following general terms:
(a) 3; 4; 5; 6; 7
(b) 8; 16; 32; 64; 128
LVL 3MATHSa.indb 22LVL 3MATHSa.indb 22 12/14/2007 2:26:51 PM12/14/2007 2:26:51 PM

23
Mo
dule
1
Unit 3
Focus on fi nance
LB page 77
SO 1, AS 1.1, LO 1.1a
Activity 1 Revision and development
1. answers will vary
2.1 R4 000
2.2 Loss; R1 560
2.3 (a) R6 250
(b) R6,25
(c) R25
3.1 The first of 8 pages.
3.2 Yes; R517,09
3.3 11 July 2005
3.4 R319,48
3.5 4 Aug. 2005; 24 days
3.6 Rent; usage
4.1 A) 49c
B) 55 c
C) 135 c
D) 227c
E) 60c
F) 105c
G) 219c
4.2 R35,98
5.1 R1 437,17
5.2 R68 984,16
5.3 No; 11c
6. ADG; JBH; EKI; CFL
7.1 $249 597,42
7.2 (a) yes
(b) R70,63
LVL 3MATHSa.indb 23LVL 3MATHSa.indb 23 12/14/2007 2:26:51 PM12/14/2007 2:26:51 PM

24
Mo
dule 1
LB page 82
SO 1, AS 1.1, LO 1.1a
Activity 2 Application
1.1 student’s answers will vary according to their own purchase prices chosen.
1.2 (a) R1101
(b) R8 072
(c) R264 240;
(d) Capital R100 000; Interest R164 240
(e) Instalment (monthly) : R1 200; Total interest less R116 000; difference = R48 240 760.
2.1 Total expenditure = total income = R11 000
Membership fees R 9 120
Fund-raising event R1 880
3.1 Yes
3.2 Yes, except for 2003
3.3 Revenue (Growth %: 2000 to 2003: revenue 44% with operating expenses 26%)
3.4 9,4 x 10; operating expenses 26
4.1 SIBULELE
4.2 Sibulelu: 36,4 % profit Shireen: 35,9% profit Sibulelu fared better
5.1 R604,80
5.2 R589,68
6.1 35,1%
6.2 53,2%
6.3 15,4%
6.4 23,2%
6.5 7,9
6.6 7,0
6.7 6,5
7.1 best and (b) worst
LVL 3MATHSa.indb 24LVL 3MATHSa.indb 24 12/14/2007 2:26:51 PM12/14/2007 2:26:51 PM

25
Mo
dule
1
LB page 85
SO 1, AS 1.1, LO 1.1a
Activity 3 Research task
Student’s responsesStudent’s responses
LB page 86
SO 1, AS 1.1, LO 1.1a
Activity 4 Application: tax in, tax out
1. Personal income tax (R94,4 billion); VAT (R79,2 billion)
2. Tax on retirement funds
3. R292,8 billion
4. Education; Social Services and Welfare; Debt Service/Interest
5. R13 billion
LB page 87
SO 1, AS 1.1, LO 1.1a
Activity 5 Application: mining and minerals
1. Aluminium, chrome, manganese, gold, platinum, vanadium, vermiculite
2. USA by 2,2%
3. Fifth .
3.1 To represent fractions
LB page 88
SO 1, AS 1.1, LO 1.1a
Activity 6 Application: friends in trade
1.1 (a) UK
(b) UK
1.2 0,491
2.1 Belgium, Israel, Holland, Japan, Spain, United Kingdom, Zambia, Mozambique
2.2 The other countries mentioned
3. UK, USA, Germany, etc.
LB page 90
SO 1, AS 1.1, LO 1.1a
Activity 7 Project
Student’s responses
Give students an opportunity to report their findings to the whole group
LVL 3MATHSa.indb 25LVL 3MATHSa.indb 25 12/14/2007 2:26:52 PM12/14/2007 2:26:52 PM
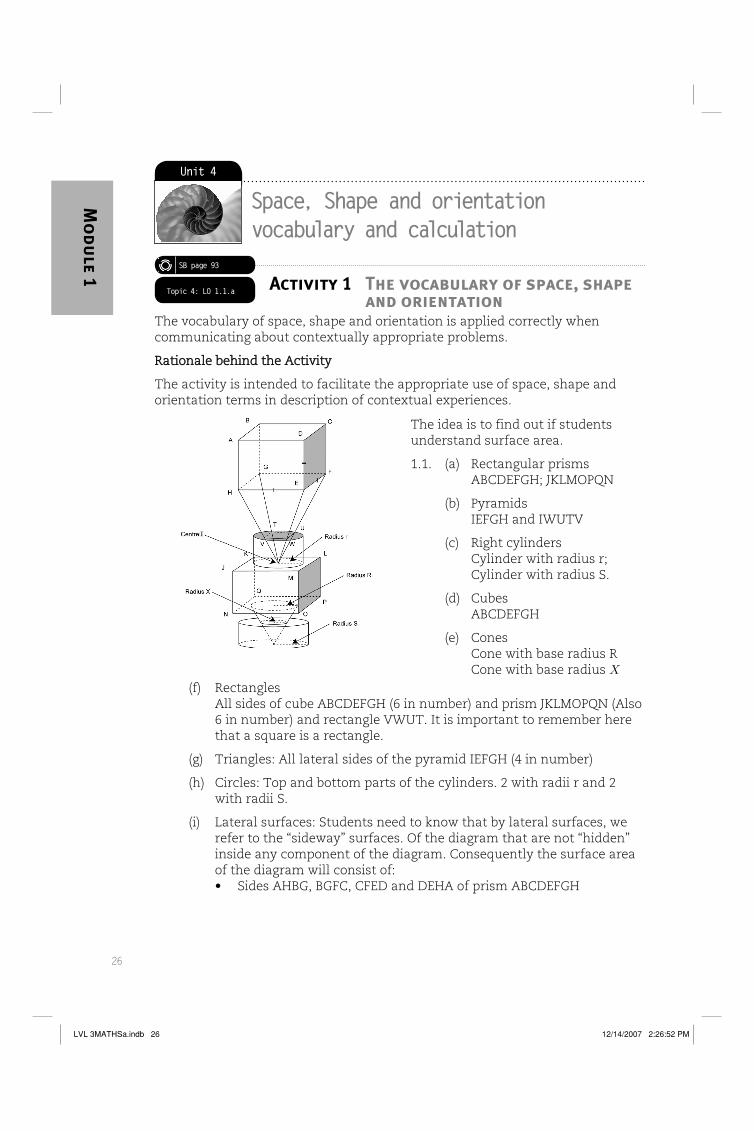
26
Mo
dule 1
Unit 4
Space, Shape and orientation vocabulary and calculation
SB page 93
Topic 4: LO 1.1.a Activity 1 The vocabulary of space, shape and orientation
The vocabulary of space, shape and orientation is applied correctly when communicating about contextually appropriate problems.
Rationale behind the ActivityRationale behind the Activity
The activity is intended to facilitate the appropriate use of space, shape and orientation terms in description of contextual experiences.
The idea is to find out if students understand surface area.
1.1. (a) Rectangular prismsABCDEFGH; JKLMOPQN
(b) PyramidsIEFGH and IWUTV
(c) Right cylindersCylinder with radius r; Cylinder with radius S.
(d) CubesABCDEFGH
(e) ConesCone with base radius RCone with base radius X
(f) RectanglesAll sides of cube ABCDEFGH (6 in number) and prism JKLMOPQN (Also 6 in number) and rectangle VWUT. It is important to remember here that a square is a rectangle.
(g) Triangles: All lateral sides of the pyramid IEFGH (4 in number)
(h) Circles: Top and bottom parts of the cylinders. 2 with radii r and 2 with radii S.
(i) Lateral surfaces: Students need to know that by lateral surfaces, we refer to the “sideway” surfaces. Of the diagram that are not “hidden” inside any component of the diagram. Consequently the surface area of the diagram will consist of:• Sides AHBG, BGFC, CFED and DEHA of prism ABCDEFGH
LVL 3MATHSa.indb 26LVL 3MATHSa.indb 26 12/14/2007 2:26:52 PM12/14/2007 2:26:52 PM

27
Mo
dule
1
• Trapezia HEWV, EFUW, FGTU and GTVH, parts of pyramid IEFGH not immersed into the cylinder.• Lateral sides of the cylinder with radius r • Sides JMON, MOPL, LPQK and KQNJ of prism JKLMOPQN• Lateral parts of cone with radius X not immersed in the cylinder with radius S.• Lateral sides of cylinder with radius S.
(j) To obtain the total surface area of the diagram, we combine the lateral surfaces with the top-and bottom sides not immersed into, or share a common side with, the other figure. The following will be the components of the total surface area of the figure:• Sides AHBG, BGFC, CFED and DEHA and ABCD of prism ABCDEFGH We do not include side EFGH because it is shared between the prism and pyramid. • Trapezia HEWV, EFUW, FGTU and GTVH, parts of pyramid IEFGH not immersed into the cylinder.• Lateral sides of the cylinder with radius r. plus its top circle less side VWUT.• Sides JMON, MOPL, LPQK and KQNJ - plus side JKLM less circle area with radius r - of prism JKLMOPQN• Lateral parts of cone with radius X not immersed in the cylinder with radius S.• Lateral sides of cylinder with radius S plus circle area with radius S less circle Area with radius X.
1.2. (a) 13: All of the rectangles.
(b) 6 squares. This stresses the fact that a square is a parallelogram.The capacity of the stand is given by the volume of the glass component, while the volume of the stand includes the volume of the wooden base plus that of the glass component.
LVL 3MATHSa.indb 27LVL 3MATHSa.indb 27 12/14/2007 2:26:53 PM12/14/2007 2:26:53 PM

28
Mo
dule 1
1.3. The students are expected to physically count the number of circular paths traversed by the satellites. In some cases, a path is traversed by more than one satellite. The earth, when looked at 2 dimensionally – also generates a circle. It is, 3 dimensionally speaking, a sphere.
1.4 Let the students count the number of stars, knowing that stars are spherical. The students should be further asked to read about galaxies, universe etc.
SB page 129
Topic 4: LO 2.1.a; LO 1.1.a
Activity 21 Area, Volume, time and distance
Use the following formulae:
Lateral surface area A of a cylinder with height l and radius r is A = 2πrl Area A of a circle with radius r is A = π r 2 Volume V of a cylinder with height h and radius r is V = πr 2 hVolume V of a sphere with radius r is V = 4/3 π r 3 Volume V of a cube with side x is V = x 3 Volume V of a right cone with radius r and height h is V = 1 _ 3 π r 2 h Surface area A of a sphere with radius r is A = 4 π r 2 Lateral surface area A of a right cone with radius r and height h is A = π r R r 2 + h 2
Answers1. Despite the fact that all three have the same base perimeter (20m) and
the same height (15m), the three rectangular tanks are of different storage volumes:
LVL 3MATHSa.indb 28LVL 3MATHSa.indb 28 12/14/2007 2:26:53 PM12/14/2007 2:26:53 PM

29
Mo
dule
1
A. V = 24 m 2 × 15m = 36 0m 3 B. V = 25 m 2 × 15m = 375 m 3 C. V = 1 6m 2 × 15m = 240 m 3
The students should observe that the closer the base of the tank is to the square, the more will be its volume.
2. As per discussion above, the garden will be maximal if it is in the form of a square. This example can be used by the students, through trial and error, to confirm that the closer the length and breadth describe a square, the larger will be the resulting area.
3.1
The total area of the conference centre is 320 m 2
∴ Area of each small boardroom = 320 m 2 _____ 8 = 40 m 2 , meaning that the area of
the main boardroom is 80m 2 .Since, for instance, boardrooms 3 and 6 have
the same length and breadth, the breadth of bedroom 3 will be 5m, and
its length will be 8m. So boardrooms 1-6 will each be of dimensions 5m by
8m, with main boardroom being of dimensions 10m by 8m.
3.2 There are an equivalent of 8 small boardrooms in the centre. Number of
square tiles per small boardroom = 8000 ____ 8 = 1000. This effectively means that
there will be 2000 square tiles in the main boardroom, and 1000 square
tiles in each of the small boardrooms. The area of each square tile in each
LVL 3MATHSa.indb 29LVL 3MATHSa.indb 29 12/14/2007 2:26:53 PM12/14/2007 2:26:53 PM

30
Mo
dule 1
of the small boardrooms =
40m 2 ____ 1000 = 0,04 m 2 = 0,04(100 cm) 2 = 400 cm 2 . The side of each square tile will
then be R400 c m 2 = 20 cm
3.1
The amount of material used will be the area of the circle (head) plus the area of the triangle less twice 3 cm 2 .Amount = π (25 cm 2 ) + 1 _ 2 × 3 cm × 10 cm – 6 c m 2 ≈ 87,54 cm 2
4. Required volume = Volume of prism – volume of cylinder.
V = 12 m × 6 m × 8 m – π(4 m 2 )(6 m) = 500,6 m 3
5.
The tyre is cylindrical in shape. Volume of tyre = volume from centre to circumference of tyre – volume of hole.
LVL 3MATHSa.indb 30LVL 3MATHSa.indb 30 12/14/2007 2:26:54 PM12/14/2007 2:26:54 PM

31
Mo
dule
1
V = π( r 2 – 100)(6) cm 3 = 264 π cm 3 ⇒ 6 πr 2 = 864 π⇒ r 2 = 144 ⇒ r = 12 cmA = π( r 2 – 100) cm 2 = 44 π cm 2
LVL 3MATHSa.indb 31LVL 3MATHSa.indb 31 12/14/2007 2:26:55 PM12/14/2007 2:26:55 PM

32
Mo
dule 2
Module 2All forms of patterns around us!
Unit 5
Calculations and measuring techniques
SB page 138
Topic 1: LO2.1.a; LO 2.1.b;c;f
Activity 1 Percentages in context
1.1 The 12 and 15 are respectively included in the 102 and 148, so that the total workforce is 250.
1.2 The required percentage is
102 ___ 250 × 100% = 40,8%
1.3 The required percentage is 223 ___ 250 × 100% = 89,2%
2.1 From the graph, 44% of management was black. This means that there were 44% × 1000 = 440 black managers in the company in 2003.
2.2 Number of managers in 2005 = 0,125 × 20000 = 2500Percentage of black managers in 2005 = 60%∴ Number of black managers in 2005 = 60% × 2500 = 1500
3.2 Number of black executive managers in 2005 = 35 ___ 100 × 180 = 63
Total number of executive managers in 2005 = 1 __ 10 × 1500 = 150
Number of black executive managers in 2005 = 40 ___ 100 × 150 = 60
Total number of middle managers in 2005 = 1 350
Number of black middle managers in 2005 = 60 ___ 100 × 1350 = 810
∴ Number of black managers in 2005 = 870
3.3 Suppose the number of executive managers in 2003 was x. Then
35 ___ 100 x = 70 ⇒ x = 70 × 100 ___ 35 = 200
This means the number of executive managers in 2003 was 200.
But then the number of middle managers in 2003 was 2 300.
Number of black middle managers in 2003 = 50 ___ 100 × 2300 = 1150
∴ Number of black managers in 2003 = 1220
LVL 3MATHSa.indb 32LVL 3MATHSa.indb 32 12/14/2007 2:26:55 PM12/14/2007 2:26:55 PM

33
Mo
dule
2
4.1 (a) Number of interventions in 2005 = 2,4 × 10000 = 2400
Number of daily interventions in 2005 = 2400 ____ 200 = 12
Number of employees in 2006 = 10000 + 10% × 10000 = 11000
Number of interventions in 2006 = 3,2 × 11000 = 35200
Number of daily interventions in 2006 = 35200 _____ 200 = 176
(b) This is a case of distribution of addition over multiplication:10000 + 10% × 10000 = 10000 × 100% + 10% × 10000 = 10000(100% + 10%) = 110% × 10000
4.2 (a) Period Amount invested Interest per annum Amount due to investor at end of period
1st year R1 000 10% R1100
2nd year R1 100 10% R1210
(b) Student’s solutions
(c) This is a case of simplifying by applying distributive property of addition over multiplication.For instance, at the end of second year, we have:A = (P + r%P)+r%(P + r%P) = P(1 + r%) [1+r%] = p(1+r%) 2
(d) A = P(1 + r%) 2 = 1000(1 + 10%) 3 = 1000(110%) 3 = 1331,meaning that at the end of the third year the amount received by the investor would, as expected, be R1 331.
(e) A = 1500(1 + 7 ___ 100 ) 15
= 1500(107%) 15 = 4138,55
The amount received at the end of 15 years would be R4138,55.
Key Display
1.07 1.07
y x 1.07
15 15
= 2.759
x 2.759
1500 1500
= 4138,55
5. % prevalence = 10,2% of 42 42%x = 1200, where x is the number of employees.That is, 0.04284x = 1200 ⇒ x ≈ 28011There were about 28011 employees in the company.OrLet x be the number of employees who went for VCT. Then10,2% of x = 1200 ⇒ x ≈ 11765If y is the total number of employees in the company in 2007, then
42% of y = 11765 ⇒ y ≈ 11765 _____ 0,42 = 28012
LVL 3MATHSa.indb 33LVL 3MATHSa.indb 33 12/14/2007 2:26:56 PM12/14/2007 2:26:56 PM

34
Mo
dule 2
SB page 142
Topic 1: LO 2.2.a Activity 3 Ratio and rate
1.1. Ratio = 1:4
1.2. % = 1 _ 5 × 100% = 20%
2. 250ml = 1 _ 4 × 1000ml = 1 _ 4 litre
Number of litres of dilute juices drunk = 1 _ 4 × 200 = 50 litres
Number of 5-litre concentrates = 2 (Each 5 - litre concentrates produces 25
litres of dilute juices).
3.1 200 loaves = 5 loaves × 40, meaning that each ingredient will be increased 40-fold. This justifies the following table:
Ingredient Quantity in grams
Flour 36 000
Baking powder 4 000
Margarine 10 000
Yeast 4 000
Salt 4 000
Sugar 2 000
3.2 4kg = 4 000g = 50g × 80. This means that each of the ingredients will be increased 80-fold, giving 80 loaves. The table outlines the amount of ingredients needed:
Ingredient Quantity in grams
Flour 72kg
Baking powder 8kg
Margarine 20kg
Yeast 8kg
Salt 8kg
Sugar 4kg
SB page 152
Topic 1: LO 3.2.a Activity 5 Volume
1.1 Lateral surface area of a cylinder with radius r and height h: A = 2πrhVolume of a cylinder with radius r and height h: V = πr 2 h
(a) Total surface area = lateral surface area + shaded area.+ surface area of water.
LVL 3MATHSa.indb 34LVL 3MATHSa.indb 34 12/14/2007 2:26:56 PM12/14/2007 2:26:56 PM
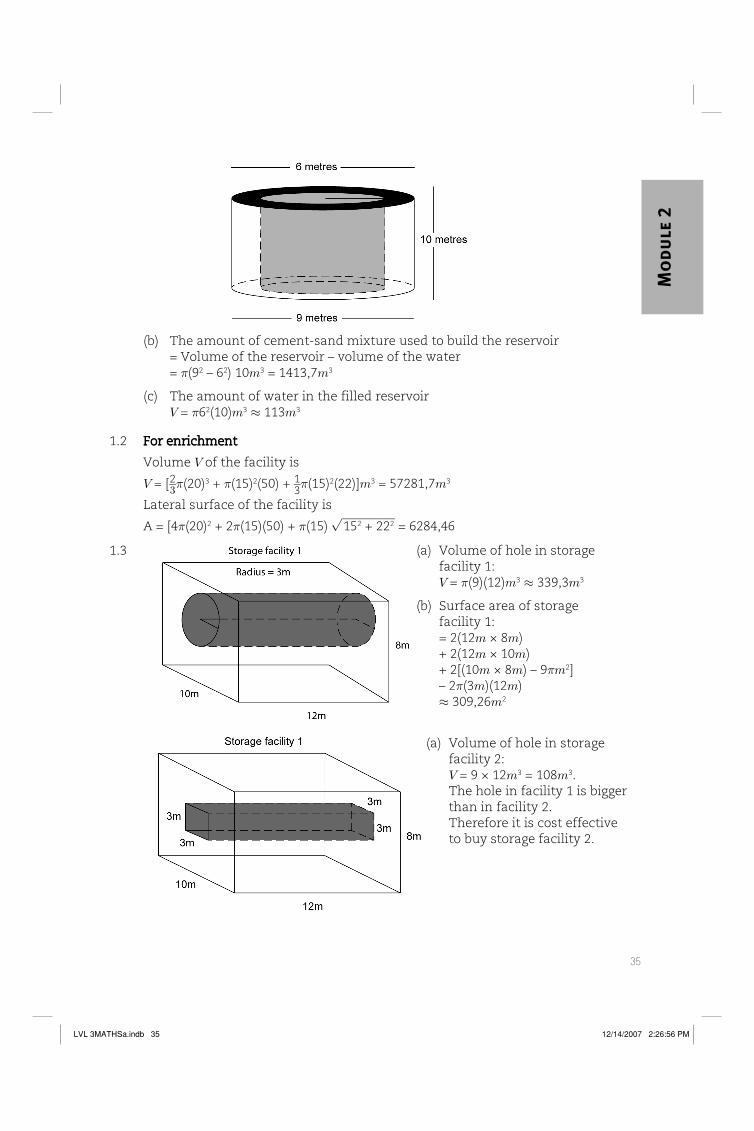
35
Mo
dule
2
(b) The amount of cement-sand mixture used to build the reservoir= Volume of the reservoir – volume of the water= π( 9 2 – 6 2 ) 1 0m 3 = 1413,7 m 3
(c) The amount of water in the filled reservoirV = π 6 2 (1 0)m 3 ≈ 113 m 3
1.2 For enrichmentFor enrichment
Volume V of the facility is
V = [ 2 _ 3 π (20) 3 + π (15) 2 (50) + 1 _ 3 π( 15) 2 (22)] m 3 = 57281,7 m 3
Lateral surface of the facility is
A = [4π (20) 2 + 2π(15)(50) + π(15) √_________
152 + 222 = 6284,46
1.3 (a) Volume of hole in storage facility 1: V = π(9)( 12)m 3 ≈ 339, 3m 3
(b) Surface area of storage facility 1:= 2(12m × 8m) + 2(12m × 10m) + 2[(10m × 8m) – 9 πm 2 ] – 2π(3m)(12m) ≈ 309,2 6m 2
(a) Volume of hole in storage facility 2: V = 9 × 12 m 3 = 10 8m 3 .The hole in facility 1 is bigger than in facility 2.Therefore it is cost effective to buy storage facility 2.
LVL 3MATHSa.indb 35LVL 3MATHSa.indb 35 12/14/2007 2:26:56 PM12/14/2007 2:26:56 PM

36
Mo
dule 2
(b) Surface area of storage facility 2:= 2(12m × 8m) + 2(12m × 10m) + 2[(10m × 8m) – 9π m 2 ] – 2π(3m)(12m) ≈ 309,2 6m 2
1.4 1. Area of the triangle = 6 cm 2 = 5H ___ 2 ∴ H = 12 __ 5 cm
2. Area of the triangle = 6 cm 2 = 3H ∴ H = 2 cm
1.5 (a) The scale 1cm = 1m means that every 1cm length on the drawing paper represents 1m on the ground.
5cm
6cm
Living Room
• The scale 2cm = 10m means that every 2cm length on the drawing paper represents 10m on the ground or, alternatively, 1cm on the drawing paper represents 5m on the ground.
• 2cm = 10m is equivalent to 1cm = 5m and 5cm = 15m is equivalent to 1cm = 3m.
• Using the scale 1cm = 1m, the length of the room will be 6m, while its breadth will be 5m, so that the area of the room will be 30 square metres.
1.6 Using the scale 2cm = 10cm, which is equivalent to 1cm = 5cm, the area of the room will be 25m × 30m = 750 square metres.
(a) 2cm = 10m implies 2cm = 1000cm or, equivalently, 1cm = 500cm.The ratio scale is therefore 1:500.
1.7 5cm = 15m implies 5cm = 1500cm or, equivalently, 1cm = 300cm.The ratio scale is therefore 1:300.
1.8 Student’s responses.
Notes to the lecturer:You will make a choice of a tool to use for assessment.
LVL 3MATHSa.indb 36LVL 3MATHSa.indb 36 12/14/2007 2:26:57 PM12/14/2007 2:26:57 PM

37
Mo
dule
2
Rubric AssessmentAssessment standards Student is competent Student is not competent
The student solves problems using a range of strategies including using and converting between appropriate S.I. units.
Student successfully used appropriate scale conversion.
Student failed to use appropriate scale conversion.
Student solves problems involving known geometric figures and solids in a range of measurement contexts by selecting measuring instruments appropriate to the problem.
Student successfully solved the problems.
Student fails to identify the representations that are required.
Task List Assessment
Task ScoreComment
Weighting Total Points
Student was able to correctly change from one scale to the other.
1 2 3 4 5 6 7 3
How to use this rubricHow to use this rubric
e.g. If a student recieves a score of 4, we then have 4 × 3 = 12 as total points. The maximum is 7 × 3 = 21 points. We then calculate the student’s percentage mark: 12 __ 21 × 100 = 57%
Assessment on group work:Assessment on group work: Evaluating Team WorkEvaluating Team Work
Criteria:Criteria: Use the following symbols: Use the following symbols:
S: Strong M: Moderate N: Needs attentionS: Strong M: Moderate N: Needs attention
Criteria Score
1 Appropriate working methods Individual Consensus
2 Trust and mutual understanding S M N S M N
3 Use of team members’ strengths S M N S M N
4 Open and effective communication S M N S M N
5 Sharing of ideas and resources S M N S M N
6 Cohesiveness and comradeship S M N S M N
7 Constructive conflict management
8 Climate of mutual support S M N S M N
9 Openness to new ideas and change S M N S M N
10 Decision making S M N S M N
11 Motivation S M N S M N
LVL 3MATHSa.indb 37LVL 3MATHSa.indb 37 12/14/2007 2:26:57 PM12/14/2007 2:26:57 PM

38
Mo
dule 2
12 Success acknowledged and celebrated S M N S M N
13 Expertise / resources improved S M N S M N
14 Roles and responsibilities clear to all S M N S M N
15 Overall team effectiveness S M N S M N
LVL 3MATHSa.indb 38LVL 3MATHSa.indb 38 12/14/2007 2:26:57 PM12/14/2007 2:26:57 PM

39
Mo
dule
2
Unit 6
Identifying and using information from patterns to solve workplace problems
The activities that include concepts that might be to the student are preceded by examples that are explained in detail. The purpose of this is to give the students the opportunity to go through these examples and answer the activities.
Do with them examples of problems that involve finding square roots of perfect squares and cube roots of perfect cubes before giving them activities on square roots and cube roots.
Remember that a perfect square is a number with rational square root and a perfect cube is a number with a rational cube root.
Definition of a rational number: A number that can be written as a _ b where
a; b ∈ Z
SB page 160
Topic 2: LO 2.1.a; LO 2.2.a
Activity 1 Dependent and independent variables1. Independent: Provinces
Dependent: Number of houses
2. Gauteng province has more job opportunities than any other province in South Africa. The discovery of gold in Johannesburg in 1926 made Guateng the most industrialized province in South Africa. More people from all over South Africa flocked to this province. Even foreign investors invested in numbers. All these necessitate the development of good infrastructure. Hence, the building of more houses.
3. Northern Cape is a poorly developed province.
4. Province Number of million houses built per year
Eastern Cape: 14,809
Free State: 10,935
Gauteng: 53,730
KwaZulu-Natal: 29,687
Mpumalanga: 8,734
Northern Cape: 3,802
Northern (Limpompo) Province: 10,359
North West: 12,263
Western Cape: 21,774
5. Students will give different answers to this one.
LVL 3MATHSa.indb 39LVL 3MATHSa.indb 39 12/14/2007 2:26:58 PM12/14/2007 2:26:58 PM

40
Mo
dule 2
SB page 161
Topic 2: LO 2.1.a Activity 2 Application
1. dependant variable – total number of co-operatives (x)independant variable – total amount of funding (y)
2. x 15 19 27 33 23
y 750 000 950 000 1350 000 1650 000 1150 000
3.1 y = 50 000x= 50 000(85)= 4 250 000R4 250 000 will be needed to fund 85 co-operatives
3.2 y = 50 000x= 50 000(101)= 5 050 000
3.3 y = 50 000x= 50 000 (1 020)= 51 000 000
3.4 y = 50 000x= 50 000(8 500)= 425 000 000
4.1 50 000x = 3 400 000x = 3 400 00050 000x = 6868 co-operatives can be funded from R3 400 000
4.2 50 000x = 4 750 000x = 4 750 00050 000= 95
4.3 50 000x = 12 000 000x = 12 000 00050 000= 240
4.4 50 000x = 123 000 000x = 123 000 00050 000= 2 460
5 – 7 Student’s own responses
LVL 3MATHSa.indb 40LVL 3MATHSa.indb 40 12/14/2007 2:26:58 PM12/14/2007 2:26:58 PM

41
Mo
dule
2
SB page 60
Topic 2: LO 2.2.bActivity 3 Linear equations
1. 12
2. 25
3. 9
4. 84
5. 8
6. 3
7. 11
8. −13
9. −1
10. −139
11. 6
12. 7, 75
13. 2, 4
14. −42
SB page 167
Topic 2: LO 2.2.bActivity 4 Quadratic equations
x = −2 or x = 3
SB page 167
Topic 2: LO 2.2.bActivity 5 Application
1. x 2 + 5x − 6 = 0(x + 6)(x − 1) = 0x + 6 = 0 or x − 1 = 0x = 6 or x = 1
2. 2 x 2 − x − 3 = 0(2x −3)(x + 1) = 02x − 3 = 0 or x + 1 = 0x = 3 or x = −12
3. x 2 − 4x − 21 = 0(x − 7)(x + 3) = 0x − 7 = 0 or x + 3 = 0x = 7 or x = −3
LVL 3MATHSa.indb 41LVL 3MATHSa.indb 41 12/14/2007 2:26:58 PM12/14/2007 2:26:58 PM

42
Mo
dule 2
4. 3x 2 − 4x + 1 = 0(3x − 1)(x −1) = 03x − 1 = 0 or x − 1 = 0x = 1 or x = 13
5. x 2 = 4 − 3x x 2 + 3x − 4 = 0(x + 4)(x − 1) = 0x + 4 = 0 or x − 1 = 0x = −4 or x = 1
6. p 2 + 9p + 20 = 0(p + 5)(p + 4) = 0P + 5 = 0 or p + 4 = 0P = −5 or p = −4
7. 6t 2 + 4 = 10t 6t 2 − 10t + 4 = 0 3t 2 − 5t + 2 = 0(3t − 2)(t − 1) = 03t − 2 = 0 or t − 1 = 0T = 2 or t = 13
8. 5 − 4x − x 2 = 0(5 + x)(1 − x) = 05 + x = 0 or 1 − x = 0x = −5 or x = 1
9. 16 + 6x − x 2 = 0(8 − x)(2 + x) = 08 − x = 0 or 2 + x = 0x = 8 or x = −2
10. 4k 2 − k − 3 = 0(4k + 3)(k − 1) = 04k + 3 = 0 or k − 1 = 0k = −3 or k = 1
SB page 168
Topic 2: LO 2.2.b Activity 6 Difference of two squares
8.1. x 2 − 100 = 0(x − 10)(x + 10) = 0x − 10 = 0 or x + 10 = 0x = 10 or x = −10Critical point: x = −b 2a x = −0 2(1) = 0
LVL 3MATHSa.indb 42LVL 3MATHSa.indb 42 12/14/2007 2:26:58 PM12/14/2007 2:26:58 PM

43
Mo
dule
2
8.2. p 2 − 64 = 0(p − 8)(p + 8) = 0p − 8 = 0 or p + 8 = 0p = 8 or p = −8Critical point: p = 0
8.3. t 2 − 36 = 0(t + 6)(t − 6) = 0t + 6 = 0 or t − 6 = 0t = −6 or t = 6Critical point: t = 0
8.4. k 2 − 49 = 0(k + 7)(k − 7) = 0k + 7 = 0 or k − 7 = 0k = −7 or k = 7Critical point: k = 0
1. Zeros Critical point
x = −4 or x = 4 x = 0
Zeros Critical points
8.1. x = −10 or x = 10 x = 0
8.2. x = −8 or x = 8 x = 0
8.3. x = −6 or x = 6 x = 0
8.4. x = −7 or x = 7 x =0
9.1. critical point: x = −1
9.2. minimum value y = −4
9.3. zeros x = −3 or x = 1
9.4. Interval of decrease: [−5; −1]Interval of increase: [−1; 4]
10.1. critical points: x = −5 and x = 4maximum value: y = 5minimum value: y = −6
10.2. zeros: x = −7 or x = −1 or x = 11
10.3. intervals of increase: [−9; −5] and [4; 13]Intervals of decrease: [−5; 4]
LVL 3MATHSa.indb 43LVL 3MATHSa.indb 43 12/14/2007 2:26:59 PM12/14/2007 2:26:59 PM

44
Mo
dule 2
10.4.
(a)
(b)
(f)
LVL 3MATHSa.indb 44LVL 3MATHSa.indb 44 12/14/2007 2:26:59 PM12/14/2007 2:26:59 PM

45
Mo
dule
2
(g)
(k)
Using the formulae supplied to determine the dependent or independent Using the formulae supplied to determine the dependent or independent variable from given formula if one of them is givenvariable from given formula if one of them is given
LVL 3MATHSa.indb 45LVL 3MATHSa.indb 45 12/14/2007 2:26:59 PM12/14/2007 2:26:59 PM

46
Mo
dule 2
ExponentsSB page 170
Topic 2: LO 2.2.a Activity 8 Application
1 – 3 Student’s responses
5. a 0 × a 1 = a 0 + 1 = a 1 = a but 1 × a = aIt follows that a 0 = 1
6. 1 × a m = a m = a m–m = a 0 = 1 but a –m × a m = a –m+m = a 0 = 1 a m a m ∴ a –m = 1 a m
7.1 5 2 × 5 3 = 5 2+3 = 5 5 = 3125
7.2 3 4 × 3 2 _____ 3 5
= 3 4+2 ___ 3 5
= 3 6–5 = 3 1 = 3
7.3 2 3 × 2 5 × 2 3 __ 4 × 2 4 = 2 3+5+3 ____ 2 2+4
= 2 11 ___ 2 6
= 2 11–6 = 2 5 = 32
7.4 ( 2 4 ) 3 × ( 3 5 ) 4 × 8
__________ ( 3 2 ) 4 × ( 2 6 ) 2 × 2 7
= 2 12 × 3 20 × 2 3 _________ 3 8 × 2 12 × 3 3
= 2 12+3–12 × 3 20–8–3 = 23 × 39 = 8 × 1 968 = 157 464,00
7.5 (6) 3 × (12) 2
_______ 3 7 × 2 8
= 6 3 × 12 2 ______ 3 7 × 2 8
= (3 × 2) 3 × (3 × 4) 2
____________ 3 7 × 2 8
= 3 3 × 2 3 × 3 2 × 2 4 ___________ 3 7 × 2 8
= 3 5 × 2 7 _____ 3 7 × 2 8
= 3 5–7 × 2 7–8
= 3–2 × 2–1 = 1 _____ 32 × 21 = 1 __ 18
= 3 –2 × 2 –1 = 1 __ 3 2
× 1 _ 2 = 1 ____ 3 2 . 2
= 1 __ 18
7.6 125 × 27 ______ 3 4 × 5 4
= 5 3 × 3 3 _____ 3 4 × 5 4
= 5 3–4 × 3 3–4 = 5 –1 × 3 –1 = 1 ___ 5 . 3 = 1 __ 15
7.7 2 5 × 2 × ( 3 4 ) 2 × ( 7 2 ) 3
______________ ( 2 3 ) 2 × 3 3 × 3 5 × 7 5 × 7
= 2 6–6 × 3 8–8 × 7 6–6 = 2 0 × 3 0 × 7 0 = 1
8. Years of investment is dependent variable amount at the end of investment period is the independent variable.
SB page 172
Topic 2: LO 2.2.a Activity 9 Square roots
1. Student’s responses
2. L 2 = A120= 60 × 50 _____ 120 = 25L = √25= 5 m
3. 2 cubes
LVL 3MATHSa.indb 46LVL 3MATHSa.indb 46 12/14/2007 2:27:00 PM12/14/2007 2:27:00 PM

47
Mo
dule
2
SB page 174
SO 1, AS 1.1, LO 1.1a
Activity 10 Constant and linear relationships
2. Independent variable: Months(x)
Dependent variable: Number of students(y)
3.
6.1. Independent variable: Number of tourists
Dependent variable: Number of job opportunities created
6.2. y = 8x
6.3.
LVL 3MATHSa.indb 47LVL 3MATHSa.indb 47 12/14/2007 2:27:01 PM12/14/2007 2:27:01 PM
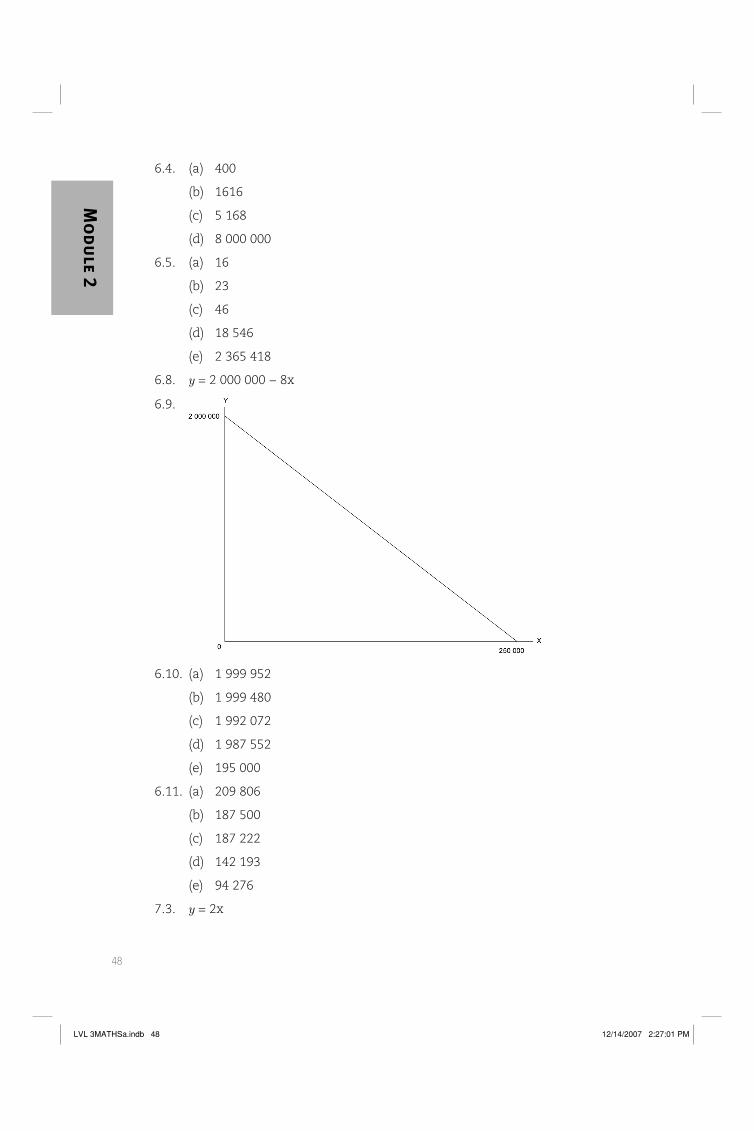
48
Mo
dule 2
6.4. (a) 400
(b) 1616
(c) 5 168
(d) 8 000 000
6.5. (a) 16
(b) 23
(c) 46
(d) 18 546
(e) 2 365 418
6.8. y = 2 000 000 − 8x
6.9.
6.10. (a) 1 999 952
(b) 1 999 480
(c) 1 992 072
(d) 1 987 552
(e) 195 000
6.11. (a) 209 806
(b) 187 500
(c) 187 222
(d) 142 193
(e) 94 276
7.3. y = 2x
LVL 3MATHSa.indb 48LVL 3MATHSa.indb 48 12/14/2007 2:27:01 PM12/14/2007 2:27:01 PM

49
Mo
dule
2
7.4. (a) 1 120
(b) 17 490
(c) 2 330
(d) 4 642
(e) 9 552
7.5. (a) 4 446
(b) 60 000
(c) 2 284
(d) 499
(e) 225 252
SB page 178
Topic 2: LO 2.2.bActivity 11 Inverse proportional relationships
1.1. 5
1.3. decreases
1.4. y = 36 __ x
1.5. (a) 18
(b) 12
(c) 6
(d) 4
(e) 2
SB page 179
Topic 2: LO 2.2.bActivity 12 Unit assessment
1.1. (a) 1300
(b) y = 50x
(d) y = 1300 − 50x
1.2. (a) Inverse proportion. Reason: Number of marbles per column decreases with an increase in the number of marbles per row. Moreover, number of marbles per row multiplied by number of marbles per column of the same column on the table gives the total number of marbles.
1. 12 2. 5 m 3. 20
LVL 3MATHSa.indb 49LVL 3MATHSa.indb 49 12/14/2007 2:27:02 PM12/14/2007 2:27:02 PM

50
Mo
dule 2
4. 108 5. 4 m × 4 m × 4 m 6. 3 m × 3 m × 3 m
Class test 2The information in the table below represents the motion of a ball that was projected vertically upwards and held at its point of projection on its way down.
t(s) 0 1 2 3 4 5 6
s(m) 0 9,8 39,2 88,2 39,2 9,8 0
1.1. Identify the dependent and independent variables in this given relationship. (1)
1.2. What maximum distance was covered by the ball? (1)
1.3. What is the axis of symmetry of the ball? (1)
1.4. Hence give the coordinates of the turning point of the ball. (1)
1.5. What is the interval of increase for this relationship? (1)
1.6. What is the interval of decrease for this relationship? (1)
1.7. The distance (in metres) covered by the car during the time (in seconds) is defined by the following relationshipf(t) = t 2 − 10t + 16
1.8. 1) Fill in the table below using the given formula defining the relationship.
t(s) 0 1 2 3 4 5 6 7 8
f(t)(m)(2)
1.9. 2) What distance had already been covered by this car when motion was first observed? (1)
1.10. 3) Calculate:
1.11. 3) 1) the zero points of this relationship. (2)
1.12. 3) 2) the critical point of this relationship. (1)
1.13. 3) 3) the turning point of the graph. (2)
1.14. 4) Sketch the graph of this motion from the information you have calculated in 1.2.3.1 to 1.2.3.3 and the information from the table. (4)
1.15. 5) During which time interval was the distance covered by the car increasing? (1)
1.16. 6) During which time interval was the distance covered by the car decreasing? (1)
TOTAL [20]
2. At an assembly students of a certain school stand in rows and columns.
LVL 3MATHSa.indb 50LVL 3MATHSa.indb 50 12/14/2007 2:27:02 PM12/14/2007 2:27:02 PM

51
Mo
dule
2
Thirty one (32) rows and twenty nine (29) columns were identified.
2.1. How many students were present at the assembly? (1)
2.2. Give five different combinations of rows and columns that can be formed from this number of students. (5)
2.3. Is this a direct or inverse proportion relationship? Support your answer. (1)
2.4. Represent the number of rows with x and the number of columns with y and give the formula for this relationship in terms of x and y. (1)
2.5. Sketch the graph of this relationship with x and y extended to the set of real numbers. (4)
TOTAL [12]
3. David has a close corporation that specializes in roofing ceilings. He obtained a job where he was supposed to roof a hall of dimensions 20m × 60m with ceiling boards. Each ceiling board had dimensions 0,5m × 0,5m. His lack of mathematical literacy skills made him to give a quotation of 4000 boards as the number of boards that would be necessary to finish the job.
3.1. 1) How many ceiling boards were actually necessary to finish this job? Show all your working. (3)
3.2. 2) Calculate the dimensions of each board if 75 square ceiling boards were necessary to do all this job. (3)
3.3 144 cubes must be cut from a cube of dimensions 48cm × 36cm × 18cm. Calculate the dimensions of each cube. (3)
3.4 A car is moving at a constant speed of 18 m/s on a level road.
3.5. 1) Use the information given in 2.5 to fill in the following table:
Time(s) 0 1 2 3 4 5 6 7 8 9 10
Speed(m/s)
(2)3.6. Use the table in 3.4.1 to sketch the graph of velocity-time for this object.
(2)
TOTAL [13]
Test solutions1.1. Dependent variable: distance
Independent variable: time
1.2. 88,2 m
1.3. t = 3 seconds
LVL 3MATHSa.indb 51LVL 3MATHSa.indb 51 12/14/2007 2:27:02 PM12/14/2007 2:27:02 PM

52
Mo
dule 2
1.4. T.P.(3;88,2)
1.5. 0 to 3 seconds
1.6. 3 to 6 seconds
1.7 The distance (in metres) covered by the car during the time (in seconds) is defined by the following relationshipf(t) = t 2 − 10t + 16
1.8. Fill in the table below using the given formula defining the relationship.
t(s) 0 1 2 3 4 5 6 7 8
f(t)(m) 16 7 0 –5 –8 –9 –8 –5 0
1.9. 16 m
1.10. Calculate: t 2 − 10t + 16 = 0(t − 2)(t − 8) = 0t − 2 = 0 or t − 8 = 0t = 2 t = 8
1.11. t = −b = −(−10) = 52a 2(1)
1.12. f(t) = t 2 − 10t + 16f(5) = (5) 2 − 10(5) + 16= −9
1.13 T.P.(5;−9)
1.14.
1.15. From 0 to 5 seconds
1.16. From 5 seconds onwards
2. At an assembly students of a certain school stand in rows and columns.Thirty one (32) rows and twenty nine (29) columns were identified.
2.1. 928
LVL 3MATHSa.indb 52LVL 3MATHSa.indb 52 12/14/2007 2:27:03 PM12/14/2007 2:27:03 PM

53
Mo
dule
2
2.2. Rows Columns
16 58
8 116
4 232
2 464
1 928
2.4. y = 928 ___ x
2.5.
3. David has a close corporation that specializes in roofing ceilings. He obtained a job where he was supposed to roof a hall of dimensions 20m × 60m with ceiling boards. Each ceiling board had dimensions 0,5m × 0,5m. His lack of mathematical literacy skills made him to give a quotation of 4000 boards as the number of boards that would be necessary to finish the job.
3.1. Number of boards = Atotal ____ Atile
= 20 × 60 ___ 0,5 × 0,5
= 1200 ____ 0,25
= 4 800
3.2. l 2 = Atotal ____ 75
= 1200 ____ 75
= 16
= R16
= 4 m
Dimensions of each tile are: 4 m × 4 m
3.3 l 3 = Vtotal ___ 144
= 48 × 36 × 18 ___ 144
= 31104 _____ 144
LVL 3MATHSa.indb 53LVL 3MATHSa.indb 53 12/14/2007 2:27:03 PM12/14/2007 2:27:03 PM

54
Mo
dule 2
= 216
l = 3 √
____ 216
= 6 mDimensions of each cube are: 6 m × 6 m × 6 m
3.4. Use the information given in 2.5 to fill in the following table:
Time(s) 0 1 2 3 4 5 6 7 8 9 10
Speed(m/s) 18 18 18 18 18 18 18 18 18 18 18
3.5.
LVL 3MATHSa.indb 54LVL 3MATHSa.indb 54 12/14/2007 2:27:03 PM12/14/2007 2:27:03 PM

55
Mo
dule
2
Unit 7
Solving workplace-based problems and using representations
LB page 186
Topic 4: LO 3.1.a LO 3.1.b; LO 3.2.b
Activity 1 Using maps
2.1. (a) The length according to the plan is 6cm. The scale along the length of the floor is 6 cm: 30 m ⇒ 6 : 3 000 ⇒ 1 : 500. In other words, 1cm on the plan represents 5m on the actual floor. Therefore 5cm on the plan will represent 25m on the floor, so that the actual area of the floor will be 30 × 25 m 2 = 750 m 2
(b)
The area of the farm according to the plan = 56 c m 2 This means that 56 c m 2 = 2016 m 2 ⇒ 1 c m 2 = 36 m 2 on the floor. In that case R1 c m 2 = R36 m 2 , or 1 cm = 6 mon the floor. This is equivalent to a scale of 1: 600, which will apply to the sides of the farm.
3.1 30 c m 2 =30 × 100 m 2 = 3000 m 2
3.2 student’s responses
3.3. (a) 1:200. According the plan, 1cm on the paper represents 2m on the ground. So the length of the room will measure 60m, and is breadth 40m, making its area 2400 m 2 . This means that the number of tiles will be 2400 ____ 0,01 = 240000
(b) 1:500. According the plan, 1cm on the paper represents 5m on the ground. So the length of the room will measure 150m, and is breadth 100m, making its area 15000 m 2 . This means that the number of tiles will be 15000 _____ 0,01 = 1500000.
LVL 3MATHSa.indb 55LVL 3MATHSa.indb 55 12/14/2007 2:27:04 PM12/14/2007 2:27:04 PM
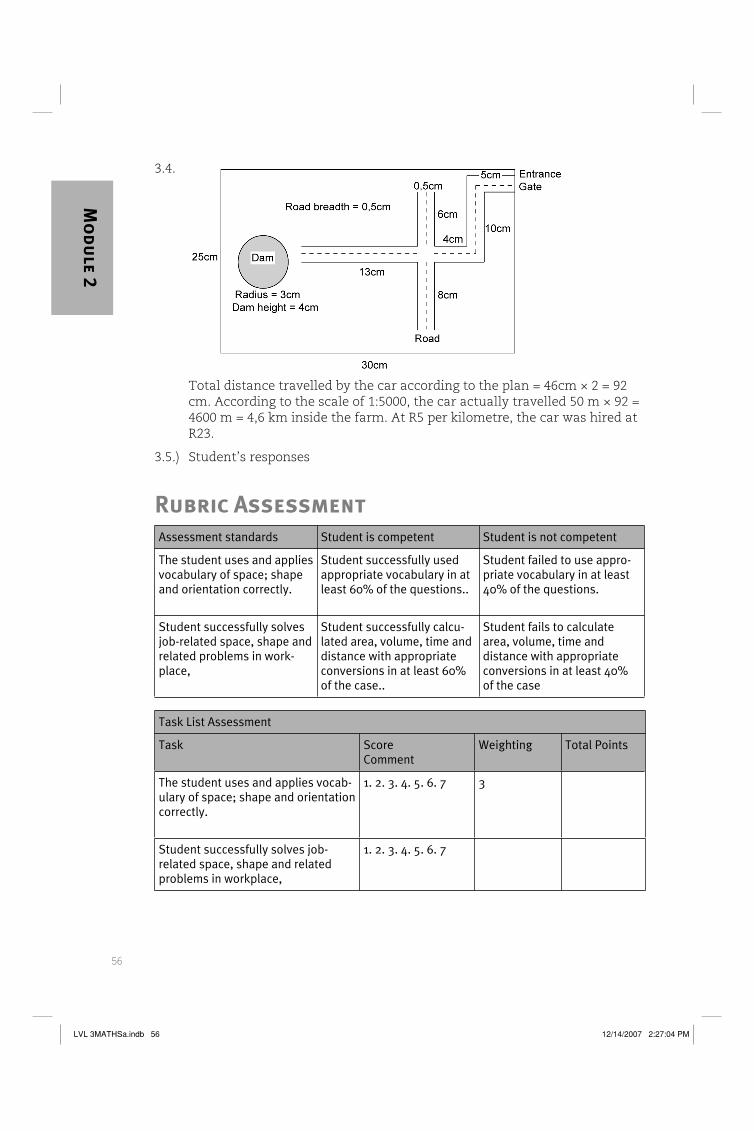
56
Mo
dule 2
3.4.
Total distance travelled by the car according to the plan = 46cm × 2 = 92 cm. According to the scale of 1:5000, the car actually travelled 50 m × 92 = 4600 m = 4,6 km inside the farm. At R5 per kilometre, the car was hired at R23.
3.5.) Student’s responses
Rubric AssessmentAssessment standards Student is competent Student is not competent
The student uses and applies vocabulary of space; shape and orientation correctly.
Student successfully used appropriate vocabulary in at least 60% of the questions..
Student failed to use appro-priate vocabulary in at least 40% of the questions.
Student successfully solves job-related space, shape and related problems in work-place,
Student successfully calcu-lated area, volume, time and distance with appropriate conversions in at least 60% of the case..
Student fails to calculate area, volume, time and distance with appropriate conversions in at least 40% of the case
Task List Assessment
Task ScoreComment
Weighting Total Points
The student uses and applies vocab-ulary of space; shape and orientation correctly.
1. 2. 3. 4. 5. 6. 7 3
Student successfully solves job-related space, shape and related problems in workplace,
1. 2. 3. 4. 5. 6. 7
LVL 3MATHSa.indb 56LVL 3MATHSa.indb 56 12/14/2007 2:27:04 PM12/14/2007 2:27:04 PM

57
Mo
dule
2
Assessment on group work:Assessment on group work: Evaluating Team WorkEvaluating Team Work
Criteria:Criteria: Use the following symbols: Use the following symbols:
S: Strong M: Moderate N: Needs attentionS: Strong M: Moderate N: Needs attention
Criteria Score
1 Appropriate working methods Individual Consensus
2 Trust and mutual understanding S M N S M N
3 Use of team members’ strengths S M N S M N
4 Open and effective communication S M N S M N
5 Sharing of ideas and resources S M N S M N
6 Cohesiveness and comradeship S M N S M N
7 Constructive conflict management
8 Climate of mutual support S M N S M N
9 Openness to new ideas and change S M N S M N
10 Decision making S M N S M N
11 Motivation S M N S M N
12 Success acknowledged and celebrated S M N S M N
13 Expertise / resources improved S M N S M N
14 Roles and responsibilities clear to all S M N S M N
15 Overall team effectiveness S M N S M N
LVL 3MATHSa.indb 57LVL 3MATHSa.indb 57 12/14/2007 2:27:05 PM12/14/2007 2:27:05 PM

58
Mo
dule 2
Unit 8
Collecting and representation information
In this unit we focus on communicating information through numbers, tables and graphs in terms of data collection, organizing, summarizing and representing it in order to answer questions.
SB page 193
Topic 5: LO 1.1.a Activity 1 Specifying and listing a hypothesis
Teaching method: Problem solvingTeaching method: Problem solving
1.1 Hypothesis is a statement or conjecture that is supported by evidences to make it true or false
(a) All Greyhound buses are not roadworthy in KZN
(b) Pregnant women between 21 and 30 years of age do not know the HIV status of their partners
(c) Drop out rate of school girls under 16 years of age is related to pregnancies in our college
1.2 (a) To focus on students who only study maths in the college
(b) To collect and list all their maths marksList all their marks according to gender this is male and female
(c) No collecting maths test marks for one test in your class does not justify Dorothy’s hypothesis because it may happen that the test was too simple or difficult
(d) One test is not sufficient to make Dorothy’s hypothesis to be true or false
1.3 (a) South African government department of minerals and energy
(b) Department of education
(c) Name of the college that have enrolled black females engineersSearch information from the Internet or check from the college enrollment for almost six trisemestersIndicate whether the female engineers has increased or decreased by 3%
(d) Motorists
(e) Students
LVL 3MATHSa.indb 58LVL 3MATHSa.indb 58 12/14/2007 2:27:05 PM12/14/2007 2:27:05 PM

59
Mo
dule
2
SB page 194
Topic 5: LO 1.1.b; LO 1.2.c
Activity 2 Development
Teaching method: Problem-centeredTeaching method: Problem-centered
Table 1
numbers names month day year Same month
1
2
3
4
5
6
7
8
9
10
Table 2
names transport home to schoolDistance covered time taken
1
2
3
4
5
6
7
8
9
10
1.1 Read the answer from the table
1.3 Draw a bar graph using information from table 1
1.4 8 Use the data collected information from the table 2
LVL 3MATHSa.indb 59LVL 3MATHSa.indb 59 12/14/2007 2:27:05 PM12/14/2007 2:27:05 PM

60
Mo
dule 2
SB page 195
Topic 5: LO 1.1.a; LO 1.1.c; LO 1.2.c
Activity 3 Data representation
1.1 Use the data collected information in Activity 2
1.2 The size of a sample is representative for the whole school, if the size for the whole school is a simple model of random sample distribution
1.3 The size of a sample can formulate the conclusion for the whole school if each of the possible sample is equally likely to occur when we choose a random sampling
1.4 If a size of big sample has a specific interval which is close to the mean for the whole school
1.5 Majority of the students who came almost late to college lives 20km away from the college. On behalf of the college I would like to make a proposal to Department of education to subsidize 150 students with 2 buses
SB page 202
Topic 5: LO 1.2.b Activity 10 Summarising data
Table 3
names ABSA Nedbank F.N.B Standard
interest
term 20 20 20 20
NB. The reserve bank/ government controls prime rate in all the banks
1. Use the table 3 to list all the banks you visited
2. According to the reserve bank interests of all the banks are similarCurrently prime rate is13%If Mr Molusi makes a home loan of R200 000 for 20years then what will be final amount of prime rate: SI =[ 13 × R200 000 ×20]÷100 = R 520 000 ∴ Final amount = 520 000 + 200 000 = R 720 000
3. [ R850 000 × 13 × 20] ÷100 = R2 210 000∴ R 850 000 + R2 210 000 = R3 060 000
4. Mean : A = R 3 060 000 ÷ 20= R15300
5. Is similar to average of mortgage bond
6. R2 210 000 × 13% = R287 300
LVL 3MATHSa.indb 60LVL 3MATHSa.indb 60 12/14/2007 2:27:05 PM12/14/2007 2:27:05 PM

61
Mo
dule
2
7. 30% of R850 000 = R255000R850 000 – R255 000 = R595 00∴ R595000 × 13% = R77350∴ R77350 × 13% = R1005.5
8 R1005.5 + R500 = R1505.5
SB page 203
Topic 5: LO 1.1.c; LO 1.2.a; LO 1.2.b
Activity 11 Assignment
Teaching method: CooperativeTeaching method: Cooperative
The auditor must check how much coveragehow much coverage does the following items (adverts, fashion and sports) get from two magazines. This enables the auditor to comparecompare two magazines (A and B) in terms of marking their scores on each item. Each item will be gradedgraded according to their score that is likely equally to likely equally to competecompete with other magazines. This allows auditor to advice his editor on what needs to be done to target market for the magazine.
SB page 203
SO1, AS1.2, LO1.a & bActivity 12 Case study
1. 52 580 and 32 580 for teachers
2. 2000 for office
3. Quarter 4
4. Survey results
SB page 204
SO1, AS1.2, LO1.a & bActivity 13 Investigation
Teaching method: DialecticTeaching method: Dialectic
If Molefi and his three friends wish to start a business of Mothalehlo manufactures, they then apply for grant from IDC. I then advise and tell them to address the following items:
LVL 3MATHSa.indb 61LVL 3MATHSa.indb 61 12/14/2007 2:27:06 PM12/14/2007 2:27:06 PM

62
Mo
dule 2
*To explore the establishment of Mathalehlo manufactures
*To provide an assessment of state of eco-labelling in general
• To identify the opportunities, obstacles and actions steps for the Development of Mothalehlo manufactures
• To examine practical aspects relating toe the implementation of a buy South African
• To provide information on both negative and positive impacts of proposed plan
• To implement strategies of proudly South AfricaSource:www.idc.co.za
SB page 204
Topic 5: LO 1.1.a; LO 1.3.a
Activity 14 Research project
Teaching method: Socio-culturalTeaching method: Socio-cultural
Table 4
countries per capita area population eco. Dev currency parties
S.A $ 534,6 b 1millionsq 44 million Rand
Lesotho $ 6 064 b 30 350sq 2 million Maluti
Swaziland $ 6 billion 17 200sq 1 million Lilangeni
Botswana $16 billion 600 370sq 1 million Pula
Namibia $16 billion 825 418sq 2 million Namibian dollar
1
Zimbabwe $24 billion 390 580 sq 12 million Zim dollar 2
Table 5
countries Year of independ. agric export mining HIV
S.A 1994 wool platinum platinum high
Lesotho 1966 corn wool high
Swaziland 1968 sugar cane sugar coal low
Botswana 1966 diamond diamond high
Namibia 1960 sorghum diamond diamond low
Zimbabwe 1965 cotton cotton coal low
Source: www. ………. History,Geography,Government and Culture
a) – d) Use the table 4 and 5 to answer the questions
e) Student’s research
LVL 3MATHSa.indb 62LVL 3MATHSa.indb 62 12/14/2007 2:27:06 PM12/14/2007 2:27:06 PM

63
Mo
dule
2
Test 11. A NQF level 2 students gained the following marks respectively out of a total
of 25.
students 1 2 3 4 5 6 7 8 9
marks 11 12 11 17 18 19 18 11 21
(a) Identify mode and median if exist. Explain (4) (b) Calculate the mean (2) (c) Draw a line graph to represent the above data (6) (d) Calculate the percentage of the highest students’ (3) (e) Calculate the range to represent the above data (2)
2. You are asked to survey the 500 people in a village to find out what their leisure activities are. The village is within reach of industrial and business centers and also contains a number of retired people.
(a) How would you obtain a list upon which to base a sample for this purpose (2)
(b) Would your sampling unit be an individual person or a whole household (1)
(c) What form of sampling would you and why (3) (d) What difficulties are there in defining leisure (2)
Test 1AnswersAnswers
1. (a) mode:11 which is the most common number in the set median: 11 11 11 12 17 18 18 19 21 17
(b) mean: 138 ÷ 915.333
(c)
(d) [21×100] ÷ 25 = 84%
(e) Range: 21 __ 10 - 11
LVL 3MATHSa.indb 63LVL 3MATHSa.indb 63 12/14/2007 2:27:06 PM12/14/2007 2:27:06 PM

64
Mo
dule 2
2. (a) Develops a questionnaire (b) Individual person to represent a group of village (c) random sampling or interested group to determine a certain percentage (d) It is difficult to find out leisure activities of different categories(retired
and middle age people in a common village
LVL 3MATHSa.indb 64LVL 3MATHSa.indb 64 12/14/2007 2:27:07 PM12/14/2007 2:27:07 PM

65
Mo
dule
3
Module 3Representing solutions of real life problems!
Unit 9
Using different representations of relationships to solve problems involving patterns in real life
It will be necessary for you to go through sketching a bar and a pie graph with your students before giving them the opportunity to answer the activities of this unit.
As an example, let us sketch the following information first on a bar graph and then on a pie graph. You can use this example to teach your students how to sketch a bar graph and a pie graph.
Represent the following information on a bar graph and then on a pie graph.
A motor car dealer has the following cars in his garage:
Tazz Astra Uno Cressida Camry
230 255 215 286 204
1. Bar graph
(a) Identify information The first thing to do here is to identify the information that must used
on the horizontal axis and information to be used on the vertical axis Remember that the independent variable goes to the horizontal axis and
the dependent variable on the vertical axis For this reason, the names of cars will be on the horizontal axis and their
numbers on the vertical axis.
(b) Choosing a suitable scale You will be using a ruler to draw this graph. Rulers are graduated in
millimeters and centimeters. Choose a scale that will enable you to sketch this information on a piece
of paper such that the diagram will be large enough to be read. A scale for the number of cars will be needed here.
LVL 3MATHSa.indb 65LVL 3MATHSa.indb 65 12/14/2007 2:27:07 PM12/14/2007 2:27:07 PM

66
Mo
dule 3
A scale of 1 cm = 40 cars will do here. With this scale:
230 cars = 230 ___ 40 = 5,75 cm which will be rounded off to 5,8 cm
255 cars = 255 ___ 40 = 6,375 cm which will be rounded off to 6,4 cm
215 cars = 215 ___ 40 = 5,375 cm which will be rounded off to 5,4 cm
286 cars = 286 ___ 40 = 7,15 cm which will be rounded off to 7,2 cm
204 cars = 204 ___ 40 = 5,1 cm
(c) Sketch the graph. The number of centimeters on the horizontal axis is only important in that the elements of the independent variable must be
equally spaced. Graph of cars
2. The pie graph
Tazz Astra Uno Cressida Camry
230 255 215 286 204
A pie graph is circular in shape. All these numbers must fit in a 360° diagram.
a) Find the number of degrees that will be occupied by each of the quantities to be represented on the graph. This is what we do in order to find that:
Add all the quantities: 230 + 255 + 215 + 286 + 204 = 1 190
230 cars = 230 ____ 1190 × 360 = 70° 255 cars = 255 ____ 1190 × 360 = 77°
215 cars = 215 ____ 1190 × 360 = 65° 286 cars = 286 ____ 1190 × 360 = 86°
204 cars = 204 ____ 1190 × 360 = 62°
If you add all the answers here you will get 360°.
LVL 3MATHSa.indb 66LVL 3MATHSa.indb 66 12/14/2007 2:27:07 PM12/14/2007 2:27:07 PM

67
Mo
dule
3
(b) The graph Use a protractor to
measure the degrees for each of the quantities and draw the graph. The graph will look like:
SB page 213
Activity 1 Reading values from graphs
Completing a table of values by reading values from the graphCompleting a table of values by reading values from the graph
1. Subject Biology Economics English Mathematics Science Tourism Zulu
% Mark 46 31 62 25 13 73 51
2. Subject Biology Economics English Mathematics Science Tourism Zulu
% Mark 43 31 62 25 13 73 51
3. Subject Biology Economics English Mathematics Science Tourism Zulu
% Mark 43 31 61 22 11 72 52
4. The third graph
5.1. Quorum(x) 0 1 2 3 4 5 6 7 8 9 10
Members(y) 1 2 3 4 5 6 7 8 9 10 11
5.2.
LVL 3MATHSa.indb 67LVL 3MATHSa.indb 67 12/14/2007 2:27:08 PM12/14/2007 2:27:08 PM

68
Mo
dule 3
5.3. Straight line graph or linear graph
6.1 x −6 −5 −4 −3 −2 −1 0 1 2 3 4 5 6
y −3 −2 −1 0 1 2 3 4 5 6 7 8 9
6.2 x −6 −5 −4 −3 −2 −1 0 1 2 3 4 5 6
y 17 15 13 11 9 7 5 3 1 −1 −3 −5 −7
LVL 3MATHSa.indb 68LVL 3MATHSa.indb 68 12/14/2007 2:27:09 PM12/14/2007 2:27:09 PM

69
Mo
dule
3
6.4. x −6 −5 −4 −3 −2 −1 0 1 2 3 4 5 6
y 36 25 15 9 4 1 0 1 4 9 16 25 36
6.4. x −6 −5 −4 −3 −2 −1 0 1 2 3 4 5 6
y −33 −22 −13 −6 −1 2 3 2 −1 −6 −13 −22 −33
LVL 3MATHSa.indb 69LVL 3MATHSa.indb 69 12/14/2007 2:27:10 PM12/14/2007 2:27:10 PM

70
Mo
dule 3
6.5. x −6 −5 −4 −3 −2 −1 0 1 2 3 4 5 6
y – 5 _ 6 −1 – 5 _ 4 – 5 _ 3 – 5 _ 2 −5 ∞ 5 5 _ 2 5 _ 3 5 _ 4 1 5 _ 6
6.6 x −6 −5 −4 −3 −2 −1 0 1 2 3 4 5 6
y 4 _ 3 8 _ 5 2 8 _ 3 4 8 ∞ −8 −4 – 8 _ 3 −2 – 8 __ 58 – 4 _ 3
LVL 3MATHSa.indb 70LVL 3MATHSa.indb 70 12/14/2007 2:27:11 PM12/14/2007 2:27:11 PM

71
Mo
dule
3
6.2. (a) and (b) are straight line graphs
(c) and (d) are parabola graphs
(e) and (f) hyperbola graphs
6.3. (a) and (b) are linear graphs
(c) and (d) are quadratic graphs
(e) and (f) inverse proportion graphs
7.1.
7.2.
LVL 3MATHSa.indb 71LVL 3MATHSa.indb 71 12/14/2007 2:27:12 PM12/14/2007 2:27:12 PM

72
Mo
dule 3
8.1. Tuesday 03 July 2007
8.2.
8.3.
LVL 3MATHSa.indb 72LVL 3MATHSa.indb 72 12/14/2007 2:27:12 PM12/14/2007 2:27:12 PM

73
Mo
dule
3
8.4.
9.1. y = 4 − x 2 9.2. y = 5 + 4x − x 2
9.3. y = 4 − 4x 9.4. y = 4x + 4
9.5. y = – 4 ___ x 9.6. y = 4 _ x
SB page 218
Topic: LO 3.1.a; LO 3.2.b
Activity 2 Enrichment
1.
LVL 3MATHSa.indb 73LVL 3MATHSa.indb 73 12/14/2007 2:27:13 PM12/14/2007 2:27:13 PM

74
Mo
dule 3
2. Representation 1Representation 1
Representation 2Representation 2
LVL 3MATHSa.indb 74LVL 3MATHSa.indb 74 12/14/2007 2:27:14 PM12/14/2007 2:27:14 PM

75
Mo
dule
3
SB page 219
Topic 2: LO 3.1.a LO 3.2.b
Activity 3 Unit assessment
1.1. (a) 785
(b) 917
(c) 648
(d) 801
(e) 723
(f) 857
(g) 1034
1.2 – Variation in grade 12 results– Arrival of new educators and/or leaving of old educators– School fees– School Governing Body can have a direct impact on enrolment The list is endless.
2. 1 Oranges: 5Apples: 3Bananas: 8Peaches: 6Lemons: 7Pears: 6
3.1 Time (s) 0 1 2 3 4 5 6 7 8 9 10 11
Speed in (m/s) 0 2 4 6 8 10 12 14 16 18 20 22
3.3
LVL 3MATHSa.indb 75LVL 3MATHSa.indb 75 12/14/2007 2:27:15 PM12/14/2007 2:27:15 PM

76
Mo
dule 3
4.1 Table
Bar graph
Pie graph
4.2 Table
Family 1 2 3 4 5 6 7 8
Number of children
5 3S 6 8 4 1 3 7
Bar graph
Pie graph
5.1 y = −4x − x 2 5.2 y = x 2 − 4x
5.3 y = x 2 + x − 3 5.4 y = x − 1
5.5 y = 2 _ x 5.6 y = −2 __ x
LVL 3MATHSa.indb 76LVL 3MATHSa.indb 76 12/14/2007 2:27:15 PM12/14/2007 2:27:15 PM

77
Mo
dule
3
Time: 30 minTotal: 25Class test
1. A mother has four children; Don, Clive, Tendani and Snenhlanhla with the following ages 2, 8, 14 and 19 respectively.
1.1. Represent
(a) the ages of these children on a bar graph (4)
(b) their ages on a pie graph (6)
1.2. Given:y = x 2 − 11x − 12 and y = x − 12
Calculate:
(a) the intercepts with the axes of both relations (5)
(b) the coordinates of the turning point where applicable (4)
2. Sketch the graphs of the relations on the same set of axis. (6)
Class test solutionsClass test solutions
1.1. (a)
(b)
LVL 3MATHSa.indb 77LVL 3MATHSa.indb 77 12/14/2007 2:27:16 PM12/14/2007 2:27:16 PM

78
Mo
dule 3
1.2. (a) y - intercepts of both graphs is − 12
(b) x - interceptsParabola: Straight line x 2 − 11x − 12 = 0 x − 12 = 0(x − 12)(x + 1) = 0 x = 12x − 12 = 0 or x + 1 = 0x = 12 or x = − 1
axis of symmetry: x = − b __ 2a
= − (– 11 ___ 2(1)
)
= 11 __ 2
y = x 2 − 11x − 12
= ( 11 __ 2 ) 2 – 11( 11 __ 2 ) – 12
= 121 ___ 4 – 121 ___ 2 – 12
= 121 – 242 – 48 __ 4
= − 169 ___ 4
T.P.( 11 __ 2 ; – 169 ___ 4 )
2.
LVL 3MATHSa.indb 78LVL 3MATHSa.indb 78 12/14/2007 2:27:17 PM12/14/2007 2:27:17 PM

79
Mo
dule
3
Unit 10
Financial knowledge power!
LB page 251
SO 1, AS 1.1, LO 1.1a
Activity 15 Getting information to make an informed decision1. Price; fuel index
2. Fiat Punto JTD (5,2 l/100 km)Citroen C3 1.4 Hdi (5,5 l/100 km)Hyundai Getz 1.5 CRDi (6,45 l/100 km)Renault Clio 1.5 dCi (5,85 l/100 km)VW Polo 1.4 TDi (6,26 l/100 km)
3. They are diesel-powered.
4.1 Yes it should (best-selling cars do so because they are reliable, relatively inexpensive to maintain, they have a good dealership network, and have a good resale value).
4.2 Fiat, Citroen, Hyundai and Renault are not from well-established and trusted manufacturers such as Volkswagen and Toyota, they have a limited dealership network, and vehicle buyers are not so sure of their maintenance costs and resale value.
5.1 Total cost of all spares listed/Price of car × 100%
5.2 (a) 4th out of the 6 cars; cheaper than the average
(b) 5th out of the 6 cars; more expensive than the average
(c) last of the 6 cars; more expensive than the average
(d) last of the 6 cars; more expensive than the average
5.3 Peugeot Nissan Honda Opel VW MB
11,38 7,18 8,72 7,56 7,70 6,51
VW is 4th out of the 6 cars.
5.4 Yes. VW is not the cheapest to maintain, but it is a top-seller, from which we can conclude that the public is very satisfied with the product (it has an excellent reputation)
9. Refer to the graph at question 10.
10. 1.4TDi:
Fixed cost for the four year period (c):
Balance on monthly installments: R338,73 x 48 = R16 259,04
LVL 3MATHSa.indb 79LVL 3MATHSa.indb 79 12/14/2007 2:27:17 PM12/14/2007 2:27:17 PM

80
Mo
dule 3
Service: = R13 800,00
License: R295 per year x 4 years = R 1 180,00
Insurance: R250 per month x 48 months = R12 000,00
Total: c = R43 239,04
Fuel cost per km (m):
6,26 l/100 km = 0,0626 l/km
At R4,50 per litre: Fuel cost per km = R4,50 x 0,0626 = R0,2817 per km
Equation: y = 0,2817x + 43 239,04
11. From the graph: ±120 000 km
Algebraically: 0,427x + 26 142,24 = 0,2817x + 43 239,040,1453x = 17 096,8x = 117 666 km
12. VW Polo 1.4 TDi
13. The higher the resale value, the higher the price he can pay for his next car.
14. Polo1.6petrol: Value after 4 years = 135 420 (1 - = 135 420 (0,9)4 = R88 849,06 Polo1.4TDi: Value after 4 years = 145 690 (1 - = 145 690 (0,88)4 = R87 367,62 Decision time: In the long run (after 120 000 km) the 1.4 TDi becomes
LVL 3MATHSa.indb 80LVL 3MATHSa.indb 80 12/14/2007 2:27:18 PM12/14/2007 2:27:18 PM

81
Mo
dule
3
cheaper than the 1.6 petrol. Since the resale value is about the same, the 1.4 TDi looks like the better choice.
LB page 259
SO 1, AS 1.1, LO 1.1a
Activity 16 Finalising the provisional decision2.1 Polo 1.6: max power 74 kw at 5500 r.p.m.
Polo 1.4: max power 55 kw at 4000 r.p.m.
2.2 Polo 1.6: max torque 140 Nm at 3250 r.p.m.Polo 1.4: max torque 195 Nm at 2200 r.p.m.Note: The answers to 2.1 and 2.2 also appear in the table in Activity 2.
2.3 (a) Engine speed (revolutions per minute – r.p.m.) in each gear at any speed.
(b) 1.6: ±3 800 r.p.m.1.4: ±2800 r.p.m.
2.4 (a) Acceleration
(b) 1.6: 11,3 sec1.4: 14,5 secNote: These answers also appear on the table in Activity 2
2.5 1.6 has more power, but at a higher engine speed1.4 has less power, but at a lower engine speedTherefore, the 1.6 feels more lively than the 1.4, but has to be driven using a fairly high engine speed.1.4 has more torque, at a lower engine speed, than the 1.6Therefore, the 1.4 is a more relaxing car to drive.1.4 has a lower engine speed than the 1.6 at any road speed.Therefore the 1.4 has less engine noise at any speed than the 1.6, and feels more relaxing to drive.1.6 accelerates faster than the 1.4.Therefore the 1.6 feels more lively than the 1.4.
LVL 3MATHSa.indb 81LVL 3MATHSa.indb 81 12/14/2007 2:27:18 PM12/14/2007 2:27:18 PM

82
Mo
dule 3
Unit 11
Information presented and misrepresented
LB page 264
Topic 5: LO 2.1.a; LO 2.1.b
Activity 1 Information on graphs
In this unit we focus on representing information through numbers, tables and graphs in terms of critically analyzing and interpreting expression of likelihood in order to answer questions.
1.1 (a) ± 54
(b) 2001 is the highest police officers trainees
(c) The police officers decreased by ± 3
(d) The police officers increased by ±2
(e)
1.2 (a) The rate of both boys and girls have increased each year except 1999 and 2001
(b) Internet was not utilized effectively maybe girls enrolment has dropped
(c) ± 325
(d) [320 ×100]÷325 = 98. 461 %
2. Teaching method: Problem-centered2. Teaching method: Problem-centered (a) What kind of snacks and how many students eat snacks of their choice (b) Vegetables (c) Popcorn (d) Fruit (e) Popcorn
LVL 3MATHSa.indb 82LVL 3MATHSa.indb 82 12/14/2007 2:27:19 PM12/14/2007 2:27:19 PM

83
Mo
dule
3
3. Measures of central tendency and dispersionTeaching method: Problem solvingTeaching method: Problem solving
3.1 [23+20+24+26+29+30+34+35+39+40+25+24+26+28+30+34+39+45+54+58]÷20 = 663÷20= 33.15
3.2 mode: 24, 26, 30, 34median:[ 40 + 25]÷2 = 65÷2 = 32.5even set of numbers
3.3 [13 ×100] ÷20 = 60%
4. Teaching method: Problem solvingTeaching method: Problem solving
4.1 provinces: 440267 ÷ 9 = 48918.555
4.2 endorsement: 227197 ÷ 9 = 25244.111
4.3 passed candidates: 82010 ÷ 9 = 9112.222
4.4 13 021 or 59 843 or 68 903
5.1 120 ÷ 10 = 12
5.2 108 ÷ 10 = 10.8
5.3 10
5.4 12
5.5 [12+11]÷2 = 23 ÷ 2= 11.5
5.6 [11+12]÷ 2 = 23 ÷ 2= 11.5
5.7 11.5 +11.5 = 23
5.8 [10 ×100 ] ÷ 120 = 8.333% and [10 ×100] ÷ 108 = 9.259%
6.1 no mode
6.2 no mode
6.3 773 ÷ 5 = 154.6
6.4 874 ÷ 5 = 174.8
6.5 125 137 145 161 205
7.1 average: 3745 ÷ 8 = 468.125
7.2 median: [465 + 485] ÷ 2 = 475
LVL 3MATHSa.indb 83LVL 3MATHSa.indb 83 12/14/2007 2:27:19 PM12/14/2007 2:27:19 PM
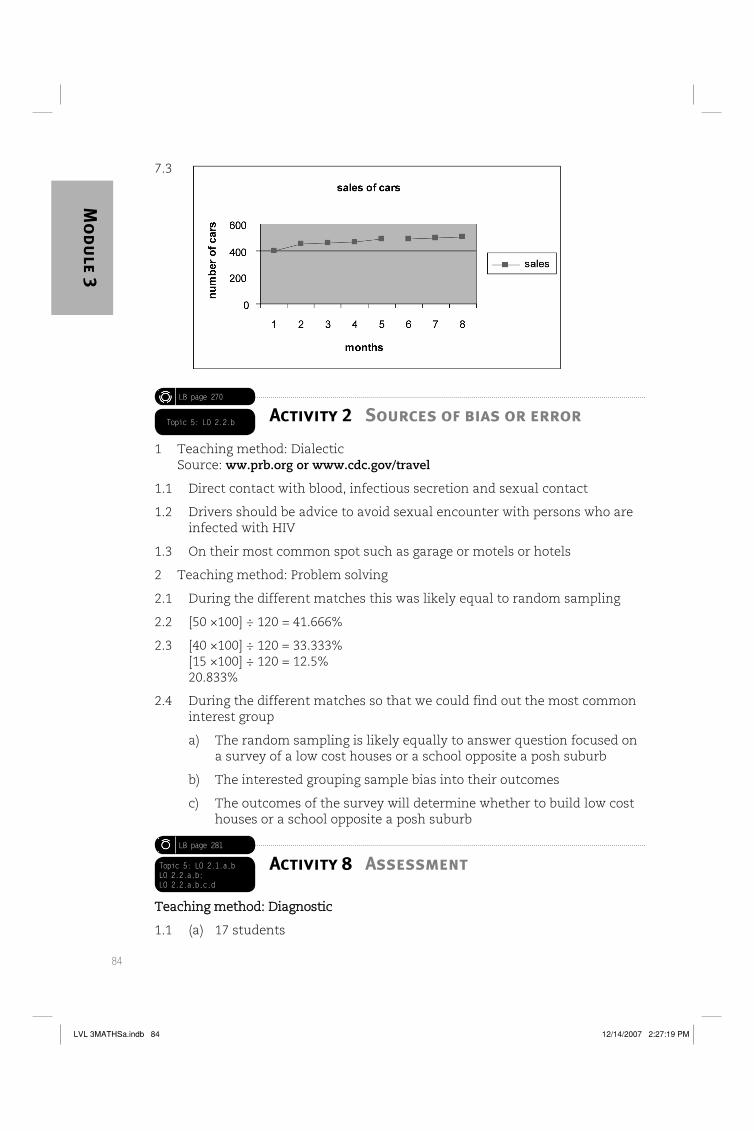
84
Mo
dule 3
7.3
LB page 270
Topic 5: LO 2.2.b Activity 2 Sources of bias or error
1 Teaching method: DialecticSource: ww.prb.org or www.cdc.gov/travel
1.1 Direct contact with blood, infectious secretion and sexual contact
1.2 Drivers should be advice to avoid sexual encounter with persons who are infected with HIV
1.3 On their most common spot such as garage or motels or hotels
2 Teaching method: Problem solving
2.1 During the different matches this was likely equal to random sampling
2.2 [50 ×100] ÷ 120 = 41.666%
2.3 [40 ×100] ÷ 120 = 33.333%[15 ×100] ÷ 120 = 12.5% 20.833%
2.4 During the different matches so that we could find out the most common interest group
a) The random sampling is likely equally to answer question focused on a survey of a low cost houses or a school opposite a posh suburb
b) The interested grouping sample bias into their outcomes
c) The outcomes of the survey will determine whether to build low cost houses or a school opposite a posh suburb
LB page 281
Topic 5: LO 2.1.a,bLO 2.2.a,b; LO 2.2.a,b,c,d
Activity 8 Assessment
Teaching method: DiagnosticTeaching method: Diagnostic
1.1 (a) 17 students
LVL 3MATHSa.indb 84LVL 3MATHSa.indb 84 12/14/2007 2:27:19 PM12/14/2007 2:27:19 PM

85
Mo
dule
3
(b) (i.) 1
(ii) 7 – 1 = 6
(iii) 7 ÷ 9 = 1.888
1.2 (a) 77 ÷ 10 = 7.7 boys62 ÷ 12 = 5.166 girlsboys are wearing big sizes than girls
(b) 5 = R10 5 = R1077 = x 62 = y5: R10 : : 77: x 5: R10 : : 62: y770 = 5x 620 = 5yR154 = x R124= y
(c)
1.3 (a) mean score of all these marks: 658 ÷ 14 = 47 average class
(b) range: 99 – 10 = 89 intelligent students
1.4 (a) mean: 33.85median: 35range: 37mode : 28
(b) The minimum value of this set of data is 21 and the maximum value is 58. The median is 35, which is the average of two middle values because the sample size is even.21 24 25 26 27 28 28 28 28 31 32 32 34 35 37 42 45 48 48 58lower quartile: 21 24 25 26 27 28 28 28 28 3155 ÷ 2 = 27.5upper quartile: 32 34 35 37 42 45 48 48 48 5887 ÷ 2 = 43.5
1.5 (a) 22 hours instead of 24 hours
(b) labeling x-axis and y-axis
(d) percentages
(e) no, there is 2hours remaining to make one daypercentage of the pie chart is 91.666%
LVL 3MATHSa.indb 85LVL 3MATHSa.indb 85 12/14/2007 2:27:20 PM12/14/2007 2:27:20 PM

86
Mo
dule 3
1.6 (a) Graph1 number of crimes are represented by the differences of 10 but graph 2 is 5
(b) Graph 2 the number of crimes clearly indicated
(c) Graph 2 there is no assumption about number of crimes in the community
1.7 (a) The total of two dice can show any score of greater than 3 (3,1;3, 2; 3,3;3,4;3,5;3,6;2,2;4,4;5,5;6,6;4;5). This is just 11 of the 36 equally likely results 11 __ 36
(b) The total score of two dice is 7(1,6;2,5;3,4) then this is just 3 of 36 equally likely results 3/36 is 1 __ 12
(c) The score is not divisible by 4(1,2;4,3;5,2;5,4;5,6) then this is just 5 of 36 equally likely results 5 __ 36
1.9 (a) The probability of getting of more than 4 on two successive rolls of a fair dice (1,4;2,4;3,4;4,4;4,5;4,6;5,5;6,5;6,6;3,3;3,2). This is just 11 of 36 equally likely results 11 __ 36
(b) The sum of more than 4 on two successive rolls of fair dice
1.10 (a) The pack of 52 cards have 26 cards then this is just 26 of 52 equally likely results 26 __ 52 is 1 _ 2
(b) The pack of 52 cards have 4 aces then this is just 4 of 52 equally likely results 4 __ 52 is 1 __ 13
(c) The pack of 52 cards have 12 court cards then this is just 12 of 52 equally likely results 12 __ 52 is 3 __ 13
1.11 (a) The first set of traffic lights is 0.6 then this is just 0.6 of 3 equally likely results 0.6 __ 3 is 1 _ 5
(b) The second set of traffic lights is 0.5 then this is just 0.5 of 3 equally likely results 0.5 __ 3 is 1 _ 6
(c) 0.5 + 0.6 = 1.1 Nomathemba will reach her granny’s house without having stop is 1.1 then this is just 1.1 of 6 equally likely results 1.1 __ 6 is 11 __ 60
Test 2 The Manager of an FET college has a rectangular bag that contains different spots (5 yellow balls and 4 red balls)
(a) What is the probability of picking up 2 yellow balls (2)
(b) What is the probability of each colour if a ball is drawn from a bag, replaced a second ball (3)
(c) Draw a diagram to carry out the structure of different balls (5)
LVL 3MATHSa.indb 86LVL 3MATHSa.indb 86 12/14/2007 2:27:20 PM12/14/2007 2:27:20 PM

87
Mo
dule
3
Test 2 solutionsTeaching method: Problem solving
(a) Probability of 2 yellow is likely equally results: 5 _ 9 × 5 _ 9 = 25 __ 81
(b) Probability of each colour is likely equally results: 5 _ 9 × 4 _ 9 + 4 _ 9 × 5 _ 9
20 __ 81 + 20 __ 81
40 __ 81
LVL 3MATHSa.indb 87LVL 3MATHSa.indb 87 12/14/2007 2:27:20 PM12/14/2007 2:27:20 PM

88
Mo
dule 4
Module 4Integrated module!
Unit 12
Integrated unit
In this unit we focus on how learners’ begins to become aware of the notion of tautology rather than rote learning is that learners’ develops confidence about doing mathematical literacy in terms of reasoning, procedural and application.
LB page 288
Pattern and Relation-ships: SO1, AS1 LO1 & 2; AS3, LO1Data Handling: SO2, AS1, LO1 & 2
Activity 2 Comparing investment options
1. i) R1 500 ii) Years Simple interest Amount invested Compound interest Invested amount
0 1000 1000
1 100 1100 100 1100
2 100 1200 110 1210
3 100 1300 121 1331
4 100 1400 133 1464
5 100 1500 146 1610
iii) Total : 1 000 + 1100 + 1 210 + 1 331 + 1 464 + 1 610 R7 715 iv) Years Simple interest Amount invested Compound interest Invested amount
0 1500 1500
1 150 1650 150 1650
2 150 1800 165 1815
3 150 1950 181 1996
4 150 2250 199 2195
5 150 2400 219 2414
v) Total: 1500 + 1650 + 1815 + 1996 + 2195 + 2414 R11 570
vi) 1000: 1500 = 2:3
LB page 289
Pattern and Relation-ships: SO1, AS1 LO1 & 2; AS3, LO1Data Handling: SO2, AS1, LO1 & 2
Activity 3 From tables to graphs
1. 10 × R60 = R600
LVL 3MATHSa.indb 88LVL 3MATHSa.indb 88 12/14/2007 2:27:20 PM12/14/2007 2:27:20 PM
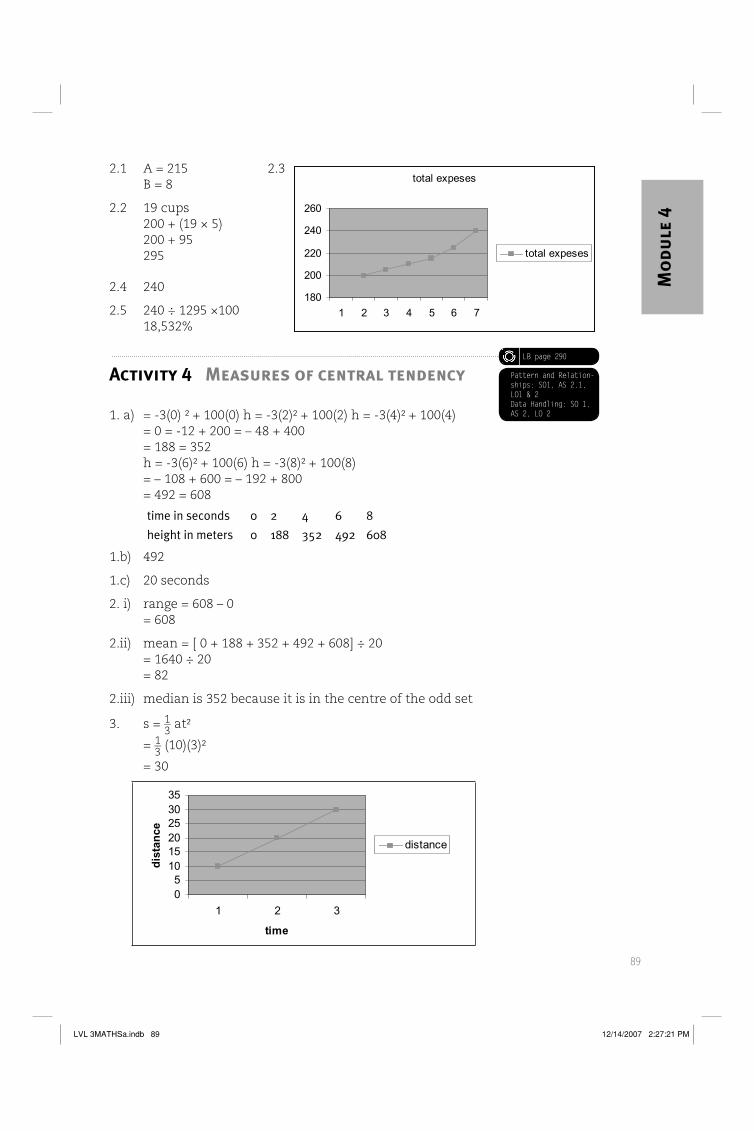
89
Mo
dule
4
2.1 A = 215B = 8
2.2 19 cups200 + (19 × 5)200 + 95295
2.4 240
2.5 240 ÷ 1295 ×10018,532%
2.3total expeses
180
200
220
240
260
1 2 3 4 5 6 7
total expeses
LB page 290
Pattern and Relation-ships: SO1, AS 2.1, LO1 & 2Data Handling: SO 1, AS 2, LO 2
Activity 4 Measures of central tendency
1. a) = -3(0) ² + 100(0) h = -3(2)² + 100(2) h = -3(4)² + 100(4)= 0 = -12 + 200 = – 48 + 400= 188 = 352h = -3(6)² + 100(6) h = -3(8)² + 100(8)= – 108 + 600 = – 192 + 800= 492 = 608
time in seconds 0 2 4 6 8
height in meters 0 188 352 492 608
1.b) 492
1.c) 20 seconds
2. i) range = 608 – 0= 608
2.ii) mean = [ 0 + 188 + 352 + 492 + 608] ÷ 20= 1640 ÷ 20= 82
2.iii) median is 352 because it is in the centre of the odd set
3. s = 1 _ 3 at²
= 1 _ 3 (10)(3)²
= 30
05
101520253035
1 2 3
time
dis
tan
ce
distance
LVL 3MATHSa.indb 89LVL 3MATHSa.indb 89 12/14/2007 2:27:21 PM12/14/2007 2:27:21 PM

90
Mo
dule 4
LB page 291
Pattern and Relation-ships: SO3, AS 3.1, LO1; AS3.1, LO1&2Data Handling: SO1, AS2.1, LO1&3
Activity 5 Investigation
a) eBhayi
b) A2
c) G 8, because the O.R Tambo is found in Gauteng
d) 4cm = x and 1cm = 300km4×300km = 1 × x1200km = x
2.1 2,5% of 2 million pounds0,025 × 2 million pounds0,05 million pounds
e) speed = distance ÷ timetime = distance ÷ speed= 1200km ÷ 120 km/h= 10 h10 × 3600 sec = 36 000 sec
2.2
months simple interest amount invested compound interest amount invested
0 2 2
1 0,05 2,1 0,05 2,05
2 0,05 2,15 0,051 2,1
3 0,05 2,20 0,052 2,15
4 0,05 2,25 0,053 2,20
5 0,05 2,30 0,054 2,25
2.3 Is arithmetic sequence because the invested growth increases by 0,05
2.4 1 pound = R10,50 and 2million pounds = x10,50 × 2 million = 1 × x21,0 million rand
2.5 1 __ 36
File factsFile facts
Hypotheses is a sample that must be tested scientifically to determine whether the conjecture is write or wrong
Mean or average is the total sum of items divide by the number of items
Mode is a number or item that appears more frequently
Median is the middle number or item of the odd set but even set has minimum value (lower quartile) and maximum value (upper quartile) that form a middle value
Range is the difference between higher value and lower value
Probability is a process that can be carried out in likely event
LVL 3MATHSa.indb 90LVL 3MATHSa.indb 90 12/14/2007 2:27:22 PM12/14/2007 2:27:22 PM

91
Mo
dule
4
Unit 13
Integrated unit
LB page 294
Activity 1 Rounding up or down!
This activity integrates three topics: Numbers, Patterns and Relationships and Finances. Students will benefit most from it if it is treated after covering these topics.
1. Month 1 2 3 4 5 6 7 8 9
Number of Children 7 11 15 19 23 27 31 35 39
2. a + (n−1)d = Tn
7 + (n−1)4 = 55
(n−1)4 = 55 − 7
n − 1 = 48 __ 4
n = 12 + 1
n = 13
3. (a) 3 _ 5 × 100% = 5% (b) 6 _ 5 × 100% = 11%
(c) 7 _ 5 × 100% = 13% (d) 9 _ 5 × 100% = 16%
4. (a) 3 _ 5 × 100% = 5,5% (b) 6 _ 5 × 100% = 10,9%
(c) 7 _ 5 × 100% = 12,7% (d) 9 _ 5 × 100% = 16,4%
5. (a) 3 _ 5 × 100% = 6% (b) 6 _ 5 × 100% = 11%
(c) 7 _ 5 × 100% = 13% (d) 9 _ 5 × 100% = 17%
6. (a) 3 _ 5 × 100% = 5% (b) 6 _ 5 × 100% = 10%
(c) 7 _ 5 × 100% = 12% (d) 9 _ 5 × 100% = 16%
7. (a) milliliters of milk consumed = 11 × 340 = 3 740 ml
(b) milliliters of milk consumed = 23 × 340 = 7 820 ml
(c) milliliters of milk consumed = 27 × 340 = 9 180 ml
(d) milliliters of milk consumed = 31 × 340 = 10 540 ml
(e) milliliters of milk consumed = 34 × 340 = 11 560 ml
(f) milliliters of milk consumed = 35 × 340 = 11 900 ml
8. (a) 3 740 ml = 3740 ____ 1000 = 3, 74 l
(b) 7 820 ml = 7820 ____ 1000 = 7, 82 l
(c) 9 180 ml = 9180 ____ 1000 = 9, 18 l
LVL 3MATHSa.indb 91LVL 3MATHSa.indb 91 12/14/2007 2:27:22 PM12/14/2007 2:27:22 PM

92
Mo
dule 4
(d) 10 540 ml = 10 540 _____ 1000 = 10,54 l
(e) 11 560 ml = 11 560 _____ 1000 = 11,56 l
(f) 11 900 ml = 11 900 _____ 1000 = 11,9 l
9. (a) Gross salary = 7 × 100 = R700,00
(b) Gross salary = 11 × 100 = R1 100,00
(c) Gross salary = 15 × 100 = R1 500,00
(d) Gross salary = 19 × 100 = R1 900,00
(e) Gross salary = 23 × 100 = R2 300,00
(f) Gross salary = 27 × 100 = R2 700,00
(g) Gross salary = 31 × 100 = R3 100,00
(h) Gross salary = 35 × 100 = R3 500,00
(i) Gross salary = 39 × 100 = R3 900,00
10. (a) March Net profit = Gross profit − Expenses
= 700 − (7 × 23 × 2,3) = R329,70 (b) April
Net profit = Gross profit − Expenses = 1 100 − (11 × 22 × 2,3) = R543,40 (c) May
Net profit = Gross profit − Expenses = 1 500 − (15 × 23 × 2,3) = R706,50 (d) June
Net profit = Gross profit − Expenses = 1 900 − (19 × 22 × 2,3) = R938,60 (e) July
Net profit = Gross profit − Expenses = 2 300 − (23 × 23 × 2,3) = R1 083,30 (f) August
Net profit = Gross profit − Expenses = 2 700 − (27 × 23 × 2,3) = R1 271,70 (g) September
Net profit = Gross profit − Expenses = 3 100 − (31 × 22 × 2,3) = R1 531,40 (h) October
Net profit = Gross profit − Expenses = 3 500 − (35 × 23 × 2,3) = R1 648,50
LVL 3MATHSa.indb 92LVL 3MATHSa.indb 92 12/14/2007 2:27:23 PM12/14/2007 2:27:23 PM

93
Mo
dule
4
(i) NovemberNet profit = Gross profit − Expenses
= 3 900 − (39 × 22 × 2,3) = R1 926,60
11. (a) 329,7 ____ 700 × 100% = 47,1% (b) 543,5
____ 1 100 × 100% = 49,4%
(c) 706,5 ____ 1 500 × 100% = 47,1,% (d) 938.6 ____ 1900 × 100% = 49,4%
(e) 1 083,3 _____ 2 300 × 100% = 47,1% (f) 1 271,7
_____ 2700 × 100% = 47,1%
(g) 1 531,4 _____ 3 100 × 100% = 49,4% (h) 1 648,5
_____ 3 500 × 100% = 47,1%
(i) 1 926,6 _____ 3 900 × 100% = 49,4%
12. (a) 700 ____ 329,7 = 1 000 ____ 471 Ratio is: 1 000 : 471
(b) 1 100 ____ 543,5 = 2 200 ____ 1 087 Ratio is: 2200 : 1087
The other ratios are calculated in the same way and they will be either 1 000 : 471 or 2200 : 1087 depending on whether it has the same answer as (a) or (b) in number 11.
13. A constant sequence
14. A oscillating sequence
LB page 295
Activity 2 Dimensions
1
1.1 For longer walls: A = l × b = 10 × 4 = 40 There are two of these walls: 2 × 40 = 80 m 2
For shorter walls: A = l × b = 8 × 4 = 32 There are two of these walls: 2 × 32 = 64 m 2
Atotal = 80 + 64 = 144 m 2
1.2 Area of windows: A = l × b = 1,8 × 1 = 1,8 There are five such windows: 5 × 1,8 = 9 m 2
Area of the door: A = l × b = 2,3 × 1 = 2,3 m 2
Required Area = Atotal − (Awindows + Adoor) = 144 − (9 + 2,3) = 132,7 m 2
LVL 3MATHSa.indb 93LVL 3MATHSa.indb 93 12/14/2007 2:27:23 PM12/14/2007 2:27:23 PM

94
Mo
dule 4
1.3 Afloor = l × b = 10 × 8 = 80 m 2
1.4 Pfloor = 2 (l + b) = 2 ( 10 + 8) = 36 m
2.
2.1 Vfloor = l × b × h
= 10 × 8 × 0,3
=24 m 3
2.2
2.2.1 Number of bags of cement = 24 __ 1 = 24
2.2.2 Number of wheelbarrows of sand = 3 × number of bags of cement
= 3 × 24
= 72
3. Cost = (24 × 45) + (72 × 8)
= R1 656
4. Atile = l × b
= 0,3 × 0,2
= 0,06 m 2
Number of tiles = A floor ___ A tile
= 80 ___ 0,06 = 1 334
5 Number of boxes needed = 1 334 ____ 15 = 89
Amount = 89 × 120 = R10 680
6.
6.1 A = 132,7 m 2 Calculated in 1.
6.2 Liters of first coat necessary = 132.7 ____ 0,6 = 222
Liters of second coat necessary = 132,7 ____ 0,9 = 148
6.3 Money spent on first coat = liters of first coat × 60 = 222 × 60 = R13 320
Money spent on second coat = liters of second coat × 65 = 148 × 65 = R9 620
LVL 3MATHSa.indb 94LVL 3MATHSa.indb 94 12/14/2007 2:27:23 PM12/14/2007 2:27:23 PM
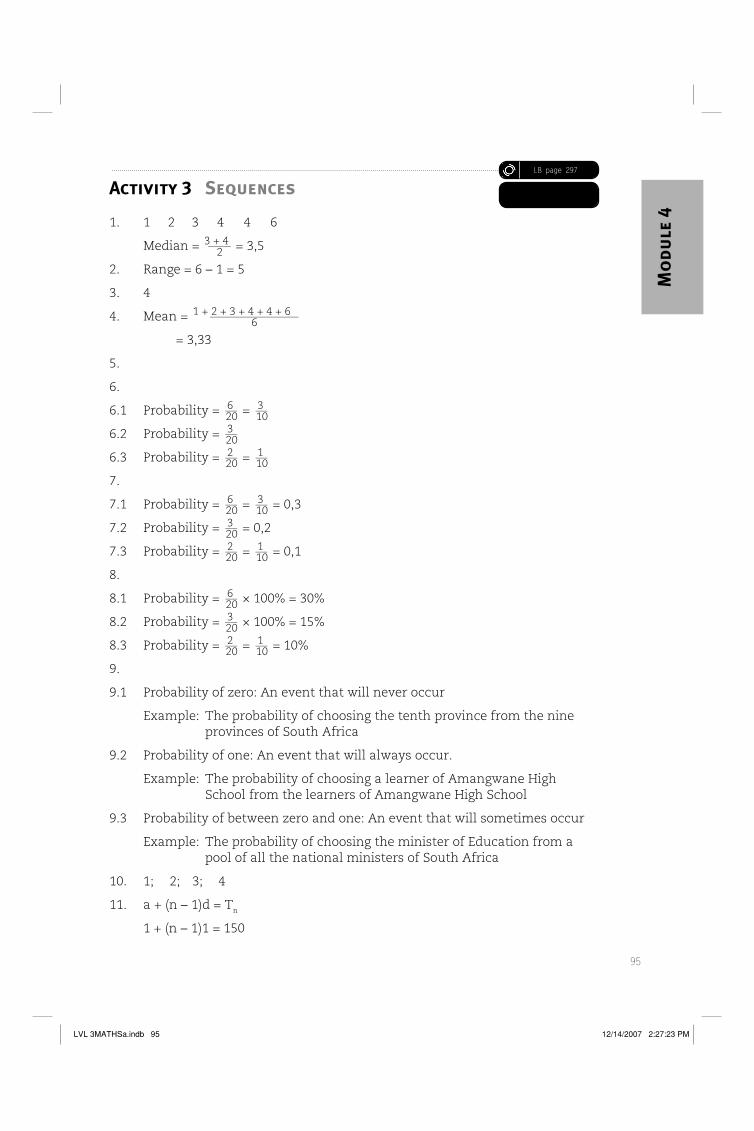
95
Mo
dule
4
LB page 297
Activity 3 Sequences
1. 1 2 3 4 4 6
Median = 3 + 4 ____ 2 = 3,5
2. Range = 6 − 1 = 5
3. 4
4. Mean = 1 + 2 + 3 + 4 + 4 + 6 ____________ 6
= 3,33
5.
6.
6.1 Probability = 6 __ 20 = 3 __ 10
6.2 Probability = 3 __ 20
6.3 Probability = 2 __ 20 = 1 __ 10
7.
7.1 Probability = 6 __ 20 = 3 __ 10 = 0,3
7.2 Probability = 3 __ 20 = 0,2
7.3 Probability = 2 __ 20 = 1 __ 10 = 0,1
8.
8.1 Probability = 6 __ 20 × 100% = 30%
8.2 Probability = 3 __ 20 × 100% = 15%
8.3 Probability = 2 __ 20 = 1 __ 10 = 10%
9.
9.1 Probability of zero: An event that will never occur
Example: The probability of choosing the tenth province from the nine provinces of South Africa
9.2 Probability of one: An event that will always occur.
Example: The probability of choosing a learner of Amangwane High School from the learners of Amangwane High School
9.3 Probability of between zero and one: An event that will sometimes occur
Example: The probability of choosing the minister of Education from a pool of all the national ministers of South Africa
10. 1; 2; 3; 4
11. a + (n − 1)d = Tn
1 + (n − 1)1 = 150
LVL 3MATHSa.indb 95LVL 3MATHSa.indb 95 12/14/2007 2:27:23 PM12/14/2007 2:27:23 PM

96
Mo
dule 4
n − 1 = 149
n = 150
12. Sn = n _ 2 [2a + (n − 1)d]
S200 = 200 ___ 2 [ 2(1) + (200 − 1)1]
= 20 100
13. The sequence: 4; 2; 1
14. Sn = a(1 − r n ) _____ 1 − r
= 4 [ 1 − ( 1 _ 2 ) 10
] _______
1 − 1 _ 2
= 7,99
15. The sequence: 1; 2; 4
Sn = a ( r n − 1 ) _____ r − 1
= 1 ( 2 10 − 1 ) ______ 2 − 1
= 1023
LB page 298
Activity 4 Series
This activity integrates topics 1,2 and 3. It is advisable that this activity is treated after covering these three topics
1 Mass = 1,3 × 1000 000 = 1300 000 g
2. (a) Mass = (4 × 50) + (3 × 80) = 440 kg
(b) Mass = (7 × 50) + (9 × 80) = 1 070 kg
(c) Mass = (15 × 50) + (21 × 80) = 2 430 kg
(d) Mass = (19 × 50) + (27 × 80) = 3 110 kg
(e) Mass = ( 25 × 50) + (33 × 80) = 3 890 kg
(f) Mass = (32 × 50) + (52 × 80) = 5 760 kg
3. (a) Mass = 440 kg = 440 ÷ 1 000 = 0, 44 tons
(b) Mass = 1 070 kg = 1 070 ÷ 1 000 = 1, 07 tons
(c) Mass = 2 430 kg = 2 430 ÷ 1 000 = 2, 43 tons
(d) Mass = 3 110 kg = 3 110 ÷ 1 000 = 3, 11 tons
(e) Mass = 3 890 kg = 3 890 ÷ 1 000 = 3, 89 tons
(f) Mass = 5 760 kg = 5 760 ÷ 1 000 = 5, 76 tons
4. (a) Mass = 440 kg = 440 × 1 000 = 440 000 g
(b) Mass = 1 070 kg = 1 070 × 1 000 = 1 070 000 g
(c) Mass = 2 430 kg = 2 430 × 1 000 = 2 430 000 g
LVL 3MATHSa.indb 96LVL 3MATHSa.indb 96 12/14/2007 2:27:24 PM12/14/2007 2:27:24 PM

97
Mo
dule
4
(d) Mass = 3 110 kg = 3 110 × 1 000 = 3 110 000 g
(e) Mass = 3 890 kg = 3 890 × 1 000 = 3 890 000 g
(f) Mass = 5 760 kg = 5 760 × 1 000 = 5 760 000 g
5. (a) Mass = 440 kg Number of loads transported = 1.
Mass of load lesser than 1 300 kg
(b) Mass = 1 070 kg Number of loads transported = 1
Mass of load lesser than 1 300 kg
(c) Mass = 2 430 kg Number of loads transported = 2
Mass of load greater than 1 300 kg but lesser than 2 600 kg
(d) Mass = 3 110 kg Number of loads transported = 3
Mass of load greater than 2 600 kg but lesser than 3 900 kg
(e) Mass = 3 890 kg Number of loads transported = 3
Mass of load greater than 2 600 kg but lesser than 3 900 kg
(f) Mass = 5 760 kg Number of loads transported = 5
Mass of load greater than 5 200 kg but lesser than 6 500 kg
6.
6.1 (a) Gross income = (4 × 160) + (3 × 210) = R1 270
(b) Gross income = (7 × 160) + (9 × 210) = R3 010
(c) Gross income = (15 × 160) + (21 × 210) = R6 810
(d) Gross income = (19 × 160) + (27 × 210) =R8 710
(e) Gross income = ( 25 × 160) + (33 × 210) =R10 930
(f) Gross income = (32 × 160) + (52 × 210) =R16 040
6.2 50 kg × 100 sacks bought for R12 000,00.
Then the price of each sack is = 12 00 ____ 100 = R120
80 kg × 100 sacks bought for R18 000,00
Then the price of each sack is = 18 000 _____ 100 = R180
(a) Net income = Gross income − cost price
= 1 270 − [(4 × 120) + (3 × 180)] = R250
(b) Net income = Gross income − cost price
= 3 010 − [(7 × 120) + (9 × 180)] = R550
(c) Net income = Gross income − cost price
= 6 810 − [(15 × 120) + (21 × 180)] = R1 230
LVL 3MATHSa.indb 97LVL 3MATHSa.indb 97 12/14/2007 2:27:24 PM12/14/2007 2:27:24 PM

98
Mo
dule 4
(d) Net income = Gross income − cost price
= 8 710 − [(19 × 120) + (27 × 180)] = R1 570
(e) Net income = Gross income − cost price
=1 0 930 − [(25 × 120) + (33 × 180)] = R1 990
(f) Net income = Gross income − cost price
=16 040 − [(32 × 120) + (52 × 180)] = R2 840
7.
(a) For month 1: Probability = 4 _ 7
(b) For month 2: Probability = 7 __ 16
8. 3; 9; 15; 21; 27; 33; 39; 46; 52
This is an arithmetic sequence. It has a common difference
9. d = T2 − T1 = 9 − 3 = 6
10. Tn = a + (n − 1)d
T15 = 3 + (15 − 1)6
= 87
11. a + (n − 1)d = Tn
3 + (n − 1)6 = 303
(n − 1)6 = 303 − 3
n − 1 = 300 ___ 6
n = 51
303 is term number 51 of the sequence
12. Sn = n _ 2 [2a + (n − 1)d]
S9 = 9 _ 2 [2(3) + (9 −1)6]
= 243
LVL 3MATHSa.indb 98LVL 3MATHSa.indb 98 12/14/2007 2:27:24 PM12/14/2007 2:27:24 PM