Fine Mapping and Marker Development for the Resistance ...
232
TECHNISCHE UNIVERSITÄT MÜNCHEN Lehrstuhl für Pflanzenzüchtung Fine Mapping and Marker Development for the Resistance Gene Rrs2 against Rhynchosporium secalis in Barley Anja Hanemann Vollständiger Abdruck der von der Fakultät Wissenschaftszentrum Weihenstephan für Ernährung, Landnutzung und Umwelt der Technischen Universität München zur Erlangung des akademischen Grades eines Doktors der Naturwissenschaften genehmigten Dissertation. Vorsitzende: Univ.-Prof. Dr. Chr.-C. Schön Prüfer der Dissertation: 1. Univ.-Prof. Dr. G. Wenzel 2. Univ.-Prof. Dr. R. Hückelhoven 3. Priv.-Doz. Dr. V. Mohler Die Dissertation wurde am 13.05.2009 bei der Technischen Universität München eingereicht und durch die Fakultät Wissenschaftszentrum Weihenstephan für Ernährung, Landnutzung und Umwelt der Technischen Universität München am 14.10.2009 angenommen.
-
Upload
khangminh22 -
Category
Documents
-
view
2 -
download
0
Transcript of Fine Mapping and Marker Development for the Resistance ...

TECHNISCHE UNIVERSITÄT MÜNCHEN
Lehrstuhl für Pflanzenzüchtung
Fine Mapping and Marker Development for the Resistance Gene Rrs2 against Rhynchosporium secalis in Barley
Anja Hanemann
Vollständiger Abdruck der von der Fakultät Wissenschaftszentrum Weihenstephan
für Ernährung, Landnutzung und Umwelt der Technischen Universität München zur
Erlangung des akademischen Grades eines
Doktors der Naturwissenschaften
genehmigten Dissertation.
Vorsitzende: Univ.-Prof. Dr. Chr.-C. Schön
Prüfer der Dissertation: 1. Univ.-Prof. Dr. G. Wenzel
2. Univ.-Prof. Dr. R. Hückelhoven
3. Priv.-Doz. Dr. V. Mohler
Die Dissertation wurde am 13.05.2009 bei der Technischen Universität München
eingereicht und durch die Fakultät Wissenschaftszentrum Weihenstephan für
Ernährung, Landnutzung und Umwelt der Technischen Universität München am
14.10.2009 angenommen.

dedicated with many thanks to S. Mikolajewski

" Ignorance more frequently begets confidence than does knowledge: it is those
who know little, not those who know much, who so positively assert that this or
that problem will never be solved by science. "
Charles Darwin

TABLE OF CONTENTS I
Table of contents
1 INTRODUCTION 1
1.1 Disease resistance in plants – a short overview............................................2
1.2 Cloned disease resistance genes of cereals with focus on cloned barley Rgenes .................................................................................................................7
1.3 Scald in barley caused by Rhynchosporium secalis ...................................101.3.1 Epidemiology and genetic variability of Rhynchosporium secalis .................111.3.2 Development of Rhynchosporium secalis on barley and effects of its toxins 111.3.3 Known resistance genes against Rhynchosporium secalis ..........................131.3.4 Known functions of resistance genes against Rhynchosporium secalis with
focus on Rrs1 ...............................................................................................141.3.5 Effectiveness of Rrs2 resistance...................................................................15
1.4 Previous work on Rrs2 ...................................................................................171.4.1 Mapping of the Rrs2 gene ............................................................................171.4.2 Establishment of a physical BAC contig for the Rrs2 locus ..........................17
1.5 Aim of the present work .................................................................................23
2 MATERIAL AND METHODS 24
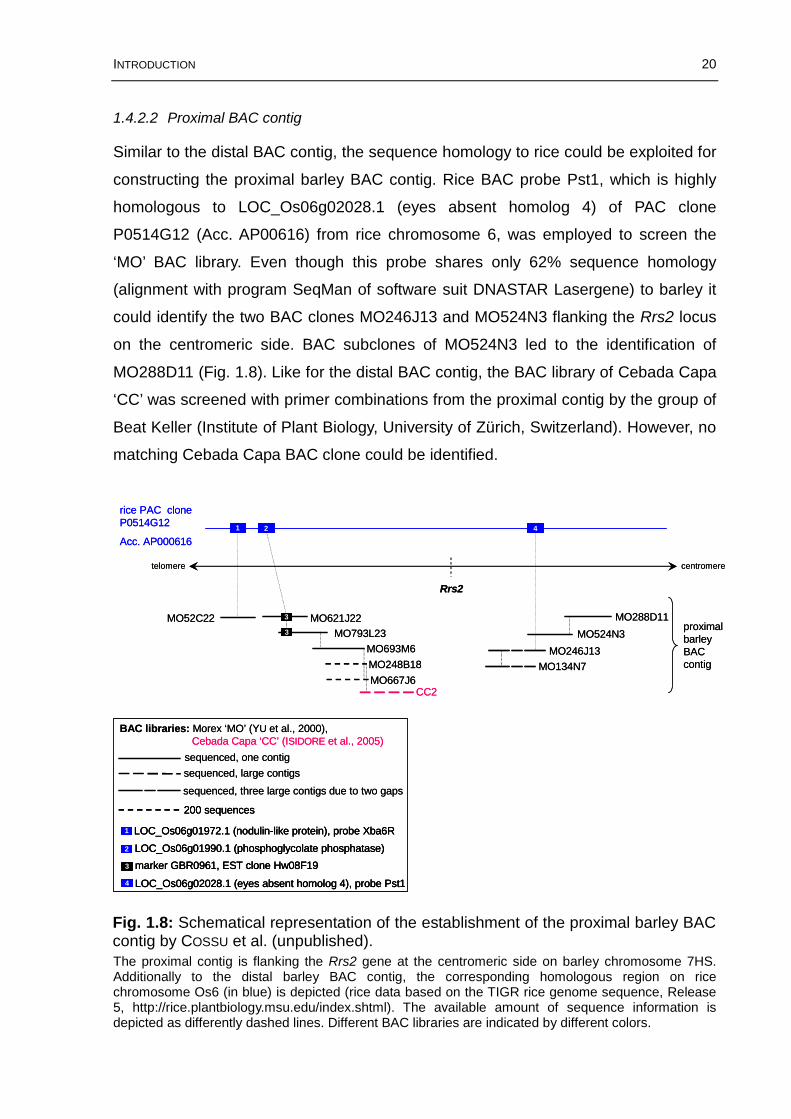
2.1 Establishment of the F2-mapping population...............................................24
2.2 Scald resistance test ......................................................................................26
2.3 Physical map establishment ..........................................................................262.3.1 BAC libraries and BAC library screening ......................................................262.3.2 BAC clone fingerprinting ...............................................................................282.3.3 Subcloning of BAC clones ............................................................................28
2.4 Nucleic acid isolation and quantification .....................................................292.4.1 Genomic DNA...............................................................................................292.4.2 Plasmid DNA ................................................................................................292.4.3 RNA..............................................................................................................30
2.5 PCR and RT-PCR.............................................................................................302.5.1 Analysis of PCR products .............................................................................31
2.6 DNA sequencing .............................................................................................31
2.7 Sequence analysis and database mining .....................................................322.7.1 In-silico sequence analysis ...........................................................................322.7.2 Sequence annotation....................................................................................32
2.8 Molecular marker development .....................................................................332.8.1 CAPS markers..............................................................................................332.8.2 Pyrosequencing markers ..............................................................................34

TABLE OF CONTENTS II
2.9 Association Study...........................................................................................342.9.1 Linkage disequilibrium ..................................................................................362.9.2 Cluster Analysis ............................................................................................36
3 RESULTS 37
3.1 Fine Mapping of the Rrs2 gene......................................................................37
3.2 Continued establishment of a physical BAC contig for the Rrs2 region ...413.2.1 Distal BAC contig..........................................................................................413.2.2 Proximal BAC contig.....................................................................................47
3.3 Summary of results for the map based cloning approach..........................49
3.4 Sequence annotation of the Rrs2 co-segregating region............................513.4.1 Sequence annotation of the distal BAC contig, BAC clones MO668A17 and
MO348I22, as well as gene information obtained from the HarvEST Barley Integrated Map 04/16/08...............................................................................52
3.4.2 Sequence annotation of the proximal BAC contig and summary of identified genes in the co-segregating region...............................................................61
3.5 Synteny of the Rrs2 region to other members of the Poacea family..........623.5.1 Synteny to rice (Oryza sativa L.)...................................................................623.5.2 Synteny to Brachypodium distachyon...........................................................66
3.6 Association study...........................................................................................693.6.1 SNP and haplotype patterns of six genomic regions located near or within the
co-segregating area of Rrs2 on barley chromosome 7HS............................713.6.2 Cluster analysis ............................................................................................753.6.3 Linkage disequilibrium (LD) analysis of haplotypes ......................................773.6.4 Association of SNPs and haplotypes of six PCR fragments with the Rrs2
phenotype.....................................................................................................79
3.7 Development of diagnostic markers for the Rrs2 gene...............................863.7.1 CAPS markers based on fragment Put_acri_res_gene_7H..........................873.7.2 CAPS markers based on fragment 668A17_g1-3.........................................883.7.3 CAPS marker based on fragment 668A17_e11-2.........................................893.7.4 Pyrosequencing marker based on PCR fragment Put_acri_res_gene_7H...903.7.5 Pyrosequencing marker based on fragment 668A17_g1-3...........................903.7.6 Pyrosequencing marker based on fragment 668A17_e11-2.........................91
3.8 Expression Analysis .......................................................................................923.8.1 PCR fragment RGH-3...................................................................................933.8.2 PCR fragment Put_acr_res_gene_7H ..........................................................933.8.3 PCR fragment FST-2 and primer combination PK95 ....................................943.8.4 PCR fragment 668A17_g1-3 and primer combinations PK37 and PK38......963.8.5 PCR fragment 668A17_e11-2.......................................................................973.8.6 PCR fragment 134N7_con5-3 and primer combination PK18 ......................973.8.7 Summary of the expression analysis ............................................................99
3.9 Summary of results.......................................................................................100
TABLE OF CONTENTS III
4 DISCUSSION 102
4.1 High-resolution mapping of the Rrs2 region ..............................................102
4.2 Possible reasons for suppressed recombination in the vicinity of the Rrs2gene ...............................................................................................................105
4.3 The Rrs2 region coincides with a region which is poorly represented in BAC libraries .................................................................................................110
4.4 Synteny to rice and Brachypodium............................................................. 111
4.5 Association study, development of diagnostic molecular markers for Rrs2, and possible origin of the Rrs2 gene ..........................................................115
4.6 Putative candidate genes for Rrs2 ..............................................................121
4.7 Outlook ..........................................................................................................126
5 SUMMARY 128
6 ZUSAMMENFASSUNG 129
7 REFERENCES 131
8 SUPPLEMENTARY MATERIAL 157

LIST OF FIGURES IV
List of Figures
Fig. 1.1: Zigzag model of the plant immune system by JONES and DANGL (2006) (modified). ...................................................................................................................3
Fig. 1.2: Classes of plant disease resistance proteins and examples of cloned R proteins for each class (modified from MCDOWELL and WOFFENDEN (2003) with information from DANGL and JONES (2001) and CHISHOLM et al. (2006))......................5
Fig. 1.3: Receptor-ligand model (A) and guard hypothesis (B,C) based on figures in DANGL and JONES (2001) and DEYOUNG and INNES (2006)..........................................7
Fig. 1.4: Locations of mapped resistance genes against Rhynchosporium secalis on the barley bin map (http://www.barleyworld.org, status of August 11, 2006)..............13
Fig. 1.5: Effectiveness of the Rrs2 mediated resistance in the field observed at the Bayerische Landesanstalt für Landwirtschaft (LfL-Bavaria) in Freising in the year 2005. .........................................................................................................................16
Fig. 1.6: Rrs2 region on barley chromosome 7HS with flanking markers and in blue the corresponding homologous region on rice chromosome Os6. ............................18
Fig. 1.7: Schematical representation of the establishment of the distal barley BAC contig by COSSU et al. (unpublished). ........................................................................19
Fig. 1.8: Schematical representation of the establishment of the proximal barley BAC contig by COSSU et al. (unpublished). ........................................................................20
Fig. 1.9: Graphical representation of the annotation of the proximal BAC contig MO134N7_MO246J13_MO524N3_MO288D11 performed by Thomas Wicker (University of Zürich). ................................................................................................22
Fig. 2.1: Overview of the establishment of the F2-mapping population. ....................25
Fig. 2.2: Schematic representation of the allocation of BAC clone DNA into pools for the Morex BAC library using BAC library plate 12 as example..................................27
Fig. 2.3: Section of the physical map of the Rrs2 locus on barley chromosome 7HS depicting the name and location of six PCR fragments analyzed in the association study. .........................................................................................................................35
Fig. 3.1: Genetic map of the Rrs2 region on chromosome 7HS................................40
Fig. 3.2: Distal barley BAC contig for the Rrs2 locus on barley chromosome 7HS established by COSSU et al. (unpublished), status at the beginning of the presented PhD work...................................................................................................................41
Fig. 3.3: Schematical representation of the work flow for the identification of barley BAC clone MO668A17 and its anchoring in the existing distal barley BAC contig. ...43
Fig. 3.4: Schematical representation of the work flow for the identification of barley BAC clones MO348I22 and MO3M16 and their anchoring in the distal BAC contig. .45
Fig. 3.5: Prolonged distal barley BAC contig of the Rrs2 locus after screening of several different BAC libraries. ..................................................................................46
Fig. 3.6: Proximal barley BAC contig for the Rrs2 locus on barley chromosome 7HS established by COSSU et al. (unpublished), status at the beginning of the presented PhD work...................................................................................................................47

LIST OF FIGURES V
Fig. 3.7: Schematical representation of work flow for the identification of BAC clone MO16J08 and its intended anchoring in the proximal BAC contig.............................48
Fig. 3.8: Summary of the genetic and physical map (minimal BAC clone tiling path) of the Rrs2 locus on barley chromosome 7HS. .............................................................50
Fig. 3.9: Section of the physical map of the Rrs2 locus on barley chromosome 7HS indicating the available sequence information of the co-segregating area of Rrs2....52
Fig. 3.10: Graphical representation of the annotated Rrs2 co-segregating region of the distal BAC contig. ................................................................................................57
Fig. 3.11: Section of the physical map of the Rrs2 locus on barley chromosome 7HS indicating the genes identified in the co-segregating area of Rrs2. ...........................62
Fig. 3.12: Graphical representation of the syntenic relationships between the Rrs2locus on barley chromosome 7HS and rice (Oryza sativa)........................................65
Fig. 3.13: Graphical representation of the syntenic relationships between the Rrs2locus on barley chromosome 7HS and Brachypodium distachyon............................68
Fig. 3.14: Overview of a section of the physical map of the Rrs2 locus on barley chromosome 7HS indicating the genomic location and names of six PCR fragments which were analyzed in the association study. ..........................................................72
Fig. 3.15: Distribution of haplotypes at six genomic regions across the Rrs2 locus on barley chromosome 7HS based on data of 72 barley accessions representing 58 different genotypes....................................................................................................74
Fig. 3.16: Cluster analysis of 72 barley accessions. .................................................76
Fig. 3.17: Linkage Disequilibrium (LD) matrix showing the correlation of haplotypes of six PCR fragments and Rrs2 mediated resistance. ...................................................78
Fig. 3.18: LD measurement R2 of pairwise comparisons of all haplotypes across the analyzed genomic area with the Rrs2 phenotype......................................................79
Fig. 3.19: CAPS marker assays for PCR fragment Put_acri_res_gene_7H with Bsp68I (A) and Eco32I (B), white numbered samples do not carry Rrs2, yellow labelled samples carry Rrs2. .....................................................................................87
Fig. 3.20: CAPS marker assays for PCR fragment 668A17_g1-3 with BncI (A) and GsuI (B), white numbered samples do not carry Rrs2, yellow labelled samples carry Rrs2...........................................................................................................................88
Fig. 3.21: CAPS marker assay for PCR fragment 668A17_e11-2 with Hin1II. ..........89
Fig. 3.22: Results of the pyrosequencing marker assay for fragmentPut_acri_res_gene_7H of varieties Atlas (Rrs2+) and Steffi (Rrs2-)..........................90
Fig. 3.23: Results of the pyrosequencing marker assay for fragment 668A17_g1-3 for the varieties Atlas (Rrs2+) and Steffi (Rrs2-). ............................................................91
Fig. 3.24: Results of the pyrosequencing marker assay for fragment 668A17_e11-2 for the varieties Atlas (Rrs2+) and Steffi (Rrs2-). .......................................................91
Fig. 3.25: PCR products separated on 2% agarose gel showing the amplification of genomic DNA and cDNA of Atlas and Steffi with a primer combination amplifying part of the barley actin gene (GenBank Acc. AY145451.1). ..............................................92

LIST OF FIGURES VI
Fig. 3.26: Alignment of PCR fragment RGH-3, EST Acc. CA004050 and HarvEST unigene #41873 with the genomic region of RGH-3 (Acc. AY853252) and with primers used for the expression analysis. .................................................................93
Fig. 3.27: Amplification of cDNA of Atlas and Steffi with primer combination PK95 and actin...........................................................................................................................95
Fig. 3.28: Graphical representation of alignment of the genomic region of the predicted HvFST-2 gene with EST consensus TC188981, EST Acc. BY842569, HarvEST unigene #31645 and #7621 together with PCR fragment FST-2 and RT-PCR fragment of PK95..............................................................................................95
Fig. 3.29: Amplification of cDNA of Atlas and Steffi with primer combinations PK37, PK38 and Actin..........................................................................................................96
Fig. 3.30: Alignment of BAC subclone 668A17_plate3_g1-t3 with EST consensus hit TC154956 and HarvEST unigene#2643, PCR fragment 668A17_g1-3 and with RT-PCR fragments PK37 and PK38. ..............................................................................97
Fig. 3.31: Amplification of cDNA of Atlas and Steffi with primer combinations PK37, PK38 and Actin..........................................................................................................98
Fig. 3.32: Alignment of PCR fragment 134N7_con5-3 with EST consensus hit TC184695 and HarvEST unigenes #3681 and #3682 and with RT-PCR fragment PK18. ........................................................................................................................98
Fig. 4.1: Geographical origin and common pedigree of barley varieties carrying Rrs2.................................................................................................................................120

LIST OF TABLES VII
List of Tables
Table 1.1: Cloned resistance genes of cereals (based on AYLIFFE and LAGUDAH
(2004) and DAI et al. (2007); updated).........................................................................8
Table 3.1: Summary of the different screening steps for establishment of the Rrs2mapping population ...................................................................................................39
Table 3.2: Overview of genetic distances and expected physical distances achieved with the mapping population......................................................................................39
Table 3.3: Summary of the expected and actual physical distances of the marker interval between markers AFLP14 and P1D23R .......................................................51
Table 3.4: List of putative genes identified in the Rrs2 co-segregating region of the distal BAC contig and on BAC clones MO668A17 and ME194H14...........................55
Table 3.5: Comparison of the location of orthologous genes found in the Rrs2 locus on barley chromosome 7HS, in rice and Brachypodium............................................69
Table 3.6: Distribution of country of origin, seasonal habit, row number, and adaptation status among the 58 different genotypes studied in the association study...................................................................................................................................71
Table 3.7: Summary of the SNP and haplotype analysis of 58 barley genotypes based on sequence data of six PCR fragments originating from the Rrs2 region on barley chromosome 7HS...........................................................................................73
Table 3.8: LD analysis results of the pairwise comparisons of haplotypes H2 of PCR fragments Put_acri_res_gene_7H, 668A17_g1-3, 668A17_e11-2, and 134N7_con5-3 with each other and with the Rrs2 gene. ...................................................................77
Table 3.9: Associations for SNPs and haplotypes of PCR fragment RGH-3 with the Rrs2 resistance phenotype calculated for 66 barley accessions using the General Linear Model (GLM). .................................................................................................80
Table 3.10: Associations for SNPs and haplotypes of PCR fragment Put_acri_res_gene_7H with the Rrs2 resistance phenotype calculated for 72 barley accessions using the General Linear Model (GLM)...................................................81
Table 3.11: Associations for SNPs and haplotypes of PCR fragment FST-2 with the Rrs2 resistance phenotype calculated for 72 barley accessions using the General Linear Model (GLM). .................................................................................................82
Table 3.12: Associations for SNPs and haplotypes of PCR fragment 668A17_g1-3 with the resistance phenotype calculated for 72 barley accessions using the General Linear Model (GLM). .................................................................................................83
Table 3.13: Associations for SNPs and haplotypes of PCR fragment 668A17_e11-2 with the resistance phenotype calculated for 72 barley accessions using the General Linear Model (GLM). .................................................................................................84
Table 3.14: Associations for SNPs and haplotypes of PCR fragment 134N7_con5-3 with the resistance phenotype calculated for 71 barley accessions using the General Linear Model (GLM). .................................................................................................85

LIST OF TABLES VIII
Table 3.15: Overview of highly associated SNPs with the Rrs2 phenotype (yellow highlighted) of three PCR fragments from which CAPS and pyrosequencing markers were developed (indicated in brackets). ....................................................................86
Table 3.16: List of genes identified in the co-segregating region of Rrs2................101

ABBREVIATIONS IX
Abbreviations
A adenine
Acc. accession number
AFLP amplified fragment length lolymorphism
BAC bacterial artificial chromosome
BC before Christ
Bd Brachypodium distachyon (L.) Beauv.
bp base pair(s)
C cytosine
CDS coding sequence
chr. chromosome
cM centi Morgan
CTAB cetyl trimethyl ammonium bromide
dNTP deoxyribonucleotide triphosphate
ddH2O double distilled water
DNA deoxyribonucleic acid
DNase deoxyribonuclease
EDTA ethylenediaminetetraacetic acid
EST expressed sequence tag
et al. et alii
F1; F2; F3… first, second, third… filial generation
FISH fluorescence in situ hybridization
G guanine
Gb gigabase(s)
H symbolizes genomes of Hordeum vulgare and H. bulbosum
h hour
HICF high information content fingerprinting
HvGI DFCI Barley Gene Index database
INDEL insertion-deletion
IPK Leibniz Institute of Plant Genetics and Crop Plant Research
IPTG isopropyl ß-D-1-thiogalactopyranoside
kb kilobase(s)
LB lysogeny broth
LINE long interspersed nuclear element
LRR leucine rich repeat
LTR long terminal repeat
M molarity
MAS marker assisted selection
Mb megabase(s)
mg milligram

ABBREVIATIONS X
min minute
ml milliliter
MITE miniature inverted repeat transposable elements
mM millimolar
n.a. not analyzed
NBS nucleotide binding site
NCBI National Center for Biotechnology Information
n.d. not determined
ng nanogram
NIP necrosis inducing protein
Os symbolizes genome of Oryza sativa
PAC P1-derived artificial chromosome
PCR polymerase chain reaction
PEST domain peptide sequence, rich in proline (P), glutamic acid (E), serine (S), threonine (T)
QTL quantitative trait locus
r resistant
RFLP restriction fragment length polymorphism
RIL recombinant inbred line
RNA ribonucleic acid
RNase ribonuclease
rpm rounds per minute
S short chromosome arm
s susceptible
SDS sodium dodecyl sulfate
SNP single nucleotide polymorphism
STS sequence-tagged-site
T thymine
TC tentative consensus
TE transposable element
TIR terminal inverted repeat
Tris tris(hydroxymethyl)aminomethane
TSD target site duplication
U unit
WRKY protein a protein that contains the conserved WRKYGQK domain(s)
µg microgram
µl microliter

INTRODUCTION 1
1 Introduction
Barley (Hordeum vulgare L.) is one of the oldest cultivated cereal crops. It has been
grown in the Middle East already prior to 10,000 BC (ZOHARY and HOPF, 2000).
Nowadays, it ranks fourth in terms of total world cereal production after maize, rice,
and wheat. Globally, an annual barley production of 136 million metric tons was
achieved in the year 2007. The European Union Member States (27 in 2007)
accounted for approximately 43% of the worldwide production with 59 million metric
tons in the year 2007, with Germany and Spain being the largest producers
(http://faostat.fao.org).
Barley is primarily used for animal feed, secondly for malt, followed by human
consumption as pearled barley or barley flour. Malt is needed for beer and whiskey
production, and used as flavoring in a variety of foods. Barley cultivars with a high
protein content are generally appreciated for food and feeding, and those with lower
protein content for malting (http://www.gramene.org).
Hordeum, as well as Triticum and Secale, belongs to the tribe Triticeae of the
Poaceae family and are thought to share one common ancestor (DEVOS, 2005).
Cultivated barley (Hordeum vulgare ssp. vulgare L.) and its wild progenitor (Hordeum
vulgare ssp. spontaneum C. Koch) have been grouped into a single species due to
the fact that no crossing barriers between the two forms exist (ASFAW and VON
BOTHMER, 1990). H. vulgare is an annual diploid species with 2n = 14 chromosomes
and an estimated 1C DNA content between 4.87 Gb (ARUMUGANATHAN and EARLE,
1991) and 5.1 Gb (BENNETT and LEITCH, 1995).
Extensive plant breeding efforts have contributed to a constant improvement of
barley concerning yield, plant height, resistance score, protein content and potential
malt extract over the past 40 years. In Bavaria, the yield of brewing barley was more
than doubled from 1950 to the present time, from 24 dt/ha to 54 dt/ha, with an
average annual increase of 49 kg/ha for the years 1955 to 2000. Plant breeding
efforts contributed to this increase mainly from the early 1970s onwards (BAUMER et
al., 2004). But still, 10.1% of the global crop losses in barley are attributable to
bacterial and fungal pathogens (data for period of 1988-1990 as described in OERKE
et al., 1994). Thus, for economical reasons, but also due to the growing demand for
environment-friendly agriculture (less use of pesticides), the breeding efforts for
resistant cultivars are of great importance.

INTRODUCTION 2
1.1 Disease resistance in plants – a short overview
Plants are targeted by a broad range of pathogens like insects, nematodes, fungi,
oomycetes, bacteria, and viruses. Due to their sessile life and the lack of a circulating
antibody system, plants possess an innate immune system in each cell with
sophisticated mechanisms for pathogen recognition and defense response activation
(DANGL and JONES, 2001; DEYOUNG and INNES, 2006; JONES and DANGL, 2006).
Plants use a two-branched innate immune system to recognize and respond to
pathogen challenges. The first branch is represented by the more basal defense,
whereby plants recognize so-called MAMPs or PAMPs (microbial- or pathogen-
associated molecular patterns). MAMPs and PAMPs are common to many classes of
pathogens and relatively slowly evolving molecules. Examples are the bacterial
flagellin and lipopolysaccharides, as well as fungal-oomycete cellulose-binding
elicitor proteins, which trigger defense reactions in many different plant species.
Through a biological ‘arms race’ pathogens have evolved mechanisms to overcome
MAMP/PAMP triggered immunity by producing effector molecules which alter
processes in the host cell. Plants reacted to this by evolving a second line of defense
in which specific resistance gene products (R) recognize specific effector molecules
and mediate defense. The two branches of defense overlap to some extend, since R
genes generally activate basal resistance responses, just in a faster and more
effective way (DANGL and JONES, 2001; DEYOUNG and INNES, 2006; JONES and
DANGL, 2006). The current understanding about the plant immune system can be
depicted in a ‘zigzag’ model shown in Fig. 1.1. It includes the two branches of
immune response and the ‘arms race’ between pathogens and plants.

INTRODUCTION 3
The presence of pathogen- or microbial-associated molecular patterns (PAMPs or MAMPs) triggers the basal immune response or PAMP triggered immunity (PTI). PTI requires signaling through MAP kinase cascades (MAPKs) and transcriptional reprogramming mediated by plant WRKY transcription factors. Successful pathogens can overcome PTI by deploying effectors which target multiple host proteins to suppress the basal immune response leading to effector-triggered susceptibility (ETS). Plant resistance proteins recognize specific effector activity and restore resistance resulting in effector-triggered immunity (ETI). ETI basically is an accelerated and amplified PTI response which often leads to hypersensitive cell death (HR). Natural selection leads to the establishment of new pathogen effectors which are not recognized by the plant immune system and therefore leading again to ETS. Natural selection also drives plants to develop new ways to recognize the new effector molecules enabling them to restore ETI.
Several R genes from different plant species, conferring resistance to various kinds
of pathogens with completely different life styles, have been cloned in the past
decades. Astonishingly, the identified proteins belong to only a few superfamilies
which are classified based on their domain organization. The majority of the R genes
encode proteins which contain nucleotide binding (NB) and leucine rich repeat (LRR)
domains (Fig. 1.2). They are distantly related to animal proteins which play a role in
animal immunity. NB-LRR resistance genes are only effective in conferring resistance
to parasites with a biotrophic or hemibiotrophic life style, but not against necrotrophic
pathogens, which kill the host tissue. LRR motifs have been identified in a diverse set
of proteins from viruses to eukaryotes and are implied also in processes other than
resistance. The carboxy-terminal LRRs can vary in length from 20 to 30 amino acids
and are thought to be involved in protein-protein interactions and are responsible for
R specificity. The conserved NB domains share sequence similarities with eukaryotic
cell death regulators. NB-LRR proteins are localized cytoplasmically and can be
Fig. 1.1: Zigzag model of the plant immune system by JONES and DANGL (2006) (modified).
MAPKsWRKY
MAMPs

INTRODUCTION 4
subdivided based on two different N-terminal structural features which are required
for downstream defense responses. One group contains a so-called TIR domain
(TIR-NB-LRR) which shows homology to the metazoan intracellular signaling
domains of the Toll-interleukin-1 innate immunity receptors. The other group contains
putative coiled-coil domains (CC-NB-LRR). The location and size of the coiled-coil
domains may vary (DANGL and JONES, 2001; MCDOWELL and WOFFENDEN, 2003;
CHISHOLM et al., 2006; DEYOUNG and INNES, 2006; JONES and DANGL, 2006).
Another major group of R proteins are the extracellular LRRs (eLRRs) (Fig. 1.2).
These include RLPs (receptor like proteins) which have an extracellular LRR and a
transmembrane domain. Another subgroup is termed RLKs (receptor like kinases)
which additionally possess a cytoplasmic kinase domain. A cell wall associated
extracellular LRR, which does not contain additional domains, was discovered with
the polygalacturonase inhibiting protein (PGIP). The majority of plant R proteins
belong to the two main classes of R genes mentioned so far, NB-LRR, RLP, RLK,
and PGIP. Besides, there exist R proteins with different domain architectures which
are not found so frequently. The Pto protein from tomato (Solanum lycopersicum) is a
serine-threonine kinase without LRRs, conferring resistance to Pseudomonas
syringae. The barley Rpg1 gene, specifying resistance to Puccinia graminis, encodes
a receptor kinase-like protein with two tandem protein kinase domains. The
Arabidopsis RPW8 protein for resistance to powdery mildew (Erysiphe sp.), contains
a membrane anchor, fused to a putative coiled-coil (CC) domain. Two extracellular
LRRs with novel structural features were the Ve1 and Ve2 proteins of tomato which
confer resistance to Verticilium species. Ve1 and Ve2 both contain receptor mediated
endocytosis-like signals (RME); additionally Ve1 possesses a leucine zipper
sequence, and Ve2 a PEST domain for protein degradation. RRS1-R is a R protein
which confers resistance to Ralstonia solanacearum. It is of the TIR-NB-LRR class,
but additionally it contains a carboxy-terminal nuclear localization signal and a WRKY
transcription factor binding domain (Fig. 1.2). A third unusual R protein, Xa27, was
cloned from rice. It confers resistance to Xanthomonas oryzae pv. oryzae. This R
protein has no homologues outside of rice and does not show homology with any
known resistance protein (DANGL and JONES, 2001; CHISHOLM et al., 2006; MCDOWELL
and WOFFENDEN, 2003).
INTRODUCTION 5
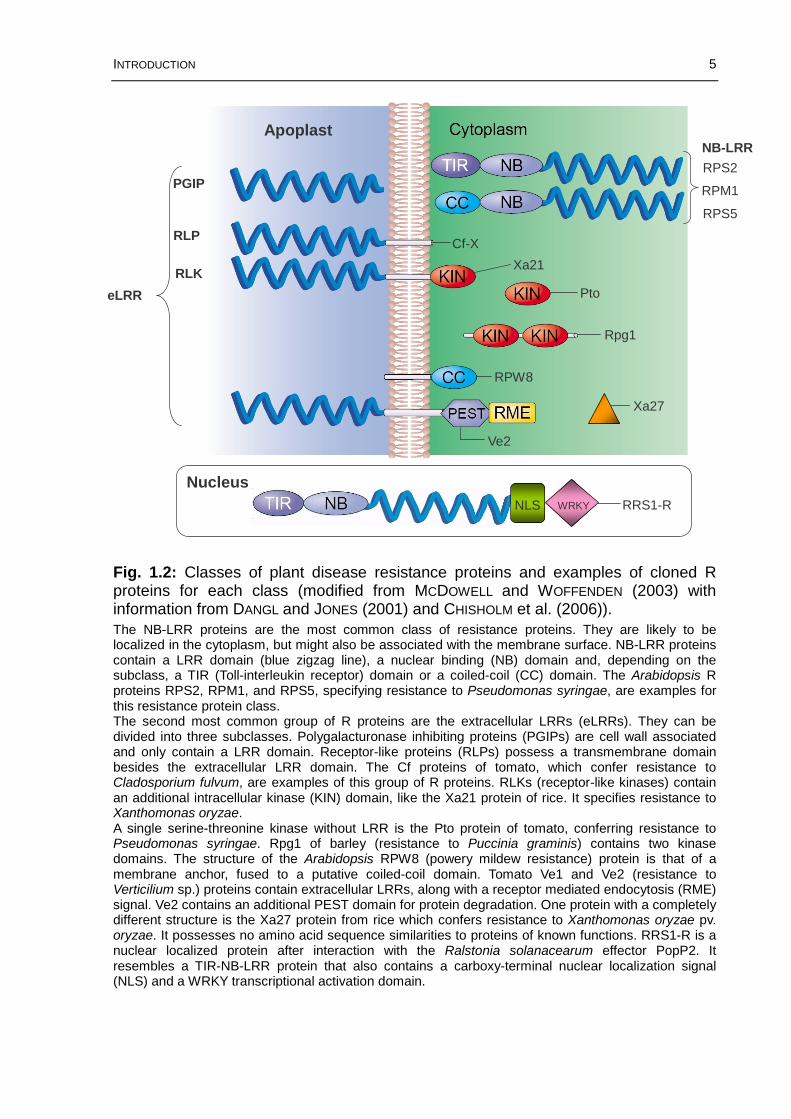
The NB-LRR proteins are the most common class of resistance proteins. They are likely to be localized in the cytoplasm, but might also be associated with the membrane surface. NB-LRR proteins contain a LRR domain (blue zigzag line), a nuclear binding (NB) domain and, depending on the subclass, a TIR (Toll-interleukin receptor) domain or a coiled-coil (CC) domain. The Arabidopsis R proteins RPS2, RPM1, and RPS5, specifying resistance to Pseudomonas syringae, are examples for this resistance protein class.The second most common group of R proteins are the extracellular LRRs (eLRRs). They can be divided into three subclasses. Polygalacturonase inhibiting proteins (PGIPs) are cell wall associated and only contain a LRR domain. Receptor-like proteins (RLPs) possess a transmembrane domain besides the extracellular LRR domain. The Cf proteins of tomato, which confer resistance to Cladosporium fulvum, are examples of this group of R proteins. RLKs (receptor-like kinases) contain an additional intracellular kinase (KIN) domain, like the Xa21 protein of rice. It specifies resistance to Xanthomonas oryzae.A single serine-threonine kinase without LRR is the Pto protein of tomato, conferring resistance to Pseudomonas syringae. Rpg1 of barley (resistance to Puccinia graminis) contains two kinase domains. The structure of the Arabidopsis RPW8 (powery mildew resistance) protein is that of a membrane anchor, fused to a putative coiled-coil domain. Tomato Ve1 and Ve2 (resistance to Verticilium sp.) proteins contain extracellular LRRs, along with a receptor mediated endocytosis (RME) signal. Ve2 contains an additional PEST domain for protein degradation. One protein with a completely different structure is the Xa27 protein from rice which confers resistance to Xanthomonas oryzae pv. oryzae. It possesses no amino acid sequence similarities to proteins of known functions. RRS1-R is a nuclear localized protein after interaction with the Ralstonia solanacearum effector PopP2. It resembles a TIR-NB-LRR protein that also contains a carboxy-terminal nuclear localization signal(NLS) and a WRKY transcriptional activation domain.
Fig. 1.2: Classes of plant disease resistance proteins and examples of cloned R proteins for each class (modified from MCDOWELL and WOFFENDEN (2003) with information from DANGL and JONES (2001) and CHISHOLM et al. (2006)).
Apoplast
PGIP
RLP
RLK
eLRR
NB-LRR
RPS2
RPM1
RPS5
RPW8
Xa21
Cf-X
Nucleus
Pto
Rpg1
Xa27
Ve2
WRKYNLS RRS1-R

INTRODUCTION 6
Studies about interactions of flax (Linum usitatissimum L.) with the flax rust fungus
led to the postulation of the ‘gene-for-gene hypothesis’ by H. H. Flor in the 1940s
(FLOR, 1971). This classic concept is based on the observation that any resistance
gene R in the host has a counterpart in the pathogen, the so-called Avr (avirulence)
gene. If matching R and Avr genes are present in both the host and the parasite, then
a resistant reaction takes place. In this case the products of R genes recognize the
Avr products (receptor-ligand model) and as a consequence host defense
mechanisms are activated. Such defense reactions include: induction of calcium
fluxes, generation of superoxide and nitric-oxide, protein kinase activation, production
of reactive oxygen intermediates (ROIs), biosynthesis of salicylic acid, induction of
ethylene biosynthesis, cell-wall strengthening, lignification, production of several
antimicrobial compounds, transcriptional reprogramming and a rapid and localized
plant cell death called ‘hypersensitive response’. In case of absence or inactivation of
either R or Avr genes, disease occurs. Then an Avr product can function as a
virulence factor which interacts with a host target changing cellular functions for the
benefit of the pathogen (VAN DER BIEZEN and JONES, 1998; DANGL and JONES, 2001).
The receptor-ligand model implies a direct interaction between R and Avr proteins.
However, despite numerous studies, only very few direct interactions could be
observed (MCDOWELL and WOFFENDEN, 2003). As a consequence, VAN DER BIEZEN
and JONES (1998) formulated an additional hypothesis, termed the ‘guard hypothesis’
which states that R proteins might also be activated indirectly by pathogen effectors.
The R proteins are guarded by other plant proteins which themselves are the targets
for effector proteins. R proteins monitor the integrity of the effector molecule’s host
targets and trigger defense reactions whenever this integrity is affected. The
receptor-ligand model and two model scenarios for the guard hypothesis are
depicted in Fig. 1.3.
INTRODUCTION 7
A B C
N-terminal domain NBS domain LRR domain pathogen effector effector target
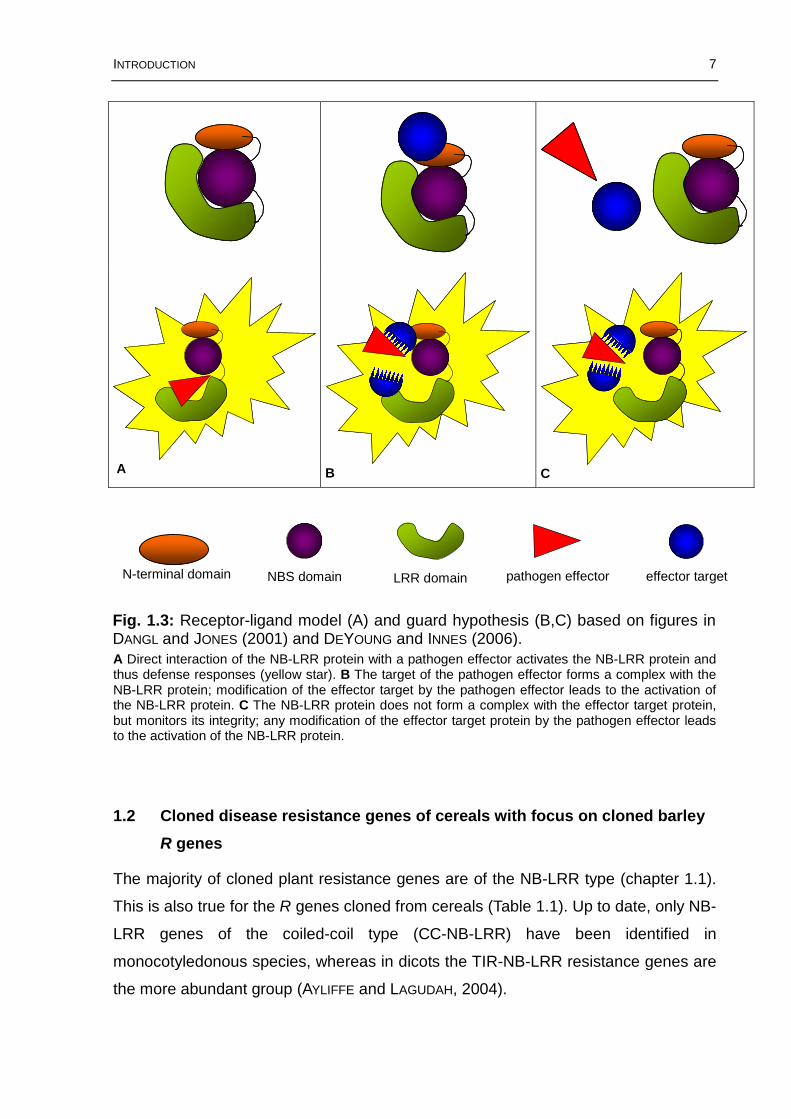
A Direct interaction of the NB-LRR protein with a pathogen effector activates the NB-LRR protein and thus defense responses (yellow star). B The target of the pathogen effector forms a complex with the NB-LRR protein; modification of the effector target by the pathogen effector leads to the activation of the NB-LRR protein. C The NB-LRR protein does not form a complex with the effector target protein, but monitors its integrity; any modification of the effector target protein by the pathogen effector leads to the activation of the NB-LRR protein.
1.2 Cloned disease resistance genes of cereals with focus on cloned barley
R genes
The majority of cloned plant resistance genes are of the NB-LRR type (chapter 1.1).
This is also true for the R genes cloned from cereals (Table 1.1). Up to date, only NB-
LRR genes of the coiled-coil type (CC-NB-LRR) have been identified in
monocotyledonous species, whereas in dicots the TIR-NB-LRR resistance genes are
the more abundant group (AYLIFFE and LAGUDAH, 2004).
Fig. 1.3: Receptor-ligand model (A) and guard hypothesis (B,C) based on figures in DANGL and JONES (2001) and DEYOUNG and INNES (2006).

INTRODUCTION 8
Species Gene Protein Pathogen Disease
Barley mlo (1) mutant seven transmembrane protein
Blumeria graminis powdery mildew
Mla1 (2) NB-LRR Blumeria graminis powdery mildew
Mla6 (3) NB-LRR Blumeria graminis powdery mildew
Rpg1 (4) protein kinase Puccinia graminis stem rust
rpg4 (5) actin depolymerizing factor-like protein
Puccinia graminis stem rust
Rpg5 (5) NB-LRR-kinase Puccinia graminis stem rust
rym4/rym5 (6) eukaryotic translationinitiation factor 4E
BaYMV, BaMMV barley yellow mosaic and barley mild mosaic virus
Maize Rp1-D (7) NB-LRR Puccinia sorghi leaf rust
Rp3 (8) NB-LRR Puccinia sorghi leaf rust
Rxo1 (9) NB-LRR Xanthomonas oryzaepv oryzicola, Burkholderia andropogonis
bacterial streak disease in rice, bacterial stripe in maize
Hm1 (10) HC toxin reductase Cochliobolus carbonum
southern corn leaf blight
Rice Xa1 (11) NB-LRR Xanthomonas oryzae bacterial blight
xa5 (12) TFII transcription factor
Xanthomonas oryzae bacterial blight
xa13 (13) homologue of nodulin MtN3
Xanthomonas oryzae bacterial blight
Xa21 (14) receptor kinase Xanthomonas oryzae bacterial blight
Xa26 (15) receptor kinase Xanthomonas oryzae bacterial blight
Xa27 (16) no homologue Xanthomonas oryzaepv. oryzae
bacterial blight
Pib (17) NB-LRR Magnaporthe grisea rice blast
Pi-ta (18) NB-LRR Magnaporthe grisea rice blast
Pi2 (19) NB-LRR Magnaporthe grisea rice blast
Pi9 (20) NB-LRR Magnaporthe grisea rice blast
Piz-t (19) NB-LRR Magnaporthe grisea rice blast
Pi-d2 (21) B-lectin receptor kinase
Magnaporthe grisea rice blast
Wheat Lr21 (22) NB-LRR Puccinia triticina leaf rust
Lr10 (23) NB-LRR Puccinia triticina leaf rust
Pm3 (24) NB-LRR Blumeria graminis powdery mildew
References (numbers in brackets behind gene designation): (1) – BÜSCHGES et al. (1997) (2) –ZHOU et al. (2001) (3) – HALTERMAN et al. (2001) (4) – BRUEGGEMAN et al. (2002) (5) –BRUEGGEMAN et al. (2008) (6) – STEIN et al. (2005) (7) – COLLINS et al. (1999) (8) – WEBB et al. (2002) (9) – ZHAO et al. (2005) (10) – HAN et al. (1997) (11) – YOSHIMURA et al. (1998) (12) –IYER and MCCOUCH (2004) (13) – CHU et al. (2006) (14) – SONG et al. (1995) (15) – SUN et al. (2004) (16) – GU et al. (2005) (17) – WANG et al. (1999) (18) – BRYAN et al. (2000) (19) – ZHOU
et al. (2006) (20) – QU et al. (2006) (21) – CHEN et al. (2006) (22) – HUANG et al. (2003) (23) –FEUILLET et al. (2003) (24) – YAHIAOUI et al. (2004)
Table 1.1: Cloned resistance genes of cereals (based on AYLIFFE and LAGUDAH (2004) and DAI et al. (2007); updated).

INTRODUCTION 9
Besides genes of the NB-LRR type, several genes with different structures have
been found. The maize Hm1 gene, which confers resistance to a necrotrophic
fungus, encodes the enzyme HC toxin reductase. This enzyme detoxifies the HC
toxin of Cochliobolus carbonum which is necessary for pathogenicity (AYLIFFE and
LAGUDAH, 2004). This type of resistance mechanism can be expected for fighting
against necrotrophic pathogens since they kill host cells by means of toxic molecules
and lytic enzymes (VAN KAN, 2006). It was shown that orthologues of Hm1 are
present in the grass family and in case of barley it was demonstrated that Hm1 is
also involved in the non-host resistance to C. carbonum (SINDHU et al., 2008).
The recessive resistance genes xa5 and xa13 of rice are quite unusual resistance
genes. The first one, xa5, encodes the gamma subunit of an eukaryotic transcription
factor called TFII (IYER and MCCOUCH, 2004). The gene xa13 codes for a protein
which is also involved in pollen development and which resembles the nodulin MtN3
protein from legumes (CHU et al., 2006). A new type of resistance gene was also
discovered with Pi-d2 of rice. It encodes a receptor-like kinase protein with a
predicted extracellular domain of a binding lectin (B-lectin) and an intracellular serine-
threonine kinase domain (CHEN et al., 2006).
An interesting case demonstrating the feasibility of resistance gene transfers
between cereals is the Rxo1 gene of maize. It does not only confer resistance to the
maize pathogen Burkholderia andropogonis, but also recognizes non-pathogens like
the rice pathogen Xanthomonas oryzae pv. oryzicola. Upon the transfer of Rxo1 to
rice, the transgenic rice lines showed resistance against the bacterial streak disease
caused by Xanthomonas oryzae pv. oryzicola (ZHAO et al., 2005).
In barley, seven resistance genes have been cloned so far (Table 1.1). The mlo gene,
another unusual resistance gene, mediates race non-specific powdery mildew
resistance. Resistant plants are homozygous for the non-functional form of the
endogenous gene. In the susceptible plants it encodes a potential cell membrane
receptor which structurally consists of seven membrane domains. The wild type gene
is thought to function as a negative regulator of the plant defense response. The mlo
mutants are very resistant to almost all isolates of Blumeria graminis f. sp. hordei, but
show a higher susceptibility for diseases like net blotch, leaf rust and Ramularia-like
leaf spot. The mutation also seems to have a negative impact on yield components
(AYLIFFE and LAGUDAH, 2004; WILLIAMS, 2003). Two additional cloned genes
conferring resistance to powdery mildew are the Mla1 and Mla6 genes which belong

INTRODUCTION 10
to the CC-NB-LRR class of resistance genes. The Mla locus on chromosome 1H
confers multiple resistance specificities to Blumeria graminis f. sp. hordei. It contains
three distinct NBS-LRR resistance-gene homologue families which are known to
function in different signalling pathways (WEI et al., 1999; WEI et al., 2002). Even
though Mla1 and Mla6 are 91.2% identical at the amino acid level, they recognize
different powdery mildew avirulence genes (HALTERMAN et al., 2001; ZHOU et al.,
2001).
After extensive efforts, the Rpg1 gene, conferring resistance to Puccinia graminis,
was isolated by map-based cloning. The gene encodes a serine/threonine protein
kinase with two tandem kinase domains. Rpg1 has provided durable protection
against stem rust in North America since 1942 when the first resistant variety was
introduced (BRUEGGEMAN et al., 2002). Two further stem rust resistance genes were
cloned recently. The Rpg5 gene encodes a NB-LRR protein with an additional
serine/threonine kinase. The candidate gene for rpg4 encodes an actin
depolymerizing factor-like protein. The role of this gene in mediating the resistance
reaction still has to be further analyzed (BRUEGGEMAN et al., 2008).
STEIN et al. (2005) identified the eukaryotic translation initiation factor 4E (Hv-eIF4E)
as the resistance gene responsible for mediating barley yellow mosaic and barley
mild mosaic virus resistance. The two recessive resistance genes rym4 and rym5
were found to be alleles of Hv-eIF4E.
Efforts to clone other resistance genes of barley are under way. High-resolution maps
have been constructed for the genes Rph5 (Puccinia hordei, MAMMADOV et al., 2005);
Rph7 (Puccinia hordei, BRUNNER et al., 2000; BRUNNER et al., 2003), Rph16 (Puccinia
hordei, PEROVIC et al., 2004), and Rdg2a (Pyrenophora graminea, BULGARELLI et al.,
2004) which will help in map-based cloning attempts (WILLIAMS, 2003).
1.3 Scald in barley caused by Rhynchosporium secalis
Scald, also referred to as leaf blotch, is a foliar disease in barley (Hordeum
vulgare L.) and in other members of the Poaceae, caused by the hemibiotrophic,
haploid fungus Rhynchosporium secalis (Oudem.) J.J. Davis (SHIPTON, 1974;
LEHNACKERS and KNOGGE, 1990; ZAFFARANO et al., 2006; ZHAN et al., 2008). Due to
the potential high yield losses and decreased grain quality upon Rhynchosporium

INTRODUCTION 11
secalis infection, scald is an economically important barley disease worldwide in the
cool and semi-humid barley growing areas (SHIPTON, 1974; BEER, 1991).
1.3.1 Epidemiology and genetic variability of Rhynchosporium secalis
Scald is a polycyclic disease which goes through several pathogen generations
during a growing season. In the field, conidia produced on crop debris function as
primary inoculum whereas secondary infection takes place through splash-dispersed
conidia from infected leaves. Seed-borne infections with Rhynchosporium secalis are
also common (ZHAN et al., 2008).
Even though a sexual stage (teleomorph) of the fungus has never been observed, it
is generally considered to exist, since the genetic structure of Rhynchosporium
secalis populations does not resemble that of an asexual pathogen (MCDONALD et al.,
1999; SALAMATI et al., 2000; LINDE et al., 2003; ZAFFARANO et al., 2006).
Rhynchosporium secalis populations have been shown to be very diverse for
molecular markers (ZAFFARANO et al., 2006) supporting the finding that there is a high
variability between isolates of a population regarding pathogenicity, sporulation rate,
colony morphology and color, conidial dimensions, response to nutritional conditions,
and fungicide sensitivity (ZHAN et al., 2008). ZAFFARANO et al. (2006) found that 39%
of the worldwide RFLP variation was distributed within a sampling plot of 1 m2 and
58% within a barley field. This explains why Rhynchosporium secalis populations are
able to adapt rapidly to newly introduced barley major resistance genes or fungicides
which were observed to become ineffective within a few growing seasons after
extensive use (MCDONALD and LINDE, 2002; XI et al., 2003; ZHAN et al., 2008).
An interesting fact, which has been discovered only lately, is that the origin of the
fungus does not co-localize with the origin of barley, the Fertile Crescent. The highest
allele frequency was found in Northern Europe which leads to the conclusion that
Rhynchosporium secalis underwent a host switch, most probably from a wild grass
onto cultivated barley shortly after the introduction of barley into Northern Europe
around 2500-5000 BC (ZAFFARANO et al., 2006; BRUNNER et al., 2007).
1.3.2 Development of Rhynchosporium secalis on barley and effects of its toxins
The development of Rhynchosporium secalis on the host plant is taking place
predominantly in the subcuticular area of the infected leaf. After penetration of the

INTRODUCTION 12
cuticle, the hyphae grow extracellularly above the epidermal cells throughout most of
the fungus life cycle. However, epidermal cells and later the mesophyll cells collapse
leading to the typical symptoms of gray and water-soaked lesions at about 8-12 days
after infection. Only in the late stages of the pathogenesis the mesophyll tissue is
penetrated by the fungus (AYESU-OFFEI and CLARE, 1970; LEHNACKERS and KNOGGE,
1990; XI et al., 2000a).
Since Rhynchosporium secalis only rarely causes recognizable disruptions of plant
cell walls, nor forms haustoria for nutrient uptake, it seems to use other means to
mobilize the plant nutrients (JONES and AYRES, 1972; JONES and AYRES, 1974;
LEHNACKERS and KNOGGE, 1990). The fact that necrotic areas develop in distance
from fungal hyphae points to the involvement of toxins in disease development
(AYESU-OFFEI and CLARE, 1971; LEHNACKERS and KNOGGE, 1990). In fact, it could be
shown that culture filtrates of Rhynchosporium secalis can produce scald disease
symptoms on leaves of barley, oat (Avena sativa L.), wheat (Triticum aestivum L.),
and cocksfoot (Dactylis glomerata L.) (AYESU-OFFEI and CLARE, 1971). AURIOL et al.
(1978) identified a low molecular weight toxin, designated rhynchosporoside, in
cultures of Rhynchosporium secalis which produced necrosis and chlorosis on leaves
of certain barley varieties, rye (Secale cereale L.), and some non-hosts of
Rhynchosporium secalis. However, insensitivity to the toxin was not correlated with
the genetic factor controlling resistance to the fungus. Another study identified a toxic
glycoprotein which also induces scald symptoms (MAZARS et al., 1984). Since it
equally produced symptoms on susceptible and resistant cultivars, it seems not to be
important for the specificity of the fungus. Later it was shown that this glycoprotein is
able to stimulate the polysaccharide biosynthesis in barley leaves, but more
importantly it was able to activate defense mechanisms like lignin biosynthesis and ß-
1,3-glucanase activity (MAZARS et al., 1990).
Three necrosis-inducing peptides (NIP1, NIP2, NIP3) were also purified from culture
filtrates. In bioassays, these toxins were host non-specific since they caused necrosis
in both resistant and susceptible cultivars (WEVELSIEP et al., 1991). Furthermore,
NIP1 and NIP3 have been shown to stimulate the activity of the plasma membrane
H+-ATPase irrespective of the host resistance genotype (WEVELSIEP et al., 1993).

INTRODUCTION 13
1.3.3 Known resistance genes against Rhynchosporium secalis
The first studies of inherited resistance of barley cultivars to Rhynchosporium secalis
were conducted 80 years ago by MACKIE (1929). Since then several resistance genes
(R genes) against Rhynchosporium secalis have been identified and mapped (Fig.
1.4). There are four major resistance loci, the Rrs1 complex on chromosome 3H with
at least 11 known alleles, the Rrs2 locus on 7HS, Rrs13 on chromosome 6H, and the
Rrs15 locus on 2H (BJØRNSTAD et al., 2002; Günther Schweizer, personal
communication). Some resistance genes have been detected in genotypes of wild
barley, H. vulgare subsp. spontaneum (Rrs12, Rrs13, Rrs14, Rrs15 on 7H), and
Hordeum bulbosum (Rrs16). Furthermore, a number of QTL studies revealed QTLs
for scald resistance on several chromosomes whose loci often coincided with
locations of known scald resistance genes (BACKES et al., 1995; THOMAS et al., 1995;
SPANER et al., 1998; JENSEN et al., 2002; GENGER et al., 2003; VON KORFF et al., 2005;
YUN et al., 2005; CHEONG et al., 2006; WAGNER et al., 2008).
1H1
2
Hor2
3
4
5
6
7
8
9
10
11
12
13
14
Rrs14 (1)
3H
Rrs4 (4)
1
2
3
4
5
6
7
8
9
10
11
12
13
14
15
16
cMWG680
HVM60
2H1
2
3
4
5
6
7
8
9
10
11
12
13
14
15
Rrs15 (2)BMAC0134
HVM36
4H
Rrs3 (rrs6, Rrs9) (3)
1
2
3
4
5
6
7
8
9
10
11
12
13
MWG634WG622
Rrs16 (5)
6H
1
2
34
5
6
7
8
9
10
11
12
13
14
Rrs1 (3)
1
2
3
4
5
6
7
8
9
10
11
12
7H
MWG555A
HVM49
ABG378
MWG916
Rrs13(6,7)
HVM4
Rrs2 (8)
Rrs12 (6,7)
Rrs15 (9)
1H1
2
Hor2
3
4
5
6
7
8
9
10
11
12
13
14
Rrs14 (1)
3H
Rrs4 (4)
1
2
3
4
5
6
7
8
9
10
11
12
13
14
15
16
cMWG680
HVM60
2H1
2
3
4
5
6
7
8
9
10
11
12
13
14
15
1
2
3
4
5
6
7
8
9
10
11
12
13
14
15
Rrs15 (2)BMAC0134
HVM36
4H
Rrs3 (rrs6, Rrs9) (3)
1
2
3
4
5
6
7
8
9
10
11
12
13
MWG634WG622
Rrs16 (5)
6H
1
2
34
5
6
7
8
9
10
11
12
13
14
Rrs1 (3)
1
2
3
4
5
6
7
8
9
10
11
12
7H
MWG555A
HVM49
ABG378
MWG916
Rrs13(6,7)
HVM4
Rrs2 (8)
Rrs12 (6,7)
Rrs15 (9)
The name of linked or flanking markers for each resistance gene is given. The exact position of Rrs3on chromosome 4H is unknown. Chromosomes are oriented with the short arm at the top; centromerelocations are indicated with a black dot. Chromosome 5H is not depicted since it does not harbour a known scald resistance gene. References (numbers following the gene designation in brackets): (1) –GARVIN et al. (2000) (2) – SCHWEIZER et al. (2004) (3) – BJØRNSTAD et al. (2002) (4) – PATIL et al. (2003) (5) – PICKERING et al. (2006) (6) – ABBOTT et al. (1992) (7) – GENGER et al. (2003) (8) –SCHWEIZER et al. (1995) (9) – GENGER et al. (2005). Figure adapted from ZHAN et al. (2008).
Fig. 1.4: Locations of mapped resistance genes against Rhynchosporium secalis on the barley bin map (http://www.barleyworld.org, status of August 11, 2006).
INTRODUCTION 14
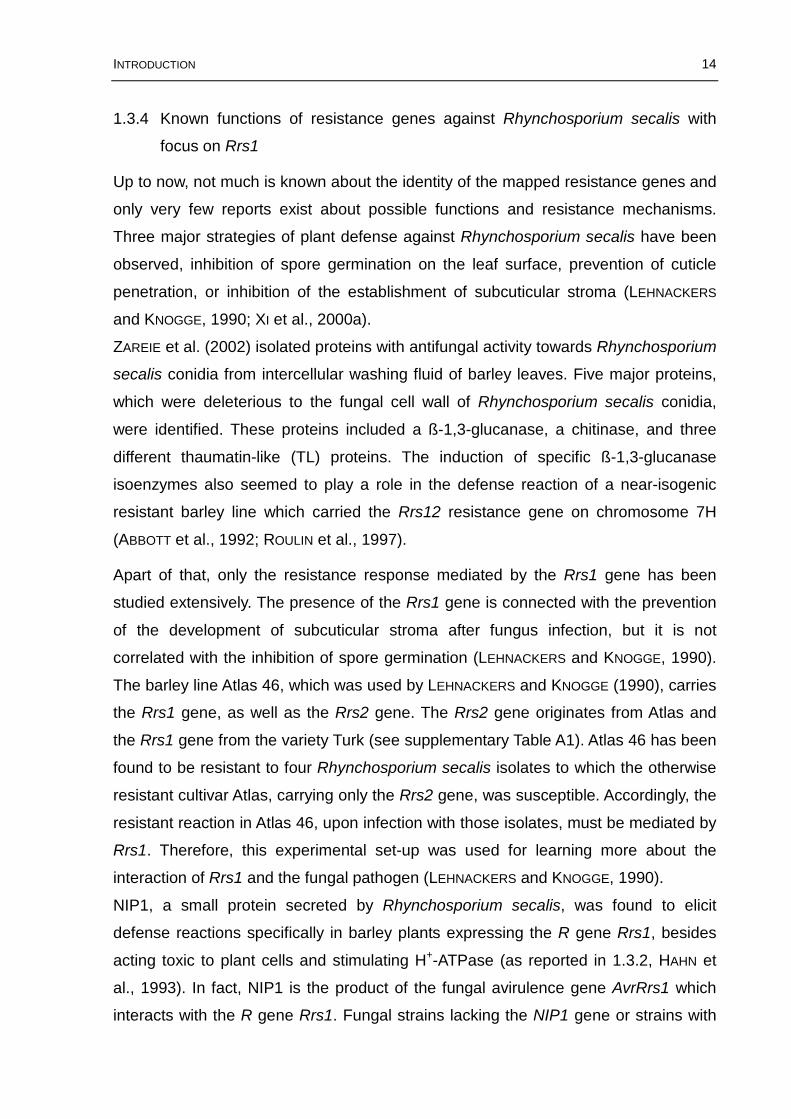
1.3.4 Known functions of resistance genes against Rhynchosporium secalis with
focus on Rrs1
Up to now, not much is known about the identity of the mapped resistance genes and
only very few reports exist about possible functions and resistance mechanisms.
Three major strategies of plant defense against Rhynchosporium secalis have been
observed, inhibition of spore germination on the leaf surface, prevention of cuticle
penetration, or inhibition of the establishment of subcuticular stroma (LEHNACKERS
and KNOGGE, 1990; XI et al., 2000a).
ZAREIE et al. (2002) isolated proteins with antifungal activity towards Rhynchosporium
secalis conidia from intercellular washing fluid of barley leaves. Five major proteins,
which were deleterious to the fungal cell wall of Rhynchosporium secalis conidia,
were identified. These proteins included a ß-1,3-glucanase, a chitinase, and three
different thaumatin-like (TL) proteins. The induction of specific ß-1,3-glucanase
isoenzymes also seemed to play a role in the defense reaction of a near-isogenic
resistant barley line which carried the Rrs12 resistance gene on chromosome 7H
(ABBOTT et al., 1992; ROULIN et al., 1997).
Apart of that, only the resistance response mediated by the Rrs1 gene has been
studied extensively. The presence of the Rrs1 gene is connected with the prevention
of the development of subcuticular stroma after fungus infection, but it is not
correlated with the inhibition of spore germination (LEHNACKERS and KNOGGE, 1990).
The barley line Atlas 46, which was used by LEHNACKERS and KNOGGE (1990), carries
the Rrs1 gene, as well as the Rrs2 gene. The Rrs2 gene originates from Atlas and
the Rrs1 gene from the variety Turk (see supplementary Table A1). Atlas 46 has been
found to be resistant to four Rhynchosporium secalis isolates to which the otherwise
resistant cultivar Atlas, carrying only the Rrs2 gene, was susceptible. Accordingly, the
resistant reaction in Atlas 46, upon infection with those isolates, must be mediated by
Rrs1. Therefore, this experimental set-up was used for learning more about the
interaction of Rrs1 and the fungal pathogen (LEHNACKERS and KNOGGE, 1990).
NIP1, a small protein secreted by Rhynchosporium secalis, was found to elicit
defense reactions specifically in barley plants expressing the R gene Rrs1, besides
acting toxic to plant cells and stimulating H+-ATPase (as reported in 1.3.2, HAHN et
al., 1993). In fact, NIP1 is the product of the fungal avirulence gene AvrRrs1 which
interacts with the R gene Rrs1. Fungal strains lacking the NIP1 gene or strains with
INTRODUCTION 15
specific point mutations in NIP1 are able to overcome Rrs1 resistance (ROHE et al.,
1995).
Upon infection of barley cultivars Atlas 46 and Atlas with fungal isolates showing
differential virulence on both varieties, a number of defense-related genes specific to
the resistant cultivar were detected. The pathogenesis-related (PR) genes PR-1,
PR-5 (acidic form), and PR-9 (peroxidase) were expressed in the mesophyll. PR10, a
lipoxygenase gene (LoxA), and a gene of unknown function (pI2-4) were detected in
the epidermis. Another gene, SD10, encoding a putative protease inhibitor was
preferentially, but not exclusively expressed in the epidermis. One gene, a germin-
like protein (OxOLP), was synthesized in the epidermis irrespective of resistance
genotype. Surprisingly, NIP1 only triggered the expression of a subgroup of the
analysed defense-related genes, the PR genes. This leads to the conclusion that
other elicitors must be involved in triggering the full defense response upon fungal
infection (STEINER-LANGE et al., 2003). This conclusion was confirmed by the finding
that a NIP1 binding site exists in membranes of both the resistant and susceptible
cultivar (VAN 'T SLOT et al., 2007). Therefore, Rrs1 does not encode for the NIP1
receptor. The Rrs1 gene product must rather play a role in recognizing the interaction
of NIP1 with its receptor and upon this it activates defense reactions including the
generation of signals which lead to defense gene activation in the mesophyll
(KNOGGE et al., 2003).
1.3.5 Effectiveness of Rrs2 resistance
Even though the variety Atlas, carrying the Rrs2 gene1, is used as the susceptible
control in the studies for Rrs1, the gene Rrs2 is very effective against most
Rhynchosporium secalis isolates. All in all only six cases are reported in the literature
where fungal isolates were shown to break the Rrs2 mediated resistance. The study
of SCHÜRCH et al. (2004) showed that two isolates (AU2 and RS88CA27) out of 41
tested were able to break the resistance of cultivar Atlas. LEHNACKERS and KNOGGE
(1990) identified four races which were able to complete the developmental cycle
1 For simplification reasons, it is referred to Rrs2 as one gene and to varieties which do not show the Rrs2 phenotype as varieties which do not carry the Rrs2 gene. However, whether the Rrs2 mediated resistance reaction is caused by one gene alone or a cluster of genes is not known. Similarly it is yet unclear whether susceptible varieties carry (a) non-functional allele(s) of the Rrs2 gene(s) or simply do not possess the Rrs2 gene(s) at all.
INTRODUCTION 16
from spore germination to sporulation on Atlas. However, three of these isolates
(CV3, UK7, and UK8) only caused microscopically visible necrotic spots, even though
the sporulation was strong. One strain (US238.1) also produced the typical lesions.
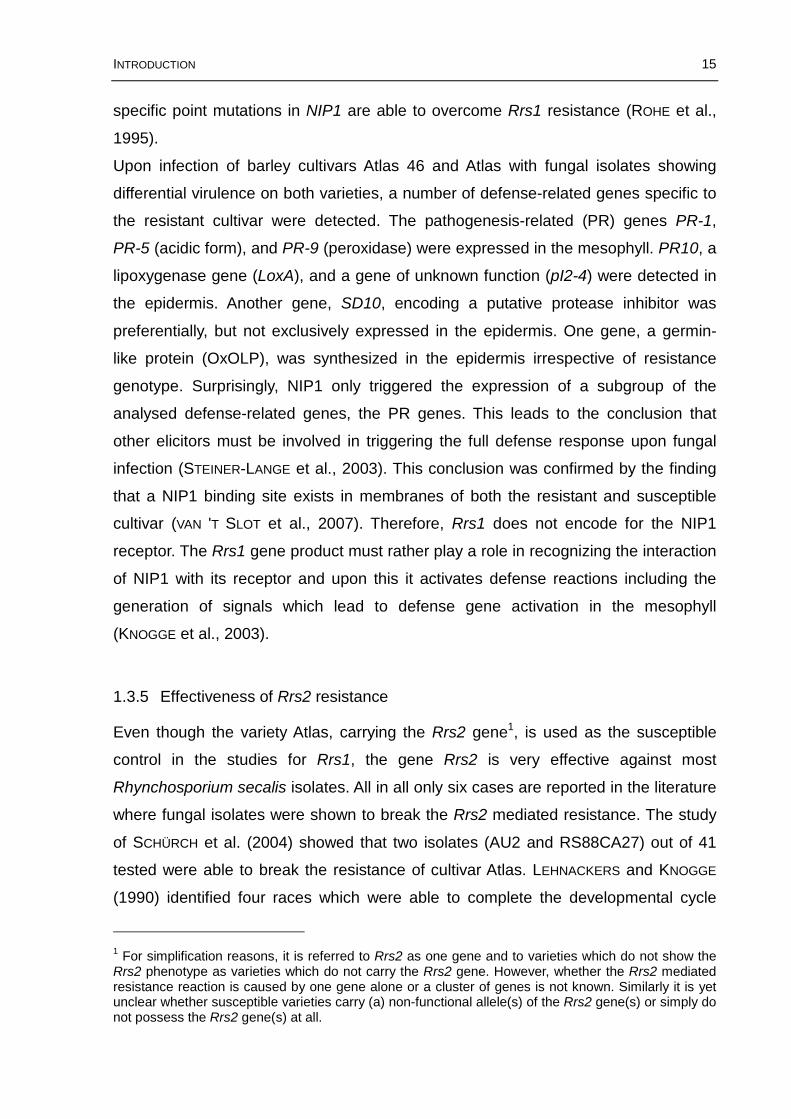
Since the year 1990 the Rrs2 mediated resistance is effective in the test field of the
Bayerische Landesanstalt für Landwirtschaft in Freising (LfL-Bavaria) (Günther
Schweizer, personal communication). Disease resistance data of 160 barley lines
obtained in the field in the year 2005 shows a clear distinction of lines which carry the
Rrs2 gene from the rest of the lines. Most lines classified into the Rrs2 carrying group
have disease resistance scores of 1 or 2 which indicate a high level of resistance.
The majority of the lines, which do not carry the Rrs2 gene, show disease scores of 3
to 6 indicating only minor basal resistance (Fig. 1.5).
1 2 3 4 5 6 7 8 9
0
5
10
15
20
25
30
num
ber
of lin
es
disease scores (2005)
Rrs2 +Rrs2 -1 2 3 4 5 6 7 8 9
0
5
10
15
20
25
30
num
ber
of lin
es
disease scores (2005)
Rrs2 +Rrs2 -
Rrs2 carrying varieties (Rrs2+) can clearly be distinguished from non-Rrs2 carrying varieties (Rrs2-). A disease score of 1 means highly resistant, 9 means highly susceptible. The data for this diagram was kindly provided by Günther Schweizer (LfL-Bavaria).
Fig. 1.5: Effectiveness of the Rrs2 mediated resistance in the field observed at the Bayerische Landesanstalt für Landwirtschaft (LfL-Bavaria) in Freising in the year 2005.
n=160

INTRODUCTION 17
1.4 Previous work on Rrs2
1.4.1 Mapping of the Rrs2 gene
The dominantly inherited Rrs2 gene (formerly called Rh2) was first mapped to the
distal part of the short arm of barley chromosome 7H by SCHWEIZER et al. (1995). The
RFLP marker CDO545 co-segregated with the resistance gene in a population of 85
doubled-haploid plants of a cross of the resistant cultivar Atlas (CI 4118) and Steffi.
Atlas is a 6-rowed American spring barley, which carries the Rrs2 gene, and Steffi, a
susceptible 2-rowed malting cultivar from Bavaria. SCHMIDT et al. (2001) established
a high-resolution genetic map of the Rrs2 region and could delimit the position of
Rrs2 between RFLP markers MWG2018 and MWG555a. The fine mapping of the
Rrs2 gene was continued by COSSU et al. (unpublished) with a larger F2-mapping
population of the cross Atlas × Steffi.
1.4.2 Establishment of a physical BAC contig for the Rrs2 locus
A high degree of microsynteny between rice chromosome Os6 and barley
chromosome 7HS has been observed (KILIAN et al., 1995). The Rrs2 resistance locus
is flanked by rice markers PSR119 and R2869 (SCHMIDT et al., 2001). PSR119
corresponds to rice gene LOC_Os06g01850.1 and R2869 to LOC_Os06g02144.1.
Both genes are located on rice chromosome 6 (TIGR rice genome sequence,
Release 5; Rice Genome Annotation Project at http://rice.plantbiology.msu.edu/
index.shtml). The region between the two loci spans roughly 164 kb in rice (Fig. 1.6).
The barley markers MWG555a (Acc. AJ234503) and MWG2018 (Acc. AJ234706)
flank the Rrs2 resistance gene more closely. However, in rice no orthologous
sequence for MWG555a exists and for MGW2018 a homologue (e-value: 6.4e-29) can
only be found on rice chromosome Os12.

INTRODUCTION 18
minimal riceBAC/PAC tiling path; accessionnumber
P0644B06
AP001129
PSR119
telomere centromere
MWG2018 (Acc. AJ234706 )
Rrs2 MWG555a (Acc. AJ234503)
R2869
P0029D06
AP001552
P0514G12
AP000616OSJNBa0004120
AP002805
164 kb in rice
LOC_Os06g01850.1 LOC_Os06g02144.1
minimal riceBAC/PAC tiling path; accessionnumber
P0644B06
AP001129
PSR119
telomere centromere
MWG2018 (Acc. AJ234706 )
Rrs2 MWG555a (Acc. AJ234503)
R2869
P0029D06
AP001552
P0514G12
AP000616OSJNBa0004120
AP002805
164 kb in rice
LOC_Os06g01850.1 LOC_Os06g02144.1
Rice data based on the TIGR rice genome sequence, Release 5, (http://rice.plantbiology.msu.edu/index.shtml).
COSSU et al. (unpublished) established two BAC contigs flanking the resistance gene
Rrs2. The initial barley BAC identification was facilitated by the sequence homology
to rice. Probes derived from a subclone library of rice BAC clone NB6P23, which
showed homology to rice PAC clone P0514G12 (Acc. AP000616), were chosen to
screen the BAC library of the barley cultivar Morex (referred to as ‘MO’ in this work,
YU et al., 2000). PAC clone P0514G12 lies in between the chromosomal location of
flanking markers PSR119 and R2869 on rice chromosome Os6 (Fig. 1.6).
1.4.2.1 Distal BAC contig
Barley BAC clone MO52C22 was identified by probe Xba6R corresponding to rice
gene LOC_Os06g01972.1 (nodulin-like protein) on PAC clone P0514G12. Morex
BAC library clones MO621J22 and MO793L23 were found using marker GBR0961
as a probe. This marker is based on barley EST clone Hw08F19 which is
homologous to the rice gene LOC_Os06g01990.1 (phosphoglycolate phosphatase).
It is located in the immediate vicinity of LOC_Os06g01972.1 (marker Xba6R) on PAC
clone P0514G12. All additional BAC clones (MO693M6, MO246B18, MO677J6) were
found using probes developed from sequence information of the already identified
BACs (Fig. 1.7).
BAC clones MO621J22, MO793L23 and MO693M6 were sequenced and assembled
to a contig of 232,809 bp by the company AGOWA (now LGC AGOWA, Berlin) with a
predicted error rate of 1 nucleotide in 100,000 bp. The complete sequence
information and annotation of the contig is available at GenBank Acc. AY853252. The
Fig. 1.6: Rrs2 region on barley chromosome 7HS with flanking markers and in blue the corresponding homologous region on rice chromosome Os6.

INTRODUCTION 19
annotation was performed by Thomas Wicker (Institute of Plant Biology, University of
Zürich, Switzerland).
Two BAC clones, MO667J6 and MO246B18, extended the fully sequenced contig
only by a few thousand base pairs. Other Morex BAC clones which significantly
extended the contig were not found. Therefore, BAC end sequences of the two BAC
clones were successfully used to screen a BAC library of the barley variety Cebada
Capa (referred to as ‘CC’ in this work, ISIDORE et al., 2005, Fig. 1.7). The screening
was performed by members of the group of Beat Keller (Institute of Plant Biology,
University of Zürich, Switzerland), who identified six positive BAC pools (CC2, CC40,
CC58, CC92, CC95 and CC122), which were further analysed by COSSU et al.
(unpublished). BAC pool CC2 was chosen for subcloning and sequencing. Sequence
data was assembled into 61 contigs.
rice PAC cloneP0514G12
Acc. AP000616
telomere
MO52C22 MO621J22
MO693M6
CC2
MO793L23
centromere
MO248B18
MO667J6
1 2
3
3
BAC libraries: Morex ‘MO’ (YU et al., 2000), Cebada Capa ‘CC’ (ISIDORE et al., 2005)
sequenced, one contig
sequenced, large contigs
200 sequences
1
2
3
LOC_Os06g01972.1 (nodulin-like protein), probe Xba6R
LOC_Os06g01990.1 (phosphoglycolate phosphatase)
marker GBR0961, EST clone Hw08F19
distal barleyBAC contig
Rrs2
rice PAC cloneP0514G12
Acc. AP000616
telomere
MO52C22 MO621J22
MO693M6
CC2
MO793L23
centromere
MO248B18
MO667J6
11 22
33
33
BAC libraries: Morex ‘MO’ (YU et al., 2000), Cebada Capa ‘CC’ (ISIDORE et al., 2005)
sequenced, one contig
sequenced, large contigs
200 sequences
11
22
33
LOC_Os06g01972.1 (nodulin-like protein), probe Xba6R
LOC_Os06g01990.1 (phosphoglycolate phosphatase)
marker GBR0961, EST clone Hw08F19
distal barleyBAC contig
Rrs2
The distal contig is flanking the Rrs2 gene at the telomeric side on barley chromosome 7HS. The corresponding homologous region on rice chromosome Os6 is depicted in blue (rice data based on the TIGR rice genome sequence, Release 5, http://rice.plantbiology.msu.edu/index.shtml). The available amount of sequence information is depicted as differently dashed lines. Different BAC libraries are indicated by different colors.
Fig. 1.7: Schematical representation of the establishment of the distal barley BAC contig by COSSU et al. (unpublished).
INTRODUCTION 20
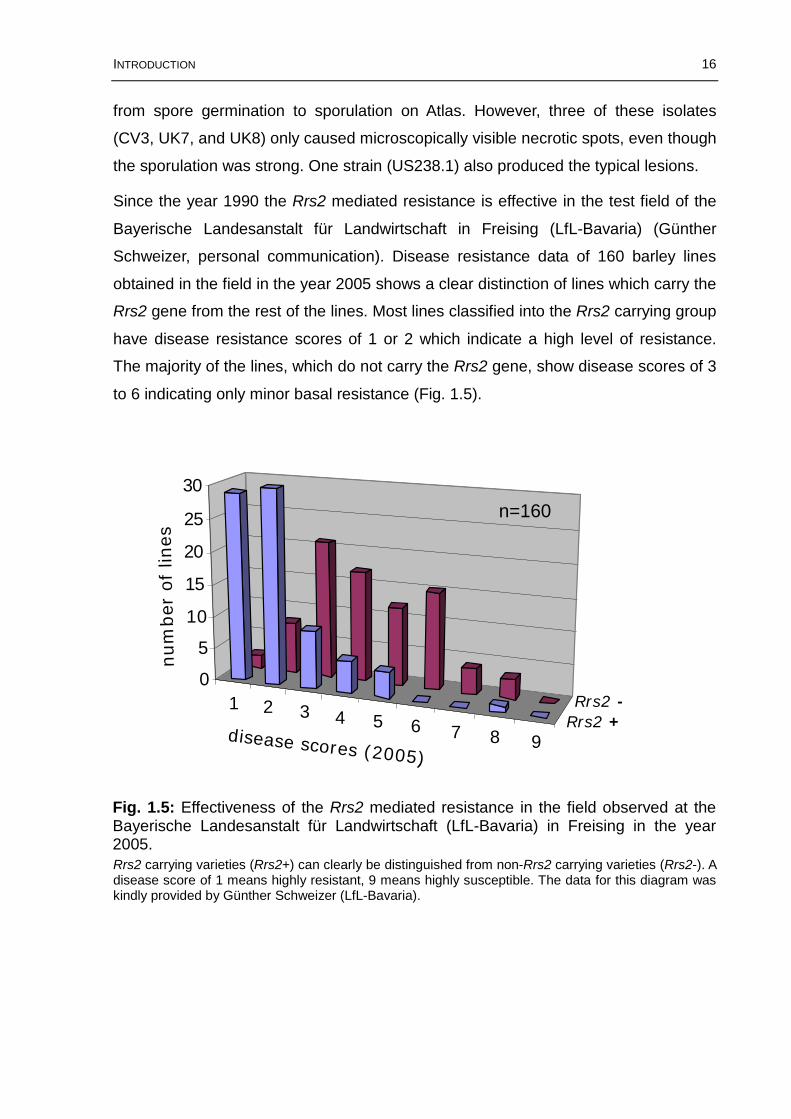
1.4.2.2 Proximal BAC contig
Similar to the distal BAC contig, the sequence homology to rice could be exploited for
constructing the proximal barley BAC contig. Rice BAC probe Pst1, which is highly
homologous to LOC_Os06g02028.1 (eyes absent homolog 4) of PAC clone
P0514G12 (Acc. AP00616) from rice chromosome 6, was employed to screen the
‘MO’ BAC library. Even though this probe shares only 62% sequence homology
(alignment with program SeqMan of software suit DNASTAR Lasergene) to barley it
could identify the two BAC clones MO246J13 and MO524N3 flanking the Rrs2 locus
on the centromeric side. BAC subclones of MO524N3 led to the identification of
MO288D11 (Fig. 1.8). Like for the distal BAC contig, the BAC library of Cebada Capa
‘CC’ was screened with primer combinations from the proximal contig by the group of
Beat Keller (Institute of Plant Biology, University of Zürich, Switzerland). However, no
matching Cebada Capa BAC clone could be identified.
rice PAC cloneP0514G12
Acc. AP000616
telomere
MO52C22 MO621J22
MO693M6
CC2
MO793L23
centromere
MO248B18
MO667J6
1 2
3
3
BAC libraries: Morex ‘MO’ (YU et al., 2000), Cebada Capa ‘CC’ (ISIDORE et al., 2005)
sequenced, one contig
sequenced, large contigs
200 sequences
MO246J13
MO524N3
MO288D11
MO134N7
1
2
3
LOC_Os06g01972.1 (nodulin-like protein), probe Xba6R
LOC_Os06g01990.1 (phosphoglycolate phosphatase)
marker GBR0961, EST clone Hw08F19
4 LOC_Os06g02028.1 (eyes absent homolog 4), probe Pst1
Rrs2
proximalbarleyBAC contig
sequenced, three large contigs due to two gaps
4
rice PAC cloneP0514G12
Acc. AP000616
telomere
MO52C22 MO621J22
MO693M6
CC2
MO793L23
centromere
MO248B18
MO667J6
11 22
33
33
BAC libraries: Morex ‘MO’ (YU et al., 2000), Cebada Capa ‘CC’ (ISIDORE et al., 2005)
sequenced, one contig
sequenced, large contigs
200 sequences200 sequences
MO246J13
MO524N3
MO288D11
MO134N7
1
2
3
LOC_Os06g01972.1 (nodulin-like protein), probe Xba6R
LOC_Os06g01990.1 (phosphoglycolate phosphatase)
marker GBR0961, EST clone Hw08F19
4 LOC_Os06g02028.1 (eyes absent homolog 4), probe Pst1
1
2
3
LOC_Os06g01972.1 (nodulin-like protein), probe Xba6R
LOC_Os06g01990.1 (phosphoglycolate phosphatase)
marker GBR0961, EST clone Hw08F19
4 LOC_Os06g02028.1 (eyes absent homolog 4), probe Pst1
Rrs2
proximalbarleyBAC contig
sequenced, three large contigs due to two gaps
44
The proximal contig is flanking the Rrs2 gene at the centromeric side on barley chromosome 7HS. Additionally to the distal barley BAC contig, the corresponding homologous region on rice chromosome Os6 (in blue) is depicted (rice data based on the TIGR rice genome sequence, Release 5, http://rice.plantbiology.msu.edu/index.shtml). The available amount of sequence information is depicted as differently dashed lines. Different BAC libraries are indicated by different colors.
Fig. 1.8: Schematical representation of the establishment of the proximal barley BAC contig by COSSU et al. (unpublished).

INTRODUCTION 21
BAC clones MO246J13, MO524N3, and MO288D11 were sequenced and assembled
by the company AGOWA (now LGC AGOWA, Berlin). However, there were two
regions in BAC clone MO246J13 which could not be resolved so that three smaller
contigs of BAC MO246J13 remained. Probe 246J13-A identified an additional BAC
clone named MO134N7 (Fig. 1.8) which was subcloned and partly sequenced at the
Leibniz Institute of Plant Genetics and Crop Plant Research (IPK). The 2,325
additional sequences were used together with all other available sequence data for a
new assembly of the proximal contig by Thomas Wicker (Institute of Plant Biology,
University of Zürich, Switzerland). This assembly resulted in a 238,212 bp long
contiguous sequence of BAC clones MO134N7, MO246J13, MO524N3 and
MO288D11, also with two unresolved gaps in the middle (Fig. 1.8). These gaps are
most likely caused by the LTRs of a retrotransposon (HORPIA) and should be
resolved by primer walking. Thomas Wicker annotated the sequence focusing mainly
on the repetitive sequences. He also identified three genes and two putative genes.
Some islands with no annotation remain which represent possible locations of further
genes (Fig. 1.9, annotation in supplementary Table A6).
Analysis of the shotgun sequence coverage revealed an extremely high coverage of
> 40 x for a distinct region at the distal end of the BAC contig (T. Wicker, personal
communication). This coverage is twice as high as would be the expected fluctuation
for an intended 10 x coverage of a sequence (Fig. 1.9). Most probably this is a result
of the pooling of all sequences for the assembly. Due to the fact that BAC clones
MO134N7 and MO246J13 possess an almost identical sequence, the coverage of
this region was therefore doubled.

INTRODUCTION 22
Repetitive elements that are inserted into other repetitive elements are raised to illustrate the nesting level. Some not-annotated islands remain where genes potentially could be located. Red arrows indicate the positions of gaps in the sequence. Shotgun coverage at the distal end of the contig is represented. Diagram source: Thomas Wicker (University of Zürich).
Fig. 1.9: Graphical representation of the annotation of the proximal BAC contig MO134N7_MO246J13_MO524N3_MO288D11 performed by Thomas Wicker (University of Zürich).

INTRODUCTION 23
1.5 Aim of the present work
Scald is one of the most important barley diseases in the temperate regions of the
world (BEER, 1991). So far four major resistance loci of barley are known to confer
resistance to almost all isolates of the fungus (BJØRNSTAD et al., 2002; Günther
Schweizer, personal communication). One of these loci is the Rrs2 locus on barley
chromosome 7HS (SCHWEIZER et al., 1995; SCHMIDT et al., 2001). The Rrs2 mediated
resistance against scald in barley has been shown to be very effective in the field
over the past years, but up to now has rarely been incorporated into commercially
important barley varieties (G. Schweizer, personal communication). The development
of diagnostic molecular markers for Rrs2 or even the identification of the resistance
gene Rrs2 would substantially facilitate the breeding efforts for resistant barley
cultivars.
The main aims of the present work were: 1) the continued fine mapping of the Rrs2
region; 2) the continued chromosome walking for enriching the region with sequence
information; 3) the investigation of the syntenous relationships of the Rrs2 region with
rice and Brachypodium; 4) the development of diagnostic markers for Rrs2 and
possibly the cloning of the resistance gene.

MATERIAL AND METHODS 24
2 Material and Methods
2.1 Establishment of the F2-mapping population
The F2-mapping population used in this work is derived from a cross between the
varieties Atlas and Steffi. Atlas (CI 4118) is a 6-rowed American spring barley variety
carrying the resistance gene Rrs2 (SCHWEIZER et al., 1995). Steffi is a 2-rowed
Bavarian spring barley variety (Saatzucht Ackermann, Irlbach) which is susceptible to
Rhynchosporium secalis (Oudem.) J.J. Davis.
The establishment of the mapping population is summarized in Fig. 2.1. The
F1-generation of the cross Atlas × Steffi was selfed and the F2-plants were analyzed
with markers flanking the Rrs2 resistance gene. Those plants in which a
recombination event had occurred between the flanking markers were identified. The
recombinant F2-lines were selfed and several single seed descendant lines of the
F3-generation were genotyped in order to identify those lines where the
recombination event was present in the homozygous state. These plants were selfed
again and single seed descendant F4-plants underwent phenotyping for disease
resistance.
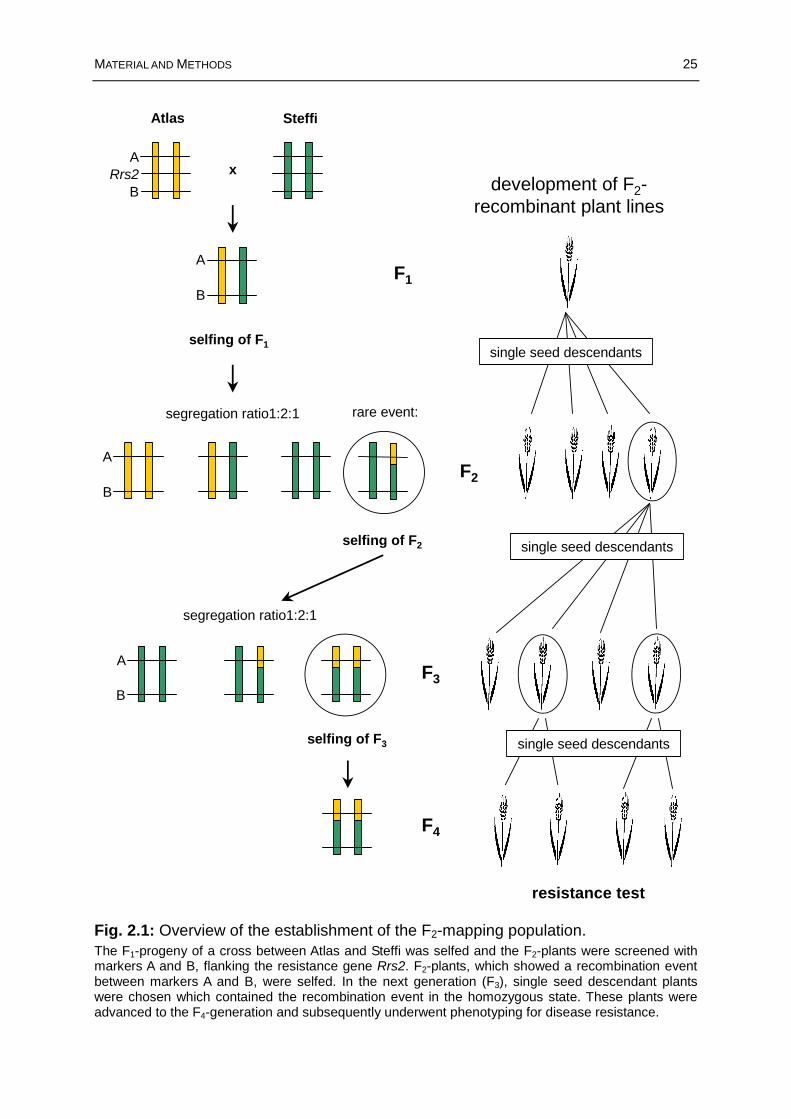
MATERIAL AND METHODS 25
Steffi
x
Atlas
ARrs2
B
B
selfing of F1
selfing of F2
resistance test
F3
A
B
F2
selfing of F3
F1
F4
single seed descendants
single seed descendants
segregation ratio1:2:1
B
A
A
rare event:
development of F2-recombinant plant lines
segregation ratio1:2:1
single seed descendants
The F1-progeny of a cross between Atlas and Steffi was selfed and the F2-plants were screened with markers A and B, flanking the resistance gene Rrs2. F2-plants, which showed a recombination event between markers A and B, were selfed. In the next generation (F3), single seed descendant plants were chosen which contained the recombination event in the homozygous state. These plants were advanced to the F4-generation and subsequently underwent phenotyping for disease resistance.
Fig. 2.1: Overview of the establishment of the F2-mapping population.

MATERIAL AND METHODS 26
2.2 Scald resistance test
The scald resistance test was performed by the lab of Günther Schweizer
(Bayerische Landesanstalt für Landwirtschaft (LfL-Bavaria), Freising-
Weihenstephan). For each recombinant plant line four seedlings were tested,
preferentially in two replicates, depending on the availability of sufficient seeds. In
total, three resistance tests with plants in the F4-generation or higher were performed.
Inoculation of Rhynchosporium secalis was carried out according to SCHWEIZER et al.
(1995) with some modifications. Spores of the single spore isolate “Sachs 271”
(collected at Straßmoos, Bavaria, Germany) were scraped into sterile water from 20-
day-old cultures grown on lima bean agar (Difco Laboratories, now BD, Heidelberg,
Germany) at 18°C. The spore suspension was filtered through muslin and diluted to
concentrations of 2 x 10⁵ spores/ml. Seedlings at the 2- to 3-leaf stage were sprayed
uniformly with inoculum (approximately 0.25 ml per plant) and left for 20 min to dry.
Inoculated plants were then lightly sprayed with water and kept for 48 h in a dark
moist chamber at 18°C. Symptoms developed after 14 days and plants were scored
on a scale from 0 to 4 according to JACKSON and WEBSTER (1976). The parents Atlas
(resistant) and Steffi (susceptible) were used as reference cultivars.
2.3 Physical map establishment
2.3.1 BAC libraries and BAC library screening
For the establishment of the physical map, mainly the BAC library of barley cultivar
Morex (YU et al., 2000) was used. This library is constructed by partial digestion with
the enzyme HindIII and with the cloning vector pBeloBAC11, which carries a
chloramphenicol resistance. The BAC library consists of 313,344 clones with an
average insert size of 106 kb and represents 6.3 haploid genome equivalents of
barley. All BAC clones originating from this library are designated ‘MO’ in this work.
For screening the Morex BAC library, DNA pools of the clones were used. In these
pools the DNA of BAC library plates is pooled in so called superpools which each
contains the DNA of 10 BAC library plate pools (Fig. 2.2). The BAC library is
represented by a total of 82 DNA superpools arranged on a single 96-well PCR plate.
Positive BAC clone addresses were identified as follows. After having detected a

MATERIAL AND METHODS 27
positive superpool by PCR, the corresponding plate DNA pools were analyzed (also
by PCR). Upon identification of the positive plate pool, pooled DNA of each row and
of each column for the positive plate was extracted. In the subsequent PCR step only
one column pool and one row pool would give an amplification signal corresponding
to the BAC clone address of interest.
1 2 3 4 5 6 7 8 9 10 11 12 13 14 15 16 17 18 19 20 21 22 23 24
A
B
C
D
E
F
G
H
I
J
K
L
M
N
O
P
1 2 3 4 5 6 7 8 9 10 11 12 13 14 15 16 17 18 19 20 21 22 23 24
A
B
C
D
E
F
G
H
I
J
K
L
M
N
O
P
BAC library plate 12 pooled DNA of BAC clones ofplate 12 = plate pool 12
pooled DNA of 10 BAC library plates(plates 11-20) = superpool 2
2 3 4 5 6 7 8 9 101 11 12
A
B
C
D
E
F
G
H
2 3 4 5 6 7 8 9 101 11 12
A
B
C
D
E
F
G
H
PCR plate with 82 superpools of 816 plate pools
DNA of each plate of the BAC library was pooled into plate pools. For the ‘MO’ Morex BAC library 816 plate pools exist. DNA of 10 plate pools was pooled into superpools. This results in 82 DNA superpools which were distributed on a 96-well plate for convenient screening of the BAC library by PCR.
Additionally, the BAC library of barley cultivar Cebada Capa described in ISIDORE et
al. (2005), screened by the group of Beat Keller (Institute of Plant Biology, University
of Zürich), was used for the establishment of the physical map of the Rrs2 region.
This BAC library is referred to as ‘CC’ in this work.
Two unpublished BAC libraries of cultivar Morex (obtained by IPK group Genome
Diversity in frame of project “Pakt für Forschung”) were also useful for the physical
map construction (SCHULTE et al., 2009). One of them is created by partial digestion
with HindIII and cloned with the pIndigoBAC-5 vector. It is designated ‘MH’ in this
work. The third Morex BAC library, called ‘ME’, is constructed using the pIndigoBAC-
536 vector and was partially digested with EcoRI. The screening of these libraries
was carried out in frame of the project “Pakt für Forschung” by Daniela Schulte at the
Genome Diversity goup of the IPK.
Fig. 2.2: Schematic representation of the allocation of BAC clone DNA into pools for the Morex BAC library using BAC library plate 12 as example.

MATERIAL AND METHODS 28
2.3.2 BAC clone fingerprinting
For estimating the overlap of two BAC clones, a fingerprinting was undertaken.
Therefore 1 µg of BAC DNA was digested with HindIII and EcoRV and the digestion
products were separated on a 1% 1 x TAE agarose gel. Gel bands were visualized
under UV light and images were captured by an INTAS gel documentation system
(Intas Science Imaging Instruments, Göttingen, Germany).
Additionally, the high information content fingerprinting (HICF) technique, developed
by LUO et al. (2003) was used for fingerprinting, contig building and identification of
novel BAC clones. The whole procedure was performed by the lab of Nils Stein
(group Genome Diversity, IKP) under supervision of Daniela Schulte. Analysis of the
fingerprints and contig assembly was performed with the FPC software, version 8.5
(SODERLUND et al., 2000).
2.3.3 Subcloning of BAC clones
For subcloning of the BAC clone inserts, 8 µg of isolated BAC DNA was dissolved in
a total volume of 100 µl ddH2O and physically sheared in a Hydroshear® machine
(Digilab Genomic Solutions, Ann Arbor, MI, USA). For obtaining 1-2 kb large DNA
fragments the settings were as follows: 25 cycles and speed 3. The fragment end
repair with Klenow polymerase (Promega GmbH, Mannheim, Germany) was carried
out according to the supplier’s manual. DNA fragments between 1-2 kb were purified
from agarose gel with QIAquick® Gel Extraction Kit (QIAGEN, Hilden, Germany),
ligated into pBlueskript SK- vector (Stratagene, now Agilent Technologies,
Waldbronn, Germany) and transformed into XL1-Blue Supercompetent Cells
(Stratagene). Successful ligations were identified by blue-white screening on LB agar
plates containing 100 µg/ml ampicillin, 20 mM IPTG for inducing the Lac operon and
80 µg/ml of X-gal substrate. White colonies were picked by hand and grown in LB
media containing ampicillin.

MATERIAL AND METHODS 29
2.4 Nucleic acid isolation and quantification
2.4.1 Genomic DNA
Smaller amounts of genomic DNA were extracted using the CTAB method (DOYLE
and DOYLE, 1990) with modifications based on RIESEBERG et al. (1993). For this
procedure leaf material of 8-10 days old plants was harvested. Preferentially, the
second or third newly emerged leafs were cut and transferred to 2 ml Eppendorf
tubes. Leaf material was ground using a Schwingmühle MM300 (RETSCH, Haan,
Germany) with the frequency setting of 25/s repeated twice for 30 s. Extracted DNA
was dissolved in 1 x TE buffer (pH 7.5-8.0).
For larger DNA amounts, a modified protocol of the sodium bisulfite isolation method
described in PLASCHKE et al. (1995) was used. Leaf material was obtained from
young seedlings grown for 14-18 days. Newly emerged leafs and younger parts of
older leafs were cut from 5-10 plants of the same accession or plant line and bulked
into one sample.
DNA quantification was carried out on 0.8% agarose gels by comparing the intensity
of DNA bands with the GeneRulerTM 1 kb Ladder Plus (Fermentas, St. Leon-Rot,
Germany) marker. In parallel, a spectrophotometric DNA quantification was
performed using the GeneQuant II RNA/DNA calculator (Pharmacia Biotech, now
belonging to GE Healthcare, Munich, Germany). DNA was diluted with ddH2O
according to requirements.
2.4.2 Plasmid DNA
For isolating DNA from BAC clones or BAC subclones a single bacterial colony was
grown for 16 h in LB media containing chloramphenicol (12.5 µg/ml) at 37°C under
vigorous shaking (250 rpm). The following DNA isolation method for plasmids from
5 ml bacterial cultures was used. After centrifuging the bacterial culture for 15 min at
3,000 rpm and discarding the supernatant, 400 µl of 4°C cold resuspension buffer P1
(QIAGEN, Hilden, Germany) was added to the bacteria pellet and mixed well. Then,
400 µl of lysis buffer P2 (QIAGEN) was added and the mixture shaken gently. After
an incubation time of 5 min, 400 µl of 4°C cold neutralization buffer P3 (QIAGEN)
was added. Following a gently mixing and incubation on ice for another 10 min the
sample was centrifuged for 10 min at 3,000 rpm. The supernatant was transferred to
a new 1.5 ml tube and centrifuged another time in order to obtain a clearer

MATERIAL AND METHODS 30
supernatant at 13,000 rpm for 10 min. Afterwards, 900 µl of the clear supernatant
was carefully mixed with 630 µl isopropanol and centrifuged at 13,000 rpm for 30 min
to precipitate and pellet the plasmid DNA. The DNA pellet was washed with 70%
ethanol, dried at room temperature and resuspended in 30 µl 1 x TE buffer (pH 8.0).
Plasmid DNA extractions from 500 ml cultures were carried out using the QIAGEN®
Plasmid Maxi Kit (QIAGEN) according to the instruction manual of the manufacturer.
BAC DNA used for subcloning was extracted with the QIAGEN® Large Construct Kit
(QIAGEN) following the user manual instructions.
Plasmid DNA quantification was performed as described in chapter 2.4.1 for genomic
DNA.
2.4.3 RNA
For RNA extraction leafs of 8 day old plants were harvested under RNase free
conditions. Therefore all tools and surface areas were treated with RNaseZap®
solution (Applied Biosystems/Ambion, Austin,TX, USA) prior to use and RNase free
collection tubes were used. Around 100 mg of leaf material from newly emerged leafs
were cut and immediately frozen in liquid nitrogen. Leaf material was ground in a
mortar under RNase free conditions in liquid nitrogen and transferred to RNase free
collection tubes.
All following steps of RNA isolation were carried out using the RNeasy® Plant Mini Kit
(QIAGEN, Hilden, Germany) with an on-column DNase digestion using the RNase-
Free DNase Set (QIAGEN). All steps were performed according to the indications of
the instructions manual.
RNA quality control and quantification were carried out in a 2100 Bioanalyzer (Agilent
Technologies, Böblingen, Germany) using the RNA 6000 Pico LabChip.
2.5 PCR and RT-PCR
PCR primers were designed using the software Primer3 (v. 0.4.0) (ROZEN and
SKALETSKY 2000; available on http://frodo.wi.mit.edu/). PCR amplifications were
performed in 25 to 50 µl reactions containing between 50 and 100 ng of template
DNA, 10 x PCR buffer (0.01 M Tris, 0.05 M KCl, 1.5 mM MgCl2, 0.01% gelatine),
0.2 mM of each dNTP, 0.4 µM of each primer and 1 U of Taq DNA polymerase. PCR
MATERIAL AND METHODS 31
reactions were carried out in a LabCycler (SensoQuest GmbH, Göttingen, Germany)
thermal cycler. After an initial denaturation at 95% for 5 min, 45 cycles were
performed at 95° for 45 s followed by annealing at appropriate temperatures (55-
60°C) for 45 s, and extension at 72°C for 1 min prior to a final extension step at 72°C
for 7 min.
For expression analysis a two step RT-PCR protocol was performed. The first step
consisted of the first strand cDNA synthesis from mRNA using oligo-dT primers and
the Omniscript® Reverse Transcription Kit (QIAGEN, Hilden, Germany). The
procedure was carried out according to the instructions of the manufacturer. As
second step a general PCR reaction (described above) followed.
2.5.1 Analysis of PCR products
PCR amplification results were assayed by electrophoresis in 1 x TAE buffer (pH 8.0)
on 1.5 to 2.5% agarose gels, depending on the expected amplicon size. The
GeneRulerTM 1 kb Ladder Plus (Fermentas, St. Leon-Rot, Germany) was used as
DNA size standard. Gel bands were visualized under UV light and images were
captured by an INTAS gel documentation system (Intas Science Imaging
Instruments, Göttingen, Germany).
PCR products amplified with a primer labelled with the fluorescent dye Cy-5, were
analysed with the electrophoresis and detection system ALFexpress®II DNA Analyser
(Amersham Biosciences, now GE Healthcare, Munich, Germany). The analysis was
performed on denaturing 6% poylacrylamid gels (ReproGelTM, Amersham
Biosciences) in short gel cassettes. The fragment size calculation was performed by
using internal size standards and the program ALFwin Fragment Analyser v1.02
(Amersham Biosciences).
2.6 DNA sequencing
PCR products were purified using the NucleoFast 96 PCR ultrafiltration kit
(MACHEREY-NAGEL GmbH & Co. KG, Düren, Germany) and 5 µl of purified product
(approx. 10 ng/100 bp) was mixed with 1 µl of primer solution (10 mM). This served
as template for the preparation of the sequencing reaction. All PCR products were
sequenced from the 5’ and 3’ ends. For BAC end sequencing 1 µg BAC DNA was
MATERIAL AND METHODS 32
used. Prior to sequencing, BAC subclones underwent TempliPhiTM template
preparation. Preparation of the sequencing reactions and sequencing itself was
performed as a service by the IPK PGRC sequencing facility. Sequencing reactions
were run on an ABI PRISM® 3730 XL DNA Analyzer system (Applied Biosystems,
Darmstadt, Germany).
2.7 Sequence analysis and database mining
2.7.1 In-silico sequence analysis
Sequence alignments and manipulations of nucleotide sequences were performed
with the programs Sequencher version 4.5 (Gene Codes Corporation, Ann Arbor,
MI, USA) and with the software suit DNASTAR (Madison, WI, USA) Lasergene
version 7 using the SeqMan and EditSeq modules. Spliced sequence alignments
were generated with the Splign program (KAPUSTIN et al., 2008) available on
http://www.ncbi.nlm.nih.gov/sutils/splign/splign.cgi.
Homologous sequences were identified using BLAST tools (ALTSCHUL et al., 1990)
from the NCBI server (http://blast.ncbi.nlm.nih.gov/Blast.cgi) under default parameter
settings.
2.7.2 Sequence annotation
For sequence annotation the sequences of interest were submitted to the Rice
Genome Automated Annotation System (http://ricegaas.dna.affrc.go.jp/; SAKATA et al.,
2002), also called RiceGAAS. This service automatically runs different programs for
gene prediction and analysis of protein-coding regions and presents the results on a
web interface.
Parallel to this, the presence of transposable elements (TEs) was checked by BLAST
searches in the following databases: TREP, the Triticeae Repeat Sequence
Database (http://wheat.pw.usda.gov/ITMI/Repeats/) using the BLASTN algorithm
searching in data set “cereal repeat sequences, complete set” and TIGR Plant
Repeat Database (http://blast.jcvi.org/euk-blast/index.cgi?project=plant.repeats)
using the BLASTN algorithm searching in data set “TIGR Gramineae Repeats”.
Repeated or inverted patterns in sequences were visualized in a dot plot matrix
generated by the program JDotter (SONNHAMMER and DURBIN, 1995).

MATERIAL AND METHODS 33
In following steps, sequence stretches that were not identified to contain a TE and all
predicted genes by RICE GAAS were checked in detail by BLAST searches in
various databases in order to identify homologies to ESTs, EST clusters or known
genes. BLASTN searches in the data set “est_others” of the NCBI server
(http://blast.ncbi.nlm.nih.gov/Blast.cgi) yielded single EST hits. Searches performed
in the DFCI Barley Gene Index (HvGI) database (http://compbio.dfci.harvard.edu/tgi/
cgi-bin/tgi/gimain.pl?gudb=barley) and the HarvEST: Barley (Assembly 35) version
1.68 database (http://harvest.ucr.edu) yielded hits to previously computed, mostly
annotated, and evaluated EST clusters or unigenes. All hits with an e-value of e-5 or
lower were considered significant.
Two gene prediction programs were used for predicting coding sequences: the
Eukaryotic GeneMark.hmm (LOMSADZE et al., 2005; http://exon.gatech.edu/
genemark), run with the H. vulgare model, and GENSCAN (BURGE and KARLIN, 1997;
http://genes.mit.edu/GENSCAN.html), run with the maize model.
Homologous sequences of rice were identified using the Rice Genome Annotation
Project BLAST search (http://rice.plantbiology.msu.edu/blast.shtml). All results are
based on Release 5 of the rice genome. Synteny studies with Brachypodium
distachyon (L.) Beauv. were performed using the BrachyBase BLAST tool
(http://blast.brachybase.org/) based on the 4x Brachypodium draft sequence.
2.8 Molecular marker development
2.8.1 CAPS markers
Nucelotide sequences derived from PCR amplification of genomic DNA of Atlas and
Steffi were aligned with the program Sequencher (see 2.7.1). The multiple
alignments were analyzed for presence of restriction sites at SNP positions with the
program SNP2CAPS (THIEL et al., 2004). In case a SNP was located in a restriction
site of a restriction enzyme, Cleaved Amplified Polymorphic Sequence (CAPS)
markers were developed. Restriction digestions of PCR products were carried out in
a 25 µl volume using 7 µl of PCR product, 3 U of the respective restriction
endonuclease (Fermentas, St. Leon-Rot, Germany) and an incubation time of
minimum 3 hours. The restricted fragments were separated on 2.5 to 3% 1 x TAE
agarose gels.

MATERIAL AND METHODS 34
2.8.2 Pyrosequencing markers
As for the CAPS marker development, nucelotide sequences obtained by PCR
amplification with genomic DNA of Atlas and Steffi were aligned with the program
Sequencher (see 2.7.1) and SNPs between the two varieties were identified.
Pyrosequencing primers were developed using the Assay Design Software, version
1.0.6 (Biotage AB, Uppsala, Sweden). After PCR with genomic DNA, pyrosequencing
was carried out according to the manufacturer’s standard protocol with Pyro Gold
Reagents (Biotage AB) on a Pyrosequencer PSQTM 96HS96A 1.2 machine (Biotage
AB). The detected SNPs were analyzed with the manufacturer’s software.
2.9 Association Study
According to literature data and personal communications, a set of 58 different barley
accessions was chosen based on their reported resistance phenotype and genotype.
Seeds of the accessions were obtained from different sources (Genebank
Gatersleben, Australian Winter Cereals Collection, and BBSCR Cereals Collection of
the John Innes Centre). DNA samples of various accessions originated from Günther
Schweizer of the Bayerische Landesanstalt für Landwirtschaft, Freising-
Weihenstephan (LfL-Bavaria). Some accessions were acquired from two genebanks
resulting in a redundant set of 72 accessions which were analyzed in the association
study. To obtain phenotypic information of the different accessions, all accessions
underwent a resistance test (see chapter 2.2) at the lab of Günther Schweizer (LfL-
Bavaria). A list of all varieties used for the association study including literature
information about their resistance can be found in supplementary Table A1. The
source from where each accession was obtained and its performance in the
resistance test is listed in supplementary Table A2.
Genotypic data was obtained by sequencing six PCR fragments which were amplified
from each accession at minimum two times in independent reactions. The PCR
fragments are located within or near the co-segregating region of Rrs2 on barley
chromosome 7HS (Fig. 2.3). PCR fragment RGH-3 is located within the second exon
of the HvRGH-3 gene of the distal BAC contig (GenBank Acc. AY853252).
Put_acri_res_gene_7H represents a region of a putative acriflavin resistance gene
which was predicted by RiceGAAS (http://ricegaas.dna.affrc.go.jp/) between

MATERIAL AND METHODS 35
bp positions 156,429 and 157,893 of the distal BAC contig. PCR fragment FST-2 is
located within the coding sequence of the HvFST-2 gene of the distal BAC contig
(GenBank Acc. AY853252). PCR fragments 668A17_g1-3 and 668A17_e11-2 are
based on subclone sequences of BAC MO668A17 and were chosen for the
association study due to their single copy nature. PCR fragment 134N7_con5-3
originated from a region that shows high homology to HvGI tentative consensus
sequence TC184695 which is annotated as “similar to UniRef100_A4BAY3 Cluster:
high-affinity zinc uptake system membrane protein ZnuB”.
Associations were calculated assuming the general linear model (GLM) using the
software package TASSEL version 2.0.1 (BRADBURY et al., 2007;
http://www.maizegenetics.net). The calculations were performed for each PCR
fragment separately using either the SNP data or haplotype data. Phenotypic data
was divided into four groups (resistant, Rrs2, susceptible, intermediate) which were
represented by numerical values for the association calculations.
MO668A17
MO246J13
134N7_con5-3
centromere
MO693M6
CC2
MO348I22
MH68J02
RGH-3
Put_acri_res_gene_7H 668A17_e11-2
668A17_g1-3FST-2
possible location of Rrs2 resistance gene
ME194H14
BAC libraries: Morex ‘MO’ (YU et al., 2000), Cebada Capa ‘CC’ (ISIDORE et al., 2005), Morex new ‘MH’ (pIndigoBAC-5, HindIII, unpublished), Morex new ‘ME’ (pIndigoBAC536, EcoRI, unpublished)
28.9 kb 45 kb approx. 80 to 100 kb between5 to 50 kb
unknown distance
MO668A17
MO246J13
134N7_con5-3
centromerecentromere
MO693M6
CC2
MO348I22
MH68J02
RGH-3
Put_acri_res_gene_7H 668A17_e11-2
668A17_g1-3FST-2
possible location of Rrs2 resistance gene
ME194H14
BAC libraries: Morex ‘MO’ (YU et al., 2000), Cebada Capa ‘CC’ (ISIDORE et al., 2005), Morex new ‘MH’ (pIndigoBAC-5, HindIII, unpublished), Morex new ‘ME’ (pIndigoBAC536, EcoRI, unpublished)
28.9 kb 45 kb approx. 80 to 100 kb between5 to 50 kb
unknown distance
If known, the distance between the PCR fragments is given. Barley BAC clones are indicated as horizontal lines, clones originating from different BAC libraries are represented in different colors. The corresponding names of BAC clones are shown on the right side of the clones. The green area indicates the co-segregating region, the striped green area denotes the region in which the border of the Rrs2 co-segregating region is located. The exact position of the border is not known.
Fig. 2.3: Section of the physical map of the Rrs2 locus on barley chromosome 7HS depicting the name and location of six PCR fragments analyzed in the association study.
MATERIAL AND METHODS 36
2.9.1 Linkage disequilibrium
Linkage disequilibrium between all SNPs of all PCR fragments and the Rrs2 gene
was analyzed with the program TASSEL by estimating the squared allele-frequency
correlations (r2).
2.9.2 Cluster Analysis
For performing the cluster analysis the program MEGA version 4 (TAMURA et al.,
2007) was employed. The cladogram was calculated using the neighbor-joining
method with the maximum composite likelihood model based on the total SNP set of
all six analyzed PCR fragments. Bootstrapping was carried out with 800 repetitions
and random seed was set to 64,238.

RESULTS 37
3 Results
3.1 Fine Mapping of the Rrs2 gene
A F2-mapping population derived from a cross of the barley varieties Atlas (resistant,
carries Rrs2) x Steffi (susceptible) was established for fine mapping the Rrs2 gene.
The number of F2-plants screened for recombination events was gradually increased
to a total number of 9179 plants (18358 gametes).
Initially, SCHMIDT et al. (2001) performed a recombinant screen for the chromosomal
region between RFLP markers MWG555a and PSR119 in 741 F2-plants (1482
gametes) which resulted in 20 recombinants. COSSU et al. (unpublished) increased
the number of F2-plants in a second screening effort by 1824 (3648 gametes) and
was able to identify four recombination events between the STS marker AFLP14
(synonym: Atlas14) and the RFLP marker 288D11-R1. In a third screening, COSSU et
al. (unpublished) analyzed 2155 (4310 gametes) F2-plants and found 11 additional
recombination events for the marker interval AFLP14 – P1D23R. Due to a lack of
recombination events in the vicinity of the Rrs2 gene, the mapping population was
increased a fourth time by 4458 F2-plants (8916 gametes). The screening of those
plants for recombination events was performed in the presented work. Twenty two
recombinants were found for the marker interval AFLP14 – P1D23R in this sub-
population. In total, 41 recombination events were identified in the accumulated
mapping population of 9179 plants between markers AFLP14 and P1D23R which
corresponds to a genetic distance of 0.22 cM for this interval (Table 3.1, Fig. 3.1).
Based on the results of KÜNZEL et al. (2000) that 1 cM corresponds to 1 – 4.4 Mb at
the telomeric end of 7HS, the expected physical distance for this interval varies
between 220 and 968 kb. Correspondingly, the average expected distance between
recombinants is between 5 and 22 kb (Table 3.2).
All recombinants were advanced to homozygosity by selfing and were subsequently
fine mapped with markers located within the marker interval AFLP14 – P1D23R (Fig.
3.1; supplementary Table A4). The pyrosequencing marker A-EST_2_SNP showed
contradictory results for recombinant plant lines 4779 and 5271 which had previously
been identified in the third screening. These two recombinant lines were especially
interesting since they showed a recombination between the Rrs2 gene and the next
closest markers (693M6-71, 693M6-R, 677J6-R, and 246B18_RKP1). For

RESULTS 38
clarification, five different genomic fragments in the vicinity of marker A-EST_2_SNP
were sequenced. Sequence information was obtained from both doubtful
recombinant lines and six additional lines which served as control. The questionable
lines had a completely different SNP pattern than Atlas, Steffi and the control plants
(supplementary Table A3). This can only be explained by an outcrossing event which
must have occurred during previous propagation of the plants. Hence, the lines were
eliminated from the genetic map which led to the co-segregation of above mentioned
markers. As a result, the Rrs2 gene was positioned between markers
Put_acri_res_gene_7H / 693M6_6 on the distal side and P1D23R on the proximal
side (Fig. 3.1). The genetic distance of the interval is 0.08 cM. All nine markers
mapping within this interval co-segregate with the resistance gene Rrs2 (markers
693M6-71, 693M6-R, 677J6-R, 246B18_RPK1, CC2_59-10, 668A17_g1-3,
668A17_e11-2, A-EST_2_SNP, and BE194942U1/L1) as shown in Fig. 3.1.
The phenotyping for Rrs2 resistance of the recombinant plants was performed in the
F4-generation and repeated in all further generations. The resistance test (chapter
2.2) was carried out in the lab of Günther Schweizer (Bayerische Landesanstalt für
Landwirtschaft, Freising-Weihenstephan).
Susceptibility is relatively easy to recognize and to score, but the expression of the
resistance phenotype is not always that obvious. For some plant lines more moderate
resistance reactions were observed compared to Atlas. The expression of these
moderate reactions could vary among single seed descendants of the same line or
between two independent resistance tests performed at two different time points
(Günther Schweizer, personal communication). Nevertheless, the ranking between
different plant lines remained the same among independent resistance tests.
Therefore, the results can be regarded as reproducible. For 52 homozygous
recombinant plant lines clear results of the resistance tests were obtained. For three
recombinant plant lines (6362, 6672, and 10439) the results of the resistance test
were inconclusive after two and, in case of 10439, four independent resistance tests.
For that reason, their resistance phenotype was designated as unclear. Two
additional recombinant plant lines (568 and 8342) were scored to be resistant in all
performed resistance tests, but according to marker data, these lines were expected
to be susceptible. They either carry a double recombination, or other factors in the
genetic background may have led to the resistant reaction (Fig. 3.1; supplementary
Table A4).

RESULTS 39
Table 3.1: Summary of the different screening steps for establishment of the Rrs2mapping population
interval PSR119 – MWG555a AFLP14 – P1D23R
total number plants 741 7411st screeningplant numbers from 1 to 1999
no. of recombinants 20 4
interval AFLP14 – 288D11-R1
total number plants 18252nd screeningplant numbers from 2000 to 3999 no. of recombinants 4
interval AFLP14 – P1D23R
total number plants 21553rd screeningplant numbers from 4000 to 6999 no. of recombinants 11
interval AFLP14 – P1D23R
total number plants 44584th screeningplant numbers from 7000 to 11458 no. of recombinants 22
plant numbers interval PSR119 – MWG555a AFLP14 – P1D23R
total from 1 to total number plants 741 917911458 no. of recombinants 20 41
Table 3.2: Overview of genetic distances and expected physical distances achieved with the mapping population
marker interval
number of gametes
number of F2-recombinant plants
average resolution (genetic distance per recombinant plant) [cM]
genetic distance of marker intervall [cM]
expected physical distance for marker interval3)
[Mb]
expected physical distance between recombinants3)
[kb]
PSR119 -MWG555a1)
1482 20 0.068 1.35 1.35 – 5.94 68 – 299.2
AFLP14 -P1D23R2)
18358 41 0.005 0.22 0.22 – 0.97 5 – 22
1) first screening 2) summary of all screenings 3) 1-4.4 Mb/cM (KÜNZEL et al., 2000)

RESULTS 40
telomere
centromere
PSR119
52C22-D6
AFLP14 (synonym: Atlas14)
1508 r 1718 s
170 r 568 r? 2394 r 2612 s 2643 r 4385 s 4768 s 5742 s 6307 s 6328 s 6362 ~ 6416 s 6672 ~
677J6-R; 246B18_RPK1; BE194942U1/L1
1693 r 2489 r 6564 s 7171 r 7329 s 7344 r 7590 s 9787 s
P1D23R
444 r 4723 s 6745 r 7132 r 7162 s 9300 s 10058 s
MWG555a
267 r 288 s 452 r 1186 r 1230 r 1378 s 1572 s 1615 s 1621 s
693M6-71; 693M6-R; 668A17_g1-3; 668A17_e11-2; A-EST_2_SNP
Rrs2 CC2_59-10 (EcoRV)
RFLP
SNP
CAPS
STS derivedfrom AFLP
289 s 401 r 871 s 1077 r
7499 r 7774 s 8001 s 8342 r? 8346 r 8493 s 8768 s 8846 s 9259 r 9662 r
10439 ~ 10823 r 11141 r
Put_acri_res_gene; 693M6_6
288D11_R1
1482 s
4/1482 (0.26 cM)
2/1482 (0.13 cM)
26/18358 (0.14 cM)
8/18358 (0.043 cM)
7/18358 (0.038 cM)
9/1482 (0.60 cM)
41/18358 (0.22 cM)
1/5132 (0.02 cM)
All markers used for fine mapping the Rrs2 locus are indicated in genetic order. The marker types are represented by differently dashed frames. Recombinant plant lines are listed on the right side between the markers where the recombination events took place. Additionally, number of recombination events in relation to all investigated gametes and genetic distances between markers are given on the left side. Resistance phenotype is indicated as r = resistant, s = susceptible, ? = resistance phenotype does not fit into genetic map, ~ = resistance phenotype unclear.
Fig. 3.1: Genetic map of the Rrs2 region on chromosome 7HS.

RESULTS 41
3.2 Continued establishment of a physical BAC contig for the Rrs2 region
3.2.1 Distal BAC contig
A BAC contig of 232,809 bp length (GenBank Acc. AY853252) had previously been
established by COSSU et al. (unpublished) using a BAC library of the cultivar Morex
(YU et al., 2000), designated as ‘MO’. Further attempts to find Morex BAC clones
which significantly extended the contig were not successful. Therefore, a BAC library
of the variety Cebada Capa (ISIDORE et al., 2005) had been screened by the lab of
Beat Keller (Institute of Plant Biology, University of Zürich, Switzerland). Several BAC
pools were identified to contain BAC clones which overlap with the distal contig. One
of the BAC pools, designated as CC2, had been sequenced and assembled into
several contigs (Fig. 3.2; for more details see chapter 1.4.2.1). At this point, work for
the presented thesis was begun.
rice PAC cloneP0514G12
Acc. AP000616
telomere
MO52C22 MO621J22
MO693M6CC2
MO793L23
centromere
1 2
3
3
BAC libraries: Morex ‘MO’ (YU et al., 2000) Cebada Capa ‘CC’ (ISIDORE et al., 2005)
sequenced, one contig
sequenced, large contigs
1
2
3
LOC_Os06g01972.1 (nodulin-like protein), probe Xba6R
LOC_Os06g01990.1 (phosphoglycolate phosphatase)
marker GBR0961, EST clone Hw08F19
distal barleyBAC contig
GenBank Acc. AY853252; 232,809 bp
rice PAC cloneP0514G12
Acc. AP000616
telomere
MO52C22 MO621J22
MO693M6CC2
MO793L23
centromere
11 22
33
33
BAC libraries: Morex ‘MO’ (YU et al., 2000) Cebada Capa ‘CC’ (ISIDORE et al., 2005)
sequenced, one contig
sequenced, large contigs
1
2
3
LOC_Os06g01972.1 (nodulin-like protein), probe Xba6R
LOC_Os06g01990.1 (phosphoglycolate phosphatase)
marker GBR0961, EST clone Hw08F19
BAC libraries: Morex ‘MO’ (YU et al., 2000) Cebada Capa ‘CC’ (ISIDORE et al., 2005)
sequenced, one contig
sequenced, large contigs
11
22
33
LOC_Os06g01972.1 (nodulin-like protein), probe Xba6R
LOC_Os06g01990.1 (phosphoglycolate phosphatase)
marker GBR0961, EST clone Hw08F19
distal barleyBAC contig
GenBank Acc. AY853252; 232,809 bp
The corresponding homologous region on rice chromosome Os6 is depicted in blue (rice data based on the TIGR rice genome sequence, Release 5, http://rice.plantbiology.msu.edu/index.shtml). Different BAC libraries are indicated by different colors. The corresponding names of BAC clones are shown on the right side of the clones. The available amount of sequence information is depicted as differently dashed lines.
Fig. 3.2: Distal barley BAC contig of the Rrs2 locus on barley chromosome 7HS established by COSSU et al. (unpublished), status at the beginning of the presented PhD work.

RESULTS 42
As a first step, sequence data of BAC pool CC2 was analyzed. Three of the 61
contigs of CC2, contig 55, contig 60 and contig 59, created a contiguous sequence of
43,307 bp and extended the distal BAC contig (GenBank Acc. AY853252) by
26,072 bp. Several primers were developed based on this sequence information.
PCR screening of the pooled Morex BAC library DNA with primer pair
CC2_contig59-1 identified DNA pool 668 (supplementary Fig. A1) and ultimately BAC
clone MO668A17 (Fig. 3.3). This BAC clone was subcloned by random shearing
(chapter 2.3.3) and 192 subclones were sequenced as well as both BAC ends. The
obtained sequences were analyzed in order to identify vector sequences,
transposable elements (TEs), ESTs or single copy sequences. Overall, 50 primer
pairs were developed from the sequence regions which did not contain a TE, since
those sequences have a higher probability for being unique in the genome. The
primers were tested for amplification with genomic DNA, DNA of different BAC clones
and wheat-barley chromosome addition lines (ISLAM et al., 1981). Those tests
resulted in the identification of two primer pairs which amplified single copy
sequences. These primer pairs (668A17_g1-3 and 668A17_e11-2) were therefore
used for mapping BAC clone MO668A17 by sequencing the PCR fragments of
homozygous recombinants of the Atlas × Steffi mapping population. This confirmed
the expected chromosomal location of BAC clone MO668A17 within the co-
segregating region of Rrs2 (Fig. 3.3). These results show that the strategy of
employing a different BAC library was very useful for bridging an apparent gap in the
‘MO’ library.
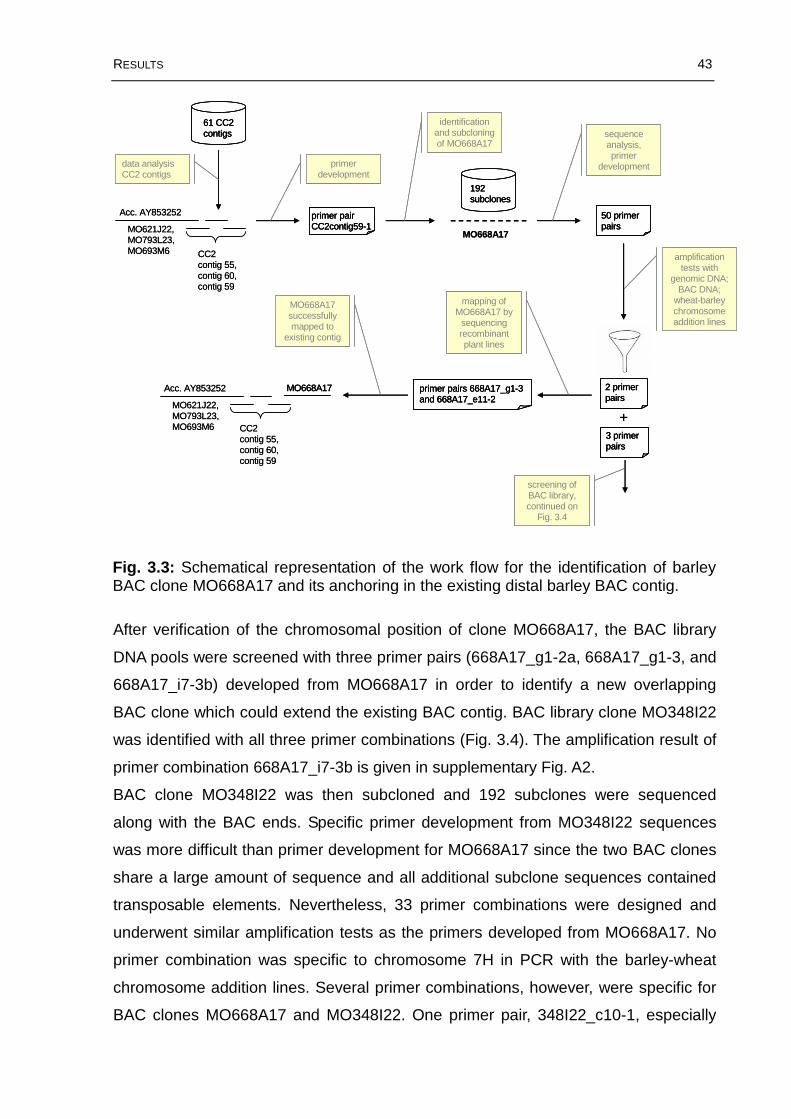
RESULTS 43
Acc. AY853252
MO621J22, MO793L23, MO693M6 CC2
contig 55, contig 60, contig 59
primer pair CC2contig59-1
primer development
identificationand subcloning of MO668A17
MO668A17
sequenceanalysis, primer
development
61 CC2 contigs
data analysisCC2 contigs
50 primer pairs
amplificationtests with
genomic DNA; BAC DNA;
wheat-barleychromosomeaddition lines
2 primer pairs
mapping of MO668A17 by
sequencingrecombinantplant lines
primer pairs 668A17_g1-3 and 668A17_e11-2
Acc. AY853252
MO621J22, MO793L23, MO693M6
MO668A17
MO668A17 successfullymapped to
existing contig
192 subclones
CC2 contig 55, contig 60, contig 59
screening of BAC library, continued on
Fig. 3.4
3 primer pairs
+
Acc. AY853252
MO621J22, MO793L23, MO693M6 CC2
contig 55, contig 60, contig 59
primer pair CC2contig59-1primer pair CC2contig59-1
primer development
identificationand subcloning of MO668A17
MO668A17
sequenceanalysis, primer
development
61 CC2 contigs61 CC2 contigs
data analysisCC2 contigs
50 primer pairs50 primer pairs
amplificationtests with
genomic DNA; BAC DNA;
wheat-barleychromosomeaddition lines
2 primer pairs2 primer pairs
mapping of MO668A17 by
sequencingrecombinantplant lines
primer pairs 668A17_g1-3 and 668A17_e11-2primer pairs 668A17_g1-3 and 668A17_e11-2
Acc. AY853252
MO621J22, MO793L23, MO693M6
MO668A17MO668A17
MO668A17 successfullymapped to
existing contig
192 subclones192 subclones
CC2 contig 55, contig 60, contig 59
screening of BAC library, continued on
Fig. 3.4
3 primer pairs3 primer pairs
+
After verification of the chromosomal position of clone MO668A17, the BAC library
DNA pools were screened with three primer pairs (668A17_g1-2a, 668A17_g1-3, and
668A17_i7-3b) developed from MO668A17 in order to identify a new overlapping
BAC clone which could extend the existing BAC contig. BAC library clone MO348I22
was identified with all three primer combinations (Fig. 3.4). The amplification result of
primer combination 668A17_i7-3b is given in supplementary Fig. A2.
BAC clone MO348I22 was then subcloned and 192 subclones were sequenced
along with the BAC ends. Specific primer development from MO348I22 sequences
was more difficult than primer development for MO668A17 since the two BAC clones
share a large amount of sequence and all additional subclone sequences contained
transposable elements. Nevertheless, 33 primer combinations were designed and
underwent similar amplification tests as the primers developed from MO668A17. No
primer combination was specific to chromosome 7H in PCR with the barley-wheat
chromosome addition lines. Several primer combinations, however, were specific for
BAC clones MO668A17 and MO348I22. One primer pair, 348I22_c10-1, especially
Fig. 3.3: Schematical representation of the work flow for the identification of barley BAC clone MO668A17 and its anchoring in the existing distal barley BAC contig.

RESULTS 44
seemed to be of interest since it only amplified BAC MO348I22 and not BAC clone
MO668A17. It was thus considered to be located in the most proximal part of the
BAC contig pointing towards the gap, which made it a good candidate for identifying
new BAC clones. Therefore, it was used to screen the DNA superpools of the Morex
BAC library together with primer pairs 348I22_d12 and 348I22_e11-2. The latter
primer pairs did not identify any new BAC DNA superpool. Primer 348I22_c10-1
amplified BAC DNA superpool 1 with the expected size. Further experiments
identified BAC clone MO3M16 as the positive BAC clone from BAC DNA
superpool 1 (Fig. 3.4).
As for the previously identified BAC clones, subloning, subclone sequencing (96
subclones), BAC end sequencing, sequence analysis, primer development and
primer testing was performed. A total of 21 primer pairs were developed, but none of
them could be confirmed by barley-wheat addition lines to be located on
chromosome 7H. In order to confirm the correct chromosomal location of BAC clone
MO3M16, PCR fragments amplified with two primer combinations (3M16_D8 and
3M16_I13-4) from the homozygous recombinants in the Atlas × Steffi mapping
population were sequenced and mapped. The two PCR fragments analyzed did not
map to the same chromosomal position as BAC clones MO668A17 and MO348I22.
Therefore, BAC clone MO3M16 had to be discarded (Fig. 3.4).

RESULTS 45
Acc. AY853252
MO621J22, MO793L23, MO693M6 CC2
contig 55, contig 60, contig 59
MO668A17
primer pairs 668A17_g1-2a;668A17_g1-3; 668A17_i7-3b
identificationand subcloning of MO348I22
MO348I22
33 primer pairs
sequenceanalysis, primer
development
amplificationtests with
genomic DNA; BAC DNA;
wheat-barleychromosomeaddition lines
primer pair 348I22_c10-1
identificationand subcloning
of MO3M16
192 subclones
MO3M16
96 subclones
MO348I22
sequenceanalysis and amplification
tests confirmedcorrect
positioning of MO348I22 in
existing contig
21 primer pairs
sequenceanalysis, primer
development
amplificationtests with
genomic DNA; BAC DNA;
wheat-barleychromosomeaddition lines
primer pairs 3M16_D8 and 3M16_I13-4
mapping of MO3M16 by sequencing
recombinant plant lines
MO3M16X
mapping of MO3M16 revealed that this BAC clone does not belong
to the contig
Acc. AY853252
MO621J22, MO793L23, MO693M6 CC2
contig 55, contig 60, contig 59
MO668A17MO668A17
primer pairs 668A17_g1-2a;668A17_g1-3; 668A17_i7-3b
primer pairs 668A17_g1-2a;668A17_g1-3; 668A17_i7-3b
identificationand subcloning of MO348I22
MO348I22
33 primer pairs33 primer pairs
sequenceanalysis, primer
development
amplificationtests with
genomic DNA; BAC DNA;
wheat-barleychromosomeaddition lines
primer pair 348I22_c10-1 primer pair 348I22_c10-1
identificationand subcloning
of MO3M16
192 subclones192 subclones
MO3M16
96 subclones96 subclones
MO348I22MO348I22
sequenceanalysis and amplification
tests confirmedcorrect
positioning of MO348I22 in
existing contig
21 primer pairs21 primer pairs
sequenceanalysis, primer
development
amplificationtests with
genomic DNA; BAC DNA;
wheat-barleychromosomeaddition lines
primer pairs 3M16_D8 and 3M16_I13-4
primer pairs 3M16_D8 and 3M16_I13-4
mapping of MO3M16 by sequencing
recombinant plant lines
MO3M16X
mapping of MO3M16 revealed that this BAC clone does not belong
to the contig
At this point the screening of the ‘MO’ BAC library was stopped because the
prospects of finding another correct BAC clone seemed very low given the available
sequence information of BAC clone MO348I22. Nevertheless, the search for new
BAC clones continued using another technique called high information content
fingerprinting (HICF). All known BAC clone addresses of the BAC contig were
provided to Daniela Schulte (Genome Diversity Group, IPK) who included them in an
ongoing project which deals with the establishment of a physical map of the barley
genome using HICF (SCHULTE et al., 2009). The analysis of all known BAC clones by
HICF confirmed the previously obtained experimental results. BAC clones
MO668A17 and MO348I22 prolonged the distal BAC contig and also showed a large
overlap with each other. BAC clone 3M16, however, did not belong to the same
contig.
Additionally to the confirmation of experimental results, the HIFC led to the
identification of two new BAC clones which prolong the distal contig. The two clones,
MH68J02 and ME194H14, originate from different BAC libraries of cultivar Morex
Fig. 3.4: Schematical representation of the work flow for the identification of barley BAC clones MO348I22 and MO3M16 and their anchoring in the distal BAC contig.

RESULTS 46
created with different restriction enzymes. However, no new BAC clone of the ‘MO’
library could be discovered by HICF.
BAC ends of BAC clone MH68J02 were sequenced, but they were not suitable for
primer development due to the presence of repetitive elements. To confirm the
overlapping of BAC clones MO348I22 and MH68J02, the primer pair 348I22_c10-3,
which was specific only for MO348I22, was used to amplify DNA of both BAC clones
and the PCR fragment was sequenced. The obtained sequences were 100%
identical. Since clones MH68J02 and ME194H14 were only identified during the final
stage of the PhD work, no further analyses were performed due to time restraints.
The prolonged distal barley BAC contig of the Rrs2 locus is depicted in Fig. 3.5.
MO52C22 MO621J22
MO693M6
CC2
MO793L23
distal barleyBAC contig
GenBank Acc. AY853252; 232,809 bp MO668A17
MO348I22
MH68J02
ME194H14
BAC libraries: Morex ‘MO’ (YU et al., 2000) Cebada Capa ‘CC’ (ISIDORE et al., 2005) Morex new ‘MH’ (pIndigoBAC-5, HindIII, unpublished) Morex new ‘ME’ (pIndigoBAC536, EcoRI, unpublished)
sequenced, one contig
sequenced, large contigs
200 sequencesno sequence information, only high informationcontent fingerprinting (HICF) information
centromere
CC2_contig59-1
668A17_g1-3 668A17_e11-2
348I22_c10-3
MO52C22 MO621J22
MO693M6
CC2
MO793L23
distal barleyBAC contig
GenBank Acc. AY853252; 232,809 bp MO668A17
MO348I22
MH68J02
ME194H14
BAC libraries: Morex ‘MO’ (YU et al., 2000) Cebada Capa ‘CC’ (ISIDORE et al., 2005) Morex new ‘MH’ (pIndigoBAC-5, HindIII, unpublished) Morex new ‘ME’ (pIndigoBAC536, EcoRI, unpublished)
sequenced, one contig
sequenced, large contigs
200 sequencesno sequence information, only high informationcontent fingerprinting (HICF) information
centromerecentromere
CC2_contig59-1
668A17_g1-3 668A17_e11-2
348I22_c10-3
Different BAC libraries are indicated with a different color. The corresponding names of BAC clones are shown on the right side of the clones. The available amount of sequence information is depicted as differently dashed lines. Primer pairs which were used in the BAC screening are shown in boxes.
Fig. 3.5: Prolonged distal barley BAC contig of the Rrs2 locus after screening of several different BAC libraries.

RESULTS 47
3.2.2 Proximal BAC contig
Before work for this thesis was started, a BAC contig proximal to the Rrs2 gene
consisting of BAC clones MO134N7, MO246J13, MO524N3 and MO288D11 already
existed which had been established by COSSU et al. (unpublished) (Fig. 3.6; for more
details see chapter 1.4.2.2).
rice PAC cloneP0514G12
Acc. AP000616
telomere centromere
MO246J13
MO524N3
MO288D11
1
MO134N7
proximalbarleyBAC contig
BAC libraries: Morex ‘MO’ (YU et al., 2000)
sequenced, one contig
1 LOC_Os06g02028.1 (eyes absent homolog 4), probe Pst1
sequenced, three large contigs due to two gaps
2325 individual sequences
rice PAC cloneP0514G12
Acc. AP000616
telomere centromere
MO246J13
MO524N3
MO288D11
1
MO134N7
proximalbarleyBAC contig
BAC libraries: Morex ‘MO’ (YU et al., 2000)
sequenced, one contig
1 LOC_Os06g02028.1 (eyes absent homolog 4), probe Pst1 11 LOC_Os06g02028.1 (eyes absent homolog 4), probe Pst1
sequenced, three large contigs due to two gapssequenced, three large contigs due to two gaps
2325 individual sequences
The corresponding homologous region on rice chromosome Os6 is depicted in blue (rice data based on the TIGR rice genome sequence, Release 5, http://rice.plantbiology.msu.edu/index.shtml). The corresponding names of BAC clones are shown on the right side of the clones. The available amount of sequence information is depicted as differently dashed lines.
Based on the obtained sequence information of the BAC clones, a contiguous
sequence of the proximal contig was later constructed by Thomas Wicker (chapter
1.4.2.2), but at the moment when chromosome walking for the proximal contig was
continued, only 2,325 individual sequences of BAC clone MO134N7 were available.
These sequences were assembled into several contigs using appropriate software.
Primers were designed from these contigs as well as from sequence information of
MO246J13. Primer design was complicated by the high content of TEs in BAC clones
MO134N7 and MO246J13. After several amplification tests similar to those described
in chapter 3.2.1, different primer combinations were used for screening the BAC
library DNA pools. Only the primer combinations 134N7_contig35-2 and
134N7_contig16-1 successfully identified a common BAC library DNA superpool.
Fig. 3.6: Proximal barley BAC contig for the Rrs2 locus on barley chromosome 7HS established by COSSU et al. (unpublished), status at the beginning of the presented PhD work.

RESULTS 48
This superpool was further analyzed and the BAC clone MO16J08 was identified as
the positive clone. BAC clone MO16J08 was subcloned and 378 subclones were
sequenced and analyzed. New primer pairs were developed from these sequences
and tested for the correct amplification patterns. Since most primers also amplified
BAC clone MO134N7, clone MO16J08 was initially regarded to be fitting in the
proximal BAC contig. Even the HICF analysis software FPC, assembled both BAC
clones into the same in silico contig, demonstrating the high sequence similarity.
However, amplification results with barley-wheat addition lines led to the conclusion
that BAC clone 16J08 does not originate from chromosome 7H, but from
chromosome 6H (Fig. 3.7).
MO524N3 MO288D11
sequenceanalysis, primer
development
amplificationtests with
genomic DNA; BAC DNA;
wheat-barleychromosomeaddition lines
identificationand subcloning
of MO16J08
MO16J08
378 subclones
sequenceanalysis, primer
development
amplificationtests with
genomic DNA; BAC DNA;
wheat-barleychromosomeaddition lines
primer pairs 134N7_contig35-2 and 134N7_contig16-1
MO16J08
X
MO246J13MO134N7
MO524N3 MO288D11
MO246J13
even though MO134N7 and MO16J08 are verysimilar in DNA content, amplification tests with
wheat-barleychromosome addition
lines showed thatMO16J08 originatesfrom chromsome 6H
and therefore does notfit in the BAC contig
MO524N3 MO288D11
sequenceanalysis, primer
development
amplificationtests with
genomic DNA; BAC DNA;
wheat-barleychromosomeaddition lines
identificationand subcloning
of MO16J08
MO16J08
378 subclones378 subclones
sequenceanalysis, primer
development
amplificationtests with
genomic DNA; BAC DNA;
wheat-barleychromosomeaddition lines
primer pairs 134N7_contig35-2 and 134N7_contig16-1
primer pairs 134N7_contig35-2 and 134N7_contig16-1
MO16J08
X
MO246J13MO134N7
MO524N3 MO288D11
MO246J13
even though MO134N7 and MO16J08 are verysimilar in DNA content, amplification tests with
wheat-barleychromosome addition
lines showed thatMO16J08 originatesfrom chromsome 6H
and therefore does notfit in the BAC contig
Due to these results and the difficulty to develop specific primer combinations from
the distal end of the proximal contig, the search for new BAC clones was not
continued. Surprisingly, even by the HICF technique, no new BAC clone from neither
the ‘MO’, ‘MH’ nor ‘ME’ library prolonging the proximal contig could be identified up to
now. It seems that the Rrs2 region is very poorly represented in barley BAC libraries
which were generated by partial restriction digestion.
Fig. 3.7: Schematical representation of work flow for the identification of BAC clone MO16J08 and its intended anchoring in the proximal BAC contig.

RESULTS 49
3.3 Summary of results for the map based cloning approach
The Rrs2 gene was fine mapped using a mapping population of 9179 F2-plants of the
cross Atlas (carrying the Rrs2 gene) x Steffi (susceptible). This led to the positioning
of Rrs2 between markers Put_acri_res_gene_7H / 693M6_6 and P1D23R. The
genetic distance of this interval is 0.08 cM. Nine markers (693M6-71, 693M6-R,
677J6-R, 246B18_RPK1, CC2_59-10, 668A17_g1-3, 668A17_e11-2, A-EST_2_SNP,
and BE194942U1/L1) which map within the interval, co-segregate with Rrs2 (Fig. 3.1;
supplementary Table A4). Additionally, two barley BAC contigs flanking the resistance
gene were established by chromosome walking. Based on the sequence information
of the distal barley BAC contig, the location of the Rrs2 gene could ultimately be
delimited between markers 693M6_6 and P1D23R (Fig. 3.8). Markers co-segregating
with the Rrs2 gene are located on both flanking BAC contigs. Up to now, a physical
gap of unknown size between the BAC contigs remains, resulting in a large physical
area co-segregating with the Rrs2 gene (Fig. 3.8).
Based on the assumption that 1 cM corresponds to 1 – 4.4 Mb at the telomeric end of
barley chromosome arm 7HS (KÜNZEL et al., 2000), the expected physical distance of
marker interval AFLP14 – P1D23R ranges from 220 kb to 968 kb. So far, 336.276 kb
sequence information of the interval has been obtained. The size of the physical
areas to both sides of the sequenced distal BAC contig can only be estimated. For
the region between marker AFLP14 and 621J22-E4-Ersatz (Fig. 3.8; supplementary
Table A4), the size of the interval is estimated to 148 kb based on data of the
accumulated mapping population after the third screening (4721 F2-plants). The total
size of the unsequenced distal BAC contig (BAC clones CC2, MO668A17,
MO348I22, MH68J02, 194H14) is approximated to at least 150 kb. The total known
physical area for the marker interval is therefore around 634 kb (Table 3.3).
Given the expected physical distance of 968 kb for the recombination rate of
4.4 Mb/cM and a correct size estimation of the unsequenced regions, the size of the
gap between the two BAC contigs could still be 334 kb. However, taking into
consideration the averaged physical distance of 2.8 Mb/cM which can be observed in
the two flanking BAC contigs (Table 3.3), the total size of the marker interval
AFLP14 – P1D23R would be 616 kb and the gap would have a predicted size of only
18 kb.
The expected number of recombination events within a given physical distance can
also be calculated based on the averaged physical distance of 2.8 Mb/cM. For the

RESULTS 50
marker interval 693M6_6 – P1D23R, which corresponds to the location of the Rrs2
gene, the expected number of recombinants ranges from 20 (for gap size of 18 kb) to
26 (for gap size of 334 kb). Within the mapping population of 9179 F2-plants only 15
recombination events have occurred between markers 693M6_6 and P1D23R. There
seems to be a significant discrepancy between the observed and expected number of
recombination events. Furthermore, an increase of the mapping population size from
4721 F2-plants to 9179 F2-plants did not result in any new informative recombination
event, all recombination events identified were redundant. Due to the apparent lack
of recombination in the vicinity of the Rrs2 gene, the physical region of the Rrs2 gene
can not be delimited further by using the mapping population of Atlas × Steffi.
proximal contig = 237,274 bp
centromere
MO52C22
distal contig = 258,886 bp sequenced + ~150 kb estimated
MO246J13
MO524N3
MO288D11
PSR119
4
52C22-D6
2
P1D23R
BAC libraries: Morex ‘MO’ (YU et al., 2000), Cebada Capa ‘CC’ (ISIDORE et al., 2005), Morex ‘MH’ (pIndigoBAC-5, HindIII, unpublished), Morex ‘ME’ (pIndigoBAC536, EcoRI, unpublished)
MO621J22
MO693M6
MO348I22
MH68J02
RFLP STS derived from AFLPSNP
Put_acri_res_gene_7H CC2_59-10, EcoRV
CAPS
ME194H14
sequenced, one contig
sequenced, large contigs
200 sequences
no sequence information, only HICF
gap
A-EST_2_SNP668A17_g1-3
MO134N7
Rrs2 co-segregating region
0.22 cM
0.08 cM
62,313 bp
77,380 bp
26 8 7
693M6_6
668A17_e11-2
~148 kb
MO668A17
CC2
MO793L23
288D11-R1 MWG555a
693M6-71
621J22-E4-Ersatz
AFLP14
91
proximal contig = 237,274 bp
centromere
MO52C22
distal contig = 258,886 bp sequenced + ~150 kb estimated
MO246J13
MO524N3
MO288D11
PSR119
4
52C22-D6
2
P1D23R
BAC libraries: Morex ‘MO’ (YU et al., 2000), Cebada Capa ‘CC’ (ISIDORE et al., 2005), Morex ‘MH’ (pIndigoBAC-5, HindIII, unpublished), Morex ‘ME’ (pIndigoBAC536, EcoRI, unpublished)
MO621J22
MO693M6
MO348I22
MH68J02
RFLP STS derived from AFLPSNP
Put_acri_res_gene_7H CC2_59-10, EcoRV
CAPS
ME194H14
sequenced, one contig
sequenced, large contigs
200 sequences
no sequence information, only HICF
gap
A-EST_2_SNP668A17_g1-3
MO134N7
Rrs2 co-segregating region
0.22 cM
0.08 cM
62,313 bp
77,380 bp
26 8 7
693M6_6
668A17_e11-2
~148 kb
MO668A17
CC2
MO793L23
288D11-R1 MWG555a
693M6-71
621J22-E4-Ersatz
AFLP14
9911
Some mapped markers (marker type indicated by differently dashed boxes), as well as recombination events between those markers (bold numbers) and some genetic and physical distances are given. BAC clones are indicated as full or dashed horizontal lines indicating the available sequence information. The corresponding BAC clone address is given on their right side. BAC clones originating from different BAC libraries are depicted in different colors. Green boxed markers are co-segregating with the Rrs2 phenotype (for reasons of simplification and better depiction, only five of the nine co-segregating markes are shown). The corresponding region on the genetic map is marked in green, the markers flanking the co-segregating region are depicted in red. The green striped area denotes the possible location of the border of the co-segregating region. The exact location of this border is not known.
Fig. 3.8: Summary of the genetic and physical map (minimal BAC clone tiling path) of the Rrs2 locus on barley chromosome 7HS.

RESULTS 51
marker interval AFLP14 – P1D23R
number of gametes 18,358
number of F2-recombinant plants
41
genetic distance of marker interval
0.22 cM
expected physical distance for marker interval 1)
220 – 968 kb
1) assuming that 1 cM at the telomeric end of chromosome 7HS corresponds to 1 – 4.4 Mb (KÜNZEL et al., 2000)
physical distance of marker interval
distal contig2) + proximal contig = 634,276 bp + unknown size of gap
2) physical distance only partially known; 258.883 kb sequenced information + approx. 148 kb gap on distal side and 150 kb estimated unsequenced information
expected physical distance between recombinants 1)
5 – 24 kb
distal contig = 16.38 kb2)physical distance between recombinants proximal contig = 11.05
distal contig = 3.0 Mb/cM 2)
proximal contig = 2.6 Mb/cMphysical distance per cM
average = 2.8 Mb/cM
3.4 Sequence annotation of the Rrs2 co-segregating region
Through the map based cloning approach, a large physical area co-segregating with
the Rrs2 gene was identified at the Rrs2 locus on barley chromosome 7HS (chapter
3.3). Two contiguous sequence stretches covering part of the co-segretation region,
as well as some sequence information of barley BAC clones from within the co-
segregating region are available (Fig. 3.9). Any of the sequenced genomic DNA,
which originates from the Rrs2 co-segregating area, could harbour the Rrs2 gene.
Therefore, the available sequence information of both barley BAC contigs, as well as
sequence information of BAC clones MO668A17 and MO348I22 was annotated
concerning their genic and non-genic DNA content. Additionally, the HarvEST Barley
Integrated Map 04/16/08 proved to be a valuable source for further information
regarding genes at the Rrs2 locus.
Table 3.3: Summary of the expected and actual physical distances of the marker interval between markers AFLP14 and P1D23R
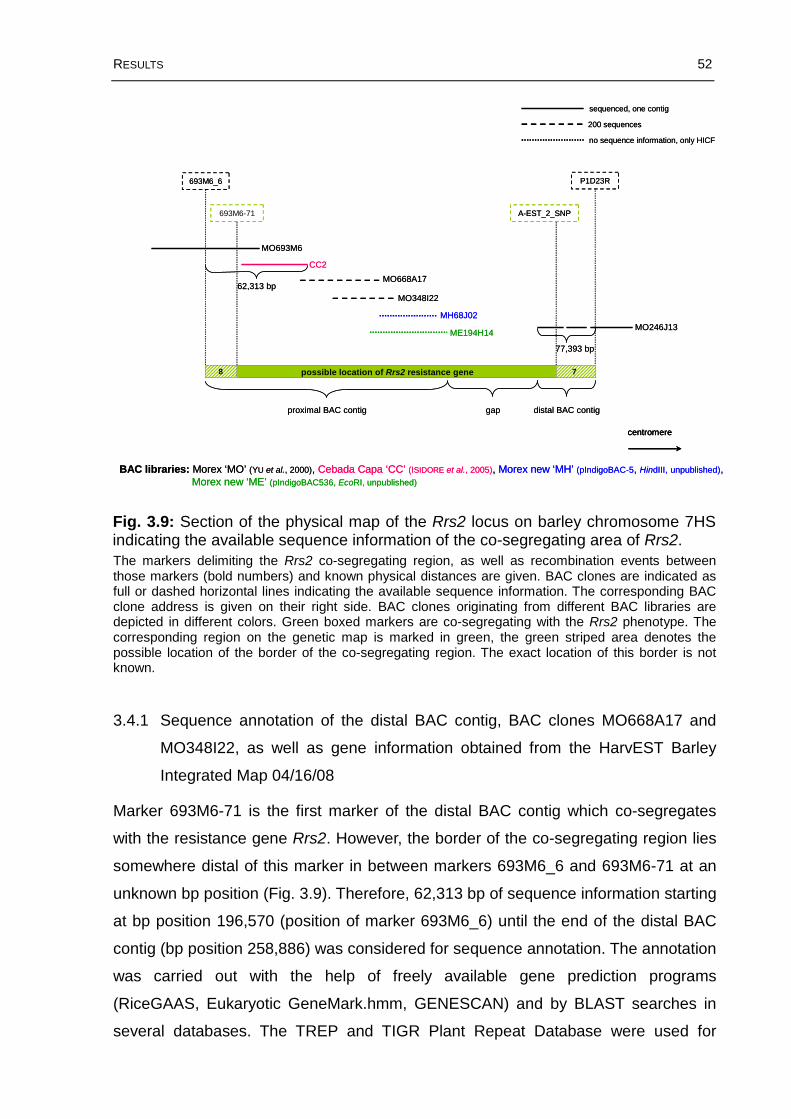
RESULTS 52
MO668A17
MO246J13
A-EST_2_SNP
centromere
MO693M6
CC2
MO348I22
MH68J02
693M6_6
possible location of Rrs2 resistance gene
ME194H14
BAC libraries: Morex ‘MO’ (YU et al., 2000), Cebada Capa ‘CC’ (ISIDORE et al., 2005), Morex new ‘MH’ (pIndigoBAC-5, HindIII, unpublished), Morex new ‘ME’ (pIndigoBAC536, EcoRI, unpublished)
693M6-71
P1D23R
8 7
62,313 bp
77,393 bp
sequenced, one contig
200 sequences
no sequence information, only HICF
proximal BAC contig gap distal BAC contig
MO668A17
MO246J13
A-EST_2_SNP
centromerecentromere
MO693M6
CC2
MO348I22
MH68J02
693M6_6
possible location of Rrs2 resistance gene
ME194H14
BAC libraries: Morex ‘MO’ (YU et al., 2000), Cebada Capa ‘CC’ (ISIDORE et al., 2005), Morex new ‘MH’ (pIndigoBAC-5, HindIII, unpublished), Morex new ‘ME’ (pIndigoBAC536, EcoRI, unpublished)
693M6-71
P1D23R
8 7
62,313 bp
77,393 bp
sequenced, one contig
200 sequences
no sequence information, only HICF
proximal BAC contig gap distal BAC contig
The markers delimiting the Rrs2 co-segregating region, as well as recombination events between those markers (bold numbers) and known physical distances are given. BAC clones are indicated as full or dashed horizontal lines indicating the available sequence information. The corresponding BAC clone address is given on their right side. BAC clones originating from different BAC libraries are depicted in different colors. Green boxed markers are co-segregating with the Rrs2 phenotype. The corresponding region on the genetic map is marked in green, the green striped area denotes the possible location of the border of the co-segregating region. The exact location of this border is not known.
3.4.1 Sequence annotation of the distal BAC contig, BAC clones MO668A17 and
MO348I22, as well as gene information obtained from the HarvEST Barley
Integrated Map 04/16/08
Marker 693M6-71 is the first marker of the distal BAC contig which co-segregates
with the resistance gene Rrs2. However, the border of the co-segregating region lies
somewhere distal of this marker in between markers 693M6_6 and 693M6-71 at an
unknown bp position (Fig. 3.9). Therefore, 62,313 bp of sequence information starting
at bp position 196,570 (position of marker 693M6_6) until the end of the distal BAC
contig (bp position 258,886) was considered for sequence annotation. The annotation
was carried out with the help of freely available gene prediction programs
(RiceGAAS, Eukaryotic GeneMark.hmm, GENESCAN) and by BLAST searches in
several databases. The TREP and TIGR Plant Repeat Database were used for
Fig. 3.9: Section of the physical map of the Rrs2 locus on barley chromosome 7HS indicating the available sequence information of the co-segregating area of Rrs2.

RESULTS 53
identifying repetitive DNA elements. For identifying ESTs, the DFCI Barley Gene
Index (HvGI), HarvEST Barley (Assembly 35) and NCBI (blastn against est_others)
databases were used. In the DFCI Barley Gene Index and HarvEST Barley
databases, ESTs are clustered into either tentative consensus sequences (TC) or
unigenes, respectively. Additionally, BLASTX searches were performed against the
NCBI non-redundant protein database. Generally, all hits with an e-value lower than
e-5 were considered for the annotation (for a more detailed description of the
annotation process see chapter 2.7.2).
For the first 36,240 bp of the co-segregating region, an annotation already existed. It
was performed by Thomas Wicker (Institute of Plant Biology, University of Zürich,
Switzerland) and was published along with the complete sequence of the distal BAC
contig (version of year 2004) under GenBank accession number AY853252. This
annotation was included in the current annotation and indicated as such
(supplementary Table A5).
Whether a sequence region which shows high homology to a gene actually contains
a functional gene is not clear, since annotation results are not based on experimental
evidence. Therefore, all so called genes in this work have to be regarded as putative
genes. Though, for reasons of simplification, they are mostly referred to as genes.
As a first step, the sequence of the co-segregating region was searched for the
presence of repetitive DNA elements. In total, nineteen repetitive DNA elements
including 8 TIR elements (7 Stowaway MITE’s and 1 CACTA), 5 LTR-
retrotransposons, 1 LINE retrotransposon and 5 unclassified TE’s were identified
(Fig. 3.10).
Nine regions of the co-segregating sequence of the distal BAC contig were identified
to harbour genes (Table 3.4, Fig. 3.10) of which three genes, number 4, 6 and 9,
might possibly be transposable elements. However, since the annotation as putative
genes could not unequivocally be excluded, they were classified as genes. The
functional annotation for gene 6 is protein phosphatase 2C, gene 4 and 9 have an
unknown function. For gene 5 evidence is weak since it is only based on a high
homology hit to the DFCI Barley Gene Index database, but on no other database or
gene prediction program. Gene 5 shows homology to N N'-diacetylchitobiose
phosphorylase. Gene loci 1, 2, 3, 7, and 8 were identified by several different
databases and gene predictions programs. Out of them, three genes (number 2, 7,
and 8) show a functional annotation which is related with pathogen defense. Gene 7

RESULTS 54
(HvRLK) contains protein kinase domains and leucine rich repeats and gene 8
(HvPEI-1) carries a pectinesterase inhibitor domain. Genes numbered 2 and 3 are
annotated as flavonol-sulfotransferase genes, whereas gene 2 represents the full
length gene (HvFST-2) which was identified and annotated by Thomas Wicker (based
on non-experimental evidence). Gene 3 shows very high homology to gene 2, but
seems to be fragmented. It might therefore be a non-functional pseudogene. Finally,
gene 1 shows homology to electron transfer flavoprotein subunit beta (HvETF). A
complete list of the annotation results for the co-segregating region of the distal
barley BAC contig is given in supplementary Table A5.
The available sequence information of BAC clones MO668A17 and MO348I22 (192
subclone sequences, each) was only analyzed concerning genic content. Out of all
subclones, three with identical sequence, originating from BAC clone MO668A17,
were identified. They showed high homology to unigenes of the HvGI and HarvEST
database (gene 10, Table 3.4). Gene 10 is annotated as a predicted protein
(HvHYP-1). No further subclones of neither MO886A17 nor MO348I22 were
identified to carry genes.
Two additional genes of the co-segregating region could be identified indirectly
through mapped genes of the HarvEST Barley Integrated Map 04/16/08. In this map
there are five unigenes which map at map position 3.3 on chromosome 7HS. Three
of them are present in the sequence information available for the Rrs2 locus.
HarvEST unigene #15670 corresponds to gene 8 (HvPEI-1, Table 3.4), #2643
corresponds to gene 10 (HvHYP-1), which was just described above, and #3681 is
found on the proximal barley BAC contig (chapter 3.4.2). The fourth unigene, #1552,
was localized on BAC clone ME194H14 by Ruvini Ariyadasa in frame of a physical
anchoring project of barley BAC contigs (IPK Genome Diversity group, personal
communication). This gene, designated gene 11 (HvPEI-2), encodes another
pectinesterase inhibitor domain containing protein which might be involved in
pathogen defense (Table 3.4). The fifth remaining unigene #2649 could not be
identified in the sequence data obtained up to date, but since all five unigenes map to
the same position, it is very likely that #2649 originates from within the gap between
the two BAC contigs flanking the Rrs2 locus. Unigene #2649 is annotated as a
-1,3-glucan synthase (HvGSY) and is designated gene 12 (Table 3.4). It
might also be involved in defense responses of the plant.
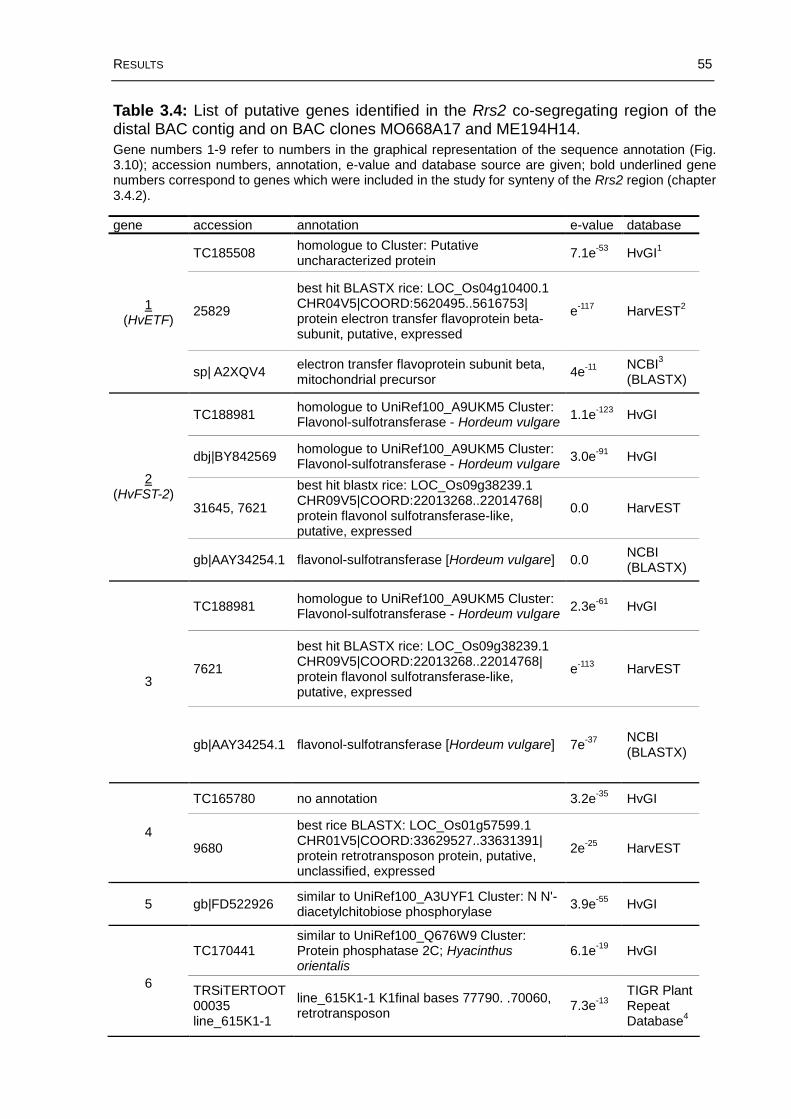
RESULTS 55
Gene numbers 1-9 refer to numbers in the graphical representation of the sequence annotation (Fig.3.10); accession numbers, annotation, e-value and database source are given; bold underlined gene numbers correspond to genes which were included in the study for synteny of the Rrs2 region (chapter 3.4.2).
Table 3.4: List of putative genes identified in the Rrs2 co-segregating region of the distal BAC contig and on BAC clones MO668A17 and ME194H14.
gene accession annotation e-value database
TC185508homologue to Cluster: Putative uncharacterized protein
7.1e-53 HvGI1
25829
best hit BLASTX rice: LOC_Os04g10400.1 CHR04V5|COORD:5620495..5616753| protein electron transfer flavoprotein beta-subunit, putative, expressed
e-117 HarvEST21(HvETF)
sp| A2XQV4electron transfer flavoprotein subunit beta, mitochondrial precursor
4e-11 NCBI3
(BLASTX)
TC188981homologue to UniRef100_A9UKM5 Cluster: Flavonol-sulfotransferase - Hordeum vulgare
1.1e-123 HvGI
dbj|BY842569homologue to UniRef100_A9UKM5 Cluster: Flavonol-sulfotransferase - Hordeum vulgare
3.0e-91 HvGI
31645, 7621
best hit blastx rice: LOC_Os09g38239.1 CHR09V5|COORD:22013268..22014768| protein flavonol sulfotransferase-like, putative, expressed
0.0 HarvEST
2(HvFST-2)
gb|AAY34254.1 flavonol-sulfotransferase [Hordeum vulgare] 0.0NCBI (BLASTX)
TC188981homologue to UniRef100_A9UKM5 Cluster: Flavonol-sulfotransferase - Hordeum vulgare
2.3e-61 HvGI
7621
best hit BLASTX rice: LOC_Os09g38239.1 CHR09V5|COORD:22013268..22014768| protein flavonol sulfotransferase-like,putative, expressed
e-113 HarvEST3
gb|AAY34254.1 flavonol-sulfotransferase [Hordeum vulgare] 7e-37 NCBI (BLASTX)
TC165780 no annotation 3.2e-35 HvGI
49680
best rice BLASTX: LOC_Os01g57599.1 CHR01V5|COORD:33629527..33631391| protein retrotransposon protein, putative, unclassified, expressed
2e-25 HarvEST
5 gb|FD522926similar to UniRef100_A3UYF1 Cluster: N N'-diacetylchitobiose phosphorylase
3.9e-55 HvGI
TC170441similar to UniRef100_Q676W9 Cluster: Protein phosphatase 2C; Hyacinthus orientalis
6.1e-19 HvGI
6 TRSiTERTOOT00035 line_615K1-1
line_615K1-1 K1final bases 77790. .70060, retrotransposon
7.3e-13TIGR Plant Repeat Database4

RESULTS 56
Gene numbers 1-9 refer to numbers in the graphical representation of the sequence annotation (Fig.3.10) accession numbers, annotation, e-value and database source are given; bold underlined gene numbers correspond to genes which were included in the study for synteny of the Rrs2 region (chapter 3.4.2).
Table 3.4 continued: List of putative genes identified in the Rrs2 co-segregating region of the distal BAC contig and on BAC clones MO668A17 and ME194H14.
gene accession annotation e-value database
TC178518weakly similar to UniRef100_Q0DBJ9Cluster: Os06g0557400 protein; Oryza sativa Japonica Group
4.2e-25 HvGI
23698
best rice blastx: LOC_Os06g36310.1CHR06V5|COORD:21273557..21271735 |protein receptor-like protein kinase 5 precursor, putative, expressed
4e-19 HarvEST7
(HvRLK)
gb|BH245278.1
BH245278 pSB0138 S. bicolorBTx623 PstI-digested total genomic DNA library Sorghum bicolor genomic clone pSB0138 contains similarity to protein kinase domains and leucine rich repeats (AAD40144)
3.7e-69TIGR Plant Repeat Database
TC158103 putative uncharacterized protein 3.5e-186 HvGI
15670, 15671
best rice blastx: LOC_Os12g03510.1 CHR12V5|COORD:1392655..1392045| protein pectinesterase inhibitor domain containing protein, expressed
0.0 HarvEST8(HvPEI-1)
gb|EAY82154.1hypothetical protein OsI_036113 [Oryza sativa (indica cultivar-group)]
4e-05 NCBI (BLASTX)
TC166213 no annotation 3.4e-22 HvGI
gb|AH011564.1SEG_AF356178S Hordeum vulgarechromosome 1H map 1H centromeric region
3.1e-18TIGR Plant Repeat Database
gb|CA015193.1Hordeum vulgare subsp. vulgarecDNA clone HT13J19 5-PRIME, mRNA sequence
1e-38NCBI (BLASTN, est_others)
9
TREP1158 DTT_Thalos_BQ472049-1 2e-31 TREP5
TC154956homologue to UniRef100_Q0D083 Cluster: Predicted protein; n=1; Aspergillus terreus
7.3e-103 HvGI
2643 no annotation 0.0 HarvEST10
(HvHYP-1)
emb|CAN79656.1 hypothetical protein [Vitis vinifera] 4e-04 NCBI (BLASTX)
11(HvPEI-2) 1552
pectinesterase inhibitor domain containing protein
2e-08 HarvEST
12(HvGSY) 2649 putative -1,3-glucan synthase 1e-115 HarvEST
1 DFCI Barley Gene Index (HvGI), http://compbio.dfci.harvard.edu/tgi/cgi-bin/tgi/gimain.pl?gudb=barley
2 HarvEST Barley, http://harvest.ucr.edu/3 NCBI, http://blast.ncbi.nlm.nih.gov/Blast.cgi4 TIGR Plant Repeat Database, http://blast.jcvi.org/euk-
blast/index.cgi?project=plant.repeats5 Triticeae Repeat Sequence Database (TREP), http://wheat.pw.usda.gov/ITMI/Repeats/

RESULTS 57
predicted intron
arrows indicate gene direction, if known
predicted exon, not confirmed by databasealignment
RiceGAAS
TREP
HvGI
HarvEST
GeneMark.hmm
GENSCAN
blastx
1 + 2 putative genes, see Table 3.4
predicted intron
arrows indicate gene direction, if known
predicted exon, not confirmed by databasealignment
RiceGAAS
TREP
HvGI
HarvEST
GeneMark.hmm
GENSCAN
blastx
1 + 2 putative genes, see Table 3.4
196,570 bp
500 1000 1500 2000 2500 3000 3500 4000 4500 5000 5500
6000 6500 7000 7500 8000 8500 9000 9500 10000 10500 11000 11500
12000 12500 13000 13500 14000 14500 15000 15500 16000 16500 17000
1 2
196,570 bp
500 1000 1500 2000 2500 3000 3500 4000 4500 5000 5500
6000 6500 7000 7500 8000 8500 9000 9500 10000 10500 11000 11500
12000 12500 13000 13500 14000 14500 15000 15500 16000 16500 17000
1 2
RLC_Ikya
DTT_Thalos
TE, unclassified
DTC_Caspar
Retrotransposon, not classified
RLC_Ikya
DTT_Thalos
TE, unclassified
DTC_Caspar
Retrotransposon, not classified
Basepair positions correspond to the co-segregating region (bp position 1 is equal to bp position 196,570 of the complete distal contig). Database hits and predicted exons and introns are represented as bars or arrows and lines at the corresponding sequence position. Arrows indicate the direction of transcription, if known. Database sources and gene prediction programs are color coded. Transposable elements are shaded in different ways according to their classification. Putative genes are designated by numbers which correspond to the numbering in Table 3.4. A complete list of the annotation results is given in supplementary Table A5.
Fig. 3.10: Graphical representation of the annotated Rrs2 co-segregating region of the distal BAC contig.

RESULTS 58
predicted intron
predicted exon, not confirmed by databasealignment
RiceGAAS
TREP
HvGI
TIGR Plant Repeat Database
HarvEST
GeneMark.hmm
GENSCAN
arrows indicate gene direction, if known
blastx
3, 4, 5, 6 putative genes, see Table 3.4
predicted intron
predicted exon, not confirmed by databasealignment
RiceGAAS
TREP
HvGI
TIGR Plant Repeat Database
HarvEST
GeneMark.hmm
GENSCAN
arrows indicate gene direction, if known
blastx
3, 4, 5, 6 putative genes, see Table 3.4
23000 23500 24000 24500 25000 25500 26000 26500 27000 27500 28000 28500
29000 29500 30000 30500 31000 31500 32000 32500 33000 33500 34000
17500 18000 18500 19000 19500 20000 20500 21000 21500 22000 22500
3 4 5
5
6
224,655 bp, position of first co-segregatingmarker 693M6-71
23000 23500 24000 24500 25000 25500 26000 26500 27000 27500 28000 28500
29000 29500 30000 30500 31000 31500 32000 32500 33000 33500 34000
17500 18000 18500 19000 19500 20000 20500 21000 21500 22000 22500
3 4 5
5
6
224,655 bp, position of first co-segregatingmarker 693M6-71
Retrotransposon, not classified
RIX_Sara
RLC_TAR4
DTT_Pan/Icarus
TE, unclassified
Retrotransposon, not classified
RIX_Sara
RLC_TAR4
DTT_Pan/Icarus
TE, unclassified
Basepair positions correspond to the co-segregating region (bp position 1 is equal to bp position 196,570 of the complete distal contig). Database hits and predicted exons and introns are represented as bars or arrows and lines at the corresponding sequence position. Arrows indicate the direction of transcription, if known. Database sources and gene prediction programs are color coded. Transposable elements are shaded in different ways according to their classification. Putative genes are designated by numbers which correspond to the numbering in Table 3.4. A complete list of the annotation results is given in supplementary Table A5.
Fig. 3.10 continued: Graphical representation of the annotated Rrs2 co-segregating region of the distal BAC contig.

RESULTS 59
predicted intron
predicted exon, not confirmed by databasealignment
RiceGAAS
TREP
HvGI
TIGR Plant Repeat Database
HarvEST
duplicated sequence, arrow indicates direction
GeneMark.hmm
GENSCAN
arrows indicate gene direction, if known
blastx
7 putative gene, see Table 3.4
predicted intron
predicted exon, not confirmed by databasealignment
RiceGAAS
TREP
HvGI
TIGR Plant Repeat Database
HarvEST
duplicated sequence, arrow indicates direction
GeneMark.hmm
GENSCAN
arrows indicate gene direction, if known
blastx
7 putative gene, see Table 3.4
34500 35000 35500 36000 36500 37000 37500 38000 38500 39000 39500
40000 40500 41000 41500 42000 42500 43000 43500 44000 44500 45000 45500
46000 46500 47000 47500 48000 48500 49000 49500 50000 50500 51000
7
34500 35000 35500 36000 36500 37000 37500 38000 38500 39000 39500
40000 40500 41000 41500 42000 42500 43000 43500 44000 44500 45000 45500
46000 46500 47000 47500 48000 48500 49000 49500 50000 50500 51000
7
RLC_HORPIA2
RLC_BARE1
Retrotransposon, not classified
DTT_Fortuna/Thalos
TE, unclassified
RLC_HORPIA2
RLC_BARE1
Retrotransposon, not classified
DTT_Fortuna/Thalos
TE, unclassified
Basepair positions correspond to the co-segregating region (bp position 1 is equal to bp position 196,570 of the complete distal contig). Database hits and predicted exons and introns are represented as bars or arrows and lines at the corresponding sequence position. Arrows indicate the direction of transcription, if known. Database sources and gene prediction programs are color coded. Transposable elements are shaded in different ways according to their classification. Putative genes are designated by numbers which correspond to the numbering in Table 3.4. A complete list of the annotation results is given in supplementary Table A5.
Fig. 3.10 continued: Graphical representation of the annotated Rrs2 co-segregating region of the distal BAC contig.

RESULTS 60
predicted intron
RiceGAAS
TREP
HvGI
TIGR Plant Repeat Database
HarvEST
duplicated sequence, arrow indicates direction
NCBI blastn (est_others)
GeneMark.hmm
GENSCAN
arrows indicate gene direction, if known
blastx
8 + 9 putative genes, see Table 3.4
predicted intron
RiceGAAS
TREP
HvGI
TIGR Plant Repeat Database
HarvEST
duplicated sequence, arrow indicates direction
NCBI blastn (est_others)
GeneMark.hmm
GENSCAN
arrows indicate gene direction, if known
blastx
8 + 9 putative genes, see Table 3.4258,883 bp
5700057500 58000 58500 59000 59500 60000 60500 61000 61500 62000 62500
8
9
51500 52000 52500 53000 53500 54000 54500 55000 55500 56000 56500
258,883 bp
5700057500 58000 58500 59000 59500 60000 60500 61000 61500 62000 62500
8
9
51500 52000 52500 53000 53500 54000 54500 55000 55500 56000 56500
RLC_HORPIA2
RLC_BARE1
DTT_Thalos
TE, unclassified
RLC_HORPIA2
RLC_BARE1
DTT_Thalos
TE, unclassified
Basepair positions correspond to the co-segregating region (bp position 1 is equal to bp position 196,570 of the complete distal contig). Database hits and predicted exons and introns are represented as bars or arrows and lines at the corresponding sequence position. Arrows indicate the direction of transcription, if known. Database sources and gene prediction programs are color coded. Transposable elements are shaded in different ways according to their classification. Putative genes are designated by numbers which correspond to the numbering in Table 3.4. A complete list of the annotation results is given in supplementary Table A5.
Fig. 3.10 continued: Graphical representation of the annotated Rrs2 co-segregating region of the distal BAC contig.
RESULTS 61
3.4.2 Sequence annotation of the proximal BAC contig and summary of identified
genes in the co-segregating region
The proximal BAC contig was previously annotated by Thomas Wicker (Institute of
Plant Biology, University of Zürich, Switzerland) focusing mainly on the repetitive
sequences. In his annotation, five genes were identified (chapter 1.4.2.2;
supplementary Table A6). Three of these, an ent-kaurenoic acid oxidase (HvKAO-1),
an eyes absent homolog (HvEYA-1), and a gene coding for a hypothetical protein
(HvHYP-2) are located within the co-segregating region of Rrs2. Additionally,
HarvEST unigene #3681 is present on the proximal contig in the Rrs2 co-segregating
region. This unigene maps to the same position in the HarvEST Barley Integrated
Map 04/16/08 as three other unigenes which are found on the distal BAC contig
(chapter 3.4.1). Unigene #3681 is annotated as coding for a high-affinity zinc uptake
system membrane protein ZnuB (HvZUS).
In total, 16 putative genes were identified in the co-segregating region (Fig. 3.11). For
eleven of them strong evidence exists throughout all checked databases. Their
annotation is therefore regarded as reliable. Three genes (genes 4, 6, and 9) showed
ambiguous results across different databases. The possibility exists, that they are in
fact transposable elements. Gene 5 also should be regarded with caution, since the
annotation only relies on the output of one database, which could not be confirmed
by other databases. Finally, gene 3 might be a pseudogene, since only gene
fragments can be found in the sequence information. Additionally, it has to be pointed
out that the location of gene 12 (HvGSY) within the sequence gap is not confirmed, it
is only suspected based on mapping information obtained from the HarvEST Barley
Integrated Map 04/16/08. Out of all genes identified in the co-segregting region of
Rrs2, five genes show an annotation that hints to an involvement in pathogen
defense processes. These genes are gene 2 (HvFST-2), gene 7 (HvRLK), gene
8 (HvPEI-1), gene 11 (HvPEI-2), and gene 12 (HvGSY).

RESULTS 62
MO668A17
MO246J13
A-EST_2_SNP
centromere
MO693M6
CC2
MO348I22
MH68J02
693M6_6
possible location of Rrs2 resistance gene
ME194H14
BAC libraries: Morex ‘MO’ (YU et al., 2000), Cebada Capa ‘CC’ (ISIDORE et al., 2005), Morex new ‘MH’ (pIndigoBAC-5, HindIII, unpublished), Morex new ‘ME’ (pIndigoBAC536, EcoRI, unpublished)
693M6-71
P1D23R
8 7
62,313 bp
77,393 bp
sequenced, one contig
200 sequences
no sequence information, only HICF
proximal BAC contig gap distal BAC contig
1 electron transfer flavoprotein subunit beta, mitochondrial precursor (HvETF)2 flavonol-sulfotransferase (HvFST-2)3 flavonol-sulfotransferase (only fragments) 4 no annotation (maybe transposable element)5 N N'-diacetylchitobiose phosphorylase (weak evidence)6 Protein phosphatase 2C (maybe transposable element) 7 protein receptor-like protein kinase 5 precursor (HvRLK)8 pectinesterase inhibitor domain containing protein (HvPEI-1)9 no annotation (maybe transposable element)
12 putative ß-1,3-glucan synthase (HvGSY)
11 pectinesterase inhibitor domain containing protein (HvPEI-2)
13 high-affinity zinc uptake system membrane protein ZnuB (HvZUS) 14 hypothetical protein (HvHYP-1)15 ent-kaurenoic acid oxidase (HvKAO-1)16 eyes absent homolog (HvEYA-1)
10 predicted protein (HvHYP-1)
MO668A17
MO246J13
A-EST_2_SNP
centromerecentromere
MO693M6
CC2
MO348I22
MH68J02
693M6_6
possible location of Rrs2 resistance gene
ME194H14
BAC libraries: Morex ‘MO’ (YU et al., 2000), Cebada Capa ‘CC’ (ISIDORE et al., 2005), Morex new ‘MH’ (pIndigoBAC-5, HindIII, unpublished), Morex new ‘ME’ (pIndigoBAC536, EcoRI, unpublished)
693M6-71
P1D23R
8 7
62,313 bp
77,393 bp
sequenced, one contig
200 sequences
no sequence information, only HICF
proximal BAC contig gap distal BAC contig
1 electron transfer flavoprotein subunit beta, mitochondrial precursor (HvETF)2 flavonol-sulfotransferase (HvFST-2)3 flavonol-sulfotransferase (only fragments) 4 no annotation (maybe transposable element)5 N N'-diacetylchitobiose phosphorylase (weak evidence)6 Protein phosphatase 2C (maybe transposable element) 7 protein receptor-like protein kinase 5 precursor (HvRLK)8 pectinesterase inhibitor domain containing protein (HvPEI-1)9 no annotation (maybe transposable element)
12 putative ß-1,3-glucan synthase (HvGSY)
11 pectinesterase inhibitor domain containing protein (HvPEI-2)
13 high-affinity zinc uptake system membrane protein ZnuB (HvZUS) 14 hypothetical protein (HvHYP-1)15 ent-kaurenoic acid oxidase (HvKAO-1)16 eyes absent homolog (HvEYA-1)
10 predicted protein (HvHYP-1)
Annotation for the underlined genes is considered reliable, these genes are therefore included in the synteny study of the Rrs2 region, presented in chapter 3.5. The markers delimiting the Rrs2 co-segregating region, as well as recombination events between those markers (bold numbers) and known physical distances are given. BAC clones are shown as full or dashed horizontal lines indicating the available sequence information. The corresponding BAC clone address is given on their right side. BAC clones originating from different BAC libraries are depicted in different colors. Green boxed markers are co-segregating with the Rrs2 phenotype. The corresponding region on the genetic map is marked in green, the green striped area denotes the possible location of the border of the co-segregating region. The exact location of this border is not known.
3.5 Synteny of the Rrs2 region to other members of the Poacea family
3.5.1 Synteny to rice (Oryza sativa L.)
Synteny, the conservation of gene content, between the rice and the barley genome
can be exploited for marker saturation of target regions in barley (KILIAN et al., 1997;
MAMMADOV et al., 2005; PEROVIC et al., 2004; VU, 2007). However, there have also
been numerous reports about loss of synteny on the sub-Mb level between syntenic
Fig. 3.11: Section of the physical map of the Rrs2 locus on barley chromosome 7HS indicating the genes identified in the co-segregating area of Rrs2.

RESULTS 63
regions in cereal genomes (CALDWELL et al., 2004; DELSENY, 2004; GALLEGO et al.,
1998; SPIELMEYER and RICHARDS, 2004).
KILIAN et al. (1995) reported a high degree of microsynteny between rice
chromosome 6 and barley chromosome 7HS. In order to find new barley BAC clones
for bridging the gap between the two BAC contigs flanking the Rrs2 gene (see Fig.
3.11), microsynteny between rice and barley could be exploited. Therefore, a
comparison of the genic content of the Rrs2 locus and the corresponding syntenic
region on rice chromosome 6 was undertaken.
For the synteny study, all available sequence information of the whole Rrs2 locus
was considered. Therefore, summarized results of previous annotations of both BAC
contigs and the new annotation for the co-segregating region performed in this work
(chapter 3.4) were used for the analysis. The previous annotations by Thomas
Wicker (Institute of Plant Biology, University of Zürich, Switzerland) are published for
the distal BAC contig under GenBank Acc. AY853252 and listed for the proximal BAC
contig in supplementary Table A6. Genes located in the Rrs2 co-segregating region
can be found in Fig. 3.11. However, only the genes with reliable annotation results
were considred for the synteny study (underlined genes in Fig. 3.11).
The results of the synteny analysis with rice are depicted in Fig. 3.12 and compared
to the results obtained with Brachypodium distachyon (described in chapter 3.5.2) at
the end of this chapter in Table 3.5.
Barley markers flanking the Rrs2 region (PSR119, Xba6, R2869), as well as three
genes of the proximal barley BAC contig (HvKAO-1, HvEYA-1, HvLEA-1) can be
found in the same order in the syntenic region on rice chromosome 6. The
chromosomal region in rice, which corresponds to the Rrs2 locus, spans roughly
164 kb (Fig. 3.12). Two other genes of the proximal barley BAC contig (HvHYP-2,
HvHYP-3) could not be localized in the syntenic region on chromosome 6, but on
other rice chromosomes. The HvZUS gene was not present in the rice genome at all
(Fig. 3.12; supplementary Table A7).
For only two out of 14 barley genes of the distal barley BAC contig, a gene at the
syntenic position in rice could be identified. Both genes (HvPGM-1, HvPGM-2), which
are found in opposite orientation to each other in barley, have one common
orthologous gene in rice. For 11 of the 12 other genes of the distal barley BAC contig,
orthologues could be localized on different rice chromosomes. Comparably to the

RESULTS 64
HvPGM genes, HvFBX-1 and HvFBX-2 are also oriented in opposite direction to
each other and only share one common orthologous gene in rice. This data provokes
the hypothesis that at a certain point of time after the divergence of barley and rice,
46 million years ago (GAUT, 2002), a duplication and inversion event took place
leading to this constellation of the HvPGM and HvFBX genes in barley. The HvPEI-1
gene was not present on any rice chromosome (Fig. 3.12; supplementary Table A8).
For the HvHYP-1 and HvPEI-2 genes, located in between the two barley BAC
contigs, also no orthologous rice gene exists. The positioning of HvGSY in between
the flanking barley BAC contigs is not confirmed by own mapping data, only
suggested by publicly available mapping data (see chapter 3.4). This gene shows an
orthologue on rice chromosome 6, but outside the syntenic region about 83 kb
proximal to the rice orthologue of barley marker R2869 (Fig. 3.12).
In total, 19 genes are located in rice at the syntenic region of the Rrs2 locus,
including the flanking markers. Out of them, seven can be found in the barley BAC
contigs, 12 are not present. Given a preserved gene order between the analyzed
regions in barley and rice, one of those 11 genes, an uridylate kinase, might be
located in the yet unsequenced gap between the distal and proximal contig (as
indicated by a dashed line in Fig. 3.12).
In summary, a certain level of synteny and colinearity (conservation of gene order)
between the distal barley BAC contig and the syntenic region on rice chromosome 6
exists, mainly in the areas flanking the co-segregating region of the Rrs2 gene. This
is consistent with the findings of KILIAN et al. (1995). However, on the sub-Mb level,
microsynteny and microcolinearity seem to be largely disrupted between the barley
Rrs2 locus and its syntenic region in rice. This limits the usefulness of the rice
sequence for development of probes applicable for finding new barley BAC clones for
the Rrs2 locus.

RESULTS 65
Orthologous genes are connected by lines, genes which do not have an orthologue are shaded in gray. Arrows indicate the direction of transcription, if known. The rice chromosomes (orange) are depicted with the short arm on the left hand side. All BAC contigs are positioned with the centromere to the right hand side. The dashed line indicates a possible orthologous relationship.
Xba6
rice chromosome
barley BAC contig of Rrs2 locus
RFLP marker
rice BAC clone
gene, arrow indicates direction of transcription
* genes marked with an asterisk lie within the co-segregating region of Rrs2
Xba6
rice chromosome
barley BAC contig of Rrs2 locus
RFLP marker
rice BAC clone
gene, arrow indicates direction of transcription
* genes marked with an asterisk lie within the co-segregating region of Rrs2
PS
R119
AP001129
AP000616
P0644B06
P0514G12
OSJNBa0004I20
AP002805
Xba6
P0029D06
AP001552
R2869
HvR
GH
-1
HvP
GM
-1
HvF
BX
-1
HvC
YP
HvF
BX
-2
HvP
UQ
HvP
GM
-2
HvR
GH
-2
HvR
GH
-3
HvR
LK
*
Os4
Os12
Os8
Os2
Os11
Os5
Os9
Os6
HvK
AO
*
HvE
YA
*
HvH
YP
-2*
rice BAC tiling path of syntenic region on Os6
BAC contigs and markers of Rrs2 region on 7HS
hits to other rice chromosomes
HvP
EI-1*
Os7
HvL
EA
HvH
YP
-3
HvZ
US
*
proximal BAC contig
distal BAC contig
HvG
SY
*
HvP
EI-2*
HvH
YP
-1*
HvF
ST
-2*
HvF
ST
-1
HvE
TF
*
83 kb
164 kb
?
PS
R119
AP001129
AP000616
P0644B06
P0514G12
OSJNBa0004I20
AP002805
Xba6
P0029D06
AP001552
R2869
HvR
GH
-1
HvP
GM
-1
HvF
BX
-1
HvC
YP
HvF
BX
-2
HvP
UQ
HvP
GM
-2
HvR
GH
-2
HvR
GH
-3
HvR
LK
*
Os4
Os12
Os8
Os2
Os11
Os5
Os9
Os6
HvK
AO
*
HvE
YA
*
HvH
YP
-2*
rice BAC tiling path of syntenic region on Os6
BAC contigs and markers of Rrs2 region on 7HS
hits to other rice chromosomes
HvP
EI-1*
Os7
HvL
EA
HvH
YP
-3
HvZ
US
*
proximal BAC contig
distal BAC contig
HvG
SY
*
HvP
EI-2*
HvH
YP
-1*
HvF
ST
-2*
HvF
ST
-1
HvE
TF
*
83 kb
164 kb
? HvRGH resistance gene homolog
HvPGM beta-phosphoglucomutase
HvCYP cytochrome P450
HvFBX F-Box like protein
HvPUQ polyubiquitin
HvFST flavonol-sulfotransferase
HvHYP hypothetical protein
HvKAO ent-kaurenoic acid oxidase
HvEYA eyes absent homolog
HvPEI pectinase inhibitor domain containing protein
HvLEA embryogenic protein LEA
HvZUS high-affinity zinc uptake system membrane protein
HvETF electron transfer protein flavoprotein subunit beta
HvRGH resistance gene homolog
HvPGM beta-phosphoglucomutase
HvCYP cytochrome P450
HvFBX F-Box like protein
HvPUQ polyubiquitin
HvFST flavonol-sulfotransferase
HvHYP hypothetical protein
HvKAO ent-kaurenoic acid oxidase
HvEYA eyes absent homolog
HvPEI pectinase inhibitor domain containing protein
HvLEA embryogenic protein LEA
HvZUS high-affinity zinc uptake system membrane protein
HvETF electron transfer protein flavoprotein subunit beta
Fig. 3.12: Graphical representation of the syntenic relationships between the Rrs2 locus on barley chromosome 7HS and rice (Oryza sativa).

RESULTS 66
3.5.2 Synteny to Brachypodium distachyon
Due to its small genome size (350 Mb) and close evolutionary relationship,
Brachypodium distachyon (L.) Beauv. (abbreviated in this work as Bd) has become a
new model species for comparative genetics in cereal crops with large genomes such
as barley, maize and wheat (HUO et al., 2008). As reported by HUO et al. (2008) and
BORTIRI et al. (2008), Brachypodium is much closer related to barley and wheat than
to other grass species, such as rice. It was therefore interesting to compare the
degree of microsynteny and microcolinearity between Brachypodium and the barley
Rrs2 locus with that observed for rice (chapter 3.5.1). For this comparison the draft
sequence of the Brachypodium dystachyon genome with 4x genome coverage was
used (http://www.brachybase.org/). The Brachypodium Genome Browser Tool used
for visualizing the BLASTN results only showed the locations of predicted genes, but
no annotation.
The syntenic relationships of Brachypodium and barley are not known yet. In the
current analysis, most orthologous genes of the Rrs2 locus in barley were found on
Bd supercontig1. Seven orthologues were identified on this supercontig, whereas
other supercontigs only harboured two genes, on average (Fig. 3.13; supplementary
Tables A9, A10).
Orthologues of the flanking markers PSR119 and R2869 were found on Bd
supercontig1, together with orthologues of five genes (HvGSY, HvEYA, HvLEA,
HvPGM-1, HvPGM-2) located within the flanking markers. A similar picture can be
observed in rice, except for HvGSY. The third flanking marker (Xba6) and the HvKAO
gene orthologue was not present in the syntenic region of Brachypodium distachyon,
whereas this was the case in rice. Another gene (HvCYP) had its orthologue not in
the syntenic region, but elsewhere on Bd supercontig1. In contrast to rice, no
orthologues could be identified for the two HvFBX genes. Seven genes of the barley
BAC contigs were not found in the Brachypodium genome at all, three more than for
rice. The rest of genes of the Rrs2 locus in barley were located on other Bd
supercontigs (Fig. 3.13; supplementary Tables A9, A10). The marker and gene order
of the syntenic region on Bd supercontig1 seem reversed compared to that in barley
and rice. However, it is not clear whether there really exists an inversion in the
Brachypodium genome or if the apparent inversion is just the result of a reversed
display of supercontigs in the Brachypodium Genome Browser Tool. There was no
RESULTS 67
information available about which end of the supercontig corresponds to which
chromosome end.
In summary, a similar disruption of microsynteny and microcolinearity, like observed
for rice, could also be seen between the barley Rrs2 locus and Brachypodium
distachyon. A comparison of the locations of the best rice hits with the best
Brachypodium hits shows no concordance of chromosomal locations, except that
genes from the short arm of rice chromosome Os6, which also are found on the short
arm of chromosome 7H, are very often located on Bd supercontig 1. All other genes
show no conserved pattern of chromosomal location (Table 3.5). Since the sequence
information of the Brachypodium distachyon genome, which was used for the
comparison, is only a draft sequence with 4x genome coverage, a higher coverage
and better gene annotation could lead to an improved synteny to rice and barley in
this chromosomal region in the future.

RESULTS 68
Orthologous genes are connected by lines, genes which do not have an orthologue are shaded in gray. Arrows indicate the direction of transcription, if known. The BAC contigs are oriented so that the centromere is located on the right hand side, the supercontigs (orange) are depicted as in the Brachypodium Genome Browser (http://www.brachybase.org), their orientation is not known.
Xba6
Brachypodium distachyon supercontig
barley BAC contig of Rrs2 locus
RFLP marker
gene, arrow indicates direction of transcription
Xba6
Brachypodium distachyon supercontig
barley BAC contig of Rrs2 locus
RFLP marker
gene, arrow indicates direction of transcription
Bd Super0
PS
R119
Xba6
R2869
HvR
GH
-1
HvP
GM
-1
HvF
BX
-1
HvC
YP
HvF
BX
-2
HvP
UQ
HvP
GM
-2
HvR
GH
-2
HvR
GH
-3
HvF
ST
-1
HvF
ST
-2*
HvR
LK
*
Bd Super3
Bd Super8
Bd Super1
Bd Super6
Bd Super5H
vKA
O*
HvE
YA
HvH
YP
-2*
proximal BAC contig
BAC contigs and markers of Rrs2 region on 7HS
hits to Brachypodium distachyon supercontigs
HvP
EI-1*
HvL
EA
HvH
YP
-3
HvE
TF
*
HvZ
US
*Bd Super2
Bd Super7
hits to Brachypodium distachyon supercontigs
distal BAC contig
HvP
EI-2*
HvH
YP
-1*
HvG
SY
*
?
HvRGH resistance gene homolog
HvPGM beta-phosphoglucomutase
HvCYP cytochrome P450
HvFBX F-Box like protein
HvPUQ polyubiquitin
HvFST flavonol-sulfotransferase
HvHYP hypothetical protein
HvKAO ent-kaurenoic acid oxidase
HvEYA eyes absent homolog
HvPEI pectinase inhibitor domain containing protein
HvLEA embryogenic protein LEA
HvZUS high-affinity zinc uptake system membrane protein
HvETF electron transfer protein flavoprotein subunit beta
HvGSY beta 1,3 glucan synthase
Fig. 3.13: Graphical representation of the syntenic relationships between the Rrs2 locus on barley chromosome 7HS and Brachypodium distachyon.

RESULTS 69
Genes are sorted according to their chromosomal location on barley chromosome 7HS, starting at the top of the table with marker PSR119, located distally near the telomeric end of the chromosome and ending with marker R2869 located proximally towards the centromere.
barley marker/gene
locus of orthologous rice gene
locus of orthologous Brachypodium gene
PSR119 LOC_Os06g01850 super1.1752
Xba6 LOC_Os06g01972 super8.1175
HvRGH-1 LOC_Os04g02520 super3.4098
HvPGM-1 LOC_Os06g01990 super1.1730
HvFBX-1 LOC_Os12g38090 –
HvCYP LOC_Os08g16320 super1.5269
HvFBX-2 LOC_Os12g38090 –
HvPGM-2 LOC_Os06g01990 super1.730
HvPUQ LOC_Os02g06640 super3.1451
HvRGH-2 LOC_Os11g11790 super8.399
LOC_Os11g45930 –
HvRGH-3 LOC_Os11g45750 super6.1239
LOC_Os05g40150 super6.1247
HvFST-1 LOC_Os09g38239 super2.2415
HvETF LOC_Os04g10400 super5.683
HvFST-2 LOC_Os09g38239 super2.2427
HvRLK LOC_Os06g36270 super0.788
HvPEI-1 – –
HvHYP-1 – –
distal barley BA
C co
ntig on 7H
S
HvPEI-2 – –
gap HvGSY LOC_Os06g02260 super1.1722
HvZUS – –HvHYP-2 LOC_Os12g01250 super7.1046
HvKAO LOC_Os06g02019 super0.2031
HvEYA LOC_Os06g02028 super1.1723
HvLEA LOC_Os06g02040 super1.724
HvHYP-3 LOC_Os07g48140 –
MWG555a – –
proxima
l barley B
AC
contig
on 7HS
R2869 LOC_Os06g02144 super1.1480
3.6 Association study
A large physical area co-segregating with the Rrs2 gene was identified through fine
mapping and chromosome walking. This co-segregating region could not be
delimited further due to the lack of recombination events in the vicinity of the Rrs2
gene within the mapping population (chapter 3.3). With association mapping
approaches based on populations composed of diverse cultivars a much higher
marker resolution for fine mapping genes can be obtained than with classical
Table 3.5: Comparison of the location of orthologous genes found in the Rrs2 locus on barley chromosome 7HS, in rice and Brachypodium.

RESULTS 70
mapping populations (TOMMASINI et al., 2007). Therefore, an association mapping
approach with the aim to identify recombination events within the co-segregating
region among a set of diverse barley genotypes was carried out.
According to literature data and personal communications, 58 different genotypes
were chosen based on their reported resistance phenotype (variety names and
corresponding literature citations are listed in supplementary Table A1). Since some
accessions with the same name were acquired from more than one source, in total a
redundant set of 72 accessions was used in the association study. For obtaining
phenotypic data, all varieties underwent the same resistance test as the recombinant
lines of the Atlas × Steffi mapping population (chapter 2.2). In total, 48 accessions
resistant to Rhynchosporium secalis were identified. Out of them 22 were reported to
carry the Rrs2 gene (supplementary Table A1). The remaining 26 resistant
accessions were described to carry other or unknown resistance genes. Seventeen
varieties were identified as susceptible and seven showed an intermediate resistance
reaction. In the latter cultivars the resistance reaction is most probably of quantitative
nature and not mediated by a major resistance gene. The varieties Brier (CI 7157),
Pioneer, and Turk (CI 14400) were reported to carry the resistance gene Rrs1
(supplementary Table A1), but the resistance test performed in this study showed a
susceptible reaction to the fungal isolate “Sachs 271”. Most probably the genotypes
used here were different than the ones used in other studies. All accessions and the
results of the resistance test are listed in supplementary Table A2.
An overview of the distribution of countries of origin, seasonal habit, row number, and
adaptation status among the set of 58 different genotypes is depicted in Table 3.6.
Around 72% of the varieties originate from either USA, Germany, Ethiopia or United
Kingdom, where USA contributes the majority of lines (20.7%) and United Kingdom
with 14.7% the least number of varieties. The remaining 28% of the cultivars originate
from 11 different countries and one unknown country. The chosen genotypes are
mainly spring barleys (86.2%), 2-rowed and 6-rowed barleys are almost equally
distributed and 27.6% of the lines are classified as landraces. The genotypes, which
carried the Rrs2 gene, are mainly adapted material or varieties, only two genotypes
(14.3%) are landraces. The Rrs2 lines originated mainly from USA (five genotypes)
and United Kingdom (four genotypes), but also from Australia, Algeria, Argentina,

RESULTS 71
Syria, and Uruguay (one genotype each). All Rrs2 carrying cultivars belong to the
spring barley pool, 35.7% are 2-rowed and 64.3% are 6-rowed genotypes.
origin/ seasonal habit/ row number/ adaptation status
number of genotypes
percentage [%] number of Rrs2carrying varieties
percentage [%]
USA 12 20.7 5 35.71
Germany 11.51 19.8 – –
Ethiopia 10 17.2 – –
United Kingdom 8.51 14.7 4 28.57
Australia 4 6.9 1 7.14
Turkey 2 3.4 – –
Algeria 1 1.7 1 7.14
Argentina 1 1.7 1 7.14
Belgium 1 1.7 – –
Canada 1 1.7 – –
Mexico 1 1.7 – –
Spain 1 1.7 – –
Syria 1 1.7 1 7.14
Ukraine 1 1.7 – –
Uruguay 1 1.7 1 7.14
unknown 1 1.7 – –
winter 8 16.0 – –
spring 50 86.2 14 100
2-rowed 28 48.3 5 35.7
6-rowed 30 51.7 9 64.3
landraces 16 27.6 2 14.3
adapted material/ varieties 42 72.4 12 85.71 one variety originates from both UK and Germany, therefore each country received 0.5 points
3.6.1 SNP and haplotype patterns of six genomic regions located near or within the
co-segregating area of Rrs2 on barley chromosome 7HS
In order to get a first overview of the location of possible recombination events, six
genomic regions distributed across the co-segregating region of Rrs2 and
neighboring regions on chromosome 7HS were chosen for obtaining genotypic data
of the 72 accessions (Fig. 3.14).
Table 3.6: Distribution of country of origin, seasonal habit, row number, and adaptation status among the 58 different genotypes studied in the association study.

RESULTS 72
gap
134N7_con5-3RGH-3
Put_acri_res_gene_7H 668A17_e11-2
FST-2
possible location of Rrs2 resistance gene
distal BAC contig proximal BAC contig
668A17_g1-3
28,922 bp 45,004 bp approx. 80 to 100 kb
located on same BAC
clone, approx. 5 to 50 kb
unknown distance centromere
gap
134N7_con5-3RGH-3
Put_acri_res_gene_7H 668A17_e11-2
FST-2
possible location of Rrs2 resistance gene
distal BAC contig proximal BAC contig
668A17_g1-3
28,922 bp 45,004 bp approx. 80 to 100 kb
located on same BAC
clone, approx. 5 to 50 kb
unknown distance centromerecentromere
The PCR fragments are located near or within the co-segregating region of Rrs2. As far as known, exact or estimated distances between the PCR fragments are given. The green area indicates the co-segregating region, the striped green area denotes the region in which the border of the Rrs2 co-segregating region is located. The exact position of the border is not known.
The chosen genomic regions were amplified from each of the 72 varieties by PCR,
sequenced and analyzed concerning their SNP and haplotype patterns.
The PCR fragment sizes ranged from 252 bp to 666 bp, totaling 2,583 bp of
sequence information. Overall, 132 polymorphic sites, 129 SNPs and 3 INDELs,
were identified. About half of the observed single nucleotide polymorphisms, 69
SNPs, had an allele frequency <10% and were therefore regarded as minor SNPs.
The average number of SNPs per kb for major SNPs (allele frequency >10%) was 24
which is equivalent to 1 SNP per 42 bp. The number of haplotypes (identical SNP
pattern shared by different genotypes) for each PCR fragment ranged from 4 to 12
(Table 3.7).
Fig. 3.14: Overview of a section of the physical map of the Rrs2 locus on barley chromosome 7HS indicating the genomic location and names of six PCR fragments which were analyzed in the association study.

RESULTS 73
PCR fragment name
fragment size
haplo-types
SNPs INDELs SNPs <10% frequency
SNPs1 >10% frequency
SNPs1/kb >10% frequency
RGH-3 459 bp 4 32 – 2 30 65.4
Put_acri_res_ gene_7H
324 bp 12 28 – 19 9 27.8
FST-2 402 bp 8 13 1 10 4 10.0
668A17_g1-3 480 bp 9 17 – 14 3 6.3
668A17_e11-2 252 bp 8 18 1 10 9 35.7
134N7_con5-3 666 bp 8 21 1 14 8 12.0
2583 bp analyzed in total132
polymorphisms in total
69 minor SNPs
63 major SNPs1
24 SNPs1/kb on average
1 including INDELs
Detailed SNP and haplotype patterns of all six PCR fragments are shown in
supplementary Fig. A3 to A8. The general conclusion of the haplotype analysis
across the genomic region, depicted in Fig. 3.15, is that recombination hardly
occurred among varieties carrying Rrs2. Except for the outer PCR fragments, RGH-3
and 134N7_con5-3, the Rrs2 possessing varieties always shared the same
haplotype. For those PCR fragments, the variety Osiris and one accession of variety
Atlas 46, Acc. HOR20489, belonged to a different haplotype and seemed to have
undergone recombination. However, these results have to be regarded with caution
since the variety Osiris used in this study was heterozygous and sequence data
probably only originates from one of the two alleles present. Furthermore, Acc.
HOR20489 of Atlas 46 possessed a completely different sequence for the two PCR
fragments than the other three accessions of Atlas 46 in the study. Therefore, it is
doubtful whether Acc. HOR20489 is a true genotype of variety Atlas 46.
There are three accessions representing the varieties Onslow (Acc. 406008, 20557)
and Gairdner (Acc. 408175) which were classified as Rrs2 carriers based on the
resistance reaction with differential isolates of Rhynchosporium secalis (Hugh
Wallwork, SARDI, Adelaide, Australia; personal communication). Those varieties are
closely related, Onslow is a parent of Gairdner. The two genotypes never shared the
same haplotype as the rest of the Rrs2 carrying accessions, except in one case
(PCR fragment RGH-3, Fig. 3.15). Therefore, it is questionable if Onslow and
Gairdner really carry the Rrs2 gene.
Table 3.7: Summary of the SNP and haplotype analysis of 58 barley genotypes based on sequence data of six PCR fragments originating from the Rrs2 region on barley chromosome 7HS.
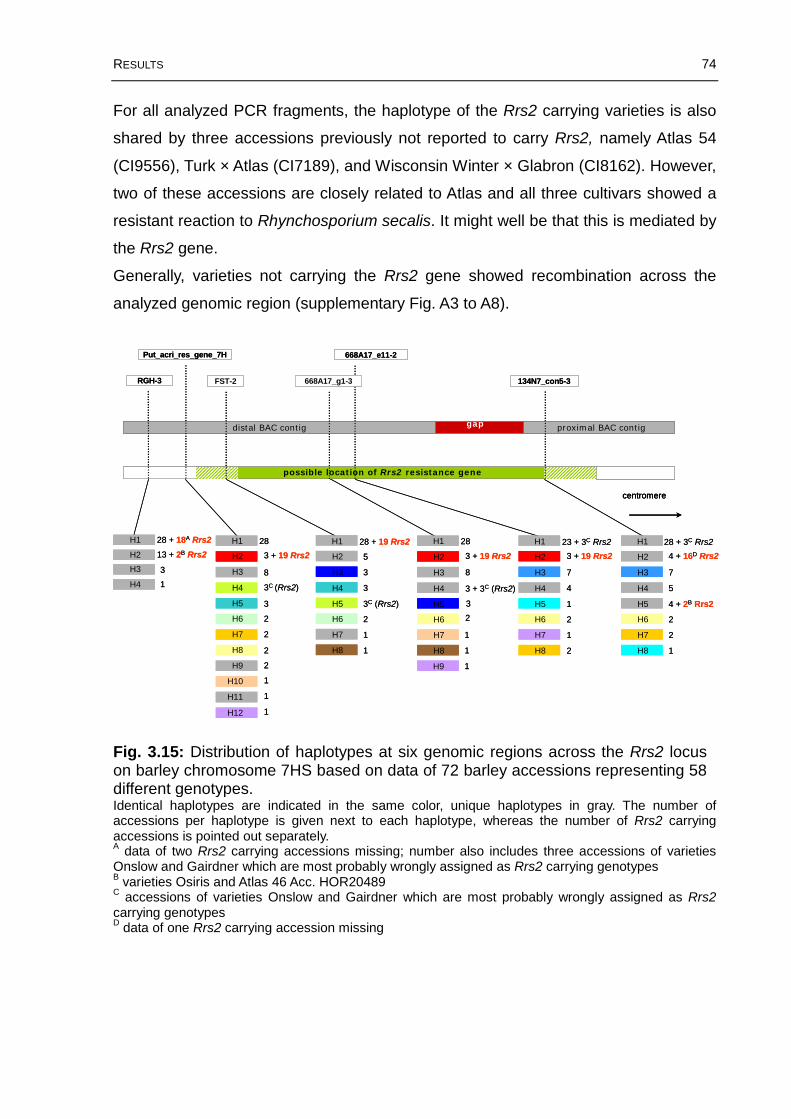
RESULTS 74
For all analyzed PCR fragments, the haplotype of the Rrs2 carrying varieties is also
shared by three accessions previously not reported to carry Rrs2, namely Atlas 54
(CI9556), Turk × Atlas (CI7189), and Wisconsin Winter × Glabron (CI8162). However,
two of these accessions are closely related to Atlas and all three cultivars showed a
resistant reaction to Rhynchosporium secalis. It might well be that this is mediated by
the Rrs2 gene.
Generally, varieties not carrying the Rrs2 gene showed recombination across the
analyzed genomic region (supplementary Fig. A3 to A8).
gap
134N7_con5-3RGH-3
Put_acri_res_gene_7H 668A17_e11-2
FST-2
possible location of Rrs2 resistance gene
distal BAC contig proximal BAC contig
H1
H2
H3
H4
28 + 18A Rrs2
13 + 2B Rrs2
3
1
H1
H2
H3
H4
H5
H6
H7
H8
H9
H10
H11
H12
H1
H2
H3
H4
H5
H6
H7
H8
H2
H3
H4
H5
H6
H7
H8
H9
H1 2828
3 + 19 Rrs2
8
3C (Rrs2)
3
2
3
2
2
2
2
1
1
1
3
3
28 + 19 Rrs2
2
3C (Rrs2)
5
1
1
3 + 19 Rrs2
8
3 + 3C (Rrs2)
1
1
1
H1
H2
H3
H4
H5
H6
H7
H8
4
2
7
23 + 3C Rrs2
1
1
2
3 + 19 Rrs2
H1
H2
H3
H4
H5
H6
H7
H8
5
2
7
28 + 3C Rrs2
4 + 2B Rrs2
2
1
4 + 16D Rrs2
centromere
668A17_g1-3
gap
134N7_con5-3RGH-3
Put_acri_res_gene_7H 668A17_e11-2
FST-2
possible location of Rrs2 resistance gene
distal BAC contig proximal BAC contig
H1
H2
H3
H4
28 + 18A Rrs2
13 + 2B Rrs2
3
1
H1
H2
H3
H4
H5
H6
H7
H8
H9
H10
H11
H12
H1
H2
H3
H4
H5
H6
H7
H8
H2
H3
H4
H5
H6
H7
H8
H9
H1 2828
3 + 19 Rrs2
8
3C (Rrs2)
3
2
3
2
2
2
2
1
1
1
3
3
28 + 19 Rrs2
2
3C (Rrs2)
5
1
1
3 + 19 Rrs2
8
3 + 3C (Rrs2)
1
1
1
H1
H2
H3
H4
H5
H6
H7
H8
4
2
7
23 + 3C Rrs2
1
1
2
3 + 19 Rrs2
H1
H2
H3
H4
H5
H6
H7
H8
5
2
7
28 + 3C Rrs2
4 + 2B Rrs2
2
1
4 + 16D Rrs2
centromerecentromere
668A17_g1-3
Identical haplotypes are indicated in the same color, unique haplotypes in gray. The number of accessions per haplotype is given next to each haplotype, whereas the number of Rrs2 carrying accessions is pointed out separately. A data of two Rrs2 carrying accessions missing; number also includes three accessions of varieties Onslow and Gairdner which are most probably wrongly assigned as Rrs2 carrying genotypesB varieties Osiris and Atlas 46 Acc. HOR20489C accessions of varieties Onslow and Gairdner which are most probably wrongly assigned as Rrs2carrying genotypesD data of one Rrs2 carrying accession missing
Fig. 3.15: Distribution of haplotypes at six genomic regions across the Rrs2 locus on barley chromosome 7HS based on data of 72 barley accessions representing 58 different genotypes.

RESULTS 75
The chromosomal region where no recombination could be observed among
varieties carrying Rrs2, co-localized with the region that co-segregates with Rrs2
within the Atlas × Steffi mapping population, suggesting a general suppression of
recombination for this area in genotypes which carry the Rrs2 gene.
3.6.2 Cluster analysis
A cluster analysis was performed with the SNP data obtained of all six PCR
fragments. Within the resulting unrooted neighbor-joining tree three major
haplogroups could be identified. (Fig. 3.16).
Almost all varieties carrying the Rrs2 gene were clustered in haplogroup 1 due to the
observed haplotype pattern described in chapter 3.6.1. As expected, Osiris and Atlas
46 Acc. HOR20489 did not cluster in haplogroup 1, since they only shared four out of
six haplotypes with the accessions of group 1. The same is true for Onslow and
Gairdner. However, as mentioned above, they are most probably wrongly assigned
as Rrs2 carrying genotypes. The three varieties Atlas 54 (CI9556), Turk × Atlas
(CI7189), and Wisconsin Winter × Glabron (CI8162) appear in haplogroup 1, since
they always share the same haplotype like the rest of the Rrs2 carrying genotypes.
Therefore, it is hypothesized that they also carry the Rrs2 gene.
Overall, it can be observed that all accessions carrying the same variety name or with
direct relationship are clustered together, also suggesting a good conservation of
genotypes across different genebanks. The only exceptions are the accession Atlas
46 Acc. HOR20489 and the variety Forrest. It is not clear why Atlas 46
Acc. HOR20489 showed a different SNP pattern for two of the six PCR fragments
compared to the other three Atlas 46 accessions which were analyzed. However, for
the accessions named Forrest it is apparent that they belong to two different
genotypes. The variety Forrest carrying Rrs2 is of Australian origin, whereas Forrest
(CI 9187) comes from USA and shows a susceptible reaction to Rhynchosporium
secalis.

RESULTS 76
Description of figure continued on next page.
Fig. 3.16: Cluster analysis of 72 barley accessions.
Group 2
Group 3
Group 1

RESULTS 77
Fig. 3.16 continued: The unrooted neighbor-joining tree is based on SNP patterns of six PCR fragments of the Rrs2 region on chromosome 7HS. Numbers on the branches indicate the frequency (%) with which a clade appeared in 800 bootstrap samples. Haplogroups 1 to 3, row number (2 or 6), and growing type (S or W) as well as resistance phenotype are given. The resistance reaction is indicated with “resistant” for those varieties which do not carry the Rrs2 gene, but which were found to be resistant against Rhynchosporium secalis.
3.6.3 Linkage disequilibrium (LD) analysis of haplotypes
The degree of linkage disequilibrium (LD), which measures the non-random
association between polymorphisms at different loci, was assessed within the set of
72 accessions for all haplotypes of the six PCR fragments and the Rrs2 gene as a
presence/absence trait using the software package TASSEL.
The pairwise comparisons revealed a high LD (r2-values between 0.48 and 1.0) for
haplotypes H2 of PCR fragments Put_acri_res_gene_7H, 668A17_g1-3,
668A17_e11-2, 134N7_con5-3, and the Rrs2 resistance gene (Table 3.8, Fig. 3.17).
The haplotypes H2 of the mentioned PCR fragments are shared almost exclusively
by Rrs2 carrying varieties. Other haplotypes, which showed an elevated LD
(Fig. 3.17), were based on comparisons of rare haplotypes most of which correspond
to the colored haplotypes in (Fig. 3.15).
pairwise comparison R² p-value
H2_Put_acri_res_gene_7H H2_668A17_g1-3 1.0 <0.0001H2_Put_acri_res_gene_7H H2_668A17_e11-2 1.0 <0.0001H2_Put_acri_res_gene_7H H2_134N7_con5-3 0.8 <0.0001H2_668A17_g1-3 H2_668A17_e11-2 1.0 <0.0001H2_668A17_g1-3 H2_134N7_con5-3 0.8 <0.0001H2_668A17_e11-2 H2_134N7_con5-3 0.8 <0.0001Rrs2 H2_Put_acri_res_gene_7H 0.64 <0.0001Rrs2 H2_668A17_g1-3 0.64 <0.0001Rrs2 H2_668A17_e11 0.64 <0.0001Rrs2 H2_134N7_con5-3 0.48 <0.0001
Table 3.8: LD analysis results of the pairwise comparisons of haplotypes H2 of PCR fragments Put_acri_res_gene_7H, 668A17_g1-3, 668A17_e11-2, and 134N7_con5-3 with each other and with the Rrs2 gene.

RESULTS 78
Each point in the LD matrix represents a comparison between a pair of haplotypes or between a haplotype and the Rrs2 gene with the R2-values displayed above the diagonal and the corresponding p-values below; blue and orange circles and arrows show corresponding pairs of haplotypes or haplotpye/Rrs2 pairs, respectively, which are significantly associated with Rrs2 resistance.
Looking at the distribution of LD (resulting from pairwise comparisons of all
haplotypes with the Rrs2 gene) across the chromosomal region analyzed, a stable
and high LD can be observed for all haplotypes shared almost exclusively by Rrs2
carrying varieties (haplotypes H2 of Put_acri_res_gene_7H, 668A17_g1-3,
668A17_e11-2, and 134N7_con5-3). All other haplotypes show a low LD (Fig. 3.18).
The linkage disequilibrium analysis indicates that for varieties carrying the Rrs2 gene,
a large stretch of genomic sequence containing the Rrs2 gene is not randomly
inherited, but as a haplotype block. However, in most varieties, which do not possess
the Rrs2 gene, this genomic region is inherited randomly and recombination takes
place.
Fig. 3.17: Linkage Disequilibrium (LD) matrix showing the correlation of haplotypes of six PCR fragments and Rrs2 mediated resistance.

RESULTS 79
The x-axis depicts the different haplotypes of the analysed PCR fragments, the y-axis R2 values. Haplotypes H2 of PCR fragments Put_Acri_res_gene_7H, 668A17_g1-3, 668A17_e11-2 and 134N7_con5-3 are comprised of mostly Rrs2 carrying varieties. PCR fragments are depicted in chromosomal order; red line marks the physical gap in the BAC contig, highlighted PCR fragments are located within the co-segregating region of Rrs2.
3.6.4 Association of SNPs and haplotypes of six PCR fragments with the Rrs2
phenotype
For all six analyzed genomic fragments distributed across the Rrs2 locus on barley
chromosome 7HS, nearly all genotypes that carry the Rrs2 gene exhibited the same
SNP pattern. For certain PCR fragments, some SNPs were exclusively present in
genotypes which carry the Rrs2 gene. In order to obtain a statistical measurement of
the strength of the observed associations between certain SNPs or haplotypes with
the Rrs2 trait, associations were calculated with the program TASSEL. Associations
were regarded significant for pcorr<0.0007 (p<0.05, Bonferroni corrected).
In the following, association calculations are presented for each PCR fragment
individually, ordered by chromosomal position at the Rrs2 locus, starting from the
distal (telomeric) side.
Fig. 3.18: LD measurement R2 of pairwise comparisons of all haplotypes across the analyzed genomic area with the Rrs2 phenotype.
0
0,1
0,2
0,3
0,4
0,5
0,6
0,7
1 2 3 4 1 2 3 4 5 6 7 8 9 10 11 1 2 1 2 3 4 5 6 7 8 1 2 3 4 5 6 7 8 9 1 2 3 4 5 6 7 8 1 2 3 4 5 6 7 8
R²
RGH-3 Put_Acri_res_gene_7H FST-2 668A17_g1-3 668A17_e11-2 134N7_con5-3
centromere
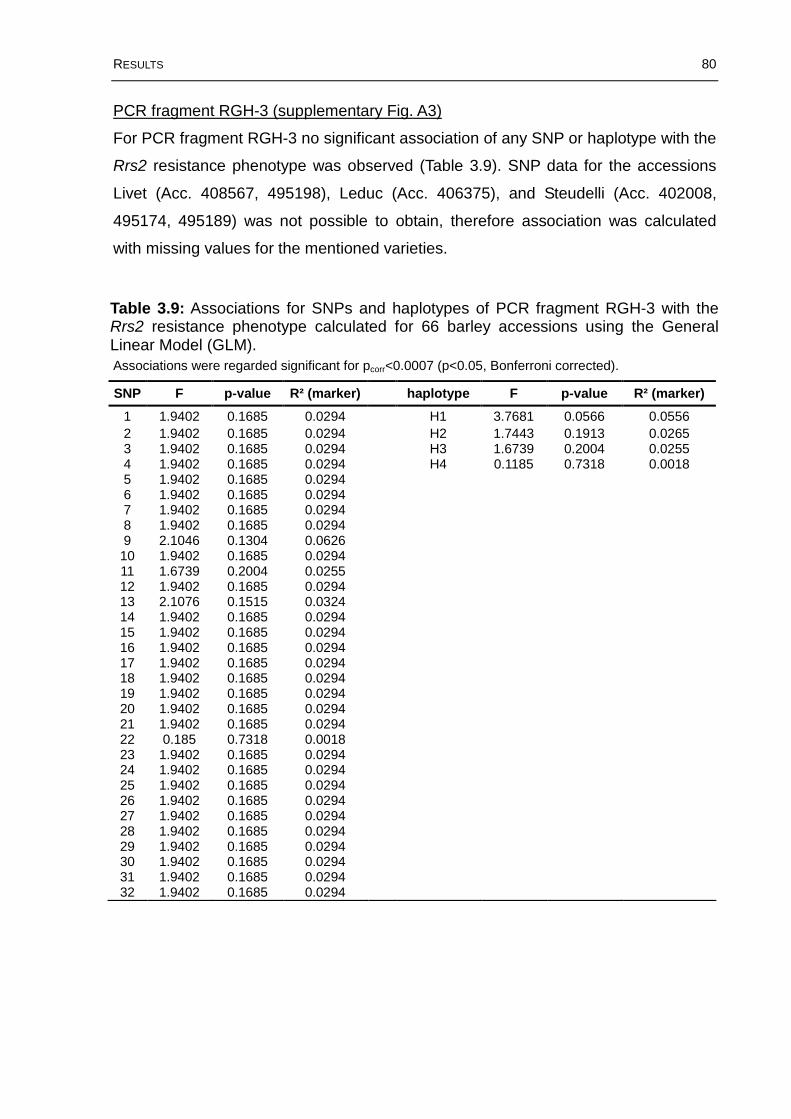
RESULTS 80
PCR fragment RGH-3 (supplementary Fig. A3)
For PCR fragment RGH-3 no significant association of any SNP or haplotype with the
Rrs2 resistance phenotype was observed (Table 3.9). SNP data for the accessions
Livet (Acc. 408567, 495198), Leduc (Acc. 406375), and Steudelli (Acc. 402008,
495174, 495189) was not possible to obtain, therefore association was calculated
with missing values for the mentioned varieties.
Associations were regarded significant for pcorr<0.0007 (p<0.05, Bonferroni corrected).
SNP F p-value R² (marker) haplotype F p-value R² (marker)
1 1.9402 0.1685 0.0294 H1 3.7681 0.0566 0.05562 1.9402 0.1685 0.0294 H2 1.7443 0.1913 0.02653 1.9402 0.1685 0.0294 H3 1.6739 0.2004 0.02554 1.9402 0.1685 0.0294 H4 0.1185 0.7318 0.00185 1.9402 0.1685 0.02946 1.9402 0.1685 0.02947 1.9402 0.1685 0.02948 1.9402 0.1685 0.02949 2.1046 0.1304 0.062610 1.9402 0.1685 0.029411 1.6739 0.2004 0.025512 1.9402 0.1685 0.029413 2.1076 0.1515 0.032414 1.9402 0.1685 0.029415 1.9402 0.1685 0.029416 1.9402 0.1685 0.029417 1.9402 0.1685 0.029418 1.9402 0.1685 0.029419 1.9402 0.1685 0.029420 1.9402 0.1685 0.029421 1.9402 0.1685 0.029422 0.185 0.7318 0.001823 1.9402 0.1685 0.029424 1.9402 0.1685 0.029425 1.9402 0.1685 0.029426 1.9402 0.1685 0.029427 1.9402 0.1685 0.029428 1.9402 0.1685 0.029429 1.9402 0.1685 0.029430 1.9402 0.1685 0.029431 1.9402 0.1685 0.029432 1.9402 0.1685 0.0294
Table 3.9: Associations for SNPs and haplotypes of PCR fragment RGH-3 with the Rrs2 resistance phenotype calculated for 66 barley accessions using the General Linear Model (GLM).

RESULTS 81
PCR fragment Put_acri_res_gene_7H (supplementary Fig. A4)
Five SNPs were found to be significantly associated with the Rrs2 phenotype for
PCR fragment Put_acri_res_gene_7H (Table 3.10). Within the 72 studied
accessions, all genotypes belonging to haplotype H2 and carrying the Rrs2 gene
possess alleles at SNP positions 9, 25, and 28, which are not present in genotypes of
other haplotypes. These SNPs are therefore highly associated with the Rrs2
phenotype. The allele ‘G’ of SNP 27, which is found in most of the cultivars carrying
Rrs2, is also present in a few non-Rrs2 carrying varieties. Therefore, it is only
characteristic for the Rrs2 phenotype in combination with allele ‘C’ of SNP 28. The
significant association of SNP 14 with the Rrs2 resistance phenotype was lost after
Bonferroni correction. This could be regarded as a Type II error or “false negative”,
since allele ‘A’ of SNP 14 and allele ‘C’ of SNP 15 are characteristic for the Rrs2
phenotype when they occur in combination (supplementary Fig. A4).
Significant associations after Bonferroni correction (pcorr<0.0007) are marked with *. Yellow highlighted SNPs and haplotype H2 are associated with the Rrs2 phenotype, light blue highlighted SNPs are only characteristic for Rrs2 in combination with the neighboring highlighted SNP. Other significant associations are not correlated with the Rrs2 phenotype.
SNP F p-value R² (marker) haplotype F p-value R² (marker)
1 0.1882 0.6657 0.0027 H1 20.4913 2.39e-05* 0.22642 0.6557 0.4208 0.0093 H2 111.054 4.32e-16* 0.61343 0.1882 0.6657 0.0027 H3 3.2823 0.0743 0.04484 0.6557 0.4208 0.0093 H4 7.5155 0.0078 0.0975 0.6557 0.4208 0.0093 H5 1.9994 0.1618 0.02786 0.6557 0.4208 0.0093 H6 0.6557 0.4208 0.00937 1.9994 0.1618 0.0278 H7 0.95 0.3331 0.01348 0.6557 0.4208 0.0093 H8 0.95 0.3331 0.01349 111.054 4.32e-16* 0.6134 H9 0.6557 0.4208 0.009310 0.824 0.443 0.0233 H10 0.3217 0.5724 0.004611 0.3217 0.5724 0.0046 H11 0.3217 0.5724 0.004612 1.9994 0.1618 0.0278 H12 0.6354 0.4281 0.00913 0.6557 0.4208 0.009314 6.0436 0.0164 0.079515 20.4913 2.39e-05* 0.226416 1.9994 0.1618 0.027817 1.9994 0.1618 0.027818 2.4114 0.125 0.033319 0.6557 0.4208 0.009320 0.3217 0.5724 0.004621 0.5145 0.4756 0.007322 1.9994 0.1618 0.027823 1.9994 0.1618 0.027824 2.4114 0.125 0.033325 77.5464 6.00e-13* 0.525626 0.95 0.3331 0.013427 51.1309 6.63e-10* 0.422128 54.9161 5.38e-15* 0.6142
Table 3.10: Associations for SNPs and haplotypes of PCR fragment Put_acri_res_gene_7H with the Rrs2 resistance phenotype calculated for 72 barley accessions using the General Linear Model (GLM).

RESULTS 82
PCR fragment FST-2 (supplementary Fig. A5)
For PCR fragment FST-2 no significant association of any SNP or haplotype with the
Rrs2 resistance phenotype could be observed within the set of 72 accessions
(Table 3.11).
Associations were regarded significant for pcorr<0.0007 (p<0.05, Bonferroni corrected).
PCR fragment 668A17_g1-3 (supplementary Fig. A6)
Only Rrs2 carrying varieties belonging to haplotype H2 possess allele ‘A’ of SNP 4,
which is highly associated with the Rrs2 phenotype (Table 3.12). Other significant
associations could not be correlated with the Rrs2 phenotype. These associations
are due to the occurrence of specific alleles preferentially in varieties designated
“non-Rrs2 resistant” or “susceptible” (supplementary Fig. A6).
Table 3.11: Associations for SNPs and haplotypes of PCR fragment FST-2 with the Rrs2 resistance phenotype calculated for 72 barley accessions using the General Linear Model (GLM).
SNP F p-value R² (marker) haplotype F p-value R² (marker)
1 0.6588 0.4198 0.0095 H1 2.0153 0.1602 0.0282 2.3421 0.1304 0.0324 H2 2.3641 0.1287 0.03273 1.0028 0.3201 0.0141 H3 1.0028 0.3201 0.01414 2.3421 0.1304 0.0324 H4 1.9994 0.1618 0.02785 1.9994 0.1618 0.0278 H5 7.5155 0.0078 0.0976 1.9994 0.1618 0.0278 H6 0.6557 0.4208 0.00937 7.5155 0.0078 0.097 H7 0.3217 0.5724 0.00468 0.6557 0.4208 0.0093 H8 0.3217 0.5724 0.00469 1.9994 0.1618 0.027810 1.9994 0.1618 0.027811 0.0067 0.9349 9.75e-05
12 1.9994 0.1618 0.027813 1.0208 0.3158 0.014414 7.5155 0.0078 0.097

RESULTS 83
Significant associations after Bonferroni correction (pcorr<0.0007) are marked with *. The yellow highlighted SNP and haplotype H2 are associated with the Rrs2 phenotype. Other significant associations are not correlated with the Rrs2 phenotype.
SNP F p-value R² (marker) haplotype F p-value R² (marker)
1 1.3636 0.2469 0.0191 H1 24.2067 5.53e-06* 0.2572 1.0028 0.3201 0.0141 H2 111.054 4.32e-16* 0.61343 1.0028 0.3201 0.0141 H3 4.7532 0.0326 0.06364 111.054 4.32e-16* 0.6134 H4 1.1601 0.2851 0.01635 0.6354 0.4281 0.009 H5 1.0028 0.3201 0.01416 0.3217 0.5724 0.0046 H6 0.95 0.3331 0.01347 0.95 0.3331 0.0134 H7 0.3217 0.5724 0.00468 0.3217 0.5724 0.0046 H8 0.3217 0.5724 0.00469 0.3217 0.5724 0.0046 H9 0.6354 0.4281 0.00910 0.95 0.3331 0.013411 0.3217 0.5724 0.004612 0.3217 0.5724 0.004613 1.0028 0.3201 0.014114 1.1601 0.2851 0.016315 16.7727 1.12e-04* 0.193316 16.7727 1.12e-04* 0.193317 0.95 0.3331 0.0134
PCR fragment 668A17_e11-2 (supplementary Fig. A7)
For PCR fragment 668A17_e11-2, four SNPs were found to be highly associated with
the Rrs2 resistance (Table 3.13). All Rrs2 carrying varieties, belonging to haplotype
H2, possess alleles at SNP positions 5, 15, 16, and 17 which are not found in any of
the other tested varieties. Additionally, SNPs 6, 11, 12, and 15 were also found to be
significantly associated with the Rrs2 phenotype. However, similarly to SNPs of PCR
fragment Put_acri_res_gene_7H, they are only 100% correlated with Rrs2 in
combination with the neighboring SNPs (supplementary Fig. A7).
Table 3.12: Associations for SNPs and haplotypes of PCR fragment 668A17_g1-3 with the resistance phenotype calculated for 72 barley accessions using the General Linear Model (GLM).

RESULTS 84
Significant associations after Bonferroni correction (pcorr<0.0007) are marked with *. Yellow highlighted SNPs and haplotype H2 are associated with the Rrs2 phenotype, light blue highlighted SNPs are only characteristic for Rrs2 in combination with the neighboring highlighted SNP(s). Other significant associations are not correlated with the Rrs2 phenotype.
SNP F p-value R² (marker) haplotype F p-value R² (marker)
1 1.3707 0.2457 0.0195 H1 13.5612 4.51e-04* 0.16232 1.3707 0.2457 0.0195 H2 111.054 4.32e-16* 0.61343 4.3198 0.0414 0.0589 H3 4.3077 0.0416 0.0584 0.95 0.3331 0.0134 H4 1.3636 0.2469 0.01915 111.054 4.32e-16* 0.6134 H5 0.3217 0.5724 0.00466 16.7727 1.12e-04* 0.1933 H6 0.95 0.3331 0.01347 0.6354 0.4281 0.009 H7 0.6354 0.4281 0.0098 0.6354 0.4281 0.009 H8 0.95 0.3331 0.01349 1.295 0.259 0.018210 0.6354 0.4281 0.00911 16.7727 1.12e-04* 0.193312 9.2388 2.82e-04* 0.213713 111.054 4.32e-16* 0.613414 1.295 0.259 0.018215 16.7727 1.12e-04* 0.193316 111.054 4.32e-16* 0.613417 111.054 4.32e-16* 0.613418 0.9517 0.3327 0.013619 4.3198 0.0414 0.0589
PCR fragment 134N7_con5-3 (supplementary Fig. A8)
In PCR fragment 134N7_con5-3, four SNPs are significantly associated with the Rrs2
phenotype (Table 3.14). All varieties belonging to haplotype H2, are carrying alleles
at SNP positions 2, 3, 10, and 22 which do not occur in varieties of any other
haplotype. In contrary to previously described PCR fragments, haplotype H2 is not
only shared by Rrs2 carrying varieties, but also by one additional genotype (Cebada
Atlas Acc. HOR19750), which for no other PCR fragment shared the same SNP
pattern than Rrs2 carrying varieties. SNPs 11 and 21 are also significantly associated
with the Rrs2 phenotype, but are only characteristic for Rrs2 in combination with
SNPs 10 and 22, respectively (supplementary Fig. A8). SNP data for the accession
Livet (Acc. 408567) was not possible to obtain, therefore association was calculated
with missing values for this variety.
Table 3.13: Associations for SNPs and haplotypes of PCR fragment 668A17_e11-2 with the resistance phenotype calculated for 72 barley accessions using the General Linear Model (GLM).

RESULTS 85
Significant associations after Bonferroni correction (pcorr<0.0007) are marked with *. Yellow highlighted SNPs and haplotype H2 are associated with the Rrs2 phenotype, light blue highlighted SNPs are only characteristic for Rrs2 in combination with the neighboring highlighted SNP(s). Other significant associations are not correlated with the Rrs2 phenotype.
SNP f-value p-value R² (marker) haplotype f-value p-value R² (marker)
1 8.9281 0.0039 0.1131 H1 7.5259 0.0077 0.09832 59.5648 6.04e-11* 0.4597 H2 55.3427 2.11e-10* 0.44513 59.5648 6.04e-11* 0.4597 H3 4.1361 0.0458 0.05664 0.95 0.3331 0.0134 H4 1.9353 0.1686 0.02735 0.0884 0.7671 0.0013 H5 0.1252 0.7245 0.00186 0.0884 0.7671 0.0013 H6 0.9083 0.3439 0.0137 0.0884 0.7671 0.0013 H7 0.9083 0.3439 0.0138 4.7532 0.0326 0.0636 H8 0.3037 0.5834 0.00449 0.0884 0.7671 0.001310 59.5648 6.04e-11* 0.459711 16.7727 1.12e-04* 0.193312 0.0884 0.7671 0.001313 0.0884 0.7671 0.001314 0.0884 0.7671 0.001315 0.0884 0.7671 0.001316 0.0884 0.7671 0.001317 0.0884 0.7671 0.001318 0.0884 0.7671 0.001319 0.0884 0.7671 0.001320 0.3182 0.5745 0.004621 15.3388 2.06e-04* 0.179722 68.0681 6.97e-12* 0.4966
In summary, from six PCR fragments analyzed, two fragments contained no SNPs
which were associated with the Rrs2 phenotype. Of the remaining four PCR
fragments, twelve SNPs were identified to be highly associated with the Rrs2
phenotype. Nine additional SNPs are correlated with Rrs2 only in combination with
other SNPs.
Table 3.14: Associations for SNPs and haplotypes of PCR fragment 134N7_con5-3 with the resistance phenotype calculated for 71 barley accessions using the General Linear Model (GLM).

RESULTS 86
3.7 Development of diagnostic markers for the Rrs2 gene
The results of the association study showed that several SNPs in four of the tested
PCR fragments are correlated to a high degree with the Rrs2 resistance phenotype in
the studied set of varieties. Those SNPs can serve as diagnostic markers useful for
marker assisted selection (MAS) in the breeding process for resistant barley varieties
to Rhynchosporium secalis. For the marker development only three out of the four
PCR fragments were regarded. SNPs of PCR fragment 134N7_con5-3 were not
considered, since one additional genotype also possessed these SNPs, thus making
potential markers less diagnostic.
CAPS markers and pyrosequencing markers were developed based on SNPs 9 and
15 of PCR fragment Put_acri_res_gene_7H, SNP 4 of PCR fragment 668A17_g1-3,
and SNPs 5 and 16 of PCR fragment 668A17_e11-2 (Table 3.15).
Significant associations after Bonferroni correction (pcorr<0.0007) are indicated with *, not highlighted significant SNPs are not correlated with the Rrs2 phenotype.
p-value
SNP Put_acri_res_gene_7H 668A17_g1-3 668A17_e11-2
1 0.6657 0.2469 0.24572 0.4208 0.3201 0.24573 0.6657 0.3201 0.04144 0.4208 4.32e-16* (2 CAPS + Pyro) 0.33315 0.4208 0.4281 4.32e-16* (Pyro)6 0.4208 0.5724 1.12e-4*7 0.1618 0.3331 0.42818 0.4208 0.5724 0.42819 4.32e-16* (CAPS+Pyro) 0.5724 0.25910 0.443 0.3331 0.428111 0.5724 0.5724 1.12e-4*12 0.1618 0.5724 2.82e-4*13 0.4208 0.3201 4.32e-16*14 0.0164 0.2851 0.25915 2.39e-5* (CAPS) 1.12e-4* 1.12e-4*16 0.1618 1.12e-4* 4.32e-16* (CAPS)17 0.1618 0.3331 4.32e-16*18 0.125 0.332719 0.4208 0.041420 0.572421 0.475622 0.161823 0.161824 0.12525 6.00e-13*26 0.333127 6.63e-10*28 5.38e-15*
Table 3.15: Overview of highly associated SNPs with the Rrs2 phenotype (yellow highlighted) of three PCR fragments from which CAPS and pyrosequencing markers were developed (indicated in brackets).

RESULTS 87
3.7.1 CAPS markers based on fragment Put_acri_res_gene_7H
In fragment Put_acri_res_gene_7H two unique restriction sites were identified
leading to the restriction of the PCR fragment into two parts depending whether the
variety carries the Rrs2 gene or not.
SNP 9 is located in the recognition site TCG^CGA of restriction enzyme Bsp68I (NruI)
at bp position 149. The enzyme digests the 324 bp large PCR products from non-
Rrs2 carrying varieties leading to two fragments with the lengths of 151 and 173 bp.
The only exceptions are the varieties Opal and 11258W (Fig. 3.19, lanes 1 and 19),
which carry a rare SNP in the recognition site of the enzyme. PCR products
originating from Rrs2 carrying varieties will not be cut by Bsp68I (Fig. 3.19A).
A digestion with restriction enzyme Eco32I (EcoRV) can also differentiate the non-
Rrs2 carrying varieties from the ones possessing Rrs2. The recognition site
GAT^ATC overlaps with SNPs 14 and 15. If the fragment Put_acri_res_gene_7H is
restricted with Eco32I the non-Rrs2 varieties will stay uncut (324 bp) whereas PCR
products of the varieties carrying Rrs2 are digested into 145 and 179 bp long
fragments (Fig. 3.19B).
Variety names corresponding to the numbered samples are listed in supplementary Table A11. Amplification for sample 20 failed. Samples 1 and 19 carry a rare additional SNP in the enzyme recognition site and are not digested (A). Sample of variety Osiris in lane 50 is heterozygous (A+B), for sample of variety Atlas 68 in lane 27 the additional band is most probably due to partial digestion (A).
Fig. 3.19: CAPS marker assays for PCR fragment Put_acri_res_gene_7H with Bsp68I (A) and Eco32I (B), white numbered samples do not carry Rrs2, yellow labelled samples carry Rrs2.
1 2 3 4 5 6 7 8 9 10 11 12 13 14 15 16 17 18 19 20 21 22 23 24 1 2 3 4 5 6 7 8 9 10 11 12 13 14 15 16 17 18 19 20 21 22 23 24
25 26 27 28 29 30 31 32 33 34 35 36 37 38 39 40 41 42 43 44 45 46 47 4825 26 27 28 29 30 31 32 33 34 35 36 37 38 39 40 41 42 43 44 45 46 47 48
49 50 51 52 53 54 49 50 51 52 53 54
A B
500 bp
300 bp
100 bp
500 bp
300 bp
100 bp
500 bp
300 bp
100 bp
500 bp300 bp
100 bp
500 bp300 bp
100 bp
500 bp300 bp
100 bp

RESULTS 88
3.7.2 CAPS markers based on fragment 668A17_g1-3
For fragment 668A17_g1-3 one unique restriction site for the enzyme BcnI (NciI) was
identified with the recognition site CC^GGG which can detect SNP 4 at bp position
127. PCR products (480 bp) from Rrs2 carrying varieties will not be digested. DNA
from non-Rrs2 possessing varieties is cut into two fragments with the length of 128
and 352 bp (Fig. 3.20A).
Another restriction enzyme which can be used for distinguishing Rrs2 carrying from
non-Rrs2 carrying varieties is GsuI (BpmI). Its recognition site CTCCAG(N)16^ also
overlaps with SNP 4. PCR products from all varieties will be cut into 278 and 202 bp
fragments. The 202 bp fragment is digested an additional time in Rrs2 carrying
varieties producing restriction fragments of 108 bp and 94 bp in length (Fig. 3.20B).
Variety names corresponding to the numbered samples are listed in supplementary Table A12. Sample of variety Osiris in lane 24 is heterozygous (A, B).
Fig. 3.20: CAPS marker assays for PCR fragment 668A17_g1-3 with BncI (A) and GsuI (B), white numbered samples do not carry Rrs2, yellow labelled samples carry Rrs2.
1 2 3 4 5 6 7 8 9 10 11 12 13 14 15 16 17 18 19 20 21 22 23 24 25 26 27 28
A
1 2 3 4 5 6 7 8 9 10 11 12 13 14 15 16 17 18 19 20 21 22 23 24 25 26 27 28
B
500 bp
300 bp
100 bp
500 bp
300 bp
100 bp
500 bp
300 bp
100 bp
500 bp
300 bp
100 bp

RESULTS 89
3.7.3 CAPS marker based on fragment 668A17_e11-2
Restriction enzyme Hin1II (NlaIII) can be used for differentiating non-Rrs2 genotypes
from the Rrs2 genotypes in PCR fragment 668A17_e11-2. Its recognition site CATG^
covers SNP 16. PCR products (252 bp) of non-Rrs2 carrying varieties are digested
into 47 bp, 80 bp, and 125 bp fragments. Rrs2 carrying varieties possess one more
restriction site and thus a digestion leads to even smaller fragments of 47 bp, 62 bp,
63 bp, and 80 bp (Fig. 3.21).
3% agarose gel, white numbered samples do not carry Rrs2, yellow labelled samples carry Rrs2. Variety names corresponding to the numbered samples are listed in supplementary Table A13.
Fig. 3.21: CAPS marker assay for PCR fragment 668A17_e11-2 with Hin1II.
1 2 3 4 5 6 7 8
500 bp
300 bp
100 bp

RESULTS 90
3.7.4 Pyrosequencing marker based on PCR fragment Put_acri_res_gene_7H
A pyrosequencing marker assay was developed for SNP 9 at bp position 150 of PCR
fragment Put_acri_res_gene_7H. The results of the marker assay for Atlas and Steffi
are depicted in Fig. 3.22 as pyrograms. Sixteen different accessions carrying the
Rrs2 gene and 14 varieties, which do not carry the Rrs2 gene, were tested with this
marker. In all cases the marker showed the expected allele, a ‘C’ for Rrs2+ and a ‘G’
for Rrs2-.
Sample: AtlasPosition1: C/C (Passed)
1400
1600
1800
E S T C G C A T A C A
C/C
5
Sample: Steffi
Position1: G/G (Passed)
2000
3000
4000
E S T C G C A T A C A
G/G
5
3.7.5 Pyrosequencing marker based on fragment 668A17_g1-3
For fragment 668A17_g1-3 a pyrosequencing marker assay was developed for
SNP 4 at bp position 129 (Fig. 3.23). The marker was tested with 16 different
accessions carrying the Rrs2 gene and 14 varieties, which do not carry the Rrs2
gene. In all cases the marker showed the expected genotype, a ‘T’ for Rrs2+ and a
‘C’ for Rrs2-.
Fig. 3.22: Results of the pyrosequencing marker assay for fragment Put_acri_res_gene_7H of varieties Atlas (Rrs2+) and Steffi (Rrs2-).

RESULTS 91
Sample: AtlasPosition1: T/T (Passed)
1500
2000
E S A C T C G A G C T
T/T
5
Sample: SteffiPosition1: C/C (Passed)
1400
1600
E S A C T C G A G C T
C/C
5
3.7.6 Pyrosequencing marker based on fragment 668A17_e11-2
A pyrosequencing marker assay was developed for SNP 5 at bp position 72 of PCR
fragment 668A17_e11-2. The results of Atlas and Steffi are depicted in Fig. 3.24 as
pyrograms. Rrs2 carrying varieties possess the allele ‘A’ and non-Rrs2 varieties carry
the allele ‘C’. All tested varieties, 16 different accessions carrying the Rrs2 gene and
14 varieties, which do not carry the Rrs2 gene, showed the expected alleles.
Sample: Atlas 495017
Position1: A/A (Passed)
1400
1600
E S T C A C G T G A C
A/A
5
Sample: Steffi
Position1: C/C (Passed)
1400
E S T C A C G T G A C
C/C
5
Fig. 3.23: Results of the pyrosequencing marker assay for fragment 668A17_g1-3 for the varieties Atlas (Rrs2+) and Steffi (Rrs2-).
Fig. 3.24: Results of the pyrosequencing marker assay for fragment 668A17_e11-2 for the varieties Atlas (Rrs2+) and Steffi (Rrs2-).

RESULTS 92
3.8 Expression Analysis
To study whether the PCR fragments investigated in the association study are part of
a functional gene, an expression study was undertaken. Samples of young leafs of
healthy plants of Atlas and Steffi grown under standard greenhouse conditions were
used to obtain mRNA. Altogether, 96 primer combinations, which bind within and in
the vicinity of the PCR fragments, were tested. Only four primer combinations out of
the 96 tested proved to give conclusive results. Additionally, the expression analysis
was complemented by different BLAST searches to identify EST clusters, single
ESTs, unigene entries or proteins which show homology to the sequences studied in
the expression analysis. BLAST searches were carried out in the DFCI Barley Gene
Index (HvGI), NCBI, and HarvEST databases.
As a positive control, the stably expressed housekeeping gene actin (GenBank
Acc. AY145451.1) was chosen. The primers for amplifying the barley actin gene,
which were developed by Volodymyr Radchuk (Seed Development Group, IPK),
showed additional bands when amplified with genomic DNA. Therefore, they served
also as control for genomic DNA contamination in the cDNA sample. The cDNA used
in the expression study showed no genomic DNA contamination (Fig. 3.25).
1 Atlas, cDNA
2 Atlas, genomic DNA
3 Steffi, cDNA
4 Steffi, genomic DNA
5 water control
This primer combination was used as the stably expressed control in the expression study. It also was used as control for genomic DNA contamination. The cDNA used in the expression study showed no genomic DNA contamination.
Fig. 3.25: PCR products separated on 2% agarose gel showing the amplification of genomic DNA and cDNA of Atlas and Steffi with a primer combination amplifying part of the barley actin gene (GenBank Acc. AY145451.1).
1 2 3 4 5
500 bp
300 bp
200 bp

RESULTS 93
3.8.1 PCR fragment RGH-3
PCR fragment RGH-3 is located within the predicted gene named HvRGH-3 which is
annotated in GenBank Acc. AY853252 as NBS-LRR resistance-like protein. Through
a BLASTN search in the HvGI database, a highly homologous sequence (7.6e-81)
was identified. Starting from bp position 29, PCR fragment RGH-3 aligns with
GenBank EST Acc. CA004050 which is annotated as “UniRef100_A9UKM3 Cluster:
NBS-LRR resistance-like protein”. The best hit (1e-75) in a BLASTX search (NCBI)
was GenBank Acc. AAY34260.1 which is annotated as “NBS-LRR resistance-like
protein [Hordeum vulgare]” as well. A BLASTN search in the HarvEST database
(Assembly 35) gave one hit with unigene #41873 (e-179) (Fig. 3.26).
Eight primer combinations were designed for the locus of RGH-3 and tested for
amplification with genomic DNA. Seven primer combinations showed expected
results with genomic DNA and were then used to check amplification of cDNA of Atlas
and Steffi, but no cDNA amplification was detected.
Therefore, PCR fragment RGH-3 has to be considered as not expressed in Atlas and
Steffi under the studied conditions (healthy plants).
RGHA_2F RGHA_2R
RGHA_3F
Acc. CA004050
RGHA_4F
RGHA_3RRGHA_1RRGHA_1F
HarvEST unigene #41873
RGHA_4R
127,025 bp 128,730 bp
Acc. AY853252
RGHA_2R
RGHA_3F
RGHA_3R
RGHA_4R
RGHA_2F
RGHA_3F
PCR-fragment RGH-3RGHA_2F RGHA_2R
RGHA_3F
Acc. CA004050
RGHA_4F
RGHA_3RRGHA_1RRGHA_1F
HarvEST unigene #41873
RGHA_4R
127,025 bp 128,730 bp
Acc. AY853252
RGHA_2R
RGHA_3F
RGHA_3R
RGHA_4R
RGHA_2F
RGHA_3F
PCR-fragment RGH-3
3.8.2 PCR fragment Put_acr_res_gene_7H
Based on results from RiceGAAS, which predicted a putative acriflavin resistance
protein of 210 bp length with three exons at the locus of Put_acr_res_gene_7H,
eighteen primer combinations were designed in a way that they would only amplify
Fig. 3.26: Alignment of PCR fragment RGH-3, EST Acc. CA004050 and HarvEST unigene #41873 with the genomic region of RGH-3 (Acc. AY853252) and with primers used for the expression analysis.

RESULTS 94
cDNA, but not genomic DNA. None of these primer combinations showed an
amplification with cDNA of Atlas and Steffi. Four of seven additional primer
combinations amplified genomic DNA, but did not amplify cDNA.
A BLASTN search showed similarity (9.6e-12) with HvGI entry TC188587, but only for
the last 130 bp of PCR fragment Put_acr_res_gene_7H. BLASTN searches in other
databases gave no significant results. A standard alignment (80% minimum match
percentage) of HvGI TC188587 and the genomic region spanning
Put_acr_res_gene_7H was not possible. A spliced alignment with the program Splign
also did not result in an alignment. It is therefore doubtful that the gene prediction of
the RiceGAAS program was correct and that PCR fragment Put_acr_res_gene_7H is
part of a functional gene.
3.8.3 PCR fragment FST-2 and primer combination PK95
Twenty-two primer combinations were designed to amplify the region of FST-2, 13
out of them showed expected results with genomic DNA and were then used for
cDNA amplification. The primer combination PK95 amplified a 255 bp PCR fragment
from cDNA of Steffi and Atlas at bp position 201,890 of GenBank Acc. AY853252 (Fig.
3.27). It is located within the region which was annotated to be an exon of the
flavonol-sulfotransferase gene, designated HvFST-2, in GenBank Acc. AY853252.
The amplified RT-PCR product was of the expected size and showed, with the
exception of one nucleotide, an identical sequence as genomic DNA.
The PCR product of PK95 overlaps fully with TC188981 (1.2e-52) which is annotated
as “homologue to UniRef100_A9UKM5 Cluster: flavonol-sulfotransferase”, as well as
with HarvEST unigene #31645 (e-168) whose best BLASTX hit is “Cluster:
Sulfotransferase domain containing protein”. PCR fragment FST-2 does not overlap
with the RT-PCR product of PK95. The two amplified regions are located 33 bp apart.
FST-2 does, however, overlap 116 bp with TC188981 and 358 bp with HarvEST
unigene #31645 (Fig. 3.28).
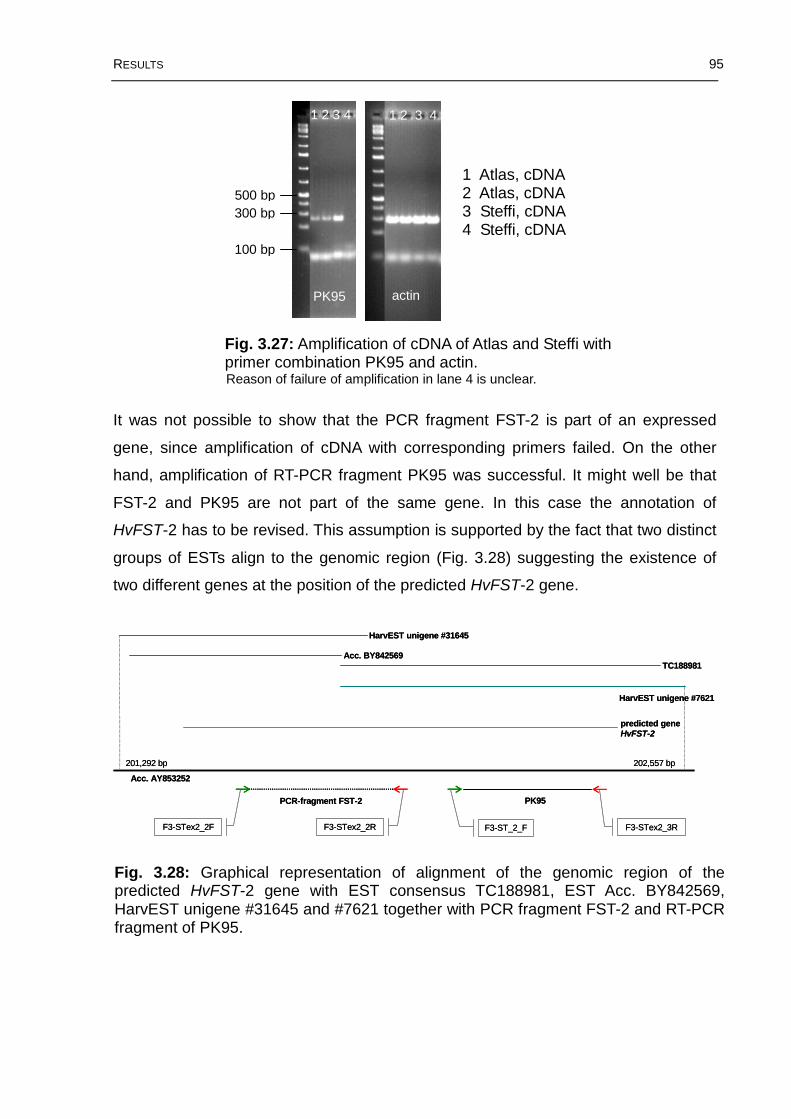
RESULTS 95
1 Atlas, cDNA 2 Atlas, cDNA3 Steffi, cDNA4 Steffi, cDNA
Reason of failure of amplification in lane 4 is unclear.
It was not possible to show that the PCR fragment FST-2 is part of an expressed
gene, since amplification of cDNA with corresponding primers failed. On the other
hand, amplification of RT-PCR fragment PK95 was successful. It might well be that
FST-2 and PK95 are not part of the same gene. In this case the annotation of
HvFST-2 has to be revised. This assumption is supported by the fact that two distinct
groups of ESTs align to the genomic region (Fig. 3.28) suggesting the existence of
two different genes at the position of the predicted HvFST-2 gene.
Acc. BY842569
HarvEST unigene #31645
202,557 bp
Acc. AY853252
PCR-fragment FST-2
201,292 bp
PK95
F3-STex2_2RF3-STex2_2F F3-STex2_3RF3-ST_2_F
TC188981
HarvEST unigene #7621
predicted geneHvFST-2
Acc. BY842569
HarvEST unigene #31645
202,557 bp
Acc. AY853252
PCR-fragment FST-2
201,292 bp
PK95
F3-STex2_2RF3-STex2_2F F3-STex2_3RF3-ST_2_F
TC188981
HarvEST unigene #7621
predicted geneHvFST-2
Fig. 3.27: Amplification of cDNA of Atlas and Steffi with primer combination PK95 and actin.
Fig. 3.28: Graphical representation of alignment of the genomic region of the predicted HvFST-2 gene with EST consensus TC188981, EST Acc. BY842569, HarvEST unigene #31645 and #7621 together with PCR fragment FST-2 and RT-PCR fragment of PK95.
PK95 actin
1 2 3 4 1 2 3 4
500 bp300 bp
100 bp

RESULTS 96
3.8.4 PCR fragment 668A17_g1-3 and primer combinations PK37 and PK38
For assessing the expression of PCR fragment 668A17_g1-3, seven primer
combinations were tested for amplification of genomic DNA. Four primer
combinations worked well with genomic DNA and were then used for checking
amplification of cDNA. The primer pair, which was used for amplifying PCR fragment
668A17_g1-3, did not amplify cDNA. However, two other primer combinations, PK37
and PK38, amplified fragments from cDNA with the size of 355 bp and 218 bp,
respectively (Fig. 3.29). The first 91 bp of RT-PCR product PK37 overlap with the last
91 bp of PCR fragment 668A17_g1-3. The amplification product of PK38 does not
overlap with PCR fragment 668A17_g1-3, but in full length with RT-PCR fragment
PK37 (Fig. 3.30). In two independent experiments, cDNA of Atlas and Steffi was
amplified with PK37 and PK38, respectively. The sequenced RT-PCR fragments
were, with the exception of two nucleotides, identical to genomic DNA sequence
information and corresponded to the expected fragment sizes.
1 Atlas, cDNA2 Atlas, cDNA3 Steffi, cDNA4 Steffi, cDNA
PCR fragment 668A17_g1-3, PK37 and PK38 show an alignment with HvGI entry
TC154956 (1.1e-73) which is annotated as “homologue to UniRef100_Q0D083
Cluster: Predicted protein”. 668A17_g1-3 also aligns completely to the not annotated
HarvEST unigene #2643 (e-value 0.0) which is mapped on the upper part of short
arm of chromosome 7H of the HarvEST Barley Integrated Map 04/16/08 at the
expected map position of 3.3 (Fig. 3.30).
Fig. 3.29: Amplification of cDNA of Atlas and Steffi with primer combinations PK37, PK38 and Actin.
1 2 3 4 1 2 3 4
PK37 PK38 actin
1 2 3 4
500 bp
300 bp
100 bp

RESULTS 97
Based on the alignments with ESTs and the partial overlapping with the expressed
PK37 fragment, PCR fragment 668A17_g1-3 is most likely part of an expressed
gene. The reason why primers used for amplifying PCR fragment 668A17_g1-3 from
genomic DNA did not amplify cDNA is not clear. The alignment with EST sequences
shows complete homology discarding the possibility of the existence of an intron.
clone 668A17_plate3-g1-t3
PK38
PK37
668A17_3-g1_2Rb668A17_3-g1_2Fb
668A17_3-g1_2Ra668A17_3-g1_2Fb
HarvEST unigene #2643
TC154956
PCR fragment668A17_g1-3
clone 668A17_plate3-g1-t3
PK38
PK37
668A17_3-g1_2Rb668A17_3-g1_2Fb
668A17_3-g1_2Ra668A17_3-g1_2Fb
HarvEST unigene #2643
TC154956
PCR fragment668A17_g1-3
3.8.5 PCR fragment 668A17_e11-2
In total, five primer combinations were tested for amplification of the locus of
fragment 668A17_e11-2. All worked well with genomic DNA, but did not amplify
cDNA. The BLASTN searches yielded no ESTs which are homologous to PCR
fragment 668A17_e11-2.
3.8.6 PCR fragment 134N7_con5-3 and primer combination PK18
For the locus of PCR fragment 134N7_con5-3, 28 primer combinations were
evaluated of which 17 showed correct amplification of genomic DNA. Those were
tested with cDNA. In three independent experiments, cDNA of Atlas and Steffi was
successfully amplified with primer combination PK18 (Fig. 3.31). The primers of PK18
bind within the sequence of PCR fragment 134N7_con5-3. The sequenced amplicons
of PK18 showed the expected length of 175 bp and were identical to sequences
generated from genomic DNA of Atlas and Steffi with the same primer combination.
Fig. 3.30: Alignment of BAC subclone 668A17_plate3_g1-t3 with EST consensus hit TC154956 and HarvEST unigene#2643, PCR fragment 668A17_g1-3 and with RT-PCR fragments PK37 and PK38.

RESULTS 98
1 Atlas, cDNA2 Atlas, cDNA3 Steffi, cDNA4 Steffi, cDNA
A BLASTN search showed that PCR fragment 134N7_con5-3 overlaps with HvGI
entry TC184695 (1.3e-129) which is annotated as “similar to UniRef100_A4BAY3
Cluster: high-affinity zinc uptake system membrane protein ZnuB”. There is also a
complete alignment with the not annotated HarvEST unigenes #3681 (e-value 0.0)
and #3682 (e-value 0.0) (Fig. 3.32). Unigene #3681 maps to the upper part of short
arm of chromosome 7HS in the HarvEST Barley Integrated Map 04/16/08 at map
position 3.3. This is the same position where HarvEST unigene #2643, mentioned in
section 3.8.4, was found to map. Due to the listed evidence PCR fragment
134N7_con5-3 is considered part of an expressed gene. A possible explanation why
primers for 134N7_con5-3 did not amplify cDNA might be that one of them binds to a
non-transcribed region.
PCR fragment134N7_con5-3
PK18
134N7con5_2F A-EST_3Fb
HarvESTunigene #3681
TC184695
HarvESTunigene #3682
PCR fragment134N7_con5-3
PK18
134N7con5_2F A-EST_3Fb
HarvESTunigene #3681
TC184695
HarvESTunigene #3682
Fig. 3.31: Amplification of cDNA of Atlas and Steffi with primer combinations PK37, PK38 and Actin.
Fig. 3.32: Alignment of PCR fragment 134N7_con5-3 with EST consensus hit TC184695 and HarvEST unigenes #3681 and #3682 and with RT-PCR fragment PK18.
actin
1 2 3 4
PK18
500 bp
300 bp
100 bp
1 2 3 4

RESULTS 99
3.8.7 Summary of the expression analysis
In the expression analysis it was investigated if the six genomic loci studied in the
association study approach contain expressed genes. Therefore, leaf samples of
healthy plants of Atlas and Steffi grown under standard greenhouse conditions were
analyzed. For three out of the six genomic regions an expressed gene was detected.
In the vicinity of PCR fragment FST-2, a fragment could be amplified from cDNA with
primer combination PK95. The amplified fragment lies within the region of the
predicted gene HvFST-2. PCR fragment FST-2 also lies within the predicted gene
HvFST-2, but does not overlap with PK95. PCR fragment FST-2 was not found to be
expressed in this study. It is therefore speculated that at the genomic location of the
predicted gene HvFST-2 there actually exist two genes, one of which was shown to
be expressed under the studied conditions. This is substantiated by the presence of
two distinct EST clusters at the genomic location. However, further investigation is
needed to clarify that.
The sequence of PCR fragment 668A17_g1-3 overlaps completely with two EST
clusters, but primers for 668A17_g1-3 did not amplify cDNA of Atlas and Steffi.
However, two RT-PCR fragments could be amplified from cDNA with primer
combinations PK37 and PK38. The two amplified fragments overlap partly with the
identified EST clusters. PK37 also shares part of the sequence of 668A17_g1-3. It
could be shown that there is an expressed gene at the genomic location of PCR
fragment 668A17_g1-3, but it is unclear why primers for 668A17_g1-3 did not amplify
cDNA.
Primer combination PK18, which binds within PCR fragment 134N7_con5-3, was
shown to amplify cDNA of Steffi and Atlas. PCR fragment 134N7_con5-3 overlaps to
a large part with three EST clusters. The genomic region of 134N7_con5-3 clearly
harbours an expressed gene.
For the remaining three genomic locations (regions around PCR fragments RGH-3,
Put_acr_res_gene_7H, and 668A17_e11-2) no signals of expressed genes could be
detected. For the regions Put_acr_res_gene_7H and 668A17_e11-2 no homologous
ESTs were identified. The region of RGH-3 contained two overlapping EST clucters
coding for a disease resistance gene. This gene might be expressed under different
conditions than the ones used in this study.

RESULTS 100
3.9 Summary of results
The Rrs2 gene was fine mapped to an interval of 0.08 cM between markers 693M6_6
and P1D23R within a mapping population of 9179 F2-plants derived from a cross of
Atlas (resistant) × Steffi (susceptible). Nine markers mapping within this interval co-
segregate with the Rrs2 gene. Co-segregating markers are located on two barley
BAC contigs which are separated by a gap of unknown size. All BAC libraries, which
were screened, showed an under-representation of BAC clones for this specific
genomic region. The number of estimated recombination events for the region
between markers 693M6_6 and P1D23R ranges between 20 and 26. However, only
15 recombination events were identified within the mapping population for this
interval. Due to the apparent lack of recombination in the vicinity of the Rrs2 gene, it
was not possible to pinpoint the exact location of Rrs2 using the information of the
Atlas × Steffi mapping population.
According to the results of an association mapping study it was observed that in
varieties possessing the Rrs2 gene, the genomic region around Rrs2 is always
inherited as a large linkage block without the occurrence of recombination. In
contrast, varieties which do not carry the Rrs2 gene show normal recombination
within this genomic area.
Comparisons of the Rrs2 locus between markers PSR119 and R2869 with the
syntenic regions of Oryza sativa and Brachypodium distachyon showed
macrosynteny between rice chromosome Os6 and Bd supercontig1, but
microsynteny, as well as microcolinearity, was largely disrupted.
Analysis of available sequence information for the co-segregating region of Rrs2 led
to the identification of sixteen putative genes of which eleven show reliable hits to
known unigene clusters (Table 3.16). Whether the flavonol-sulfotransferase gene
(HvFST-2) is really a single gene is unclear, since expression analysis could only
prove the expression of a part of the predicted exon. In addition, two distinct unigene
clusters were identified for the region of the predicted gene. In the HarvEST Barley
Integrated Map 04/16/08 five unigenes are found to map at map position 3.3 on
chromosome 7HS. Four of them are present in the available sequence information of
the Rrs2 locus. These are HarvEST unigenes #15670, #2643, #1552, and #3681
which correspond to genes HvPEI-1, HvHYP-1, HvPEI-2, and HvZUS, respectively
(Table 3.4). The remaining unigene #2649 could not be identified in the sequence

RESULTS 101
data obtained up to date. However, since all five unigenes map to the same position,
it is very likely that #2649, which corresponds to HvGSY, originates from within the
gap between the two BAC contigs flanking the Rrs2 locus.
From the sixteen known genes located in the co-segregating region of Rrs2, five
show a functional annotation hinting to an involvement in defense processes and
might be possible candidate genes for Rrs2. Those genes are highlighted in bold font
in Table 3.16.
Only those genes which showed reliable annotation results were given a short name. The annotation of the highlighted genes hints to an involvement in disease response. Those genes might be possible candidates for Rrs2.
no. name annotation location expression1 HvETF electron transfer flavoprotein beta-subunit distal BAC contig not tested2 HvFST-2 flavonol-sulfotransferase distal BAC contig confirmed
3 – flavonol-sulfotransferase (only fragments) distal BAC contig not tested
4 – no annotation (maybe transposable element)
distal BAC contig not tested
5 – N N'-diacetylchitobiose phosphorylase (weak evidence)
distal BAC contig not tested
6 – Protein phosphatase 2C (maybe transposable element)
distal BAC contig not tested
7 HvRLK receptor-like protein kinase 5 precursor distal BAC contig not tested
8 HvPEI-1 pectinesterase inhibitor domain containing protein
distal BAC contig not tested
9 – no annotation (maybe transposable element)
distal BAC contig not tested
10 HvHYP-1 predicted protein BAC clone MO668A17 confirmed
11 HvPEI-2 pectinesterase inhibitor domain containing protein
BAC clone ME194H14 not tested
12 HvGSY ß-1,3-glucan synthase in the gap, but location not confirmed
not tested
13 HvZUS high-affinity zinc uptake system membrane protein ZnuB
proximal BAC contig confirmed
14 HvHYP-2 hypothetical protein proximal BAC contig not tested
15 HvKAO ent-kaurenoic acid oxidase proximal BAC contig not tested
16 HvEYA Eyes absent homolog proximal BAC contig not tested
The association study led to the discovery of twelve SNPs originating from four
different genomic regions which were highly associated with the Rrs2 phenotype.
Additionally, nine SNPs were also diagnostic for Rrs2, but only in combination with
other SNPs. Based on five SNPs from three PCR fragments, eight diagnostic
molecular markers for Rrs2 (five CAPS markers and three pyrosequencing markers)
were developed. These markers can be used for the discrimination of Rrs2 carrying
and non-Rrs2 carrying barley lines in the breeding process for resistant varieties
against Rhynchosporium secalis.
Table 3.16: List of genes identified in the co-segregating region of Rrs2.

DISCUSSION 102
4 Discussion
4.1 High-resolution mapping of the Rrs2 region
The genetic map distance of two loci on one chromosome can be measured by
determining the frequency of recombination events observed between both loci. The
larger the distance, the greater the chance that crossover events occur in the region
between the two loci (STURTEVANT, 1913). One genetic map unit (1 centimorgan [cM])
is defined as the 1% chance of occurrence of recombination between two loci in a
single generation. In other words, 1 cM corresponds to one recombination event in
100 meioses.
The relationship between genetic and physical distances, i.e. kilobase/centimorgan
ratio (recombination rate), has been observed to vary greatly between different
genomic regions, for example in humans (CRAWFORD et al., 2004; GRAFFELMAN et al.,
2007), Arabidopsis (DROUAUD et al., 2006), tomato (TANKSLEY et al., 1992), wheat
(AKHUNOV et al., 2003), rice (WU et al., 2003), and barley (KÜNZEL et al., 2000). The
general observation is that recombination rates are high near the telomeric regions of
the chromosomes and suppressed surrounding the centromere.
KÜNZEL et al. (2000) related physical distances to genetic distances in barley by using
microdissected translocation chromosomes in PCR with sequence tagged site
primers. They found that in barley the distribution of recombination is heterogeneous
along individual chromosomes. There are few, relatively small, regions with a very
high rate of recombination, so called hot spots of recombination, which are separated
by large areas in which recombination is severely suppressed. According to the
updated map of KÜNZEL et al. (2000), available at http://pgrc.ipk-gatersleben.de/
kuenzel/image7h.gif, 1 cM at the chromosomal position of the Rrs2 gene, distal of
translocation breakpoint T17ai, corresponds to 1 Mb. However, the average
recombination rate surrounding the Rrs2 locus, which was observed in this study, is
almost three times lower, namely 2.8 Mb/cM.
The goal of fine mapping a gene of interest is the identification of markers that are
tightly linked or, in an ideal case, co-segregating with the trait of interest. Therefore,
high-resolution maps with a high marker density and genotypic and phenotypic
information obtained of a large number of progeny are required in order to detect
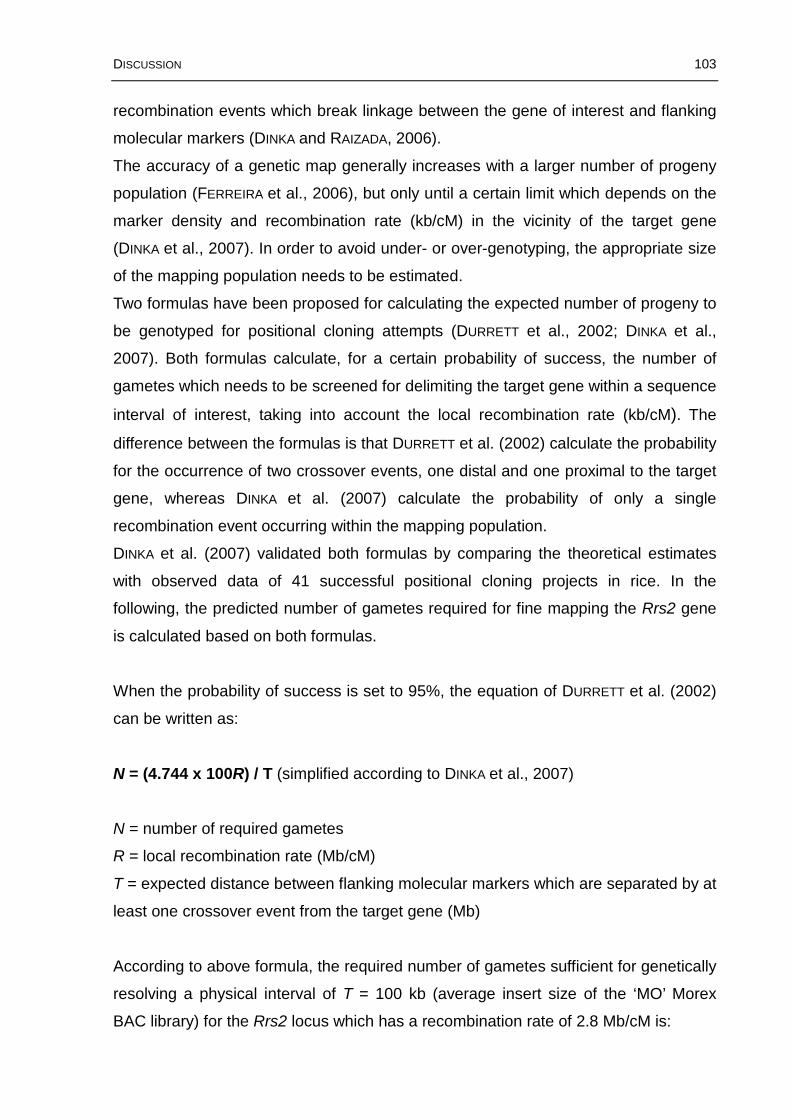
DISCUSSION 103
recombination events which break linkage between the gene of interest and flanking
molecular markers (DINKA and RAIZADA, 2006).
The accuracy of a genetic map generally increases with a larger number of progeny
population (FERREIRA et al., 2006), but only until a certain limit which depends on the
marker density and recombination rate (kb/cM) in the vicinity of the target gene
(DINKA et al., 2007). In order to avoid under- or over-genotyping, the appropriate size
of the mapping population needs to be estimated.
Two formulas have been proposed for calculating the expected number of progeny to
be genotyped for positional cloning attempts (DURRETT et al., 2002; DINKA et al.,
2007). Both formulas calculate, for a certain probability of success, the number of
gametes which needs to be screened for delimiting the target gene within a sequence
interval of interest, taking into account the local recombination rate (kb/cM). The
difference between the formulas is that DURRETT et al. (2002) calculate the probability
for the occurrence of two crossover events, one distal and one proximal to the target
gene, whereas DINKA et al. (2007) calculate the probability of only a single
recombination event occurring within the mapping population.
DINKA et al. (2007) validated both formulas by comparing the theoretical estimates
with observed data of 41 successful positional cloning projects in rice. In the
following, the predicted number of gametes required for fine mapping the Rrs2 gene
is calculated based on both formulas.
When the probability of success is set to 95%, the equation of DURRETT et al. (2002)
can be written as:
N = (4.744 x 100R) / T (simplified according to DINKA et al., 2007)
N = number of required gametes
R = local recombination rate (Mb/cM)
T = expected distance between flanking molecular markers which are separated by at
least one crossover event from the target gene (Mb)
According to above formula, the required number of gametes sufficient for genetically
resolving a physical interval of T = 100 kb (average insert size of the ‘MO’ Morex
BAC library) for the Rrs2 locus which has a recombination rate of 2.8 Mb/cM is:

DISCUSSION 104
13,283 = (4.744 x 100 x 2.8)/0.1
The expected number of gametes to be genotyped based on single crossover
probability (DINKA et al., 2007) is calculated as follows:
N = Log(1 – P) / Log(1 – T / 100R)
N = number of required gametes
P = threshold probability of success
T = expected distance between flanking molecular markers (Mb)
R = local recombination rate
The necessary number of gametes which need to be genotyped in order to delimit
the position of Rrs2 within a 100 kb interval supposing the recombination rate of
2.8 Mb/cM, is: 8,387 = Log(1 – 0.95)/Log(1 – 0.1/(100 x 2.8)), according to the
formula of DINKA et al. (2007).
Accordingly, the appropriate size of the mapping population, necessary for delimiting
the position of the Rrs2 gene within a 100 kb interval, varies between 4,194 and
6,642 individuals, depending on the formula which is employed.
After the screening of 4,721 F2-plants, the location of the Rrs2 gene, which co-
segregated with several markers, was separated by three recombination events from
the next flanking markers on either side. However, the co-segregating markers were
located on two BAC contigs which were physically separated by an unknown
distance. Therefore, in order to identify recombination events in the immediate vicinity
of the Rrs2 gene and break the co-segregation of markers, the size of the mapping
population was increased by 4,458 to a total number of 9,179 F2-plants. The
increasing of the mapping population did not result in a higher genetic resolution of
the marker interval AFLP14 – P1D23R, nor did it lead to a more accurate positioning
of the Rrs2 gene. All identified recombination events were redundant and not a single
recombination between any of the co-segregating markers was identified. As
mentioned in chapter 3.3, the number of observed recombination events within the
co-segregating region is between 25% and 42% lower than the expected number of
recombination events, taking into account local recombination rates observed for the

DISCUSSION 105
studied region on 7HS. The data strongly suggests that the Rrs2 gene is located
within an area of suppressed recombination. As a consequence, neither an accurate
calculation of the recombination rate and estimation of the physical distance for the
co-segregating marker interval, nor the exact positioning of the location of the Rrs2
gene is possible in absence of recombination.
4.2 Possible reasons for suppressed recombination in the vicinity of the
Rrs2 gene
It is very well known that recombination around centromeres of eukaryotes is
suppressed (LAMBIE and ROEDER, 1986; TANKSLEY et al., 1992; MAHTANI and WILLARD,
1998; HAUPT et al., 2001). This repression has been assumed to be due to the
heterochromatic nature of centromeric regions which is associated with high amounts
of tandemly repetitive sequences and centromere specific retrotransposons
(ROBERTS, 1965; KHUSH and RICK, 1967). However, in recent years this hypothesis
has been challenged by several reports which showed that recombination is also
suppressed in centromeres which lack heterochromatin (LAMBIE and ROEDER, 1986;
YAMAMOTO and MIKLOS, 1978; YAN et al., 2005). It is doubtful whether sequence
features are involved in the recombination suppression at the centromere at all
(HAUPT et al., 2001; YAN et al., 2005). Rather, the centromere specific activity itself
which is linked to a higher-order chromatin organization, namely the presence of a
special centromere specific histone H3 variant (CENH3), is thought to be responsible
for suppression of recombination around centromeres (CHOO, 1998; YAN et al., 2005).
YAN et al. (2005) suggest that the inhibition of recombination is an indirect effect
resulting from a high concentration of cohesins which are bound by CENH3.
Outside of centromeric regions, it has been hypothesized that meiotic recombination
in eukaryotes is largely restricted to genes (THURIAUX, 1977) and gene-rich regions
(GILL et al., 1996a; GILL et al., 1996b; SCHNABLE et al., 1998).
In maize this is supported by a study which shows a strong positive correlation
between gene density and recombination rate on the genome wide level (ANDERSON
et al., 2006) and by reports where various hot spots of recombination are associated
with genes (FU et al., 2001; FU et al., 2002; YAO et al., 2002). This is further
substantiated by the finding that regions surrounding these loci, which are gene-poor

DISCUSSION 106
and rich in retrotransposons, lack recombination (FU et al., 2002; YAO et al., 2002).
The fact that the presence of transposable elements suppresses recombination has
also been reported by XU et al. (1995). DOONER and MARTÍNEZ-FÉREZ (1997)
proposed that, in maize, recombination generally takes place in regions where the
chromatin is less densely packed (i.e. genic regions) and therefore is better
accessible to the recombination machinery. However, YAO et al. (2002) also observed
a non-genic recombination hot spot and, vice versa, no recombination around a gene
and therefore concludes that “not all hot spots are genes and… not all genes are hot
spots”.
The preferential occurrence of recombination in gene-rich regions has also been
reported for wheat and barley (GILL et al., 1996a; GILL et al., 1996b; KÜNZEL et al.,
2000; ROSTOKS et al., 2002; SANDHU and GILL, 2002a; ERAYMAN et al., 2004).
However, within gene-rich regions the recombination rate was found to be highly
variable (STEIN et al., 2000; SANDHU and GILL, 2002a; SANDHU and GILL, 2002b;
ERAYMAN et al., 2004). Except for the area around the centromere, no correlation
could be found between recombination and the gene density, the size and
chromosomal location of gene-rich regions (ERAYMAN et al., 2004). Gene-poor areas
exhibiting low recombination rates were shown to be mostly comprised of repetitive
elements and pseudogenes (SANDHU and GILL, 2002a). But, similar to maize,
recombination is not always confined to gene-rich regions. WEI et al. (2002) also
found a high rate of recombination in a region flanking the Mla resistance cluster in
barley which is gene-poor and dense in repetitive elements.
In Arabidopsis and rice, the correlation between gene density as well presence of
transposable elements and recombination rate seems not to be so pronounced.
Studies of crossing-over rates across chromosome 4 of Arabidopsis revealed that
recombination rates are not correlated with genes, pseudogenes, transposable
elements, or dispersed repeats (DROUAUD et al., 2006). On the other hand, an earlier
report of THE ARABIDOPSIS GENOME INITIATIVE (2000) states that transposon-rich
regions exhibit lower rates of recombination in Arabidopsis. WU et al. (2003)
observed in a study on six rice chromosomes that, in so called cold spots outside the
centromeric regions, which show inactivated recombination, the content of repetitive
elements and the gene density were similar to those regions with normal
recombination rates. DINKA et al. (2007) established a meiotic recombination
frequency map for the rice genome and found that the genes/cM ratio varied as much

DISCUSSION 107
as the kb/cM ratio indicating that there is no correlation of gene density and
recombination rate. Otherwise the ratio of genes/cM should have been constant,
since with an increased number of genes the frequency of crossovers should have
increased as well. Furthermore, comparing recombination rates of positional cloning
studies with average recombination rates of the rice genome, DINKA et al. (2007)
could show that there is no bias in recombination near genes.
In summary, it seems that centromeric regions inhibit recombination not because of
the heterochromatic nature or special sequence features, but rather through an
indirect effect exhibited by the centromere specific histone CENH3. This mode of
recombination suppression is, however, restricted to centromeric regions. Low levels
of recombination in distal regions of the genome generally seem to be correlated with
the presence of transposable elements and gene-poor regions, at least in maize,
wheat, and barley. For other plant genomes (Arabidopsis and rice), gene density and
transposable elements seem not to have such a strong influence on the
recombination rate.
The resistance locus Rrs2 is located at the distal end of barley chromosome 7HS, a
region which has been reported to have a very high recombination rate (KÜNZEL et
al., 2000). Nevertheless, an area of suppressed recombination has been observed in
the mapping population of Atlas × Steffi for the interval where the Rrs2 gene is
located. However, results of the association study performed in this work indicate that
only for varieties carrying the Rrs2 gene recombination is suppressed, whereas
recombination takes place in varieties which possess the susceptible allele.
Therefore, the recombination inhibition can not be the result of a general local cold
spot of recombination (caused for example by a high density of repetitive elements),
since this would be expected to affect all barley varieties. Moreover, a very high gene
density even in the area of suppressed recombination can be observed which also
contradicts a recombination cold spot. For a 62 kb large region of the distal BAC
contig where recombination is repressed in the mapping population, a gene density
of one gene per 15 kb was observed (only counting the four genes which showed
reliable hits to unigene clusters). This ratio is even higher than the average gene
density of one gene per 20 kb reported for gene-rich regions of the barley genome
(PANSTRUGA et al., 1998; ROSTOKS et al., 2002; BRUNNER et al., 2003).

DISCUSSION 108
The suppression of recombination in the vicinity of Rrs2 seems to be correlated with
the presence of the Rrs2 gene itself. The most likely explanation for this is a
structural dissimilarity between the varieties Atlas and Steffi as structural differences
of two sequences can also account for altered recombination frequencies. In tomato,
LIHARSKA et al. (1996) showed a reduction of recombination for a defined genetic
interval which contained introgressed chromatin from close relatives of
L. esculentum. The suppression of recombination was dependent on the size of the
alien segment and the source. The closer related the donor of the foreign chromatin,
the higher the amount of recombination due to the lower sequence divergence.
Similar findings have been reported by DOONER and MARTÍNEZ-FÉREZ (1997), who
demonstrated for the bronze (bz) gene in maize that fewer crossovers occurred
within regions of the gene which exhibited a higher density of sequence
polymorphisms between alleles. Also for Arabidopsis it was shown that sequence
divergence can dramatically reduce recombination. LI et al. (2006) observed a
reduction in recombination of up to 20-fold for a 9% sequence divergence.
Apart from introgressions or sequence polymorphisms, also chromosomal inversions
are known to inhibit recombination between normal and inverted chromosomal
segments in heterozygous arrangements (PHILLIPS, 1969). Through cytological
studies and fluorescence in situ hybridization (FISH) analysis, JIANG et al. (2007)
discovered a paracentric inversion to be the reason for the suppressed genetic
recombination observed at the floral organ number 3 (FON3) locus on rice
chromosome 11. Similarly in maize, a paracentric inversion was discovered by
cytogenetic analyses to be responsible for inhibiting recombination at the narrow
sheath 2 (ns2) locus on chromosome 4L (SCANLON et al., 2000). For barley varieties,
the occurrence of spontaneous inversions has been reported by POWELL and NILAN
(1968); TSUCHIYA (1972); TSUCHIYA and SINGH (1972); and WIEBE (1972).
Introgressions of alien chromatin and structural rearrangements (inversions,
insertions, deletions) have been hypothesized or reported to be responsible for
suppressed recombination surrounding many disease resistance loci of several plant
species like tomato, poplar, wheat and barley. In tomato, suppression of
recombination was observed in the vicinity of the Tm-2a gene, conferring resistance
to tobacco mosaic virus, which was introgressed into cultivated tomato from the wild
species L. peruvianum (GANAL et al., 1989; GANAL and TANKSLEY, 1996). MESSEGUER
et al. (1991) obtained similar results for the root knot nematode resistance gene Mi-1

DISCUSSION 109
in tomato which was also introgressed from L. peruvianum. The reduced homology
between the introgressed segment and the receptor genome had originally been
hypothesized to be responsible for the severe reduction in recombination
(MESSEGUER et al., 1991; HO et al., 1992). However, it was shown by SEAH et al.
(2004) that the lack of recombination events at the Mi-1 locus was due to a
paracentric inversion between resistant and susceptible tomato lines.
The barley Mla powdery mildew resistance cluster on chromosome 1HS showed a
10-fold reduction in recombination compared to flanking regions which was attributed
to a high degree of polymorphism between the parents of the mapping cross and
additionally also to the introgressed Mla6 allele which originates from H. spontaneum
(WEI et al., 1999). Suppressed recombination near the Mlg locus in barley, which also
confers resistance to powdery mildew, was observed by GÖRG et al. (1993).
STIRLING et al. (2001) found a more than 25-fold reduction of the recombination
frequency for the region which harbors the MXC3 gene in poplar conferring
resistance to Melampsora leaf rust. Further studies by YIN et al. (2004) revealed that
the suppression of recombination was most likely caused by large hemizygous
rearrangements (insertions/deletions) in one of the parents used for establishing the
mapping population.
The Lr20-Sr15-Pm1 resistance locus on chromosome 7AL in wheat confers
resistance to leaf rust, stem rust and powdery mildew. A lack of recombination was
observed in two mapping populations for the Lr20 and Pm1 genes. NEU et al. (2002)
concluded that this might be caused by an alien introgression. However, other
possibilities, for example an inversion, could not be excluded. Additionally,
suppressed recombination in the vicinity of resistance gene loci which had been
introgressed from wild relatives into hexaploid wheat were reported for stem rust
resistance gene Sr22 (PAULL et al., 1994), and leaf rust resistance genes Lr9
(SCHACHERMAYR et al., 1994), Lr24 (SCHACHERMAYR et al., 1995), and Lr35 (SEYFARTH
et al., 1999).
As for the Rrs2 locus, both possibilities of either an introgressed chromosomal
segment or a chromosomal inversion, present only in the varieties carrying the Rrs2
gene, seem plausible explanations for the suppressed recombination observed in the
Atlas × Steffi mapping population. The crossing of a plant with a rearranged
chromosome segment with a plant with the “wild type” chromosome would result in
incomplete chromosome pairing in meiosis and prevent crossing over events in the

DISCUSSION 110
area of sequence dissimilarity. However, an introgression looks to be less likely, since
all PCR primers developed from Morex sequence information binding within the co-
segregating region also gave amplification results with plants carrying the Rrs2 gene.
If the sequence dissimilarity of the putative introgressed segment was high enough to
suppress recombination, at least some primer pairs should not be able to amplify
DNA fragments from plants carrying the introgressed segment containing the Rrs2
gene.
4.3 The Rrs2 region coincides with a region which is poorly represented in
BAC libraries
The ‘MO’ BAC library of Morex (YU et al., 2000), which was used in this study for
obtaining genomic sequences originating from the Rrs2 locus on barley chromosome
7HS, has a 6-fold genome coverage. Theoretically, each locus of the barley genome
should be represented six times in the ‘MO’ BAC library. However, at some locations
only one or two BAC clones could be identified or even no clones at all. A gap in the
‘MO’ BAC library present between BAC clones MO693M6 and MO668A17 could be
bridged by BAC clones of another barley BAC library representing the genome of
cultivar Cebada Capa (ISIDORE et al., 2005). However, up to date the major sequence
gap between the two BAC contigs flanking the Rrs2 locus on chromosome 7HS
remains unclosed, even after screening two additional BAC libraries (designated ‘MH’
and ‘ME’) of cultivar Morex. The screening of the ‘MH’ and ‘ME’ libraries was
successful in that two new BAC clones (one of each library) were identified which
prolonged the distal contig. However, also those libraries seem to exhibit little BAC
clone coverage for the Rrs2 region as only one clone per library was identified and
only for one of the established contigs.
All BAC libraries used in this study were constructed from DNA partially digested with
either the restriction enzyme HindIII, or EcoRI. Gaps in BAC libraries constructed by
partial restriction strategies can occur due to the uneven distribution of restriction
enzyme recognition sites across the genome and due to differing cutting rates of
enzymes between sites (WARD and JEN, 1990; OSOEGAWA et al., 2007). For example,
telomeric and subtelomeric sequences are normally underrepresented in BAC
libraries because they contain large amounts of repeat sequences which lack
restriction sites (RIETHMAN et al., 2001; MEFFORD and TRASK, 2002). Another well

DISCUSSION 111
documented reason for gaps in BAC libraries is that certain DNA fragments are
simply non-clonable or highly unstable in Escherichia coli hosts, for example long
inverted-repeats, AT-rich sequences, or sequences that result in toxic products to the
host, when expressed (HAGAN and WARREN, 1982; KANG and COX, 1996; RAVIN and
RAVIN, 1999; RAZIN et al., 2001).
The cloning bias generated by restriction digestion can be circumvented by using
random genomic libraries constructed from physically sheared DNA (THORSTENSON et
al., 1998; AMMIRAJU et al., 2005; OSOEGAWA et al., 2007). In fact, one random sheared
BAC library for barley is available in the Group of Genome Diversity of IPK
Gatersleben which is currently being fingerprinted by high information content
fingerprinting (HICF). Maybe additional BAC clones will be available from this library
in the near future for continuing the chromosome walking at the Rrs2 locus on barley
chromosome 7HS which might ultimately lead to the closing of the gap between the
already established BAC contigs.
4.4 Synteny to rice and Brachypodium
The grass family (Poaceae) evolved from a common ancestor around 77 million
years ago, barley (Pooideae) and rice (Erhartoideae) diverged about 46 million years
ago (GAUT, 2002). Barley, as well as wheat and rye, belong to the tribe Triticeae
within the subfamily Pooideae. Brachypodium has been placed in its own tribe
Brachypodieae which also belongs to the subfamily Pooideae (HASTEROK et al.,
2004). This is confirmed by phylogenetic studies which have revealed a closer
evolutionary relationship between Brachypodium and members of the tribe Triticeae
than between Brachypodium and other grasses (BORTIRI et al., 2008; HUO et al.,
2008).
Comparative mapping studies in grasses have shown a good conservation of marker
order (colinearity) between the grass species, even though they differ largely in
genome size, chromosome number, ploidy level and repetitive DNA content (DEVOS
et al., 1993; MOORE et al., 1995; DEVOS and GALE, 1997; GALE and DEVOS, 1998;
DEVOS and GALE, 2000; KELLER and FEUILLET, 2000). Due to the observed colinearity
on the map level, comparative genomics was considered to be a useful tool for map
based cloning using the sequence information of the model plant rice with a small

DISCUSSION 112
genome for isolating genes of agronomical importance from crop species with larger
genomes like barley, wheat, and maize (GALE and DEVOS, 1998; DEVOS and GALE,
2000).
However, in recent years comparative sequence analyses revealed a much higher
diversity on the micro-level than was predicted by mapping studies. Researchers
reported chromosomal rearrangements between cereal crops which were not
observed at the map level, including small inversions, tandem duplications, gene
insertion/deletion events, and gene translocations (BENNETZEN and RAMAKRISHNA,
2002; FEUILLET and KELLER, 2002; BENNETZEN and MA, 2003). It is estimated that, on
average, one to two of ten genes are rearranged between rice and other cereals
(BENNETZEN and MA, 2003). For barley and rice, STEIN et al. (2007) showed that only
46% of the studied barley ESTs mapped at syntenic positions in rice.
There are examples of almost completely conserved orthologous loci, for example
between barley and rice the BCD135 region (rice chr. Os4, barley chr. 2H) and the
RZ567 region (rice chr. 2, barley chr. 6H) (VAN DEYNZE et al., 1998; ROSTOKS et al.,
2002; PARK et al., 2004). The Xwg644 locus between barley (5H), rice (Os3), and
wheat (5Am) (DUBCOVSKY et al., 2001; SANMIGUEL et al., 2002), as well as the
shrunken2 (sh2)/a1 locus in sorghum, maize, and rice (CHEN et al., 1997; CHEN et al.,
1998) are also conserved. Genes, which were isolated based on sequence
information of rice, are the VRN1 gene involved in the vernalization response of
wheat (YAN et al., 2003) and the barley ROR2 gene which is required for basal
penetration resistance against Blumeria graminis f. sp. hordei (COLLINS et al., 2003).
On the other hand, disrupted microcolinearity was observed for the alcohol
dehydrogenase (adh) locus in maize and sorghum (TIKHONOV et al., 1999) or the
hardness (Ha) locus in barley, rice, and wheat (CALDWELL et al., 2004; CHANTRET et
al., 2008). Another example is the report by SONG et al. (2002) who found that rice
does not contain a storage protein gene at the orthologous position of the zein gene
in maize and the kafirin gene in sorghum (SONG et al., 2002). Also the region
surrounding the r1 and b1 genes, which are co-regulators of the anthocyanin
biosynthetic pathway, underwent extensive rearrangements in rice, sorghum and
maize (S et al., 2005). There are reports that microcolinearity can even be
disrupted within one species, for example between different maize lines (FU and
DOONER, 2002; SONG and MESSING, 2003) or barley cultivars at the Rph7 leaf rust
resistance locus (SCHERRER et al., 2005).

DISCUSSION 113
Therefore, nowadays it is often pointed out to use colinearity with caution for map
based cloning in large genomes such as barley or maize and it is rather proposed to
use more closely related species or best the species of interest itself (FEUILLET and
KELLER, 1999; FEUILLET and KELLER, 2002; SANDHU and GILL, 2002b; BENNETZEN and
MA, 2003; CALDWELL et al., 2004; GUYOT et al., 2004; SALSE et al., 2004).
Nevertheless, many reports show that the rice sequence can be very useful for the
development of markers for saturating maps at the locus of interest (KILIAN et al.,
1997; SANDHU and GILL, 2002b; BRUNNER et al., 2003; RAMAKRISHNA and BENNETZEN,
2003; PEROVIC et al., 2004).
Due to its several advantages over rice, Brachypodium distachyon (L.) Beauv. was
proposed as a new model system for the grasses and especially for the tribe Triticeae
(DRAPER et al., 2001, OZDEMIR et al., 2008). It has one of the smallest genomes of
any grass species (~350 Mb) with a low content of repetitive DNA, it is easy to grow,
has a short growth cycle, is self-fertile, and is very closely related to the tribe Triticeae
(HUO et al., 2008). So far, genome synteny of Brachypodium distachyon to rice was
confirmed by HASTEROK et al. (2006). Synteny of orthologous loci of Brachypodium
sylvaticum (Huds.) Beauv. (a related species of Brachypodium distachyon) to rice
chromosome 9 and to Sdw3 (semi-dwarfing locus 3) on barley chromosome 2H were
shown by FOOTE et al. (2004) and VU (2007), respectively. However, there was also
one report where a 371 kb large region of Brachypodium sylvaticum, which showed
perfect macro-colinearity with wheat on the marker level, had a considerable different
gene content than wheat (BOSSOLINI et al., 2007). Therefore, more studies are
needed in order to evaluate the true usefulness of Brachypodium species as a
‘bridge’ between rice and the Triticeae tribe.
The gene content of the available contiguous sequence information originating from
barley cultivars Morex and Cebada Capa as well as flanking markers of the Rrs2
locus were compared to the rice sequence and to the draft sequence of the
Brachypodium distachyon (Bd) genome. An overall macrosynteny, as reported by
DEVOS and GALE (1997) and KILIAN et al. (1995), could be confirmed between the
Rrs2 locus and the telomeric end of rice chromosome 6. Three flanking markers and
four genes were found in colinear positions to the orthologous locus in rice which
spans roughly 164 kb. Comparisons with the Brachypodium sequence led to the
conclusion that the orthologous region of the Rrs2 locus of barley is located on Bd
DISCUSSION 114
supercontig 1, since it carries more orthologous genes and flanking markers than any
other Bd supercontig.
Even though on the macro-level there seems to be a certain degree of synteny,
microsynteny (conservation of gene content on the sub-Mb level) and
microcolinearity (conservation of gene order on the sub-Mb level) was largely
disrupted between the Rrs2 locus of barley and its orthologous loci in rice and
Brachypodium. Thirteen genes present on the analyzed barley BAC contigs were not
found in the orthologous region on rice chromosome Os6, but mostly on different rice
chromosomes (Os2, 4, 5, 8, 9, 11, and 12) or at a different position on Os6. For four
genes of the barley BAC contigs no homologous sequence could be identified in the
rice genome at all. Two of them are annotated to encode pectinesterase inhibitor
domain containing proteins which are later discussed as possible candidate genes for
Rrs2. Eleven genes, present at the orthologous region on rice chromosome Os6,
were not found in the available barley sequence information. A similar situation as in
rice can be found in Brachypodium, where genes and gene order even seem to be
less conserved than in rice. One gene and one marker, which were present in the
orthologous region in rice, were not located in the syntenous region in Brachypodium
distachyon. Seven genes of the barley BAC contigs were not found in the
Brachypodium genome at all, four of which were also absent in rice. However, it has
to be kept in mind that only a draft sequence of the Brachypodium distachyon
genome was available for comparisons, and the results might be improved with a
higher coverage and better gene annotation.
Large rearrangements, as have occurred at the Rrs2 locus, are often observed at the
telomeric ends of chromosomes (CALDWELL et al., 2004) and at disease resistance
loci (RAMAKRISHNA and BENNETZEN, 2003), which are particularly unstable (DEVOS,
2005) due to their rapid reorganization (LEISTER et al., 1998). For example, a
disruption of microcolinearity between wheat and rice has been reported for the leaf
rust resistance genes Lr1 and Lr10 (GALLEGO et al., 1998; GUYOT et al., 2004) as well
as for the leaf rust resistance locus Rph7 of barley where large rearrangements
interrupted microcolinearity to rice (BRUNNER et al., 2003). INUKAI et al. (2006) found a
lack of barley-rice microsynteny in the region of the blast resistance gene RMo1 and
the Mla powdery mildew resistance gene. Interestingly, the sequence area
surrounding stem rust resistance gene Rpg1, which maps proximal of Rrs2 on
chromosome 7HS near marker MWG555a (KILIAN et al., 1997), showed an excellent

DISCUSSION 115
colinearity of flanking markers with rice and only minor rearrangements. However, a
Rpg1 homologue was missing in the rice sequence (HAN et al., 1999) and could
finally be cloned by obtaining sequence information of corresponding barley BAC
clones (BRUEGGEMAN et al., 2002). Also for Rdg2a, a leaf stripe resistance gene of
barley, the homologue could not be identified in rice. Rdg2a is located in very close
proximity distal to Rrs2 near marker MWG2018 (TACCONI et al., 2001). In contrast to
the Rpg1 region, but similar to the findings in this study, the rice-barley synteny of the
Rdg2a region also seems to be disrupted (BULGARELLI et al., 2004).
4.5 Association study, development of diagnostic molecular markers for
Rrs2, and possible origin of the Rrs2 gene
Originally developed for human genetics, association studies, also referred to as
association mapping, or linkage disequilibrium (LD) mapping, have increasingly been
applied to crop plant species in the past years (MACKAY and POWELL, 2007). The
method relies on the decline of linkage disequilibrium (nonrandom association of
alleles at different loci) over genetic distance for correlating markers with traits of
interest (FLINT-GARCIA et al., 2003). It is used for evaluating and fine mapping of
quantitative trait loci (QTL) (MACKAY and POWELL, 2007) and to identify causative
variants of genes of interest (GAUT and LONG, 2003).
The advantage of LD mapping over classical linkage mapping is that it uses the
variation present in natural populations or collections of cultivars instead of the more
limited information extractable from family relationships of segregating populations.
The higher diversity and shorter extend of LD due to the recombinational history of
the samples, which contain many more informative meioses than classical mapping
populations, leads to a much higher marker resolution (GAUT and LONG, 2003). This
was for example demonstrated by the study of TOMMASINI et al. (2007), who observed
a 390-fold higher marker resolution with an association mapping population than with
a RIL population.
In barley, association studies identified correlations between markers and traits such
as yield, yield stability, malting quality, heading date, flowering time, drought and salt
tolerance (PAKNIYAT et al., 1997; IGARTUA et al., 1999; IVANDIC et al., 2002; IVANDIC et
al., 2003; KRAAKMAN et al., 2004; MATTHIES et al., 2009). In other crop species,

DISCUSSION 116
exemplary works of successful association studies are the study of BRESEGHELLO and
SORRELLS (2006), who associated SSR markers with kernel size in hexaploid wheat
or of THORNSBERRY et al. (2001) who found that polymorphisms in the maize Dwarf8
gene are associated with variations in flowering time. Association studies have also
been used to detect markers in LD with resistance genes. IVANDIC et al. (2003)
detected the association of a SSR locus in barley with powdery mildew resistance,
TOMMASINI et al. (2007) observed associations of markers with Stagonospora
nodorum blotch resistance in European winter wheat, GEBHARDT et al. (2004) and
SIMKO et al. (2004) found markers highly associated with late blight resistance and
Verticillium dahliae resistance in potato, respectively.
The aim of the association study in this work was to further fine map the Rrs2 locus
on barley chromosome 7HS using a diverse set of 58 different genotypes. Therefore,
six genomic regions from near or within the co-segregating region of Rrs2 were
sequenced and analyzed concerning their SNP and haplotype patterns. In case
recombination among the Rrs2 carrying varieties was observed in the initial
screening, further PCR fragments from specific areas of interest were intended to be
analyzed. However, the results obtained for the first six genomic regions indicated
that the analysis of any further PCR fragment from within the co-segregating region
would lead to redundant results and therefore, no additional genomic regions were
studied for the association analysis.
Among the assayed collection of barley genotypes, a high SNP frequency could be
observed. On average, 1 SNP occurred every 42 bp. However, this number refers
only to common SNPs with an allele frequency >10%. If also minor SNPs with an
allele frequency <10% are regarded, the rate increases to 1 SNP per 20 bp. SNP
frequencies for different sets of barley genotypes and across various genomic loci
were reported by a number of studies. The values ranged from 1 SNP per 27 bp
(BUNDOCK and HENRY, 2004) to 46 bp (Annika Johrde, Transcriptome Analysis Group,
IPK Gatersleben, personal communication), 78 bp (RUSSELL et al., 2004), 130 bp
(KOTA et al., 2008); 131 bp (BUNDOCK et al., 2003), 163 bp (CHEN et al., 2008), 189 bp
(KANAZIN et al., 2002), 200 bp (ROSTOKS et al., 2005) up to 240 bp (KOTA et al., 2001).
Generally, higher SNP frequencies were observed in studies which analyzed a large
number of genotypes including landraces and wild barley accessions (BUNDOCK and
HENRY, 2004; RUSSELL et al., 2004; Annika Johrde, personal communication),
whereas lower frequencies were reported for studies involving only small numbers of
DISCUSSION 117
cultivars (KOTA et al., 2001; KANAZIN et al., 2002; BUNDOCK et al., 2003; ROSTOKS et
al., 2005; CHEN et al., 2008; KOTA et al., 2008). The values obtained in the present
study are comparable to the reported SNP frequencies for large sets of accessions
containing diverse barley genotypes.
An association study has the potential to narrow down observed differences in
phenotypes to a single nucleotide polymorphism in a gene, as was shown for the
sugary1 (su1) gene in maize where the identified SNP was responsible for the natural
occurrence of sweet maize genotypes (WHITT et al., 2002). The extent of linkage
disequilibrium (LD) is an important determinant for the possibilities to correlate
genetic with phenotypic variation through association analysis. The distance over
which LD prevails, determines the number and density of markers needed for
association mapping (FLINT-GARCIA et al., 2003). Therefore, the extent of LD across
the genomic area was assessed. Haplotypes, which were exclusively shared among
the varieties carrying the Rrs2 gene, showed a high LD (r2-values of 0.48 – 1.0) for
four out of the six analyzed genomic regions. With the exception of some rare
haplotypes, low levels of LD were observed for all other haplotypes across the
genomic region. This indicates a tight linkage of SNPs across the analyzed genomic
region in varieties carrying the Rrs2 gene which over generations has not been
disrupted by recombination. Such tight linkage of SNPs can not be observed in the
vast majority of genotypes which do not carry the Rrs2 gene.
All varieties carrying the Rrs2 gene always belonged to the same haplotype at all six
genomic locations, with some minor exceptions. One exception is the variety Osiris. It
did not show the same haplotype as the rest of the Rrs2 carrying varieties for the
PCR fragments RGH-3 and 134N7_con5-3. Both PCR fragments are located either
outside or at the edge of the Rrs2 co-segregating region which was identified with the
Atlas × Steffi mapping population. This could hint to possible recombination events at
the borders of the co-segregating region. However, the results of Osiris have to be
interpreted with caution, since the sample of Osiris used in this study proved to be
heterozygous in other experiments and the sequence information at the two genomic
locations most probably only represent one allele of the presumed two that are
present in Osiris. Another case was one sample of variety Atlas 46, Acc. HOR20489.
It is not clear why this line showed a different SNP pattern for PCR fragments RGH-3
and 134N7_con5-3 compared to the other samples of cultivar Atlas 46. Most probably
this line does not represent the pure variety Atlas 46.

DISCUSSION 118
There were three accessions, representing the varieties Onslow (Acc. 406008, Acc.
20557) and Gairdner (Acc. 408175), which were previously reported to carry the Rrs2
gene according to Hugh Wallwork (SARDI, Adelaide, Australia; personal
comunication). This report was based on data obtained from resistance reactions to
differential isolates of Rhynchosporium secalis. However, it is doubtful whether these
cultivars really carry the Rrs2 gene, since the gene has not been genetically mapped
in those varieties and Onslow and Gairdner are the only cultivars of the set of
varieties classified to carry the Rrs2 gene which never shared the same SNP pattern
as the other Rrs2 carrying varieties. They probably possess another resistance gene
which mediates a similar reaction to differential fungal isolates as does the Rrs2
gene.
The three resistant accessions Atlas 54 (CI9556), Turk × Atlas (CI7189), and
Wisconsin Winter x Glabron (CI8162) have never been described to carry the Rrs2
gene. However, they showed the same SNP pattern as all other Rrs2 possessing
varieties in all analyzed genomic fragments. Additionally, two of the varieties are
directly related with the variety Atlas. It is therefore highly probable that the resistance
reaction in Atlas 54 (CI9556), Turk × Atlas (CI7189), and Wisconsin Winter x Glabron
(CI8162) is mediated by Rrs2. This must especially be the case if the observed
recombination suppression at the Rrs2 locus is due to the presumed chromosomal
rearrangement. Nevertheless, whether these varieties really carry Rrs2 has to be
investigated further using segregating populations.
In summary, a large linkage block extending over several hundred kb at the Rrs2
locus on barley chromosome 7H was observed in varieties carrying the Rrs2 gene.
Recombination suppression seen on the mapping population level extends also to
the variety level, thus rendering the further fine mapping of the Rrs2 gene via an
association mapping approach not possible. However, several SNPs which were
exclusively present in lines which carry the Rrs2 gene, and therefore highly
associated with the Rrs2 resistance phenotype, could be converted into eight high-
throughput molecular markers. In total five CAPS markers and three pyrosequencing
markers, targeting five SNPs of three genomic fragments of the Rrs2 locus, were
developed and tested on a set of varieties which differ in the Rrs2 phenotype. These
high-throughput markers can now be applied to marker assisted selection (MAS) in
breeding programs for resistant cultivars against Rhynchosporium secalis. MAS
makes it possible to select traits with greater accuracy and to develop new varieties

DISCUSSION 119
quicker and therefore more cost effectively than with conventional selection methods.
It should be considered that Rhynchosporium secalis is a highly variable fungus
which is able to overcome resistance genes quickly (WILLIAMS et al., 2001).
Therefore, pyramiding Rhynchosporium secalis resistance genes can greatly prolong
the time varieties remain resistant against the fungus. Up to now the Rrs2 resistance
gene is not yet widely present in current barley cultivars and so far no reports exist of
a break of the Rrs2 mediated resistance by the fungus in Germany. However, the
resistance of Pewter, which carries the Rrs2 gene, has been reported to be broken in
the UK (Günther Schweizer, personal communication).
Since all varieties possessing the Rrs2 gene contain an identical stretch of sequence,
which does not seem to recombine, it is very likely that this sequence originates from
a single common ancestor. The pedigree of Rrs2 carrying varieties does not show
any obvious relationship between the varieties. Three different groups of common
geographical origin or pedigree can be distinguished, but the links between the
groups are missing (Fig. 4.1). There is a slight hint that the Rrs2 gene could have
originated in Northern Africa. The varieties Coast and Osiris are the oldest varieties
from the set of 14 varieties studied (introduction year unknown for two varieties) and
both varieties are reported to originate from Northern Africa. However, the geographic
origin data for the variety Coast varies, therefore the possible origin of Rrs2 from
Northern Africa remains only a vague guess (Fig. 4.1).

DISCUSSION 120
A possible source of Rrs2 from Northern Africa and hypothetical relationships between varieties are indicated based on introduction year and improvement status of varieties. If not indicated otherwise, introduction years were obtained from http://www.ars-grin.gov/npgs/searchgrin.html. Pedigree information can be found in Supplementary Table A1. Varieties Atlas (CI 4118), Atlas 46, Coast (CI 2235), Escaldadura 15, Gloria LB Iran × Harrington, Osiris (CI 1622), Pewter, and PI452395 were confirmed as Rrs2 carrying varieties by mapping experiments performed at the Bayerische Landesanstalt für Landwirtschaft in Freising by the lab of Günther Schweizer. Digger and Livet were reported to carry Rrs2 by William Thomas (SCRI, Dundee, UK) and Forrest (AUS) by Hugh Wallwork (SARDI, Adelaide, Australia). In the association study performed in this work all those varieties carried the same SNP pattern which was also shared by Atlas 54, Turk × Atlas, and Wisconsin Winter × Glabron (CI 8162). The last varieties are therefore regarded to carry Rrs2, but this still needs to be confirmed by mapping experiments.
Fig. 4.1: Geographical origin and common pedigree of barley varieties carrying Rrs2.
1 http://www.ars-grin.gov/cgi-bin/npgs/acc/search.pl?accid=CI2235%3A%3AHordeum
2 http://www.j ic.ac.uk/GERMPLAS/bbsrc_ce/Pedb.txt
3 RUSSEL et al. (2000)
4 THOMAS et al. (2001)
5 KANAZIN et al. (2002)
Digger (1985)
Livet (19983)
Pewter (2001)
PI452395 (1981)
UK origin
possible source of Rrs2
maybe from North Africa?
South American origin
Escaldadura 15 (Uruguay)
CI 8162 - Wisconsin Winter x Glabron (Argentina) (~1948)
4
Gloria LB Iran x Harrington (Syria)
Middle East + North African origin
CI 1622 – Osiris (Algeria) (1910s)
CI 2235 – Coast
USA1 orNorth Africa2, 5
(~1912)
CI 4118 - Atlas
USA, line selection of Coast (1920s)
Turk x Atlas (~1945)
Atlas 46 (1947)
Atlas 54 (1954)
Forrest (AUS) (1981)
Coast background
1 http://www.ars-grin.gov/cgi-bin/npgs/acc/search.pl?accid=CI2235%3A%3AHordeum
2 http://www.j ic.ac.uk/GERMPLAS/bbsrc_ce/Pedb.txt
3 RUSSEL et al. (2000)
4 THOMAS et al. (2001)
5 KANAZIN et al. (2002)
Digger (1985)
Livet (19983)
Pewter (2001)
PI452395 (1981)
UK origin
possible source of Rrs2
maybe from North Africa?
South American origin
Escaldadura 15 (Uruguay)
CI 8162 - Wisconsin Winter x Glabron (Argentina) (~1948)
4
Gloria LB Iran x Harrington (Syria)
Middle East + North African origin
CI 1622 – Osiris (Algeria) (1910s)
CI 2235 – Coast
USA1 orNorth Africa2, 5
(~1912)
CI 4118 - Atlas
USA, line selection of Coast (1920s)
Turk x Atlas (~1945)
Atlas 46 (1947)
Atlas 54 (1954)
Forrest (AUS) (1981)
CI 2235 – Coast
USA1 orNorth Africa2, 5
(~1912)
CI 4118 - Atlas
USA, line selection of Coast (1920s)
Turk x Atlas (~1945)
Atlas 46 (1947)
Atlas 54 (1954)
Forrest (AUS) (1981)
Coast background
SUMMARY 121
4.6 Putative candidate genes for Rrs2
Sequence analysis of the co-segregating region of Rrs2 led to the identification of
eleven genes which show reliable hits to known unigene clusters or ESTs. Among the
eleven genes were a flavonol-sulfotransferase (HvFST-2), a receptor-like protein
kinase 5 precursor (HvRLK), two genes encoding pectinesterase inhibitor domain
containing proteins (HvPEI-1, HvPEI-2), and a putative -1,3-glucan synthase gene
(HvGSY). Those genes all show a functional annotation that hints to an involvement
in disease resistance processes.
LACOMME and ROBY (1996) identified a flavonol-sulfotransferase in Arabidopsis which
was induced by salicylic acid, a signal molecule which is involved in the defense
response of plants upon pathogen infection (CHEN et al., 1995). Additionally, the
expression of this flavonol-sulfotransferase was increased following infection with the
bacterial pathogens Xanthomonas campestris pv. campestris and Pseudomonas
syringae pv. maculicola. The maximal expression of the gene occurred after infection
with avirulent bacterial strains of both pathosystems causing a hypersensitive
reaction. This suggests that the investigated flavonol-sulfotransferase participates in
the establishment of systemic acquired resistance (VARIN et al., 1997). One part of
the predicted exon of the flavonol-transferase gene (HvFST-2), present in the Rrs2
co-segregating region, was shown to be expressed under standard greenhouse
conditions in Atlas and Steffi. Whether HvFST-2 could mediate the Rrs2 response
needs further investigation. However, based on the observations of LACOMME and
ROBY (1996) for the Arabidopsis FST gene, it is more likely that HvFST-2 would
either function as a downstream component of the defense reaction or in basal
defense mechanisms.
Receptor-like protein kinases (RLKs) play an essential role in plant growth and
development, in responses to biotic and abiotic stresses as well as nodulation and
rhizobial symbiosis. The majority of RLKs possess transmembrane and extracellular
domains enabling them to sense extracellular signals like pathogen elicitors (SHIU et
al., 2004). Examples of RLKs involved in pathogen defense are Xa21 and Xa26, two
leucine-rich repeat receptor-like kinases (LRR-RLK) of rice which confer resistance to
the bacterial blight pathogen Xanthomonas oryzae pv. oryzae (SONG et al., 1995; SUN
et al., 2004). The Arabidopsis FLS2 and BAK1 proteins, also LRR-RLKs, are involved
in recognition and signalling of flagellin (GÓMEZ-GÓMEZ and BOLLER, 2000;
SUMMARY 122
CHINCHILLA et al., 2007). Furthermore BAK1 is also implied in cell death control and
resistance to necrotrophic fungi (HE et al., 2007; KEMMERLING et al., 2007). Another
RLK of Arabidopsis, called LysM RLK1, is required for response to chitin, a
component of fungal cell walls (MIYA et al., 2007; WAN et al., 2008). The dominant R
gene Pi-d2 of rice encodes a B-lectin RLK which confers resistance to the fungal
pathogen Magnaporthe grisea (CHEN et al., 2006). Receptor-like cytoplasmic kinases
(RLCKs), a subgroup of RLKs, do not possess transmembrane and extracellular
domains, but are closely related to RLKs (SHIU and BLEECKER, 2001) and are also
involved in pathogen defense responses. A very well studied member of this group is
Pto which confers race-specific resistance to Pseudomonas syringae in tomato
(MARTIN et al., 1993). Other members are the PBS1 protein from Arabidopsis which
confers resistance to Pseudomonas syringae pv. phaseolicola (SWIDERSKI and INNES,
2001) and the protein encoded by Rpg1 of barley against Puccinia graminis f. sp.
tritici (BRUEGGEMAN et al., 2002). The Pto and PBS1 genes have been shown to
require the NBS-LRR genes Prf and RPS5, respectively, for resistance (SALMERON et
al., 1996; WARREN et al., 1999). This indicates that sometimes RLKs and NBS-LRR R
genes need to work together for conferring resistance against plant pathogens. RLKs
constitute a structurally diverse and large gene family with >600 members in
Arabidopsis thaliana and around 1130 in rice (SHIU et al., 2004). Even though the
knowledge of the biological function of most of those RLKs is limited (YIN et al.,
2002), it has been shown that RLKs are involved in various signalling processes
involving R gene mediated defense responses. Therefore, the RLK gene found in the
Rrs2 co-segregating region, which shows similarity to a LRR-RLK (Table 3.4; chapter
3.4), is regarded as a candidate gene for Rrs2. Nevertheless, it is equally possible
that this gene is involved in other signal transduction processes. A case like this was
observed for the wheat receptor-like kinase gene Lrk10. It was found to co-segregate
with the Lr10 gene which confers resistance to the leaf rust pathogen Puccinia
triticina (FEUILLET et al., 1997). However, Lrk10 had no influence on the leaf rust
resistance and Lr10 turned out to be a typical R gene of the CC-NBS-LRR family
(FEUILLET et al., 2003).
In many plant-pathogen interactions the cell wall functions as a physical barrier which
first must be overcome for further colonization of the plant. Enzymes, secreted by
phytopathogenic fungi and bacteria, are able to degrade plant cell walls, thus
enabling the pathogens to penetrate it, and additionally providing a nutrient source
SUMMARY 123
(ESQUERRÉ-TUGAYÉ et al., 2000). Apart from cellulose and hemicellulose, pectin is the
main and the most complex polysaccharide of plant cell walls. Pectinolytic enzymes
are among the first to be secreted by plant pathogens and include,
polygalacturonases, pectate and pectin lyases, as well as pectinesterases (ALGHISI
and FAVARON, 1995; VALETTE-COLLET et al., 2003). Sometimes those enzymes are
even essential for the virulence of different pathogens (ROGERS et al., 2000; YAKOBY
et al., 2000; ISSHIKI et al., 2001; OESER et al., 2002; VALETTE-COLLET et al., 2003).
Plants in turn produce enzymes which can inhibit the activity of microbial enzymes.
Known inhibitor proteins for pectinolytic enzymes include polygalacturonase inhibiting
proteins (PGIPs), a fairly well studied group of inhibitors (POWELL et al., 2000;
LORENZO and FERRARI, 2002; FERRARI et al., 2003; FERRARI et al., 2006) and a
pectinmethylesterase inhibitor (PMEI) from pepper (Capsicum annuum) (AN et al.,
2008). PMEIs seem to exhibit target specificities either for plant or microbial
pectinmethylesterases (PMEs), since all other PMEIs isolated so far only inhibited
PMEs of plant origin and did not affect the activity of microbial enzymes (MATTEO et
al., 2005). It is not known whether the two genes coding for pectinesterase inhibitor
domain containing proteins found in the Rrs2 co-segregating region are targeted
against plant or microbial enzymes. However, besides their co-segregation with Rrs2,
there is another good reason to consider both genes as possible candidate genes for
Rrs2. Histological studies of the infection process of Rhynchosporium secalis have
shown that the fungus often initiates penetration of the cuticle in the groove between
two epidermal cells, a region rich in pectin (JONES and AYRES, 1974; LEHNACKERS and
KNOGGE, 1990; XI et al., 2000a). This led to the hypothesis that Rhynchosporium
secalis produces pectin degrading enzymes for penetration of the cuticle (XI et al.,
2000a). The activity of pectin degrading enzymes in later stages of the
Rhynchosporium secalis infection is suggested by JONES and AYRES (1974) due to
observations of structural changes in pectic substances near subcuticular hyphae.
The fifth and last gene (HvGSY) with possible involvement in resistance processes
encodes a -1,3-glucan synthase, also called callose synthase. At this point it needs
to be reminded that all discussions about this gene are based on the assumption that
HvGSY is located in the co-segregating region of Rrs2. It is inferred from mapping
data of the HarvEST Barley Integrated Map 04/16/08, but was not confirmed by other
means in this study.

SUMMARY 124
Callose is a high-molecular- -1,3-glucan which plays a role in plant growth
and development. However, callose synthesis is also induced by biotic and abiotic
stresses (DONG et al., 2008). It plays a role in early responses to microbial attacks
through its rapid deposition in cell wall appositions (papillae) (JACOBS et al., 2003;
STRANGE, 2003). Those appositions which form beneath infection sites contain mainly
callose and minor amounts of other polysaccharides, phenolic compounds, reactive
oxygen intermediates, and proteins, but the molecular components of papillae can
differ between susceptible and resistant plant lines (BAYLES et al., 1990; JACOBS et
al., 2003). Papillae are generally thought to exhibit a physical barrier to microbial cell
wall penetration (JACOBS et al., 2003; NISHIMURA et al., 2003), but it is also reported
that the resistance function can depend on the chemical composition (BAYLES et al.,
1990). Early callose synthase activation and the resulting formation of papillae has
been shown to be essential for the mlo mediated resistance of barley against
Blumeria graminis (BAYLES et al., 1990). When papillae formation was delayed
through inhibiting callose synthase, the powdery mildew fungus was able to infect the
plant.
Resistance to Rhynchosporium secalis in the barley varieties Johnston and CDC
Guardian is characterized by the prevention of fungal penetration through the cuticle
(XI et al., 2000a). Host cell wall alterations (HCWA), a term which summarizes
apposition and halo formation, were observed to be negatively correlated with the
penetration of the fungus. A similar case was reported for cultivars Digger and Osris
(JØRGENSEN et al., 1993) which both carry the Rrs2 gene. Osiris also possesses
other resistance genes (supplementary TableA1). In both studies, also the
susceptible cultivars reacted with papilla and halo formation upon Rhynchosporium
secalis infection. However, in resistant cultivars appositions and halos developed
much quicker and reached a larger size. This accelerated and intensified reaction
was correlated with the inhibition of fungal penetration. It is speculated by both
authors that the appositions beneath the epidermal cell walls rather act as chemical
barriers than physical barriers, since hyphae only penetrate the cuticle and not the
epidermal cell walls (JØRGENSEN et al., 1993; XI et al., 2000a). The Rrs1 mediated
resistance, which was studied histologically by LEHNACKERS and KNOGGE (1990),
showed no correlation between apposition formation and resistance. The resistant
reaction was rather correlated with prevention of subcuticular hyphae growth.

SUMMARY 125
In the Arabidopsis thaliana genome different callose synthases exist which are
hypothesized to participate in different physiological processes and act in different
tissues (VERMA and HONG, 2001). The gene present in the Rrs2 co-segregating
region might be implied in callose production upon pathogen infection. The action of
-1,3-
glucan synthase gene (HvGSY) in question is a candidate for Rrs2, since callose
deposition in papillae also occurs in susceptible barley cultivars.
Concluding, the resistance reaction against Rhynchosporium secalis, mediated by
Rrs2, is characterized by an accelerated and larger formation of papillae and halos
and a possible involvement of chemical compounds to stop the fungal penetration of
the cuticle (JØRGENSEN et al., 1993). From the five genes co-segregating with Rrs2,
which show a functional annotation related to disease resistance processes, three
genes are considered possible candidate genes for Rrs2 based on similarities to
other known resistance genes and their possible role in the resistance reaction. One
of these genes is the receptor-like protein kinase 5 precursor which could be involved
in perception and signalling of the pathogen attack leading to an accelerated
activation of general defense mechanisms of the plant. The other two candidate
genes are encoding pectinesterase inhibitor domain containing proteins which could
be involved in the inhibition of pectin degrading enzymes of Rhynchosporium secalis
resulting in a penetration prevention. The flavonol-sulfotransferase (HvFST-2) gene
-1,3-glucan synthase gene (HvGSY) are thought to be involved in
downstream or general defense mechanism of the plant and are therefore not
considered possible candidate genes of Rrs2.
All sequence information obtained of the Rrs2 co-segregating region originates from
the susceptible barley cultivars Morex and Cebada Capa. It can be argued that the
Rrs2 gene possibly is not present in those cultivars and hence can also not be
identified in the sequence information. Furthermore, not all barley BAC clones of the
Rrs2 co-segregating region have been fully sequenced and there also remains a
sequence gap of unknown size spanning this region. Therefore, further work is
needed to close this gap and to obtain all the missing sequence information,
preferentially from a Rrs2 carrying cultivar, so that all possible candidate genes can
be identified.

SUMMARY 126
4.7 Outlook
The results obtained in this study, which led to the development of diagnostic
molecular markers for Rrs2, are very useful for barley breeders, who now can employ
those markers in their breeding programs. Nevertheless, the identification and
cloning of Rrs2 still is of relevant scientific interest. It could answer fundamental
questions regarding host-pathogen interactions of barley and Rhynchosporium
secalis and provide hints on the structure and function of other R genes against
Rhynchosporium secalis. Furthermore, the elucidation of the reason behind the
suppressed recombination in varieties carrying the Rrs2 gene could be of interest
regarding genome dynamics in barley and possibly also in respect to R gene
evolution.
The following steps are proposed for continuing the identification of candidate genes
for Rrs2 and to investigate whether the suppressed recombination in Rrs2 carrying
varieties is due to an inverted chromosomal fragment:
1) The sequence gap spanning the Rrs2 co-segregating region needs to be
closed. Therefore, sequence information of BAC clones MH68J02 and
ME194H14 should be obtained in order to continue chromosome walking in
parallel to the high information content fingerprinting (HICF) which is ongoing
in the Genome Diversity Group of IPK. The HICF screening of a random
sheared BAC library of Morex is also expected to provide new BAC clones
prolonging the present BAC contigs. Additionally to the possible identification
of new BAC clones, sequence information of MH68J02 and ME194H14 might
provide information about further candidate genes.
2) The assumed position of HarvEST unigene #2649 (HvGSY) in the co-
segregating region of Rrs2 needs to be confirmed by mapping this gene in the
Atlas × Steffi mapping population. After successful mapping, all available BAC
libraries should be screened with a probe or primers obtained from HvGSY.
This could identify one or more BAC clones from within the co-segregating
region. Those clones might not have been found up to now through
chromosome walking, because linking BAC clones could be absent from the
BAC libraries.
3) Finally, the construction of a genomic insert library of cultivar Atlas or another
variety which carries the Rrs2 gene would be necessary in order to sequence

SUMMARY 127
the co-segregating region of a plant which actually possesses the Rrs2 gene.
This will greatly facilitate the identification of possible candidate genes and
also help to limit their number, as any identical gene can be discarded and any
different or additional gene is a direct candidate for Rrs2.
4) In case a manageable number of candidate genes is identified (5-10), detailed
studies on the transcriptional level should be carried out in order to further
narrow down the list of possible candidates. Ultimately, a confirmation of
candidate genes, for example by gene silencing or transformation
experiments, is needed.
5) In order to investigate whether Rrs2 possessing barley varieties carry an
inversion of a chromosomal fragment, cytological studies of pachytene
chromosomes of F1-generation crosses between Rrs2 and non-Rrs2 carrying
plants could be carried out. In case a large enough inversion exists, inversion
loops should be observed.
Another possible way to elucidate the presence of an inversion could be the
use of the fluorescent in situ hybridization (FISH) technique. BAC clones from
the area of interest could be hybridized to barley chromosomes from barley
lines with and without Rrs2 and their chromosomal order could be compared.
However, for barley this technique is still in process of development (Ingo
Schubert, Karyotype Evolution Group, IPK, personal communication).
Therefore, this proposed experiment is only hypothetical up to now.

SUMMARY 128
5 Summary
The Rrs2 gene confers resistance to the fungal pathogen Rhynchosporium secalis
which causes leaf scald, a major barley disease. Rrs2 is located on the distal end of
barley chromosome 7HS, a region that shows macrosynteny to rice chromosome
Os6 and Brachypodium distachyon supercontig1, but a disrupted microsynteny. The
Rrs2 gene was fine mapped to an interval of 0.08 cM between markers 693M6_6 and
P1D23R within a mapping population of 9179 F2-plants derived from a cross of Atlas
(resistant) × Steffi (susceptible). In parallel, a physical map of the Rrs2 locus was
established using various BAC libraries. All markers mapping within the Rrs2 interval
co-segregated with the Rrs2 gene. However, co-segregating markers were located
on two different physical barley BAC contigs which are separated by a gap of
unknown size. This situation was already observed after screening about half the
number of total progeny in the mapping population. The additional screening of the
remaining progeny did not result in any new recombination event breaking the co-
segregation. The number of observed recombination events within the Rrs2 interval
was considerably less than the expected number of recombination events. This led to
the conclusion that there is an area of suppressed recombination in the vicinity of
Rrs2 in the Atlas × Steffi mapping population.
An association mapping approach, undertaken in order to obtain a higher genetic
resolution, showed that markers of the co-segregating region were in linkage
disequilibrium, but only in cultivars carrying the Rrs2 gene. The genomic region
around Rrs2 always seems to be inherited as a large linkage block. A possible
explanation for this is a local chromosomal rearrangement in Rrs2 carrying varieties
due to either an alien introgression or an inversion. The association study led to the
discovery of twelve SNPs, originating from four different genomic regions, which were
highly associated with the Rrs2 phenotype. Based on five SNPs, eight diagnostic
molecular markers for Rrs2 (five CAPS markers and three pyrosequencing markers)
were developed. These markers can be used for the discrimination of barley lines in
the breeding process for resistant varieties against Rhynchosporium secalis carrying
Rrs2.
Eleven genes were identified in the Rrs2 co-segregating region. Among them are a
receptor-like protein kinase 5 precursor and two genes encoding pectinesterase
inhibitor domain containing proteins. Due to their similarity to known resistance genes
and their function, those genes are regarded as possible candidate genes for Rrs2.

ZUSAMMENFASSUNG 129
6 Zusammenfassung
Das Gen Rrs2 vermittelt Resistenz gegen den pilzlichen Erreger Rhynchosporium
secalis, Verursacher der gleichnamigen Blattfleckenkrankheit in Gerste. Das Gen
kartiert distal auf den kurzen Arm des Chromosom 7H der Gerste. Mithilfe einer 9179
F2-Pflanzen umfassenden Kartierungspopulation aus einer Kreuzung der resistenten
Sorte Atlas mit der anfälligen Sorte Steffi, wurde das Rrs2 Gen in einen 0,08 cM
großen Bereich zwischen die Marker 693M6_6 und P1D23R feinkartiert. Zeitgleich
erfolgte die Erstellung einer physikalischen Karte der Rrs2-Region, welche aus BAC
Klonen verschiedener BAC Bibliotheken aufgebaut ist.
Alle Marker, die in dem 0,08 cM großen Bereich zwischen Marker 693M6_6 und
P1D23R liegen, co-segregieren mit dem Rrs2 Gen. Allerdings befinden sich die co-
segregierenden Marker auf zwei unterschiedlichen BAC contigs, welche durch eine
Lücke mit unbekannter Größe voneinander getrennt sind. Dieses konnte schon nach
der Untersuchung der Hälfte der Nachkommenschaft der Gesamtkartierungs-
population festgestellt werden. Die weitere Analyse der restlichen F2-Pflanzen lieferte
keine neuen Rekombinationsereignisse zwischen den co-segregierenden Markern.
Die Anzahl beobachteter Rekombinationsereignisse im untersuchten Bereich war
signifikant geringer, als die erwartete Anzahl. Daher wird vermutet, dass die Region
um die Rrs2-Genregion in der Atlas × Steffi Kartierungspopulation eine unterdrückte
Rekombination aufweist.
Eine Assoziationsstudie mit dem Ziel eine höhere genetische Auflösung um das Rrs2
Gen zu erreichen, zeigte ein Kopplungsungleichgewicht (linkage disequilibrium) der
Marker aus der co-segregierenden Region. Dies war allerdings nur in den Sorten, die
das Rrs2 Gen besitzen der Fall. Die Region um das Rrs2 Gen scheint daher immer
als großer zusammenhängender Bereich vererbt zu werden. Eine mögliche
Erklärung dafür könnten strukturelle chromosomale Veränderungen infolge eines
Introgressions- oder Inversionsereignisses in den Sorten, die das Rrs2 Gen tragen,
sein. Dank der Assoziationsstudie wurden zwölf SNPs in vier Genomregionen des
co-segregierenden Bereichs entdeckt, welche eine hohe Assoziation mit dem Rrs2-
Phänotyp aufweisen. Basierend auf fünf SNPs, wurden infolgedessen acht
diagnostische molekulare Marker für das Rrs2 Gen entwickelt (fünf CAPS Marker
und drei Pyrosequenziermarker). Diese Marker können zur Selektion auf Rrs2-
Resistenz in Gerstenlinien während des Züchtungsprozesses eingesetzt werden.

ZUSAMMENFASSUNG 130
In der mit Rrs2 co-segregierenden Region konnten elf Gene identifiziert werden.
Unter ihnen sind ein Gen, welches für eine Vorstufe der Rezeptor-ähnlichen Kinase 5
kodiert und zwei Gene, die für Pektinesterase Inhibitoren kodieren. Aufgrund ihrer
Ähnlichkeit zu bekannten Resistenzgenen und wegen ihrer Funktion, können diese
Gene als mögliche Kandidatengene für Rrs2 angesehen werden.

REFERENCES 131
7 References
D. C. ABBOTT, A. H. D. BROWN, J. J. BURDON (1992) Genes for scald resistance from wild barley (Hordeum vulgare spp. spontaneum) and their linkage to isozyme markers. Euphytica 61:225-231.
E. D. AKHUNOV, A. W. GOODYEAR, S. GENG, L.-L. QI, B. ECHALIER, B. S. GILL, MIFTAHUDIN, J. P. GUSTAFSON, G. LAZO, S. CHAO, et al. (2003) The organization and rate of evolution of wheat genomes are correlated with recombination rates along chromosome arms. Genome Res 13:753-763.
P. ALGHISI, F. FAVARON (1995) Pectin-degrading enzymes and plant-parasite interactions. Eur J Plant Pathol 101:365-375.
S. M. ALI (1975a) Inheritance of scald resistance in barley. I Resistance genes of group A barley cultivars. Aust J Agric Res 26:243-250.
S. M. ALI (1975b) Inheritance of scald resistance in barley. II Resistance genes of group B barley cultivars. Aust J Agric Res 26:251-257.
S. M. ALI (1976) Pathogenicity of 203 isolates of Rhynchosporium secalis on 21 barley cultivars. Physiol Plant Pathol 9:135-143.
S. F. ALTSCHUL, W. GISH, W. MILLER, E. W. MYERS, D. J. LIPMAN (1990) Basic local alignment search tool. J Mol Biol 215:403-410.
J. S. S. AMMIRAJU, Y. YU, M. LUO, D. KUDRNA, H. KIM, J. L. GOICOECHEA, Y. KATAYOSE, T. MATSUMOTO, J. WU, T. SASAKI, et al. (2005) Random sheared fosmid library as a new genomic tool to accelerate complete finishing of rice (Oryza sativaspp. nipponbare) genome sequence: sequencing of gap-specific fosmid clones uncovers new euchromatic portions of the genome. Theor Appl Genet111:1596-1607.
S. H. AN, K. H. SOHN, H. W. CHOI, I. S. HWANG, S. C. LEE, B. K. HWANG (2008) Pepper pectin methylesterase inhibitor protein CaPMEI1 is required for antifungal activity, basal disease resistance and abiotic stress tolerance. Planta 228:61-78.
L. K. ANDERSON, A. LAI, S. M. STACK, C. RIZZON, B. S. GAUT (2006) Uneven distribution of expressed sequence tag loci on maize pachytene chromosomes. Genome Res 16:115-122.
THE ARABIDOPSIS GENOME INITIATIVE (2000) Analysis of the genome sequence of the flowering plant Arabidopsis thaliana. Nature 408:796-815.
K. ARUMUGANATHAN, E. D. EARLE (1991) Nuclear DNA content of some important plant species. Plant Mol Biol Report 9:208-218.
REFERENCES 132
Z. ASFAW, R. VON BOTHMER (1990) Hybridization between landrace varieties of Ethiopian barley (Hordeum vulgare ssp. vulgare) and the progenitor of barley (H. vulgare ssp. spontaneum). Hereditas 112:57-64.
P. AURIOL, G. STROBEL, J. P. BELTRAN, G. GRAY (1978) Rhynchosporoside, a host-selective toxin produced by Rhynchosporium secalis, the causal agent of scald disease of barley. Proc Natl Acad Sci U S A 75:4339-4343.
E. N. AYESU-OFFEI, B. G. CLARE (1970) Processes in the inheritance of barley leaves by Rhynchosporium secalis. Aust J Biol Sci 23:299-307.
E. N. AYESU-OFFEI, B. G. CLARE (1971) Symptoms of scald disease induced by toxic metabolites of Rhynchosporium secalis. Aust J Biol Sci 24:169-174.
M. A. AYLIFFE, E. S. LAGUDAH (2004) Molecular genetics of disease resistance in cereals. Ann Bot (Lond) 94:765-773.
P. G. AYRES, H. OWEN (1971) Resistance of barley varieties to establishment of subcuticular mycelia by Rhynchosporium secalis. Trans Brit Mycol Soc57:233-240.
G. BACKES, A. GRANER, B. FOROUGHI-WEHR, G. FISCHBECK, G. WENZEL, A. JAHOOR
(1995) Localization of quantitative trait loci (QTL) for agronomic important characters by the use of a RFLP map in barley (Hordeum vulgare L.). Theor Appl Genet 90:294-302.
R. J. BAKER, E. N. LARTER (1963) The inheritance of scald resistance in barley. Can J Genet Cytol 5:445-449.
M. BAUMER, L. HARTL, R. CAIS (2004) Züchtungsfortschritt bei Braugerste. Getreide Magazin 9:158-163.
C. J. BAYLES, M. S. GHEMAWAT, J. R. AIST (1990) Inhibition by 2-deoxy-D-glucose of callose formation, papilla deposition, and resistance to powdery mildew in an ml-o barley mutant. Physiol Mol Plant Pathol 36:63-72.
W. W. BEER (1991) Leaf blotch of barley. Zentralbl Mikrobiol 146:339-358.
A. P. BEHN (2003) Molekulargenetische Charakterisierung und Lokalisierung der Widerstandsfähigkeit gegen die nichtparasitäre Blattverbräunung bei Sommergerste. PhD thesis. Technischen Universität München, Fakultät Wissenschaftszentrum Weihenstephan für Ernährung, Landnutzung und Umwelt, Lehrstuhl für Pflanzenbau und Pflanzenzüchtung.
M. D. BENNETT, I. J. LEITCH (1995) Nuclear DNA amounts in Angiosperms. Ann Bot (Lond) 76:113-176.
J. L. BENNETZEN, W. RAMAKRISHNA (2002) Numerous small rearrangements of gene content, order and orientation differentiate grass genomes. Plant Mol Biol48:821-827.

REFERENCES 133
J. L. BENNETZEN, J. MA (2003) The genetic colinearity of rice and other cereals on the basis of genomic sequence analysis. Curr Opin Plant Biol 6:128-133.
Å. BJØRNSTAD, V. PATIL, A. TEKAUZ, A. G. MARØY, H. SKINNES, A. JENSEN, H. MAGNUS, J.MACKEY (2002) Resistance to scald (Rhynchosporium secalis) in barley (Hordeum vulgare) studied by near-isogenic lines: I. markers and differential isolates. Phytopathology 92:710-720.
H. E. BOCKELMAN, E. L. SHARP (1977) Trisomic analysis of genes for resistance to scald and net blotch in several barley cultivars. Can J Bot 55:2142-2148.
E. BORTIRI, D. COLEMAN-DERR, G. R. LAZO, O. D. ANDERSON, Y. Q. GU (2008) The complete chloroplast genome sequence of Brachypodium distachyon: sequence comparison and phylogenetic analysis of eight grass plastomes. BMC Res Notes 1:61.
E. BOSSOLINI, T. WICKER, P. A. KNOBEL, B. KELLER (2007) Comparison of orthologous loci from small grass genomes Brachypodium and rice: implications for wheat genomics and grass genome annotation. Plant J 49:704-717.
P. J. BRADBURY, Z. ZHANG, D. E. KROON, T. M. CASSTEVENS, Y. RAMDOSS, E. S. BUCKLER
(2007) TASSEL: software for association mapping of complex traits in diverse samples. Bioinformatics 23:2633–2635.
F. BRESEGHELLO, M. E. SORRELLS (2006) Association mapping of kernel size and milling quality in wheat (Triticum aestivum L.) cultivars. Genetics 172:1165-1177.
R. BRUEGGEMAN, N. ROSTOKS, D. KUDRNA, A. KILIAN, F. HAN, J. CHEN, A. DRUKA, B.STEFFENSON, A. KLEINHOFS (2002) The barley stem rust-resistance gene Rpg1is a novel disease-resistance gene with homology to receptor kinases. Proc Natl Acad Sci U S A 99:9328-9333.
R. BRUEGGEMAN, A. DRUKA, J. NIRMALA, T. CAVILEER, T. DRADER, N. ROSTOKS, A.MIRLOHI, H. BENNYPAUL, U. GILL, D. KUDRNA, et al. (2008) The stem rust resistance gene Rpg5 encodes a protein with nucleotide-binding-site, leucine-rich, and protein kinase domains. Proc Natl Acad Sci U S A 105:14970-14975.
P. C. BRUNNER, S. SCHÜRCH, B. A. MCDONALD (2007) The origin and colonization history of the barley scald pathogen Rhynchosporium secalis. J Evol Biol20:1311-1321.
S. BRUNNER, B. KELLER, C. FEUILLET (2000) Molecular mapping of the Rph7.g leaf rust resistance gene in barley (Hordeum vulgare L.). Theor Appl Genet 101:783-788.
S. BRUNNER, B. KELLER, C. FEUILLET (2003) A large rearrangement involving genes and low-copy DNA interrupts the microcollinearity between rice and barley at the Rph7 locus. Genetics 164:673-683.
REFERENCES 134
G. T. BRYAN, K. S. WU, L. FARRALL, Y. JIA, H. P. HERSHEY, S. A. MCADAMS, K. N. FAULK, G. K. DONALDSON, R. TARCHINI, B. VALENT (2000) A single amino acid difference distinguishes resistant and susceptible alleles of the rice blast resistance gene Pi-ta. Plant Cell 12:2033-2046.
C. S. BRYNER (1957) Inheritance of scald resistance in barley. PhD thesis. Pennsylvania State University, University Park, Pennsylvania (Diss. Abstr., 17, 2752).
D. BULGARELLI, N. C. COLLINS, G. TACCONI, E. DELLAGLIO, R. BRUEGGEMAN, A.KLEINHOFS, A. M. STANCA, G. VALÈ (2004) High-resolution genetic mapping of the leaf stripe resistance gene Rdg2a in barley. Theor Appl Genet 108:1401-1408.
P. C. BUNDOCK, J. T. CHRISTOPHER, P. EGGLER, G. ABLETT, R. J. HENRY, T. A. HOLTON
(2003) Single nucleotide polymorphisms in cytochrome P450 genes from barley. Theor Appl Genet 106:676-682.
P. C. BUNDOCK, R. J. HENRY (2004) Single nucleotide polymorphism, haplotype diversity and recombination in the Isa gene of barley. Theor Appl Genet109:543-551.
C. BURGE, S. KARLIN (1997) Prediction of complete gene structures in human genomic DNA. J Mol Biol 268:78-94.
R. BÜSCHGES, K. HOLLRICHER, R. PANSTRUGA, G. SIMONS, M. WOLTER, A. FRIJTERS, R.VAN DAELEN, T. VAN DER LEE, P. DIERGAARDE, J. GROENENDIJK, et al. (1997) The barley Mlo gene: a novel control element of plant pathogen resistance. Cell88:695-705.
K. S. CALDWELL, P. LANGRIDGE, W. POWELL (2004) Comparative sequence analysis of the region harboring the hardness locus in barley and its colinear region in rice. Plant Physiol 136:3177-3190.
N. CHANTRET, J. SALSE, F. SABOT, A. BELLEC, B. LAUBIN, I. DUBOIS, C. DOSSAT, P.SOURDILLE, P. JOUDRIER, M.-F. GAUTIER, et al. (2008) Contrasted microcolinearity and gene evolution within a homoeologous region of wheat and barley species. J Mol Evol 66:138-150.
A. CHEN, A. BRÛLÉ-BABEL, U. BAUMANN, N. COLLINS (2008) Structure-function analysis of the barley genome: the gene-rich region of chromosome 2HL. Funct Integr Genomics.
F. Q. CHEN, D. PREHN, P. M. HAYES, D. MULROONEY, A. COREY, H. VIVAR (1994) Mapping genes for resistance to barley stripe rust (Puccinia striiformis f. sp. hordei). Theor Appl Genet 88:215-219.
M. CHEN, P. SANMIGUEL, A. C. D. OLIVEIRA, S.-S. WOO, H.ZHANG, R. A. WING, J. L.BENNETZEN (1997) Microcolinearity in sh2-homologous regions of the maize, rice, and sorghum genomes. Proc Natl Acad Sci U S A 94:3431-3435.
REFERENCES 135
M. CHEN, P. SANMIGUEL, J. L. BENNETZEN (1998) Sequence organization and conservation in sh2/a1-homologous regions of sorghum and rice. Genetics148:435-443.
X. CHEN, J. SHANG, D. CHEN, C. LEI, Y. ZOU, W. ZHAI, G. LIU, J. XU, Z. LING, G. CAO, et al. (2006) A B-lectin receptor kinase gene conferring rice blast resistance. Plant J 46:794-804.
Z. CHEN, J. MALAMY, J. HENNING, U. CONRATH, P. SÁNCHEZ-CASAS, H. SILVA, J.RICIGLIANO, D. K. KLESSIG (1995) Induction, modification, and transduction of the salicylic acid signal in plant defense responses. Proc Natl Acad Sci U S A92:4134-4137.
J. CHEONG, K. WILLIAMS, H. WALLWORK (2006) The identification of QTLs for adult plant resistance to leaf scald in barley. Aust J Agric Res 57:961-965.
D. CHINCHILLA, C. ZIPFEL, S. ROBATZEK, B. KEMMERLING, T. NÜRNBERGER, J. D. G.JONES, G. FELIX, T. BOLLER (2007) A flagellin-induced complex of the receptor FLS2 and BAK1 initiates plant defence. Nature 448:497-500.
S. T. CHISHOLM, G. COAKER, B. DAY, B. J. STASKAWICZ (2006) Host-microbe interactions: shaping the evolution of the plant immune response. Cell124:803-814.
K. H. CHOO (1998) Why is the centromere so cold? Genome Res 8:81-82.
Z. CHU, M. YUAN, J. YAO, X. GE, B. YUAN, C. XU, X. LI, B. FU, Z. LI, J. L. BENNETZEN, et al. (2006) Promoter mutations of an essential gene for pollen development result in disease resistance in rice. Genes Dev 20:1250-1255.
N. COLLINS, J. DRAKE, M. AYLIFFE, Q. SUN, J. ELLIS, S. HULBERT, T. PRYOR (1999) Molecular characterization of the maize Rp1-D rust resistance haplotype and its mutants. Plant Cell 11:1365-1376.
N. C. COLLINS, H. THORDAL-CHRISTENSEN, V. LIPKA, S. BAU, E. KOMBRINK, J.-L. QIU, R.HÜCKELHOVEN, M. STEIN, A. FREIALDENHOVEN, S. C. SOMERVILLE, et al. (2003) SNARE-protein-mediated disease resistance at the plant cell wall. Nature425:973-977.
R. COSSU, D. SCHMIDT, G. SCHWEIZER, M. W. GANAL, M. RÖDER Comparative sequencing and fine mapping of the Rh2 gene. (unpublished)
D. C. CRAWFORD, T. BHANGALE, N. LI, G. HELLENTHAL, M. J. RIEDER, D. A. NICKERSON, M. STEPHENS (2004) Evidence for substantial fine-scale variation in recombination rates across the human genome. Nat Genet 36:700-706.
L.-Y. DAI, X.-L. LIU, Y.-H. XIAO, G.-L. WANG (2007) Recent advances in cloning and characterization of disease resistance genes in rice. J Integr Plant Biol 49:112-119.

REFERENCES 136
J. L. DANGL, J. D. JONES (2001) Plant pathogens and integrated defence responses to infection. Nature 411:826-833.
M. DELSENY (2004) Re-evaluating the relevance of ancestral shared synteny as a tool for crop improvement. Curr Opin Plant Biol 7:126-131.
K. M. DEVOS, T. MILLAN, M. D. GALE (1993) Comparative RFLP maps of the homoeologous group-2 chromosomes of wheat, rye and barley. Theor Appl Genet 85:784-792.
K. M. DEVOS, M. D. GALE (1997) Comparative genetics in the grasses. Plant Mol Biol35:3-15.
K. M. DEVOS, M. D. GALE (2000) Genome relationships: the grass model in current research. Plant Cell 12:637-646.
K. M. DEVOS (2005) Updating the 'crop circle'. Curr Opin Plant Biol 8:155-162.
B. J. DEYOUNG, R. W. INNES (2006) Plant NBS-LRR proteins in pathogen sensing and host defense. Nat Immunol 7:1243-1249.
S. J. DINKA, M. N. RAIZADA (2006) Inexpensive fine mapping and positional cloning in plants using visible, mapped transgenes. Can J Bot 84:179-188.
S. J. DINKA, M. A. CAMPBELL, T. DEMERS, M. N. RAIZADA (2007) Predicting the size of the progeny mapping population required to positionally clone a gene. Genetics 176:2035-2054.
X. DONG, Z. HONG, J. CHATTERJEE, S. KIM, D. P. S. VERMA (2008) Expression of callose synthase genes and its connection with Npr1 signaling pathway during pathogen infection. Planta 229:87-98.
H. K. DOONER, I. M. MARTÍNEZ-FÉREZ (1997) Recombination occurs uniformly within the bronze gene, a meiotic recombination hotspot in the maize genome. Plant Cell 9:1633-1646.
J. J. DOYLE, J. L. DOYLE (1990) A rapid total DNA preparation procedure for fresh plant tissue. Focus 12:13-15.
J. DRAPER, L. A. MUR, G. JENKINS, G. C. GHOSH-BISWAS, P. BABLAK, R. HASTEROK, A. P.ROUTLEDGE (2001) Brachypodium distachyon. A new model system for functional genomics in grasses. Plant Physiol 127:1539-1555.
J. DROUAUD, C. CAMILLERI, P.-Y. BOURGUIGNON, A. CANAGUIER, A. BÉRARD, D. VEZON, S. GIANCOLA, D. BRUNEL, V. COLOT, B. PRUM, et al. (2006) Variation in crossing-over rates across chromosome 4 of Arabidopsis thaliana reveals the presence of meiotic recombination "hot spots". Genome Res 16:106-114.
J. DUBCOVSKY, W. RAMAKRISHNA, P. J. SANMIGUEL, C. S. BUSSO, L. YAN, B. A. SHILOFF, J. L. BENNETZEN (2001) Comparative sequence analysis of colinear barley and rice bacterial artificial chromosomes. Plant Physiol 125:1342-1353.

REFERENCES 137
R. T. DURRETT, K.-Y. CHEN, S. D. TANKSLEY (2002) A simple formula useful for positional cloning. Genetics 160:353-355.
P. L. DYCK, C. W. SCHALLER (1961) Inheritance of resistance in barley to several physiologic races of the scald fungus. Can J Genet Cytol 3:153-164.
M. ERAYMAN, D. SANDHU, D. SIDHU, M. DILBIRLIGI, P. S. BAENZIGER, K. S. GILL (2004) Demarcating the gene-rich regions of the wheat genome. Nucleic Acids Res32:3546-3565.
M.-T. ESQUERRÉ-TUGAYÉ, G. BOUDART, B. DUMAS (2000) Cell wall degrading enzymes, inhibitory proteins, and oligosaccharides participate in the molecular dialogue between plants and pathogens. Plant Physiol Biochem 38:157-163.
R. L. EVANS (1969) Studies on the leaf blotch of barley (Rhynchosporium secalis). PhD thesis. University of Wales.
S. FERRARI, D. VAIRO, F. M. AUSUBEL, F. CERVONE, G. D. LORENZO (2003) Tandemly duplicated Arabidopsis genes that encode polygalacturonase-inhibiting proteins are regulated coordinately by different signal transduction pathways in response to fungal infection. Plant Cell 15:93-106.
S. FERRARI, R. GALLETTI, D. VAIRO, F. CERVONE, G. D. LORENZO (2006) Antisense expression of the Arabidopsis thaliana AtPGIP1 gene reduces polygalacturonase-inhibiting protein accumulation and enhances susceptibility to Botrytis cinerea. Mol Plant-Microbe Interact 19:931-936.
A. FERREIRA, M. F. DA SILVA, L. DA COSTA E SILVA, C. D. CRUZ (2006) Estimating the effects of population size and type on the accuracy of genetic maps. Genet Mol Biol 29:187-192.
C. FEUILLET, G. SCHACHERMAYR, B. KELLER (1997) Molecular cloning of a new receptor-like kinase gene encoded at the Lr10 disease resistance locus of wheat. Plant J 11:45-52.
C. FEUILLET, B. KELLER (1999) High gene density is conserved at syntenic loci of small and large grass genomes. Proc Natl Acad Sci U S A 96:8265-8270.
C. FEUILLET, B. KELLER (2002) Comparative genomics in the grass family: molecular characterization of grass genome structure and evolution. Ann Bot (Lond)89:3-10.
C. FEUILLET, S. TRAVELLA, N. STEIN, L. ALBAR, A. NUBLAT, B. KELLER (2003) Map-based isolation of the leaf rust disease resistance gene Lr10 from the hexaploid wheat (Triticum aestivum L.) genome. Proc Natl Acad Sci U S A 100:15253-15258.
S. A. FLINT-GARCIA, J. M. THORNSBERRY, E. S. BUCKLER (2003) Structure of linkage disequilibrium in plants. Annu Rev Plant Biol 54:357-374.

REFERENCES 138
H. H. FLOR (1971) Current status of the gene-for-gene concept. Annu Rev Phytopathol 9:275-296.
T. N. FOOTE, S. GRIFFITHS, S. ALLOUIS, G. MOORE (2004) Construction and analysis of a BAC library in the grass Brachypodium sylvaticum: its use as a tool to bridge the gap between rice and wheat in elucidating gene content. Funct Integr Genomics 4:26-33.
J. H. FRECHA (1967) Inheritance of resistance to Rhynchosporium secalis in barley. Bol Genet Inst Fitotec Castelar 4:513.
H. FU, W. PARK, X. YAN, Z. ZHENG, B. SHEN, H. K. DOONER (2001) The highly recombinogenic bz locus lies in an unusually gene-rich region of the maize genome. Proc Natl Acad Sci U S A 98:8903-8908.
H. FU, H. K. DOONER (2002) Intraspecific violation of genetic colinearity and its implications in maize. Proc Natl Acad Sci U S A 99:9573-9578.
H. FU, Z. ZHENG, H. K. DOONER (2002) Recombination rates between adjacent genic and retrotransposon regions in maize vary by 2 orders of magnitude. Proc Natl Acad Sci U S A 99:1082-1087.
M. D. GALE, K. M. DEVOS (1998) Plant comparative genetics after 10 years. Science282:656-658.
F. GALLEGO, C. FEUILLET, M. MESSMER, A. PENGER, A. GRANER, M. YANO, T. SASAKI, B.KELLER (1998) Comparative mapping of the two wheat leaf rust resistance loci Lr1 and Lr10 in rice and barley. Genome 41:328-336.
M. GANAL, N. YOUNG, S. D. TANKSLEY (1989) Pusled field gel electrophoresis and physical mapping of large DNA fragments in the Tm-2a region of chromosome 9 in tomato. Mol Gen Genet 215:395-400.
M. W. GANAL, S. D. TANKSLEY (1996) Recombination around the Tm2a and Miresistance genes in different crosses of Lycopersicon peruvianum. Theor Appl Genet 92:101-108.
D. F. GARVIN, A. H. D. BROWN, H. RAMAN, B. J. READ (2000) Genetic mapping of the barley Rrs14 scald resistance gene with RFLP, isozyme and seed storage protein markers. Plant Breed 119:193-196.
B. S. GAUT (2002) Evolutionary dynamics of grass genomes. New Phytol 154:15-28.
B. S. GAUT, A. D. LONG (2003) The lowdown on linkage disequilibrium. Plant Cell15:1502-1506.
C. GEBHARDT, A. BALLVORA, B. WALKEMEIER, P. OBERHAGEMANN, K. SCHÜLER (2004) Assessing genetic potential in germplasm collections of crop plants by marker-trait association: a case study for potatoes with quantitative variation of resistance to late blight and maturity type. Mol Breed 13:93-102.

REFERENCES 139
R. K. GENGER, K. J. WILLIAMS, H. RAMAN, B. J. READ, H. WALLWORK, J. J. BURDON, A.H. D. BROWN (2003) Leaf scald resistance genes in Hordeum vulgare and Hordeum vulgare ssp. spontaneum: parallels between cultivated and wild barley. Aust J Agric Res 54:1335-1342.
R. K. GENGER, K. NESBITT, A. H. D. BROWN, D. C. ABOTT, J. J. BURDON (2005) A novel barley scald resistance gene: genetic mapping of the Rrs15 scald resistance gene derived from wild barley, Hordeum vulgare ssp. spontaneum. Plant Breed 124:137-141.
K. S. GILL, B. S. GILL, T. R. ENDO, T. TAYLOR (1996a) Identification and high-density mapping of gene-rich regions in chromosome group 1 of wheat. Genetics144:1883-1891.
K. S. GILL, B. S. GILL, T. R. ENDOT, E. V. BOYKO (1996b) Identification and high-density mapping of gene-rich regions in chromosome group 5 of wheat. Genetics 143:1001-1012.
L. GÓMEZ-GÓMEZ, T. BOLLER (2000) FLS2: an LRR receptor-like kinase involved in the perception of the bacterial elicitor flagellin in Arabidopsis. Mol Cell 5:1003-1011.
S. B. GOODWIN (1988) Analysis of gene-for-gene interactions, and variability for isozyme and pathogenicity markers in Rhynchosporium secalis (Oud.) Davis.PhD thesis. University of California, Davis.
S. B. GOODWIN, R. W. ALLARD, R. K. WEBSTER (1990) A nomenclature for Rhynchosporium secalis pathotypes. Phytopathology 80:1130-1336.
R. GÖRG, K. HOLLRICHER, P. SCHULZE-LEFERT (1993) Functional analysis and RFLP mediated mapping of the Mlg resistance locus in barley. Plant J 3:857-866.
J. GRAFFELMAN, D. J. BALDING, A. GONZALEZ-NEIRA, J. BERTRANPETIT (2007) Variation in estimated recombination rates across human populations. Hum Genet122:301-310.
K. GU, B. YANG, D. TIAN, L. WU, D. WANG, C. SREEKALA, F. YANG, Z. CHU, G.-L. WANG, F.F. WHITE, et al. (2005) R gene expression induced by a type-III effector triggers disease resistance in rice. Nature 435:1122-1125.
R. GUYOT, N. YAHIAOUI, C. FEUILLET, B. KELLER (2004) In silico comparative analysis reveals a mosaic conservation of genes within a novel colinear region in wheat chromosome 1AS and rice chromosome 5S. Funct Integr Genomics 4:47-58.
M. R. HABGOOD, J. D. HAYES (1971) The inheritance of resistance to Rhynchosporium secalis in barley. Heredity 27:25-37.
C. E. HAGAN, G. J. WARREN (1982) Lethality of palindromic DNA and its use in selection of recombinant plasmids. Gene 19:147-151.

REFERENCES 140
M. HAHN, S. JÜNGLING, W. KNOGGE (1993) Cultivar-specific elicitation of barley defense reactions by the phytotoxic peptide NIP1 from Rhynchosporium secalis. Mol Plant-Microbe Interact 6:745-754.
D. HALTERMAN, F. ZHOU, F. WEI, R. P. WISE, P. SCHULZE-LEFERT (2001) The MLA6 coiled-coil, NBS-LRR protein confers AvrMla6-dependent resistance specificity to Blumeria graminis f. sp. hordei in barley and wheat. Plant J 25:335-348.
F. HAN, A. KILIAN, J. P. CHEN, D: KUDRNA, B. STEFFENSON, K. YAMAMOTO, T. MATSUMOTO, T. SASAKI, A. KLEINHOFS (1999) Sequence analysis of a rice BAC covering the syntenous barley Rpg1 region. Genome 42:1071-1076.
F. HAN, A. KLEINHOFS, A. KILIAN, S. E. ULLRICH (1997) Cloning and mapping of a putative barley NADPH-dependent HC-toxin reductase. Mol Plant-Microbe Interact 10:234-239.
L. R. HANSEN, H. A. MAGNUS (1973) Virulence spectrum of Rhynchosporium secalis in Norway and sources of resistance in barley. J Phytopathol 76:303-313.
R. HASTEROK, J. DRAPER, G. JENKINS (2004) Laying the cytotaxonomic foundations of a new model grass, Brachypodium distachyon (L.) Beauv. Chromosome Res12:397-403.
R. HASTEROK, A. MARASEK, I. S. DONNISON, I. ARMSTEAD, A. THOMAS, I. P. KING, E.WOLNY, D. IDZIAK, J. DRAPER, G. JENKINS (2006) Alignment of the genomes of Brachypodium distachyon and temperate cereals and grasses using bacterial artificial chromosome landing with fluorescence in situ hybridization. Genetics173:349-362.
W. HAUPT, T. C. FISCHER, S. WINDERL, P. FRANSZ, R. A. TORRES-RUIZ (2001) The CENTROMERE1 (CEN1) region of Arabidopsis thaliana: architecture and functional impact of chromatin. Plant J 27:285-296.
K. HE, X. GOU, T. YUAN, H. LIN, T. ASAMI, S. YOSHIDA, S. D. RUSSELL, J. LI (2007) BAK1 and BKK1 regulate brassinosteroid-dependent growth and brassinosteroid-independent cell-death pathways. Curr Biol 17:1109-1115.
J.-Y. HO, R. WEIDE, H. M. MAI, M. F. VAN WORDRAGEN, K. N. LAMBED, M. KOORNNEEF, P.ZABEL, V. M. WILLIAMSON (1992) The root-knot nematode resistance gene (Mi) in tomato: construction of a molecular linkage map and identification of dominant cDNA markers in resistant genotypes. Plant J 2:971-982.
L. HUANG, S. A. BROOKS, W. LI, J. P. FELLERS, H. N. TRICK, B. S. GILL (2003) Map-based cloning of leaf rust resistance gene Lr21 from the large and polyploid genome of bread wheat. Genetics 164:655-664.
N. HUO, G. R. LAZO, J. P. VOGEL, F. M. YOU, Y. MA, D. M. HAYDEN, D. COLEMAN-DERR, T.A. HILL, J. DVORAK, O. D. ANDERSON, et al. (2008) The nuclear genome of Brachypodium distachyon: analysis of BAC end sequences. Funct Integr Genomics 8:135-147.

REFERENCES 141
E. IGARTUA, A. M. CASAS, F. CIUDAD, J. MONTOYA, I. ROMAGOSA (1999) RFLP markers associated with major genes controlling heading date evaluated in a barley germ plasm pool. Heredity 83:551-559.
T. INUKAI, M. I. VALES, K. HORI, K. SATO, P. M. HAYES (2006) RMo1 confers blast resistance in barley and is located within the complex of resistance genes containing Mla, a powdery mildew resistance gene. Mol Plant-Microbe Interact19:1034-1041.
E. ISIDORE, B. SCHERRER, A. BELLEC, K. BUDIN, P. FAIVRE-RAMPANT, R. WAUGH, B.KELLER, M. CABOCHE, C. FEUILLET, B. CHALHOUB (2005) Direct targeting and rapid isolation of BAC clones spanning a defined chromosome region. Funct Integr Genomics 5:97-103.
A. K. M. R. ISLAM, K. W. SHEPHERD, D. H. B. SPARROW (1981) Isolation and characterization of euplasmic wheat-barley chromosome addition lines. Heredity 46:161-174.
A. ISSHIKI, K. AKIMITSU, M. YAMAMOTO, H. YAMAMOTO (2001) Endopolygalacturonase is essential for citrus black rot caused by Alternaria citri but not brown spot caused by Alternaria alternata. Mol Plant-Microbe Interact 14:749-757.
V. IVANDIC, C. A. HACKETT, E. NEVO, R. KEITH, W. T. B. THOMAS (2002) Analysis of simple sequence repeats (SSRs) in wild barley from the Fertile Crescent: associations with ecology, geography and flowering time. Plant Mol Biol48:511-527.
V. IVANDIC, W. T. B. THOMAS, E. NEVO, Z. ZHANG, B. P. FORSTER (2003) Associations of simple sequence repeats with quantitative trait variation including biotic and abiotic stress tolerance in Hordeum spontaneum. Plant Breed 122:300-304.
A. S. IYER, S. R. MCCOUCH (2004) The rice bacterial blight resistance gene xa5encodes a novel form of disease resistance. Mol Plant-Microbe Interact17:1348-1354.
L. F. JACKSON, R. K. WEBSTER (1976) Race differentiation, distribution, and frequency of Rhynchosporium secalis in California. Phytopathology 66:719-725.
A. K. JACOBS, V. LIPKA, R. A. BURTON, R. PANSTRUGA, N. STRIZHOV, P. SCHULZE-LEFERT, G. B. FINCHER (2003) An Arabidopsis callose synthase, GSL5, is required for wound and papillary callose formation. Plant Cell 15:2503-2513.
J. JENSEN, G. BACKES, H. SKINNES, H. GIESE (2002) Quantitative trait loci for scald resistance in barley localized by a non-interval mapping procedure. Plant Breed 121:124-128.
L. JIANG, W. ZHANG, Z. XIA, G. JIANG, Q. QIAN, A. LI, Z. CHENG, L. ZHU, L. MAO, W. ZHAI
(2007) A paracentric inversion suppresses genetic recombination at the FON3locus with breakpoints corresponding to sequence gaps on rice chromosome 11L. Mol Gen Genom 277:263-272.

REFERENCES 142
J. D. G. JONES, J. L. DANGL (2006) The plant immune system. Nature 444:323-329.
P. JONES, P. G. AYRES (1972) The nutrition of the subcuticular mycelium of Rhynchosporium secalis (barley leaf blotch): permeability changes induced in the host. Physiol Plant Pathol 2:383-392.
P. JONES, P. G. AYRES (1974) Rhynhchosporium leaf blotch of barley studied during the subcuticular phase by electron microscopy. Physiol Plant Pathol 4:229-233.
H. J. L. JØRGENSEN, E. D. NEERGAARD, V. SMEDEGAARD-PETERSEN (1993) Histological examination of the interaction between Rhynchosporium secalis and susceptible and resistant cultivars of barley. Physiol Mol Plant Pathol 42:345-358.
V. KANAZIN, H. TALBERT, D. SEE, P. DECAMP, E. NEVO, T. BLAKE (2002) Discovery and assay of single-nucleotide polymorphisms in barley (Hordeum vulgare). Plant Mol Biol 48:529-537.
H. K. KANG, D. W. COX (1996) Tandem repeats 3' of the IGHA genes in the human immunoglobulin heavy chain gene cluster. Genomics 35:189-195.
Y. KAPUSTIN, A. SOUVOROV, T. TATUSOVA, D. LIPMAN (2008) Splign: algorithms for computing spliced alignments with identification of paralogs. Biol Direct 3:20.
B. KELLER, C. FEUILLET (2000) Colinearity and gene density in grass genomes. Trends Plant Sci 5:246-251.
B. KEMMERLING, A. SCHWEDT, P. RODRIGUEZ, S. MAZZOTTA, M. FRANK, S. A. QAMAR, T.MENGISTE, S. BETSUYAKU, J. E. PARKER, C. MÜSSIG, et al. (2007) The BRI1-associated kinase 1, BAK1, has a brassinolide-independent role in plant cell-death control. Curr Biol 17:1116-1122.
G. S. KHUSH, C. M. RICK (1967) Studies on the linkage map of chromosome 4 of the tomato and on the transmission of induced deficiencies. Genetica 38:74-94.
A. KILIAN, D. A. KUDRNA, A. KLEINHOFS, M. YANO, N. KURATA, B. STEFFENSON, T. SASAKI
(1995) Rice-barley synteny and its application to saturation mapping of the barley Rpg1 region. Nucleic Acids Res 23:2729-2733.
A. KILIAN, J. CHEN, F. HAN, B. STEFFENSON, A. KLEINHOFS (1997) Towards map-based cloning of the barley stem rust resistance genes Rpg1 and rpg4 using rice as an intergenomic cloning vehicle. Plant Mol Biol 35:187-195.
W. KNOGGE, K. A. E. VAN'T SLOT, S. STEINER-LANGE (2003) Recognition and response -the barley scald model. Proceedings of the 11th Australian Barley Technical Symposium.
R. KOTA, R. K. VARSHNEY, T. THIEL, K. J. DEHMER, A. GRANER (2001) Generation and comparison of EST-derived SSRs and SNPs in barley (Hordeurn vulgare L.). Hereditas 135:145-151.

REFERENCES 143
R. KOTA, R. K. VARSHNEY, M. PRASAD, H. ZHANG, N. STEIN, A. GRANER (2008) EST-derived single nucleotide polymorphism markers for assembling genetic and physical maps of the barley genome. Funct Integr Genomics 8:223-233.
A. T. W. KRAAKMAN, R. E. NIKS, P. M. M. M. V. DEN BERG, P. STAM, F. A. V. EEUWIJK
(2004) Linkage disequilibrium mapping of yield and yield stability in modern spring barley cultivars. Genetics 168:435-446.
G. KÜNZEL, L. KORZUN, A. MEISTER (2000) Cytologically integrated physical restriction fragment length polymorphism maps for the barley genome based on translocation breakpoints. Genetics 154:397-412.
C. LACOMME, D. ROBY (1996) Molecular cloning of a sulfotransferase in Arabidopsis thaliana and regulation during development and in response to infection with pathogenic bacteria. Plant Mol Biol 30:995-1008.
E. J. LAMBIE, G. S. ROEDER (1986) Repression of meiotic crossing over by a centromere (CEN3) in Saccharomyces cerevisiae. Genetics 114:769-789.
H. LEHNACKERS, W. KNOGGE (1990) Cytological studies on the infection of barley cultivars with known resistance genotypes by Rhynchosporium secalis. Can J Bot 68:1953-1961.
D. LEISTER, J. KURTH, D. A. LAURIE, M. YANO, T. SASAKI, K. DEVOS, A. GRANER, P.SCHULZE-LEFERT (1998) Rapid reorganization of resistance gene homologues in cereal genomes. Proc Natl Acad Sci U S A 95:370-375.
L. LI, M. JEAN, F. BELZILE (2006) The impact of sequence divergence and DNA mismatch repair on homeologous recombination in Arabidopsis. Plant J45:908-916.
T. LIHARSKA, M. VAN WORDRAGEN, A. VAN KAMMEN, P. ZABEL, M. KOORNNEEF (1996) Tomato chromosome 6: effect of alien chromosomal segments on recombinant frequencies. Genome 39:485-491.
C. C. LINDE, M. ZALA, S. CECCARELLI, B. A. MCDONALD (2003) Further evidence for sexual reproduction in Rhynchosporium secalis based on distribution and frequency of mating-type alleles. Fungal Genet Biol 40:115-125.
A. LOMSADZE, V. TER-HOVHANNISYAN, Y. O. CHERNOFF, M. BORODOVSKY (2005) Gene identification in novel eukaryotic genomes by self-training algorithm. Nucleic Acids Res 33:6494–6506.
G. D. LORENZO, S. FERRARI (2002) Polygalacturonase-inhibiting proteins in defense against phytopathogenic fungi. Curr Opin Plant Biol 5:295-299.
M.-C. LUO, C. THOMAS, F. M. YOU, J. HSIAO, S. OUYANG, C. R. BUELL, M. MALANDRO, P.E. MCGUIRE, O. D. ANDERSON, J. DVORAK (2003) High-throughput fingerprinting of bacterial artificial chromosomes using the SNaPshot labeling kit and sizing of restriction fragments by capillary electrophoresis. Genomics 82:378-389.

REFERENCES 144
I. MACKAY, W. POWELL (2007) Methods for linkage disequilibrium mapping in crops. Trends Plant Sci 12:57-63.
W. W. MACKIE (1929) Inheritance of resistance to barley scald. Phytopathology19:1141.
M. M. MAHTANI, H. F. WILLARD (1998) Physical and genetic mapping of the human X chromosome centromere: repression of recombination. Genome Res 8:100-110.
J. MAMMADOV, B. STEFFENSON, M. MAROOF (2005) High-resolution mapping of the barley leaf rust resistance gene Rph5 using barley expressed sequence tags (ESTs) and synteny with rice. Theor Appl Genet 111:1-10.
G. B. MARTIN, S. H. BROMMONSCHENKEL, J. CHUNWONGSE, A. FRARY, M. W. GANAL, R.SPIVEY, T. WU, E. D. EARLE, S. D. TANKSLEY (1993) Map-based cloning of a protein kinase gene conferring disease resistance in tomato. Science262:1432-1436.
A. D. MATTEO, A. GIOVANE, A. RAIOLA, L. CAMARDELLA, D. BONIVENTO, G. D. LORENZO, F. CERVONE, D. BELLINCAMPI, D. TSERNOGLOU (2005) Structural basis for the interaction between pectin methylesterase and a specific inhibitor protein. Plant Cell 17:849-858.
I. E. MATTHIES, S. WEISE, M. S. RÖDER (2009) Association of haplotype diversity in the -amylase gene amy1 with malting quality parameters in barley. Mol Breed
23:139–152.
C. MAZARS, K. D. HAPNER, G. A. STROBEL (1984) Isolation and partial characterization of a phytotoxic glycoprotein from culture filtrates of Rhynchosporium secalis. Experientia 40:1244-1247.
C. MAZARS, C. LAFITTE, P. Y. MARQUET, M. ROSSIGNOL, P. AURIOL (1990) Elicitor-like activity of the toxic glycoprotein isolated from Rhynchosporium secalis (Oud.) Davis culture filtrates. Plant Sci 69:11-17.
B. A. MCDONALD, J. ZHAN, J. J. BURDON (1999) Genetic structure of Rhynchosporium secalis in Australia. Phytopathology 89:639-645.
B. A. MCDONALD, C. LINDE (2002) The population genetics of plant pathogens and breeding strategies for durable resistance. Euphytica 124:163-180.
J. M. MCDOWELL, B. J. WOFFENDEN (2003) Plant disease resistance genes: recent insights and potential applications. Trends Biotechnol 21:178-183.
H. C. MEFFORD, B. J. TRASK (2002) The complex structure and dynamic evolution of human subtelomeres. Nat Rev Genet 3:91-102.

REFERENCES 145
R. MESSEGUER, M. GANAL, M. C. DE VICENTE, N. D. YOUNG, H. BOLKAN, S. D. TANKSLEY
(1991) High resolution RFLP map around the root knot nematode resistance gene (Mi) in tomato. Theor Appl Genet 82:529-536.
A. MIYA, P. ALBERT, T. SHINYA, Y. DESAKI, K. ICHIMURA, K. SHIRASU, Y. NARUSAKA, N.KAWAKAMI, H. KAKU, N. SHIBUYA (2007) CERK1, a LysM receptor kinase, is essential for chitin elicitor signaling in Arabidopsis. Proc Natl Acad Sci U S A104:19613-19618.
M. S. MOHAMED (1975) Genetics of resistance in barley to Rhynchosporium secalisscald, Rhynchosporium secalis (Oud.) Davis. PhD thesis. University of California, Davis.
G. MOORE, K. M. DEVOS, Z. WANG, M. D. GALE (1995) Cereal genome evolution. Grasses, line up and form a circle. Curr Biol 5:737-739.
C. NEU, N. STEIN, B. KELLER (2002) Genetic mapping of the Lr20–Pm1 resistance locus reveals suppressed recombination on chromosome arm 7AL in hexaploid wheat. Genome 45:737-744.
M. T. NISHIMURA, M. STEIN, B.-H. HOU, J. P. VOGEL, H. EDWARDS, S. C. SOMERVILLE
(2003) Loss of a callose synthase results in salicylic acid-dependent disease resistance. Science 301:969-972.
E. C. OERKE, H. W. DEHNE, F. SCHÖNBECK, A. WEBER (1994) Crop production and crop protection - estimated losses in major food and cash crops. Elsevier.
B. OESER, P. M. HEIDRICH, U. MÜLLER, P. TUDZYNSKI, K. B. TENBERGE (2002) Polygalacturonase is a pathogenicity factor in the Claviceps purpurea/rye interaction. Fungal Genet Biol 36:176-186.
K. OSOEGAWA, G. M. VESSERE, C. L. SHU, R. A. HOSKINS, J. P. ABAD, B. DE PABLOS, A.VILLASANTE, P. J. DE JONG (2007) BAC clones generated from sheared DNA. Genomics 89:291-299.
B. S. OZDEMIR, P. HERNANDEZ, E. FILIZ, H. BUDAK (2008) Brachypodium Genomics. Int J of Plant Genomics 536104.
H. PAKNIYAT, W. POWELL, E. BAIRD, L. L. HANDLEY, D. ROBINSON, C. M. SCRIMGEOUR, E.NEVO, C. A. HACKETT, P. D. S. CALIGARI, B. P. FORSTER (1997) AFLP variation in wild barley (Hordeum spontaneum C. Koch) with reference to salt tolerance and associated ecogeography. Genome 40:332-341.
R. PANSTRUGA, R. BÜSCHGES, P. PIFFANELLI, P. SCHULZE-LEFERT (1998) A contiguous 60 kb genomic stretch from barley reveals molecular evidence for gene islands in a monocot genome. Nucleic Acids Res 26:1056-1062.
Y.-J. PARK, A. DIXIT, J.-W. YOO, J. BENNETZEN (2004) Further evidence of microcolinearity between barley and rice genomes at two orthologous regions. Mol Cells 17:492-502.
REFERENCES 146
V. PATIL, A. BJØRNSTAD, H. MAGNUS, J. M. KEY (2002) Resistance to scald (Rhynchosporium secalis) in barley (Hordeum vulgare L.). II. Diallel analysis of near-isogenic lines. Hereditas 137:186-197.
V. PATIL, A. BJØRNSTAD, J. MACKEY (2003) Molecular mapping of a new gene Rrs4CI11549 for resistance to barley scald (Rhynchosporium secalis). Mol Breed12:169-183.
J. G. PAULL, M. A. PALLOTTA, P. LANGRIDGE, T. T. THE (1994) RFLP markers associated with Sr22 and recombination between chromosome 7A of bread wheat and the diploid species Triticum boeoticum. Theor Appl Genet 89:1039-1045.
D. PEROVIC, N. STEIN, H. ZHANG, A. DRESCHER, M. PRASAD, R. KOTA, D. KOPAHNKE, A.GRANER (2004) An integrated approach for comparative mapping in rice and barley with special reference to the Rph16 resistance locus. Funct Integr Genomics 4:74-83.
R. L. PHILLIPS (1969) Recombination in Zea mays L. II. Cytogenetic studies of recombinatoin in reciprocal crosses. Genetics 61:117-127.
R. PICKERING, B. RUGE-WEHLING, P. A. JOHNSTON, G. SCHWEIZER, P. ACKERMANN, P.WEHLING (2006) The transfer of a gene conferring resistance to scald (Rhynchosporium secalis) from Hordeum bulbosum into H. vulgarechromosome 4HS. Plant Breed 125:576-579.
J. PLASCHKE, M. W. GANAL, M. S. RÖDER (1995) Detection of genetic diversity in closely related bread wheat using microsatellite markers. Theor Appl Genet91:1001-1007.
A. L. T. POWELL, J. V. KAN, A. T. HAVE, J. VISSER, L. C. GREVE, A. B. BENNETT, J. M.LABAVITCH (2000) Transgenic expression of pear PGIP in tomato limits fungal colonization. Mol Plant-Microbe Interact 13:942-950.
J. B. POWELL, R. A. NILAN (1968) Evidence for spontaneous inversions in cultivated barley. Crop Sci 8:114-116.
S. QU, G. LIU, B. ZHOU, M. BELLIZZI, L. ZENG, L. DAI, B. HAN, G.-L. WANG (2006) The broad-spectrum blast resistance gene Pi9 encodes a nucleotide-binding site-leucine-rich repeat protein and is a member of a multigene family in rice. Genetics 172:1901-1914.
W. RAMAKRISHNA, J. L. BENNETZEN (2003) Genomic colinearity as a tool for plant gene isolation. Methods Mol Biol 236:109-122.
N. V. RAVIN, V. K. RAVIN (1999) Use of a linear multicopy vector based on the minireplicon of temperate coliphage N15 for cloning DNA with abnormal secondary structure. Nucleic Acids Res 27:e13.
S. V. RAZIN, E. S. IOUDINKOVA, E. N. TRIFONOV, K. SCHERRER (2001) Non-clonability correlates with genomic instability: a case study of a unique DNA region. J Mol Biol 307:481-486.

REFERENCES 147
O. C. RIDDLE, C. A. SUNESON (1948) Sources and use of scald resistance in barley. Agron J 40:926-928.
O. C. RIDDLE, F. N. BRIGGS (1950) Inheritance of resistance to scald in barley. Hilgardia 20:19-27.
L. H. RIESEBERG, H. CHOI, R. CHAN, C. SPORE (1993) Genomic map of a diploid hybrid species. Heredity 70:285-293.
H. C. RIETHMAN, Z. XIANG, S. PAUL, E. MORSE, X. L. HU, J. FLINT, H. C. CHI, D. L.GRADY, R. K. MOYZIS (2001) Integration of telomere sequences with the draft human genome sequence. Nature 409:948-951.
P. A. ROBERTS (1965) Difference in the behaviour of eu- and hetero-chromatin: crossing-over. Nature 205:725-726.
L. M. ROGERS, Y. K. KIM, W. GUO, L. GONZÁLEZ-CANDELAS, D. LI, P. E. KOLATTUKUDY
(2000) Requirement for either a host- or pectin-induced pectate lyase for infection of Pisum sativum by Nectria hematococca. Proc Natl Acad Sci U S A97:9813-9818.
M. ROHE, A. GIERLICH, H. HERMANN, M. HAHN, B. SCHMIDT, S. ROSAHL, W. KNOGGE
(1995) The race-specific elicitor, NIP1, from the barley pathogen, Rhynchosporium secalis, determines avirulence on host plants of the Rrs1resistance genotype. EMBO J 14:4168-4177.
N. ROSTOKS, Y.-J. PARK, W. RAMAKRISHNA, J. MA, A. DRUKA, B. A. SHILOFF, P. J.SANMIGUEL, Z. JIANG, R. BRUEGGEMAN, D. SANDHU, et al. (2002) Genomic sequencing reveals gene content, genomic organization, and recombination relationships in barley. Funct Integr Genomics 2:51-59.
N. ROSTOKS, S. MUDIE, L. CARDLE, J. RUSSELL, L. RAMSAY, A. BOOTH, J. T. SVENSSON, S. I. WANAMAKER, H. WALIA, E. M. RODRIGUEZ, et al. (2005) Genome-wide SNP discovery and linkage analysis in barley based on genes responsive to abiotic stress. Mol Gen Genom 274:515-527.
S. ROULIN, P.XU, A. H. D. BROWN, G. B. FINCHER (1997) Expression of specific (1 -ß-glucanase genes in leaves of near-isogenic resistant and susceptible barley lines infected with the leaf scald fungus (Rhynchosporium secalis). Physiol Mol Plant Pathol 50:245-261.
S. ROZEN, H. J. SKALETSKY (2000) Primer3 on the WWW for general users and for biologist programmers. In Bioinformatics methods and protocols: Methods in molecular biology. S. KRAWETZ and S. MISENER. Humana Press, Totowa, NJ, 365-386.
J. R. RUSSELL, R. P. ELLIS, W. T. B. THOMAS, R. WAUGH, J. PROVAN, A. BOOTH, J.FULLER, P. LAWRENCE, G. YOUNG, W. POWELL (2000) A retrospective analysis of spring barley germplasm development from foundation genotypes to currently successful cultivars. Mol Breed 6:553-568.

REFERENCES 148
J. R. RUSSELL, A. BOOTH, J. FULLER, B. HARROWER, P. HEDLEY, G. MACHRAY, W. POWELL
(2004) A comparison of sequence-based polymorphism and haplotype content in transcribed and anonymous regions of the barley genome. Genome 47:389-398.
K. SAKATA, Y. NAGAMURA, H. NUMA, B. A. ANTONIO, H. NAGASAKI, A. IDONUMA, W.WATANABE, Y. SHIMIZU, I. HORIUCHI, T. MATSUMOTO, et al. (2002) RiceGAAS: an automated annotation system and database for rice genome sequence. Nucleic Acids Res 30:98-102.
S. SALAMATI, J. ZHAN, J. J. BURDON, B. A. MCDONALD (2000) The genetic structure of field populations of Rhynchosporium secalis from three continents suggests moderate gene flow and regular recombination. Phytopathology 90:901-908.
J. M. SALMERON, G. E. OLDROYD, C. M. ROMMENS, S. R. SCOFIELD, H. S. KIM, D. T.LAVELLE, D. DAHLBECK, B. J. STASKAWICZ (1996) Tomato Prf is a member of the leucine-rich repeat class of plant disease resistance genes and lies embedded within the Pto kinase gene cluster. Cell 86:123-133.
J. SALSE, B. PIÉGU, R. COOKE, M. DELSENY (2004) New in silico insight into thesynteny between rice (Oryza sativa L.) and maize (Zea mays L.) highlights reshuffling and identifies new duplications in the rice genome. Plant J 38:396-409.
D. SANDHU, K. S. GILL (2002a) Gene-containing regions of wheat and the other grass genomes. Plant Physiology 128:803-811.
D. SANDHU, K. S. GILL (2002b) Structural and functional organization of the '1S0.8 gene-rich region' in the Triticeae. Plant Mol Biol 48:791-804.
P. J. SANMIGUEL, W. RAMAKRISHNA, J. L. BENNETZEN, C. S. BUSSO, J. DUBCOVSKY
(2002) Transposable elements, genes and recombination in a 215-kb contig from wheat chromosome 5Am. Funct Integr Genomics 2:70-80.
M. J. SCANLON, K. D. CHEN, I. V. M. CC (2000) The narrow sheath duplicate genes: sectors of dual aneuploidy reveal ancestrally conserved gene functions during maize leaf development. Genetics 155:1379-1389.
G. SCHACHERMAYR, H. SIEDLER, M. D. GALE, H. WINZELER, M. WINZELER, B. KELLER
(1994) Identification and localization of molecular markers linked to the Lr9leaf rust resistance gene of wheat. Theor Appl Genet 88:110-115.
G. M. SCHACHERMAYR, M. M. MESSMER, C. FEUILLET, H. WINZELER, M. WINZELER, B.KELLER (1995) Identification of molecular markers linked to the Agropyron elongatum-derived leaf rust resistance gene Lr24 in wheat. Theor Appl Genet90:982-990.
C. W. SCHALLER, C. O. QUALSET, J. N. RUTGER (1964) Inheritance and linkage of the Yd2 gene conditioning resistance to the barley yellow dwarf virus disease in barley. Crop Sci 4:544-548.

REFERENCES 149
B. SCHERRER, E. ISIDORE, P. KLEIN, J.-S. KIM, A. BELLEC, B. CHALHOUB, B. KELLER, C.FEUILLET (2005) Large intraspecific haplotype variability at the rph7 locus results from rapid and recent divergence in the barley genome. Plant Cell17:361-374.
D. SCHMIDT, M. S. RÖDER, H. DARGATZ, N. WOLF, G. F. SCHWEIZER, A. TEKAUZ, M. W.GANAL (2001) Construction of a YAC library from barley cultivar Franka and identification of YAC-derived markers linked to the Rh2 gene conferring resistance to scald (Rhynchosporium secalis). Genome 44:1031-1040.
P. S. SCHNABLE, A.-P. HSIAT, B. J. NIKOLAUF (1998) Genetic recombination in plants. Curr Opin Plant Biol 1:123-129.
D. SCHULTE, T. J. CLOSE, A. GRANER, P. LANGRIDGE, T. MATSUMOTO, G. MUEHLBAUER, K.SATO, A. H. SCHULMAN, R. WAUGH, R. P. WISE, et al. (2009) The international barley sequencing consortium - at the threshold of efficient access to the barley genome. Plant Physiol 149:142-147.
S. SCHÜRCH, C. C. LINDE, W. KNOGGE, L. F. JACKSON, B. A. MCDONALD (2004) Molecular population genetic analysis differentiates two virulence mechanisms of the fungal avirulence gene NIP1. Mol Plant-Microbe Interact 17:1114-1125.
G. F. SCHWEIZER, M. BAUMER, G. DANIEL, H. RUGEL, M. S. RÖDER (1995) RFLP markers linked to scald (Rhynchosporium secalis) resistance gene Rh2 in barley. Theor Appl Genet 90:920-924.
G. F. SCHWEIZER, M. HERZ, S. MIKOLAJEWSKI, M. BRENNER, L. HARTL, M. BAUMER
(2004) Genetic mapping of a novel scald resistance gene Rrs15CI8288 in barley. Proceedings of the 9th International Barley Genetics Symposium, Brno, Czech Republic. 20-26 June. 258-265.
S. SEAH, J. YAGHOOBI, M. ROSSI, C. A. GLEASON, V. M. WILLIAMSON (2004) The nematode-resistance gene, Mi-1, is associated with an inverted chromosomal segment in susceptible compared to resistant tomato. Theor Appl Genet108:1635-1642.
R. SEYFARTH, C. FEUILLET, G. SCHACHERMAYR, M. WINZELER, B. KELLER (1999) Development of a molecular marker for the adult plant leaf rust resistance gene Lr35 in wheat. Theor Appl Genet 99:554-560.
W. A. SHIPTON (1974) Scald of barley. Rev Plant Pathol 53:839-861.
S. H. SHIU, A. B. BLEECKER (2001) Receptor-like kinases from Arabidopsis form a monophyletic gene family related to animal receptor kinases. Proc Natl Acad Sci U S A 98:10763-10768.
S. H. SHIU, W. M. KARLOWSKI, R. PAN, Y.-H. TZENG, K. F. X. MAYER, W.-H. LI (2004) Comparative analysis of the receptor-like kinase family in Arabidopsis and rice. Plant Cell 16:1220-1234.

REFERENCES 150
I. SIMKO, S. COSTANZO, K. G. HAYNES, B. J. CHRIST, R. W. JONES (2004) Linkage disequilibrium mapping of a Verticillium dahliae resistance quantitative trait locus in tetraploid potato (Solanum tuberosum) through a candidate gene approach. Theor Appl Genet 108:217-224.
A. SINDHU, S. CHINTAMANANI, A. S. BRANDT, M. ZANIS, S. R. SCOFIELD, G. S. JOHAL
(2008) A guardian of grasses: specific origin and conservation of a unique disease-resistance gene in the grass lineage. Proc Natl Acad Sci U S A105:1762-1767.
C. SODERLUND, S. HUMPHRAY, A. DUNHAM, L. FRENCH (2000) Contigs built with fingerprints, markers, and FPC V4.7. Genome Res 10:1772-1787.
R. SONG, V. LLACA, J. MESSING (2002) Mosaic organization of orthologous sequences in grass genomes. Genome Res 12:1549-1555.
R. SONG, J. MESSING (2003) Gene expression of a gene family in maize based on noncollinear haplotypes. Proc Natl Acad Sci U S A 100:9055-9060.
W. Y. SONG, G. L. WANG, L. L. CHEN, H. S. KIM, L. Y. PI, T. HOLSTEN, J. GARDNER, B.WANG, W. X. ZHAI, L. H. ZHU, et al. (1995) A receptor kinase-like protein encoded by the rice disease resistance gene, Xa21. Science 270:1804-1806.
E. L. SONNHAMMER, R. DURBIN (1995) A dot-matrix program with dynamic threshold control suited for genomic DNA and protein sequence analysis. Gene167:GC1-G10.
D. SPANER, L. P. SHUGAR, T. M. CHOO, I. FALAK, K. G. BRIGGS, W. G. LEGGE, D. E. FALK, S. E. ULLRICH, N. A. TINKER, B. J. STEFFENSON, et al. (1998) Mapping of disease resistance loci in barley on the basis of visual assessment of naturally occurring symptoms. Crop Sci 38:843-850.
W. SPIELMEYER, R. A. RICHARDS (2004) Comparative mapping of wheat chromosome 1AS which contains the tiller inhibition gene (tin) with rice chromosome 5S. Theor Appl Genet 109:1303-1310.
T. M. STARLING, C. W. ROANE, K. R. CHI (1971) Inheritance of reaction to Rhynchosporium secalis in winter barley cultivars. Proceedings of the 2nd International Barley Genetics Symposium. Pullman, W.A., USA, 1969. 513-519.
N. STEIN, C. FEUILLET, T. WICKER, E. SCHLAGENHAUF, B. KELLER (2000) Subgenome chromosome walking in wheat: a 450-kb physical contig in Triticum monococcum L. spans the Lr10 resistance locus in hexaploid wheat (Triticum aestivum L.). Proc Natl Acad Sci U S A 97:13436-13441.
N. STEIN, D. PEROVIC, J. KUMLEHN, B. PELLIO, S. STRACKE, S. STRENG, F. ORDON, A.GRANER (2005) The eukaryotic translation initiation factor 4E confers multiallelic recessive Bymovirus resistance in Hordeum vulgare (L.). Plant J42:912-922.

REFERENCES 151
N. STEIN, M. PRASAD, U. SCHOLZ, T. THIEL, H. ZHANG, M. WOLF, R. KOTA, R. K.VARSHNEY, D. PEROVIC, I. GROSSE, et al. (2007) A 1,000-loci transcript map of the barley genome: new anchoring points for integrative grass genomics. Theor Appl Genet 114:823-839.
S. STEINER-LANGE, A. FISCHER, A. BOETTCHER, I. ROUHARA, H. LIEDGENS, E.SCHMELZER, W. KNOGGE (2003) Differential defense reactions in leaf tissues of barley in response to infection by Rhynchosporium secalis and to treatment with a fungal avirulence gene product. Mol Plant-Microbe Interact 16:893-902.
B. STIRLING, G. NEWCOMBE, J. VREBALOV, I. BOSDET, H. D. BRADSHAW, JR. (2001) Suppressed recombination around the MXC3 locus, a major gene for resistance to poplar leaf rust. Theor Appl Genet 103:1129-1137.
R. N. STRANGE (2003) Introduction to plant pathology. John Wiley and Sons.
A. H. STURTEVANT (1913) The linear arrangement of six sex-linked factors in Drosophila, as shown by their mode of association. Journal Exp Zool 14:43-59.
X. SUN, Y. CAO, Z. YANG, C. XU, X. LI, S. WANG, Q. ZHANG (2004) Xa26, a gene conferring resistance to Xanthomonas oryzae pv. oryzae in rice, encodes an LRR receptor kinase-like protein. Plant J 37:517-527.
M. R. SWIDERSKI, R. W. INNES (2001) The Arabidopsis PBS1 resistance gene encodes a member of a novel protein kinase subfamily. Plant J 26:101-112.
Z. S , J. L. BENNETZEN, J. MESSING (2005) Structure and evolution of the r/bchromosomal regions in rice, maize and sorghum. Genetics 169:891-906.
G. TACCONI, L. CATTIVELLI, N. FACCINI, N. PECCHIONI, A. M. STANCA, G. VALÉ (2001) Identification and mapping of a new leaf stripe resistance gene in barley (Hordeum vulgare L.). Theor Appl Genet 102:1286-1291.
K. TAMURA, J. DUDLEY, M. NEI, S. KUMAR (2007) MEGA4: Molecular Evolutionary Genetics Analysis (MEGA) Software Version 4.0. Mol Biol Evol 24:1596-1599.
S. D. TANKSLEY, M. W. GANAL, J. P. PRINCE, M. C. DE VICENTE, M. W. BONIERBALE, P.BROUN, T. M. FULTON, J. J. GIOVANNONI, S. GRANDILLO, G. B. MARTIN (1992) High density molecular linkage maps of the tomato and potato genomes. Genetics 132:1141-1160.
T. THIEL, R. KOTA, I. GROSSE, N. STEIN, A. GRANER (2004) SNP2CAPS: a SNP and INDEL analysis tool for CAPS marker development. Nucleic Acids Res 32:e5.
W. T. B. THOMAS, W. P. R. WAUGH, K. J. CHALMERS, U. M. BARUA, P. JACK, V. LEA, B. P.FORSTER, J. S. SWANSTON, R. P. ELLIS, P. R. HANSON, et al. (1995) Detection of quantitative trait loci for agronomic, yield, grain and disease characters in spring barley (Hordeum vulgare L.). Theor Appl Genet 91:1037-1047.

REFERENCES 152
W. T. B. THOMAS, R. WAUGH, L. RAMSAY, J. R. RUSSELL, W. POWELL, T. KONISHI, R. C.MEYER, G. R. YOUNG, P. E. LAWRENCE, A. BOOTH, et al. (2001) Annual Report. Scottish Crop Research Institute:162-164.
J. M. THORNSBERRY, M. M. GOODMAN, J. DOEBLEY, S. KRESOVICH, D. NIELSEN, E. S.BUCKLER (2001) Dwarf8 polymorphisms associate with variation in flowering time. Nat Genet 28:286-289.
Y. R. THORSTENSON, S. P. HUNICKE-SMITH, P. J. OEFNER, R. W. DAVIS (1998) An automated hydrodynamic process for controlled, unbiased DNA shearing. Genome Res 8:848-855.
P. THURIAUX (1977) Is recombination confined to structural genes on the eukaryotic genome? Nature 268:460-462.
A. P. TIKHONOV, P. J. SANMIGUEL, Y. NAKAJIMA, N. M. GORENSTEIN, J. L. BENNETZEN, Z.AVRAMOVA (1999) Colinearity and its exceptions in orthologous adh regions of maize and sorghum. Proc Natl Acad Sci U S A 96:7409-7414.
L. TOMMASINI, T. SCHNURBUSCH, D. FOSSATI, F. MASCHER, B. KELLER (2007) Association mapping of Stagonospora nodorum blotch resistance in modern European winter wheat varieties. Theor Appl Genet 115:697-708.
T. TSUCHIYA (1972) A case of paracentric inversion affecting genetic behavior of a white streak gene. Barley Genetics Newsletter 2:104-105.
T. TSUCHIYA, R. J. SINGH (1972) Another case of paracentric inversion in a genetic stock, Engleawnless, for Lk of barley. Barley Genetics Newsletter 2:110-111.
O. VALETTE-COLLET, A. CIMERMAN, P. REIGNAULT, C. LEVIS, M. BOCCARA (2003) Disruption of Botrytis cinerea pectin methylesterase gene Bcpme1 reduces virulence on several host plants. Mol Plant-Microbe Interact 16:360-367.
K. A. E. VAN 'T SLOT, A. GIERLICH, W. KNOGGE (2007) A single binding site mediates resistance- and disease-associated activities of the effector protein NIP1 from the barley pathogen Rhynchosporium secalis. Plant Physiol 144:1654-1666.
E. A. VAN DER BIEZEN, J. D. JONES (1998) Plant disease-resistance proteins and the gene-for-gene concept. Trends Biochem Sci 23:454-456.
A. E. VAN DEYNZE, M. E. SORRELLS, W. D. PARK, N. M. AYRES, H. FU, S. W.CARTINHOUR, E. PAUL, S. R. MCCOUCH (1998) Anchor probes for comparative mapping of grass genera. Theor Appl Genet 97:356-369.
J. A. L. VAN KAN (2006) Licensed to kill: the lifestyle of a necrotrophic plant pathogen. Trends Plant Sci 11:247-253.
L. VARIN, F. MARSOLAIS, M. RICHARD, M. ROULEAU (1997) Sulfation and sulfotransferases 6: Biochemistry and molecular biology of plant sulfotransferases. FASEB J 11:517-525.

REFERENCES 153
D. P. VERMA, Z. HONG (2001) Plant callose synthase complexes. Plant Mol Biol47:693-701.
M. VON KORFF, H. WANG, J. LÉON, K. PILLEN (2005) AB-QTL analysis in spring barley. I. Detection of resistance genes against powdery mildew, leaf rust and scald introgressed from wild barley. Theor Appl Genet 111:583-590.
T. H. G. VU (2007) Towards map based cloning of the gibberrellin-insensitive dwarfing gene sdw3 of barley. PhD thesis. Ernst-Moritz-Arndt-Universität Greifswald, Mathematisch-Naturwissenschaftliche Fakultät.
C. WAGNER, G. SCHWEIZER, M. KRÄMER, A. G. DEHMER-BADANI, F. ORDON, W. FRIEDT
(2008) The complex quantitative barley-Rhynchosporium secalis interaction: newly identified QTL may represent already known resistance genes. Theor Appl Genet 118:113-122.
J. WAN, X.-C. ZHANG, D. NEECE, K. M. RAMONELL, S. CLOUGH, S.-Y. KIM, M. G. STACEY, G. STACEY (2008) A LysM receptor-like kinase plays a critical role in chitin signaling and fungal resistance in Arabidopsis. Plant Cell 20:471-481.
Z. X. WANG, M. YANO, U. YAMANOUCHI, M. IWAMOTO, L. MONNA, H. HAYASAKA, Y.KATAYOSE, T. SASAKI (1999) The Pib gene for rice blast resistance belongs to the nucleotide binding and leucine-rich repeat class of plant disease resistance genes. Plant J 19:55-64.
E. R. WARD, G. C. JEN (1990) Isolation of single-copy-sequence clones from a yeast artificial chromosome library of randomly-sheared Arabidopsis thaliana DNA. Plant Mol Biol 14:561-568.
R. F. WARREN, P. M. MERRITT, E. HOLUB, R. W. INNES (1999) Identification of three putative signal transduction genes involved in R gene-specified disease resistance in Arabidopsis. Genetics 152:401-412.
C. A. WEBB, T. E. RICHTER, N. C. COLLINS, M. NICOLAS, H. N. TRICK, T. PRYOR, S. H.HULBERT (2002) Genetic and molecular characterization of the maize rp3 rust resistance locus. Genetics 162:381-394.
F. WEI, K. GOBELMAN-WERNER, S. M. MORROLL, J. KURTH, L. MAO, R. WING, D. LEISTER, P. SCHULZE-LEFERT, R. P. WISE (1999) The Mla (powdery mildew) resistance cluster is associated with three NBS-LRR gene families and suppressed recombination within a 240-kb DNA interval on chromosome 5S (1HS) of barley. Genetics 153:1929-1948.
F. WEI, R. A. WING, R. P. WISE (2002) Genome dynamics and evolution of the Mla(powdery mildew) resistance locus in barley. Plant Cell 14:1903-1917.
S. A. WELLS, W. P. SKOROPAD (1963) Inheritance of reaction to Rhynchosporium secalis in barley. Can J Plant Sci 43:184-187.
REFERENCES 154
L. WEVELSIEP, K.-H. KOGEL, W. KNOGGE (1991) Purification and characterization of peptides from Rhynchosporium secalis inducing necrosis in barley. Physiol Mol Plant Pathol 39:471-482.
L. WEVELSIEP, E. RÜPPING, W. KNOGGE (1993) Stimulation of barley plasmalemma peptides from the fungal pathogen H+-ATPase by phytotoxic Rhynchosporium secalis. Plant Physiol 101:297-301.
S. R. WHITT, L. M. WILSON, M. I. TENAILLON, B. S. GAUT, E. S. BUCKLER (2002) Genetic diversity and selection in the maize starch pathway. Proc Natl Acad Sci U S A99:12959-12962.
T. WICKER, F. SABOT, A. HUA-VAN, J. L. BENNETZEN, P. CAPY, B. CHALHOUB, A. FLAVELL, P. LEROY, M. MORGANTE, O. PANAUD, et al. (2007) A unified classification system for eukaryotic transposable elements. Nat Rev Genet 8:973-982.
G. A. WIEBE (1972) Tight linkage of the awnless gene in Engleawnless with the Vvlocus. Barley Genetics Newsletter 2:108.
K. WILLIAMS, P. BOGACKI, L. SCOTT, A. KARAKOUSIS, H. WALLWORK (2001) Mapping of a gene for leaf scald resistance in barley line 'B87/14' and validation of microsatellite and RFLP markers for marker-assisted selection. Plant Breed120:301-304.
K. J. WILLIAMS (2003) The molecular genetics of disease resistance in barley. Aust J Agric Res 54:1065-1079.
J. WU, H. MIZUNO, M. HAYASHI-TSUGANE, Y. ITO, Y. CHIDEN, M. FUJISAWA, S. KATAGIRI, S. SAJI, S. YOSHIKI, W. KARASAWA, et al. (2003) Physical maps and recombination frequency of six rice chromosomes. Plant J 36:720-730.
K. XI, P. A. BURNETT, J. P. TEWARI, M. H. CHEN, T. K. TURKINGTON, J. H. HELM (2000a) Histopathological study of barley cultivars resistant and susceptible to Rhynchosporium secalis. Phytopathology 90:94-102.
K. XI, A. G. XUE, P. A. BURNETT, J. H. HELM, T. K. TURKINGTON (2000b) Quantitative resistance of barley cultivars to Rhynchosporium secalis. Can J Plant Pathol22:217-223.
K. XI, T. K. TURKINGTON, J. H. HELM, K. G. BRIGGS, J. P. TEWARI, T. FERGUSON, P. D.KHARBANDA (2003) Distribution of pathotypes of Rhynchosporium secalis and cultivar reaction on barley in Alberta. Plant Dis 87:391-396.
X. XU, A.-P. HSIA, L. ZHANG, B. J. NIKOLAU, P. S. SCHNABLE (1995) Meiotic recombination break points resolve at high rates at the 5' end of a maize coding sequence. Plant Cell 7:2151-2161.
N. YAHIAOUI, P. SRICHUMPA, R. DUDLER, B. KELLER (2004) Genome analysis at different ploidy levels allows cloning of the powdery mildew resistance gene Pm3b from hexaploid wheat. Plant J 37:528-538.

REFERENCES 155
N. YAKOBY, S. FREEMAN, A. DINOOR, N. T. KEEN, D. PRUSKY (2000) Expression of pectate lyase from Colletotrichum gloeosporioides in C. magna promotes pathogenicity. Mol Plant-Microbe Interact 13:887-891.
M. YAMAMOTO, G. L. MIKLOS (1978) Genetic studies on heterochromatin in Drosophila melanogaster and their implications for the functions of satellite DNA. Chromosoma 66:71-98.
H. YAN, W. JIN, K. NAGAKI, S. TIAN, S. OUYANG, C. R. BUELL, P. B. TALBERT, S. HENIKOFF, J. JIANG (2005) Transcription and histone modifications in the recombination-free region spanning a rice centromere. Plant Cell 17:3227-3238.
L. YAN, A. LOUKOIANOV, G. TRANQUILLI, M. HELGUERA, T. FAHIMA, J. DUBCOVSKY (2003) Positional cloning of the wheat vernalization gene VRN1. Proc Natl Acad Sci U S A 100:6263-6268.
H. YAO, Q. ZHOU, J. LI†, H. SMITH†, M. YANDEAU, B. J. NIKOLAU, P. S. SCHNABLE (2002) Molecular characterization of meiotic recombination across the 140-kb multigenic a1-sh2 interval of maize. Proc Natl Acad Sci U S A 99:6157-6162.
T. M. YIN, S. P. DIFAZIO, L. E. GUNTER, S. S. JAWDY, W. BOERJAN, G. A. TUSKAN (2004) Genetic and physical mapping of Melampsora rust resistance genes inPopulus and characterization of linkage disequilibrium and flanking genomic sequence. New Phytol 164:95-105.
Y. YIN, D. WU, J. CHORY (2002) Plant receptor kinases: systemin receptor identified. Proc Natl Acad Sci U S A 99:9090-9092.
S. YOSHIMURA, U. YAMANOUCHI, Y. KATAYOSE, S. TOKI, Z. X. WANG, I. KONO, N. KURATA, M. YANO, N. IWATA, T. SASAKI (1998) Expression of Xa1, a bacterial blight-resistance gene in rice, is induced by bacterial inoculation. Proc Natl Acad Sci U S A 95:1663-1668.
Y. YU, J. P. TOMKINS, R. WAUGH, D. A. FRISCH, D. KUDRNA, A. KLEINHOFS, R. S.BRUEGGEMAN, G. J. MUEHLBAUER, R. P. WISE, R. A. WING (2000) A bacterial artificial chromosome library for barley (Hordeum vulgare L.) and the identification of clones containing putative resistance genes. Theor Appl Genet101:1093-1099.
S. J. YUN, L. GYENIS, P. M. HAYES, I. MATUS, K. P. SMITH, B. J. STEFFENSON, G. J.MUEHLBAUER (2005) Quantitative trait loci for multiple disease resistance in wild barley. Crop Sci 45:2563-2572.
P. L. ZAFFARANO, B. A. MCDONALD, M. ZALA, C. C. LINDE (2006) Global hierarchical gene diversity analysis suggests the fertile crescent is not the center of origin of the barley scald pathogen Rhynchosporium secalis. Phytopathology 96:941-950.
R. ZAREIE, D. L. MELANSON, P. J. MURPHY (2002) Isolation of fungal cell wall degrading proteins from barley (Hordeum vulgare L.) leaves infected with Rhynchosporium secalis. Mol Plant-Microbe Interact 15:1031-1039.

REFERENCES 156
J. ZHAN, B. D. L. FITT, H. O. PINNSCHMIDT, S. J. P. OXLEY, A. C. NEWTON (2008) Resistance, epidemiology and sustainable management of Rhynchosporium secalis populations on barley. Plant Pathol 57:1-14.
B. ZHAO, X. LIN, J. POLAND, H. TRICK, J. LEACH, S. HULBERT (2005) A maize resistance gene functions against bacterial streak disease in rice. Proc Natl Acad Sci U S A 102:15383-15388.
B. ZHOU, S. QU, G. LIU, M. DOLAN, H. SAKAI, G. LU, M. BELLIZZI, G.-L. WANG (2006) The eight amino-acid differences within three leucine-rich repeats between Pi2 and Piz-t resistance proteins determine the resistance specificity to Magnaporthe grisea. Mol Plant-Microbe Interact 19:1216-1228.
F. ZHOU, J. KURTH, F. WEI, C. ELLIOTT, G. VALÈ, N. YAHIAOUI, B. KELLER, S. SOMERVILLE, R. WISE, P. SCHULZE-LEFERT (2001) Cell-autonomous expression of barley Mla1 confers race-specific resistance to the powdery mildew fungus via a Rar1-independent signaling pathway. Plant Cell 13:337-350.
D. ZOHARY, M. HOPF (2000) Domestication of plants in the old world: the origin and spread of cultivated plants in West Asia, Europe and the Nile Valley. 3rd Edition. Oxford University Press.

SUPPLEMENTARY MATERIAL 157
8 Supplementary Material
accession/donor number pedigree origin resistance genes
11258 W (Malta × Emir × 818 × Tria) x (409S × Malta)G
GermanyA quantitative resistanceG
Abyssinian (CI 668) landraceB EthiopiaB Rh9 (BAKER and LARTER, 1963), Rrs1 Abyssinian (BJØRNSTAD et al., 2002)
Abyssinian (CI 1233) landraceB EthiopiaB unknown (RIDDLE and SUNESON, 1948)
Abyssinian (CI 1237) cultivarB EthiopiaB unknown (SCHALLER et al., 1964 cited in PATIL et al., 2002)
Abyssinian/Benton (CI 1227)
belongs to Abyssinian (Ethiopia) group of barleysB
EthiopiaB unknown (SCHALLER et al., 1964 cited in PATIL et al., 2002)
Alexis Breun St. 1622 × TrumpfC GermanyC susceptibleG
Atlas (CI 4118) pure line selection from CoastB USAB Rh2 (DYCK and SCHALLER, 1961)one gene which may also occur in CI 5831 (GOODWIN, 1988 cited in GOODWIN
et al., 1990)Rh2 (SCHWEIZER et al., 1995)
Atlas 46 (CI 7323) ((Hanna × CI5611-2) × Atlas*6) x (Turk × Atlas*7)B
USAB two dominant genes, one probably Rh or Rh3 (ALI, 1975a)Rh2, Rh3 (DYCK and SCHALLER, 1961)Rh3 (EVANS, 1969 cited in HABGOOD and HAYES, 1971)one gene (GOODWIN, 1988 cited in GOODWIN et al., 1990)Rh, (Rh2) (HABGOOD and HAYES, 1971)one dominant gene, probably Rh3 (MOHAMED, 1975 cited in GOODWIN et al., 1990)two dominant genes, Rh-Rh3-Rh4-complex and Rh2 (STARLING et al., 1971)
Atlas 46 Atrada × Atlas CI 7189H – two dominant genes, one is common with a gene in Osiris (FRECHA, 1967cited in ALI, 1976)
Atlas 54 (Lion × 10 Atlas) × Atlas 46C USAC no information
Table A1: Names of accessions used in the association study, their pedigree, origin and described resistance genes obtained from literature and personal communications. Footnotes are explained at the end of the table.

SUPPLEMENTARY MATERIAL 158
accession/donor number pedigree origin resistance genes
Atlas 68 (CI 13824) (Atlas 3 × CI 3920-1) × (Atlas 46 × Atlas × CI 1179) × Atlas 57B
USAB no information
Auriga (Viskosa × Krona) × AnnabellC GermanyC susceptibleG
Barke Libelle × AlexisC GermanyC susceptibleG
Birte Goldie × CorkC GermanyC susceptibleG
Braemar NFC 5563 × NFC 94-20C United KingdomC susceptibleG
Breustedts Atlas unknownA GermanyA no information
Brier (CI 7157) selection from LV-West-Virginia, winter barleyB
USAB Rh3 (AYRES and OWEN, 1971)Rrs1Brier (BJØRNSTAD et al., 2002)Rh (BRYNER, 1957 cited in HABGOOD and HAYES, 1971)Rh (DYCK and SCHALLER, 1961)Rh1, rh6 (HABGOOD and HAYES, 1971)one dominant gene (MOHAMED, 1975 cited in GOODWIN et al., 1990)Rh (STARLING et al., 1971)
Cebada Atlas unkownC unknownC no information
CI 1225 landraceB EthiopiaB unknownG
CI 2235 (Coast) pure lineB Idaho, USAB orNorth AfricaL
Rrs2, based on mapping dataG
CI 3515 landrace, collected 1923B Toledo, SpainB Rh4 (allele of Rh), Rh10 (HABGOOD and HAYES, 1971)two genes, one at Rh-Rh3-Rh locus, second one is not Rh2 (STARLING et al., 1971)one dominant gene like in Turk (Rh3) (WELLS and SKOROPAD, 1963)
CI 4364 landraceB EthiopiaB rh11 (HABGOOD and HAYES, 1971)
Table A1 continued: Names of accessions used in the association study, their pedigree, origin and described resistance genes from literature and personal communication. Footnotes are explained at the end of the table.

SUPPLEMENTARY MATERIAL 159
accession/donor number pedigree origin resistance genes
CI 5831 landrace, collected 1930B Kharkiv, UkraineB three genes, one may be Rh2, another be shared with Osiris (GOODWIN, 1988cited in GOODWIN et al., 1990)two dominant linked genes (MOHAMED, 1975 cited in GOODWIN et al., 1990)
CI 8288 (GEMBLOUX 456) cultivarB Namur, BelgiumB Rrs15 (SCHWEIZER et al., 2004)
Digger Magnif-E-105 × Universe (MMG-68-5-11) × AramirE
United KingdomE Rrs2 according to William Thomas (SCRI, Dundee, UK)
Escaldadura 15 landraceG UruguayG Rrs2, based on mapping dataG
Forrest Atlas 57 × (Prior × Ymer)B Western Australia, AustraliaB
Rrs2 according to Hugh Wallwork (SARDI, Adelaide, Australia), based on infection data with differential fungal isolates
Forrest (CI 9187) pureline selection from Brandon 1136 = (Newal × Peatland) × OA 21B
USAB –
Gairdner (Onslow × Tas ’83-587’) ×FranklinD
Western Australia, AustraliaD
Rrs2 according to Hugh Wallwork (SARDI, Adelaide, Australia), based on infection data with differential fungal isolates
GloriaLBIran × Harrington ((LBIran × Una827) ×(Gloria×Come))K × HarringtonG
ICARDA/CIMMYTK Rrs2, based on mapping dataG
Hendrix Madras × S 90772E GermanyE susceptibleG
Hispont (CI 8828) Haisa × Imperial × Hordeum spontaneum-H-204C
GermanyC no information
Hudson (CI 8067) Michigan-Winter × WongC USAC two dominant genes, one probably Rh3 or Rh (ALI, 1975a)two genes, one may be the same as in Brier and Turk (GOODWIN, 1988 cited in GOODWIN et al., 1990)Rh (HABGOOD and HAYES, 1971)one dominant gene at the Rh-Rh3-Rh4 locus (STARLING et al., 1971)
Table A1 continued: Names of accessions used in the association study, their pedigree, origin and described resistance genes from literature and personal communication. Footnotes are explained at the end of the table.

SUPPLEMENTARY MATERIAL 160
accession/donor number pedigree origin resistance genes
IPZ 24727 IPZ 23838 × MaresiF GermanyF susceptibleG
Jet (CI 967) landraceB EthiopiaB rh6, rh7 (BAKER and LARTER, 1963)rrs1Jet (BJØRNSTAD et al., 2002)rrs1, rrs6 (BOCKELMAN and SHARP, 1977)rh5 (allele of Rh), rh6 (HABGOOD and HAYES, 1971)
La Mesita (CI 7565) line selection from California MarioutB
MexicoC, USAB two dominant genes, one probably Rh4 (ALI, 1975b)Rrs1La Mesita (BJØRNSTAD et al., 2002)Rh4 (DYCK and SCHALLER, 1961)one gene (GOODWIN, 1988 cited in GOODWIN et al., 1990)Rh4(allele of Rh), Rh10 (HABGOOD and HAYES, 1971)one dominant gene, the same like in Osiris (MOHAMED, 1975 cited in GOODWIN et al., 1990)one dominant gene in common with Trebi and Turk (RIDDLE and BRIGGS, 1950)one dominant gene at the Rh-Rh3-Rh4 complex (STARLING et al., 1971)
Leduc Steptoe × ClondikeB Manitoba, CanadaB
adult plant resistance, quantitative resistance (XI et al., 2000b)
Livet 22746C041 × TSS 311-54E or (Dera × Digger) × (TS-42-3-5 ×Armelle)C
United KingdomE Rrs2 according to William Thomas (SCRI, Dundee, UK)
Magnum Magnif 104 × UniverseE United KingdomE no information
Manchuria (CI 2230) Deficiens × JetA USAA unknown (SCHALLER et al., 1964 cited in PATIL et al., 2002)
Modoc (CI 7566) line selection from Composite Cross II, CI 5461B
USAB Rrs1Modoc (BJØRNSTAD et al., 2002)Rh42 (DYCK and SCHALLER, 1961)one gene (GOODWIN, 1988 cited in GOODWIN et al., 1990)Rh2(allele of Rh), rh6 (HABGOOD and HAYES, 1971)one dominant gene, different from the one in Trebi, Osiris, and La Mesita (MOHAMED, 1975 cited in GOODWIN et al., 1990)Rh42 (STARLING et al., 1971)
Table A1 continued: Names of accessions used in the association study, their pedigree, origin and described resistance genes from literature and personal communication. Footnotes are explained at the end of the table.

SUPPLEMENTARY MATERIAL 161
accession/donor number pedigree origin described resistance genes in literature
Morex Cree × BonanzaB USAB susceptibleG
Nigrinudum (CI 11549) landraceB EthiopiaB Rrs1CI11549, Rrs4CI11549 (BJØRNSTAD et al., 2002)rh8 (HABGOOD and HAYES, 1971)rrsx (rhx) (PATIL et al., 2003)
Nigrinudum (CI 2222) landraceB EthiopiaB Rrs2, possibly same allele as in Steudelli (PATIL et al., 2003)rh8 (WELLS and SKOROPAD, 1963)
Onslow Forrest × AapoB Western Australia, AustraliaB
Rrs2 according to Hugh Wallwork (SARDI, Adelaide, Australia), based on infection data with differential fungal isolates
Opal Puffin × AngoraC United Kingdom/ GermanyC
susceptibleG
Osiris (CI 1622) landraceB, selection from Cheliff (PI 39590)
Mascara, AlgeriaB Rh4 (DYCK and SCHALLER, 1961)Rh4 (EVANS, 1969 cited in HABGOOD and HAYES, 1971)one dominant gene in common with Atrada x Atlas (Atlas 46) (FRECHA, 1967cited in ALI, 1976)two genes, one of which may be common to CI 5831 (GOODWIN, 1988 cited in GOODWIN et al., 1990)Rh4(allele of Rh), rh6, Rh10 (HABGOOD and HAYES, 1971)two dominant genes, one probably the same as Rh4 (MOHAMED, 1975 cited in GOODWIN et al., 1990)one dominant gene like in Turk (Rh3) (WELLS and SKOROPAD, 1963)Rrs2G
Pewter NFC 94-20 × NFC 94-11E United KingdomE Rrs2, based on mapping dataG
PI 452395 breeding line from EnglandB United KingdomB Rrs2, based on mapping data G
Pioneer (CI 9508) Tschermaks Zweizeilige Wintergerste / Spratt ArcherC
United KingdomC Rh3 (AYRES and OWEN, 1971)Rh10 (HANSEN and MAGNUS, 1973)
Prestige Cork × ChariotC United KingdomC susceptibleG
Table A1 continued: Names of accessions used in the association study, their pedigree, origin and described resistance genes from literature and personal communication. Footnotes are explained at the end of the table.

SUPPLEMENTARY MATERIAL 162
accession/donor number pedigree origin described resistance genes in literature
Quinn (CI 1024) landraceB New South Wales, AustraliaB
unknown (http://www.ars-grin.gov/cgi-bin/npgs/html/acchtml.pl? 1104769)
Steffi (Stamm 101 × Aramir) ×Stamm 210E
GermanyE susceptibleG
Steudelli (CI 2226) selection from PI 12376B, J Harer, EthiopiaB, J rh6J, rh7J (BAKER and LARTER, 1963)Rrs2Steudelli (BJØRNSTAD et al., 2002)one geneJ (GOODWIN, 1988 cited in GOODWIN et al., 1990)
Trebi (CI 936) selection from PI 15821 (from Samsun, Turkey)B
Trebizond, Asiatic TurkeyB
Rh4 (DYCK and SCHALLER, 1961)one gene (GOODWIN, 1988 cited in GOODWIN et al., 1990)Rh43(HANSEN and MAGNUS, 1973)one dominant gene in common with La Mesita and Turk (RIDDLE and BRIGGS, 1950)Rh4 (STARLING et al., 1971)
Triton cross from 8 F1E GermanyE unknownG
Turk (CI 14400 = CI 5611-2) landraceB TurkeyB Rh3 or Rh (ALI, 1975a)Rh3 (BAKER and LARTER, 1963)Rrs1Turk (BJØRNSTAD et al., 2002)Rh3, Rh5 (DYCK and SCHALLER, 1961)Rh3 (EVANS, 1969 cited in HABGOOD and HAYES, 1971)one gene (GOODWIN, 1988 cited in GOODWIN et al., 1990)Rh, (Rh5), rh6 (HABGOOD and HAYES, 1971)one dominant gene (MOHAMED, 1975 cited in GOODWIN et al., 1990)one dominant gene in common with La Mesita and Trebi (RIDDLE and BRIGGS, 1950)Rh3 (STARLING et al., 1971)one dominant gene (Rh3) (WELLS and SKOROPAD, 1963)
Turk × Atlas (CI 7189) Turk, CI 5611-2 × Atlas 7B USAB no information
Wisconsin Winter × Glabron (CI 8162)
breeding lineB ArgentinaB Rrs1Brier (BJØRNSTAD et al., 2002)one gene (GOODWIN, 1988 cite in GOODWIN et al., 1990)Rh3 (HABGOOD and HAYES, 1971)
Table A1 continued: Names of accessions used in the association study, their pedigree, origin and described resistance genes from literature and personal communication. Footnotes are explained at the end of the table.

SUPPLEMENTARY MATERIAL 163
A http://barley.ipk-gatersleben.de/ebdb.php3B http://www.ars-grin.gov/npgs/searchgrin.htmlC http://genbank.vurv.cz/barley/pedigree/pedigree.aspD http://www.regional.org.au/au/abts/1999/paynter.htmE http://www.lfl.bayern.de/ipz/gerste/09740/gerstenstamm.phpF BEHN, 2003
G personal communication Günther Schweizer (Bayerische Landesanstalt für Landwirtschaft, Freising, Lfl-Bayern)H FRECHA, 1967; HABGOOD and HAYES, 1971J BAKER and LARTER, 1963 and GOODWIN, 1988 refer to Steudelli as CI 2266; a check in two databases (http://www.ars-grin.gov/npgs/searchgrin.html and http://barley.ipk-gatersleben.de/) showed that this accession number originates from Uzbekistan and is either called Donjon or Steudelii, therefore the authors have either used a different genotype than other authors or a mistake in the accession number occurred.K CHEN et al., 1994L http://www.jic.ac.uk/GERMPLAS/bbsrc_ce/Pedb.txt
accession/donor numberaccession number
source of seed material or DNAresistance according to resistance test
expected resistance phenotype (for citations see Table A1)
11258W – Bayerische Landesanstalt für Landwirtschaft (DNA) resistant resistant
Abyssinian (CI 668) HOR5023 Genebank Gatersleben (seed) resistant resistant
Abyssinian (CI 1233) HOR5039 Genebank Gatersleben resistant resistant
Abyssinian (CI 1237) HOR5041 Genebank Gatersleben resistant resistant
Abyssinian/ Benton (CI 1227) HOR5037 Genebank Gatersleben intermediate resistant
Alexis – Bayerische Landesanstalt für Landwirtschaft susceptible susceptible
Atlas 495017 Australian Winter Cereals Collection (seed) resistant resistant
Atlas (CI 4118) HOR4840 Genebank Gatersleben resistant resistant
Atlas – parent of mapping population (DNA) resistant resistant
Atlas 46 495191 Australian Winter Cereals Collection (seed) resistant resistant
Atlas 46 HOR20489 Genebank Gatersleben resistant resistant
Atlas 46 HOR3876 Genebank Gatersleben resistant resistant
Table A1 continued: Explanation of footnotes for Table A1.
Table A 2: Accessions used in the association study, their accession numbers, source of seed material or DNA, as well as results of the resistance test and resistance phenotype described in literature.

SUPPLEMENTARY MATERIAL 164
accession/donor numberaccession number
source of seed material or DNAresistance according to resistance test
expected resistance phenotype (for citations see Table A1)
Atlas 46 – Bayerische Landesanstalt für Landwirtschaft resistant resistant
Atlas 54 (CI 9556) HOR9547 Genebank Gatersleben resistant no information
Atlas 68 (CI 13824) HOR9592 Genebank Gatersleben resistant no information
Auriga – Bayerische Landesanstalt für Landwirtschaft susceptible susceptible
Barke – Bayerische Landesanstalt für Landwirtschaft susceptible susceptible
Birte – Bayerische Landesanstalt für Landwirtschaft susceptible susceptible
Braemar – Bayerische Landesanstalt für Landwirtschaft susceptible susceptible
Breustedts Atlas HOR2913 Genebank Gatersleben susceptible no information
Brier (CI 7157) HOR3106 Genebank Gatersleben susceptible resistant
Cebada Atlas HOR19750 Genebank Gatersleben resistant no information
CI 1225 – Bayerische Landesanstalt für Landwirtschaft resistant resistant
CI 2235 – Bayerische Landesanstalt für Landwirtschaft resistant resistant
CI 3515 – Bayerische Landesanstalt für Landwirtschaft resistant resistant
CI 4364 HOR5203 Genebank Gatersleben resistant resistant
CI 5831 – Bayerische Landesanstalt für Landwirtschaft resistant resistant
CI 8288 – Bayerische Landesanstalt für Landwirtschaft resistant resistant
Digger 18560 BBSCR Cereals Collection, John Innes Centre (seed) resistant resistant
Digger 24525 BBSCR Cereals Collection, John Innes Centre resistant resistant
Table A2 continued: Accessions used in the association study, their accession numbers, source of seed material or DNA, as well as results of the resistance test and resistance phenotype described in literature.

SUPPLEMENTARY MATERIAL 165
accession/donor numberaccession number
source of seed material or DNAresistance according to resistance test
expected resistance phenotype (for citations see Table A1)
Escaldadura 15 – Bayerische Landesanstalt für Landwirtschaft resistant resistant
Forrest BCC1701 Genebank Gatersleben resistant resistant
Forrest AUS 400180 Australian Winter Cereals Collection resistant resistant
Forrest (CI 9187) HOR3631 Genebank Gatersleben susceptible no information
Gairdner 408175 Australian Winter Cereals Collection resistant resistant
GloriaLBIran × Harrington – Bayerische Landesanstalt für Landwirtschaft resistant resistant
Hendrix – Bayerische Landesanstalt für Landwirtschaft susceptible susceptible
Hispont (CI8828) HOR9535 Genebank Gatersleben susceptible no information
Hudson BCC880 Genebank Gatersleben intermediate resistant
Hudson HOR15375 Genebank Gatersleben intermediate resistant
Hudson (CI 8067) HOR3118 Genebank Gatersleben intermediate resistant
Hudson HOR3264 Genebank Gatersleben intermediate resistant
IPZ24727 – Bayerische Landesanstalt für Landwirtschaft susceptible susceptible
Jet (CI 967) HOR5032 Genebank Gatersleben resistant resistant
La Mesita – Bayerische Landesanstalt für Landwirtschaft resistant resistant
Leduc 406375 Australian Winter Cereals Collection not analyzed resistant
Livet 495198 Australian Winter Cereals Collection not analyzed resistant
Livet 408567 Australian Winter Cereals Collection not analyzed resistant
Table A2 continued: Accessions used in the association study, their accession numbers, source of seed material or DNA, as well as results of the resistance test and resistance phenotype described in literature.

SUPPLEMENTARY MATERIAL 166
accession/donor numberaccession number
source of seed material or DNAresistance according to resistance test
expected resistance phenotype (for citations see Table A1)
Magnum HOR8670 Genebank Gatersleben intermediate no information
Manchuria (CI 2230) HOR10580 Genebank Gatersleben resistant resistant
Modoc (CI 7566) HOR8883 Genebank Gatersleben intermediate resistant
Morex – unknown susceptible susceptible
Nigrinudum (CI 11549) HOR4844 Genebank Gatersleben resistant resistant
Nigrinudum (CI 2222) HOR5055 Genebank Gatersleben not analyzed resistant
Onslow 20557 BBSCR Cereals Collection, John Innes Centre resistant resistant
Onslow 406008 Australian Winter Cereals Collection resistant resistant
Opal – Bayerische Landesanstalt für Landwirtschaft susceptible susceptible
Osiris – Bayerische Landesanstalt für Landwirtschaft resistant resistant
Pewter – Bayerische Landesanstalt für Landwirtschaft resistant resistant
PI452395 – Bayerische Landesanstalt für Landwirtschaft resistant resistant
Pioneer 4707 BBSCR Cereals Collection, John Innes Centre susceptible resistant
Prestige – Bayerische Landesanstalt für Landwirtschaft susceptible susceptible
Quinn (CI 1024) HOR2397 Genebank Gatersleben not analyzed resistant
Steffi – parent of mapping population susceptible susceptible
Steudelli 402008 Australian Winter Cereals Collection not analyzed resistant
Steudelli 495174 Australian Winter Cereals Collection not analyzed resistant
Steudelli 495189 Australian Winter Cereals Collection not analyzed resistant
Table A2 continued: Accessions used in the association study, their accession numbers, source of seed material or DNA, as well as results of the resistance test and resistance phenotype described in literature.

SUPPLEMENTARY MATERIAL 167
accession/donor numberaccession number
source of seed material or DNAresistance according to resistance test
expected resistance phenotype (for citations see Table A1)
Trebi 3599 BBSCR Cereals Collection, John Innes Centre resistant resistant
Triton – Bayerische Landesanstalt für Landwirtschaft resistant resistant
Turk (CI 14400) HOR8886 Genebank Gatersleben susceptible resistant
Turk × Atlas (CI 7189) HOR8881 Genebank Gatersleben resistant no information
Wisconsin Winter × Glabron (CI 8162)
HOR8885 Genebank Gatersleben resistant resistant
Table A2 continued: Accessions used in the association study, their accession numbers, source of seed material or DNA, as well as results of the resistance test and resistance phenotype described in literature.
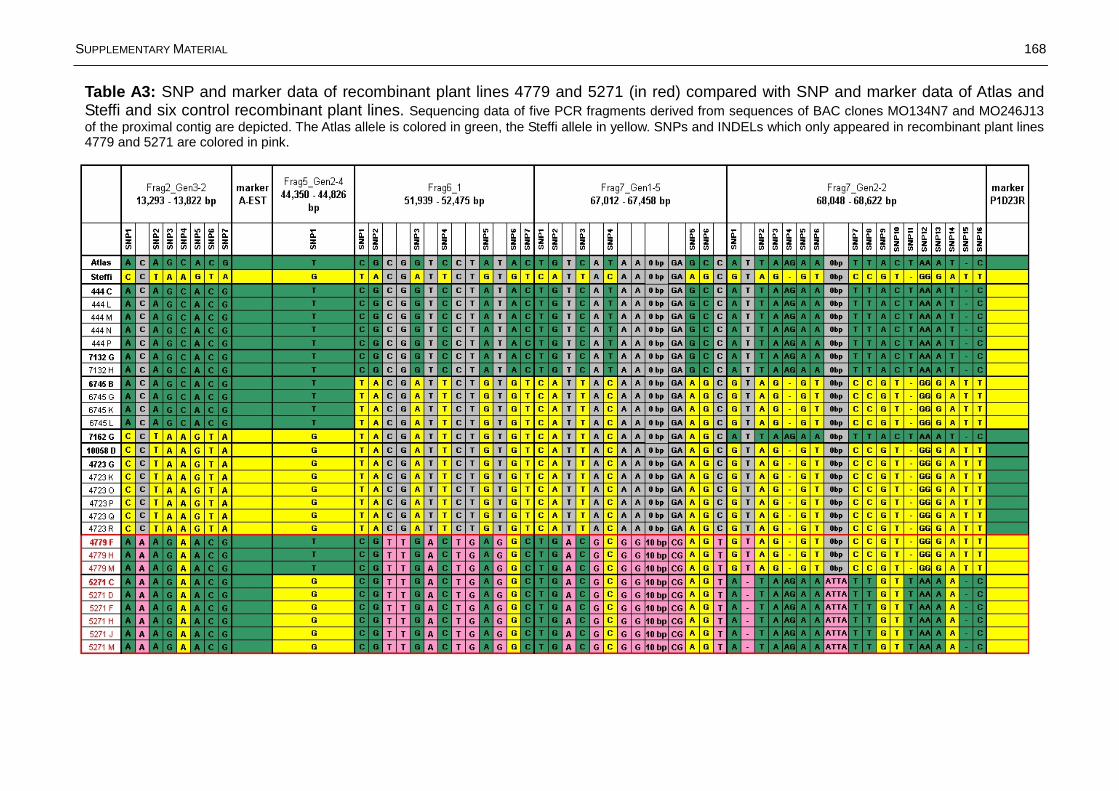
SUPPLEMENTARY MATERIAL 168
Table A3: SNP and marker data of recombinant plant lines 4779 and 5271 (in red) compared with SNP and marker data of Atlas and Steffi and six control recombinant plant lines. Sequencing data of five PCR fragments derived from sequences of BAC clones MO134N7 and MO246J13 of the proximal contig are depicted. The Atlas allele is colored in green, the Steffi allele in yellow. SNPs and INDELs which only appeared in recombinant plant lines 4779 and 5271 are colored in pink.

SUPPLEMENTARY MATERIAL 169
Table A4: Overview of recombinant plant lines and corresponding genotyping and phenotyping results. A = allele of Atlas; S = allele of Steffi; ~ = unclear resistance test result

SUPPLEMENTARY MATERIAL 170
Table A4 continued: Overview of recombinant plant lines and corresponding genotyping and phenotyping results. A = allele of Atlas;S = allele of Steffi; ~ = unclear resistance test result

SUPPLEMENTARY MATERIAL 171
Table A4 continued: Overview of recombinant plant lines and corresponding genotyping and phenotyping results. A = allele of Atlas;S = allele of Steffi; ~ = unclear resistance test result
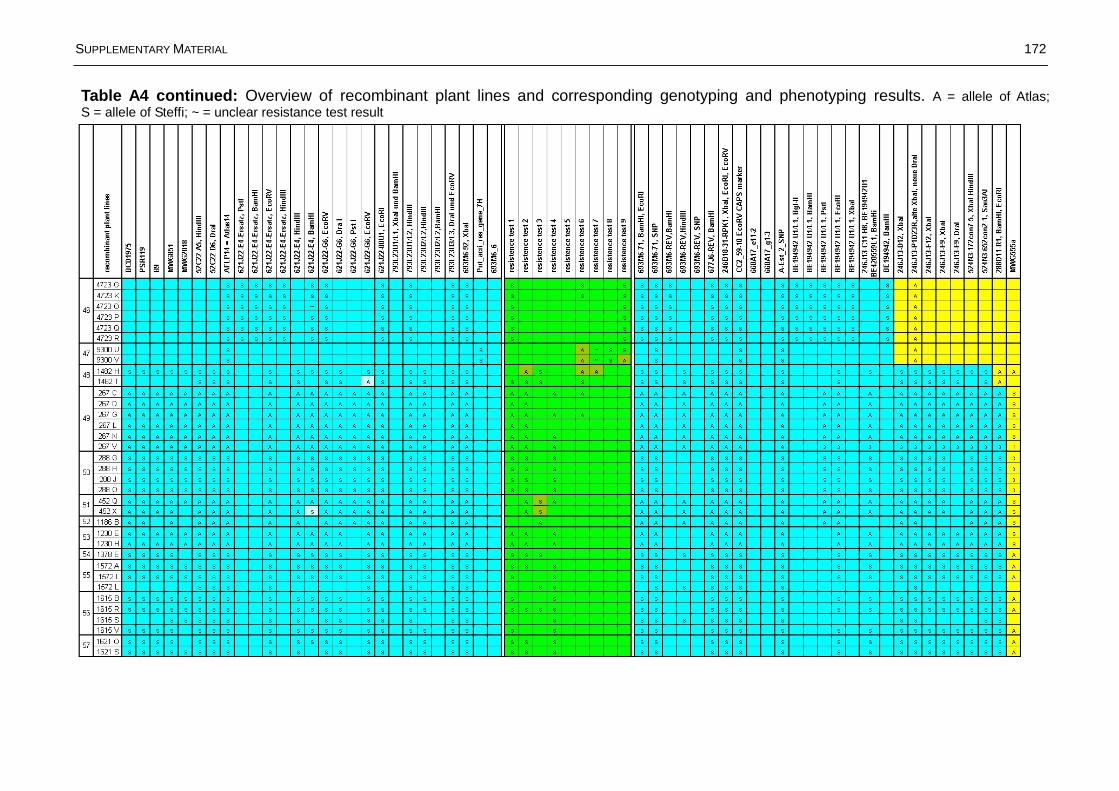
SUPPLEMENTARY MATERIAL 172
Table A4 continued: Overview of recombinant plant lines and corresponding genotyping and phenotyping results. A = allele of Atlas;S = allele of Steffi; ~ = unclear resistance test result
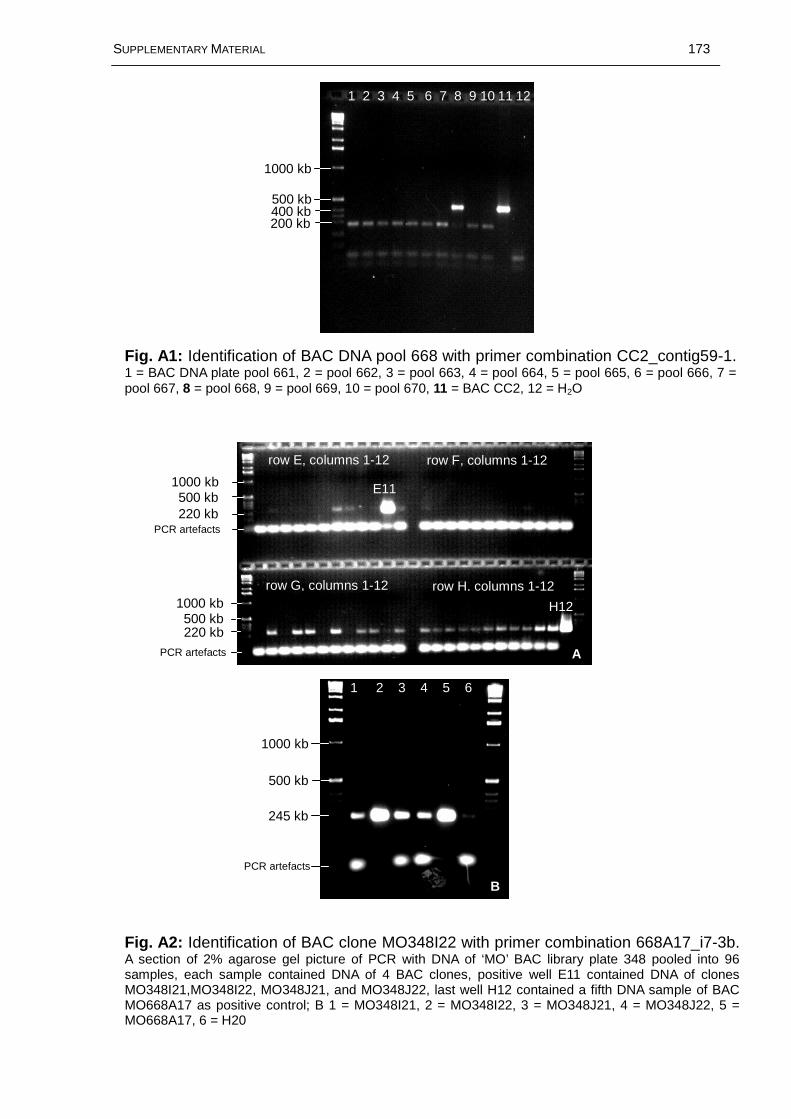
SUPPLEMENTARY MATERIAL 173
Fig. A1: Identification of BAC DNA pool 668 with primer combination CC2_contig59-1. 1 = BAC DNA plate pool 661, 2 = pool 662, 3 = pool 663, 4 = pool 664, 5 = pool 665, 6 = pool 666, 7 = pool 667, 8 = pool 668, 9 = pool 669, 10 = pool 670, 11 = BAC CC2, 12 = H2O
Fig. A2: Identification of BAC clone MO348I22 with primer combination 668A17_i7-3b. A section of 2% agarose gel picture of PCR with DNA of ‘MO’ BAC library plate 348 pooled into 96 samples, each sample contained DNA of 4 BAC clones, positive well E11 contained DNA of clones MO348I21,MO348I22, MO348J21, and MO348J22, last well H12 contained a fifth DNA sample of BAC MO668A17 as positive control; B 1 = MO348I21, 2 = MO348I22, 3 = MO348J21, 4 = MO348J22, 5 = MO668A17, 6 = H20
500 kb
245 kb
PCR artefacts
B
1 2 3 4 5 6
A
row E, columns 1-12 row F, columns 1-12
row G, columns 1-12 row H, columns 1-12
H12
500 kb1000 kb
220 kbPCR artefacts
500 kb1000 kb
220 kb
PCR artefacts
1000 kb
1000 kb
1 2 3 4 5 6 7 8 9 10 11 12
E11
500 kb
200 kb400 kb
1000 kb
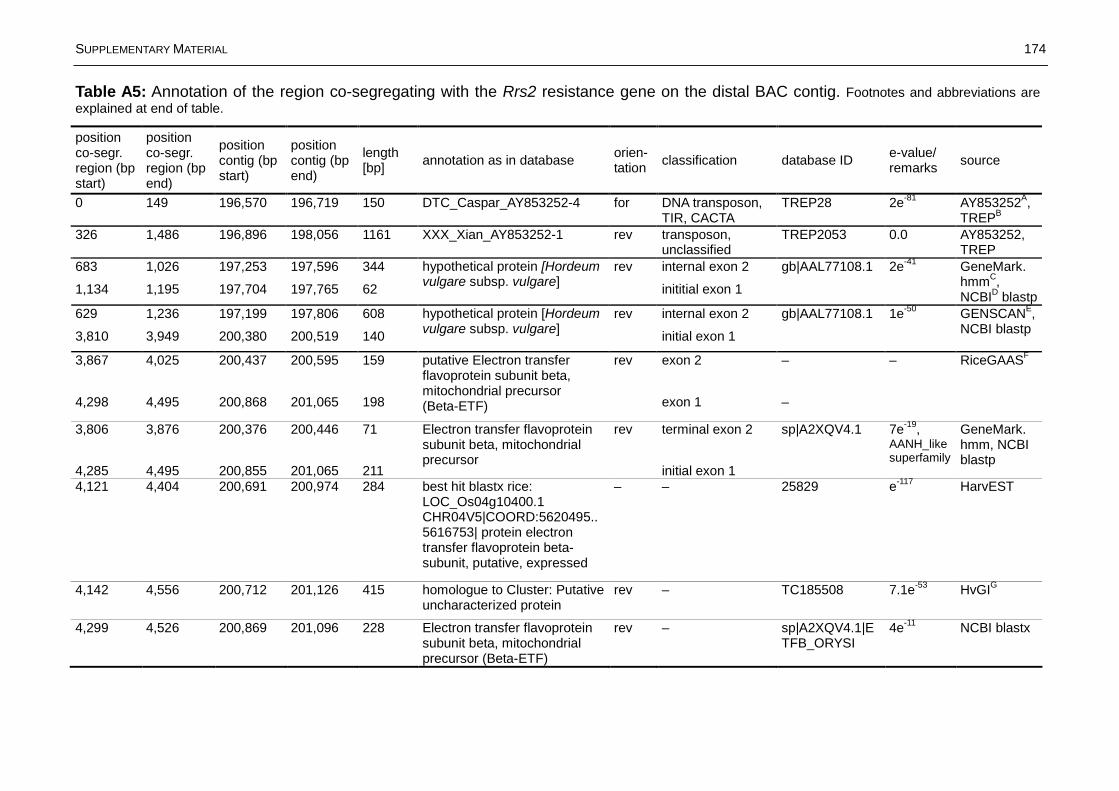
SUPPLEMENTARY MATERIAL 174
position co-segr. region (bp start)
position co-segr. region (bp end)
position contig (bp start)
position contig (bp end)
length [bp]
annotation as in databaseorien-tation
classification database IDe-value/ remarks
source
0 149 196,570 196,719 150 DTC_Caspar_AY853252-4 for DNA transposon, TIR, CACTA
TREP28 2e-81 AY853252A, TREPB
326 1,486 196,896 198,056 1161 XXX_Xian_AY853252-1 rev transposon, unclassified
TREP2053 0.0 AY853252, TREP
683 1,026 197,253 197,596 344 internal exon 2
1,134 1,195 197,704 197,765 62
hypothetical protein [Hordeum vulgare subsp. vulgare]
rev
inititial exon 1
gb|AAL77108.1 2e-41 GeneMark.hmmC, NCBID blastp
629 1,236 197,199 197,806 608 internal exon 2
3,810 3,949 200,380 200,519 140
hypothetical protein [Hordeum vulgare subsp. vulgare]
rev
initial exon 1
gb|AAL77108.1 1e-50 GENSCANE, NCBI blastp
3,867 4,025 200,437 200,595 159 exon 2 –
4,298 4,495 200,868 201,065 198
putative Electron transfer flavoprotein subunit beta, mitochondrial precursor(Beta-ETF)
rev
exon 1 –
– RiceGAASF
3,806 3,876 200,376 200,446 71 terminal exon 2
4,285 4,495 200,855 201,065 211
Electron transfer flavoprotein subunit beta, mitochondrial precursor
rev
initial exon 1
sp|A2XQV4.1 7e-19, AANH_like superfamily
GeneMark.hmm, NCBI blastp
4,121 4,404 200,691 200,974 284 best hit blastx rice: LOC_Os04g10400.1 CHR04V5|COORD:5620495..5616753| protein electron transfer flavoprotein beta-subunit, putative, expressed
– – 25829 e-117 HarvEST
4,142 4,556 200,712 201,126 415 homologue to Cluster: Putative uncharacterized protein
rev – TC185508 7.1e-53 HvGIG
4,299 4,526 200,869 201,096 228 Electron transfer flavoprotein subunit beta, mitochondrial precursor (Beta-ETF)
rev – sp|A2XQV4.1|ETFB_ORYSI
4e-11 NCBI blastx
Table A5: Annotation of the region co-segregating with the Rrs2 resistance gene on the distal BAC contig. Footnotes and abbreviations are explained at end of table.

SUPPLEMENTARY MATERIAL 175
position co-segr. region (bp start)
position co-segr. region (bp end)
position contig (bp start)
position contig (bp end)
length [bp]
annotation as in databaseorien-tation
classification database IDe-value/ remarks
source
4,292 4,483 200,862 201,053 192 initial exon 1
4,797 5,765 201,367 202,335 969
flavonol-sulfotransferase [Hordeum vulgare]
for
terminal exon 2
gb|AAY34254.1 0.0, sulfo-transfer1 superfamily
GENSCAN, NCBI blastp
4,676 4,684 201,246 201,254 9 TATA signal for –
4,799 5,764 201,369 202,334 966 flavonol-sulfotransferase for exon
5,922 5,927 202,492 202,497 6 PolyA-signal for –
– FST-2 AY853252
4,800 5,765 201,370 202,335 966 flavonol-sulfotransferase [Hordeum vulgare]
for single exon gb|AAY34254.1 0.0, sulfo-transfer1 superfamily
GeneMark.hmm, NCBI blastp
4,800 5,762 201,370 202,332 963 flavonol-sulfotransferase [Hordeum vulgare]
for – gb|AAY34254.1 0.0 NCBI blastx
4,710 5,170 201,280 201,740 461 homologue to UniRef100_A9UKM5 Cluster: Flavonol-sulfotransferase -Hordeum vulgare
– – dbj|BY842569 3.0e-91 HvGI
4,710 5,170 201,430 201,890 461 best hit blastx rice: LOC_Os11g30810.1 CHR11V5|COORD:17440822..17442665| protein flavonol sulfotransferase-like, putative, expressed
– – 31645 0.0 HarvEST
5,167 5,779 201,737 202,349 613 homologue to UniRef100_A9UKM5 Cluster: Flavonol-sulfotransferase -Hordeum vulgare
for TC188981 1.1e-123 HvGI
Table A5 continued: Annotation of the region co-segregating with the Rrs2 resistance gene on the distal BAC contig. Abbreviations are explained at end of table.

SUPPLEMENTARY MATERIAL 176
position co-segr. region (bp start)
position co-segr. region (bp end)
position contig (bp start)
position contig (bp end)
length [bp]
annotation as in databaseorien-tation
classification database IDe-value/ remarks
source
5,167 5,779 201,887 202,499 613 best hit blastx rice: LOC_Os09g38239.1 CHR09V5|COORD:22013268..22014768| protein flavonol sulfotransferase-like, putative, expressed
– – 7621 0.0 HarvEST
7,418 7,502 203,988 204,072 85 putative protease for exon 1 – – RiceGAAS
7,595 8,154 204,165 204,724 560 exon 2 – –
7,415 7,502 203,985 204,072 88 initial exon 1 – –
7,595 8,154 204,165 204,724 560
predicted exons for
terminal exon 2 – –
GENSCAN
7,754 8,074 204,324 204,644 321 putative protein [Triticum monococcum]
for gb|AAS88566.1 3e-13 NCBI blastx
7,692 7,771 204,262 204,341 80 terminal exon 7 – –
7,875 7,962 204,445 204,532 88 internal exon 6 – –
9,680 9,821 206,250 206,391 142 internal exon 5 – –
10,560 10,643 207,130 207,213 84 internal exon 4 – –
10,886 10,981 207,456 207,551 96 internal exon 3 – –
11,096 11,159 207,666 207,729 64 internal exon 2 – –
11,289 11,418 207,859 207,988 130
predicted exons rev
initial exon 1 – –
GeneMark.hmm
Table A5 continued: Annotation of the region co-segregating with the Rrs2 resistance gene on the distal BAC contig. Abbreviations are explained at end of table.

SUPPLEMENTARY MATERIAL 177
position co-segr. region (bp start)
position co-segr. region (bp end)
position contig (bp start)
position contig (bp end)
length [bp]
annotation as in databaseorien-tation
classification database IDe-value/ remarks
source
8,365 8,528 204,935 205,098 164 DTT_Thalos_AY853252-2 for DNA transposon, TIR, Mariner, MITE, Stowaway
TREP2043 3e-89, complete element, 2 bp TSD
AY853252, TREP
9,147 9,310 205,717 205,880 164 DTT_Thalos_AY853252-3 rev DNA transposon, TIR, Mariner, MITE, Stowaway
TREP2044 3e-89, complete element, 2 bp TSD
AY853252, TREP
9,147 9,161 205,717 205,731 15 exon 4 – –
9,680 9,821 206,250 206,391 142 exon 3 – –
10,560 10,697 207,130 207,267 138
hypothetical protein rev
exon 2 – –
RiceGAAS
9,147 9,161 205,717 205,731 15 terminal exon 4 – –
9,680 9,821 206,250 206,391 142 internal exon 3 – –
10,560 10,697 207,130 207,267 138 internal exon 2 – –
10,982 11,418 207,552 207,988 437
predicted exons rev
initial exon 1 – –
GENSCAN
10,264 11,627 206,834 208,197 1,364 XXX_Xanti_AY853252-1 for transposon, unclassified
TREP2050 0.0 AY853252, TREP
11,993 18,820 208,563 215,390 6,828 RLC_Ikya_AY853252-1 rev retrotransposon, LTR, Copia
TREP2016 0.0, complete element, 5bp TSD
AY853252, TREP
Table A5 continued: Annotation of the region co-segregating with the Rrs2 resistance gene on the distal BAC contig. Abbreviations are explained at end of table.

SUPPLEMENTARY MATERIAL 178
position co-segr. region (bp start)
position co-segr.region (bp end)
position contig (bp start)
position contig (bp end)
length [bp]
annotation as in databaseorien-tation
classification database IDe-value/ remarks
source
12,543 14,856 209,113 211,426 2,313 exon 7 – –
14,936 15,731 211,506 212,301 795 exon 6 – –
15,807 16,428 212,377 212,998 621 exon 5 – –
16,466 16,713 213,036 213,283 247 exon 4 – –
18,731 18,815 215,301 215,385 84 exon 3 – –
19,222 19,506 215,792 216,076 284 exon 2 – –
19,703 19,864 216,273 216,434 161
putative gag-pol polyprotein rev
exon 1 – –
RiceGAAS
11,500 11,716 208,070 208,286 217 terminal exon 4 – –
12,050 12,154 208,620 208,724 105
predicted exons
internal exon 3 – –
GeneMark.hmm
16,079 16,302 212,649 212,872 224 Os04g0635300 [Oryza sativa(japonica cultivar-group)]
internal exon 2
16,466 16,630 213,036 213,200 165
rev
initial exon 1
ref|NP_001054006.1
3e-22 GeneMark.hmm, NCBI blastp
11,500 11,683 208,070 208,253 184 terminal exon 5 – –
12,050 12,159 208,620 208,729 110 terminal exon 4 – –
14,379 14,482 210,949 211,052 104
predicted exons
internal exon 3 – –
15,807 16,329 212,377 212,899 523 OSJNBa0011J08.29 [Oryza sativa (japonica cultivar-group)]
internal exon 2 emb|CAE03274.1
3e-46
16,562 16,630 213,132 213,200 69 predicted exons
rev
initial exon 1 – –
GENSCAN, NCBI blastp
Table A5 continued: Annotation of the region co-segregating with the Rrs2 resistance gene on the distal BAC contig. Abbreviations are explained at end of table.

SUPPLEMENTARY MATERIAL 179
position co-segr. region (bp start)
position co-segr. region (bp end)
position contig (bp start)
position contig (bp end)
length [bp]
annotation as in databaseorien-tation
classification database IDe-value/ remarks
source
17,616 17,753 214,186 214,323 138 initial exon 1 – –
18,057 18,129 214,627 214,699 73 internal exon 2 – –
18,559 18,605 215,129 215,175 47
predicted exons
internal exon 3 – –
GeneMark.hmm
19,886 20,098 216,456 216,668 213 flavonol-sulfotransferase [Hordeum vulgare]
for
terminal exon 4 gb|AAY34254.1 1e-35, sulfo-transfer1 superfamily
GeneMark.hmm, NCBI blastp
17,616 17,811 214,186 214,381 196 initial exon 1 – –
17,986 18,107 214,556 214,677 122
predicted exons
internal exon 2 – –
19,886 20,098 216,456 216,668 213 flavonol-sulfotransferase [Hordeum vulgare]
for
terminal exon 3 gb|AAY34254.1 4e-35, sulfo-ransfer1 superfamily
GENSCAN, NCBI blastp
19,871 20,096 216,441 216,666 226 flavonol-sulfotransferase [Hordeum vulgare]
for – gb|AAY34254.1 7e-37 NCBI blastx
19,871 20,112 216,441 216,682 242 homologue to UniRef100_A9UKM5 Cluster: Flavonol-sulfotransferase -Hordeum vulgare
for – TC188981 2.3e-61 HvGI
19,871 20,108 216,591 216,828 238 best hit blastx rice: LOC_Os09g38239.1 CHR09V5|COORD:22013268..22014768| protein flavonol sulfotransferase-like, putative, expressed
– – 7621 e-113 HarvEST
Table A5 continued: Annotation of the region co-segregating with the Rrs2 resistance gene on the distal BAC contig. Abbreviations are explained at end of table.
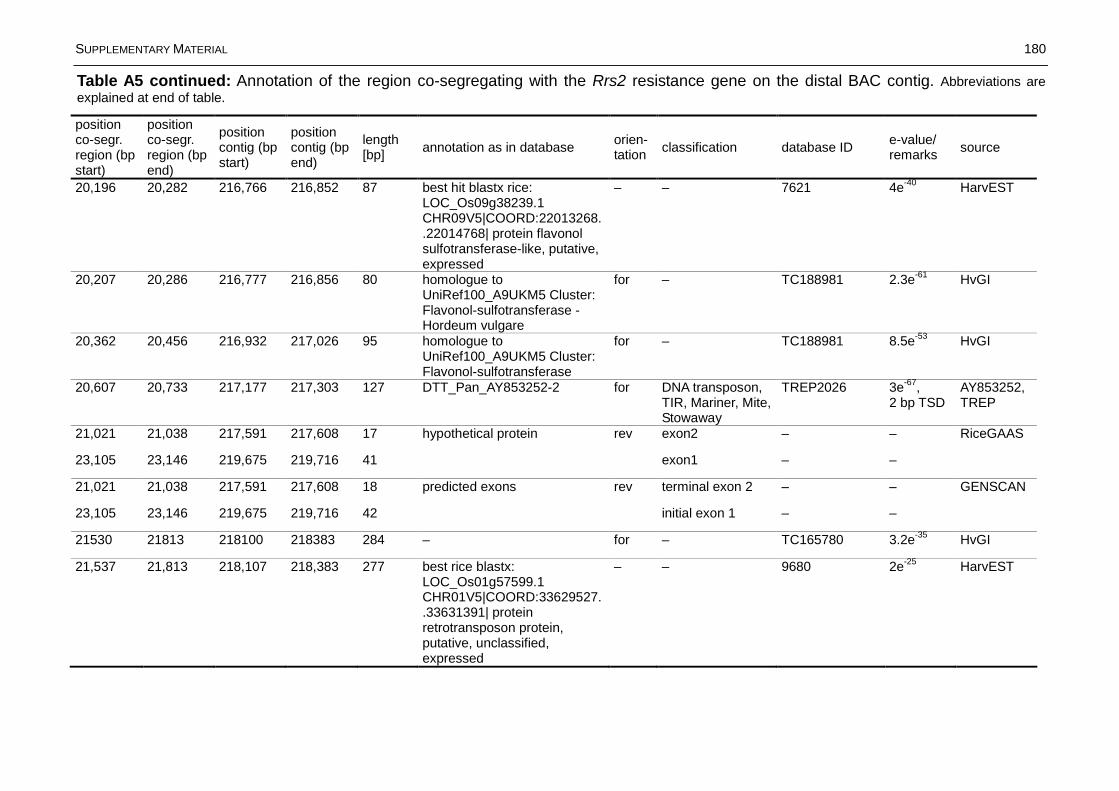
SUPPLEMENTARY MATERIAL 180
position co-segr. region (bp start)
position co-segr. region (bp end)
position contig (bp start)
position contig (bp end)
length [bp]
annotation as in databaseorien-tation
classification database IDe-value/ remarks
source
20,196 20,282 216,766 216,852 87 best hit blastx rice: LOC_Os09g38239.1 CHR09V5|COORD:22013268..22014768| protein flavonol sulfotransferase-like, putative, expressed
– – 7621 4e-40 HarvEST
20,207 20,286 216,777 216,856 80 homologue to UniRef100_A9UKM5 Cluster: Flavonol-sulfotransferase -Hordeum vulgare
for – TC188981 2.3e-61 HvGI
20,362 20,456 216,932 217,026 95 homologue to UniRef100_A9UKM5 Cluster: Flavonol-sulfotransferase
for – TC188981 8.5e-53 HvGI
20,607 20,733 217,177 217,303 127 DTT_Pan_AY853252-2 for DNA transposon, TIR, Mariner, Mite, Stowaway
TREP2026 3e-67, 2 bp TSD
AY853252, TREP
21,021 21,038 217,591 217,608 17 exon2 – –
23,105 23,146 219,675 219,716 41
hypothetical protein rev
exon1 – –
RiceGAAS
21,021 21,038 217,591 217,608 18 terminal exon 2 – –
23,105 23,146 219,675 219,716 42
predicted exons rev
initial exon 1 – –
GENSCAN
21530 21813 218100 218383 284 – for – TC165780 3.2e-35 HvGI
21,537 21,813 218,107 218,383 277 best rice blastx: LOC_Os01g57599.1 CHR01V5|COORD:33629527..33631391| protein retrotransposon protein, putative, unclassified, expressed
– – 9680 2e-25 HarvEST
Table A5 continued: Annotation of the region co-segregating with the Rrs2 resistance gene on the distal BAC contig. Abbreviations are explained at end of table.
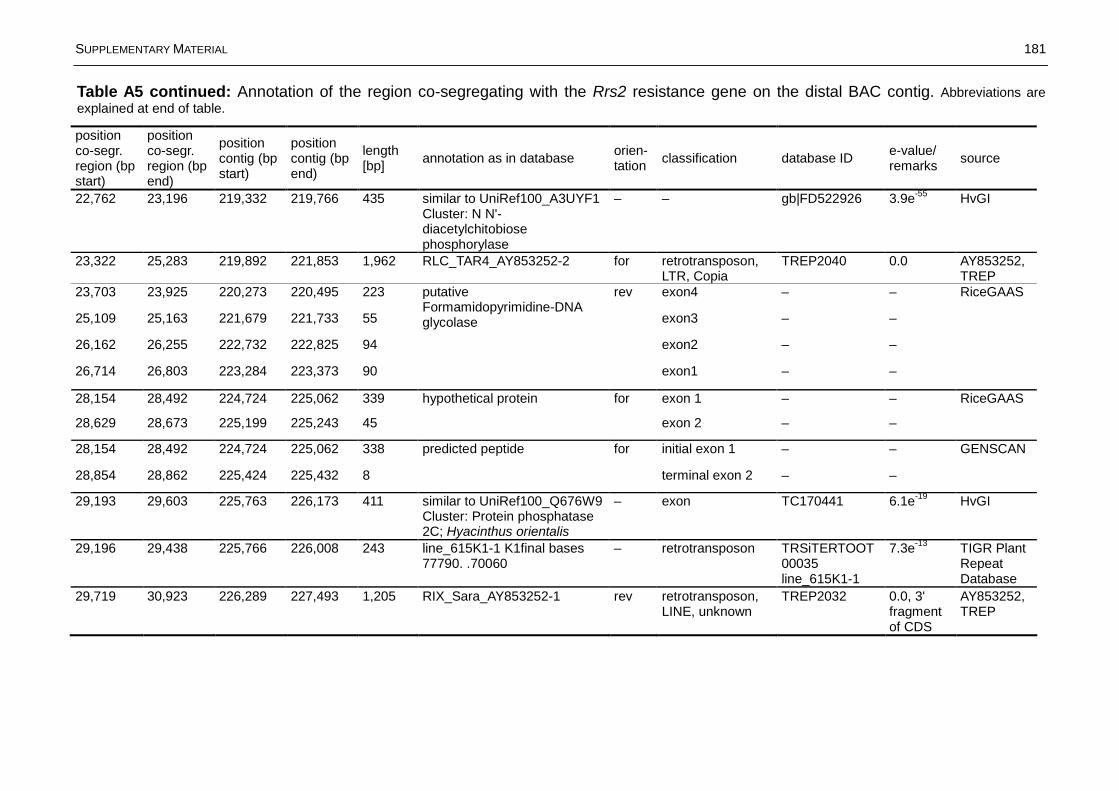
SUPPLEMENTARY MATERIAL 181
position co-segr. region (bp start)
position co-segr. region (bp end)
position contig (bp start)
position contig (bp end)
length [bp]
annotation as in databaseorien-tation
classification database IDe-value/ remarks
source
22,762 23,196 219,332 219,766 435 similar to UniRef100_A3UYF1 Cluster: N N'-diacetylchitobiose phosphorylase
– – gb|FD522926 3.9e-55 HvGI
23,322 25,283 219,892 221,853 1,962 RLC_TAR4_AY853252-2 for retrotransposon, LTR, Copia
TREP2040 0.0 AY853252, TREP
23,703 23,925 220,273 220,495 223 exon4 – –
25,109 25,163 221,679 221,733 55 exon3 – –
26,162 26,255 222,732 222,825 94 exon2 – –
26,714 26,803 223,284 223,373 90
putative Formamidopyrimidine-DNA glycolase
rev
exon1 – –
RiceGAAS
28,154 28,492 224,724 225,062 339 exon 1 – –
28,629 28,673 225,199 225,243 45
hypothetical protein for
exon 2 – –
RiceGAAS
28,154 28,492 224,724 225,062 338 initial exon 1 – – GENSCAN
28,854 28,862 225,424 225,432 8
predicted peptide for
terminal exon 2 – –
29,193 29,603 225,763 226,173 411 similar to UniRef100_Q676W9 Cluster: Protein phosphatase 2C; Hyacinthus orientalis
– exon TC170441 6.1e-19 HvGI
29,196 29,438 225,766 226,008 243 line_615K1-1 K1final bases 77790. .70060
– retrotransposon TRSiTERTOOT00035 line_615K1-1
7.3e-13 TIGR Plant Repeat Database
29,719 30,923 226,289 227,493 1,205 RIX_Sara_AY853252-1 rev retrotransposon, LINE, unknown
TREP2032 0.0, 3' fragment of CDS
AY853252, TREP
Table A5 continued: Annotation of the region co-segregating with the Rrs2 resistance gene on the distal BAC contig. Abbreviations are explained at end of table.

SUPPLEMENTARY MATERIAL 182
position co-segr. region (bp start)
position co-segr. region (bp end)
position contig (bp start)
position contig (bp end)
length [bp]
annotation as in databaseorien-tation
classification database IDe-value/ remarks
source
31,152 31,260 227,722 227,830 109 exon1 – –
33,804 33,853 230,374 230,423 50
putative D-amino acid dehydrogenase, small subunit family protein
for
exon2 – –
RiceGAAS
32,718 32,877 229,288 229,447 160 DTT_Icarus_consensus-1 for DNA transposon, TIR, Mariner, MITE, Stowaway
TREP3092 7E-05 AY853252, TREP
31,152 31,260 227,722 227,830 108 initial exon 1 – –
33,804 33,853 230,374 230,423 49
predicted peptide for
terminal exon 2 – –
GENSCAN
33,842 34,858 230,412 231,428 1,017 XXX_Xanti_AY853252-2 rev transposon, unclassified
TREP2051 0.0 AY853252, TREP
34,943 35,300 231,513 231,870 358 DTT_Fortuna_AY853252-1 for DNA transposon, TIR, Mariner, MITE, Stowaway
TREP2015 0.0, 2 bp TSD
AY853252, TREP
35,585 35,747 232,155 232,317 163 DTT_Thalos_AY853252-4 rev DNA transposon, TIR, Mariner, MITE, Stowaway
TREP2045 6e-27 AY853252, TREP
36,046 36,383 232,616 232,953 338 exon1 – –
36,448 36,463 233,018 233,033 16
hypothetical protein for
exon2 – –
RiceGAAS
36,229 36,383 232,799 232,953 154 initial exon 1 – –
39,241 39,355 235,811 235,925 114
predicted peptide for
terminal exon 2 – –
GENSCAN
36,868 36,988 233,438 233,558 121 exon3 – –
37,072 37,126 233,642 233,696 55 exon2 – –
38,839 38,866 235,409 235,436 28
putative PE_PGRS family protein
rev
exon1 – –
RiceGAAS
Table A5 continued: Annotation of the region co-segregating with the Rrs2 resistance gene on the distal BAC contig. Abbreviations are explained at end of table.

SUPPLEMENTARY MATERIAL 183
position co-segr. region (bp start)
position co-segr. region (bp end)
position contig (bp start)
position contig (bp end)
length [bp]
annotation as in databaseorien-tation
classification database IDe-value/ remarks
source
37,233 37,367 233,803 233,937 135 retrotransposon – retrotransposon protein putative unclassified
gb|BQ465907 2.2e-17 HvGI
39,094 39,131 235,664 235,701 38 exon1 – –
39,172 39,355 235,742 235,925 184
hypothetical protein for
exon2 – –
RiceGAAS
40,014 42,495 236,,584 239,065 2,482 XXX_unnamed_EF540321-2 – TE, class unknown
TREP3285 5e-06 TREP
40,292 40,333 236,862 236,903 42 exon4 – –
40,677 40,758 237,247 237,328 82 exon3 – –
42,826 42,869 239,396 239,439 44 exon2 – –
42,899 42,913 239,469 239,483 15
hypothetical protein rev
exon1 – –
RiceGAAS
36,052 36,300 232,622 232,870 249 predicted exon internal exon 1 – –
43,545 44,835 240,115 241,405 1,291 internal exon 2
44,926 44,960 241,496 241,530 35 internal exon 3
45,060 45,092 241,630 241,662 33
Unigene Os06g0557100 [Oryza sativa (japonica cultivar-group)], putative serine-threonine protein kinase [Oryza sativa]
for
terminal exon 4
ref|NP_001057858.1, dbj|BAD54139
3e-145, LRRNT_2_superfamily, LRR-RI superfamily, COG4886 domain
GeneMark.hmm, NCBI blastp
43,467 45,029 240,037 241,599 1,563 putative leucine-rich repeat family protein / protein kinase family protein
for exon – – RiceGAAS
43,431 43,843 240,001 240,413 413 weakly similar to UniRef100_Q0DBJ9 Cluster: Os06g0557400 protein; Oryza sativa (japonica cultivar-group)
for – TC178518 4.2e-25 HvGI
Table A5 continued: Annotation of the region co-segregating with the Rrs2 resistance gene on the distal BAC contig. Abbreviations are explained at end of table.

SUPPLEMENTARY MATERIAL 184
position co-segr. region (bp start)
position co-segr. region (bp end)
position contig (bp start)
position contig (bp end)
length [bp]
annotation as in databaseorien-tation
classification database IDe-value/ remarks
source
43,552 45,026 240,122 241,596 1,475 Os06g0557100 [Oryza sativa(japonica cultivar-group)], putative serine-threonine protein kinase [Oryza sativa]
for – ref|NP_001057858.1, dbj|BAD54139.1
5e-174 NCBI blastx
43,687 43,890 240,257 240,460 204 best rice blastx: LOC_Os06g36310.1 CHR06V5|COORD:21273557..21271735 |protein receptor-like protein kinase 5 precursor, putative, expressed
– – 23698 4e-19 HarvEST
43,724 44,536 240,294 241,106 813 S. bicolor BTx623 PstI-digested total genomic DNA library Sorghum bicolorgenomic clone pSB0138 contains similarity to protein kinase domains and leucine rich repeats (AAD40144)
– – SRSiOTOT00000015, gi|16960288, gb|BH245278.1
3.7e-69 TIGR Plant Repeat Database
43,467 44,960 240,037 241,530 1,493 initial exon 1
48,005 48,010 244,575 244,580 5
Os06g0557100 [Oryza sativa(japonica cultivar-group)], putative serine-threonine protein kinase [Oryza sativa]
for
terminal exon 2
ref|NP_001057858.1, dbj|BAD54139
2e-161, contains LRR domain
GENSCAN, NCBI blastp
45,898 52,974 242,468 249,544 7,077 RLC_HORPIA2_AF521177-1 rev retrotransposon, LTR, Copia
TREP1162 0.0 TREP
45,893 52,974 242,463 249,544 7,082 RLC_HORPIA2_AY643843-1 rev retrotransposon, LTR, Copia
TREP1639 0.0, 5 bp TSD
TREP
46,623 49,677 243,193 246,247 3,055 RLC_BARE1_B_consensus-1 (Subfamily B);
for retrotransposon, LTR, Copia
TREP3133 0.0 TREP
46,624 49,631 243,194 246,201 3,008 RLC_BARE1_A_consensus-1 (Subfamily A)
for retrotransposon, LTR, Copia
TREP3132 0.0 TREP
Table A5 continued: Annotation of the region co-segregating with the Rrs2 resistance gene on the distal BAC contig. Abbreviations are explained at end of table.

SUPPLEMENTARY MATERIAL 185
position co-segr. region (bp start)
position co-segr. region (bp end)
position contig (bp start)
position contig (bp end)
length [bp]
annotation as in databaseorien-tation
classification database IDe-value/ remarks
source
50,225 50,284 246,795 246,854 60 terminal exon 4 – –
50,392 50,447 246,962 247,017 56
predicted exons
internal exon 3 – –
52,221 52,886 248,791 249,456 666 internal exon 2
53,614 53,842 250,184 250,412 229
hypothetical protein OsJ_018857 [Oryza sativa(japonica cultivar-group)]
rev
initial exon 1
gb|EAZ35374.1 5e-51
GeneMark.hmm, NCBI blastp
50,225 50,296 246,795 246,866 71 terminal exon 2
50,392 51,765 246,962 248,335 1,373
Os09g0473900 [Oryza sativa(japonica cultivar-group)]
rev
initial exon 1
ref|NP_001063453.1, dbj|BAF25367.1
9e-146, contains rve domain
GENSCAN, NCBI blastp
50,396 51,093 246,966 247,663 698 inverted duplication of bp region 249,578 –250,261
– – structural feature
JDotterH
53,001 54,967 249,571 251,537 1,967 RLC_HORPIA2_AY643843-1 for retrotransposon, LTR, Copia
TREP1639 0.0, 5 bp TSD
TREP
53,001 54,584 249,571 250,117 547 RLC_HORPIA2_AF521177-1 for retrotransposon, LTR, Copia
TREP1162 0.0 TREP
53,008 53,691 249,578 250,261 684 inverted duplication of bp region 246966 -247663
– – structural feature
JDotterH
53,053 53,548 249,623 250,118 496 exon1 – –
53,643 54,210 250,213 250,780 568 exon2 – –
54,415 54,789 250,985 251,359 375 exon3 – –
56,118 56,670 252,688 253,240 553
putative pol polyprotein for
exon4 – –
RiceGAAS
52,063 52,886 248,633 249,456 823 terminal exon 2
53,506 53,842 250,076 250,412 336
hypothetical protein OsJ_018857 [Oryza sativa(japonica cultivar-group)]
rev
initial exon 1
gb|EAZ35374.1 2e-52 GENSCAN, NCBI blastp
Table A5 continued: Annotation of the region co-segregating with the Rrs2 resistance gene on the distal BAC contig. Footnote and abbreviations are explained at the end of the table.

SUPPLEMENTARY MATERIAL 186
position co-segr. region (bp start)
position co-segr. region (bp end)
position contig (bp start)
position contig (bp end)
length [bp]
annotation as in databaseorien-tation
classification database IDe-value/ remarks
source
53,957 54,150 250,527 250,720 194 OSJNBa0029L02.7 [Oryza sativa (japonica cultivar-group)]
for initial exon embl|CAE04466.3
2e-08 GeneMark.hmm
55,924 56,770 252,494 253,340 847 putative uncharacterized protein
for exon TC158103 3.5e-186 HvGI
55,925 56,695 252,495 253,265 771 best rice blastx: LOC_Os12g03510.1 CHR12V5|COORD:1392655..1392045| protein pectinesterase inhibitor domain containing protein, expressed
– – 15670 0.0 HarvEST
56,044 56,736 252,614 253,306 693 best rice blastx: LOC_Os12g03510.1 CHR12V5|COORD:1392655..1392045| protein pectinesterase inhibitor domain containing protein, expressed
– – 15671 0.0 HarvEST
56,087 56,398 252,657 252,968 312 hypothetical protein OsI_036113 [Oryza sativa(indica cultivar-group)]
for – gb|EAY82154.1 4e-05 NCBI blastx
56,374 56,548 252,944 253,118 174 initial exon 1
59,254 59,393 255,824 255,963 139
predicted peptide for
terminal exon 2
GENSCAN
57,207 57,437 253,777 254,007 231 SEG_AF356178S Hordeum vulgare chromosome 1H map 1H centromeric region
– – HRSiCMCMOOT00004, gi|19879923, gb|AH011564.1
3.1e-18 TIGR Plant Repeat Database
57,225 57,438 253,795 254,008 214 – for – TC166213 3.4e-22 HvGI
Table A5 continued: Annotation of the region co-segregating with the Rrs2 resistance gene on the distal BAC contig. Abbreviations are explained at end of table.

SUPPLEMENTARY MATERIAL 187
position co-segr. region (bp start)
position co-segr. region (bp end)
position contig (bp start)
position contig (bp end)
length [bp]
annotation as in databaseorien-tation
classification database IDe-value/ remarks
source
57,251 57,415 253,821 253,985 165 Hordeum vulgare subsp. vulgare cDNA clone HT13J19 5-PRIME, mRNA sequence
– – gb|CA015193.1, gb|HT13J19r
1e-38 NCBI blastn (est_others)
57,259 57,415 253,829 253,985 157 DTT_Thalos_BQ472049-1 – DNA transposon, TIR, Mariner, MITE, Stowaway
TREP1158 2e-31 TREP
58,656 59,091 255,226 255,661 436 exon3 – –
59,275 59,381 255,845 255,951 107 exon2 – –
59,628 59,642 256,198 256,212 15
putative Immuno Globulin-like Cell adhesion Molecule family member (igcm-3)
rev
exon1 – –
RiceGAAS
61,259 61,316 257,829 257,886 57 predicted peptide for initial exon 1 – – GENSCAN
61,805 62,313 258,375 258,883 509 RLC_BARE1_B_consensus-1, Subfamily B
for retrotransposon, LTR, Copia
TREP3133 0.0 TREP
61,853 62,313 258,423 258,883 461 RLC_BARE1_A_consensus-1,Subfamily A
for retrotransposon, LTR, Copia
TREP3132 0.0 TREP
for, forwardrev, reverseTSD, target site duplicationthree letter code for transposable elements based on WICKER et al. (2007) and the TREP database (XXX, unknown code for transposable element)A GenBank Acc. No. AY853252B TREP (Triticeae Repeat Sequence Database, http://wheat.pw.usda.gov/ITMI/Repeats/)C GeneMark.hmm (http://exon.gatech.edu/GeneMark/)
D NCBI BLAST server (http://blast.ncbi.nlm.nih.gov/Blast.cgi) E GENSCAN (http://genes.mit.edu/GENSCAN.html)F RiceGAAS (Rice Genome Automated Annotation System, http://ricegaas.dna.affrc.go.jp/G HvGI (DFCI Barley Gene Index, http://compbio.dfci.harvard.edu/tgi/cgi-bin/tgi/gimain.pl?gudb=barley)H JDotter (http://pgrc.ipk-gatersleben.de/jdotter/)
Table A5 continued: Annotation of the region co-segregating with the Rrs2 resistance gene on the distal BAC contig.

SUPPLEMENTARY MATERIAL 188
position contig (bp start) position contig (bp end) annotationorien-tation
classification remarknesting level
1 445 DTC_Donald_M801L24-1 rev CACTA fragment –
446 4,152 RLC_BARE1_B_consensus-1"; Subfamily B
for Retrotransposon, LTR, Copia fragment –
3,870 4,345 134n7_end rev marker BACend? –
4,153 5,535 RLG_Jeli_AY661558-1 for Retrotransposon, LTR, Gypsy fragment –
7,933 8,300 246j13 for marker BACend? –
5,536 11,552 RLG_Sabrina_AF474371-3 for Retrotransposon, LTR, Gypsy 3'fragment –
13,780 14,302 Caspar_2A for CACTA 3' end,TSD=CCA –
14,376 15,212 high-affinity zinc uptake system membrane protein ZnuB
– gene identified in this work, shown to be expressed
–
17,500 17,983 Caspar_3A for CACTA 3' end,TSD=GCA –
23,193 23,900 HP_1 for gene hypothetical protein
–
29,232 34,507 DTC_Donald_AY853252-2 ref DNA transposon, TIR, CACTA TSD –
37,248 37,247 Gap_1 for gap 100 x N –
37,248 37,665 RLC_HORPIA2_AF427791-1 for Retrotransposon, LTR, Copia 3'fragment –
37,666 37,765 Gap_2 for gap 100 x N –
37,766 41,655 RLC_HORPIA2_AF427791-1 for Retrotransposon, LTR, Copia 3'fragment –
42,165 43,750 Artem_1A rev unclassified fragment –
46,964 51,332 RLC_Elena_AY853252-1 rev Retrotransposon, LTR, Copia TSD –
51,664 51,810 DTT_Oleus_AY853252-5 for DNA transposon, TIR, Mariner TSD –
53,013 53,130 DTT_Icarus_BE517313-1 for DNA transposon, TIR, Mariner TSD –
53,173 62,027 RLC_BARE1_AY853252-1 for Retrotransposon, LTR, Copia TSD –
Table A6: Annotation of the proximal BAC contig, performed by Thomas Wicker (Institute of Plant Biology, University of Zürich, Switzerland). Annotation results were updated according to WICKER et al. (2007) and the Triticeae Repeat Sequence Database (TREP, http://wheat.pw.usda.gov/ITMI/Repeats/)

SUPPLEMENTARY MATERIAL 189
position contig (bp start) position contig (bp end) annotationorien-tation
classification remarknesting level
65,536 65,695 DTT_Thalos_AY853252-11 rev DNA transposon, TIR, Mariner (CA-TA TSD) –
67,264 67,377 DTT_Thalos_AY853252-12 rev DNA transposon, TIR, Mariner 5' fragment –
67,645 67,652 TATA for TATA putative TATA-box
–
67,701 67,801 KAO_UTR_1 for UTR 5' UTR –
67,802 68,040 KAO_1.1 for gene exon 1 –
69,998 70,754 KAO_1.2 for gene exon 2 –
70,853 70,942 KAO_1.3 for gene exon 3 –
71,087 71,165 KAO_1.4 for gene exon 4 –
71,289 71,395 KAO_1.5 for gene exon 5 –
71,511 71,632 KAO_1.6 for gene exon 6 –
71,739 71,844 KAO_1.7 for gene exon 7 –
71,845 72,087 KAO_UTR_1 for UTR 3' UTR –
72,180 72,185 Poly_A for poly_A poly_A signal –
74,133 74,281 DTT_Thalos_AY853252-13 rev DNA transposon, TIR, Mariner (TA-CG TSD) –
75,853 75,989 HVEYA_1_UTR for UTR exon 1 –
76,685 76,937 HVEYA_1_UTR for UTR exon 2 –
76,692 76,937 HVEYA_1.1 for gene exon 2 –
77,133 77,300 HVEYA_1.2 for gene exon 3 –
78,318 78,402 HVEYA_1.3 for gene exon 4 –
78,996 79,151 HVEYA_1.4 for gene exon 5 –
79,273 79,523 HVEYA_1.5 for gene exon 6 –
79,524 79,911 HVEYA_1_3'UTR for UTR 3'UTR –
Table A6 continued: Annotation of the proximal BAC contig, performed by Thomas Wicker (Institute of Plant Biology, University of Zürich, Switzerland). Annotation results were updated according to WICKER et al. (2007) and the Triticeae Repeat Sequence Database (TREP, http://wheat.pw.usda.gov/ITMI/Repeats/)

SUPPLEMENTARY MATERIAL 190
position contig (bp start) position contig (bp end) annotationorien-tation
classification remarknesting level
79,769 80,834 XXX_Xajek_AY853252-5 for Unclassified – –
80,835 81,204 XXX_Xajek_AY853252-2 for Unclassified – 1
81,205 90,125 DTM_HORMU2_AY853252-1 rev DNA transposon, TIR, Mutator (9 bp TSD) 2
90,126 91,492 XXX_Xajek_AY853252-2 for Unclassified – 1
91,494 91,513 Thalos_4A rev MITE fragment 2
91,518 91,682 DTT_Thalos_AY853252-5 rev DNA transposon, TIR, Mariner (TSD) 2
91,685 91,807 XXX_Xajek_AY853252-2 for Unclassified – 1
91,808 94,928 RLC_TAR2_AY853252-1 for Retrotransposon, LTR, Copia 3' fragment? 2
94,929 102,918 RLG_Sabrina_AY853252-4 for Retrotransposon, LTR, Gypsy end truncated? 3
102,919 105,446 RLC_TAR2_AY853252-1 for Retrotransposon, LTR, Copia 3' fragment? 2
105,447 105,463 XXX_Xajek_AY853252-2 for Unclassified – 1
105,462 110,611 DTC_Clifford_AY853252-12 for DNA transposon, TIR, CACTA (TSD) 2
110,639 118,156 DTC_Balduin_AY853252-1 rev DNA transposon, TIR, CACTA (TSD) 3
118,157 119,963 BARE_2 rev copia solo-LTR (TSD) 4
119,964 122,476 DTC_Balduin_AY853252-1 rev DNA transposon, TIR, CACTA (TSD) 3
122,477 128,690 DTC_Clifford_AY853252-12 for DNA transposon, TIR, CACTA (TSD) 2
128,691 131,176 XXX_Xajek_AY853252-2 for unclassified – 1
131,177 131,749 XXX_Xajek_AY853252-1 for unclassified – –
131,750 132,024 DTH_Islay_AY853252-1 rev DNA transposon, TIR, Harbinger (3 bp TSD) 1
132,025 132,576 XXX_Xajek_AY853252-1 for unclassified – –
Table A6 continued: Annotation of the proximal BAC contig, performed by Thomas Wicker (Institute of Plant Biology, University of Zürich, Switzerland). Annotation results were updated according to WICKER et al. (2007) and the Triticeae Repeat Sequence Database (TREP, http://wheat.pw.usda.gov/ITMI/Repeats/)

SUPPLEMENTARY MATERIAL 191
position contig (bp start) position contig (bp end) annotationorien-tation
classification remarknesting level
132,577 132,737 DTT_Thalos_AY853252-6 rev DNA transposon, TIR, Mariner (TSD) 1
132,738 132,952 XXX_Xajek_AY853252-1 for unclassified – –
133,910 137,307 RIX_Karin_AY853252-1 for Retrotransposon, LINE partial CDS –
137,450 139,253 DTC_Clifford_AY853252-13 for DNA transposon, TIR, CACTA 3' fragment –
141,565 143,889 XXX_Xajek_AY853252-2 for unclassified – –
144,476 144,638 DTT_Thalos_AY853252-7 rev DNA transposon, TIR, Mariner (TSD) –
144,881 147,954 RLC_Elena_AY853252-2 rev Retrotransposon, LTR, Copia (TSD) –
147,955 155,810 DTC_Dagobert_AY853252-1 for DNA transposon, TIR, CACTA (TSD) 1
155,811 156,772 RLC_Elena_AY853252-2 rev Retrotransposon, LTR, Copia (TSD) –
159,281 161,411 RLC_TAR2_AY853252-2 for Retrotransposon, LTR, Copia fragment? –
162,265 162,519 XXX_Xajek_AY853252-3 for Unclassified – –
162,520 170,809 DTC_Donald_AY853252-11 for DNA transposon, TIR, CACTA (TSD) 1
170,810 171,325 XXX_Xajek_AY853252-3 for unclassified – –
171,326 172,087 DTC_Clifford_AY853252-14 for DNA transposon, TIR, CACTA 5' fragment –
172,088 172,911 RLG_WHAM_AY853252-1 for Retrotransposon, LTR, Gypsy (5 bp TSD) 1
172,912 181,314 RLC_BARE1_AY853252-3 for Retrotransposon, LTR, Copia (TSD) 2
181,315 181,927 RLG_WHAM_AY853252-1 for Retrotransposon, LTR, Gypsy (5 bp TSD) 1
181,928 183,819 DTC_Clifford_AY853252-14 for DNA transposon, TIR, CACTA 5' fragment –
185,328 187,443 RLC_BARE1_AY853252-4 for Retrotransposon, LTR, Copia fragment –
189,266 189,966 RLC_Hilda_AY853252-1 rev Retrotransposon, LTR, Copia fragment of CDS –
191,062 192,581 RLG_BAGY1_AY853252-1 rev Retrotransposon, LTR, Gypsy 5' fragment –
Table A6 continued: Annotation of the proximal BAC contig, performed by Thomas Wicker (Institute of Plant Biology, University of Zürich, Switzerland). Annotation results were updated according to WICKER et al. (2007) and the Triticeae Repeat Sequence Database (TREP, http://wheat.pw.usda.gov/ITMI/Repeats/)

SUPPLEMENTARY MATERIAL 192
position contig (bp start) position contig (bp end) annotationorien-tation
classification remarknesting level
193,965 194,252 DTH_Kerberos_AY853252-1 rev DNA transposon, TIR, Harbinger (3 bp TSD) –
194,971 196,381 XXX_Xajek_AY853252-4 for unclassified – –
196,382 199,090 DTC_Gaston_AY853252-9 rev DNA transposon, TIR, CACTA (TSD) 1
199,091 199,548 XXX_Xajek_AY853252-4 for unclassified – –
199,968 200,459 RLG_Derami_AY368673-1 rev Retrotransposon, LTR, Gypsy fragment –
200,634 200,950 DTC_Sherlock_AY853252-2 rev DNA transposon, TIR, CACTA 3'end –
201,607 201,703 DTT_Hades_AY853252-1 for DNA transposon, TIR, Mariner (TSD) –
202,261 207,873 RLC_Ikeros_AY853252-2 rev Retrotransposon, LTR, Copia 3' fragment? –
208,124 208,323 HVLEA_1 rev UTR 3' UTR –
208,324 208,677 HVLEA_1 rev gene embryogenic protein LEA
–
208,678 208,773 HVLEA_1 rev UTR 5' UTR –
208,807 208,814 TATA rev TATA putative TATA-Box
–
214,815 215,528 PUT_1 rev gene gene? –
215,771 215,886 Thalos_8A rev MITE 3' fragment –
216,037 216,199 DTT_Thalos_AY853252-9 rev DNA transposon, TIR, Mariner (TSD) –
221,274 222,128 RLC_Lena_AY853252-1 rev Retrotransposon, LTR, Copia internal domain CDS
–
222,677 222,847 Anna_2A for copia fragment –
222,848 229,986 RLC_Anna_AY853252-1 for Retrotransposon, LTR, Copia ends truncated? –
236,446 236,714 DTT_Orion_AY853252-2 for DNA transposon, TIR, Mariner degenerated –
Table A6 continued: Annotation of the proximal BAC contig, performed by Thomas Wicker (Institute of Plant Biology, University of Zürich, Switzerland). Annotation results were updated according to WICKER et al. (2007) and the Triticeae Repeat Sequence Database (TREP, http://wheat.pw.usda.gov/ITMI/Repeats/)
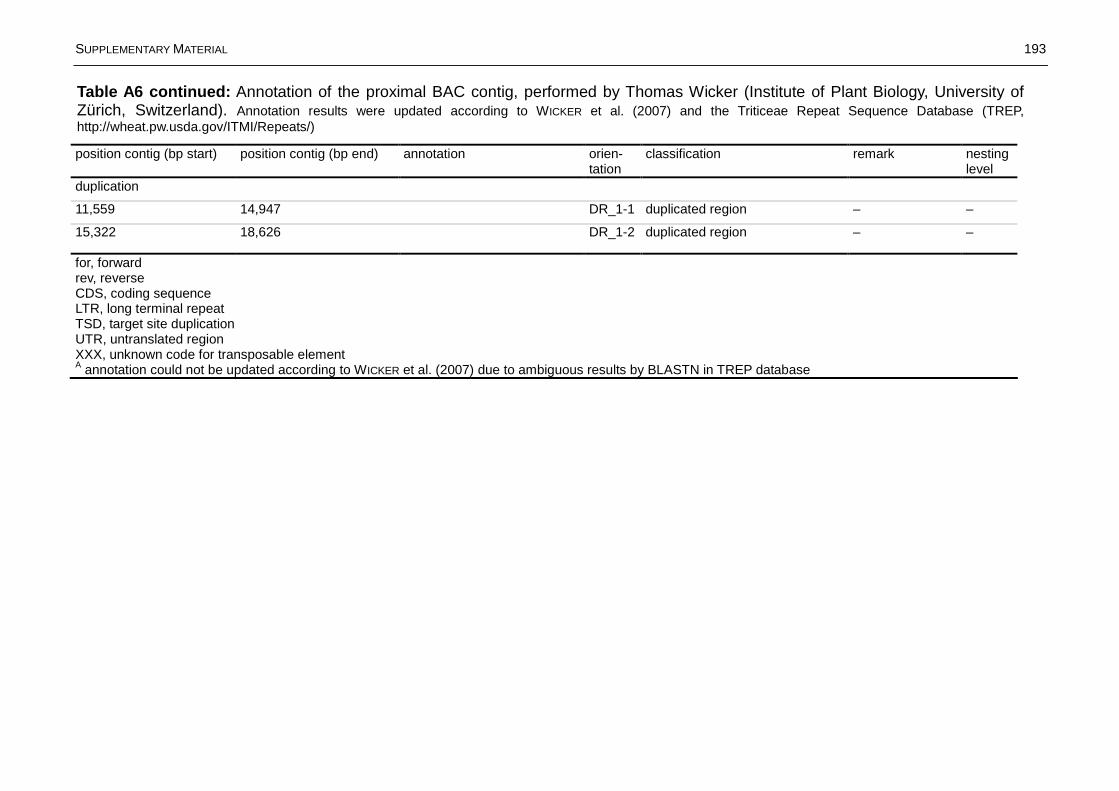
SUPPLEMENTARY MATERIAL 193
position contig (bp start) position contig (bp end) annotation orien-tation
classification remark nesting level
duplication
11,559 14,947 DR_1-1 duplicated region – –
15,322 18,626 DR_1-2 duplicated region – –
for, forwardrev, reverse CDS, coding sequenceLTR, long terminal repeatTSD, target site duplication UTR, untranslated regionXXX, unknown code for transposable elementA annotation could not be updated according to WICKER et al. (2007) due to ambiguous results by BLASTN in TREP database
Table A6 continued: Annotation of the proximal BAC contig, performed by Thomas Wicker (Institute of Plant Biology, University of Zürich, Switzerland). Annotation results were updated according to WICKER et al. (2007) and the Triticeae Repeat Sequence Database (TREP, http://wheat.pw.usda.gov/ITMI/Repeats/)

SUPPLEMENTARY MATERIAL 194
position right contig(bp start)
position right contig(bp start)
length [bp]
orien-tation
gene name
annotation barley gene/marker
remarksorthologous rice gene
orien-tation of rice gene
annotation rice gene
rice chromosome, bp position of rice gene
e-value
14,496 15,110 615 – HvZUS high-affinity zinc uptake system membrane protein
region of markers A-EST_2_SNP,134N7_con5-3
– – – – –
22,096 23,791 1,696 for HvHYP-2
hypothetical protein
– LOC_Os12g01250 for unspliced-genomic csAtPR5, putative
Os12, 147,185 – 152,390
2.4e-11
67,802 71,844 4,043 complete gene 1.5e-186
67,802 68,040 239 exon1 8.2e-24
69,998 70,754 757 exon2 2.9e-101
70,853 70,942 90 exon3 9.0e-07
71,087 71,165 79 exon4 2.6e-06
71,289 71,395 107 exon5 5.0e-11
71,511 71,632 122 exon6 3.6e-11
71,739 71,844 106
for HvKAO ent-kaurenoic acid oxidase-1
exon7
LOC_Os06g02019 for unspliced-genomic cytochrome P450 88A1, putative, expressed
Os6, 579,736 – 585,105
2.1e-07
76,692 79,523 2,832 complete gene 1.4e-133
76,692 76,937 246 exon1 2.7e-23
77,133 77,300 168 exon2 3.0e-23
78,318 78,402 85 exon3 1.7e-08
78,996 79,151 156 exon4 2.7e-19
79,273 79,523 251
for HvEYA eyes absent homolog
exon5
LOC_Os06g02028 for unspliced-genomic eyes absent homolog 4, putative expressed
Os6, 587,160 – 590,629
8.7e-28
Table A7: Comparison of synteny between the proximal barley BAC contig of the Rrs2 region and rice (Oryza sativa). Abbreviations: for = forward, rev = reverse.
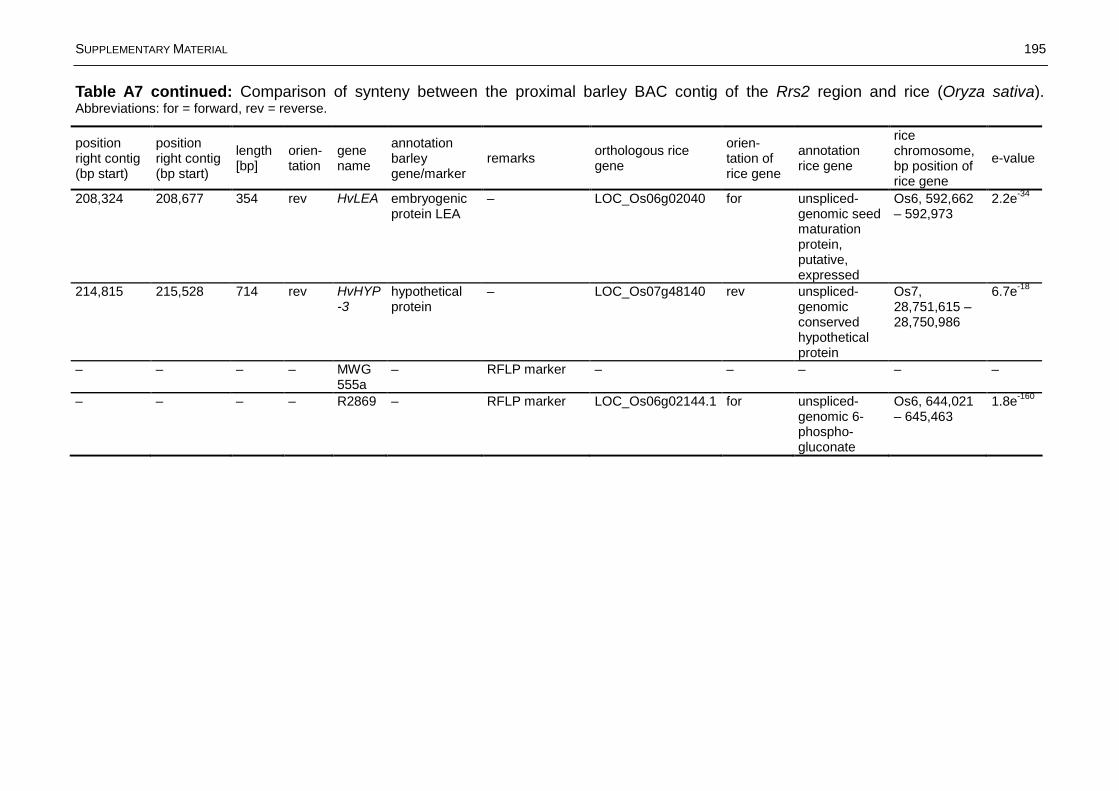
SUPPLEMENTARY MATERIAL 195
position right contig(bp start)
position right contig(bp start)
length [bp]
orien-tation
gene name
annotation barley gene/marker
remarksorthologous rice gene
orien-tation of rice gene
annotation rice gene
rice chromosome, bp position of rice gene
e-value
208,324 208,677 354 rev HvLEA embryogenic protein LEA
– LOC_Os06g02040 for unspliced-genomic seed maturation protein, putative, expressed
Os6, 592,662 – 592,973
2.2e-34
214,815 215,528 714 rev HvHYP-3
hypothetical protein
– LOC_Os07g48140 rev unspliced-genomic conservedhypothetical protein
Os7, 28,751,615 –28,750,986
6.7e-18
– – – – MWG 555a
– RFLP marker – – – – –
– – – – R2869 – RFLP marker LOC_Os06g02144.1 for unspliced-genomic 6-phospho-gluconate
Os6, 644,021 – 645,463
1.8e-160
Table A7 continued: Comparison of synteny between the proximal barley BAC contig of the Rrs2 region and rice (Oryza sativa). Abbreviations: for = forward, rev = reverse.

SUPPLEMENTARY MATERIAL 196
position left contig(bp start)
position left contig(bp start)
length [bp]
orien-tation
gene/ marker name
annotation barley gene/marker
remarksorthologous rice gene
orien-tation of rice gene
annotation rice gene
rice chromosome, bp position of rice gene
e-value
– – 400 – PSR119 ferredoxin-NADP(H) oxidoreductase
RFLP marker
LOC_Os06g01850 rev unspliced-genomic ferredoxin--NADP reductase, leaf isozyme, chloroplast precursor, putative, expressed
Os6, 480,523 – 478,424
1.6e-48
– – 716 – Xba6 – RFLP marker
LOC_Os06g01972 for unspliced-genomic nodulin-like protein, putative, expressed
Os6, 545,567 – 549,104
1.1e-131
1 2,919 2,919 rev HvRGH-1
NBS-LRR resistance-like protein
– LOC_Os04g02520 rev unspliced-genomic Leucine Rich Repeat family protein
Os4, 920,506 – 912,253
7.0e-67
37,016 37,516 501 exon 1 8.6e-70
38,011 38,190 180
for HvPGM-1
beta-phosphogluco-mutase exon 2
LOC_Os06g01990 rev unspliced-genomic phosphoglycolate phosphatase
Os6, 555,548 – 554,637
2.2e-09
46,113 47,305 1,193 exon 1 LOC_Os12g38090 rev unspliced-genomic F-box domain containing protein
Os12, 23,361,839 –23,360,442
3.2e-17
47,564 47,570 7
for HvFBX-1
F-box like protein
exon 2 – – – – –
55,973 56,067 95 exon 1 – – – – –
56,984 58,247 1,264
for HvCYP cytochrome P450 exon 2 LOC_Os08g16320 rev unspliced-genomic
cytochrome P450 86A1, putative
Os8, 9,954,132 –9,952,630
2.6e-86
62,988 62,994 7 exon 1 – – – – –
63,253 64,445 1,193
rev HvFBX-2
F-box like protein
exon 2 LOC_Os12g38090 rev unspliced-genomic F-box domain containing protein
Os12, 23,361,839 –23,360,442
3.2e-17
Table A8: Comparison of synteny between the distal barley BAC contig of the Rrs2 region and rice (Oryza sativa). Abbreviations: for = forward, rev = reverse.

SUPPLEMENTARY MATERIAL 197
position left contig(bp start)
position left contig(bp start)
length [bp]
orien-tation
gene name
annotation barley gene/marker
remarksorthologous rice gene
orien-tation of rice gene
annotation rice gene
rice chromosome, bp position of rice gene
e-value
67,587 67,766 180 exon 1 2.2e-09
68,261 68,761 501rev HvPGM-
2beta-phosphogluco-mutase
exon 2LOC_Os06g01990 rev unspliced-genomic
phosphoglycolate phosphatase
Os6, 555,548 – 554,637 8.6e-70
84,320 85375 1,056 for HvPUQ polyubiquitin – LOC_Os02g06640 rev unspliced-genomic polyubiquitin containing 7 ubiquitin monomers
Os2, 3,342,015 –3,340,642
4.4e-49
108,569 110,483 1,915 exon 1 LOC_Os11g11790 rev unspliced-genomic expressed protein
Os11, 6,539,811 –6,537,769
9.4e-64
110,856 112,078 1,223
rev HvRGH-2
NBS-LRR resistance-like protein
exon 2 LOC_Os11g45930 for NB-ARC domain containing protein, expressed
Os11, 27,287,029 –27,290,569
2.2e-14
125,244 126,019 776 exon 1 LOC_Os11g45750 rev unspliced-genomic NBS-LRR disease resistance protein
Os11, 27,183,228 –27,177,575
1.6e-14
126,947 129,764 2,818
for HvRGH-3
NBS-LRR resistance-like protein
exon 2 LOC_Os05g40150 rev unspliced-genomic RGH2A, putative, expressed
Os5, 23,502,194 –23,498,045
5.4e-166
194,549 196,317 1,769 for HvFST-1
flavonol-sulfotransferase
– LOC_Os09g38239 for unspliced-genomic flavonol sulfotransferase-like, putative, expressed
Os9, 22,013,332 –22,014,489
2.4e-25
200,691 201,126 436 rev HvETF putative electron transfer flavoprotein subunit beta
exon LOC_Os04g10400 rev unspliced-genomic electron transfer flavoprotein beta-subunit, putative, expressed
Os04, 5,620,408 –5,616,858
7.1e-28
Table A8 continued: Comparison of synteny between the distal barley BAC contig of the Rrs2 region and rice (Oryza sativa). Abbreviations: for = forward, rev = reverse.

SUPPLEMENTARY MATERIAL 198
position left contig(bp start)
position left contig(bp start)
length [bp]
orien-tation
gene name
annotation barley gene/marker
remarksorthologous rice gene
orien-tation of rice gene
annotation rice gene
rice chromosome, bp position of rice gene
e-value
201,369 202,334 966 for HvFST-2
flavonol-sulfotransferase
– LOC_Os09g38239 for unspliced-genomic flavonol sulfotransferase-like, putative, expressed
Os9, 22,013,332 –22,014,489
1.1e-77
240,037 241,599 1,563 – HvRLK putative leucine-rich repeat family protein / protein kinase family protein
– LOC_Os06g36270 for unspliced-genomic receptor-like protein kinase 5 precursor, putative, expressed
Os6, 21,254,314 –21,257,605
1.2e-152
252,494 253,340 847 – HvPEI-1 pectinase inhibitor domain containing protein
– – – – – –
– – 809 – HvHYP-1
predicted protein
HarvEST unigene #2643
– – – – –
– – 839 – HvPEI-2 pectinase inhibitor domain containing protein
HarvEST unigene #1552
– – – – –
– – 1,053 HvGSY -1,3-glucan synthase
HarvEST unigene #2649
LOC_Os06g02260 rev callose synthase, putative, expressed
Os6, 728,511 – 724,296
5.7e-66
Table A8 continued: Comparison of synteny between the distal barley BAC contig of the Rrs2 region and rice (Oryza sativa). Abbreviations: for = forward, rev = reverse.

SUPPLEMENTARY MATERIAL 199
position right contig(bp start)
position right contig(bp start)
length [bp]
orien-tation
gene/ marker name
annotation barley gene/marker remarksorthologous Brachypodium gene
Brachypodiumcontig, bp position
e-value
– – 400 bp - PSR119 ferredoxin-NADP(H) oxidoreductase RFLP marker
super1.1752 super1, 11,129,999 –11,130,073
5e-25
– – 716 bp - Xba6 – RFLP marker
super8.1175 super8, 7,670,415 –7,670,467
1e-11
1 2,919 2,919 rev HvRGH-1 NBS-LRR resistance-like protein – super3.4098 super3, 26,085,738 –26,086,056
4e-24
37,016 37,516 501 beta-phosphogluco-mutase exon 1 super1.1730 super1, 11,015,833 –11,016,093
3e-45
38,011 38,190 180
for HvPGM-1
exon 2 – – –
46,113 47,305 1,193 exon 1 – – –
47,564 47,570 7
for HvFBX-1 F-box like protein
exon 2 – – –
55,973 56,067 95 exon 1 – – –
56,984 58,247 1,264
for HvCYP cytochrome P450
exon 2 super1.5269 super1, 33,796,483 –33,796,543
5e-09
62,988 62,994 7 exon 1 – – –
63,253 64,445 1,193
rev HvFBX-2 F-box like protein
exon 2 – – –
67,587 67,766 180 exon 1 – – –
68,261 68,761 501
rev HvPGM-2 beta-phosphogluco-mutase
exon 2 super1.730 super1, 11,015,833 –11,016,093
3e-45
84,320 85,375 1,056 for HvPUQ polyubiquitin – super3.1451 super3, 9,206,572 –9,206,649
3e-07
Table A9: Comparison of synteny between the distal barley BAC contig of the Rrs2 region and Brachypodium distachyon. Abbreviations: for = forward, rev = reverse.

SUPPLEMENTARY MATERIAL 200
position right contig(bp start)
position right contig(bp start)
length [bp]orien-tation
gene name
annotation barley gene/marker remarksorthologous Brachypodium gene
Brachypodiumcontig, bp position
e-value
108,569 110,483 1,915 exon 1 super8.399 super8, 2,642,331 –2,642,416
1e-16
110,856 112,078 1,223
rev HvRGH-2 NBS-LRR resistance-like protein
exon 2 – – –
125,244 126,019 776 exon 1 super6.1239 super6, 7,958,839 –7,959,006
2e-13
126,947 129,764 2,818
for HvRGH-3 NBS-LRR resistance-like protein
exon 2 super6.1247 super6, 8,001,160 –8,001,101
8e-53
194,549 196,317 1,769 for HvFST-1 flavonol-sulfotransferase – super2.2415 super2, 15,582,086 – 15,582,139
4e-07
200,691 201,126 436 rev HvETF putative electron transfer flavoprotein subunit beta
exon super5.683 super5, 3,767,390 –3,767,546
1e-47
201,369 202,334 966 for HvFST-2 flavonol-sulfotransferase – super2.2427 super2, 15,658,821 – 15,658,880
2e-29
240,037 241,599 1,563 – HvRLK putative leucine-rich repeat family protein / protein kinase family protein
– super0.788 super0, 4,704,189 –4,704,456
7e-49
252,494 253,340 847 – HvPEI-1 pectinase inhibitor domain containing protein
– – – –
– – 809 – HvHYP-1 predicted protein HarvEST unigene #2643
– – –
– – 839 – HvPEI-2 pectinase inhibitor domain containing protein
HarvEST unigene #1552
– – –
– – 1,053 – HvGSY -1,3-glucan synthase HarvEST unigene #2649
super1.1722 super1, 10,919,832 – 10,919,596
1e-73
Table A9 continued: Comparison of synteny between the distal barley BAC contig of the Rrs2 region and Brachypodium distachyon. Abbreviations: for = forward, rev = reverse.

SUPPLEMENTARY MATERIAL 201
position right contig(bp start)
position right contig(bp start)
length [bp]
orien-tation
gene/ markername
annotation barley gene/marker remarksorthologous Brachypodium gene
Brachypodiumcontig, bp position
e-value
14,496 15,110 615 – ZUS-1 high-affinity zinc uptake system membrane protein
region of markers A-EST, 134N7_con5-3
– – –
22,096 23,791 1696 for HYP-1 hypothetical protein – super7.1046 super7, 5,953,795 –5,95,3865
2e-12
67,802 71,844 4,043 complete gene 3e-47
67,802 68,040 239 exon1 3e-47
69,998 70,754 757 exon2 8e-47
70,853 70,942 90 exon3 7e-11
71,087 71,165 79 exon4 3e-47
71,289 71,395 107 exon5 5e-34
71,511 71,632 122 exon6 6e-34
71,739 71,844 106
for KAO-1 ent-kaurenoic acid oxidase-1
exon7
super0.2031 super0, 12,737,574 – 12,737,393
7e-24
76,692 79,523 2,832 complete gene 9e-65
76,692 76,937 246 exon1 2e-60
77,133 77,300 168 exon2 1e-54
78,318 78,402 85 exon3 2e-29
78,996 79,151 156 exon4 1e-44
79,273 79,523 251
for EYA-1 eyes absent homolog
exon5
super1.1723 super1, 10,954,869 – 10,955,131
2e-44
208,324 208,677 354 rev LEA-1 embryogenic protein LEA – super1.724 super1, 10,959,726-10,959,961
5e-40
214,815 215,528 714 rev HYP-2 hypothetical protein – – – –
– – – – MWG 555a
– RFLP marker – – –
– – – – R2869 – RFLP marker super1.1480 super1, 9,521,596 –9,522,080
0.0
Table A10: Comparison of synteny between the proximal barley BAC contig of the Rrs2 region and Brachypodium distachyon. Abbreviations: for = forward, rev = reverse.
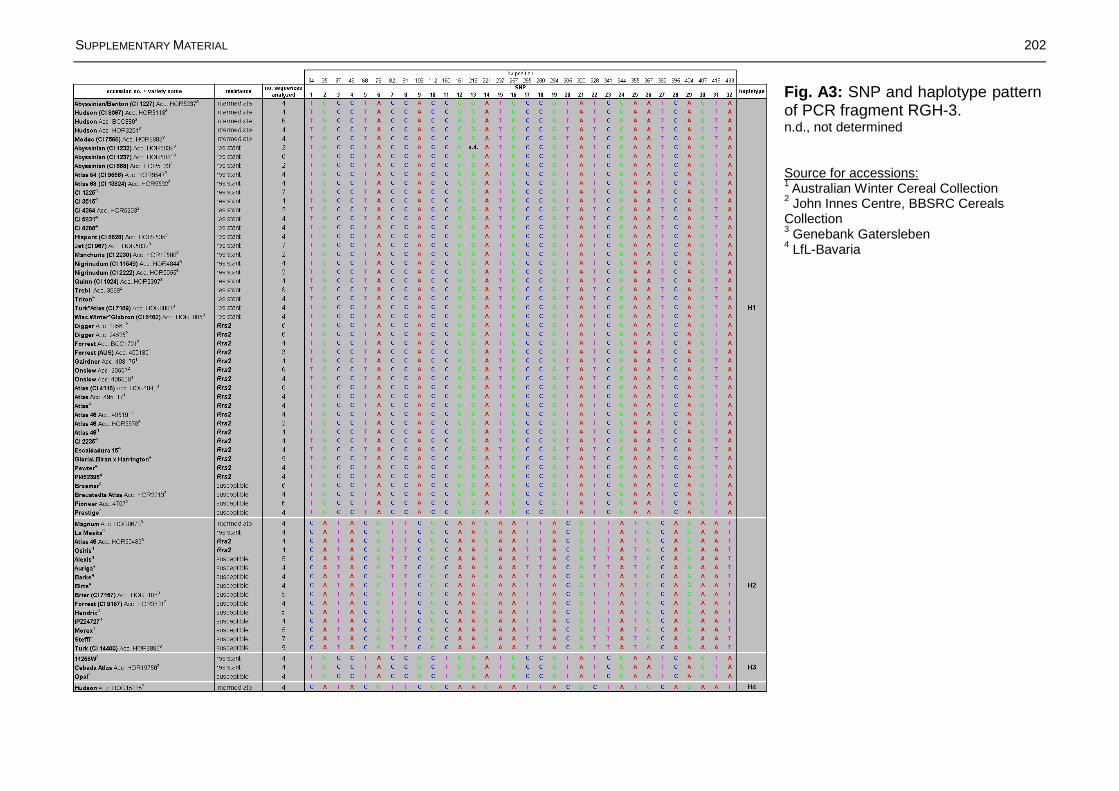
SUPPLEMENTARY MATERIAL 202
Fig. A3: SNP and haplotype pattern of PCR fragment RGH-3.n.d., not determined
Source for accessions:1 Australian Winter Cereal Collection2 John Innes Centre, BBSRC Cereals Collection3 Genebank Gatersleben4 LfL-Bavaria

SUPPLEMENTARY MATERIAL 203
Source for accessions:1 Australian Winter Cereal Collection2 John Innes Centre, BBSRC Cereals Collection3 Genebank Gatersleben4 LfL-Bavaria
Significant associations with Rrs2 phenotype:*p<0.00007 (after Bonferroni correction)
Fig. A4: SNP and haplotype pattern of PCR fragment Put_acri_res_gene_7H.
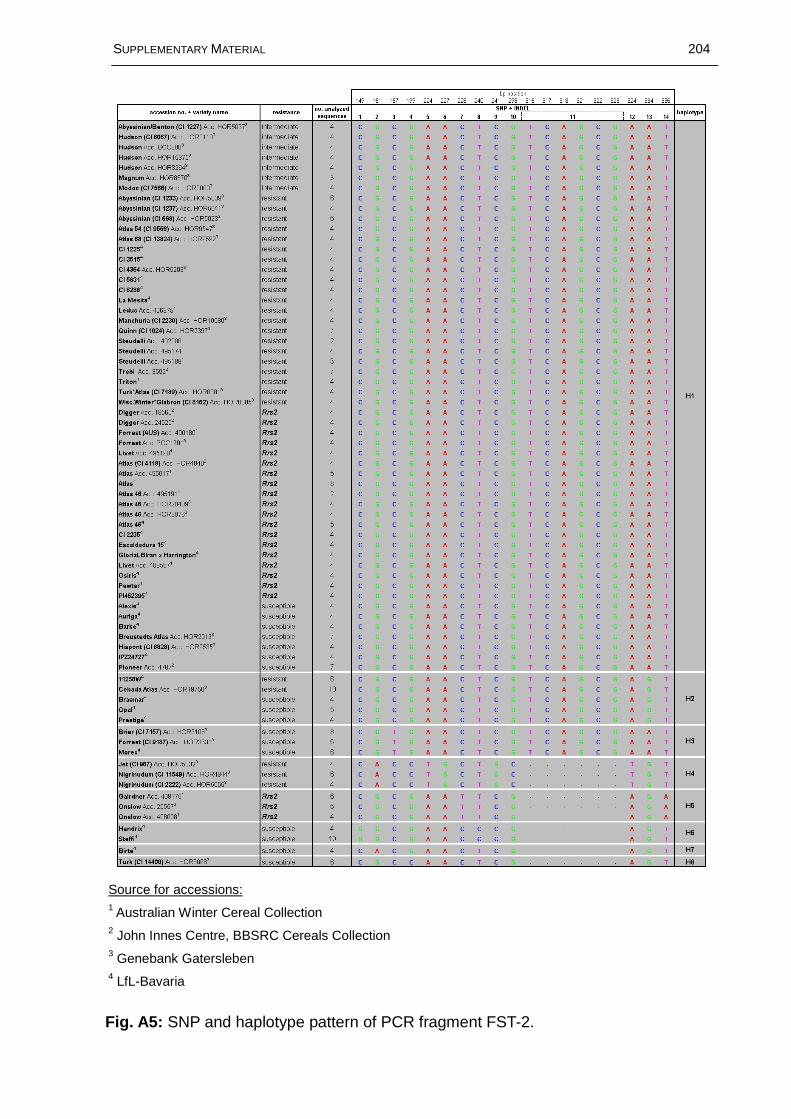
SUPPLEMENTARY MATERIAL 204
Source for accessions:1 Australian Winter Cereal Collection2 John Innes Centre, BBSRC Cereals Collection3 Genebank Gatersleben4 LfL-Bavaria
Fig. A5: SNP and haplotype pattern of PCR fragment FST-2.

SUPPLEMENTARY MATERIAL 205
Source for accessions:1 Australian Winter Cereal Collection2 John Innes Centre, BBSRC Cereals Collection3 Genebank Gatersleben4 LfL-Bavaria
Significant associations with Rrs2 phenotype:
*p<0.00007 (after Bonferroni correction)
Fig. A6: SNP and haplotype pattern of PCR fragment668A17_g1-3.

SUPPLEMENTARY MATERIAL 206
Source for accessions:1 Australian Winter Cereal Collection2 John Innes Centre, BBSRC Cereals Collection3 Genebank Gatersleben4 LfL-Bavaria
n.d., not determined
Significant associations with Rrs2 phenotype:
*p<0.00007 (after Bonferroni correction)
Fig. A7: SNP and haplotype pattern of PCR fragment 668A17_e11-2.

SUPPLEMENTARY MATERIAL 207
Source for accessions:1 Australian Winter Cereal Collection2 John Innes Centre, BBSRC Cereals Collection3 Genebank Gatersleben4 LfL-Bavaria
n.d., not determined
Significant associations with Rrs2 phenotype:
*p<0.00007 (after Bonferroni correction)
Fig. A8: SNP and haplotype pattern of PCR fragment 134N7_con5-3.
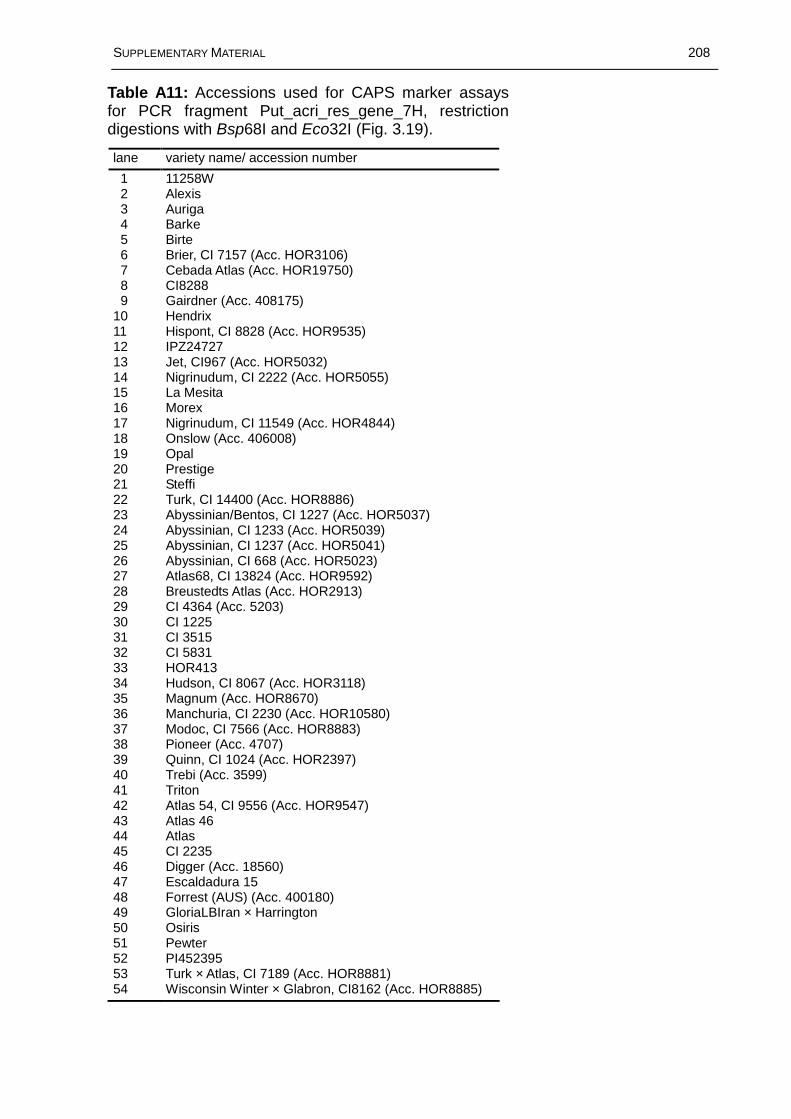
SUPPLEMENTARY MATERIAL 208
lane variety name/ accession number
1 11258W 2 Alexis 3 Auriga4 Barke
5 Birte 6 Brier, CI 7157 (Acc. HOR3106) 7 Cebada Atlas (Acc. HOR19750) 8 CI8288 9 Gairdner (Acc. 408175)10 Hendrix11 Hispont, CI 8828 (Acc. HOR9535)12 IPZ2472713 Jet, CI967 (Acc. HOR5032)14 Nigrinudum, CI 2222 (Acc. HOR5055)15 La Mesita16 Morex17 Nigrinudum, CI 11549 (Acc. HOR4844)18 Onslow (Acc. 406008)19 Opal20 Prestige21 Steffi22 Turk, CI 14400 (Acc. HOR8886)23 Abyssinian/Bentos, CI 1227 (Acc. HOR5037)24 Abyssinian, CI 1233 (Acc. HOR5039)25 Abyssinian, CI 1237 (Acc. HOR5041)26 Abyssinian, CI 668 (Acc. HOR5023)27 Atlas68, CI 13824 (Acc. HOR9592)28 Breustedts Atlas (Acc. HOR2913)29 CI 4364 (Acc. 5203)30 CI 122531 CI 351532 CI 583133 HOR41334 Hudson, CI 8067 (Acc. HOR3118)35 Magnum (Acc. HOR8670)36 Manchuria, CI 2230 (Acc. HOR10580)37 Modoc, CI 7566 (Acc. HOR8883)38 Pioneer (Acc. 4707)39 Quinn, CI 1024 (Acc. HOR2397)40 Trebi (Acc. 3599)41 Triton42 Atlas 54, CI 9556 (Acc. HOR9547)43 Atlas 4644 Atlas45 CI 223546 Digger (Acc. 18560)47 Escaldadura 1548 Forrest (AUS) (Acc. 400180)49 GloriaLBIran × Harrington50 Osiris51 Pewter52 PI45239553 Turk × Atlas, CI 7189 (Acc. HOR8881)54 Wisconsin Winter × Glabron, CI8162 (Acc. HOR8885)
Table A11: Accessions used for CAPS marker assays for PCR fragment Put_acri_res_gene_7H, restriction digestions with Bsp68I and Eco32I (Fig. 3.19).

SUPPLEMENTARY MATERIAL 209
lane variety name/ accession number
1 Alexis 2 Barke 3 CI 1225 4 Forrest (Acc. HOR3631) 5 Hispont, CI 8828 (Acc. HOR9535) 6 Hudson (Acc. HOR15375) 7 Magnum (Acc. HOR8670)8 Morex
9 Nigrinudum, CI 11549 (Acc. HOR4844)10 Onslow (Acc. 406008)11 Steffi12 Steudelli (Acc. 402008)13 Trebi (Acc. 3599)14 Triton15 Atlas 4616 Atlas 54, CI 9556 (Acc. HOR9547)17 Atlas18 CI 223519 Digger (Acc. 24525)20 Escaldadura 1521 Forrest (Acc. BCC1701)22 GloriaLBIran × Harrington23 Livet (Acc. 408567)24 Osiris25 Pewter26 PI45239527 Turk × Atlas, CI 7189 (Acc. HOR8881)28 Wisconsin Winter × Glabron, CI 8162 (Acc.
HOR8885)
lane variety name/ accession number1 Alexis2 Barke3 Steffi4 Morex5 Atlas6 Digger (Acc. 24525)7 Forrest (Acc. BCC1701)8 Pewter
Table A12: Accessions used for CAPS marker assays for PCR fragment 668A17_g1-3, restriction digestions with BncI and GsuI (Fig. 3.20).
Table A13: List of varieties used for CAPS marker assays for PCR fragment 668A17_e11-2 with Hin1II (Fig. 3.21).
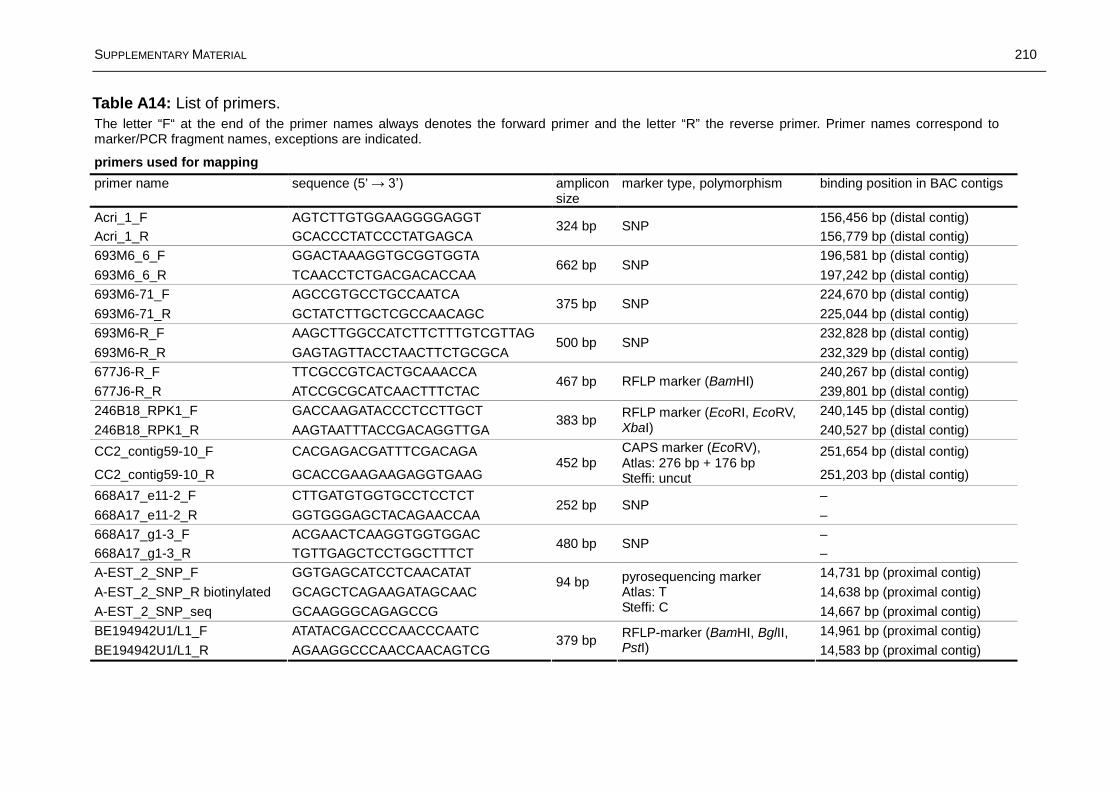
SUPPLEMENTARY MATERIAL 210
The letter “F“ at the end of the primer names always denotes the forward primer and the letter “R” the reverse primer. Primer names correspond to marker/PCR fragment names, exceptions are indicated.
primers used for mapping
primer name sequence (5’ amplicon size
marker type, polymorphism binding position in BAC contigs
Acri_1_F AGTCTTGTGGAAGGGGAGGT 156,456 bp (distal contig)
Acri_1_R GCACCCTATCCCTATGAGCA324 bp SNP
156,779 bp (distal contig)
693M6_6_F GGACTAAAGGTGCGGTGGTA 196,581 bp (distal contig)
693M6_6_R TCAACCTCTGACGACACCAA662 bp SNP
197,242 bp (distal contig)
693M6-71_F AGCCGTGCCTGCCAATCA 224,670 bp (distal contig)
693M6-71_R GCTATCTTGCTCGCCAACAGC375 bp SNP
225,044 bp (distal contig)
693M6-R_F AAGCTTGGCCATCTTCTTTGTCGTTAG 232,828 bp (distal contig)
693M6-R_R GAGTAGTTACCTAACTTCTGCGCA500 bp SNP
232,329 bp (distal contig)
677J6-R_F TTCGCCGTCACTGCAAACCA 240,267 bp (distal contig)
677J6-R_R ATCCGCGCATCAACTTTCTAC467 bp RFLP marker (BamHI)
239,801 bp (distal contig)
246B18_RPK1_F GACCAAGATACCCTCCTTGCT 240,145 bp (distal contig)
246B18_RPK1_R AAGTAATTTACCGACAGGTTGA383 bp
RFLP marker (EcoRI, EcoRV, XbaI) 240,527 bp (distal contig)
CC2_contig59-10_F CACGAGACGATTTCGACAGA 251,654 bp (distal contig)
CC2_contig59-10_R GCACCGAAGAAGAGGTGAAG452 bp
CAPS marker (EcoRV), Atlas: 276 bp + 176 bpSteffi: uncut 251,203 bp (distal contig)
668A17_e11-2_F CTTGATGTGGTGCCTCCTCT –
668A17_e11-2_R GGTGGGAGCTACAGAACCAA252 bp SNP
–
668A17_g1-3_F ACGAACTCAAGGTGGTGGAC –
668A17_g1-3_R TGTTGAGCTCCTGGCTTTCT480 bp SNP
–
A-EST_2_SNP_F GGTGAGCATCCTCAACATAT 14,731 bp (proximal contig)
A-EST_2_SNP_R biotinylated GCAGCTCAGAAGATAGCAAC94 bp
14,638 bp (proximal contig)
A-EST_2_SNP_seq GCAAGGGCAGAGCCG
pyrosequencing markerAtlas: TSteffi: C 14,667 bp (proximal contig)
BE194942U1/L1_F ATATACGACCCCAACCCAATC 14,961 bp (proximal contig)
BE194942U1/L1_R AGAAGGCCCAACCAACAGTCG379 bp
RFLP-marker (BamHI, BglII, PstI) 14,583 bp (proximal contig)
Table A14: List of primers.

SUPPLEMENTARY MATERIAL 211
The letter “F“ at the end of the primer names always denotes the forward primer and the letter “R” the reverse primer. Primer names correspond to marker/PCR fragment names, exceptions are indicated.
Table A14 continued: List of primers.
primers used for mapping (continued)
primer name sequence (5’ amplicon size
marker type, polymorphism binding position in BAC contigs
P1D23R_F GAACTACAATCAACCCTATCT 77,140 bp (proximal contig)
P1D23R_R TTCTAAATGCAACAACACTAC242 bp
77,381 bp (proximal contig)
P1D23R_seq TTGGAGACAAGTATGAAAAGG
pyrosequencing markerAtlas: A, GSteffi: G, C 77,283 bp (proximal contig)
primers for screening wrong recombinants134N7_Frag2_Gen3_2F TCCGTGAAAAGCCCATACTT 13,293 bp (proximal contig)
134N7_Frag2_Gen3_2R TTTCTCTGTGCTTGGTCGAA530 bp –
13,822 bp (proximal contig)
134_Frag5_Gen2_4F TCTGTTCGATCGTGTCTTGC 44,350 bp (proximal contig)
134_Frag5_Gen2_4R TGAGGATGACGAAAGGAGGA477 bp –
44,826 bp (proximal contig)
134_Frag6_1F ATCGTCAACAGTGCCTTTCC 51,939 bp (proximal contig)
134_Frag6_1R TCCTAGGGGTGAACTTAGGTGA537 bp –
52,475 bp (proximal contig)
134_Frag7_Gen1_5F CATCTTGCCCTGGTGAGAAT 67,012 bp (proximal contig)
134_Frag7_Gen1_5R TGCCATTAAAGCTCCCTGAT447 bp –
67,458 bp (proximal contig)
134_Frag7_Gen2_2F AGTTTCCGCTGTTGCTGTTT 68,048 bp (proximal contig)
134_Frag7_Gen2_2R GACGATGGATCTTTGCCACT575 bp –
68,622 bp (proximal contig)
primers used for BAC screeningCC2_contig59_1F AGCCCGGCCTGGATACCC 258,129 bp (distal contig)
CC2_contig59_1R GCTGCGGCGGCGACTCT437 bp –
257,693 bp (distal contig)
668A17_3-g1_2Fa TAGAACAGACCCATGCGACA –
668A17_3-g1_2Ra AATTCCTGGGTGACGTTCAG453 bp –
–
668A17_3-i7_3F ATCGTCTTTTCCACCATTGC –
668A17_3-i7_3Rb GATGTCGACGACGACTAGCA245 bp –
–
348I22_c10_1F CAGTCTGCGAACGAATGAAA –
348I22_c10_1R GGGACACGAACCGGTACTAA330 bp –
–
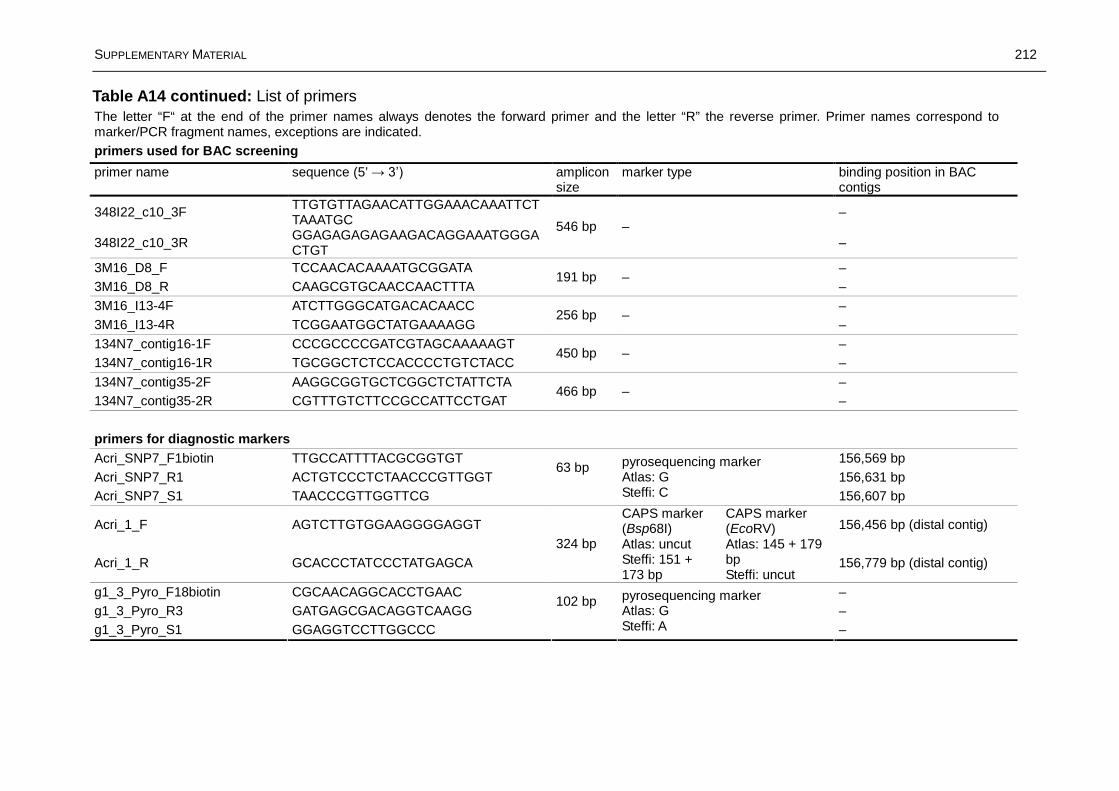
SUPPLEMENTARY MATERIAL 212
The letter “F“ at the end of the primer names always denotes the forward primer and the letter “R” the reverse primer. Primer names correspond to marker/PCR fragment names, exceptions are indicated.
Table A14 continued: List of primers
primers used for BAC screening
primer name sequence (5’ amplicon size
marker type binding position in BAC contigs
348I22_c10_3FTTGTGTTAGAACATTGGAAACAAATTCTTAAATGC
–
348I22_c10_3RGGAGAGAGAGAAGACAGGAAATGGGACTGT
546 bp ––
3M16_D8_F TCCAACACAAAATGCGGATA –
3M16_D8_R CAAGCGTGCAACCAACTTTA191 bp –
–
3M16_I13-4F ATCTTGGGCATGACACAACC –
3M16_I13-4R TCGGAATGGCTATGAAAAGG256 bp –
–
134N7_contig16-1F CCCGCCCCGATCGTAGCAAAAAGT –
134N7_contig16-1R TGCGGCTCTCCACCCCTGTCTACC450 bp –
–
134N7_contig35-2F AAGGCGGTGCTCGGCTCTATTCTA –
134N7_contig35-2R CGTTTGTCTTCCGCCATTCCTGAT466 bp –
–
primers for diagnostic markers
Acri_SNP7_F1biotin TTGCCATTTTACGCGGTGT 156,569 bp
Acri_SNP7_R1 ACTGTCCCTCTAACCCGTTGGT63 bp
156,631 bp
Acri_SNP7_S1 TAACCCGTTGGTTCG
pyrosequencing markerAtlas: GSteffi: C 156,607 bp
Acri_1_F AGTCTTGTGGAAGGGGAGGT 156,456 bp (distal contig)
Acri_1_R GCACCCTATCCCTATGAGCA
324 bp
CAPS marker (Bsp68I)Atlas: uncutSteffi: 151 + 173 bp
CAPS marker (EcoRV)Atlas: 145 + 179 bpSteffi: uncut
156,779 bp (distal contig)
g1_3_Pyro_F18biotin CGCAACAGGCACCTGAAC –
g1_3_Pyro_R3 GATGAGCGACAGGTCAAGG102 bp
–
g1_3_Pyro_S1 GGAGGTCCTTGGCCC
pyrosequencing markerAtlas: GSteffi: A –

SUPPLEMENTARY MATERIAL 213
The letter “F“ at the end of the primer names always denotes the forward primer and the letter “R” the reverse primer. Primer names correspond to marker/PCR fragment names, exceptions are indicated.
Table A14 continued: List of primers
primers for diagnostic markers
primer name sequence (5’ amplicon size
marker type binding position in BAC contigs
668A17_g1-3F ACGAACTCAAGGTGGTGGAC –
668A17_g1-3R TGTTGAGCTCCTGGCTTTCT
480 bp
CAPS marker (BcnI)Atlas: uncut Steffi: 128 + 352 bp
CAPS marker (GsuI)Atlas: 278 + 108 + 94 bpSteffi: 278 + 202 bp
–
e11_2_SNP1_F1 GAAAAGGCGGGCCGAGAG –
e11_2_SNP1_R2b TCAACGCGCTTTGTTGCC119 bp
–
e11_2_SNP1_S1 GGAGGGAGCATCGTAG
pyrosequencing markerAtlas: ASteffi: C
–
668A17_e11-2F CTTGATGTGGTGCCTCCTCT
668A17_e11-2R GGTGGGAGCTACAGAACCAA252 bp
CAPS marker (NlaIII)Atlas: 47 + 62 + 63 + 80 bpSteffi: 47 + 80 + 125 bp
primers used in association studyRGHA_2F (locus RGH-3) ATTTTGATGTGCTTTTCAGTAGAGG 127,534 bp (distal contig)
RGHA_2R (locus RGH-3) ATTTTAGCTGTTGAATCTCATCTGG459 bp SNP
127,992 bp (distal contig)
Acri_1F AGTCTTGTGGAAGGGGAGGT 156,456 bp (distal contig)
Acri_1R GCACCCTATCCCTATGAGCA324 bp SNP
156,779 bp (distal contig)
F3-STex2_2F (locus FST-2) ATACATCGTTGAGGCAATGGAG 201,560 bp (distal contig)
F3-STex2_2R (locus FST-2) ATACACTTCTTGGCAAACATCCAC402 bp SNP
201,861 bp (distal contig)
668A17_g1-3F ACGAACTCAAGGTGGTGGAC –
668A17_g1-3R TGTTGAGCTCCTGGCTTTCT480 bp SNP
–
668A17_e112F CTTGATGTGGTGCCTCCTCT –
668A17_e112R GGTGGGAGCTACAGAACCAA252 bp SNP
–
134N7_con5-3F AAAAATCTCAACCCTCGCACATCA 15,243 bp (proximal contig)
134N7_con5-3R TACCAAGAAGGCCCAACCAACAGT666 bp SNP
14,578 bp (proximal contig)

SUPPLEMENTARY MATERIAL 214
The letter “F“ at the end of the primer names always denotes the forward primer and the letter “R” the reverse primer. Primer names correspond to marker/PCR fragment names, exceptions are indicated.
Table A14 continued: List of primers
primers used in expression analysis (only the ones leading to successful cDNA amplifications)
primer name sequence (5’ amplicon size
marker type binding position in BAC contigs
F3-ST_2_F (PK95) GGAGGACACCTTCACCTTCA 201,895 bp (distal contig)
F3-STex2_3R (PK95) CACAGCTCCACAATCTGCTG255 bp –
202,149 bp (distal contig)
668A17_3-g1_2Ra (PK37) AATTCCTGGGTGACGTTCAG –
668A17_3-g1_2Fb (PK37) TCCGTGACTAAGCTGCATTG355 bp –
–
668A17_3-g1_2Rb (PK38) GACGGCAACAGAGAAGAAGG –
668A17_3-g1_2Fb (PK38) TCCGTGACTAAGCTGCATTG218 bp –
–
A-EST_3Fb (PK18) TATCAATGGCGACGTGTACC – 14,848 bp (proximal contig)
134N7con5_2F (PK18) GGAAACCCCAAGGCGACCAACT175 bp
– 15,022 bp (proximal contig)
Actin_F TCACCGAGAGAGGTTACTCCT –
Actin_R TCCTGATATCCACGTCACACT294 bp
–
–

SUPPLEMENTARY MATERIAL 215
buffer composition
TE 10 mM Tris-HCl1 mM EDTA
pH 8.0
1 x TBE 89 mM Tris89 mM boric acid 2 mM EDTApH 8.3
1 x TAE 40 mM Tris1 mM EDTA
20 mM acetic acidpH 8.5
DNA extraction buffer for sodium bisulfite isolation method
100 mM Tris-HCl500 mM NaCl 50 mM EDTA, pH 8.01.25% SDS3.8 g/l NaHSO3
DNA extractionextraction buffer (DOYLE and DOYLE, 1990), modified according to RIESEBERG et al. (1993)
100 mM Tris-HCl 20 mM EDTA1.4 M NaCl1.0% Na2S2O5
2.0% CTAB0.2% ß-mercaptoethanol
CIA 96% chloroform 4% isoamyl alcohol
acetate mix 3 M sodium acetate10 M ammonium acetate
Table A 15: Buffers and solutions
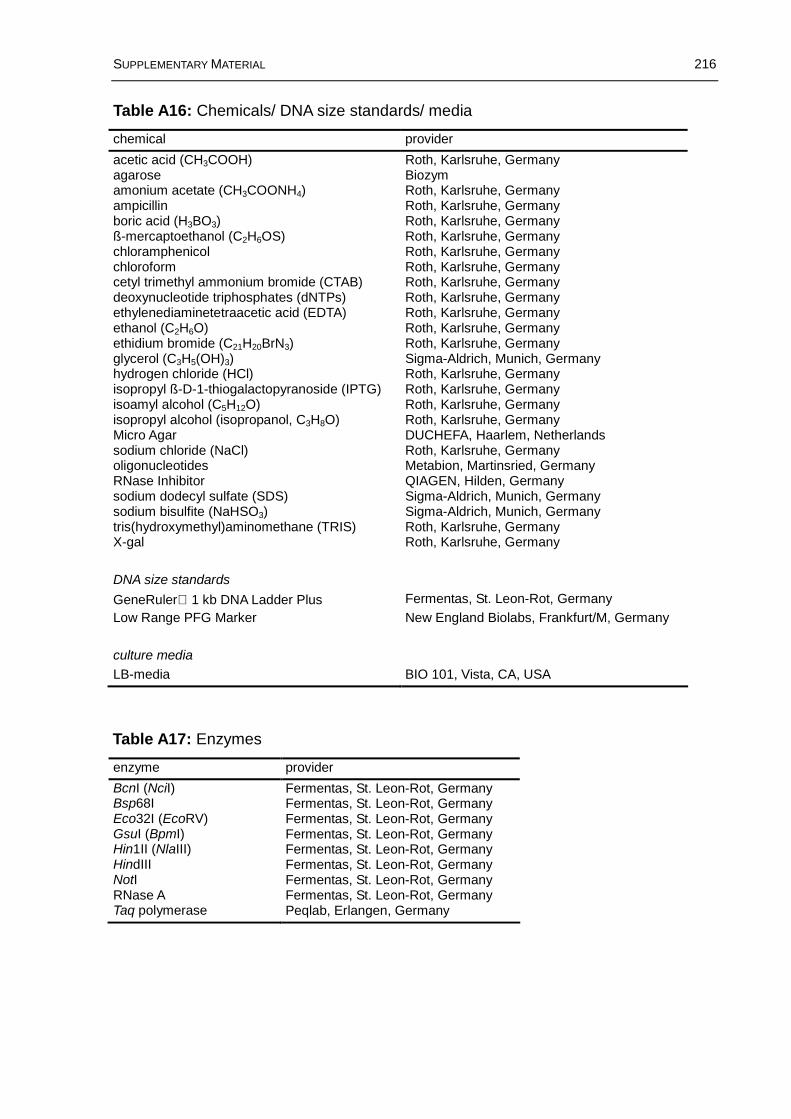
SUPPLEMENTARY MATERIAL 216
chemical provider
acetic acid (CH3COOH) Roth, Karlsruhe, Germanyagarose Biozymamonium acetate (CH3COONH4) Roth, Karlsruhe, Germanyampicillin Roth, Karlsruhe, Germanyboric acid (H3BO3) Roth, Karlsruhe, Germanyß-mercaptoethanol (C2H6OS) Roth, Karlsruhe, Germanychloramphenicol Roth, Karlsruhe, Germanychloroform Roth, Karlsruhe, Germanycetyl trimethyl ammonium bromide (CTAB) Roth, Karlsruhe, Germanydeoxynucleotide triphosphates (dNTPs) Roth, Karlsruhe, Germanyethylenediaminetetraacetic acid (EDTA) Roth, Karlsruhe, Germanyethanol (C2H6O) Roth, Karlsruhe, Germanyethidium bromide (C21H20BrN3) Roth, Karlsruhe, Germanyglycerol (C3H5(OH)3) Sigma-Aldrich, Munich, Germanyhydrogen chloride (HCl) Roth, Karlsruhe, Germanyisopropyl ß-D-1-thiogalactopyranoside (IPTG) Roth, Karlsruhe, Germanyisoamyl alcohol (C5H12O) Roth, Karlsruhe, Germanyisopropyl alcohol (isopropanol, C3H8O) Roth, Karlsruhe, GermanyMicro Agar DUCHEFA, Haarlem, Netherlandssodium chloride (NaCl) Roth, Karlsruhe, Germanyoligonucleotides Metabion, Martinsried, GermanyRNase Inhibitor QIAGEN, Hilden, Germanysodium dodecyl sulfate (SDS) Sigma-Aldrich, Munich, Germanysodium bisulfite (NaHSO3) Sigma-Aldrich, Munich, Germanytris(hydroxymethyl)aminomethane (TRIS) Roth, Karlsruhe, GermanyX-gal Roth, Karlsruhe, Germany
DNA size standards
GeneRuler 1 kb DNA Ladder Plus Fermentas, St. Leon-Rot, Germany
Low Range PFG Marker New England Biolabs, Frankfurt/M, Germany
culture media
LB-media BIO 101, Vista, CA, USA
enzyme provider
BcnI (NciI) Fermentas, St. Leon-Rot, GermanyBsp68I Fermentas, St. Leon-Rot, GermanyEco32I (EcoRV) Fermentas, St. Leon-Rot, GermanyGsuI (BpmI) Fermentas, St. Leon-Rot, GermanyHin1II (NlaIII) Fermentas, St. Leon-Rot, GermanyHindIII Fermentas, St. Leon-Rot, GermanyNotI Fermentas, St. Leon-Rot, GermanyRNase A Fermentas, St. Leon-Rot, GermanyTaq polymerase Peqlab, Erlangen, Germany
Table A16: Chemicals/ DNA size standards/ media
Table A17: Enzymes

Acknowledgements
I would like to express my thanks to Prof. Dr. Gerhard Wenzel for giving me the
opportunity to defend the thesis at the Technische Universität München.
Furthermore, I am grateful to Prof. Dr. Chris-Carolin Schön, Prof. Dr. Ralph
Hückelhoven, and Dr. habil. Volker Mohler for being part of the thesis committee.
I am deeply indebted to my thesis supervisors Dr. Marion Röder and Dr. Günther
Schweizer. My sincere thanks to both of them for all the helpful discussions, their
guidance, and support. I especially want to thank Dr. Marion Röder for the financial
support that was provided during the final year of the PhD and Dr. Günther
Schweizer for his valuable comments on the manuscript. Moreover, I want to
acknowledge the work of Dr. Roberto Cossu, which laid the basis for this PhD work.
My extra special thanks and appreciation go to Sigrid Steinborn and Ellen Weiss for
their excellent and reliable work in the lab and greenhouse. Without their help and
efforts this thesis would not have been possible. Additionally, I want to thank them for
many nice conversations and joyful moments, for listening to all the small and big
problems and their continuous encouragements.
I would like to thank all the other current and former members of the GGK workgroup,
especially Dr. Uttam Kumar, Dr. Inge Matthies, Dr. Christoph Pietsch, Sonja Allner,
Rosemarie Czihal, Angelika Flieger, and Anette Heber for the nice and cooperative
working atmosphere in the group. I am particularly obliged to Dr. Inge Matthies for
spending her free time proofreading the manuscript.
I would like to express my gratitude to the lab of Dr. Günther Schweizer at the
Bayerische Landesanstalt für Landwirtschaft for performing the numerous disease
resistance tests for this project. Many thanks also to the lab of Prof. Dr. Beat Keller at
the University of Zürich for screening the Cebada Capa BAC library and to Dr.
Thomas Wicker for helping with the annotation of the BAC contigs. I am very grateful
to Daniela Schulte of the working group Genome Dynamics at the IPK for analyzing
our BAC clones with the high information content fingerprinting method and informing
me of any new BAC clones that prolonged the BAC contigs. At this point I also would

like to thank Dr. Urs Hähnel (former member of Expression Mapping group at the
IPK) and Ingelore Dommes (Expression Mapping group) for teaching me the BAC
subcloning and for all their other help with “bacteria issues”. Furthermore, I wish to
extend my thanks to Susanne König of the sequencing lab of the IPK, the IPK
librarians and the ladies at the printing office for ever friendly and helpful assistance.
I would like to say a big thank you to all the people who were involved in establishing
the PhD Student Board and organizing the first and second Student Conference at
the IPK and all the others who have contributed so much to the fun times I had during
the course of my PhD at the IPK.
Finally, a special thanks is devoted to my parents, grandparents and siblings for
whose love and support throughout my life I am endlessly gratefuly. Also, I will always
feel indepted to Dan, Leslie, Nathan, Lucas, Elliot, Logan, and the extended Murray
family for making me feel a family member and giving me the opportunity to get to
know and to love the American way of life.
My deepest and affectionate thanks go to José for his unconditional love and
friendship and for his constant support and encouragement, which helped me
through the most challenging moments of my PhD.

Curriculum Vitae
Personal data
Name Anja Hanemann
Date of birth 12 April 1979
Place of birth Gera, Germany
Marital status unmarried, no children
Education
1986 – 1988 C. G. Rochlitzer Schule in Freiberg/Saxony
1988 – 1991 Clara Zetkin Schule in Freiberg/Saxony
1991 – 1995 Geschwister Scholl Gymnasium in Freiberg/Saxony
1995 – 1996 Orchard Park High School in Orchard Park (NY), USA
1996 – 1998 Geschwister Scholl Gymnasium in Freiberg/Saxony
graduation certificate: Allgemeine Hochschulreife
1998 – 2000 Universität Rostock
field of study: Agrarökologie
degree: Vordiplom
2001 – 2004 Humboldt-Universität zu Berlin
field of study: Agrarwissenschaften (Pflanzenbau)
degree: Diplom (Diplom thesis research was conducted at the
Bayerische Landesanstalt für Landwirtschaft in Freising)
Professional experience
2001 – 2003 Student assistent at the department of plant breeding at the
Humboldt-Universität zu Berlin
2003 – 2004 Student assistant at the apogene GmbH & Co.KG
Biotechnologie in Freising
2002 + 2004 in total 3 months practical work experience at the
Pajbjergfonden plant breeding company in Odder, Denmark
2004 – Wissenschaftliche Mitarbeiterin at the Leibniz Institute of Plant
Genetics and Crop Plant Research (IPK) in Gatersleben