final report - ScholarSpace
64
July 1989 INFORMATION TEXT SERIES 034 FINAL REPORT The MARKETS and MARKETING ISSUES of the KONA COFFEE INDUSTRY Prepared for the State of Hawaii Department of Agriculture Prepared by Stuart T. Nakamoto and John M. Halloran Dept. of Agricultural and Resource Economics College of Tropical Agriculture and Human Resources University of Hawaii HITAHR · COLLEGE OF TROPICAL AGRICULTURE AND HUMAN RESOURCES · UNIVERSITY OF HAWAII
-
Upload
khangminh22 -
Category
Documents
-
view
0 -
download
0
Transcript of final report - ScholarSpace

July 1989 INFORMATION TEXT SERIES 034
FINAL REPORT
The
MARKETS and MARKETING ISSUESof the
KONA COFFEE INDUSTRY
Prepared for theState of Hawaii
Department of Agriculture
Prepared by
Stuart T. Nakamoto and John M. HalloranDept. of Agricultural and Resource Economics
College of Tropical Agriculture and Human ResourcesUniversity of Hawaii
HITAHR · COLLEGE OF TROPICAL AGRICULTURE AND HUMAN RESOURCES · UNIVERSITY OF HAWAII

ACKNOWLEDGMENTS
This study was funded by the Hawaii State Legislature, under the administration of the Hawaii State Deparment ofAgriculture. The study team wishes to acknowledge the many individuals and firms within the industry, whose knowledgeand cooperation contributed significantly to this report. Special thanks to Dr. John Yanagida for his review and commentsof an earlier draft. The tables and figures were prepared by Jill Lani Stone.
THE AUTHORS
Stuart T. Nakamoto is an assistant specialist in the Department of Agricultural and Resource Economics, College ofTropical Agriculture and Human Resources, University of Hawaii at Manoa.
John M. Halloran is an assistant specialist in the same department.

FINAL REPORT
The
MARKETS and MARKETING ISSUESof the
KONA COFFEE INDUSTRY
Prepared for theState of Hawaii
Department of Agriculture
Prepared byStuart T. Nakamoto and John M. Halloran
Dept. of Agricultural and Resource EconomicsCollege of Tropical Agriculture and Human Resources
University of Hawaii
HITAHR · COLLEGE OF TROPICAL AGRICULTURE AND HUMAN RESOURCES · UNIVERSITY OF HAWAII

EXECUTIVE SUMMARYThe Markets and Marketing Issues of the Kona Coffee Industry
Findings:1. The Kona Coffee industry is not dealing with a single,homogeneous market. Instead, several market segmentsare identified based on product form, channel of distribution, and fmal consumer. These are:
(1) Institutions (hotels and restaurants)
(2) Local residents (specialty outlets and supermarkets)
(3) Tourists (from US vs. from Japan)
(4) Exports (out-of-state sales, including mail order)
These segments are in different stages ofdevelopment, and have different marketing needs(promotion and advertising are treated as only part ofmarketing.) These market segments are perhaps the majorreason for the lack of industry cohesion.
2. Universal concerns to the industry are or should beproduct quality, reputation, and image. These are essentialto maintaining markets, expanding markets, and meetingcompetition posed by specialty coffees and other products.The biggest external threat is "Kona-style" or counterfeitcoffee. Quality, reputation, and image can establish Konacoffee as distinct from but complementary to other Hawaiicoffees.
3. Fluctuating prices resulting from fluctuating productionhave a negative influence on the price/value perceptions ofespecially roasters, and are a major cause of instability inmarkets. This aggravates the high carrying cost bypurchasers of Kona coffee. In terms of many productionproblems, recent history has demonstrated that higherprices are attracting resources to the industry. Pricestability will further enhance the position of Kona coffee inmarkets and hence, of producing Kona coffee.
4. This study cannot support or refute minimum contentlegislation for Kona blends. Besides issues of logistics,enforceability, jurisdiction, etc., the available informationdoes not conclusively show that Kona blend either helps orhurts the growers. Further, it would be very costly to collectthe information needed for a definite conclusion, and firmsare unlikely to willingly part with the required information.
This report instead recommends an approach thatallows the market mechanism to dictate the proper blendpercentage. The desired results attributed to minimumcontent standards can be obtained using truth in labellingtogether with a certification program andeducation/promotion as outlined below.
Recommendations:1. Certification program. The individual market segmentsand overall Kona coffee industry will be best served by acertification program for pure Kona coffee. This programis patterned after similar endeavors in other products,
iii
notably Jamaica Blue Mountain and Colombia coffees, andFlorida orange juice. However, especially the coffeeexamples serve as only models because of the differentstructure, organization, and operating conditions of theseforeign industries.
The underlying concept behind certification forKona coffee is as follows. Although the program isvoluntary, non-participation implies that something is wrongwith the uncertified product. Certified processors issuedated certificates of authenticity with each bag of greencoffee sold. This assures buyers that a product is pure Konacoffee of established quality. Buyers in turn are licensed touse a seal of approval on final products. Processors andbuyers must demonstrate compliance in order to remaincertified, reinforced by other means of monitoring. A feeschedule can also be included so the program is selffunding.
An essential complement to certification iseducation/information directed first at the trade, then toretailers, and eventually the consuming public. Thisincludes using trade magazines (e.g., an explanation ofcertification with a list of certified processors), and anewsletter on Kona coffee. Such efforts would also be apowerful negative incentive to cheating or not participating.
If successful, the program could expand to includeKona blends, perhaps via truth in labelling. Again, theimplication of non-participation would be that something iswrong with the product.
2. Inventory/stock control is one approach to easing supplyfluctuations and thus to stabilizing inter- and intra-yearprice fluctuations. Possible actions include a centralizedwarehousing and/or distribution scheme; public subsidy(construction and low cost operating loans); the use ofspeculators to carry inventory costs and assume market risk.
3. There are innumerable activities for promotion andadvertising, especially on the firm level. These wouldideally be tied in to the certification program. However,promotion and advertising can quickly deplete limitedresources without the desired results. For the industry ingeneral, in-state markets have not been sufficiently tapped.In particular, tourists are a captive audience that need to bebetter utilized, with a "free" carryover to residents. Strongerefforts in activities focusing on the Kona area could befruitful. Events include the Kona Coffee Festival, IronmanTriathalon, Hawaii and International billfish tournaments.If successful, such efforts could be extended to other events.
4. The recommendations outlined, especially on anindustry-wide basis, will be best implemented by anindustry-wide organization such as the Kona CoffeeCouncil. Program success and longevity is enhanced withgreater self-sufficiency in financing.

TABLE OF CONTENTS
List of Tables vi
List of Figures VI
CHAPTER I: OBJECTIVES AND BACKGROUNDIA Introduction 1I.B World Coffee Trade 1I.C Specialty Coffee 5
CHAPTER II: THE KONA COFFEE INDUSTRYIIA Structure 6II.B Product CharacteristicsII.B.l Grades 8II.B.2 Prices 8II.B.3 Product Differentiation 9
CHAPTER III: MARKETS FOR KONA COFFEEIlIA Classifications of "Markets" for Kona Coffee 10III.B Product Form 13III.C Market Channels or OutletsIII.C.l The Institutional Market 13III.C.2 Specialty Market 14III.C.3 Hawaii Supermarkets 15III.D Final ConsumersIII.D.l The Export Market - U.S. Mainland 19III.D.2 The Export Market - Japan 20
Japan in the world market 20Green coffee 20Other coffee products 22Channels of distribution 22Consumption trends 23Outlook 27
III.D.3 Oahu Residents 28Focus groups 28Telephone surveys 28
III.D.4 The Visitor Market 32III.D.4.a Visitor Demographics 32III.D.4.b Tourists' Perceptions 33III.D.4.c Important Factors Affecting Purchase 35III.D.4.d Factors Affecting Kona Coffee Purchase 35III.D.4.e Place of Consumption 38
iv

TABLE OF CONTENTS (continued)
IV. ISSUES AFFECTING THE KONA COFFEE INDUSTRY 39
IVA Unreliable Supply 40IV.B Competition 40
Specialty coffees as luxury goods 40Specialty coffees as quality products 41Flavored coffees 41Kona-style coffee 41Other Hawaii coffee 41
IV.C Image 42IV.D Reputation 43IV.E Quality 43IV.F Blends and LabellingIV.F.1 Recommendation 44IV.F.2 Analysis 44IV.F.3 Conclusions 47
V. CONCLUSIONS & RECOMMENDATIONSVA Conclusions 48V.B Jamaica and Colombia's Programs 49
Jamaica 49Colombia 49
V.C Information, Education, and Promotional Activities 51V.C.1 Promotional Opportunities 51V.C.2 Promotional Activities 52V.D Certification Program 54V.E Inventory or Stock Control Programs 55V.F Industry Organization 55
v

List of Tables
1-1. Coffee Consumption Trends in the United States 311-1. Kona Coffee Production Statistics 711-2. Conversion Rates between Coffee Products 711-3. Typical Kona Coffee Yield, by Grade 7
111-1. Green Coffee Imports to Japan, by Major Suppliers, 1982-1986 20111-2. Price of Green Coffee Imports to Japan, by Supplier 22111-3. Domestic Supplies of Regular & Instant Coffee in Japan 23111-4. Consumption of Coffee Products Over Time in Japan 26111-5. 1985 Consumption of Coffee Products in Japan by Location 26111-6. Comparative Visitor and Trip Profiles 32111-7. Visitors' Comparative Identification of Agricultural Products with Hawaii 33IV-1. Perceived Issues in Kona Coffee 39IV-2. Perceived Percentage of Pure Kona Coffee in Blend, by Respondent Type 45V-1. Prices Received for Green Coffee 50V-2. Possible Promotional Activities for Kona Coffee Industry 52
List of Figures
1-1. Coffee Marketing Systems 2111-1. Segmentation of Kona Coffee Markets 11111-2. Kona Coffee Market Segment Matrix 12111-3. Sales of Coffee in Selected Hawaii Supermarkets, 1986-1987 16111-4. Supermarket Sales of Regular Coffee by Type 17111-5. 1986 Coffee Imports to Japan by Type 21111-6. Coffee Imports to Japan, 1959 to 1986 21III-7. Distribution Channels of Regular Coffee in Japan 24111-8. Consumer Image of Selected Beverages in Japan 25111-9. Resident Purchase Habits of Kona Coffee, All Respondents 29111-10. Resident Purchase Habits of Kona Coffee, Purchasers Only 30111-11. Relative Importance of Kona Coffee Characteristics
in Purchase Decision of Residents 31111-12. Residents' Main Reasons for Not Purchasing Kona Coffee 31111-13. Visitors' Identification of Products with Hawaii 34111-14. Comparative Purchases of Products by Tourists 36111-15. Relative Importance of Souvenir and Gift Characteristics
in Purchase Decision for Visitors 37111-16. Relative Importance of Kona Coffee Characteristics
in Purchase Decision of Visitors 37
vi

CHAPTER I: OBJECTIVES AND BACKGROUND
I.A IntroductionThe goal of this report is to provide information on
the markets for Kona Coffee so the Kona Coffee industrycan maintain and increase its profitability. Profitability canbe improved by increasing revenues, decreasing costs, orboth. Profitability is also enhanced by increasing thestability of revenues or costs. To accomplish this goal, thisresearch has three objectives:
1. Identify current and potential markets for KonaCoffee
2. Identity constraints to achieving market potential3. Identify possible strategies and activities to
penetrate or develop and maintain markets
The procedures for reaching these objectives rely heavily onpublished information, supplemented by surveys andinterviews.
The primary audience for this report is a broadlydefined Kona Coffee industry and when the situationwarrants, more specifically the existing growers of KonaCoffee.
General overviews of the world's coffee trade andof specialty coffee are presented in this chapter, where someglobal and u.s. statistics are provided to gain a betterperspective of Kona Coffee. The production and processingend is closely scrutinized in Chapter II. Chapter IIIdescribes various market segments as defined by productform, final consumer, and the way in which the productreaches the consumer. The discussion includes a summaryof market statistics for coffee in Japan. Three surveys wereconducted for North American tourists coming to Hawaii,Japanese tourists, and Honolulu residents. Their results arealso presented. Finally, there is an analysis of supermarketcoffee sales data.
Chapter IV is intended as an objective presentationof the various issues uncovered from interviews with variousroasters and processors in Hawaii and on the continentalUnited States. In particular, the closely related concepts ofimage, quality, and reputation are treated in separatesections. "Image" involves peoples' perceptions and beliefssuch as are related to emotions and past experiences."Quality" is used in reference to the physical characteristicsof Kona Coffee (such as taste, aroma, and mildness), and"reputation" deals with the consistency and perceptions ofquality, and the provision of quality (service).
The intent of Chapter V is to summarize theprevious chapters and discuss various options that areavailable for developing a marketing strategy for theindustry. Some activities will also be useful to individualfirms.
1
I.B World Coffee TradeCommodity coffee is the second most widely traded
single commodity, following only oil in world trade. Tradeis controlled by quotas set in the 6-year International CoffeeAgreement (leA) so as to keep prices within apredetermined range. The ICA is between the 50 coffeeproducing and 24 coffee-consuming members <1> of theInternational Coffee Organization (ICO), a group whosegoal is to provide fair prices and returns to both producersand consumers. Imports by ICO members account for 85 to90 percent of total world exports. ICA quotas currentlyresult in large inventories being held by producers: theUSDA estimates beginning coffee stocks for the 1988-89season to be half the expected world production. SeePieterse and Silvis<2> or Uker's Buyers' Guide<3> formore details on the ICA and ICO. The most recent ICAexpires in September 1989.
While the ICO is worldwide in scope, individualcountries typically also have their own organizations.Uker's lists groups within each country. In the UnitedStates, the ICO funds the Coffee Development Group(CDG), whose mission is to increase the consumption ofcoffee in the U.S. via educational, informational, andmarketing programs.
The largest industry group in the u.S. is theNational Coffee Service Association. The National CoffeeAssociation of U.SA., Inc. is second with over 200 membercompanies handling about 85% of all coffee imported androasted in the country. Other trade organizations in theu.S. are the Specialty Coffee Association of America, theGreen Coffee Association of New Orleans, Green CoffeeAssociation of New York City, New York Coffee Roasters'Association, Pacific Coast Coffee Association, and SouthernCoffee Association.
For the 1988/89 crop year, the USDA ForeignAgricultural Service estimates world production to be 93.3million bags, or roughly 12.3 billion pounds, down tenpercent from the previous year (USDA<4». Figure 1-1illustrates the flow of coffee from typical growers to finalconsumers. Brazil and Colombia are major producers,while major consumers are developed countries such as theUnited States, members of the European EconomicCommunity, and Japan. In total, ten countries account forthree-fourths of coffee imports. The United States is thelargest importer with 25 to 30 percent of total worldimports.
The 1982 study by Pieterse and Silvis estimated theworld income elasticity of coffee demand at 0.448; that is,coffee demand would increase by 4.5 percent if incomeincreases by 10 percent, ceteris paribus (or all other factorsremaining constant. Japan, Central Europe, and centrallyplanned economies were estimated to have the greatestgrowth potential. Annual per capita consumption ishighest in the Scandinavian countries (22 to 26 lbs perperson), more than twice the ten lb/person in the UnitedStates.

Figure I-I. Coffee Marketing Systems
Coffee producing couI,tryIIII
Coffee importing coulltry
ItIGrowerProductionII
fo-------------t-----------------t----------!-----------.----------~I
Intermediation(Trade) Broker* - Exporter/Importer· ...
Consumer
Wholesale/Retail
Processing/roasting..
Wholesale/Retail
Processing/roasting
Distribution
Consumption
Transformation ,II
~--·---------t-·_----------I I --I ----------IIIII
f-------·----t------------T-----------t----------t------------
I Consumer I I. I
I
•....------ - - ---t--------- - --1---------l--~--- --- - - -1---- - - - - ----
I•
N
* Private or governmental agencies
Source: UNCTAD, 1984. Studies in Processing, Marketing and Distribution of Commodities.

In 1986 the United States imported 2.6 billionpounds of crude' (green) coffee valued at $4.4 billion fromover eighty countries (Yokoyama et al. <5.». Another$267 million was imported in the form of mstant coffee,roasted coffee coffee extract, and coffee mixed withsubstitutes. In 'terms of the type of coffee, 1987/88 importswere reported by the USDA as 15.5~ Colombian milds,36% other milds, 29% unwashed Arablcas, 15.5% Robustas,and 4% other in green bean equivalents. One-half to threefourths of u.S. coffee imports are handled through some100 trading frrms (remain?er. imported direc~ly byprocessors), with the ten leadmg lDlporters accountmg forabout 40 percent of the volume. Although there are some200 roasters and processors, General Foods (MaxwellHouse, Master Blend, Sanka, Yuban, Brim), Hills Brothers(Hills Bros, MJB, Chase & Sanborn), and Procter &Gamble (Folger's) account for three-fourths of 1987 roastedcoffee sales in the United States. The Nestle Company(Nestle, Taster's Choice) is also a major fIrm for instantcoffee.
In terms of individual countries, Brazil has been theleading supplier to the United States except in ~986, whenColombia had 13.5 percent of crude coffee unports byvolume. Mexico also has a market share larger than 10percent. The most expensive coffee, measured in terms ofthe average landed price of a supplier's shipments, camefrom Jamaica at $3.67 per pound for 99 thousandpounds <6>. The least expensive shipments were from thePeople's Republic of China, at $0.71 per pound. Colombianimports commanded $1.96/lb. On the average, green coffeereceived in 1986 had a landed price of $1.72 per pound.
Pieterse and Silvis estimated the short term priceelasticity of coffee import demand for the United States at 0.372 and for the world at -0.186. Thus, a 10 percentdecrease in price would result in an increase in the quantity
demanded in the U.S. market of 3.7 percent, and anincrease in the world market of less than two percent, ceterisparibus. Conversely, the market must adjust to any changein the quantity supplied with a proportionately greaterchange in price.
Reductions in supply seem to result from eitherdisease or a natural disaster in some production area. Theprice increase fr~m a production s~ortfa11 w~uld be wellreceived by survivmg growers, and mIght result m some newplantings. Since there is a time lag for new trees to mat~e,
persistent high prices that encourage even more plantmgswould have disastrous longer-term effects. When theadditional plantings reach full production, prices areseverely depressed until the next calamity. T~e impacts ~emore pronounced in many coffee exportmg count~les
because of the importance of coffee these economIes,leading to various government policies and programs tosupport production and better control supply. Forimporters, processing fIrms regularly carry ~6 weeks ofinventory to better control their supply fluctuatIons.
There are several noteworthy trends with regardsto coffee consumption in the United States. The ICOconducts an annual Winter Coffee Drinking Study<7> .This study has shown a long-term decrease in both percapita and total consumption since 1962, the peak year forcoffee consumption in the United States (Table 1-1). Thetable also shows a marked decrease in the percentage of thepopulation which drinks coffee, from 75% in 1962 to 50% in1988<8>. In comparison, milk and tea have been relativelystable at about 45-50% and 25-30%, respectively. Percapita consumption of juices had been increasing but seemsto be stabilizing in the 40-45% range, while soft drinks showa continuing increase, and have surpassed coffee as themost popular beverage.
Table 1-1. Coffee Consumption Trends in the United States
Cups per person per day
Cups per drinker per day
Percentage drinking
U.S. population (millions)
Computed total consumption
(million cups/day)
1962
3.12
4.17
74.7
186.5
581.9
1984
1.99
3.48
57.3
236.5
470.6
1985
1.83
3.33
54.9
238.7
436.8
1986
1.74
3.32
52.4
241.1
419.5
1987
1.76
3.38
52.0
243.9
429.3
1988
1.67
3.34
50.0
246.2
411.2
Source: International Coffee Organization. United States of America: Coffee Drinking Study, Winter 1988 and earlierissues. lCD, London.
3
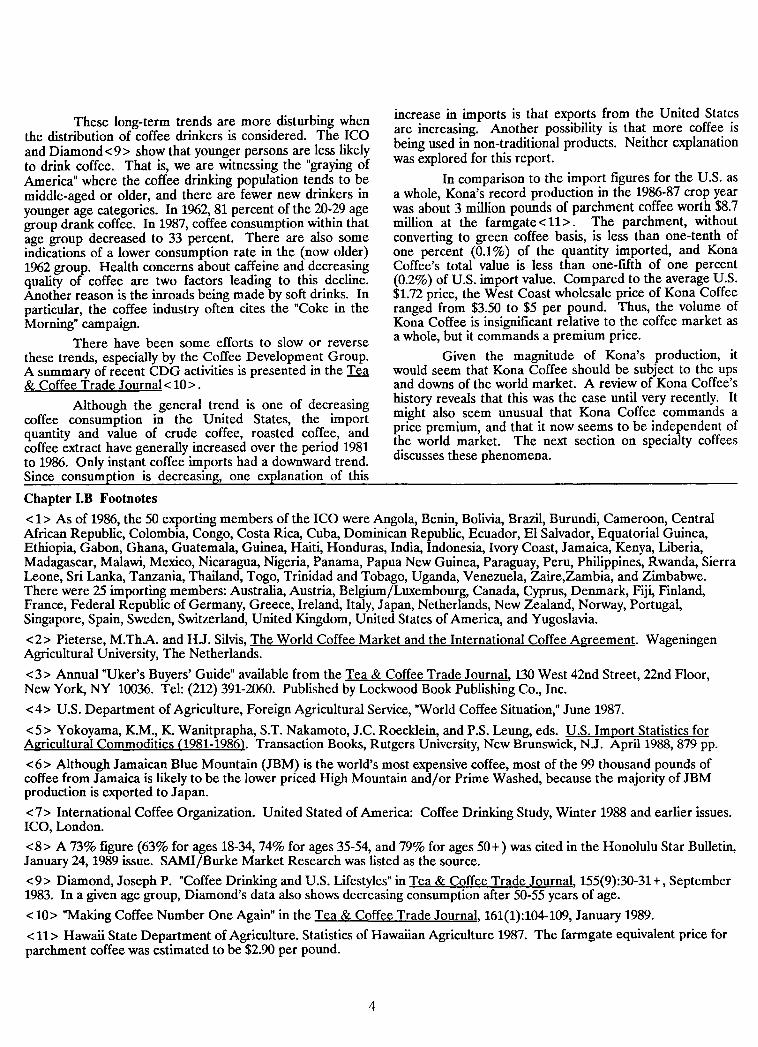
These long-term trends are more disturbing whenthe distribution of coffee drinkers is considered. The ICOand Diamond < 9 > show that younger persons are less likelyto drink coffee. That is, we are witnessing the "graying ofAmerica" where the coffee drinking population tends to bemiddle-aged or older, and there are fewer new drinkers inyounger age categories. In 1962, 81 percent of the 20-29 agegroup drank coffee. In 1987, coffee consumption within thatage group decreased to 33 percent. There are also someindications of a lower consumption rate in the (now older)1962 group. Health concerns about caffeine and decreasingquality of coffee are two factors leading to this decline.Another reason is the inroads being made by soft drinks. Inparticular, the coffee industry often cites the "Coke in theMorning" campaign.
There have been some efforts to slow or reversethese trends, especially by the Coffee Development Group.A summary of recent CDG activities is presented in the Tea& Coffee Trade Journal < 10> .
Although the general trend is one of decreasingcoffee consumption in the United States, the importquantity and value of crude coffee, roasted coffee, andcoffee extract have generally increased over the period 1981to 1986. Only instant coffee imports had a downward trend.Since consumption is decreasing, one explanation of this
increase in imports is that exports from the United Statesare increasing. Another possibility is that more coffee isbeing used in non-traditional products. Neither explanationwas explored for this report.
In comparison to the import figures for the U.S. asa whole, Kona's record production in the 1986-87 crop yearwas about 3 million pounds of parchment coffee worth $8.7million at the farmgate < 11> . The parchment, withoutconverting to green coffee basis, is less than one-tenth ofone percent (0.1%) of the quantity imported, and KonaCoffee's total value is less than one-futh of one percent(0.2%) of U.S. import value. Compared to the average U.S.$1.72 price, the West Coast wholesale price of Kona Coffeeranged from $3.50 to $5 per pound. Thus, the volume ofKona Coffee is insignificant relative to the coffee market asa whole, but it commands a premium price.
Given the magnitude of Kona's production, itwould seem that Kona Coffee should be subject to the upsand downs of the world market. A review of Kona Coffee'shistory reveals that this was the case until very recently. Itmight also seem unusual that Kona Coffee commands aprice premium, and that it now seems to be independent ofthe world market. The next section on specialty coffeesdiscusses these phenomena.
Chapter I.B Footnotes
< 1> As of 1986, the 50 exporting members of the ICO were Angola, Benin, Bolivia, Brazil, Burundi, Cameroon, CentralAfrican Republic, Colombia, Congo, Costa Rica, Cuba, Dominican Republic, Ecuador, EI Salvador, Equatorial Guinea,Ethiopia, Gabon, Ghana, Guatemala, Guinea, Haiti, Honduras, India, Indonesia, Ivory Coast, Jamaica, Kenya, Liberia,Madagascar, Malawi, Mexico, Nicaragua, Nigeria, Panama, Papua New Guinea, Paraguay, Peru, Philippines, Rwanda, SierraLeone, Sri Lanka, Tanzania, Thailand, Togo, Trinidad and Tobago, Uganda, Venezuela, Zaire,Zambia, and Zimbabwe.There were 25 importing members: Australia, Austria, Belgium/Luxembourg, Canada, Cyprus, Denmark, Fiji, Finland,France, Federal Republic of Germany, Greece, Ireland, Italy, Japan, Netherlands, New Zealand, Norway, Portugal,Singapore, Spain, Sweden, Switzerland, United Kingdom, United States of America, and Yugoslavia.
<2> Pieterse, M.ThA. and HJ. Silvis, The World Coffee Market and the International Coffee Agreement. WageningenAgricultural University, The Netherlands.
<3> Annual "Uker's Buyers' Guide" available from the Tea & Coffee Trade Journal, 130 West 42nd Street, 22nd Floor,New York, NY 10036. Tel: (212) 391-2060. Published by Lockwood Book Publishing Co., Inc.
<4> U.S. Department of Agriculture, Foreign Agricultural Service, "World Coffee Situation," June 1987.
<5> Yokoyama, K.M., K. Wanitprapha, S.T. Nakamoto, J.C. Roecklein, and P.S. Leung, eds. u.S. Import Statistics forAgricultural Commodities (1981-1986). Transaction Books, Rutgers University, New Brunswick, NJ. Apri11988, 879 pp.
<6> Although Jamaican Blue Mountain (JBM) is the world's most expensive coffee, most of the 99 thousand pounds ofcoffee from Jamaica is likely to be the lower priced High Mountain and/or Prime Washed, because the majority of JBMproduction is exported to Japan.
<7> International Coffee Organization. United Stated of America: Coffee Drinking Study, Winter 1988 and earlier issues.lCD, London.
<8> A 73% figure (63% for ages 18-34, 74% for ages 35-54, and 79% for ages 50+) was cited in the Honolulu Star Bulletin,January 24, 1989 issue. SAMI/Burke Market Research was listed as the source.
<9> Diamond, Joseph P. "Coffee Drinking and U.S. Lifestyles" in Tea & Coffee Trade Journal, 155(9):30-31+, September1983. In a given age group, Diamond's data also shows decreasing consumption after 50-55 years of age.
< 10> "Making Coffee Number One Again" in the Tea & Coffee Trade Journal, 161(1):104-109, January 1989.
< 11> Hawaii State Department of Agriculture. Statistics of Hawaiian Agriculture 1987. The farrogate equivalent price forparchment coffee was estimated to be $2.90 per pound.
4

I.C Specialty CoffeeExcept for Japan and a few other areas, coffee
consumption throughout the world has been declining, andthe United States is no exception. Health concerns aboutcaffeine consumption, a decrease in product quality, and astrong push by soft drink manufacturers targeting youngerconsumers are all cited as contributing factors to coffee'sdecline.
Most product segments of the coffee industry canbe characterized as "mature." Growth and/or profitabilityof industry participants are achieved by increasing marketshare at the expense of other fums. The industry is verycompetitive as marketing strategies focus on shelf space,packaging, and advertising and promotional campaignstargeted at wresting sales from the competition. Manyefforts are aimed at older consumers, while the youngergeneration seems to be conceded to soft drinkmanufacturers.
The market segment called specialty coffee targetsthe high end of the coffee market. Kona Coffee is identifiedas a specialty coffee, and exemplifies better quality andhigher price relative to regular retail coffees, which areperhaps the two most distinguishing characteristics ofspecialty coffees. Specialty coffees are usually identified bytheir country of origin (as compared to brand names insupermarkets), and are typically arabicas, high grown, andof best quality. Depending on the user and the context,specialty coffee also includes or excludes gourmet coffeesand coffees flavored with extracts of fruits, nuts, and variousliquors. Examples of the latter include chocolate, amaretto,almond, macadamia nut, Irish Cream, Kahlua, and GrandMarnier. The term specialty coffee traditionally refers tothose coffees sold in the whole bean form, but certain otherproduct forms such as dark roasts (e.g., Italian, European,Vienna, French), expresso, and cappuccino are more likelyto be associated with specialty coffee.
Along the lines of achieving and maintaining highquality, preparation of specialty coffee is more useroriented, with the emphasis on minimizing the time betweenroasting, grinding, brewing, and consuming the coffee.According to "Daw's first law of retail quality," the quality ofthe coffee in the cup varies inversely with the distance whichseparates the drinker from the roaster < 1>. Home roastersand grinders, special filters, and similar paraphernalia mayalso be involved because of what might best be described asthe rituals that are often associated with the consumption offine coffee. In many cases, the consumer's perception maybe of a higher quality product because of these rituals or"hype," although the actual quality may be no different fromother products.
In the past, specialty coffees were often associatedwith small independent roasters, and sales were more likelythrough small outlets that stress quality and service. Thesespecialty coffee outlets often serve coffee on the premises ina cozy, often intimate atmosphere. To a certain degreemuch of this is still true, but the use of the term specialtycoffee has become broader or more blurred, especially forthe consumer.
5
Specialty coffee has recently been the fastest, anddepending on definition, the only growing segment in thecoffee industry. Retail sales in the United States totaled$270 million in 1985, up from $60 million in 1981. This hasattracted a number of firms; over the same period thenumber of roasters had increased from 15 to 60. In 1985,there were reportedly 125 wholesalers of specialty coffees inthe United States and Canada<2>. Many of the largecommercial roasters now have their own specialty lines.Associated with this growth is the sale of specialty-typecoffees in the retail supermarket.
Some argue that these developments essentiallyreflect the expanding market of a new product, and that thesegment is maturing, as evidenced by slower or stagnantgrowth in certain cities. They also maintain that the entry ofcommercial roasters further indicates an impendingshakeout in specialty coffee. Nevertheless, and althoughpurists may not consider all premium priced (and especiallyground) products to be specialty coffee, it is clear thatregardless of product form, the premium priced productsare being merchandised as specialty coffee and thatsupermarkets have become a major outlet for specialtycoffee. Both the specialty coffee outlets and supermarketsare further discussed in Chapter III.
Chapter I.C Footnotes
<1> Daw, Stuart. "Coffee's Image Still Needs Upgrading"in Tea & Coffee Trade Journal, 157(1):57-62, January 1985.
<2> Schoenhold, Donald N. "A Look into the SpecialtyTrade" in Tea & Coffee Trade Journal, 157(12):3-6,December 1985.
CHAPTER II: THE KONA COFFEE INDUSTRY
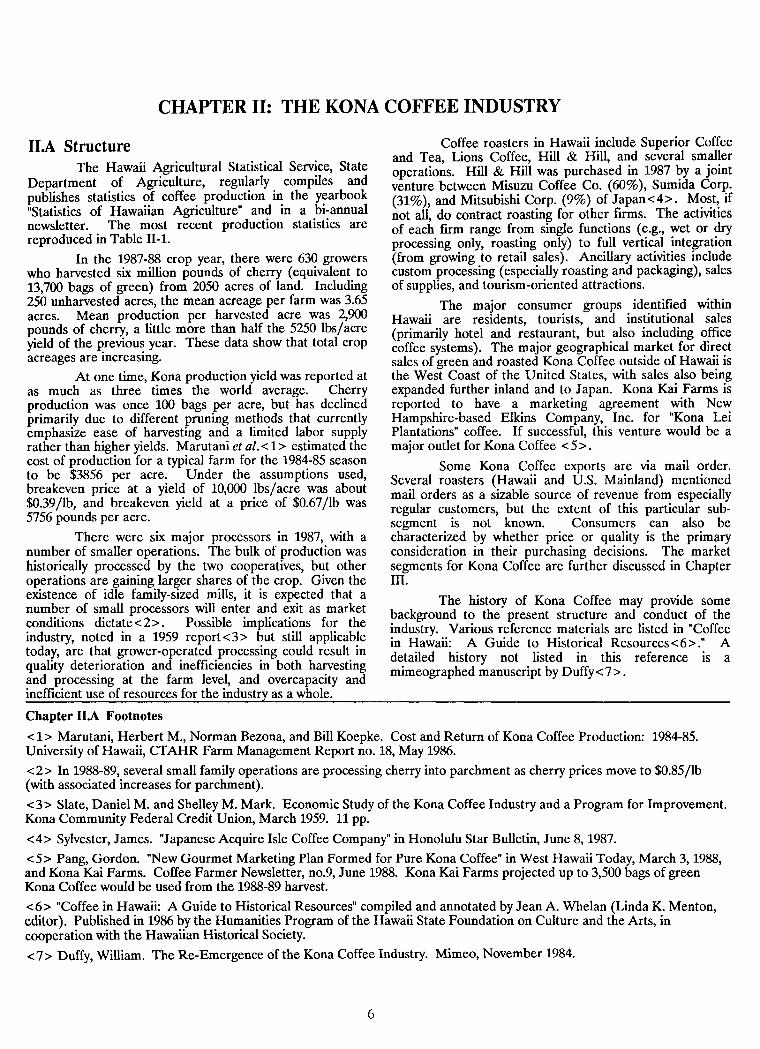
II.A StructureThe Hawaii Agricultural Statistical Service, State
Department of Agriculture, regularly compiles andpublishes statistics of coffee production in the yearbook"Statistics of Hawaiian Agriculture" and in a bi-annualnewsletter. The most recent production statistics arereproduced in Table 11-1.
In the 1987-88 crop year, there were 630 growerswho harvested six million pounds of cherry (equivalent to13,700 bags of green) from 2050 acres of land. Including250 unharvested acres, the mean acreage per farm was 3.65acres. Mean production per harvested acre was 2,900pounds of cherry, a little more than half the 5250 lbsjacreyield of the previous year. These data show that total cropacreages are increasing.
At one time, Kona production yield was reported atas much as three times the world average. Cherryproduction was once 100 bags per acre, but has declinedprimarily due to different pruning methods that currentlyemphasize ease of harvesting and a limited labor supplyrather than higher yields. Marutani et ale < 1> estimated thecost of production for a typical farm for the 1984-85 seasonto be $3856 per acre. Under the assumptions used,breakeven price at a yield of 10,000 lbsjacre was about$0.39lIb, and breakeven yield at a price of $0.67lIb was5756 pounds per acre.
There were six major processors in 1987, with anumber of smaller operations. The bulk of production washistorically processed by the two cooperatives, but otheroperations are gaining larger shares of the crop. Given theexistence of idle family-sized mills, it is expected that anumber of small processors will enter and exit as marketconditions dictate<2>. Possible implications for theindustry, noted in a 1959 report < 3 > but still applicabletoday, are that grower-operated processing could result inquality deterioration and inefficiencies in both harvestingand processing at the farm level, and overcapacity andinefficient use of resources for the industry as a whole.
Coffee roasters in Hawaii include Superior Coffeeand Tea, Lions Coffee, Hill & Hill, and several smalleroperations. Hill & Hill was purchased in 1987 by a jointventure between MisuZll Coffee Co. (60%), Sumida Corp.(31%), and Mitsubishi Corp. (9%) of Japan<4>. Most, ifnot all, do contract roasting for other firms. The activitiesof each fIrm range from single functions (e.g., wet or dryprocessing only, roasting only) to full vertical integration(from growing to retail sales). Ancillary activities includecustom processing (especially roasting and packaging), salesof supplies, and tourism-oriented attractions.
The major consumer groups identified withinHawaii are residents, tourists, and institutional sales(primarily hotel and restaurant, but also including officecoffee systems). The major geographical market for directsales of green and roasted Kona Coffee outside of Hawaii isthe West Coast of the United States, with sales also beingexpanded further inland and to Japan. Kona Kai Farms isreported to have a marketing agreement with NewHampshire-based Elkins Company, Inc. for "Kona LeiPlantations" coffee. If successful, this venture would be amajor outlet for Kona Coffee < 5 > .
Some Kona Coffee exports are via mail order.Several roasters (Hawaii and U.S. Mainland) mentionedmail orders as a sizable source of revenue from especiallyregular customers, but the extent of this particular subsegment is not known. Consumers can also becharacterized by whether price or quality is the primaryconsideration in their purchasing decisions. The marketsegments for Kona Coffee are further discussed in ChapterIII.
The history of Kona Coffee may provide somebackground to the present structure and conduct of theindustry. Various reference materials are listed in "Coffeein Hawaii: A Guide to Historical Resources<6>." Adetailed history not listed in this reference is amimeographed manuscript by Duffy< 7 > .
Chapter II.A Footnotes
< 1> Marutani, Herbert M., Norman Bezona, and Bill Koepke. Cost and Return of Kona Coffee Production: 1984-85.University of Hawaii, CTAHR Farm Management Report no. 18, May 1986.
<2> In 1988-89, several small family operations are processing cherry into parchment as cherry prices move to $0.85jlb(with associated increases for parchment).
<3> Slate, Daniel M. and Shelley M. Mark. Economic Study of the Kona Coffee Industry and a Program for Improvement.Kona Community Federal Credit Union, March 1959. 11 pp.
<4> Sylvester, James. "Japanese Acquire Isle Coffee Company" in Honolulu Star Bulletin, June 8, 1987.
<5> Pang, Gordon. "New Gourmet Marketing Plan Formed for Pure Kona Coffee" in West Hawaii Today, March 3, 1988,and Kona Kai Farms. Coffee Farmer Newsletter, no.9, June 1988. Kona Kai Farms projected up to 3,500 bags of greenKona Coffee would be used from the 1988-89 harvest.
<6> "Coffee in Hawaii: A Guide to Historical Resources" compiled and annotated by Jean A. Whelan (Linda K. Menton,editor). Published in 1986 by the Humanities Program of the Hawaii State Foundation on Culture and the Arts, incooperation with the Hawaiian Historical Society.
<7> Duffy, William. The Re-Emergence of the Kona Coffee Industry. Mimeo, November 1984.
6

Table II-I. Kona Coffee Production Statistics
cherry! parchment parchment green
crop harvest volume volume value volume
year acres acres (000#) (000#) ($000) (000#)
1983-84 2000 1800 9800 2800 6300 na
1984-85 2000 1700 6125 1750 4813 na
1985-86 2100 1650 6475 1850 5180 1535
1986-87 2300 2000 10500 3000 8700 2400
1987-88 2300 2050 5950 1700 4845 1370
1 Computed using 3.5:1 cherry to parchment conversion factor.
Source (except cherry volume): Hawaii Agricultural Statistics Service, "Statistics of Hawaiian Agriculture1987," Hawaii State Department of Agriculture, annual.
Table 11-2. Conversion Rates between Coffee Products
Equivalents to Equivalents toproduct 100 lbs roasted 100 lbs cherry
cherry 600 100parchment 150 25green 120 20roast 100 16.6
Table 11-3. Typical Kona Coffee Yield, by Grade
Peaberry6%
Extra Fancy13%
Fancy26%
7
#145%
Prime &3X10%

II.B Product Characteristics
II.B.1 GradesKona Coffee, like most other coffees, goes through
several stages of processing between the original cherry andthe cup of final product. Actual conversion ratios betweenproduct in the different stages are affected by a number offactors, including weather conditions at time of harvest, thesize distribution of coffee beans, the degree of roast, andthe method used in "quenching," or cooling the roastedproduct (i.e., air vs. water). "Typical" conversion ratios arecherry to parchment 4:1, parchment to green 1.25:1, andgreen to roast 1.19:1. Using these factors, the quantitiesderived from 100 lbs of cherry or conversely, required to get100 lbs of roasted product are presented in Table 11-2.
With regards to grades and standards, there is asystem of grades for Kona Coffee and for Hawaii coffeeunder the Administrative Rules of the Hawaii StateDepartment of Agriculture < 1> . Cherry can have threegrades according to the percentage of defects and theforeign material content. #1 can have no more than 2%defects and 0.125% foreign material, #2--7% defects and0.25% foreign material, and #3--12% defects and 0.25%foreign material. The Kona Farmers Cooperative is theonly wet processor that is known to grade cherry.
Parchment grades are A, B, and Offgrade. Thegrades of green coffee based on size, appearance, andnumber of defects are Extra Fancy, Fancy, #1, Prime Green(#2), #3, and Offgrade, with a category calledPeaberry<2>. The higher grades and Peaberry areespecially attractive for products being sold as whole bean.#3 is the regular commercial grade; product grading outbelow #3 legally cannot have the Kona name.
Green coffee is mechanically graded by size withsorting screens, then by density with a gravity separator.Processed lots are then sampled for the number of defectsand for cupping. As a general rule, less defects areassociated with better cupping quality, but it is also possiblefor the best grades to cup poorly.
The yield of a crop between the grades will varyfrom year to year depending on weather, productionpractices (e.g., pruning, fertilization, weed control) treestress and nutrition, size of the current crop per tree, andother factors. A "typical" breakdown of Kona Coffee isgiven in Table 11-3. Many, if not most processors will try toupgrade the product by increased sorting, etc. so as toreduce the content of defects and damaged beans and forbetter sizing. As a result (and also to further pricedifferentiate the market), some processors have also addeda number of "sub-grades", for example High, Medium, andLow Fancy.
II.B.2 PricesThe only coffee priced consistently higher than
Kona is Jamaica Blue Mountain, with 1987-88 prices of$6.50lIb for green coffee out of Jamaica (if available) <3 >and around $11jlb if purchased via Japan. At the green
8
level, Kona Coffee typically has a $2.50 to $3.00 premiumover other high quality coffees. Some of the stated reasonsfor this difference are the higher quality of Kona Coffee, astrong demand for the product, the limited supply of Kona,the relative market power of the suppliers (until veryrecently, a thinly traded market because of Superior Coffeeand Tea's control of supply), intrinsic characteristics (image,allure, romance of Hawaii, reputation), and high productioncosts.
In 1987, per pound prices for pure Kona Coffeewere $0.50 to $0.60 for cherry<4>, $2.55 for parchment,$3.50 to $4.70 for green, $6 to $7 for roasted wholesale, and$7 to $14 at retail. In a February 1986 article, prices werelisted at $9.95 to $11.95/lb to retailers, $7.50 to $8.50/lb toroasters, $4.00 to $5.oo/lb to brokers, $2.50 to $3.00/lb toprocessors, and $0.50 to $0.75jlb to farmers<5>. 1987 U.S.prices for all roasted coffee were $2.79 to $3.3Ojlb atwholesale, and $2.73 to $3.24jlb at retail<6>.
Most West Coast roasters reported earning less onKona than on other coffees; a typical figure was $ljlb"margin" <7> for Kona at wholesale versus $1.50lIb forothers. Because other coffees also cost less, the percentagereturn is lower but Kona Coffee must be carried because ofbuyer requests--i.e., roasters need to carry a full productline. Specialty retailers were tteported to be willing to buyKona Coffee at a high price as long as the product moves.As a rule of thumb for coffee in general, the trade considersthe value added to the cost of green coffee to consist of 16%for shrinkage plus a charge for roasting, typically 4-5 centsper pound of green coffee. On the other hand, typical retailmargins were estimated by roasters at 35% to 50%, versus25-30% for regular coffees.
There are a number of reasons for pricedifferences observed at anyone level. The quality of thecoffee is a major factor. For example, Prime green mightsell for $4, #1 for $4.45, Fancy for $4.55, and Extra Fancycould command "whatever price the seller wants." Somereported that an unspecified amount of damaged coffeecoupled with a large harvest "was causing havoc" withmarket prices. Depending on the size of the total harvest,the timing of the purchase within the season could be animportant factor. Related to timing is the carrying cost ofholding inventory; at 12%, the interest cost on a bag ofgreen Kona Coffee is nearly $5.00 a month.
Most sellers offer some type of volume discount,and firms handling a large volume usually have economiesof size. The volume also affects the mode and cost oftransportation. Transportation costs vary between ship, airfreight, mail, or courier (UPS, Federal Express, etc.) andthe distance; the differential between the East and WestCoast was reported to be 7-8 cents/lb. Location also has animpact because·of demand. For example, retail margins forall products are reportedly 25% outside of Waikiki and 25%to 35% in Waikiki.
Prices are affected by packaging. Valve bags mayadd to shelf life but could cost 24-25 cents each, versus 10-

12 cents for a paper bag. A common strategy in otherproducts is to charge more on a per pound basis for smallerpackages, partly because of increased handling and certaincosts that change little between package sizes. At the otherextreme, bulk bins may minimize packaging and handling bythe seller, but entail other costs. Another strategy is to usedifferent package sizes that cannot be easily compared.Related to the above are processing practices and thedegree of processing. For example, a darker roast typicallyweighs less than a light roast of the same volume. Anotherexample has to do with the degree of quenching; an oftenheard complaint was that certain roasters added weight totheir product by using excess water in the cooling process.
The last major determinants of prices consideredare the degree of vertical integration and the business andmarketing strategies of the fIrm. For example, a roaster/retailer who purchases green coffee direct from processorshas more flexibility in pricing than if the product was boughtand sold through every possible marketing level. In theextreme, some operations are fully integrated from growingto retailing.
II.B.3 Product DifferentiationAny good which has some characteristics or
attributes that distinguish it from others can be called aseparate product. Product differentiation is the process ofcreating this distinct set of characteristics. A successfullydifferentiated product has something unique, or some"gimmick," that consumers are willing to pay for.
Chapter II.B Footnotes
The widest range of Kona Coffee products is foundin Kana, followed by locations attracting many tourists. Theprimary product forms are pure (100%) and blended KonaCoffee, sold as regular or decaffeinated ("decaf') and aswhole bean, ground, or instant. Some blends are flavoredwith extracts such as macadamia or chocolate, and someblends recently name other specific coffees in addition toKana. At least one firm is known to offer an "organicallygrown" product. Coffee is decaffeinated via either thechemical or water processes, and is usually shipped to as faras Europe to be processed. Decaf typically commands ahigher price because of the added processing costs andweight lost in the process (about 15 percent of the originalweight).
Products are sold in cans, jars, paper or foil bags,cello bags, valve bags, and in bulk bins. Container sizes aretypically from eight ounces to a pound, although there issome movement towards smaller sizes such as two ounces.Package appearance ranges from product and companynames stenciled on brown paper bags, to one product with apackage within an outer burlap bag, and another with a foilbag cushioned by packing material within an outer box.Some sport reproductions of photographs and paintings,graphics range from simple to ornate and often with aHawaiian motif, others have lettering on a plainbackground.
Other products using the Kona Coffee nameinclude flavored candies, chocolate covered coffee beans,and Kona Coffee liquor (the Kona Coffee Festival promotesrecipes using Kana Coffee). The extent to which theseproducts actually contain Kona Coffee (and thus contributesto industry sales) is unknown, and undoubtedly varieswidely.
<1> Hawaii State Department of Agriculture. Hawaii Administrative Rules, Title 4, Subtitle 4 Division of Marketing andConsumer Services; Chapter 43 Standards for Coffee.
<2> In the past, peaberry commanded a high price, comparable to the top grades, because consumers (especially in thePhilippine market) were able to evenly roast coffee in a frying pan. Peaberries are again in demand in the specialty coffeemarket. Some claim that the flavor from two beans has been concentrated into the single peaberry.
<3> Comparable prices were 3.75/1b for High Mountain and $3.oo-$3.20/lb for Prime Wash.
<4> In the 1988-89 season, observed prices reached $0.85/lb at farmgate and $4.25/lb for parchment in Kona, $5.50-$7.00for green (including resale on the West Coast) and the equivalent of $33 per pound at some retail outlets.
<5> Cox, Daniel C. "Kona--America's True Cup" in Fancy Food & Candy, February 1986, pp. 51-53.
<6> U.S. Department of Agriculture, Foreign Agricultural Service. World Coffee Situation, Tables 9 and 10. We speculatethat the reason for the discrepancy (i.e., wholesale higher than retail) is at least partially because retail prices are based oncanned coffee only, whereas wholesale prices may include more expensive products.
<7> Margin was used by different roasters to mean "profit", profit plus overhead, the difference between sales price and anundefined level of costs.
9

CHAPTER III: MARKETS FOR KONA COFFEE
IlIA Classifications of "Markets" for KonaCoffee
There is no one single, homogeneous market forKona Coffee. Instead, the "market" for Kona Coffeeconsists of a number of segments, each of which can beconsidered a market in itself. Different interests within theindustry deal with different segments. Further, differentsegments are in different stages of development, so havedifferent marketing needs < 1> . These differences areperhaps the major reason for the lack of industry cohesion.
These market segments are based on differentcombinations of product form, market channel, and fmalconsumer (Figure 111-1). There are theoretically 18 possiblecombinations that can be viewed as a three-dimensionalmatrix (Figure 111-2), but in practice several possibilities arenegligible or difficult to define (e.g., export blends), whileothers can be combined.
The product form deals with whether coffee is soldas a blend or as 100% pure Kona Coffee. The marketchannels concerns the outlets through which Kona Coffeereaches the final consumer. The distinguishing features ofeach channel are the type of customers and the form of theproduct. There are three channels: (1) institutions,including hotels, restaurants, and office coffee systems(OCS); (2) specialty or gourmet coffee outlets, involvingspecialty coffee shops, mail order businesses, and somedepartment stores; and (3) retail outlets, consisting ofsupermarkets, tourist shops, and some department stores;
Final consumers are divided into Hawaii residents,tourists, and an export market. The fIrst two concernpurchases made within the State, while the export categoryrecognizes that most decisionmaking occurs out of theState. Hawaii residents purchase Kona Coffee for gifts andfor their own consumption (including consumption at homeand when dining out). Tourists also drink Kona Coffee inlocal establishments, and purchase gifts and souvenirs.Anecdotal evidence stressed a difference between touriststhat were westbound (from continental U.S.) and eastbound(from Asia, notably Japan). The export market is mostly tothe West Coast, although the rest of the Mainland, Japan,and perhaps Europe could be large potential markets <2> .
Obviously, these market segments could be brokeninto even smaller units. Furthermore sellers and buyersmay inhabit more than one market segment at varioustimes. The important point is that the needs of a buyer willvary depending upon their location in market segmentspace. Given these differences the marketing approach toprofitably satisfy these needs will also vary.
The basis of market segmentation is that not allcustomers have the same needs, wants or desire. Bytargeting and developing a product and marketing strategywhich satisfies the needs of a specific segment of thecustomer base a fIrm or industry may achieve a competitiveadvantage, and thus higher sales and net profits. Throughproper targeting, a product becomes differentiated in theeyes of the customer and a consumer franchise is developed.
10
Surveys were conducted on tourists and Hawaiiresidents. Personal interviews, secondary data, and nonpublished information were used to examine the remainingsegments, especially the local retail market and Japanesemarket.
Chapter IlIA Footnotes
<1> Throughout this document, "marketing" is used in thebroader sense, i.e., not only advertising and promotion, butall functions in getting the product/service from theproducer to the final consumer.
<2> The following two references studied (1) the marketfor coffee in Europe, and (2) Germany as a possible exportmarket for Kona Coffee.
a. E.R.C. Statistics International Ltd. The Marketfor Coffee in Europe (London). Volume one summarizedin "From the E.R.C. Survey: The Market for Coffee inEurope" in Tea & Coffee Trade Journal, 161(1):86-96,January 1989.
b. Winter, Lothar G. A Market Survey of KonaCoffee Export Possibilities to Germany. Honolulu, HawaiiCoffee Industry, Inc., February 1962.

Figure m-l. Segmentation ofKona Coffee Markets
Product Form: Market Channelsor Outlets:
Final Consumers:
Export
Institutional
Specialty/Gounnet
1000/0
(pure)
Kona
Coffee
Kona
mend
Supermarket!
General Retail
11

FINAL CONSUMERS
JI r-u:=J
OJ ~ 0c.. 0~ cr
0.-
T~~tsV../
/' ~IL~. crCD 0
LL/
//
0/'
/'
HawaiiResiden
Export
~
N /
Figure 111-2. Kana Coffee Market Segment Matrix

III.R Product FormMost roasters produce blended Kona Coffee, while
a smaller number will also produce a pure Kona Coffee. Inso doing the roasters are attempting to target a differentmarket segment as identified above. An operati~g
assumption which will be used ~hrougho~t the analyses ISthat any frrm in the coffee In.dus~ry IS attem~tlng tomaximize its profit. Thus, a combmatlon of strategtes, suchas selling both pure and blended coffee, may be pursued.Although many of the roasters interviewed believed thatKona blends had the potential to damage the product'simage, virtually all roasters marketed a Kona blend. Mor~
Kona blend is sold than pure Kona, and at least for retaIloutlets probably in a ratio that reflects shelf space.Howe~er, the actual amounts of Kona Coffee being movedas both product forms are not known.
In most cases, it will be argued that Kona blendsand pure Kona Coffee appeal to different consumersegments. Pure Kona is viewed more as a luxury item thanis blended Kona Coffee. Purists also maintain that the fullcharacteristics of Kona Coffee can only be experienced withthe unblended product. It is certain proper handling isnecessary to maintain quality. As such, pure Kona Coffee isfound more predominantly in the gourmet or specialtycoffee outlets. However, this does not preclude its sale inother market outlets. Kona blend may also be sold inspecialty and gourmet outlets as some customers may preferit over pure Kona.
There are at least five reasons to produce a Konablend. First,blends target a different market segment thandoes pure Kona Coffee. While still more expensive thanmost other blends, Kona blend is more likely to appeal tothose customers of coffee who are more price consciousthan are the consumers of pure Kona Coffee.
Second, to maintain their own accounts, roastersmust be able to offer a full product line, and they must beable to offer the product on a consistent basis. Blendingenables roasters to stretch a limited supply of pure Kona.Third, related to the limited supply, blending enablesroasters to better use Kona Coffee's reputation and imageand expand sales by offering product at a lower price.
The last two reasons have direct economic impactson the firms. Fourth, economies of size may be achieved inroasting and packing through the blending of Kona Coffee.For example, the larger volume may allow existing capacityto be fully utilized, or it may warrant the purchase of larger,more efficient equipment. Finally, blends are often moreprofitable, especially for certain market segments.
A roaster producing Kona blend for the touristmarket via retail outlets is likely to have different goals andoperating conditions than a firm targeting specialty coffeeshops with pure Kona Coffee. In general, the divergence ofopinion and conflict within the Kona Coffee industry can betraced to the different market segments being pursued by itsindividual members. By pointing out the differences, thesemarket classifications can help to identify some commonground or mutual areas for cooperation and coordinated,unified industry activity. The issue of pure versus blendedKona Coffee is further discussed in Chapter IV.
13
III.C Market Channels or Outlets
III.C.I The Institutional MarketThe institutional or food service market, comprised
of hotels, restaurants, office systems, vending machines, andhospitals, has traditionally been a major market for KonaCoffee. This market is large: in 1987, one out of every threeretail firms in the state, or 1870 businesses, were restaurantsand bars < 1>. There were also some 69,000 rooms in 195hotels. At an 81.1% occupancy rate, this is a potential 20.4million cups of coffee, if each room used one cup of coffee.Some industry participants have noted that a large hotel orrestaurant can move as much coffee in a week as a roaster,i.e., 300 pounds of roasted product per week. At that rate,the entire 1987-88 crop could have been taken up by lessthan 90 hotels/restaurants serving pure Kona.
A 1963 survey estimated that 53 percent ofHonolulu restaurants served Kona Coffee and that another33 percent were willing to do so <2> . A more recentestimate pegs usage at 90-95% of the hotels and at least60% of other institutional establishments. Even though theextent of pure versus blend usage is not known, there islittle doubt that the potential market for Kona Coffee ishuge. A recent figure published by the U.S. Department ofAgriculture estimated that the average household spends 42percent of its annual food budget on meals away fromhome. There are few reasons to doubt that Hawaiiresidents differ from the national average (if anything,Hawaii residents may eat out more often, especially giventhe number of families with two wage earners) and as theabove figures indicate, the tourist population is huge as well.
The keys to entering this market segment are a costcompetitive product, the related services provided by thedistributor (including provision and service of brewingmachines), and the ability to deliver on a consistent basis.Although most institutions attach large margins to theircoffee, their purchase decision is based primarily on the costof the product. Thus, the product form being moved ismostly Kona blend. Several roasters noted that pure KonaCoffee could be offered at a cost difference of less than anickel per cup. It is uncertain whether this cost difference issufficient to discourage buyers, or whether sellers have notpromoted the notion that this is a small cost for the addedvalue of having pure Kona.
Servicing a large number of accounts is probablybeyond the capacity of most firms within the Kona Coffeeindustry except for a few major actors, especially if dealingwith the unblended product on a consistent basis. However,there seems to be opportunities for smaller firms to servicea few select accounts, notably with pure Kona Coffee.
There are several perceived problems in theinstitutional market segment. First is the weak, often nonexistent differentiation between pure Kana Coffee andKona blends. Menus throughout the state typically list only"Kana Coffee," and sometimes don't even mention Kona.Second institutions are often criticized for their handling ofcoffee. ' Burnt or stale coffee, reheated coffee, and dirty orsoapy equipment are included in a long list of complaints.

The quality of the coffee might be excellent going into theestablishment, after which poor treatment ruins the product.
Third is the market share occupied by other coffees(e.g., Yuban and Maxwell House), including the observationthat some establishments in Kona do not sell Kona Coffeein any form. However, we suggest that serving Kona Co~fee
in every restaurant and hotel may not be an appropriategoal at this time, especially if the quality maintenance issueis not addressed.
Although the institutional market is primarilyserviced by larger firms, the industry as a whole will gain byassisting institutions in the promotion and use of KonaCoffee. The major reason is the excellent opportunity thathotels and restaurants provide for exposing potentialcustomers to a new product. There is a longer-term goal toassisting institutions, and that is to increase the awarenessand experience level of consumers to where they becomeregular Kona Coffee buyers. All other market segmentsthen stand to benefit. Visitors typically have little choiceexcept to use hotels and restaurants, and many are receptiveto new products and experiences while in Hawaii. If justone percent of the 6.1 million visitors in 1988 becameregular customers, the payoff from an institutional programwould be 61,000 new clients.
Residents are also major institutional clients, andon a repeating basis. In especially the gourmet or luxuryestablishments, the experience and atmosphere areconducive to exposing both visitors and residents to whatmight otherwise be a "pricey" (and therefore untried)product. These outlets also allow the industry to targetcertain groups of consumers.
The institutional market segment thereforeprovides a unique opportunity to utilize this "captiveaudience." Further, dollars spent here are more effective.The audience is already attuned or receptive to promotion.And, rather than a nationwide program or a localizedversion duplicated in many cities, efforts are concentrated ina limited geographical area.
To fully utilize this opportunity, the Kona Coffeeindustry must maintain high quality to protect KonaCoffee's reputation and its image. If the Kona name is tobe on the product, we need to be sure that product is of thebest quality possible. Otherwise, the hotel and restaurantclients will try a poor product, wonder why it has so muchpublicity and such a high price, and never bother with KonaCoffee again. An important part of the institutionalprogram therefore will be efforts aimed at educating andmotivating institutional employees in proper handlingtechniques.
Other activities are promotional discounts duringcertain periods (e.g., to coincide with the Kona CoffeeFestival or other events focusing on Kona), or in exchangefor including Kona Coffee in firms' advertising. Theindustry could provide the advertising copy itself, or it mightsubsidize reprinting costs if the new menu highlights anddifferentiates Kona Coffee. Other possibilities arediscussed in Chapter V.
14
III.C.2 Specialty MarketIn one frrm's experience<3>, a certain unnamed
city with a population of ·about 3 million has some 300outlets for specialty coffee, of which 70 were full-fledgedspecialty coffee stores and the remainder sold otherproducts besides coffee. Each full-fledged store averagedsales of about 1,000 pounds per month, and each part-timestore averaged about 200 pounds per month. Total sales inthis city from specialty outlets therefore averaged 116,000pounds per month.
One might expect conditions in Hawaii to beproportionately scaled, but especially compared to othermarket segments, specialty coffee outlets play a relativelylimited role in the state. The telephone directory yellowpages lists seven retail coffee outlets on Oahu, two onKauai, eight on Hawaii (including three affiliated withprocessors), and five on Maui. This may reflect thedemographic characteristics of Hawaii consumers, includingthe tourist:resident mix, and also the fact fact that Hawaii isa producing area and located in the subtropics. Much of theKona Coffee being consumed under the more traditionaldefinitions of specialty coffee is being exported out ofHawaii. Nevertheless, a lot of Kona Coffee is sold via otherretail outlets, most notably those affiliated with the touristtrade.
As discussed in Chapter I, supermarkets andspecialty coffee outlets are strongly interrelated. Ratherthan being separate from traditional specialty outlets,supermarkets pose challenges of a different degree. Assupermarket retailers gain more experience in handlingspecialty coffees and as more supermarkets adopt upscaleformats, many differences will diminish. Furthermore,many developments at the supermarket mirror not onlywhat is occurring in the specialty shop, but also events atother retail outlets (i.e., department stores, tourist-orientedshops). Lessons learned from anyone are applicable to theother outlets. Although the following may mention aspecific type of retailer, the discussion is also pertinent toother retail operations.
In the supermarket and most retail operations, theacquisition of shelf space and shelf location is highlycompetitive. Retailers look for products with either highturnover and/or high margins, and both are stronglyinfluenced by what happens with shelf space. For certainretailers, Kona Coffee brands compete not only amongthemselves, but with other coffees as well. With otherretailers, products such as macadamia nuts are among thecompetition. With the adoption of universal product codes,retailers are better able to track the performance ofindividual products and thus, are better able to cull productsthat don't perform to expectations. Furthermore,supermarkets possess limited brand loyalty. All otherfactors being equal, they will select the product from thefrrm that offers the best deal. Suppliers must also considerthe different services that need to be offered. Specialtyshops may restock their own bins, but suppliers may need toprovide this service to supermarkets. So, the Kona Coffeeindustry must weigh the different total returns per unitagainst the potential sales through the various outlets.

Given the competition over shelf space, theestablishment of consumer loyalty is highly desirable.Strong consumer loyalty will lessen the ability of the retailerto bargain with the roaster. Popular methods targeted atachieving brand identification in supermarkets are displays,attractive and distinctive packaging, in-store sampling, pointof purchase materials, and of course, a quality product.
Another challenge is the maintenance of qualityonce the product is in the outlet. Most retailers outside ofspecialty coffee shops probably know little aboutmaintaining coffee quality (and probably have little interestor incentive in doing so). Packaging can have a vital rolewith respect to maintaining product integrity. If educationis desirable, either the individual roaster or the industry ingeneral must assume the responsibility of educatingretailers. Furthermore, quality maintenance may requirethe roaster to service the store to uphold quality and rotatestocks. A major Hawaii roaster with a significant presencein the Honolulu market employs many of these practices,and apparently with a fair measure of success.
A recent study commissioned by the CoffeeDevelopment Group (COG) regarding the perceptions ofwhole bean and non-whole bean purchasers highlightsseveral opportunities for growth <4>. The study found thatonly one out of five coffee drinkers regularly purchasedwhole bean coffee. Almost 60 percent of coffee drinkersrarely or never purchased whole bean coffee. Notsurprisingly, those respondents who drank whole beancoffee on a regular basis could be characterized as moreaffluent and having a higher level of education than thosewho were not whole bean drinkers. The consumption ofwhole bean coffee is related to lifestyle. This informationcould be useful in targeting retail outlets for the sale ofKona Coffee, as well as for potential mail order sales.
Supermarkets are not ignorant of this informationand the use of target marketing. More and more chains aredesigning their stores to individually match the tastes andwants of the local community. The use of chain-wideformat is going by the wayside. This provides an opportunityfor roasters who may be unable to supply the volume tomeet the needs of an entire chain. However, they may beable to provide enough for select stores within a chain.
The COG study also found that while salespeoplein specialty stores were perceived as knowledgeable, theymade actual recommendations only in a few sales. Very fewrespondents found supermarket salespeople to be useful.Most respondents, including those who rarely or neverpurchased whole bean coffee, indicated they would welcomebrochures containing information such as place of origin,coffee cupping characteristics, and storage or brewingsuggestions. Their responses also indicated that they arenot interested in a lot of self-praise or puffery in the deliveryof this information.
These results suggest that a more aggressivemarketing stance in both the specialty shop and thesupermarket would be useful to individual firms, andpossibly to the Kona Coffee industry as a whole. Suchactivities might include merchandising kits and newslettersto keep retail outlet operators and their sales staff fully
15
informed. Informational needs include the uniqueattributes of Kona Coffee and how it should be prepared forbest results. In conjunction, incentives could be created togarner more personal commitment from the retail outletand its employees. For example, a tour to Hawaiiassociated with the Kona Coffee Festival could be a salesincentive award, as well as a good educational tool. In-storesampling would be an effective tool for increasing sales,especially for introducing the first time buyer to KonaCoffee. Other suggestions are presented in Chapter V.
III.C.3 Hawaii SupermarketsUniform Product Code (UPC), or barcode data,
was obtained from three cooperating supermarket chains(22 outlets) to identify actual sales of coffee in the localsupermarket segment. The raw data are generated by theUPC bars on the packages as the items are rung up at thecash register. Data were available for the period February1986 through November 1987.
There are two major weaknesses with the data.First, because of confidentiality, prices are not (as of yet)reported - only volume figures were available for this study.This is especially a problem in identifying trends, becausepromotional discounts at one store or chain typically has astrong impact on other outlets in the area. The analysis istherefore based only on the pounds sold, and should beinterpreted accordingly. Second, not all firms cooperated inproviding data, but there are no apparent differencesbetween the cooperating outlets and other Oahusupermarket chains. Oahu is the largest market based onpopulation; while there may be demographic differencesfrom the Neighbor Islands, these are not expected to besignificant for this market segment. We therefore believethe analysis is representative of supermarkets throughoutthe state.
Figure 111-3 shows sales in the cooperatingsupermarkets for commercial, specialty (including KonaCoffee)<5>, and soluble (instant) coffees. Total sales bythe reporting stores averaged 4600 pounds per month ofspecialty coffees, 31.6 thousand lbs/month of commercialcoffee, and 9800 lbs/month of soluble coffee over the 22month period in which data were collected. In Figure 111-4,specialty coffees represent 12.7 percent of regular coffeesales (specialty and commercial--solubles not included).There were 71 separate products. Judging from 34 of theseproduct descriptions, the market share of coffees labelled"Kona" is 9.4 percent of regular coffee. Kona-Iabelledproducts outsold other specialty coffees by a 3-to-1 ratio.Again, these figures are only representative ofsupermarkets, and do not include sales from specialty shops,tourist outlets, and other retail establishments.
Decaffeinated products accounted for eight percentof specialty coffee sales and 7 percent overall. Forty-sixpercent of specialty coffees were labelled as whole beans.This result is opposite of the commercial segment in whichthe ground form is predominant.

Figure m-3. Sales ofCoffee in Selected Hawaii Supermarkets, 1986-1987
-e- Ground -0- Soluble -.- Gourmet
0- -o~ 0 _____20,000 5 0 0 0 ~ --.........0---- 0 0
1 -----o~ .10,000 • • • • .--- - ••••
0.1 I I I I I I I I I I1986 1987
F-M A-M J-J A-S O-N D-J F-M A-M J-J A-S O-N
TWO-MONTH PERIOD
30,000
90,000
.~.""./.",.~.80,000
70,000 . .~
:::;/ ."".40,000 +
poUNDS
~
(J\

Figure ill-4. Supermarket Sales ofRegular Coffee by Typ€
Other specialty coffees3.30%
Kona-name9.40%
~
'-l
87.30%Commercial coffee

Although specific firms cannot be cited because ofconfidentiality, three of the seven firms producing specialtycoffees account for over 99% of sales volume. It should benoted that the two leaders in gourmet coffee usually havelarge shelf spaces, well-designed displays, and haveextensive advertising/promotional campaigns.
The data are insufficient to estimate growth trends,but in general, specialty or "gourmet-like" coffee salesthrough supermarkets have increased in the past five years.This growth is expected to continue, but at a slower rate. A
Chapter III.C Footnotes
recent development in the Honolulu market is theproliferation of non-Kona specialty coffees. These itemscompete with Kona coffee for shelf-space and theconsumers' dollars. In-store promotions and point-ofpurchase material may be useful in assisting Kona coffeemaintain and expand its current status in the market. As ageneral rule, in-store samples are a very effective method in(at least temporarily) boosting a product's usage.
<1> Business statistics from Mason, George and Tom Leonard (eds), "All About Business in Hawaii 1989", 17th annual ed.,Crossroads Press, Inc.
<2> Lindstrom, Harold R. and Joseph T. Keeler. Restaurant Use of Kona Coffee in Metropolitan Honolulu. AgriculturalEconomics Report no. 66, Hawaii Agr. Experiment Station, University of Hawaii. June 1965.
<3> Daw, Stuart. "Coffee's Image Still Needs Upgrading" in Tea & Coffee Trade Journal, 157(1):57-62, January 1985.
<4> R.H. Bruskin Associates. A Market Strategy Study of the Whole Bean Coffee Industry. Coffee Development Group,Washington. December 1985.
<5> As used in this section, "specialty coffee" refers to products of certain roasters, and products defined by themanufacturer as targeting the specialty or high-end market. The frrms included are French Market Coffee, General Foods(Horizon, Maxwell House Special Reserve), Hawaiian Host, Hill & Hill, Lion Coffee, Superior Coffee, and S&W. Othersare called "commercial coffee," while specialty plus commercial make up "regular coffee," as opposed to soluble or instantcoffee.
18

III.D Final Consumers
III.D.I The Export Market· U.S. Mainland<1>
In the late Fifties, 85% of the Kona Coffee cropwas sold to u.s. mainland roasters<2>. The currentportion entering the export market is sizable, probably stillaccounts for the majority of the crop, and undoubtedlynumbers in the thousands of bags. Most of the buyers areconcentrated on the West Coast, although several arelocated on the Eastern Seaboard. Several are brokers,including roasters who resell green coffee to other fIrms.One source estimated the number of roasters handlingKona coffee at 200-250 fIrms, of which 10 to 15 willpurchase 250 or more bags of green Kona Coffee in a givenyear. While most of these roasters deal in the specialtycoffee market, the amount of Kona going to different uses isnot known.
Hawaii contributes a miniscule quantity of coffee tothe total supply in the U.S. Several factors appear to favorKona's ability to sell in the mainland market. There iscontinued interest among consumers to try and purchasequality products which appeal to their lifestyle, combinedwith the high quality of Kona Coffee. The u.S. market ishuge and can easily absorb Hawaii's supply, even if only asmall percentage of the population consumes Kana Coffee.More consumers are becoming more aware of Kona Coffeeand Hawaii's marketers are showing increasedaggressiveness in this market.
However, there are several factors which mayadversely affect Hawaii's ability to market its coffee in theu.S. mainland. First is the small supply of Kona Coffee. Itis difficult to conduct an aggressive marketing programwhen the product isn't available. Blends are already beingused to stretch supplies, and unavailability has probablyhelped promote counterfeiting. Relatedly, mainlandroasters expressed dissatisfaction with the general pricelevel of Kana Coffee and the behavior of prices throughoutthe season. This subject is covered more thoroughly inChapter IV.
A significant number of mainland roasters believedthat while Kona Coffee is good, it isn't great. In some casesthey indicated they carry Kona Coffee as a competitiveresponse and to offer their accounts a full product line. Thecosts involved and the small amounts they were able toacquire often (they claimed) made Kona Coffee a lowproduct item. Overall though, most of their complaints andresistance revolved around the small and erratic supply ofKona Coffee.
A significant number of mainland roasters believethat while Kona Coffee is good, it isn't great. In some casesthey indicated they carry Kona Coffee as a competitiveresponse and to offer their accounts a full product line. Thecosts involved and the small amounts they were able toacquire often (they claimed) made Kana Coffee a low profititem. Overall though, most of their complaints andresistance revolved around the small and erratic supply ofKona Coffee.
19
Several roasters mentioned that Hawaii, as anindustry, could be more aggressive in their promotionalefforts. The most common suggestions were the productionof merchandising kits for the roasters to use in servicingtheir accounts and point-of-purchase material to be used atthe retail level. They also believed that outside of someselected markets such as San Francisco and Seattle, evensome specialty coffee shop operators are not aware of thecharacteristics of Kona Coffee.
Finally, Kona Coffee may be in danger of being avictim of its own success. Anecdotal evidence collected overthe past year suggests that Kona Coffee (usually in theblend form) is being marketed in more places in the UnitedStates than in recent history. Given the short supply in thelast two seasons, one is left wondering how much Kona is inthe blend. Not only are there questionable blends, butseveral mainland specialty shops featured "Kona-style" or"Kona-like" coffee. The claim, when the package is read, isalong the lines of "this coffee has been roasted (blended) tobring out the characteristics of the legendary Kona Coffee."
From a mainland roasters perspective, this type ofstrategy is understandable. They really have no vestedinterest in Kona Coffee, and if they can make a quick profitthrough the sale of such coffees, why not? Those roasters(and they may be the majority) who are concerned aboutputting out a quality product usually have to respond tocompetitive pressures. Since Kona's reputation for qualityis one of its main sales attributes, the Kana Coffee industrymust take a fIrm position on these practices. However, todo so will require more information on the extent of suchpractices and their impact on the perception of quality byKana's consumers. This subject is discussed more fully inChapters IV and V.
Chapter II.D.I Footnotes
<1> Most of the observations in this section are based onpersonal interviews with mainland and Hawaii processorsand roasters.
<2> Slate, Daniel M. and Shelley M. Mark. EconomicStudy of the Kona Coffee Industry and a Program forImprovement. Kona Community Federal Credit Union.March 1959.

III.D.2 The Export Market - Japan <1>
In Japan, coffee is the second most popularbeverage after Japanese tea. Coffee plays a significant rolein many business and social activities. Unlike the UnitedStates, consumption is increasing over time.
The Japanese are generally recognized asconsumers who appreciate and are willing to pay for highquality and gourmet items. In the case of coffee, themajority of the world's premium coffee, Jamaica BlueMountain, is consumed in Japan. According to Ukers'International Tea and Coffee Buyers' Guide, Japan alsopurchases nearly all of Yemen's production. A generalobservation is that tourists from Japan are major buyers ofpure Kona Coffee while in Hawaii, especially in terms ofpurchasing omiyage, or gifts to bring home. However,current sales of Kona Coffee in Japan seem to be limited.Overall, Japan has the potential of being a significantmarket for Kona and other high quality coffees.
Japan in the world market. Of the InternationalCoffee Organization (ICO) members, Japan has recentlybeen the fifth largest importer of coffee and coffee productsbehind the United States, West Germany, France, and Italy.In the 1985/86 crop year, Japan imported the equivalent of4.6 million bags of green coffee (274.7 thousand metrictons), a 10.6 percent increase over the previous year.
The most common imported product form is greencoffee (88%), followed by about six percent of instant (orsoluble) coffee, five percent of coffee extract or concentrate,and about 2/10 of one percent roasted coffee (Figure 111-5).Of the various coffee product forms, only green coffee has
no import tariff. Other coffee products are charged varyingrates of up to 35%, depending on agreements, traderegulations, and trading status of the exporting nation.
Green coffee. Japan imported 535 million poundsof green coffee in 1986, with a U.S. equivalent value of $1.02billion <2> . Except for recessionary periods, there hasbeen a steady increase in green coffee imports since at least1959 (Figure 111-6). Imports from 1979 to 1986 grew at anannual rate of 4.7 percent.
About fifty countries are suppliers, with Brazil,Colombia, and Indonesia accounting for the majority ofimports (Table 111-1). These three countries supplied 53%of imports in 1982, and from 57% to 65% in the followingfour years<3>. During the same period, imports from theUnited States were relatively insignificant at from 57thousand to 300 thousand pounds. Jamaican and Yemeniimports over the period ranged from 1.6 million to 2.5million lbs, and 395 thousand to 736 thousand lbs,respectively. The largest importers by value generallymirror the quantity figures, except for Indonesia in 1986.This is reflected by the prices received by the market shareleaders (Table 111-2).
Table 111-2 further indicates that the highest pricedgreen coffee in 1984-1986 was from the United States, andthat both the U.S. and Jamaican imports were priced muchhigher than the mean for all imports, indicative of theirhigher quality <4>. Imports from Yemen were priced thirdhighest in 1984 and 1985.
Table III-I. Green Coffee Imports to Japan, by Major Suppliers, 1982-1986(in million lbs)
----1986---- ----1985---- ----1984---- ----1983---- ----1982----Supplier Volume Supplier Volume Supplier Volume Supplier Volume Supplier Volume
Indonesia 109.12 Brazil 165.64 Brazil 147.45 Brazil 138.30 Brazil 106.79Brazil 107.19 Indonesia 96.19 Indonesia 85.20 Indonesia 67.80 Indonesia 58.06
Colombia 88.44 Colombia 68.65 Colombia 62.13 Colombia 60.51 Colombia 51.40Honduras 42.17 Honduras 28.80 Honduras 32.53 India 28.58 Honduras 28.58
Peru 33.67 Peru 27.23 EI Salvador 22.91 Ivory Coast 26.66 Ivory Coast 26.44Guatemala 18.99 Guatemala 19.07 India 21.32 Honduras 23.20 Uganda 22.49Jamaica 1.92 Jamaica 1.83 Jamaica 2.49 Jamaica 1.57 Jamaica 2.12Yemen 0.73 Yemen 0.71 Yemen 0.51 Yemen 0.66 Yemen 0.40
USA 0.09 USA 0.06 USA 0.18 USA 0.15 USA 0.31Other 132.43 Other 101.58 Other 117.20 Other 102.42 Other 112.76
20

Figure m-5. 1986 Coffee Imports to Japan by Type. (green coffeeequivalent)
Concentrate (5.0%)
Instant coffee (6.4%)
Roasted beans (0.21 %)
Green coffee(88.3%)
o Green coffee • Roasted beans 121 Instant coffee II Concentrate
Figure 111-6. Coffee Imports to Japan, 1959 to 198B
700000
v~; 600000 , Total.············~~=O::
U h 500000 7°....•..,..•.......Mo -,,0 ./
8 0'~ ~. ~~ Green coffeeL - 200000 ~~"'~~~~~A·~~,~ow·........I·=-·--..J,L. _~~"mN
B~.~o
~o •S 100000 ~~~···~g==ro_g~"""""""'-..._-"""'--_J'o...............~~ ..........
o_o-S::S=i? ...o 0..---·-o .-. I I I I I I I I I I I
'59 '60 '61 '62 '63 '64 '65 '66 '67 '68 '69 '70 71 72 '73 74 '75 '76 'n '78 '79 '80 '81 '82 '83 '84 '85 '86
YEAR
21

Table 111-2. Price of Green Coffee Imports to Japan, by Supplier(in dollars per pound)
----1986---- ----1985---- ----1984----
Top Five$4.86 USA $4.18 USA $3.93USA
Bolivia $4.44 Jamaica $3.54 Jamaica $3.19
Venezuela $4.35 Yemen $2.22 Yemen $2.15
Jamaica $4.04 Switzerland $2.15 Cuba $1.61
Central Africa $3.32 Cuba $2.08 Kenya $1.61
SelectedBrazil $2.23 Brazil $1.23 Brazil $1.36
Colombia $2.05 Colombia $1.43 Colombia $1.46
Honduras $2.09 Honduras $1.43 Honduras $1.44
Indonesia $1.43 Indonesia $1.18 Indonesia $1.27
Mean $1.91 Mean $1.33 Mean $1.39
Other coffee products. Compared to the $1.02billion of green coffee imported in 1986, Japan alsoimported $78 million of instant coffee, $4 million of roastedproduct, $24 million of sweetened coffee extract, and $8million of coffee extract without sugar.
Brazil and Columbia accounted for 60% of the 15million pounds of instant or soluble coffee imported in 1986,priced respectively at $3.68 and $4.08/lb. American instantcoffee was the highest price at an average of $9.24/lb.From Table 111-3, instant coffee imports peaked strongly in1979, but gradually declined since then at an annual rate ofabout -3 percent.
Over 75% of the 1.1 million pounds of roastedcoffee imported in 1986 came from the United States.Brazil is the major supplier of the other coffee products.The Tea and Coffee Trade Journal (6/88) reported importsof roasted beans and sugarless extract increased in 1987 bymore than 2.5-fold to 5.1 million lbs and 10.7 million lbs,respectively. No figures were reported for sweetenedextract.
Although imports of these products are smallcompared to green coffee, and although instant coffeeimports have been declining, actual consumption in Japanof both regular and instant coffee has been steadilyincreasing (Table 111-3). Consumption of regular roastedcoffee has grown by 8.3% compounded annually, andinstant coffee has grown by six percent. Production inJapan accounts for practically all the net supply in regularcoffee, and about 85% of the net supply in instant coffee.Domestic production of both products utilize roughly equalshares of green coffee imports. <5> The per unit price of
22
instant coffee is generally more than twice the price ofregular coffee.
Channels of distribution. Figure III-7 diagramsthe primary, secondary, and tertiary channels of distributionfor regular coffee in Japan. Orders typically are placedwhen prices are favorable, or at a given inventory levelindependent of price, usually three months or 30 days priorto delivery. The major channel for green coffee, accountingfor 75% of volume, is from the production region throughan importer/trading company to a green coffee wholesaler,then to the roaster, with some flow bypassing thewholesaler. Twenty-five percent of imports go directly towholesalers or roasters. There are three major roasters and500 smaller firms engaged in roasting.
From the roaster, some coffee passes on to foodprocessors, and food wholesalers handle some tertiary flowsto retail frrms. Four major categories are defined at theretail level: the institutional market, including hotels,restaurants, coffee houses and tea rooms; franchise chains;department stores and supermarkets; and miscellaneousfood retailers. The most frequently reported retail outletsfor purchasing regular coffee are specialty coffee stores and"super-combis" (supermarkets).
In 1986, Ueshima Coffee Company and KimuraCoffee had a combined 60.8% share of the regular coffeemarket going to business use, and 56.1% of home use.Instant coffee was dominated by Nestle Japan (67.8%) andAjinomoto/General Foods (24.2%).

Table 111-3. Domestic Supplies of Regular & Instant Coffee in Japan
REGULAR COFFEE
Year Dom.Prodn Imports Exports Tot.Supply Value Computed $
(1000 lbs.) (1000 lbs.) (1000 lbs.) (1000 lbs.) (in dollars) ($/lb.)
1977 101,430 185 ° 101,615 $495,762 $4.881978 110,250 273 ° 110,523 $550,223 $4.981979 132,300 364 ° 132,664 $554,919 $4.181980 142,664 234 84 142,813 $619,780 $4.341981 145,089 542 415 145,217 $626,857 $4.321982 149,940 423 542 149,821 $581,002 $3.881983 164,052 412 494 163,970 $676,216 $4.121984 171,549 355 494 171,410 $710,256 $4.141985 191,615 439 256 191,798 $820,106 $4.281986 206,609 1,091 139 207,561 $1,393,390 $6.71
INSTANT COFFEE
Year Dom.Prodn Imports Exports Tot.Supply Value Computed $(1000 lbs.) (1000 lbs.) (1000 lbs) (in dollars) ($/lb.)
1977 43,454 10,833 ° 54,287 $607,389 $11.191978 42,268 7,764 ° 50,031 $704,728 $14.091979 59,352 18,465 ° 77,817 $961,121 $12.351980 55,321 13,964 ° 69,286 $780,850 $11.271981 58,371 14,961 ° 73,332 $783,613 $10.691982 64,706 16,077 ° 80,782 $776,574 $9.611983 66,302 15,794 ° 82,097 $816,707 $9.951984 71,054 16,231 ° 87,285 $867,813 $9.941985 72,776 13,314 ° 86,090 $910,091 $10.571986 76,379 14,981 ° 91,360 $1,366,568 $14.96
* Computed $ = Value/Total Supply
Consumption trends. The most popular beveragein Japan is Japanese tea. This traditional beverage wasconsumed by more than 92% of the populace in 1985,slightly down from 94% in 1980. Coffee is second inpopularity, and its reported consumption increased from78% in 1980 to 83% of consumers in 1985. Next are milk,juice, sodas other than cola, and American tea. Cannedcoffee as the sixth most popular beverage, consumed atleast sometimes by 70% of the population.
Coffee is rivaling tea as a social drink. Unlike theU.S., this is especially true among younger consumers.There are over 50,000 coffee shops in Tokyo, more than any
23
other city in the world. These are an integral component ofcity life: most customers do not just drink coffee. "They goto meet friends or lovers, to do business (many offer a widerange of modern business services), to talk politics, to listento music, to eat (most serve light meals or snacks), to study,to relax, and for a variety of other reasons. Coffee drinkingis only incidental." <6>
In terms of the different coffee products, regular orground coffee is regarded as a luxury item together withAmerican tea (Figure 111-8). This placement also suggeststhat coffee is regarded as a Western product, while instantcoffee is more similar to other ordinary beverages. Figure111-8 also confirms that both regular and instant coffeedrinkers tend to be younger than tea drinkers.

Production Region
Importer - Trading Company
Coffee Wholesalers
I
IIIIII
• .J
Roasters ...----..~~ Food Processors
1- - - - - - .... 'l
Food WholesalersI
1--------,~'+ ~'.
Hotels,Tea ROOIllS,
CoffeeHouses,
Restaurants
FranchiseChains
DepartDlentStores,
Supennarkets
MiscellaneousFood
Retailers
Figure 111-7. Distribution Channels Of Regular Coffee In Japan
24

Young
Luxury Goods
--
-I- • Regular Coffee
• American Tea
l-
• Cola, , , , ,l l l l l
Instant Coffee •
• Sportsman Drinks • Oolong Tea(e.g. Gatorade)
• Milk
-- • Wheat Tea • Japanese Tea
-
Ordinary Goods
Figure ill-8. ConsUlller lInage ofSelected Beverages in Japan.
25
Adult

Canned coffee drinks (iced coffee) was introducedto Japan in the early seventies by Ueshima CoffeeCompany. The market has since been increasing at anaverage rate of over ten percent annually, and has a currentsales volume of over $3.5 billion. Canned coffee drinks arethe best selling drink on a year-round basis in Japan's twomillion vending machines. The makers of Coca-Cola haveabout 33% of the market, and Ueshima Coffee Companyhas about a 20% market share <7> .
The household market for regular coffee is smallbut increasing. Given the strong historical use of Japanesetea and with coffee being regarded as a Western drink, mostconsumers don't know how to brew coffee. Householdconsumption has therefore been mainly instant coffee.Recent marketing efforts have concentrated more onhouseholds, have promoted coffee as a Japanese afterdinner beverage, and have demonstrated brewingtechniques. The result of these efforts has been an increasein the overall consumption of coffee, and in relatively moreregular coffee and relatively less instant coffee beingconsumed in households as opposed to institutional andbusiness locations.
The consumption of coffee has also been increasingon a per capita basis (Table 111-4). Per capita consumptionof instant, regular, and canned coffee has increased between1980 and 1985, with total consumption growing from 6.6 tonine cups per week. The proportions between products hasremained relatively unchanged. The 1987 Ukers'International Tea and Coffee Buyers' Guide estimates 1986per capita annual consumption of coffee in Japan at 7.1pounds. Most regular coffee is purchased in specialty coffeestores (42%) and at "super-combis" (i.e. supermarkets-37%), while 75 percent of instant coffee comes fromsupermarkets.
Table 111-5 breaks down 1985 per capita coffeeconsumption by different locations. Overall, the majority ofcoffee is consumed at home, with 22 percent beingconsumed at the workplace or at school. The breakdown isvery different between products. Nearly all instant isconsumed either at home or at the workplace/school. Asmuch regular coffee is consumed in tea rooms as is athome. The consumption pattern for canned coffee is verydifferent, with twenty percent being consumed at home,thirty percent at work/school, and half at some otherlocation.
Table 111-4. Consumption of Coffee Products Over Time in Japan(in cups per week)
Coffee Type 1980 1983 1985
Instant 3.8 5.0 5.3Regular 2.2 2.5 2.7
Can 0.6 1.0 1.0
Total 6.6 8.5 9.0*
Table 111-5. 1985 Consumption ofCofTee Products in Japan by Location
Location Instant Regular Can Total* (%)
At home 3.9 1.1 0.2 5.2 58%Tearoom 0.0 1.1 0.0 1.1 12%
Work/school 1.3 0.4 0.3 2.0 22%Restaurant/school 0.0 0.1 0.0 0.1 1%
Other 0.1 0.0 0.5 0.7 7%
Total 5.3 2.7 1.0 9.0 100%(%) 59% 29% 11% 100%
* May not total due to rounding
26

The characteristics of a coffee that at least 25percent of consumers report as desirable, in decreasingorder of importance, are: 1) a soft, mild aroma, 2) a mildtaste, 3) a weak flavor, 4) mild bitterness, and 5) goodaftertaste. The four least mentioned characteristics were astrong sour taste, lingering aftertaste, strong bitterness, andstrong flavor.
The four most often mentioned reasons as to whyconsumers drink coffee, by decreasing frequency ofresponses, are: 1) the condition of the coffee, 2) taste orflavor, 3) coffee's aroma in preparation, and 4) to enhanceenjoyment of conversation. All were static over time exceptfor an increase in the condition of the coffee, presumably areflection of a change from instant to ground coffee.
Finally, the Agriculture Department of the JapanExternal Trade Organization (JETRO) looked at sixcharacteristics of food products that have gained popularityin the Japanese market <8 >. The characteristic most oftencited for coffee was tastiness, which was important to about40% of the population. Second was cooking convenience(25%), brand name (20%), quality (13%), low price (12%),
Chapter III.D.2 Footnotes
and freshness (2%). JETRO also noted four trends thatseem to fit the needs of the Japanese market: (1) smallerservings of packaged foods, (2) more convenience foods, (3)better quality and increased variety, and (4) more healthfulfoods.
Outlook. There is a strong potential market forKona Coffee in Japan. As in the case of the U.S. mainland,Japan could easily absorb all the Kona Coffee produced.
However, there are problems in penetrating thismarket. First is the need to maintain and perhaps increasehigh quality. Regardless of what suppliers may believe, theproduct must meet the specifications of the Japaneseconsumer. As with most goods that enter the Japanesemarket, it will probably be necessary to establish a strongcontact with an established Japanese firm. The drawback isthe danger of Hawaii firms being able to exercise onlyminimal control. As the State presently does on a periodicbasis, a trade mission might be able to act as a facilitator inidentifying interested parties on both sides of the exchange.
<1> The information for this section of the report was obtained via cooperative efforts with Professor Yuichi Kishimoto ofSt. Andrew's University, Osaka, Japan. Information is condensed from "The Coffee Market in Japan" by S.T. Nakamoto,J.M. Halloran, Y. Kishimoto, and H. Kazumi, forthcoming as a publication of the College of Tropical Agriculture andHuman Resources. Reported figures are from the United Institute of Coffee in Tokyo, Japan, unless otherwise cited.
<2> All 1986 figures are converted from yen using an exchange rate of 168.5 yen per dollar.
<3> Only quantity data are available for 1987.
<4> While Jamaica Blue Mountain generally is recognized as the most expensive coffee in the world, the import figuresprobably includes other, lower priced Jamaican coffees.
<5> The conversion rates, in terms of green coffee required for one pound of finished product are 1.191bs for roasted(regular) coffee, and 2.6 pounds (up to 1983) and 3.0 pounds (since 1983) for instant coffee. It was reported that 1.72 gramsof product is used for one cup (153 cc) of instant coffee, and 7.14 grams of grounds per 159 cc cup of regular.
<6 > Asia Pacific Agribusiness Report, Supplement to Issue 8, August 1988
<7> Asia Pacific Agribusiness Report, Issue 5, May 1988.
<8> JETRO Agriculture Department AG-20, "Food Market in Japan, 1987" as cited in UH Department of Food Scienceand Human Nutrition, "Hawaii Food Technology News" vol. IV(5).
27
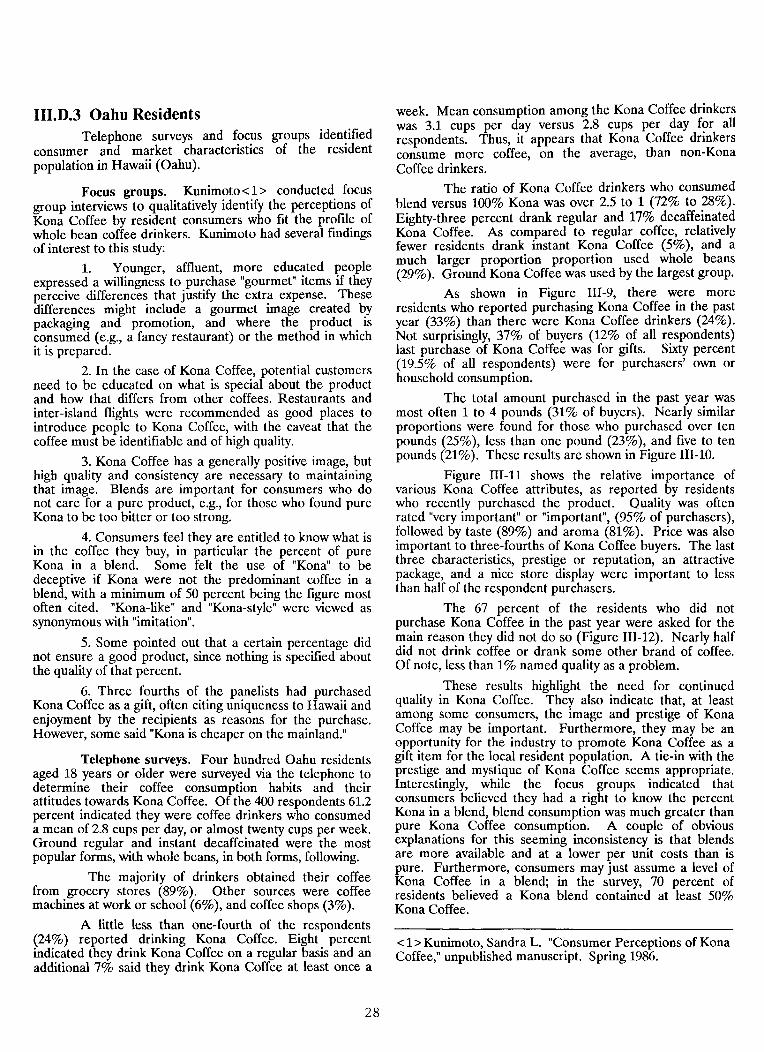
III.D.3 Oahu ResidentsTelephone surveys and focus groups identified
consumer and market characteristics of the residentpopulation in Hawaii (Oahu).
Focus groups. Kunimoto <1> conducted focusgroup interviews to qualitatively identify the perceptions ofKana Coffee by resident consumers who fit the profile ofwhole bean coffee drinkers. Kunimoto had several fmdingsof interest to this study:
1. Younger, affluent, more educated peopleexpressed a willingness to purchase "gourmet" items if theyperceive differences that justify the extra expense. Thesedifferences might include a gourmet image created bypackaging and promotion, and where the product isconsumed (e.g., a fancy restaurant) or the method in whichit is prepared.
2. In the case of Kana Coffee, potential customersneed to be educated on what is special about the productand how that differs from other coffees. Restaurants andinter-island flights were recommended as good places tointroduce people to Kana Coffee, with the caveat that thecoffee must be identifiable and of high quality.
3. Kana Coffee has a generally positive image, buthigh quality and consistency are necessary to maintainingthat image. Blends are important for consumers who donot care for a pure product, e.g., for those who found pureKana to be too bitter or too strong.
4. Consumers feel they are entitled to know what isin the coffee they buy, in particular the percent of pureKana in a blend. Some felt the use of "Kana" to bedeceptive if Kana were not the predominant coffee in· ablend, with a minimum of 50 percent being the figure mostoften cited. "Kana-like" and "Kana-style" were viewed assynonymous with "imitation".
5. Some pointed out that a certain percentage didnot ensure a good product, since nothing is specified aboutthe quality of that percent.
6. Three fourths of the panelists had purchasedKana Coffee as a gift, often citing uniqueness to Hawaii andenjoyment by the recipients as reasons for the purchase.However, some said "Kana is cheaper on the mainland."
Telephone surveys. Four hundred Oahu residentsaged 18 years or older were surveyed via the telephone todetermine their coffee consumption habits and theirattitudes towards Kana Coffee. Of the 400 respondents 61.2percent indicated they were coffee drinkers who consumeda mean of 2.8 cups per day, or almost twenty cups per week.Ground regular and instant decaffeinated were the mostpopular forms, with whole beans, in both forms, following.
The majority of drinkers obtained their coffeefrom grocery stores (89%). Other sources were coffeemachines at work or school (6%), and coffee shops (3%).
A little less than one-fourth of the respondents(24%) reported drinking Kana Coffee. Eight percentindicated they drink Kana Coffee on a regular basis and anadditional 7% said they drink Kana Coffee at least once a
28
week. Mean consumption among the Kana Coffee drinkerswas 3.1 cups per day versus 2.8 cups per day for allrespondents. Thus, it appears that Kana Coffee drinkersconsume more coffee, on the average, than non-KanaCoffee drinkers.
The ratio of Kana Coffee drinkers who consumedblend versus 100% Kana was over 2.5 to 1 (72% to 28%).Eighty-three percent drank regular and 17% decaffeinatedKana Coffee. As compared to regular coffee, relativelyfewer residents drank instant Kana Coffee (5%), and amuch larger proportion proportion used whole beans(29%). Ground Kana Coffee was used by the largest group.
As shown in Figure 111-9, there were moreresidents who reported purchasing Kana Coffee in the pastyear (33%) than there were Kana Coffee drinkers (24%).Not surprisingly, 37% of buyers (12% of all respondents)last purchase of Kana Coffee was for gifts. Sixty percent(19.5% of all respondents) were for purchasers' own orhousehold consumption.
The total amount purchased in the past year wasmost often 1 to 4 pounds (31% of buyers). Nearly similarproportions were found for those who purchased over tenpounds (25%), less than one pound (23%), and five to tenpounds (21%). These results are shown in Figure 111-10.
Figure 111-11 shows the relative importance ofvarious Kana Coffee attributes, as reported by residentswho recently purchased the product. Quality was oftenrated "very important" or "important", (95% of purchasers),followed by taste (89%) and aroma (81%). Price was alsoimportant to three-fourths of Kana Coffee buyers. The lastthree characteristics, prestige or reputation, an attractivepackage, and a nice store display were important to lessthan half of the respondent purchasers.
The 67 percent of the residents who did notpurchase Kana Coffee in the past year were asked for themain reason they did not do so (Figure 111-12). Nearly halfdid not drink coffee or drank some other brand of coffee.Of note, less than 1% named quality as a problem.
These results highlight the need for continuedquality in Kana Coffee. They also indicate that, at leastamong some consumers, the image and prestige of KanaCoffee may be important. Furthermore, they may be anopportunity for the industry to promote Kana Coffee as agift item for the local resident population. A tie-in with theprestige and mystique of Kana Coffee seems appropriate.Interestingly, while the focus groups indicated thatconsumers believed they had a right to know the percentKana in a blend, blend consumption was much greater thanpure Kana Coffee consumption. A couple of obviousexplanations for this seeming inconsistency is that blendsare more available and at a lower per unit costs than ispure. Furthermore, consumers may just assume a level ofKana Coffee in a blend; in the survey, 70 percent ofresidents believed a Kana blend contained at least 50%Kana Coffee.
<1>Kunimoto, Sandra L. "Consumer Perceptions of KanaCoffee," unpublished manuscript. Spring 1986.

Figure m-9. Resident Purchase Habits ofKona Coffee, AllRespondents
(10+ Ibs.)
8.20%(5 to 10 Ibs.)
7.00%
(1 to 4 Ibs.)10.000/0
(Less than 1 lb.)7.50%
Purchases of Kona Coffee in Past Year
(Other)1.20%
(Self or household)19.500/0
(Gift)12.00%
'1111~Rae.a~s:on for last purchasingI!!!!!: Kona Coffee
29
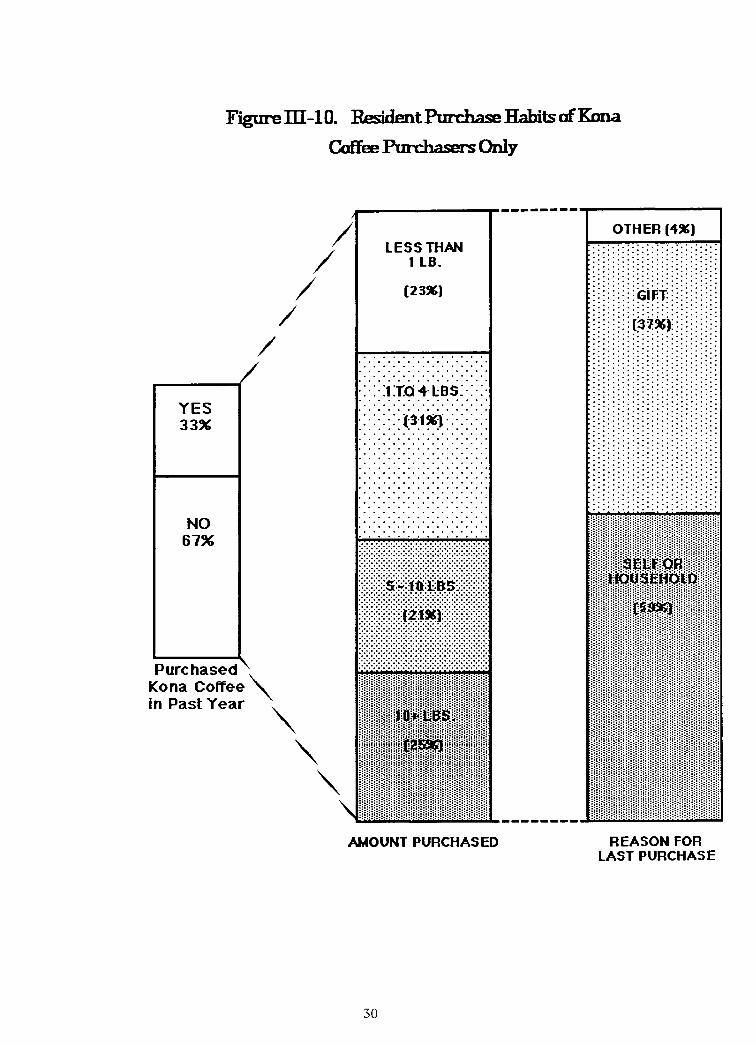
Figure ill-10. ResidentPurchase Habits ofKona
Coffee Purchasers Only
OTHER (1~)
· .· .· .· .· .· .· .· .· .· .· .· .· .· .· .· .· .· .
LESS THAN1 LB.
(23~)
. . . . . . . . . . . . .· .
· .
.:.:.:.:. f3·1~J·:·:·:·:·· .
.:.:. :l:td 1·lBS~·:·:·
..........................................................................................................
iiiiiiiiiii~i~iil~i~if,lliiiiiiiiiii~:~:~:~:~:~:~:~:~:~iZ:f~i: ~:~:~:~:~:~:~:~:~:~ ~~~ ~ ~f~~~~ ~~~@~~ ~ ~~~ ~~~ ~~~ ~~~ ~~~ ~~~ ~~~ ~~~~~~ ~ ~ ~..................................................................................................................................................................................................................... ............................
..-------....--------.......-------..I
//
//
/
NO67%
YES33%
Purchased ..
Kona Coffee ""in Past Year .""".
""\11111!11111!11111111111111111111111111111111111!1111I
AMOUNT PURCHASED REASON FORLAST PURCHAS E
30

Figure III-II. Relative Importance ofKona CoffeeCharacteristics in Purchase Decision ofResidents
Quality
Taste
Aroma
Price
Unique Gift
Availability
Recommendations
Prestige/Reputation
Attractive Package
Store Display
(1) Responses of "somewhat unimportant &"not at allimportant"
Figure 111-12. Residents' Main Reasons for Not Purchasing KonaCoffee
Drink DifferentBrand (5.5%)
Other(8.5%)
Unavailable(8%)
Taste(11%)
Price(24%)
[1] Including quality (0.4%)
31
Don't Drink Coffee(43%)

111.D.4 The Visitor MarketVisitors from the u.s. mainland and Japan were
surveyed to identify: (1) their coffee consumption andpurchase habits; (2) the association of differ.en~ produc~.s
with Hawaii; (3) what items they purchased whIle m Hawall;(4) why they purchased these products; and (5)demographic data.
111.D.4.a Visitor DemographicsTable 111-6 compares typical visitors from the u.s.
and Japan that completed the survey. American visitors aretypically older and have more education that their Japanesecounterparts. While incomes are comparable, Japanese aremore likely to be married.
Japanese visitors are more predisposed to packagetours, as they were more likely to use tour agencies andtraveled in larger groups. Americans stayed nearly twice aslong, and were a little more likely to be on a repeat trip.u.s. visitors were also 3 times more likely to visit the BigIsland, but only Molokai and Lanai received less visits fromeither group.
u.s. In our survey, the typical visitors from theMainland U.S. are likely to be married (76 percent) and on
a 10 day pleasure trip. They are in their mid-forties, havesome college education, and have a family income in the$40-50,000 range. Including this trip, they have been inHawaii over 3-1/2 times. As with 69 percent of other u.s.tourists, they are traveling alone or as a pair. Tra~el andlodging arrangements were made by a tour agency In 62%of the cases. One out of four tourists visited Hilo or Kona -only Molokai and Lanai had a lower rate.
The largest portion of visitors was from California(23%), followed by Texas (7 percent), .Minnesota (6percent), New York (5 percent) and IllInOIS (5 percent).Not counting California, all regions of the country seem tobe well represented.
Japan. Although 22 percent traveled in pairs oralone, the average tourist from Japan arrived in a group of19 persons on a 5-1/2 day trip; 84 percent were traveling forpleasure. This trip was most likely his or her first (91percent were on their first trip to Hawaii), and arranged bya tour agency (92 percent). Tourists were likely to bemarried (91 percent), in their late twenties with 51% havingno more than a high school education, and had familyincomes equivalent to $40-50,000 in the U.S. While 9 of 10tourists visited Honolulu, less than 1 in 10 visited Hilo orKona.
Table 111-6. Comparative Visitor and Trip Profiles
Japan
Married (91%)28.6 years
High School$40-49,000
Pleasure (84%)18.5 persons
5.5 days1.2 trips
Tour Agency (92%)
Characteristic
Marital StatusMean Age
Median EducationMedian Household Income
Mean Household SizeType of Trip
Mean Party SizeLength of Trip
Trips to HawaiiTravel Arrangement
U.SA.
Married (76%)46.2 years
Some Univ. or College$40-49,0002.8 persons
Pleasure (91%)4.6 persons (median 2)
10.1 days3.6 trips
Tour Agency (62%)
Percentage Visiting Different Locations and Islands
Japan
89%29%26%8%4%
Characteristic
Honolulu/OahuMauiKauai
Kona/HiloMolokai/Lanai
32
u.S.
81%39%33%24%5%

III.D.4.b Tourists' PerceptionsTourists were asked to rate how strongly they
identified certain products with Hawaii (Figure 111-13). Thetop three products were very strongly or strongly identifiedby at least 85 percent of respondents, were Aloha wear,macadamia nuts, and chocolate covered macadamia nuts forJapanese visitors, and pineapple, macadamia nuts, andAloha wear for Americans. From the negative end of thescale, no more than 5 percent of responses had a weak orvery weak identification for these products.
The products least identified with Hawaii, in termsof both a low strong rating and high weak rating, were artsand crafts, jewelry, and perfume.
There were major differences between both groupsof visitors when considering only the six agriculturalproducts (Table 111-7). Only macadamia nuts wereidentified by comparable percentages, with other productsbeing widely divergent in absolute scores and relativerankings. Pineapple was the strongest and papaya theweakest product for Americans, but both were in themiddle, and with reversed rankings, for Japanese visitors.Kona Coffee did relatively poorly in both groups, and wasthe only agricultural product to be strongly identified by lessthan 50 percent of either group.
One explanation for these differences is that theidentification reflects the amount of promotion andadvertising put into the different products. Since fewtourists are fluent in both Japanese and English, anadvertisement would have to be bilingual to reach both
groups while also considering the different cultures - e.g.,one group may spend more time or be more likely to watchtelevision, especially while on vacation.
Identification may also reflect the availability of theproduct, especially from competing sources, at home. Forexample, papayas may do poorly because of Mexican andCaribbean imports to North America, but "Hawaiianpineapple" may be a household word. A lot of SoutheastAsian pineapple and flowers may enter Japan.
In the case of Kona Coffee, 76 percent of U.S.visitors strongly identified the product with Hawaii, but itstill had the second lowest level of identification among theagricultural products listed. Forty-three percent either didnot or were not sure if they knew of Kona Coffee beforetheir trip (57 percent knew of Kona Coffee), implying thatmany were informed in Hawaii. Further, 31 percent saidKona Coffee is available in their hometowns.
In contrast, 46 percent of Japanese visitors stronglyidentified Kona Coffee with Hawaii and forty percent knewof the product before their trip. This suggests that exposureto Kona Coffee in Hawaii is minimal. Kona Coffee is alsoless available in Japan (21 percent said it is available athome), where competition is stronger given the dominanceof tea as a beverage and the strong presence of JamaicanBlue Mountain and other specialty coffees. With a lowprofile and strong competition, we speculate that "Kona",especially if not tied to Hawaii, is easily lost or obscured inthe mix of products.
Table 111-7. Visitors' Comparative Identification of Agricultural Products with Hawaii
United States Japan
Pineapple 96% Macadamia Nuts 92%Macadamia Nuts 93% Chocolate CoveredFlowers 83% Macadamia Nuts 90%Chocolate Covered Papayas 80%
Macadamia Nuts 79% Pineapple 75%Kona Coffee 76% Flowers 63%Papayas 69% Kona Coffee 46%
33

Figure ill-13. Visitors' Identification ofProducts withHawaii
10000/0 10 % 20% 30% 400/0 50% 600/0 70% 800/0 90% 0/0
~ US~ .
II Japan
Aloha Clothing .-----------Macadamia Nuts .
~ Pin eappie .:.:.:.:.:.:.:.:.:.:.:.:.:.:.:.:.:.:.:.:.:.:.:.:.:.:.:.:.:.:.:.:.:.:.:.:.:.:.:.:.:.:.:.:.:.:.:.:.:.:.:.:.:.:.:.:.:.:.:.:.:.:.:.:.:.:.:.:.:.:.:.:.:.:.:.:.:.:.:.:.:.:.:.:.:.:.:.:.:.:.:.:.:.:.:.:.:.:.:.:.:.:.:.:.:.:.:.:.:.:.:.:.:.:.:.:.:.:.:.:.:.:.:.:.:.:.:.:.:.:.:.:.:.:.:.:.:.:.:.:.:.:.:.:.:.:.:.:.:.:.:.:.:.:.:.:.:.:.:.:.: .
Choc covered Mac Nut
Papayas r····················································· w •• : ••••••••••••••••••••••••••or
Flowers
~MT~:~:i:::::;:::::::::~:::;:::::::::;:::::~··~:::::::::::;:::::::::::::::::::::::::::::::::::;:::;:::::::::::;:;:;:;:;:::::::::::::::;:::;:;:::::::::::::;:::;:::;~-----
Jewelry
Ar:s~~r::: DOl

III.D.4.c Important Factors Affecting PurchaseIdentification notwithstanding, the bottom-line
variable for those targeting the tourist market are sales.Visitors polled on agricultural products that were purchasedto take home indicated that regular and chocolate coveredmacadamia nuts were overwhelming favorites for bothgroups (Figure 111-14). While this might be expected forJapan, pineapples and flowers would also be expected to bemore popular for the u.s. In the survey, Kona Coffee doesabout as well as both products. For Japan, Kona Coffeedoes much better than the fruit and flowers in relativeterms, although the opposite would be expected from theidentification of the products with Hawaii.
Perishability is apparently a factor in returning toJapan, given the lengthy return trip and the very low level ofpurchases for all fresh products. Perishability may also be afactor for North America, but foreign competition and theavailability of the product at home may also be factors.
What other factors are considered by tourists whenselecting gifts and souvenirs? Figure 111-15 shows therelative importance of eleven product characteristics. Thestrong identification of products with Hawaii is reflected intwo of the top four characteristics for both groups ofvisitors: uniqueness to Hawaii and image of Hawaii. Beingeasy to take home was also common to both, while taste forNorth Americans and price for Japanese rounded out thetop four <1>.
Three other variables, store display, advertising,and coupons had negligible importance. There were noteddifferences between groups for price, looks of package, andproduct reputations, and also for whether a product wasrequested, package size, and store display. In general,visitors from Japan were more likely to rate a characteristicas important, and Americans as not important. Oneimplication is that many marketing efforts may be moreeffective for Japanese rather than U.S. visitors.
Chapter III.D.4.c Footnotes
<1> This is a somewhat surprising result, in that a widelyheld belief is that Japanese visitors are quality or brandconscious, and willing to pay sometimes exorbitant prices.However, the question did not ask if low price wasimportant. Further, prices may be relatively reasonable,given the favorable exchange rate and prices in Japan.Finally, prices may be important because of its role in thecustom of gift giving, where either a too expensive or toolow cost gift would be inappropriate.
35
III.D.4.d Factors Affecting Kona CoffeePurchase
The tendency toward a higher rating for factors byJapanese visitors as opposed to American visitors was evenmore pronounced when considering the char~cteristics
important to the purchase of only Kona Coffee (FIgure 11116). Respondents did not find Kona Coffee characteristicsto be as important as the same characteristics for gifts andsouvenirs in general.
Taste, aroma, quality, price, and uniqueness toHawaii were the five most important characteristicsinfluencing Japanese tourists' purchase of Kona Coffee.These were the same for American visitors except for price.The four most unimportant factors for Americans were arequest for the product, store display, prestige, and packageappearance. The corresponding four most unimportant forJapanese were store display, requested item,recommendations, and package size.
The results suggest that banking on the image ofHawaii to sell Kona Coffee is not enough. The mostimportant factors -- taste, aroma, and quality -- are physicalcharacteristics of Kona Coffee.

Figure ill-14. Comparative Purchases ofProducts by Tourists
00/0 100/0 20% 30% 400/0 50% 600/0 700/0
Choc-Covered Mac Nuts
Macademia Nuts
Pineapple
Kana Coffee
Flowers
Papayas
36
680/0
II Japan
III U.S.

Figure m·15. Relative Importance ofSouvenir and GiftCharacteristi~ in Purchase Decision for VISitors
;:::::::::::.:.:;;.:.:::;.;: .. :;;:.:.:::.:;;.:.:;.:::;:::; ... ::.::.:.;: .. :.: ... ;.:.::;:::;:::;:;.:::.:;;.;.;.:... ;... :.:.:.;... ;..:.=::;:::.:::;:.::::::.
00/0 100/0 20 0k 30% 400/0 50% 60% 70% 80% 900/0
Easy ~ ~ke home~.~~~:~'3% I85%Unique to HawaII 84%
83%Image of HawaII85%
61'
::::::::::::::::::::=;::::::::::::::::::::"::::::::=:::::::::::::.:::::::.:"::::::::::::::::::::::::::::::"':.:.::.::.:.:"::':'::'::'.,:"::"::::::::::::::::"::::;:;.::::::;::=;:
!.;::~::;:;S;'§i.ts;::::;:~:;"i:·~:::;;ri:sti'iti,4i~i;:;Xti::t;*:;o)··:::?;i·:Wi;Z;~i!i!!i·!>i·1i=i;·:i~i?i'i····;ti!.i;;'!.i!'ii~i'·;E9;~i·rwii~·~·'~S~8.'••••• 74%Ih:::::::::~::::::::~:£L::::::;;::~:k:::11;;J1:t;~W:::;ff::::~«-:;:::::c~:;::Wt};lJ;Mf;_:ti4;Mk4¥$$;MtJ 5 5 ,
(:.:.;.:.:.:.:.:.:.:.;.;.:.:...;.:.:.;.:.:.:.:.;.:.:.:.:.;.:.:.:.:.2'21.:.;.:.;.;.;.;.:.:.;.:.;.;.:.;.:.;.;.:.;.:.;.;.:.;,.;.;.;.;,.;.:.:.;,.:.;.;.:.;.;.;.:.;.;.;.:.;.:.;.;.:.:.;.:.;.;.;.;.;.:.;.:.;.:.;.;.;.:.:.:.;,.:.;.:i 4 8 ,
~llg.:-:.:.:.:.:.:.:.t:.;.;.:.;.:.:.:...;.:-:.:.:.;.:.:.;.:.;.:.:.:.:.;.:.;.:.;.;.:.;.;.:.;.;.;.;.;.:.;.:.;.;.:.;.;.:.;.;.[22;.;.:.:.;.;.;.;.;.:.:.:.:.:.;.:.:.:.;.;.;.:.;.;.;.:.:.;.;.;.;.;.;.;.;.:.;.;.;.;.t.~111!'4.\"-- 6 0 ,
1:.:.:.:.:.:.:.;.:.:.;.:.:.:.:.:.:.1.;.;.:.;.:.:.:.:.:.;.;.:.;.:.:.;.;.;.:.;.;-:.:.;.;.;.;.:.:.;.;.:.:.;.:.;.:.:.;.;.:.;.gi21.:.:.:.;.;.;.:.:.;.;.:.:,.;.:.:-:.;.:.:.:.;.;.:.:.;.;.;.:.;.;.;.:.:.r1'j', 5 2 ,
ni)lngIE?;;.?:;}.;:-:.:.:;.::.;:.:-:.;;;:-:.:.;;.;.:.;.i;.:.:.;;.:.;.;.i:.:.:.:i:.;.i:.:.:-:i.:.:l~iil; iii••••••111111 65%
Price ~:.:.:.:...:...,...J.....:..';"..j..J....w •.•••.•••;•••••;.";'·:·X·~'·;····:·,:t·····lJ·~:':i"·;mw,··x'''.'.:-&' ...h"iliIt"·@.···"liIU..UJ<i.ftIllTaste
Easy to Find
Product Reputation
Requested
Package Size
Recommended
Package Appearance
I • Japan EJ U.S. & Canada
Figure m-16. Relative Importance ofKona Coffee Characteristicsin Purchase Decision ofVisitors
TasteAromaQuality
PriceUnique to Hawaii
Easy to Take HomePronuct Renutation
Ima~e of HawaiiEasy to Find
Presti~e
Packa~e SizeR~commendations
Package AnnearanceStore Display
Requested
Jllf:8!~BI:::::!R:&~:::::IB::i-~BI:::::SE:::::.8.:::::BI:::::II:::::.:::::81::::'II.::::~:::::8::::~BI.~'1I::f.;;,:::81i-;:...81.::::"",•••~:::8i-;~BI•••fSE::;::8:::::...BI.::::!R::!~:::::IB::::~IJI.-;':;' •••::=iv,•••:::BI::::mSE•.••••I8:::~II:::::II=*•.*=81.:::::fJI*=.::~8*,)i.II.::::II~:::~:::::IBM::BI::::~SE;,*"••::~81~::::-fJl.:*••*8:::::11:::::11:::'_:;89flll'.....U...iI888B 87\
~;.:.:.M:.:.:~:;.::.:.:::~.:::••~.::-::~:.;::~.:::.~:::.:"-::.::.:.:::.M:.:-:"':;.::.:.;::~.:::.I.':::.;.~:.:-:~.:::.M;::.~.;-.:.~:.:: ...~::;..fW.::-.:...~••:-:at~.M:::.:"-:;.;:.:-:.:M~.;.-.:~Ift;v;~.;~fW~.,:.:.~~:;..:-:.M:-;-;-.~:-: •.,.~•••~M~:.:.~:.:••:-:-:~.»-,,~.;~~~.;.:~.~~.;::-M::;':"~:';.~:':Yo~.::..M.:~••:-:""."__I88881I88881t88l111 85\
1!E::~:::::":::::":':·::::fR:::!~:::::.::::::~:::::":::::.:::::"::::f":::f"l-:::::M:::::~:::::.:::::"!:f"·::::I1:::::,-·9::M:::!~::f.:f~".·:~:":::::":::::-:::::..."••:::II:::::.-.:::::R:::~~••~:-.'i-;:...".J":::::"':::::"::::f":::f":::::-:::::!R:::::":::::"':::::":::::R::'~:::::.:::::IR::::lIltI8J.' IIIUI8BBlS...88I18B1II 81'
,!J!mtttnlD_-'=InUl_!UU:ll1Ulll%l on 0 0 0 DO. 75'
I:~:::::::::::::::::MM:::::::::::::::::::::::::::::~:::::::::::::~l:::::::::::~::~::::::f:~~~:lf:::::::::::::::::::::::~::::;:::::~:~:~:::f:::::::::::~:~:~:~:::~SIt S 63\
!!!l~:J!1:!l!!!!l1!Jl!-!\'ID!mJJP.-=:!!lUJ.lv\g!P:::.~!I!!I~f BE 62'
.1IR::!.gJ··L·.Lt·L~··~II..~.:::::R·e···gJe·o·:.·:···~o·e·~II...•...•..~~....II··.•i2~o·cgll·o·2•.£..£gR.:!II~.!-2Rf.~gJ··.···•.·:::.:::)c.~·.~.·e·:R.....II.~~•."V--f-'_1881188... 60'
1!!!!.I!!'Ji!I:I!'«'U'L'tIllWMMJfA!!.l!t!!!.M.lM« 'm IBBI 51 \
W::::::::::::::::::::=:tt:::::::::::::::::.:::::::::::::::::::::»:::::::::::::::::::.:::-J::!I~::::::.-«::::::::::::::::::::=:::::::::::=:::::::l:::::::~ 221IlIIlBlIJilllllIUII:l'::§UII ~1 l n n nI 56\
1:1;:;:;:;:;:;:;:;:~;:;M:;~:;:;:::;:;:;:;:;:;:;:~;M;:~;:;:;:;:;~~;~~:;~:~;:;:~;:;~:~~:;:f~~~;~:!$i 36
\
l::::::::::::::::::::::::-.::::::::::::::::::::::::::::::::::~:i-;::«::::::::::*:«=:::«::::::::::::::::::::::::::::< ~Jf 37\
tU:;::=::::;::::::::::::=::::::;:;;;:::::::::~:J:»:::::::...~ flf aaaaaaaB aa B 39\
I::::::::::::::::::::::::::::::::::::::::::::::::::::::::::::::::::::::::::::::::::::::1 ~ ~I
!':~::::::::::t::::::':~:::::;:MlJ::::::~:::::~:~:~:::::::::::::::: 11\ E ai aI 35\
III J apan~1~~U~! U. S .
37

III.D.4.e Place of ConsumptionA larger percentage of respondents from Japan
drink coffee, but each drinker consumes less than his or hercounterpart from the U.S. Ninety-two percent of Japanesevisitors drank coffee, at a mean average of 11 cups perweek, compared to 78 percent of Americans at 18 cups perweek<l>.
The location at which coffee was purchased alsovaried widely. Visitors from the u.s. were most likely topurchase coffee from a grocery store or supermarket (69percent). In comparison, only 46 percent of visitors fromJapan used this source, while 59 percent bought coffee fromspecialty coffee shops, including tea rooms. Also, moreJapanese bought coffee at work<2>.
A large proportion of Japanese tourists either didnot know (42 percent) or were not sure (18 percent) ofKona Coffee before their current trip. As compared to theremaining forty percent who had known about Kona Coffee,57 percent of U.S. tourists were aware of Kona Coffeebefore their trip. Still, a larger proportion of Japanesevisitors drank Kona Coffee more often than u.s. tourists.Thirty-one percent of respondents reported drinking KonaCoffee more than once a month, and 24 percent consumedit on a daily basis. In the U.S., 13 percent drank KonaCoffee more than once a month, and five percent drank itdaily.
Nineteen percent reported Kona Coffee was notavailable where they live in Japan. It was available for 21percent, and the majority, 60 percent, were not sure. Only 1out of 10 Japanese tourists purchased coffee to take home.
Thirty-one percent of American tourists could getKona Coffee at home, 27 percent could not, and 42 percent
Footnotes
were not sure. Seventy-five percent did not purchase anycoffee to take home. Of those who did, nearly two-thirds(16 percent of all respondents) purchased less than twopounds and one-fourth (7 percent of all responses)purchased two to five pounds.
These results are interesting from severalperspectives. First, they indicate that only a smallpercentage of the tourists (10% of Japanese and 25% ofU.S.) purchase any Kona Coffee to take home with them. Ithas long been thought that tourists could be used as amechanism to "export" Kona Coffee, but it would appearthat greater efforts could be made in this area. Second, it isinteresting that these percentages roughly correspond to thepercentage of tourists which visit the Island of Hawaii(Table 111-6), so immediate efforts might be targeted on theIsland of Oahu. Third, it was found that advertising andstore displays had little impact on the purchase decision.This is not a criticism of what is currently being done, butperhaps more on the level of these activities. Tourists couldalso be targeted before they leave the airport upon theirarrival. Ideally, preliminary efforts would be done beforetheir arrival in Hawaii.
These results also indicate that if the Japan marketis to be targeted, the outlets through which Kona Coffee willbe moved are likely to be different than for the U.S.mainland. This will dictate a different promotional strategy.Furthermore, some thought should be given to the productform (ground, whole bean, and instant) and what isappropriate in each market. In both cases, there appears tobe an opportunity to better inform mainland consumersabout the availability of Kona Coffee.
<1> Our information on the Japan market showed 83% of Japanese drank an average of 9 cups per week in 1985. The ICO1988 Winter Coffee Drinking Study reported 50% of Americans are coffee drinkers who consume 23.4 cups/week (3.34cups/day). Per capita consumption (drinkers and non-drinkers combined) is 11.7 cups/week (1.67 cups/day).
We speculate that the main reason for these differences are that visitors differ from the general populations. Themean age of the Japanese visitor was 28.6 years, probably much lower than the national average. Since older Japanese aremore likely to drink tea, it stands to reason that removing them from the statistics would raise the percentage of coffeedrinkers and the average amount of coffee consumed. Also, the nationwide figures should have increased since 1985, ifhistorical trends had continued.
For Americans, proportionately more visitors drank coffee, but at a lower rate than the population in general.There were only 19 persons aged 18 or below (out of nearly 1100 visitors surveyed), while the national survey apparentlyconsidered all persons 10 years and older. The visitor survey therefore did not include many of the non-drinkers in thenational population, so the proportion is higher. Of note, an independent survey found the coffee drinking percentage to be73% for persons aged 18 and older (SAMI/Burke Market Research, as cited in the Honolulu Star Bulletin, January 24,1989). We speculate that differences in incomes, education, and age as well as the large amount of California visitors, couldexplain differences in the quantity consumed.
<2> The information from the Japan market listed the supermarket as a source for 75% of instant coffee purchases and42% of regular coffee. Specialty coffee shops and tea rooms accounted for 53% of regular coffee purchases.
38

IV. ISSUES AFFECTING THE KONA COFFEE INDUSTRY
Various groups have identified a number of issuesthat might stand in the way of the Kona Coffee industry inreaching its full potential. An arbitrary grouping of most ofthese issues is listed in Table IV-1.
Kona Coffee starts at the grower level. Theindustry analyses identified several production-orientedproblems including land tenure, pest control, water, andlabor. Production and marketing go hand in hand. It isobvious that marketing is not a problem if there is noproduction to market, and that a crop that can't be sold is
equally useless. Any improvement in production ormarketing that will increase and stabilize revenues ordecrease costs will benefit the grower and ultimately theoverall industry. Other efforts are involved with production;this study focused on more marketing-oriented issues. Inparticular, this chapter considers unreliable supply, somecompetition to Kona Coffee, the related concepts of image,reputation, and quality, and the issue of blending andminimum content legislation.
Table IV-I. Perceived Issues in Kona Coffee(as reported by various groups)
Production and Supply issues· aging farmers, land, labor, mechanical harvesting, etc.· cost reduction in processing and production· production practices· seasonality· weather
Quality, Image, and Reputation· inconsistent image· quality standards· price/value perceptions
Existing and potential market segments· undeveloped export (out-of-state) markets· tourist markets· resident markets· institutional markets· supermarket/retail· specialty outlets
market structure & conduct· price resistance· limited working capital· fluctuation in supply· inventory carrying cost
39
Competition· specialty coffees as luxury goods· price competition from other coffees· coffee product proliferation (flavored, other gourmet)· counterfeiting, Kona-style coffee· other Hawaii coffees· passing fad, lifestyle, life cycle issues
Blends and labelling· pure vs. blend· minimum content legislation· truth in labelling legislation· consumer misconception of blend
Industry-wide activities· lack of cohesive industry association· industry vs. individual incentives· funding and enforcement

IV.A Unreliable SupplyOne issue which has received a fair amount of
attention, especially from the West Coast market, is thefluctuating quantity of Kona coffee both within a year andbetween seasons. There are several aspects of this problemwhich must be considered.
1. Much of the supply fluctuation stems fromproduction issues. Production fluctuations seem to be aseasonal phenomenon, yet there is some evidence thatpoints to the possibility of easing the year-to-year variation.Potential production-oriented approaches include somepruning, fertilization, and irrigation practices. These is~ues
require research, whose results should be incorporated Intoa grower education program.
2. Easing the production fluctuation will easeprocessing problems. To maintain quality, currentfluctuations may force processors to adopt a "peak load"mentality to maintain quality. That is, there will be idlecapacity in the mills to assure that large crops can behandled without a drop in quality, but this idle capacitymeans idle capital and labor which most processors cannotafford. The result is an inability to maintain quality duringheavy production, as may have been the case with recentbumper crops.
3. Fluctuating supply, especially under pastconditions, has a downward drag on price. Because buyersknow that Kona can be bought at say $4/lb (and becauseprocessors had to sell at that price at some time), there isresistance to price increases.
On the other hand, if the expectation is for a highprice (as is the case for Jamaica Blue Mountain), priceresistance can be eased and perhaps eliminated. With anabsolute limit on the amount of pure Kona Coffee that canbe produced, with the increased demand from a successfulpromotional program, and with an inelastic demand duringshort years, Kona should be able to command higher prices.
4. The high price of Kona coffee, given limitedbudgets and the need to stockpile Kona to last a year,makes it very expensive to carry an inventory. At $5/lb, tenbags of green Kona Coffee represents $5000 of someone'sworking capital sitting in a storeroom before consideringinterest costs. This could put a significant strain on acompany's finances.
Barring investments in processing capacity, theindustry can expect fluctuating production to lead to futurequality problems. This will aggravate price resistance andproblems with buyers. While recent high prices haveattracted resources to the industry, stability in prices shouldfurther enhance the industry's position.
Suggested approaches to the supply inconsistencyproblem include a research program and grower educationto stabilize production. Our recommendations also includea stock control/inventory program to further reducefluctuations faced by buyers. This may also help thefinancial aspect of holding Kana Coffee in inventory.
40
IV.B CompetitionKona Coffee faces five sources of competition from
other coffees. These are:
1. specialty coffees as luxury goods2. specialty coffees as quality products3. flavored coffees4. Kona-style coffee5. Other Hawaii coffee
These products compete with Kona Coffee indifferent market segments. They may target the sameconsumers and they may offer many of the same productcharacteristics as Kona coffee. As a specialty coffee, Konamust compete with other high quality coffees for a share ofthe consumer's pocketbook. Kona Coffee may be a prestigeor luxury good for some of these consumers. Others maybuy Kona Coffee for its physical characteristics, such asappearance, taste, and aroma. Still others may want thetrappings of specialty coffees, but may prefer a familiarflavor (at least on some occasions). The high price andlimited quantity of genuine Kona Coffee may attractimitations, whose lower price is attractive to manyconsumers. Other than on a price basis, Hawaii coffee willbe a competitor to the extent that it is the image of Hawaiithat sells Kona coffee.
Thus, the competition from other coffees varieswith the desired product attributes, geographic market, andtarget consumer. Although not directly addressed in thissection, this principle can be applied beyond competingcoffees. Other souvenir items in the tourist market are anexample.
Specialty coffees as luxury goods. Someconsumers gain satisfaction from paying a high price fortheir coffee; more satisfaction is gained with a higher price.Products such as designer clothing, expensive jewelry, andracy sportcars are often cited as examples of luxury goods,where it is the "snob appeal" more than any physicalcharacteristic that commands an expensive price tag. Therituals associated with specialty coffee and the serviceprovided by vendors also are attractive.
The population segments and markets for luxurygoods are typically affluent and/or described as "Yuppie."Market segments dealing with pure Kona Coffee are mostlikely to be affected. Competing products include productforms such as expresso and cappuccino.
As a prestige item, Kona Coffee's main competitor,especially for Extra Fancy and products at the high end ofthe price spectrum, is Jamaica Blue Mountain (JBM)<1>.JBM is the best of three grades produced in Jamaica (bluemountain, high mountain, and prime wash), and is the mostexpensive coffee in the world. The supply of green JBM isabout one million pounds annually, and is expected todouble by the early 199Os. Japan purchases 75 to 80 percentof the crop, but the Japanese market is controlled by only afew companies. Two Japanese firms own farms with fifteenpercent of production, and Japanese are also rumored to befinancing expanded production. European sales are limited

because JBM is too expensive. However, recent sales hadbeen increasing at an annual rate of fifteen to twentypercent.
Thus, part of the higher price for JBM can beexplained by a smaller annual production than Kona coffee,and by being sold almost exclusively as pure JBM. The factthat most JBM is exported to Japan contributes to price, butalso points out Japan as a market opportunity for Konacoffee. Further, the Jamaican government plays aprominent role in controlling the quality and supply of JBM(see discussion of the program in Chapter V) and infinancing the industry. These also provide strong insightsinto possible action by Kona's industry.
In summary, the price of Kona Coffee comespartially from being a luxury product and to that extent,JBM is a good example and role model. However, prestigeis only part of the overall image of Kona coffee, an imagethat also includes the mystique, allure, and romanceassociated with Hawaii.
Specialty coffees as quality products. Otherconsumers focus on the physical characteristics of a coffee.As a top quality product, Kona must compete with otherhigh quality coffees such as Guatemalan Antigua, CostaRican, Kenya AA, Sumatra Mandheling, and CelebesKalossi. Many industry members thought these and similarproducts were comparable to Kona Coffee in terms ofquality, but at a much lower price. The lower cost of thecompetition may mean a higher margin to the seller and/ora lower price to the buyer than for Kona coffee. The mainadvantages Kona has over this competition are its imageand "grown in the U.SA." distinction.
Other high quality coffees are especially a factor incontinental u.S. specialty outlets, where it may be more theroaster's or retailer's preference (and hencerecommendation) that sells a coffee rather than a finalconsumer's own selection. That is, coffee in specialty shopsare often "pushed" instead of "pulled," especially when thecustomer has no stated preference. Seller incentives as wellas a vested interest in Kona Coffee can be particularlyuseful in this regard. Past industry activities tied to theKona Coffee Festival and this report's recommendations(see Chapter V) are some possible actions.
Flavored coffees. Related to the above, someconsumers may enjoy the quality of and trappings (e.g., therituals of grinding and brewing coffee) associated withspecialty coffees without having a particular preference.Many, if not most, would be hard-pressed to describe thedifferences between coffees of similar quality. Some assertthat at least fifty percent of coffee drinkers cannotdistinguish between coffees, yet, most know when they tastea product they like. Flavored coffees provide theseconsumers with a familiar and perhaps favorite taste.
While this has been called an "aberration ... amutant that came crawling out of Lake Mead into LasVegas" (Davids<2», sales of flavored coffee seems to bemore than an "insidious fad," and likely cuts into sales of
41
Kona. This may be particularly true in Hawaii markets,where the popularity of macadamia nuts will enhance amacnut-flavored coffee, especially in the tourist market.Image is a major contributing characteristic for both giftand tourist sales.
Kona-style coffee. The limited supply of KonaCoffee coupled with its high prices and revenues are apowerful incentive to produce Kona-style coffee. A Konastyle coffee is essentially a counterfeit product. Mislabellinga blend as pure Kona is one example. At best, Kona-stylecoffee is a blend of inexpensive coffees that allegedlymimics the characteristics of Kona. With anything less,consumers get a product whose quality may impart a false,and perhaps negative, impression of true Kona Coffee.Producers of Kona-style use the name, image, andreputation of the true product to their benefit, while theKona Coffee industry loses both current and potentialrevenues and markets. As an example, a rumor on theWest Coast was that the amount of Kona sold is two timesthe actual production. Further, part of the "poor qualitycoming out of Kona" might be traced to a counterfeitproduct! Buyers would therefore be more unwilling to payhigher prices because they may not get the real thing, wouldbe more leery of making a purchase, or may not buy Konaat all.
One estimate places the extent of counterfeitproduct at 20 to 35 percent of the total U.S. mainlandmarket for Kona. The existence of Kona-style coffee seemsto be more pervasive on the East Coast--in New York City,both Kona-style and JBM-style coffees were observed beingsold out of bulk barrels in one of the leading gourmetstores. Casual observation led to the belief that shopperstend to ignore the "style" portion of the name.
Other Hawaii coffee. Kona's high prices andrevenues have also attracted several efforts to produce otherHawaii coffees. Maui Tropical Plantations is producing andmarketing its own "Maui Blend," albeit on limited acreage.Amfac and Castle & Cooke are conducting trials at severallocations on a number of varieties. Amfac's intent is to lookfor a niche, perhaps around the idea of Hawaii being anAmerican coffee. The firm may also approach the laborproblem by subleasing orchards to individuals whilecontracting to provide certain services and to purchase thecrop.
Two other firms will rely heavily on mechanicalharvesting, and have stated an intent to producecommercial-grade coffee at world prices. Coffees ofHawaii, inc. (formerly Hawaii Guarani Plantations) plansproduction on up to 800 acres on Molokai and is reportedto have at least informal marketing agreements with a largeroaster. Island Coffee Co., a joint venture betweenMcBryde Farms Inc. (a subsidiary of Alexander & BaldwinInc.) and Hills Bros. Coffee Inc. (A subsidiary of NestleSA.) has processed a small sampIe crop < 3 >. The venturehas 400 acres in coffee on Kauai, of up to a planned threemillion trees on 5,000 acres. If successful, the first

commercial crop will be harvested and marketed in 1990-91,either as a separate blend, as part of other Hills Bros.coffees, or both.
One of the major product attributes of KonaCoffee is its image. Hawaii coffee will be a competitor tothe extent that it is the image of "Hawaii" and not "Kona"that sells the product. This will be especially true for thetourist and local gift markets, where the expected lower costof Hawaii coffees will provide a distinct advantage.
Hawaii coffee has been called the dark stormclouds on the horizon that threaten to engulf the Konaindustry. It has also been called a double-edged swordbecause while Hawaii coffee could cut drastically intoexisting markets with its image and price, it could alsoenhance Kona Coffee's position. For one, this mightprovide the basis for a blend of Hawaii coffees, and thusincrease the demand for Kona Coffee because of a broaderproduct line.
Hawaii coffee is also expected to provide sufficientvolume to attract large firms and efforts toward developinga mass market. These firms have considerable financialresources, especially relative to the Kona industry. Bypositioning itself as the premium Hawaii coffee, Kona couldbenefit from promotional efforts by these companies tobetter penetrate new and existing markets. Hawaii coffeeswould therefore enhance the awareness of Kona Coffee.
Chapter IV.B Footnotes
<1> Much of the information presented is from a personalinterview with Mr. Derryck Cox, Jamaica TradeCommissioner, supplemented by data obtained from othersources.
<2> Davids, Kenneth. Coffee: A Guide to Buying,Brewing, and Enjoying (revised edition). 101 ProductionsSan Francisco, 1987. pg.28. '
<3> Andrade, Ken. "A&B in Coffee Venture with Nestle"in Honolulu Star Bulletin, February 14, 1989.
IV.e Image. The standard a~ainst which all coffees are judged is
JamaIca Blue Mountam (JBM). Where Kona is oftendescribed as good or very good, JBM is a great coffee.T.hus, whi~e the general cons~nsus h~lds Kona to be of veryhIgh qualIty, many people m the mdustry, the specialtyroasters in particular, believe Kona to be no better thanmany other premium coffees when judged purely on itsphysical characteristics as a coffee. Some comparableproducts named by different individuals include Kenya AA,Sumatra Mandheling, Guatemalan Antigua, and ColombianSupremo, all of which may sell for $2.50 to $3.00/lb less(green) than Kona.
42
The main reason for this price differential is hereincalled the image of Kona Coffee, backed by a high qualityproduct with a good reputation. This nebulouscharacteristic of image has also' been described as themystique, aura, or romance associated with Kona Coffee.
More often than not, image is associated withHawaii instead of Kona. For these consumers, there is littledifference whether the coffee is.from Hawaii or from Kona.The imagery and fond memories of Hawaii are a uniquecharacteristic and currently a strong selling point of KonaCoffee. Yet, Kona Coffee is a part of the Hawaiiexperience for only some of the general public--the overallmystique of Hawaii does not automatically carry over toKona. "Hawaii" and the name "Kona" do not make theaverage consumer think of coffee as does "Colombia."Similar to how "Idaho" evokes an image of potatoes,"Washington" of apples, and "Florida" of oranges,Colombia's advertising and promotional campaign has beensuccessful in associating their name (and Juan Valdez) withcoffee.
To knowledgeable consumers the Kona namemeans high quality, but some people do not know that Konais in Hawaii. One anecdote tells of a retail seller whoclaimed Kona Coffee was from Africa. This again points tothe need of high quality associated with the name.
. ~hus, Ko~a Coffee c~n command a price premiumover SImilar qualIty coffees If only because of its image~s~ecially as as~ociat~d with H~waii. In this sense, prestig~IS Involved--a hIgh prIce can reInforce the image of a highquality, exotic product. Several approaches taken to furtherbolster this image involve slick packaging and an emphasison the whole bean appearance of especially higher gradeKona Coffee.
. The price/value relationship that exists in buyers'mInds must be maintained. Part of its image is that KonaCoffee is expensive, but worth it. A price not consistentwith a high quality image could lead consumers to questionthe quality of the product (e.g., why would a Mercedes sellfor $100, unless something was terribly wrong with it?).Conversely, a poor quality product will hurt Kona's imageand prestige, possibly to the extent that consumers expect topay a. lower . price ~d again, suspect products pricedInconsIstent WIth the prIce/value perception.
Other Hawaii coffees will benefit to the extent thatit is "Hawaii" rather than "Kona" that builds Kona Coffee'simage. In the longer run, it will therefore be imperativethat consumers be able to differentiate Kona from otherHawaii. coffees. If not, one person noted that product mayotherwIse leave the State as Hawaii coffee, but will be"transformed" and sold on the mainland as Kona Coffee.Hawaii coffee gets Kona's price, but assuming Kona Coffee~s of higher quality, such sales will only harm the KonaImage.

IV.D Reputation.An issue often discussed with image is the
reputation or "good name" ~f ~ona <:offee. Reput~tion andimage are closely related; .similar to Ima~e, reputatl?n dealswith peoples' past exper~ences, but Wlt~ emphasIs o~ aspecific product. ReputatIon also deals WIth more tangtblemeasures (e.g., cupping quality, supply reliability, price)whereas image has more emotional ties. The majordifference is that Kona Coffee has a reputation of its own,but the image of Kona Coffee is blurred into the image ofHawaii.
Reputation and image are also intertwined withpeoples' expectations: a good reputation and image helpform high expectations of a product. Conversely, sinceKona Coffee has no separate image, reputation will betarnished more than image if expectations are not met.That is, Hawaii will survive, but Kona Coffee will godownhill.
The separation of reputation and image into closelyrelated but distinct concepts makes it easier for the industryto focus its activities so as to get a greater marginal impact-that is, better results for the extra time and effort that areinvested. In the long run, it may be beneficial to develop astronger image for Kona Coffee, but the industry's short runprograms will be more effective with an emphasis onmaintaining or enhancing Kona Coffee's reputation, ratherthan Hawaii's image. The element of reputation that can bemost affected by the industry (that which the industry hasstrongest impact on) is the quality of Kona Coffee. By nocoincidence, reputation and quality are pivotal elements indiscussions of Kona-style or counterfeit Kona Coffee and ofKona blend.
The issue of ruining a product's reputation throughthe marketing of low-quality goods is very relevant to KonaCoffee and cannot be ignored. In economics, it is widelyrecognized that selling some inferior units can harm thereputation, and thereby reduce the total demand for theproduct. Once the reputation is hurt, prices must belowered on all units - regardless of their quality - to movethe same volume of product as before the diminishment ofthe product's reputation.
Used cars are the classic example of thisphenomenon. Everyone assumes that used cars are"lemons" and thus reduce the amount they are willing to payfor any particular car. Assuming the worst case reduces thecosts of making a mistake. The other alternatives the buyerfaces are: 1) to conduct a costly search to identify those carswhich are not lemons; or 2) to believe the salesperson atface value, which entails obvious risks. Thus, the least riskyand least costly strategy for the buyer is to assume all usedcars are lemons. This is a situation which the Kona Coffeeindustry must avoid.
43
IV.E Quality.Quality is a cornerstone of the Kona Coffee
industry. Without high quality, it is doubtful that thecurrent industry would survive for very long. We can tr~ce
out a likely scenario: High prices are a powerful temptationto sell lower-quality product, but if enough producers selllow-quality coffee, consumers will learn. to as~ociat~ lowquality with the product. The practice wdl ahenateconsumers, who will switch to other coffees of equal qualitybut lower price. The consumer will not believe claims ofhigh quality, so will not continue to pay a premium.Without high prices the incentive to produce and maintainhigh quality is eliminated, and most of the current growers,processors, roasters, and related entities would find itunprofitable to handle Kona Coffee. Only low qualitycoffee would be produced and sold. For the industry ingeneral, bad coffee will drive out good coffee.
Low quality will have somewhat different impactson different market segments. Assuming it is still profitableto the firms involved, the Hawaii image will continue to sellsome Kona Coffee, but at a lower price. Because of itsimage, Kona Coffee will probably continue to be in demandfor the tourist market as a souvenir item, and for residentsas gifts.
Image will have less of an impact on the specialtycoffee segment, including most of the export markets, wherequality is more important. However, the problem of poorquality does not preclude the development of, for example,estate coffees or some other means of branding. Individualfirms may get price premiums to the extent that they areable to develop and maintain their own reputations, sinceconsumers can learn to associate quality with certain brandnames.
Thus, problems with quality do not necessarilymean that the industry will totally vanish. However, anysurviving industry will probably be smaller than the currentsituation. It is almost certain that Kona Coffee will notdevelop to its full potential.
The current general opinion within the industry andamong coffee handlers is that Kona Coffee is a high qualitycoffee. However, a number of complaints were repeated inour interviews. Many roasters noted irregularities in eitherthe production, harvesting, processing, grading, roasting, orsome other facet in the handling of Kona Coffee, leading toirregular quality. Some industry observers have commentedthat the processors seem intent on competing via price,instead of quality. It is reported that at least some Japanesebelieve Kona is "not too good", in part because of the poorquality and bad reputation of the product processed inJapan. Several have complained that "You can't get a goodcup of Kona Coffee in Kona."
It seems the industry's and product's reputation forhigh quality is being tarnished. Individuals are tradingshort-term profits (the "quick buck") for the longer termbenefits. Once lost, it is very difficult to regain a goodname. The easier route in the long run is to maintain highquality and a good reputation.
There is a chain of handlers from the grower to thefinal consumer. Maintaining quality is importantthroughout: like a chain, the overall industry is only asstrong as its weakest link. Quality cannot improve oncecoffee is harvested. Therefore, production and harvestingmethods must ensure top quality. Proper milling isimportant. Buyers must be knowledgeable enough to"purchase correctly," and final consumers must properlyprepare the final cup of coffee.
For example, "raisins" lowers grade and poorcupping, but it is difficult to separate them at the mill.Pickers must understand this and correct the problem; ifthey won't, then a scheme such as a per pound penalty atthe mill level (if universally applied) could be a powerfulincentive. If the mill is not maintaining quality, thenroasters should be made aware, and take action withappropriate price adjustments. Ideally, if final consumersare aware, they could boycott a roaster's product. Thegrowers and perhaps processors currently have very littlecontrol of what happens to Kona Coffee once it leavesHawaii, and it may be unrealistic to try to do so. However,the industry can can take steps to assure top quality whenthe product does leave.
IV.F Blends and Labelling
IV.F.! RecommendationThis report recommends that the State move
cautiously in the area of minimum content standards.Instead, 'we propose a combination of truth in labelling,certification, and buyer education and promotion as analternate means of protecting the Kona Coffee industry.Our analysis and reasoning follows.
IV.F.2 AnalysisBlended Kona Coffee is a major issue and point of
contention within the Kona Coffee industry. A relatedproblem is counterfeiting, but the underlying problem forboth is that a large amount of other coffees is beingperceived by consumers and being sold as pure KonaCoffee. Of note, the majority of residents and visitorssurveyed believed pure Kona Coffee makes up at least 50percent of a Kona blend (Table IV-2). This would tend tosupport the contention of one roaster that his sales werebeing hurt by labelling his actual content.
The minimum content argument revolves aroundhow much Kona Coffee should be in a blend before it cancarry the label "Kona." The two extreme positions are: (1)any Kona blend should have a minimum of fifty percent (orsome other level) of Kona; and (2) as long as the product isaccepted in the market place (i.e., consumers are satisfied)don't bother with any minimum standards. The costs andbenefits of pursuing either proposal varies with the identityand position of the market participant, so it is usually true
44
that once the target market segment of a participant isidentified, so is the position that he or she favors.
Supporters of the legislation implicitly assume thereputation of Kona Coffee is being weak~~ed thro~~ thesale of low content Kona blends, so reqUIrIng a mInImumcontent will strengthen reputation and lead to an increase indemand for Kona Coffee. The basic argument is thatconsumers of Kona blend are disappointed by its qualityand so are "turned off' to Kona Coffee in general. Thosewho oppose the legislation maintain that the sale of Konablends has not adversely affected sales and, if anything, hasincreased the demand for Kona Coffee.
While we strongly believe the quality andreputation of Kona Coffee must be protected, the role ofKona blends relative to quality and reputation, andespecially to demand, is not clear. The proper strategy forthe industry to follow depends upon at least four factors:
1. The ability of consumers to distinguish (based ontheir perception of cupping quality) various levels of Konain the blends and their preferences, based on a willingnessto pay, for these levels.
2. The degree to which, if any, the presence of lowpercentage Kona blends damages the overall image of KonaCoffee and hurts its marketability.
3. The economies of size (efficient plant utilization)in the processing and roasting of Kona Coffee.
4. The relative consumer price elasticities ofdemand for pure Kona Coffee and blended Kona Coffee.
With respect to these four points, let's review whatinformation is needed to arrive at a rational decisionregarding the minimum content, and what someimplications could be.
Consumer cupping ability. There is someinformation on the desirable characteristics of pure KonaCoffee. Many argue that blending is an art to create aparticular set of characteristics, and some claim Kona canbe duplicated using the proper mix of other coffees. Themix for a particular blend usually changes over time withthe availability, cost, and quality variation in the blendcomponents. Further, higher percentage of Kona does notguarantee a better product; it is possible for a 25% Konablend to be inferior to a 10% blend, depending on thequality of the other coffees. So, setting some minimumlevel mayor may not improve the blend's quality.
It also seems accepted that most Americans areused to and prefer a blend, and some argue that KonaCoffee has the image of a premium blend. Critics point outthat Kona is unique, and should not be transformed toimitate a common, everyday beverage.
It is not clear whether consumers are able todiscern any differences, positive or negative, from theamount of Kona in a blend. Moreover, we don't know howthis would translate into what they would be willing to spendnor the amounts they would wish to purchase. A minimum

Table IV-2. Perceived Percentage of Pure Kona Coffee in Blend, by Respondent Type
At least 50% Mean level ofrespondent n (%) Kona in blend
Oahu Resident 75/107 (70%) 51.4%u.s. Visitor 567/670 (85%) 55.7%
Japan Visitor 156/222 (70%) 51.1%
Explanation: thus 75 of 107 Oahu residents, or 70% of respondents, believed a Kona blend contains at least 50% KonaCoffee. The mean perceived level of Kona Coffee, over the 107 respondents, is 51.4%
content may raise the price of the product, with no otherdiscernible difference to the consumer! Unless thecustomer can be convinced otherwise, the laws of supplyand demand predict that sales will decline.
Taste panels and focus groups are appropriatemethods of obtaining information on the cupping abilities ofconsumers, and on their preferences. CTAHR isconducting research in this area using these formats. Inaddition, this may present an opportunity for the industry toeducate consumers on what constitutes a "good" cup ofKona Coffee blend - if the industry chooses this direction.
Impact on reputation. Many (but not all) roastersbelieve there should be some type of control over blendpercentages to minimize abuse of the Kona name, althoughit was unclear on how such legislation would be enforcedand even whether they themselves would abide by it. Therewas wide disagreement on what an appropriate minimumlevel should be, with suggestions varying from ten percent toover seventy percent. A straw poll found that most roastersconsidered even as high as a 25-30% blend to be aquestionable practice, but that it is nevertheless common for"the other guys" to abuse the Kona name. Nevertheless, allexcept one roaster implied that their product was below theproposed fifty percent minimum.
This may be primarily a competitive response.Most will agree that blends are more profitable and areoften necessary to "stretch" supplies of Kona, especiallyduring short years. Almost all mainland roasters also~omplained about the high costs of Kona Coffee, includingInventory costs, advancement of payments, and small ordersize. A high minimum content law could exacerbate theirproblems.
Economies of size. Certain costs such asdepreciation, management salaries, and lease rent are fIXedover a broad range of production output. The efficient andprofitable operation of a processing or a roasting plantdepends not only on the price received for output and pricespaid for inputs, but also on the ability to operate at close to
45
physical, managerial and marketing capacity. If not, theoverhead costs per unit of output become very high. Thereobviously may be tradeoffs between the number of unitsproduced and the price per unit received. However, itwould be foolish to assume Rolls Royce is not operating itsplant at close to capacity simply because Rolls Roycereceives a high per unit price .
Requiring a higher minimum content in Konablends than whatever is the current practice would raise theraw materials cost of the blend. This may mean roasterswould reduce the number of units produced (see discussionon elasticity) and thus, incur higher per unit overhead costs.It could conceivably lead to some processors and roastersdropping out of the industry if the price received doesn'tcover reduced operating efficiencies (but surviving roasterswill have increased opportunities). It could also enhancethe possibility of other coffees being roasted and sold inHawaii (notably other Hawaii coffees) in place of Konablend, if only so roasters can more fully utilize their plants.Whether either scenario is good for the Kona Coffeeindustry, especially the producers, is questionable. Theimpact of minimum content standards on economies ofscale must be addressed.
Elasticity of demand. With the exception ofpossible damage to reputation, the selection of theappropriate minimum level of Kona in a blend will hinge onthe relative elasticities of demand for blended Kona andpure Kona Coffee. The elasticity of demand, Ed, also calleddemand elasticity, is a measure of consumers'responsiveness in terms of purchases of a product tochanges in the price of that product, ceteris paribus. It isusually expressed as a ratio of percentages:
Ed = (% change in quantity purchased)/ ( % change in price) < 1>

Ed is almost always characterized as elastic orinelastic. In the case of an inelastic demand, the percentchange in quantity purchased is less than the associatedpercent change in price (i.e. for inelastic demand, Ed < 1).In the case of an elastic demand the percent change inquantity purchased is greater than the percent change inprice (i.e., for elastic demand, Ed > 1).
While not in such vague or overly academic terms,most successful businesses are increasingly aware ofdemand elasticity. That is, they know what happens to salesvolume and revenues (and hence profits) if the price of theirproduct is either raised or lowered. While it is generallytrue that less product is sold if price is raised (and viceversa), whether total revenue also decreases is anothermatter. Recalling that total revenue equals the quantitysold times its per unit price (TR = P X Q), the elasticity ofdemand predicts the relationships between a price changeand its effects on quantity sold and total revenue.
With an inelastic demand, total revenue increaseswhen price is increased. Although charging a higher pricewill reduce the number of units sold (law of demand), theprice gain is high enough to offset the loss in numbers sold.If price decreases, revenues will decrease.
With an elastic demand just the opposite is true.Total revenue is decreased (increased) if price is increased(decreased). The increase in price is not enough to offsetthe decrease in units sold.
With a demand elasticity of 1, total revenues areunaffected by changes in product price. (However, Ed = 1is a hypothetical case that is rarely observed).
In a simple example with Kona Coffee, supposeblends and pure are separable products, and supposeminimum content legislation is used to force an increase inthe amount of Kona Coffee used in a blend, with the intentof helping the Kona Coffee "industry" (however industry isdefined). The cost of the blend will increase, because KonaCoffee is more expensive than the other blend components.What happens if roasters pass this cost increase on toconsumers? This sets of a chain of events. Because price isincreased, we expect that less blend will be sold. If thedemand for Kona blend is elastic, the increase in price willnot compensate for the loss of sales volume, so totalrevenues from blend sales will decrease.
If this means less Kona is used for blends, then theexcess must be sold on the pure market. To move thisextra, the price will have to decrease, but if demand isinelastic the revenues from pure sales will also decrease! Ifthe hypothetical demand elasticities are correct, then whatis necessary to increase revenues is to increase sales in thebl~~d market, just the opposite effect of the proposedmInImum content! <2>
The analysis to this point shows what happens onthe roaster level. What are the impacts on growers? In theshort run, especially over a harvest season, the supply ofKona Coffee is essentially fIXed. That is, the amount ofcoffee is set (growers might harvest less, but cannot produceany more), so grower earnings are determined by the pricereceived. In the scenario above, it is likely that roasters and
46
processors will pass the lower price needed to move pureKona Coffee back to the grower, resulting in lower growerrevenues. Again, the effect is the opposite of thelegislation's intent.
But what if the elasticities were reversed? Or whatif both demand curves are elastic (or inelastic) but to adifferent degree? We can gain intuitive insights towardanswering such questions by considering two major factorsthat determine the demand elasticity for coffee: (1) theimportance of Kona Coffee in the buyer's budget, and (2)the availability of good substitutes for Kona Coffee.
First, if expenditures on a product make up a smallportion of the buyer's total income or wealth, we expect thatdemand would be more inelastic than for a product whichtakes up a larger share of the budget because the amount ofmoney affected by a change in price is relativelyinsignificant. Second, with many good substitutes, buyersare able to easily switch between products when priceschange. Such a product will tend to have a more elasticdemand than another product which has few substitutes.
Salt is a commodity that illustrates bothfactors <3>. A dash or two of salt costs less than a penny,and one package lasts a long time. Thus, expenditures onsalt are a very small part of consumer budgets. Further, salthas only a few good substitutes. Even if salt prices were todouble or triple, we would not be sprinkling sugar on frenchfries. If prices were to fall away to almost nothing, we wouldnot give up pepper and instead pour more salt onto ourscrambled eggs. Overall, buyers are relatively insensitive toany change in the price of salt; demand is very inelastic.
This example provides further insights. Suppose anexecutive at Morton's Salt Company is inspired by thisanalysis to double the price of their product. If this schemewere carried out, Morton is likely to lose a lot of itscustomers because there are other sources -- i.e., substitutes-- for Morton salt. The demand faced by a firm is usuallymore elastic than the demand for the industry. As asidenote, this observation is a major driving force behindproduct differentiation via branding, packaging, advertising,and other activities. A differentiated product is perceived asbeing different from its competitors, so it effectively has fewsubstitutes.
In considering these factors, it quickly becomesapparent that the relevant level of inspection is not thebroad "Kona Coffee market" but instead the individualmarket segments. For instance, we would expect demand atfour-star restaurants to differ from demand insupermarkets. The restaurant would be part of a small elitegroup, patrons are likely to be more affluent and pure KonaCoffee may be the only coffee served, while supermarketsshoppers have shelves of coffees and probably severalsupermarket chains to choose from. For tourists,substitution is not only between different brands of KonaCoffee, but also with any other product that could serve as agift or souvenir. In this tourist market segment, we expect aprice increase will result in sales shifting to items such aschocolate-covered macadamia nuts, shell leis, or Alohawear.

There are other issues relating to a regulatory orlegislative approach such as proposed with a minimumcontent standard. A major one is whether governmentshould support one group at the expense of another. Othersrelate to monitoring and enforcement, the applicability oflaws to out-of-state roasters and markets, the ability andcost to evaluate the blend level to check for compliance,whether a government-run program will be toobureaucratic, who is liable (should there be governmentsubsidy) if buyers decide to abandon the regulated productin favor of a cheaper import, and the question of who wouldpay for any such program.
The relevant demand elasticities would be of greatassistance in resolving the minimum content issue.Unfortunately, this information is not available, andobtaining such information is a costly, time-consuming, andoften impossible task. There are at least three alternatives.One is to do nothing. The second is to go ahead with theminimum content standard anyway, and hope things workout or that any damage is reversible. We cannot blindlycondone an effort that could severely backfire, and whichmay be advocating one segment of the industry to thedetriment of another.
The third is to take a modified approachsomewhere between both extremes. This reportrecommends using "truth in labelling" together withpromotional backup and a certification program for pureKona Coffee. With truth in labelling, blends must be clearlylabelled as such, and roasters will be required to specify thepercentage of Kona Coffee. Many of the benefits attributedto minimum content standards would be achieved by truthin labelling. There should be less problems than withminimum content, because the market mechanism willdecide many of the issues, including how much Kona shouldbe in a Kona blend<4>.
Truth in labelling might even be instituted in avoluntary form, using the rationale in Chapter V forcertification. That is, customers can be educated to
Chapter IV.F Footnotes
question blends that do not list the content. Roasters willhave an incentive to behave ethically, so products will berepresented accurately. Consumers in the differentsegments will be able to effectively dictate what blends theywant, and what prices they are willing to pay.
IV.F.3 ConclusionsOur recommendation is that the State move
cautiously and slowly in the area of minimum contentstandards. Rightly or wrongly, it is clear that some KonaCoffee handlers will benefit from minimum contentlegislation, and given the current situation, probably at theexpense of others. Beyond that, the impacts and objectivesof such legislation are very uncertain. There are severalserious questions that our research does not and cannotfully address.
As stated earlier, when necessary this report iswritten from the perspective of the well-being of the coffeeproducer. It is unclear whether minimum content standardswould result in higher prices and revenues to producers.The assumption that prices at the farm level would increasecan only be justified under certain conditions. Based on theon the limited information available, it is impossible todetermine the "optimum" level for minimum contentstandards. The information can neither support nor refuteminimum content legislation.
The desired industry-wide results attributed tominimum contend standards could be obtained using truthin labelling augmented by certification andeducation/promotion. This will promote free and honestcompetition by allowing the consumer to make an informedchoice.
<1> Ed is generally a negative number since price and quantity purchased usually have an inverse relationship, i.e., as priceincreases (decreases), the quantity purchased decreases (increases). To avoid complication, demand elasticity is usuallyreferred to as a positive (absolute) value.
<2> A variation of this occurs in the orange industry, where fresh oranges are the higher priced product and orange juice isthe equivalent of the blend. Much of a season's production is often sent to the processing market, or destroyed in the field,to limit supplies of fresh oranges and hence, raise prices and revenues.
<3> Adapted from Paul Heyne, The Economic Way of Thinking (4th edition), Science Research Associates, Inc., 1983. pp.27-31.
<4> As to the argument of undue hardship because roasters would need several labels to account for a percentage that iscontinually changing, truth in labelling could allow for lettering along the lines of "contains at least X percent pure KonaCoffee," or only different stickers with the various percentages could be used. The latter will also allow existing stock to beutilized.
47

v. CONCLUSIONS AND RECOMMENDATIONS
V.A ConclusionsThe Kona Coffee industry is not dealing with a
single, homogeneous market. Instead, Kona Coffee involvesseveral market segments according to the product form,target consumer, and market channel by which the productreaches the consumer. These market segments aredifferent because of the factors that affect buyers' purchasesand subsequently, the focus of any marketing efforts. Thefact that there are several market segments, and thatdifferent firms target different segments, makes it verydifficult to develop industry-wide recommendations thathelp, or at least don't hurt, all industry participants.
It is not the intent of this report's recommendationsto neglect any market segment. In most cases, a strongargument can be made that improvements in one marketsegment has positive spillover effects on other marketsegments. As an example, promoting Kona Coffee inrestaurants should increase sales in gift shops. Yet, giventhe scarce resources available to the industry, it will beunwise to apply efforts equally across all market segments.The Kona Coffee industry will be facing difficult choices.
This study identified various marketing issues thatrevolve around three product and industry characteristics:high quality, good reputation, and appealing image(romance, mystique, and allure). Although treatedseparately in the analyses, these characteristics are stronglyinterrelated. Quality is the cornerstone. It must be reemphasized that top quality starts at the producer and canonly be maintained, not enhanced by each step to the finalconsumer. T~e reputation of Kona Coffee is largely basedon t~e quahty of the product, but reputation is alsomagnIfied by Kona Coffee's image. To come full circle theimage of Kona Coffee is enhanced by the product's quaiity-Kona Coffee is at least a class above the more commontourist trinkets such as plastic hula skirts beach mats andHawaii key chains. "
All three characteristics are necessary conditionsthat must be mainta~ned and improved for a viable, longterm Kona Coffee mdustry. To do this, the long-termrecommendation is for ongoing education information andpromotional programs. If successful, ma~y of the m;rketo~iented is~ues in Table IV-1 ~ll be addressed by providinghIgh quahty, good reputatIon, and appealing image.However, there are three problems that can have animmediate negative impact on these characteristics and indoing. so, that pose a threat to the long-term well being ofthe mdustry. These are counterfeit Kona Coffeeinconsistent supply, and a lack of industry cohesion. '
First, counterfeiting--the use of "Kona-style" and"Kona-like" coffee--must be minimized and eliminated. Theindu~try is not ~nly being hurt .by lost sales right now, butthe Impact on Image, reputatIon, and quality will causeserious long-term, perhaps irreversible damage. Werecommend certification of pure Kona Coffee backed up byan education and information program.
48
The second problem of inconsistent supply as aresult of fluctuations in yields would be less of an issue byitself, except for the high cost of carrying Kona Coffee ininventories. This problem involves both fluctuationsbetween years, and fluctuation within a year. The suggestedinventory or stock control program is a possible solution.
Finally, a problem that affects the followingrecommendations and any other industry-wide programs isthe lack of industry cohesion, especially as relates toimplementation and cost. The dimensions and extent of thisproblem are aptly demonstrated by the industry'sexperience with their Kona Coffee Council. Anorganization such as the KCC will greatly facilitate any typeof industry-wide activity. In some instances the industryorganization is necessary. This report contends that anunderlying cause of industry divisiveness is the differentKona Coffee market segments. We hope this understandingwill encourage the re-establishment of some type of activeindustry organization.
. Many of the issues confronting the Kona CoffeeIndustr¥ can be tra~ed or distilled to concerns with quality,reputatIon, and Image. Other issues are differentperceptions arising because different individuals servicedifferent market segments. The major issue in this regard isKona blend. The analysis in Chapter IV did notconclusively show that a Kona blend is either good or badfor the entire industry. There are serious questions that ourresearch does not and cannot fully address. Given ourcurrent state of knowledge, we believe the industry as awhole should not have minimum content standards at thistime.. . Instead, the desired industry-wide results attributedto mInImum content standards could be obtained via truthin labelling augmented by certification and, on an industryor fIrm by firm basis, with education and promotion.
The remainder of this report offers some broadmarket-oriented recommendations by which the entir~Kona Coffee industry can improve its profitability. Thecoffee marketing programs of Jamaica and Colombia arefirst outlined. These programs provide a wealth ofbackground information for industry programs.
.<?ur .long-term recommendation for improvedprofitabI~Ity In t~e Kona Coffee industry involvesInformatIon, educatIon, and promotional programs directedat all marketing levels from the grower to the finalconsumer. More immediately, certification is a viableprogram to supplement and enhance informationeducation, and promotion. A second recommendation thatcan be initi~ted i~ an inventory or stock control program asa m~ketIng-C?rIented approach to easing supplyfluctu~tIons. FInally, any att~mpt at reaching the industry'spotentIal, and almost certaInly the most effective andeffi.cient means for doing so, will require cohesive groupactIon on the part of the Kona Coffee industry members.Therefore, our last recommendation is for some type ofindustry-wide organization.

V.B Jamaica and Colombia's ProgramsJamaica and Colombia provide examples of
programs aimed at protecting and promoting their coffees.In these programs, the roles of grading and cert!fication,. aswell as of government, promotion, and fin~cmg proVIdestrong insights into possible action by Kona's Industry.
Jamaica. < 1> In the 1920s and Thirties, Jamai.cahad a large coffee export industry but with .poor quahtycontrol. The industry almost collapsed until the ~offeeindustry board and certification pro~am was started 1!1 theFifties. Today, Jamaica Blue Mount!"n (JB~) coffee IS !hepremier coffee in terms of reputation, quality, and price.JBM can command a retail price of $24 per pound (1987),when and if it is available. Such prices combined with alimited supply (only about one million pound~ of gr~en JBMis produced annually, with three-fourths b~I~~ shipped toJapan) are a power~ul ince!1ti~e for activities such. ascounterfeiting and cutting or diluting the product and selhngit as pure JBM.
To demand its price and be able to hold it, Jamaicahas taken a number of steps to maintain quality and assurea 100%, pure product. Only coffee grown in certain areasand above a given elevation (2500. feet) can b~ called "~lue
Mountain". Other grades are High Mountain and PrimeWash. The government has grower education programsand a nursery, and government ~arms produce 25 percent. ofthe crop. All JBM production IS purchased by the JamaicaCoffee Industry Board (a government body) which checksquality, grades, and sets price. Any produc.t not suitable forexport can be processed for the domestic market. ~he
board has returned to shipping green JBM after an abortiveattempt to protect quality by shipping only roasted JBM,since it is harder to tamper with roasted coffee.
Specialty roasters are the preferred customers. Ifsold to brokers, the buyer must disclose its customers. Onlycertain cooperatives can export JBM, and only after thebuyer has been approved by the board. Further, the boardhas the authority to take and test samples.
Jamaica prohibits the importation of green coff~e
except for use in domestic instant coffee, and JBM blend IS"discouraged" in Jamaica. Although a High M~untain blendexists there is no authentic JBM blend In the u.s.(alth~ugh it is not clear whether ~his is by mandate, becauseit is counter to the 100 percent Image of JBM, because ofimplicit loss of ability to purchase JBM, or because ofimpossibility of proving content in a blend).
Jamaica started exporting JBM in a distinctivewooden barrel in the late Fifties or early Sixties. Aconsumer and trade education program is planned.Consumers are warned to be suspicious of underpricedJBM since Jamaica prices green JBM at $9 to $10 perpound. The trade education emphasizes that JBM is onlyexported in a wooden barrel, with a seal by the coffee boardand ICO certification. A buyer will be able to ask for boththe seal and certificate. Jamaica is actively fighting resalesfrom Japan, including warnings that the seal and certificateare not applicable except to direct purchases.
49
Initially the program was fully funded by thegovernment. Assessments were started in the 1970's.Roasters and exporters now pay about a penny per pound(3-4 cents Jamaican) to help defray costs, but the progra~
is not self-financing. Thus, much of the progra~. ISgovernment subsidized. Since 1977, the BrltI~hCommonweath, Japan, and. the ~u!opean EconomicCommunity have been aggressively sohclted for loans to beused in expanding the industry.
Colombia. <2> The marketing program torColombian coffee is administered by the FederaclonNational de Cafeteros de Colombia (National Federatio~ ofCoffee Growers of Colombia). The goal of the Federationis to improve the standard of ~ving of coffee ~owers byproviding an acceptable economic ret1!rn to gro~ng coffeeand by avoiding drastic fluctuations In purchaSing p0'Yer.Activities include production research; grower ed.ucatIon,health care, housing, and sanitation; market pro~~tIon; andgrower financing. The :':eder~tion gene~ally faclhtates themarketing of coffee, and IS a direct seller In some Europeancountries.
Product quality and consistency are critical to thesuccess of the program and ultimately, for the overallwelfare of producers. There must be sufficient volumes tomeet increased demand--it is costly to advertise a productthat is not available. The Federation therefore supportsresearch and development, and promotes the application ofmodern technology to coffee production. It also operates afreeze-drying facility, and has a participatory role in theGrancolombiana Shipping Company, the Coffee Bank, andin warehousing and insurance.
Colombia's program is centered around the twentyfive year old "Juan Valdez" logo and "100% pure Colombiancoffee." Colombia's strategy is partly based on consumerawareness of the logo. According to the Federation, JuanValdez has been very effective in developing consumerdemand for Colombian coffee, mainly by getting existingdrinkers to switch from other coffees.
Together with this "pull", the strategy called forColombian coffee to be pushed into the market channels.u.s. roasters were hesitant to join the program due to theinvestment made in developing blends and in brandingproducts, so strong incentives were offered to handle 100%Colombian coffee. Incentives included a rebate program aswell as help in advertising. These have reportedlydeveloped a vested interest on the part of ~oasters tocontinue buying Columbian coffee and to abide by theprogram's rules.
In the current program, the Federation runs amultimedia campaign featuring Juan Valdez, augmented bypromotional materials such as shelf strips saying 100%Colombian. Columbian coffee can only be purchased byentering into contracts with the Federation, and accor~ing
to certain quotas. Packaging must sa~ 100% .Columbl~n,
but roasters can piggyback on the extensive media campaignby using the Juan Valdez logo in their advertising.

Monitoring and enforcement are crucial formaintaining credibility. The burden of monitoring rests onthe buyers, who must provide reports audited and certifiedby a CPA. These reports also are the basis for the rebateprogram, so there is a fmancial incentive for timeliness andaccuracy.
Enforcement also relies on blind tasting of retailpackages to test for fraudulent use of either the logo or"100% Colombian." These are conducted on both a randombasis, and according to tips from the industry. Colombiancoffee costs more than most commercial coffees. Becausecompetition is often on the basis of price, any "100%Colombian" product that sells below certain price levels isimmediately suspect.
Since the logo is trademarked, legal recourse isavailable to the Federation. Prosecuting a few cases takescare of most problems: in Colombia's case prosecution hasresulted in an estimated 80% reduction of fraudulent use.
The program currently costs $20 million per year($80 million over the past five years) just for advertising.The industry self-fmances its programs with taxes onproducts assessed on growers and paid by exporters. ForColombia, the volume of coffee is substantial, so program iscost effective.
As a crude measure of the program's effectiveness,consider the prices received. Table V-1lists selected FA.S.(source country) prices for green coffee entering the UnitedStates. In the six years of data, Colombian coffee had aprice premium of at least six cents per pound and up to 22
cents per pound over the world average. In 1986, thepremium translates to an additional $76.5 million over whatwould have been received if Colombia's exports to theUnited States were priced at the world average. In thissense, the Federation has achieved above average returnsfor growers.
However, the effectiveness is less certain whenBrazil is considered. As the world's largest producer, Brazilalso received a price premium over the average. It can beargued that the difference between Colombia and Brazil isdue to quality (i.e., type of coffee and processing) ratherthan a successful program.
Chapter V.B Footnotes
<1> Much of the information presented is from a personalinterview with Mr. Derryck Cox, Jamaica TradeCommissioner, supplemented by data obtained from othersources.
<2> The information presented is from a personalinterview with Mr. Dario Rodrigues of the NationalFederation of Coffee Growers of Colombia, supplementedwith information published by the Federation.
Table V-I. Prices Received for Green Coffee
worldyear average Colombia difference Brazil
1981 $1.19 $1.37 $0.18 $1.561982 1.18 1.40 .22 1.251983 1.19 1.29 .10 1.231984 1.30 1.36 .06 1.311985 1.26 1.35 .09 1.221986 1.66 1.88 .22 1.72
50
V.C Information, Education, and PromotionalActivities
"Promotion" involves general activities for theentire industry as well as activities targeting specific marketsegments. Promotion includes not only the more familiarpersuasive element, but information and educationalcomponents as well. The distinction being made betweenthe three components is largely a matter of degree, butunderstanding the difference is crucial because (1) it isusually easier (and less costly) to keep an existing customerthan it is to create a new one, but (2) keeping a customerrequires sustained effort and outlays <1> .
Persuasion includes the advertising and relatedactivities aimed atincreasing sales. Results are oftenimmediate, but results may also be short-lived. Informationand education seek to pass on knowledge that may increaseor extend the value of a product. There mayor may not bean immediate impact on sales, but results are usuallylonger-lasting. Further, informational activities are morepassive while education requires more active participationon the part of the audience. With respect to thecertification program discussed in section V.D, there is asubtle but important difference between a buyer merelyreading a list of certified sellers, and knowing theimplications of being or not being on that list. Thedifference could mean the success or failure of the program.
Promotional activities, as defined to includeeducation and information, provide excellent opportunitiesfor enhancing the long-term profitability and success of theKona Coffee industry. Promotion will enhance certificationand inventory control. However, successful implementationon an. in~ustry-wide basis may hinge on a cohesive industryorganIzatIon.
Footnotes
<1>: It should also be recognized that promotion usuallyentaIls a threshold effect. That is, a certain minimal level ofpromotion must be conducted before there is any impact.In some cases the dollars necessary to reach this thresholdlevel may be prohibitive. Two typical examples aremagazine and television advertising. Thus, the potentialimpacts of promoting Kona coffee via anyone activityshould be evaluated in light of not only that activity's merits,but also that money's use in some other activity.
51
V.C.I Promotional OpportunitiesPromotional programs can capitalize on a number
of factors. One group of programs centers around theproduct's quality, reputation, and image. Kona Coffee is arecognized high quality product. It is American, and isgrown in a place with romance and allure. As an export, itcan aid the trade imbalance. One industry suggestion is theslogan "American coffee for the American meal."
A second group relates to the tourists that come toHawaii. Visitors to Hawaii need be recognized not onlybecause of their direct and considerable purchases of KonaCoffee, but because of the longer-term, indirect benefitsthey could provide to the Kona Coffee industry. We ineffect have a "captive audience" that continuously turns over,with many opportunities for free or low cost promotion(especially compared to taking the message to visitors'hometowns). Each visitor that becomes a loyal customer inHawaii is one less client that needs to be sold in lessconducive conditions, and a satisfied customer often sells hisor her friends. Further, most visitors purchase souvenirsand gifts, so any items that convey the message of KonaCoffee would effectively be free advertising.
Interisland and trans-Pacific flights provideexcellent opportunities, as in subsidized 100% Kona beingserved to first class passengers or being included incomplementary goody bags. Hotels may have displays oflocal attractions, and some have gifts for their guests. KonaCoffee could have a prominent role in both. Restaurantsprovide ideal opportunities for visitors (and residents) to beexposed to and to try a new food product. Japanese-ownedlocal hotels may provide a great opportunity to gain an entryinto selling coffee in Japan.
Tourist-related attractions and events also provideunique opportunities. Attractions such as the Kona CoffeeMuseum and Maui Tropical Plantations provide anatmosphere conducive to promotion. The Kona CoffeeFestival is generally perceived as a positive event for theindustry. Among others, the festival provides opportunitiesfor tie-ins with tour packages and media exposure. Otherevents such as the annual Ironman Triathalon and thegamefishing tournaments attract as much or more people toKona. Events on other islands or even out of state couldalso be utilized, as in the Hawaiian Open or Kapalua Opengolf tournaments or the Aloha Week, Kamehameha Day, orRose Bowl parades. These are further discussed underspecific promotional activities.

v.e.2 Promotional ActivitiesTable V-2 lists a number of possible promotional
activities for the Kona Coffee industry. This list is notcomprehensive, nor presented with the idea that allactivities should be pursued. Its intent is to demonstrate therange of possible activities, many of which have alreadybeen used to some degree within the industry. IndividualfIrms may wish to pursue these activities independently. Onan industry-wide basis, different programs should betargeted at different marketing levels. The foundation ofKona Coffee's quality are growers; educational programsneed to be directed at this level to produce top quality. Theindustry must then target processors, roasters, otherhandlers, and fmally consumers to maintain that quality.The following discusses some of the items listed in the table.
Table V-2. Possible Promotional Activities forthe Kona Coffee Industry
* packaging* point-of-purchase/point-of-sale materials anddisplays* Coupons, price discounts* In-store demonstrations and sampling* Mass media
* generic advertising* cooperative advertising* Golden Cup program* joint promotion of complimentary products
* newsletter* trade magazines* tourist pubs* other publications, literature
* Kona Coffee Festival* tourist events* tourist attractions* Secondary market gifts and souvenirs
* Grower/processor education* Trade shows and booths* specialty outlet incentives
52
Standard Promotional Activities. Some of themore familiar promotional efforts deal with advertisementsin the mass media such as television, radio, newspapers,magazines, or billboards. These typically can be quiteexpensive, and there is often a threshold effect for especiallytelevision and radio, where an ad needs to be run for anumber of times before the message is passed to the targetaudience.
Generic advertising, where industry members pooltheir resources to advertise Kona Coffee as a whole, is oneoption for meeting expenses. Others are cooperativeadvertising with some of the broader spectrum promotionalcampaigns (i.e., Island Fresh, Made in Hawaii With Aloha,Hawaii Food Manufacturers), or with retailers andrestauranteurs. For restaurants, a "Golden Cup" programcould be tied to a certification program, with associatedpromotional opportunities. Another possibility is jointpromotion with complementary products such as pureHawaii cane sugar or Hawaii fresh milk. In the last case,there are already gift packs combining Kona Coffee withother items. While this is mainly targeted at the touristmarket, other opportunities are available. Again, activitieswill vary with different market segments.
Coupons or similar price discounts are often usedin printed media, and ad campaigns may include sales.However, these should be used cautiously depending onintent and because of possible impacts on image andreputation. For example, customers may question a highquality item that is being discounted, or a sale price that isrun often enough may be perceived as the actual price.Questionable and often illegal tactics such as bait-andswitch, mislabelling, or "running out of stock" of a sale itemhurts not only the firm's integrity, but the overall KonaCoffee industry's reputation as well.
Attractive packaging and displays often can sell aproduct by themselves. A clear wrap can highlight certaincharacteristics such as the appearance of the whole bean.Other attributes such as color or graphic design are used toconvey a certain image. Container size and type (can vs.bag) can be a factor not only because of serving/storageconsiderations, but because associated cost and ease ofpacking can affect the purchase decision of especiallyvisitors. While innovations like the valve bag might improveproduct quality, this may be lost on consumers in certainmarket segments, especially if they are uninformed.
In-store displays play a prominent role. Shelfspace and location (e.g., end of aisle, eye level) have longbeen a major determinant of success in supermarketretailing, and probably work similarly in other retail outlets.Clear bulk bins and self-service grinders seem to have beenvery successful in retailing coffee. Point-of-purchase orpoint-of-sale materials include literature, videos,merchandising kits, and shelf promotions. In-storedemonstrations and taste sampling have been successful inat least temporarily increasing sales.

Publications. A newsletter or similar periodical isa useful promotional device. It serves to maintaincommunications within the industry. Industry members canbe notified of new developments as they occur, includinggeneral information for each season such as the cropoutlook or market statistics. Either a separate newsletterfor the targeted groups, or specific sections or issues couldbe a cost-effective means of educating and informingspecific groups such as growers, brokers, roasters, orretailers. Features could include refresher material gleanedfrom other sources (e.g., hints on brewing great KonaCoffee, the recommended timing and application rates offertilizer), a column responding to client concerns, or aforum for debating industry issues.
For out-of-state readers, a newsletter is especiallyimportant in providing timely information directly from thesource, versus via hearsay or a biased source. This willeliminate much of the misperceptions and false rumors thatperiodically seem to surface. To the extent thatexpectations are important in purchasing decisions, anewsletter is also a potent tool for setting expectations andguiding perceptions. It helps to justify prices, and can beuseful for advertising.
Some connection to existing publications, such ascontributed columns or articles into trade magazines andassociation newsletters, can be invaluable. These may belower cost alternatives to paid advertisements, and areintegral parts of certain programs such as certification. Theconcept could be expanded to newspapers and generalcirculation magazines, as well as tourist-orientedpublications in the "Things to do/Places to see" genre. Thiswould include material for hotel lobby and visitorinformation booths, hotel guest information packets, andcar rental brochures.
In general, clients also appreciate writteninformation such as the "Kona Coffee Guide" produced bythe Kona Coffee Council. This is both for theirinformation, and for their clientele. Existing materialsinclude fliers and leaflets (often in conjunction with salesdisplays), table tents in restaurants, and merchandise tagsphysically attached to the product.
Kona Coffee Festival. The previous discussion ontourism related opportunities listed several events that theKona Coffee Industry might target as promotionalopportunities. While mentioned in the context of visitors,such events are also valuable for residents and out-of-stateaudiences. The Kona Coffee Festival (KCF) in particularprovides an annual focal point for the industry.
If nothing else, these events provide opportunitiesfor free media exposure because of the coverage by localand national press. Although this exposure is moreinformational in nature, it would be useful for buildingawareness in the general population and inmaintaining/renewing existing clients.
The Kona Coffee Festival is an opportunity for tieins with tour packages, similar to seeing the Mardi Gras inNew Orleans. A variation of this concept is what was done
53
with the Specialty Coffee Association of America (SCAA).Th.at is, regional or national organizations of especially thecoffee industry could be persuaded to time theirconventions to coincide with the Festival.
Two related problems cited are that most personsknow very little about coffee production areas, and thatsales staff don't know about Kona Coffee. Thus, anotherprogram that could be tied into the Festival is aneducational tour of production and processing, as is done bythe Kenya coffee industry. Allowing the customer to see theprocess fosters trust in the industry and reinforces honesty.A trip to Hawaii to participate in the Festival might be partof an incentives or awards program for shops and salespersonnel to push Kona Coffee.
Other Tourist Opportunities. Besides visitorevents, other promotional opportunities include visitorattractions and a "secondary market" for Kona Coffeerelated items. Attractions such as the visitor plantationsand botanical gardens have been mentioned. It is importantthat displays be well-designed and well-maintained toproject a positive image of Kona Coffee. Such attractionsare often conducive for product sampling or for distributingcertain types of literature.
Some firms are at least peripherally involved inwhat is called the secondary market for Kona Coffee relateditems. These are broadly defined as items depicting KonaCoffee in words or pictures. Products include traditionalvisitor souvenirs such as T-shirts, caps, sun visors, calendars,and key chains as well as items more closely associated withcoffee. Examples are coffee mugs, coffee grinding orbrewing paraphenalia, posters (perhaps printed on burlap),bumper stickers, buttons, coffee picking baskets, and eventhe coffee bags themselves.
There are several reasons for being involved in thesecondary market. Perhaps the most obvious is theimmediate revenue potential: a sale can still be made evenif the visitor or resident is not interested in the coffee itself.More importantly, the item is being used for promotionalpurposes. A coffee drinker remembers Kona Coffee eachtime he or she uses the Kona Coffee mug. An attractivepicture for the month of December reminds the shopperthat Kona Coffee makes an excellent Christmas gift.Houseguests or office visitors inquire about the distinctive,perhaps koa framed poster. In this light, it is important thatthe item reflects high quality, good reputation, and anappealing image. The concept is readily carried over toother target audiences such as coffee brokers or specialtyoutlet owners and employees.
While the potential to individual firms are obvious,an industry-wide effort will provide certain benefits. Forexample, these products would be useful reminders of acertificate program. Materials might use a standard logowith provisions for individual members to add their firmname. An industry organization should possess economiesof scale in ordering certain items that could be passed on tomembers. Provisions can be made to be a revenuegenerating source for the industry organization.

Grower/Processor Education. The inherentquality of a coffee bean is at its peak when that bean isharvested. Growers are therefore essential in producingthat quality, as are subsequent handlers in maintaining thequality level. Education of industry participants is anongoing activity, either to keep members up to date onlatest developments or to refresh past knowledge. Anewsletter has been discussed earlier. Activities that havebeen used in the past include field days, demonstrationfarms, tours of showcase operations, field representatives,and problem hotlines. With regards to other Kona Coffeehandlers, trade shows and booths are often used asopportunities to inform and promote, as well as gain sales.Activities that are highly complementary to education are astrong tie to research and the ability to keep abreast ofdevelopments in other areas.
V.D Certification ProgramA recommendation that can be implemented in the
near future is a certification program, where the buyer isassured that he or she is receiving pure Kona Coffee, e.g.via a "seal of approval" and certificate of authenticity. Thereis recent precedent for this activity, in that the Kona CoffeeCouncil had initiated a seal of approval program in 1988.However, the status and future of the program is unknownat this time.
Participation in the recommended certificationprogram could be voluntary, but the implication of being anon-participant is that there is something wrong with thenon-certified product. Promotional activities will play astrong role especially in informing and educating theindustry's clientele, and also as a powerful tool forcompliance with the terms of the certification program.Since most industry members had expressed a willingness tobe ethical, we envision that this program will encourageethical behavior as a marketing advantage.
A seal of approval has several precedents, includingJamaica Blue Mountain Coffee, Colombia coffee (wherebuyers pay for privilege of using the Juan Valdez logo),Florida orange juice which has two seals, one for 100%Florida juice and one for product that meets Florida'sspecifications, and the Good Housekeeping andUnderwriters Laboratories seals. The following discussionoutlines possible procedures; the existing programs canprovide examples of other activities.
The certification program would involve severallevels from processors to buyers to roasters and retailers.The process, as well as monitoring and enforcement, beginsat the processing level. Green Kona Coffee is alreadygraded and can be cupped. Either all bags, or once aprocessor passes a probationary period, random samples,are to be tested for lot certification. Dated certificates areissued per unit (e.g. bag or half-bag of coffee) and paid forvia assessment. To get and maintain "certified processor"status, the processor must submit records of purchase,processing, and sales (including buyer and quantity). Theprogram could require that these records be verified by aCPA, and/or be subject to an independent audit. A list of
54
certified processors is distributed to buyers and could beused in promotions, as in trade magazines.
At the retail level, a "Golden Cup Award" andmembership into the elite club of awardees could be used toboth publicize the certification program and recognizerestaurants and similar outlets for serving excellent,certified Kona Coffee. Incentives for firms to participatecan be similar to those involved in obtaining a four or fivestar rating, and also would include the associated freepublicity and perhaps assistance in reprinting menus forparticipants and awardees.
The certificate is administratively or physicallyattached to the coffee bag and passed on to the green coffeebuyer. For a roaster to obtain and maintain certified status,he or she must submit records of purchases, processing, andsales together with certificates. Certified roasters wouldthen be able to apply the seal to their final product. A feemay be involved, if only for the certification stamp andnumber of seals used. A list of certified roasters will bedistributed or available for distribution to retailers andpossibly final consumers. As an added incentive, this list ofcertified dealers can also be used in promotional material.Once educated, retailers and consumers would know thatthis seal signifies real Kona Coffee.
Assuming a technical test is available, there couldbe random testing of products at all levels, withdecertification and a widely publicized notice of deletionfrom the list as minimum penalties. The negative publicityfrom being decertified should be used as a strong deterrentagainst non-compliance. To be most effective, participantsshould be fully aware of these penalties before they sign up.Finally, legal prosecution may also be an option.
As stated above, an integral part of the certificationis an information and educational program explaining whatit is and why it is done. However, this certification programdoes not preclude other promotional programs either on anindustry wide or individual firm basis. Fees will make for aself-supporting, perhaps income generating program, andrecords will provide necessary information for futuremarketing efforts.
The certification program is more easily applied tothe pure product, and reporting must include what goes intoblends to minimize fraudulent use. It might be adapted forblends via a separate seal certifying that "this productcontains Kona Coffee as one of its ingredients in theproportion listed", together with truth in labelling.
Some entity must administer the certificationprogram. The State is one candidate (as is done forJamaica and Colombia), but is suggested only as a lastresort. A market order is also possible, but impliesmandatory rather than voluntary participation. The costsinvolved with either alternative are formidable. A privatemanagement/administrative firm is a third alternative, butthe desirable and recommended option is an industryorganization. This is most likely to involve the level ofdetail and commitment necessary for a successful program.An industry organization can also foster an air of authorityand objectivity vis-a-vis a private firm.
V.E. Inventory or Stock Control ProgramsThe inconsistent supply of Kona Coffee, resulting
from fluctuations in yields and aggravated by the high costof carrying Kona Coffee in inventory, is having a strongnegative effect on the reputation of the industry and onprices received. Much of the problem can be traced toproduction issues.
An approach with a marketing orientation seeks toease supply fluctuations between years and within a year viasome type of inventory control or stockpiling program. Theaim of this program is to stabilize the physical flow of coffeeand ease the cash flow requirements of individual firms.
Inventory/ stock control would operate around thegeneral theme of having pooled operations with or withouta centralized facility. The general idea is for processors toput their harvest into one pot, and for the crop to be doledout as needed, with price adjustments for storage costs.Since control is exerted over a larger supply, Kona Coffeecan be sold at either a minimum price (excess supplies to becarried over to the next season) or in a short season, atprices dictated by consumer demand with excess returnsbeing distributed back to the industry. The minimum priceensures price stability to processors and ultimately growers.Pooling harvests can also even out price and supplyuncertainties over the harvest season.
At one extreme, processors could sell their productto an organization with a sales force and a warehousespecially adapted for coffee storage. Processors wouldbenefit because this would free funds and facilities currentlyused for storage, free resources used for sales andcollection, guarantee a set price, and provide quickerpayment. Growers should benefit commensurately. Buyersbenefit via resources freed from searching out and carryingan inventory of Kona Coffee, and in general, from a morereliable supply. Further, the holding firm offers the industryadvantages from specialization and economies of scale notonly in storage, but possibly in transportation, bookkeeping,and many of the activities that would be associated with acertification program.
At the other extreme, the organization might onlyact as an information broker that brings buyers and sellerstogether. This arrangement offers less benefits to allparticipants, so would be less likely to succeed.
As for the certification program, some industryorganization is the preferable means of implementation.An additional organizational form to be considered is thecooperative.
The inventory/ stock control program could begovernment subsidized, e.g. in construction of a facility or inlow interest operation loans. However, it should befinancially self-sufficient for long-term success. Thus, aprogram may include the use of speculators to carryinventory costs and assume market risks.
55
V.F Industry OrganizationMost observers will agree that Kona Coffee is a
very fragmented industry. Organizational attempts in theKona Coffee industry has a long a colorful history. TheKona Coffee Association (KCA) received nearly $700thousand from the State (matched by Superior Coffee andTea) over an eight year period starting in 1970. However,the KCA expired with its charter in 1978. The Kona Coffeecouncil was organized in the early to mid-Eighties, but wassteadily weakening throughout 1988. Interest has also beenperiodically expressed in a Federal or State market order.The duration and success of such efforts are varied and, inthe words of one observer, "seem to be inversely related tothe price level of the product."
This report presents several recommendations thatcould conceivably be put into operation by individual firms.Since the industry is made up of these firms, it could furtherbe argued that such actions will benefit the industry.
However, we contend that any attempt at reachingthe Kona Coffee industry's potential is more likely tosucceed with cohesive group action on the part of theindustry members. The most effective and efficient meansof implementing the recommendations will require sometype of industry-wide organization. This organization couldbe very formalized and rigid, as in a Federal or State marketorder, or it could exist in a less structured form.
The advantages of cohesive action relate mostly tothe benefits of a large group, and to certain economies to begained from group versus individual action. There are atleast four advantages.
(1) Coordinated activities will eliminate duplicatedeffort and wasted resources. Instead of fighting each other,industry members could better focus their energies andresources. For example, advertising expenditures bycompeting firms to capture larger shares of an existingmarket might be better spent in trying to enlarge the overallmarket.
(2) Certain programs require a critical mass tohave any impact. Using our recommendations as anexample, certification by an individual firm is more likely tobe perceived as a gimmick, than if the entire industry wereto certify its product. As another example, most individualfirms do not have the resources to develop and implement agrower or consumer education program.
Related to this are what economists call "spillovereffects" and "free riders," which refer to the tendency to notpay for receiving certain benefits if someone else will do so.A dollar spent on any activity should lead to more than adollar's increase in benefits. However, anyone firm may beunwilling to foot the entire bill if its competitors stand toreap much of the benefits for free. If all firms (i.e., via theindustry organization) agree to pay a proportionate share,then the industry as a whole stands to benefit.
(3) Compared to an individual firm, an industryorganization would be best able to coordinate the variousactivities that could take place. Consider, for example, thecase when promotional efforts are not matched to

production capability. That is, what if a strong demand iscreated without sufficient supply?
The macadamia nut industry faced this situationwhen a certain frrm's marketing program was, in retrospect,too successful. Supply was short, so retail shelf space waslost. Later inability to regain the space resulted in lost sales,and wasted promotional efforts overall. The supplyproblem was further aggravated by other products taggingon the promotional coattail, with more macnuts being usedas ingredients in products such as cookies, ice cream, andcandy. An alleged result was that Hawaii became thelargest importer of macadamia nuts! At least some buyersfound the imports to be good, low cost substitutes for theHawaii product. So, when production catches up, Hawaiiproducers will have to match lower prices, or morepromotion will be required to regain market share, or thesemarket segments will be lost.
A similar situation might exist for Kona Coffee,where we could consider a number of issues. The point is,the Kona Coffee industry should be better off coordinatingits various activities, and some type of industry organizationis the best available vehicle for such coordination.
(4) In the past, different parties have presentedthemselves as representative of the industry, with the resultthat an outsider will receive conflicting reports on what isgoing on in "the industry." A cohesive industry presents a"united front" or a "single voice" to the public. A formalgroup will also provide industry leadership. This isespecially crucial for effective communication with thelegislature and State and Federal agencies.
There are several prerequisites for a successfulindustry organization. Four of these are as follows:
* Areas of mutual interest. Individuals cannotwork together without some common bond, but perhapsmore than most other groups, the organization must beconcerned with striking a balance in its focus and objectives;its goals need to be realistic to enhance its chances ofsuccess (especially given the history of past industryorganizations), yet not so limited as to have no impact onthe industry's problems. A key may be the fact that a strongindustry means its members will prosper. This report pointsout maintenance and improvement of high quality, goodreputation, and appealing image as necessary conditions fora viable, long-term Kona Coffee industry.
* Recognition of differences. The various KanaCoffee market segments provide the basis for understandingthese differences. These will also identify issues that can beaddressed on an industry-wide basis, as opposed to thosewhich may be applicable to only specific market segments.
* A willingness to compromise to reach decisions.Given individual differences, there must be some give andtake to reach industry-wide decisions.
* Commitment and unified support of decisions.A successful organization requires the commitment of itsmembership, and one measure of commitment is support ofdecisions. Anyone can support a popular decision. Thebetter test of commitment is the recognition that some
56
decisions will be unpopular, but that they need equalsupport.
Additionally, a viable industry organization needsfunding of its programs as well as its day-to-day operations.There are problems related to obtaining funding, then in thedistribution of those funds. Most recent voluntary fundingin the industry has had only limited, short-run success. Oneoption that had been investigated was a market order, inpart as a source of funds. The proposed certificationprogram offers some other opportunities for raising funds.
Past attempts at industry organizations have failedbecause of a lack of industry cohesion, yet some form oforganization would best serve to address many of the KonaCoffee industry's problems. An underlying cause ofindustry divisiveness is the different Kana Coffee marketsegments. This report has identified these segments andoutlined some of the problems and potentials of each. Wehope this understanding will facilitate the re-establishmentof some type of viable industry organization.

Hawaii· Agricultural Experiment StationHITAHR, College of Tropical Agriculture and Human ResourcesNoel P. Kefford, Dean of the College, and Chauncey T. K. Ching, Director of the Institute
INFORMATION TEXT SERIES 034-07.89(900)