Final Project Report Low-Voltage DC Protection
72
FINAL PROJECT REPORT FEN Research Campus Low-Voltage DC Protecon Seed Fund Project LV-05
-
Upload
khangminh22 -
Category
Documents
-
view
0 -
download
0
Transcript of Final Project Report Low-Voltage DC Protection

FINAL PROJECT REPORTFEN Research Campus
Low-Voltage DC Protection Seed Fund Project LV-05

1
Final Project Report
Low-Voltage DC Protection
Conducted by
Univ.-Prof. Dr. ir. Dr. h. c. Rik W. De Doncker Institute for Power Electronics and Electrical Drives (ISEA)
at RWTH Aachen University
Univ.-Prof. Dr.-Ing. Antonello Monti Automation of Complex Power Systems (ACS)
at RWTH Aachen University
In collaboration with
Rafael Goldbeck (ISEA) Jägerstraße 17/19 52066 Aachen
Tel.: +49 241 80-49955 Fax: +49 241 80-92203
Ting Wang (ACS) Mathieustraße 30 52074 Aachen
[email protected] Tel.: +49 241 80 49607 Fax: +49 241 80 49709
Wilbert Rey Tarnate (ACS) Mathieustraße 30 52074 Aachen
Tel.: +49 241 80 49618 Fax: +49 241 80 49609

2
Content Executive Summary ................................................................................................................................. 4
1 Introduction ..................................................................................................................................... 6
2 Influencing Factors on LVDC System Protection .............................................................................. 7
2.1 Faults at the Customer End ..................................................................................................... 7
2.1.1 Grounding Strategy .............................................................................................................. 7
2.1.2 Body Current Path ............................................................................................................... 8
2.1.3 Current Duration and Direction ......................................................................................... 10
2.1.4 Personal Hazard of Installed DC-Link Capacitance ............................................................. 12
2.2 Faults in LVDC Distribution Level ........................................................................................... 14
2.2.1 Pole-to-pole Faults in LVDC Distribution Level ................................................................... 15
2.2.2 Pole-to-ground Faults in LVDC Distribution Level .............................................................. 18
2.3 Topological Impact ................................................................................................................. 22
2.4 Power Quality ........................................................................................................................ 23
2.4.1 Harmonic/Interharmonic PQ Index ................................................................................ 23
2.4.2 Ripple PQ-index ............................................................................................................. 24
3 System Behavior and Protection Devices ....................................................................................... 25
3.1 LVDC System Dynamics .......................................................................................................... 25
3.2 Design Aspects of an LVDC Protection System ...................................................................... 26
3.3 Protection Devices ................................................................................................................. 27
3.3.1 Fuse ............................................................................................................................... 27
3.3.2 Circuit Breaker ............................................................................................................... 30
3.3.3 Disconnector .................................................................................................................. 33
3.3.4 Residual Current Device (RCD) ....................................................................................... 33
3.3.5 Arc-Fault Detection Device (AFDD) ................................................................................ 35
3.3.6 Insulation Monitoring Devices (IMD) in IT Systems ....................................................... 36
3.3.7 Overvoltage Protection (OVP) ........................................................................................ 37
3.3.8 Inrush Current Limiter (ICL) ........................................................................................... 40
4 Protection Strategies for DC-Grid Structures ................................................................................. 42
4.1 Voltage Selection for LVDC Distribution Network at Customer End ...................................... 42
4.2 Assessment of state-of-the-art LV DC protective components .............................................. 43
4.3 Comparison of Strategies for Fault Detection and Location in Literature .............................. 45
4.3.1 Objectives of the Strategies ........................................................................................... 45
4.3.2 System Characteristics ................................................................................................... 45
4.3.3 Overcurrent-Based Protection ....................................................................................... 46

3
4.3.4 Rate-of-Change-of-Current- (di/dt) Based Protection ................................................... 46
4.3.5 Resonance-Based Protection ......................................................................................... 47
4.3.6 Differential Protection ................................................................................................... 48
4.3.7 Use of Intelligent-End-Devices (IEDs) ............................................................................. 48
4.3.8 Impedance Estimation Approach ................................................................................... 49
4.3.9 Voltage Derivative Management ................................................................................... 50
4.3.10 Summary ........................................................................................................................ 51
5 Conclusions and Outlook ............................................................................................................... 56
Abbreviations ........................................................................................................................................ 60
Bibliography ........................................................................................................................................... 61
List of Tables .......................................................................................................................................... 67
List of Figures ......................................................................................................................................... 68

4
Executive Summary
The global trend towards renewable energies and the increasing use of end devices incorporating an internal DC-link encourage the deployment of low-voltage direct current (LVDC) networks to realize higher efficiencies and enhanced controllability in the power distribution system. However, the fault protection in LVDC grids remains a challenging task. In this report the current state of research regarding LVDC protection approaches is investigated.
To identify the main challenges related to LVDC protection, the influencing factors on fault dynamics and their impact on the human body are studied as a first step. To this end, a distinction is made be-tween grids at the customer end and at distribution level. In customer-end grids, the personal protec-tion against electrical shock in case of a fault is of utmost importance as the electrical infrastructure is in permanent reach of the users. The impact of an electrical shock on the human body depends on the touch voltage, the path and direction of the fault current through the human body as well as the expo-sure duration. It can be effectively minimized by implementing a coordinated strategy between the ap-plied grounding scheme and fast-acting protection equipment. Against this background, the effect of different grounding schemes on the touch-voltage is discussed. It is moreover shown that body currents that are passing through the heart in the upward direction are more likely to cause ventricular fibrillation than downward currents. To derive specific requirements on the fault current interruption time of LVDC protection equipment, the resulting body currents for different touch voltages and current paths are compared with each other.
At distribution level, the electrical infrastructure is typically out of reach of untrained persons. Hence, the main focus lies more on the fault propagation and the stable operation of the grid without running the risk of damaging the equipment. Simulations of the AC-DC interface at the point of common coupling between the three-phase mains grid and a DC microgrid are used to discuss the transient effects of pole-to-pole and pole-to-ground faults depending on the fault impedance and the chosen earthing points.
After having identified the key determinants for the safe operation of LVDC grids, the performance of state-of-the-art LVDC protection devices is evaluated. Based on an initial analysis of the fault types and the dynamic behavior of an LVDC system, the vulnerabilities and challenges related to DC power distri-bution are exposed. A subsequent discussion of existing and proposed protection devices provides a broad overview of operating principles as well as the associated advantages and disadvantages.
The review of the protection landscape shows that many of the concepts and devices employed in AC grids can be applied to LVDC distribution systems with minor effort. However, major challenges persist, requiring further research to provide the same level of safety as in modern AC distribution systems. Three main concerns can be identified:
• Personal Safety: The applicability of mechanical breaking concepts for the personal protection in DC grids is very limited, as they prove to be too slow for voltage levels above 200 V and exhibit reduced switching lifetimes in the context of purely DC fault currents. Alternative concepts based on solid-state or hybrid breaking devices deal with these shortcomings. While pure solid-state devices are confronted with excessive conduction losses, hybrid circuit breakers combin-ing both mechanical and solid-state approaches show promising performance levels.

5
• System Stability: The distributed inductance and capacitance of cables, filter circuits and DC links within an LVDC grid constitute a resonant tank whose frequency behavior significantly affects the system stability. In grids with a high penetration of plug loads, the dynamic behavior is highly dependent on the connected loads. To achieve the required robustness of such a changing sys-tem, concrete design rules and stability limits need to be defined and introduced into standard-ization.
• Reliability vs. Selectivity: The trip levels of individual protection devices have to be properly set to discriminate between abnormal fault currents and normal switching transients. In the event of high-impedance faults though, the amplitude of oscillations related to fault currents lies in the range of the normal noise level in the grid. To avoid nuisance tripping, sophisticated fault detection and localization concepts as well as a proper coordination of downstream and up-stream protection devices are required.
Conventional overcurrent protection devices are able to detect and interrupt high fault currents, but exhibit several shortcomings in small-scale grids when fault current levels are low. To overcome those shortcomings, a multitude of protection strategies are proposed in literature for detecting and locating faults. These strategies mainly aim at 1) providing high-speed protection against large fault currents, 2) detecting small fault currents, and 3) locating the fault in the grid. The most promising approaches for the realization of these goals are discussed in an extensive literature review in the last part of this report. Depending on the prioritization of the three goals, different strategies prove most effective. The fastest fault detection is provided for ring bus configurations based on calculations of the rate of change of the current, which are compared to a pre-defined threshold value. The highest potential in terms of detect-ing small fault currents is offered by an approach that is based on a resonant relay incorporating an internal inductor and a capacitor for fault detection. When a fault occurs, the current changes cause oscillations in the resonant tank, which can be detected even for low fault levels. To enhance the fault location in an LVDC grid, the detection methods can be complemented by intelligent end devices (IEDs) that are linked through a communication system. To test the performance of these concepts, a joint study combining the different protection approaches in a pilot LVDC grid is recommended. The study can provide a better understanding of how the individual approaches interact and evaluate their per-formance as part of a comprehensive protection system for LVDC grids. It can also reveal the effects of these strategies on power quality and vice-versa.

6
1 Introduction
The goal of this seed-fund project is to provide an overview of the current status in LVDC protection and to identify open questions for future research in this field. To this end, a subdivision into three work packages (WP) as indicated in the time schedule in Figure 1 is made. In a first step, the fundamental influencing factors on the operational safety of LVDC grids are investigated in WP1 in order to specify the requirements on the protection system. Parallel to this, a discussion of the applicability of existing protection devices to LVDC grid applications is conducted in WP2. An overview of the state of research in dedicated LVDC protection devices concludes this work package. In WP3 the findings from the first two work packages are used to identify open research questions in this domain and to specify the un-resolved requirements that have to be addressed by future LVDC protection strategies. A comparison of different concepts proposed in literature to tackle these open questions provides a comprehensive impression of the current state of LVDC protection.
Figure 1: Work packages and time schedule of the seed-fund project “LVDC Protection”
18 20 22 24 26 28 30 32 34 36 38 40 42 44
Calendar WeekLVDC Protection
WP1
WP2
WP3
Analysis of influencingfactors on LVDC system
protection
Comparison of existingLVDC protective devices
and recent developmentsDerivation of requirements
for suitable protectionstrategies
Mai ’17 June ’17 July ’17 August ’17 September ’17 October ’17
ISEA ACS

7
2 Influencing Factors on LVDC System Protection
2.1 Faults at the Customer End
The major concern of faults at the customer end is the human safety, as the LVDC distribution network is within day-to-day reach of non-technical users who could be exposed to live parts in the event of insulation failure. Hence, the installation of a fast and reliable system of personal protection is of top priority to ensure the safe operation of the grid and to minimize the hazard of electric shocks. Against this background, this section aims at investigating the impact of electric shock on the human body and identifying the influencing factors that define the requirements for a suitable personal protection sys-tem.
2.1.1 Grounding Strategy
As in the AC system, the grounding strategies in LVDC networks can be categorized into TT, IT and TN systems. The different grounding schemes are illustrated in Figure 2 for a generic unipolar grid. The grid is composed of a source converter representing the point of common coupling to the DC or AC mains grid and the remaining DC installation, which is to be protected. The different grounding strategies are distinguished by the grounding method on the sides of the source and the installation (low-/ high-im-pedance grounding, centralized/decentralized enclosure grounding). In case of an internal insulation failure, a user who touches the enclosure will receive an electric shock. This hazardous condition is called indirect contact.
(a) (b)
(c) (d)
Figure 2: Indirect touch in the LVDC customer end network of (a) TT system, (b) IT system, (c) TN-S system and (d) TN-C system
The touch voltage in case of indirect contact is depending on the resistance ratio between source and installation and from installation to ground. According to [1], the ratios of touch voltage to grid voltage for different earthing strategies in LVDC grids are listed below:
Source Installation
L+
L⎻
PETouch voltage
Source Installation
L+
L⎻
PETouch voltage𝑅𝑅H
Source Installation
L+
L⎻
PETouch voltage
Source Installation
L+
L⎻/PE
Touch voltage

8
Table 1 Ratio of touch voltage in LVDC networks with different earthing strategies
System earthing strategies Ratio of touch voltage (to grid voltage) TT system 0.1 – 0.5 IT system <0.1 at first ground fault, but may reach 0.5 in the
event of a second ground fault on the other pole. TN-S system 0.5-0.7 TN-C system 0.5
Two issues needs to be clarified regarding the voltage ratio. In case of an IT system, due to the high impedance in the ungrounded operation system, the touch voltage will take on very low values in the event of a first fault. But if this fault is not detected and isolated before a second ground fault on the other pole occurs, the high-resistance earth path through RH is bypassed and a low-impedance short-circuit loop can be formed between the two fault locations. In this case, the system behaves like a TT or TN system, depending on whether the enclosures are earthed individually or connected to a central grounding via a common PE connection. In the TN-C system, the protective earth line is integrated into the power line conductor. As the load current through this conductor will cause a voltage drop across the line, which is proportional to the line impedance, the enclosures of the earthed equipment will have a non-zero potential even under normal operating conditions. Hence, this type of grounding should be avoided for residential and commercial networks, in which the IT systems is more advantageous due to its tolerance of the first isolation fault without threatening the personal safety.
2.1.2 Body Current Path
According to Ohm’s law, the body current depends on the touch voltage Utouch and the body imped-ance Zbody (which can be simplified to a purely resistive element given a DC system):
𝐼𝐼body =𝑈𝑈touch𝑍𝑍body
≈𝑈𝑈touch𝑅𝑅body
The body resistance depends on a number of factors. Physically, it is composed of the skin and internal body impedances, which are arranged in series. The skin acts as a low-conductive layer until it breaks down and carbonizes when exposed to high current densities. The internal part of the human body has a resistance in the order of several hundred ohms due to the wet and salty condition beneath the skin. The skin resistance can be effectively bypassed by high voltages, physical damage and water. In the following discussion, a healthy and dry skin condition is assumed. Since the exposure to an electric shock is usually limited to a short period of time before the protection devices react, the body resistance cor-responding to 100 ms of body current duration suggested by IEC 60479-1 will be adopted. For longer durations of current exposure the total body resistance may decrease.

9
Table 2: Total body resistances RT for a current path hand to hand, DC, for large surface areas of contact in dry con-ditions [2]
Touch voltage (V)
Values for the total body resistance RT (Ω) that are not exceeded for 5 % of the population 50 % of the population 95 % of the population
25 2 100 3 875 7 275 50 1 600 2 900 5 325 75 1 275 2 275 4 100
100 1 100 1 900 3 350 125 975 1 675 2 875 150 875 1 475 2 475 175 825 1 350 2 225 200 800 1 275 2 050 225 775 1 225 1 900 400 700 950 1 275 500 625 850 1 150 700 575 775 1 050
1 000 575 775 1 050
IEC standard provides the values of body resistance of 5%, 50% and 95% percentile ranks in population and under different touch voltage values in Table 2. In the following discussion, the body resistance values corresponding to the 5th percentile rank are adopted.
The skin resistance decreases with the size of the contact area, i.e. the resistance in case of an exposure of the entire palm area is significantly smaller than compared to a finger contact. To cover the worst case, a large contact area (8000 mm2) is considered in the discussion below.
The resistance values in Table 2 cover only the current path from hand to hand. In reality, the body current could take a variety of paths through the human body, which leads to two consequences: 1) the different paths may have different body resistance values and 2) the current through different paths varies in terms of the associated threat for the human body. Both effects can be mapped to specific correction factors, namely, the body resistance factor FB and the heart current factor FH, which are ex-plained below.
To evaluate the body impedance of different current paths, the body impedance factor FB is introduced. The body resistance corresponding to a current path from hand to hand is chosen as a reference value with FB = 1. For the derivation of the resistance value related to a hand-to-foot current path, IEC 60479-1 suggests a 10 % to 30 % reduction of the hand-to-hand resistance. To follow this suggestion, an aver-age body impedance factor of FB=0.8 for the hand-to-foot path is assumed. In the approximate calcula-tion, the hand-to-trunk resistance (and equivalently the contact cases of the back, chest and seat) is half of the hand-to-hand resistance, which results in FB = 0.5.
It should be noted that in IEC standard 604791-1 the skin and internal impedances are treated as a whole part and scaled with the identical factor when the total body resistance values are derived for different current paths. An exact calculation should be performed based on the separate discussion of skin and internal body impedances of different body current paths.
10
Table 3: Body resistance FB and heart-current factor FH for different current paths
Current path Body resistance factor FB Heart-current factor FH
Left hand to left or right foot 0,8 1,0 Left hand to both feet 0,65 1,0
Both hands to both feet 0,4 1,0
Hand to hand 1 0,4
Right hand to left or right foot 0,8 0,8
Right hand to both feet 0,65 0,8
Back to right hand 0,5 0,3
Back to left hand 0,5 0,7
Back to both hands 0,25 0,5
Chest to right hand 0,5 1,3
Chest to left hand 0,5 1,5
Chest to both hands 0,25 1,4
Seat to left or right hand 0,5 0,7
Seat to both hands 0,25 0,7
Left foot to right foot 0,6 0,04 The heart-current factor FH is introduced in IEC60479-1 to determine the cardiac risk of body currents through different paths. A higher value of FH indicates a higher risk of the associated current path. The current path from the left hand to both feet is chosen as a reference corresponding to FH = 1. Table 3 provides the FH values for a variety of current paths as specified in [2].
Considering both the body impedance and heart current factors, an overall expression for the equiva-lent body current can be derived as follows:
To enable a comparison of different current paths in terms of their harmfulness for the human body, the respective current amplitudes can be converted to an equivalent body current through the refer-ence hand-to-hand path using the body impedance and heart-current factors:
𝐼𝐼equivalent =𝑈𝑈touch
𝑅𝑅hand−to−hand ∗ FB∗ FH
It should be noted that Iequivalent does not correspond to a physically measurable current value, but is only used to compare the physiological impact of different fault current paths on the human body.
2.1.3 Current Duration and Direction
The impact of an electric shock on the human body is the consequence of a body current flowing through the human body for a certain time period. The severity of this impact depends on the time of exposure and the current amplitude. As per IEC 60479-1, four different time current zones can be dis-tinguished according to their physiological effects on human body:
• DC-1: Slightly pricking sensation. • DC-2: Involuntary muscular contractions.
11
• DC-3: Strong involuntary muscular contraction and reversible disturbance formation and con-duction of formation and conduction of impulses in the heart may occur, no organic damage.
• DC-4: Patho-physiological effect may occur, ventricular fibrillation may happen.
Generally, the zones DC-1 to DC-3 are relatively safe for human beings because there is no risk of organic damage, while DC-4 represents a potentially lethal time-current zone that should be avoided in any conditions of the LVDC system. Figure 3 shows the boundary line between the safe zones and the haz-ardous DC-4 zone for a body current from the left hand to both feet.
Figure 3: Time-current zones for DC body current from left hand to feet
The two different boundary lines depicted in the time-current plot in Figure 3 correspond to a body current with upward or downward current direction, respectively. The boundary definition for an up-ward body current is cited from the IEC 60479-1 [2] and IEC 60479-2 [3], while the current limitation for a downward body current is assumed to be twice the limit for an upward current, in accordance with [3].
Due to the fact that upward current is more dangerous than downward current, it is recommendable to earth the DC system on the negative pole, if the touch voltage potentially exceeds Safety Extra-Low Voltage (SELV) level [4].
Figure 4: Current path through human body (a) downward current (b) upward current
As a summary of the discussion in this section, the equivalent currents for different current paths are plotted as functions of the touch voltage in Figure 5:
0,1
1
10
100
1000
100 1000 10000 100000
Dur
atio
n of
cur
rent
flow
in m
s
Body current through left hand to feet in mASafety boundary of upward currentSafety boundary of downward current
Safe Zone
Dangerous Zone
+
⎻⎻+
(a) (b)

12
Figure 5: Equivalent body currents of different current paths
2.1.4 Personal Hazard of Installed DC-Link Capacitance
In LVDC grids with many voltage source converters (VSCs) connected to the same DC-rail, multiple DC-link capacitors are operated in a parallel configuration. In this case, the large cumulative DC-link capac-itance 𝐶𝐶cum will dominate the system behavior over a wide frequency range. When a person gets in contact with live parts linked to the DC bus, all connected DC-link capacitors will discharge into the fault, i.e., into the parallel configuration of the grounding path and the human body. The physical danger of such a capacitive discharge depends on the cumulative capacitance value, representing the size of the system under consideration. To evaluate the critical capacitance value beyond which the discharge cur-rent through the human body may cause ventricular fibrillation and death, the generic system model in Figure 6 (a) is considered. The parallel DC-link capacitors can be aggregated into the total system capac-itance 𝐶𝐶cum. At t=0, the switch is flipped from the supplying source 𝑈𝑈dc to the voltage-dependent re-sistance 𝑅𝑅b, which represents the human body and is defined based on fifth percentile values in Table 2 in compliance with IEC 60479-1. The cumulative capacitance immediately starts to discharge entirely through the body resistance, with the characteristic time curve shown in Figure 6 (b). This scenario can be used as a conservative estimation of the body current as a function of 𝑈𝑈dc and 𝐶𝐶cum, independently of the grounding strategy, which is neglected for the sake of simplicity.

13
Figure 6: Evaluation of capacitive discharge effects through the human body: (a) generic LVDC system model, (b) qualitative waveform of a capacitive discharge current through the human body over time
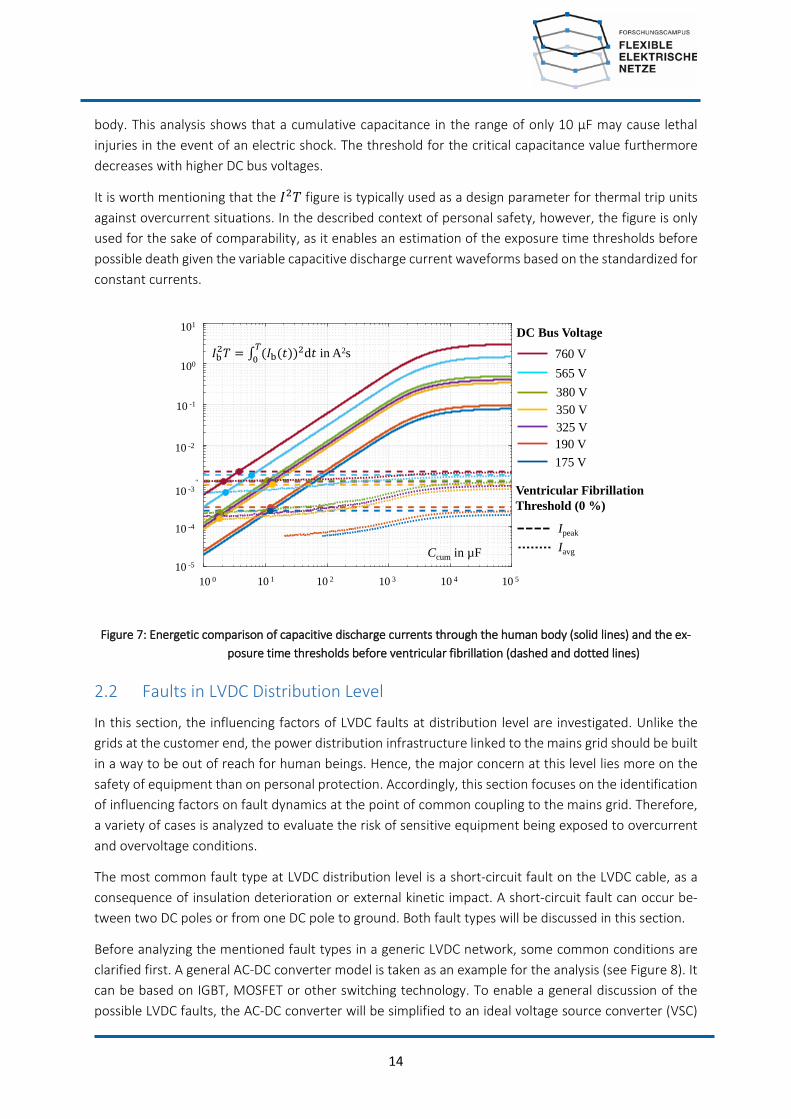
As shown in Figure 3, IEC 60479-1/-2 defines specific thresholds for the acceptable time of exposure to certain body currents beyond which ventricular fibrillation may occur. However, these thresholds as-sume constant current values over the entire time of exposure. To evaluate the exposure time threshold related to a capacitive discharge current as depicted in Figure 6 (b), the waveform would have to be approximated by a constant current value, e.g., its peak value 𝐼𝐼peak or the average current 𝐼𝐼avg. To take into account the characteristic waveform of capacitive discharge currents, the transferred energy can be considered instead. For that purpose, the time integral over the squared discharge current flowing through the human body1 is plotted as a function of the total installed DC-link capacitance 𝐶𝐶cum for different DC bus voltages 𝑈𝑈dc in Figure 7 (solid lines). For comparison, the same energy figures are plot-ted as dashed and dotted lines for an approximated constant peak current 𝐼𝐼b,peak
2 𝑇𝑇crit(𝐼𝐼peak) and an
approximated constant average current 𝐼𝐼b,avg2 𝑇𝑇crit(𝐼𝐼b,avg), respectively. The upper limits of these time
integrals are set to the time exposure threshold values related to the assumed constant current values. Thus, the dashed and dotted lines indicate the amount of energy that is transferred within the maximum tolerable time of exposure to 𝐼𝐼peak and 𝐼𝐼avg, respectively, before ventricular fibrillation may occur. Le-thal effects can hence be expected from capacitive discharges that fall into the zone above the dashed lines. This is a conservative estimation as a constant body current corresponding to the peak of the discharge current waveform is assumed. The dotted lines mark a more optimistic boundary based on the assumption of a constant current corresponding to the average of the discharge waveform. The intersection points with the solid lines relate the energy transferred by the approximated constant cur-rents within the limits of the exposure time threshold values from the standard to the energy passed through the human body by the actual discharge current waveform (see Figure 6 (b)). They subdivide the curves into three zones: to the left of the intersection points with the dotted lines, the discharge currents can be considered low enough to be safe. Cumulative capacitance values in the range between the two intersection points with the dashed and dotted lines are potentially lethal. For capacitance val-ues above the intersection points with the dashed lines, lethal discharge currents are to be expected, so an adequate protection strategy would have to prevent an uninhibited discharge into the human
1 The time integral is limited to a discharge period of 10 s, which corresponds to the maximum time of exposure specified by the standard IEC 60479-1.
ib
t
Ipeak
Iavg
(a) (b)
14
body. This analysis shows that a cumulative capacitance in the range of only 10 µF may cause lethal injuries in the event of an electric shock. The threshold for the critical capacitance value furthermore decreases with higher DC bus voltages.
It is worth mentioning that the 𝐼𝐼2𝑇𝑇 figure is typically used as a design parameter for thermal trip units against overcurrent situations. In the described context of personal safety, however, the figure is only used for the sake of comparability, as it enables an estimation of the exposure time thresholds before possible death given the variable capacitive discharge current waveforms based on the standardized for constant currents.
Figure 7: Energetic comparison of capacitive discharge currents through the human body (solid lines) and the ex-posure time thresholds before ventricular fibrillation (dashed and dotted lines)
2.2 Faults in LVDC Distribution Level
In this section, the influencing factors of LVDC faults at distribution level are investigated. Unlike the grids at the customer end, the power distribution infrastructure linked to the mains grid should be built in a way to be out of reach for human beings. Hence, the major concern at this level lies more on the safety of equipment than on personal protection. Accordingly, this section focuses on the identification of influencing factors on fault dynamics at the point of common coupling to the mains grid. Therefore, a variety of cases is analyzed to evaluate the risk of sensitive equipment being exposed to overcurrent and overvoltage conditions.
The most common fault type at LVDC distribution level is a short-circuit fault on the LVDC cable, as a consequence of insulation deterioration or external kinetic impact. A short-circuit fault can occur be-tween two DC poles or from one DC pole to ground. Both fault types will be discussed in this section.
Before analyzing the mentioned fault types in a generic LVDC network, some common conditions are clarified first. A general AC-DC converter model is taken as an example for the analysis (see Figure 8). It can be based on IGBT, MOSFET or other switching technology. To enable a general discussion of the possible LVDC faults, the AC-DC converter will be simplified to an ideal voltage source converter (VSC)
10 0 10 1 10 2 10 3 10 4 10 510 -5
10 -4
10 -3
10 -2
10 -1
10 0
10 1
Ccum in µF
101
100
10 -1
10 -2
10 -3
10 -4
10 -5
10 0 10 1 10 2 10 3 10 4 10 5
175 V
760 V
380 V565 V
350 V325 V190 V
DC Bus Voltage
Ventricular FibrillationThreshold (0 %)
Ipeak
Iavg
in A2s

15
with capacitors on the DC link. For the following analysis, a power flow during normal operation from the AC mains grid into the DC grid via the 3-level AC-DC converter is assumed.
Figure 8: Circuit model of ideal front end converter with short circuit faults on the distribution line
2.2.1 Pole-to-pole Faults in LVDC Distribution Level
A pole-to-pole fault immediately causes a short-circuit path between the DC poles, which leads to a voltage drop at the DC and AC sides of the converter.
Figure 9: Simplified circuit diagram of ideal front end converter
At the AC side of the system, the front end converter can be simplified to the circuit shown in Figure 9
in which 𝑉𝑉��⃗ ac represents the AC source voltage and 𝑉𝑉��⃗ conv is the voltage on the AC terminal of converter. The impedance between the two equivalent voltage sources contains the impedances of the trans-former and other transmission elements that are mainly inductive.
Case 1: High-impedance pole-to-pole faults
In this case, the fault resistance is so high that the DC-link voltage can be maintained at rated level with only a slight drop for a short period. The converter continues to operate within the linear PWM opera-tion range. As a result, there is no excessive overcurrent or voltage drop on the AC or DC sides of the converter. Such types of faults are equivalent to a sudden load change and do not have a significant impact on either loads or the grid.
Figure 10 shows the simulation results of a high-impedance pole-to-pole fault in the exemplary system from Figure 8. The system is started at t=0 s and exposed to a high-impedance fault at t=0.1 s, which causes the DC current to double (see Figure 10a) but does not lead to a permanent voltage drop (see Figure 10b). On the AC side, the fault leads to a sudden increase of input AC current (see Figure 10c), which is equivalent to the behavior in the event of a load step.

16
(a)
(b)
(c)
Figure 10: Simulation results of high impedance pole-to-pole fault (a) DC current, (b) DC voltage and (c) AC voltage (p.u.) & current (p.u.)

17
Case 2: Low-impedance pole-to-pole faults
In this case, the fault resistance is so low that the rated voltage at the DC link cannot be sustained anymore. The converter loses active control of the power flow and acts as a 6-pulse rectifier, the grid-side feeding current flows mainly through the diodes of this rectifier bridge. In this condition, overcur-rent occurs at both the AC and DC sides of the converter. Moreover, the DC-link capacitor discharges into the fault, releasing a huge amount of power which may destroy sensitive equipment in the DC system. On the AC side of the converter, overcurrent through the transformer windings may drive the ferro-magnetic material into saturation and damage the transformer within a short period of time.
Figure 11 shows the simulation of such a fault condition. The fault occurs as t=0.1 s, causing the DC-link voltage to drop immediately and not to recover (see Figure 11b). Overcurrent transients occur on the AC (see Figure 11c) and DC sides (see Figure 11a) of the converter. The initial surge in the DC current is caused by a sudden discharge of the DC link capacitor.
(a)
(b)

18
(c)
Figure 11: Simulation results of low-impedance pole-to-pole fault (a) DC current, (b) DC voltage and (c) AC voltage (p.u.) & current (p.u.)
Case 3: Overmodulation condition
In the first case of a high-impedance fault, the drop in the DC-link voltage is low enough to sustain full controllability through PWM. In the second case discussed above, the fault impedance is low enough to cause instability of the DC-link voltage, as the active switches are bypassed by the antiparallel diodes. If the fault impedance lies in a range that causes the DC-link voltage to drop to a value between the two aforementioned cases, the converter only partially loses PWM control, resulting in a steady-state volt-age dip that still lies within the stable operating range. Hence, the converter works in an overmodulation mode. This means that the converter is partially PWM controlled and partially in an uncontrolled bridge rectifier mode. Non-PWM-controlled intervals appear in the waveform of the current through the sem-iconductor switches when the voltage on the AC side of the converter exceeds the DC-link voltage and leaves the linear modulation range. During these intervals, the AC-DC converter is working in rectifier mode. When the voltage on the AC side of the converter falls back into the linear modulation range as it decreases below the DC-link voltage again, the PWM operation is resumed. The transients in the sys-tem induced by such mid-level faults can be seen as an intermediate case between the aforementioned two cases.
2.2.2 Pole-to-ground Faults in LVDC Distribution Level
Unlike the pole-to-pole faults, the impact of pole-to-ground short circuit faults is highly dependent on the grounding strategy of the system, which includes the grounding connection at both AC and DC sides of the converter. The AC system could be earthed at the system neutral point, which is most commonly the neutral point of the transformer. In the DC system, the system could be earthed at the mid-point of the DC link or one of the DC poles. Yet it should be noted that the system should not be earthed on both AC and DC sides, as this would cause common mode currents that traverse the converter. In the follow-ing discussion, the different possibilities of system grounding will be analyzed. The system parameters below are the same as in the simulations of pole-to-pole faults. The pole-to-ground fault occurs at t=0.1 s.

19
Case 1: AC neutral point earthed, DC system unearthed.
Figure 12: Pole to ground fault when the system is earthed at AC neutral point
In this case, the fault current loop includes both the AC and DC sides of the converter, as indicated by the red dotted path in Figure 12. During the fault, the AC power source continuously feeds power into the fault through the highlighted fault current loop, causing overcurrent conditions on the AC (Figure 13c) and DC (Figure 13a) sides. The DC-link voltage can still be maintained, yet a potential drift of the two poles relative to ground can be observed: while the potential of the faulty pole decreases, the mag-nitude of the potential of the healthy pole is increased (see Figure 13b). Thus, the line-to-ground voltage of the healthy pole can reach values in the range of twice its rated value, which may be a threat to system insulation. This fault case is typical in an IT DC system, in which the DC link is unearthed while the secondary neutral point of upstream AC transformer is earthed.
(a)

20
(b)
(c)
Figure 13: Simulation results of pole-to-ground fault when the system is earthed at the AC neutral point: (a) DC currents, (b) DC voltages and (c) AC voltage (p.u.) & current (p.u.)
Case 2: AC neutral point unearthed, DC system earthed at the DC mid-point
Since the AC system is unearthed in this case, the ground current is limited within the DC system. More specifically, the fault current path extends only to the red dotted line indicated in Figure 14 between the DC capacitor of the faulty pole and the ground-fault location. During the fault, the capacitor of the faulty pole is discharged while the DC-link capacitor of the healthy pole is charged. This leads to the same overvoltage issues as in the previous case. The simulation results of this fault condition are shown in Figure 15. The overcurrent related to the fault is limited to the loop across the faulty pole (see Figure 15a). The DC-link voltage can be maintained, yet a voltage drift relative to ground can be observed: while the electrical potential of the faulty pole drops as it is shorted to ground, the potential of the healthy pole rises to almost twice its rated value (see Figure 15b).

21
Figure 14: Pole to ground fault when the system is earthed at DC mid-point
The simulation results also show that the DC output current after the fault contains zero-sequence com-ponents (see Figure 15c). This is caused by the loss of available voltage levels used for the modulation: as the potential of the faulty pole decreases to zero right after the fault (see Figure 15b), the voltage levels related to the faulty pole cannot be used by the PWM controller anymore. The modulated AC line voltage is hence changed from a 3-level to a 2-level waveform, which generates the observed zero-sequence components in the fault current.
(a)
(b)

22
(c)
Figure 15: Simulation of pole-to-ground fault when the system is earthed at the DC mid-point: (a) DC currents, (b) DC voltages and (c) AC voltage (p.u.) & current (p.u.)
When the system is earthed at one of the DC poles, the ground fault on the other pole immediately generates a short-circuit connection between the two poles. This kind of fault is equivalent to a pole-to-pole fault, so the analysis in section 2.2.1 applies.
A summary of the fault impact on the LVDC distribution grid is provided in Table 4.
Table 4: Impact of pole-to-pole and pole-to-ground short circuit faults on the LVDC distribution system
Fault Type Grounding Strategy Impact
Overcurrent Overvoltage
Pole-to-Pole Fault All On both AC and DC
sides No
Pole-to-Ground Fault
Earthed on AC neutral point, DC is unearthed
On all three phases in AC system and the faulty DC line
On the healthy pole
AC is unearthed, DC mid-point is earthed
Only on the faulty DC line
On the healthy pole
AC is unearthed, one of the DC poles is earthed
On both AC and DC sides
No
2.3 Topological Impact
The influencing factors in LVDC system protection also include the grid and converter topologies. These topologies mainly affect the following factors in the design of LVDC protection systems [5] [6]:
• sources and direction of fault currents, • fault characteristics (rate-of-change of currents and voltage, steady-state values), • blocking capability of DC faults using converter topologies, • location of devices being protected.

23
The variety of possible grid topologies for LVDC grids brings about a multitude of proposed protection approaches. These protection approaches must provide a proper fault detection and location regardless of the impact of different topologies. Chapter 4 of this report discusses and compares these approaches.
2.4 Power Quality
Another influencing factor on LVDC Protection is power quality. Power quality affects the design of a protection system, as well as the applied device settings [87]. This is because protection systems should not falsely respond to disturbances that do not originate from faults (e.g., transients due to load changes). LVDC grids need standardized indicators for power quality, as well as allowable values for different applications. These standards will help in the design of protection systems and equipment (relays, sensing equipment).
In [88], the authors attempt to define different indicators for power quality in LVDC grids:
1. voltage fluctuations, 2. voltage variations, 3. voltage dips, 4. short interruptions and long interruptions, 5. harmonics and interharmonics, 6. ripple, 7. voltage surges/transients, 8. flicker in LEDs.
All these indicators, except two, were defined similarly to their AC counterparts. The two exceptions are the definitions for harmonics/interharmonics and ripple.
2.4.1 Harmonic/Interharmonic PQ Index
The indication of harmonics/interharmonics reflects the distortion in the DC voltage of a grid due to sinusoidal signal contents. Harmonics/interharmonics are defined in AC grids relative to the fundamen-tal frequency. However, there is no fundamental frequency in LVDC grids, and the indices need to be defined in another way. Therefore, to quantify the distortions of the DC signal due to sinusoidal content, the following indicator is proposed in [88]:
𝐷𝐷𝐿𝐿𝐿𝐿𝐿𝐿𝐷𝐷 = [��𝑄𝑄[𝑘𝑘]𝑄𝑄[0]�
2𝑘𝑘𝑚𝑚𝑚𝑚𝑚𝑚
𝑘𝑘>0
]
1/2
where
• 𝐷𝐷𝐿𝐿𝐿𝐿𝐿𝐿𝐿𝐿 is the index for harmonic/interharmonic PQ • 𝐿𝐿𝐿𝐿𝐿𝐿𝐷𝐷 stands for “Low Frequency Sinusoidal Disturbance” • 𝑄𝑄[0] is the steady state dc value; • 𝑄𝑄[𝑘𝑘] is the frequency spectrum (in RMS) of the sampled DC signal; • 𝑘𝑘 is the frequency index between 0 and 𝑘𝑘𝑚𝑚𝑚𝑚𝑚𝑚 = 𝐿𝐿𝑚𝑚𝑚𝑚𝑚𝑚 𝑑𝑑𝑑𝑑⁄ ; • 𝑑𝑑𝑑𝑑 is the frequency resolution for the adopted time window length and time-to-frequency
transform (namely, DFT) • 𝐿𝐿𝑚𝑚𝑚𝑚𝑚𝑚 is the largest frequency in the frequency spectrum considered
24
2.4.2 Ripple PQ-index
Ripple quantifies the periodic variation of the DC voltage over time due to semiconductor switching. In [88], the following definition of the ripple index for LVDC grids is proposed:
𝑞𝑞𝑝𝑝𝑝𝑝,𝑇𝑇 = 𝑚𝑚𝑚𝑚𝑚𝑚{𝑞𝑞[𝑛𝑛] − 𝑞𝑞[𝑛𝑛 + 𝑘𝑘 + 𝑘𝑘𝑇𝑇]},
where 𝑞𝑞𝑝𝑝𝑝𝑝,𝑇𝑇 is the peak-to-peak value of the sampled DC signal (𝑞𝑞[𝑛𝑛]) with 𝑘𝑘𝑇𝑇 samples over ripple time window 𝑇𝑇, and 𝑛𝑛 and 𝑘𝑘 are positive integers, which ensure that the two terms inside the brackets cannot be “closer” than 𝑘𝑘𝑇𝑇 samples.

25
3 System Behavior and Protection Devices
3.1 LVDC System Dynamics
The full potential of DC distribution unfolds in systems that involve multiple sources and a large portion of DC-native or DC-interfaced loads. A generic example of such an LVDC system is depicted in Figure 16, which consists of a point of common coupling to the three-phase mains supply grid, a photovoltaic (PV) source, a motor load and an LED lighting load. The individual components are interconnected by a com-mon bipolar DC bus operating at ±380 V DC and a secondary distribution level based on a unipolar feeder at -48 V. The depicted grid shall serve as an illustrative example for a preliminary discussion of the par-ticularities of DC distribution systems with respect to protection concepts, before the state-of-the-art in LVDC protection equipment is presented in Section 3.3.
Figure 16: Fault types at the example of a generic ±380 V DC grid
The particularities of DC power distribution present some major challenges for the protection system that may not be sufficiently addressed by modern AC protection equipment:
• No natural zero crossings: The absence of natural zero crossings significantly compli-cates the complete interruption of the load current in the event of a fault. In AC sys-tems, the protection devices benefit from the periodic zero crossings occurring within a maximum of half the mains period (i.e. 10 ms at 50 Hz), which intrinsically support the extinction of the arcs drawn across the opening contacts of a common mechanical circuit breaker. In contrast, the continuous power flow through a standing arc requires more effort for extinction and involves faster contact deterioration.
• High inrush currents: In LVDC systems with many VSCs, the large number of parallel DC-link capacitors causes high inrush currents during the initial system startup phase and upon the connection of large loads with a VSC-interface. These inrush currents may drive the system into an instable or dangerous operating point and lead to a cascading system failure.
P6
P7
P8
P1
P2
P3
P4
P5
P11
P12
P9
P10A
B
CC
E
F
D D
G

26
• Capacitive discharge effects: In a VSC-based LVDC system, the DC-link capacitors are directly connected to the DC bus. In the event of a short circuit or a ground fault on the DC bus, these capacitors immediately discharge into the fault, even when the feeding power electronic interfaces are switched off. Hence, a suitable protection concept has to provide a way to interrupt or divert this discharge energy. The personal hazard of the energy stored in the cumulated system capacitance is investigated in Section 2.3.
• System stability: The DC-link capacitors of the VSCs, any filter capacitors and the induct-ances of the power lines form a resonant tank. Normal switching actions of the power electronic devices, the connection of large electrical loads and fault events may excite this system and cause undesired oscillations. The stability limits of such a system de-pend very much on the grid structure, the connected components, the length of the power lines, etc. However, the severity of this issue remains to be investigated.
• System time constant vs. plug loads: In LVDC grids that are characterized by a large num-ber of plug loads, the system time constant and the frequency behavior of the system are strongly dependent on the connected loads. This is due to the direct connection of DC-link capacitors/inductors as part of the plug loads’ power supplies to the DC bus. However, the system time constant is an important parameter for the design and coor-dination of a protection system. Moreover, the frequency behavior determines the sta-bility limits of the system.
3.2 Design Aspects of an LVDC Protection System
For the design of a safe and reliable protection system, the variety of possible fault types has to be known in advance and properly addressed. Figure 16 distinguishes seven characteristic faults A-G, which differ in terms of their type (short circuit, ground fault, arc fault) and location (main DC bus, feeder line, isolated subsystem). Depending on the characteristics of the fault, different fault clearing strategies and hence different protection devices are required. Table 5 summarizes these aspects and assigns specific protection devices to the different faults based on the expertise from AC protection systems. The table and the figure may serve as an overview of the basic elements of a common protection concept.
The requirements for the different devices depend on their protection goals, which can be distinguished into the equipment and personal protection. Equipment protection serves to ensure a reliable operation of all components within the system with low maintenance effort. It includes the protection of sensitive electrical components against overcurrents and overvoltages from overload situations, short circuits and switching transients and also contains measures to prevent electrical fires. Personal protection measures are designed to minimize the impact of an electric shock on the human body by limiting the time of exposure to dangerous touch voltages and body currents. As the human body represents a high-impedance current path, the corresponding protection devices have to be able to detect small-scale leakage currents and interrupt the full load current feeding into the fault. They are typically subject to stricter standards in terms of the fault clearing time when compared to the requirements of equipment protection. The primary goal is the prevention of lethal injuries in the event of indirect or direct contact of human beings with live parts.

27
Table 5: Characteristic faults and commonly employed protection devices
Identifier Fault Location Fault Type Protection Devices
A DC bus
Short circuit (line-to-line) • Fuse • Circuit breaker
B Ground fault • Fuse • RCD (incl. circuit breaker)
C Feeder
Short circuit (line-to-line) • Fuse • Circuit breaker
D Ground fault • Fuse • RCD (incl. circuit breaker)
E IT-(sub-)system Ground fault • Fuse • IMD (+IFLS)
F
Anywhere
Series arc fault • AFDD • Circuit breaker
G Parallel arc fault • AFDD • RCD • Circuit breaker
The proper placement of protective devices within the addressed grid is crucial to ensure the safety of equipment and people. Figure 16 indicates reasonable locations for protection devices in the generic grid example by rectangular symbols on the lines marked with a ‘P’. As shown in Section 2.1.4, a parallel interconnection of multiple DC-link capacitors via the DC bus exceeding an aggregated capacitance value in the range of 10 µF involves a risk of ventricular fibrillation and death in the event of human contact with live parts. Therefore, protection devices have to be placed between the DC-link capacitors and the DC bus to enable the interruption of discharge currents in the event of a fault (P1-P8). At the 48 V distribution level, this kind of protection is not required, as it is operated within the SELV range. Beyond the provision of personal safety, the electrical equipment requires protection as well. As an example, P11/P12 indicate alternative locations for equipment protection devices such as fuses and overcurrent/overvoltage limiters. The locations P9/P10 address the special case of isolated subsystems, such as PV plant connections to the converter. In unsafe operating conditions, protection devices at these locations enable the disconnection of the source to avoid any damage to the converter and po-tential fires. The operating principles and state-of-the-art of protection devices will be addressed in the following.
3.3 Protection Devices
3.3.1 Fuse
Fuses are simple passive devices that are installed in series to an electrical circuit to provide overcurrent protection for the downstream equipment. They are generally composed of a thin metal strip (or fuse link) between the two terminals, which is embedded in a non-combustible heat-absorbing filler material (see Figure 17). When an overcurrent occurs, the fuse link heats up and ultimately melts. The resulting arc between the terminal contacts is then cooled by the heat-absorbing filler material until it is

28
quenched and the faulty circuit is successfully opened. While the arc is still burning, the fuse has a cur-rent-limiting effect on the total fault current level, which already provides a first degree of protection against high short-circuit currents.
Figure 17: Schematic design [7] and let-through characteristic of a melting fuse [8]
The fuse link is able to withstand a certain amount of thermal energy (while it is constantly “cooled” by the surrounding heat-absorbing material) before it melts. This behaviour is reflected by the character-istic time-current curves exemplified in Figure 18 (a).
(a) (b)
Figure 18: Exemplary fuse curves: (a) time-current characteristics [9] and (b) I2t characteristics for different fuse currents (Bussmann/Eaton S505SCH time-delay fuse) [10]

29
Depending on the application, different fuse characteristics are required. The key parameters for fuse selection are:
• Continuous current rating • I2t rating • Breaking capacity • Voltage rating
The continuous current rating specifies the current carrying capacity of a fuse under normal steady-state conditions and an ambient temperature of 25°C. It is highly temperature-dependent with a de-creasing breaking point at higher operating temperatures. Therefore, a rule of thumb recommends the use of fuses with a 25 % margin on the current carrying capability, i.e., where the operating current of the circuit corresponds to 75 % of the fuse current rating.
The I2t rating, also known as the melting integral, specifies the thermal energy required to melt the fuse link. It is defined by the time integral of the squared fuse current and includes the total clearing time of the fuse. In contrast to the steady-state current rating, the I2t figure takes into account transient effects and can therefore be applied to any kind of current waveform. The value given in the datasheet usually assumes a rectangular current pulse corresponding to the rated breaking capacity at rated voltage. It can also be specified for different current magnitudes as in Figure 18 (b). The I2t rating is a key figure for the coordination of upstream and downstream protection devices. In this context, a differentiation be-tween fast acting fuses with a low I2t rating and time lagging fuses with high I2t values can be made. To ensure selective tripping of branches that are closest to the fault, downstream fuses should provide fast protection, while their upstream counterparts usually exhibit a certain time lag.
The breaking capacity (or interrupting/short circuit rating) indicates the maximum current that the fuse can safely break at rated voltage without losing physical integrity. Thus, the breaking capacity of the fuse applied to a circuit must be greater than the maximum fault current that may occur.
The voltage rating must be greater than or equal to the maximum open-circuit voltage [10]. This is es-sential for the fuse to be able to quench the tripping arc after the fuse link has melted and avoid re-striking arc discharges across the fuse terminals.
For the proper functioning of a fuse, the system time constant needs to be small enough to ensure a fast current rise time di/dt. Large system time constants (> 6 ms) bear the risk of a pre-heating of the filler material, such that it is no longer able to absorb enough thermal energy from the burning arc to quench it entirely. In an LVDC distribution system, this imposes a constraint on the cable length and the installed DC-link capacitors. As the system time constant is highly variable in the presence of plug loads (see section 3.1), future guidelines on the installation of such a system have to provide appropriate limits. Another deficiency of fuses are light overcurrents that may appear from high-impedance arc faults, for instance. Since false tripping due to switching actions and other phenomena under normal operating conditions is to be avoided, the detection of such faults represents a major issue in distribu-tion systems that cannot be handled by the passive fuse structure. Besides these limitations to fuse applicability, the general operating principle of fuses is not limited to AC applications and commercial DC fuses are readily available.

30
3.3.2 Circuit Breaker
Circuit breakers are designed to make and break fault currents, in order to prevent damage or injury in the event of a fault. In contrast to most fuses, they are resettable devices allowing numerous interrup-tion actions and usually exhibit faster reaction times depending on the triggering mechanism. They are used to protect circuits from overload and short-circuit conditions as well as in connection with other protection devices such as in residual current devices (RCDs) to ensure the personal safety in the event of ground faults. From a technological standpoint, a differentiation has to be made between mechanical circuit breakers (MCBs), solid-state circuit breakers (SSCBs) and hybrid circuit breakers (HCBs).
MCBs constitute the most prevalent circuit breaker technology for equipment protection and personal safety in traditional AC grids. Depending on their field of application, they come with different tripping mechanisms. In the context of overload and short-circuit protection, mechanical circuit breakers are usually equipped with both thermal and electromagnetic trip units (see Figure 19). The thermal trip unit consists of a bimetallic strip, which is connected to the trigger mechanism. It is supposed to detect slow overload situations, as the Joule heating bends the strip until it triggers the switch. The electromagnetic trip unit is conceived to provide fast interruption of highly dynamic overcurrent transients such as short-circuit currents. In AC applications it consists of a simple coil wound around a movable plunger. A sudden rise of the current in the event of a short circuit would induce a magneto-motive force, causing the plunger to release the latch mechanism. This simple solution is unsuited for a DC load current, however, as it would drive the plunger core into saturation.
Figure 19: Internal structure of mechanical circuit breaker [11]
As part of an RCD, a different trip mechanism is used. The trip element generally incorporates a perma-nent magnet, a magnetic shunt, a spring and an excitation winding that is connected to the secondary windings of the RCD current transformers, as illustrated in Figure 20. In a fault-free condition, the mag-netic flux from the permanent magnet counteracts the mechanical spring force and holds the armature. In the event of a fault, an excitation current through the winding induces a second magnetic flux in the core that cancels out the magnetic field of the permanent magnet. This allows the spring to pull the armature away from the pole face and to release the MCB contacts connected to the spring. A major

31
advantage of the MCB consists in the conduction losses of the mechanical contacts that carry the load current during normal operation. In the event of a fault, however, an arc is drawn between the mechan-ical contacts, which may deteriorate the material and reduce the switching lifetime of the devices. The overall fault-clearing time, until all arcs are successfully extinguished, lies in the range of tens to hun-dreds of milliseconds (see Figure 23 (b)). This makes MCBs comparatively slow breaking devices.
Figure 20: Electromagnetic trip element of MCB as part of RCD [12]
To achieve higher current interruption speeds, SSCBs substitute the slow mechanical switch in MCBs with fast solid-state switches in series with the DC line and a parallel voltage-clamping component like a metal oxide varistor (MOV). When a fault is detected, the solid-state switch is turned off, so that the current commutates into the parallel MOV, which clamps the voltage to a defined level and forces the current to zero. The whole process takes less than one millisecond. Some experimental setups have demonstrated a complete current interruption in the microsecond range [13], [14], [15], [16], [17], [18], [19], [20], [21], [22], [23]. In addition to the fast clearing times, a positive effect on switching lifetime can be expected from the absence of arcing phenomena. A major drawback of SSCBs consists in the high on-state resistance, which generates high conduction losses under fault-free conditions. To ensure galvanic isolation, a mechanical disconnector (see section 3.3.3) needs to be connected in series to the SSCB.
Figure 21: Operating principle of SSCB [24]
HCBs make use of a parallel arrangement of both mechanical and solid-state switches to combine the benefits of low conduction losses and fairly high opening speeds. Under fault-free operating conditions, the load current is conducted via the closed contacts of the mechanical switch. Upon fault detection, a forced commutation of the load current to the solid-state switches is initiated by opening the moving
Semiconductor Devices
Protection Control Board
MOV
MeasurementUnit
Communication Bus
SignalsMeasured
Current Open / Close
Safety IsolationSwitch
Trip

32
contacts while turning on the solid-state switches. When the distance between the opening contacts is sufficient, the solid-state switches are turned off again, forcing the current to divert through a parallel voltage-clamping device (typically an MOV), which arrests the voltage to a defined level and dissipates the remaining energy. When zero current is reached, a disconnector (see section 3.3.3) opens under no-load condition to provide galvanic isolation. Following this concept, arc discharges are intrinsically quenched before reaching high intensities, as the arc voltage creates a reversing current component that supports the commutation process. However, the many benefits of HCBs are offset by their high complexity and cost, as they are basically composed of a parallel connection of an MCB and an SSCB.
Figure 22: Operating principle of HCB [25]
Figure 23 compares the ratings and clearing times of state-of-the-art circuit breakers divided into the discussed technological designs. It includes commercially available MCBs from a wide range of manu-facturers and experimental designs of SSCBs and HCBs from the literature. The comparison substanti-ates the aforementioned differences regarding device ratings and clearing times: while SSCBs allow for fast opening speeds in the low-power range, for instance, MCBs are already available for a broad spec-trum of power systems, though with limited possibilities in terms of clearing times.
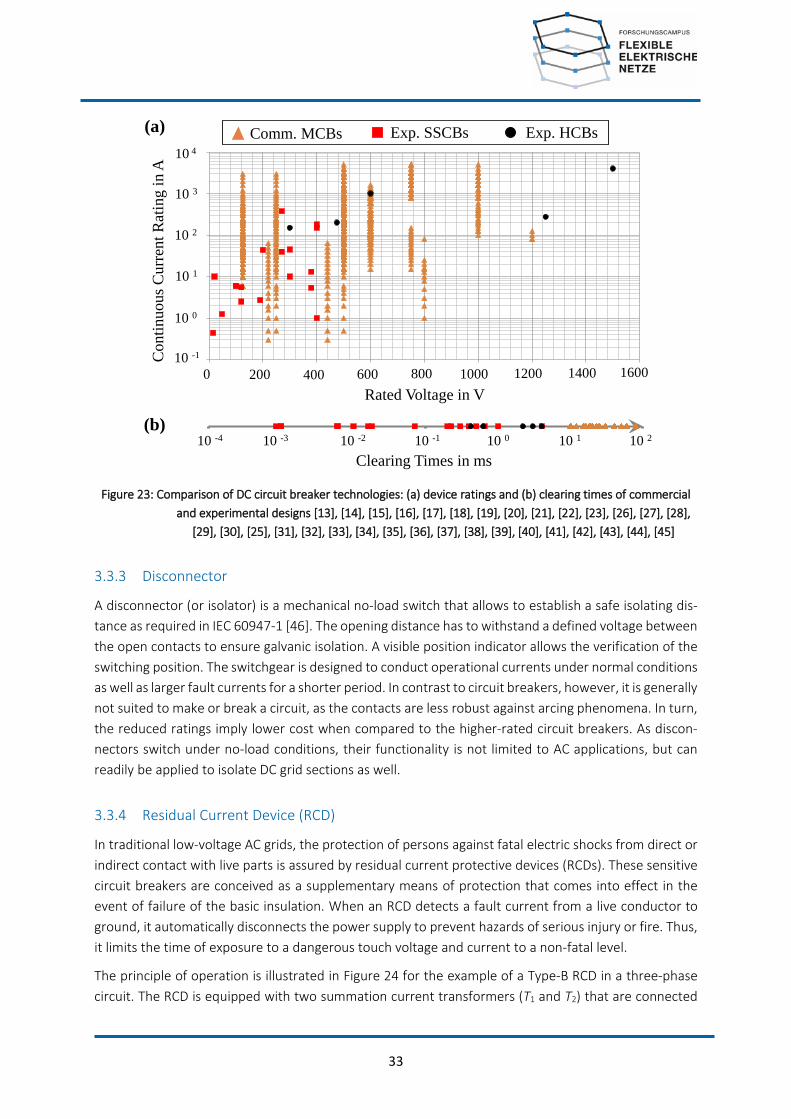
33
Figure 23: Comparison of DC circuit breaker technologies: (a) device ratings and (b) clearing times of commercial and experimental designs [13], [14], [15], [16], [17], [18], [19], [20], [21], [22], [23], [26], [27], [28],
[29], [30], [25], [31], [32], [33], [34], [35], [36], [37], [38], [39], [40], [41], [42], [43], [44], [45]
3.3.3 Disconnector
A disconnector (or isolator) is a mechanical no-load switch that allows to establish a safe isolating dis-tance as required in IEC 60947-1 [46]. The opening distance has to withstand a defined voltage between the open contacts to ensure galvanic isolation. A visible position indicator allows the verification of the switching position. The switchgear is designed to conduct operational currents under normal conditions as well as larger fault currents for a shorter period. In contrast to circuit breakers, however, it is generally not suited to make or break a circuit, as the contacts are less robust against arcing phenomena. In turn, the reduced ratings imply lower cost when compared to the higher-rated circuit breakers. As discon-nectors switch under no-load conditions, their functionality is not limited to AC applications, but can readily be applied to isolate DC grid sections as well.
3.3.4 Residual Current Device (RCD)
In traditional low-voltage AC grids, the protection of persons against fatal electric shocks from direct or indirect contact with live parts is assured by residual current protective devices (RCDs). These sensitive circuit breakers are conceived as a supplementary means of protection that comes into effect in the event of failure of the basic insulation. When an RCD detects a fault current from a live conductor to ground, it automatically disconnects the power supply to prevent hazards of serious injury or fire. Thus, it limits the time of exposure to a dangerous touch voltage and current to a non-fatal level.
The principle of operation is illustrated in Figure 24 for the example of a Type-B RCD in a three-phase circuit. The RCD is equipped with two summation current transformers (T1 and T2) that are connected
Clearing Times in ms10 -4 10 -3 10 -2 10 -1 10 0 10 1 10 2
(a)
10 -1
Exp. HCBs
200 400 600 800 1000 1200 1400 1600Rated Voltage in V
10 1
10 2
10 3
10 4
10 0
0
Con
tinuo
us C
urre
nt R
atin
g in
AComm. MCBs Exp. SSCBs
(b)

34
in series between the supply and the load to detect both AC and DC fault currents. The line and neutral conductors are wound around both cores to constitute the primary windings. The secondary windings, however, are different for the two transformers. In the upper transformer T1 the secondary side is di-rectly connected to a protective relay, which operates the tripping mechanism. In a healthy circuit, the line and neutral currents are balanced, so that the opposing magnetic fields induced in the magnetic core cancel each other out. In the event of a fault current to ground, the currents are unbalanced, in-ducing a current in the secondary winding, which will trigger the protective relay to open the circuit as soon as it reaches a certain threshold (usually 30 mA). The described setup only works for AC fault cur-rents though, as a DC offset in the effective primary current would saturate the ferromagnetic material of the core and thus impair the energy transfer to the secondary winding. This saturation effect is made use of in the transformer setup T2, where an electronic circuit is permanently applying an alternating voltage to the secondary winding to monitor the inductance of the coil. When the magnetic core is driven into saturation by a DC fault current in the primary winding, the measured inductance will de-crease. This variation is processed to trigger the protective relay.
Figure 24: Principle of operation of a Type-B RCD [47]
The application of the illustrated RCD operating principle to LVDC grids presents some particular chal-lenges regarding the definition of appropriate trip levels and the coordination of protective devices. In the presence of multiple sources of power supply, the cumulated fault current is difficult to predict, as the individual contributions of the different sources vary significantly. The variable number of DC-link capacitors in the grid (depending on the number of connected loads) further contributes to this uncer-tainty. Moreover, high levels of inrush currents may appear upon connection of large loads, when the DC-link capacitors are initially energized. An appropriate trip threshold should discriminate between current transients from such inrush effects and actual fault currents, to avoid unintended tripping. The resulting uncertainty also complicates the coordination of upstream and downstream RCDs, which is needed to ensure a proper selectivity of the protection system.
To exclude the risk of lethal injuries in the event of indirect contact with live parts, the time of exposure to a dangerous body current has to be limited to the thresholds defined in Figure 4. Since the magnitude
35
of the body current is highly dependent on the touch voltage, as outlined in chapter II, the applicable interruption time thresholds vary depending on the voltage level of the faulted circuit. Hence, higher voltage levels may involve significant efficiency benefits for the energy transfer, but they require much faster interruption times of the protective devices. The fault-clearing times of RCDs are highly depend-ent of the applied circuit breaker technology. Slow interruption speeds may be a limiting factor for the protectable system voltage (see Figure 23 and Table 6). Due to the absence of natural zero crossings, only DC-rated breakers qualify for the application in DC-RCDs.
3.3.5 Arc-Fault Detection Device (AFDD)
In the event of loose contacts, an insulation failure or cable breakage, an arc may be drawn between two exposed live parts of the circuit or from an exposed conductor to ground. The thermal energy re-leased by these arcs can produce very high temperatures and easily ignite surrounding combustible materials. Thus, the majority of electrical fires in buildings are related to arc faults, according to the United States Fire Administration (USFA) [48]. To prevent electrical fires, arc faults need to be detected and cleared at an early stage. As a rule of thumb, an arc power of approximately 70 W is sufficient to cause a fire [12]. Depending on the system voltage and the maximum transmissible power, different disconnection times become necessary.
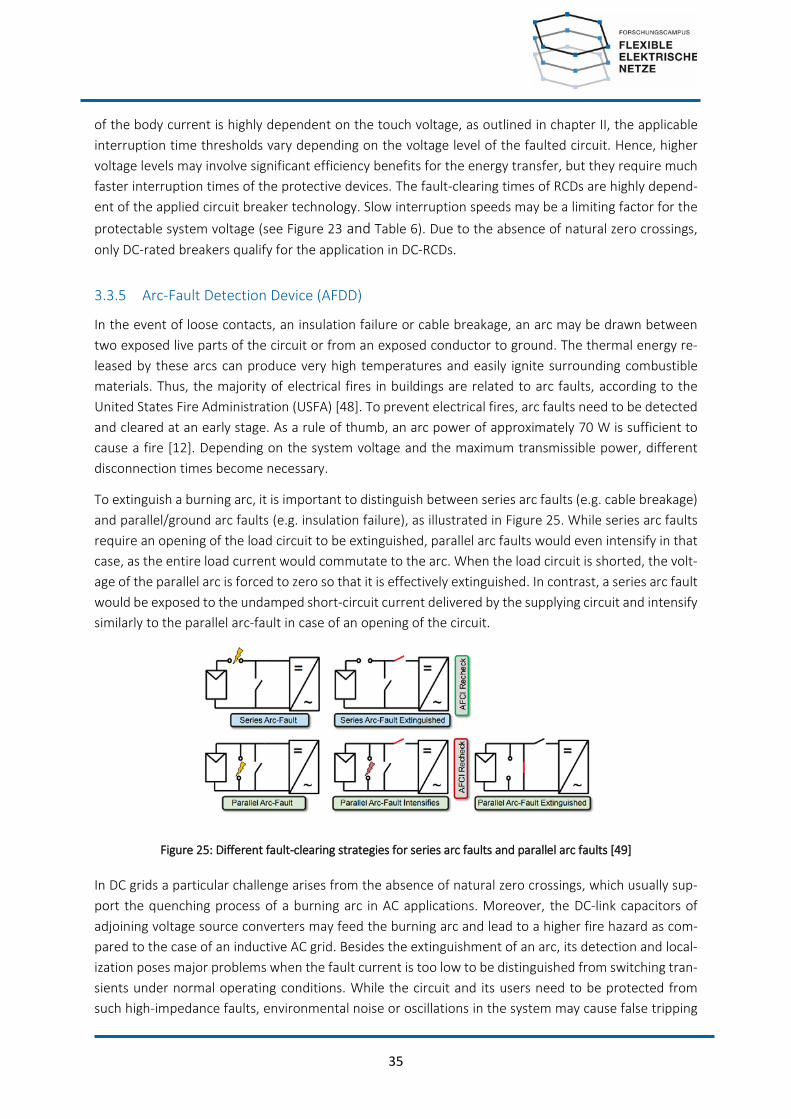
To extinguish a burning arc, it is important to distinguish between series arc faults (e.g. cable breakage) and parallel/ground arc faults (e.g. insulation failure), as illustrated in Figure 25. While series arc faults require an opening of the load circuit to be extinguished, parallel arc faults would even intensify in that case, as the entire load current would commutate to the arc. When the load circuit is shorted, the volt-age of the parallel arc is forced to zero so that it is effectively extinguished. In contrast, a series arc fault would be exposed to the undamped short-circuit current delivered by the supplying circuit and intensify similarly to the parallel arc-fault in case of an opening of the circuit.
Figure 25: Different fault-clearing strategies for series arc faults and parallel arc faults [49]
In DC grids a particular challenge arises from the absence of natural zero crossings, which usually sup-port the quenching process of a burning arc in AC applications. Moreover, the DC-link capacitors of adjoining voltage source converters may feed the burning arc and lead to a higher fire hazard as com-pared to the case of an inductive AC grid. Besides the extinguishment of an arc, its detection and local-ization poses major problems when the fault current is too low to be distinguished from switching tran-sients under normal operating conditions. While the circuit and its users need to be protected from such high-impedance faults, environmental noise or oscillations in the system may cause false tripping

36
signals when the detection algorithms are configured too sensitive. The variable system time constants and resonance frequencies in DC grids with many plug-load additionally complicates a proper tuning of the arc fault detection and the trigger level.
A multitude of publications addresses the issue of DC arc-fault detection. A good overview of recent developments in this field is provided in [50]. The general approach of the different detection strategies can be subdivided into three steps: sensor-based measurement of relevant physical quantities, the der-ivation of a characteristic fault signature and the actual detection algorithm, which compares the meas-ured quantities with the derived fault parameters to evaluate whether the circuit operates in normal or faulty condition. Figure 26 summarizes the main strategies for the three steps based on [50].
Figure 26: Summary of recent DC arc-fault detection techniques from literature based on [50]
3.3.6 Insulation Monitoring Devices (IMD) in IT Systems
IT-earthed systems allow for continuous operation throughout the event of a first fault from one pole to ground, as they limit the maximum touch voltage to safe levels, as outlined in Section 0. When the other pole is struck by a second ground fault though, the touch voltage may rise above half of the grid voltage level, representing a potential threat to personal safety. Therefore, the first fault needs to be detected, localized and cleared as fast as possible, while the grid continuous to supply power to the connected loads. For this purpose, the insulation resistance of the entire IT system has to be perma-nently monitored by insulation monitoring devices (IMD) in accordance with IEC 61557-8, DIN EN 61557-8 and DIN VDE 0100-530 [51]. If the resistance drops below the applicable limits defined in DIN VDE 0100-410, an alarm is triggered and an insulation fault location system (IFLS) attempts to localize the fault in the system.
IMDs are active measuring devices that are connected between the power lines and ground in parallel to the circuit they monitor (see Figure 27) and continuously superimpose a measuring voltage Um. An insulation fault corresponding to the fault resistance RF generates a leakage current Im that is propor-tional to RF and closes through the IMD circuitry and causes a voltage drop across the measuring re-sistance Rm. An electronic circuit compares this voltage drop to the thresholds defined by the applicable standards and trigger an alarm if those are exceeded.
The measuring technique used in IMDs is applicable to both AC and DC systems, corresponding com-mercial devices are readily available.

37
Figure 27: IT-earthed DC system with active IMD (ISOMETER®) [51]
3.3.7 Overvoltage Protection (OVP)
Transient overvoltages are a serious threat for power electronics, as they may exceed the breakdown voltage of the semiconductor material in switching devices. They may have different sources of origin internal and external to the power system. The most common causes are:
• Lightning strikes • Inductive switching transients • Electrostatic discharge
Lightning strikes may reach thousands of kilovolts with peak currents beyond 20 kA followed by a tail current in the range of 150 A that lasts around 100 ms. Against this background, the rare event of a direct hit will most likely cause permanent damage to any semiconductor device regardless of the pro-tection strategy. A much more relevant scenario, however, is the threat of lightning-induced overvolt-ages in a nearby distance of a few kilometers from the strike.
Figure 28: Lightning-induced voltage in a wire as a function of the distance from the strike

38
Inductive switching transients occur when an inductive load is switched off, e.g., in the event of a power failure, a load failure or during pulsed operation upon the normal opening of a switch. As the current i is switched off, the magnetic energy stored in the inductive load L induces an opposing transient voltage V according to (1) until it is entirely de-energized.
𝑉𝑉 = 𝐿𝐿 ⋅ d𝑖𝑖d𝑡𝑡
(1)
To evaluate the immunity of electrical and electronic equipment, IEC 61000-4-4 defines a test set-up and a standardized electrical fast transient (EFT) waveform created by inductive switching events.
Electrostatic discharge (ESD) may occur during manufacturing, shipping and operation of semiconductor devices. The voltage waveform typically lies in the range of 0.5 to 5 kV, though it can reach peak voltages of 30 kV from a metalized tip in dry conditions. Special precautions along the assembly and supply chain are taken to avoid large potentials from discharging into the sensitive components, like grounded-tip soldering irons, ionized air blowers and shipping containers made of conductive material [52]. In field operation, sensitive electronic components in integrated circuit are particularly prone to overvoltages resulting from ESDs.
Overvoltage protection is usually provided by a two-step approach composed of a primary and a sec-ondary surge protection device (see Figure 29). The primary device is located at the interface to the external power infrastructure and intercepts the bulk energy from external voltage waveforms to pre-vent them from propagating into the protected power system. The secondary elements are located close to sensitive circuits and provide additional protection against let-through stress from the primary devices and the voltage transients created within the considered power system.
Figure 29: Primary and secondary overvoltage protection for the example of a building power system [52]
The operating principle of overvoltage protection devices can be broken down to the provision of a low-resistive current path in parallel to the protected circuit that is opened upon the detection of an over-voltage condition. Three common types can be distinguished, which all apply to both AC and DC systems
[53]:
• Silicon controlled rectifier (SCR) overvoltage crowbar (see Figure 30): The crowbar circuit is com-posed of an SCR (SCR1), a Zener diode (ZD1), a resistor (R1) and a capacitor (C1) and is placed in parallel to the protected circuit between the power supply and ground. The voltage rating of

39
the Zener diode must be slightly above the supply voltage across the protected output termi-nals. In the event of an overvoltage condition at the DC input, the Zener diode voltage is ex-ceeded so that it starts to conduct in reverse direction. The resulting voltage drop across the resistor fires the SCR, which establishes a short-circuit connection across the two input poles. The resulting short-circuit current will then trigger the fuse that protects the switch cell repre-sented by TR1 in Figure 30. The capacitor buffers short overvoltage spikes to avoid unnecessary tripping. A major drawback of the crowbar circuit is related to the fixed voltage threshold of the Zener diode with a manufacturing tolerance of at least 5 %. Added to the voltage margin that is supposed to prevent false tripping, an appropriate configuration to safe protection levels may be challenging.
Figure 30: Thyristor-based crowbar overvoltage protection circuit [53]
• Voltage clamping (see Figure 30): A low-cost solution involving only a Zener diode that is con-nected in parallel to the protected circuit between the power supply and ground (see Figure 30 (a)). When an overvoltage transient occurs, the diode clamps the protected output voltage to the fixed Zener voltage, whose rating is chosen slightly above the supply voltage. To achieve a higher current rating, a transistor buffer can be added in parallel to the Zener diode with a resistor providing the necessary gate voltage for turn-on (see Figure 30 (b)).
Figure 31: Overvoltage clamping: (a) simple Zener diode, (b) higher current with transistor buffer [53]
• Voltage limiting: A simple and low-cost solution can also include the installed switch-mode or switching power supplies (particularly DC-DC converters) to limit the voltage in the downstream circuits to an acceptable level. For this purpose, an external voltage sensor (i.e. outside the main

40
IC regulator) monitors the voltage and issues a signal to the IC regulator as soon as an overvolt-age condition is detected. The regulator then shuts down the converter to prevent the over-voltage transients from propagating into the sensitive circuits.
3.3.8 Inrush Current Limiter (ICL)
When a VSC-based DC system is initially started up or large electronic loads are turned-on, high inrush currents far above the steady-state condition can occur during the energization of the uncharged DC-link capacitors. These currents present a major challenge for the system stability and the design of a reliable protection system when the installed capacitance is high. They can be limited by placing a series element into the circuit in front of the capacitors, which reduces the voltage slew rate to limit the en-ergizing currents that are imposed on the system. The most common inrush current limiter (ICL) ap-proaches include [54], [55]:
• a negative temperature coefficient (NTC) thermistor, • an inductor, • a resistor with a bypass switch, • certain voltage regulators, • integrated inrush current protection modules.
The first two solutions describe the simplest ICL designs, which contain only passive components.
Passive ICLs
An exemplary set-up with a current limiting NTC thermistor RT is shown in Figure 32. At room tempera-ture, the NTC thermistor has a high initial resistance, which absorbs part of the energizing power and thereby dampens the inrush current peak. As its operating temperature rises due to the Joule effect, the resistance decreases by a factor of 30-50 to only a few percent of its initial value. In continuous operation the temperature of the NTC thermistor is kept high enough to ensure a low-loss energy trans-fer with minimal power consumption of the ICL. A major drawback of passive ICLs is related to their long cooling time: when the load current is switched off, the NTC thermistor requires a recovery time be-tween 30 seconds and two minutes to cool down to room temperature again and restore its high initial resistance value. Unless the discharge time of the protected capacitor is sufficiently long compared to the cooling time of the NTC thermistor, a subsequent short-term turn-on has to be avoided to ensure proper operation of the passive ICL.

41
Figure 32: Mounting positions for NTC thermistors as passive ICL devices in a protective circuit [56]
The other passive option substitutes the NTC thermistors in Figure 32 by large inductors to limit the slew rate of the current. The inductors act as low-pass filters, which allow for lossless transmission of ideal DC currents and attenuate the steep inrush current surges upon connection of capacitive loads. However, the insertion of additional inductors may introduce resonance effects with the system capac-itances and compromise the stability of the overall system.
Active ICLs
Soft-start capable solutions allowing for the immediate reconnection of capacitive loads employ active current limiting devices. To mimic the behaviour of NTC thermistors, a simple resistor can be applied in combination with a bypass switch, which can be a relay or a semiconductor switch. When a capacitive load is connected to the system, the resistor dampens the current spike. During continuous operation, the bypass switch is turned on to enable a low-loss energy transfer from the source to the load.
Voltage regulators like DC-DC converters and linear regulators often inherently imply soft-start capabil-ity, which is based on controlling the gate voltage slew rate. In this manner, the transmitted power is actively regulated in a way to limit the inrush current of any downstream load.
Beyond the addressed variety of discrete current limiting circuits, commercial suppliers offer diverse load switches with integrated current limiting functionality as off-the-shelf solutions.
Depending on the application, different ICL concepts may prove beneficial. Due to the capacitive nature of the problem, existing solutions specifically address DC (sub-)systems. An application to LVDC grids is hence possible without further adaptations.

42
4 Protection Strategies for DC-Grid Structures
4.1 Voltage Selection for LVDC Distribution Network at Customer End
The IEC defines a set of low-voltage ranges, which are subject to different protection requirements. In the context of DC grids, IEC 60038 delimits the low-voltage range to any voltage below 1500 V. Within this range, IEC 61140 defines another threshold at 120 V as the upper limit of the extra-low voltage (ELV) range, below which no lethal dangers from electric shocks are to be expected. A last refinement distinguishes the SELV range below 60 V, which is considered inherently touch-safe under normal con-ditions as well as in the event of a single fault to earth.
Beyond these characteristic threshold values, the existing standards do not provide any general refer-ence in terms of voltage levels for use in LVDC customer-end distribution systems. However, the open discussion seems to converge towards a few favored ones, with the most prominent being 24 V, 48 V, 230 V, 325 V, 380 V, 750 V and 1200 V to 1500 V. For the investigation of protection requirements in customer-end networks, the voltage level of 380 V is the most relevant among the listed figures, since 24 V and 48 V can be considered inherently touch-safe and voltage levels beyond 750 V would rather address industrial distribution systems. A central benefit of 380 V DC is related to the fact that standard AC/DC power supplies of many devices already incorporate an internal DC-link capacitance operating at this voltage level. This facilitates a transition from existing AC infrastructure to DC grids. To profit from a high voltage level for the supply of large electrical loads and a low voltage level for the (usually more numerous) small loads with lower protection requirements, a bipolar variant with a grid voltage of ±190 V is another promising option for future LVDC power infrastructure in buildings.
To evaluate the worst-case tripping time requirements for the different grid voltages, a relationship between the associated touch voltages and the exposure time thresholds of the safe zone in Figure 3 has to be defined. For this purpose, Figure 5 provides a comparison of the equivalent body current values for different current paths as functions of the touch voltage. As the figure implies, the equivalent body current increases with the touch voltage. The highest values are reached for a current path from the chest to both hands, which corresponds to the worst-case scenario in terms of personal safety. The other curves cover the most relevant cases for indirect contact incidents for comparison. In this context, any single-handed contact is represented by a current path through the left hand, which bears a gener-ally higher risk of ventricular in comparison with a current through the right hand.
The touch voltage will take on different values below the grid voltage, depending on the grounding strategy and the system resistance. To cover the worst-case scenario, a touch voltage equal to the grid voltage will be assumed in the following.
The equivalent body currents for different paths at grid voltages of 120V, 190V, 230 V, 325 V and 380 V can be acquired from Figure 5. With these values the maximum tolerable time of exposure of a human being to a body current in upward or downward direction can be derived from Figure 3. This exposure time threshold can be considered as the applicable disconnection time requirement for protection de-vices in LVDC customer-end networks. The results for a current path from the chest to both hands (worst-case scenario) and a current flow from the seating position to the left hand are summarized in Table 6.
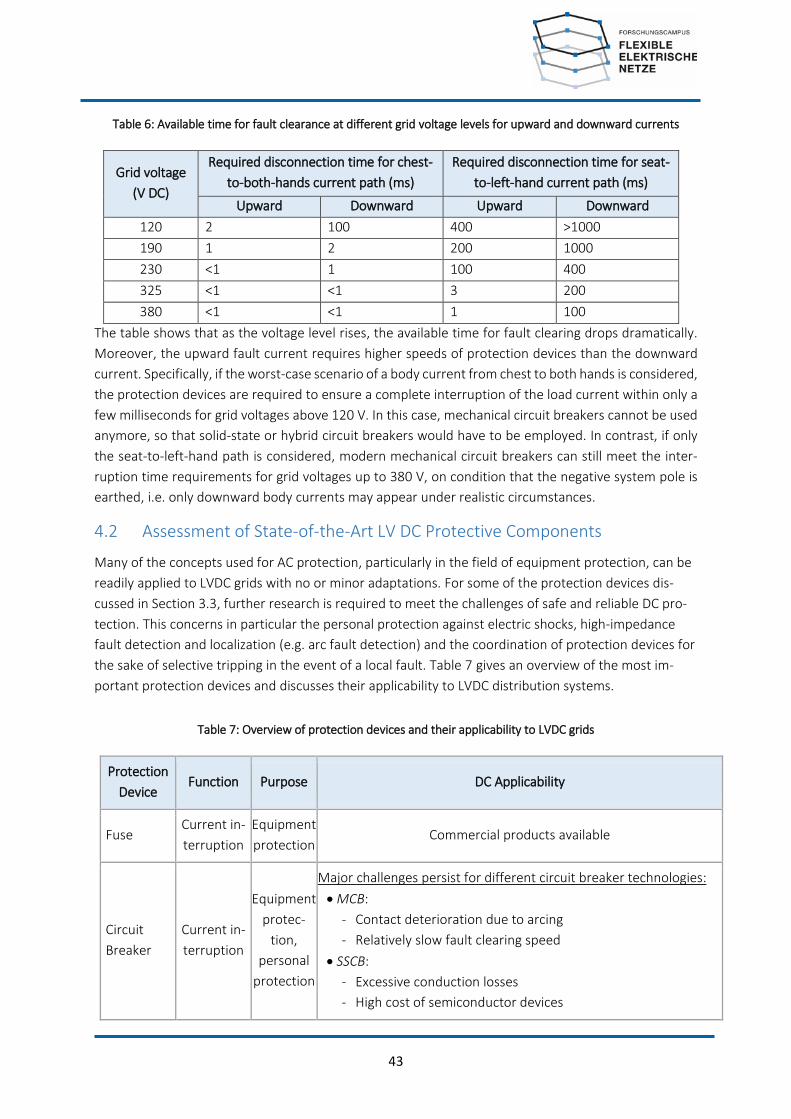
43
Table 6: Available time for fault clearance at different grid voltage levels for upward and downward currents
Grid voltage (V DC)
Required disconnection time for chest-to-both-hands current path (ms)
Required disconnection time for seat-to-left-hand current path (ms)
Upward Downward Upward Downward 120 2 100 400 >1000 190 1 2 200 1000 230 <1 1 100 400 325 <1 <1 3 200 380 <1 <1 1 100
The table shows that as the voltage level rises, the available time for fault clearing drops dramatically. Moreover, the upward fault current requires higher speeds of protection devices than the downward current. Specifically, if the worst-case scenario of a body current from chest to both hands is considered, the protection devices are required to ensure a complete interruption of the load current within only a few milliseconds for grid voltages above 120 V. In this case, mechanical circuit breakers cannot be used anymore, so that solid-state or hybrid circuit breakers would have to be employed. In contrast, if only the seat-to-left-hand path is considered, modern mechanical circuit breakers can still meet the inter-ruption time requirements for grid voltages up to 380 V, on condition that the negative system pole is earthed, i.e. only downward body currents may appear under realistic circumstances.
4.2 Assessment of State-of-the-Art LV DC Protective Components
Many of the concepts used for AC protection, particularly in the field of equipment protection, can be readily applied to LVDC grids with no or minor adaptations. For some of the protection devices dis-cussed in Section 3.3, further research is required to meet the challenges of safe and reliable DC pro-tection. This concerns in particular the personal protection against electric shocks, high-impedance fault detection and localization (e.g. arc fault detection) and the coordination of protection devices for the sake of selective tripping in the event of a local fault. Table 7 gives an overview of the most im-portant protection devices and discusses their applicability to LVDC distribution systems.
Table 7: Overview of protection devices and their applicability to LVDC grids
Protection Device
Function Purpose DC Applicability
Fuse Current in-terruption
Equipment protection
Commercial products available
Circuit Breaker
Current in-terruption
Equipment protec-
tion, personal
protection
Major challenges persist for different circuit breaker technologies: • MCB:
- Contact deterioration due to arcing - Relatively slow fault clearing speed
• SSCB: - Excessive conduction losses - High cost of semiconductor devices

44
- Limited current/voltage ratings - Experimental stage in LVDC applications
• HCB: - High cost and complexity - Experimental stage in LVDC applications
Discon-nector
Galvanic isolation
Auxiliary switch
Commercial products available
RCD Detection Personal
protection
Major challenges persist: • Definition of appropriate trip levels
- Nuisance tripping - Selective tripping (coordination of protective devices) - Proper tuning in plug load systems (variable resonance fre-
quencies) - High inrush currents at grid startup and connection of large
loads • Fault current interruption
- No natural zero crossings - Circuit breaker technology (see above) - Application range of widely proven MCBs is limited to low
voltage levels (approximately < 120 V for downward body currents or < 200 V depending on consideration of skin im-pedance) due to slow fault clearing speed
AFDD Detection Arc faults
Concepts available, but challenges persist: • High-impedance arc fault detection
- Nuisance tripping - Proper tuning in plug load systems (variable resonance fre-
quencies) • Arc fault localization/selective tripping • Arc extinction
- No natural zero crossing - Immediate discharge of DC-link capacitors into the fault
IMD Detection IT-earthed
systems (1st fault)
Commercial products available
OVP Voltage
limitation Equipment protection
Commercial products available
ICL Current
limitation Equipment protection
Commercial products available

45
4.3 Comparison of Strategies for Fault Detection and Location in Literature
This section gives an overview of the protection approaches proposed for LVDC grids. The overview gives the main considerations and challenges in detecting and locating faults in LVDC grids.
4.3.1 Objectives of the Strategies
Protection systems need to quickly detect the fault before it harms people or causes damage to con-nected equipment. It is desirable that they also locate the fault. Locating the fault before tripping can minimize the number of devices experiencing power interruptions. Locating the fault after tripping min-imizes the time needed to find the fault manually and fix the cause of the fault.
4.3.2 System Characteristics
The applicability of the protection approaches depends on the grid characteristics. In comparing differ-ent approaches proposed in literature, the possibility of the following grid characteristics was consid-ered:
1. The grid has many sources of fault currents. Fault currents may come from distributed energy resources and battery storage systems. System capacitances, including those in the power con-verters, will supply fault currents.
2. Fault currents in the system may not be large enough to trigger overcurrent protection. Limited levels of fault currents may come from a number of reasons:
a. Some power converters in LVDC grids have fault-limiting capability [57]. b. There are also voltage-weak LVDC grids, where the voltage drops during short-circuits
[58]. c. The fault resistance may be large.
These characteristics challenge the idea of just relying on overcurrent protection in LVDC grids.
In addition, there is a need to provide high-speed protection in LVDC grids [59] [5]. It protects sensitive electronic equipment from damage and limits voltage transients after tripping. Slower protection re-sponse in LVDC grids may lead to unacceptable voltage transients. This is the result of the investigation in [59]. Here, they consider the LVDC grid in Figure 33-a. The grid connects two sources and two loads. Clearing fault F1 after 1 ms results in the voltage in Figure 33-b. Here, the resulting voltage transients are within 20% of the nominal value. Clearing fault F1 after 5 ms results in the voltage plotted in Figure 33-c. Here, the voltage deviates more than 20% of the nominal value. This may not be acceptable in LVDC grids depending on future requirements.

46
Rf Lf
R4
C2
R4
C2
Rbatt Lbatt LLB RLB
CLB CLB
Vbatt
Vbatt
LL1RL1
CL1 CL1
CL1 CL1
LL
RL
CLLL
Steady-State Load
ModelLL1RL1
Rbatt Lbatt LLB RLB
CLB CLB
LL2RL2
CL2 CL2
CL2 CL2
LL
RL
CLLL
Steady-State Load
ModelLL2RL2
+ udc –
F1
(a)
(b) (c)
Figure 33. Voltage transients related to fault clearing of (a) fault F1 in a low-voltage DC grid, (b) after 1 ms and (c) after 5 ms [59]
4.3.3 Overcurrent-Based Protection
This approach triggers protections systems using an overcurrent element. Here, the protection system responds when the current exceeds a certain threshold. This approach ensures the safety of humans and devices. However, this approach requires a large fault current during the fault.
Interrupting the large DC fault current may result in unacceptable voltage transients [59] or damage to circuit breakers due to excessive arcing. These effects may be attenuated by limiting the fault currents through the converter, using a DC RL snubber circuit, for instance, as suggested in [60]. On the one hand, this approach may lead to cost reductions as a lower circuit breaker rating can be applied. How-ever, it requires more converter functions. These functions come with extra costs and coordination is-sues.
4.3.4 Rate-of-Change-of-Current- (di/dt) Based Protection
In [61], the rate-of-change of current (di/dt) is used to detect and locate faults. Successive measure-ments at different locations in a ring bus are sent to a central controller. The controller then determines the di/dt for each location. When di/dt exceeds a certain threshold, the controller assumes that a fault exists. Moreover, the location with the highest di/dt is assumed to be the location closest to the fault.

47
The advantage of this approach is that faults can be detected early. The fault currents do not need to reach high values to be detected. Thus, the circuit breakers can have lower ratings and comprise cheaper parts.
One of the disadvantages of this approach is that it requires communication. In addition, the di/dt char-acteristic in compact grids is sensitive to the fault resistance. This is due to the small line impedances. Thus, the di/dt may not vary enough across different locations in a compact grid, making it harder to provide selective response [6]. Furthermore, the di/dt-threshold must be high enough to exclude non-fault-related transients to provide selectivity and avoid nuisance tripping.
4.3.5 Resonance-Based Protection
A major limitation of overcurrent protection is that it cannot detect small fault currents. To address this limitation, residual current protection can be employed to detect ground faults with small fault currents. Line-to-line faults with small fault currents are also possible to detect with this method. The low fault current level can be due to the system having 1) low system capacitance, 2) current-limiters in convert-ers, 3) large fault resistances, or 4) voltage drops during fault. To overcome these issues, [62] proposes the use of resonant relays to detect faults with small fault currents. The schematic is shown in Figure 34-a.
LCRCLR
CR
CdcSW RF
Relay
(a) (b)
Figure 34: (a) Schematic diagram for resonance-based protection (b) results of wavelet transform triggering protection response [62]
The relay in Figure 34-a includes an overcurrent element to detect large fault currents. To detect small fault currents, the relay includes an inductor and a capacitor. The inductor and capacitor will produce an oscillation when a fault occurs, regardless of the value of the fault current. The oscillation will be detected by the relay through a discrete-wavelet-transform tool (DWT). The DWT produces a signal decomposition, as in Figure 34-b, to detect the oscillation and thereby the fault. In Figure 34-b, the fault occurs at t = 50 ms, and the fault is detected after 4.56 ms. All the different cases simulated in [62] have reached detection times of less than 5 ms.
The slow response of the resonance-based approach means that it cannot be used against harmful fault currents. The resonance-based approach is designed to detect small fault currents, for which the slow response is not yet critical. In [62], this approach is used in conjunction with an overcurrent-based pro-tection. The overcurrent-based protection quickly responds against potentially harmful overcurrents. Meanwhile, the resonance-based protection ensures that faults with small fault currents will be de-tected.

48
Furthermore, the resonance-based approach assumes that all loads are connected to the grid via power converters. The resonant frequency of the relay is set high enough so that switching transients will not trigger the DWT. Locating faults using this approach may become tricky, as all relays resonate during a fault.
4.3.6 Differential Protection
Differential protection works by comparing the currents that are entering and leaving a part of the sys-tem. This part may be a line or a node. A schematic diagram is shown in Figure 35. During normal oper-ation, the sum of the leaving currents equals the sum of the entering currents. If this condition is not fulfilled, then a fault must exist within the protected zone.
Analog to Digital
Conversion
Micro-controller
Passive or Act ive Network
Power Sources
Trip Output
Figure 35. Schematic diagram for fast differential protection scheme [63].
The concept of differential protection is simple. Differential protection achieves both fault detection and location in a straightforward manner. In [63], a fast differential protection is proposed for DC distri-bution systems. Here, the simulations show that fault detection can be achieved within 50 µs. This is the duration between the time of exceeding the current-differential threshold and the emission of the trip signal. This does not include the time for the current-difference to reach the threshold, the opening time of the circuit breaker, or the possible communication delays. Furthermore, in [64], the use of dif-ferential protection is extended to also determine the fault type in a PV-based microgrid.
One crucial requirement in differential protection is the synchronization of measurements. Otherwise, the approach will result in nuisance tripping. In addition, the protection and measurement configura-tions have to be updated when there are changes in the grid topology.
4.3.7 Use of Intelligent-End-Devices (IEDs)
A protection approach that uses Intelligent End Devices (IEDs) is proposed in [5]. Figure 36 shows the schematic diagram for this approach. Here, the IEDs are located in different sections of the grid. Each IED receives local measurements of voltage magnitude, current magnitude, and current direction. Each IED controls a switching device that can break the fault current. In this approach, the fault detection
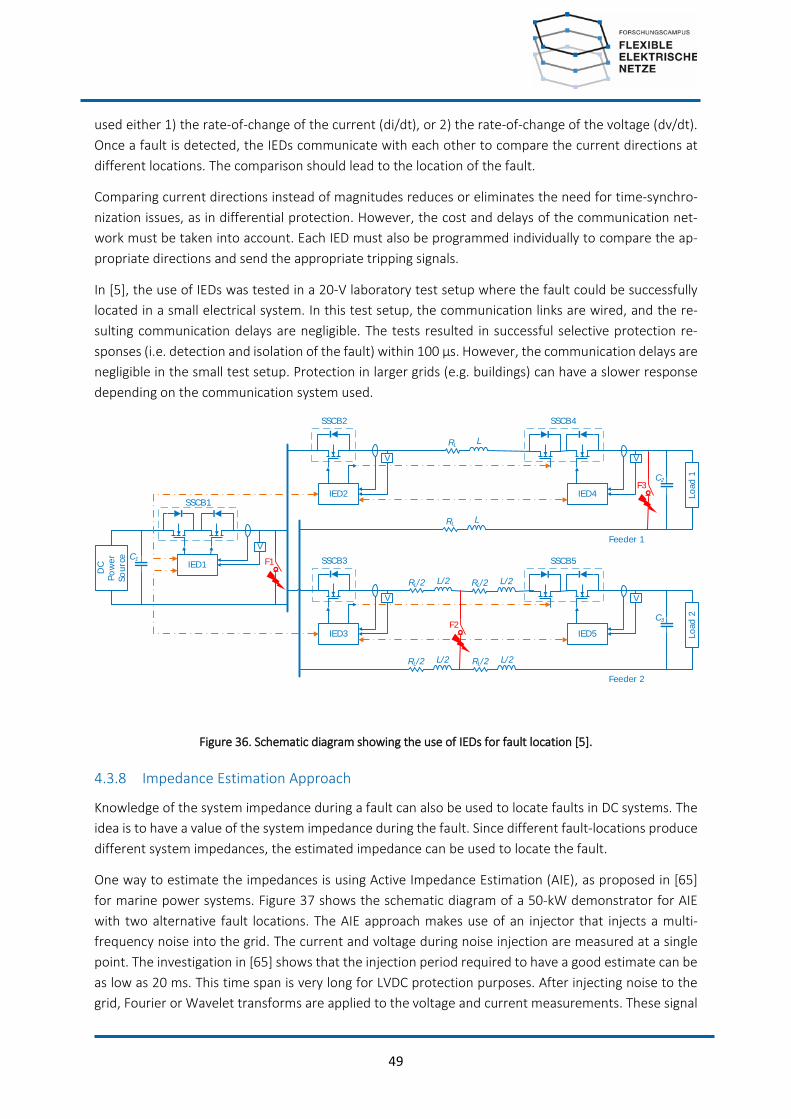
49
used either 1) the rate-of-change of the current (di/dt), or 2) the rate-of-change of the voltage (dv/dt). Once a fault is detected, the IEDs communicate with each other to compare the current directions at different locations. The comparison should lead to the location of the fault.
Comparing current directions instead of magnitudes reduces or eliminates the need for time-synchro-nization issues, as in differential protection. However, the cost and delays of the communication net-work must be taken into account. Each IED must also be programmed individually to compare the ap-propriate directions and send the appropriate tripping signals.
In [5], the use of IEDs was tested in a 20-V laboratory test setup where the fault could be successfully located in a small electrical system. In this test setup, the communication links are wired, and the re-sulting communication delays are negligible. The tests resulted in successful selective protection re-sponses (i.e. detection and isolation of the fault) within 100 µs. However, the communication delays are negligible in the small test setup. Protection in larger grids (e.g. buildings) can have a slower response depending on the communication system used.
DC
Pow
er
Sour
ce C1
LRL
IED1
V
IED2
V
IED4
V
Load
1C2
LRL
L/2RL/2
IED3
V
IED5
V
Load
2C3
L/2RL/2
L/2RL/2
L/2RL/2
SSCB1
SSCB2 SSCB4
SSCB3 SSCB5F1
F3
F2
Feeder 1
Feeder 2
Figure 36. Schematic diagram showing the use of IEDs for fault location [5].
4.3.8 Impedance Estimation Approach
Knowledge of the system impedance during a fault can also be used to locate faults in DC systems. The idea is to have a value of the system impedance during the fault. Since different fault-locations produce different system impedances, the estimated impedance can be used to locate the fault.
One way to estimate the impedances is using Active Impedance Estimation (AIE), as proposed in [65] for marine power systems. Figure 37 shows the schematic diagram of a 50-kW demonstrator for AIE with two alternative fault locations. The AIE approach makes use of an injector that injects a multi-frequency noise into the grid. The current and voltage during noise injection are measured at a single point. The investigation in [65] shows that the injection period required to have a good estimate can be as low as 20 ms. This time span is very long for LVDC protection purposes. After injecting noise to the grid, Fourier or Wavelet transforms are applied to the voltage and current measurements. These signal

50
processing techniques will take additional processing times. After processing the signals, an estimate of the system impedance is derived from the signals’ frequency content.
Load
2
Load
1
Supp
y Fi
lter
Pow
er C
onve
ter
Inje
ctor F1 F2
Figure 37. Schematic diagram of a 50-kW distribution demonstrator for Active Impedance Estimation [65]
Furthermore, high-resistance faults reduce the effectiveness of AIE. In high-resistance faults, the esti-mated system impedance before and during the fault may not differ significantly. An alternative to AIE is the Inductance Estimation approach proposed in [57]. Inductance Estimation only locates the fault and relies on other means to detect the fault. As opposed to AIE, Inductance Estimation only relies on the inductance estimations, and not on impedance estimation. By relying only on the inductance, this method should not be affected by the fault resistance. This method uses the transient voltage, current, and di/dt measurements during faults. These measurements are fed to a mathematical model of the system. Solving the model produces the equivalent inductances between each protective device and the fault. The fault can be located using the estimated inductances and a selective response to the fault can be achieved.
Simulations and hardware tests in [57] have shown that inductance estimation can locate the fault in 0.40 to 0.65 ms. However, despite quickly locating the fault, the proposed Inductance Estimation tech-nique has several limitations. First, the differences between the equivalent inductances in LVDC grids may be small. Therefore, a small inaccuracy in the estimation may trigger the wrong protective devices. Series inductances could be added to the line at the protection boundaries. However, the effect of this inductance on the overall transient behavior of the system and system resonance must be studied. Also, the mathematical formulation in [57] does not consider system capacitances, which have large effects in the transient behavior of LVDC grids.
4.3.9 Voltage Derivative Management
Another approach for fault location is proposed in [57]. This technique is envisioned to be used in volt-age-weak systems. These are systems where the voltages drop during faults. Figure 38 shows the sche-matic diagram of the protection concept. In the diagram, there are different possible sources of fault currents in the system. To locate a fault, a circuit breaker is inserted at the system node (i.e., where the three branches meet). Inside this circuit breaker, each branch has its own circuit-breaking element. In the proposed approach, the circuit breaking-element at the branch with the fastest dropping voltage during fault condition will open. Passive elements are added inside the circuit breaker to ensure that the voltage at the fault-side will drop the fastest.
This approach has several challenges as discussed in [58]. First, the passive elements inside the breaker must be sized properly. Different nodes in a system will have different appropriate sizes for the passive elements. Second, the voltage measurements must have sampling rates high enough to differentiate

51
the rate of change of the voltage drop across the different sides of the breaker. Third, the voltage drops caused by faults must be differentiated from voltage drops caused by changes in the load.
Power Converter
Circuit Breaker
Power Converter
Power Converter
Figure 38. Schematic diagram for the voltage derivative management [57]
4.3.10 Summary
In the following, the protection approaches discussed in this section will be summarized and compared to each other. The general goal of the approaches is to detect or locate faults in LVDC grids. To do so, they have to overcome the following characteristic challenges related to LVDC grids:
1. During a fault, the current on a line may flow in either direction when multiple energy sources are feeding the system.
2. The value of the fault current may not be high. 3. High-speed detection is essential to detect the fault before it reaches its peak. This avoids high
breaker ratings and reduces voltage transients after tripping.
Table 8 summarizes the advantages and disadvantages of the different protection approaches. In addi-tion, Table 9 compares the different approaches based on their ability to provide the following:
1. High-speed fault detection of large fault currents 2. Selective protection against large fault currents 3. Fault detection of small current faults. 4. Selective protection against small fault currents

52
Table 8. Summary of the advantages and disadvantages of different protection approaches proposed for LVDC grids
Protection Con-cept Advantages Disadvantages
Overcurrent • Protection of humans and devices is
provided based on a simple overcur-rent element.
• Small fault currents cannot be de-tected.
• Providing selective protection in grids with bidirectional power flow is very challenging.
• Fault currents can reach very high lev-els, thereby increasing the required circuit breaker ratings.
di/dt-based
• Early detection is possible, which 1) allows a reduction of the required cir-cuit breaker rating and 2) avoids un-wanted voltage oscillations.
• The current derivative levels at differ-ent locations in a compact grid can be very close to each other, making it dif-ficult to provide selective protection.
• A mechanism for the measure-ment/calculation of di/dt is required.
• For selective protection, communica-tion systems are required.
Differential protection
• All non-series faults can be detected. • High-speed detection can be pro-
vided. • Protection zones are easily defined,
making it comparatively easy to pro-vide selective protection.
• Faults are easily distinguishable from load changes.
• It can be extended to classify faults and detect DC arc faults
• Time synchronization and noise prob-lems must be dealt with.
• Changes in the grid topology may re-quire modifications to the wiring of the differential protection system.
Resonance-based
• Small fault currents can be detected • Load transients can be differentiated
from fault transients.
• Need for additional signal processing tools and time to detect the fault.
• Only feasible for grids where all loads and generation are interfaced via con-verters.
• There are no provisions selective pro-tection response yet
Active Impedance Es-
timation
• Large and small fault currents can be detected.
• Selective protection response can be provided. The estimated impedance provides the location of the fault.
• The required noise injection period is very long for LVDC protection pur-poses.
• Need for additional signal processing tools and time to detect the fault.
• The impedance estimates can be inac-curate when the fault impedances are high.

53
Inductance Es-timation
• The inductance estimation is not de-pendent on fault resistance.
• Only applicable for fault location, the detection of a fault is not provided.
• The formulation of the concept does not consider grid capacitances, which are non-negligible in LVDC grids.
• The requirement for high sampling frequency increases system cost.
Use of IEDs
• Selective protection response is pro-vided.
• By comparing directions of the cur-rents instead of instantaneous values, the need for measurement synchroni-zation is eliminated (in contrast to the differential protection approach)
• Combination with other fast-detec-tion approaches (e.g. di/dt-based ap-proach) possible.
• By itself alone, the approach cannot detect the existence of a fault.
• Need for IEDs, additional communica-tion and processing time
Voltage deriv-ative manage-
ment
• Provides fault detection • Provides selective protection re-
sponse
• Application to voltage-weak systems only
• Passive elements inside the circuit breakers need to be sized according to the grid characteristics. Changes in the grid topology require a resizing of these passive elements.
Table 9. Summary of different protection approaches proposed for LVDC grids
Protection Concept
High-Speed Detection: Large Fault
Current
Coordination: Large Fault
Current
Detection: Small Fault
Current
Coordination: Small Fault
Current
Overcurrent n/a n/a di/dt-based n/a n/a Differential protection Resonance-based n/a n/a Active Impedance Estimation Inductance Estimation n/a n/a Use of IEDs n/a n/a Voltage derivative management (for voltage weak systems)
The most basic among the different protection approaches is the overcurrent-based protection. This approach ensures that the current will not rise to levels that are dangerous to humans and equipment.
Remarks = more challenging to implement = no communication requirement = less challenging to implement = can be used with communications = communication required

54
In LVDC grids, this approach can be implemented using the available DC circuit breakers and fuses. How-ever, there are many problems related to the use of overcurrent-based protection in LVDC grids. This protection approach cannot detect small fault currents. Also, it cannot interrupt large fault currents before they reach large values. Furthermore, with overcurrent-based protection, it is challenging to provide selective protection when the system has multiple sources of fault currents (e.g., capacitors, DER).
The di/dt-based protection enables faster fault detection than overcurrent-based protection. The main advantage of the di/dt-based approach is that it can detect the fault current very early. It can trip the fault current before it reaches a high value, thereby reducing the required circuit breaker ratings. How-ever, it needs extra processing of current measurements to determine the current derivative. To provide a selective protection response, it also requires communication systems to compare the different di/dt's in the system.
The di/dt-based protection is also used in combination with other approaches that are able to locate faults but not to detect them. One example is the approach that uses IEDs. It relies on the speed of the di/dt-based approach to detect the fault. However, it does not use the di/dt values to locate the fault, because they may be too similar in an LVDC system for a proper distinction, which is necessary for the location of the fault. Thus, it is challenging to provide selective protection using the di/dt-based protec-tion scheme alone. Another drawback is related to small fault currents, which may exhibit too low di/dt’s to allow proper detection using the di/dt-based approaches.
The resonance-based approach solves the problem of overcurrent- and di/dt-based approaches in de-tecting small fault currents. However, due to the required signal processing (e.g., wavelet transforms), the resonance-based approach is slower than the di/dt-based approach. Therefore, it can only be ap-plied for the detection of fault currents that are low enough to make the detection speed a non-critical parameter. The main disadvantage of the resonance-based approach is that it has no provisions for selective protection. Also, the resonance-based approach requires that all loads and generation are connected to the grid via electronic power converters.
Differential protection allows detecting and locating faults. It is a straight-forward way of detecting the presence of small or large fault currents. The simplicity of its protection concept may bring a wide ac-ceptance within the industry. The main obstacle in differential protection is the problem of synchroniz-ing the measurements. If this obstacle is not solved, differential protection may result in false detec-tions.
The approach combining IEDs and communication systems for fault location solves several of the prob-lems mentioned above. This approach neither relies on the actual current magnitude, nor on its deriv-ative value. Therefore, like differential protection, it can be used for any fault types and with any net-work topologies. By comparing current directions instead of magnitudes, it can provide selective pro-tection without measurement synchronization. However, it has to be applied in combination with an-other protection approach (e.g., di/dt-based) to detect the fault. The main drawback of this approach is the extra communication requirement.
Aside from using IEDs, there are other approaches to locate faults in a power grid. These approaches are the Active Impedance Estimation, Inductance Estimation, and Voltage Derivative Management. They

55
do not need communication systems. However, they are less flexible than IED-based concepts due to the following reasons:
• Active Impedance Estimation performs well for low-impedance faults, but not for high-imped-ance faults. It also requires additional equipment that will inject noise into the grid.
• Inductance Estimation is not designed for systems where capacitances have a big effect on the fault characteristics. Therefore, its suitability for LVDC grids is questionable.
• Voltage Derivative Management avoids the use of communication systems. However, getting a mass rollout of the breakers needed in this approach is very challenging, since the elements in each breaker need to be sized specifically for the breaker location.
Thus, the use of IEDs presents the most flexible approach to locate fault currents without the need for synchronized measurements. In addition, the IEDs and the communication network can serve other control and monitoring functions as well. As these functions become more ubiquitous in the future, the use of protection with IEDs becomes more viable and economic.

56
5 Conclusions and Outlook The safe operation of LVDC grids relies on a protection system that allows fast detection and interrup-tion of fault currents before substantial damage is caused to humans and equipment. A variety of influ-encing factors shape the requirements that have to be met by an effective protection system for LVDC grids. In LVDC distribution systems at the customer end, a particular focus of the protection system has to be laid on the personal protection. In this context, the most important influencing factors encompass the grounding scheme, the body current path and the direction of current flow through the human body. To evaluate and compare the physiological impact of different body current paths, a general ap-proach is proposed in chapter 2. The hand-to-chest current path is determined as the worst-case sce-nario with regard to the risk of ventricular fibrillation.
Many of the protection concepts and devices employed in AC grids can be applied to LVDC distribution systems with minor effort. However, major challenges persist, requiring further research to provide the same safety level as in modern AC distribution systems. Three main concerns can be identified:
• Provide personal safety in the event of direct or indirect contact of human beings with live parts. • Keep oscillations within reasonable limits and ensure system stability during both normal oper-
ation and fault condition. • Avoid nuisance tripping through adequate fault detection mechanisms and proper coordination
of protection devices.
For the personal safety in LVDC grids, the top priority is the prevention of major and lethal injuries by minimizing the time of exposure to dangerous body currents. Hence, the protection devices have a lim-ited time frame, depending on the touch voltage, to detect and interrupt the fault current. In mechan-ical breaking devices, arcs across the opening contacts sustain the fault current and inhibit a complete disconnection of the fault location from power supply. Without the support of a natural zero crossing, the extinction of these arcs is a much more challenging task in DC than in AC distribution systems, which requires increased effort and time. This makes mechanical circuit breakers (as part of RCDs) too slow for applications where higher touch voltages (> 200 V or even lower, depending on the consideration of skin impedance) may occur, as they cannot meet the strict interruption time requirements in the event of human contact with live parts anymore. In such cases, alternative breaking concepts (SSCBs, HCBs) are needed that provide sufficient interruption speed to ensure a safe and reliable operation of the grid. While pure solid-state devices are confronted with excessive conduction losses, hybrid concepts com-bining both mechanical and solid-state approaches show promising performance levels. However, SSCBs and HCBs for LVDC applications are still at an experimental stage.
The distributed inductances and capacitances of the cables, filter circuits and DC links within an LVDC grid constitute a resonant tank whose frequency behavior significantly affects the system stability. Switching actions, connection of large loads, faults and disconnection of affected branches excite the system and may cause severe oscillations. This further complicates the definition of appropriate trip levels and bears the risk of cascaded system shutdown when the stability limits are exceeded. The prob-lem is aggravated in the presence of many plug loads, where the frequency behavior can change con-siderably depending on the connected loads and the associated DC links, filter components and cable sections. For a proper system configuration without the need for a complete re-engineering of every new LVDC grid, concrete design rules and limits need to be defined to achieve a standardized system

57
behavior. This requires a thorough characterization of transient dynamics in LVDC grids subject to dif-ferent load cases.
The proper definition of trip levels and conception of fault detection mechanisms are further non-trivial aspects of LVDC protection. The trip levels have to be properly set to discriminate between fault cur-rents and switching transients during normal operation. In the event of high-impedance faults though, the amplitude of the oscillations related to fault currents lies in the range of the normal noise level of the grid. Sophisticated detection algorithms have to be developed to distinguish between normal and fault-related transients (see Figure 26 for an overview of concepts from the literature in the context of arc-fault detection). The uncertainty in terms of the system time constant and the frequency behavior of LVDC systems with a large number of plug loads adds to the complexity of this task. Once a fault is detected, it has to be localized to allow for selective fault isolation and fast restoration of a healthy system state. The fast proliferation of fault currents within an LVDC distribution system makes the co-ordination of protection devices a challenging task though. When the protection parameters are poorly designed, nuisance tripping can compromise the reliability of the system. Communication between the protection devices and a sophisticated control strategy can support the coordination for the sake of selectivity.
In this context, a multitude of different approaches for LVDC protection is proposed in literature to overcome the challenges related to the following protection objectives:
• providing high-speed detection of large fault currents, • detecting small fault currents, • providing selective protection against large and small fault currents in a system with multiple
sources of fault currents.
The concept of differential protection can achieve the three objectives. However, its implementation is challenged by synchronization errors, electrical noise, and the need for a physical measurement inter-face. The results of the review rather suggest the use of a combination of different approaches to achieve the protection objectives. For high-speed detection of large fault currents, the di/dt-based ap-proach offers the highest potential. However, a cost-effective means of measuring di/dt's in the system still needs to be found. Moreover, appropriate di/dt thresholds have to be defined to allow for accurate fault detection and minimized nuisance tripping. Thus, a proper configuration has to make sure that load transients and inrush currents will not trigger the di/dt-based protection equipment. For detecting small fault currents, the review shows that the resonance-based approach has the highest potential. This approach can differentiate small fault currents from current transients that are not caused by faults. It can also detect large fault currents, but its slow response limits the applicability of resonance-based protection to small fault current levels. For locating the fault and providing selective protection, the use of IEDs interconnected via a communication network is recommended. The review suggests that this approach is the most flexible against variations in the characteristics of the fault and the grid. This ap-proach is based on the comparison of current directions and not current magnitudes, thus eliminating the need for synchronized measurements. The requirement of a communication system for the sake of selectivity comes at an additional cost. However, the IEDs and the communication network can serve other measurement and control functions in future LVDC grids. As these functions become more com-mon in the future, this approach becomes more cost-effective. The implementation and modularity of this approach in a building-level grid or a larger distribution system needs to be studied.

58
It is advised to study the joint performance of the three recommended approaches in a pilot LVDC grid. Observations in this grid could help to get a better understanding of the effects of power quality issues on LVDC protection and vice versa.
Table 10 summarizes the principle research questions identified in the scope of this seed-fund project.
Table 10: Identified open research questions for LVDC protection
Field of Research
Challenges Promising Starting Points for Future Re-
search
Personal Safety
• Limited applicability of common mechani-cal breakers in RCDs: - Fault current interruption too slow for
touch voltages > 120 V (conservative, see discussion on skin impedance)
- Increased arcing problems reduce switching lifetime of mechanical RCDs
• Excessive conduction losses in alternative solid-state breaking devices
• High cost of solid-state devices • High-impedance fault detection (see be-
low): discriminate between faults and transients from normal operation
• Protection against discharge currents from interconnected DC-link capacitors via the DC bus in case of a fault (high fault current and energy levels)
• Development of a hybrid breaking device to be used in DC-RCDs, which fulfill the following requirements: - Fast fault current interruption
speed (microsecond range) - Minimized conduction losses - Competitive cost level compared
to modern mechanical devices in AC grids
• Characterization of LVDC system be-havior under normal operating con-ditions to facilitate a better discrimi-nation between normal and faulty conditions
• Integrated discharge circuit con-cepts within the power electronic interface connected to the DC-link capacitors
System Stability
• Distributed capacitance and inductance from cables, filter components and DC links form a resonant tank Excitations from switching actions,
connection of large electrical loads and fault events may cause undesired oscillations and drive the system into instable conditions
• Variable transfer function / system dy-namics in plug load systems
• Characterization of LVDC system be-havior
• Derivation of stability margins allow-ing for a modular system design within specified limits
Selectivity / Coordination of Protection
Devices
• Definition of static trip levels vs. fault lo-calization & “active” coordination
• Characterization of LVDC system be-havior under normal operating con-

59
• Definition of selective trip levels for the coordination of upstream & downstream protection devices - High-impedance faults vs. normal op-
erating transients - Variable transfer function / system dy-
namics in plug load systems • Maintain the flexibility of modular system
extension (vs. immutable system design with centralized control strategy)
ditions to facilitate a better discrimi-nation between normal and faulty conditions
• Sophisticated fault detection algo-rithms (e.g., use of IEDs and com-munication systems)
• Modular communication concepts
High-Impe-dance Fault Detection
• Discriminate between fault transients & acceptable oscillations from normal oper-ation
• Fault localization • Reliable fault switch-off vs. nuisance trip-
ping
• Sophisticated fault detection algo-rithms (e.g., resonance-based detec-tion and the study of fault signa-tures)

60
Abbreviations
AIE – Active Impedance Estimation
di/dt – Rate of Change of Current
dv/dt – Rate of Change of Voltage
DWT – Discrete Wavelet Transform
DC – Direct Current
DER – Distributed Energy Resources
EFT – Electrical Fast Transient
ELV – Extra-Low Voltage
ESD – Electrostatic Discharge
HCB – Hybrid Circuit Breaker
IC – Integrated Circuit
ICL – Inrush Current Limiter
IED – Intelligent End Device
IFLS – Insulation Fault Location System
IMD – Insulation Monitoring Device
MCB – Mechanical Circuit Breaker
NTC – Negative Temperature Coefficient
OVP – Overvoltage Protection
PV – Photovoltaic
RCD – Residual Current Device
SCR – Silicon Controlled Rectifier
SELV – Safety Extra-Low Voltage
SSCB – Solid-State Circuit Breaker
USFA – United States Fire Administration
VSC – Voltage Source Converter
WP – Work Package

61
Bibliography[1] L. Li, J. Yong, L. Zeng, and X. Wang, "Investigation on the system grounding types for low
voltage direct current systems," in 2013 IEEE Electrical Power & Energy Conference, Halifax, NS, 2013, pp. 1-5.
[2] IEC, IEC TS: 60479-1 Effects of current on human beings and livestock - Part 1: General Aspects., 2005.
[3] IEC, IEC TS 60479-2: Effects of current on human beings and livestock - Part 2: Special aspects., 2007.
[4] ABB, "Technical Application Papers No.14 Faults in LVDC microgrids with front-end converters," , 2015.
[5] A. A. S. Emhemed, K. Fong, S. Fletcher, and G. M. Burt, "Validation of Fast and Selective Protection Scheme for an LVDC Distribution Network," IEEE Transactions on Power Delivery, pp. 1432-1440, June 2017.
[6] S. D. A. Fletcher, P. J. Norman, S. J. Galloway, P. Crolla, and G. M. Burt, "Optimizing the Roles of Unit and Non-unit Protection Methods Within DC Microgrids," IEEE Transactions on Smart Grid, vol. 3, no. 4, pp. 2079-2087, 2012.
[7] H. C. Cline, "Fuse Protection of DC Systems," , USA, 1995.
[8] Cooper Bussmann. (2005) Component Protection - How To Use Current-Limitation Charts. [Online]. http://www.cooperindustries.com/content/dam/public/bussmann/Electrical/Resources/solution-center/technical_library/BUS_Ele_Tech_Lib_Fuse_Let_Through_Charts_Current_Limitations_Charts.pdf
[9] Littelfuse, POWR-GARD Products, 2015.
[10] Eaton/Cooper Bussmann. (2016) www.cooperindustries.com. [Online]. http://www.cooperindustries.com/content/dam/public/bussmann/Electronics/Resources/technical-literature/Circuit%20Protection/bus-elx-an-10483-fuse-technology.pdf
[11] Electrical Engineering Community. (2014, Apr.) http://engineering.electrical-equipment.org. [Online]. http://engineering.electrical-equipment.org/electrical-distribution/selection-of-miniature-circuit-breaker.html
[12] Siemens AG, Residual Current Protective Devices - Technology Primer. Regensburg, Germany: Siemens AG, 2016.
[13] K. P. Bhat and Y.-B. Guo and Y. Xu and T. Baltis and D. C. Hopkins, Results for an Al/AlN composite 350°C SiC solid-state circuit breaker module, 2012.

62
[14] Z. Miao and G. Sabui and A. Chen and Y. Li and Z. J. Shen and J. Wang and Z. Shuai and A. Luo and X. Yin and M. Jiang, A self-powered ultra-fast DC solid state circuit breaker using a normally-on SiC JFET, 2015.
[15] Jin-young Kim and Seung-soo Choi and In-dong Kim, A novel reclosing and rebreaking DC solid state circuit breaker, 2015.
[16] Z. Miao and G. Sabui and A. Moradkhani and J. Wang and Z. Shuai and X. Yin, A self-powered bidirectional DC solid state circuit breaker using two normally-on SiC JFETs, 2015.
[17] Z. J. Shen and Z. Miao and A. M. Roshandeh and P. Moens and H. Devleeschouwer and A. Salih and B. Padmanabhan and W. Jeon, First experimental demonstration of solid state circuit breaker (SSCB) using 650V GaN-based monolithic bidirectional switch, 2016.
[18] J. Hayes and K. George and P. Killeen and B. McPherson and K. J. Olejniczak and T. R. McNutt, Bidirectional, SiC module-based solid-state circuit breakers for 270 Vdc MEA/AEA systems, 2016.
[19] L. A. Capilla and E. J. J. Rodriguez and F. J. Leon and C. Gordillo Tapia and J. J. Martinez, DC ultra-fast solid state circuit breaker using the voltage inductor to activate short circuit protection, 2017.
[20] Yukihiko Sato and Yasunori Tanaka and Akiyoshi Fukui and Mikio Yamasaki and Hiromichi Ohashi, SiC-SIT Circuit Breakers With Controllable Interruption Voltage for 400-V DC Distribution Systems, 2014.
[21] Atif Maqsood, Z-Source Circuit Breaker Design and Protection Schemes for DC Micro Grid Systems, 2017.
[22] Daniel Ryan and Jugh Torresan and Behrooz Bahrani, A Bi-Directional Series Z-Source Circuit Breaker, 2017.
[23] Swati Savaliya and Sumeet Singh and B.G. Fernandes, Protection of DC System using Bi-directional, 2016.
[24] L. L. Qi and A. Antoniazzi and L. Raciti and D. Leoni, "Design of Solid-State Circuit Breaker-Based Protection for DC Shipboard Power Systems," IEEE Journal of Emerging and Selected Topics in Power Electronics, pp. 260-268, 2017.
[25] J. M. Meyer and A. Rufer, "A DC Hybrid Circuit Breaker with Ultra-Fast Contact Opening and Integrated Gate-Commutated Thyristors (IGCTs)," IEEE Transactions on Power Delivery, pp. 646-651, 2006.
[26] Davood Keshavarzi and Teymoor Ghanbari and Ebrahim Farjah, A Z-Source-Based Bidirectional DC Circuit Breaker With Fault Current Limitation and Interruption Capabilities, 2017.
[27] Keith A. Corzine and Robert W. Ashton, A New Z-Source DC Circuit Breaker, 2012.

63
[28] Changle Li and Ziling Nie and Huayu Li and Yinfeng Zhang, A Novel Solid-State Protection Scheme for DC System, 2016.
[29] R. Jungblut and R. Sittig, Hybrid high-speed DC circuit breaker using charge-storage diode, 1998.
[30] P. van Gelder and J. A. Ferreira, Zero volt switching hybrid DC circuit breakers, 2000.
[31] Luca Novello and Fabio baldo and Alberto Ferro and Alberto Maistrello and Elena Gaio, Development and Testing of a 10-kA Hybrid Mechanical–Static DC Circuit Breaker, 2011.
[32] D. Bösche and E.D. Wilkening and H. Köpf and M. Kurrat, Breaking performance investigation of hybrid DC circuit breakers: An experimental approach, 2015.
[33] S. Zen and T. Hayakawa and K. Nakayama and K. Yasuoka, Development of an arcless DC circuit break using a mechanical contact and a semiconductor device, 2017.
[34] Siemens AG. (2010) http://cmsapps.sea.siemens.com. [Online]. http://cmsapps.sea.siemens.com/controls/icc2010/10IndControl_%20pdfs/10IC_17/17_042.pdf
[35] Siemens AG. (2016) https://www.lowvoltage.siemens.com. [Online]. https://www.lowvoltage.siemens.com/wcms/kataloge/LV-10_English_3.pdf
[36] ABB. (2010) http://search.abb.com. [Online]. http://search.abb.com/library/Download.aspx?DocumentID=1SDC200012D0202&LanguageCode=en&DocumentPartId=&Action=Launch
[37] ABB. (2015) http://search.abb.com. [Online]. http://search.abb.com/library/Download.aspx?DocumentID=1SDC210054D0203&LanguageCode=&DocumentPartId=&Action=Launch
[38] ABB. (2017) https://search-ext.abb.com. [Online]. https://search-ext.abb.com/library/Download.aspx?DocumentID=9AKK107045A0861&LanguageCode=en&DocumentPartId=&Action=Launch
[39] ABB. https://library.e.abb.com. [Online]. https://library.e.abb.com/public/fb7b893dcbd3f6f3c125792c00416d5a/2CCC413002C0104.pdf
[40] Hager. https://www.hager.de. [Online]. https://www.hager.de/files/download/0/15662122_1/0/DE_18DE0001_TECHNIK_LEITUNGSSCHUTZSCHALTER.PDF
[41] Schneider Electric. (2013) https://www.schneider-electric.dk. [Online]. https://www.schneider-electric.dk/documents/brochurer/Acti9_ApplicationsGuide_2013_Low.pdf
[42] Schneider Electric. (2015) http://www2.schneider-electric.com. [Online]. http://www2.schneider-

64
electric.com/resources/sites/SCHNEIDER_ELECTRIC/content/live/FAQS/289000/FA289174/en_US/Compact%20NSX%20(2015).pdf
[43] Schneider Electric. (2015) http://download.schneider-electric.com. [Online]. http://download.schneider-electric.com/files?p_Reference=0613CT0501&p_EnDocType=Catalog&p_File_Id=1188682281&p_File_Name=0613CT0501%20net.pdf
[44] GE Energy. (2010) http://apps.geindustrial.com. [Online]. http://apps.geindustrial.com/publibrary/checkout/DET-739?TNR=Application%20and%20Technical%7CDET-739%7Cgeneric
[45] GE Industrial Solutions. (2016) http://apps.geindustrial.com. [Online]. http://apps.geindustrial.com/publibrary/checkout/I-3376-E-EX-0-1-ED-07-16?TNR=Catalogs%20and%20Buyers%20Guides%7CI-3376-E-EX-0-1-ED-07-16%7CPDF&filename=Record_Plus_Catalogue_English_EMEA_ed07-16_680860.pdf
[46] E. Csanyi. (2014, June) http://electrical-engineering-portal.com. [Online]. http://electrical-engineering-portal.com/disconnectors-load-switches-switch-disconnectors-cbs
[47] C. Amadori, "Everything You Wanted to Know About Type B Residual Current Circuit Breakers But Never Dared to Ask," 2015.
[48] United States Fire Administration (USFA). (2014, Mar.) https://www.usfa.fema.gov. [Online]. https://www.usfa.fema.gov/downloads/pdf/statistics/v14i13.pdf
[49] J. Johnson, Codes and Standards for Photovoltaic DC Arc-Fault Detection, October 21, 2011.
[50] X. Yao and J. Wang and D. L. Schweickart, "Review and Developments in DC Arc Fault Detection," IEEE International Power Modulator and High Voltage Conference (IPMHVC), pp. 467-472, 2016.
[51] H. Sellner, "Electrical Safety for DC Systems," 2013. [Online]. http://www.bender-es.com/fileadmin/bender-de/downloads/article/Elektrische_Sicherheit_DC_2013_EN.pdf
[52] ON Semiconductor. (2008) www.onsemi.com. [Online]. https://www.onsemi.com/pub/Collateral/TND335-D.PDF
[53] I. Poole. www.electronics-notes.com. [Online]. https://www.electronics-notes.com/articles/analogue_circuits/power-supply-electronics/over-voltage-protection.php
[54] S. Butler. (2012) http://www.vptpower.com. [Online]. http://www.vptpower.com/wp-content/uploads/downloads/2012/01/info_inrushCurrent.pdf
[55] A. Kaknevicius and A. Hoover, "Managing Inrush Current," Dallas, TX, USA, 2015.
[56] Epcos AG. (2013) https://en.tdk.eu. [Online]. https://en.tdk.eu/download/528070/f5be4fca9d1f66204de9cf37891e5265/pdf-inrushcurrentlimiting-an2.pdf
http://www.bender-es.com/fileadmin/bender-de/downloads/article/Elektrische_Sicherheit_DC_2013_EN.pdf
http://www.bender-es.com/fileadmin/bender-de/downloads/article/Elektrische_Sicherheit_DC_2013_EN.pdf
65
[57] X. Feng, L. Qi, and J. Pan, "A novel fault location method and algorithm for DC distribution protection," in 2016 IEEE Industry Applications Society Annual Meeting, Portland, OR, 2016, pp. 1-5.
[58] L. Hailu, M. Mackay, M. Gajic, and J. A. Ferreira, "Protection coordination of voltage weak DC distribution grid: Concepts," in 2016 IEEE 2nd Annual Southern Power Electronics Conference (SPEC), Auckland, 2016, pp. 1-5.
[59] D Salomonsson, L Soder, and A Sannino, "Protection of Low-Voltage DC Microgrids," IEEE Transactions on Power Delivery, vol. 24, no. 3, pp. 1045-1053, July 2009.
[60] S. R. B. Vanteddu, A. Mohamed, and O. Mohammed, "Protection design and coordination of DC Distributed Power Systems Architectures," in 2013 IEEE Power & Energy Society General Meeting, Vancouver, BC, 2013, pp. 1-5.
[61] G. Madingou, M. Zarghami, and M. Vaziri, "Fault detection and isolation in a DC microgrid using a central processing unit," in 2015 IEEE Power & Energy Society Innovative Smart Grid Technologies Conference (ISGT), Washington DC, 2015, pp. 1-5.
[62] K. Saleh, A. Hooshyar, and E. El-Saadany, "Hybrid passive-overcurrent relay for detection of faults in low-voltage DC grids," IEEE Trans. Smart Grid, p. 99, September 2015 (Updated 2017).
[63] S. D. A. Fletcher, P. J. Norman, F. Kong, S. J. Galloway, and G. M. Burt, "High-Speed Differential Protection for Smart DC Distribution Systems," IEEE Transactions on Smart Grid, vol. 5, no. 5, pp. 2610-2617, September 2014.
[64] S. Dhar and P. K. Dash, "Differential current-based fault protection with adaptive threshold for multiple PV-based DC microgrid," IET Renewable Power Generation, vol. 11, no. 6, pp. 778-790, 2017.
[65] E. Christopher, M. Sumner, D. Thomas, W. Xiaohui, and F. de Wildt, "Fault location in a zonal DC marine power system using active impedance estimation," in Proc. IEEE Energy Convers. Congr. Expo., 2010, pp. 3050-3054.
[66] Forschungsgemeinschaft für Elektrische Anlagen e.V, Zustandprognose von Papiermasse-Kabelanlagen in Verteilungsnetzen, 2006.
[67] A.J. Schwab, Elektroenergiesysteme, 2009.
[68] A. Küchler, Hochspannungstechnik, 2009.
[69] VDE, Störungs- und Verfügbarkeitsstatistik, 2008.
[70] Fuchs, K., Novitskiy, A., Berger, F. und Westerman, Hochspannungsgleichstromübertragung - Eigenschaften des Übertragungsmediums Freileitung, 2014.
[71] Maruvada, S. P., Janischewskyj, W., D.C. corona on smooth conductors in air. Steady-state analysis of the ionisation layer, 1969.
66
[72] R. Puffer, Vorlesung Freileitungen, 2013.
[73] YU, Z. et al., Analysis on Switching Transient EMI in +- 500-kV HVDC Converter Stations, 2008.
[74] R. W. De Doncker, Power Electronic Technologies for Flexible DC Distribution Grids, 2014.
[75] A. Moser, Elektrizitätsversorgungssysteme - Skriptum zur Vorlesung, 2010.
[76] Davies, M., Dommaschk, M., Dorn, J., Lang, J., Ret, HVDC PLUS Basics and Principles of Operation, 2009.
[77] N. Flourentzou, VSC-Based HVDC Power Transmission Systems: An Overview, 2009.
[78] Benz, T., Görner, R., Freileitungen und Erdkabel - Möglichkeiten der Stromübertragung mit Gleichstrom, 2012.
[79] Pugliese, H., Vonkannewurf, M., Direct Current Circuit Breaker Primer, 2010.
[80] Lee, S., Hyosung-Kim, A Study on Low-Voltage DC Circuit Breaker, 2013.
[81] C. Meyer, Key Components for Future Offshore DC Grids, 2007.
[82] Schumacher, M. et al., Get On the Digital Bus to Substation Automation, 2007.
[83] IAEW et al., Moderne Verteilernetze für Deutschland, 2014.
[84] M., Dommaschk, M., Dorn, J., Lang, J., Retzmann, D.,Soerangr, D. Davies, HVDC PLUS Basics and Principles of Operation, 2009.
[85] P. BRESESTI, W.L. KLING, R.L. HENDRIKS, and R. VAILATI, HVDC Connection of offshore Wind Farms to the Transmission System, 2007.
[86] J. M. Meyer and A. Rufer, A DC hybrid circuit breaker with ultra-fast contact opening and integrated gate-commutated thyristors (IGCTs), 2006.
[87] F.Wang, On power quality and protection. Göteborg: Chalmers University of Technology, 2001.
[88] M. C. Magro, A. Mariscotti, P. Pimceti, Definition of power quality indices for DC low voltage distribution networks, 2006 Instrumentation and Measurement Technology Conference Proceedings, Sorrento, 2006.

67
List of Tables
Table 1. Ratio of touch voltage in LVDC networks with different earthing strategies [1] ................... 7
Table 2: Total body resistances RT for a current path hand to hand, DC, for large surface areas of contact in dry conditions [2] ............................................................................................................ 9
Table 3: Body resistance FB and heart-current factor FH for different current paths ......................... 10
Table 4: Impact of pole-to-pole and pole-to-ground short circuit faults on the LVDC distribution system ..................................................................................................................................................... 22
Table 5: Characteristic faults and commonly employed protection devices ......................................... 27
Table 6: Available time for fault clearance at different grid voltage levels for upward and downward currents........................................................................................................................... 43
Table 7: Overview of protection devices and their applicability to LVDC grids ................................... 43
Table 8. Summary of the advantages and disadvantages of different protection approaches proposed for LVDC grids ................................................................................................................. 52
Table 9. Summary of different protection approaches proposed for LVDC grids ................................ 53
Table 10: Identified open research questions for LVDC protection .......................................................... 58

68
List of Figures
Figure 1: Work packages and time schedule of the seed-fund project “LVDC Protection” ................. 6
Figure 2: Indirect touch in the LVDC customer end network of (a) TT system, (b) IT system, (c) TN-S system and (d) TN-C system ................................................................................................. 7
Figure 3: Time-current zones for DC body current from left hand to feet .............................................. 11
Figure 4: Current path through human body (a) downward current (b) upward current .............. 11
Figure 5: Equivalent body currents of different current paths .................................................................... 12
Figure 6: Evaluation of capacitive discharge effects through the human body: (a) generic LVDC system model, (b) qualitative waveform of a capacitive discharge current through the human body over time ............................................................................................................. 13
Figure 7: Energetic comparison of capacitive discharge currents through the human body (solid lines) and the exposure time thresholds before ventricular fibrillation (dashed and dotted lines) ......................................................................................................................................... 14
Figure 8: Circuit model of ideal front end converter with short circuit faults on the distribution line ............................................................................................................................................................ 15
Figure 9: Simplified circuit diagram of ideal front end converter .............................................................. 15
Figure 10: Simulation results of high impedance pole-to-pole fault (a) DC current, (b) DC voltage and (c) AC voltage (p.u.) & current (p.u.) ................................................................................. 16
Figure 11: Simulation results of low-impedance pole-to-pole fault (a) DC current, (b) DC voltage and (c) AC voltage (p.u.) & current (p.u.) ................................................................................. 18
Figure 12: Pole to ground fault when the system is earthed at AC neutral point ................................ 19
Figure 13: Simulation results of pole-to-ground fault when the system is earthed at the AC neutral point: (a) DC currents, (b) DC voltages and (c) AC voltage (p.u.) & current (p.u.) ......................................................................................................................................................... 20
Figure 14: Pole to ground fault when the system is earthed at DC mid-point ....................................... 21
Figure 15: Simulation of pole-to-ground fault when the system is earthed at the DC mid-point: (a) DC currents, (b) DC voltages and (c) AC voltage (p.u.) & current (p.u.) ............... 22

69
Figure 16: Fault types at the example of a generic ±380 V DC grid ........................................................... 25
Figure 17: Schematic design [7] and let-through characteristic of a melting fuse [8] ....................... 28
Figure 18: Exemplary fuse curves: (a) time-current characteristics [9] and (b) I2t characteristics for different fuse currents (Bussmann/Eaton S505SCH time-delay fuse) [10] ....... 28
Figure 19: Internal structure of mechanical circuit breaker [11] ............................................................... 30
Figure 20: Electromagnetic trip element of MCB as part of RCD [12] ...................................................... 31
Figure 21: Operating principle of SSCB [24] ........................................................................................................ 31
Figure 22: Operating principle of HCB [25] ......................................................................................................... 32
Figure 23: Comparison of DC circuit breaker technologies: (a) device ratings and (b) clearing times of commercial and experimental designs [13], [14], [15], [16], [17], [18], [19], [20], [21], [22], [23], [26], [27], [28], [29], [30], [25], [31], [32], [33], [34], [35], [36], [37], [38], [39], [40], [41], [42], [43], [44], [45] ............................................... 33
Figure 24: Principle of operation of a Type-B RCD [47] ................................................................................. 34
Figure 25: Different fault-clearing strategies for series arc faults and parallel arc faults [49] ...... 35
Figure 26: Summary of recent DC arc-fault detection techniques from literature based on [50]. 36
Figure 27: IT-earthed DC system with active IMD (ISOMETER®) [51] ..................................................... 37
Figure 28: Lightning-induced voltage in a wire as a function of the distance from the strike ....... 37
Figure 29: Primary and secondary overvoltage protection for the example of a building power system [52] ........................................................................................................................................... 38
Figure 30: Thyristor-based crowbar overvoltage protection circuit [53] .............................................. 39
Figure 31: Overvoltage clamping: (a) simple Zener diode, (b) higher current with transistor buffer [53] ............................................................................................................................................. 39
Figure 32: Mounting positions for NTC thermistors as passive ICL devices in a protective circuit [56] ........................................................................................................................................................... 41
Figure 33. Voltage transients related to fault clearing of (a) fault F1 in a low-voltage DC grid, (b) after 1 ms and (c) after 5 ms [59] ................................................................................................ 46

70
Figure 34: (a) Schematic diagram for resonance-based protection (b) results of wavelet transform triggering protection response [62] ..................................................................... 47
Figure 35. Schematic diagram for fast differential protection scheme [63]. ......................................... 48
Figure 36. Schematic diagram showing the use of IEDs for fault location [5]. ...................................... 49
Figure 37. Schematic diagram of a 50-kW distribution demonstrator for Active Impedance Estimation [65] ................................................................................................................................... 50
Figure 38. Schematic diagram for the voltage derivative management [57] ......................................... 51

Flexible Electrical Networks FEN Research CampusFEN GmbH
Campus-Boulevard 7952074 AachenGermany
+49 241 80 [email protected]