FINAL 2008 REGIONAL TRANSPORTATION IMPROVEMENT ...
332
July 2008 401 B Street, Suite 800 • San Diego, CA 92101-4231 • (619) 699-1900 FINAL 2008 REGIONAL TRANSPORTATION IMPROVEMENT PROGRAM
-
Upload
khangminh22 -
Category
Documents
-
view
0 -
download
0
Transcript of FINAL 2008 REGIONAL TRANSPORTATION IMPROVEMENT ...

July 2008
401 B Street, Suite 800 • San Diego, CA 92101-4231 • (619) 699-1900
FINAL 2008
REGIONAL TRANSPORTATION IMPROVEMENT PROGRAM

ii
BOARD OF DIRECTORS
The 18 cities and county government are SANDAG serving as the forum for regional decision-making. SANDAG builds consensus; plans, engineers, and builds public transit; makes strategic plans; obtains and allocates
resources; and provides information on a broad range of topics pertinent to the region’s quality of life.
CHAIR
Hon. Mary Teresa Sessom
FIRST VICE CHAIR
Hon. Lori Holt Pfeiler
SECOND VICE CHAIR
Hon. Jerome Stocks
EXECUTIVE DIRECTOR
Gary L. Gallegos
CITY OF CARLSBAD Hon. Matt Hall, Councilmember (A) Hon. Bud Lewis, Mayor (A) Hon. Ann Kulchin, Mayor Pro Tem CITY OF CHULA VISTA Hon. Cheryl Cox, Mayor (A) Hon. Jerry Rindone, Deputy Mayor (A) Hon. John McCann, Councilmember CITY OF CORONADO Hon. Phil Monroe, Councilmember (A) Hon. Carrie Downey, Mayor Pro Tem (A) Hon. Al Ovrom, Councilmember CITY OF DEL MAR Hon. Crystal Crawford, Deputy Mayor (A) Hon. David Druker, Mayor (A) Hon. Richard Earnest, Councilmember CITY OF EL CAJON Hon. Mark Lewis, Mayor (A) Hon. Jillian Hanson-Cox, Councilmember CITY OF ENCINITAS Hon. Jerome Stocks, Mayor (A) Hon. Teresa Barth, Councilmember CITY OF ESCONDIDO Hon. Lori Holt Pfeiler, Mayor (A) Hon. Ed Gallo, Councilmember (A) Hon. Sam Abed, Mayor Pro Tem CITY OF IMPERIAL BEACH Hon. Jim Janney, Mayor (A) Hon. Patricia McCoy, Mayor Pro Tem (A) Hon. Mayda Winter, Councilmember CITY OF LA MESA Hon. Art Madrid, Mayor (A) Hon. Mark Arapostathis, Councilmember (A) Hon. David Allan, Councilmember CITY OF LEMON GROVE Hon. Mary Teresa Sessom, Mayor (A) Hon. Jerry Jones, Councilmember (A) Hon. Jerry Selby, Mayor Pro Tem CITY OF NATIONAL CITY Hon. Ron Morrison, Mayor (A) Hon. Frank Parra, Vice Mayor (A) Hon. Louie Natividad, Councilmember CITY OF OCEANSIDE Hon. Jim Wood, Mayor (A) Hon. Jerry Kern, Councilmember (A) Hon. Jack Feller, Councilmember CITY OF POWAY Hon. Mickey Cafagna, Mayor (A) Hon. Robert Emery, Deputy Mayor (A) Hon. Don Higginson, Councilmember CITY OF SAN DIEGO Hon. Jerry Sanders, Mayor Hon. Jim Madaffer, Council President Pro Tem (A) Hon. Anthony Young, Councilmember (A) Hon. Scott Peters, Council President (A) Hon. Toni Atkins, Councilmember (A) Hon. Ben Hueso, Councilmember CITY OF SAN MARCOS Hon. Jim Desmond, Mayor (A) Hon. Hal Martin, Vice Mayor (A) Hon. Rebecca Jones, Councilmember
CITY OF SANTEE Hon. Jack Dale, Councilmember (A) Hon. Hal Ryan, Councilmember (A) Hon. John Minto, Councilmember CITY OF SOLANA BEACH Hon. Lesa Heebner, Councilmember (A) Hon. Dave Roberts, Mayor (A) Hon. Mike Nichols, Deputy Mayor CITY OF VISTA Hon. Judy Ritter, Councilmember (A) Hon. Bob Campbell, Councilmember (A) Hon. Steve Gronke, Councilmember COUNTY OF SAN DIEGO Hon. Greg Cox, Chairman (A) Hon. Pam Slater-Price, Chair Pro Tem (A) Hon. Ron Roberts, Supervisor Hon. Dianne Jacob, Vice Chairwoman (A) Hon. Bill Horn, Supervisor IMPERIAL COUNTY (Advisory Member) Hon. Victor Carrillo, Supervisor (A) Hon. David Ouzan, Councilmember CALIFORNIA DEPARTMENT OF TRANSPORTATION (Advisory Member) Will Kempton, Director (A) Pedro Orso-Delgado, District 11 Director METROPOLITAN TRANSIT SYSTEM (Advisory Member) Harry Mathis, Chairman (A) Hon. Jerry Rindone, Vice Chairman (A) Hon. Robert Emery, Chair Pro Tem NORTH COUNTY TRANSIT DISTRICT (Advisory Member) Hon. Ed Gallo, Chairman (A) Hon. Jerome Stocks, Planning Committee Chair (A) Hon. Chris Orlando, Monitoring Committee Chair U.S. DEPARTMENT OF DEFENSE (Advisory Member) CAPT Steve Wirsching, USN, CEC, Southwest Division Naval Facilities Engineering Command (A) CAPT Robert Farley, USN, CEC Southwest Division Naval Facilities Engineering Command SAN DIEGO UNIFIED PORT DISTRICT (Advisory Member) Laurie Black, Commissioner (A) Michael Najera, Commissioner SAN DIEGO COUNTY WATER AUTHORITY (Advisory Member) Marilyn Dailey, Commissioner (A) Mark Muir, Commissioner (A) Gary Croucher, Commissioner SOUTHERN CALIFORNIA TRIBAL CHAIRMEN’S ASSOCIATION (Advisory Member) Chairman Robert Smith (Pala), SCTCA Chair (A) Chairman Allen Lawson (San Pasqual) MEXICO (Advisory Member) Hon. Remedios Gómez-Arnau Cónsul General of Mexico
As of July 16, 2008

iii
TABLE OF CONTENTS
Chapter 1 – EXECUTIVE SUMMARY
Overview ........................................................................................................................................................ 3
Document Organization ................................................................................................................................. 3
Program Summary.......................................................................................................................................... 4
Consistency with the RTP................................................................................................................................ 4
Air Quality Conformity Determination ............................................................................................................ 6
Financial Capacity Assessment ........................................................................................................................ 8
Public Participation ......................................................................................................................................... 8
Status of Projects from the 2006 RTIP............................................................................................................. 9
Chapter 2 – RTIP DEVELOPMENT PROCESS
Federal Transportation Requirements............................................................................................................ 13 Air Quality Conformity............................................................................................................................. 14 Federal Funding Programs ....................................................................................................................... 14 Federal Submittal Requirements............................................................................................................... 15
State Transportation Requirements............................................................................................................... 15 State Transportation Improvement Program............................................................................................. 15
Proposition 1B Highway Safety, Traffic Reduction, Air Quality, and Port Security Bond Act for 2006 .............................................................................................................. 17
State Submittal Requirements.................................................................................................................. 19
TransNet Requirements................................................................................................................................. 19
RTIP Development Process for TransNet ........................................................................................................ 20 Public Participation .................................................................................................................................. 20
RTIP Amendment Process ............................................................................................................................. 20 Administrative Amendments.................................................................................................................... 21 Formal Amendments ............................................................................................................................... 21 Lump Sums.............................................................................................................................................. 22

iv
TABLE OF CONTENTS (CONT'D)
Chapter 3 – PROJECT LISTINGS
Caltrans Highway Projects ............................................................................................................................ 25
Local Agency Projects ................................................................................................................................... 25
Transit Projects ............................................................................................................................................. 26
Other Regional and Miscellaneous Projects ................................................................................................... 26
Federal Funding Requirements...................................................................................................................... 26
Consistency with the RTP.............................................................................................................................. 27
Advance Construction .................................................................................................................................. 27
Chapter 4 – FINANCIAL CAPACITY ANALYSIS
Inflation Assumptions ................................................................................................................................. 159
Expenditures and Revenues Demonstration of Fiscal Constraint .................................................................. 159
Alternative Financing .................................................................................................................................. 160
Program Revenues...................................................................................................................................... 164 Federal Revenues ................................................................................................................................... 164 State Revenues ...................................................................................................................................... 165 Local Revenues ...................................................................................................................................... 166 Other Transportation Program Revenues................................................................................................ 166
TransNet Revenue Estimates ....................................................................................................................... 166
Operations and Maintenance Costs ............................................................................................................ 167 Transit Operating Costs ......................................................................................................................... 167 Highway Costs....................................................................................................................................... 168 Local Streets and Road Costs ................................................................................................................. 168
Chapter 5 – AIR QUALITY CONFORMITY ANALYSIS
Demonstration of Fiscal Constraint ............................................................................................................. 171
Development of Transportation Control Measures...................................................................................... 171
Air Quality Conformity Requirements ......................................................................................................... 172
Quantitative Emissions Analysis................................................................................................................... 174
Emissions Budget Analysis .......................................................................................................................... 174
Conclusion ................................................................................................................................................. 177

v
TABLE OF CONTENTS (CONT'D)
APPENDICES
Appendix A – Public Participation............................................................................................................ 183
Appendix B – Projects Exempt from Air Quality Conformity Determination ............................................. 197
Appendix C – Regional Emissions Analysis and Modeling Procedures ...................................................... 201
Appendix D – Expedited Project Selection Process (EPSP)......................................................................... 229
Appendix E – Non-Carryover Projects from 2006 RTIP ............................................................................ 271
Appendix F – Regional Arterial System (RAS) .......................................................................................... 311
Appendix G – Glossary of Terms and Acronyms ...................................................................................... 323
TABLES
Chapter 1 – EXECUTIVE SUMMARY
Table 1-1 2008 RTIP Program Summary of Major Projects by Mode............................................................ 5
Table 1-2 2008 RTIP – San Diego Region, Transportation Tactics ................................................................ 7
Chapter 4 – FINANCIAL CAPACITY ANALYSIS
Table 4-1a 2008 RTIP – San Diego Region, Revenue Sources .................................................................... 161
Table 4-1b 2008 RTIP – San Diego Region, Total Program ........................................................................ 162
Table 4-1c 2008 RTIP – San Diego Region, Available Balance ................................................................... 163
Table 4-2 TransNet Revenue Forecast, FY 2009-2013 RTIP – San Diego Region ...................................... 167
Table 4-3 Transit Operating Costs and Revenues Forecast....................................................................... 168
Chapter 5 – AIR QUALITY CONFORMITY ANALYSIS
Table 5-1 2008 RTIP – San Diego Region, Transportation Tactics ............................................................ 175
Table 5-2 2008 RTIP and 2030 RTP: Pathways to the Future, Air Quality Conformity Analysis for Eight-Hour Ozone ................................................................................................................... 176
Table 5-3 2008 RTIP and 2030 RTP: Pathways to the Future, Air Quality Conformity Analysis for Carbon Monoxide................................................................................................................... 176
FIGURES
Chapter 2 – RTIP DEVELOPMENT PROCESS
Figure 2-1 State Transportation Fund Allocation Process ......................................................................... 18
Chapter 3 – PROJECT LISTINGS
Figure 3-1 RTIP Project Users Guide......................................................................................................... 28


Chapter 1
EXECUTIVE SUMMARY


3
Chapter 1
EXECUTIVE SUMMARY
OVERVIEW
The 2008 Regional/Federal Transportation Improvement Program (RTIP) is a multi-billion dollar, five-year program of major highway, transit arterial, and nonmotorized projects funded by federal, state, TransNet local sales tax, and other local and private funding covering the years FY 2008/09 to FY 2012/13. The 2008 RTIP, which includes the air quality emissions analysis for all regionally significant projects, requires approval by the Federal Highway Administration (FHWA) and the Federal Transit Administration (FTA).
The 2008 RTIP is a prioritized program designed to implement the region’s overall strategy for providing mobility and improving the efficiency and safety of the transportation system, while reducing transportation-related air pollution in support of efforts to attain federal and state air quality standards for the region. The 2008 RTIP also incrementally implements the Regional Transportation Plan (RTP), the long-range transportation plan for the San Diego region (approved by the SANDAG Board of Directors November 2007).
DOCUMENT ORGANIZATION
This document includes five chapters. This first chapter, the Executive Summary, provides an overview of the document. Chapter 2 describes the RTIP development process, including federal, state, and TransNet transportation programming requirements. Chapter 3 contains the detailed listing of projects. Chapter 4 provides the financial capacity analysis. Chapter 5 describes the air quality conformity analysis.
Also included are a number of appendices: Appendix A describes the SANDAG public participation process, Appendix B lists the projects exempt from air quality conformity review. Appendix C includes the detailed air quality emissions analysis report. Appendix D outlines the Expedited Project Section Process (EPSP) that allows SANDAG to advance the implementation of projects ahead of their programmed dates. Appendix E provides the status of all non-carryover projects from the 2006 RTIP. Appendix F provides the list of Regional Arterial System (RAS) within San Diego based on the approved RTP. Appendix G includes a glossary of acronyms and terms.
The 2008 RTIP also can be found on the SANDAG Web site at www.sandag.org\2008RTIP. This Web page is designed to provide background information, as well as the latest updates to the program. The site is updated regularly to provide the latest information available.

4
PROGRAM SUMMARY
A summary of the major highway, transit, local street and road, and other projects is provided in Table 1-1. The individual project listings have been developed in coordination with the California Department of Transportation (Caltrans), the San Diego Metropolitan Transit System (MTS), the North County Transit District (NCTD), local jurisdictions, other agencies, and various SANDAG working groups.
CONSISTENCY WITH THE RTP
On December 10, 2007, FHWA and FTA issued a finding that the SANDAG 2030 revenue constrained RTP entitled, San Diego 2030 Regional Transportation Plan: Pathways for the Future, was in conformance with federal air quality and planning regulations. The 2008 RTIP is consistent with the 2030 revenue constrained RTP and as a financially constrained document, contains only those major transportation projects listed in the revenue constrained RTP.

5
Table 1-1 2008 RTIP Program
Summary of Major Projects by Mode (in $000s)

6
AIR QUALITY CONFORMITY DETERMINATION
Federal metropolitan planning and air quality regulations prescribe the process for determining air quality conformity. These regulations require that the proposed RTIP: (1) provide for the timely implementation of transportation control measures (TCMs); (2) include a quantitative emissions analysis of projects programmed in the RTIP, including all regionally significant projects; and (3) be within the region’s emissions budgets (targets) included in the approved State Implementation Plan (SIP).
The 2008 RTIP programs substantial funds for the implementation of the four Transportation Tactics adopted in the 1991 Regional Air Quality Strategy (RAQS)/1982 SIP for air quality improvement. These Transportation Tactics also are included as TCMs in the 1982 SIP and have been fully implemented. The Transportation Tactics programmed for implementation total approximately $2.7 billion, or 30.8 percent of the total funds programmed. Included are $23.9 million for Ridesharing, $2.5 billion for Transit Improvements, $82.8 million for Bicycle Facilities and Programs, and $120.3 million for Traffic Flow Improvements. Based upon this analysis, the 2008 RTIP provides for the expeditious implementation of the four Transportation Tactics included in the 1991 RAQS.
A quantitative air quality emissions analysis was conducted for the years 2008, 2010, 2020, and 2030 revenue constrained transportation scenarios, as shown in Chapter 5. The result of these analyses was distributed to San Diego Region Conformity Working Group (CWG) on June 2, 2008, and reviewed by the CWG at its meeting on June 4, 2008. The 2008 RTIP meets the conditions for determining conformity with the applicable SIPs for air quality. A detailed description of the regional emissions analysis and modeling procedures is included in Appendix C. Chapter 5 of this report summarizes the air quality conformity analysis for the 2008 RTIP.

7
Table 1-2 2008 RTIP – San Diego Region (in $000s)
Transportation Tactics

8
FINANCIAL CAPACITY ASSESSMENT
Chapter 4 provides a financial capacity analysis of the major program areas. Based upon this analysis, the projects contained within the 2008 RTIP are reasonable when considering available funding sources.
For non-attainment and maintenance areas, the 2008 RTIP must be a revenue constrained document, with programmed projects based upon committed funding for the first two fiscal years of the RTIP and/or reasonably available for the third fiscal year. Funding assumptions are generally based upon: (1) authorized or appropriated levels of federal and state funding from current legislation; (2) conservative projections of future federal and state funding based upon a continuation of current funding levels; (3) the most current revenue forecasts for the TransNet program; and (4) the planning and programming documents of the local transportation providers.
The projects programmed in the 2008 RTIP are expressed in future dollars. That is, they have been escalated based upon anticipated inflation and other factors to the expected year of obligation. For the State Transportation Improvement Program (STIP) and State Highway Operations and Protection Program (SHOPP) the 2008 Fund Estimate (adopted by CTC in November 2007) assumes a 3 percent escalation rate. For the major TransNet projects, SANDAG has used a 3.6 percent rate, which is a blended rate for both the right-of-way and construction phases based on historical trends. This also rate is consistent with the recently adopted long-range plan.
PUBLIC PARTICIPATION
It is the policy of SANDAG to encourage public participation in the development of agency planning and programming activities. SANDAG has various working groups made up of stakeholders and other members of the public. The public is provided opportunities to participate through comment at SANDAG Board and committee meetings, SANDAG public notices of document availability and public hearings, and through the SANDAG public communications program. Pursuant to 23 U.S.C. 134(i), the draft RTIP was released for public review and comment for a minimum of 30 days and a public hearing was held on July 18, 2008.
Examples of public outreach efforts and ongoing participation include:
Independent Taxpayer Oversight Committee (ITOC): In conformance with 2004 TransNet measure, a citizen advisory committee, the ITOC, oversees projects funded through the TransNet program. As the document through which SANDAG identifies TransNet projects, the RTIP is reviewed by the ITOC, and their comments on the TransNet Program of Projects are conveyed to the SANDAG Transportation Committee, and ultimately, to the Board of Directors.

9
Tribes: In addition to sending out notices to local tribal governments regarding the development of the RTIP, SANDAG actively solicited participation from the 17 tribal governments, along with the Reservation Transportation Authority in San Diego County. SANDAG hosted a tribal forum made up of elected officials from each of the tribes. SANDAG also held a workshop specifically to seek involvement in the regional planning and programming processes.
Public Workshops: SANDAG provided information and sought comments during a special workshop developed for the 2030 San Diego RTP: Pathways for the Future. A total of five workshops were held in various parts of the county. The outreach effort for the RTP included an extensive public involvement program and was conducted as part of the RTP update process. The goal of the program was to secure participation from a broad range of groups and individuals in the RTP development and decision-making process. Activities included a community-based outreach program, updates through the rEgion electronic newsletter, public speaking engagements, among other efforts.
Expansion of Electronic Notifications: In addition to the current list of external industry professionals, SANDAG continually strives to expand the notifications to other citizen-involved working groups.
Appendix A describes the SANDAG public participation process and includes a copy of the latest the Public Participation Policy which contains the section specifically addressing the RTIP development and amendment process.
STATUS OF PROJECTS FROM THE 2006 RTIP
While there were number of regionally significant project completed during the 2006 RTIP, none were over $10 million.


Chapter 2
RTIP DEVELOPMENT PROCESS


13
Chapter 2
RTIP DEVELOPMENT PROCESS
This chapter discusses the federal, state, and TransNet programming requirements and the process used by SANDAG to develop this update. It also describes the process for amendments during this cycle.
FEDERAL TRANSPORTATION REQUIREMENTS
SANDAG is designated by the U.S. Department of Transportation (DOT) and the U.S. Environmental Protection Agency (EPA) as the metropolitan planning organization (MPO) for the San Diego region.
As the MPO, SANDAG must have a continuing, comprehensive, and coordinated transportation planning process in order to receive federal capital or operating funds. The planning process includes the development of: (1) a long-range, 20-year transportation plan describing the policies, strategies, and transportation facility need; and (2) a Federal Transportation Improvement Program (FTIP) covering at least a four-year period. Consistent with these requirements, the SANDAG Board, in November 2007, adopted the 2030 Revenue Constrained RTP: Pathways for the Future, for which Federal Highway Administration (FHWA) and Federal Transportation Administration (FTA) issued a finding of conformity to the 2030 revenue constrained RTP on December 10, 2007. The 2008 Regional Transportation Improvement Program (RTIP) includes five years of project programming. Both the RTP and the RTIP documents fulfill these requirements.
Federal and state regulations identify the development process and required content for the programming document. In general, the RTIP must include all major projects receiving certain categories of federal or state transportation funding which need federal approval, capacity increasing projects, and projects identified as regionally significant. Minor projects that do not significantly increase system capacity are typically categorized as lump-sum minor improvements. The 2008 RTIP also includes the program of projects funded by TransNet, the local transportation sales tax program administered by SANDAG.
Streets & Highways Code Sections 182.6(e) and 182.7(d) require MPOs to submit their Transportation Improvement Programs (TIP) to the state by August 1 on even-numbered years. The projects from all of the regional TIPs and the STIP are combined to form what is referred to as the Federal State Transportation Improvement Program (FSTIP). The current state law requires the state to submit the FSTIP to the FHWA by September 1 on even-numbered years (Government Code Section 65074). Safe, Accountable, Flexible, Efficient Transportation Equity Act: A Legacy for Users (SAFETEA-LU) changed the programming cycle from every two years to every four years. The state law is scheduled to be reviewed so that the TIP update schedule may be revised to no less than every four years.
The 2008 RTIP indicates the region’s priorities for the implementation of transportation projects. It is required to include realistic estimates of project costs and anticipated program revenue. It also must be a financially constrained program. This means that funding must be available and committed to implement the projects listed in this document. The U.S. Environmental Protection Agency (EPA) designated the San Diego air basin

14
as non-attainment for the federal 8-Hour Ozone standard effective June 15, 2004. The air basin was initially classified as a basic non-attainment area under Subpart 1 of the Clean Air Act and the maximum statutory attainment date for the 8-Hour Ozone Standard was set as June 15, 2009. However, EPA is responding to a court decision and is expected to propose that, among other areas of the country, the San Diego basic non-attainment area will be reclassified as a Subpart 2 moderate non-attainment area, with a maximum statutory attainment date of June 15, 2010. Several areas that are tribal lands in eastern San Diego County were excluded from the non-attainment designation. In cooperation with the San Diego Air Pollution Control District (APCD) and SANDAG, the California Air Resources Board (ARB) developed an 8-Hour Ozone Attainment Plan, which was submitted to the U.S. EPA by June 15, 2007. The budgets in the 8-Hour Ozone Attainment Plan for San Diego County were found adequate for transportation conformity purposes by U.S. EPA, effective June 9, 2008.
As a result, all projects in the first two fiscal years must have dedicated funding, and projects in the outyears either must have a firm funding commitment or a reasonable strategy or expectation that funds will be available. In addition, all projects within the 2008 RTIP must be consistent with the RTP.
Air Quality Conformity
The 2008 RTIP must be evaluated for conformity with the State Implementation Plans (SIP) for air quality attainment. The SIP requires that the 2008 RTIP satisfy a number of specific tests to indicate the program will achieve certain air quality emissions reductions and requires the RTIP to implement agreed-upon transportation control measures (Transportation Tactics). Chapter 5 further describes the air quality conformity process.
Federal Funding Programs
SAFETEA-LU provides transportation funding for the five-year period FFY 2005 to 2009. Although the 2008 RTIP begins with the last year of SAFETEA-LU, projects that received federal funding in the current legislation still apply. Additionally, programs which have been allocated under formula basis are assumed to continue beyond the end of SAFETEA-LU.
Surface Transportation Program (STP), including Regional STP (RSTP) and State STP
Congestion Mitigation and Air Quality Program (CMAQ)
Transportation Enhancement (TE) Activities Program
Highway Bridge Program (HBP)
Highway Safety Improvement Program/High Risk Roads Program
Railroad/Highway Grade Crossing Program (Section 130 Rail)
Federal Lands Highway – Indian Reservation Roads (IRR)
Federal Special/Demonstration/High Priority/Borders & Infrastructure Projects
Federal Transit Administration Sections 5307 (Urbanized Formula Grant), 5309 (Fixed Guideway Modification/New Start/Bus/Bus Discretionary Programs), 5316 JARC (Jobs Access Reverse Commute), 5317 (New Freedom/Senior/Disabled), and 5311 (Rural Transit) Programs

15
Federal funding for the RSTP and CMAQ programs is apportioned by the state to the San Diego region by formula. As the MPO, SANDAG is responsible for determining which local projects receive funding under the San Diego region’s share of these two federal funding programs.
RSTP funds can be used for state highway, local street and road, transit, bicycle, traffic signal, and transportation demand management (TDM) projects. CMAQ funds can be used for most categories of transportation projects that improve air quality, such as alternative-fuel transit vehicles, TDM activities, and high occupancy vehicle (HOV) facilities as provided in federal law. CMAQ funds cannot be used for projects that increase the transportation system’s capacity for single-occupant vehicles (SOVs).
Federal Submittal Requirements
Upon adoption by SANDAG, the 2008 RTIP will be submitted to Caltrans for inclusion in the FSTIP. The 2008 RTIP also will be submitted to FHWA, FTA, and EPA for federal approval of the air quality conformity determination. FHWA and FTA approve the RTIP project programming as an element of the FSTIP.
EPA acts as a commenting agency to FHWA and FTA in the RTIP air quality conformity process. The 2008 RTIP may be amended by SANDAG, as needed. However, any revisions that add or modify capacity-increasing, nonexempt projects require an air quality conformity determination. A listing of projects that are typically exempt from the air quality conformity determination is provided in Appendix B.
STATE TRANSPORTATION REQUIREMENTS
In addition to serving as the federal MPO, SANDAG is designated by the state of California as one of 26 Regional Transportation Planning Agencies (RTPA). RTPAs are responsible for implementing state laws regarding transportation planning and funding and to ensure coordinated planning efforts meet both state and federal requirements. The 2008 RTIP is a document which meets both federal and state regulations and includes major projects receiving state transportation funding through the State Transportation Improvement Program (STIP). The California Transportation Commission (CTC) adopted the 2008 STIP in May 2008.
State Transportation Improvement Program
The STIP is the state’s spending plan that includes, in addition to state funding sources, federal TE program funds. Pursuant to SB 45, the STIP is comprised of the Regional Improvement Program (RIP) and the Interregional Improvement Program (IIP). CTC develops the STIP fund estimate that includes the RIP “County Share” and IIP fund allocations. The program is updated every two years and currently covers a five-year period. STIP-funded projects, like all other state and federally funded projects, must be listed in the RTIP in order for the sponsor agencies to access funding. The STIP consists of funds from the Transportation Investment Fund (TIF). as well as from the Public Transportation Account. As illustrated in Figure 2-1, various administrative, operations, and maintenance programs absorb 100 percent of the State Transportation Assistance funds. There are no longer any remaining funds to distribute between the regional and statewide needs.
Seventy-five percent of the STIP funds flow to the regions by formula whereby the regional planning agencies are charged with developing an expenditure plan for the funds. Eligible project types include improvements to state highways, local roads, public transit, intercity rail, pedestrian and bicycle facilities, grade separations,

16
transportation system management, transportation demand management, soundwall projects, intermodal facilities, and safety. The regional share is further divided by 40 percent to the northern half and 60 percent to the southern half of the state.
The remaining 25 percent of the funds flow through the IIP, which is a statewide competitive program administered by Caltrans. Sixty percent (of the 25 percent) is directed to projects that improve interregional transportation, and 40 percent is programmed at the discretion of the CTC, subject to the north/south ratio identified above. Eligible project types include intercity passenger rail, mass transit guideways, grade separations, and state highways.
As the RTPA for the San Diego region, SANDAG is responsible for nominating projects to receive the region’s share of regional STIP (STIP-RIP) funding (as discussed above). These projects in total must be constrained to the “county share or target” funding amount specified in the STIP fund estimate published by the CTC. The California Department of Transportation (Caltrans) is responsible for nominating projects to be funded under the interregional STIP (STIP-IIP) statewide program. The CTC must approve the local projects proposed in the RIP and IIP by including them in the adopted STIP or a STIP amendment in order for these projects to receive funding.
State law requires the CTC to adopt the STIP fund estimate by April of every odd-numbered year. The 2008 STIP Fund Estimate was adopted by CTC in November 2007. The 2008 STIP does not include any new programming capacity apart from a small amount of added federal TE funds, which have limited applicability. Over the years the San Diego region has advanced programming in future years; as a result, there is no new funding identified for the San Diego region. The priority for STIP-funded projects is based on the criteria approved by the SANDAG Transportation Committee at its October 21, 2005, meeting. These criteria include:
Complete projects currently programmed in the STIP
Place particular emphasis on programming and completing TransNet Early Action Program projects
Program projects at the earliest possible time they can be constructed or implemented
Maintain existing STIP funding levels as a minimum on existing programmed projects
Reflect the efforts by the region and Caltrans to complete some of these projects outside the STIP through other funding sources.
For the STIP IIP, Caltrans added environmental and design funds for one new double track project located on the north coast rail corridor: CP Cardiff to CP Craven. All other existing programmed funds were re-programmed in the 2008 STIP; however, the CTC revised the program year, delaying the availability of these funds by one to three years.
Also included in the 2008 STIP are the TE program and the 2008 State Highway Operation and Protection Program (SHOPP). Caltrans develops the SHOPP program which is divided into six project groupings—bridge preservation, collision reduction, mandates, mobility, roadway preservation, and roadside preservation. The TE program previously administered at the local level was folded into the STIP process as part of the 2006 STIP. SANDAG is still responsible for selecting the TE projects and submitting them to Caltrans for project eligibility. Beginning with the 2006 STIP, the TE funds have been programmed for the Pilot Smart Growth Incentive Program for funds received through FY 2011. The region is in the process of prioritizing other projects for funds that are available in FY 2012 and 2013 for approval. Final funding allocation rests with the CTC.

17
Projects funded with STIP and SHOPP are programmed in the 2008 RTIP based on the final CTC STIP adoption.
Proposition 1B Highway Safety, Traffic Reduction, Air Quality, and Port Security Bond Act for 2006
In November 2006, voters approved the general obligation infrastructure bond that is expected to inject $19.9 billion to various existing and new transportation programs. The programs add money for various existing programs such as the STIP, the SHOPP, Local Streets and Roads, and State Transit Assistance. New programs to be funded with these bond proceeds include the Corridor Mobility Improvement Account (CMIA) for congestion relief; the Trade Corridor Improvement Account (TCIF) for port infrastructure, goods movement and security; a revived State and Local Partnership Program (SLPP); Transit Security Grant Program, and others. Some of the programs such as the SLPP require follow-up legislation that will help define the eligibility and administration policies and procedures. While not yet fully known due to the uncertainty in the ultimate language of the follow-up legislation, the San Diego region anticipates receiving approximately $1.4 billion from the various bond programs. Already, the CTC has identified $432 million in CMIA funds: $350 million for the I-15 Managed Lanes (South) project and for the $82 million for the I-805 HOV lanes project between Carroll Canyon Road and the I-5 “Merge” projects. Additionally, $82 million in STIP funds sourced from the bonds have been programmed on the SR 52 Extension project to Santee. The CTC has also identified $400 million for goods movement infrastructure improvements on border, rail and port projects.
In FY 2001, the Governor of California initiated a new, one-time funding program, Traffic Congestion Relief Program (TCRP), in an effort to relieve congestion statewide. The CTC oversees the TCRP which is included in the adopted Fund Estimate; however the status of TCRP-funded projects remains uncertain as the state faces significant budget deficits and competing unmet needs. The 2008 RTIP reflects the TCRP funds in the year of anticipated allocation for the four remaining corridors (Pacific Surfliner, SR 94, SR 94/SR 125 Interchange and I-5/Virginia Avenue Re-alignment).

18
Figure 2-1 State Transportation Fund Allocation Process
STATE HIGHWAY ACCOUNT
(State & Federal Funds)
70% 30%
Non-STIP Projects
SHOPP: Maintenance/Operations Rehabilitation/Safety
Administration
Local Assistance
Support Engineering
Other
STIP Projects
Highways
Transit
Local Projects
Support/Engineering
75% 25%
Regional Improvement Program (RIP)
Interregional
Improvement Program (IIP)
40% 60% 60% 40%
North Counties
South Counties
Interregional Program
State
Discretionary Program
SANDAG Share
(Approximately 7.3% of total RIP)
19
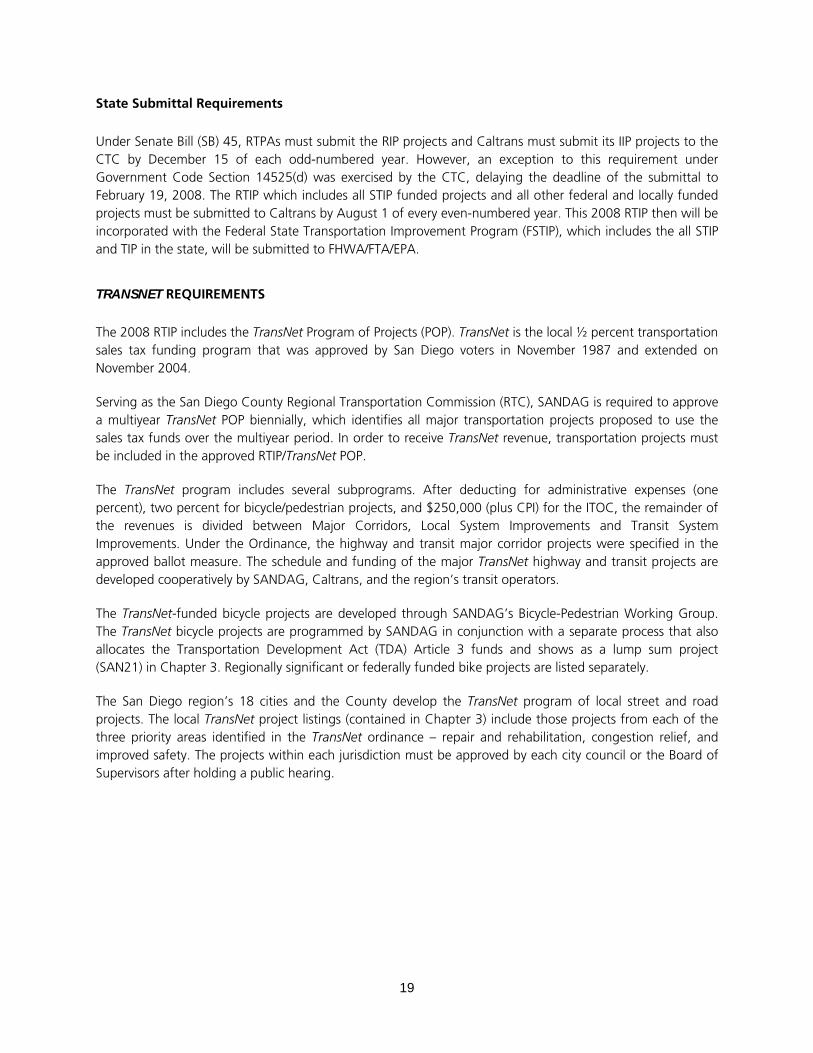
State Submittal Requirements
Under Senate Bill (SB) 45, RTPAs must submit the RIP projects and Caltrans must submit its IIP projects to the CTC by December 15 of each odd-numbered year. However, an exception to this requirement under Government Code Section 14525(d) was exercised by the CTC, delaying the deadline of the submittal to February 19, 2008. The RTIP which includes all STIP funded projects and all other federal and locally funded projects must be submitted to Caltrans by August 1 of every even-numbered year. This 2008 RTIP then will be incorporated with the Federal State Transportation Improvement Program (FSTIP), which includes the all STIP and TIP in the state, will be submitted to FHWA/FTA/EPA.
TRANSNET REQUIREMENTS
The 2008 RTIP includes the TransNet Program of Projects (POP). TransNet is the local ½ percent transportation sales tax funding program that was approved by San Diego voters in November 1987 and extended on November 2004.
Serving as the San Diego County Regional Transportation Commission (RTC), SANDAG is required to approve a multiyear TransNet POP biennially, which identifies all major transportation projects proposed to use the sales tax funds over the multiyear period. In order to receive TransNet revenue, transportation projects must be included in the approved RTIP/TransNet POP.
The TransNet program includes several subprograms. After deducting for administrative expenses (one percent), two percent for bicycle/pedestrian projects, and $250,000 (plus CPI) for the ITOC, the remainder of the revenues is divided between Major Corridors, Local System Improvements and Transit System Improvements. Under the Ordinance, the highway and transit major corridor projects were specified in the approved ballot measure. The schedule and funding of the major TransNet highway and transit projects are developed cooperatively by SANDAG, Caltrans, and the region’s transit operators.
The TransNet-funded bicycle projects are developed through SANDAG’s Bicycle-Pedestrian Working Group. The TransNet bicycle projects are programmed by SANDAG in conjunction with a separate process that also allocates the Transportation Development Act (TDA) Article 3 funds and shows as a lump sum project (SAN21) in Chapter 3. Regionally significant or federally funded bike projects are listed separately.
The San Diego region’s 18 cities and the County develop the TransNet program of local street and road projects. The local TransNet project listings (contained in Chapter 3) include those projects from each of the three priority areas identified in the TransNet ordinance – repair and rehabilitation, congestion relief, and improved safety. The projects within each jurisdiction must be approved by each city council or the Board of Supervisors after holding a public hearing.

20
RTIP DEVELOPMENT PROCESS FOR TRANSNET
Designated as the region’s MPO and RTPA and as the San Diego County Regional Transportation Commission (RTC), SANDAG has the overall responsibility for developing the required RTIP document. In a memo dated January 8, 2008, SANDAG requested that project sponsors review and update the projects for submittal for inclusion into the 2008 RTIP. The individual project listings (included in Chapter 3) have been submitted by the project sponsors and reviewed for compliance by SANDAG.
The 2008 RTIP has been prepared with input and cooperation from Caltrans, the cities and county, the region’s transit operators, and the SANDAG Transportation Committee, as well as other technical and advisory working groups.
Public Participation
SANDAG has provided ample opportunity for community involvement and interagency consultation in the development of the 2008 RTIP, and the SANDAG public participation process provides opportunity for public review and comment on the draft document prior to its adoption. Opportunities for community involvement and interagency consultation on the transportation projects included in the 2008 RTIP have been provided through public meetings of the various SANDAG committees and working groups that are responsible for the development and oversight of the projects. These committees include the Transportation Committee, Cities/County Transportation Advisory Committee (CTAC), Bicycle-Pedestrian Working Group, Stakeholders Working Group, and San Diego Region Conformity Working Group. In addition, SANDAG held a transportation workshop with the 17 tribal governments along with the Reservation Transportation Authority in San Diego County, as well as conducted a workshop for the tribal nations. In addition, SANDAG conducted five workshops throughout the county for the Regional Transportation Plan (RTP), which included information about the TIP.
At its June 20, 2008, meeting the SANDAG Transportation Committee accepted the draft 2008 RTIP including its conformity determination, as well as the conformity re-determination of the 2030 San Diego RTP: Pathways for the Future, for distribution and public comment. The Transportation Committee held a public hearing on the draft 2008 RTIP at its meeting on July 18, 2008. There were no public speakers related to the 2008 RTIP and there were no significant comments raised at the meeting. The progress of the 2008 RTIP and any actions taken were continuously updated throughout the TIP development via the RTIP web page – www.sandag.org/2008RTIP. The SANDAG Board at its meeting on July 25, 2008 adopted the 2008 RTIP..
RTIP AMENDMENT PROCESS
On occasion, circumstances may dictate changes to the current RTIP. Federal regulations allow changes or amendments if the procedures are consistent with federal requirements. SANDAG will consider such amendments when the circumstances prompting the amendments are compelling and when the changes will not adversely affect air quality conformity or financial constraint of the TIP. The proposed changes to projects also must be consistent with the rules of the particular funding program.
There are two types of amendments, formal and administrative, described in detail below. SANDAG will process formal amendments on a quarterly basis and administrative amendments on an as-needed basis. There are ongoing discussions regarding the two different types of amendments at the statewide level. Until

21
the formal guidance is finalized and approved for implementation, below are the qualifications for the two types of amendments that SANDAG processes. Both the 2008 RTIP and any amendment requests during the 2008 RTIP cycle must include the sponsor’s governing board/council approval.
Administrative Amendments
Administrative amendments require the approval of the SANDAG Transportation Committee and the state but do not require federal approval. Federal agencies will be notified of the amendments for informational purposes. Project requests that fall within the following criteria can be administratively amended:
Revise a project description which does not change the scope of the project or is in conflict with the project environmental document, and wherein the project does not affect air quality or the timely implementation of TCMs nor impact the financial constraint;
Revise the funding amount up to 20 percent of the project cost or $2 million, whichever is less;
Change the funding source;
Change a project lead agency;
Split or combine individually listed projects as long as cost, schedule, and scope remain unchanged;
Change required information for grouped project (lump sum) listings; or
Add or delete projects from grouped project (lump sum) listings as long as the funding amount stays within the guidelines indicated above.
Administrative amendments require an action by the SANDAG Transportation Committee and Caltrans. Caltrans will notify the MPO, FHWA, and FTA of the approval. This streamlined approach helps expedites the approval process.
Formal Amendments
Project requests that do not meet the above criteria for administrative amendments will require formal amendments. Below are some, but not all, of the reasons for formal amendments:
The request would add or delete a new federally or state-funded project or add or delete an existing federally or state-funded project;
The request would shift funds from the fifth year (i.e., FY 2013) to the quadrennial element (i.e., FY 2009 through FY 2012), or vice versa;
The request would affect air quality conformity or the timely implementation of TCMs;
The request would require additional air quality emissions analysis and/or a new finding of air quality conformity;
The request would impact the financial constraint of the RTIP; or
The request would result in major changes in scope, design, and concept.

22
Formal amendments require an action by the SANDAG Transportation Committee, Caltrans, FHWA, FTA, and EPA. Formal amendments will be processed on the quarterly basis. Due to the lengthy process involved in determining air quality conformity, amendment requests for regionally significant capacity increasing projects requiring new emissions analysis will be scheduled on an as-needed basis (not quarterly).
Lump Sums
Lump sum line items are grouped projects under a specified work type (projects must be exempt from air quality conformity). The purpose of lump sums is to provide flexibility where the individual implementation priorities are unclear. Examples of lump sums include:
Railroad crossing projects (non-capacity increasing)
Transportation Enhancement (TE)
Highway Safety Program
Shoulder improvements
Traffic control devices
Adding medians
Lighting improvements
Bike and pedestrian facilities
Intersection channelization
Interchange reconfiguration
Emergency repair program
Transportation System Management
Seismic retrofit
Minor safety and hazard projects
Pavement rehabilitation
Bridge replacement and retrofit.
For each lump sum listing in the RTIP, SANDAG maintains a list of projects that comprise of the lump sum projects which is available for review upon request.

Chapter 3
PROJECT LISTINGS


25
Chapter 3
PROJECT LISTINGS
This chapter contains the individual project listings for those major highway, transit, local street and road, and non-motorized projects and programs proposed to use federal, state, TransNet, and other local funding. The listings are grouped by project sponsors in alphabetical order. The listings include descriptive material (i.e., type of work, termini, length, etc.), the anticipated federal, state and local revenue sources, and the fiscal year of proposed work (see Figure 3-1).
Federally funded, discretionary projects are based on listings from SAFETEA-LU. Programming levels for formula programs such as Federal Transit Administration (FTA) Urbanized Area Formula, Fixed Guideway, Jobs Access and New Freedom are based on the UZA estimate as provided in SAFETEA-LU. Caltrans provided the estimated revenues for the Regional Surface Transportation Program (RSTP) and Congestion Mitigation and Air Quality (CMAQ) programs. Also included are projects funded by the STIP, SHOPP, Proposition. 1B, Traffic Congestion Relief Program (TCRP), the TransNet local sales tax program (including short- and long-term borrowings), other local funding, and private sources.
CALTRANS HIGHWAY PROJECTS
Caltrans is the project sponsor for most of the highway projects. Senate Bill 45 requires that projects in the STIP be programmed in six categories—(1) project development, (2) design, (3) construction engineering, (4) right-of-way capital, (5) right-of-way support, and (6) construction capital—to allow CTC to monitor the projects by these phases; however, for purposes of the SANDAG RTIP, projects are shown by fiscal year and three phases, preliminary engineering, right-of-way and construction, which provides enough detailed information for regional programming purposes
Several highway programs are identified in the Caltrans listing as lump-sum line items. These state administered lump-sum programs such as Highway Bridge Program (HBP), SHOPP programs, and Highway Safety Program (among others) are identified by Caltrans’ headquarters office and implemented by the local Caltrans’ district offices. All lump sum listed projects are exempt for purposes of air quality. The list of individual projects that make up the lump sum is available upon request.
LOCAL AGENCY PROJECTS
The 18 cities and the County of San Diego are the project sponsors for the local agency projects included in this chapter. The local agency listings, organized alphabetically by jurisdiction and by their MPO identification number, generally consist of regional arterial, local street and road, bicycle, and traffic signal improvement projects. The local agency projects include those funded by federal and state, TransNet, and local funding programs.

26
TRANSIT PROJECTS
Senate Bill 1703 consolidated the planning functions between SANDAG, the San Diego Metropolitan Transit Development Board (MTDB), and the North San Diego County Transit Development Board (NCTD) effective July 2003. As a result, major regionally significant transit projects are being implemented by SANDAG with minor capital projects and operations continuing under NCTD and the Metropolitan Transit System (MTS, formally MTDB). There remains one major transit project, the SPRINTER Light Rail project, still programmed under NCTD that was not transferred for SANDAG implementation under SB 1703. For all of these projects, costs and revenues are listed by fiscal year for each project phase or for the total project.
The sources of federal assistance for transit include Federal Transit Administration (FTA) Section 5307, Section 5309 (Fixed Guideway Modernization, New Starts, and Bus Discretionary), 5310, 5311, 5316, 5317 funds and CMAQ funds. Other transit projects included are those funded through the STIP, the state Transportation Development Act (TDA), State Transit Assistance, (STA), Prop. 1B, and the TransNet programs.
OTHER REGIONAL AND MISCELLANEOUS PROJECTS
SANDAG also is the project sponsor for other regional projects. The listing includes the Regional Transportation Demand Management (TDM) program (one of the identified Transportation Tactics), the Freeway Service Patrol (FSP) program, the I-15 Managed Lane Value Pricing project, and Intelligent Transportation System (ITS) projects.
Other project listings are included for project sponsors not members of SANDAG that have transportation projects within the San Diego region. These include the Bureau of Indian Affairs, the Transportation Corridor Agencies, San Dieguito River Park, and other requesting agencies.
FEDERAL FUNDING REQUIREMENTS
The federal revenue sources shown in this chapter are identified either by specific federal fund category (e.g., RSTP, CMAQ) or by the STIP and SHOPP funding programs. The specific federal fund categories and federal eligibility for the specific projects funded under the STIP and SHOPP are determined by Caltrans as part of a statewide fund management activity.
The STIP and SHOPP projects listed in this chapter must include any required non-federal matching funds. In general, Caltrans provides the non-federal matching funds for STIP state highway projects, and local agencies provide the non-federal matching funds for local street and road projects.
In order to receive federal funding, projects listed in this chapter must provide a minimum non-federal local match depending on type of federal funds. The federal participation rates range from 80 percent (FTA, High Priority, etc.) to 91.57 percent (Interstate Highway Maintenance).
Full 100 percent federal funding is applicable for projects such as traffic control signalization, pavement marking, carpooling and vanpooling, installation of traffic signs, traffic lights, guardrails, impact attenuators, concrete barrier end treatments, break-away utility poles, and priority control system projects.
Appendix E includes a list of projects from the previous RTIP for those projects that were not carried over into the RTIP. The status for each project is indicated by a watermark. “Completed” indicates the project has

27
opened to traffic or has begun construction. ”Delayed” indicates that the project is ongoing, but no new funding has been identified for the RTIP period or the agency has determined other priority projects to fund and may be brought back. “Deleted” indicates that the agency has decided to no longer pursue the project. “Split/Combine” indicates that one project has either split into several projects (as project scope has been refined), or two or more projects were combined into one project (they may share funding, linkage in scope, and environmental document). With this appendix, every project from the previous RTIP is accounted for and provides a complete picture of the projects’ status.
CONSISTENCY WITH THE RTP
In order to illustrate the level of consistency between the RTP and the RTIP and to provide additional information for each project, the individual project listing in the following pages provide the RTP page number for those regionally significant projects, the estimated total project cost should the project completion date falls outside of the RTIP years, the Caltrans EA and PPNO numbers, and the federal earmark numbers. The TIP User Guide (Figure 3-1) points to the various sources of information provided for each project.
ADVANCE CONSTRUCTION
For some of the major projects as well as projects funded with federal funds included in SAFETEA-LU, agencies programmed future funds using Advanced Construction (AC). Using the AC fund source allows agencies to front local or state funds in order to fully fund a phase or to advance the project with the anticipation of a future reimbursement once the federal funds become available. In order to provide an accurate project cost, the AC funds are shown as a negative number in the future reimbursement years while the federal funds are shown as ‘Conversion.’

28
Figure 3-1 RTIP Project Users Guide
MPO ID RTIP project number
Capacity Status indicates whether a project will increase system capacity (CI) or not (NCI); important for regional air quality
RTIP # Latest approved RTIP version
Title name of the proejct
CR/Maint Congestion Relief (CR) or Maintenance (Maint) refers to requirement for Local Street Improvement (LSI)
funding only
Description project information including location, limits, and scope
EA No: unique number assigned by Caltrans in which Caltrans is either the lead agency or providing oversight
PPNO No.: unique number assigned by Caltrans in which Caltrans is the lead agency
RTP Page No.: in order to show consistency between the plan and the program, provides the RTP page number for
reference – only applies to regionally significant projects
SANDAG ID: SANDAG capital project or OWP number; provides reference to the SANDAG budget
Earmark No.: federal legislative number
RAS Regional Arterial System (RTP page number – see Appendix F)
Est. Total Cost sometimes the total program is less than the estimated total project cost because the project continues
beyond the RTIP cycle years; total should be consistent with the RTP
MPO ID: CAPACITY STATUS: RTIP #
TITLE: (CR/Maint)
DESCRIPTION:
EA No PPNO No
RTP Page No. SANDAG ID:
Earmark No. Est Total Cost
RAS
FUND TYPE TOTAL PRIOR 06/07 07/08 08/09 09/10 10/11 PE RW CON
TOTAL
type of funds committed to the project. See fund type acronym at end of project listings
funds programmed prior to current RTIP cycle, provides insight into the total programmed to date
Total programmed
fiscal years covered by this RTIP cycle
phase by fund type (see Appendix G)

Table 1
San Diego Region (in $000s)2008 Regional Transportation Improvement Program
MPO ID:TITLE:
CAL09Interstate 5 - HOV Managed Lanes
Caltrans
Capacity Status: CI 08-00RTIP #:
From La Jolla Village Dr. to Harbor Dr. - construct HOV/Managed Lanes on I-5 undercrossingDESCRIPTION:
EST TOTAL COST:EA NO: 235800 PPNO: 0615
RTP PAGE NO: A-5 SANDAG ID: 1200501
$50,677
CONRWPEPRIORTOTAL 08/09 09/10 10/11 11/12 12/13
CBI $500 $500 $500
IM $4,000 $4,000 $4,000
RSTP $18,599 $18,599 $18,599
STIP-RIP NHS $1,831 $1,831 $1,831
STIP-RIP State Cash $628 $628 $628
STP $2,000 $2,000 $2,000
TransNet - MC $23,119 $13,803 $9,316 $7,624 $15,495
TOTAL $50,677 $41,361 $9,316 $35,182 $15,495
MPO ID:TITLE:
CAL09AI-5 Lomas Santa Fe Interchange/HOV
lanes
Capacity Status: CI 08-00RTIP #:
From Via De La Valle to San Elijo Lagoon - construct interchange and HOV LaneDESCRIPTION:
EST TOTAL COST:EA NO: 2358U PPNO: 0701
RTP PAGE NO: A-5 SANDAG ID: 1200502
$61,716
CONRWPEPRIORTOTAL 08/09 09/10 10/11 11/12 12/13
Corridor Mobility Program $24,500 $24,500 $24,500
TCRP $6,000 $6,000 $6,000
TransNet - MC $31,216 $13,705 $17,511 $1,461 $29,755
TOTAL $61,716 $44,205 $17,511 $1,461 $60,255
MPO ID:TITLE:
CAL09CI-805 Direct Access Ramp and HOV
at Carroll Canyon
Capacity Status: CI 08-00RTIP #:
From Carroll Canyon Road to Interstate 5 - On I-805, construction of Direct Access Ramps (DARs) and
HOV to Carroll Canyon Road
DESCRIPTION:
EST TOTAL COST:EA NO: 2T040 PPNO: 0716
RTP PAGE NO: A-5, A22, A-39 SANDAG ID: 1280505
RAS (TA 9-5)
$102,000
CONRWPEPRIORTOTAL 08/09 09/10 10/11 11/12 12/13
Corridor Mobility Program $57,500 $57,500 $57,500
Local Funds $11,700 $2,000 $9,700 $2,000 $9,700
TransNet - MC $32,800 $6,900 $5,800 $20,100 $10,800 $1,900 $20,100
TOTAL $102,000 $6,900 $7,800 $87,300 $10,800 $3,900 $87,300
1Page Wednesday, July 23, 2008
29

San Diego Region (in $000s)2008 Regional Transportation Improvement Program
MPO ID:TITLE:
CAL18I-15 Managed Lanes (Middle)
Caltrans
Capacity Status: CI 08-00RTIP #:
From SR56 to Centre City Pkwy - construct managed lanes including 3 direct access rampsDESCRIPTION:
EST TOTAL COST:EA NO: 064811 PPNO: 0672
RTP PAGE NO: A-5 SANDAG ID: 1201502
EARMARK NO: CA707, 3783
$430,230
CONRWPEPRIORTOTAL 08/09 09/10 10/11 11/12 12/13
CMAQ $35,586 $35,586 $974 $34,612
DEMO - Sec 115 $1,000 $1,000 $1,000
HPP $4,000 $4,000 $4,000
HPP Conversion $1,000 $1,000 $1,000
Local Funds $15,810 $15,810 $15,810
RSTP $57,153 $57,153 $57,153
SHOPP - State Cash $4,136 $4,136 $4,136
STIP-IIP NHS $36,032 $36,032 $36,032
STIP-IIP NHS GARVEE $49,250 $49,250 $49,250
STIP-IIP State Cash $4,668 $4,668 $4,668
STIP-RIP NHS $3,984 $3,984 $3,984
STIP-RIP NHS GARVEE $147,750 $147,750 $147,750
STIP-RIP State Cash $516 $516 $516
TCRP $64,300 $64,300 $24,963 $9,337 $30,000
TransNet - MC $5,045 $2,438 $1,900 $267 $220 $220 $1,000 $126 $3,919
TransNet - MC AC $1,000 $(1,000)
TOTAL $430,230 $427,623 $1,900 $267 $220 $220 $30,463 $10,437 $389,330
MPO ID:TITLE:
CAL18AI-15 Managed Lanes-North Segment
Capacity Status: CI 08-00RTIP #:
From Clarence Lane to SR 78 - construct managed lanesDESCRIPTION:
EST TOTAL COST:EA NO: 081001 PPNO: 0672F
RTP PAGE NO: A-5 SANDAG ID: 1201503
$223,489
CONRWPEPRIORTOTAL 08/09 09/10 10/11 11/12 12/13
CMAQ $14,112 $11,725 $2,387 $4,050 $5,432 $4,630
CMAQ - Conversion $67,798 $20,942 $21,202 $25,654 $67,798
RSTP $33,086 $33,086 $1,505 $31,581
RSTP - Conversion $28,905 $2,591 $24,740 $1,574 $28,905
STIP-RIP NHS $4,426 $4,426 $4,426
STIP-RIP State Cash $574 $574 $574
TransNet - MC $74,588 $17,318 $9,746 $7,792 $8,161 $31,571 $14,267 $704 $59,617
TransNet - MC AC $96,703 $(23,533) $(45,942) $(27,228)
TOTAL $223,489 $163,832 $12,133 $7,792 $8,161 $31,571 $24,822 $6,136 $192,531
Additional $25M is programmed under CAL91*
2Page Wednesday, July 23, 2008
30

San Diego Region (in $000s)2008 Regional Transportation Improvement Program
MPO ID:TITLE:
CAL18BI-15 Managed Lanes- South Segment
Caltrans
Capacity Status: CI 08-00RTIP #:
From SR 163 to 15/56 Separation - construct managed lanes, south segment including Direct Access
Ramps; construct auxiliary lane along northbound I-15 from Pomerado Rd. over crossing to Carroll Canyon
Rd. over crossing
DESCRIPTION:
EST TOTAL COST:EA NO: 081501 PPNO: 0672G
RTP PAGE NO: A-5 SANDAG ID: 1201501
$481,324
CONRWPEPRIORTOTAL 08/09 09/10 10/11 11/12 12/13
CMAQ $11,744 $11,744 $11,744
Corridor Mobility Program $350,000 $350,000 $350,000
STIP-RIP NHS $8,853 $8,853 $8,853
STIP-RIP State Cash $51,147 $1,147 $50,000 $1,147 $50,000
TransNet - MC $59,580 $32,901 $5,661 $17,526 $2,796 $348 $348 $40,256 $19,324
TOTAL $481,324 $404,645 $5,661 $17,526 $52,796 $348 $348 $62,000 $19,324 $400,000
Funding shown in FY 2012 and FY 2013 is for administrative close out of the project*
MPO ID:TITLE:
CAL26State Route 52 Freeway (E&F)
Capacity Status: CI 08-00RTIP #:
From SR 125 to Cuyamaca Street to SR 67 - construct 4 lane freewayDESCRIPTION:
EST TOTAL COST:EA NO: 010611 PPNO: 0260
RTP PAGE NO: A-5 SANDAG ID: 1205203
EARMARK NO: HPP 1134/2735, CA424/604
$599,500
CONRWPEPRIORTOTAL 08/09 09/10 10/11 11/12 12/13
DEMO $2,250 $2,250 $2,250
HPP $6,000 $6,000 $6,000
HPP Conversion $4,000 $2,000 $2,000 $4,000
RSTP $47,330 $22,438 $24,892 $22,438 $24,892
RSTP - Conversion $45,101 $2,555 $25,146 $17,400 $45,101
STIP-IIP NHS $3,010 $3,010 $2,125 $885
STIP-IIP State Cash $5,355 $5,355 $4,732 $623
STIP-RIP NHS $26,558 $26,558 $5,848 $20,710
STIP-RIP Prior NHS $16,375 $16,375 $16,375
STIP-RIP Prior State Cash $802 $802 $802
STIP-RIP State Cash $218,791 $218,791 $11,140 $26,205 $181,446
TCRP $45,000 $45,000 $45,000
TCSP $1,000 $1,000 $1,000
TransNet - H $44,340 $44,340 $671 $43,669
TransNet - MC $132,542 $67,847 $4,636 $14,675 $41,190 $2,097 $2,097 $9,960 $54,176 $68,406
TransNet - MC AC $45,101 $(2,555) $(25,146) $(17,400)
TOTAL $598,454 $506,867 $31,528 $14,675 $41,190 $2,097 $2,097 $34,476 $234,133 $329,845
Additional local funds will be programmed in FY2014 at which time total project programmed will equal total project cost*
3Page Wednesday, July 23, 2008
31

San Diego Region (in $000s)2008 Regional Transportation Improvement Program
MPO ID:TITLE:
CAL26BSR 52 Auxiliary Lanes and Inside
Widening
Caltrans
Capacity Status: CI 08-00RTIP #:
From SR 52/I-15 to Mast Blvd. Undercrossing (7.4/13.3), from Mast Blvd. Undercrossing to SR 52/SR 125
separation(13.3/14.9) - Phase 1, construct eastbound and westbound auxiliary lanes; Phase 2, add one
mixed flow lane in each direction, widen two structures and install a ramp meter at Mission Gorge Road
(PE only)
DESCRIPTION:
EST TOTAL COST:EA NO: 267300
RTP PAGE NO: A-5 SANDAG ID: 1205202
$62,369
CONRWPEPRIORTOTAL 08/09 09/10 10/11 11/12 12/13
Local Funds $1,000 $1,000 $1,000
SHOPP - State Cash $2,000 $2,000 $2,000
TransNet - MC $59,369 $23,399 $22,119 $13,851 $8,234 $110 $51,025
TOTAL $62,369 $26,399 $22,119 $13,851 $11,234 $110 $51,025
MPO ID:TITLE:
CAL29SR 76 Middle
Capacity Status: CI 08-00RTIP #:
From Melrose Dr. to So. Mission Rd. - widen from 2 to 4 lanesDESCRIPTION:
EST TOTAL COST:EA NO: 08010 PPNO: 0759
RTP PAGE NO: A-6 SANDAG ID: 1207602
EARMARK NO: CA603/2719
$88,711
CONRWPEPRIORTOTAL 08/09 09/10 10/11 11/12 12/13
DEMO - TEA 21 $5,519 $5,519 $1,560 $3,959
HPP $4,000 $4,000 $4,000
RSTP $6,285 $6,285 $6,285
STP $1,000 $1,000 $1,000
TransNet - MC $71,907 $28,168 $3,174 $32,727 $7,838 $12,434 $59,473
TOTAL $88,711 $35,453 $12,693 $32,727 $7,838 $21,279 $67,432
MPO ID:TITLE:
CAL29BSR 76 East
Capacity Status: CI 08-00RTIP #:
From Mission Rd. to I-15 - widen from 2 to 4 lanesDESCRIPTION:
EST TOTAL COST:EA NO: 25711
RTP PAGE NO: A-6 SANDAG ID: 1207606
$241,610
CONRWPEPRIORTOTAL 08/09 09/10 10/11 11/12 12/13
RSTP $3,166 $3,166 $3,166
RSTP - Conversion $48,452 $2,178 $2,092 $12,582 $31,600 $4,270 $44,182
TransNet - MC $33,354 $3,309 $2,757 $1,556 $1,270 $13,607 $10,855 $16,536 $16,818
TransNet - MC AC $2,092 $(2,092) $44,182 $(12,582) $(31,600)
TOTAL $84,972 $10,745 $2,757 $1,556 $45,452 $13,607 $10,855 $23,972 $61,000
Project completion outside of programming cycle*
4Page Wednesday, July 23, 2008
32

San Diego Region (in $000s)2008 Regional Transportation Improvement Program
MPO ID:TITLE:
CAL31SR 125 (Toll, Gap, Connector)
Caltrans
Capacity Status: CI 08-00RTIP #:
From SR 905 to SR 54 - construct 4-lane facility and 6-lane freeway with interchange and HOV provisionsDESCRIPTION:
EST TOTAL COST:EA NO: 00300
RTP PAGE NO: A-6
$477,244
CONRWPEPRIORTOTAL 08/09 09/10 10/11 11/12 12/13
Local Funds $332,946 $332,946 $24,850 $40,075 $268,021
RSTP $121,702 $121,702 $29,116 $92,586
TransNet - H $22,596 $21,403 $1,193 $2,103 $20,493
TOTAL $477,244 $476,051 $1,193 $24,850 $71,294 $381,100
MPO ID:TITLE:
CAL38SR-905 New Freeway
Capacity Status: CI 08-00RTIP #:
From I-805 to Otay Mesa Port of Entry - construct 6-lane freeway (Phase 1)DESCRIPTION:
EST TOTAL COST:EA NO: 093160 PPNO: 0374K
RTP PAGE NO: A-6
EARMARK NO: HPP 2813, CA612
$450,500
CONRWPEPRIORTOTAL 08/09 09/10 10/11 11/12 12/13
CBI $105,342 $93,639 $11,703 $105,342
DEMO - Sec 115 $3,000 $3,000 $3,000
DEMO - TEA 21 $40,485 $40,485 $40,485
HPP $12,000 $9,600 $2,400 $500 $11,500
STIP-IIP Interstate $100,666 $100,666 $12,944 $28,087 $59,635
STIP-IIP Prior NHS $6,406 $6,406 $1,976 $4 $4,426
STIP-IIP Prior State Cash $12,966 $12,966 $7,000 $5,966
STIP-IIP State Cash $23,296 $23,296 $1,933 $9,176 $12,187
STIP-RIP Interstate $20,974 $20,974 $11,912 $9,062
STP $1,000 $1,000 $1,000
STP - Sec 117 $1,000 $1,000 $1,000
TCRP $23,365 $23,365 $23,365
Trade Corridor Program $91,605 $91,605 $91,605
TransNet - Border $8,395 $8,395 $8,395
TOTAL $450,500 $336,397 $114,103 $24,353 $229,337 $196,810
MPO ID:TITLE:
CAL42AEmergency Repair Program
Capacity Status: NCI 08-00RTIP #:Other - Damage repair caused by unusual disastersExempt Category:
At various locations - state highway projects to repair damage caused by natural disasters, civil unrest, or
terrorist acts
DESCRIPTION:
EST TOTAL COST: $150
CONRWPEPRIORTOTAL 08/09 09/10 10/11 11/12 12/13
SHOPP Emergency Repair $150 $100 $50 $150
TOTAL $150 $100 $50 $150
5Page Wednesday, July 23, 2008
33

San Diego Region (in $000s)2008 Regional Transportation Improvement Program
MPO ID:TITLE:
CAL44Highway Bridge Program
Caltrans
Capacity Status: NCI 08-00RTIP #:Safety - Non capacity widening or bridge reconstructionExempt Category:
Countywide - lump sum to replace and/or rehabilitate bridges; projects are exempt pursuant to 40 CFR
Parts 51 & 93 of the Transportation Conformity Rule, as amended
DESCRIPTION:
EST TOTAL COST: $153,656
CONRWPEPRIORTOTAL 08/09 09/10 10/11 11/12 12/13
HBP $57,480 $27,656 $9,794 $27 $20,003 $57,480
HBRR $7,988 $7,988 $7,988
Local Bridge Seismic Retrofit Account $4,437 $1,922 $698 $1,817 $4,437
Local Funds $6,247 $3,854 $1,044 $571 $3 $775 $6,247
Local Funds AC $8,056 $8,056 $8,056
SHOPP - State Cash $1,233 $1,233 $1,233
TOTAL $85,441 $41,420 $10,333 $11,063 $30 $22,595 $1,233 $84,208
As transmitted by Caltrans, total program is $154M which goes beyond the current RTIP cycle (including the AC conversion)*
MPO ID:TITLE:
CAL46ASHOPP Mobility
Capacity Status: NCI 08-00RTIP #:Safety - Non signalization traffic control and operatngExempt Category:
Countywide - lump sum for SHOPP mobility projects including operational improvements, transportation
management systems, weigh station, WIM, and 'Go California' projects
DESCRIPTION:
EST TOTAL COST: $53,824
CONRWPEPRIORTOTAL 08/09 09/10 10/11 11/12 12/13
CBI $1,200 $1,200 $1,200
SHOPP (AC) $26,342 $11,509 $9,876 $4,957 $4,957 $21,385
SHOPP - State Cash $5,619 $3,696 $1,280 $643 $949 $4 $4,666
SHOPP Augmentation - Mobility $8,350 $8,350 $8,350
SHOPP NHS - Mobility $12,313 $12,313 $12,313
TOTAL $53,824 $28,718 $8,350 $11,156 $5,600 $5,906 $4 $47,914
MPO ID:TITLE:
CAL46BSHOPP Collision Reduction
Capacity Status: NCI 08-00RTIP #:Safety - Guardrails, median barriers, crash cushionsExempt Category:
Countywide - lump sum for SHOPP collision reduction projects including safety improvements, collision
severity reduction and updating median barriers
DESCRIPTION:
EST TOTAL COST: $88,861
CONRWPEPRIORTOTAL 08/09 09/10 10/11 11/12 12/13
SHOPP (AC) $70,145 $29,441 $12,176 $17,565 $10,963 $70,145
SHOPP - State Cash $10,191 $4,918 $1,577 $2,276 $1,420 $10,191
SHOPP STP - Collision Reduction $8,525 $8,525 $8,525
TOTAL $88,861 $42,884 $13,753 $19,841 $12,383 $88,861
6Page Wednesday, July 23, 2008
34

San Diego Region (in $000s)2008 Regional Transportation Improvement Program
MPO ID:TITLE:
CAL46CSHOPP Roadside Preservation
Caltrans
Capacity Status: NCI 08-00RTIP #:Other - Plantings, landscaping, etcExempt Category:
Countywide - lump sum for roadside preservation projects including planting restoration, freeway
maintenance access, roadside enhancement, beautification and modernization, safety rest area
restoration, new safety roadside rest areas
DESCRIPTION:
EST TOTAL COST: $53,912
CONRWPEPRIORTOTAL 08/09 09/10 10/11 11/12 12/13
SHOPP (AC) $30,198 $13,281 $2,500 $12,832 $1,585 $30,198
SHOPP - State Cash $6,183 $3,992 $324 $1,662 $205 $6,183
SHOPP NHS - Roadside Preserv. $17,531 $17,531 $17,531
TOTAL $53,912 $34,804 $2,824 $14,494 $1,790 $53,912
MPO ID:TITLE:
CAL46DSHOPP Bridge Preservation
Capacity Status: NCI 08-00RTIP #:Safety - Non capacity widening or bridge reconstructionExempt Category:
Countywide - non capacity increase bridge preservation projects including rehabilitation, scour mitigation,
rail replacement and upgrade, seismic restoration, widening, preservation and transportation permit
requirements
DESCRIPTION:
EST TOTAL COST: $20,936
CONRWPEPRIORTOTAL 08/09 09/10 10/11 11/12 12/13
SHOPP (AC) $18,535 $5,675 $7,716 $5,144 $18,535
SHOPP - State Cash $2,401 $735 $1,000 $666 $2,401
TOTAL $20,936 $6,410 $8,716 $5,810 $20,936
MPO ID:TITLE:
CAL46ESHOPP Roadway Preservation
Capacity Status: NCI 08-00RTIP #:Safety - Pavement resurfacing and/or rehabilitationExempt Category:
Countywide - lump sum for roadway preservation projects including roadway/pavement rehabilitation,
pavement preservation, long-life pavement rehabilitation, roadway protective betterments, drainage system
restoration, signs and lighting rehabilitation
DESCRIPTION:
EST TOTAL COST:RAS (4-5) $112,098
CONRWPEPRIORTOTAL 08/09 09/10 10/11 11/12 12/13
SHOPP (AC) $80,308 $23,617 $2,728 $16,012 $37,951 $80,308
SHOPP - State Cash $12,857 $5,513 $353 $2,074 $4,917 $12,857
SHOPP NHS - Roadway Preserv. $18,933 $18,933 $18,933
TOTAL $112,098 $48,063 $3,081 $18,086 $42,868 $112,098
MPO ID:TITLE:
CAL46ISHOPP Mandates
Capacity Status: NCI 08-00RTIP #:Other - Noise attenuationExempt Category:
Various - relinquishments, noise attenuation for schools, railroad grade crossings, hazardous waste
mitigation, storm water mitigation, ADA curb ramps, SHOPP TEA, and minor programs
DESCRIPTION:
EST TOTAL COST: $75,031
CONRWPEPRIORTOTAL 08/09 09/10 10/11 11/12 12/13
SHOPP (AC) $62,848 $532 $1,272 $4,008 $28,877 $28,159 $210 $62,638
SHOPP - State Cash $12,183 $4,110 $165 $519 $3,741 $3,648 $1,624 $10,559
TOTAL $75,031 $4,642 $1,437 $4,527 $32,618 $31,807 $1,834 $73,197
7Page Wednesday, July 23, 2008
35

San Diego Region (in $000s)2008 Regional Transportation Improvement Program
MPO ID:TITLE:
CAL56I-5/805 Port of Entry Expansion
Caltrans
Capacity Status: NCI 08-00RTIP #:Other - Truck size and weight inspection stationsExempt Category:
From US/Mexico Border to San Ysidro Blvd. - on I-5 from US/Mexico Border to San Ysidro Blvd.; I-5
Modification and Port of Entry Expansion
DESCRIPTION:
EST TOTAL COST:EA NO: 07970 PPNO: 0616 $12,273
CONRWPEPRIORTOTAL 08/09 09/10 10/11 11/12 12/13
CBI $2,198 $2,198 $2,198
SHOPP - State Cash $75 $75 $75
TCRP $10,000 $600 $5,000 $4,400 $5,600 $400 $4,000
TOTAL $12,273 $675 $7,198 $4,400 $7,873 $400 $4,000
MPO ID:TITLE:
CAL67SR 94 Widening
Capacity Status: NCI 08-00RTIP #:Other - Engineering studiesExempt Category:
From I-5 to I-805 - On Route 94, complete environmental studies and future construction of HOV LanesDESCRIPTION:
EST TOTAL COST:EA NO: 28710 PPNO: T0770
RAS (A-5,TA.1)
$16,000
CONRWPEPRIORTOTAL 08/09 09/10 10/11 11/12 12/13
TCRP $16,000 $7,000 $2,000 $1,000 $6,000 $16,000
TOTAL $16,000 $7,000 $2,000 $1,000 $6,000 $16,000
MPO ID:TITLE:
CAL68SR 94/125 Widening
Capacity Status: NCI 08-00RTIP #:Other - Engineering studiesExempt Category:
From SR 94 to SR125 - near La Mesa and Lemon Grove - study future freeway to freeway connectorDESCRIPTION:
EST TOTAL COST:EA NO: 14665 PPNO: 0356
RTP PAGE NO: A-6
$150,000
CONRWPEPRIORTOTAL 08/09 09/10 10/11 11/12 12/13
TCRP $6,700 $3,000 $1,850 $1,850 $6,700
TOTAL $6,700 $3,000 $1,850 $1,850 $6,700
MPO ID:TITLE:
CAL69Noise Barrier Program
Capacity Status: NCI 08-00RTIP #:Other - Noise attenuationExempt Category:
In La Mesa - construct soundwallsDESCRIPTION:
EST TOTAL COST:EA NO: 00350 $3,085
CONRWPEPRIORTOTAL 08/09 09/10 10/11 11/12 12/13
RSTP $1,311 $1,311 $177 $252 $882
TransNet - H $170 $170 $70 $100
TransNet - MC $1,604 $1,604 $150 $1,454
TOTAL $3,085 $1,311 $1,774 $397 $352 $2,336
8Page Wednesday, July 23, 2008
36

San Diego Region (in $000s)2008 Regional Transportation Improvement Program
MPO ID:TITLE:
CAL71I-5/SR 78
Caltrans
Capacity Status: NCI 08-00RTIP #:Other - Engineering studiesExempt Category:
In Carlsbad, on I-5 from Carlsbad Village Drive (formally Elm Street) undercrossing to California Street
overcrossing, on SR 78 from I-5/SR 78 separation to Jefferson Street overcrossing - modify interchange,
future construction of auxiliary lanes and direct connectors
DESCRIPTION:
EST TOTAL COST:EA NO: 07890K $1,000
CONRWPEPRIORTOTAL 08/09 09/10 10/11 11/12 12/13
STP $1,000 $500 $500 $1,000
TOTAL $1,000 $500 $500 $1,000
MPO ID:TITLE:
CAL73Balboa Park Historic Preservation
Capacity Status: NCI 08-00RTIP #:Other - Transportation enhancement activitiesExempt Category:
From Richmond to 6th - landscaping, lighting and fencingDESCRIPTION:
EST TOTAL COST: $3,611
CONRWPEPRIORTOTAL 08/09 09/10 10/11 11/12 12/13
STIP-IIP STP TE $3,197 $342 $2,855 $328 $14 $2,855
STIP-IIP State Cash $414 $44 $370 $42 $2 $370
TOTAL $3,611 $386 $3,225 $370 $16 $3,225
MPO ID:TITLE:
CAL75I-5 Sorrento Valley Auxiliary Lane
Capacity Status: CI 08-00RTIP #:
From Genesee Avenue to Sorrento Valley Overhead - on I-5, construct southbound auxiliary laneDESCRIPTION:
EST TOTAL COST:EA NO: 06500 PPNO: 0129P
RAS (TA 7-48)
$12,958
CONRWPEPRIORTOTAL 08/09 09/10 10/11 11/12 12/13
SHOPP (AC) $10,779 $10,779 $3,770 $7,009
SHOPP - State Cash $1,487 $90 $1,397 $579 $908
SHOPP NHS - Mobility $692 $692 $692
TOTAL $12,958 $782 $12,176 $5,041 $7,917
MPO ID:TITLE:
CAL76SR 67 Improvements
Capacity Status: NCI 08-00RTIP #:Other - Engineering studiesExempt Category:
From Mapleview to Dye Road - study future widening of expressway from 2 to 4 lanesDESCRIPTION:
EST TOTAL COST: $500
CONRWPEPRIORTOTAL 08/09 09/10 10/11 11/12 12/13
STP $500 $500 $500
TOTAL $500 $500 $500
9Page Wednesday, July 23, 2008
37

San Diego Region (in $000s)2008 Regional Transportation Improvement Program
MPO ID:TITLE:
CAL77I-5/I-8 Connector
Caltrans
Capacity Status: CI 08-00RTIP #:
On I-5 from 0.1 km south of junction with I-8 and on the right lanes through the Sea World Drive
interchange, On I-8 from I-8/I-5 separation to 06. km east of Morena Blvd. undercrossing - construction of
auxiliary lanes and widening of connectors
DESCRIPTION:
EST TOTAL COST:EA NO: 00270 $3,170
CONRWPEPRIORTOTAL 08/09 09/10 10/11 11/12 12/13
IM $1,200 $1,200 $1,200
SHOPP - State Cash $1,970 $1,970 $1,970
TOTAL $3,170 $3,170 $3,170
MPO ID:TITLE:
CAL78AInterstate 805 Southbound Auxiliary
Capacity Status: CI 08-00RTIP #:
From SR 54 to E Street - in Chula Vista from 1 km south of Bonita Road Undercrossing to .3 km south of
Sweet River Bridge, construct two southbound Auxiliary Lanes
DESCRIPTION:
EST TOTAL COST:EA NO: 081640 PPNO: 0948
RTP PAGE NO: A-5 SANDAG ID: 1280506
$19,702
CONRWPEPRIORTOTAL 08/09 09/10 10/11 11/12 12/13
SHOPP - State Cash $2,260 $2,260 $258 $75 $1,927
SHOPP NHS - Mobility $17,442 $17,442 $1,992 $577 $14,873
TOTAL $19,702 $19,702 $2,250 $652 $16,800
MPO ID:TITLE:
CAL78BI-805 HOV/Managed Lanes - North
Capacity Status: NCI 08-00RTIP #:Other - Engineering studiesExempt Category:
On I-805 from the I-805/SR 52 to Sorrento Valley, on SR 52 at the I-805/SR 52 separation - preliminary
engineering for future construction of managed lanes
DESCRIPTION:
EST TOTAL COST:EA NO: 08163 PPNO: 0732
RTP PAGE NO: A-5; A-10 SANDAG ID: 1280503
$7,802
CONRWPEPRIORTOTAL 08/09 09/10 10/11 11/12 12/13
RSTP $1,775 $1,775 $1,775
TransNet - MC $6,027 $4,827 $950 $250 $6,027
TOTAL $7,802 $6,602 $950 $250 $7,802
MPO ID:TITLE:
CAL78CI-805 HOV/Managed Lanes - South
Capacity Status: NCI 08-00RTIP #:Other - Engineering studiesExempt Category:
From Hall Avenue to Landis Street - preliminary engineering for future construction of managed lanesDESCRIPTION:
EST TOTAL COST:EA NO: 08161 PPNO: 0730
RTP PAGE NO: A-5; A-10 SANDAG ID: 1280501
$22,479
CONRWPEPRIORTOTAL 08/09 09/10 10/11 11/12 12/13
Local Funds $180 $180 $180
RSTP $4,113 $4,113 $4,113
TransNet - MC $18,144 $16,480 $1,400 $264 $18,144
TransNet - Transit $42 $42 $42
TOTAL $22,479 $20,815 $1,400 $264 $22,479
10Page Wednesday, July 23, 2008
38

San Diego Region (in $000s)2008 Regional Transportation Improvement Program
MPO ID:TITLE:
CAL90I-8 Auxiliary Lane
Caltrans
Capacity Status: CI 08-00RTIP #:
From Second Street to Greenfield Drive - in El Cajon construct auxiliary lane eastbound and remove
pedestrian overcrossing bridge
DESCRIPTION:
EST TOTAL COST:EA NO: 06380 PPNO: 0187P
RAS (4-15)
$28,823
CONRWPEPRIORTOTAL 08/09 09/10 10/11 11/12 12/13
SHOPP (AC) $25,516 $25,516 $4,096 $367 $21,053
SHOPP - State Cash $3,307 $3,307 $531 $48 $2,728
TOTAL $28,823 $28,823 $4,627 $415 $23,781
MPO ID:TITLE:
CAL91SR 15 Citracado to Valley Parkway
Capacity Status: CI 08-00RTIP #:
From Citricado Parkway to Valley Parkway - construct north and southbound auxiliary lanesDESCRIPTION:
EST TOTAL COST:EA NO: 2T082, 2T081
RTP PAGE NO: A-5
$25,196
CONRWPEPRIORTOTAL 08/09 09/10 10/11 11/12 12/13
SHOPP Prior - National Hwy System $22,306 $22,306 $4,817 $633 $16,856
SHOPP Prior - State Cash $2,890 $2,890 $624 $82 $2,184
TOTAL $25,196 $25,196 $5,441 $715 $19,040
MPO ID:TITLE:
CAL103High Risk Rural Roads Program
Capacity Status: NCI 08-00RTIP #:Safety - Pavement marking demonstrationExempt Category:
South Grade Road from SR 76 to Canfield Drive/ East Grade Road on Mount Palomar - rumble stripDESCRIPTION:
EST TOTAL COST: $144
CONRWPEPRIORTOTAL 08/09 09/10 10/11 11/12 12/13
High Risk Rural Road Program $130 $130 $130
Local Funds $14 $14 $14
TOTAL $144 $144 $144
MPO ID:TITLE:
CAL105Highway Safety Improvement
Program
Capacity Status: NCI 08-00RTIP #:Safety - Safety Improvement ProgramExempt Category:
Various - lump sum for safety improvementsDESCRIPTION:
EST TOTAL COST: $1,779
CONRWPEPRIORTOTAL 08/09 09/10 10/11 11/12 12/13
HSIP $1,601 $57 $1,544 $1,601
Local Funds $178 $178 $178
TOTAL $1,779 $57 $1,722 $1,779
11Page Wednesday, July 23, 2008
39

San Diego Region (in $000s)2008 Regional Transportation Improvement Program
MPO ID:TITLE:
CAL10732nd Street - Grade Separation
Caltrans
Capacity Status: NCI 08-00RTIP #:Safety - Railroad/highway crossingExempt Category:
From 32nd Street to Harbor Drive - in San Diego, grade separationDESCRIPTION:
EST TOTAL COST:EA NO: 29320
RTP PAGE NO: B-5
EARMARK NO: CA380/618
$118,460
CONRWPEPRIORTOTAL 08/09 09/10 10/11 11/12 12/13
HPP $800 $800 $800
Local Funds $66,995 $200 $66,795 $200 $66,795
Trade Corridor Program $50,665 $50,665 $50,665
TOTAL $118,460 $1,000 $117,460 $1,000 $117,460
MPO ID:TITLE:
CAL109San Diego Smart Parking Pilot
Project
Capacity Status: NCI 08-00RTIP #:Mass Transit - Construction or renovation of power, signal,
and communications systems
Exempt Category:
Selected Coaster Stations - provide access to real-time parking availability, conduct evaluations, analysis
of parking strategies and pricing
DESCRIPTION:
EST TOTAL COST: $800
CONRWPEPRIORTOTAL 08/09 09/10 10/11 11/12 12/13
State Cash $160 $53 $107 $160
Value Pricing Program $640 $211 $429 $640
TOTAL $800 $264 $536 $800
Formally SAN69*
MPO ID:TITLE:
CAL110At Civic Center Drive, Harbor Drive,
and I-5
Capacity Status: NCI 08-00RTIP #:Other - Intersection channelization projectsExempt Category:
I-5, Harbor Drive, and Civic Center Drive - in National City, at-grade improvements and construct truck ramp
linking I-5 to National City Marine Cargo terminal
DESCRIPTION:
EST TOTAL COST:EA NO: 29760 PPNO: 0859
EARMARK NO: CA560/2340
$3,260
CONRWPEPRIORTOTAL 08/09 09/10 10/11 11/12 12/13
HPP $930 $20 $910 $20 $910
Local Funds $1,180 $940 $240 $260 $680 $240
Trade Corridor Program $1,150 $1,150 $1,150
TOTAL $3,260 $960 $2,300 $280 $680 $2,300
12Page Wednesday, July 23, 2008
40

San Diego Region (in $000s)2008 Regional Transportation Improvement Program
MPO ID:TITLE:
CAL111Grade Separation At 10th Ave Marine
Terminal/Cesar Chavez Blvd.
Caltrans
Capacity Status: NCI 08-00RTIP #:Safety - Railroad/highway crossingExempt Category:
10th Avenue and Harbor Drive from 10th Ave./Ceasar Chavez - Marine Terminal to Harbor Drive - Port of
San Diego Access Improvement and Truck Route to I-5 and I-15
DESCRIPTION:
EST TOTAL COST:EA NO: 297700
RTP PAGE NO: B-5, B-1
EARMARK NO: CA588/2618
$67,200
CONRWPEPRIORTOTAL 08/09 09/10 10/11 11/12 12/13
HPP $400 $400 $400
Local Funds $35,890 $1,750 $12,750 $21,390 $5,510 $8,990 $21,390
Trade Corridor Program $30,910 $30,910 $30,910
TOTAL $67,200 $2,150 $12,750 $52,300 $5,910 $8,990 $52,300
MPO ID:TITLE:
CAL114I-5/SR 56 Interchange
Capacity Status: CI 08-00RTIP #:
At I-5/SR 56 interchange - in San Diego, construct freeway to freeway interchange, associated operational
improvements, and the relocation of the fiber optic cable line
DESCRIPTION:
EST TOTAL COST:EA NO: 17790
RTP PAGE NO: A-5
$95,488
CONRWPEPRIORTOTAL 08/09 09/10 10/11 11/12 12/13
CBI $1,942 $1,942 $1,942
DEMO - Sec 115 $1,000 $1,000 $1,000
DEMO - TEA 21 $375 $375 $375
IM $453 $453 $453
Local Funds $879 $879 $579 $300
STP $4,500 $1,500 $3,000 $3,000 $1,500
STP - Sec 112 $400 $400 $400
TOTAL $9,549 $4,696 $4,853 $7,349 $400 $1,800
formally SD88*
MPO ID:TITLE:
CAL115Bay Marina Drive at I-5 At-Grade
Improvements
Capacity Status: NCI 08-00RTIP #:Safety - Railroad/highway crossingExempt Category:
Bay Marina/I-5 Intersection - in National City, at-grade intersection improvements, construction of truck
ramp linking I-5 to National City Marine Cargo terminal
DESCRIPTION:
EST TOTAL COST:EA NO: 29761 PPNO: 0855
EARMARK NO: CA560/2340
$2,380
CONRWPEPRIORTOTAL 08/09 09/10 10/11 11/12 12/13
HPP $1,470 $210 $350 $910 $210 $350 $910
Trade Corridor Program $910 $910 $910
TOTAL $2,380 $210 $350 $1,820 $210 $350 $1,820
13Page Wednesday, July 23, 2008
41

San Diego Region (in $000s)2008 Regional Transportation Improvement Program
MPO ID:TITLE:
CB04AEl Camino Real Widening - Tamarack
Avenue to Chestnut Avenue
Carlsbad, City of
Capacity Status: CI 08-00RTIP #:
El Camino Real from Tamarack Ave. to Chestnut Ave. - in Carlsbad, widen El Camino Real to prime
arterial standards with three travel lanes, bike lanes and sidewalks in each direction including intersection
improvements at Tamarack Avenue and Chestnut Avenue
DESCRIPTION:
EST TOTAL COST:RAS (TA 7-43) $8,331
CONRWPEPRIORTOTAL 08/09 09/10 10/11 11/12 12/13
Local Funds $7,909 $7,656 $253 $1,225 $60 $6,624
Local RTCIP $422 $422 $422
TOTAL $8,331 $7,656 $675 $1,225 $60 $7,046
MPO ID:TITLE:
CB04BEl Camino Real and Cannon Road
Capacity Status: CI 08-00RTIP #:
El Camino Real from El Camino Real to Cannon Road - in Carlsbad, widen along the eastside of El
Camino Real just south of Cannon Road to prime arterial standards with three through lanes, a right turn
lane and a sidewalk approaching the intersection; and southbound add a second left turn lane to
eastbound Cannon Road
DESCRIPTION:
EST TOTAL COST:RAS (TA 7-43) $2,205
CONRWPEPRIORTOTAL 08/09 09/10 10/11 11/12 12/13
Local Funds $1,231 $300 $931 $270 $30 $931
Local RTCIP $974 $974 $974
TOTAL $2,205 $300 $1,905 $270 $30 $1,905
MPO ID:TITLE:
CB04CEl Camino Real - Lisa Street to
Crestview Drive
Capacity Status: CI 08-00RTIP #:
El Camino Real from Lisa Street to Crestview Drive - in Carlsbad, roadway widening to provide three
southbound through lanes, curb, gutter and sidewalk along the west side of El Camino Real
DESCRIPTION:
EST TOTAL COST:RAS (TA 7-43) $959
CONRWPEPRIORTOTAL 08/09 09/10 10/11 11/12 12/13
TransNet - L (Cash) $959 $959 $82 $250 $627
TOTAL $959 $959 $82 $250 $627
MPO ID:TITLE:
CB12College Boulevard Reach A
Capacity Status: CI 08-00RTIP #:
College Boulevard from Badger Lane to Cannon Road - in Carlsbad, construct a new 4-lane arterial
roadway with raised median, bike lanes and sidewalks/trails
DESCRIPTION:
EST TOTAL COST:RAS (TA 7-43) $11,952
CONRWPEPRIORTOTAL 08/09 09/10 10/11 11/12 12/13
Local Funds $11,952 $3,731 $8,221 $2,774 $9,178
TOTAL $11,952 $3,731 $8,221 $2,774 $9,178
14Page Wednesday, July 23, 2008
42

San Diego Region (in $000s)2008 Regional Transportation Improvement Program
MPO ID:TITLE:
CB13Poinsettia Lane Reach E
Carlsbad, City of
Capacity Status: CI 08-00RTIP #:
Poinsettia Lane from Cassia Drive to Skimmer Court - in Carlsbad, construct a new 4-lane arterial with
median, bike lanes, and sidewalks/trails
DESCRIPTION:
EST TOTAL COST:EARMARK NO: CA366/517
RAS (TA 7-43)
$13,450
CONRWPEPRIORTOTAL 08/09 09/10 10/11 11/12 12/13
HPP $1,600 $1,600 $1,600
Local Funds $11,850 $1,260 $10,590 $1,260 $1,900 $8,690
TOTAL $13,450 $1,260 $12,190 $1,260 $1,900 $10,290
MPO ID:TITLE:
CB16Carlsbad Blvd. Bridge over Las
Encinas Creek
Capacity Status: NCI 08-00RTIP #:Safety - Non capacity widening or bridge reconstructionExempt Category:
On Carlsbad Blvd. 0.6 miles south of Palomar Airport Road - replace and reconstruct bridge over Las
Encinas Creek along southbound Carlsbad Blvd. (local match to HBP, part of CAL44)
DESCRIPTION:
EST TOTAL COST:RAS (TA 7-43) $2,219
CONRWPEPRIORTOTAL 08/09 09/10 10/11 11/12 12/13
TransNet - L $255 $255 $39 $216
TOTAL $255 $255 $39 $216
MPO ID:TITLE:
CB17Carlsbad Blvd. Bridge over Encina
Power Station
Capacity Status: NCI 08-00RTIP #:Safety - Guardrails, median barriers, crash cushionsExempt Category: (Maint)
From Carlsbad Blvd. to 0.5 mile north of Cannon Road - upgrade bridge railings on the bridge over the
warm water discharge from the Encina power plant (local match to HBP, part of CAL44)
DESCRIPTION:
EST TOTAL COST:RAS (TA 7-43) $456
CONRWPEPRIORTOTAL 08/09 09/10 10/11 11/12 12/13
TransNet - LSI $52 $8 $44 $8 $44
TOTAL $52 $8 $44 $8 $44
MPO ID:TITLE:
CB18Carlsbad Blvd. Bridge over SDNR
Railroad
Capacity Status: NCI 08-00RTIP #:Safety - Guardrails, median barriers, crash cushionsExempt Category:
Carlsbad Blvd. from Mountain View to State - in Carlsbad 0.6 miles NW of Carlsbad Village Drive, upgrade
the bridge railings on the Carlsbad Blvd. Bridge over the San Diego Northern Railway (SDNR) railroad (local
match to HBP, part of CAL44)
DESCRIPTION:
EST TOTAL COST:RAS (TA 7-43) $276
CONRWPEPRIORTOTAL 08/09 09/10 10/11 11/12 12/13
TransNet - L $12 $12 $12
TOTAL $12 $12 $12
15Page Wednesday, July 23, 2008
43

San Diego Region (in $000s)2008 Regional Transportation Improvement Program
MPO ID:TITLE:
CB20Pavement Management - Overlay
Carlsbad, City of
Capacity Status: NCI 08-00RTIP #:Safety - Pavement resurfacing and/or rehabilitationExempt Category: (CR)
Street locations by year as follows: FY 08/09 roadways - Tamarack Avenue, Carlsbad Village Drive, El
Camino Real and College Blvd., FY 09/10 roadways - La Costa Avenue, Carlsbad Blvd., Aviara Parkway,
Alga Road,El Fuerte Street, Alicante Road, FY10/11 roadways - Palomar Airport Road, College Blvd.,
Cannon Blvd., Faraday Ave., Paseo del Norte, Carslbad Blvd., FY 11/12 roadways - La Costa Ave., Calle
Barcelona, El Camino Real, Levante Street, Rancho Santa Fe, Los Coches and FY 12-13 roadways -
Carlsbad Blvd., Carlsbad Village Drive, Grand Avenue, Jefferson Street, State Street, Chestnut Avenue,
Basswood Ave., Las Flores, and Kelly Dr. - in Carlsbad, pavement overlay and roadway repairs; to be
implemented in a series of zones
DESCRIPTION:
EST TOTAL COST: $16,513
CONRWPEPRIORTOTAL 08/09 09/10 10/11 11/12 12/13
Local Funds $5,505 $450 $2,080 $2,000 $475 $500 $5,505
TransNet - L (Cash) $273 $273 $273
TransNet - LSI $10,735 $2,377 $1,220 $1,300 $2,838 $3,000 $10,735
TOTAL $16,513 $3,100 $3,300 $3,300 $3,313 $3,500 $16,513
MPO ID:TITLE:
CB21Pavement Management -Seal
Capacity Status: NCI 08-00RTIP #:Safety - Pavement resurfacing and/or rehabilitationExempt Category:
Various minor/local roadways within each zone as noted on the project diagram - in Carlsbad, street
sealing and roadway repairs
DESCRIPTION:
EST TOTAL COST: $1,500
CONRWPEPRIORTOTAL 08/09 09/10 10/11 11/12 12/13
Local Funds $1,500 $300 $300 $300 $300 $300 $1,500
TOTAL $1,500 $300 $300 $300 $300 $300 $1,500
MPO ID:TITLE:
CB22Avenida Encinas - Widen from PAR
to EWPCF
Capacity Status: CI 08-00RTIP #:
In Carlsbad - Avenida Encinas from Palomar Airport Road southerly to existing improvements adjacent to
the Encina Water Pollution Control Facility; roadway widening to create one lane of travel in each direction
with a raised median and a parking lane on the eastside and a trail/bike lane on the west side
DESCRIPTION:
EST TOTAL COST: $2,605
CONRWPEPRIORTOTAL 08/09 09/10 10/11 11/12 12/13
Local Funds $2,605 $2,605 $400 $30 $2,175
TOTAL $2,605 $2,605 $400 $30 $2,175
MPO ID:TITLE:
CB23Palomar Airport Road - Armada Drive
to Paseo Del Norte
Capacity Status: CI 08-00RTIP #:
Palomar Airport Road from Armada Drive to Paseo Del Norte - in Carlsbad, provide four through lanes and
a right turn lane onto northbound Paseo Del Norte
DESCRIPTION:
EST TOTAL COST:RAS (TA 7-43) $1,244
CONRWPEPRIORTOTAL 08/09 09/10 10/11 11/12 12/13
Local Funds $1,244 $1,244 $185 $1,059
TOTAL $1,244 $1,244 $185 $1,059
16Page Wednesday, July 23, 2008
44

San Diego Region (in $000s)2008 Regional Transportation Improvement Program
MPO ID:TITLE:
CB24College Boulevard and Palomar
Airport Road - Intersection
Improvements
Carlsbad, City of
Capacity Status: CI 08-00RTIP #:
College Boulevard from College Blvd. to Palomar Airport Road - in Carlsbad, roadway widening along
southbound College Blvd. to provide dual left turns, one through lane, one right turn and through lane
shared and one right turn lane along southbound
DESCRIPTION:
EST TOTAL COST:RAS (TA 7-43) $587
CONRWPEPRIORTOTAL 08/09 09/10 10/11 11/12 12/13
Local Funds $587 $587 $80 $30 $477
TOTAL $587 $587 $80 $30 $477
MPO ID:TITLE:
CB25Palomar Airport Road to Southbound
Melrose Drive
Capacity Status: CI 08-00RTIP #:
Palomar Airport Road from Palomar Airport Road to Melrose Drive - in Carlsbad, widen eastbound Palomar
Airport Road to create a right turn lane from eastbound Palomar Airport Road to southbound Melrose Drive
DESCRIPTION:
EST TOTAL COST:RAS (TA 7-43) $254
CONRWPEPRIORTOTAL 08/09 09/10 10/11 11/12 12/13
Local Funds $254 $254 $254
TOTAL $254 $254 $254
MPO ID:TITLE:
CB26Melrose and Palomar Airport Road
Capacity Status: CI 08-00RTIP #:
Melrose Drive from Melrose Drive to Palomar Airport Road - in Carlsbad, roadway widening along
southbound Melrose to provide an additional right turn lane to westbound Palomar Airport Road
DESCRIPTION:
EST TOTAL COST:RAS (TA 7-43) $410
CONRWPEPRIORTOTAL 08/09 09/10 10/11 11/12 12/13
Local Funds $410 $410 $50 $360
TOTAL $410 $410 $50 $360
MPO ID:TITLE:
CB27Melrose Drive widening south of
Palomar Airport Road
Capacity Status: CI 08-00RTIP #:
On Melrose Drive - in Carlsbad, Palomar Airport Road southerly 1000' to align with Melrose Drive north of
Palomar Airport Road, widen Melrose Drive to provide three through lanes southbound and four through
lanes northbound with dual left turn lanes and a right turn lane northbound
DESCRIPTION:
EST TOTAL COST:RAS (TA 7-43) $700
CONRWPEPRIORTOTAL 08/09 09/10 10/11 11/12 12/13
Local Funds $700 $700 $700
TOTAL $700 $700 $700
17Page Wednesday, July 23, 2008
45

San Diego Region (in $000s)2008 Regional Transportation Improvement Program
MPO ID:TITLE:
CB28Carlsbad Bridge Preventive
Maintenance Program
Carlsbad, City of
Capacity Status: NCI 08-00RTIP #:Safety - Non capacity widening or bridge reconstructionExempt Category:
Various bridge locations throughout the City - in Carlsbad, prepare a comprehensive list of preventive
maintenance activities for each bridge, as defined by Caltrans
DESCRIPTION:
EST TOTAL COST: $125
CONRWPEPRIORTOTAL 08/09 09/10 10/11 11/12 12/13
Local Funds $36 $36 $36
TOTAL $36 $36 $36
18Page Wednesday, July 23, 2008
46

San Diego Region (in $000s)2008 Regional Transportation Improvement Program
MPO ID:TITLE:
CHV06Pavement Rehabilitation Program
Chula Vista, City of
Capacity Status: NCI 08-00RTIP #:Safety - Pavement resurfacing and/or rehabilitationExempt Category: (Maint)
Citywide - AC overlay, chip seals and slurry seal rehabilitationDESCRIPTION:
EST TOTAL COST: $28,425
CONRWPEPRIORTOTAL 08/09 09/10 10/11 11/12 12/13
Local Funds $1,000 $1,000 $160 $840
TransNet - L $15,900 $15,900 $3,250 $12,650
TransNet - L (Cash) $6,900 $6,900 $1,300 $5,600
TransNet - LSI $4,625 $600 $850 $925 $1,100 $1,150 $680 $3,945
TOTAL $28,425 $22,800 $1,600 $850 $925 $1,100 $1,150 $5,390 $23,035
MPO ID:TITLE:
CHV08Willow Street Bridge Project
Capacity Status: CI 08-00RTIP #:
Willow Street from Bonita Road to Sweetwater Road - replace and widen bridge including shouldersDESCRIPTION:
EST TOTAL COST: $16,095
CONRWPEPRIORTOTAL 08/09 09/10 10/11 11/12 12/13
HBP $711 $445 $266 $445 $266
HBRR $500 $500 $500
Local Funds $236 $236 $236
Local RTCIP $1,790 $1,756 $34 $853 $300 $637
TOTAL $3,237 $1,181 $1,756 $300 $2,034 $566 $637
MPO ID:TITLE:
CHV18Sidewalk Rehabilitation/Installation
Program
Capacity Status: NCI 08-00RTIP #:Air Quality - Bicycle and pedestrian facilitiesExempt Category: (Maint)
Citywide - sidewalk construction, replacements, installation in areas along school routes, around senior
citizen centers and in areas of high pedestrian traffic
DESCRIPTION:
EST TOTAL COST: $3,339
CONRWPEPRIORTOTAL 08/09 09/10 10/11 11/12 12/13
Local Funds $1,289 $1,289 $1,289
TransNet - L $1,950 $1,950 $1,950
TransNet - LSI $100 $100 $100
TOTAL $3,339 $3,239 $100 $3,339
MPO ID:TITLE:
CHV19North Broadway Reconstruction
Capacity Status: NCI 08-00RTIP #:Safety - Pavement resurfacing and/or rehabilitationExempt Category: (CR)
North Broadway from C Street to D Street - pavement reconstruction and associated drainageDESCRIPTION:
EST TOTAL COST: $1,220
CONRWPEPRIORTOTAL 08/09 09/10 10/11 11/12 12/13
Local Funds $324 $324 $324
TransNet - LSI $896 $896 $200 $696
TOTAL $1,220 $324 $896 $200 $1,020
19Page Wednesday, July 23, 2008
47

San Diego Region (in $000s)2008 Regional Transportation Improvement Program
MPO ID:TITLE:
CHV22Advance Planning Studies
Chula Vista, City of
Capacity Status: NCI 08-00RTIP #:Other - Engineering studiesExempt Category: (Maint)
Citywide - study GIS-based infrastructure deficiency database for pavement and street improvements;
planning rehabilitation programs
DESCRIPTION:
EST TOTAL COST: $1,344
CONRWPEPRIORTOTAL 08/09 09/10 10/11 11/12 12/13
Local Funds $720 $495 $75 $75 $75 $720
TransNet - L $375 $375 $375
TransNet - LSI $249 $45 $47 $50 $52 $55 $249
TOTAL $1,344 $870 $120 $122 $125 $52 $55 $1,344
MPO ID:TITLE:
CHV26Pedestrian Master Plan
Capacity Status: NCI 08-00RTIP #:Other - Non construction related activitiesExempt Category: (Maint)
Citywide - master plan will identify missing pedestrian improvements, establish priorities and program
capital improvement projects that will increase connectivity among existing facilities
DESCRIPTION:
EST TOTAL COST: $211
CONRWPEPRIORTOTAL 08/09 09/10 10/11 11/12 12/13
TDA - Bicycles $150 $150 $150
TransNet - LSI $61 $61 $61
TOTAL $211 $150 $61 $211
MPO ID:TITLE:
CHV30I-5 Multi-Modal Corridor Improvement
Study
Capacity Status: NCI 08-00RTIP #:Other - Engineering studiesExempt Category: (CR)
On I-5 between SR 54 and Main Street interchange - conduct a study to examine multi-modal
improvements to the I-5 corridor between the Main Street Interchange and State Route 54
DESCRIPTION:
EST TOTAL COST:EARMARK NO: CA677/3482 $2,527
CONRWPEPRIORTOTAL 08/09 09/10 10/11 11/12 12/13
HPP $1,987 $1,987 $1,987
TransNet - L $50 $50 $50
TransNet - LSI $490 $490 $490
TOTAL $2,527 $2,527 $2,527
MPO ID:TITLE:
CHV35Traffic Signing, Studies and Signal
Upgrade
Capacity Status: NCI 08-00RTIP #:Other - Engineering studiesExempt Category: (Maint)
Citywide - annual program to prioritize Traffic Signing and Striping CIP projects including upgrading and
maintaining traffic signal and streetlight systems
DESCRIPTION:
EST TOTAL COST: $1,176
CONRWPEPRIORTOTAL 08/09 09/10 10/11 11/12 12/13
Local Funds $571 $410 $161 $571
TransNet - L $135 $135 $135
TransNet - LSI $470 $250 $55 $55 $55 $55 $470
TOTAL $1,176 $545 $411 $55 $55 $55 $55 $1,176
20Page Wednesday, July 23, 2008
48

San Diego Region (in $000s)2008 Regional Transportation Improvement Program
MPO ID:TITLE:
CHV36Heritage Road Bridge Studies
Chula Vista, City of
Capacity Status: NCI 08-00RTIP #:Other - Engineering studiesExempt Category:
Heritage Road from Main Street to Entertainment Circle - preliminary engineering, environmental analysis
for future widening of bridge
DESCRIPTION:
EST TOTAL COST:EARMARK NO: CA356/450 $4,620
CONRWPEPRIORTOTAL 08/09 09/10 10/11 11/12 12/13
HPP $2,800 $2,800 $2,800
Local Funds $1,820 $1,820 $1,820
TOTAL $4,620 $4,620 $4,620
MPO ID:TITLE:
CHV37Palomar Gateway Community Transit
Area
Capacity Status: NCI 08-00RTIP #:Air Quality - Bicycle and pedestrian facilitiesExempt Category: (CR)
Palomar Street from Frontage Road to approximately 200 beyond Industrial Blvd.; approximately 200 feet
north of Palomar Street to ADA Street - street and pedestrian improvements to Palomar transit station and
its environs; includes parkways, medians, bicycle lanes, bus stop, traffic circle roundabout, sidewalk
construction (this program augments V04)
DESCRIPTION:
EST TOTAL COST: $3,075
CONRWPEPRIORTOTAL 08/09 09/10 10/11 11/12 12/13
Local Funds $875 $875 $820 $30 $25
TransNet - LSI $200 $200 $100 $100
TOTAL $1,075 $1,075 $920 $30 $125
MPO ID:TITLE:
CHV39Traffic Signal System Optimization
Capacity Status: NCI 08-00RTIP #:Other - Traffic signal synchronization projectsExempt Category: (CR)
Palomar Street from I-5 to I-805; Broadway from Palomar Street to C Street; H Street from I-805 to I-5 -
upgrade traffic signal coordination at locations identified by the City's Traffic Monitoring Program in order to
reduce congestion and intersection delays
DESCRIPTION:
EST TOTAL COST: $500
CONRWPEPRIORTOTAL 08/09 09/10 10/11 11/12 12/13
TransNet - L $150 $150 $150
TransNet - LSI $350 $150 $50 $50 $50 $50 $350
TOTAL $500 $150 $150 $50 $50 $50 $50 $500
MPO ID:TITLE:
CHV43Congestion Relief Study and
Implementation
Capacity Status: NCI 08-00RTIP #:Other - Intersection signalization projectsExempt Category: (Maint)
Citywide - program will allow for identification and implementation of solutions for congestion relief on local
streets, such as median installation , new traffic signals, traffic signal upgrades, intersection lighting, traffic
signal coordination/ interconnection, video traffic surveillance systems, traffic data collection systems.
DESCRIPTION:
EST TOTAL COST: $1,000
CONRWPEPRIORTOTAL 08/09 09/10 10/11 11/12 12/13
Local Funds $50 $50 $15 $35
TransNet - L $575 $575 $525 $50
TransNet - LSI $375 $75 $75 $75 $75 $75 $375
TOTAL $1,000 $625 $75 $75 $75 $75 $75 $915 $85
21Page Wednesday, July 23, 2008
49

San Diego Region (in $000s)2008 Regional Transportation Improvement Program
MPO ID:TITLE:
CHV44I-805, SR54 and Otay Mesa
Transportation System Improvements
Chula Vista, City of
Capacity Status: NCI 08-00RTIP #:Other - Engineering studiesExempt Category: (CR)
In Chula Vista - preliminary analysis of the I-805/ SR54 interchange and include other on/off ramps on
SR54 to I-5, the Bonita Road and Main Street on/ off ramps to I-805 and the impact of traffic in Otay Mesa
on La Media Road and other major streets in Chula Vista in order to reduce congestion
DESCRIPTION:
EST TOTAL COST: $570
CONRWPEPRIORTOTAL 08/09 09/10 10/11 11/12 12/13
TransNet - L $100 $100 $100
TransNet - LSI $470 $110 $90 $90 $90 $90 $470
TOTAL $570 $100 $110 $90 $90 $90 $90 $570
MPO ID:TITLE:
CHV45Traffic Monitoring Program
Capacity Status: NCI 08-00RTIP #:Safety - Non signalization traffic control and operatngExempt Category: (Maint)
Citywide - traffic monitoring to comply with the City's traffic threshold standards, as well as the city's
annual traffic count program, which provides data for safety commission studies, capital improvements
projects, speed surveys and other traffic uses
DESCRIPTION:
EST TOTAL COST: $125
CONRWPEPRIORTOTAL 08/09 09/10 10/11 11/12 12/13
Local RTCIP $50 $50 $50
TransNet - LSI $75 $75 $75
TOTAL $125 $125 $125
MPO ID:TITLE:
CHV46Harborside Elementary Pedestrian
Improvements
Capacity Status: NCI 08-00RTIP #:Air Quality - Bicycle and pedestrian facilitiesExempt Category: (Maint)
Area in the vicinity of Harborside Elementary School southeast of the intersection of Naples Street and
Industrial Blvd. - install missing pedestrian improvements and rehabilitate existing pedestrian
infrastructure in order to provide pedestrians with a safer route to school
DESCRIPTION:
EST TOTAL COST: $575
CONRWPEPRIORTOTAL 08/09 09/10 10/11 11/12 12/13
TCSP $490 $490 $80 $410
TransNet - LSI $85 $85 $20 $65
TOTAL $575 $575 $100 $475
MPO ID:TITLE:
CHV47Urban Core Level of Service
Thresholds Study
Capacity Status: NCI 08-00RTIP #:Other - Engineering studiesExempt Category: (Maint)
Area is generally bounded by the northern City limits, the Bayfront, L Street to the south and Hilltop Drive
to the east - update the traffic threshold standards established for the Urban Core Specific Plan area
based on the General Plan update adopted by Council in late 2005. These standards need to take into
account alternative modes of transportation emphasized in the General Plan
DESCRIPTION:
EST TOTAL COST: $125
CONRWPEPRIORTOTAL 08/09 09/10 10/11 11/12 12/13
Local RTCIP $75 $75 $75
TransNet - LSI $50 $50 $50
TOTAL $125 $50 $75 $125
22Page Wednesday, July 23, 2008
50

San Diego Region (in $000s)2008 Regional Transportation Improvement Program
MPO ID:TITLE:
CHV48Pavement Major Rehabilitation
Chula Vista, City of
Capacity Status: NCI 08-00RTIP #:Safety - Pavement resurfacing and/or rehabilitationExempt Category: (CR)
Various locations (see list of specific locations) - ongoing program of pavement rehabilitation and
reconstruction which includes overlays (one-inch thick and greater) and street reconstruction
DESCRIPTION:
EST TOTAL COST: $15,635
CONRWPEPRIORTOTAL 08/09 09/10 10/11 11/12 12/13
TransNet - LSI $15,635 $1,410 $3,350 $3,525 $3,600 $3,750 $2,560 $13,075
TOTAL $15,635 $1,410 $3,350 $3,525 $3,600 $3,750 $2,560 $13,075
MPO ID:TITLE:
CHV49Third Avenue Bicycle and Pedestrian
Access
Capacity Status: NCI 08-00RTIP #:Air Quality - Bicycle and pedestrian facilitiesExempt Category:
Within the Chula Vista Urban Core Specific Plan Area, which is bordered by SR54, I-5, H Street and I-805
- study to determine ways to develop more bikeways and pedestrian access to the downtown Third Avenue
area
DESCRIPTION:
EST TOTAL COST:EARMARK NO: CA635/3067 $300
CONRWPEPRIORTOTAL 08/09 09/10 10/11 11/12 12/13
HPP $240 $240 $240
Local Funds $60 $60 $60
TOTAL $300 $300 $300
23Page Wednesday, July 23, 2008
51

San Diego Region (in $000s)2008 Regional Transportation Improvement Program
MPO ID:TITLE:
COR04Street and Road Preventive
Maintenance; Minor Drainage Repair
Coronado, City of
Capacity Status: NCI 08-00RTIP #:Safety - Pavement resurfacing and/or rehabilitationExempt Category: (Maint)
Alameda Blvd. - First Street to Third Street , Alameda Blvd. - Fourth Street to Ocean Blvd., Eighth Street -
Adella Avenue to Coronado Avenue, First Street - Alameda Blvd. to Orange Avenue, Ninth Street - Orange
Avenue to Alameda Blvd., Ocean Blvd. - Sunset Park to Orange Avenue, Olive Avenue - Alameda Blvd. to
D Avenue, Pine Court - Tenth Street to Ocean Blvd., Pine Street - Pine Street to Cul de Sac, Second
Street - Alameda Blvd. to A Avenue, Sixth Street - Glorietta Blvd. to Coronado Avenue, Tenth Street -
Glorietta Blvd. to Alameda Avenue, Ynez Place - Adella Avenue to Glorietta Blvd., Parking Lots:, Avenida
de las Arenas, Avenida Del Sol, B Avenue at Second, , Total Area SF = 2,056,608, - preventive
maintenance such as slurry seal, crack sealing, and minor drainage repair
DESCRIPTION:
EST TOTAL COST: $2,304
CONRWPEPRIORTOTAL 08/09 09/10 10/11 11/12 12/13
Local Funds $783 $190 $116 $232 $245 $23 $760
TransNet - L $1,237 $1,190 $47 $55 $1,182
TransNet - LSI $284 $155 $91 $38 $7 $277
TOTAL $2,304 $1,380 $318 $323 $283 $85 $2,219
MPO ID:TITLE:
COR05SR 75 Tunnel
Capacity Status: NCI 08-00RTIP #:Other - Engineering studiesExempt Category:
From Glorietta to Alameda - From San Diego-Coronado Bridge plaza westerly 1.4 miles beneath Fourth
Street with egress onto NAS North Island - SR 75 Tunnel EIS to provide analysis of a tunnel & other
congestion relief alternatives to SR 75 corridor (DEMO ID: CA397/713; HPP No: 866/3789)
DESCRIPTION:
EST TOTAL COST: $520,380
CONRWPEPRIORTOTAL 08/09 09/10 10/11 11/12 12/13
CBI $500 $500 $500
HPP $9,000 $6,120 $2,880 $9,000
Local Funds $8,337 $8,337 $8,337
STP $745 $745 $745
TCSP $564 $564 $564
TOTAL $19,146 $16,266 $2,880 $19,146
MPO ID:TITLE:
COR07Street and Road Major Rehabilitation;
Major Drainage; Reconstruction, and
Traffic Operations
Capacity Status: NCI 08-00RTIP #:Safety - Pavement resurfacing and/or rehabilitationExempt Category: (CR)
A Ave., Adella Ave., B Ave, Bay Circle, C Ave., Coronado Ave., D Ave., E Ave., Eight St., F Ave., Fifth St.,
First St., G Ave., Guadalupe Ave., H Ave., I Ave., J Ave., Jacitno Place, Maria Place, Miguel Ave., Ninth
St., Pomona Ave., San Luis Rey Ave., Second St., Seventh St., Sixth St., and Tenth St. - rehabilitation of
roadways including removal and replacement of severely damaged areas, grinding and overlays of 1 1/2";
Orange Avenue/Sixth Street - drainage improvements include approximately 1500 lineal feet of new storm
drains and associated drainage structures to relieve flooding
DESCRIPTION:
EST TOTAL COST: $3,653
CONRWPEPRIORTOTAL 08/09 09/10 10/11 11/12 12/13
Local Funds $698 $109 $309 $280 $71 $627
TransNet - L $1,616 $1,138 $367 $111 $136 $1,480
TransNet - LSI $1,339 $363 $449 $527 $111 $1,228
TOTAL $3,653 $1,247 $730 $869 $807 $318 $3,335
24Page Wednesday, July 23, 2008
52

San Diego Region (in $000s)2008 Regional Transportation Improvement Program
MPO ID:TITLE:
COR08Orange Avenue Extended Left Hand
Turn Lane (300 block)
Coronado, City of
Capacity Status: NCI 08-00RTIP #:Other - Intersection channelization projectsExempt Category:
From Orange Ave to Third Street - extend a single left turn lane for southbound Orange Avenue from the
existing location approximately mid-block to Third Street providing a continuous left turn lane for
southbound traffic for the entire length of the block (from Third to Fourth Street)
DESCRIPTION:
EST TOTAL COST: $145
CONRWPEPRIORTOTAL 08/09 09/10 10/11 11/12 12/13
Toll - Managed Lanes $145 $145 $20 $125
TOTAL $145 $145 $20 $125
MPO ID:TITLE:
COR09Sixth and Orange Drainage
Improvements
Capacity Status: NCI 08-00RTIP #:Other - Plantings, landscaping, etcExempt Category:
Tenth Street between C and Orange Avenues, Along C Avenue between Eighth Street and Tenth Street,
Along Sixth Street between C and Orange Avenues - will install storm drain lines and catch basins to
reduce the number of times the area floods during minor (ten year storm events)
DESCRIPTION:
EST TOTAL COST: $975
CONRWPEPRIORTOTAL 08/09 09/10 10/11 11/12 12/13
Local Funds $656 $526 $130 $126 $530
Toll - Managed Lanes $224 $4 $220 $64 $160
TransNet - L $95 $95 $95
TOTAL $975 $530 $445 $190 $785
25Page Wednesday, July 23, 2008
53

San Diego Region (in $000s)2008 Regional Transportation Improvement Program
MPO ID:TITLE:
DM01Resurfacing & Drainage Projects
Del Mar, City of
Capacity Status: NCI 08-00RTIP #:Safety - Pavement resurfacing and/or rehabilitationExempt Category: (Maint)
Citywide - resurface and/or rehabilitate roadwaysDESCRIPTION:
EST TOTAL COST: $1,691
CONRWPEPRIORTOTAL 08/09 09/10 10/11 11/12 12/13
Local Funds $590 $590 $590
TransNet - L $857 $857 $857
TransNet - LSI $244 $58 $60 $62 $64 $244
TOTAL $1,691 $1,447 $58 $60 $62 $64 $1,691
MPO ID:TITLE:
DM02Local Match to Bridge Retrofit
Projects
Capacity Status: NCI 08-00RTIP #:Safety - Non capacity widening or bridge reconstructionExempt Category: (CR)
At N. Torrey Pines Bridge, CDM Bridge over San Dieguito River - local match to federal Highway Bridge
Program providing for seismic retrofit (part of CAL44)
DESCRIPTION:
EST TOTAL COST: $20,000
CONRWPEPRIORTOTAL 08/09 09/10 10/11 11/12 12/13
TransNet - LSI $298 $186 $12 $100 $12 $286
TOTAL $298 $186 $12 $100 $12 $286
MPO ID:TITLE:
DM03Jimmy Durante Blvd. Northbound lane
Capacity Status: NCI 08-00RTIP #:Safety - Pavement resurfacing and/or rehabilitationExempt Category: (CR)
Jimmy Durante Blvd. from Camino Del Mar to South of San Dieguito Drive - grind and 2" overlayDESCRIPTION:
EST TOTAL COST: $160
CONRWPEPRIORTOTAL 08/09 09/10 10/11 11/12 12/13
TransNet - LSI $160 $121 $39 $160
TOTAL $160 $121 $39 $160
MPO ID:TITLE:
DM04Camino Del Mar Major Rehabilitation
Projects
Capacity Status: NCI 08-00RTIP #:Safety - Pavement resurfacing and/or rehabilitationExempt Category: (CR)
From 4th to 9th Street and from 13th to 15th Street - on Camino Del Mar, grind and 2" overlayDESCRIPTION:
EST TOTAL COST: $295
CONRWPEPRIORTOTAL 08/09 09/10 10/11 11/12 12/13
TransNet - LSI $295 $145 $150 $295
TOTAL $295 $145 $150 $295
26Page Wednesday, July 23, 2008
54

San Diego Region (in $000s)2008 Regional Transportation Improvement Program
MPO ID:TITLE:
EL03Overlay/Reconstruction Projects
El Cajon, City of
Capacity Status: NCI 08-00RTIP #:Safety - Pavement resurfacing and/or rehabilitationExempt Category: (CR)
Washington Ave., from Avocado to City limits, Fletcher Parkway from Hacienda to SR67, Cuyamaca,
Weld Blvd. to Fletcher Pkwy., East Main Street, Third Street and Johnson Ave. , Mollison St. from Main
St. to Washington in Fletcher Hills area - street reconstruction and overlays of 2" - 3" thick, including
collectors, thoroughfares & residential streets
DESCRIPTION:
EST TOTAL COST: $12,972
CONRWPEPRIORTOTAL 08/09 09/10 10/11 11/12 12/13
TransNet - L $6,647 $4,947 $1,700 $6,647
TransNet - L (Cash) $2,500 $600 $1,900 $2,500
TransNet - LSI $3,825 $1,125 $1,300 $1,400 $3,825
TOTAL $12,972 $5,547 $4,725 $1,300 $1,400 $12,972
MPO ID:TITLE:
EL06Traffic Signals Projects
Capacity Status: NCI 08-00RTIP #:Other - Traffic signal synchronization projectsExempt Category: (CR)
Magnolia @ Main St., Magnolia @ Douglas, New Signal at Main St and I-8 - new or modify traffic signals
and Traffic Management Center through installation of passive-permissive left turn phases
DESCRIPTION:
EST TOTAL COST: $1,560
CONRWPEPRIORTOTAL 08/09 09/10 10/11 11/12 12/13
TransNet - L $580 $580 $580
TransNet - L (Cash) $300 $300 $300
TransNet - LSI $680 $280 $200 $200 $680
TOTAL $1,560 $880 $280 $200 $200 $1,560
MPO ID:TITLE:
EL11Sidewalk and other Repairs
Capacity Status: NCI 08-00RTIP #:Safety - Pavement resurfacing and/or rehabilitationExempt Category: (Maint)
Various locations - repair broken sidewalk, driveway, ramps, etc.DESCRIPTION:
EST TOTAL COST: $1,200
CONRWPEPRIORTOTAL 08/09 09/10 10/11 11/12 12/13
TransNet - L $600 $600 $150 $450
TransNet - L (Cash) $150 $150 $150
TransNet - LSI $450 $150 $150 $150 $450
TOTAL $1,200 $750 $150 $150 $150 $150 $1,050
MPO ID:TITLE:
EL17Pavement Management System
Capacity Status: NCI 08-00RTIP #:Other - Engineering studiesExempt Category:
Citywide - provide for the inspection, ranking and GIS database for the city's pavement inventory and
provide a management program to efficiently manage its pavement infrastructure needs
DESCRIPTION:
EST TOTAL COST: $300
CONRWPEPRIORTOTAL 08/09 09/10 10/11 11/12 12/13
TransNet - L $300 $300 $300
TOTAL $300 $300 $300
27Page Wednesday, July 23, 2008
55

San Diego Region (in $000s)2008 Regional Transportation Improvement Program
MPO ID:TITLE:
EL18Street Light Installation Projects
El Cajon, City of
Capacity Status: NCI 08-00RTIP #:Safety - Lighting improvementsExempt Category: (CR)
Broadway from Main Street to City Limits - provide for new street lights which include removing wooden
pole mounted lights with utility underground
DESCRIPTION:
EST TOTAL COST: $100
CONRWPEPRIORTOTAL 08/09 09/10 10/11 11/12 12/13
TransNet - LSI $100 $100 $100
TOTAL $100 $100 $100
MPO ID:TITLE:
EL19Pedestrian Ramp Project - Various
Locations
Capacity Status: NCI 08-00RTIP #:Air Quality - Bicycle and pedestrian facilitiesExempt Category: (CR)
In the Fletcher Hills area: Chatham St., Hacienda Dr., Dryden Rd., and Garfield Ave. - installation of
pedestrian ramps to meet ADA regulations
DESCRIPTION:
EST TOTAL COST: $300
CONRWPEPRIORTOTAL 08/09 09/10 10/11 11/12 12/13
TransNet - LSI $300 $75 $75 $75 $75 $300
TOTAL $300 $75 $75 $75 $75 $300
MPO ID:TITLE:
EL20Traffic Signal Red Light Bulb
Replacement
Capacity Status: NCI 08-00RTIP #:Other - Traffic signal synchronization projectsExempt Category: (Maint)
Citywide - replace red lights on all signalsDESCRIPTION:
EST TOTAL COST: $100
CONRWPEPRIORTOTAL 08/09 09/10 10/11 11/12 12/13
TransNet - LSI $100 $100 $100
TOTAL $100 $100 $100
MPO ID:TITLE:
EL21Street Resurfacing with slurry seals
and ARAM products
Capacity Status: NCI 08-00RTIP #:Safety - Pavement resurfacing and/or rehabilitationExempt Category: (Maint)
In Fletcher Hills area - street resurfacing with slurry seals and asphalt rubber aggregate membrane
(ARAM)
DESCRIPTION:
EST TOTAL COST: $1,000
CONRWPEPRIORTOTAL 08/09 09/10 10/11 11/12 12/13
TransNet - LSI $1,000 $200 $400 $400 $1,000
TOTAL $1,000 $200 $400 $400 $1,000
28Page Wednesday, July 23, 2008
56

San Diego Region (in $000s)2008 Regional Transportation Improvement Program
MPO ID:TITLE:
ENC14AStreet Overlay Program
Encinitas, City of
Capacity Status: NCI 08-00RTIP #:Safety - Pavement resurfacing and/or rehabilitationExempt Category: (CR)
Encinitas Boulevard – Willowspring to Rancho Santa Fe Road, Rancho Santa Fe Road – Manchester Ave.
to La Bajada Bridge, San Elijo Avenue – Manchester Ave. to Montgomery, Willowspring Drive – Cerro St.
to the ERGC Golf Cart Crossing, Cerro Street – Encinitas Blvd. to Willowspring Drive, Leucadia Blvd. –
Hermes to Hymettus Avenue, San Dieguito – Requeza to Melba, Woodmoss Ct. – Willowspring Dr. to
End, Winsome Place – Mountain Vista to End - asphalt grinding, 6" dig outs, and 1-1/2" polymer modified
asphalt overlay
DESCRIPTION:
EST TOTAL COST: $5,760
CONRWPEPRIORTOTAL 08/09 09/10 10/11 11/12 12/13
Local Funds $4,400 $600 $950 $950 $950 $950 $4,400
TransNet - LSI $1,360 $450 $150 $200 $250 $310 $1,360
TOTAL $5,760 $1,050 $1,100 $1,150 $1,200 $1,260 $5,760
MPO ID:TITLE:
ENC17Safe Routes to School Sidewalk
Program
Capacity Status: NCI 08-00RTIP #:Air Quality - Bicycle and pedestrian facilitiesExempt Category: (Maint)
Sidewalks on Balour Drive from Santa Fe Drive to Melba, on Cereus Street from Hermes Avenue to Hygeia
Ave., and on Westminster/Summit from Verdi to Montgomery, Hygeia Ave. from Leucadia Blvd. to 200'
south - installation of pathways to include curb, gutter, drainage improvements and landscaping where
appropriate
DESCRIPTION:
EST TOTAL COST: $2,897
CONRWPEPRIORTOTAL 08/09 09/10 10/11 11/12 12/13
Local Funds $227 $227 $227
TransNet - L $1,370 $1,370 $1,370
TransNet - L (Cash) $550 $300 $250 $550
TransNet - LSI $750 $250 $250 $250 $750
TOTAL $2,897 $1,597 $300 $250 $250 $250 $250 $2,897
MPO ID:TITLE:
ENC19Traffic Safety/Calming
Capacity Status: NCI 08-00RTIP #:Safety - Non signalization traffic control and operatngExempt Category: (CR)
On Rubenstein Avenue, Summit Avenue and Westminster Drive - install traffic safety and calming
improvements such as speed humps, chicanes, narrowing roadway, landscaped pop-outs and stop signs
DESCRIPTION:
EST TOTAL COST: $1,380
CONRWPEPRIORTOTAL 08/09 09/10 10/11 11/12 12/13
Local Funds $180 $180 $180
TransNet - L $450 $450 $450
TransNet - LSI $750 $150 $150 $150 $150 $150 $750
TOTAL $1,380 $630 $150 $150 $150 $150 $150 $1,380
29Page Wednesday, July 23, 2008
57

San Diego Region (in $000s)2008 Regional Transportation Improvement Program
MPO ID:TITLE:
ENC20North Coast Highway 101
Beautification
Encinitas, City of
Capacity Status: NCI 08-00RTIP #:Other - Plantings, landscaping, etcExempt Category: (CR)
N. Coast Hwy. 101 from A Street to La Costa Avenue - design/construct comprehensive streetscape
improvements: new curb, gutter, sidewalk and landscaping - the preferred design includes pedestrian and
bicycle improvements, lane reconfiguration, and five traffic circles to facilitate and ease traffic congestion
and more efficiently move vehicular traffic
DESCRIPTION:
EST TOTAL COST: $3,100
CONRWPEPRIORTOTAL 08/09 09/10 10/11 11/12 12/13
TransNet - L $500 $500 $500
TransNet - L (Cash) $600 $100 $500 $600
TransNet - LSI $2,000 $500 $500 $500 $500 $2,000
TOTAL $3,100 $600 $500 $500 $500 $500 $500 $1,100 $2,000
MPO ID:TITLE:
ENC28Traffic Signal Modifications
Capacity Status: NCI 08-00RTIP #:Other - Traffic signal synchronization projectsExempt Category: (Maint)
On Santa Fe Drive, El Camino Real and Encinitas Boulevard - install radio communication to traffic
signals, hard wiring system to traffic signals
DESCRIPTION:
EST TOTAL COST: $650
CONRWPEPRIORTOTAL 08/09 09/10 10/11 11/12 12/13
TransNet - L $100 $100 $100
TransNet - L (Cash) $300 $300 $300
TransNet - LSI $250 $50 $50 $50 $50 $50 $250
TOTAL $650 $400 $50 $50 $50 $50 $50 $650
MPO ID:TITLE:
ENC31I-5/Encinitas Blvd. Interchange
Modification
Capacity Status: CI 08-00RTIP #:
At I-5/Encinitas Blvd. Interchange - modify interchange to improve safety and alleviate congestion (design
only)
DESCRIPTION:
EST TOTAL COST:RTP PAGE NO: A-5
RAS (TA 7-44)
$1,330
CONRWPEPRIORTOTAL 08/09 09/10 10/11 11/12 12/13
Local Funds $1,330 $1,000 $330 $1,330
TOTAL $1,330 $1,000 $330 $1,330
MPO ID:TITLE:
ENC32Encinitas Pedestrian Crossing
Capacity Status: NCI 08-00RTIP #:Safety - Railroad/highway crossingExempt Category:
Along LOSSAN railroad (MP 235.1 to 239.5) from La Costa Avenue to Chesterfield Drive - PE, PS&E for 4
grade separated crossings located at Montgomery Ave., Santa Fe Drive, El Portal and Hillcrest;
construction of Phase I at Santa Fe Drive
DESCRIPTION:
EST TOTAL COST: $25,000
CONRWPEPRIORTOTAL 08/09 09/10 10/11 11/12 12/13
Local Funds $1,725 $225 $1,500 $1,725
STIP-IIP PTA $1,248 $1,248 $1,248
TCRP $4,000 $1,248 $2,752 $1,248 $2,752
TOTAL $6,973 $1,473 $5,500 $1,248 $5,725
30Page Wednesday, July 23, 2008
58

San Diego Region (in $000s)2008 Regional Transportation Improvement Program
MPO ID:TITLE:
ENC41Improvements to the Leucadia
Blvd./Coast Hwy. 101/Vulcan Avenue
Intersection
Encinitas, City of
Capacity Status: NCI 08-00RTIP #:Safety - Railroad/highway crossingExempt Category:
Leucadia Blvd. from Vulcan Ave. to N. Coast Hwy. 101 - at-grade vehicular railroad crossing in the vicinity
of Cadmus Street
DESCRIPTION:
EST TOTAL COST: $1,050
CONRWPEPRIORTOTAL 08/09 09/10 10/11 11/12 12/13
Local Funds $1,000 $250 $750 $1,000
TransNet - L $50 $50 $50
TOTAL $1,050 $300 $750 $50 $1,000
MPO ID:TITLE:
ENC42Pavement Management Plan
Capacity Status: NCI 08-00RTIP #:Other - Engineering studiesExempt Category:
Citywide - develop a pavement maintenance schedule to set priorities for streets to be paved within the
next several fiscal years
DESCRIPTION:
EST TOTAL COST: $100
CONRWPEPRIORTOTAL 08/09 09/10 10/11 11/12 12/13
TransNet - L $100 $100 $100
TOTAL $100 $100 $100
31Page Wednesday, July 23, 2008
59

San Diego Region (in $000s)2008 Regional Transportation Improvement Program
MPO ID:TITLE:
ESC02Bear Valley/East Valley/Valley
Center
Escondido, City of
Capacity Status: CI 08-00RTIP #:(CR)
Bear Valley/East Valley from Citrus Avenue to Beven Drive - realignment and widening from 2 to 4 lanesDESCRIPTION:
EST TOTAL COST:RAS (TA 7-44) $11,992
CONRWPEPRIORTOTAL 08/09 09/10 10/11 11/12 12/13
Local Funds $2,431 $2,431 $229 $802 $1,400
RSTP $7,969 $7,969 $1,771 $6,198
TransNet - L $192 $192 $192
TransNet - LSI $1,400 $1,400 $1,400
TOTAL $11,992 $10,400 $1,592 $2,000 $7,000 $2,992
MPO ID:TITLE:
ESC02AEast Valley/Valley Center
Capacity Status: CI 08-00RTIP #:(CR)
East Valley Pkwy to Valley Center Dr, New Eureka Ranch St to E. Valley Pkwy - widen roadway from 4 to
6 lanes with raised medians and left turn pockets; modify signal at Lake Wohlford and Valley Center Road;
widen bridge over Escondido Creek
DESCRIPTION:
EST TOTAL COST:EARMARK NO: CA332/260
RAS (TA 7-44)
$12,627
CONRWPEPRIORTOTAL 08/09 09/10 10/11 11/12 12/13
HPP $1,600 $1,600 $1,600
Local Funds $1,342 $1,342 $256 $1,086
RSTP $7,969 $7,969 $1,771 $6,198
TransNet - L $1,396 $1,396 $229 $1,167
TransNet - LSI $320 $320 $200 $120
TOTAL $12,627 $10,707 $1,920 $2,200 $7,621 $2,806
MPO ID:TITLE:
ESC03Citracado Parkway
Capacity Status: CI 08-00RTIP #:
Citracado from Don Lee to Vineyard - widen from 2 to 4 lanes with left turn pockets and new traffic signal
at Aero Way and Citracado Parkway
DESCRIPTION:
EST TOTAL COST:RAS (TA 7-44) $11,773
CONRWPEPRIORTOTAL 08/09 09/10 10/11 11/12 12/13
Local Funds $2,400 $1,800 $600 $600 $1,800
TransNet - L $4,800 $4,800 $100 $4,700
TransNet - L (Cash) $4,573 $173 $4,400 $4,573
TOTAL $11,773 $6,773 $5,000 $100 $600 $11,073
32Page Wednesday, July 23, 2008
60

San Diego Region (in $000s)2008 Regional Transportation Improvement Program
MPO ID:TITLE:
ESC04Citracado Parkway II
Escondido, City of
Capacity Status: CI 08-00RTIP #:(CR)
Citracado Parkway from West Valley to Harmony Grove - widen from 2 to 4 lanes with raised medians,
construct bridge over Escondido Creek
DESCRIPTION:
EST TOTAL COST:RAS (TA 7-44) $21,129
CONRWPEPRIORTOTAL 08/09 09/10 10/11 11/12 12/13
HUD $908 $908 $908
Local Funds $13,641 $13,000 $162 $166 $161 $152 $200 $1,000 $12,441
TransNet - L $581 $581 $581
TransNet - LSI $5,999 $1,796 $2,226 $1,977 $5,999
TOTAL $21,129 $14,489 $1,958 $2,392 $2,138 $152 $1,108 $1,581 $18,440
MPO ID:TITLE:
ESC05El Norte Parkway Phase IV
Capacity Status: CI 08-00RTIP #:
From La Honda Drive at citrus/Mission Avenue to e. Washington Avenue - widen from 2 to 4 lanes and
construct missing section of El Norte Pkwy. with left turn pockets, raised medians and new traffic signals
DESCRIPTION:
EST TOTAL COST:RAS (TA 7-44) $4,586
CONRWPEPRIORTOTAL 08/09 09/10 10/11 11/12 12/13
TransNet - L $4,235 $4,235 $4,235
TransNet - L (Cash) $351 $351 $351
TOTAL $4,586 $4,235 $351 $4,586
MPO ID:TITLE:
ESC06El Norte Parkway Bridge at
Escondido Creek
Capacity Status: CI 08-00RTIP #:
El Norte Parkway from Kaile Lane to Key Lime Way - construct missing two lane bridge at Escondido
Creek
DESCRIPTION:
EST TOTAL COST:RAS (TA 7-44) $4,950
CONRWPEPRIORTOTAL 08/09 09/10 10/11 11/12 12/13
Local Funds $650 $650 $650
TransNet - L $2,350 $2,350 $50 $2,300
TransNet - L (Cash) $1,950 $1,950 $1,950
TOTAL $4,950 $3,000 $1,950 $50 $4,900
MPO ID:TITLE:
ESC08Felicita Ave/Juniper Street
Capacity Status: CI 08-00RTIP #:
From Escondido Boulevard to Juniper Street and from Juniper Street to Chestnut Street - widen from 2 to
4 lanes with left turn pockets, raised medians on Felicita; new traffic signals at Juniper and Chestnut,
Juniper and 13th Ave., Juniper and 15th Ave.; modify traffic signal at Juniper and Felicita
DESCRIPTION:
EST TOTAL COST: $5,186
CONRWPEPRIORTOTAL 08/09 09/10 10/11 11/12 12/13
Local Funds $3,500 $2,000 $1,500 $3,500
TransNet - L $1,356 $1,356 $50 $1,306
TransNet - L (Cash) $330 $330 $330
TOTAL $5,186 $3,356 $1,830 $50 $5,136
33Page Wednesday, July 23, 2008
61

San Diego Region (in $000s)2008 Regional Transportation Improvement Program
MPO ID:TITLE:
ESC09Ninth Avenue
Escondido, City of
Capacity Status: CI 08-00RTIP #:(CR)
Ninth Avenue from La Terraza to Spruce - widen from 2 to 4 lanes with raised median and modify traffic
signals at Ninth Ave and Tulip Street
DESCRIPTION:
EST TOTAL COST: $2,977
CONRWPEPRIORTOTAL 08/09 09/10 10/11 11/12 12/13
TransNet - L $160 $160 $160
TransNet - LSI $2,817 $365 $2,452 $100 $100 $2,617
TOTAL $2,977 $160 $365 $2,452 $260 $100 $2,617
MPO ID:TITLE:
ESC11Street Rehabilitation & Resurface
Capacity Status: NCI 08-00RTIP #:Safety - Pavement resurfacing and/or rehabilitationExempt Category: (Maint)
Citywide - reconstruction, resurfacing, chip sealing, crack filling, sidewalk repairDESCRIPTION:
EST TOTAL COST: $17,946
CONRWPEPRIORTOTAL 08/09 09/10 10/11 11/12 12/13
Local Funds $9,051 $3,771 $1,475 $1,583 $1,645 $302 $275 $500 $8,551
TransNet - L $2,404 $2,304 $100 $2,404
TransNet - L (Cash) $1,500 $1,500 $1,500
TransNet - LSI $4,991 $907 $946 $995 $1,047 $1,096 $4,991
TOTAL $17,946 $6,075 $3,982 $2,529 $2,640 $1,349 $1,371 $500 $17,446
MPO ID:TITLE:
ESC13Nordahl Road Bridge @ SR-78
Capacity Status: NCI 08-00RTIP #:Safety - Non capacity widening or bridge reconstructionExempt Category:
Nordahl Road from Mission Ave. to Montiel Road - widen Nordahl Road overcrossing 12 feet to
accommodate operational improvements through left-turn storage at the ramp intersections; widen the
eastbound and westbound exit ramps to provide three lanes at the intersections; widen Nordahl Road to
provide a dedicated right-turn onto Montiel Road (no additional travel lanes)
DESCRIPTION:
EST TOTAL COST:RAS (TA 7-44) $5,286
CONRWPEPRIORTOTAL 08/09 09/10 10/11 11/12 12/13
DEMO - TEA 21 $2,250 $2,250 $1,200 $100 $950
RSTP $300 $300 $300
TransNet - L $736 $736 $191 $25 $520
TransNet - L (Cash) $2,000 $2,000 $2,000
TOTAL $5,286 $3,286 $2,000 $1,691 $125 $3,470
MPO ID:TITLE:
ESC17Neighborhood Projects
Capacity Status: NCI 08-00RTIP #:Safety - Pavement resurfacing and/or rehabilitationExempt Category:
Citywide - curb & gutter, sidewalks, street lights and other misc. street improvementsDESCRIPTION:
EST TOTAL COST: $1,800
CONRWPEPRIORTOTAL 08/09 09/10 10/11 11/12 12/13
TransNet - L $1,750 $1,750 $200 $1,550
TransNet - L (Cash) $50 $50 $50
TOTAL $1,800 $1,750 $50 $200 $1,600
34Page Wednesday, July 23, 2008
62

San Diego Region (in $000s)2008 Regional Transportation Improvement Program
MPO ID:TITLE:
ESC23Valley/Maple and 2nd/Maple Traffic
Signals
Escondido, City of
Capacity Status: NCI 08-00RTIP #:Other - Intersection signalization projectsExempt Category:
At the intersections of Valley Parkway/Maple Street and Second Avenue/Maple Street - construct two new
traffic signals
DESCRIPTION:
EST TOTAL COST: $874
CONRWPEPRIORTOTAL 08/09 09/10 10/11 11/12 12/13
Local Funds $74 $74 $15 $59
TransNet - L $400 $400 $400
TransNet - L (Cash) $400 $400 $400
TOTAL $874 $474 $400 $15 $859
MPO ID:TITLE:
ESC24Centre City Parkway
Capacity Status: CI 08-00RTIP #:
Centre City Parkway from Mission Road to SR 78 - widen 4 lanes to 6 lanes with intersection
improvements
DESCRIPTION:
EST TOTAL COST:RAS (TA 7-44) $3,220
CONRWPEPRIORTOTAL 08/09 09/10 10/11 11/12 12/13
Local Funds $846 $846 $300 $100 $446
TransNet - L $974 $974 $974
TransNet - L (Cash) $1,400 $1,400 $1,400
TOTAL $3,220 $1,820 $1,400 $300 $100 $2,820
MPO ID:TITLE:
ESC25Citracado/Nordahl
Capacity Status: CI 08-00RTIP #:
Citracado/Nordahl from Country Club Lane to SR 78 - widen from 4 lanes to 6 lanes with double left turn
lanes and exclusive right turn lanes
DESCRIPTION:
EST TOTAL COST:RAS (TA 7-44) $3,776
CONRWPEPRIORTOTAL 08/09 09/10 10/11 11/12 12/13
Local Funds $477 $477 $25 $452
TransNet - H (78) $2,154 $2,154 $2,154
TransNet - L $900 $900 $375 $200 $325
TransNet - L (Cash) $245 $245 $245
TOTAL $3,776 $3,531 $245 $400 $200 $3,176
MPO ID:TITLE:
ESC29Citracado Parkway I-15 to West
Valley Parkway,
Capacity Status: CI 08-00RTIP #:
Citracado from I-15 to West Valley Pkwy - environmental and preliminary engineering, designated in the
General Plan as a Major Road, 102-ft Right-of-way, 82-ft curb to curb
DESCRIPTION:
EST TOTAL COST: $1,151
CONRWPEPRIORTOTAL 08/09 09/10 10/11 11/12 12/13
TransNet - L (Cash) $1,151 $581 $570 $1,151
TOTAL $1,151 $581 $570 $1,151
35Page Wednesday, July 23, 2008
63

San Diego Region (in $000s)2008 Regional Transportation Improvement Program
MPO ID:TITLE:
ESC30El Norte Parkway Medians and
Landscaping
Escondido, City of
Capacity Status: NCI 08-00RTIP #:Safety - Adding mediansExempt Category: (CR)
El Norte Parkway from Washington Avenue to Valley Parkway - construct stamped concrete medians with
landscape and irrigation
DESCRIPTION:
EST TOTAL COST:RAS (TA 7-44) $909
CONRWPEPRIORTOTAL 08/09 09/10 10/11 11/12 12/13
TransNet - L (Cash) $271 $271 $271
TransNet - LSI $638 $638 $100 $538
TOTAL $909 $909 $100 $809
MPO ID:TITLE:
ESC31Lake Hodges Bicycle and Pedestrian
Bridge
Capacity Status: NCI 08-00RTIP #:Air Quality - Bicycle and pedestrian facilitiesExempt Category:
Across Lake Hodges - construction of a bicycle and pedestrian bridge across Lake Hodges on the west
side of I-15
DESCRIPTION:
EST TOTAL COST: $1,875
CONRWPEPRIORTOTAL 08/09 09/10 10/11 11/12 12/13
TDA - Bicycles $1,696 $1,696 $1,696
TransNet - BPNS $179 $179 $179
TOTAL $1,875 $1,875 $1,875
project being implemented by the San Dieguito River Park*
36Page Wednesday, July 23, 2008
64

San Diego Region (in $000s)2008 Regional Transportation Improvement Program
MPO ID:TITLE:
IB02Street Maintenance Operations
Imperial Beach, City of
Capacity Status: NCI 08-00RTIP #:Safety - Pavement resurfacing and/or rehabilitationExempt Category: (Maint)
Various locations - street maintenanceDESCRIPTION:
EST TOTAL COST: $2,696
CONRWPEPRIORTOTAL 08/09 09/10 10/11 11/12 12/13
TransNet - L $1,658 $1,658 $1,658
TransNet - LSI $1,038 $190 $197 $207 $217 $227 $1,038
TOTAL $2,696 $1,658 $190 $197 $207 $217 $227 $2,696
MPO ID:TITLE:
IB11SR 75 Vehicle, Bicycle, Transit,
Pedestrian Improvements
Capacity Status: NCI 08-00RTIP #:Air Quality - Bicycle and pedestrian facilitiesExempt Category:
Palm Ave (SR75) from 7th Street to 9th Street - design and construct vehicle, bicycle and public transit
circulation and pedestrian access improvements along and across SR 75, including 7th Street and 9th
Street intersections
DESCRIPTION:
EST TOTAL COST: $300
CONRWPEPRIORTOTAL 08/09 09/10 10/11 11/12 12/13
Local RTCIP $300 $300 $90 $210
TOTAL $300 $300 $90 $210
MPO ID:TITLE:
IB12Major Street Improvements
Capacity Status: NCI 08-00RTIP #:Safety - Pavement resurfacing and/or rehabilitationExempt Category: (CR)
Dahlia St. from 5th St. to Carolina, 5th St. from Palm Ave. to Elm Ave., Grove St. from Connecticut to
Delaware, Delaware Ave. from Grove to Imperial Beach Blvd., Elm Ave. Storm drain from Florence to
Florida, Calla Storm Srain from 532 Calla to Rainbow, 9th Steet Overlay from Calla to Imperial Beach Blvd.
- work includes but not limited to overlay, new sidewalks, curbs and gutters, ramps, and storm drain
DESCRIPTION:
EST TOTAL COST: $2,421
CONRWPEPRIORTOTAL 08/09 09/10 10/11 11/12 12/13
TransNet - LSI $2,421 $443 $460 $483 $506 $529 $727 $1,694
TOTAL $2,421 $443 $460 $483 $506 $529 $727 $1,694
37Page Wednesday, July 23, 2008
65

San Diego Region (in $000s)2008 Regional Transportation Improvement Program
MPO ID:TITLE:
LAM17Street Construction
La Mesa, City of
Capacity Status: NCI 08-00RTIP #:Safety - Pavement resurfacing and/or rehabilitationExempt Category: (CR)
FY09 - Jackson Drive Rehabilitation Project (Jackson Drive from Fletcher Pkwy. to northern city limits),
FY09 - 2008 Resurfacing Projects: Boulder Drive, Chevy Chase, from Hillcrest Ave. To Sunrise Ave.,
Colina Drive from Orchard Way to end of street, Crowder Lane from Lemon Ave. to Hillcrest Ave., Grape
Street from Lee Ave. to Normal Ave., Hillcrest Ave., Lee Aven. from University Ave. to Grape Street,
Maiden Lane, Normal Ave. from Windsor Dr. to Lemon Ave., Palm Ave. from University Ave. to Allison
Ave., Spring Street from Allison Ave. to La Mesa Blvd., Summit Drive; FY10 - Baltimore Dr. from northern
city limit to University Ave.; FY11 - Normal Ave. From Lowell St. to Windsor Ave.; FY13 - Normal Avenue
from Windsor Ave. to La Mesa Blvd. - rehabilitate pavement of identified priority streets that are in poor
condition and in need of major reconstruction including removal of existing pavement greater than 1" in
depth, and construction of new structural pavement to provide a smooth travel surface
DESCRIPTION:
EST TOTAL COST: $4,800
CONRWPEPRIORTOTAL 08/09 09/10 10/11 11/12 12/13
TransNet - CP $2,500 $2,500 $150 $2,350
TransNet - L $1,100 $687 $413 $150 $950
TransNet - LSI $1,200 $100 $300 $350 $450 $120 $1,080
TOTAL $4,800 $687 $2,913 $100 $300 $350 $450 $420 $4,380
MPO ID:TITLE:
LAM18Street Maintenance-Various
Capacity Status: NCI 08-00RTIP #:Safety - Pavement resurfacing and/or rehabilitationExempt Category: (Maint)
Citywide - minor repairs or maintenance based on Pavement Management System StudyDESCRIPTION:
EST TOTAL COST: $980
CONRWPEPRIORTOTAL 08/09 09/10 10/11 11/12 12/13
TransNet - L $340 $142 $198 $340
TransNet - LSI $640 $170 $170 $100 $100 $100 $640
TOTAL $980 $142 $368 $170 $100 $100 $100 $980
MPO ID:TITLE:
LAM19Update Pavement Management Study
Capacity Status: NCI 08-00RTIP #:Other - Engineering studiesExempt Category: (Maint)
Citywide - updates to the existing Pavement Management System Study to determine condition of city
streets
DESCRIPTION:
EST TOTAL COST: $75
CONRWPEPRIORTOTAL 08/09 09/10 10/11 11/12 12/13
TransNet - L $50 $21 $29 $50
TransNet - LSI $25 $5 $5 $5 $5 $5 $25
TOTAL $75 $21 $34 $5 $5 $5 $5 $75
MPO ID:TITLE:
LAM20Curb and Gutter and Sidewalk
Capacity Status: NCI 08-00RTIP #:Safety - Pavement resurfacing and/or rehabilitationExempt Category: (Maint)
Citywide - remove and replace identified and prioritized tripping hazardsDESCRIPTION:
EST TOTAL COST: $875
CONRWPEPRIORTOTAL 08/09 09/10 10/11 11/12 12/13
TransNet - L $200 $83 $117 $200
TransNet - LSI $675 $100 $125 $150 $150 $150 $675
TOTAL $875 $83 $217 $125 $150 $150 $150 $875
38Page Wednesday, July 23, 2008
66

San Diego Region (in $000s)2008 Regional Transportation Improvement Program
MPO ID:TITLE:
LAM21Street Lights for Utility
Undergrounding
La Mesa, City of
Capacity Status: NCI 08-00RTIP #:Safety - Lighting improvementsExempt Category: (CR)
Parkway Dr. from Marengo to Lambda Ln., Spring St. from Park Ave. to southern city limits, Orien Ave.
from Lowell St. to 7463 Orien Ave., Normal Ave. from Lowell St. to Windsor Ave., Waite Dr. from western
city limit to High St., Massachusetts Ave. from University Ave. to southern city limits - installation of new
streetlights to bring underground districts up to current city standards
DESCRIPTION:
EST TOTAL COST: $200
CONRWPEPRIORTOTAL 08/09 09/10 10/11 11/12 12/13
TransNet - L $100 $42 $58 $100
TransNet - LSI $100 $20 $20 $20 $20 $20 $100
TOTAL $200 $42 $78 $20 $20 $20 $20 $200
MPO ID:TITLE:
LAM22Traffic Signal Upgrades - Various
Capacity Status: NCI 08-00RTIP #:Other - Intersection signalization projectsExempt Category: (CR)
Lake Murray @ El Paso, Lake Murray @ Baltimore - improve existing traffic signal and intersection
locations by providing safety improvements such as protected left turns, overhead signals in lieu of island
signals, and pedestrian ramps for improved pedestrian access
DESCRIPTION:
EST TOTAL COST: $675
CONRWPEPRIORTOTAL 08/09 09/10 10/11 11/12 12/13
TransNet - L $400 $167 $233 $45 $355
TransNet - LSI $275 $75 $100 $100 $25 $250
TOTAL $675 $167 $233 $75 $100 $100 $70 $605
MPO ID:TITLE:
LAM23Pedestrian Ramps-Various
Capacity Status: NCI 08-00RTIP #:Air Quality - Bicycle and pedestrian facilitiesExempt Category: (Maint)
Citywide - install pedestrian ramps in the sidewalk where there is no existing access, in order to comply
with the Americans with Disabilities Act.
DESCRIPTION:
EST TOTAL COST: $350
CONRWPEPRIORTOTAL 08/09 09/10 10/11 11/12 12/13
TransNet - L $100 $42 $58 $100
TransNet - LSI $250 $50 $50 $50 $50 $50 $250
TOTAL $350 $42 $108 $50 $50 $50 $50 $350
MPO ID:TITLE:
LAM24Roadway Drainage Improvements
Capacity Status: NCI 08-00RTIP #:Safety - Pavement resurfacing and/or rehabilitationExempt Category: (CR)
Johnson St. from Garfield St. to 8975 Johnson St., Adams Avenue Drainage Impr between Adams/Tower
Avenues, Amaya Dr. from Water St to Primrose Lane, Schuyler area - improvements to address
inadequate street drainage by constructing new or improving existing storm drain or surface improvements,
reducing congestion by improved vehicular and pedestrian flow all year around
DESCRIPTION:
EST TOTAL COST: $1,410
CONRWPEPRIORTOTAL 08/09 09/10 10/11 11/12 12/13
TransNet - L $160 $67 $93 $18 $142
TransNet - LSI $1,250 $350 $300 $200 $200 $200 $125 $1,125
TOTAL $1,410 $67 $443 $300 $200 $200 $200 $143 $1,267
39Page Wednesday, July 23, 2008
67

San Diego Region (in $000s)2008 Regional Transportation Improvement Program
MPO ID:TITLE:
LAM25Traffic Calming -Various
La Mesa, City of
Capacity Status: NCI 08-00RTIP #:Safety - Non signalization traffic control and operatngExempt Category: (Maint)
Citywide - Implement traffic calming measures including signing and striping, speed bumps and other
similar measures.
DESCRIPTION:
EST TOTAL COST: $225
CONRWPEPRIORTOTAL 08/09 09/10 10/11 11/12 12/13
TransNet - L $100 $42 $58 $100
TransNet - LSI $125 $25 $25 $25 $25 $25 $125
TOTAL $225 $42 $83 $25 $25 $25 $25 $225
40Page Wednesday, July 23, 2008
68

San Diego Region (in $000s)2008 Regional Transportation Improvement Program
MPO ID:TITLE:
LG13Street Improvements (Congestion
Relief)
Lemon Grove, City of
Capacity Status: CI 08-00RTIP #:(CR)
Various - Massachusetts Avenue Corridor Project: This project will design and construct improvements at
multiple intersections along Massachusetts Avenue. Those intersections include Broadway Avenue, San
Miguel Avenue, and Lemon Grove Avenue/Main Street/Canton Drive/San Altos Place; all locations
intersect with Massachusetts Avenue;
Lemon Grove Avenue Realignment Project: A key project in the redevelopment of the city’s Downtown
Village Specific Plan, this project improves access to and from SR-94, reducing motorist delays and
emissions, while greatly enhancing the visual appeal of the block adjacent to the trolley station. This
project is expected to begin in FY 09 and extend into FY 10;
Pavement Rehabilitation (citywide): This project involves roadway rehabilitation (grinding and overlay or
new structural pavement, or new overlay 1-inch thick or greater) of several streets within the city. Streets
were prioritized for work based on levels of deterioration identified in the Pavement Management System;
LGA Pavement Rehabilitation: The southbound lanes of Lemon Grove Avenue, from Central Avenue to the
southerly city limits, were rehabilitated using rubberized asphalt in October 2007. Rehabilitation of the
north bound lanes awaits the completion of the upgrade to the sewer main on Lemon Grove Avenue. It is
planned that the northbound lanes will be paved immediately after the sewer upgrade project is completed;
Sidewalk Rehabilitation: This annual project adds sidewalks, widens sidewalks, removes and/or replaces
various sidewalk locations and installs ADA compliant curb ramps throughout the city
DESCRIPTION:
EST TOTAL COST: $2,878
CONRWPEPRIORTOTAL 08/09 09/10 10/11 11/12 12/13
TransNet - L (Cash) $1,534 $1,534 $1,534
TransNet - LSI $1,344 $64 $320 $320 $320 $320 $134 $1,210
TOTAL $2,878 $1,598 $320 $320 $320 $320 $134 $2,744
MPO ID:TITLE:
LG14Traffic Improvements (Maintenance)
Capacity Status: NCI 08-00RTIP #:Other - Traffic signal synchronization projectsExempt Category: (Maint)
Citywide - traffic related projects scheduled throughout each fiscal year: traffic loop replacements, traffic
signal upgrades, street striping improvements, traffic calming studies, and the repair or replacement of
street signs; these projects are part of the annual maintenance program established within the City to
maintain the operational readiness of the street system
DESCRIPTION:
EST TOTAL COST: $488
CONRWPEPRIORTOTAL 08/09 09/10 10/11 11/12 12/13
TransNet - LSI $488 $130 $70 $96 $96 $96 $50 $438
TOTAL $488 $130 $70 $96 $96 $96 $50 $438
41Page Wednesday, July 23, 2008
69

San Diego Region (in $000s)2008 Regional Transportation Improvement Program
MPO ID:TITLE:
LG15Storm Drain Rehabilitation
(Maintenance)
Lemon Grove, City of
Capacity Status: NCI 08-00RTIP #:Other - Plantings, landscaping, etcExempt Category: (Maint)
Citywide - improvements or repairs to multiple storm drain facilities such as spot repairs to existing pipes,
berms or other diversion devices; attention will be given to the continuous maintenance of Chollas Creek in
accordance with the requirements of the NPDES permit which involve debris removal, vegetation control,
and/or habitat restoration
DESCRIPTION:
EST TOTAL COST: $50
CONRWPEPRIORTOTAL 08/09 09/10 10/11 11/12 12/13
TransNet - LSI $50 $10 $10 $10 $10 $10 $50
TOTAL $50 $10 $10 $10 $10 $10 $50
MPO ID:TITLE:
LG16Storm Drain Rehabilitation
(Congestion Relief)
Capacity Status: NCI 08-00RTIP #:Other - Plantings, landscaping, etcExempt Category: (CR)
For intersections: Longdale Drive at Myra Street, Olive Street at Pacific Avenue, San Miguel Avenue at
MacArthur Drive, and , San Miguel Avenue at New Jersey Avenue; for point locations: Bakersfield Street,
Colfax Drive, Dennis Lane, Drew Lane, Darryl Street, Elkhorn Street, Ensenada Street, North Avenue, and
San Altos Place - evaluate, prioritize, and implement improvements to the city's storm drain system by
identifying deteriorated or problematic portions of the storm drain system, perform risk assessments to
prioritize need, and perform the necessary construction repairs or replacements to avoid roadway flooding
DESCRIPTION:
EST TOTAL COST: $410
CONRWPEPRIORTOTAL 08/09 09/10 10/11 11/12 12/13
TransNet - LSI $410 $310 $100 $41 $369
TOTAL $410 $310 $100 $41 $369
MPO ID:TITLE:
LG17Street Improvements (Maintenance)
Capacity Status: NCI 08-00RTIP #:Safety - Pavement resurfacing and/or rehabilitationExempt Category: (Maint)
Citywide - Pavement Management System: This is an annual program updating the list of paved streets
needing improvement within the city which involves a survey of city streets, assignment of an objective
score to each street based upon the observed conditions, and finally a prioritized list of needed repairs
DESCRIPTION:
EST TOTAL COST: $75
CONRWPEPRIORTOTAL 08/09 09/10 10/11 11/12 12/13
TransNet - LSI $75 $15 $15 $15 $15 $15 $75
TOTAL $75 $15 $15 $15 $15 $15 $75
MPO ID:TITLE:
LG18Traffic Improvements (Congestion
Relief)
Capacity Status: NCI 08-00RTIP #:Other - Intersection signalization projectsExempt Category: (CR)
The intersections along Broadway Avenue, College Avenue, Federal Boulevard, Lemon Grove Avenue,
Massachusetts Avenue, Sweetwater Way, and Skyline Drive - design, construction, and installation of a
new traffic signals
DESCRIPTION:
EST TOTAL COST: $92
CONRWPEPRIORTOTAL 08/09 09/10 10/11 11/12 12/13
TransNet - LSI $92 $92 $9 $83
TOTAL $92 $92 $9 $83
42Page Wednesday, July 23, 2008
70

San Diego Region (in $000s)2008 Regional Transportation Improvement Program
MPO ID:TITLE:
NC01Plaza Blvd Widening
National City, City of
Capacity Status: CI 08-00RTIP #:(CR)
Plaza Blvd. from Highland Ave. to Euclid Ave. - widen from 2 to 3 lanes including a new traffic lane in each
direction, new sidewalks, sidewalk widening, traffic signal upgrades and interconnection
DESCRIPTION:
EST TOTAL COST:RTP PAGE NO: A-6
RAS (TA 7-45)
$20,000
CONRWPEPRIORTOTAL 08/09 09/10 10/11 11/12 12/13
RSTP $2,000 $2,000 $2,000
TransNet - L $1,092 $1,092 $1,092
TransNet - LSI $974 $174 $200 $200 $200 $200 $974
TOTAL $4,066 $3,092 $174 $200 $200 $200 $200 $4,066
MPO ID:TITLE:
NC03Street Resurfacing Project
Capacity Status: NCI 08-00RTIP #:Safety - Pavement resurfacing and/or rehabilitationExempt Category: (CR)
Harding Avenue (north-end to W. 30th St.), Van Ness Avenue(Leonard St. to 200'south), E. 31st St. (B
Ave. to D Ave., Roosevelt Avenue (north-end to W. 18th St.), Thelma Way (4th St. to E. 5th St.), E Avenue
(E. 20th St. to Cul-de-sac), B Avenue (E. 7th St. to E. 8th St.), E. 5th Street (D Ave. to Highland Ave.), E.
17th St. (N Ave. to Palm Ave.), F Avenue (E. 4th St. to E. 8th St.), Lanoitan Avenue (Division St. to
Melrose St.), Burden Dr. (E. 7th St. to E. 8th St.), E. 1st St. (Euclid Ave. to Clairmont Ave.), E. 24th St.
(N.C. Blvd. to D Ave.), E. 2nd St. (Valva Ave. to Clairmont Ave.) W. 19th St. (Wilson Ave. to Harding Ave.),
E. 3rd St. (Valva Ave. to Clairmont Ave.), W. 16th Street (Hoover Ave. to N.C. Blvd.), Prospect Avenue (E.
20th St. to E. 22nd St.), E. 28th St. (J Ave. to K Ave.), U Avenue (E. 1st St. to E. 4th St.), Paradise Dr.
(PCC Fork in Road to E. 10th St.) E. 5th St. (N.C. Blvd. to D Ave.), E. 5th St. (Q Ave. to R Ave.), N
Avenue (E. 16th St. to E. 18th St.), E. 15th St. (Highland Ave. to K Ave.), G Ave.(E. 21st St. to E. 22nd
St.), E. 7th St. (Palm Ave. to Q Ave.), F Ave. (E. 26th St. to E. 28th St.), E. 18th St. (Highland Ave. to
Palm Ave.), Valva Ave. (Melrose St. to E. 3rd St.), Paradise Drive (E. 8th St. to Fork in Road), Salot Street
(E. 7th St. to E. 8th St.), I Ave. (E. 13th St. to E. 15th St.), Melrose St. (Valva Ave. to Clairmont Ave.), V
Ave. (E. 7th St. to E. 8th St.), C Ave. (E. 18th St. to E. 22nd St.), Terry Lane (R Ave. to East Cul-de-sac),
W. 11th St. (Hoover Ave. to N.C. Blvd.), 40 W. 20th St. (Wilson Ave. to Harding Ave.), E. 16th St. (N Ave.
to Palm Ave.),E. 28th St. (K Ave. to L Ave.) - provide roadway rehabilitation (grinding and new overlay 1
inch thick or greater)and repair of concrete sidewalks, curb and gutters
DESCRIPTION:
EST TOTAL COST: $18,090
CONRWPEPRIORTOTAL 08/09 09/10 10/11 11/12 12/13
Local Funds $5,014 $3,514 $300 $300 $300 $300 $300 $5,014
TransNet - CP $4,500 $4,500 $4,500
TransNet - L $5,313 $5,313 $5,313
TransNet - LSI $3,263 $142 $518 $1,005 $1,598 $3,263
TOTAL $18,090 $8,827 $4,800 $442 $818 $1,305 $1,898 $18,090
43Page Wednesday, July 23, 2008
71

San Diego Region (in $000s)2008 Regional Transportation Improvement Program
MPO ID:TITLE:
NC04Traffic Signal Install/Upgrade
National City, City of
Capacity Status: NCI 08-00RTIP #:Other - Intersection signalization projectsExempt Category: (CR)
National City Boulevard (1st Street to 35th Street), Plaza Boulevard (Roosevelt Avenue to Paradise Valley
Road), Euclid Avenue (Division Street to Sweetwater Road), 30th Street (National City Boulevard to Euclid
Avenue), Harbor Drive (Civic Center Drive to 8th Street), Highland Avenue (Division Street to 30th Street),
8th Street (Harbor Drive to Paradise Valley Road), Division Street (Highland Avenue to Harbison Avenue),
DD Avenue (8th Street to 30th Street), Palm Avenue (Division Street to 18th Street), 18th Street (National
City Boulevard to Euclid Avenue), 24th Street (Tidelands Avenue to Highland Avenue), Sweetwater Road
(Euclid Avenue to Plaza Bonita Center Way) - install and/or upgrade traffic signals
DESCRIPTION:
EST TOTAL COST: $1,465
CONRWPEPRIORTOTAL 08/09 09/10 10/11 11/12 12/13
Local Funds $50 $50 $50
TransNet - L $1,015 $1,015 $1,015
TransNet - LSI $400 $100 $100 $100 $100 $400
TOTAL $1,465 $1,065 $100 $100 $100 $100 $1,465
44Page Wednesday, July 23, 2008
72

San Diego Region (in $000s)2008 Regional Transportation Improvement Program
MPO ID:TITLE:
NCTD01Bus Associated Capital Maintenance
North County Transit District
Capacity Status: NCI 08-00RTIP #:Mass Transit - Rehabilitation of transit vehiclesExempt Category:
NCTD service area - bus tire leaseDESCRIPTION:
EST TOTAL COST: $1,502
CONRWPEPRIORTOTAL 08/09 09/10 10/11 11/12 12/13
FTA 5307 $1,200 $600 $150 $150 $150 $150 $1,200
Local Funds $302 $150 $38 $38 $38 $38 $302
TOTAL $1,502 $750 $188 $188 $188 $188 $1,502
MPO ID:TITLE:
NCTD02Preventive Maintenance
Capacity Status: NCI 08-00RTIP #:Mass Transit - Transit operating assistanceExempt Category:
NCTD service area - fixed route, rail fleet and facility maintenance costsDESCRIPTION:
EST TOTAL COST: $117,091
CONRWPEPRIORTOTAL 08/09 09/10 10/11 11/12 12/13
FTA 5307 $69,139 $36,339 $8,400 $8,400 $8,000 $8,000 $69,139
FTA 5309 (FG) $24,534 $11,034 $3,100 $3,100 $3,600 $3,700 $24,534
Local Funds $23,418 $11,843 $2,875 $2,875 $2,900 $2,925 $23,418
TOTAL $117,091 $59,216 $14,375 $14,375 $14,500 $14,625 $117,091
MPO ID:TITLE:
NCTD03ADA Paratransit Services
Capacity Status: NCI 08-00RTIP #:Mass Transit - Transit operating assistanceExempt Category:
NCTD service area - operating cost associated with providing ADA/paratransit servicesDESCRIPTION:
EST TOTAL COST: $28,219
CONRWPEPRIORTOTAL 08/09 09/10 10/11 11/12 12/13
FTA 5307 $6,014 $3,074 $720 $730 $740 $750 $6,014
Local Funds $19,866 $9,071 $2,365 $2,582 $2,844 $3,004 $19,866
TransNet - ADA $1,228 $286 $298 $314 $330 $1,228
TransNet - Transit (S&D) $1,111 $1,111 $1,111
TOTAL $28,219 $13,256 $3,371 $3,610 $3,898 $4,084 $28,219
MPO ID:TITLE:
NCTD05Bus/ADA/ Revenue Vehicle
Purchases & Related Equipment
Capacity Status: NCI 08-00RTIP #:Mass Transit - Purchase new buses and rail cars to
replace existing vehicles or minor expansions of fleet
Exempt Category:
NCTD service area - purchase replacement vehicles and related equipment; CNG buses, ADA vans and
shuttle vehicles
DESCRIPTION:
EST TOTAL COST: $44,566
CONRWPEPRIORTOTAL 08/09 09/10 10/11 11/12 12/13
FTA 5307 $26,322 $7,379 $1,864 $5,440 $5,709 $5,930 $26,322
FTA 5311 $3,169 $1,686 $349 $363 $378 $393 $3,169
Local Funds $7,375 $2,250 $511 $1,445 $1,636 $1,533 $7,375
TCRP $7,700 $7,700 $7,700
TOTAL $44,566 $19,015 $2,724 $7,248 $7,723 $7,856 $44,566
45Page Wednesday, July 23, 2008
73

San Diego Region (in $000s)2008 Regional Transportation Improvement Program
MPO ID:TITLE:
NCTD06Bus/Rail Support Equipment &
Facility
North County Transit District
Capacity Status: NCI 08-00RTIP #:Mass Transit - Purchase of office, shop and operating
equipment for existing facilities
Exempt Category:
NCTD service area - facility and support equipment for fixed route and rail services including radio
equipment, buildings and structures, shop and garage equipment, computer hardware & software,
furnitures and fixtures, and service vehicles
DESCRIPTION:
EST TOTAL COST: $16,233
CONRWPEPRIORTOTAL 08/09 09/10 10/11 11/12 12/13
FTA 5307 $12,277 $6,046 $2,584 $1,326 $1,133 $1,188 $12,277
Local Funds $3,956 $2,398 $646 $332 $283 $297 $3,956
TOTAL $16,233 $8,444 $3,230 $1,658 $1,416 $1,485 $16,233
MPO ID:TITLE:
NCTD07Fixed Route - Bus Shelters & Stops
Capacity Status: NCI 08-00RTIP #:Mass Transit - Construction of small passenger shelters
and information kiosks
Exempt Category:
NCTD service area - upgrade bus shelters & bus stopsDESCRIPTION:
EST TOTAL COST: $3,642
CONRWPEPRIORTOTAL 08/09 09/10 10/11 11/12 12/13
FTA 5307 $1,644 $216 $180 $184 $184 $880 $1,644
FTA 5316 - JARC $1,270 $736 $534 $100 $1,170
Local Funds $728 $237 $179 $46 $46 $220 $25 $703
TOTAL $3,642 $1,189 $893 $230 $230 $1,100 $125 $3,517
MPO ID:TITLE:
NCTD16Oceanside-Escondido Rail Project
Capacity Status: CI 08-00RTIP #:
From Oceanside to Escondido - design & construct 22 mile light rail (Sprinter) including 15 stations and
maintenance facility
DESCRIPTION:
EST TOTAL COST:EA NO: R599FB PPNO: 8192A $460,266
CONRWPEPRIORTOTAL 08/09 09/10 10/11 11/12 12/13
CMAQ $4,900 $4,900 $4,900
FTA 5309 (NS) $152,100 $152,100 $7,930 $2,097 $142,073
HBRR $61 $61 $61
Local Funds $14,608 $14,608 $14,608
Local Funds AC $41,397 $(16,397) $(12,500) $(12,500)
Prop. 108 $17,615 $17,615 $17,615
STIP-GF RIP State Cash $6,600 $6,600 $3,600 $3,000
State Bond - STA $50,000 $8,603 $16,397 $12,500 $12,500 $50,000
TCRP $80,000 $80,000 $80,000
TransNet - MC $24,070 $24,070 $24,070
TransNet - Transit $110,312 $110,312 $27,421 $82,891
TOTAL $460,266 $460,266 $11,530 $47,133 $401,603
46Page Wednesday, July 23, 2008
74

San Diego Region (in $000s)2008 Regional Transportation Improvement Program
MPO ID:TITLE:
NCTD16BOceanside to Escondido Rail
Operations
North County Transit District
Capacity Status: NCI 08-00RTIP #:Mass Transit - Transit operating assistanceExempt Category:
For Sprinter service - start-up operating cost; debt service payments on $34 million COP's after
construction is completed
DESCRIPTION:
EST TOTAL COST: $27,261
CONRWPEPRIORTOTAL 08/09 09/10 10/11 11/12 12/13
CMAQ $16,000 $6,000 $4,000 $6,000 $16,000
Local Funds $4,000 $1,250 $1,250 $1,500 $4,000
TransNet - TSI $7,261 $1,300 $1,300 $2,338 $2,323 $7,261
TOTAL $27,261 $7,250 $6,550 $8,800 $2,338 $2,323 $27,261
MPO ID:TITLE:
NCTD18Rail - ROW Improvements
Capacity Status: NCI 08-00RTIP #:Mass Transit - Track rehabilitation in existing right of wayExempt Category:
NCTD service area - cross-tie renewal program, street cross protection, rail structure rehabilitation, rail
replacement, storage tracks, rail lubricators, at-grade crossing renewal, turnout renewal, other misc.
improvements
DESCRIPTION:
EST TOTAL COST: $20,795
CONRWPEPRIORTOTAL 08/09 09/10 10/11 11/12 12/13
FTA 5307 $13,106 $5,860 $1,936 $1,216 $2,256 $1,838 $13,106
FTA 5309 (FG) $1,877 $579 $1,040 $258 $1,877
Local Funds $3,556 $1,420 $484 $564 $564 $524 $3,556
TransNet - Transit $2,256 $2,256 $2,256
TOTAL $20,795 $10,115 $2,420 $2,820 $2,820 $2,620 $20,795
MPO ID:TITLE:
NCTD20Rail Vehicles & Related Equipment
Capacity Status: NCI 08-00RTIP #:Mass Transit - Purchase new buses and rail cars to
replace existing vehicles or minor expansions of fleet
Exempt Category:
NCTD service area - locomotive purchase/overhaul, revenue vehicles, misc. support equipment including
vehicles, spare components and signal equipment upgrade/replacement
DESCRIPTION:
EST TOTAL COST: $4,820
CONRWPEPRIORTOTAL 08/09 09/10 10/11 11/12 12/13
FTA 5307 $2,125 $2,125 $2,125
FTA 5309 (FG) $676 $476 $200 $676
Local Funds $890 $840 $50 $890
STIP-IIP PTA $1,000 $1,000 $500 $500
TCRP $129 $129 $129
TOTAL $4,820 $4,570 $250 $500 $4,320
47Page Wednesday, July 23, 2008
75

San Diego Region (in $000s)2008 Regional Transportation Improvement Program
MPO ID:TITLE:
NCTD22Bridge & Infrastructure Program
North County Transit District
Capacity Status: NCI 08-00RTIP #:Safety - Railroad/highway crossingExempt Category:
Along coastal ROW from Orange County Line to downtown station at Santa Fe Depot and along inland
ROW from Oceanside Transit Center (Oceanside, CA) to Escondido Transit Center (Escondido, CA). -
bridges & other infrastructure improvements along rail ROW
DESCRIPTION:
EST TOTAL COST: $40,385
CONRWPEPRIORTOTAL 08/09 09/10 10/11 11/12 12/13
FTA 5307 $4,440 $2,840 $1,600 $720 $3,720
FTA 5309 (FG) $27,847 $16,007 $3,280 $2,880 $2,880 $2,800 $4,160 $23,687
Local Funds $8,098 $4,738 $1,220 $720 $720 $700 $1,220 $6,878
TOTAL $40,385 $23,585 $6,100 $3,600 $3,600 $3,500 $6,100 $34,285
MPO ID:TITLE:
NCTD29Planning
Capacity Status: NCI 08-00RTIP #:Other - Non construction related activitiesExempt Category:
NCTD Service area - local short range and other transit planning studiesDESCRIPTION:
EST TOTAL COST: $1,125
CONRWPEPRIORTOTAL 08/09 09/10 10/11 11/12 12/13
FTA 5307 $900 $500 $100 $100 $100 $100 $900
Local Funds $225 $125 $25 $25 $25 $25 $225
TOTAL $1,125 $625 $125 $125 $125 $125 $1,125
MPO ID:TITLE:
NCTD34Expanded Transit Service
Capacity Status: NCI 08-00RTIP #:Mass Transit - Transit operating assistanceExempt Category:
NCTD service area - operating support for existing fixed route and rail transit service, including intercity bus
and rural services
DESCRIPTION:
EST TOTAL COST: $40,035
CONRWPEPRIORTOTAL 08/09 09/10 10/11 11/12 12/13
FTA 5316 - JARC $156 $156 $156
FTA 5317 - NF $44 $44 $44
Local Funds $799 $201 $186 $199 $213 $799
TransNet - TSI $39,036 $9,478 $9,952 $9,488 $10,118 $39,036
TOTAL $40,035 $9,879 $10,138 $9,687 $10,331 $40,035
MPO ID:TITLE:
NCTD36Solana Beach Intermodal Transit
Station
Capacity Status: CI 08-00RTIP #:
Solana Beach train station - construct parking structure, part of mixed-use transit oriented developmentDESCRIPTION:
EST TOTAL COST: $9,599
CONRWPEPRIORTOTAL 08/09 09/10 10/11 11/12 12/13
FTA 5309 (Bus) $2,873 $2,534 $339 $649 $2,224
Local Funds $726 $641 $85 $163 $563
STIP-IIP PTA $6,000 $6,000 $6,000
TOTAL $9,599 $9,175 $424 $812 $8,787
48Page Wednesday, July 23, 2008
76

San Diego Region (in $000s)2008 Regional Transportation Improvement Program
MPO ID:TITLE:
NCTD40Rail Station Improvements
North County Transit District
Capacity Status: NCI 08-00RTIP #:Mass Transit - Reconstruction or renovation of transit
structures
Exempt Category:
NCTD service area - Coaster & Sprinter station improvements including platform extension; Convention
Center/Padres stadium design information display panel
DESCRIPTION:
EST TOTAL COST: $2,060
CONRWPEPRIORTOTAL 08/09 09/10 10/11 11/12 12/13
FTA 5307 $663 $343 $320 $663
Local Funds $167 $87 $80 $167
TransNet - MC $1,230 $1,230 $1,230
TOTAL $2,060 $1,660 $400 $2,060
STIP-TransNet swap*
MPO ID:TITLE:
NCTD41San Luis Rey Transit Center
Capacity Status: NCI 08-00RTIP #:Other - Bus terminals and transfer pointsExempt Category:
In Oceanside - construct new multi-modal transit center as a component of a transit-oriented, mixed-use
development which would include retail, commercial, residential and office space
DESCRIPTION:
EST TOTAL COST: $7,615
CONRWPEPRIORTOTAL 08/09 09/10 10/11 11/12 12/13
FTA 5307 $3,876 $3,876 $676 $3,200
FTA 5309 (Bus) $1,843 $1,485 $358 $297 $1,079 $467
Local Funds $1,436 $1,347 $89 $74 $446 $916
TransNet - MC $460 $460 $36 $424
TOTAL $7,615 $7,168 $447 $407 $2,625 $4,583
STIP-TransNet swap*
49Page Wednesday, July 23, 2008
77

San Diego Region (in $000s)2008 Regional Transportation Improvement Program
MPO ID:TITLE:
O06Melrose Drive Extension
Oceanside, City of
Capacity Status: CI 08-00RTIP #:(CR)
Melrose Drive from North Santa Fe Avenue to Spur Avenue - in Oceanside, future construction of 4-lane
arterial highway with raise medians, sidewalks and bike lanes
DESCRIPTION:
EST TOTAL COST:RAS (TA 7-45) $2,294
CONRWPEPRIORTOTAL 08/09 09/10 10/11 11/12 12/13
TransNet - L $2,094 $2,094 $2,094
TransNet - LSI $200 $200 $200
TOTAL $2,294 $2,094 $200 $2,294
MPO ID:TITLE:
O08College Boulevard Raising
Capacity Status: NCI 08-00RTIP #:Other - Plantings, landscaping, etcExempt Category:
College Boulevard from Plaza Drive to Lake Boulevard - reconstruct box culvert of College Blvd over Buena
Vista Creek to raise the highway above the flood level
DESCRIPTION:
EST TOTAL COST:RAS (TA 7-45) $7,054
CONRWPEPRIORTOTAL 08/09 09/10 10/11 11/12 12/13
Local Funds $3,754 $3,754 $3,754
TransNet - L $3,300 $3,300 $900 $300 $2,100
TOTAL $7,054 $3,300 $3,754 $900 $300 $5,854
MPO ID:TITLE:
O09El Camino Real Bridge
Capacity Status: NCI 08-00RTIP #:Safety - Non capacity widening or bridge reconstructionExempt Category:
At SR 78 - reconstruct to accommodate increased lane/shoulder widthDESCRIPTION:
EST TOTAL COST: $1,664
CONRWPEPRIORTOTAL 08/09 09/10 10/11 11/12 12/13
Local Funds $320 $320 $320
TransNet - L $1,344 $1,344 $1,000 $344
TOTAL $1,664 $1,344 $320 $1,320 $344
MPO ID:TITLE:
O12Pala Road Extension
Capacity Status: NCI 08-00RTIP #:Other - Engineering studiesExempt Category:
Pala Road from Foussat Road to Los Arbolitos Blvd - future construction of 4-lane arterialDESCRIPTION:
EST TOTAL COST: $770
CONRWPEPRIORTOTAL 08/09 09/10 10/11 11/12 12/13
Local Funds $370 $370 $370
TransNet - L $400 $400 $400
TOTAL $770 $400 $370 $770
50Page Wednesday, July 23, 2008
78

San Diego Region (in $000s)2008 Regional Transportation Improvement Program
MPO ID:TITLE:
O14Bridge Rehabilitation
Oceanside, City of
Capacity Status: NCI 08-00RTIP #:Safety - Non capacity widening or bridge reconstructionExempt Category:
North Coast Highway bridge over the San Luis Rey River, Douglas Drive bridge over the San Luis Rey River
- seismic retrofit of highway bridges over the San Luis Rey River
DESCRIPTION:
EST TOTAL COST: $8,750
CONRWPEPRIORTOTAL 08/09 09/10 10/11 11/12 12/13
TransNet - L $6,300 $6,300 $6,300
TransNet - L (Cash) $2,450 $2,450 $2,450
TOTAL $8,750 $6,300 $2,450 $8,750
MPO ID:TITLE:
O17Loma Alta Creek/Sprinter Detention
Basin
Capacity Status: NCI 08-00RTIP #:Mass Transit - Track rehabilitation in existing right of wayExempt Category: (CR)
Loma Alta Creek and Sprinter right-of-way east of El Camino Real; east of Rancho del Oro Blvd. -
construction of flood control walls along Loma Alta Creek east of El Camino Real and east of Rancho del
Oro Drive and south of Oceanside Boulevard and north of the NCTD Sprinter railroad tracks in Oceanside
DESCRIPTION:
EST TOTAL COST: $13,400
CONRWPEPRIORTOTAL 08/09 09/10 10/11 11/12 12/13
TransNet - L $7,700 $7,700 $7,700
TransNet - LSI $5,700 $2,500 $3,200 $5,700
TOTAL $13,400 $7,700 $2,500 $3,200 $13,400
MPO ID:TITLE:
O18Neighborhood Sidewalk/ADA/Traffic
Improvements
Capacity Status: NCI 08-00RTIP #:Safety - Pavement resurfacing and/or rehabilitationExempt Category: (Maint)
Citywide - in Oceanside, completion of missing segments of sidewalks, new access ramps and shoulder
improvements for pedestrian accessibility and road safety improvements
DESCRIPTION:
EST TOTAL COST: $2,350
CONRWPEPRIORTOTAL 08/09 09/10 10/11 11/12 12/13
TransNet - L $1,150 $1,150 $1,150
TransNet - LSI $1,200 $600 $600 $1,200
TOTAL $2,350 $1,150 $600 $600 $2,350
MPO ID:TITLE:
O20Oceanside Boulevard Bus Stop ADA
Upgrades
Capacity Status: NCI 08-00RTIP #:Mass Transit - Construction of small passenger shelters
and information kiosks
Exempt Category: (CR)
Oceanside Boulevard from I-5 to El Camino Real - acquire right-of-way and construct wider sidewalk and
bus stop waiting pads to allow NCTD buses to deploy wheelchair lifts
DESCRIPTION:
EST TOTAL COST:RAS (TA 7-45) $500
CONRWPEPRIORTOTAL 08/09 09/10 10/11 11/12 12/13
TransNet - LSI $500 $200 $300 $100 $100 $300
TOTAL $500 $200 $300 $100 $100 $300
51Page Wednesday, July 23, 2008
79

San Diego Region (in $000s)2008 Regional Transportation Improvement Program
MPO ID:TITLE:
POW01AStreet Maintenance
Poway, City of
Capacity Status: NCI 08-00RTIP #:Safety - Pavement resurfacing and/or rehabilitationExempt Category: (CR)
Poway Road between SR-67 and Espola Road (FY 2009), Bowron Road, Carriage Road, Metate Lane,
Solera Way (FY 2010), Martincoit Road between Espola Road and Orchard Gate Court (FY 2011),
Pomerado Road between Poway Road and Scripps Poway Parkway (FY 2012), Stowe Drive and Titan
Way (FY 2013) - in Poway, rehabilitate roadways grind and overlay 2.5" of AC
DESCRIPTION:
EST TOTAL COST:RAS (114) $13,036
CONRWPEPRIORTOTAL 08/09 09/10 10/11 11/12 12/13
Local Funds $3,168 $935 $503 $296 $1,087 $347 $3,168
TransNet - L $3,108 $3,108 $3,108
TransNet - LSI $6,760 $1,352 $1,352 $1,352 $1,352 $1,352 $6,760
TOTAL $13,036 $3,108 $2,287 $1,855 $1,648 $2,439 $1,699 $13,036
MPO ID:TITLE:
POW02Espola Road
Capacity Status: CI 08-00RTIP #:
Espola Road from Twin Peaks Road to Titan Way - widen Espola Road from 2 to 3 lanes with 8-foot bike
lanes/shoulders
DESCRIPTION:
EST TOTAL COST:RTP PAGE NO: A-6
RAS (TA 7-45)
$8,298
CONRWPEPRIORTOTAL 08/09 09/10 10/11 11/12 12/13
Local Funds $4,333 $1,275 $1,572 $1,486 $1,275 $3,058
Local RTCIP $300 $100 $100 $100 $100 $200
RSTP $290 $290 $290
TOTAL $4,923 $1,565 $100 $1,672 $1,586 $1,665 $3,258
MPO ID:TITLE:
POW03Pomerado Road Signal Responsive
System
Capacity Status: NCI 08-00RTIP #:Other - Traffic signal synchronization projectsExempt Category:
Pomerado Road from Creek Road to Bernardo Hights Pkwy - in Poway, upgrade signal system, QuikNet4,
to a responsive system, install traffic data stations and provide wireless communication between data
stations and signal controllers which will provide additional traffic flow capacity on Pomerado Road through
changes in coordination timing plans during peak periods (responsive). The traffic data stations will also
provide arterial traffic data to the region RAMS and I-15 ICM systems and potentially commuters in the
area
DESCRIPTION:
EST TOTAL COST:RAS (114) $589
CONRWPEPRIORTOTAL 08/09 09/10 10/11 11/12 12/13
Local Funds $489 $489 $489
TransNet - L (Cash) $100 $100 $50 $50
TOTAL $589 $100 $489 $50 $539
52Page Wednesday, July 23, 2008
80

San Diego Region (in $000s)2008 Regional Transportation Improvement Program
MPO ID:TITLE:
SAN03AFreeway Service Patrol
San Diego Association of Governments
Capacity Status: NCI 08-00RTIP #:Safety - Non signalization traffic control and operatngExempt Category:
Countywide - provides rapid removal of disabled vehicles; joint project between SANDAG, Caltrans and
CHP to alleviate traffic congestion associated with non-recurring incidents
DESCRIPTION:
EST TOTAL COST: $19,111
CONRWPEPRIORTOTAL 08/09 09/10 10/11 11/12 12/13
FSP $14,475 $2,895 $2,895 $2,895 $2,895 $2,895 $14,475
Local Funds $1,016 $351 $340 $325 $1,016
RSTP $3,620 $724 $724 $724 $724 $724 $3,620
TOTAL $19,111 $3,970 $3,959 $3,944 $3,619 $3,619 $19,111
MPO ID:TITLE:
SAN04I-15 Managed Lane/Value Pricing
Capacity Status: NCI 08-00RTIP #:Safety - Non signalization traffic control and operatngExempt Category:
From SR 163 to SR 78 - implementation of FasTrak system along I-15 corridor (studies, preliminary
engineering completed)
DESCRIPTION:
EST TOTAL COST:RTP PAGE NO: A-5 $25,416
CONRWPEPRIORTOTAL 08/09 09/10 10/11 11/12 12/13
CMAQ $234 $234 $234
Local Funds $17 $17 $17
RSTP $250 $250 $250
Toll - Managed Lanes $120 $120 $120
TransNet - MC $23,188 $4,959 $12,016 $1,373 $2,116 $1,483 $1,241 $2,794 $20,394
Value Pricing Program $1,606 $1,606 $1,606
TOTAL $25,415 $7,186 $12,016 $1,373 $2,116 $1,483 $1,241 $5,021 $20,394
MPO ID:TITLE:
SAN07APlan, Program & Monitor
Capacity Status: NCI 08-00RTIP #:Other - Non construction related activitiesExempt Category:
Regionwide - planning, programming and monitoring activities related to transportation fundingDESCRIPTION:
EST TOTAL COST:SANDAG ID: 11091 $3,708
CONRWPEPRIORTOTAL 08/09 09/10 10/11 11/12 12/13
STIP-RIP State Cash $3,708 $705 $705 $705 $705 $888 $3,708
TOTAL $3,708 $705 $705 $705 $705 $888 $3,708
MPO ID:TITLE:
SAN11ARegional Rideshare Program
Capacity Status: NCI 08-00RTIP #:Air Quality - Ride-sharing and van-pooling programExempt Category:
Countywide - Component of overall regional Transportation Demand ManagementDESCRIPTION:
EST TOTAL COST:SANDAG ID: 60001 $23,930
CONRWPEPRIORTOTAL 08/09 09/10 10/11 11/12 12/13
CMAQ $23,930 $2,830 $3,500 $5,600 $6,000 $6,000 $23,930
TOTAL $23,930 $2,830 $3,500 $5,600 $6,000 $6,000 $23,930
53Page Wednesday, July 23, 2008
81

San Diego Region (in $000s)2008 Regional Transportation Improvement Program
MPO ID:TITLE:
SAN13Joint Transit Operations Center
San Diego Association of Governments
Capacity Status: NCI 08-00RTIP #:Mass Transit - Construction or renovation of power, signal,
and communications systems
Exempt Category:
Regionwide - operations facility/control center to coordinate and integrate several ITS deployments; part of
ITS regional architecture
DESCRIPTION:
EST TOTAL COST:SANDAG ID: 1142600 $1,300
CONRWPEPRIORTOTAL 08/09 09/10 10/11 11/12 12/13
FTA 5309 (Bus) $337 $337 $337
TransNet - H $963 $963 $963
TOTAL $1,300 $337 $963 $1,300
MPO ID:TITLE:
SAN19GARVEE Debt Service
Capacity Status: NCI 08-00RTIP #:Other - Non construction related activitiesExempt Category:
From SR 56 to Centre City Pkwy - Debt service for issue of GARVEE bonds for the I-15 ML (CAL18)
project
DESCRIPTION:
EST TOTAL COST:RTP PAGE NO: A-5 $238,283
CONRWPEPRIORTOTAL 08/09 09/10 10/11 11/12 12/13
STIP-IIP NHS GARVEE $48,363 $21,068 $5,459 $5,459 $5,459 $5,459 $5,459 $59,281
STIP-RIP NHS GARVEE $146,249 $64,369 $16,376 $16,376 $16,376 $16,376 $16,376 $179,001
TOTAL $194,612 $85,437 $21,835 $21,835 $21,835 $21,835 $21,835 $238,282
Debt Service program not shown for FY 2014 and FY 2015*
MPO ID:TITLE:
SAN21Non-motorized Projects
Capacity Status: NCI 08-00RTIP #:Air Quality - Bicycle and pedestrian facilitiesExempt Category:
Various locations countywide - lump sum for non-motorized projectsDESCRIPTION:
EST TOTAL COST: $20,499
CONRWPEPRIORTOTAL 08/09 09/10 10/11 11/12 12/13
FTA 5316 - JARC $168 $168 $168
Local Funds $10,481 $750 $1,935 $7,191 $605 $1,900 $8,581
TDA - Bicycles $5,233 $5,233 $1,625 $3,608
TransNet - B $4,167 $4,167 $463 $3,704
TransNet - BPNS $450 $450 $450
TOTAL $20,499 $10,318 $2,385 $7,191 $605 $4,438 $16,061
MPO ID:TITLE:
SAN22Regional Fare Technology
Capacity Status: NCI 08-00RTIP #:Mass Transit - Purchase of vehicle operating equipmentExempt Category:
Regionwide - design, procure, and install fare collection system for transit operators in the countyDESCRIPTION:
EST TOTAL COST:SANDAG ID: 1145700 $47,800
CONRWPEPRIORTOTAL 08/09 09/10 10/11 11/12 12/13
FTA 5307 $18,620 $18,620 $18,620
Local Funds $1,580 $1,580 $1,580
STIP-RIP (AB3090) $19,500 $19,500 $19,500
STIP-RIP State Cash $800 $800 $800
TransNet - MC $7,300 $2,800 $4,500 $7,300
TOTAL $47,800 $43,300 $4,500 $47,800
STIP-TransNet swap*
54Page Wednesday, July 23, 2008
82

San Diego Region (in $000s)2008 Regional Transportation Improvement Program
MPO ID:TITLE:
SAN23Mid-Coast Corridor Project
San Diego Association of Governments
Capacity Status: CI 08-00RTIP #:
From Old Town Transit Ctr to University City - design/construct light rail line from Old Town Transit Center
to Balboa Ave; conduct alternative alignment study; begin PE from Balboa Ave to University City;
mid-coast corridor planning/environmental
DESCRIPTION:
EST TOTAL COST:PPNO: 7307
RTP PAGE NO: A-5 SANDAG ID: 1041501
$1,246,292
CONRWPEPRIORTOTAL 08/09 09/10 10/11 11/12 12/13
FTA 5307 $519 $519 $519
FTA 5309 (NS) $8,940 $8,940 $8,940
PTA $537 $537 $537
STIP State Cash $28,756 $28,756 $28,756
STIP-RIP State Cash $4,000 $4,000 $4,000
TCRP $10,000 $10,000 $10,000
TransNet - MC $60,159 $15,222 $44,937 $60,159
TransNet - MC AC $28,756 $(28,756)
TransNet - Transit $35,067 $25,533 $9,534 $35,067
TOTAL $147,978 $49,529 $9,534 $28,756 $15,222 $44,937 $147,978
Total cost includes execution of Full Funding Grant Agreement with FTA*
MPO ID:TITLE:
SAN26I-15 BRT Transit Stations Project
Capacity Status: CI 08-00RTIP #:
From SR 163 to SR 78 - construct transit stations along the I-15 corridor including stations at Mira Mesa
Blvd, SR 56, Rancho Bernardo Road, and Del Lago Blvd; modify Escondido Transit Station
DESCRIPTION:
EST TOTAL COST:RTP PAGE NO: A-5 SANDAG ID: 1201505 $56,400
CONRWPEPRIORTOTAL 08/09 09/10 10/11 11/12 12/13
CMAQ $20,459 $20,459 $20,459
FTA 5309 (Bus) $3,624 $3,624 $321 $3,303
STIP-RIP PTA $11,500 $11,500 $11,500
TCRP $5,716 $5,716 $5,716
TransNet - MC $8,001 $4,406 $50 $50 $458 $1,806 $1,231 $406 $7,595
TransNet - Transit $7,100 $7,100 $1,833 $5,267
TOTAL $56,400 $52,805 $50 $50 $458 $1,806 $1,231 $2,154 $11,389 $42,857
MPO ID:TITLE:
SAN26AI-15 BRT Operations and Vehicles
Capacity Status: CI 08-00RTIP #:
From Escondido to San Diego - planning, operations and vehicle acquisition for the BRT service along I-15
corridor
DESCRIPTION:
EST TOTAL COST:SANDAG ID: 1201508 $32,726
CONRWPEPRIORTOTAL 08/09 09/10 10/11 11/12 12/13
CMAQ $828 $828 $828
Local Funds $35 $35 $35
TransNet - MC $31,303 $668 $1,700 $1,456 $13,198 $13,812 $469 $3,824 $27,479
TransNet - Transit $560 $560 $560
TOTAL $32,726 $2,091 $1,700 $1,456 $13,198 $13,812 $469 $4,419 $28,307
55Page Wednesday, July 23, 2008
83

San Diego Region (in $000s)2008 Regional Transportation Improvement Program
MPO ID:TITLE:
SAN26BI-15 BRT Downtown Transit Stations
San Diego Association of Governments
Capacity Status: CI 08-00RTIP #:
Downtown San Diego (East Village and financial core area) - construct transit stations and transit lanesDESCRIPTION:
EST TOTAL COST:SANDAG ID: 1201507 $11,027
CONRWPEPRIORTOTAL 08/09 09/10 10/11 11/12 12/13
TransNet - MC $11,027 $263 $270 $780 $3,699 $5,938 $77 $2,282 $72 $8,673
TOTAL $11,027 $263 $270 $780 $3,699 $5,938 $77 $2,282 $72 $8,673
MPO ID:TITLE:
SAN26CI-15 BRT Mid-City Transit Stations
Capacity Status: CI 08-00RTIP #:
At University Avenue and at El Cajon Blvd. (mid-city area of San Diego) - construct transit stations and
transit lanes
DESCRIPTION:
EST TOTAL COST:SANDAG ID: 1201507 $20,895
CONRWPEPRIORTOTAL 08/09 09/10 10/11 11/12 12/13
TransNet - MC $20,895 $525 $1,517 $7,180 $11,524 $149 $3,917 $143 $16,835
TOTAL $20,895 $525 $1,517 $7,180 $11,524 $149 $3,917 $143 $16,835
MPO ID:TITLE:
SAN27San Ysidro Intermodal Freight Facility
Capacity Status: NCI 08-00RTIP #:Mass Transit - Track rehabilitation in existing right of wayExempt Category:
From Commercial St. to International Border - SD&AE Freight Yard and South Line Mainline in San Ysidro
- environmental studies, design, site planning, and construction for an international freight facility; signal
installation for the track and rail cars
DESCRIPTION:
EST TOTAL COST:RTP PAGE NO: A-5 SANDAG ID: 1140600 $149,090
CONRWPEPRIORTOTAL 08/09 09/10 10/11 11/12 12/13
CBI $600 $600 $600
DEMO - TEA 21 $9,980 $1,280 $1,280 $7,420 $2,560 $7,420
Local Funds $320 $320 $320
Trade Corridor Program $123,960 $98,060 $25,900 $123,960
TransNet - Border $14,230 $328 $8,750 $5,152 $9,440 $4,790
TOTAL $149,090 $1,600 $1,608 $8,750 $13,172 $98,060 $25,900 $12,920 $12,210 $123,960
MPO ID:TITLE:
SAN28Del Mar Bluff Stabilization
Capacity Status: NCI 08-00RTIP #:Mass Transit - Track rehabilitation in existing right of wayExempt Category:
From MP 244.1 in Del Mar to MP 245.7 in Del Mar - stabilize bluff areasDESCRIPTION:
EST TOTAL COST:EA NO: R550SB PPNO: 7300
SANDAG ID: 1143000
$14,237
CONRWPEPRIORTOTAL 08/09 09/10 10/11 11/12 12/13
FTA 5309 (NS) $3,981 $3,981 $3,981
Prop. 116 $405 $405 $405
STIP-GF IIP State Cash $4,500 $4,500 $4,500
STIP-IIP PTA $4,597 $1,200 $3,397 $1,200 $3,397
STIP-IIP State Cash $754 $754 $754
TOTAL $14,237 $10,435 $405 $3,397 $1,605 $12,632
56Page Wednesday, July 23, 2008
84

San Diego Region (in $000s)2008 Regional Transportation Improvement Program
MPO ID:TITLE:
SAN29Sorrento to Miramar Double
Track/Realign
San Diego Association of Governments
Capacity Status: NCI 08-00RTIP #:Mass Transit - Track rehabilitation in existing right of wayExempt Category:
Phase 1: CP Pines (MP 249,8) to CP Miramar (MP 251), Phase 2: CP Miramar (MP 251) to CP Cumbres
(MP 252.9) - realign curve and construct second main track; fully funds PE and design for both Phase 1
and Phase 2; construction for Phase 1 only.
DESCRIPTION:
EST TOTAL COST:EA NO: R690SA PPNO: 7301
RTP PAGE NO: A-5 SANDAG ID: 1142200
$150,000
CONRWPEPRIORTOTAL 08/09 09/10 10/11 11/12 12/13
PTA $1,010 $1,010 $1,010
STIP-IIP PTA $3,900 $3,900 $3,900
STIP-IIP State Cash $1,300 $1,300 $1,300
Trade Corridor Program $10,800 $10,800 $10,800
TransNet - MC $10,800 $10,800 $600 $10,200
TOTAL $27,810 $6,210 $21,600 $6,210 $600 $21,000
MPO ID:TITLE:
SAN31Escondido Maintenance Facility
Capacity Status: NCI 08-00RTIP #:Mass Transit - Const of new bus or rail storage/maint
facilities excluded in 23 CFR part 771
Exempt Category:
Escondido at Washington and Centre City - improvements to maintenance facility including electronic
gates, surveillance systems, video cameras, security
DESCRIPTION:
EST TOTAL COST:PPNO: 1142300 $7,267
CONRWPEPRIORTOTAL 08/09 09/10 10/11 11/12 12/13
FTA 5307 $3,183 $3,183 $411 $2,772
FTA 5309 (Bus) $680 $680 $680
Local Funds $1,172 $1,172 $107 $1,065
TransNet - MC $2,232 $2,232 $2,232
TOTAL $7,267 $5,035 $2,232 $518 $6,749
STIP-TransNet swap*
MPO ID:TITLE:
SAN39Rail Electrification & Power
Distribution
Capacity Status: NCI 08-00RTIP #:Mass Transit - Track rehabilitation in existing right of wayExempt Category:
Countywide - cantenary improvements, substation standardizationDESCRIPTION:
EST TOTAL COST: $19,480
CONRWPEPRIORTOTAL 08/09 09/10 10/11 11/12 12/13
FTA 5307 $5,864 $3,784 $520 $520 $520 $520 $5,864
FTA 5309 (FG) $9,682 $2,682 $1,750 $1,750 $1,750 $1,750 $9,682
Local Funds $3,934 $1,662 $568 $568 $568 $568 $3,934
TOTAL $19,480 $8,128 $2,838 $2,838 $2,838 $2,838 $19,480
57Page Wednesday, July 23, 2008
85

San Diego Region (in $000s)2008 Regional Transportation Improvement Program
MPO ID:TITLE:
SAN40Metropolitan Planning
San Diego Association of Governments
Capacity Status: NCI 08-00RTIP #:Other - Non construction related activitiesExempt Category:
Countywide - ongoing regional transportation planning including the regional vanpool program and survey
and inventory of bridges
DESCRIPTION:
EST TOTAL COST: $21,970
CONRWPEPRIORTOTAL 08/09 09/10 10/11 11/12 12/13
FTA 5307 $17,357 $3,290 $3,312 $3,444 $3,582 $3,729 $17,357
FTA 5316 - JARC $169 $169 $169
FTA 5317 - NF $80 $80 $80
Local Funds $4,364 $1,675 $861 $896 $932 $4,364
TOTAL $21,970 $3,290 $5,236 $4,305 $4,478 $4,661 $21,970
MPO ID:TITLE:
SAN43AReduced Price Pass Subsidy
Capacity Status: NCI 08-00RTIP #:Mass Transit - Transit operating assistanceExempt Category:
Various - subsidy for reduced price passes required by TransNetDESCRIPTION:
EST TOTAL COST: $27,500
CONRWPEPRIORTOTAL 08/09 09/10 10/11 11/12 12/13
TransNet - TSI $27,500 $5,500 $5,500 $5,500 $5,500 $5,500 $27,500
TOTAL $27,500 $5,500 $5,500 $5,500 $5,500 $5,500 $27,500
MPO ID:TITLE:
SAN46Mid-Coast Super Loop
Capacity Status: CI 08-00RTIP #:
University City in San Diego - design and construction of transit priority treatments que jumper lanes,
street modifications, new and modified transit stations, and acquisition of 12 expansion shuttles
DESCRIPTION:
EST TOTAL COST:RTP PAGE NO: A-5 SANDAG ID: 1041502 $37,518
CONRWPEPRIORTOTAL 08/09 09/10 10/11 11/12 12/13
FTA 5309 (NS) $617 $617 $617
TransNet - MC $36,202 $7,834 $24,939 $3,429 $6,276 $955 $28,971
TransNet - Transit $699 $699 $699
TOTAL $37,518 $9,150 $24,939 $3,429 $7,592 $955 $28,971
MPO ID:TITLE:
SAN47South Bay BRT
Capacity Status: CI 08-00RTIP #:
From Otay Ranch to downtown San Diego - plan, design, and construct transit stations, transit way, local
street and road modifications, freeway modifications
DESCRIPTION:
EST TOTAL COST:SANDAG ID: 1280504 $110,627
CONRWPEPRIORTOTAL 08/09 09/10 10/11 11/12 12/13
FTA 5307 $545 $545 $545
FTA 5309 (Bus) $1,028 $1,028 $1,028
Local Funds $355 $355 $355
TransNet - MC $107,905 $1,800 $9,200 $41,600 $43,300 $11,705 $300 $14,000 $7,000 $86,905
TransNet - Transit $794 $794 $794
TOTAL $110,627 $4,522 $9,200 $41,600 $43,300 $11,705 $300 $16,722 $7,000 $86,905
58Page Wednesday, July 23, 2008
86

San Diego Region (in $000s)2008 Regional Transportation Improvement Program
MPO ID:TITLE:
SAN49Feasibility Study - MAGLEV to New
Regional Airport
San Diego Association of Governments
Capacity Status: NCI 08-00RTIP #:Other - Engineering studiesExempt Category:
Counties of San Diego, Imperial, and Los Angeles - Phase I: conduct feasibility study for a dedicated
intermodal east-west link between San Diego and Imperial Valley; Phase II: continue feasibility study to
link to SCAG MagLev network
DESCRIPTION:
EST TOTAL COST: $800
CONRWPEPRIORTOTAL 08/09 09/10 10/11 11/12 12/13
HPP $640 $320 $320 $640
Local Funds $160 $80 $80 $160
TOTAL $800 $400 $400 $800
MPO ID:TITLE:
SAN54ITS Operating
Capacity Status: NCI 08-00RTIP #:Safety - Non signalization traffic control and operatngExempt Category:
Regionwide - implementation of ITS projects such as Compass Card Program, IMTMS, Freeway Service
Patrol, 511 Advanced Traveler Information System, Regional Arterial Management System; activities
include data collection, dissemination, software upgrades
DESCRIPTION:
EST TOTAL COST: $12,587
CONRWPEPRIORTOTAL 08/09 09/10 10/11 11/12 12/13
RSTP $11,142 $1,279 $2,029 $2,565 $2,611 $2,658 $11,142
TransNet - MC $1,445 $166 $263 $332 $339 $345 $1,445
TOTAL $12,587 $1,445 $2,292 $2,897 $2,950 $3,003 $12,587
MPO ID:TITLE:
SAN55Bus & Fixed Guideway Support
Equipment and Facilities
Capacity Status: NCI 08-00RTIP #:Mass Transit - Purchase of office, shop and operating
equipment for existing facilities
Exempt Category:
Various bus/rail facilities - provide for support equipment and facilities work related to bus and rail
operations such as roof renovations, shop equipment, LRV car wash replacement, building repairs, IT
infrastructure, servers, and storage, non-revenue vehicles, and safety and security equipment
DESCRIPTION:
EST TOTAL COST: $3,000
CONRWPEPRIORTOTAL 08/09 09/10 10/11 11/12 12/13
FTA 5307 $2,400 $480 $480 $480 $480 $480 $2,400
Local Funds $600 $120 $120 $120 $120 $120 $600
TOTAL $3,000 $600 $600 $600 $600 $600 $3,000
MPO ID:TITLE:
SAN57Fixed Guideway Transitways/Lines
Capacity Status: NCI 08-00RTIP #:Mass Transit - Track rehabilitation in existing right of wayExempt Category:
Countywide - provide for work on transitways and transit lines including but not limited to, drainage work,
tie replacement, grade crossing improvements, switches, rail straightening and grinding
DESCRIPTION:
EST TOTAL COST: $2,815
CONRWPEPRIORTOTAL 08/09 09/10 10/11 11/12 12/13
FTA 5307 $1,750 $350 $350 $350 $350 $350 $1,750
FTA 5309 (FG) $500 $100 $100 $100 $100 $100 $500
Local Funds $565 $113 $113 $113 $113 $113 $565
TOTAL $2,815 $563 $563 $563 $563 $563 $2,815
59Page Wednesday, July 23, 2008
87

San Diego Region (in $000s)2008 Regional Transportation Improvement Program
MPO ID:TITLE:
SAN585317 New Freedom Program
San Diego Association of Governments
Capacity Status: NCI 08-00RTIP #:Mass Transit - Transit operating assistanceExempt Category:
Lump sum for new federal program to provide transit service to eldery and disabled residentsDESCRIPTION:
EST TOTAL COST: $2,145
CONRWPEPRIORTOTAL 08/09 09/10 10/11 11/12 12/13
FTA 5317 - NF $1,421 $912 $509 $1,309 $112
Local Funds $724 $374 $350 $696 $28
TOTAL $2,145 $1,286 $859 $2,005 $140
MPO ID:TITLE:
SAN63Bus and Fixed Guideway Stations
Stops and Terminals
Capacity Status: NCI 08-00RTIP #:Mass Transit - Construction of small passenger shelters
and information kiosks
Exempt Category:
Countywide - provide for station stops and terminals including construction, rehabilitation, equipment, and
support items (station platform)
DESCRIPTION:
EST TOTAL COST:SANDAG ID: 1095400 $1,499
CONRWPEPRIORTOTAL 08/09 09/10 10/11 11/12 12/13
FTA 5309 (FG) $80 $80 $80
Local Funds $20 $20 $20
TransNet - Transit $1,399 $1,399 $1,399
TOTAL $1,499 $100 $1,399 $1,499
MPO ID:TITLE:
SAN64San Luis Rey Bridge Replacement &
Second Track
Capacity Status: NCI 08-00RTIP #:Other - Engineering studiesExempt Category:
From MP 225.3 to MP 225.9 - in Oceanside, adds a new 0.6 mile section of double track and replace the
700-foot long San Luis Rey River Bridge just north of the Oceanside Transit Center on the San Diego
Subdivision of the SDNR
DESCRIPTION:
EST TOTAL COST:PPNO: 2074 $3,000
CONRWPEPRIORTOTAL 08/09 09/10 10/11 11/12 12/13
STIP-IIP PTA $3,000 $3,000 $3,000
TOTAL $3,000 $3,000 $3,000
MPO ID:TITLE:
SAN66Blue Line Upgrade
Capacity Status: NCI 08-00RTIP #:Mass Transit - Reconstruction or renovation of transit
structures
Exempt Category:
From 12th/Imperial to San Ysidro - design and construction for Trolley wayside and trackway modifications
including stations to support new low-floor vehicle operations on the Blue Line
DESCRIPTION:
EST TOTAL COST:SANDAG ID: 1210001 $110,500
CONRWPEPRIORTOTAL 08/09 09/10 10/11 11/12 12/13
Local Funds $29,797 $750 $12,407 $16,640 $3,587 $26,210
TransNet - MC $43,376 $90 $1,159 $3,940 $9,140 $12,407 $16,640 $7,758 $35,618
TransNet - Transit $18,556 $67 $6,159 $3,940 $8,390 $4,148 $14,408
TOTAL $91,729 $157 $7,318 $7,880 $18,280 $24,814 $33,280 $15,493 $76,236
Project completion outside of programming cycle*
60Page Wednesday, July 23, 2008
88

San Diego Region (in $000s)2008 Regional Transportation Improvement Program
MPO ID:TITLE:
SAN67Blue Line Vehicles
San Diego Association of Governments
Capacity Status: NCI 08-00RTIP #:Mass Transit - Purchase new buses and rail cars to
replace existing vehicles or minor expansions of fleet
Exempt Category:
Along Blue Line service - low-floor vehicle procurement and existing light rail vehicle rehabilitation for the
San Diego Trolley system sufficient to run low floor service on the Blue Line
DESCRIPTION:
EST TOTAL COST:SANDAG ID: 1210002 $228,397
CONRWPEPRIORTOTAL 08/09 09/10 10/11 11/12 12/13
Local Funds $73,106 $43 $1,024 $1,472 $6,078 $29,110 $35,379 $1,067 $72,039
TransNet - MC $73,576 $513 $1,024 $1,472 $6,078 $29,110 $35,379 $1,537 $72,039
TOTAL $146,682 $556 $2,048 $2,944 $12,156 $58,220 $70,758 $2,604 $144,078
Project completion outside of programming cycle*
MPO ID:TITLE:
SAN68Vehicle Assist and Automation
Capacity Status: NCI 08-00RTIP #:Other - Non construction related activitiesExempt Category:
From Chula Vista to Sorrento Valley along 21-mile corridor of I-805 - provide dedicated transit lane
demonstration using vehicle guidance technology; provide value pricing program evaluation for goods
movement/freight operations limited to medium duty commercially operated vehicles
DESCRIPTION:
EST TOTAL COST: $22,500
CONRWPEPRIORTOTAL 08/09 09/10 10/11 11/12 12/13
FTA 5309 (Bus) $15,000 $15,000 $15,000
ITS $3,000 $1,500 $1,500 $3,000
TransNet - MC $4,500 $300 $4,200 $300 $4,200
TOTAL $22,500 $16,800 $5,700 $3,300 $19,200
MPO ID:TITLE:
SAN73Cardiff to Craven Double Track
Capacity Status: NCI 08-00RTIP #:Other - Engineering studiesExempt Category:
From MP 239.6 to MP 241.1 - in the Cities of Encinitas and Solana Beach, preliminary engineering to
double track 1.5 miles between Control Point (CP) Cardif and CP Craven
DESCRIPTION:
EST TOTAL COST: $4,397
CONRWPEPRIORTOTAL 08/09 09/10 10/11 11/12 12/13
STIP-IIP PTA $4,397 $2,200 $2,197 $4,397
TOTAL $4,397 $2,200 $2,197 $4,397
MPO ID:TITLE:
SAN74Escondido Bus Rapid Transit
Capacity Status: NCI 08-00RTIP #:Mass Transit - Transit operating assistanceExempt Category:
Route 350, a six-mile local bus route in the City of Escondido - improvements include bus stop
consolidation and enhancements, queue jumper, and transit signal priority; improve transit travel times and
reliability;
DESCRIPTION:
EST TOTAL COST:SANDAG ID: 1143300 $6,377
CONRWPEPRIORTOTAL 08/09 09/10 10/11 11/12 12/13
TransNet - MC $2,800 $484 $2,316 $978 $1,822
TOTAL $2,800 $484 $2,316 $978 $1,822
STIP for TransNet exchange*
61Page Wednesday, July 23, 2008
89

San Diego Region (in $000s)2008 Regional Transportation Improvement Program
MPO ID:TITLE:
SAN76Orange Line Upgrade
San Diego Association of Governments
Capacity Status: NCI 08-00RTIP #:Mass Transit - Track rehabilitation in existing right of wayExempt Category:
Along Orange Line Trolley - design and construction for Trolley wayside and trackway modifications
including stations to support new low-floor vehicle operations
DESCRIPTION:
EST TOTAL COST:SANDAG ID: 1220001 $53,923
CONRWPEPRIORTOTAL 08/09 09/10 10/11 11/12 12/13
TransNet - MC $37,033 $66 $1,132 $3,846 $8,921 $12,112 $10,956 $8,562 $28,471
TOTAL $37,033 $66 $1,132 $3,846 $8,921 $12,112 $10,956 $8,562 $28,471
Project completion outside of programming cycle*
MPO ID:TITLE:
SAN77Orange Line Vehicles
Capacity Status: NCI 08-00RTIP #:Mass Transit - Purchase new buses and rail cars to
replace existing vehicles or minor expansions of fleet
Exempt Category:
Along Orange Line Trolley - New low-floor vehicle procurement and existing light rail vehicle rehabilitation
for the Orange Line
DESCRIPTION:
EST TOTAL COST:SANDAG ID: 1220002 $39,359
CONRWPEPRIORTOTAL 08/09 09/10 10/11 11/12 12/13
TransNet - MC $25,195 $15 $353 $507 $2,094 $10,033 $12,193 $999 $24,196
TOTAL $25,195 $15 $353 $507 $2,094 $10,033 $12,193 $999 $24,196
Project completion outside of programming cycle*
MPO ID:TITLE:
SAN78Mid-City BRT
Capacity Status: CI 08-00RTIP #:
From downtown San Diego to San Diego State University via Park and El Cajon Boulevards - development
of a Rapid Bus route
DESCRIPTION:
EST TOTAL COST:SANDAG ID: 1240001 $44,526
CONRWPEPRIORTOTAL 08/09 09/10 10/11 11/12 12/13
FTA 5307 $320 $320 $320
FTA 5309 (NS) $252 $252 $252
TransNet - MC $21,995 $51 $1,560 $3,381 $17,003 $1,611 $20,384
TransNet - Transit $309 $309 $309
TOTAL $22,876 $932 $1,560 $3,381 $17,003 $2,492 $20,384
Total cost assumes receipt of New Starts funding*
62Page Wednesday, July 23, 2008
90

San Diego Region (in $000s)2008 Regional Transportation Improvement Program
MPO ID:TITLE:
SAN79Centralized Train Control (CTC)
San Diego Association of Governments
Capacity Status: NCI 08-00RTIP #:Mass Transit - Construction or renovation of power, signal,
and communications systems
Exempt Category:
MTS service area - develop modern operation center which combines elements of train location, switch
control, and fire/life and safety monitoring, as well as allowing staff to control passenger information signs
and public address systems; the project will procure both a back-end computer system, as well as deploy
the necessary field equipment to safely and efficiently control our train network
DESCRIPTION:
EST TOTAL COST:SANDAG ID: 1142500 $12,231
CONRWPEPRIORTOTAL 08/09 09/10 10/11 11/12 12/13
FTA 5307 $3,200 $3,200 $3,200
Local Funds $800 $800 $800
TransNet - MC $8,231 $2,527 $3,858 $1,846 $8,231
TOTAL $12,231 $4,000 $2,527 $3,858 $1,846 $12,231
STIP-TransNet swap*
MPO ID:TITLE:
SAN80Rapid Bus Transit Service
Capacity Status: NCI 08-00RTIP #:Mass Transit - Transit operating assistanceExempt Category:
Various - Mid-city rapid Bus service from SDSU to downtown San Diego; I-15 BRT from Escondido via I-15
to (1) Downtown San Diego and (2) Sorrento Mesa/UTC/UCSD; Super Loop transit circulator service in the
University City area
DESCRIPTION:
EST TOTAL COST: $16,850
CONRWPEPRIORTOTAL 08/09 09/10 10/11 11/12 12/13
TransNet - BRT/Rail Ops $16,850 $250 $2,750 $2,750 $3,950 $7,150 $16,850
TOTAL $16,850 $250 $2,750 $2,750 $3,950 $7,150 $16,850
63Page Wednesday, July 23, 2008
91

San Diego Region (in $000s)2008 Regional Transportation Improvement Program
MPO ID:TITLE:
CNTY05Channel Road Equestrian Crossing
San Diego County
Capacity Status: NCI 08-00RTIP #:Air Quality - Bicycle and pedestrian facilitiesExempt Category: (CR)
Between Lakeside Avenue and Mapleview Street;, in the vicinity of Channel Rd Bridge - in Lakeside,
design an equestrian trail crossing at the San Diego River
DESCRIPTION:
EST TOTAL COST: $209
CONRWPEPRIORTOTAL 08/09 09/10 10/11 11/12 12/13
TransNet - L $87 $87 $87
TransNet - L (Cash) $33 $33 $33
TransNet - LSI $89 $89 $89
TOTAL $209 $87 $33 $89 $209
MPO ID:TITLE:
CNTY14South Santa Fe Avenue North
Capacity Status: CI 08-00RTIP #:(CR)
South Santa Fe Avenue from Rancho Santa Fe Rd to Bosstick Blvd - Vista City limits to 700 feet south of
Woodland - reconstruct and widen from 2 to 4 lanes including bicycle lane
DESCRIPTION:
EST TOTAL COST:RAS (TA 7-50) $32,678
CONRWPEPRIORTOTAL 08/09 09/10 10/11 11/12 12/13
Local Funds $200 $200 $200
TransNet - H $9,200 $9,200 $500 $8,700
TransNet - H (78) $8,901 $8,901 $8,551 $350
TransNet - L $3,181 $3,181 $3,181
TransNet - L (Cash) $459 $459 $459
TransNet - LSI $10,737 $200 $10,337 $200 $400 $300 $10,037
TOTAL $32,678 $21,482 $459 $200 $10,337 $200 $13,091 $9,550 $10,037
MPO ID:TITLE:
CNTY14ASouth Santa Fe Avenue South
Capacity Status: CI 08-00RTIP #:(CR)
South Santa Fe from 700 ft south of Woodland Dr to Smilax Rd - future wideningDESCRIPTION:
EST TOTAL COST:RAS (TA 7-50) $988
CONRWPEPRIORTOTAL 08/09 09/10 10/11 11/12 12/13
TransNet - L $175 $175 $175
TransNet - L (Cash) $2 $2 $2
TransNet - LSI $488 $325 $100 $63 $488
TOTAL $665 $175 $327 $100 $63 $665
MPO ID:TITLE:
CNTY17SR 54/94 Phase II & III
Capacity Status: CI 08-00RTIP #:(CR)
Ph 2: on SR94 extend Jamacha Blvd; Ph 3: on SR54 extend from Cuyamaca College east to Braham -
Widen from 4 to 6 lanes with intersection improvements, raised median and left turn pockets (additional
funding in the outyears for mitigation only)
DESCRIPTION:
EST TOTAL COST: $18,370
CONRWPEPRIORTOTAL 08/09 09/10 10/11 11/12 12/13
Local Funds $1,207 $1,207 $1,207
TransNet - L $16,713 $16,663 $50 $200 $16,513
TransNet - LSI $450 $150 $200 $100 $450
TOTAL $18,370 $17,870 $200 $200 $100 $650 $17,720
64Page Wednesday, July 23, 2008
92

San Diego Region (in $000s)2008 Regional Transportation Improvement Program
MPO ID:TITLE:
CNTY18SR 56 Contribution
San Diego County
Capacity Status: NCI 08-00RTIP #:Other - Non construction related activitiesExempt Category:
From I-15 to I-5 - final payment for County's share to city of San DiegoDESCRIPTION:
EST TOTAL COST: $1,350
CONRWPEPRIORTOTAL 08/09 09/10 10/11 11/12 12/13
TransNet - L $825 $825 $825
TransNet - L (Cash) $525 $525 $525
TOTAL $1,350 $825 $525 $1,350
MPO ID:TITLE:
CNTY19Valley Center North & South
Capacity Status: CI 08-00RTIP #:(CR)
Valley Center Road from city of Escondido to Cole Grade Road - widen and reconstruct with 14-ft striped
center 2-way lane, bike lanes and pathways
DESCRIPTION:
EST TOTAL COST:RAS (TA 7-50) $70,309
CONRWPEPRIORTOTAL 08/09 09/10 10/11 11/12 12/13
Local Funds $15,634 $15,634 $15,634
TransNet - L $44,157 $40,490 $3,667 $1,889 $2,848 $39,420
TransNet - L (Cash) $5,585 $5,585 $5,585
TransNet - LSI $4,933 $4,433 $500 $1,450 $3,483
TOTAL $70,309 $61,709 $8,100 $500 $3,339 $2,848 $64,122
MPO ID:TITLE:
CNTY21Bradley Avenue Overpass at SR 67
Capacity Status: CI 08-00RTIP #:(CR)
Bradley Avenue from Magnolia Ave. to Mollison Ave. - widen of Bradley Ave. including the SR-67 overpass
from 2 to 4 lanes plus sidewalks
DESCRIPTION:
EST TOTAL COST:RAS (TA 7-49) $34,000
CONRWPEPRIORTOTAL 08/09 09/10 10/11 11/12 12/13
RSTP $750 $750 $750
TransNet - L $698 $698 $698
TransNet - LSI $5,277 $535 $552 $600 $1,490 $2,100 $1,022 $4,255
TOTAL $6,725 $1,448 $535 $552 $600 $1,490 $2,100 $2,470 $4,255
MPO ID:TITLE:
CNTY24Cole Grade Road
Capacity Status: CI 08-00RTIP #:(CR)
Cole Grade Road from N. of Horse Creek Trail to South of Pauma Heights Road - widen to accommodate
14-ft traffic lane in both direction, 12-ft center 2-way left turn, 6-ft bike lane & 10-ft pathway
DESCRIPTION:
EST TOTAL COST:RAS (TA 7-49) $2,419
CONRWPEPRIORTOTAL 08/09 09/10 10/11 11/12 12/13
TransNet - L $1,127 $1,127 $1,127
TransNet - L (Cash) $408 $408 $408
TransNet - LSI $884 $129 $755 $795 $89
TOTAL $2,419 $1,127 $537 $755 $2,330 $89
65Page Wednesday, July 23, 2008
93

San Diego Region (in $000s)2008 Regional Transportation Improvement Program
MPO ID:TITLE:
CNTY25East Mission Road
San Diego County
Capacity Status: NCI 08-00RTIP #:Safety - Pavement resurfacing and/or rehabilitationExempt Category: (CR)
Mission Road from Hill St to Main - in Fallbrook, reconstruct roadDESCRIPTION:
EST TOTAL COST:RAS (TA 7-50) $2,024
CONRWPEPRIORTOTAL 08/09 09/10 10/11 11/12 12/13
TransNet - L $1,724 $1,724 $1,724
TransNet - LSI $300 $300 $300
TOTAL $2,024 $1,724 $300 $300 $1,724
MPO ID:TITLE:
CNTY26Street Improvements Lump Sum
Capacity Status: NCI 08-00RTIP #:Safety - Pavement resurfacing and/or rehabilitationExempt Category: (Maint)
Ramona Drive Sidewalks, Julian Avenue, Olive Vista Drive, and Valley Center Road - construction of
curbs, gutter, sidewalks, drainage, and landscaping
DESCRIPTION:
EST TOTAL COST: $23,543
CONRWPEPRIORTOTAL 08/09 09/10 10/11 11/12 12/13
TransNet - L $16,039 $16,039 $620 $1,075 $14,344
TransNet - L (Cash) $735 $735 $124 $611
TransNet - LSI $6,769 $3,299 $3,460 $10 $782 $121 $5,866
TOTAL $23,543 $16,039 $4,034 $3,460 $10 $1,526 $1,196 $20,821
MPO ID:TITLE:
CNTY33Via de Santa Fe/La Granada
Capacity Status: NCI 08-00RTIP #:Other - Interchange reconfiguration projectsExempt Category: (CR)
At Via de Santa Fe and La Granada from Camino Selva to La Fletcha - modify intersection to encourage
northbound traffic to use La Granada north of this intersection; work includes new striping, stop signs and
new sidewalk
DESCRIPTION:
EST TOTAL COST: $659
CONRWPEPRIORTOTAL 08/09 09/10 10/11 11/12 12/13
TransNet - L $278 $230 $48 $230 $48
TransNet - L (Cash) $55 $55 $55
TransNet - LSI $326 $326 $326
TOTAL $659 $230 $103 $326 $285 $48 $326
MPO ID:TITLE:
CNTY34Dye Road Extension
Capacity Status: CI 08-00RTIP #:(CR)
Dye Road from Dye Road to San Vicente Road - in Ramona, study, design and construct a 2-lane
community collector road with intermittent turn lanes, bike lanes, curb, gutter, and pathway
DESCRIPTION:
EST TOTAL COST: $1,980
CONRWPEPRIORTOTAL 08/09 09/10 10/11 11/12 12/13
TransNet - L $451 $384 $67 $451
TransNet - L (Cash) $242 $242 $242
TransNet - LSI $1,287 $105 $907 $275 $385 $102 $800
TOTAL $1,980 $384 $414 $907 $275 $1,078 $102 $800
66Page Wednesday, July 23, 2008
94

San Diego Region (in $000s)2008 Regional Transportation Improvement Program
MPO ID:TITLE:
CNTY35Ramona Street Extension
San Diego County
Capacity Status: CI 08-00RTIP #:(CR)
Ramona Street from Boundary Ave. to Warnock Dr. - in the community of Ramona, construct new road
extension, 2 lanes with intermittent turn lanes and bike lanes
DESCRIPTION:
EST TOTAL COST: $3,026
CONRWPEPRIORTOTAL 08/09 09/10 10/11 11/12 12/13
Local Funds
TransNet - L $288 $234 $54 $234 $54
TransNet - L (Cash) $225 $225 $225
TransNet - LSI $2,513 $1,977 $536 $362 $75 $2,076
TOTAL $3,026 $234 $2,256 $536 $821 $129 $2,076
MPO ID:TITLE:
CNTY36San Vicente Road Improvements
Capacity Status: CI 08-00RTIP #:(CR)
San Vicente Road from Warnock Drive to Wildcat Canyon Road - in Ramona, design and reconstruct road
improvements, including 2-lane community collector road with intermittent turn lanes, bike lanes, curb,
gutter, and pathway
DESCRIPTION:
EST TOTAL COST: $22,600
CONRWPEPRIORTOTAL 08/09 09/10 10/11 11/12 12/13
TransNet - L $1,600 $943 $657 $1,563 $21 $16
TransNet - L (Cash) $600 $600 $600
TransNet - LSI $20,400 $150 $2,250 $10,000 $8,000 $1,050 $1,800 $17,550
TOTAL $22,600 $943 $1,257 $150 $2,250 $10,000 $8,000 $3,213 $1,821 $17,566
MPO ID:TITLE:
CNTY38Rancho Santa Fe Roundabouts
Capacity Status: NCI 08-00RTIP #:Other - Interchange reconfiguration projectsExempt Category: (CR)
At intersections of Via De La Valle/Paseo Delicias, El Montevideo/Paseo Delicias/La Valle Plateada, and
El Camino Del Norte/El Escondido Del Dios Highway - in Rancho Santa Fe, replace existing stop sign
control with roundabouts at several intersections including ADA compliant pathways to accommodate
bicycles in the traffic lane or on walked on the pedestrian paths
DESCRIPTION:
EST TOTAL COST: $6,500
CONRWPEPRIORTOTAL 08/09 09/10 10/11 11/12 12/13
TransNet - LSI $585 $179 $306 $100 $581 $4
TOTAL $585 $179 $306 $100 $581 $4
MPO ID:TITLE:
CNTY39Bear Valley Parkway North
Capacity Status: CI 08-00RTIP #:(CR)
Bear Valley Parkway from San Pasqual Valley Road to Boyle Avenue - widen from two lanes to four lanes,
with a center median, a bike lane and shoulder in each direction of travel
DESCRIPTION:
EST TOTAL COST:RAS (TA 7-49) $13,100
CONRWPEPRIORTOTAL 08/09 09/10 10/11 11/12 12/13
TransNet - L $6 $6 $6
TransNet - L (Cash) $6 $6 $6
TransNet - LSI $2,987 $136 $1,101 $1,500 $250 $385 $992 $1,610
TOTAL $2,999 $6 $142 $1,101 $1,500 $250 $397 $992 $1,610
67Page Wednesday, July 23, 2008
95

San Diego Region (in $000s)2008 Regional Transportation Improvement Program
MPO ID:TITLE:
CNTY41Valley Center Road Widening (Cole
Grade to SR-76)
San Diego County
Capacity Status: NCI 08-00RTIP #:Other - Engineering studiesExempt Category: (CR)
Valley Center Road from City of Escondido to SR 76 - study future widening from 2-lanes to 4-lanes
between Cole Grade Road and SR-76
DESCRIPTION:
EST TOTAL COST:RAS (TA 7-50) $297
CONRWPEPRIORTOTAL 08/09 09/10 10/11 11/12 12/13
TransNet - LSI $297 $297 $297
TOTAL $297 $297 $297
MPO ID:TITLE:
CNTY42Otay Mesa Road Widening
Capacity Status: NCI 08-00RTIP #:Other - Engineering studiesExempt Category: (CR)
Otay Mesa Road from SR 125 to Enrico Fermi Drive - future widening of Otay MesaDESCRIPTION:
EST TOTAL COST:RAS (T A7-50) $217
CONRWPEPRIORTOTAL 08/09 09/10 10/11 11/12 12/13
TransNet - LSI $217 $164 $53 $217
TOTAL $217 $164 $53 $217
68Page Wednesday, July 23, 2008
96

San Diego Region (in $000s)2008 Regional Transportation Improvement Program
MPO ID:TITLE:
MTS23ATransNet Expanded Service Subsidy
San Diego Metropolitan Transit System
Capacity Status: NCI 08-00RTIP #:Mass Transit - Transit operating assistanceExempt Category:
MTS service area - operating support for existing service including rural bus service linking communities in
the rural portions of San Diego county to shopping and medical centers in the San Diego urban areas.
Service is regularly scheduled and includes published timetables and maps.
DESCRIPTION:
EST TOTAL COST: $109,267
CONRWPEPRIORTOTAL 08/09 09/10 10/11 11/12 12/13
TransNet - TSI $109,267 $20,782 $21,307 $21,843 $22,389 $22,946 $109,267
TOTAL $109,267 $20,782 $21,307 $21,843 $22,389 $22,946 $109,267
MPO ID:TITLE:
MTS28Bus & Rail Rolling Stock
Capacity Status: NCI 08-00RTIP #:Mass Transit - Purchase new buses and rail cars to
replace existing vehicles or minor expansions of fleet
Exempt Category:
MTS service area - purchase replacement buses (9 mid-size CNG, 141 ADA small, 11 medium, 83 40-foot
CNG, 10 high capacity) and Light Rail Vehicle rehabilitation, LRV Tires, rehabilitation of electronic control
circuit for U2s and LRV HVAC retrofit
DESCRIPTION:
EST TOTAL COST: $151,633
CONRWPEPRIORTOTAL 08/09 09/10 10/11 11/12 12/13
FTA 5307 $90,726 $33,342 $12,083 $13,552 $15,080 $16,669 $90,726
FTA 5309 (Bus) $985 $488 $497 $985
FTA 5309 (FG) $7,333 $4,133 $800 $800 $800 $800 $7,333
Local Funds $7,762 $7,762 $7,762
State Bond - STA $27,788 $27,788 $27,788
TDA $15,722 $576 $3,221 $3,588 $3,970 $4,367 $15,722
TransNet - Transit $1,317 $1,317 $1,317
TOTAL $151,633 $75,406 $16,601 $17,940 $19,850 $21,836 $151,633
MPO ID:TITLE:
MTS29Bus and Fixed Guideways Station
Stops and Terminals
Capacity Status: NCI 08-00RTIP #:Mass Transit - Reconstruction or renovation of transit
structures
Exempt Category:
Blue Line station in Chula Vista - ADA Bus stop improvement at the transit stationDESCRIPTION:
EST TOTAL COST: $2,685
CONRWPEPRIORTOTAL 08/09 09/10 10/11 11/12 12/13
FTA 5307 $400 $100 $100 $100 $100 $400
FTA 5309 (FG) $1,749 $144 $405 $400 $400 $400 $1,749
Local Funds $411 $36 $125 $125 $125 $411
TDA $125 $125 $125
TOTAL $2,685 $180 $630 $625 $625 $625 $2,685
69Page Wednesday, July 23, 2008
97

San Diego Region (in $000s)2008 Regional Transportation Improvement Program
MPO ID:TITLE:
MTS30Bus/Rail Support Equipment and
Facilities
San Diego Metropolitan Transit System
Capacity Status: NCI 08-00RTIP #:Mass Transit - Purchase of office, shop and operating
equipment for existing facilities
Exempt Category:
MTS facilities - bus video cameras, bus/rail facility and station security improvements, office/computer
equipment, rail traction motors, rail rehabilitation, other misc capital equipment for transit maintenance;
design, procure, and install fare collection system for all operators in the County
DESCRIPTION:
EST TOTAL COST: $57,806
CONRWPEPRIORTOTAL 08/09 09/10 10/11 11/12 12/13
FTA 5307 $27,604 $11,604 $4,000 $4,000 $4,000 $4,000 $27,604
FTA 5309 (Bus) $1,179 $1,179 $1,179
FTA 5309 (FG) $7,690 $2,810 $590 $1,086 $1,602 $1,602 $7,690
Local Funds $5,116 $5,116 $5,116
STA $3,074 $3,074 $3,074
TDA $5,919 $699 $1,148 $1,272 $1,400 $1,400 $5,919
TransNet - Transit $7,224 $7,224 $7,224
TOTAL $57,806 $31,706 $5,738 $6,358 $7,002 $7,002 $57,806
MPO ID:TITLE:
MTS31Rail Electrification and Power
Capacity Status: NCI 08-00RTIP #:Mass Transit - Track rehabilitation in existing right of wayExempt Category:
Along Blue Line ROW - Blue Line tie replacement, rail profile grindingDESCRIPTION:
EST TOTAL COST: $2,869
CONRWPEPRIORTOTAL 08/09 09/10 10/11 11/12 12/13
FTA 5309 (FG) $1,920 $480 $480 $480 $480 $1,920
STA $469 $469 $469
TDA $480 $120 $120 $120 $120 $480
TOTAL $2,869 $469 $600 $600 $600 $600 $2,869
MPO ID:TITLE:
MTS32ABus & Rail Preventive Maintenance
Capacity Status: NCI 08-00RTIP #:Mass Transit - Transit operating assistanceExempt Category:
MTS service area - maintenance of federally funded equipment, rolling stock and facilities for bus and rail
systems
DESCRIPTION:
EST TOTAL COST: $174,000
CONRWPEPRIORTOTAL 08/09 09/10 10/11 11/12 12/13
FTA 5307 $89,274 $29,274 $15,000 $15,000 $15,000 $15,000 $89,274
FTA 5309 (FG) $49,200 $16,400 $8,200 $8,200 $8,200 $8,200 $49,200
Local Funds $6,548 $6,548 $6,548
TDA $28,978 $5,778 $5,800 $5,800 $5,800 $5,800 $28,978
TOTAL $174,000 $58,000 $29,000 $29,000 $29,000 $29,000 $174,000
MPO ID:TITLE:
MTS33ASenior Disabled Program
Capacity Status: NCI 08-00RTIP #:Mass Transit - Transit operating assistanceExempt Category:
MTS service area - Subsidy for senior and disabled as required by TransNetDESCRIPTION:
EST TOTAL COST: $4,892
CONRWPEPRIORTOTAL 08/09 09/10 10/11 11/12 12/13
TransNet - ADA $3,628 $697 $711 $725 $740 $755 $3,628
TransNet - Transit (S&D) $1,264 $1,264 $1,264
TOTAL $4,892 $1,264 $697 $711 $725 $740 $755 $4,892
70Page Wednesday, July 23, 2008
98

San Diego Region (in $000s)2008 Regional Transportation Improvement Program
MPO ID:TITLE:
MTS34Bus Signal and Communications
Equipments
San Diego Metropolitan Transit System
Capacity Status: NCI 08-00RTIP #:Mass Transit - Reconstruction or renovation of transit
structures
Exempt Category:
MTS service area - rehabilitation of light rail vehicles (LRV), electronic control circuit (U2), LRV HVAC
retrofit, rehabilitate traction motor phase II and pilot motor control unit drive, LRV tires; design and
implement new ITS to replace failing radio/CAD and scheduling system
DESCRIPTION:
EST TOTAL COST: $10,104
CONRWPEPRIORTOTAL 08/09 09/10 10/11 11/12 12/13
FTA 5307 $7,915 $3,115 $1,200 $1,200 $1,200 $1,200 $7,915
FTA 5309 (FG) $120 $120 $120
Local Funds $765 $765 $765
STA $60 $60 $60
TDA $1,244 $44 $300 $300 $300 $300 $1,244
TOTAL $10,104 $4,104 $1,500 $1,500 $1,500 $1,500 $10,104
MPO ID:TITLE:
MTS35Fixed Guideway Transitways/Lines
Capacity Status: NCI 08-00RTIP #:Mass Transit - Track rehabilitation in existing right of wayExempt Category:
MTS service area - rail infrastructure including Blue Line tie replacement, Taylor Street grade crossing
improvements, switch indicator standardization and rail file grinding
DESCRIPTION:
EST TOTAL COST: $3,217
CONRWPEPRIORTOTAL 08/09 09/10 10/11 11/12 12/13
FTA 5309 (FG) $2,546 $946 $400 $400 $400 $400 $2,546
Local Funds $121 $121 $121
STA $34 $34 $34
TDA $516 $116 $100 $100 $100 $100 $516
TOTAL $3,217 $1,217 $500 $500 $500 $500 $3,217
MPO ID:TITLE:
MTS42Job Access Reverse Commute
funded Transit Operating Assistance
Capacity Status: NCI 08-00RTIP #:Mass Transit - Transit operating assistanceExempt Category:
Route 905 (San Ysidro to Otay Mesa), Route 960 (UTC-Euclid Stattion) and Route 30 (Weekend Service) -
transit operating assistance to fund an unmet need identified in previous Welfare to Work Transit Study
and SD Regional Welfare to work transportation plan to mitigate transit service deficiencies; new service
will be added for these routes including AM peak northbound trip for Route 960 and expanding the current
service in the other two routes; purchase HASTOPS - a module that works with HASTUS software that
allows automatic production of bus stop posters and distribute them in a more efficient and effective
manner
DESCRIPTION:
EST TOTAL COST: $6,541
CONRWPEPRIORTOTAL 08/09 09/10 10/11 11/12 12/13
FTA 5316 - JARC $3,294 $2,290 $1,004 $3,294
Local Funds $3,247 $2,290 $957 $3,247
TOTAL $6,541 $4,580 $1,961 $6,541
71Page Wednesday, July 23, 2008
99

San Diego Region (in $000s)2008 Regional Transportation Improvement Program
MPO ID:TITLE:
SD01Alvarado Canyon Road Realignment
San Diego, City of
Capacity Status: NCI 08-00RTIP #:Other - Intersection signalization projectsExempt Category: (CR)
Alvarado Canyon Road from Fairmount Ave./Camino del Rio N to Fairmount Ave./Mission Gorge Road - in
San Diego, roadway realignment and improvements to include traffic signal modifications to improve traffic
flow at the interchange of I-8, Fairmount Avenue and Mission Gorge Road. (CIP: 52-713.0)
DESCRIPTION:
EST TOTAL COST: $9,550
CONRWPEPRIORTOTAL 08/09 09/10 10/11 11/12 12/13
TransNet - L $460 $460 $460
TransNet - LSI $4,190 $100 $4,090 $100 $4,090
TOTAL $4,650 $460 $100 $4,090 $560 $4,090
MPO ID:TITLE:
SD04Division Street - I-5 to 43rd Street
Capacity Status: CI 08-00RTIP #:
Division Street from I-5 to 43rd Street - in San Diego, Phase I: signal additions, drainage rehabilitation and
minor street improvements; Phase II: widen from 2 to 4 lanes roadway (CIP: 52-347.0)
DESCRIPTION:
EST TOTAL COST: $1,478
CONRWPEPRIORTOTAL 08/09 09/10 10/11 11/12 12/13
Local Funds $1,250 $50 $1,200 $1,250
TransNet - L $228 $228 $228
TOTAL $1,478 $278 $1,200 $1,478
MPO ID:TITLE:
SD06Aldine Drive and Fairmont Avenue
Slope Restoration
Capacity Status: NCI 08-00RTIP #:Safety - Guardrails, median barriers, crash cushionsExempt Category: (CR)
Fairmount Avenue between Meade Avenue and Aldine Drive, Aldine Drive between Fairmount Avenue and
Adams Avenue - in San Diego, provides for road restoration and slope stability improvements for the
purpose of improving capacity impeding conditions as a result of slope failure and related drainage
conditions (CIP 52-592.0)
DESCRIPTION:
EST TOTAL COST:RAS (TA7-47) $2,335
CONRWPEPRIORTOTAL 08/09 09/10 10/11 11/12 12/13
Local Funds $10 $10 $10
TransNet - L $500 $500 $300 $200
TransNet - LSI $1,825 $1,825 $1,825
TOTAL $2,335 $510 $1,825 $300 $2,035
72Page Wednesday, July 23, 2008
100

San Diego Region (in $000s)2008 Regional Transportation Improvement Program
MPO ID:TITLE:
SD09Sidewalks
San Diego, City of
Capacity Status: NCI 08-00RTIP #:Air Quality - Bicycle and pedestrian facilitiesExempt Category: (CR)
Genesee Ave. & Marlesta Dr.: new sidewalk, curb ramps, railings, Satellite Blvd.: new sidewalk northside
between Thermal & Saturn, Hollister St & Ilex St.: new sidewalk & curb ramps where missing, 28th St.
from Treat St. to 115'north: new sidewalk, La Jolla Shores Dr. n/o Cam del Collado: new sidewalk where
missing Nimitz Blvd. at W. Pt. Loma: new sidewalk on southside, Juniper St. from Felton St. to Westland
Ave.: new sidewalk northside 67th St. from El Cajon Blvd. to Amherst: new sidewalk where missing
including curb and gutter Bluffside Ave./Mission Bay Dr. from Pico S.t to Rose Creek Crossing: install new
5 foot wide sidewalk Green Bay from Iris to Rimbey: new sidewalk and curb ramps - install new sidewalks
(CIP 52-700/715, 59-002)
DESCRIPTION:
EST TOTAL COST: $4,660
CONRWPEPRIORTOTAL 08/09 09/10 10/11 11/12 12/13
TransNet - L $2,910 $2,910 $21 $2,889
TransNet - LSI $1,750 $350 $350 $350 $350 $350 $1,750
TOTAL $4,660 $2,910 $350 $350 $350 $350 $350 $21 $4,639
MPO ID:TITLE:
SD11Regents Road Bridge
Capacity Status: NCI 08-00RTIP #:Other - Engineering studiesExempt Category:
Regents Road from Lahitte Ct. to Governor Dr. - in San Diego on Regents Road Bridge spanning the
AT&SF railroad and a portion of the Rose Canyon flood plain connecting the existing Regents Rd. on both
sides of the canyon; future widening Regents Rd. from 100' north of Lahitte Ct. to Governor and from 100'
north of Lahitte Ct. to the south abutment of the bridge including four lane with sidewalks and class II bike
lanes (CIP 53-044.0)
DESCRIPTION:
EST TOTAL COST:RAS (TA7-48) $38,344
CONRWPEPRIORTOTAL 08/09 09/10 10/11 11/12 12/13
Local Funds $38,236 $24,109 $14,127 $38,236
TransNet - L $108 $108 $108
TOTAL $38,344 $24,217 $14,127 $38,344
MPO ID:TITLE:
SD14SR 15 Bikeway
Capacity Status: NCI 08-00RTIP #:Air Quality - Bicycle and pedestrian facilitiesExempt Category: (CR)
State Route 15 from Landis Street to Adams Avenue - in San Diego, Pedestrian and bicycle right-of-way
improvements along I-15 corridor including widened pedestrian paths, lighting, signage, striping and signal
improvements(581270)
DESCRIPTION:
EST TOTAL COST: $851
CONRWPEPRIORTOTAL 08/09 09/10 10/11 11/12 12/13
CMAQ $525 $525 $525
TransNet - B $286 $286 $68 $218
TransNet - LSI $40 $40 $40
TOTAL $851 $811 $40 $633 $218
73Page Wednesday, July 23, 2008
101

San Diego Region (in $000s)2008 Regional Transportation Improvement Program
MPO ID:TITLE:
SD15Street Lights
San Diego, City of
Capacity Status: NCI 08-00RTIP #:Safety - Lighting improvementsExempt Category: (CR)
Install new street lights:, Donahue St @ Friars Rd, northeast corner, Donahue St @ Friars Rd, northwest
corner, Donahue St @ Friars Rd, southside, Fifth Ave @ Brookes Ave, northeast corner, Fifth Ave @
Anderson Pl, southeast corner, 29th St @ Broadway, northwest corner, 18th St @ Coronado Ave (sb),
northeast corner, 18th St @ Coronado Ave (sb), northwest corner, 18th St @ Coronado Ave (sb), south
side - in San Diego, install new street lights (CIP 52-293.0, 61-201.0, 68-012.0)
DESCRIPTION:
EST TOTAL COST: $5,046
CONRWPEPRIORTOTAL 08/09 09/10 10/11 11/12 12/13
Local Funds $400 $200 $200 $400
TransNet - L $3,135 $3,135 $3,135
TransNet - LSI $1,511 $311 $300 $300 $300 $300 $1,511
TOTAL $5,046 $3,335 $511 $300 $300 $300 $300 $5,046
MPO ID:TITLE:
SD16ATraffic Signals Citywide
Capacity Status: NCI 08-00RTIP #:Other - Intersection signalization projectsExempt Category: (CR)
New traffic signal installation locations:, Technology Drive at West Bernardo Drive and Lincoln Avenue at
Park Boulevard, Traffic signal upgrades/modernization locations:, Hillcrest/Uptown Vehicle Detection
Installation, Ash Street, 5th Ave. @ Robinson Ave., 8th Ave. @ Broadway, 8th Ave. @ E Street, 10th Ave.
@ E Street, 11th Ave. @ E street, 25th St. @ Market Street, 30th St. @ Market Street, 32nd St. @
Market Street, Balboa Ave. @ Viewridge Ave., Black Mtn. Rd. @ Capricorn Way, Cam Santa Fe @ Mira
Mesa Blvd., Canon St. @ Rosecrans St., Chatsworth Blvd. @ Voltaire St., Clairemont Dr. @ Merrimac
St., El Cajon Blvd. @ Fairmount Ave., Evergreen St/Lowell St. @ Nimitz Blvd., Executive Dr. @ Towne
Center Dr., Huennekens St. @ Mira Mesa Blvd., Lake Murray Blvd. @ Turnbridge Way, Lusk Blvd. @
Vista Sorrento Pkwy., Mira Mesa Blvd. @ Westview Pkwy., Moore St. @ Old Town Ave., Pacific Hwy. @
Palm St. (W), Palm Ave. (sb) @ Saturn Blvd., Rosecrans St. @ Talbot St., Scott St. @ Shelter Island Dr.,
Interconnect Systems:, Hardware, software upgrades to centrally controlled traffic signal optimization
system, Traffic controller replacement:, upgrade 75 downtown locations, , - in San Diego, install new
traffic signals with intersection street lighting systems, upgrade/modernize traffic signals, install
passive/permissive traffic signal systems; traffic signal interconnect systems (CIP 62-001/002/210,
63-002/043, 68-001/010/011, 62-275/292, 62-331.0)
DESCRIPTION:
EST TOTAL COST: $14,517
CONRWPEPRIORTOTAL 08/09 09/10 10/11 11/12 12/13
TransNet - L $5,790 $5,790 $5,790
TransNet - LSI $8,726 $2,162 $1,625 $1,635 $1,646 $1,658 $8,726
TOTAL $14,516 $5,790 $2,162 $1,625 $1,635 $1,646 $1,658 $14,516
MPO ID:TITLE:
SD17Guard Rails
Capacity Status: NCI 08-00RTIP #:Safety - Guardrails, median barriers, crash cushionsExempt Category:
Citywide - install new and replace old guard rails along streets (CIP 68-006.0)DESCRIPTION:
EST TOTAL COST: $1,250
CONRWPEPRIORTOTAL 08/09 09/10 10/11 11/12 12/13
Local Funds $200 $200 $200
TransNet - L $1,050 $1,050 $1,050
TOTAL $1,250 $1,050 $200 $1,250
74Page Wednesday, July 23, 2008
102

San Diego Region (in $000s)2008 Regional Transportation Improvement Program
MPO ID:TITLE:
SD18Traffic Control Measures
San Diego, City of
Capacity Status: NCI 08-00RTIP #:Safety - Non signalization traffic control and operatngExempt Category: (CR)
In Smart Growth Areas of San Diego: Park Blvd. @ City College:lighted crosswalk and pop-outs, Saturn
Blvd. south of Coronado Ave.: median installation, Park Blvd. @ Essex St: lighted crosswalk, Rimbey Ave.
@ school location mid-block: crosswalk and pop-outs, 5th Ave. @ Nutmeg St.: lighted crosswalk, Thermal
Ave. @ Hermes St.: pop-outs, Lotus Drive: traffic circles Park Blvd. @ Cypress Ave.: lighted crosswalk
and pop-outs, Fay Ave. north of Pearl St.: pop-outs, Adams Ave. @ Hamilton St.: pop-outs, Saturn Ave.
@ Hermes St.: pop-outs, Mission Bay Dr. @ Grand Ave.: "S" type median, Traffic calming measures at:
Landale Drive, Leon Avenue, Washington Place, Cardeno Drive, Lotus Drive, Calle Cristobal, Park Village
Road, Villa Mallorca - traffic control and traffic calming measures (CIP 61-001.0)
DESCRIPTION:
EST TOTAL COST: $3,417
CONRWPEPRIORTOTAL 08/09 09/10 10/11 11/12 12/13
Local Funds $163 $163 $163
TransNet - L $2,254 $2,254 $2,254
TransNet - LSI $1,000 $200 $200 $200 $200 $200 $1,000
TOTAL $3,417 $2,254 $363 $200 $200 $200 $200 $3,417
MPO ID:TITLE:
SD19Streamview Drive
Capacity Status: NCI 08-00RTIP #:Safety - Adding mediansExempt Category: (CR)
Streamview Drive from 54th Street to College Avenue - in San Diego, installation of new raised median,
new sidewalk including curb & gutter, and traffic circles to improve the flow of traffic and increase safety
(CIP 52-588.0)
DESCRIPTION:
EST TOTAL COST: $1,970
CONRWPEPRIORTOTAL 08/09 09/10 10/11 11/12 12/13
TransNet - L $350 $350 $350
TransNet - LSI $1,620 $180 $200 $1,240 $380 $1,240
TOTAL $1,970 $350 $180 $200 $1,240 $730 $1,240
MPO ID:TITLE:
SD23Storm Drains - Roadway Drainage
Improvements
Capacity Status: NCI 08-00RTIP #:Other - Intersection channelization projectsExempt Category: (CR)
Ransom/Darwin , Glen Curtis Drain, Ingulf Place , Riviera Drive at 3663, Wenrich Drive, Fashion Valley
Road, - roadway drainage projects for the purpose of improving traffic impeding conditions and alleviate
significant and frequent flooding (CIP 13-005.0, 13-502.0, 11-3020/3060/3070,)
DESCRIPTION:
EST TOTAL COST: $9,358
CONRWPEPRIORTOTAL 08/09 09/10 10/11 11/12 12/13
Local Funds $1,605 $1,605 $1,605
TransNet - L $4,428 $4,428 $4,428
TransNet - LSI $3,325 $600 $600 $600 $726 $799 $3,325
TOTAL $9,358 $4,428 $2,205 $600 $600 $726 $799 $9,358
75Page Wednesday, July 23, 2008
103

San Diego Region (in $000s)2008 Regional Transportation Improvement Program
MPO ID:TITLE:
SD2943rd/Logan/National Avenues
San Diego, City of
Capacity Status: NCI 08-00RTIP #:Other - Intersection channelization projectsExempt Category:
43rd Street from Logan to National - intersection realignments (CIP 52-409)DESCRIPTION:
EST TOTAL COST: $11,379
CONRWPEPRIORTOTAL 08/09 09/10 10/11 11/12 12/13
Local Funds $7,540 $117 $7,423 $50 $7,490
TransNet - L $3,839 $3,839 $1,352 $2,334 $153
TOTAL $11,379 $3,956 $7,423 $1,402 $2,334 $7,643
MPO ID:TITLE:
SD31Carmel Valley Road
Capacity Status: NCI 08-00RTIP #:Air Quality - Bicycle and pedestrian facilitiesExempt Category: (CR)
Carmel Valley Road from 300 feet east of Portofino Drive to Via Mar Valle (Del Mar limit) - in San Diego,
modify existing 2-lane collector street by adding Class II bike path (CIP 52-517)
DESCRIPTION:
EST TOTAL COST:RAS (TA7-46) $9,045
CONRWPEPRIORTOTAL 08/09 09/10 10/11 11/12 12/13
Local Funds $562 $562 $562
TransNet - L $8,288 $8,288 $1,859 $6,429
TransNet - LSI $195 $120 $25 $25 $25 $195
TOTAL $9,045 $8,850 $120 $25 $25 $25 $1,859 $7,186
MPO ID:TITLE:
SD34El Camino Real
Capacity Status: CI 08-00RTIP #:(CR)
El Camino Real from San Dieguito Road to Via de la Valle - In San Diego on El Camino Real from San
Dieguito Road to Via de la Valle - reconstruct & widen from 2 to 4 lanes and extend transition lane and
additional grading to avoid biological impacts (CIP 52-479.0)
DESCRIPTION:
EST TOTAL COST:RAS (TA7-47) $13,276
CONRWPEPRIORTOTAL 08/09 09/10 10/11 11/12 12/13
HBP $320 $320 $320
HBRR $1,708 $1,708 $1,700 $8
Local Funds $3,106 $3,106 $652 $1,527 $927
RSTP $2,717 $2,717 $2,717
TransNet - L $526 $526 $526
TransNet - LSI $4,899 $300 $300 $500 $3,799 $1,100 $3,799
TOTAL $13,276 $5,660 $300 $300 $3,217 $3,799 $4,298 $1,535 $7,443
MPO ID:TITLE:
SD38Georgia St Bridge/University Ave
Capacity Status: NCI 08-00RTIP #:Safety - Guardrails, median barriers, crash cushionsExempt Category:
On Georgia Street over University Avenue - in San Diego, provides for bridge replacement, retaining walls
and guardrails along bridge walls (CIP 52-555)
DESCRIPTION:
EST TOTAL COST: $8,963
CONRWPEPRIORTOTAL 08/09 09/10 10/11 11/12 12/13
Local Funds $671 $671 $671
TransNet - L $2,333 $2,333 $1,095 $1,238
TOTAL $3,004 $2,333 $671 $1,095 $1,909
76Page Wednesday, July 23, 2008
104

San Diego Region (in $000s)2008 Regional Transportation Improvement Program
MPO ID:TITLE:
SD49Median Improvements Citywide
San Diego, City of
Capacity Status: NCI 08-00RTIP #:Safety - Pavement marking demonstrationExempt Category: (CR)
El Cajon Blvd. (CIP 39-234.0), Navajo (CIP 52-668.0), Normal St. (CIP 52-769.0) and Thorn (52-406.0),
Florida Ave. between Bob Wilson Dr. and Pershing Dr. (new median for safety improvements) - in San
Diego for safety improvements and/or left turn movements
DESCRIPTION:
EST TOTAL COST: $6,165
CONRWPEPRIORTOTAL 08/09 09/10 10/11 11/12 12/13
Local Funds $1,327 $1,102 $225 $1,102 $225
TransNet - L $2,505 $2,505 $2,505
TransNet - L (Cash) $641 $641 $641
TransNet - LSI $1,692 $300 $300 $330 $363 $399 $1,692
TOTAL $6,165 $4,248 $525 $300 $330 $363 $399 $3,607 $2,558
MPO ID:TITLE:
SD51North Torrey Pines Road Bridge
Capacity Status: NCI 08-00RTIP #:Safety - Non capacity widening or bridge reconstructionExempt Category: (CR)
North Torrey Pines Road from Carmel Valley Road to Torrey Pines Park Road - in San Diego, replace
North Torrey Pines Road bridge over Los Penasquitos Creek (CIP 53-050.0)
DESCRIPTION:
EST TOTAL COST:RAS (T7-48) $3,070
CONRWPEPRIORTOTAL 08/09 09/10 10/11 11/12 12/13
Local Funds $243 $208 $35 $243
TransNet - L $2,752 $2,752 $653 $2,099
TransNet - LSI $75 $50 $25 $75
TOTAL $3,070 $2,960 $85 $25 $653 $2,417
MPO ID:TITLE:
SD70West Mission Bay Drive Bridge
Capacity Status: CI 08-00RTIP #:(CR)
West Mission Bay Drive bridge over San Diego River - in San Diego, replace and increase from 4 to 6-lane
bridge including Class II bike lane (52-643)
DESCRIPTION:
EST TOTAL COST:RAS (T7-49) $62,317
CONRWPEPRIORTOTAL 08/09 09/10 10/11 11/12 12/13
HBRR $2,600 $2,600 $2,600
TransNet - L $1,240 $1,240 $1,240
TransNet - LSI $600 $100 $100 $100 $100 $200 $600
TOTAL $4,440 $3,840 $100 $100 $100 $100 $200 $4,440
MPO ID:TITLE:
SD81Genesee Avenue - Nobel Drive to
SR52
Capacity Status: NCI 08-00RTIP #:Other - Engineering studiesExempt Category:
Genesee Avenue from Noble Drive to SR 52 - in San Diego, future widening to 6-lane major street north of
Decoro Street and to a 6-lane primary arterial south of Decoro Street and included Class II bicycle lanes
(CIP 52-458.0)
DESCRIPTION:
EST TOTAL COST:RAS (TA7-47) $24,500
CONRWPEPRIORTOTAL 08/09 09/10 10/11 11/12 12/13
Local Funds $5,952 $1,500 $2,675 $1,777 $5,952
TOTAL $5,952 $1,500 $2,675 $1,777 $5,952
77Page Wednesday, July 23, 2008
105

San Diego Region (in $000s)2008 Regional Transportation Improvement Program
MPO ID:TITLE:
SD83SR 163 & Friars Road
San Diego, City of
Capacity Status: NCI 08-00RTIP #:Other - Engineering studiesExempt Category: (CR)
SR163 and Friars Road - in San Diego, future construction new southbound SR 163 to westbound Friars
Road off-ramp - PE only (CIP 52-455)
DESCRIPTION:
EST TOTAL COST:RAS (TA7-47) $15,072
CONRWPEPRIORTOTAL 08/09 09/10 10/11 11/12 12/13
Local Funds $3,673 $673 $3,000 $3,673
RSTP $2,240 $2,240 $2,240
TransNet - L $2,207 $2,207 $2,207
TransNet - LSI $6,952 $2,000 $4,952 $6,952
TOTAL $15,072 $5,120 $5,000 $4,952 $15,072
MPO ID:TITLE:
SD86Famosa Slough Salt Marsh
Restoration
Capacity Status: NCI 08-00RTIP #:Air Quality - Bicycle and pedestrian facilitiesExempt Category: (CR)
West Point Loma Blvd. from Rue D'Orleans to Famosa Blvd. - in San Diego, provide enhanced pedestrian
and bicycle access, and usability to the open space area by leveling and widening access road which
would improve emergency vehicle access and also provided mitigation for impacts to coastal salt marsh
(CIP 12-152.0)
DESCRIPTION:
EST TOTAL COST: $265
CONRWPEPRIORTOTAL 08/09 09/10 10/11 11/12 12/13
TransNet - L $219 $219 $219
TransNet - LSI $46 $24 $22 $46
TOTAL $265 $219 $24 $22 $219 $46
MPO ID:TITLE:
SD90SR 163/Clairemont Mesa Blvd.
Interchange
Capacity Status: CI 08-00RTIP #:(CR)
Clairemont Mesa Blvd. from Kearny Villa Road to Kearny Mesa - in San Diego, widen from 4 to 6 lane
prime arterial; Phase II of the project - west ramps (CIP 52-745.0)
DESCRIPTION:
EST TOTAL COST:RAS (TA7-46) $24,600
CONRWPEPRIORTOTAL 08/09 09/10 10/11 11/12 12/13
Local Funds $17,862 $9,862 $8,000 $2,535 $15,327
RSTP $5,238 $5,238 $5,238
TransNet - L $500 $500 $500
TransNet - LSI $1,000 $1,000 $1,000
TOTAL $24,600 $15,600 $1,000 $8,000 $3,535 $21,065
78Page Wednesday, July 23, 2008
106

San Diego Region (in $000s)2008 Regional Transportation Improvement Program
MPO ID:TITLE:
SD92Streetscape Improvement Projects
San Diego, City of
Capacity Status: NCI 08-00RTIP #:Other - Plantings, landscaping, etcExempt Category: (CR)
Golden Hill Improvement on Beech/Fern/30th (37-224), Washington Street from San Diego Ave. to Front
St.; and on Goldfinch St. from University Ave. to Ft. Stockton (39-216), Hillcrest Improvements on
University Ave. from 10th to Park; and on Normal Street from University to Washington (39-213), North
Park/University Avenue Improvements (39-207), Azalea Park area - on Poplar Street at Fairmount Avenue
and Poplar Street at Tulip Street(39-086.0/39-086.1) - in San Diego, installation of new medians for
vehicular and pedestrian safety as well as new sidewalks with curb ramps and curb extensions; install
median for safety improvements including pop-outs for safer pedestrian crossing of the intersection
DESCRIPTION:
EST TOTAL COST: $5,200
CONRWPEPRIORTOTAL 08/09 09/10 10/11 11/12 12/13
Local Funds $3,620 $3,620 $3,620
TransNet - L $1,220 $1,220 $1,220
TransNet - LSI $360 $150 $210 $50 $310
TOTAL $5,200 $4,840 $150 $210 $50 $5,150
MPO ID:TITLE:
SD96Street Resurfacing Citywide
Capacity Status: NCI 08-00RTIP #:Safety - Pavement resurfacing and/or rehabilitationExempt Category:
Citywide - in San Diego, resurface and slurry seal city streets (590010)DESCRIPTION:
EST TOTAL COST: $14,269
CONRWPEPRIORTOTAL 08/09 09/10 10/11 11/12 12/13
Local Funds $10,269 $10,269 $10,269
TransNet - L $4,000 $4,000 $4,000
TOTAL $14,269 $4,000 $10,269 $14,269
MPO ID:TITLE:
SD97School Traffic Safety Improvements
Capacity Status: NCI 08-00RTIP #:Other - Intersection signalization projectsExempt Category: (CR)
Willow Elementary located in San Ysidro on Willow Road, Joyner Elementary located on Myrtle Ave - in
San Diego, provide traffic control devices (CIP 68-017)(62-266.0)(62-337.0)
DESCRIPTION:
EST TOTAL COST: $1,930
CONRWPEPRIORTOTAL 08/09 09/10 10/11 11/12 12/13
Local Funds $150 $150 $150
TransNet - L $650 $650 $650
TransNet - LSI $1,130 $330 $200 $200 $200 $200 $1,130
TOTAL $1,930 $650 $480 $200 $200 $200 $200 $1,930
MPO ID:TITLE:
SD99Bridge Rehabilitation
Capacity Status: NCI 08-00RTIP #:Safety - Guardrails, median barriers, crash cushionsExempt Category: (CR)
Citywide - in San Diego, bridge retrofit or replacement projects citywide(525190)including Voltaire Street
Bridge over Nimitz Blvd. rehabilitation (525233) and Barnett Ave. Bridge over Pacific Highway (525231)
DESCRIPTION:
EST TOTAL COST: $900
CONRWPEPRIORTOTAL 08/09 09/10 10/11 11/12 12/13
TransNet - L $300 $300 $300
TransNet - LSI $600 $100 $100 $121 $133 $146 $600
TOTAL $900 $300 $100 $100 $121 $133 $146 $900
79Page Wednesday, July 23, 2008
107

San Diego Region (in $000s)2008 Regional Transportation Improvement Program
MPO ID:TITLE:
SD101First Avenue Bridge Over Maple
Canyon
San Diego, City of
Capacity Status: NCI 08-00RTIP #:Safety - Non capacity widening or bridge reconstructionExempt Category:
First Avenue from Nutmeg Street to Quince Street - in San Diego, seismic retrofit of bridge (CIP 52-554.0)
(local match to HBP, part of CAL44)
DESCRIPTION:
EST TOTAL COST: $19,675
CONRWPEPRIORTOTAL 08/09 09/10 10/11 11/12 12/13
Local Funds $711 $411 $300 $711
TransNet - L $1,264 $1,264 $750 $514
TOTAL $1,975 $1,675 $300 $750 $1,225
MPO ID:TITLE:
SD102Otay Truck Route
Capacity Status: NCI 08-00RTIP #:Safety - Emergency truck pulloversExempt Category:
Otay Truck Route from Drucker Lane to Point of Entry - in San Diego, add emergency lane primarily for
Border Patrol use and fire department access (Phase 3) (CIP 52-682.1)
DESCRIPTION:
EST TOTAL COST: $3,480
CONRWPEPRIORTOTAL 08/09 09/10 10/11 11/12 12/13
Local Funds $780 $780 $780
STP - Sec 117 $2,000 $2,000 $2,000
TransNet - L $700 $700 $700
TOTAL $3,480 $1,480 $2,000 $1,480 $2,000
MPO ID:TITLE:
SD102AOtay Truck Route Widening (Ph. 4)
Capacity Status: CI 08-00RTIP #:(CR)
on Otay Truck Route - in San Diego, from Drucker Lane to La Media, add one lane (total 3 lanes) for
trucks; from Britannia to La Media, add one lane for trucks and one lane for emergency vehicles (Border
Patrol/fire department access) (CIP 52-682.1)
DESCRIPTION:
EST TOTAL COST:EARMARK NO: CA596/2655, CA700/3776 $7,101
CONRWPEPRIORTOTAL 08/09 09/10 10/11 11/12 12/13
HPP $4,201 $473 $3,728 $473 $3,728
Local Funds $1,050 $118 $932 $118 $932
TransNet - L $100 $100 $100
TransNet - LSI $1,750 $500 $1,250 $1,750
TOTAL $7,101 $691 $4,660 $500 $1,250 $691 $6,410
80Page Wednesday, July 23, 2008
108

San Diego Region (in $000s)2008 Regional Transportation Improvement Program
MPO ID:TITLE:
SD103I-5/Genesee Ave Interchange
San Diego, City of
Capacity Status: CI 08-00RTIP #:
Along I- 5 from Sorrento Valley Road to Genesee Avenue - in San Diego, replace Genesee Ave. over
crossing from 4-lane bridge with 6-lane bridge; construct auxiliary lanes and replace Voight Drive bridge;
add additional lane at on/off ramp to Sorrento Valley Rd.; add one carpool lane and one general purpose
lane to on ramp from Sorrento Valley Road to southbound I-5; install ramp meters at on ramp and
construct a southbound auxiliary lane between Sorrento Valley Road and Genesee Avenue
DESCRIPTION:
EST TOTAL COST:RTP PAGE NO: A-5
RAS (TA7-41)
$27,363
CONRWPEPRIORTOTAL 08/09 09/10 10/11 11/12 12/13
HPP $1,600 $1,280 $320 $1,600
Local Funds $24,800 $9,200 $15,600 $9,940 $3,960 $10,900
TransNet - MC $963 $963 $963
TOTAL $27,363 $10,480 $320 $16,563 $11,540 $3,960 $11,863
MPO ID:TITLE:
SD106Mission Beach Bulkhead Preservation
Capacity Status: NCI 08-00RTIP #:Other - Plantings, landscaping, etcExempt Category:
Ocean Front Walk from Balboa Ct. to Pacific Beach Dr. - in San Diego, preserves bulkhead including
replacing concrete deck and restoring wall (CIP 527190)
DESCRIPTION:
EST TOTAL COST: $1,015
CONRWPEPRIORTOTAL 08/09 09/10 10/11 11/12 12/13
Local Funds $150 $150 $150
TransNet - L $865 $865 $865
TOTAL $1,015 $865 $150 $1,015
MPO ID:TITLE:
SD108Bayshore Bikeway
Capacity Status: NCI 08-00RTIP #:Air Quality - Bicycle and pedestrian facilitiesExempt Category:
Along bayshore bikeway - in San Diego at the borders of Imperial Beach (13th Street) and Chula Vista
(Main Street, design/construct Class I bike path (581400)
DESCRIPTION:
EST TOTAL COST: $5,260
CONRWPEPRIORTOTAL 08/09 09/10 10/11 11/12 12/13
PTA $90 $90 $90
TransNet - B $772 $772 $329 $443
TransNet - BPNS $624 $624 $624
TransNet - MC $3,774 $3,774 $1,284 $2,490
TOTAL $5,260 $4,636 $624 $1,703 $3,557
81Page Wednesday, July 23, 2008
109

San Diego Region (in $000s)2008 Regional Transportation Improvement Program
MPO ID:TITLE:
SD120San Diego River Multi-Use Bicycle
and Pedestrian Path
San Diego, City of
Capacity Status: NCI 08-00RTIP #:Air Quality - Bicycle and pedestrian facilitiesExempt Category: (CR)
Hazard Center Drive from SR163 westside to SR163 eastside - in San Diego on Hazard Center Road under
SR 163 - construct bicycle and pedestrian path on north side of San Diego River (CIP 58-191.0)
DESCRIPTION:
EST TOTAL COST:EARMARK NO: CA 317/90 $900
CONRWPEPRIORTOTAL 08/09 09/10 10/11 11/12 12/13
HPP $400 $400 $400
TransNet - B $180 $180 $180
TransNet - LSI $320 $320 $320
TOTAL $900 $180 $720 $180 $720
MPO ID:TITLE:
SD125Park Boulevard-Harbor Drive Rail
Grade Separation
Capacity Status: NCI 08-00RTIP #:Safety - Railroad/highway crossingExempt Category:
Park Boulevard from Harbor Drive to Harbor Drive - in San Diego, rail grade separationDESCRIPTION:
EST TOTAL COST:RAS (TA7-47) $22,963
CONRWPEPRIORTOTAL 08/09 09/10 10/11 11/12 12/13
HPP $2,800 $2,240 $560 $2,800
Local Funds $20,163 $20,163 $2,766 $17,397
TOTAL $22,963 $22,403 $560 $2,766 $20,197
MPO ID:TITLE:
SD127Shoal Creek Pedestrian Bridge -
Phase 1
Capacity Status: NCI 08-00RTIP #:Air Quality - Bicycle and pedestrian facilitiesExempt Category: (CR)
along Shoal Creek Drive to facilitate crossing of Ted Williams Parkway - in San Diego, construct a
pedestrian bridge; this phase includes design and environmental (CIP 54-012.0)
DESCRIPTION:
EST TOTAL COST:EARMARK NO: CA373/572 $840
CONRWPEPRIORTOTAL 08/09 09/10 10/11 11/12 12/13
HPP $480 $480 $480
Local Funds $120 $120 $120
TransNet - L $210 $210 $210
TransNet - LSI $30 $30 $30
TOTAL $840 $810 $30 $840
82Page Wednesday, July 23, 2008
110

San Diego Region (in $000s)2008 Regional Transportation Improvement Program
MPO ID:TITLE:
SD129University Avenue Mobility Project
Phase 1
San Diego, City of
Capacity Status: NCI 08-00RTIP #:Other - Transportation enhancement activitiesExempt Category: (CR)
University Avenue from Florida Street to Boundary Street - in San Diego, environmental studies for
improvements to University Avenue transit corridor in North Park (CHIP 52-766.0), improvements include
installation of new medians for safety improvements, restriping, pedestrian popouts, new traffic signal,
enhanced pedestrian crossings, and new bike racks (augments Smart Growth Funding for this project in
V04)
DESCRIPTION:
EST TOTAL COST:RAS (TA7-48) $7,715
CONRWPEPRIORTOTAL 08/09 09/10 10/11 11/12 12/13
Local Funds $300 $300 $300
TransNet - L $415 $415 $415
TransNet - LSI $7,000 $200 $800 $6,000 $200 $6,800
TOTAL $7,715 $415 $500 $800 $6,000 $915 $6,800
MPO ID:TITLE:
SD130Skyline Drive - 58th Street to Sears
Ave
Capacity Status: NCI 08-00RTIP #:Other - Intersection channelization projectsExempt Category: (CR)
Skyline Drive from 58th St. to Sears Ave. - in San Diego, installation of new medians for safety
improvements, intersection lighting, traffic signal upgrades and other street improvements to enhance
pedestrian and vehicular movement (CIP 52-763)
DESCRIPTION:
EST TOTAL COST:EARMARK NO: CA574/2479 $2,380
CONRWPEPRIORTOTAL 08/09 09/10 10/11 11/12 12/13
HPP $800 $800 $800
Local Funds $325 $325 $325
TransNet - L $305 $305 $305
TransNet - LSI $950 $950 $950
TOTAL $2,380 $305 $2,075 $305 $2,075
MPO ID:TITLE:
SD133Mira Sorrento Place
Capacity Status: CI 08-00RTIP #:(CR)
Mira Sorrento Place from Scranton Rd. to Vista Sorrento Pkwy. - in San Diego, widen the existing
two-lane 560' portion of Mira Sorrento Place (40' road width, 55' right of way) to a four-lane collector (72'
road width, 92' right of way), and extend the road to intersect with Vista Sorrento Parkway at the existing
on/off ramps to I-805 (CIP 52-676.0)
DESCRIPTION:
EST TOTAL COST: $12,875
CONRWPEPRIORTOTAL 08/09 09/10 10/11 11/12 12/13
Local Funds $11,885 $11,885 $2,600 $1,500 $7,785
TransNet - L $810 $810 $810
TransNet - LSI $180 $60 $60 $60 $180
TOTAL $12,875 $12,695 $60 $60 $60 $2,600 $1,500 $8,775
83Page Wednesday, July 23, 2008
111

San Diego Region (in $000s)2008 Regional Transportation Improvement Program
MPO ID:TITLE:
SD137Palm Avenue Roadway Improvements
San Diego, City of
Capacity Status: NCI 08-00RTIP #:Other - Non construction related activitiesExempt Category: (CR)
Palm Ave from I-805 to Beyer Blvd - in San Diego, install traffic improvements to include raised medians
with turn pockets, traffic signals, pedestrian refuge areas, etc (CIP 52-764.0)
DESCRIPTION:
EST TOTAL COST:RAS (TA7-48) $869
CONRWPEPRIORTOTAL 08/09 09/10 10/11 11/12 12/13
TransNet - L $300 $300 $300
TransNet - LSI $569 $269 $300 $569
TOTAL $869 $300 $269 $300 $869
MPO ID:TITLE:
SD139Laurel Street Bridge over Highway
163
Capacity Status: NCI 08-00RTIP #:Safety - Non capacity widening or bridge reconstructionExempt Category: (CR)
on Laurel Street over SR 163 (Cabrillo Bridge) - in San Diego, preliminary engineering relating to diagnostic
testing and evaluation of the bridge to scope the required rehabilitation work and seismic retrofitting of the
bridge (CIP 53-061.0)
DESCRIPTION:
EST TOTAL COST: $470
CONRWPEPRIORTOTAL 08/09 09/10 10/11 11/12 12/13
TransNet - L $420 $420 $420
TransNet - LSI $50 $50 $50
TOTAL $470 $420 $50 $470
MPO ID:TITLE:
SD15325th Street Renaissance
Capacity Status: NCI 08-00RTIP #:Other - Interchange reconfiguration projectsExempt Category: (CR)
25th Street from Broadway to B Street - in San Diego, augments existing Smart Growth projects (V04)
related infrastructure improvements to include the construction of amenities to improve pedestrian safety
and provide traffic calming, including the installation of a roundabout at the intersection of 25th and B
Streets; the roundabout will replace a four-way stop controlled intersection and will provide continuous
flow and reduce delay; congestion will be reduced as vehicles will no longer stop and queue at the stop
signs; the improvements will promote and improve pedestrian safety at intersection crossings and create a
more walkable neighborhood; streetscape and parking improvements may also be provided (CIP 62-332.0)
DESCRIPTION:
EST TOTAL COST: $850
CONRWPEPRIORTOTAL 08/09 09/10 10/11 11/12 12/13
TransNet - LSI $850 $200 $650 $200 $650
TOTAL $850 $200 $650 $200 $650
MPO ID:TITLE:
SD155Old Otay Mesa Road
Capacity Status: NCI 08-00RTIP #:Safety - Pavement resurfacing and/or rehabilitationExempt Category:
Old Otay Mesa Road from Hawkin Dr. to 1,100 feet west of Crescent Bay Dr. - in San Diego, install
sidewalk, berm and retaining walls (CIP 52-775.0/52-642.0)
DESCRIPTION:
EST TOTAL COST: $7,600
CONRWPEPRIORTOTAL 08/09 09/10 10/11 11/12 12/13
Local Funds $7,400 $2,400 $1,500 $3,500 $2,400 $1,500 $3,500
TransNet - L $200 $200 $200
TOTAL $7,600 $200 $2,400 $1,500 $3,500 $2,600 $1,500 $3,500
84Page Wednesday, July 23, 2008
112

San Diego Region (in $000s)2008 Regional Transportation Improvement Program
MPO ID:TITLE:
SD15634th and 35th at Madison Avenue
Improvements
San Diego, City of
Capacity Status: NCI 08-00RTIP #:Safety - Pavement resurfacing and/or rehabilitationExempt Category: (CR)
On 34th and 35th Streets from Adams to Madison, on from Felton to 35th Street - in San Diego,
construction of new sidewalk and drainage improvements including curbs and gutters (CIP 52-774.0)
DESCRIPTION:
EST TOTAL COST: $1,260
CONRWPEPRIORTOTAL 08/09 09/10 10/11 11/12 12/13
TransNet - L $60 $60 $60
TransNet - LSI $1,200 $120 $480 $600 $120 $1,080
TOTAL $1,260 $60 $120 $480 $600 $180 $1,080
MPO ID:TITLE:
SD157Cherokee Street Improvements
Capacity Status: NCI 08-00RTIP #:Safety - Pavement resurfacing and/or rehabilitationExempt Category: (CR)
Cherokee St from Monroe Ave to E Mountain View - in San Diego, construction of sidewalk and drainage
improvements including curb and gutter; drainage improvements will reduce frequent flooding problems
(CIP 52-773.0)
DESCRIPTION:
EST TOTAL COST: $1,358
CONRWPEPRIORTOTAL 08/09 09/10 10/11 11/12 12/13
TransNet - L $30 $30 $30
TransNet - LSI $1,328 $70 $305 $375 $578 $70 $1,258
TOTAL $1,358 $30 $70 $305 $375 $578 $100 $1,258
MPO ID:TITLE:
SD161Preliminary Engineering for
Congestion Relief Projects
Capacity Status: NCI 08-00RTIP #:Other - Engineering studiesExempt Category: (CR)
Various locations (list attached), - in San Diego, perform preliminary design work for future congestion
relief project development (CIP 59-023.0; project types include roadway realignment, roadway widening for
bike lanes, new or widened sidewalks, new traffic signals and traffic signal upgrades including intersection
lighting, traffic calming measures
DESCRIPTION:
EST TOTAL COST: $3,103
CONRWPEPRIORTOTAL 08/09 09/10 10/11 11/12 12/13
TransNet - L $600 $600 $600
TransNet - LSI $2,503 $576 $415 $457 $502 $553 $2,503
TOTAL $3,103 $600 $576 $415 $457 $502 $553 $3,103
MPO ID:TITLE:
SD163Prospect Street/Silverado Street
Roundabout
Capacity Status: NCI 08-00RTIP #:Other - Intersection channelization projectsExempt Category: (CR)
on Prospect Street and Silverado Street - in San Diego, install intersection improvements to include a
roundabout which provide continuous flow and reduce delay; the improvements will promote and improve
pedestrian safety at the intersection crossing (CIP 52-776.0)
DESCRIPTION:
EST TOTAL COST: $920
CONRWPEPRIORTOTAL 08/09 09/10 10/11 11/12 12/13
TransNet - L $150 $150 $150
TransNet - LSI $770 $770 $770
TOTAL $920 $150 $770 $150 $770
85Page Wednesday, July 23, 2008
113

San Diego Region (in $000s)2008 Regional Transportation Improvement Program
MPO ID:TITLE:
SD164Miramar Road
San Diego, City of
Capacity Status: NCI 08-00RTIP #:Other - Interchange reconfiguration projectsExempt Category: (CR)
Miramar Road from I 805 to Eastgate Mall - in San Diego, add right turn lane at intersection; roadway
design includes Class II bike lane and sidewalks (CIP 52-679.0)
DESCRIPTION:
EST TOTAL COST:RAS (TA7-48) $1,425
CONRWPEPRIORTOTAL 08/09 09/10 10/11 11/12 12/13
TransNet - L $925 $925 $925
TransNet - LSI $500 $500 $500
TOTAL $1,425 $925 $500 $1,425
MPO ID:TITLE:
SD166Minor Bicycle Facilities
Capacity Status: NCI 08-00RTIP #:Air Quality - Bicycle and pedestrian facilitiesExempt Category: (CR)
Citywide - in San Diego, install Class II bike lanes or Class II bike routes (CIP 58-204.0)DESCRIPTION:
EST TOTAL COST: $90
CONRWPEPRIORTOTAL 08/09 09/10 10/11 11/12 12/13
TransNet - L $15 $15 $15
TransNet - LSI $75 $15 $15 $15 $15 $15 $75
TOTAL $90 $15 $15 $15 $15 $15 $15 $75 $15
MPO ID:TITLE:
SD17338th Street Improvements
Capacity Status: NCI 08-00RTIP #:Safety - Pavement resurfacing and/or rehabilitationExempt Category: (CR)
38th Street from Dwight to Myrtle - in San Diego, this project provides for full street reconstruction to
include the installation of new sidewalk with pedestrian ramps, and roadway drainage improvements
including curbs and gutters. (CIP 52-782.0)
DESCRIPTION:
EST TOTAL COST: $1,755
CONRWPEPRIORTOTAL 08/09 09/10 10/11 11/12 12/13
TransNet - L $100 $100 $100
TransNet - LSI $1,655 $1,655 $1,655
TOTAL $1,755 $100 $1,655 $100 $1,655
MPO ID:TITLE:
SD175Talbot Street Slope
Capacity Status: NCI 08-00RTIP #:Other - Plantings, landscaping, etcExempt Category: (CR)
On Talbot Street at Martinez Street - in San Diego, stabilize adjacent slope to prevent slope failure which
would create capacity impeding conditions by impacting vehicle usage of roadway (CHIP 12-501.0)
DESCRIPTION:
EST TOTAL COST: $1,106
CONRWPEPRIORTOTAL 08/09 09/10 10/11 11/12 12/13
TransNet - L $250 $250 $250
TransNet - LSI $856 $856 $856
TOTAL $1,106 $250 $856 $250 $856
86Page Wednesday, July 23, 2008
114

San Diego Region (in $000s)2008 Regional Transportation Improvement Program
MPO ID:TITLE:
SD176Maintenance and Non Congestion
Relief Efforts
San Diego, City of
Capacity Status: NCI 08-00RTIP #:Safety - Pavement resurfacing and/or rehabilitationExempt Category: (Maint)
Citywide - in San Diego, maintenance and non congestion relief efforts including but not limited to
pavement overlay, pot hole repair, etc
DESCRIPTION:
EST TOTAL COST: $40,969
CONRWPEPRIORTOTAL 08/09 09/10 10/11 11/12 12/13
TransNet - LSI $40,969 $8,153 $7,453 $7,946 $8,462 $8,955 $40,969
TOTAL $40,969 $8,153 $7,453 $7,946 $8,462 $8,955 $40,969
MPO ID:TITLE:
SD178Pershing Drive/Redwood Street
Intersection
Capacity Status: NCI 08-00RTIP #:Other - Intersection channelization projectsExempt Category: (CR)
At Pershing and Redwood Street - in San Diego, install permanent traffic roundabout improvement to
replace stop signs at the controlled intersection; roundabouts provide continuous flow and reduce delay;
congestion is reduced because vehicles will no longer stop and queue up at the stop signs. The
improvements will promote and improve pedestrian safety at the intersection crossing (CIP 52-696.0)
DESCRIPTION:
EST TOTAL COST: $900
CONRWPEPRIORTOTAL 08/09 09/10 10/11 11/12 12/13
TransNet - LSI $900 $900 $900
TOTAL $900 $900 $900
MPO ID:TITLE:
SD179Linda Vista Road at Genesee Avenue
Capacity Status: NCI 08-00RTIP #:Other - Intersection channelization projectsExempt Category: (CR)
on Linda Vista Road at Genesee Avenue - in San Diego, roadway improvements to include extension of
medians for left turn lanes and the widening of Linda Vista Road for the creation of exclusive right turn
lanes (CIP 52-754.0)
DESCRIPTION:
EST TOTAL COST:RAS (TA7-47) $700
CONRWPEPRIORTOTAL 08/09 09/10 10/11 11/12 12/13
TransNet - LSI $700 $70 $280 $350 $70 $630
TOTAL $700 $70 $280 $350 $70 $630
MPO ID:TITLE:
SD180Hollister Street Improvements
Capacity Status: NCI 08-00RTIP #:Other - Intersection channelization projectsExempt Category: (CR)
on Hollister Street on the west side of the 900 block - in San Diego, install new sidewalk including curb
and gutter for drainage improvements; new asphalt paving (CIP 52-810.0)
DESCRIPTION:
EST TOTAL COST: $1,975
CONRWPEPRIORTOTAL 08/09 09/10 10/11 11/12 12/13
TransNet - LSI $1,975 $200 $175 $625 $975 $375 $1,600
TOTAL $1,975 $200 $175 $625 $975 $375 $1,600
87Page Wednesday, July 23, 2008
115

San Diego Region (in $000s)2008 Regional Transportation Improvement Program
MPO ID:TITLE:
SD181Soledad Mountain Road Emergency
Repair
San Diego, City of
Capacity Status: NCI 08-00RTIP #:Other - Damage repair caused by unusual disastersExempt Category:
Soledad Mountain Road from Desert View Dr. to Palomino Circle - in San Diego, reconstruct roadway lost
as result of landslide (CIP 52-805.0)
DESCRIPTION:
EST TOTAL COST: $20,000
CONRWPEPRIORTOTAL 08/09 09/10 10/11 11/12 12/13
Local Funds $12,500 $12,500 $12,500
TransNet - L (Cash) $3,500 $3,500 $3,500
TOTAL $16,000 $3,500 $12,500 $16,000
MPO ID:TITLE:
SD182Hollister Street - Coronado to Tocayo
- Reconstruction
Capacity Status: NCI 08-00RTIP #:Safety - Non capacity widening or bridge reconstructionExempt Category: (CR)
Hollister Street from Coronado to Tocayo - in San Diego, major roadway reconstruction to include curb,
gutter and sidewalk, driveways, new traffic signal installation and drainage improvements; right of way
acquisition required (CIP 52-812.0)
DESCRIPTION:
EST TOTAL COST: $2,950
CONRWPEPRIORTOTAL 08/09 09/10 10/11 11/12 12/13
TransNet - LSI $2,950 $600 $2,350 $600 $2,350
TOTAL $2,950 $600 $2,350 $600 $2,350
MPO ID:TITLE:
SD183Division Street - Bryanview to 61st -
Reconstruction
Capacity Status: NCI 08-00RTIP #:Safety - Pavement resurfacing and/or rehabilitationExempt Category: (CR)
Division Street from Bryanview to 61st - in San Diego, major roadway reconstruction; improvements may
include installation of curb, gutter and sidewalks, retaining walls, drainage, landscaping and property
acquisition (CIP 52-813.0)
DESCRIPTION:
EST TOTAL COST: $7,817
CONRWPEPRIORTOTAL 08/09 09/10 10/11 11/12 12/13
TransNet - LSI $7,817 $900 $6,917 $900 $6,917
TOTAL $7,817 $900 $6,917 $900 $6,917
MPO ID:TITLE:
SD184Saturn Boulevard Westside
Capacity Status: NCI 08-00RTIP #:Other - Intersection channelization projectsExempt Category: (CR)
Saturn Blvd from Coronado to Grove - in San Diego, roadway reconstruction to include installation of new
sidewalk, curb and gutter; new paving and retaining walls, drainage improvements (CIP 52-814.0)
DESCRIPTION:
EST TOTAL COST: $1,275
CONRWPEPRIORTOTAL 08/09 09/10 10/11 11/12 12/13
TransNet - LSI $1,275 $175 $1,100 $175 $1,100
TOTAL $1,275 $175 $1,100 $175 $1,100
88Page Wednesday, July 23, 2008
116

San Diego Region (in $000s)2008 Regional Transportation Improvement Program
MPO ID:TITLE:
SD185Ocean View Boulevard
San Diego, City of
Capacity Status: NCI 08-00RTIP #:Safety - Non capacity widening or bridge reconstructionExempt Category: (CR)
Ocean View Blvd. from 40th to 32nd - in San Diego, major roadway reconstruction which will include the
installation of new curb, gutter and sidewalk, street light relocation, drainage and pavement improvements
(CIP 52-811.0)
DESCRIPTION:
EST TOTAL COST: $2,050
CONRWPEPRIORTOTAL 08/09 09/10 10/11 11/12 12/13
TransNet - LSI $2,050 $50 $2,000 $50 $2,000
TOTAL $2,050 $50 $2,000 $50 $2,000
MPO ID:TITLE:
SD186Administrative Expenses
Capacity Status: NCI 08-00RTIP #:Other - Non construction related activitiesExempt Category:
Citywide - City of San Diego 1% administrative costsDESCRIPTION:
EST TOTAL COST: $1,381
CONRWPEPRIORTOTAL 08/09 09/10 10/11 11/12 12/13
TransNet - LSI $1,381 $275 $251 $268 $285 $302 $1,381
TOTAL $1,381 $275 $251 $268 $285 $302 $1,381
MPO ID:TITLE:
SD188Congestion Relief/Traffic Operations
Capacity Status: NCI 08-00RTIP #:Other - Engineering studiesExempt Category: (CR)
Various locations (see attached list) - studies to provide congestion relief efforts to include intersection
lighting, traffic signal coordination, centrally controlled traffic signal optimization system, traffic data
collection for performance monitoring; traffic calming in Smart Growth areas; and project
development/preliminary engineering/Corridor studies
DESCRIPTION:
EST TOTAL COST: $10,160
CONRWPEPRIORTOTAL 08/09 09/10 10/11 11/12 12/13
TransNet - LSI $10,160 $2,032 $2,032 $2,032 $2,032 $2,032 $10,160
TOTAL $10,160 $2,032 $2,032 $2,032 $2,032 $2,032 $10,160
89Page Wednesday, July 23, 2008
117

San Diego Region (in $000s)2008 Regional Transportation Improvement Program
MPO ID:TITLE:
SM19Grand Avenue Bridge
San Marcos, City of
Capacity Status: CI 08-00RTIP #:
On Grand Avenue - in San Marcos, between Discovery Street and San Marcos Boulevard, construct 4-lane
arterial; between Grand Ave to Discovery Street construct 6-lane arterial
DESCRIPTION:
EST TOTAL COST: $15,720
CONRWPEPRIORTOTAL 08/09 09/10 10/11 11/12 12/13
Local Funds $15,720 $2,170 $2,550 $11,000 $2,240 $680 $12,800
TOTAL $15,720 $2,170 $2,550 $11,000 $2,240 $680 $12,800
MPO ID:TITLE:
SM22South Santa Fe from Bosstick to
Smilax
Capacity Status: CI 08-00RTIP #:
South Santa Fe Road from Bosstick Blvd. to Smilax Rd. - widen and realign existing road to 4-lane
secondary arterial standards
DESCRIPTION:
EST TOTAL COST:RAS (TA 7-50) $7,480
CONRWPEPRIORTOTAL 08/09 09/10 10/11 11/12 12/13
Local Funds $6,900 $900 $2,800 $3,200 $400 $3,300 $3,200
TransNet - H (78) $580 $580 $580
TOTAL $7,480 $1,480 $2,800 $3,200 $400 $3,880 $3,200
MPO ID:TITLE:
SM23Barham Drive Widening
Capacity Status: CI 08-00RTIP #:(CR)
Barham Drive from Woodland Pkwy to Opper Street - widen Barham Drive to secondary arterial standardsDESCRIPTION:
EST TOTAL COST:RAS (TA 7-50) $6,480
CONRWPEPRIORTOTAL 08/09 09/10 10/11 11/12 12/13
Local Funds $4,480 $1,380 $3,100 $580 $800 $3,100
TransNet - L $1,000 $1,000 $1,000
TransNet - LSI $1,000 $1,000 $1,000
TOTAL $6,480 $2,380 $4,100 $580 $800 $5,100
MPO ID:TITLE:
SM24Woodland Parkway Interchange
Improvements
Capacity Status: CI 08-00RTIP #:
From Hill Street to Rncheros Drive - modify existing ramps at Woodland Parkway and Barham Drive ;
future widening and realignment of SR 78 undercrossing and associated work
DESCRIPTION:
EST TOTAL COST:RAS (TA 7-51) $46,900
CONRWPEPRIORTOTAL 08/09 09/10 10/11 11/12 12/13
Local Funds $46,300 $2,200 $3,500 $13,200 $4,400 $23,000 $1,700 $9,000 $35,600
TransNet - L $600 $600 $600
TOTAL $46,900 $2,200 $4,100 $13,200 $4,400 $23,000 $2,300 $9,000 $35,600
90Page Wednesday, July 23, 2008
118

San Diego Region (in $000s)2008 Regional Transportation Improvement Program
MPO ID:TITLE:
SM25Street Improvements and Bridge
Construction
San Marcos, City of
Capacity Status: NCI 08-00RTIP #:Other - Engineering studiesExempt Category:
Borden Road from Twin Oaks Valley Road to Woodward Street - On Borden future construction of
approximately 700 lineal feet of a 4-lane secondary arterial including a bridge
DESCRIPTION:
EST TOTAL COST:RAS (199) $11,300
CONRWPEPRIORTOTAL 08/09 09/10 10/11 11/12 12/13
Local Funds $1,235 $935 $300 $735 $500
TOTAL $1,235 $935 $300 $735 $500
MPO ID:TITLE:
SM26Poinsettia Widening at La Mirada
Drive
Capacity Status: CI 08-00RTIP #:
Poinsettia Avenue from Linda Vista Drive to La Mirada Drive - limited widening of Poinsettia Ave; construct
cul-de-sac east of La Mirada intersection, and install traffic signal at Poinsettia/La Mirada intersection
DESCRIPTION:
EST TOTAL COST: $1,920
CONRWPEPRIORTOTAL 08/09 09/10 10/11 11/12 12/13
Local Funds $1,920 $330 $1,480 $110 $130 $200 $1,590
TOTAL $1,920 $330 $1,480 $110 $130 $200 $1,590
MPO ID:TITLE:
SM27McMahr Street Improvements
Capacity Status: NCI 08-00RTIP #:Safety - Pavement resurfacing and/or rehabilitationExempt Category:
McMahr Road from San Marcos Boulevard to Main Street - reconstruct road to arterial street standardsDESCRIPTION:
EST TOTAL COST: $5,860
CONRWPEPRIORTOTAL 08/09 09/10 10/11 11/12 12/13
Local Funds $3,980 $1,305 $1,475 $1,200 $980 $3,000
TOTAL $3,980 $1,305 $1,475 $1,200 $980 $3,000
MPO ID:TITLE:
SM28Twin Oaks Valley Road Street
Widening and Improvements
Capacity Status: CI 08-00RTIP #:(CR)
Twin Oaks Valley Road from Richmar Avenue to Borden Road - widen from two lanes to four lanes
including sidewalk and landscaping
DESCRIPTION:
EST TOTAL COST:RAS (TA 7-51) $895
CONRWPEPRIORTOTAL 08/09 09/10 10/11 11/12 12/13
Local Funds $110 $60 $50 $110
TransNet - L $764 $764 $764
TransNet - LSI $21 $21 $21
TOTAL $895 $60 $835 $110 $785
91Page Wednesday, July 23, 2008
119

San Diego Region (in $000s)2008 Regional Transportation Improvement Program
MPO ID:TITLE:
SM30San Marcos Boulevard Street
Improvements: Rancho Santa Fe
Road to Bent Avenue
San Marcos, City of
Capacity Status: CI 08-00RTIP #:
San Marcos Boulevard from Rancho Santa Fe Road to Bent Avenue - widen road to a 6-lane prime arterialDESCRIPTION:
EST TOTAL COST:RAS (TA 4-50) $2,300
CONRWPEPRIORTOTAL 08/09 09/10 10/11 11/12 12/13
Local Funds $2,300 $200 $2,100 $200 $1,100 $1,000
TOTAL $2,300 $200 $2,100 $200 $1,100 $1,000
92Page Wednesday, July 23, 2008
120

San Diego Region (in $000s)2008 Regional Transportation Improvement Program
MPO ID:TITLE:
SNT04Santee Rehabilitation and Major
Repair Work
Santee, City of
Capacity Status: NCI 08-00RTIP #:Safety - Pavement resurfacing and/or rehabilitationExempt Category: (CR)
FY08-09, , Residential Zone EB:, Big Rock Road - Rancho Fanita Drive to Shantung Drive, Organdy Drive -
Rancho Fanita Drive to Shantung Drive, , Residential Zone DB:, Amster Drive - north and south of
Braverman Drive, Anne Sladon Court - Ramsgate Drive to end of cul-de-sac, Braverman Drive - Marvin Drive
to Jeremy Street, Bundy Drive - north and south of Braverman Drive, Deer Hollow Court - Ramsgate Drive
to end of cul-de-sac, Grand Teton Way - Mast Boulevard to Yellowstone Place, Hillcreek Lane - Hill Creek
Road to end of cul-de-sac, Hillcreek Road - Jeremy Street to end of cul-de-sac, Hillcreek Way - Hillcreek
Road to end of cul-de-sac, Hinsdale Street - Mast Boulevard to Ramsgate Drive, Hinton Drive - Braverman
Drive to end of cul-de-sac, Kenesaw Court - Ramsgate Drive to end of cul-de-sac, Marvin Drive - Braverman
Drive to end of cul-de-sac, Notnil Court - Ramsgate Drive to end of cul-de-sac, Ramsgate Drive -
Yellowstone Place to Ramsgate Way, Ramsgate Way - Ramsgate Drive to end of cul-de-sac, Reginas
Court - Amster Drive to end of cul-de-sac, Share Court - Bundy Drive to end of cul-de-sac, Waldo Court -
Bundy Drive to end of cul-de-sac, Yellowstone Place - Ramsgate Drive to end of cul-de-sac, , Other:,
Tamberly Way - Mission Gorge Road to end of cul-de-sac, Los Ranchitos Road - Mast Boulevard to north
City limits - Reconstruction and rehabilitation in the form of removal and replacement of existing pavement
section 2 inches minimum, 3 inches typical, edge grind with 1.5 inch minimum overlay, complete
reconstruction with 6 inches base and 2 inch surface course
DESCRIPTION:
EST TOTAL COST: $30,000
CONRWPEPRIORTOTAL 08/09 09/10 10/11 11/12 12/13
Local Funds $686 $686 $686
TransNet - L $7,729 $6,156 $1,573 $7,729
TransNet - LSI $287 $287 $287
TOTAL $8,702 $6,842 $1,860 $8,702
MPO ID:TITLE:
SNT07Santee Slurry Seal and Minor Repair
Work
Capacity Status: NCI 08-00RTIP #:Safety - Pavement resurfacing and/or rehabilitationExempt Category: (Maint)
Various locations - maintenance repair in the form of grind and patch failed areas followed by Cape seal or
Slurry seal of the street
DESCRIPTION:
EST TOTAL COST: $10,000
CONRWPEPRIORTOTAL 08/09 09/10 10/11 11/12 12/13
TransNet - LSI $300 $300 $300
TOTAL $300 $300 $300
MPO ID:TITLE:
SNT08Mast Boulevard Street Lighting
Capacity Status: NCI 08-00RTIP #:Safety - Lighting improvementsExempt Category: (CR)
Mast Boulevard from Carlton Hills Boulevard to Cuyamaca Street - install street lighting on Mast Boulevard
due to utility undergrounding project
DESCRIPTION:
EST TOTAL COST: $325
CONRWPEPRIORTOTAL 08/09 09/10 10/11 11/12 12/13
Local Funds $75 $75 $75
TransNet - LSI $250 $250 $250
TOTAL $325 $325 $325
93Page Wednesday, July 23, 2008
121

San Diego Region (in $000s)2008 Regional Transportation Improvement Program
MPO ID:TITLE:
SB01Lomas Santa Fe Drive/I-5 Interchange
Solana Beach, City of
Capacity Status: CI 08-00RTIP #:(CR)
At Lomas Santa Fe and I-5 - design and ROW for interchange and auxiliary lanes on I-5 north &
southbound
DESCRIPTION:
EST TOTAL COST:RAS (TA 7-51) $3,691
CONRWPEPRIORTOTAL 08/09 09/10 10/11 11/12 12/13
RSTP $2,525 $2,525 $1,602 $923
TransNet - L $1,116 $1,116 $268 $848
TransNet - LSI $50 $50 $50
TOTAL $3,691 $3,641 $50 $1,870 $1,771 $50
MPO ID:TITLE:
SB06Coastal Rail Trail at Cliff St.
Pedestrian Bridge
Capacity Status: NCI 08-00RTIP #:Air Quality - Bicycle and pedestrian facilitiesExempt Category:
Highway 101 from Cliff St to Cliff St - Completion of Coastal Rail Trail (bike & pedestrian trail) at newly
constructed pedestrian bridge crossing railroad tracks.
DESCRIPTION:
EST TOTAL COST: $120
CONRWPEPRIORTOTAL 08/09 09/10 10/11 11/12 12/13
TransNet - L (Cash) $120 $120 $120
TOTAL $120 $120 $120
MPO ID:TITLE:
SB07Highway 101 Streetscape and Traffic
Calming Project
Capacity Status: NCI 08-00RTIP #:Air Quality - Bicycle and pedestrian facilitiesExempt Category: (Maint)
Highway 101 from Dahlia Dr to Ocean St - construct street and parkway improvements to increase
pedestrian safety and enhance pedestrian parkways; will complement and connect to the recently
constructed Coastal Rail Trail, providing a pedestrian friendly environment along the Highway 101 corridor
DESCRIPTION:
EST TOTAL COST:RAS (TA 7-51) $930
CONRWPEPRIORTOTAL 08/09 09/10 10/11 11/12 12/13
TransNet - L (Cash) $787 $400 $387 $400 $387
TransNet - LSI $143 $123 $20 $143
TOTAL $930 $400 $510 $20 $400 $530
94Page Wednesday, July 23, 2008
122

San Diego Region (in $000s)2008 Regional Transportation Improvement Program
MPO ID:TITLE:
TCA01Foothill Transportation Corridor South
Transportation Corridor Agencies
Capacity Status: CI 08-00RTIP #:
On SR 241 from Orange Co./San Diego Co. line to Cristianitos interchange - construct 3 general purpose
toll lanes; from Cristianitos interchange to I-5 - construct 2 general purpose toll lanes (program funding for
Phase 1)
DESCRIPTION:
EST TOTAL COST: $401,900
CONRWPEPRIORTOTAL 08/09 09/10 10/11 11/12 12/13
Local Funds $401,900 $66,300 $14,000 $74,000 $136,600 $87,000 $24,000 $87,900 $21,000 $293,000
TOTAL $401,900 $66,300 $14,000 $74,000 $136,600 $87,000 $24,000 $87,900 $21,000 $293,000
Funding Source = Foothill/Eastern Tansportation Corridor Agency*
95Page Wednesday, July 23, 2008
123

San Diego Region (in $000s)2008 Regional Transportation Improvement Program
MPO ID:TITLE:
V01Inland Rail Trail
Various Agencies
Capacity Status: NCI 08-00RTIP #:Air Quality - Bicycle and pedestrian facilitiesExempt Category:
From Escondido Transit Center to Oceanside Transit Center along Sprinter ROW - joint project between
NCTD and cities of San Marcos, Escondido, Vista & Oceanside to design and construct 22 miles of
regional bikeway
DESCRIPTION:
EST TOTAL COST:RTP PAGE NO: 6-55 $30,841
CONRWPEPRIORTOTAL 08/09 09/10 10/11 11/12 12/13
BTA $550 $550 $450 $100
CMAQ $21,550 $21,550 $2,700 $18,850
PTA $180 $180 $180
TDA $550 $550 $400 $150
TDA - Bicycles $958 $958 $958
TEA-R $800 $800 $800
TransNet - B $2,383 $2,383 $200 $2,183
TransNet - BPNS $3,870 $3,870 $3,870
TOTAL $30,841 $26,971 $3,870 $4,730 $26,111
MPO ID:TITLE:
V02Coastal Rail Trail
Capacity Status: NCI 08-00RTIP #:Air Quality - Bicycle and pedestrian facilitiesExempt Category:
Coastal Rail Trail from Oceanside to San Diego - multi-jurisdictional class I bike & pedestrian trail along
the Coaster ROW
DESCRIPTION:
EST TOTAL COST: $14,012
CONRWPEPRIORTOTAL 08/09 09/10 10/11 11/12 12/13
CMAQ $4,665 $4,665 $1,399 $3,266
RSTP $2,099 $2,099 $2,099
STIP-RIP STP TE $5,114 $5,114 $1,220 $3,894
TDA $651 $651 $467 $184
TransNet - B $1,483 $1,211 $272 $391 $1,092
TOTAL $14,012 $11,641 $2,371 $3,477 $10,535
MPO ID:TITLE:
V03Otay Valley Regional Park Trails
Capacity Status: NCI 08-00RTIP #:Air Quality - Bicycle and pedestrian facilitiesExempt Category:
West of Heritage Road and south of Main St - multi-jurisdictional (City & County) to improve existing
footpaths and create trails to meet local trail standards
DESCRIPTION:
EST TOTAL COST: $2,042
CONRWPEPRIORTOTAL 08/09 09/10 10/11 11/12 12/13
Local Funds $1,900 $1,864 $36 $1,900
RTP $142 $142 $142
TOTAL $2,042 $1,864 $178 $2,042
96Page Wednesday, July 23, 2008
124

San Diego Region (in $000s)2008 Regional Transportation Improvement Program
MPO ID:TITLE:
V04Smart Growth Incentive Program
Various Agencies
Capacity Status: NCI 08-00RTIP #:Other - Transportation enhacement activitiesExempt Category:
Lump Sum for Transportation Enhancement Activities (TE) Program including enhancement of sidewalks
and pedestrian plazas (landscaping, kiosks, trees, lighting, benches), intersection bulb-outs, traffic
calming, landscaping and safety enhancements, and enhanced pedestrian amenities around transit
stations
DESCRIPTION:
EST TOTAL COST: $24,654
CONRWPEPRIORTOTAL 08/09 09/10 10/11 11/12 12/13
Local Funds $359 $359 $359
SHOPP - State Cash $138 $138 $138
SHOPP STP - TE $1,062 $1,062 $1,062
STIP-RIP STP TE $20,445 $8,257 $3,880 $4,754 $3,554 $740 $19,705
STIP-RIP State Cash $2,650 $1,070 $503 $616 $461 $96 $2,554
TOTAL $24,654 $10,527 $4,742 $5,370 $4,015 $1,195 $23,459
MPO ID:TITLE:
V07Biological Mitigation Program
Capacity Status: NCI 08-00RTIP #:Other - Advance land acquisitionsExempt Category:
Countywide - habitat acquisition, restoration, creation, enhancement, management and monitoring
necessary for meeting project mitigation requirements; mitigation efforts will focus on TransNet Early
Action Program projects, then Regional Transportation Plan (RTP) Revenue Constrained projects, then the
remaining RTP projects in this order
DESCRIPTION:
EST TOTAL COST:SANDAG ID: 1200200 $440,000
CONRWPEPRIORTOTAL 08/09 09/10 10/11 11/12 12/13
TransNet - REMP $336,964 $21,964 $100,000 $100,000 $70,000 $30,000 $15,000 $12,600 $144,900 $179,464
TOTAL $336,964 $21,964 $100,000 $100,000 $70,000 $30,000 $15,000 $12,600 $144,900 $179,464
Project completion outside of programming cycle*
MPO ID:TITLE:
V08Regional Habitat Conservation Fund
Capacity Status: NCI 08-00RTIP #:Other - Plantings, landscaping, etcExempt Category:
Countywide - regional habitat management and monitoringDESCRIPTION:
EST TOTAL COST:SANDAG ID: 1200300 $48,062
CONRWPEPRIORTOTAL 08/09 09/10 10/11 11/12 12/13
TransNet - REMP $26,976 $1,678 $6,928 $4,326 $4,499 $4,679 $4,866 $26,976
TOTAL $26,976 $1,678 $6,928 $4,326 $4,499 $4,679 $4,866 $26,976
Project completion outside of programming cycle*
97Page Wednesday, July 23, 2008
125

San Diego Region (in $000s)2008 Regional Transportation Improvement Program
MPO ID:TITLE:
VISTA25Roadway Rehabilitation/Curbs and
Gutters CIP 7650
Vista, City of
Capacity Status: NCI 08-00RTIP #:Safety - Pavement resurfacing and/or rehabilitationExempt Category: (Maint)
Citywide - repair/replace sidewalks, curbs, and guttersDESCRIPTION:
EST TOTAL COST: $471
CONRWPEPRIORTOTAL 08/09 09/10 10/11 11/12 12/13
Local Funds $346 $346 $346
TransNet - L $50 $50 $50
TransNet - LSI $75 $25 $25 $25 $75
TOTAL $471 $396 $25 $25 $25 $471
MPO ID:TITLE:
VISTA30Street Rehabilitation and
Maintenance Annual Project 07/08,
CIP 8154
Capacity Status: NCI 08-00RTIP #:Safety - Pavement resurfacing and/or rehabilitationExempt Category: (CR)
S. Melrose Dr. from South City Limit to W. Vista Way; N. Melrose Dr. from Copper to North City Limit;
Bobier Dr. from West City Limit to Lynette Circle; North Dr. from West City Limit to Melrose Dr.; and N.
Santa Fe Ave from Osborne to Bobier. - FY2006/07 and FY2007/08, repair/rehabilitate distressed
pavement areas and overlay streets with asphalt concrete where identified as priorities in street inventory
DESCRIPTION:
EST TOTAL COST: $5,437
CONRWPEPRIORTOTAL 08/09 09/10 10/11 11/12 12/13
Local Funds $2,725 $2,725 $300 $2,425
TransNet - L $1,242 $1,242 $1,242
TransNet - LSI $1,470 $1,470 $1,470
TOTAL $5,437 $3,967 $1,470 $300 $5,137
MPO ID:TITLE:
VISTA34Street Rehabilitation and
Maintenance FY2008-2009 CIP8155
Capacity Status: NCI 08-00RTIP #:Safety - Pavement resurfacing and/or rehabilitationExempt Category: (CR)
University Dr from Sycamore Ave. to Wal-Mart driveway; Business Park Dr. from Sycamore Ave .to
Poinsettia Ave.; Hacienda Dr. from West city limit to Emerald Dr.; Hacienda Dr. from La Tortuga Dr. to
1475 west of La Tortuga Dr.; Crescent Dr. from Escondido Ave. to Eucalyptus Ave.; Arcadia Ave. from Oak
Dr. to Bonair Road; Osborne St. from N. Santa Fe Ave. to Guajome Lake Rd.; Townsite Dr. from Wellpot
Pl. to Indian Rock Rd.; Alta Vista Dr. from Escondido Ave. to Verdant Pl.; and Beaumont Dr. from
Eucalyptus Ave. to Coventry Rd. - repair/rehabilitate distressed pavement areas and overlay streets with
asphalt concrete where identified as priorities in street inventory, including all preparation work such as
dig-outs, skin patching, shoulder grading, traffic loops, raising manholes, striping, and traffic safety control,
as well as survey monument preservation
DESCRIPTION:
EST TOTAL COST: $4,600
CONRWPEPRIORTOTAL 08/09 09/10 10/11 11/12 12/13
Local Funds $3,408 $3,408 $300 $3,108
TransNet - LSI $1,192 $1,192 $1,192
TOTAL $4,600 $3,408 $1,192 $300 $4,300
98Page Wednesday, July 23, 2008
126

San Diego Region (in $000s)2008 Regional Transportation Improvement Program
RTIP Fund Types
AC = Advanced Construction
BIA = Bureau of Indian Affairs
BIP = Border Infrastructure Program (Federal under SAFETEA-LU)
BTA = Bicycle Transportation Account (State)
CBI = Corridors and Borders Infrastructure Program (Federal under TEA-21)
CMAQ = Congestion Mitigation and Air Quality (Federal formula)
CMIA = Corrdior Mobility Improvement Account (Prop. 1B state bond)
DEMO = High Priority Demonstration Program under TEA-21 (Federal discretionary)
DEMO-Sec 115 = High Priority Demonstration Program under FY 2004 Appropriations
DEMO-Sec 117/STP = Surface Transportation Program under FHWA Administrative Program (congressionally
directed appropriations)
FSP = Freeway Service Patrol (State legislation)
HBP = Highway Bridge Program under SAFETEA-LU (Federal)
HBRR = Highway Bridge Repair and Rehabilitation under TEA-21 (Federal)
HES = Hazard Elimination System (Federal administered by Caltrans)
HPP = High Priority Demonstration Program under SAFETEA-LU (Federal discretionary)
HSIP = Highway Safety Improvement Program (State administered by Caltrans)
IBRC = Innovative Bridge Research & Construction (Federal)
IM = Interstate Maintenance Discretionary (Federal)
IRR = Indian Reservation Roads program (Federal)
ITS = Intelligent Transportation System (Federal)
NCPD = National Corridor Planning & Development (Federal - same as CBI)
PLH = Public Lands Highway (Federal)
PTA = Public Transportation Account (State)
PTMISE = Public Transportation Modernization, Improvement, and Service Enhancement (Prop. 1B state
bond)
RSTP = Regional Surface Transportation Program (Federal)
RTP = Recreational Trails Program (Federal)
SHOPP AC = State Highway Operation & Protection Program federal share (for Caltrans use only)
SHOPP State Cash = State Highway Operation & Protection Program cash match (for Caltrans use only)
SRTS = Safe Routes to School (Federal program administered by Caltrans)
STIP-IIP = State Transportation Improvement Program - Interregional Program (State)
STIP-RIP = State Transportation Improvement Program - Regional Improvement Program (State)
Section 5307 = Federal Transit Administration Urbanized Area Formula Program
Section 5309 (Bus) = Federal Transit Administration Discretionary Program
Section 5309 (FG) = Federal Transit Administration Fixed Guideway Modernization (Rail Mod)
Section 5309 (NS) = Federal Transit Administration Discretionary - New Starts Program
99Page Wednesday, July 23, 2008
127

San Diego Region (in $000s)2008 Regional Transportation Improvement Program
Section 5310 = Federal Transit Administration Elderly & Disabled Program
Section 5311 = Federal Transit Administration Rural Program
Section 5316 (JARC) = Federal Transit Administration Jobs Access Reverse Commute
Section 5317 (NF) = Federal Transit Administration New Freedom
TCIF = Trade Corridor Improvement Fund (Prop. 1B state bond)
TCRP = Traffic Congestion Relief Program (State)
TCSP = Transportation & Community & System Preservation (Federal)
TDA = Transportation Development Act (State)
TDA-B = Transportation Development Act-Bicycle & Pedestrian Facilities (State)
TEA = Transportation Enhancement Activities Program (Federal)
TSM = Transportation Systems Management (State)
TransNet-78 = Prop. A Local Transportation Sales Tax - SR 78 (Local)
TransNet-ADA = Prop. A Local Transportation Sales Tax - compliance with federal Americans with Disabilities
Act (Local)
TransNet-B = Prop. A Local Transportation Sales Tax - Bike (Local)
TransNet-BRT/Ops = Prop. A Local Transportation Sales Tax - Bus Rapid Transit/New Service (Local)
TransNet-Border = Prop. A Local Transportation Sales Tax - Border, part of Major Corridor (Local)
TransNet-H = Prop. A Local Transportation Sales Tax - Highway (Local)
TransNet-L = Prop. A Local Transportation Sales Tax - Local Streets & Roads (Local)
TransNet-LSI = Prop. A Extension Local Transportation Sales Tax -Local System Improvements (Local)
TransNet-MC = Prop. A Extension Local Transportation Sales Tax - Major Corridors (Local)
TransNet-REMP = Prop. A Extension Local Transportation Sales Tax - Regional Environmental Mitigation (Local)
TransNet-S&D = Prop. A Local Transportation Sales Tax - Senior/Disabled (Local)
TransNet-T = Prop. A Local Transportation Sales Tax - Transit (Local)
TransNet-TSI = Prop. A Extension Local Transportation Sales Tax - Transit System Improvements (Local)
100Page Wednesday, July 23, 2008
128

Lump Sum Locations
San Diego Region (in $000s)2008 Regional Transportation Improvement Program
MPO ID:TITLE:
CHV48Pavement Major Rehabilitation
Chula Vista, City of
Capacity Status: NCI 08-00RTIP #:Safety - Pavement resurfacing and/or rehabilitationExempt Category: (CR)
Various locations (see list of specific locations) - ongoing program of pavement rehabilitation and
reconstruction which includes overlays (one-inch thick and greater) and street reconstruction
DESCRIPTION:
EST TOTAL COST: $15,635
CONRWPEPRIORTOTAL 08/09 09/10 10/11 11/12 12/13
TransNet - LSI $15,635 $1,410 $3,350 $3,525 $3,600 $3,750 $2,560 $13,075
TOTAL $15,635 $1,410 $3,350 $3,525 $3,600 $3,750 $2,560 $13,075
Monday, June 30, 2008
129

130
CHV48

Lump Sum Locations
San Diego Region (in $000s)2008 Regional Transportation Improvement Program
MPO ID:TITLE:
SD161Preliminary Engineering for
Congestion Relief Projects
San Diego, City of
Capacity Status: NCI 08-00RTIP #:Other - Engineering studiesExempt Category: (CR)
Various locations (list attached), - in San Diego, perform preliminary design work for future congestion
relief project development (CIP 59-023.0; project types include roadway realignment, roadway widening for
bike lanes, new or widened sidewalks, new traffic signals and traffic signal upgrades including intersection
lighting, traffic calming measures
DESCRIPTION:
EST TOTAL COST: $3,103
CONRWPEPRIORTOTAL 08/09 09/10 10/11 11/12 12/13
TransNet - L $600 $600 $600
TransNet - LSI $2,503 $576 $415 $457 $502 $553 $2,503
TOTAL $3,103 $600 $576 $415 $457 $502 $553 $3,103
MPO ID:TITLE:
SD188Congestion Relief/Traffic Operations
Capacity Status: NCI 08-00RTIP #:Other - Engineering studiesExempt Category: (CR)
Various locations (see attached list) - studies to provide congestion relief efforts to include intersection
lighting, traffic signal coordination, centrally controlled traffic signal optimization system, traffic data
collection for performance monitoring; traffic calming in Smart Growth areas; and project
development/preliminary engineering/Corridor studies
DESCRIPTION:
EST TOTAL COST: $10,160
CONRWPEPRIORTOTAL 08/09 09/10 10/11 11/12 12/13
TransNet - LSI $10,160 $2,032 $2,032 $2,032 $2,032 $2,032 $10,160
TOTAL $10,160 $2,032 $2,032 $2,032 $2,032 $2,032 $10,160
Monday, June 30, 2008
131

132
SD161

SD 161 (CIP #59-023.0)
Area Location SD-UP-1 5th Ave. at Anderson Place, southeast corner SD-UP-1 5th Ave. at Brookes Ave, northeast corner SD-GH-1 29th St. at Broadway, northwest corner SD-OMN-3 18th St. at Coronado Ave, northeast corner SD-OMN-3 18th St. at Coronado Ave, northwest corner SD-MD-1 Enterprise St. at Jessop Lane, north side SD-MV-1 Donahue St. at Friars Rd., south side SD-MV-1 Donahue St. at Friars Rd., northwest corner SD-MV-1 Donahue St. at Friars Rd., northeast corner
133

Traffic signal coordination Data collection (such as turning movement counts, pedestrian counts, travel time studies, etc.) that will be utilized to support the subsequent traffic signal coordination and retiming of the following systems. System Limits Carmel Mountain Road/Rancho Penasquitos Bl Governor Dr Genesee to Radcliffe Nobel Drive (UTC) Villa La Jolla to Shoreline Dr Genesee Avenue (UTC) Scripps Hospital to Decoro Del Mar Heights Road HighBluff to Carmel Country La Jolla Pearl St (La Jolla Bl to Girard) Torrey Pines Rd (Girard to Prospect) La Jolla Parkway (La Jolla Shores to Torrey Pines) North Torrey Pines Science Park Dwy to La Jolla Village Dr Laurel Street 1st Av to 6th Av Rosecrans Street Canon St to Camino del Rio W Midway Drive Sports Arena to Rosecrans Sports Arena Bl/W Point Loma Rosecrans to Adrian St West Laurel Street Pacific Highway to State St Poway Road I-15 to City Limits Mira Mesa I-15 to I-805 Balboa Avenue I-5 to I-15 Clairemont Mesa (West) Luna to Doliva Linda Vista/Morena Morena Bl (Buenos to Linda Vista) Napa (Morena to Riley) Montezuma Rd Collwood to Reservoir
Centrally controlled traffic signal optimization system Upgrade and expand the city’s video surveillance system to an IP-enabled broadband video system. Expand the communication network to include additional locations with fiber or copper interconnect. Traffic data collection system for performance monitoring purposes Traffic data counts to support various categories of congestion relief projects such as corridor studies, traffic signal coordination, and Smart Growth Related Infrastructure. Smart Growth Related Infrastructure Traffic calming measures
1. Nestor Area Traffic Calming Project. It is smart growth area SD-OMN-7 and land use type characteristic area Community Center. Evaluate and make recommendations for traffic calming measures on the following streets: Leon Ave, Grove Ave., Saturn Blvd., Ilex Ave., Iris Ave., Hemlock Ave., Judith Ave., Imogene Ave., Ingrid Ave. Rimbey Ave., Switzerland Dr., Leider Dr.
134

SD188
2. Traffic calming on Rosecrans St. from Talbot St. to Lanning Rd./Russel St. Its smart growth area SD-PA-1 and land use type characteristic area Mixed Use Transit Corridor. Evaluate and make recommendations for traffic calming measures on Rosecrans St. and adjacent corridors.
3. Traffic calming measures on Cesar Chavez Parkway and adjacent corridors in the Barrio
Logan community. Its smart growth area SD-BL-1 and land use type characteristic area Community Center
Pedestrian Roadway lighting in the smart growth areas: Area Location SD-UP-1 5th Ave. at Anderson Place, southeast corner SD-UP-1 5th Ave. at Brookes Ave, northeast corner SD-GH-1 29th St. at Broadway, northwest corner SD-OMN-3 18th St. at Coronado Ave, northeast corner SD-OMN-3 18th St. at Coronado Ave, northwest corner SD-MD-1 Enterprise St. at Jessop Lane, north side SD-MV-1 Donahue St. at Friars Rd., south side SD-MV-1 Donahue St. at Friars Rd., northwest corner SD-MV-1 Donahue St. at Friars Rd., northeast corner Congestion relief project development/preliminary engineering Corridor Studies for the following locations. The project objective is to achieve community consensus on the design of traffic flow, transit, bicycle and pedestrian improvements in order to reach a refined concept plan for the corridor that addresses mobility for all modes of travel. Collect and compile data on existing conditions such as existing roadway and intersection configuration, traffic, bicycle and pedestrian counts and transit facilities and services. With this information the project would integrate initial traffic, transit and bicycle and pedestrian concepts into a draft concept plan followed by the feasibility and alternatives analysis to further refine the plan.
• Rosecrans St. from I-5/I-805 to Talbot St. • Spring Canyon from Pomerado Rd. to Scripps Ranch Blvd. • Palm Ave. from I-805 to Beyer Blvd. • Skyline Dr. from Valencia Parkway to Cardiff St.
135

City of San Diego Traffic Signal Upgrades SD161, Five Year CIP Programming, CIP 59-023.0
Location Scope of Work01st Avenue at University Avenue Replace 7-8" heads with 12" heads04th Avenue at Ash Street Install EVPE04th Avenue at Cedar Street Replace 4-8" heads with 12" heads04th Avenue at Elm Street Replace 4-8" heads with 12" heads04th Avenue at Robinson Avenue Install EVPE04th Avenue at University Avenue Replace 3-8" heads with 12" heads05th Avenue at Robinson Avenue Install EVPE05th Avenue at University Avenue Replace 5-8" heads with 12" heads05th Avenue at Upas Avenue Install EVPE05th Avenue at Washington Street Install new poles with longer mast arms06th Avenue at Elm Street Replace 5-8" heads with 12" heads06th Avenue at University Avenue Replace 2-8" heads with 12" heads08th Avenue at Broadway Install mast arms for SB; replace 8" heads with 12" heads08th Avenue at E Street Install mast arms for EB/WB; replace 8" heads with 12" heads08th Avenue at University Avenue Replace 7-8" heads with 12" heads10th Avenue at E Street Replace 7-8" heads with 12" heads11th Avenue at E Street Replace 6-8" heads with 12" heads11th Avenue at F Street Install longer mast arm for WB traffic13th Street at Broadway Install mast arms for NB; replace 8" heads with 12" heads13th Street at E Street Replace 7-8" heads with 12" heads13th Street at F Street Replace 5-8" heads with 12" heads14th Street at Broadway Install mast arms for SB; replace 8" heads with 12" heads16th Street (SB) at Palm Avenue Remove median poles; install new poles for EB/WB traffic19th Street at Imperial Avenue Install mast arms; replace 8" heads with 12" heads25th Street at Broadway Replace 8 ppb with ADA ppb; install type III service25th Street at C Street Replace 8 ppb with ADA ppb25th Street at Market Street Remove PV heads and install LED heads w/arrows28th Street (South) at National Avenue Relocate signal controller & pole on SWC30th Street at Broadway Replace 7 ppb with ADA ppb; install new poles at NWC & SEC30th Street at C Street Install new poles with longer mast arms & new type III service30th Street at Lincoln Avenue Replace ppb with ADA ppb; install type 3 service; replace 8" indications with 12" indicatio30th Street at Market Street Install left turn phasing for EB & WB on Market St30th Street at Meade Avenue Install detection; Install new poles with longer mast arms & new detection
1 of 7136

City of San Diego Traffic Signal Upgrades SD161, Five Year CIP Programming, CIP 59-023.0
30th Street at Redwood Street Replace 8 ppb with ADA ppb; install EVPE30th Street at University Avenue Install detection32nd Street at North Park Way Replace 8 ppb with ADA ppb; replace 8" indications with 12" indications32nd Street at University Avenue Replace ppb with ADA ppb; replace 8" indications with 12" indications33rd Street at El Cajon Boulevard Install new poles with longer mast arms35th Street at Orange Avenue Replace 8-8" heads with 12" heads42nd Street at University Avenue Install new poles with longer mast arms52nd Street at El Cajon Boulevard Install new poles with longer mast arms; install ped heads54th Street at Montezuma Road Install new poles with longer mast arms55th Street at Montezuma Road Install new poles with longer mast arms56th Street at El Cajon Boulevard Install new poles with longer mast arms; replace 8" indications with 12" indications.58th Street at University Avenue Install new poles with longer mast arms; replace 8" indications with 12" indications.63rd Street at El Cajon Boulevard Install new poles with longer mast arms; replace 8" indications with 12" indications.Adams Avenue at Ohio Street Replace 6 ppb with ADA ppb; install type III service; install EVPEAero Drive at John J. Montgomery Drive/Sandrock Road Replace 6-8" heads with 12" heads; install EVPEAlaquinas Drive at Beyer Boulevard Install EVPEAppleton Street at Genesee Avenue Install new poles with longer mast armsAragon Drive at University Avenue Install new poles with longer mast armsAshford Street at Mesa College Drive Install new poles with longer mast armsAvenida Abeja at Bernardo Center Drive Install pole mounted signal head for EB trafficB Street (W) at Front Street Replace 6-8" heads with 12" headsBalboa Avenue at Garnet Avenue Install new poles with longer mast armsBalboa Avenue at Viewridge Avenue Install left turn phasing for NB & SB on ViewridgeBarnett Avenue at Midway Drive Replace 4-8" heads with 12" headsBeech Street (W) at Front Street Replace 3-8" heads with 12" headsBeyer Boulevard at Del Sur Boulevard Install EVPEBeyer Boulevard at Smythe Avenue Install EVPEBeyer Way at Picador Boulevard Install EVPEBeyer Way/Picador Boulevard at Palm Avenue (SB) Replace 4-8" heads with 12" headsBillman Street/Streamview Drive at College Avenue Install new poles with longer mast arms; install EVPEBisby Lake Avenue at Navajo Road Install new poles with longer mast arms; replace 8" indications with 12" indications.
2 of 7137

City of San Diego Traffic Signal Upgrades SD161, Five Year CIP Programming, CIP 59-023.0
Black Mountain Road at Capricorn Way Install right turn overlap for EB right turnBlack Mountain Road/Carroll Centre Road at Kearny Villa Road Install EVPEBob Wilson Drive at Florida Drive Replace 8 ppb with ADA ppb; replace 8" indications with 12" indicationsBoulder Lake Avenue at Navajo Road Install new poles with longer mast arms; replace 8" indications with 12" indications.Boundary Street/Iowa Street at Meade Avenue Install new poles with longer mast arms; install type III service; install curb rampsCamino de la Plaza/East Beyer Boulevard at East San Ysidro Boulevard Install new poles with longer mast arms for SB trafficCamino Del Este at Camino De La Reina Install left turn phasing for NB & SB on Cam Del EsteCamino Estrellado/Margerum Avenue at Navajo Road Install EVPECamino Ruiz at Mira Mesa Boulevard Install new poles with longer mast arm for EB; replace 8" indications with 12" indications.Camino Santa Fe at Mira Mesa Bl Install right turn overlap for NB right turnCampanile Drive at Montezuma Road Install new poles with longer mast armsCanon Street at Rosecrans Street Install left turn lane for EB; install right turn lane for SB
Carla Way/Sea Ridge Drive at La Jolla Boulevard Replace 8" heads with 12" headsCass Street at Garnet Avenue Install new poles with longer mast arms; replace 8" indications with 12" indications.Cass Street at Turquoise Street Replace 8" heads with 12" headsCatalina Boulevard at Point Loma Boulevard Install EVPECatalina Boulevard at Talbot Street Install EVPEClairemont Drive at Iroquois Avenue Install left turn phasing on Clairemont DrClairemont Mesa Boulevard at Convoy Street Install new poles with longer mast arms; replace 8" indications with 12" indications.Clairemont Mesa Boulevard at Genesee Avenue Install new poles with longer mast arms; install near side head FSBTClairemont Mesa Boulevard at Overland Avenue Install new poles with longer mast arms for EB/WBClairemont Mesa Boulevard at Ruffin Road Install new pole with longer mast arm for SBClayton Drive at Miramar Road Install new poles with longer mast arms for EB/WB; install EVPECleveland Avenue at Washington Street Relocate WB left turn signal head from mast arm to far sideCollege Avenue at The Grove Shopping Center Driveway Install new poles with longer mast arms
Commerce Avenue/Milch Road at Miramar Road Install video detection for NBConvoy Street at Othello Avenue Install new poles with longer mast arms; replace 8" indications with 12" indications.Coronado Avenue (SB) at Hollister Street Install new poles with longer mast arms; replace 8" indications with 12" indications.
3 of 7138

City of San Diego Traffic Signal Upgrades SD161, Five Year CIP Programming, CIP 59-023.0
Coronado Avenue (SB) at Saturn Boulevard Install new poles with longer mast arms; replace 8" indications with 12" indications.Cowles Mountain Boulevard at Navajo Road Install new poles with longer mast arms; replace 8" indications with 12" indications.
Crown Point Drive/Riviera Drive at Ingraham Street Install detection; install signal mast armDairy Mart Road at West San Ysidro Boulevard Install new curb ramps and ppbDana Landing Road/Quivira Road at West Mission Bay Drive Replace 8" heads with 12" heads; install detectionDel Sol Boulevard at Picador Boulevard Replace PV signal heads with LED signal heads; install EVPEDerrick Drive at Genesee Avenue Install new poles with longer mast armsDiamond Street at Ingraham Street Replace 8" heads with 12" headsDunaway Drive/Glenbrook Way at Torrey Pines Road Install new poles with longer mast arms; install ped heads; install curb rampsEast Mission Bay Drive/Pacific Highway at Sea World Drive Install new curb ramps; install detection; relocate one ped headEl Cajon Boulevard at Fairmount Avenue Install detectionEl Cajon Boulevard at Illinois Street Replace 8 ppb with ADA ppb; cut median nose out of crosswalk areaEl Cajon Boulevard at Rolando Boulevard/Rolando Court Replace 8" heads with 12" headsEl Cajon Boulevard at Texas Street Install new poles with longer mast arms; replace 8" indications with 12" indications.El Cajon Boulevard at Winona Avenue Install new poles with longer mast arms; replace 8" indications with 12" indications.Esprit Avenue/ Highland Ranch Road at Ted Williams Parkway Relocate pole mounted head for WB onto mast armEuclid Avenue at Logan Avenue/Olvera Avenue Relocate ppb on NWC and SEC
Evergreen Street/Lowell Street at Nimitz Boulevard Replace 5-8" heads with 12" headsExecutive Drive at Towne Centre Drive Replace PPLT with protected LT for EB/WBFairmount Avenue at University Avenue Install detectionFanuel Street at Garnet Avenue Install new poles with longer mast arms; replace 8" indications with 12" indications.Fashion Valley Road at Hotel Circle North Install EVPEFelspar Street at Mission Boulevard Replace 8" heads with 12" headsFlorida Street at University Avenue Replace 4 ppb with ADA ppb; install EVPE for NB/SBFrazee Road at Friars Road Install EVPEFriars Road at Riverdale Street Install EVPEFriars Road at Sea World Drive Install new poles with longer mast arms; install ped heads
4 of 7139

City of San Diego Traffic Signal Upgrades SD161, Five Year CIP Programming, CIP 59-023.0
Friars Road at Ulric Street Install EVPEFulton Street at Linda Vista Road Install new poles with longer mast armsGenesee Avenue at Governor Drive Install new poles with longer mast arms; replace 8" indications with 12" indications.Genesee Avenue at Linda Vista Road Install new loops for SB on Linda VistaGleason Road at West Mission Bay Drive Replace 8" heads with 12" headsGoldfinch Street at University Avenue Replace 8" heads with 12" heads; install EVPEGolfcrest Drive at Jackson Drive Install EVPEGolfcrest Drive at Navajo Road Install new poles with longer mast arms
Gramercy Road/Greyling Drive at Sandrock Road Replace 8" heads with 12" headsGrape Street (W) at Columbia Street Replace 8" heads with 12" heads; install EVPEGrape Street (W) at India Steet Replace 8" heads with 12" heads; install EVPEGrape Street (W) at Kettner Boulevard Replace 8" heads with 12" heads; install EVPEGrape Street (W) at North Harbor Drive Replace 8" heads with 12" heads; install EVPEGrape Street (W) at Pacific Highway Install EVPEGrape Street (W) at State Street Replace 8" heads with 12" headsGreens East Road/Paseo del Verano at Pomerado Road Install EVPEGrim Avenue at University Avenue Replace 8" heads with 12" heads; install EVPE; install ADA ppbHawthorn Street (W) at North Harbor Drive Replace 8" heads with 12" headsHawthorn Street (W) at Pacific Highway Install EVPEHuennekens Street at Mira Mesa Boulevard Install left turn phase for NB/SB; install longer mast arms for NB/SBIllinois Street at University Avenue Replace ppb with ADA ppb; replace 8" indications with 12" indicationsIngraham Street at La Playa Avenue Install new pole with longer mast arm for NB; replace 8" indications with 12" indicationsInspiration Point Way at Park Boulevard Install new poles with longer mast arms; replace 8" indications with 12" indications.Jackson Drive at Navajo Road Install new poles with longer mast arms for EB/WBKearny Mesa Road at Miramar Rd Install detection for NB
La Jolla Shores Drive at North Torrey Pines Road Replace 8" heads with 12" headsLa Jolla Village Drive at Villa La Jolla Drive Install new poles with longer mast armsLake Arrowhead Drive/San Carlos Drive at Lake Murray Boulevard Install EVPELake Murray Bl at Turnbridge Wy Install PPLT for NB/SBLaning Road at North Harbor Drive Install new adv loops for EB/WB & new EVPE
5 of 7140

City of San Diego Traffic Signal Upgrades SD161, Five Year CIP Programming, CIP 59-023.0
Laurel Street (W) at North Harbor Drive Install EVPELinda Vista Road at Mesa College Drive Install new poles with longer mast armsLinda Vista Road at Tait Street Install new poles with longer mast arms; install left turn phase on TaitLinda Vista Road at Ulric Street Install new poles with longer mast arms for EB/WBLinda Vista Road at Wheatley Street Install new poles with longer mast armsLusk Boulevard at Vista Sorrento Parkway Remove PV heads and install LED heads w/arrows; add 3-section head for SBMadison Avenue at Texas Street Replace ppb with ADA ppb; install curb ramps, install new poles with longer mast armsMain Street at Vesta Street Install EVPEMargerum Avenue/Mission Vista Drive at Mission Gorge Road Install EVPEMast Boulevard at West Hills Parkway Install EVPEMeade Avenue at Texas Street Install detection; install signal mast arms; install type III service
Meade Avenue/Mission Avenue at Park Boulevard Replace ppb with ADA ppb; replace 8" indications with 12" indications; install detectionMira Mesa Boulevard at Scranton Road Install new pole with longer mast arm for WB; install additional head for WBMira Mesa Boulevard at Steadman Street Install left turn phase for NB/SB; install longer mast arms for NB/SBMira Mesa Boulevard at Viper Way Install left turn phase for NB/SB; install longer mast arms for NB/SBMira Mesa Boulevard at Westview Parkway Install new pole with longer mast arm for WBMiramar Road at Miramar Way Install EVPEMission Boulevard at West Mission Bay Drive/Ventura Place Install new poles with longer mast armsMission Gorge Place at Mission Gorge Road Install EVPE; install near left signal head FSBT at 17'Mission Gorge Road at Zion Avenue Replace 8" heads with 12" heads; install longer mast arm for NBMississippi Street at University Avenue Replace 8 ppb with ADA ppbMoore St @ Old Town Av Install split phasing on Old Town AvMorena Boulevard at Napa Street Install new poles with longer mast armsMorena Boulevard at Sea World Drive/Tecolote Road Install new poles with longer mast arms
Morena Boulevard at West Morena Boulevard (S) Install new poles with longer mast armsNavajo Road at Park Ridge Boulevard Install new poles with longer mast arms for EB/WB; install EVPENimitz Boulevard at North Harbor Drive Install EVPENorth Harbor Drive at Coast Guard Aircraft Crossing Install EVPE
6 of 7141

City of San Diego Traffic Signal Upgrades SD161, Five Year CIP Programming, CIP 59-023.0
North Harbor Drive at Scott Street Install EVPEOhio Avenue at University Avenue Remove ped heads & buttons at NEC & SEC; install ADA ppb; install curb rampsPacific Highway at Palm Street (W) Install split phasing on Palm St (W)Park Boulevard at Presidents Way Install new poles with longer mast arms; replace 8" indications with 12" indications.Rolando Boulevard at University Avenue Install new poles with longer mast arms; install ped headsRosecrans Street at Talbot Street Install EVPE
Santa Monica Avenue at Sunset Cliffs Boulevard Install EVPESanto Road at Tierrasanta Boulevard Replace 8" heads with 12" headsScott St at Shelter Island Dr Install ped heads/buttons for NE & SE cornersTexas Street at University Avenue Install EVPE for NB/SBUniversity Avenue at Utah Street Replace 8 ppb with ADA ppb; install new street light on SWC; install EVPE
7 of 7142

SD161, Five Year CIP Programming, CIP 59-023.0
Transportation Engineering & Operations
City of San DiegoEngineering & Capital Projects Department
6/26/2008
Project Title
New Sidewalks and/or Sidewalk Widening
24th Street from Sirrah Street to Palm Avenue Sidewalk Improvement
27th (SB) Street Sidewalk (Elm Av. - Caulfield Dr., East Side)
28th Street from Treat Street to 115' north Sidewalk Improvement
33rd Street from Imperial Avenue to northwest corner Sidewalk Improvement
34th Street from Island Avenue to Market Street Sidewalk Improvement
34th Street from J Street Sidewalk Improvement
35th Street from 110 - 116 to Webster Avenue Sidewalk Improvement
43rd Street from Myrtle Street to 80' south Sidewalk Improvement
45th Street from Quince Street to Redwood Street Sidewalk Improvement
49th Street from Federal Boulevard to A Street Sidewalk Improvement
52nd Street from 52nd Place to 250' north Sidewalk Improvement
52nd Street from Wightman Street to Landis Street Sidewalk Improvement
53rd Street from Imperial Avenue to Groveland Street Sidewalk Improvement
53rd Street from Santa Margarita Street to Imperial Avenue Sidewalk Improvement
54th Street from Imperial Avenue to Naranja Street Sidewalk Improvement
54th Street from Imperial Avenue to Santa Margarita Street Sidewalk Improvement
60th Street from Old Memory Lane to Broadway Street Sidewalk Improvement
60th Street from Tooley Street to Old Memory Lane Sidewalk Improvement
61st Street from Akins Street to Brooklyn St East side only
61st Street from Brooklyn Avenue to Akins Avenue Sidewalk Improvement
62nd to 65th St Channel Improvements
67th Street Sidewalk (El Cajon Blvd. - Amherst (S) St., Both Sides)
68th Street from Lisbon Street to Jamacha Road Sidewalk Improvement
70th Street Sidewalk
A Street Sidewalk Improvement
Ace Street from Winlow Street to Streamview Drive Sidewalk Improvement
Acorn Street from Catherine Avenue to Virginia Avenue Sidewalk Improvement
Adams Avenue Pedestrian Refuge at Florida Street
Aero Drive from Aero Court to Afton Road Sidewalk Improvement
Albatross Drive Sidewalk (southside) Extension from W Lewis Street to Front Street
Page 1 of 11
143

SD161, Five Year CIP Programming, CIP 59-023.0
Transportation Engineering & Operations
City of San DiegoEngineering & Capital Projects Department
6/26/2008
Project Title
New Sidewalks and/or Sidewalk Widening
Albemarle Street from Flintridge Street to Reo Drive Sidewalk Improvement
Albemarle Street from Rachael Avenue to Flintridge Street Sidewalk Improvement
Alta Vista Avenue from Cervantes Avenue to 58th Street Sidewalk Improvement
Alta Vista Way from Alta Vista Street Sidewalk Improvement
Altadena Avenue from Orange Avenue to 125' w/o same Sidewalk Improvement
Altadena Avenue from Trojan Avenue to 100' s/o Trojan Avenue Sidewalk Improvement
Alvarado Road from 70th Street to 750' west Sidewalk Improvement
Appleton Street from 200' e/o Biltmore Street to 500' e/o Biltmore Sidewalk Improvement
Architectural Barriers Removal (Curb Ramps)
Arey Dr and Twining Ave (4100 blk.)
Arista Street from Congress Street to San Diego Avenue Sidewalk Improvement
Balboa Avenue from Mt Culebra Avenue to Mt Everest Avenue Sidewalk Improvement
Bancroft Street from Island Avenue to J Street Sidewalk Improvement
Bayview Heights Drive from Grape Street to 810' south Sidewalk Improvement
Beacon Drive from Jamacha Road to 110' south Sidewalk Improvement
Bernardo Center Drive from Bernardo Center to Escala Drive Sidewalk Improvement
Beta Street from 43rd Street to dead end Sidewalk Improvement
Bittern Street from Klauber Avenue to Madera Street Sidewalk Improvement
Bluebird Street from Mallard Street to Mulberry Street Sidewalk Improvement
Bluffside Avenue/Mission Bay Dr from Pico St. to Rose Creek Crossing
Bolivar Street from Reo Drive to Rachael Avenue Sidewalk Improvement
Boquita Drive from Del Mar Heights Elementary School to 70' north Sidewalk Improvement
Boundary Street Sidewalk (Nutmeg St. - Covington Rd., West Side)
Brooklyn Avenue from 65th Street Sidewalk Improvement
Brooklyn Avenue from Merlin Street to 63rd Street Sidewalk Improvement
Bunker Hill Street from Princeton Avenue to Trenton Avenue Sidewalk Improvement
Calle Del Oro from La Jolla Shores Drive to Westway Street Sidewalk Improvement
Calle Primera from Via de San Ysidro to Willow Road Sidewalk Improvement
Calle Primera - Via de San Ysidro to Willow Road
Calle Tres Lomas from Seascape Drive to Cumberland Street Sidewalk Improvement
Page 2 of 11
144

SD161, Five Year CIP Programming, CIP 59-023.0
Transportation Engineering & Operations
City of San DiegoEngineering & Capital Projects Department
6/26/2008
Project Title
New Sidewalks and/or Sidewalk Widening
Camino del Norte from I-15 to Paseo Montanoso Sidewalk Improvement
Camino del Rio South (2425 to 2727)
Camino del Rio South (2763, Across from 2878)
Camino del Rio South (2878 to 3160)
Camino del Rio South from 3110 to 3160 Sidewalk Improvement
Camino del Rio South from Texas Street to 1860' east Sidewalk Improvement
Camino Tranquilo Sidewalk Improvement
Cape May Street from alley to Cape May Street Sidewalk Improvement
Carmel Country Road from Del Mar Trails Road to SR-56 on/off-ramps Sidewalk Improvement
Carroll Canyon Road - Nancy Ridge Road to Carroll Road
Carroll Canyon Road from Nancy Ridge Drive to Pacific Heights Boulevard Sidewalk Improvement
Carroll Canyon Road from Pacific Heights Boulevard Sidewalk Improvement
Castana Street from Euclid Avenue to Groveland Drive Sidewalk Improvement
Castana Street from Euclid Avenue to San Jacinto Drive Sidewalk Improvement
Catalina Boulevard from Dupont Street to Canon Street Sidewalk Improvement
Catoctin Street from Montezuma Road to Catoctin Street Sidewalk Improvement
Celia Vista Drive from Vista Grande Drive to Hope Street Sidewalk Improvement
Cervantes Avenue from Euclid Avenue to Bonita Drive Sidewalk Improvement
Chalcedony Street from Academy Place Sidewalk Improvement
Chateau Drive from Camber Drive to 210' northwest Sidewalk Improvement
Chatsworth Boulevard from Garrison Street Sidewalk Improvement
Chelsea Avenue (west side) from Camino de La Costa to a point 200 feet South fronting the Hermosa Park
Clairemont Drive from Hartford Street to Clairemont Sidewalk Improvement
Clairemont Mesa Boulevard from 9280 to 9290 Sidewalk Improvement
Clayton Drive from n/o Miramar Road to n/o Miramar Road Sidewalk Improvement
Clovis Street Sidewalk (Mentone St. - Valeta St., West Side)
Coban Street from Bonita Drive to Reynolds Street Sidewalk Improvement
College Avenue from Rock Street to Rock Place Sidewalk Improvement
College Avenue from Streamview Drive to University Avenue Sidewalk Improvement
College/Streamview Avenue from Sparling Street to Meridian Avenue Sidewalk Improvement
Page 3 of 11
145

SD161, Five Year CIP Programming, CIP 59-023.0
Transportation Engineering & Operations
City of San DiegoEngineering & Capital Projects Department
6/26/2008
Project Title
New Sidewalks and/or Sidewalk Widening
Collingwood Drive (4900) Sidewalk Improvement
Collingwood Drive Sidewalk Improvement
Collingwood Drive Sidewalk Improvement
Convoy Court - I-805 to Easterly Terminus
Convoy Street from Convoy to 150' south Sidewalk Improvement
Cordero Road from Mira Montana Drive to Boquita Drive Sidewalk Improvement
Cordero Road from Requerdo Drive to Mercado Drive Sidewalk Improvement
Cottonwood Road from Beyer Boulevard to Foothill Road Sidewalk Improvement
Creston Drive from Selma Place to Roswell Street Sidewalk Improvement
Crown Point Drive Sidewalk (South of Pacific Beach Dr., East Side)
Cumberland Street from Calle Serena Drive to Calle Tres Lomas Sidewalk Improvement
Cumberland Street from Rancho Drive to Calle Serena Sidewalk Improvement
Dagget Street from Ruffner Street to Convoy Street Sidewalk Improvement
Dahlia Avenue from 18th Street to Saturn Boulevard Sidewalk Improvement
Dalbergia Street Sidewalk Improvement
Dawes Street from Missouri Street to Missouri 85' e/o Street Sidewalk Improvement
Dawes Street from Oliver Avenue to Oliver 60' north Avenue Sidewalk Improvement
Day Street from 58th Street Sidewalk Improvement
Delta Street from 43rd Street Sidewalk Improvement
Donax Avenue from 17th Street Sidewalk Improvement
Edgewater Street from Rancho Drive Sidewalk Improvement
El Cajon Blvd Sidewalk, 5900 block
El Cajon Boulevard from Amherst Street to 170' east Sidewalk Improvement
Electric Avenue from Retaheim Way Sidewalk Improvement
Elkhart Street Sidewalk Improvement
Elm Avenue from 14th Street to Granger Street Sidewalk Improvement
Elm Avenue from Granger Street to 15th Street Sidewalk Improvement
Elm Street from 18th Street to Saturn Boulevard Sidewalk Improvement
Elm Street Sidewalk (East of 49th Street, North Side)
Elsa Road from Twain Avenue Sidewalk Improvement
Page 4 of 11
146

SD161, Five Year CIP Programming, CIP 59-023.0
Transportation Engineering & Operations
City of San DiegoEngineering & Capital Projects Department
6/26/2008
Project Title
New Sidewalks and/or Sidewalk Widening
Escala Drive from Devereux Road to Voisin Sidewalk Improvement
Escondido Avenue from Chantilly Avenue to Murray Ridge Park Sidewalk Improvement
Euclid Avenue at Dwight St Sidewalk
Euclid Avenue from Cervantes Avenue to Solola Avenue Sidewalk Improvement
Euclid Avenue from North of Home Avenue Sidewalk Improvement
Ewing Street from Montezuma Road Sidewalk Improvement
Fairmount Avenue from 44th Street to 260' N&S Street Sidewalk Improvement
Fairmount Avenue from Home Avenue to 44th Street Sidewalk Improvement
Fairmount Avenue from I-8 off-ramp to 58' north Sidewalk Improvement
Fairmount Avenue from Laurel Street to 44th Street Sidewalk Improvement
Fairmount Avenue from Maple 100' s/o Street to Maple 300' s/o Street Sidewalk Improvement
Fallon 3830 Circle from Kinsella Sidewalk Improvement
Fergus Street from Brooklyn Street to Akins Street Sidewalk Improvement
Flicker Street from Lisbon Street to Imperial Avenue Sidewalk Improvement
Flicker Street from Lisbon Street to Jamacha Road Sidewalk Improvement
Frankfort Street Sidewalk
Frost Street from Health Center Drive to Childrens Way Sidewalk Improvement
G Street from 22nd Street to 24th Street Sidewalk Improvement
Gardena Avenue from Illion Street Sidewalk Improvement
Garfield Road from Kane Street Sidewalk Improvement
Genesee Avenue and Marlesta Drive Sidewalk Improvements
Genesee Avenue from Mount Foraker Avenue to 330' n/o Derrick Drive Sidewalk Improvement
Genesee Avenue from Mount Herbert Avenue to Mount Foraker Avenue Sidewalk Improvement
Genesee Avenue Sidewalk (Chateau Dr. - Sauk Av., East Side)
Geneva Avenue from 51st Street to Euclid Avenue Side*via*walk Improvement
Geneva Avenue from Hanover Street Sidewalk Improvement
Graham Street Sidewlk (Riviera Dr. - Gresham St., North Side)
Graham Street Sidewlk (Riviera Dr. - Gresham St., South Side)
Grand Avenue from Bond Street to Figeuroa Boulevard Sidewalk Improvement
Green Bay from Iris to Rimbey St. Sidewalk project
Page 5 of 11
147

SD161, Five Year CIP Programming, CIP 59-023.0
Transportation Engineering & Operations
City of San DiegoEngineering & Capital Projects Department
6/26/2008
Project Title
New Sidewalks and/or Sidewalk Widening
Grove Street from Hollister 300' e/o Street to Hollister 400' e/o Street Sidewalk Improvement
Groveland Drive from Euclid Avenue to 53rd Street Sidewalk Improvement
Haines Street from Law Street to 150' N&S Sidewalk Improvement
Harbor Drive Sidewalk Improvement
Harris Avenue Sidewalk Improvement
Hasty Street from Streamview Drive to Thorn Street Sidewalk Improvement
Hawley Boulevard from Arthur Avenue Sidewalk Improvement
Hershey Street from Sparling Street Sidewalk Improvement
Hollister Street at Ilex Street sidewalk
Hollister Street from Palm Avenue to Citrus Avenue Sidewalk Improvement
Hollister Street from Palm Avenue to Conifer Avenue Sidewalk Improvement
Hollister Street Sidewalk from Iris to Leon Sidewalk
Hollister Street Sidewalk from Leon Avenue to Iris Avenue
Home Avenue from Fairmount Avenue to Menlo Street Sidewalk Improvement
Home Avenue Sidewalk Improvement
Ilex Street from Hollister Street to Green Bay Street Sidewalk Improvement
Illion Street from 320' s/o Orten Street to 475' s/o Orten Street Sidewalk Improvement
Illion Street from Milton Street Sidewalk Improvement
Iris Ave. (southside) sidewalk from Westerly end of Iris Avenue at Green Bay St.
Iris Avenue Sidewalk (northside) from Green Bay St. to Hollister St.
Jewell Street from Malden Street Sidewalk Improvement
Juniper Street Sidewalk (Felton St. - Westland Av, North Side)
Keating Street Sidewalk Improvement
Klauber Avenue from 69th Street to Broadway Sidewalk Improvement
Klauber Avenue from Bittern Street to Broadway Sidewalk Improvement
Knoxville Street from Morena Boulevard to Nashville Street Sidewalk Improvement
La Cresta Drive from La Cresta Drive to La Cresta Drive Sidewalk Improvement
La Dorna Street to 5175 Sidewalk Improvement
La Jolla Scenic South Drive from all Sidewalk Improvement
La Jolla Shores Drive from Poole Street to south of Poole Street Sidewalk Improvement
Page 6 of 11
148

SD161, Five Year CIP Programming, CIP 59-023.0
Transportation Engineering & Operations
City of San DiegoEngineering & Capital Projects Department
6/26/2008
Project Title
New Sidewalks and/or Sidewalk Widening
La Jolla Shores Drive Sidewalk (North of Camino Del Collado, West Side)
La Paz Drive from Euclid Avenue to San Bernardo Sidewalk Improvement
Lake Murray Boulevard from Jackson Drive to 120' north of same Drive Sidewalk Improvement
Landis Street from 52nd Street to Shilo Street Sidewalk Improvement
Leghorn Avenue Sidewalk Improvement
Leon Avenue Sidewalk (Hollister Street - Saturn Boulevard, south side)
Locust Street from Ingelow Street Sidewalk Improvement
Loma Land Drive from Moana Drive to Tarento Drive Sidewalk Improvement
Loma Land Drive from Tarento Drive to Temple Street Sidewalk Improvement
Loma Land Drive from Temple Street to Catalina Boulevard Sidewalk Improvement
Loring Street Sidewalk Improvement
Los Altos Road Sidewalk Improvement
Madera Sidewalk Improvements from 66th to 69th
Madera Street from Broadway to NE SE SW Corners Sidewalk Improvement
Madera Street from Wunderlin Avenue to Brooklyn Avenue Sidewalk Improvement
Malden Street from Kendall Street Sidewalk Improvement
Mallard Street Sidewalk Improvement
Manzanares Way from Santa Rosealia Drive to 120' E to 660' East Sidewalk Improvement
Maple Street from Highland Avenue to Roseview Place Sidewalk Improvement
Marcy Avenue from 29th Street to 30th Street Sidewalk Improvement
Marilou Road from 300' west of Euclid Avenue Sidewalk Improvement
Marilou Road from N Euclid Avenue to End Sidewalk Improvement
Market Street from Euclid Avenue to Pitta Street Sidewalk Improvement
Mercado Drive from Del Mar Heights Road to Cordero Road Sidewalk Improvement
Michael Street Sidewalk Improvement
Midway Street from Chelsea Street to 50' east Sidewalk Improvement
Mira Mesa Boulevard from Oberlin Drive to Pacific Heights Boulevard Sidewalk Improvement
Mira Mesa Community Transit Center
Mission Bay Drive from Bluffside Ave to Rose Creek Crossing
Mission Gorge Place from Mission Gorge Road to 25' east Sidewalk Improvement
Page 7 of 11
149

SD161, Five Year CIP Programming, CIP 59-023.0
Transportation Engineering & Operations
City of San DiegoEngineering & Capital Projects Department
6/26/2008
Project Title
New Sidewalks and/or Sidewalk Widening
Monmouth Drive Sidewalk Improvement
Montezuma Road from Collwood Boulevard to Yerba Santa Drive Sidewalk Improvement
Morena Boulevard from Avati Drive to 400' N-870' N Sidewalk Improvement
Morena Boulevard from Balboa Avenue to Avati Drive Sidewalk Improvement
Muir Avenue from West Point Loma Boulevard to 130' east Sidewalk Improvement
Neptune Place from Bonair Street to Westborne Street Sidewalk Improvement
New Jersey Street from 4381 Street Sidewalk Improvement
Nimitz Blvd. Sidewalk Improvements. South side at West Point Loma Blvd.
Nimitz Boulevard from Famosa Boulevard to West Point Loma Blvd Median Improvements
Nimitz Boulevard from Famosa Boulevard to West Point Loma Blvd Median Improvements
Nimitz Boulevard from West Point Loma Boulevard Sidewalk Improvement
North Lane from Beyer Boulevard Sidewalk Improvement
Ogden Street from 52nd Street to Shilo Street Sidewalk Improvement
Old Otay Mesa Rd Sidewalk
Olney Street Sidewlk (Pacific Beach Dr. - Oliver Ave., East Side)
Olney Street Sidewlk (Oliver Ave. - Reed Ave., West Side)
Orange Avenue from 54th Street to 54th Place Sidewalk Improvement
Pacific Beach Drive Sidewalk (Crown Point Dr. - Olney St., South Side)
Pacific Highway from San Diego River Sidewalk Improvement
Pacific Highway from Rosecrans to San Diego River Sidewalk Improvement
Paradise Valley Road from Briarwood Road to Deep Dell Road Sidewalk Improvement
Paradise Valley Road from Zest Street to Briarwood Road Sidewalk Improvement
Poinsettia Drive from Oleander Drive to Leland Drive Sidewalk Improvement
Point Loma Avenue from Froude Street to Ebers Street Sidewalk Improvement
Point Loma Avenue from Santa Barbara Street to Guizot Street Sidewalk Improvement
Pomerado Road from Semillon Boulevard to 2000 S Spring Canyon Road Sidewalk Improvement
Pomerado Road Sidewalk Improvements
Princeton Avenue from Bunker Hill Street Sidewalk Improvement
Princeton Avenue from Bunker Hill Street to 150' east Sidewalk Improvement
Racine Road from Marlowe Drive to Vista Grande Drive Sidewalk Improvement
Page 8 of 11
150

SD161, Five Year CIP Programming, CIP 59-023.0
Transportation Engineering & Operations
City of San DiegoEngineering & Capital Projects Department
6/26/2008
Project Title
New Sidewalks and/or Sidewalk Widening
Radio Drive from 60th Street to Springfield Drive Sidewalk Improvement
Reynard Way from 300' n/o Arroyo Drive to 655' n/o Arroyo Drive Sidewalk Improvement
Reynard Way from Curlew Street to 220' n/o Curlew Street Sidewalk Improvement
Reynard Way from Maple Street to n/o Maple Street Sidewalk Improvement
Reynard Way from Otsego Drive to 165' s/o Otsego Drive Sidewalk Improvement
Reynard Way from s/o Sutter Street to Pennsylvania Avenue Sidewalk Improvement
Richmond Street from Myrtle Avenue to Pennsylvania Avenue Sidewalk Improvement
Ridgehaven Court Sidewalk (Ruffin Rd. - End, North Side)
Ridgehaven Court Sidewalk (Ruffin Rd. - End, South Side)
Rimbey Avenue from Saturn Boulevard to School Entrance Sidewalk Improvement
Rosecrans Street from Kurtz Street to Sports Arena Boulevard Sidewalk Improvement
Rosecrans Street from Moore Street to Hancock Street Sidewalk Improvement
Roselle Street from I-5 to Dunhill Street Sidewalk Improvement
Ruffin Road Sidewalk (Balboa Av. - Ridgehaven Ct., West Side)
Ruffin Road Sidewalk (Balboa Av. to 815' n/o Balboa Av., East Side)
Ruffin Road Sidewalk (South of Ridgehaven Court, East Side)
Rutgers Road from all Sidewalk Improvement
San Diego Avenue Sidewalk Improvement
Santa Barbara Street from Cape May Avenue to 140' south Sidewalk Improvement
Santa Isabel Drive from Bonita Drive to west of Sidewalk Improvement
Santa Margarita Street from San Jacinto Drive to 55th Street Sidewalk Improvement
Santo Road at the SR-52 Bridge Sidewalk Improvement
Satellite Blvd. Sidewalk
Saturn Boulevard (west side) North of Halo Sidewalk
Saturn Boulevard from Rimbey Avenue to Leon Avenue Sidewalk Improvement
Savoy Street from Varona Street Sidewalk Improvement
Seaside Street from Castelar Street Sidewalk Improvement
Sharron Place from Vale Way to Orange Avenue Sidewalk Improvement
Shaw Street from Deauville Street Sidewalk Improvement
Snowdrop Street from Poplar Street Sidewalk Improvement
Page 9 of 11
151

SD161, Five Year CIP Programming, CIP 59-023.0
Transportation Engineering & Operations
City of San DiegoEngineering & Capital Projects Department
6/26/2008
Project Title
New Sidewalks and/or Sidewalk Widening
Soledad Mountain Road from Felspar Street to 350' n/o same Sidewalk Improvement
Soledad Mountain Road Sidewalk Improvement
Solola Avenue from Euclid Avenue to 310' east Sidewalk Improvement
South 58th Street from Alta Vista Avenue Sidewalk Improvement
South 58th Street Sidewalk Improvement
Southeastern San Diego Street and Sidewalk Improvements
Sparling Street from Thorn Street to Streamview Drive Sidewalk Improvement
Stadium Way from Camino Del Rio North to Camino De La Reina Sidewalk Improvement
Streamview Drive from 40' e/o Spa Street to 90' e/o Spa Street Sidewalk Improvement
Sunrise Drive from Sycamore Road Sidewalk Improvement
Swan 1800 Blk Street from Springfield Street Sidewalk Improvement
Taylor Street from Morena Boulevard to Hotel Circle South Sidewalk Improvement
Thermal Street from Donax Street to Palm Street Sidewalk Improvement
Thorn Street Sidewalk Improvement
Thorn/Lynn Street from Lynn Street to Thorn/Redwood Street Sidewalk Improvement
Ticonderoga Street from Ethan Allen Avenue to Morena Boulevard Sidewalk Improvement
Tooley Street Sidewalk Improvement
Torrey Pines Road from Ardath Lane to 280' north Sidewalk Improvement
Tourmaline Street from Dawes Street Sidewalk Improvement
Ulric Street from Fashion Hills Boulevard to Linbrook Street Sidewalk Improvement
University Ave at front Street Sidewalk and Pop Out project
University Ave Sidewalk from 54th Street to 68th Street
University Avenue at Front Street Sidewalk Extension
University Avenue from 52nd Street to 80' east Sidewalk Improvement
Valencia Parkway from Division Street to 800' north Sidewalk Improvement
Valeta Street from Clovis Street to Camulos Street Sidewalk Improvement
Viewridge Avenue Sidewalk (Balboa Av. - Ridgehaven Ct., East Side)
Viewridge Avenue Sidewalk (Balboa Av. - Ridgehaven Ct., West Side)
Vista Sorento Parkway from Lusk Boulevard Sidewalk Improvement
Waite Drive from 69th Street to City limits Sidewalk Improvement
Page 10 of 11
152

SD161, Five Year CIP Programming, CIP 59-023.0
Transportation Engineering & Operations
City of San DiegoEngineering & Capital Projects Department
6/26/2008
Project Title
New Sidewalks and/or Sidewalk Widening
Webster Avenue from 35th Street Sidewalk Improvement
West Point Loma Boulevard from Bacon Street Sidewalk Improvement
West Point Loma Boulevard from Rialto Street to Famosa Boulevard Sidewalk Improvement
West Point Loma Boulevard from Temecula Street to Rialto Street Sidewalk Improvement
West San Ysidro Boulevard from Cottonwood Road to Cypress Drive Sidewalk Improvement
West Street from Imperial Avenue Sidewalk Improvement
Woodman Street - Cielo Drive to Skyline Drive
Woodman Street from 290' n/o Benson Avenue to Benson Avenue Sidewalk Improvement
Woodman Street from 835' s/o Richey Street to Cielo Drive Sidewalk Improvement
Woodman Street from Richey 835's/o Street to Madrone 290' s/o Avenue Sidewalk Improvement
Wunderlin Avenue from 63rd Street to 900' east Sidewalk Improvement
Number of Projects: 311
Page 11 of 11
153

154

155

156

Chapter 4
FINANCIAL CAPACITY ANALYSIS


159
Chapter 4
FINANCIAL CAPACITY ANALYSIS
This chapter provides an analysis of the financial capacity of the region's transportation agencies to implement the programmed projects. Financial capacity is measured by a comparison of the total cost of the proposed projects against the assumed revenues and a test of the reasonableness of the revenue assumptions.
Separate analyses are provided for the state highway and local street and road projects, the transit program, and other transportation projects and programs. The assumptions used in the forecasts of available funding are based upon information provided in the 2008 State Transportation Improvement Program (STIP) Fund Estimate that was adopted by the California Transportation Commission (CTC) in November 2007, and other forecasts of ongoing transportation funding programs.
INFLATION ASSUMPTIONS
The projects to be programmed in the 2008 RTIP, covering fiscal years 2009 to 2013 are expressed in future dollars. That is, they have been escalated based upon anticipated inflation and other factors to the expected year of obligation or expenditure. For the State Transportation Improvement Program (STIP) and State Highway Operations, Protection Program (SHOPP), the revenues and program are based on the 2008 Fund Estimate scheduled to be adopted by the California Transportation Commission (CTC) in May 2008. The Fund Estimate documents a 3 percent escalation rate for the Transportation Improvement Fund (TIF) from which the STIP and SHOPP are derived. For the major TransNet projects, SANDAG used 3.6 percent rate which is a blended rate for both the right-of-way and construction phase based on historical trends. This rate is also consistent with the recently adopted long range plan.
EXPENDITURES AND REVENUES DEMONSTRATION OF FISCAL CONSTRAINT
Tables 4-1a to 4-1c provide a summary by major funding sources (i.e., federal, state, TransNet, and local) for revenues, programs, and remaining balance for the RTIP program period. The five-year project costs and programmed revenues are contained within the individual project listings in Chapter 3. Individual projects listed in Chapter 3 include phases where full funding reasonably anticipated to be available within the time period contemplated for completion of the phase or project.

160
ALTERNATIVE FINANCING
The Grant Anticipation Revenue Vehicle (GARVEE) program is an innovative financing technique established in federal law and defined in state law (SB 928, 1999). The intent of the program is to provide a financing mechanism to accelerate the funding and construction of critical transportation projects in order to provide the congestion relief benefits to the public significantly sooner than under traditional financial techniques. SANDAG and the state successfully pursued GARVEE bond for the I-15 Managed Lanes project (CAL18). In a joint venture with Caltrans, SANDAG pays for 75% of the debt service through its RIP share of the STIP while Caltrans pays for the remaining 25% through the IIP share of the STIP.
With the approval by the voters of San Diego County to extend the TransNet program, the SANDAG Board at its meeting on January 2005 approved a set of projects for accelerated implementation referred to as the TransNet Early Action Program (EAP), a list of regionally significant projects in the region. Within the next 10 years, SANDAG anticipates all of the EAP projects to open to traffic providing much needed congestion relief. To accomplish this SANDAG developed the Plan of Finance (POF), the financial strategy for implementing the EAP, which includes work on 20 of the 47 major corridor projects identified in the TransNet Extension Ordinance and Expenditure Plan. The POF is the debt financing mechanism through which SANDAG plans to complete the EAP projects.
The region, the state and much of the country continues to suffer under severe budget and fiscal limitations. SANDAG firmly believes that the continuation of major transportation projects would benefit the regional economic outlook by providing jobs, containing costs (by avoiding cost increases associated with project delays), and providing congestion relief which saves travel time. With the use of such financial tools as GARVEE, the financial strategy outline in the TransNet POF, and other innovative mechanisms, SANDAG, with endorsement from its Board of Directors, fully intends to continue to aggressively promote early completion of transportation projects.

161
Table 4-1a 2008 Regional Transportation Improvement Program – San Diego Region
Revenue Sources (in $000s)

PROGRAMMED Prior FY 2009 FY 2010 FY 2011 FY 2012 FY 2013 Total
Local Total $1,695,236 $556,368 $536,819 $591,330 $464,362 $354,939 $4,199,054
State Highway Operations and Protection Program (SHOPP) $172,614 $52,453 $53,040 $124,490 $92,868 $5,600 $501,065 SHOPP (Including Augmentation) $172,614 $52,453 $27,844 $124,490 $92,868 $5,600 $475,869 SHOPP Prior $0 $0 $25,196 $0 $0 $0 $25,196State Transportation Improvement Program (STIP) $576,356 $8,313 $7,323 $58,117 $34,661 $3,085 $687,855 STIP (Including Augmentation) $539,807 $8,313 $7,323 $58,117 $34,661 $3,085 $651,306 STIP Prior $36,549 $0 $0 $0 $0 $0 $36,549 Proposition 1 B $412,813 $108,002 $70,698 $25,360 $99,877 $107,475 $824,225 GARVEE Bonds* $282,438 $21,835 $21,835 $21,835 $21,835 $21,835 $435,283 Traffic Congestion Relief Program $254,058 $8,850 $10,002 $6,000 $0 $0 $278,910 State Transit Assistance (STA) (e.g., population/revenue based, Prop 42)
$3,637 $0 $0 $0 $0 $0 $3,637
Other (FSP, Prop 116) $18,165 $3,300 $2,895 $2,895 $2,895 $2,895 $33,045State Total $1,720,081 $202,753 $165,793 $238,697 $252,136 $140,890 $2,764,020 Bus and Bus Related Grants (5309c) $26,356 $1,194 $0 $0 $0 $0 $27,550 Clean Fuel Formula Program (5308) $0 $0 $0 $0 $0 $0 $0 Elderly & Persons with Disabilities Formula Program (5310) $0 $0 $0 $0 $0 $0 $0 Fixed Guideway Modernization (5309a) $55,512 $19,105 $20,436 $20,212 $20,490 $0 $135,755 Intercity Bus (5311f) $0 $0 $0 $0 $0 $0 $0 Job Access and Reverse Commute Program (5316) $3,194 $1,864 $0 $0 $0 $0 $5,058 New and Small Starts (Capital Investment Grants) (5309b) $165,890 $0 $0 $0 $0 $0 $165,890 New Freedom (SAFETEA-LU) $912 $632 $0 $0 $0 $0 $1,544 Nonurbanized Area Formula Program (5311) $1,686 $349 $363 $378 $393 $0 $3,169 Public Transportation on Indian Reservation (5311c) $0 $0 $0 $0 $0 $0 $0 Transit in the Parks (5320) $0 $0 $0 $0 $0 $0 $0 Urbanized Area Formula Program (5307) $180,823 $54,899 $56,192 $58,585 $60,884 $0 $411,383 Other (Please specify) $0 $0 $0 $0 $0 $0 $0Federal Transit Total $434,373 $78,043 $76,991 $79,175 $81,767 $0 $750,349Federal Highway Non-Discretionary $0 Congestion Mitigation and Air Quality (CMAQ) $118,216 $30,159 $30,702 $31,254 $6,000 $6,000 $222,331 Surface Transportation Program (Regional) $301,337 $31,578 $32,147 $32,726 $33,317 $34,982 $466,087 Highway Bridge Program (HBP) $41,279 $0 $10,060 $27 $20,003 $0 $71,369 Highway Safety Improvement Program (HSIP) $57 $1,544 $0 $0 $0 $0 $1,601 Railway (Section 130) $0 $0 $0 $0 $0 $0 $0 Safe Routes to School (SRTS) (SAFETEA-LU) $0 $0 $0 $0 $0 $0 $0 Safe Routes to School (SR2S) $0 $0 $0 $0 $0 $0 $0 Transportation Improvements (TI) $0 $0 $0 $0 $0 $0 $0 Federal Lands Highway $0 $0 $0 $0 $0 $0 $0 Other (Please specify) $0 $0 $0 $0 $0 $0 $0Subtotal $460,889 $63,281 $72,909 $64,007 $59,320 $40,982 $761,388 Federal Highway Discretionary Programs $0 Bridge Discretionary Program $0 $0 $0 $0 $0 $0 $0 Corridor Infrastructure Improvement Program (SAFETEA-LU Sec. 1302)
$0 $0 $0 $0 $0 $0 $0
Coordinated Border Infrastructure (SAFETEA-LU Sec.1303) $97,781 $13,901 $0 $600 $0 $0 $112,282 Ferry Boat Discretionary $0 $0 $0 $0 $0 $0 $0 High Priority Projects (HPP) $83,153 $32,664 $1,950 $9,240 $0 $1,600 $128,607 High Risk Rural Road (HRRR) $0 $0 $130 $0 $0 $0 $130 National Scenic Byways Program $0 $0 $0 $0 $0 $0 $0 Projects of National/Regional Significance (SAFETEA-LU Sec. 1301)
$0 $0 $0 $0 $0 $0 $0
Public Lands Highway Discretionary $0 $0 $0 $0 $0 $0 $0 Recreational Trails $0 $142 $0 $0 $0 $0 $142 Transportation and Community and System Preservation Program $1,564 $490 $0 $0 $0 $0 $2,054 Other (Please specify) $14,851 $9,764 $429 $0 $0 $0 $25,044 Subtotal $197,349 $56,961 $2,509 $9,840 $0 $1,600 $268,259 Federal Highway Total $658,238 $120,242 $75,418 $73,847 $59,320 $42,582 $1,029,647FEDERAL TOTAL $1,092,611 $198,285 $152,409 $153,022 $141,087 $42,582 $1,779,996
PROGRAMMED TOTAL $4,507,928 $957,406 $855,021 $983,049 $857,585 $538,411 $8,743,070
*Total includes debt service to 2015
San Diego Region
Table 4-1b
2008 Regional Transportation Improvement Program (RTIP)
Total Program (in $000s)
FED
ERA
L H
IGH
WA
YLO
CA
LST
ATE
FED
ERA
L TR
AN
SIT
07/23/2008162

163
Table 4-1c 2008 Regional Transportation Improvement Program – San Diego Region
Available Balance (in $000s)

164
PROGRAM REVENUES
RTIP revenue sources have been grouped into different categories and are described below:
Federal Revenues
Federal funds programmed are based on the current federal authorizing legislation, Safe, Accountable, Flexible and Efficient Transportation Equity Act: A Legacy for Users (SAFETEA-LU) scheduled to expire in 2009, and on an assumption that there will be a new federal authorization that will continue the existing formula programs.
Border Infrastructure Program: SAFETEA-LU changed the distribution of this program to a formula based program at the national level but administered at the state level. For San Diego, the state legislation identified funding for the SR 905 (CAL38) project and a smaller amount for the San Ysidro Main line (SAN27) project. No additional funding beyond SAFETEA-LU is assumed.
CMAQ: Federal CMAQ funds are estimated and apportioned by Caltrans for the San Diego region.
Demonstration/High-Priority Projects: SAFETEA-LU includes several San Diego region projects under the High-Priority Project Authorizations program. No additional funding beyond SAFETEA-LU is assumed.
FTA (Section 5309) Capital Program: The FTA Section 5309 program includes both a discretionary program for major bus and new starts capital projects and formula program for fixed guideway rail modernization. The revenues for the formula program (5309 fixed guideway) are based on SAFETEA-LU for FY 2009 then escalated by 4 percent to 2013 (the escalation rate is based on an average growth over the SAFETEA-LU period for this program). No new discretionary funding is assumed.
FTA Urbanized Area Formula (Section 5307) Capital Program: The FTA Section 5307 program is a formula program to fund ongoing preventive maintenance, bus acquisition programs, the regional vanpool program, office and shop equipment, and other capital and planning projects. The revenues are based on SAFETEA-LU for FY 2009 then escalated by 4 percent to 2013 (the escalation rate is based on an average growth over the SAFETEA-LU period for this program).
FTA Formula (Section 5310) Capital Program: This program is administered by Caltrans and the funds are allocated each year by the California Transportation Commission (CTC). Recipients are nonprofit organizations serving the elderly and the disabled community in need of vehicles and other capital items in order to provide services.
FTA Formula (Section 5311) Operating Program: Section 5311 funds provide support for transit services in the non-urbanized areas of the region. Caltrans provides the estimates of revenues.
FTA Formula (Section 5316) Jobs Access Reverse Commute Program: This program can fund operating, capital, and mobility management projects providing transportation services to jobs and employment-related activities for persons with limited means. The revenues are based on SAFETEA-LU for FY 2009. Although not a new program, SAFETEA-LU changed the administrative oversight and allocation from previous legislation. As a result, no new funding is assumed after FY 2009 until a new federal legislation is in place or annual apportionment is published.
FTA Formula (Section 5316) New Freedom Program: This program can fund operating, capital, and mobility management projects providing new or expanded transportation services and facilities for

165
persons with disabilities. The revenues are based on SAFETEA-LU for FY 2009. Although not a new program, SAFETEA-LU changed the administrative oversight and allocation from previous legislation. As a result, no new funding is assumed after FY 2009 until a new federal legislation is in place or annual apportionment is published.
Highway Bridge Program (HBP) Safe Routes to Schools (SR2S), High Risk Rural Roads, Highway Safety: These programs are administered by Caltrans at the statewide level. All funding assumptions are provided by Caltrans.
Regional Surface Transportation Program (RSTP): Federal RSTP funds are apportioned by Caltrans to various areas of the state, including the San Diego region. RSTP funding levels are based on estimates provided by Caltrans.
Transportation Enhancement (TE): Although this is a federal program, the fund administration was transferred from the regional agencies to CTC. The SANDAG Board elected to focus the regional share of this program for the Smart Growth Incentive Program and projects were selected for the initial five-year period (from the 2006 STIP, FY 2007 to FY 2011). Although the 2008 Fund Estimate includes the County target for the San Diego area through FY 2013, there are no new TE funded projects in the RTIP. Once new projects are selected by the SANDAG Board those will be programmed into the RTIP during the amendment cycle.
State Revenues
The state highway projects programmed are based on the 2008 STIP adoption. The State Transit Assistance program is based on estimates provided by the State Controller’s office.
Freeway Service Patrol (FSP): Funds are provided through the state legislature. The FSP program costs and revenue estimates have been developed jointly by SANDAG, Caltrans, and the California Highway Patrol based upon the most current statewide FSP Act funding levels.
Prop 1B: There are several programs under the state bond program which are administered by the CTC. CTC has approved or allocated funding for some programs including STIP/SHOPP Augmentation, Public Transportation Modernization, Improvement and Service Enhancement (PTMISEA), Congestion Mobility Improvement Account (CMIA), and the Trade Corridors Improvement Fund (TCIF). The funding received under these programs is included in the RTIP. As the other programs are allocated, to the extent that San Diego region is the recipient; those will be programmed as they are approved.
STIP and SHOPP: The CTC programs the STIP and SHOPP on a statewide basis. The program funding is based upon reasonably expected state and federal revenues, as identified in the 2008 STIP Fund Estimate.
State Transit Assistance (STA): The STA program provides state operating and capital support for the region's transit operators through a formula program. The STA funds can be used for both operating (after meeting certain eligibility criteria) and capital projects. Certain STA funds are included in the ‘local’ revenue sources. The funding levels are based on estimates provided by the State Controller’s office.
Traffic Congestion Relief Program (TCRP): In FY 2001, the Governor of California initiated a new funding program (TCRP) in an effort to relieve congestion statewide. The TCRP, a one time program was created as a result of a budget surplus; however, with the subsequent and continuing budget deficit, TCRP allocations have been sporadic. TCRP funds are based on the priority list of TCRP allocations.

166
Local Revenues
TransNet Local Transportation Sales Tax Program: TransNet revenues are estimated based upon taxable retail sales forecasts derived from SANDAG’s short-term forecasting model. The TransNet Ordinance specifies several sub-programs that augment the major transportation projects in the region including Major Corridors, Smart Growth Incentive Program, and an innovative program for early mitigation for projects – Environmental Mitigation Program (EMP) The EMP, which is the first program of this nature in the state, provides for the purchase of habitat for mitigation well ahead of actual project implementation in order to reduce the cost of projects in the future while preserving the ecology of the region.
Local Agency Funding: The local agency revenues programmed are based on reasonably expected revenues as submitted by local agencies. Included are city and county local gas tax subventions, developer fees, local public funds, Prop. 42 funds and developer funds administered by local agencies.
Local Privatization/Toll Revenues: There are two local privatization/toll revenue funding: (1) the SR 125 private toll road project from SR 905 to SR 54 and (2) the SR 241 Foothill Corridor toll road.
Transportation Development Act (TDA): Although this program is enabled by state legislation and the funds are collected by the State Board of Equalization, TDA is administered locally. Funds are based on a ¼ percent state sales tax, with revenues made available primarily for transit operating and capital purposes. The San Diego County Auditor’s office estimates the apportionment for the upcoming fiscal year. SANDAG prepares forecasts of TDA based on a forecast of sales tax revenues estimated for the San Diego County using SANDAG’s short-term forecasting model, which takes into consideration numerous variables, including population growth, inflation, and real income growth.
Other Transportation Program Revenues
Other Funds: These funds include contributions from various state funding sources, local agency contributions, private sector funding, advertising income, investment earnings, passenger fare revenue, and other miscellaneous income. Revenues from these sources are generally consistent with established historical trends or are based upon funding commitments from local agencies.
Alternative Financing: One project funded through federally funded Grant Anticipation Revenue Vehicle (GARVEE) continues in the RTIP, I-15 Managed Lanes. The intent of the program is to provide a financing mechanism to accelerate the funding and construction of critical transportation projects in order to provide the congestion relief benefits to the public significantly sooner than under traditional financial techniques. Based on the same concept of advancing projects, SANDAG Board approved the issuance of $600 million in long term debt backed by TransNet in order to complete major transportation projects early.
TRANSNET REVENUE ESTIMATES
The TransNet Ordinance and Expenditure Plan describe the process for allocating the sales tax program revenues to specified agencies and for selecting which major projects will be eligible to receive sales tax funding. Table 4-2 shows the current forecast of TransNet sales tax revenues from FY 2009 to FY 2013.
The TransNet revenues programmed reflect the latest estimate of sales tax revenues based upon SANDAG’s newly developed short-term forecast model. The programming of TransNet funds is typically less than the

167
TransNet receipts, since a portion of the annual receipts is committed to revenue bond debt service. Debt service information is provided as part of the annual Cash Flow Update sent to each agency at the beginning of the fiscal year.
Table 4-2 TransNet Revenue Forecast
FY 2009-2013 RTIP – San Diego Region (in $000s of future dollars)
FY 2009 FY 2010 FY 2011 FY 012 FY 2013 Total
Estimated Revenue(1) $246,013 $256,837 $269,936 $283,973 $297,319 $1,354,078
Administration (2) $2,460 $2,568 $2,699 $2,840 $2,973 $13,541
Independent Taxpayer Oversight Committee $324 $335 $347 $360 $373 $1,739
Bicycle Projects $4,920 $5,137 $5,399 $5,679 $5,946 $27,082
Major Corridors $101,043 $105,490 $110,872 $116,640 $122,123 $556,168
New BRT/Rail Operations $19,303 $20,153 $21,181 $22,283 $23,330 $106,249
Transit System Improvements $39,321 $41,051 $43,146 $45,390 $47,524 $216,433
Local Streets Improvements $78,642 $82,103 $86,292 $90,781 $95,049 $432,867
(1) 1/2% sales tax (2) 1% maximum
Note: Revenue estimates are based on proposed FY 2009 TransNet budget and current SANDAG short term forecasting model.
OPERATIONS AND MAINTENANCE COSTS
Although the RTIP is a program document that includes major transportation capital projects, 23 CFR 450.21(m) and 23 CFR 450.322(f)(10)(i) require that the RTIP financial chapter illustrate the costs and revenue sources to adequately operate and maintain highway, public transportation systems.
Transit Operating Costs
Two transit districts provide transit service in San Diego County – the North County Transit District (NCTD) and the San Diego Metropolitan Transit System (MTS). NCTD services 1,020 square miles located in the northern portion of the County and provides commuter rail, new light rail, fixed-route, general purpose demand response and ADA paratransit services. For FY 2009 NCTD estimates providing 7.7 million service miles carrying 13.8 million passengers. MTS provides transit service in the remaining areas of the County. MTS consists of four transit operators in its service area. In addition to providing fixed-route, general purpose demand response, ADA paratransit services, MTS also operates the region’s light rail system. The MTS area operators estimate carrying approximately 94 million passengers over 31 million annual service miles in FY 2009. Both NCTD and MTS provide these services on a coordinated basis.
Table 4-3 shows the projected ongoing costs as developed by the two transit districts for the next five years. Although both transit districts have balanced budgets for FY 2009, as the table illustrates, they face an $18 million deficit over the next five years. With reduced revenues and increases in cost, the transit agencies are struggling to meet the needs of the transit dependent and provide mobility alternatives for the choice rider. The table includes NCTD and MTS plans to pursue cost savings strategies to mitigate these deficits

168
Table 4-3 Transit Operating Costs and Revenues Forecast
(in $000s of future dollars)
FY 2009 FY 2010 FY 2011 FY 2012 FY 2013 Total
North County Transit District
Revenues $91,785 $95,093 $93,786 $97,577 $101,097 $479,339
Less Expenses $91,785 $93,348 $96,504 $101,993 $105,317 $488,947
Projected Deficit/Surplus $0 $1,746 $(2,719) $(4,415) $(4,220) $(9,608)
Metropolitan Transit System
Revenues $222,083 $227,210 $233,556 $239,902 $246,465 $1,169,216
Less Expenses $222,083 $228,397 $235,239 $242,286 $249,545 $1,177,550
Projected Deficit/Surplus $0 $(1,188) $(1,683) $(2,384) $(3,079) ($8,334)
Source: June 20, 2008 Transportation Committee Meeting (Draft FY 2009 Transit Agency Operating Budgets)
Highway Costs
Caltrans is responsible for the operations, maintenance, and rehabilitation of state highway in the San Diego region. Excluding capital projects, over the next five years, Caltrans estimates approximately $337 million for operations and administrative costs and $47 million for maintenance costs. The highway costs are based on anticipated revenues the state has deemed available; therefore, costs and revenues equal.
Local Streets and Road Costs
The local cities within the region are responsible for the operations and maintenance of its streets and roads. The cost to operate, maintain and rehabilitate the local streets is estimated at $1.5 billion over the next five years. The local agencies plan to utilize various sources of funding including gas tax subventions, Prop. 1B, Prop. 42, and their formula share of TransNet.

Chapter 5
AIR QUALITY CONFORMITY ANALYSIS


171
Chapter 5
AIR QUALITY CONFORMITY ANALYSIS
On April 15, 2004, the U.S. Environmental Protection Agency (EPA) designated the San Diego air basin as non-attainment for the new Eight-Hour Ozone Standard. This designation took effect on June 15, 2004. The air basin was initially classified as a basic non-attainment area under Subpart 1 of the Clean Air Act and the maximum statutory attainment date for the Eight-Hour Ozone Standard was set as June 15, 2009. However, EPA is responding to a court decision and is expected to propose that, among other areas of the country, the San Diego basic non-attainment area will be reclassified as a Subpart 2 moderate non-attainment area, with a maximum statutory attainment date of June 15, 2010. Several areas that are tribal lands in eastern San Diego County were excluded from the non-attainment designation.
In cooperation with the San Diego APCD and SANDAG, the California Air Resources Board (ARB) developed an Eight-Hour Ozone Attainment Plan which was submitted to the U.S. EPA by June 15, 2007. The budgets in the Eight-Hour Ozone Attainment Plan for San Diego County were found adequate for transportation conformity purposes by the U.S. EPA, effective June 9, 2008.
The SANDAG Board of Directors made a finding of conformity of the 2030 Regional Transportation Plan: Pathways for the Future (2030 RTP) and 2006 RTIP, as amended, on November 30, 2007. The U.S. Department of Transportation (DOT) issued its conformity finding on December 10, 2007.
Also, the U.S. EPA designated the San Diego region as a federal maintenance area for the Carbon Monoxide (CO) standard. On January 30, 2006, the U.S. EPA approved the 2004 Revision to the California State Implementation Plan for Carbon Monoxide or CO Maintenance Plan as a State Implementation Plan (SIP) revision.
DEMONSTRATION OF FISCAL CONSTRAINT
The 2008 RTIP is consistent with the 2030 RTP. As a financially constrained document, the 2008 RTIP contains only those major transportation projects listed in the revenue-constrained 2030 RTP. See Chapter 4 for detailed discussion on financial constraint.
DEVELOPMENT OF TRANSPORTATION CONTROL MEASURES
In 1982, SANDAG adopted four Transportation Tactics as elements of the 1982 Revised Regional Air Quality Strategy (RAQS). These Transportation Tactics are ridesharing, transit improvements, traffic flow improvements, and bicycle facilities and programs.
These four Transportation Tactics were subsequently approved by the San Diego Air Pollution Control Board (APCB) and are included in the 1982 SIP for Air Quality as Transportation Control Measures (TCMs). The U.S.

172
EPA approved this State Implementation Plan (SIP) revision for the San Diego Air Basin in 1983. However, the four TCMs have been fully implemented.
The California Clean Air Act required the preparation of a 1991 RAQS, including TCMs. During 1991 and 1992, SANDAG, in cooperation with local agencies, transit agencies, and the APCD developed a TCM Plan. SANDAG approved the TCM Plan on March 27, 1992.
On June 30, 1992, the APCD amended the TCM Plan and adopted the 1991 RAQS, including the amended TCM Plan. TCMs included in the 1991 RAQS include the four Transportation Tactics described above, as well as a transportation demand management (TDM) program, vanpools, high-occupancy-vehicle (HOV) lanes, and park and ride facilities. On November 12, 1992, the Air Resources Board (ARB) gave approval to the 1991 RAQS, including the TCMs.
The 1995 Triennial RAQS Update subsequently deleted the Employee Commute Travel Reduction Program contained in the TDM program because the program was no longer required under federal law. Assembly Bill 3048 (Statutes of 1996, Chapter 777) eliminated all state requirements for mandatory trip reduction programs. As a result, the Student Travel Reduction Program, the Non-Commute Travel Reduction Program, and the Goods Movement/Truck Operation Program proposed in the 1991 RAQS were no longer statutorily mandated and were deleted from the RAQS in 1998. Neither the 2001 nor the 2004 Triennial RAQS Revisions made changes to measures related to mobile sources or the TCM Plan.
AIR QUALITY CONFORMITY REQUIREMENTS
SANDAG, as the Metropolitan Planning Organization (MPO), and the U.S. DOT must make a determination that the 2008 RTIP and 2030 RTP conform to the applicable SIP. Conformity to the SIP means that transportation activities will not create new air quality violations, worsen existing violations, or delay the attainment of the National Ambient Air Quality Standards (NAAQS).
Based upon the U.S. EPA’s Transportation Conformity Rule, as amended, conformity of transportation plans and programs, including the 2008 RTIP, is determined according to the 1990 Clean Air Act Amendments (CAAA) [Section 176(c)(3)(A)] if the following is demonstrated:
The 2008 RTIP provides for the timely implementation of the Transportation Tactics contained in the 1991 RAQS. These tactics are also included as TCMs in the 1982 SIP, but have been fully implemented.
A quantitative analysis is conducted on the cumulative emissions of projects programmed within the 2008 RTIP, including all regionally significant, capacity-increasing projects. Further, implementation of the projects and programs must meet the motor vehicle emissions budget developed by local and state air quality agencies and approved by the U.S. EPA. The 2008 RTIP must meet the applicable emission budgets prescribed in the 8-Hour Ozone Attainment Plan for San Diego County which were found adequate for transportation conformity purposes by the U.S. EPA, effective June 9, 2008. Also, the 2008 RTIP must meet the CO emissions budget established in the CO Maintenance Plan (approved by the U.S. EPA in January 2006).
In addition to the required emissions tests, consultation with transportation and air quality agencies is required. The consultation process followed to prepare the air quality conformity analysis complies with the San Diego Transportation Conformity Procedures adopted in July 1998.

173
Interagency consultation involves SANDAG, the SDAPCD, Caltrans, ARB, the U.S. DOT, and the U.S. EPA, which form the San Diego Region CWG.
Consultation is a three-tier process that:
1. formulates and reviews drafts through a conformity working group;
2. provides local agencies and the public with opportunities for input through existing regional advisory committees and workshops; and
3. seeks comments from affected federal and state agencies through participation in the development of draft documents and circulation of supporting materials prior to formal adoption.
SANDAG consulted with the San Diego Region Conformity Working Group (CWG) for the preparation of the new air quality analysis of the 2008 RTIP. Conformity of the 2030 Regional Transportation Plan: Pathways for the Future also is being redetermined to comply with the new Eight Hour ozone budgets, however, no new regionally significant, capacity-increasing projects have been added to the regional emissions analysis.
The schedule for the development of the 2008 RTIP was presented to the CWG on February 6, 2008. Criteria and procedures for determining conformity of the 2008 RTIP were presented at the CWG meetings on February 6, 2008, April 2, 2008, and May 7, 2008. SANDAG also followed interagency consultation procedures for exempt projects. A draft list of exempt and capacity increasing projects was provided to the CWG on May 9, 2008. Additional exempt projects were distributed to the CWG on May 13, 2008, and May 23, 2008, for interagency consultation. Comments from the CWG were incorporated into the final project list, which was discussed at the June 4, 2008, CWG meeting.
The quantitative emissions analyses for the 2008 RTIP and 2030 RTP redetermination were initiated on April 23, 2008, and the results distributed on June 2, 2008, to the San Diego Conformity Working group for an initial review and comment period. The San Diego Region CWG reviewed the draft air quality conformity analysis at its June 4, 2008, meeting. The draft 2008 RTIP and its conformity analysis and the 2030 RTP conformity re-determination were released for public review and comment on June 20, 2008, and a public hearing was held on July 18, 2008. The results of the draft and final regional emissions analysis indicate that the 2008 RTIP and 2030 RTP meet the air quality conformity requirements.
The SANDAG Board of Directors made a conformity finding for the 2008 RTIP and 2030 RTP re-determination and approved the 2008 RTIP at its July 25, 2008.
The following sections provide a summary of the air quality conformity analysis of the 2008 RTIP and 2030 RTP in relation to the above conformity requirements. Appendix C provides additional information related to regional emissions analysis and modeling procedures and expeditious implementation of Transportation Tactics.
The first requirement of the air quality conformity finding is to provide for the expeditious implementation of adopted TCMs, which are also the Transportation Tactics included in the 1991 RAQS. These tactics are ridesharing, transit service improvements, traffic flow improvements, and bicycle facilities and programs.
The 1982 SIP established the TCMs, which identified general objectives and implementing actions for each tactic. Due to substantial investments since 1982, SANDAG has fully implemented the TCMs. Ridesharing, transit, bicycling, and traffic flow improvements continue to be funded, although the level of implementation established in the SIP has been surpassed. No TCMs have been removed or substituted from the SIP.

174
The 2008 RTIP makes substantial progress in programming funds for implementation of the four adopted Transportation Tactics for the San Diego region contained in the 1991 RAQS. Table 5-1 shows that Transportation Tactics programmed for implementation total approximately $2.7 billion, or 30.8 percent of the total funds programmed. Included are $23.9 million for Ridesharing, $2.5 billion for Transit Improvements, $82.8 million for Bicycle Facilities and Programs, and $120.3 million for Traffic Flow Improvements.
Based upon this analysis, the 2008 RTIP continues to provide for the expeditious implementation of the four Transportation Tactics approved in the 1991 RAQS.
QUANTITATIVE EMISSIONS ANALYSIS
The second requirement of the conformity finding is to conduct a quantitative emissions analysis on the proposed 2008 RTIP. The emissions analysis must show that implementation of the 2008 RTIP and 2030 RTP meet the emissions budgets established in the 2004 CO Maintenance Plan and in the Eight-Hour Ozone Attainment Plan for San Diego County.
A quantitative emissions analysis was conducted according to the requirements established in the Transportation Conformity Rule under Section 93.122(b). Motor vehicle emissions forecasts were produced for the following analysis years: 2008, 2010, 2020, and 2030.
SANDAG's regional growth forecasts and transportation models, as well as ARB’s emissions model, were used to generate the emissions forecasts. Transportation forecasts were developed using the TransCAD transportation planning computer package. The four-step transportation modeling process includes trip generation, trip distribution, mode split, and trip assignment. The quantitative emissions analysis was conducted using the EMFAC 2007 model.
All of the proposed capacity-increasing improvements identified in the 2008 RTIP that are on the Regional Arterial System (as defined in the RTP) or the FHWA functional classification system (other principal arterials and higher classifications) were modeled.
EMISSIONS BUDGET ANALYSIS
Tables 5-2 and 5-3 on the following page provide a summary of the results of the quantitative emissions analysis conducted for the 2008 RTIP and 2030 RTP.
The analysis shown in Table 5-2 demonstrates that the 2008 RTIP and the 2030 Regional Transportation Plan: Pathways for the Future meet the applicable budgets for the8-Hour Ozone standard. Projected reactive organic gas (ROG) and nitrogen oxide (NOx) emissions for 2008, 2010, 2020, and 2030 are below the SIP budgets for 2008. Table 5-3 shows that projected CO emissions from the 2008 RTIP and the 2030 Regional Transportation Plan: Pathways for the Future are below the 2003 CO budget of 730 tons per day.

RIDESHARING
Transportation Demand Management (TDM) $23,930
Subtotal: $23,930
TRANSIT IMPROVEMENTS
Transit - Bus/Rail Infrastructure $499,033
Transit - Bus/Rail Intermodal Stations $174,690
Transit - Bus/Rail Vehicle Purchase $426,062
Transit - I-15 BRT $121,048
Transit - Mid-Coast $147,978
Transit - Other BRT $171,021
Transit - Other Bus/Rail (Operations/Planning) $462,277
Transit - Sprinter $460,266
Subtotal: $2,462,375
BICYCLE FACILITIES PROJECTS
Bicycle/Pedestrian Projects $82,760
Subtotal: $82,760
TRAFFIC FLOW IMPROVEMENTS
Transportation Management System/Intelligent Transportation System $91,662
Traffic Management/Signal Projects $28,604
Subtotal: $120,266
Total Transportation Tactics in 2008 RTIP: $2,689,331
Total All Transportation Projects in 2008 RTIP: $8,743,070
Share of T-Tactics Projects in 2008 RTIP: 30.8%
Table 5-1
2008 RTIP - SAN DIEGO REGION (IN $000s)
TRANSPORTATION TACTICS
07/23/2008175

176
Table 5-2 2008 RTIP and 2030 Regional Transportation Plan: Pathways to the Future
Air Quality Conformity Analysis for Eight-Hour Ozone
ROG NOx
Year
Average Weekday Vehicle Starts
(1,000s)
Average Weekday Vehicle Miles
(1,000s)
SIP Emissions
Budget Tons/Day
ROG Emissions Tons/Day
SIP Emissions
Budget Tons/Day
NOx Emissions Tons/Day
2008 14,081 87,462 53 49 98 96
2010 14,440 90,214 53 44 98 89
2020 16,105 101,884 53 28 98 48
2030 17,877 114,386 53 23 98 33
Note: Emissions budgets from Eight Hour Ozone Attainment Plan for San Diego County, found adequate for transportation conformity purposes by the U.S. EPA, effective June 9, 2008.
Table 5-3 2008 RTIP and 2030 Regional Transportation Plan: Pathways to the Future
Air Quality Conformity Analysis for Carbon Monoxide
CO
Year
Average Weekday
Vehicle Starts (1,000s)
Average Weekday
Vehicle Miles (1,000s)
SIP Emissions Budget
Tons/Day
CO Emissions Tons/Day
2010 14,440 90,214 730 460
2018 15,772 99,550 730 294
2020 16,105 101,884 730 252
2030 17,877 114,386 730 193
Note: Emissions budgets for the San Diego region from 2004 Revision to California State Implementation Plan for Carbon Monoxide, Updated Maintenance Plan for Ten Federal Planning Areas (Approved as SIP revision in January 2006).

177
CONCLUSION
Based upon an evaluation of projects and funds programmed and a quantitative emissions analysis, the 2008 RTIP and 2030 RTP meet the U.S. EPA transportation conformity regulations contained within the federal guidelines published on August 15, 1997, and subsequent amendments, as well as the requirements of the federal Clean Air Act amendments of 1990.


APPENDICES

(Insert blank page)

Appendix A
PUBLIC PARTICIPATION

(Insert blank page)

183
Appendix A
PUBLIC PARTICIPATION
It is the policy of SANDAG to encourage public participation in the transportation planning and programming processes. The public involvement program consists of (1) participation on various SANDAG working groups, (2) opportunities to comment at SANDAG Board meetings and public hearings, (3) through the SANDAG public communications program; and (4) special outreach efforts conducted for the 2030 RTP: Pathways for the Future. All of these components were used in the development of the 2008 RTIP.
SANDAG COMMITTEES AND WORKING GROUPS
SANDAG uses policy and advisory committees and technical working groups to provide additional opportunities for involvement in SANDAG transportation planning and programming activities by local agency officials and staff, interested groups, and the general public. The following committee and working groups have participated in the development of the RTIP. Meeting notices and agendas are sent to the committee and working group members and other citizen groups and individuals expressing an interest. All committee and working group meetings are open to the public.
POLICY ADVISORY COMMITTEE
Transportation Committee: This committee of SANDAG Board members has been delegated additional authority for numerous transportation related issues including holding public hearings and approving RTIP amendments in addition to continuing its advisory role to the full SANDAG Board on matters pertaining to major transportation projects and transportation policy-level matters. The Committee provides recommendations to the Board regarding funding of transportation projects included in the RTIP and TransNet Program. Caltrans, MTS, and NCTD are ex-officio members of the Committee.
WORKING GROUPS/ADVISORY COMMITTEES
Independent Taxpayer Oversight Committee (ITOC): This advisory committee made up of members of the public was created in FY 2006 with the passage of the TransNet extension. Based on the provisions of the TransNet Extension Ordinance, the ITOC is responsible for reviewing projects proposed for funding with TransNet funds and providing comments to the SANDAG Transportation Committee and to the Board of Directors for consideration when actions are taken on the RTIP. Specifically, the ITOC’s role in the RTIP process is provided below:
8. “Review and comment on the programming of TransNet revenues in the Regional Transportation Improvement Program (RTIP). This provides an opportunity for the ITOC to raise concerns regarding the eligibility of projects proposed for funding before any expenditure are made. In addition to a general eligibility review, this effort should focus

184
on significant cost increases and/or scope changes on the major corridor projects identified in the Ordinance and Expenditure Plan.
Cities/County Transportation Advisory Committee (CTAC): CTAC reviews and provides an advisory
role in (1) transportation fund allocations; (2) local streets and road projects included in the RTP and RTIP; and (3) highway and local streets and road-related SANDAG studies. Membership includes public works directors or engineers from each city and the County, Caltrans, MTS, NCTD, the Port of San Diego, and APCD.
Bicycle-Pedestrian Advisory Working Group: This working group helps in the development of the bicycle and pedestrian facilities portion of the RTP and RTIP, and recommends projects for funding under the Transportation Development Act (TDA), the TransNet Program, and any bicycle/pedestrian-related federal funding programs. Membership includes citizen participants, the cities and County, Caltrans, MTS, NCTD, and the Port of San Diego.
Subcommittee for Accessible Transportation (SCAT): SCAT is responsible for review and comment on accessibility issues related to services and programs for the elderly and physically challenged. Membership includes representatives from the region’s transit operators and user groups.
San Diego Regional Traffic Engineers’ Council (SANTEC): SANTEC serves as SANDAG's technical advisory committee on regional traffic engineering matters. Membership includes a traffic engineering representative from each city, the County, and Caltrans.
San Diego Region Conformity Working Group (CWG): The CWG provides federal interagency coordination for the transportation/air quality conformity process and advises on regional and statewide air quality matters. The CWG includes representatives from SANDAG, Caltrans, APCD, the California Air Resources Board (CARB), FHWA, FTA, and EPA.
The Transportation Committee and the various working groups previously will be provided with both written material and staff presentations on the major projects included in the 2008 RTIP. Where appropriate, their comments are noted in staff reports to the SANDAG Board, and may be reflected in the 2008 RTIP or in its subsequent amendments.
SANDAG BOARD MEETINGS AND PUBLIC HEARINGS
All SANDAG Board meetings are noticed, open to the public, and held in handicapped-accessible meeting rooms served by public transportation. The public hearing notice is published in local newspapers of general circulation as well as in various minority newspapers. The SANDAG Transportation Committee accepted the draft 2008 RTIP for review and distribution at its meeting on June 20, 2008, and held a public hearing at its July 18, 2008 meeting.
In addition, each city, and the County of San Diego are responsible for providing adequate notice and holding public meetings and/or public hearings as part of their process to develop and submit transportation projects for inclusion in the 2008 RTIP. Pursuant to federal law, the requirements to hold public hearings/notices for federally funded transit projects for MTS and NCTD are herein incorporated as part of the public hearing process for the 2008 RTIP. The public meetings/hearings held by each member agency provide further opportunities for public involvement and participation on specific projects and programs.

185

186

187

188

189

190

191

192

193


Appendix B
PROJECTS EXEMPT FROM AIR QUALITY CONFORMITY DETERMINATION


197
APPENDIX B Projects Exempt from Air Quality Conformity Determination*

198
APPENDIX B Projects Exempt from Air Quality Conformity Determination*
*Source: Part II Environmental Protection Agency 40 CFR Parts 51 and 93 Transportation Conformity Rule, as amended, July 1, 2004.

Appendix C
REGIONAL EMISSIONS ANALYSIS AND MODELING PROCEDURES


201
APPENDIX C
REGIONAL EMISSIONS ANALYSIS AND MODELING PROCEDURES
BACKGROUND
The federal Clean Air Act (CAA), which was last amended in 1990, requires the United States Environmental Protection Agency (U.S. EPA) to set National Ambient Air Quality Standards (NAAQS) for pollutants considered harmful to public health and the environment. California has adopted state air quality standards that are more stringent than the NAAQS. Areas with levels that exceed the standard for specified pollutants are designated as non-attainment areas.
The U.S. EPA requires that each state containing non-attainment areas develop plans to attain the NAAQS by a specified attainment deadline. These attainment plans are called State Implementation Plans (SIP). The San Diego County Air Pollution Control District (APCD) prepares the San Diego portion of the California SIP. Once the standards are attained, further plans—called Maintenance Plans—are required to demonstrate continued maintenance of the NAAQS.
SANDAG and the U.S. Department of Transportation (USDOT) must make a determination that the Regional Transportation Plan (RTP) and the Regional Transportation Improvement Program (RTIP) conform to the SIP for air quality. Conformity to the SIP means that transportation activities will not create new air quality violations, worsen existing violations, or delay the attainment of the national ambient air quality standards.
The 2006 RTIP was found in conformity with the SIP by the SANDAG Board of Directors and by the USDOT on August 4, 2006, and on October 2, 2006, respectively. On November 30, 2007, the SANDAG Board made a finding of conformity of the 2030 RTP: Pathways for the Future and the 2006 RTIP Amendment No. 9 and adopted the plan. The USDOT made its conformity determination on December 10, 2007.
The San Diego region attained the federal One-Hour Ozone Standard in 2001. The U.S. EPA redesignated the San Diego air basin as attainment/maintenance and approved the One-Hour Ozone Maintenance Plan as a SIP revision, effective on July 28, 2003. On June 15, 2005, the U.S. EPA revoked the federal One-Hour Ozone Standard after the Eight-Hour Ozone Standard became applicable for conformity.
On April 15, 2004, the U.S. EPA designated the San Diego air basin as non-attainment for the new Eight-Hour Ozone Standard. This designation took effect on June 15, 2004. The air basin was initially classified as a basic non-attainment area under Subpart 1 of the Clean Air Act and the maximum statutory attainment date for the Eight-Hour Ozone Standard was set as June 15, 2009. However, EPA is responding to a court decision and is expected to propose that, among other areas of the country, the San Diego basic nonattainment area will be reclassified as a Subpart 2 moderate nonattainment area, with a maximum statutory attainment date of June 15, 2010. Several areas that are tribal lands in eastern San Diego County were excluded from the non-attainment designation. As shown in Figure C.1, page C-17, La Posta Areas #1 and #2, Cuyapaipe, Manzanita, and Campo Areas #1 and #2 are attainment areas for the Eight-Hour Ozone NAAQS.

202
In cooperation with the San Diego APCD and SANDAG, the California Air Resources Board (ARB) developed an Eight-Hour Ozone Attainment Plan which was submitted to the U.S. EPA on June 15, 2007. The budgets in the Eight-Hour Ozone Attainment Plan for San Diego County were found adequate for transportation conformity purposes by the U.S. EPA, effective June 9, 2008.
The San Diego region also has been designated by the U.S. EPA as a federal maintenance area for the Carbon Monoxide (CO) standard. On November 8, 2004, the ARB submitted the 2004 revision to the California SIP for CO to the U.S. EPA. Effective January 30, 2006, the U.S. EPA has approved this maintenance plan as a SIP revision.
TRANSPORTATION CONFORMITY: MODELING PROCEDURES
Introduction
The 2008 RTIP is consistent with the 2030 RTP: Pathways for the Future. As a financially constrained plan the 2008 RTIP only contains those major transportation projects listed in the revenue constrained 2030 RTP. See Chapter 4 for detailed discussion on fiscal constraint. Conformity of the 2030 RTP expires on December 10, 2011. However, to comply with the transportation conformity rule standards which require a redetermination of conformity within two years of new budgets, SANDAG is redetermining conformity of the 2030 RTP: Pathways for the Future in conjunction with the 2008 RTIP. Table C.2 to Table C.4 include the conformity analysis for both the 2008 RTIP and the 2030 Revenue Constrained RTP.
Growth Forecasts
Every three to five years, SANDAG produces a long-range forecast of population, housing, and employment growth for the San Diego region. The most recent is the 2030 Regional Growth Forecast Update, which was accepted by the SANDAG Board on September 8, 2006, for use in the 2030 RTP.
The forecast process relies on three integrated forecasting models. The first one, the Demographic and Economic Forecasting Model (DEFM), provides a detailed econometric and demographic forecast for the entire region. The second one, the Interregional Commuting Model, provides a forecast of commuting between the San Diego region, Orange County, southwest Riverside County, Imperial County, and Tijuana/Northern Baja California. The third one, the Urban Development Model, allocates the results of the first two models to subregional areas based upon the current plans and policies of the jurisdictions.
The 2030 Regional Growth Forecast Update is based solely on the adopted general plans and community plans and policies of the 18 cities. For the unincorporated area, the forecast is based on the most recent (June 2005) version of San Diego County’s General Plan 2020 update, as directed by the Board of Supervisors.
In February 2008 SANDAG consulted with the San Diego Region Conformity Working Group (CWG) on the use of the 2030 Regional Growth Forecast Update for the air quality conformity analysis of the 2008 RTIP and 2030 RTP. Previously, both USDOT and U.S. EPA concurred that approved plans should be used as input in the air quality conformity process. Table C.1 shows the regional population and employment growth forecast for the San Diego region through 2030.

203
Table C.1—San Diego Regional Population and Employment Forecast
Final 2030 Regional Growth Forecast Update
Year Total Population Total Employment
2004 3,013,014 1,449,349
2010 3,245,279 1,573,742
2020 3,635,855 1,741,033
2030 3,984,753 1,913,682
Source: SANDAG, September 2006
Transportation Modeling
SANDAG follows a widely used, four-step transportation modeling process of trip generation, trip distribution, mode choice, and assignment to forecast travel activity in the San Diego region. After a first pass through the four steps, a final pass is made through the mode choice and assignment steps to reflect congested travel conditions in mode decision making. Travel model results then are combined with additional post-process input and output functions to form the complete modeling chain.
The estimates of regional transportation-related emissions analysis meet the requirements established in the Transportation Conformity Rule, Sections 93.122(b) and 93.122(c). These requirements relate to the procedures to determine regional transportation-related emissions, including the use of network-based travel models, methods to estimate traffic speeds and delays, and the estimation of vehicle miles of travel.
TransCAD is the transportation planning computer package used by SANDAG to provide a framework for performing much of the computer processing involved with modeling. Another software package used extensively in the modeling process is ArcInfo. This geographic information system (GIS) maintains, manipulates, and displays transportation, land use, and demographic data. SANDAG has written numerous programs that provide a linkage between TransCAD and ArcInfo. Other programs manipulate data and perform some modeling functions such as trip generation and mode choice.
A number of data files and surveys are used to calibrate the transportation models. These include:
1995 Travel Behavior Survey
2001 Caltrans Statewide Travel Survey
2001-2003 San Diego Regional Transit Survey
External Trip Surveys
Traffic Generation Studies
1991 San Diego Visitor Survey
2000 Census Transportation Planning Package

204
In addition to model parameters derived from these surveys, there are three major inputs to the transportation models:
Growth forecast inputs used to describe existing and planned land use patterns and demographic characteristics;
Highway networks used to describe existing roadway facilities and planned improvements to the roadway system; and
Transit networks used to describe existing and planned public transit service.
Highway Networks
The regional highway networks in the 2008 RTIP and 2030 RTP include all roads classified by local jurisdictions in their general plan circulation elements. These roads include freeways, expressways, and the Regional Arterial System (RAS). The RAS consists of all conventional state highways, prime arterials, and selected major streets. In addition, some local streets are included in the networks for connectivity between zones.
The route improvements and additions in the 2008 RTIP and 2030 RTP are developed to provide adequate travel service that is compatible with adopted regional policies for land use and population growth. All regionally significant projects are included in the quantitative emissions analysis. These include all state highways, all proposed national highway system routes, all regionally significant arterials, and all Federal Highway Administration functionally classified "Other Principal Arterials."
The networks also account for programs intended to improve the operation of the highway system, including high occupancy vehicle (HOV) lanes and ramp metering. Existing and proposed toll facilities also are modeled to reflect time, cost, and capacity effects of these facilities. The State Route (SR) 125 South, SR 11 projects, and SR 241 are the only modeled toll facilities included in Revenue Constrained Plan for the San Diego region.
In addition, several managed/HOV lanes are included in the Revenue Constrained Plan. Facilities with proposed managed lanes include Interstate 5 (I-5), I-15, I-805, and SR 52. Managed lanes are defined as reversible HOV routes and HOV routes with two or more lanes in the peak direction. It is assumed that the excess capacity not utilized by carpools and transit on these facilities would be managed so that single occupant vehicles could use these lanes under a pricing mechanism. Traffic flows would be managed so that the facility would operate at level of service D or better.
Based on the networks and programs described above, the transportation forecasts of the 2008 RTIP and 2030 RTP differentiate between four highway modes:
drive alone non-toll
drive alone toll
shared-ride non-HOV/non-toll
shared-ride HOV/non-toll SANDAG maintains a master highway network from which a specific year network, between the years 2004 (the 2030 Regional Growth Forecast Update base year) and 2030, can be built. Four networks were built and verified (2008, 2010, 2020, and 2030) for air quality conformity analyses of the 2008 RTIP and 2030 RTP. A list of the major highway and near-term regional arterial projects included in the conformity analysis, and their implementation phasing is included with the draft Air Quality Conformity Determination. The RAS and Transportation Project Evaluation Criteria and Rankings are included in the 2030 RTP. Locally funded,

205
regionally significant projects also have been included in the air quality conformity analysis. These projects are funded with TransNet funds, a 20-year, half-cent local sales tax for transportation that expires in 2008; TransNet Extension funds, a 40-year, half-cent local sales tax extension approved by voters in 2004 that expires in 2048; and other local revenue sources.
Transit Networks
SANDAG also maintains transit network datasets for existing and proposed transit systems. Most transit routes run over the same streets, freeways, HOV lanes, and ramps used in the highway networks. As a result the only additional facilities that are added to the transportation coverage for transit modeling purposes are:
trolley and commuter rail lines
streets used by buses that are not part of local general plan circulation elements
There are seven transit modes, which group routes with similar operating characteristics. They are:
commuter rail
trolley
regional bus rapid transit (BRT)
corridor BRT
limited-express bus
express bus
local bus
BRT service would have stations similar to commuter rail and trolleys, and operating characteristics midway between rail and bus service. BRT service would be provided by advanced design buses operating on HOV lanes, some grade-separated transit ways, and surface streets with priority transit treatments. Once TransCAD transit networks have been built, TransCAD finds minimum time paths between transit access points (TAP). TAPs are selected transit stops that are used to represent walk and auto access to the transit system. The following four sets of paths are created for modes:
a.m. peak-period local bus
a.m. peak-period premium service
mid-day local bus
mid-day premium service
Bus speeds assumed in the transit networks are derived from modeled highway speeds and reflect the effects of congestion. Regional and express transit routes on surface streets are assumed to operate out of congestion due to priority transit treatments. Higher bus speeds may result for transit vehicles operating on highways with HOV lanes and HOV bypass lanes at ramp meters, compared to those routes that operate on highways where these facilities do not exist.
In addition to transit travel times, transit fares are required as input to the mode choice model. TransCAD procedures replicate the San Diego region’s complicated fare policies which differ between:
buses which collect a flat fare of between $1.00 and $4.00, depending on the type of service;
trolleys which charge a variable fare of between $1.25 and $3.00, depending on how many stations are traversed;
commuter rail which has a zone-based fare of between $4.00 and $5.50;

206
proposed regional BRT routes which are assumed to charge a distance-based fare of between $0.14 and $0.60 per mile that replicates limited-express and commuter rail fares; and
proposed corridor BRT routes, which are assumed to use trolley station-based fares.
Fares are converted to 1999 dollars (consistent with household incomes from the growth forecast) and are assumed to remain constant in inflation-adjusted dollars over the forecast period.
Near-term transit route changes are drawn from the Regional Short-Range Transit Plan produced in coopera-tion with the region’s transit agencies. Longer-range improvements are proposed as a part of the RTP development and other transit corridor studies. In addition to federal and state funded projects, locally funded regionally significant transit projects have been included in the air quality conformity analysis of the 2008 RTIP and 2030 RTP. These transit projects also are funded with TransNet funds or other local revenue sources. Once network coding is completed, the transportation models are run for the applicable scenarios (2008, 2010, 2020, and 2030). The air quality conformity document contains the list of major regional transit projects included in the analysis and their implementation phasing.
Trip Generation
Trip generation is the first step in the transportation modeling process. Average weekday trip ends by all forms of transportation starting and ending in each zone are estimated for ten trip types.
1. home-work 6. work-other
2. home-college 7. other-other
3. home-school 8. serve passenger
4. home-shop 9. visitor
5. home-other 10. airport The model computes person trips, which account for all forms of transportation including automobiles, trucks, taxicabs, motorcycles, public transit, bicycling, and walking.
The trip generation model works by applying trip rates to zone-level growth forecasts. The model calculates each of the trip ends separately, as trip productions and attractions. Trip production rates are expressed as trips per household, while trip production rates vary by trip type and structure type. Trip attractions are expressed as trips per acre of nonresidential land use or trips per household. Trip attraction rates vary by trip type and land use category. The 2030 Regional Growth Forecast Update was used to produce trip generation forecasts for the years 2008, 2010, 2020, and 2030. Trip generation rates were established by utilizing data from traffic generator studies and expanding rates from the 1995 Travel Behavior Survey and 2001 Caltrans Statewide Travel Survey.
The SANDAG regional transportation model uses a relatively high trip generation rate for households (8.1 vehicle trips per day), which may account for possible increases in trip-making as new facilities are built. Also, the model accounts for travel diversion among facilities.
The model reduces future year person trips by a small amount to reflect increased use of teleworking and e-commerce. Reduction factors of 3 percent to 5 percent were applied to selected trip purposes and land uses.

207
Trip Distribution
After trip generation, trip movements between zones are determined using a doubly-constrained, gamma-function gravity model form of the trip distribution model. Inputs to the trip distribution model include zone-level trip generation forecasts by trip type, zone-to-zone impedances, and gamma function parameters by trip type. The model is designed to modify trip patterns in response to new development and reflects shortened trip lengths in the vicinity of smart growth, mixed-use developments. The model also modifies trip patterns as new roadways are added.
The model is calibrated to match observed trip length frequencies from the 1995 Travel Behavior Survey and 2001 Caltrans Statewide Travel Survey. Zone-to-zone impedances are a composite measure of peak and off-peak travel times and costs by highway, transit, and non-motorized modes.
Mode Choice
At this point in the modeling process, total person trip movements between zones are split into different forms of transportation by highway, transit, and non-motorized modes (bicycling and walking). Highway modes include drive alone non-toll, drive alone toll, shared-ride non-HOV/non-toll, and shared-ride HOV/non-toll. Nine transit modes differentiate transit trips by three ride modes (rail, BRT, and bus) and three access modes (walk, drive, and drop-off). The mode choice model is designed to link mode use to demographic assumptions, highway network conditions, transit system configuration, land use alternatives, parking costs, transit fares, and auto operating costs. Trips between zone pairs are allocated to modes based on the cost and time of traveling by a particular mode compared to the cost and time of traveling by other modes. For example, vehicle trips on a congested route would be more likely to be diverted to light rail than vehicle trips on an uncongested freeway.
Income level also is considered since lower-income households tend to own fewer automobiles, and therefore, make more trips by transit and carpooling. People in higher-income households tend to choose modes based on time and convenience rather than cost. The mode choice model is calibrated using 1995 and 2001 Travel Behavior Survey trip tables by mode and income and 2001-2003 Regional Transit Survey transit trip characteristics. Regional-level Census 2000 work trip mode shares also were used to fine tune mode share estimates.
Highway and transit travel times reflect highway congestion effects from the final iteration of the feedback loop. The model produces a.m. peak, p.m. peak, and off-peak period trip tables for vehicles and transit riders. The a.m. peak period is from 6:00 to 9:00 in the morning and the p.m. peak period is from 3:00 to 6:00 in the afternoon. The off-peak period covers the remaining 18 hours of the day. A series of mode choice model runs were performed in the course of analyzing the 2008 RTIP and 2030 RTP through the complete modeling process.
Highway and Transit Assignment
Highway
Highway assignment produces traffic volume estimates for all roadway segments in the system. These traffic volumes are an important input to emissions modeling. Similarly, transit trips are assigned to transit routes and segments.
SANDAG loads traffic using the TransCAD “Multi-Modal Multi-Class Assignment” function. The highway assignment model works by finding roads that provide the shortest travel impedance between each zone

208
pair. Trips between zone pairs are then accumulated on road segments making up minimum paths. Highway impedances consider posted speed limits, signal delays, congestion delays, and costs. The model computes congestion delays for each segment based on the ratio of the traffic volume to roadway capacity. Motorists may choose different paths during peak hours when congestion can be heavy and off-peak hours when roadways are typically free flowing. For this reason, traffic is assigned separately for a.m. peak, p.m. peak, and off-peak periods. Vehicle trip tables for each scenario reflect increased trip-making due to population growth and variations in travel patterns due to the alternative transportation facilities/networks proposed.
Model accuracy is assessed by comparing model estimated traffic volumes with actual traffic counts obtained through the SANDAG traffic monitoring program and highway performance monitoring system estimates of vehicle miles of travel (VMT).
After completing the highway assignments, additional processing is needed. Adjustments are made for calibration error volume, HOV/managed lane volume, bus volumes, hourly distribution factors, level of service (LOS), and travel time.
Transit
For transit assignment, TransCAD software assigns TAP-to-TAP transit trips to the network. Eight separate transit assignments are produced for peak and off-peak periods; walk and auto access; and local bus and premium service. These individual assignments are summed to obtain total transit ridership forecasts.
Before assigning transit trips, external transit trips coming into San Diego from outside the region need to be added to the internal transit trips estimated by the mode choice model. Currently, few transit trips enter from the north or east, however, over 20,000 transit trips cross the Mexican border each day. An external transit trip table for the base year is developed from on-board transit ridership surveys and factored to future years based on border crossing trends to account for these trips.
For accuracy, transit ridership forecasts from the transit assignment model are compared with transit counts from the SANDAG transit passenger counting program to determine whether transit modeling parameters need to be adjusted.
Some of these comparisons of model-estimated boardings with actual boardings include:
System-level boardings, which may reveal transfer rate problems and lead to changes to the transfer wait time factor in the mode choice model;
Boardings by mode, which may reveal modal biases and lead to changes in mode choice modal constants;
Boardings by frequency of service, which may show biases that lead to changes in the first wait factor in the mode choice model; and
Centre City screenline crossings, which may lead to changes in parking costs, and boardings by stop location, which may indicate problems with specific generators such as a university.
Post-TransCAD Processing
Standard TransCAD output needs to be reformatted and adjusted to be useful for emissions modeling. Several routines and computer programs have been written to accomplish the following major functions:
Correcting link-specific traffic volume forecasts for calibration error;
Adding in estimated travel on roads not in the transportation modeling process;

209
Computing link speeds based on corrected link volumes, highway capacity manual relationships between congestion, and speed (or signal delay);
Splitting link volumes into heavy-duty truck and other traffic to obtain speed distributions by vehicle class; and
Preparing a data set that contains total VMT, number of trip starts, and VMT by speed category by time of day for each vehicle class.
Motor Vehicle Emissions Modeling
Emissions Model
In November 2006, ARB released EMission FACtors (EMFAC) 2007, an emissions inventory model that calculates emissions for motor vehicles operating in California. It is an integrated model that combines emission rate data with vehicle activity to calculate regional emissions. The U.S. EPA approved EMFAC 2007 for use in conformity determinations on January 18, 2008.
The EMFAC 2007 model supports calculation of emissions for the Burden mode. The Burden mode is used for calculating regional emission inventories. In this mode, the model reports total emissions as tons per day for each pollutant, by vehicle class, and the total vehicle fleet. The Burden mode uses emission factors that have been corrected for ambient conditions and speeds combined with vehicle activity to calculate emissions in tons per day. Vehicle activity includes the number of vehicles, daily vehicle miles traveled, and the number of daily trips.
The air quality analysis of the 2008 RTIP and 2030 RTP was conducted using EMFAC 2007’s Burden mode. Projections of daily regional emissions were prepared for reactive organic gases (ROG), nitrogen oxides (NOx), and CO.
On-road motor vehicle emissions are attributed to several different processes:
Starting exhaust;
Running exhaust;
Idle exhaust (calculated for heavy-duty trucks only);
Resting and diurnal evaporation;
Running losses; and
Hot soak evaporation.
Emission factors vary by vehicle class, fuel usage, and technology. The fuels modeled are gasoline, diesel, and electrically powered vehicles. Technology categories can be grouped into catalyst, noncatalyst, and diesel. Thirteen vehicle classes are modeled:
passenger car line-haul vehicle
two types of light-duty trucks urban bus
medium-duty truck school bus
two types of light-heavy-duty trucks motorcycle
medium-heavy-duty truck motor home
heavy-heavy-duty truck

210
Emission factors for processes that vary by temperature (i.e., starting exhaust, hot soak, and running exhaust) are broken down further by specified temperature ranges. Exhaust emission factors also are broken down by speed range.
Regional Emissions Forecasts
Regional transportation forecasts were initiated in April 2008. Output from the TransCAD model was then reformatted and adjusted to be useful for emissions modeling.
Eight-Hour Ozone Standard
Effective June 9, 2008, the U.S. EPA found the eight-hour ozone budgets included in the Eight-Hour Ozone Attainment Plan for San Diego County adequate for transportation conformity purposes. In May 2008 SANDAG prepared countywide forecasts of average weekday ROG and NOx emissions for, 2008, 2010, 2020, and 2030 using the EMFAC 2007 model. ROG and NOx emissions are based on the summer season.
The analysis years were selected to comply with Sections 93.106(a) (1) and 93.118 (a) of the Transportation Conformity Rule. According to these sections, the first horizon year (2010) must be within ten years from the base year used to validate the regional transportation model (2004), the last horizon year must be the last year of the transportation plan’s forecast period (2030), and the horizon years may be no more than ten years apart (2020).
The Board will be asked to make a finding of conformity for the years 2008, 2010, 2020, and 2030 using EMFAC 2007. This emissions model was approved by the U.S. EPA for use in conformity findings on January 18, 2008.
CO Standard
CO regional emissions were projected for 2010, 2018, 2020, and 2030 for the conformity determination of the 2008 RTIP and 2030 RTP conformity redetermination. CO emissions are based on the winter season. Regional emissions for 2018 are interpolated.
Emissions Modeling Results
An emissions budget is the part of the SIP that identifies emissions levels necessary for meeting emissions reduction milestones, attainment, or maintenance demonstrations.
To determine conformity of the 2008 RTIP and 2030 RTP, the plan must comply with the emission analysis described in the Regional Emissions Forecast section. Table C.2 shows that the projected ROG and NOx emissions from the 2008 RTIP and 2030 RTP are below the 2008 ROG and NOx budgets.

211
Table C.2—2008 RTIP and 2030 Revenue Constrained RTP Air Quality Conformity Analysis for Eight-Hour Ozone
ROG NOx
Year
Average Weekday Vehicle Starts
(1,000s)
Average Weekday Vehicle Miles
(1,000s)
SIP Emissions
Budget Tons/Day
ROG Emissions Tons/Day
SIP Emissions
Budget Tons/Day
NOx Emissions Tons/Day
2008 14,081 87,462 53 49 98 96
2010 14,440 90,214 53 44 98 89
2020 16,105 101,884 53 28 98 48
2030 17,877 114,386 53 23 98 33
Note: Emissions budgets are from the Eight-Hour Ozone Attainment Plan for San Diego County, which were found adequate for transportation conformity purposes by the U.S. EPA, effective June 9, 2008.
Table C.3 shows that projected CO emissions from the 2008 RTIP and 2030 RTP are below the 2003 CO budget of 730 tons per day. Adjustment factors were provided by ARB to account for recently adopted emission control programs not reflected in EMFAC 2007 and other corrections. Table C.4 includes the adjustment factors by analysis year.
Table C.3—2008 RTIP and 2030 Revenue Constrained RTP Air Quality Conformity Analysis for Carbon Monoxide
CO
Year
Average Weekday
Vehicle Starts (1,000s)
Average Weekday Vehicle Miles
(1,000s)
SIP Emissions Budget
Tons/Day
CO Emissions Tons/Day
2010 14,440 90,214 730 460
2018 15,772 99,550 730 294
2020 16,105 101,884 730 252
2030 17,877 114,386 730 193
Note: Emissions budgets for the San Diego region from 2004 Revision to California State Implementation Plan for Carbon Monoxide, Updated Maintenance Plan for Ten Federal Planning Areas (Approved as SIP revision in January 2006).

212
Table C.4—EMFAC 2007 Adjustment Factors
Year ROG Adjustment Factor (tons/day)
NOx Adjustment Factor (tons/day)
2008 0.26 5.53
2010 0.04 2.37
2020 0.33 2.40
2030 0.71 2.80
Note: Adjustment factors were provided by ARB. The tons listed are subtracted from the EMFAC 2007 output of tons per day for ROG and NOx.
Exempt Projects
Section 93.126 of the Transportation Conformity Rule exempts certain highway and transit projects from the requirement to determine conformity. The categories of exempt projects include safety, mass transit, air quality (ridesharing and bicycle and pedestrian facilities), and other (such as planning studies).
Table C.5 illustrates the exempt projects considered in the 2008 RTIP and 2030 Revenue Constrained RTP. This table shows short-term exempt projects. Additional unidentified projects could be funded with revenues expected to be available from the continuation of existing state and federal programs.

213
Table C.5—Exempt Projects
Project/Program Description
Bikeway, Rail Trail and Pedestrian Projects
Bayshore Bikeway
Cliff Street Pedestrian/Bicycle Bridge
Coastal Rail Trail
Escondido Creek Bike Path Bridge
Inland Rail Trail
Lake Hodges Bicycle-Pedestrian Bridge
Plaza Bonita Class I Bikeway
Regional Bike Locker Program
SR 56/Black Mountain Road Bikeway Interchange
Various Bicycle Master Plans
Regionwide Traffic Incident Management
Freeway Service Patrol
Safety Improvement Program
Bridge Rehabilitation/Preservation
Collision Reduction
Hazard Elimination
High Risk Roads Program
Highway Safety Improvement Program
Noise Barrier Program
Roadway/Roadside Preservation
Transportation Demand Management
Regional Vanpool Program
RideLink Regional Rideshare Program
Transportation Management Systems
Joint Transportation Operations Center (JTOC)
ITS Operations
Ramp Meters (I-5/I-805, SR 94)
Regional Fare Technology
Smart Parking Pilot Program
Traffic Management System (I-805, SR 94) Vehicle Assist and Automation

214
Implementation of Transportation Control Measures
There are four federally-approved Transportation Control Measures (TCM) that must be implemented in San Diego. In the SIP theses are referred to as Transportation Tactics. They include ridesharing, transit service improvements, traffic flow improvements, and bicycle facilities and programs.
These TCMs were established in the 1982 SIP, which identified general objectives and implementing actions for each tactic. The TCMs have been fully implemented. Ridesharing, transit, bicycling, and traffic flow improvements continue to be funded, although the level of implementation established in the SIP has been surpassed. The list of actions that implemented the TCMs is available at SANDAG.
Interagency Consultation Process and Public Input
The consultation process followed to prepare the air quality conformity analysis for the 2008 RTIP and 2030 RTP complies with the San Diego Transportation Conformity Procedures adopted in July 1998. In turn, these procedures comply with federal requirements under 40 CFR 93. Interagency consultation involves SANDAG (as the MPO for San Diego County), the APCD, Caltrans, ARB, USDOT, and U.S. EPA.
Consultation is a three-tier process that: 1. formulates and reviews drafts through a conformity working group;
2. provides local agencies and the public with opportunities for input through existing regional advisory committees and workshops; and
3. seeks comments from affected federal and state agencies through participation in the development of draft documents and circulation of supporting materials prior to formal adoption.
SANDAG consulted on the development of the air quality conformity analysis of the 2008 RTIP and 2030 RTP at meetings of the CWG, as follows:
On February 6, 2008, SANDAG staff presented the schedule for the preparation of the 2008 RTIP and its conformity analysis. Staff also presented information on the 2030 Regional Growth Forecast Update and Transportation Control Measures.
On April 2, 2008, SANDAG consulted the CWG on the conformity criteria and procedures to be followed to determine conformity of the 2008 RTIP including: the latest emissions model; emissions budgets and interim emissions analysis; and public involvement and outreach.
On May 7, 2008, SANDAG staff presented information on the Revenue Constrained financial assumptions and stated that the CWG would be receiving the 2008 RTIP exempt projects by email for interagency consultation. Staff distributed the list of exempt projects to the CWG on May 9, 2008. Additional exempt projects were distributed to the CWG on May 13, 2008. Additionally, staff confirmed that a re-determination of conformity would be done for the 2030 RTP, in conjunction with the 2008 RTIP in order to provide consistency with the new eight-hour ozone budgets.
On June 2, 2008, SANDAG released the draft air quality conformity analysis of the 2008 RTIP and 2030 RTP to the San Diego Region CWG for a review-and-comment period. On June 4, 2008, the draft air quality analysis was discussed at the meeting of the San Diego Region CWG, and applicable comments were incorporated in the report.
On June 20, 2008, the draft 2008 RTIP and its conformity determination and the 2030 RTP conformity redetermination were released for public review.

215
On July 18, 2008, a public hearing was held on the draft 2008 RTIP and its conformity determination and the 2030 Regional Transportation Plan: Pathways for the Future conformity re-determination.
The SANDAG Board adopted the 2008 RTIP and its conformity determination and the 2030 RTP conformity re-determination at its July 25, 2008, meeting.
No significant comments were received during the comment period and during the publicly held meetings.

216
[THIS PAGE INTENTIONALLY LEFT BLANK]

CUYAPAIPECUYAPAIPE
MANZANITAMANZANITA
LA POSTA #1LA POSTA #1
CAMPO #1CAMPO #1
CAMPO #3CAMPO #2
LA POSTA #2LA POSTA #2
Eastern San Diego County AttainmentAreas For The 8-Hour Ozone NAAQS
0 0.5 1 1.5 2Miles
ORC0400503.1 March 9, 2004
San Diego County
217


219
Table A.2–Phased Highway Projects – 2030 Regional Transportation Plan Revenue Constrained Plan¹
($ MILLIONS – 2006 DOLLARS) YEAR BUILT
BY FREEWAY FROM TO EXISTING IMPROVEMENT
COST CUMULATIVE
COST
2008 I-5 I-805 SR 56 10F 14F $186 $186
2008 I-15 SR 56 Centre City Parkway 8F 10F + 4ML/MB $427 $613
2008 SR 125 SR 905 San Miguel Road -- 4T $640 $1,253
2008 SR 125 San Miguel Road SR 54 -- 4F $160 $1,413
2010 SR 52 SR 125 SR 67 -- 4F $538 $1,951
2010 SR 75/282 Glorietta Boulevard Alameda Boulevard 6C 6C+2TU (PE only) $20 $1,971
2020 I-5 La Jolla Village Drive I-5/I-805 Merge 8F/14F 8F/14F + 2HOV $160 $2,131
2020 I-5 I-5/I-805 Merge Cannon Road 8F/14F 8F/14F + 4ML $1,440 $3,571
2020 I-5/I-805 North to North & South to South -- HOV Connectors $170 $3,741
2020 I-5/I-805 Port of Entry – Mexico -- Inspection Facility $30 $3,771
2020 SR 11 SR 905 Mexico -- 4T $300 $4,071
2020 I-15 SR 163 SR 56 8F + 2ML (R) 10F + 4ML/MB $414 $4,485
2020 I-15 Centre City Parkway SR 78 8F 8F + 4ML $210 $4,695
2020 SR 52 I-805 SR 125 4F/6F 6F + 2ML (R) $330 $5,025
2020 SR 76 Melrose Drive I-15 2C 4C $500 $5,525
2020 SR 241 Orange County I-5 -- 4T $402 $5,927
2020 I-805 Palomar Street SR 94 8F 8F + 2HOV $584 $6,511
2020 I-805/SR 94 North to West & East to South -- HOV Connectors $95 $6,606
2020 I-805 Carroll Canyon Road I-5 8F 8F + 2HOV $218 $6,824
2020 SR 905 I-805 Mexico -- 6F $595 $7,419

220
Table A.2–Phased Highway Projects - 2030 Regional Transportation Plan Revenue Constrained Plan (cont’d)
($ MILLIONS – 2006 DOLLARS) YEAR BUILT
BY FREEWAY FROM TO EXISTING IMPROVEMENT
COST CUMULATIVE
COST
2020 I-5/SR 56 West to North & South to East -- Freeway Connectors $185 $7,604
2020 I-15/I-805 North to North & South to South -- HOV Connectors $66 $7,670
2020 I-15 SR 94 SR 163 6F/8F 8F + 2HOV $265 $7,935
2020 I-15/SR 94 South to West & East to North -- HOV Connectors $140 $8,075
2020 SR 56 I-5 I-15 4F 6F $53 $8,128
2020 SR 94 I-5 I-805 8F 8F + 2HOV $200 $8,328
2020 SR 94/SR 125 West to North & South to East -- Freeway Connectors $150 $8,478
2020 I-805 SR 52 Carroll Canyon Road 8F 8F + 4ML $203 $8,681
2030 I-5 J Street Sea World Drive 8F Access Improvements $225 $8,906
2030 I-5 I-8 La Jolla Village Drive 8F/10F 8F/10F + 2HOV $200 $9,106
2030 I-5 Cannon Road Vandegrift Boulevard 8F 8F + 4ML $800 $9,906
2030 I-5/SR 78 West to South & South to East -- Freeway Connectors $200 $10,106
2030 SR 125 Telegraph Canyon. San Miguel Road 4T 8T $130 $10,236
2030 SR 125 San Miguel Road SR 54 4F 8F $40 $10,276
2030 SR 241* Orange County I-5 4T 4T/6T $150 $10,426
2030 I-805 Palomar Street SR 94 8F + 2HOV 8F + 4ML $300 $10,726
2030 I-805 SR 94 SR 52 8F 8F + 2HOV $631 $11,357
2030 I-805/SR 52 West to North & South to East -- HOV Connectors $190 $11,547
¹ These projects are included in the 2008, 2010, 2020, and 2030 analysis years for air quality assessment. * SR 241 - 4 toll lanes from I-5 to Cristianitos interchange; 6 toll lanes from Cristianitos Interchange to Orange County line
KEY
C = Conventional Highway Lanes F = Freeway Lanes TU = Tunnel
T = Toll Lanes MB = Movable Barrier
ML = Managed Lanes (HOV & Value Pricing) HOV = High Occupancy Vehicle Lanes ML(R) = Managed Lanes (Reversible)

221
Table A.3–Phased Transit Services - 2030 Regional Transportation Plan Revenue Constrained Plan¹
YEAR ROUTE DESCRIPTION PEAK
HEADWAY (MINUTES)
OFF-PEAK HEADWAY (MINUTES)
2010 634 UCSD/UTC Super Loop 10 15
2010 350 Escondido Rapid Bus 10 10
2020 510 Increase in Blue Line Service (current headways 7½/15) 7.5 10
2020 610 Escondido to Downtown San Diego via I-15/SR 94* 15 30
2020 470 Escondido to Sorrento Mesa via Mira Mesa Blvd. (and via Carroll Canyon after 2020) 10 --
2020 611 Mid-City Rapid Bus – SDSU to Downtown San Diego via El Cajon Boulevard and Park Boulevard
10 10
2020 680 Otay Mesa to Sorrento Mesa via I-805/I-15/SR 52 10 --
2020 628 Otay Mesa to Downtown San Diego via I-805/SR 94 10 30
2020 398 Increase in COASTER Service (current headways 36/120)** 20 60
2020 399 Increase in SPRINTER Rail (opening headways 30/30) 15 30
2020 570 Mid-Coast Trolley 15 15
2030 510 Increase in Blue Line Trolley Service 7.5 7.5
2030 520 Increase in Orange Line Trolley Service (current headways 15/15) 7.5 15
2030 530 Increase in Green Line Trolley Service (current headways 15/15) 7.5 15
2030 610 Increase in Escondido to Downtown San Diego via I-15/SR 94* 10 15
2030 470 Increase in Escondido to Sorrento Mesa via Carroll Canyon Road 10 15
2030 628 Increase in Otay Mesa to Downtown San Diego via I-805/SR 94 10 15
2030 680 Increase in Otay Mesa to Sorrento Mesa via I-805/I-15/SR 52 10 15
2030 399 Increase in SPRINTER Rail 15 15
¹ These projects are included in the 2008, 2010, 2020, and 2030 analysis years for air quality assessment.
* I-15 BRT services includes all-day core service (Route 610) and peak period express services (Routes 607 and 608)
** Average headways

222
Table A.5–Phased Arterial Projects - 2030 Regional Transportation Plan Revenue Constrained Plan¹
CONFORMITY ANALYSIS YEAR SANDAG ID LEAD AGENCY PROJECT TITLE PROJECT DESCRIPTION
2008 CNTY08 County of San Diego Mission Road Pepper Tree Lane to Clemmens Lane in Fallbrook - widen from three to five lanes
2008 CNTY23 County of San Diego Valley Center Road (Wohlford Intersection)
East of Valley Center & Cole Grade Road and extending approximately six miles to Rincon Casino - widen from two to three lanes; construct traffic signal at North Lake Wohlford Road/Valley Center Road intersection
2008 ESC25 Escondido Citracado/Nordahl Country Club to State Route 78 – widen from four to six lanes with double left turn lanes and exclusive right turn lanes
2008 SNT02 Santee Forester Creek Channelization
Forester Creek Channelization - construct Olive Lane & Mission Gorge Road bridges over flood control channel
2010 CB04 Carlsbad El Camino Real Improvements
SR 78 and Olivenhain Road - widen and improve to six lane arterial including traffic signal upgrades, bike lanes, and sidewalks
2010 CB12 Carlsbad College Boulevard Reach A Badger Lane to future Cannon Road - construct four lane arterial with median, bike lanes, and sidewalks/trails
2010 CB13 Carlsbad Poinsettia Lane Reach E Cassia Drive to Skimmer Court - construct 4-lane arterial with median, bike lanes, and sidewalks/trails (DEMO ID: CA366 HPP No: 517)
2010 CNTY17 County of San Diego SR 54/SR 94 Ph 1: widen from four to six lanes with intersection improvements, raised median and left turn pockets; Ph 2: on SR 94 extend Jamacha Blvd; Ph 3: on SR 54 extend from Cuyamaca College east to Braham
2010 CNTY19 County of San Diego Valley Center North & South City of Escondido to Cole Grade Road - widen and reconstruct with 14-ft striped center 2-way lane, bike lanes and pathways
2010 ESC03 Escondido Citracado Parkway Don Lee Lane to Vineyard Avenue - widen from two to four lanes with left turn pockets and new traffic signal at Aero Way and Citracado Parkway
2010 ESC05 Escondido El Norte Parkway, Phase IV La Honda Drive at Citrus/Mission Avenue & at E Washington Avenue - widen from two to four lanes and construct missing section of El Norte Pkwy with left turn pockets, raised medians and new traffic signals at Lincoln Ave, Citrus/Mission Ave and E Washington Ave

223
Table A.5–Phased Arterial Projects - 2030 Regional Transportation Plan Revenue Constrained Plan¹ – (cont’d)
CONFORMITY ANALYSIS YEAR SANDAG ID LEAD AGENCY PROJECT TITLE PROJECT DESCRIPTION
2010 ESC24 Escondido Centre City Parkway SR 78 to Mission Avenue - widen from four to six lanes with intersection improvements on Mission Avenue
2010 NC01 National City Plaza Blvd Widening Highland Ave to Euclid Ave - widen from two to three lanes
2010 N/A Poway Espola Road Twin Peaks Road and Titan Way - future widening from two to four lanes
2010 SM09 San Marcos South Santa Fe Road Rancho Santa Fe Road to Bosstick Boulevard - construct new four lane arterial with raised median, curb and gutter, sidewalk, utility undergrounding, and traffic signal system (CIP-011)
2010 SM22 San Marcos South Santa Fe from Bosstick to Smilax
Widen and realign existing road to four secondary arterial standards
2010 SM23 San Marcos Barham Drive Widening Woodland Pkwy to Opper Street - widen Barham Drive to secondary arterial standards
2010 SM28 San Marcos Twin Oaks Valley Road Street Widening and Improvements
San Marcos Blvd to Borden Rd - future widening from two lanes to four lanes including sidewalk and landscaping
2010 VISTA08 Vista West Vista Way Widening Melrose Drive west to Thunder Drive - realign W. Vista Way including providing preliminary improvement plans, final right-of-way maps, and a metes and bounds legal description anticipated to provide congestion relief by widening W. Vista Way from two to four lanes
2020 CB11 Carlsbad Cannon Road Reach 4 College Blvd. to boundary with Oceanside - construct four lane arterial with median, bike lanes, sidewalks, and pedestrian trails
2020 CHV08 Chula Vista Willow Street Bridge Project Bonita to Sweetwater - replace and widen from two to four lanes including bicycle lanes
2020 CNTY14 County of San Diego South Santa Fe Avenue Vista City limits to 700 feet south of Woodland - reconstruct and widen from two to four lanes including bicycle lane
2020 CNTY14A County of San Diego South Santa Fe Avenue South Future widening of South Santa Fe Ave. from 700 feet south of Woodland Dr./South Santa Fe intersection to San Marcos city limits at Similax Road

224
Table A.5–Phased Arterial Projects - 2030 Regional Transportation Plan Revenue Constrained Plan¹ – (cont’d)
CONFORMITY ANALYSIS YEAR SANDAG ID LEAD AGENCY PROJECT TITLE PROJECT DESCRIPTION
2020 CNTY21 County of San Diego Bradley Avenue Overpass at SR 67
Magnolia Ave to Mollison Ave - future widening of Bradley Ave overpass from two to four lanes
2020 CNTY24 County of San Diego Cole Grade Road Future widening of Cole Grade Road from north of Horse Creek Trail to south of Pauma Heights Road to accommodate 14-ft traffic lane in both direction, 12-ft center 2-way left turn, 6-ft bike lane and 10-ft pathway
2020 CNTY39 County of San Diego Bear Valley Parkway North Bear Valley Parkway from San Pasqual Valley Road to Boyle Avenue - future widening
2020 EL10 El Cajon Jamacha Road East Main Street to south of City limit - future widening of Jamacha Road from four to six lanes
2020 ESC02A Escondido East Valley/Valley Center East Valley Pkwy to Valley Center Dr - widen roadway from four to six lanes with raised medians and left turn pockets; New Eureka Ranch Street and E. Valley Pkwy - modify signal at Lake Wohlford and Valley Center Road; widen bridge over Escondido Creek (DEMO ID: CA332; HPP No: 260)
2020 ESC04 Escondido Citracado Parkway II West Valley Pkwy to Harmony Grove Road - widen from two to four lanes with raised medians, construct bridge over Escondido Creek
2020 SD11 San Diego City Regents Road Bridge Bridge spanning the AT&SF railroad and a portion of the Rose Canyon floodplain connecting the existing Regents Rd on both sides of the canyon - future widening Regents Rd from 100' north of Lahitte Ct to Governor and from 100' north of Lahitte Ct to the south abutment of the bridge including four lane with sidewalks and class II bike lanes (CIP 53-044.0)
2020 SD34 San Diego City El Camino Real San Dieguito Road to Via de la Valle - reconstruct and widen from two to four lanes and extend transition lane and additional grading to avoid biological impacts (CIP 52-479)
2020 SD70 San Diego City W. Mission Bay Bridge Over San Diego River - replace from four to six lane bridge with class II bike lane (52-643)
2020 SD81 San Diego City Genesee Avenue - Nobel Drive to SR 52
Nobel Drive to SR 52 - future widening to six lane major street north of Decoro Street and to a six lane primary arterial south of Decoro Street (CIP 52-458.0)

225
Table A.5–Phased Arterial Projects - 2030 Regional Transportation Plan Revenue Constrained Plan¹ – (cont’d)
CONFORMITY ANALYSIS YEAR SANDAG ID LEAD AGENCY PROJECT TITLE PROJECT DESCRIPTION
2020 SD83 San Diego City SR 163 and Friars Road Future construction new southbound SR 163 to westbound Friars Road off-ramp - PE only (CIP 52-455)
2020 SD90 San Diego City SR 163/Clairemont Blvd. Interchange
Kearny Mesa to Kearny Villa Road - widen from four to six lane prime arterial (CIP 52-745.0)
2020 SD103 San Diego City I-5/Genesse Ave Interchange In San Diego, replace Genesee Ave overcrossing from four lane bridge with six lane bridge; between Sorrento Valley Road and La Jolla Village Drive - construct auxiliary lanes and replace Voight Drive bridge (DEMO ID: CA639; HPP No: 3086)
2020 SD113 San Diego City I-5/Sorrento Valley Road On I-5 at Sorrento Valley - future new freeway access interchange including ramp
2020 SD115 San Diego City La Jolla Village Drive/I-805 Interchange Ramps
I-805 at La Jolla Village Drive - reconfigure interchange and add 220 meters of acceleration lane (524850)
2020 SM10 San Marcos SR 78/Smilax Interchange Improvements
Construct new interchange at Smilax Road and SR 78
2020 SM24 San Marcos Woodland Parkway Interchange Improvements
Modify existing ramps at Woodland Parkway and Barham Drive between Hill Drive and Rancheros Drive; future widening and realignment of SR 78 overcrossing and associated work
2020 SM30 San Marcos San Marcos Boulevard Street Improvements
San Marcos Boulevard: Between Rancho Santa Fe Road to Bent Avenue; widen road to a six lane prime arterial
1 These projects are included in the 2008, 2010, 2020, and 2030 analysis years for air quality assessment

226

Appendix D
EXPEDITED PROJECT SELECTION PROCESS


229
APPENDIX D
EXPEDITED PROJECT SELECTION PROCESS
Federal Regulations 23 Code of Federal Regulations (CFR) Part 450 and Title 23 of the United States Code (USC) allow for the movement of projects within the quadrennial element of the Federal Transportation Improvement Program (FTIP) subject to procedures agreed to by the cooperating parties. SANDAG as the Metropolitan Planning Agency (MPO) for the San Diego region has in place a formal project selection process agreed to by all of the region’s partners including the two transit districts. SANDAG developed the project selection process through numerous consultations and cooperation of our region’s partners – Caltrans, North County Transit District, Metropolitan Transit System, and local agencies. The SANDAG Board formally adopted the process and criteria as part of the Regional Transportation Plan (RTP) in November 2008. The projects included in the 2008 RTIP reflect the projects prioritized in the RTP via the project selection process. Projects in the quadrennial element are either already in construction or identified as ready to deliver. For projects within the State Transportation Improvement Program (STIP), SANDAG would advance projects subject to amendments approved by the California Transportation Commission. For projects in which the state acts as the program manager the decision for priority lies with the state. These programs include the State Highway Operation Protection Program (SHOPP), the Highway Bridge Program (HBP), Section 130 Rail program, Safe Routes to School (SRTS), High Risk Rural Road Program (HR3), and Highway Safety Improvement Program (HSIP).

230
TECHNICAL APPENDIX 7 TRANSPORTATION EVALUATION CRITERIA AND RANKINGS
This technical appendix describes the process for developing evaluation criteria for prioritizing highway, high occupancy vehicle (HOV) connectors, freeway connectors, and transit projects included in the 2030 San Diego Regional Transportation Plan: Pathways for the Future (RTP). This appendix also includes information on the creation of criteria to prioritize regional rail grade separation, regional ranking criteria for transit capital replacement and rehabilitation projects, and screening criteria for the regional arterial system. Criteria were also developed to evaluate Goods Movement Action Plan projects and are included in RTP Appendix B.
TRANSPORTATION PROJECT EVALUATION CRITERIA
SANDAG utilized criteria for evaluating and ranking highway, transit, freeway connector and high occupancy vehicle (HOV) connectors in the previous RTP, MOBILITY 2030. In order to review and update the criteria for use in the 2030 RTP, the Transportation Committee approved the formation of the Transportation Project Evaluation Criteria Ad Hoc Working Group (TPEC) at its December 9, 2005, meeting. Regional arterials were not included in the updated ranking criteria since it was not anticipated that regional dollars would be distributed as part of the 2030 RTP.
The TPEC was composed of representatives from a number of standing SANDAG working groups, including the Bicycle-Pedestrian Working Group (BPWG), Cities/County Transportation Advisory Committee (CTAC), Regional Freight Working Group (FWG), Regional Housing Working Group (RHWG), Regional Planning Stakeholders Working Group (SWG), Regional Planning Technical Working Group (TWG), as well as staff from Caltrans, MTS, and NCTD. The TPEC met on a regular basis beginning in January 2006 and created updated evaluation criteria for regional transit service, highway, freeway connector, and HOV connector projects.
The revisions to the RTP criteria were intended to support the vision of the Regional Comprehensive Plan (RCP) and address the updated goals of the 2030 RTP. Where appropriate, efforts also were taken to simplify and standardize the criteria across different modal categories. The revised criteria are structured with a standard 100-point scoring system.
The TPEC organized the updated criteria into three criteria major categories: serves travel needs, develops network integration, and cost-effectiveness; and determined that each of these three categories should receive roughly one third of the total points. The serves travel needs category contains criteria that focus on the movement of people and goods and awards points for projects that serve peak-period trips, goods movement, or congested corridors. The network integration criteria give credit for projects that provide connectivity between surrounding land uses and the transportation network. Criteria in this category include measures such as serving RCP Smart Growth Areas, incorporation of transit and/or Managed or HOV lanes, and minimizing negative residential and environmental impacts. The cost-effectiveness criteria provide for a comprehensive assessment of the annual capital, operation, and maintenance costs of the project in relation to the number of people moved or person hours saved.
The same three criteria categories are used for transit services, highway, freeway connector, and HOV connector criteria, with variations in the individual criteria. TPEC felt that each of the three major categories should receive about one-third of the total points. Within each of the three categories weighting for each of

231
the individual criteria also was determined. The full individual criteria descriptions, weighting, and score details are listed in Tables TA 7.1 to TA 7.15.
HIGHWAY CORRIDOR EVALUATION
SANDAG has used criteria for evaluating and ranking highway corridor projects since 1997. Using the MOBILITY 2030 criteria as a basis the TPEC created a set of revised highway corridor evaluation criteria which reflect SANDAG Board-adopted principles on smart growth and the Regional Transit Vision.
The ten highway evaluation criteria presented in Tables TA 7.1 and TA 7.2 quantify project traffic usage, travel time savings, cost, critical linkages, safety, goods movement, employment, smart growth, carpool lane integration, transit integration, habitat preservation, and residential impacts. SANDAG staff has worked with Caltrans, MTS, NCTD, the TPEC members and their respective working groups to revise and update the criteria. Table TA 7.3 describes the highway evaluation criteria weighting.
The highway network corridor evaluation has been used to develop the Reasonably Expected Revenue Network and Revenue Constrained Network alternatives and project phasing included in the 2030 RTP. The entire 52 unconstrained highway corridors originally evaluated for the 2030 RTP are listed in priority order in Table TA 7.4.
The prioritized list of highway projects is used as a tool in assembling logical networks of highway projects that complement transit and arterial projects. Priority order is not necessarily strictly followed. Rather, emphasis is placed upon developing meaningful networks in accordance with the 2030 RTP goals and objectives.

232
Table TA 7.1—Summary of Highway Project Evaluation Criteria
GOAL CRITERIA DESCRIPTION
Located in a High Crash Rate Area Is the project located in an area with a high vehicular
crash rate?
Serves Goods Movement Does the project provide for goods movement?
Serves Peak-Period Trips * What is the number of peak-period trips located within
one mile of the highway corridor?
Provides Mobility * What is the increase in person capacity resulting from
the project?
SERVES
TRAVEL
NEEDS
Provides Congestion Relief * What is the number of daily person-hours saved?
Serves RCP Smart Growth Areas Does the project serve RCP Smart Growth Areas?
Facilitates Carpool and Transit Mobility Does the project contain carpool/managed lane facilities
and/or regional or corridor transit service?
Minimizes Habitat and Residential Impacts Does the project minimize negative habitat and
residential impacts?
DEVELOPS
NETWORK
INTEGRATION
Critical Linkage Is the project located in a high volume freeway corridor and/or lacking a continuous parallel arterial listed in the Regional Arterial System or completes a missing link?
COST-
EFFECTIVENESS
Cost-Effectiveness * What is the annual capital and operating project cost divided by person hours saved?

233
Table TA 7.2—Highway Corridor Evaluation Criteria
CRITERIA DESCRIPTION
1. Located in a High Crash Rate Area
Is the project located in an area with a high vehicular crash rate? Score Description
5 Greater than 160 percent of the 3-year average statewide crash rate for a similar facility (i.e. 60% over the statewide average)
4 Greater than 150% “ “ 3 Greater than 140% “ “ 2 Greater than 130% “ “ 1 Greater than 120% “ “
Analysis based on accident data provided by Caltrans.
2. Serves Goods Movement Does the project provide for goods movement?
A) Is the highway a major freight corridor as measured by truck AADT%
2 >7%
1 4%-7%
0 less than 3%
B) Is the highway part of a designated trade corridor as defined in the Regional Truck Network- as part of the RTP Freight Strategy?
2 Yes
0 No
C) Does the highway serve a major freight center (within one mile of the corridor) such as a Port, International Airport, Port of Entry, Rail Intermodal/Transload Facility or Industrial Cluster/Distribution Center?
1 Yes
0 No
3. Serves Peak-Period Trips* What is the number of peak-period trips located within one mile of the highway corridor?
Calculated as all peak-period origin and destinations within one mile of the highway corridor. Score Description
5 - 1 Number of peak-period trips per mile
4. Provides Mobility* What is the increase in person capacity resulting from the project?
Calculated as change in person miles traveled divided by project length (miles). Score Description
10 - 1 Change in persons per lane mile

234
Table TA 7.2—Highway Corridor Evaluation Criteria (cont’d)
CRITERIA DESCRIPTION
5. Provides Congestion Relief *
What is the number of daily person-hours saved?
This criterion accounts for both current (2006) and 2030 congestion relief.
Total daily travel time is computed for a baseline condition that includes all current (2006) fully funded and/or environmentally cleared projects. Travel time is again computed by adding each project, one by one, to the baseline condition. The resulting travel time is then compared to the baseline travel time. The difference is the travel time savings that can be attributed to each project. Higher ranking projects have the largest number of person-hours saved.
To incorporate existing congestion the 2006 Congestions Mitigation Map was utilized to determine the level of service (LOS) on the existing network. The LOS were grouped into categories of F, E-D, and C-A. The 2030 hours were then divided by a factor assigned to these three groups. F = 1, E-D = 1.5 and C-A = 2. Score Description
15 -1 Number of person hours saved (per lane mile)
6. Serves RCP Smart Growth Centers
Does the highway corridor serve existing/planned and/or potential RCP Smart Growth areas?
Highway Corridors shall receive points for each place type they serve. Score Description
5 Serves existing/planned Metropolitan Center or Urban Center 3 Serves existing/planned Special Use Center 1 Serves potential Urban Center or Special Use Center
Scores are based on the total number of these points*
5 More than 7 points 4 6 to 7 points 3 5 points 2 3 to 4 points 1 1 to 2 points
7. Facilitates Carpool and Transit Mobility
Does the project contain carpool/managed lane facilities and/or regional or corridor transit service? Score Description
5 Includes carpool/managed lane facility and Regional or Corridor transit services identified in the Regionally Significant Transportation Network
3 Includes carpool facility/managed lane or Regional or Corridor transit services identified in the Regionally Significant Transportation Network.

235
Table TA 7.2—Highway Corridor Evaluation Criteria (cont’d)
CRITERIA DESCRIPTION
8. Minimizes Habitat and Residential Impacts
Does the project minimize negative habitat and residential impacts?
Projects receive points for each of the descriptions they satisfy Points Description
2 Avoids preserve areas as defined by habitat preserve plans 1 Avoids natural areas as defined by habitat preserve plans 2 Avoids existing residential development
(defined as existing housing stock within 500-feet of the highway right of way is less than two dwelling-units per acre- this does not imply a taking and is used only as a measure of proximity)
9. Critical Linkage Is the project located in a high volume freeway corridor and/or lacking a continuous parallel arterial or completes a missing link? Score Description
5 High volume freeway corridor and lacking a continuous parallel arterial listed in the Regional Arterial System (High volume is defined as greater than 250,000 ADT using the 2030 Smart Growth forecast)
3 Completes a missing regional link 1 High volume freeway corridor or lacking a continuous parallel arterial
listed in the Regional Arterial System
10. Cost-Effectiveness* What is the annual capital and operating project cost per project mile divided by person hours saved?
Calculated as: [((Capital project cost/project life) +(operating & maintenance costs))/project mile)] / Project life] / annual weekday person hours saved
Higher ranking projects have a lower cost per person hour saved. Score Description
30 - 1 Cost per person hour saved per lane mile
* Criterion denoted with an asterisk were calculated using a relative score quantitative method where the top scoring project received the full number of points for that criterion and the subsequent projects received points relative to the top project score.

236
Table TA 7.3—Highway Corridor Evaluation Criteria Weighting
CRITERIA CATEGORY
RTP GOALS CRITERIA DESCRIPTION MAX
SCORE TOTAL
PERCENT
Reliability Located in a High Accident Rate Area
Is the project located in an area with a high vehicular crash rate?
5
Mobility Serves Goods Movement
Does the project provide for goods movement? 10
Accessibility, Mobility,
Environmental Sustainability
Serves Peak-Period Trips
What is the number of peak-period trips located within one mile of the highway corridor?
5
Mobility Provides Mobility What is the increase in person capacity resulting from the project?
10
SERVES TRAVEL NEEDS
Livability, Mobility
Provides Congestion Relief
What is the number of daily person-hours saved? 15
45
Livability, Accessibility
Serves RCP Smart Growth Areas
Does the project serve RCP Smart Growth Areas?
5
Accessibility, Efficiency
Facilitates Carpool and Transit Mobility
Does the project contain carpool/managed lane facilities and/or regional or corridor transit service?
10
Environmental Sustainability
Minimizes Habitat and Residential Impacts
Does the project minimize negative habitat and residential impacts?
5
DEVELOPS NETWORK INTEGRATION
Reliability, Mobility Critical Linkage
Is the project located in a high volume freeway corridor and/or lacking a continuous parallel arterial listed in the Regional Arterial System or completes a missing link?
5
25
COST- EFFECTIVENESS Efficiency Cost-Effectiveness
What is the annual capital and operating project cost divided by person hours saved?
30 30

237
[THIS PAGE INTENTIONALLY LEFT BLANK]

238
Table TA 7.4—Highway Corridor Evaluation Ranking
Initial Phase in RC
TransNet, EAP & Toll
No.Cost
(millions)Freeway From To Existing Improvements
YES TransNet 1 $450 I-5 I-8 La Jolla Village Dr 8F 10F + 2HOV
- TransNet 2 $350 I-5 SR 54 I-15 8F 10F+2HOV
YES EAP (Env) 3 $1,290 I-5 SR 56 Palomar Airport Rd 8F/10F 10F+4ML
- TransNet 4 $202 I-5 SR 905 SR 54 8F 8F + 2HOV
YES EAP (Env) 5 $2,410 I-805 H St I-8 8F/10F 10F+4ML
YES EAP (Env) 6 $579 I-805 I-8 SR 52 8F/10F 8F + 4ML
- - 7 $160 SR 125 SR 94 I-8 8F 10F+2HOV
- Toll 8 $2,060 I-15 SR 78 Riverside Co 8F 8F+4ML
YES EAP 9 $500 SR 52 I-15 SR 125 4F/6F 6F + 3ML-Rev
- TransNet 10 $870 I-5 I-15 I-8 8F 8F+2HOV
YES EAP (Env) 11 $610 I-805 Mission Valley Viaduct 8F 8F + 4ML
- - 12 $210 SR 52 I-5 I-805 4F 6F+2HOV
YES EAP (Env) 13 $291 I-5 La Jolla Village Dr SR 56 8F/14F 8F/14F + 4ML
YES EAP (Env) 14 $202 I-805 La Jolla Village Dr I-5 8F 8F + 4ML
- - 15 $184 I-8 SR 125 SR 67 8F 8F + 2HOV
YES EAP (Env) 16 $290 I-805 SR 52 La Jolla Village Dr 8F 10F+4ML
- TransNet 17 $400 SR 67 Mapleview St Dye Rd 2C/4C 4C
YES EAP (Env) 18 $532 I-805 SR 905 H St 8F 8F+4ML
- TransNet 19 $650 SR 78 I-5 I-15 6F 6F + 2HOV
YES EAP (Env) 20 $1,200 I-5 Palomar Airport Rd SR 76 8F 10F+4ML
YES EAP (Transit) 21 $200 SR 94 I-5 I-805 8F 8F+2HOV
- - 22 $48 I-8 SR 67 2nd Street 6F 6F + 2HOV
YES EAP (Transit) 23 $290 SR 52 I-805 I-15 6F 8F + 2HOV
YES Toll 24 $40 SR 125 San Miguel Rd. SR 54 4F 8F
- TransNet 25 $128 SR 54 I-5 SR 125 6F 8F+2HOV
YES EAP (Transit) 26 $580 I-15 I-5 SR 163 6F/9F 8F+2HOV
- - 27 $1,330 I-8 I-5 I-15 8F 8F+2HOV
- TransNet 28 $520 SR 94 I-805 College Ave 8F/10F 10F+2HOV
- - 29 $980 I-8 College Ave SR 125 8F 8F+2HOV
- - 30 $1,080 I-8 I-15 College Ave 10F 10F+2HOV
- - 31 $50 SR 52 SR 125 SR 67 4F 6F
- TransNet 32 $260 SR 94 College Ave SR 125 8F 8F + 2HOV
- - 33 $200 SR 163 I-805 I-15 8F 8F+2HOV
- - 34 $270 SR 125 I-8 SR 52 8F 8F+2HOV
YES EAP 35 $260 SR 76 Melrose Drive Mission Rd 2C 6C
YES EAP 36 $140 SR 76 Mission Rd I-15 2C 4C
- TransNet (GP Lanes) 37 $190 I-8 2nd Street Los Coches 4F 6F + 2HOV
- - 38 $270 SR 905 I-5 Mexico 4F/6F 8F
- TransNet 39 $170 SR 125 SR 54 SR 94 6F 8F+2HOV
- - 40 $160 SR 76 I-5 Melrose Drive 4E 6E
YES Toll 41 $300 SR 11 SR 905 Mexico --- 4T
- - 42 $143 I-8 Los Coches Dunbar Rd. 4F/6F 6F
- - 43 $130 SR 67 I-8 Mapleview St 4F/6F 8F/6F
- Toll 44 $810 I-5 SR 76 Orange Co 8F 8F + 4ML
YES (PE only) TransNet 45 $460 SR 75/SR 282 Glorietta Blvd. Alameda Blvd. 6C 6C + 4TU
- TransNet 46 $290 SR 56 I-5 I-15 4F/5F 6F + 2HOV
- TransNet 47 $260 SR 94 SR 125 Avocado Blvd 4F 6F+2HOV
- TransNet 48 $210 SR 94 Jamacha Rd Otay Lakes Rd 2C 4C
- TransNet (4 lanes) 49 $30 SR 94 Avocado Blvd Jamacha Rd 4C 6C
- - 50 $457 SR 54 SR 125 SR 94 --- 6E
- - 51 $200 SR 76 I-15 Pala Mission Rd 2C 4C/6C
- - 52 $980 SR 76 Pala Mission Rd La Jolla Indian Res 2C 4C

239
(continued)
Cost-Effectiveness
[1] Serves Goods Movement 10 %
[2] Serves Peak Period Trips 5%
[3] Provides Mobility 10%
[4] Provides Current and Future Congestion Relief 15%
[5] High Vehicular Crash Rate 5%
[6] Serves RCP Smart Growth Areas 5%
[7] Facilitates Carpool and Transit 10%
[8] Minimizes Habitat and Residential Impacts 5%
[9] Critical Linkage 5%
[10] Cost-Effectiveness 30%
Weighted Score 100%
Original Weighting Rank (1-52)
Project Rank (1-52)
2 1.11 7.52 12.64 0 5 10 0 5 30.00 73.27 1 1
2 1.78 7.44 15.00 0 3 10 0 0 16.63 55.84 5 2
8 0.54 6.28 9.33 0 1 10 0 5 13.93 54.08 8 3
2 1.30 7.59 9.47 0 3 10 0 1 19.67 54.04 6 4
8 1.59 6.75 11.00 0 3 10 0 5 8.25 53.59 3 5
8 1.94 6.59 9.31 0 4 10 0 1 12.50 53.34 1 6
6 1.44 5.60 5.34 0 3 10 2 0 19.45 52.83 6 7
10 0.27 4.87 10.38 0 0 10 2 1 14.24 52.77 3 8
6 0.34 6.71 12.16 0 0 10 0 1 15.99 52.21 15 9
4 2.75 9.35 10.60 0 5 10 3 0 6.37 51.07 9 10
6 5.00 6.47 11.63 0 3 10 0 5 1.81 48.92 24 11
2 0.90 4.16 11.12 0 0 6 0 1 23.58 48.75 21 12
6 1.46 5.77 7.47 0 4 10 0 0 12.07 46.76 12 13
10 1.71 5.07 6.15 0 3 6 2 1 11.08 46.01 12 14
10 2.05 10.00 4.76 0 3 6 3 0 5.82 44.63 18 15
8 1.50 6.48 6.15 0 3 10 0 1 8.08 44.21 14 16
4 0.27 3.56 12.14 3 0 0 2 0 19.20 44.16 28 17
8 1.03 5.80 7.33 0 0 10 0 1 9.91 43.07 9 18
4 1.14 7.29 6.79 0 5 6 0 0 11.56 41.78 11 19
8 1.15 5.50 8.43 0 0 6 0 1 11.08 41.16 21 20
6 3.82 9.42 3.75 0 3 10 2 0 2.75 40.74 28 21
10 3.86 7.56 3.17 0 0 6 3 0 6.66 40.25 18 22
2 1.29 5.64 7.41 0 0 10 2 0 11.24 39.58 16 23
8 0.59 2.86 1.20 0 0 6 2 1 17.17 38.82 27 24
6 1.11 4.28 3.84 0 3 6 0 0 14.17 38.40 17 25
6 1.18 6.56 5.14 0 0 10 0 0 8.83 37.70 23 26
0 2.31 8.75 10.06 0 5 6 2 0 3.41 37.53 24 27
4 1.64 7.38 7.79 0 0 10 0 0 6.33 37.13 20 28
2 2.52 8.60 9.39 0 5 6 0 0 2.47 35.98 34 29
0 1.62 7.77 10.06 0 2 6 2 1 3.29 33.73 34 30
6 1.47 5.48 3.88 0 0 0 2 0 12.56 31.39 33 31
4 1.23 8.01 5.19 0 0 10 0 0 2.70 31.13 34 32
4 1.29 7.78 3.50 0 1 6 2 0 4.39 29.95 28 33
8 1.35 4.52 0.59 0 4 10 0 0 1.18 29.65 41 34
4 0.56 3.35 5.96 0 0 0 0 1 14.74 29.61 31 35
4 0.48 3.87 4.64 3 0 0 2 1 10.04 29.03 24 36
6 1.47 4.96 3.17 0 0 6 0 1 5.22 27.82 39 37
10 0.69 2.09 2.50 0 0 6 0 0 6.13 27.42 43 38
6 0.99 5.17 1.16 0 0 10 0 0 3.42 26.73 34 39
4 1.58 2.99 4.28 0 0 0 0 0 13.87 26.71 31 40
10 0.51 2.94 3.18 0 0 0 2 3 4.05 25.68 45 41
8 0.28 4.53 2.60 0 0 0 2 0 6.84 24.24 39 42
6 1.34 4.63 2.65 0 0 0 0 0 7.92 22.53 41 43
8 0.08 4.52 0.60 0 0 6 0 1 1.75 21.96 48 44
0 2.17 2.15 8.09 3 0 0 3 0 3.33 21.74 44 45
4 0.62 4.47 1.13 0 0 6 0 0 4.64 20.86 38 46
4 1.07 4.19 0.29 0 0 6 3 1 0.33 19.88 47 47
4 0.24 1.88 1.50 3 0 0 2 1 4.35 17.98 51 48
2 2.25 3.53 1.50 3 0 0 0 1 4.24 17.52 50 49
4 1.36 1.77 3.08 0 0 0 0 0 6.23 16.43 46 50
4 0.26 2.19 0.69 2 0 0 2 1 2.20 14.33 49 51
4 0.11 1.67 0.61 1 0 0 2 1 0.40 10.79 52 52
Serves Travel Needs Develops Network Integration

240
High Occupancy Vehicle (HOV) Connectors
HOV connectors will facilitate direct HOV to HOV access and allow for continuous movement on the HOV network from freeway to freeway. In MOBILITY 2030, HOV connectors were prioritized based on average daily traffic data. For the 2030 RTP, the criteria were revised to evaluate traffic levels of the connector and the overall interchange, transit integration, habitat and residential impacts, and cost effectiveness. The HOV connector criteria and weighting are shown in Tables TA 7.5 through 7.7. The HOV Connectors are ranked by pair and shown in Table TA 7.8. A total of six HOV connectors are included in the Reasonably Expected Revenue Scenario and five are included in the Revenue Constrained Scenario.
Table TA 7.5—HOV Project Evaluation Criteria Summary
GOAL CRITERIA DESCRIPTION
Serves High Demand What is the 2030 Person Average Daily Traffic on the HOV connections?
SERVES
TRAVEL
NEEDS Serves Congested Corridors What is the 2030 Average Daily Traffic for the overall interchange?
Serves Regional and/or Corridor Transit
Routes
Does the project serve regional and/or corridor transit?
DEVELOPS
NETWORK
INTEGRATION Minimizes Habitat and Residential Impacts Does the project minimize negative habitat and
residential impacts?
COST-
EFFECTIVENESS
Cost-Effectiveness What is the annual capital and operating project cost divided by Person Average Daily Traffic?

241
Table TA 7.6—HOV Connector Criteria
CRITERIA DESCRIPTION
1. Serves High Demand What is the 2030 Person Average Daily Traffic (PADT) on the HOV connections? Score Description
5 More than 45,000 PADT (pair) 4 30,000 to 45,000 PADT (pair) 3 20,000 to 29,999 PADT (pair) 2 10,000 to 19,999 PADT (pair) 1 Less than 10,000 PADT (pair)
2. Serves Congested Corridors
What is the 2030 Average Daily Traffic (ADT) for the overall interchange? Score Description
5 Over 450,000 ADT 4 400,000 to 450,000 ADT 3 375,000 to 399,999 ADT 2 300,000 to 374,999 ADT 1 Under 300,000 ADT
3. Serves Regional and/or Corridor Transit Routes
Does the project serve regional and/or corridor transit? Score Description
5 Serves Regional or Corridor transit services identified in the Regionally Significant Transportation Network
0 Does not serve the Regional or Corridor transit services identified in the Regionally Significant Transportation Network
4. Minimizes Habitat and Residential Impacts
Does the project minimize negative habitat and residential impacts?
Projects receive points for each of the descriptions they satisfy. Points Description
2 Avoids preserve areas as defined by habitat preserve plans 1 Avoids natural areas as defined by habitat preserve plans 2 Avoids existing residential development (defined as existing housing stock
within 500-feet of the highway right-of-way that is less than two dwelling-units per acre- this does not imply a taking and is used only as a measure of proximity).
242
Table TA 7.6—HOV Connector Criteria (cont’d)
CRITERIA DESCRIPTION
5. Cost-Effectiveness What is the annual capital and operating project cost divided by Person Average Daily Traffic (by pair)
Calculated as:
[(Capital project cost/project life) + (annual operating & maintenance costs)] / Annual Weekday Person Average Daily Traffic?
Higher ranking projects have a lower cost per Annual Person Average Daily Traffic (PADT). Score Description
5 Less than $0.30 per PADT 4 $0.30 to $0.49 per PADT 3 $0.50 to $0.99 per PADT 2 $1.00 to $1.25 per PADT 1 Over $1.25 per PADT
Table TA 7.7—HOV Connector Evaluation Criteria Weighting
CRITERIA GOAL RTP GOALS CRITERIA DESCRIPTION
MAX SCORE
PERCENT NEW
Mobility, Reliability
Serves High Demand
What is the 2030 Person Average Daily Traffic on the HOV connections?
20 SERVES TRAVEL NEEDS
Mobility Serves Congested Corridors
What is the 2030 Average Daily Traffic for the overall interchange?
20
40
Livability, Accessibility,
Mobility
Serves Regional and/or Corridor Transit Routes
Does the project serve regional and/or corridor transit routes? 20
DEVELOPS NETWORK INTEGRATION
Environmental Sustainability
Minimizes Habitat and Residential Impacts
Does the project minimize negative habitat and residential impacts?
10
30
COST-EFFECTIVENESS Efficiency,
Mobility Cost-Effectiveness
What is the annual capital and operating project cost divided by Person average Daily Traffic (PADT)?
30 30

243
Table TA 7.8—HOV Connector Evaluation Ranking Cost-
Effectiveness
Initial Phase in RC
TransNet, EAP
No.Cost ($M)
Direction
[1] Serves High Demand 20%
[2] Serves Congested Corridors 20%
[3] Serves Regional and/or Corridor Transit Routes 20%
[4] Habitat/ Residential Impacts 10%
[5] Cost Effective- ness 30%
WeightedScore 100%
Project Rank (1-25)
YES 1 $190 I-15 I-805 North to North 20 16 20 0 30 86 1South to South
2 $166 I-805 SR 94 East to South 8 20 20 6 18 72 2North to West
2 $200 I-5 SR 94 South to East 20 16 0 6 30 72 2West to North
4 $200 I-805 SR 94 South to East 20 20 0 0 30 70 4North to West
YES TransNet 5 $170 I-5 I-805 North to North 20 12 0 4 30 66 5South to South
TransNet 5 $213 I-15 SR 78 East to South 20 12 0 10 24 66 5North to West
YES TransNet 5 $190 I-805 SR 52 West to North 8 16 20 4 18 66 5South to East
8 $180 I-15 SR 52 West to North 16 12 0 8 24 60 8South to East
YES TransNet 9 $140 I-15 SR 94 South to West 8 8 20 0 18 54 9East to North
9 $190 I-805 SR 163 North to North 16 8 0 6 24 54 9South to South
11 $280 I-8 SR 125 West to South 12 16 0 6 18 52 11North to East
12 $180 I-15 SR 163 North to North 12 12 0 8 18 50 12South to South
13 $190 I-5 SR 56 North to East 16 4 0 4 24 48 13West to South
14 $200 I-5 SR 94 West to South 8 20 0 6 12 46 14North to East
14 $190 I-15 SR 56 East to North 8 16 0 10 12 46 14South to West
16 $180 SR 52 SR 125 North to West 16 4 0 0 24 44 16East to South
18 $185 I-5 SR 78 North to East 12 8 0 0 18 38 18West to South
17 $200 I-805 SR 54 South to East 8 16 0 4 12 40 17West to North
19 $166 I-805 SR 94 West to South 4 20 0 4 6 34 19North to East
20 $180 I-5 SR 54 South to East 8 8 0 4 12 32 20West to North
21 $190 I-5 SR 56 South to East 4 20 0 0 6 30 21West to North
22 $185 I-5 SR 78 South to East 8 8 0 0 12 28 22West to North
23 $180 I-5 SR 52 South to East 8 8 0 4 6 26 23West to North
24 $180 I-5 SR 52 West to South 4 8 0 4 6 22 24North to East
25 $180 I-5 SR 54 West to South 4 4 0 0 6 14 25North to East
Serves Travel Needs Develops Network Integration
Intersecting Freeways

244
FREEWAY-TO-FREEWAY CONNECTORS
The TPEC also updated the Freeway-to-Freeway Connector criteria. The TPEC elected to use a number of the same criteria that were used to evaluate highway projects. The six criteria shown in Tables TA 7.9 and 7.10 quantify project area accident rates, goods movement, mobility, congestion relief, transit integration, and cost effectiveness. The ranked projects are shown in Table TA 7.11.
Table TA 7.9—Freeway Connectors Study Evaluation Criteria
GOAL CRITERIA DESCRIPTION
Located in a High Crash Rate Area Is the project located in an area with a vehicular high crash rate?
Serves Goods Movement Does the project provide for goods movement?
Provides Mobility What is the Person Average Daily Traffic?
SERVES TRAVEL NEEDS
Provides Congestion Relief What is the number of daily person-hours saved?
Serves Regional and/or Corridor Transit Routes
Does the project serve regional and/or corridor transit routes?
DEVELOPS NETWORK INTEGRATION
Minimizes Habitat and Residential Impacts Does the project minimize negative habitat and residential impacts?
COST-EFFECTIVENESS
Cost-Effectiveness What is the annual capital and operating project cost divided by person-hours saved?

245
Table TA 7.10—Freeway-to-Freeway Connector Criteria
CRITERIA DESCRIPTION
1. Located in a High Crash Rate Area
Is the project located in an area with a high vehicular crash rate? Score Description
5 Greater than 160 percent of the 3-year average statewide crash rate for a similar facility (i.e., 60% over the statewide average)
4 Greater than 150% “ “ 3 Greater than 140% “ “ 2 Greater than 130% “ “ 1 Greater than 120% “ “
2. Serves Goods Movement
Does the project provide for goods movement?
A) Is the highway a major freight corridor as measured by truck AADT%
2 >7%
1 4%-7%
0 less than 3%
B) Is the highway part of a designated trade corridor as defined in the Regional Truck Network- as part of the RTP Freight Strategy?
2 Yes
0 No
C) Does the highway serve a major freight center (within one mile of the corridor) such as a Port, International Airport, Port of Entry, Rail Intermodal/Transload Facility or Industrial Cluster/Distribution Center?
1 Yes
0 No
3. Provides Mobility
What is 2030 Person Average Daily Traffic (PADT)? Score Description
5 Over 45,000 PADT 4 30,000 to 45,000 PADT 3 25,000 to 29,999 PADT 2 20,000 to 24,999 PADT 1 Less than 20,000 PADT

246
Table TA 7.10—Freeway-to-Freeway Connector Criteria (cont’d)
CRITERIA DESCRIPTION
4. Provides Congestion Relief
What is the number of daily person-hours saved?
Staff calculated the existing travel time using local roadways that provide the same movement that the proposed freeway connector would provide. The travel time savings has been equated to the existing travel time along the local roadways minus the travel time with the connector, which was then multiplied by the number of person trips. Score Description
5 Over 1,400 person hours saved 4 1,000 to1,400 person hours saved 3 800 to 999 person hours saved 2 500 to 799 person hours saved 1 Under 500 person hours saved
5. Serves Regional and/or Corridor Transit Routes
Does the project serve regional and/or corridor transit? Score Description
5 Serves Regional or Corridor transit services identified in the Regionally Significant Transportation Network
0 Does not serve Regional or Corridor transit services identified in the Regionally Significant Transportation Network
6. Minimizes Habitat and Residential Impacts
Does the project minimize negative habitat and residential impacts?
Projects receive points for each of the descriptions they satisfy (maximum of 5 points total) Points Description
2 Avoids preserve areas as defined by habitat preserve plans 1 Avoids natural areas as defined by habitat preserve plans 2 Avoids existing residential development (defined as existing housing stock
within 500 feet of the highway right of way is less than two dwelling-units per acre- this does not imply a taking and is used only as a measure of proximity)

247
Table TA 7.10—Freeway-to-Freeway Connector Criteria (cont’d)
CRITERIA DESCRIPTION
7. Cost-Effectiveness
What is the annual capital and operating/maintenance project cost divided by person-hours saved?
Calculated as: [(Total capital costs/project life) + (annual operating & maintenance costs)]/ Annual Weekday Person Hours Saved
Higher ranking projects have a lower cost per person-hour saved. Score Description
5 Less that $1.25 per person hour saved 4 $1.25 to $2.00 per person hour saved 3 $2.01 to $3.00 per person hour saved 2 $3.01 to $5.00 per person hour saved 1 Over $5.00 per person hour saved

248
Table TA 7.11—Freeway Connectors Project Rankings
Cost-Effectiveness
Initial Phase in
RC
TransNet and EAP
No. FreewayIntersecting
FreewayMovement
[1] Serves Goods
Movement 10%
[2] Provides Mobility
10%
[3] Provides Congestion Relief 10%
[4] High Vehicular Accident
Rate Area 10%
[5] Serves Regional and/or
Corridor Transit
Routes 15%
[6] Minimizes Habitat and Residential
Impacts 15%
[7] Cost-Effectiveness
30%
Weighted Score 100%
Project Rank
YES TransNet 1 SR 94 SR 125 West to North 6 10 10 0 0 9 30 65 1
YES TransNet 2 SR 94 SR 125 South to East 6 10 8 0 0 9 30 63 2
YES TransNet 3 I-5 SR 56 West to North 6 6 10 0 0 0 30 52 3
YES TransNet 4 I-5 SR 78 West to South 6 10 6 0 0 0 24 46 4
5 I-5 I-8 East to North 0 6 6 2 0 6 24 44 5
YES TransNet 5 I-5 SR 78 South to East 6 10 6 4 0 0 18 44 5
YES TransNet 7 I-5 SR 56 South to East 6 6 6 0 0 0 24 42 7
8 I-5 SR 94 North to East 2 8 4 6 0 9 6 35 8
8 I-15 SR 56 North to West 8 4 2 0 0 15 6 35 8
10 I-5 I-8 South to West 0 2 2 0 0 6 12 22 10
Serves Travel Needs Develops
Network Integration

249
TRANSIT SERVICES EVALUATION
The TPEC, with key input from MTS and NCTD staff, updated the Transit Services Evaluation criteria in order to prioritize new transit services. Building on the criteria developed for use in MOBILITY 2030, the TPEC recommended a number of modifications which integrate the Regional Comprehensive Plan and transit connectivity. This evaluation and prioritization of regional transit services was used to develop the transit network in the 2030 RTP.
The draft criteria were presented for comment to the NCTD Board on August 17, 2006 and to the MTS Board on September 14, 2006. Modifications to the criteria were made in response to comments received. The criteria were accepted by the SANDAG Board on October 13, 2006 and incorporated in the development of the RTP transit network. Tables TA 7.12 and 7.13 describe the transit services evaluation criteria and detailed scoring. Table TA 7.14 describes the transit services criteria weighting. All transit routes evaluated for the 2030 RTP are listed in priority order in Table TA 7.15.
Table TA 7.12—Transit Services Evaluation Criteria
GOAL CRITERIA DESCRIPTION
Serves Congested Areas Does the route serve the more congested
corridors in the region?
Serves Peak-Period Trips What are the number of trips within the
capture areas of the transit stations and park
and ride facilities?
Provides Competitive/Reliable Transit What is the percentage of the route located in
priority treatment?
Peak Transit Utilization What are the morning and afternoon passenger
miles divided by seat miles?
SERVES
TRAVEL NEEDS
Off-Peak Transit Utilization What are the midday and evening passenger
miles divided by seat miles?
Links High-Frequency Transit Services How many other high frequency (timed transfer
service or 15-minute or higher frequency)
transit routes does the route connect to?
DEVELOPS
NETWORK
INTEGRATION
Serves RCP Smart Growth Areas Does the route serve existing/planned and/or
potential RCP Smart Growth areas?
COST-
EFFECTIVENESS
Project Cost-Effectiveness What is the annual capital and operating
lifecycle project cost divided by passenger
miles?

250
Table TA 7.13—Detailed Scoring for Transit Project Criteria
Criteria Description
1. Serves Congested Areas*
Does the route serve the more congested corridors in the region? Score Description 10-0 Percentage of route corridor with Level of Service E or F in 2030
2. Serves Peak-Period Travel Trips *
What are the number of peak-period trips within the capture areas of the transit stations and park and ride facilities?
As calculated as:
a + 1/10b + #c = average peak trips.
a = All trips within 1/3 mile of the transit station (captures walkable trips).
b = All trips located between 1/3 to 1 mile of the transit station (captures trips served by shuttle/bicycles).
c = number of trips to account for park and ride facilities (captures park-and ride-origin trips) multiplied by the number of park and ride facilities located on the route.
Score Description 10-0 Total potential trips per station
3. Provides Competitive/ Reliable Transit *
What is the percentage of the route located in priority treatment? Value Treatment
5 Dedicated Transit Guideway or Dedicated Arterial Lane or Rail 3 Managed Lane or HOV Lane or Arterial Spot Treatments
(e.g., signal priority, queue jumpers)
To calculate the score of a project the percentage of the route on dedicated treatment is multiplied by the value of the treatment to determine the total of points received. The point total is then associated with a project score.
Example Route A is located in 50% Dedicated Arterial Lane and 50% on an arterial with spot treatments.
(50 x 5) + (50 x 3) = 400 Score Description 5-0 500 – 0 points

251
Table TA 7.13—Detailed Scoring for Transit Project Criteria (cont’d)
Criteria Description
4. Peak Transit Utilization*
What is the morning and afternoon peak-period transit utilization? Transit utilization is calculated as passenger miles divided by seat miles.
Route Type Seats Assumed
Heavy Rail 140/car (5 car trains)
Trolley 68/car (3 car trains)
SPRINTER 136/car (1 car trains)
Bus 47/vehicle
Score Description 5-0 Percentage of highest-transit utilization of route during peak.
5. Off-Peak Transit Utilization *
What is the midday and evening transit utilization?
Transit utilization is calculated as passenger miles divided by seat miles.
Route Type Seats Assumed
Heavy Rail 140/car (5 car trains)
Trolley 68/car (3 car trains)
SPRINTER 136/car (1 car trains)
Bus 47/vehicle
Score Description 5-0 Percentage of highest utilization of route during off-peak-period.
6. Links High-Frequency Transit Services*
How many other high frequency (timed transfer service or 15 minute or higher frequency) transit routes does the route connect to? Score Description 20-0 Total number of route connections with high frequency transit routes

252
Table TA 7.13—Detailed Scoring for Transit Project Criteria (cont’d)
Criteria Description
7. Serves RCP Smart Growth Centers *
Does the route serve existing/planned and/or potential RCP Smart Growth areas?
Transit routes shall receive points for each place type they serve. Points Place Type
5 Serves existing/planned Metropolitan Center or Urban Center 4 Serves existing/planned Town Center or Special Use Center 3 Serves existing/planned Transit Corridor or Community Center 2 Serves existing/planned Rural Center 1 Serves potential RCP Smart Growth Area
Scores are based on the total number of these points
Score Description 15-0 Total number of points
8. Cost Effectiveness * What is the annual capital and operating project cost divided by passenger miles?
Calculated as:
((Total annual operating/maintenance subsidy) + (capital project cost / Project
life)) / Passenger miles traveled
Higher ranking projects have a lower cost per passenger-mile traveled. Score Description 30-0 Total dollar amount per passenger mile traveled
* Criterion denoted with an asterisk were calculated using a quantitative relative score method where the top scoring project received the full number of points for that criterion and the subsequent projects received points relative to the top project score.

253
Table TA 7.14—Transit Criteria Weighting
CRITERIA GOAL
RTP GOALS CRITERIA DESCRIPTION MAX
SCORE PERCENT
Reliability, Livability
Serves Congested Areas
Does the route serve the more congested corridors in the region?
10
Livability, Accessibility,
Mobility Environmental Sustainability
Serves Peak-period Trips
What are the number of trips within the capture areas of the transit stations and park and ride facilities?
10
Efficiency, Reliability, Mobility
Provides High Speed/Reliable
Transit
What is the percentage of the route located in priority treatment?
5
Accessibility, Mobility,
Environmental Sustainability
Peak Transit Utilization
What are the morning and afternoon passenger miles divided by seat miles?
5
SERVES TRAVEL NEEDS
Accessibility, Mobility,
Environmental Sustainability
Off-Peak Transit Utilization
What are the midday and evening passenger miles divided by seat miles?
5
35
Reliability, Livability, Mobility
Links High-Frequency Transit
Services
How many other high frequency (timed transfer service or 15 minute or higher frequency) transit routes does the route connect to?
20
DEVELOPS NETWORK INTEGRATION
Livability, Accessibility,
Environmental Sustainability
Serves RCP Smart Growth Areas
Does the route serve existing/planned and/or potential RCP Smart Growth areas?
15
35
COST-EFFECTIVENESS Efficiency Cost Effectiveness
What is the annual project capital and operating cost divided by passenger miles?
30 30

254
Table TA 7.15—Transit Services Evaluation Ranking
YES EAP (Capital) 1 510 Light Rail Blue Line San Ysidro to Santa Fe Depot via Park/C Street 265
YES TransNet 2 15 BRT Mid-City Rapid SDSU to Downtown San Diego via El Cajon Boulevard and Park Boulevard 100
YES TransNet 3 530 Light Rail Green Line Santee to 12th and Imperial via Bayside Alignment 80
YES EAP 4 610 BRT Escondido to Downtown San Diego via I-15 & SR-94 315
YES TransNet 5 680 BRT Otay Mesa to Sorrento Mesa via I-805/I-15/SR-52 820
YES EAP 6 608 BRT Escondido to Downtown San Diego via I-15 & 4th/5th/SR 163 corridor guideway -
7 120 Rapid Bus Downtown San Diego to Kearny Mesa via 4th/5th/SR 163 corridor guideway 866
8 640 BRT San Ysidro to Downtown San Diego and Kearny Mesa via I-5 and 4th/5th/SR 163 corridor guideway 58
YES EAP 9 628 BRT Otay Mesa to Downtown San Diego via I-805/SR 94 420
YES TransNet 10 398 Commuter Rail COASTER Oceanside to Downtown San Diego 2,204
11 10 Rapid Bus La Mesa to Old Town via University Avenue 16
YES EAP (Capital) 12 520 Light Rail Orange Line El Cajon to American Plaza via Park/C Street 150
13 90 Express Bus El Cajon to Downtown San Diego via SR 125, SR 94, and Broadway 9
14 11 Rapid Bus SDSU to Downtown San Diego and Spring Valley via Adams, 1st Street, and National Avenue 61
15 210 BRT Mira Mesa to Downtown San Diego via I-15 and SR 94 15
YES EAP 16 607 BRT Rancho Bernardo to Downtown via I-15 & 4th/5th/SR 163 corridor guideway -
17 2 Rapid Bus North Park to Downtown San Diego via 30th Street and Broadway 7
YES EAP (Capital) 18 570 Light Rail Mid-Coast Trolley from Downtown San Diego to Sorrento Mesa 1,072
19 30 Rapid Bus UTC to Downtown San Diego via La Jolla Village Drive, La Jolla Boulevard, Grand Avenue, and I-5 11
20 955 Rapid Bus SDSU to National City via 54th Street, Euclid Avenue, and Main Street 13
YES TransNet 21 399 Light Rail SPRINTER Oceanside to Westfield North County (Double tracking, Top 4 Grade Separations) 762
22 41 Rapid Bus Fashion Valley to UTC/UCSD via SR 163, Genesee Avenue, and La Jolla Village 12
TransNet 23 472 Rapid Bus Oceanside to UTC via El Camino Real and I-5 52
24 150 BRT Sorrento Mesa to Downtown San Diego via I-5 13
25 13 Rapid Bus National City to Allied Gardens via Euclid and Fairmount 15
YES TransNet 26 470 BRT Riverside County to UTC/UCSD via Carroll Canyon 80
27 690 BRT Otay Ranch to UTC/UCSD via Palomar Street and I-805 14
28 929 Rapid Bus San Ysidro to 8th Street Trolley via 3rd Avenue and Highland 16
29 691 BRT Otay Ranch to Sorrento Mesa via Palomar Street and I-805 15
30 609 BRT Escondido to Kearny Mesa via I-15 54
31 27 Rapid Bus Pacific Beach to Kearny Mesa via Garnet and Balboa Avenue 9
32 660 BRT El Cajon to Kearny Mesa via Cuyamaca and SR 52 18
33 31 Rapid Bus Mira Mesa to UTC/UCSD via Carroll Canyon, Camino Santa Fe, and Miramar Road 8
34 709 Rapid Bus H Street Trolley to Otay Mesa via H Street, Palomar Street, and SR 125 13
35 50 Rapid Bus Bay Park to Kearny Mesa via Clairemont Drive and Clairemont Mesa Boulevard 10
TransNet 36 471 Rapid Bus Oceanside to San Marcos via Highway 101 and Palomar Airport Road 13
37 35 Rapid Bus Old Town to Ocean Beach via Midway Drive, W. Point Loma Blvd., and Cable Street 6
38 692 BRT El Cajon to Otay Mesa via SR 125 15
39 962 Rapid Bus Spring Valley to National City via Jamacha, Paradise Valley Rd and Plaza Boulevard 15
40 936 Rapid Bus 70th Street Trolley to Spring Valley via College Avenue and Skyline Drive 11
41 479 Rapid Bus Oceanside to Palomar Airport via College Avenue and Melrose Drive 13
42 303 Rapid Bus Oceanside to Vista via Mission, SR 76, and North Santa Fe 12
43 620 BRT Otay Border to Imperial Beach via Airway Road, SR 905, and Palm Avenue 157
Capital Costs
(millions)Mode DescriptionRank
Initial Phase in
RC
TransNet and EAP
Route

255
(continued)
Cost Effective-ness
[1]Serves Congested Areas (10%)
[2]Serves Peak Period Trips (10%)
[3]Provides Competitive/Reliable Transit (5%)
[4]Peak Transit Utilization (5%)
[5]Off-Peak Transit Utilization (5%)
[6]Links High Frequency Transit Services (20%)
[7]Serves RCP Smart Growth Areas (15%)
[3]Project Cost-Effective-ness (30%)
187 452 8.1 4.5 5.0 4.6 2.9 10.5 9.1 30.0 74.7
87 187 10.0 5.4 3.5 5.0 5.0 12 9.3 7.0 57.2
208 288 7.8 3.6 5.0 1.7 0.8 10.5 15.0 12.2 56.6
170 485 7.0 5.0 3.6 1.7 2.8 19 9.9 6.9 56.0
154 974 4.0 2.1 3.7 2.5 2.1 20 8.5 7.5 50.3
- - 7.4 10.0 3.6 1.8 0.0 13 9.3 4.1 49.2
13 879 6.3 5.2 4.9 2.9 2.5 14.5 7.4 4.0 47.7
42 100 7.0 6.1 3.6 2.4 0.0 19 5.3 4.2 47.6
65 485 5.0 5.4 3.6 2.5 2.8 14 4.2 8.3 45.9
187 2,391 7.0 5.7 5.0 1.3 0.5 13.5 7.0 5.2 45.1
30 46 8.3 2.5 3.0 2.0 1.5 10.5 12.3 5.0 45.1
153 303 6.1 4.7 5.0 1.1 0.6 9.5 7.8 9.1 44.0
16 25 4.4 8.8 1.5 2.5 0.0 10.5 3.6 12.3 43.6
149 210 7.0 3.6 3.0 1.5 1.6 11.5 8.9 5.5 42.5
39 54 6.9 7.3 3.0 2.1 0.0 11 5.1 6.6 42.0
- - 7.7 9.2 3.8 0.5 0.0 10 7.8 1.0 40.0
35 42 6.6 6.9 3.0 1.4 1.4 9.5 6.1 4.0 38.9
151 1,223 5.5 3.8 5.0 1.3 0.9 12.5 7.2 2.4 38.5
24 35 7.2 5.9 2.1 1.5 0.0 10 6.1 4.6 37.4
53 66 7.9 2.1 3.0 1.7 1.6 7 7.0 5.8 36.0
139 901 6.7 2.2 5.0 1.0 0.6 10.5 6.5 2.0 34.6
60 72 3.4 1.6 2.8 1.3 1.4 11.5 5.5 5.2 32.7
74 126 5.8 1.6 3.0 1.5 0.9 12.5 2.1 4.3 31.8
25 38 4.9 6.1 1.5 1.1 0.0 14.5 2.1 1.6 31.7
55 70 5.1 1.5 3.0 1.2 1.0 9 6.3 4.0 31.1
97 177 6.8 2.5 2.0 0.6 0.0 13.5 4.6 1.1 31.0
33 47 4.7 1.9 3.4 1.4 0.0 12.5 4.4 2.2 30.6
75 91 5.0 2.1 3.0 1.1 0.8 8 7.8 2.8 30.5
34 49 4.5 2.1 3.6 1.4 0.0 11 4.2 2.3 29.1
22 76 7.0 2.0 3.0 0.9 0.0 10 2.1 3.1 28.2
32 41 5.2 1.9 3.0 0.9 0.7 8 4.6 2.4 26.7
44 62 7.1 1.9 3.3 1.2 0.6 6.5 1.9 1.8 24.3
25 33 3.3 2.5 3.0 0.8 0.5 9 2.5 2.4 24.0
32 45 2.6 1.8 3.8 0.7 0.5 7.5 4.4 2.0 23.4
30 40 5.9 1.5 3.0 0.6 0.4 7 2.7 1.4 22.6
63 76 6.6 1.3 3.1 0.6 0.5 5.5 3.0 1.9 22.5
19 25 7.0 2.6 3.0 1.1 0.8 2.5 1.9 2.4 21.3
20 35 1.0 2.3 2.3 0.5 0.0 8.5 5.1 1.0 20.6
48 63 3.9 0.9 3.3 0.9 0.6 6 1.5 2.1 19.0
34 45 2.2 1.8 3.0 0.6 0.6 4 4.6 2.0 18.8
37 50 5.9 1.1 3.0 0.3 0.2 5.5 0.6 1.0 17.6
34 46 4.8 1.4 3.0 0.3 0.3 4.5 2.1 1.1 17.5
63 220 0.9 1.6 1.9 0.7 0.6 6 3.2 1.0 15.9
Total Score
Serves Travel Needs Develops Network Integration
Operating Subsidy
(millions)
Total Costs (millions)

256
RAIL GRADE SEPARATION EVALUATION CRITERIA
The Cities/County Transportation Advisory Committee (CTAC) developed regional rail grade separation prioritization criteria that stress congestion relief, safety and funding needs as the primary elements, with additional consideration of other factors including impacts to pedestrian traffic, bus transit operations, emergency services, truck freight operations and noise.
In preparation for the development of the criteria staff conducted a literature search of other rail grade separation prioritization criteria. These included the California Public Utilities Commission criteria, other states’ criteria, the federal government as well as articles published in research journals. The findings formed the basis for the initial discussions within CTAC.
The intent of the implementation of a regional rail grade separation program is to provide funding for construction of significant traffic congestion relief projects through the implementation of rail grade separations where other more economical alternatives are demonstrably not feasible or practical. Elimination of crossings is considered a potentially practical alternative. Program allocations will need to be considered in conjunction with other regional transportation funding priorities and needs, and will be dependent on the availability of funding from federal, state and local sources.
The rail grade separation prioritization criteria were accepted by the SANDAG Board of Directors for inclusion in the 2030 RTP on October 13, 2006. To date, a regional list of potential grade separations has not been created or prioritized.
Projects will be prioritized based on two criteria categories: Project Specific Criteria and Regional Housing Needs Assessment (RHNA) Housing Production. The Project Specific Criteria will be worth 75 percent and the RHNA Housing Production criteria will compose 25 percent of the total project score.
Project-Specific Criteria
These criteria take into account existing vehicular and train traffic, accident history, cost, noise, access to emergency services and other factors.
The following criteria and point system will be implemented, with a potential maximum of 100 points. The total Project Specific Criteria score will be multiplied by .75 to produce a scaled 75 point score for the total regional rail grade separation project score.
1. Peak-period Exposure Index (PPEI) factor, measured as the product of
the existing high directional traffic and the total measured blocking delay during the same three hours of the day experiencing the highest congestion at the crossing.
MAXIMUM POINTS = 20
PPEI = VT3 x BD3 x C3
Where the score is the product of the above formula, rounded to the next whole number, up to a maximum of 20; and, where
VT3 = Vehicular traffic in high direction during selected three hour period
BD3 = Total blocking delay during same three hour period selected
C3 = 1/1,350,000, a mathematical constant used for the three hour peak-period calculation

257
Notes:
a. For crossings where two or more streets that are adjacent to each other that are impacted simultaneously by the operation of the train, the vehicular traffic volume on those streets is cumulative for purposes of the calculation of this congestion relief factor.
b. Selected three hour period consists of three, one-hour periods which may be consecutive. However, the selected three-hour period shall be the same when counting vehicular and train traffic.
c. Blocking delay shall be measured as the time period beginning when the warning devices are activated to the time when the warning devices are de-activated.
Example:
At a crossing, there are 5,400 total cars in the high direction counted between 6:30 am and 7:30 am, 8:00 am and 9:00 am and between 5:00 pm and 6:00 pm, with eight trains per hour during those same hours and 60 seconds delay time per train during those same hours.
VT3 = 5,400 cars in high direction selected three hour period
BD3 = 8 trains x 2 directions x 3 hours x 60 second delay = 2,880
PPEI = 5,400 x 2,880 x [1/1,350,000] =11.52
Rounding up to next whole number: PPEI Score = 12 2. Peak Day Total Delay Exposure Index (PDEI) factor, measured as the
product of the existing average daily traffic (ADT), the total number of trains, and an average train crossing delay time factor.
MAXIMUM POINTS = 20
PDEI = PD-ADT x PD-NT x ATCDF x PD-C
Where the score is the produce of the above formula, rounded to the next whole number, up to a maximum of 20; and, where
PD-ADT = Peak Day Average Daily Traffic
PD-NT = Peak Day Total Number of Trains
ATCDF = Average Train Crossing Delay Factor, corresponds to point scale as shown in table below.
PD-C = 1/1,000,000, a mathematical constant used for peak day period calculation
Average Train Crossing Delay Factor (ATCDF) Table
From (minutes) To (minutes) Points
0.00 0.75 1 0.75 1.00 2 1.00 1.25 3 1.25 1.50 4 1.50 2.00 5 2.00 3.00 6 3.00 4.00 7 4.00 6.00 8 6.00 8.00 9 8.00 10.00 10

258
Notes:
a. For crossings where two or more streets that are adjacent to each other that are impacted simultaneously by the operation of the train, the vehicular traffic volume on those streets is cumulative for purposes of the calculation of this congestion relief factor.
b. Average Annual Daily Traffic can be used for peak day, but ADT for weekday or week-end day may be used as appropriate if available. However, the selected day period shall be the same when counting vehicular and train traffic. As an example, if ADT for weekday is available, the highest train traffic of any day between Monday and Friday can be used for the calculations, and not the week-end day train traffic.
c. Blocking delay shall be measured as the time period beginning when the warning devices are activated to the time when the warning devices are de-activated.
Example:
At a crossing, there is an arterial with an ADT of 30,000 vehicles on weekdays, 144 daily trains in both directions also on weekdays, averaging 55 seconds per crossing.
PDEI = PD-ADT x PD-NT x ATCDF x PD-C
PD-ADT` = 30,000 vehicles on weekdays PD-NT = 144 trains in both directions, on weekdays ATCDF = 2 points
PDEI = 30,000 x 144 x 2 x [1/1,000,000] = 8.64
3. Rounding up to the next whole number: PDEI Score = 9 4. Accident History: Accident History in the past five years involving
vehicles, pedestrians and bicycles with trains, not including accidents involved in attempted suicides.
MAXIMUM POINTS = 20
Assign points to according to the following schedule
Number of Qualifying Accidents 1 2 3 4 5+
Points 2 4 6 8 10
Increase the number of points for an accident or accidents by 100% when heavy rail is involved. 5. Funding Request: The funding request criterion awards points for
amount of funds requested from the program as an equivalent cost benefit criterion by awarding a higher score for those projects that request a lower amount of funds score points are based on the total request for funds, with a cap of $45 million.
MAXIMUM POINTS = 20
Note: Minimum 10% participation is required.

259
Assign points according to the following schedule:
Funding Request ($millions)
Points (Planning-Level Estimate)
Points (NEPA-Level Estimate)
$0.0 – $15.0 10.0 20.0
$15.1 – $20.0 8.5 17.0
$20.1 – $25.0 7.0 14.0
$25.1 – $30.0 5.5 11.0
$30.1 – $35.0 4.0 8.0
$35.1 – $40.0 2.5 5.0
$40.1 – $45.0 1.0 2.0
NEPA: National Environmental Protection Act 6. Pedestrian Benefits MAXIMUM POINTS = 4
Assign points according to following criteria:
a. Grade separation would serve 1-50 pedestrians during top 4 hours: 1 point
b. Grade separation would serve 51-100 pedestrians during top 4 hours: 2 points
c. Grade separation would serve 101-150 pedestrians during top 4 hours: 3 points
d. Grade separation would serve more than 150 pedestrians during top 4 hours: 4 points 7. Bus Operations Impacts MAXIMUM POINTS = 4
Assign points according to following criteria:
e. Grade separation would serve up to four buses an hour: 1 point
f. Grade separation would serve from four to eight buses an hour: 2 points
g. Grade separation would serve from eight to sixteen buses an hour: 3 points
a. Additional point if the grade crossing is adjacent to a transit center. 8. Noise Reduction MAXIMUM POINTS = 4
Assign points according to following criteria:
a. Rail crossing area located within 200 feet of sensitive receptors: 4 points
b. Rail crossing area located between 200-500 feet of sensitive receptors: 2 points
c. Rail crossing area located more than 500 feet away from sensitive receptors: 0 points
d. Sensitive receptors include: Residential areas, hospital, school, house of worship.
Rail crossing area includes crossing plus 200 feet along track in either direction away from crossing.

260
9. Benefit to Emergency Services MAXIMUM POINTS = 4
Assign points according to following criteria:
a. Rail crossing located within ½ mile of emergency service provider and no alternate grade-separated crossing exists within ½ mile: 4 points
b. Rail crossing located between ½ and 1 mile of emergency service provider and no alternate grade-separated crossing exists within ½ mile: 2 points
c. Rail crossing located between 1 and 1½ miles of emergency service provider and no alternate grade-separated crossing exists within ½ mile: 1 point
d. Rail crossing located further than 1½ miles of emergency service provider and no alternate grade-separated crossing exists within ½ mile: 0 points
Emergency service providers include services such as police, fire, paramedic, ambulance, and hospital services. Distance is measured as driven distance from crossing.
10. Impact to Truck Freight Operations MAXIMUM POINTS = 4
Assign points according to the following criteria:
a. Rail crossing located between freeway and major truck freight transfer point (200+ trucks per day): 4 points
b. Rail crossing located between freeway and medium sized truck freight transfer point (100-200 trucks per day): 2 points
c. Rail crossing located between freeway and medium sized truck freight transfer point (0-100 trucks per day): 0 points
Step 2: Once the projects have been prioritized according to the criteria above, consideration for funding would include the following project readiness elements:
a. Project feasibility (e.g., physical constraints, reliability of cost estimate)
b. Environmental document status
c. Right-of-way acquisition status
d. Permits (e.g., PUC, Coastal Commission, Dep’t of Fish & Game, etc.)
Regional Housing Needs Assessment (RHNA) Criteria
As dictated in SANDAG Board Policy Number 033, rail grade separation projects must include incentive points (a minimum of 25 points out of 100 possible) to be given to projects in jurisdictions in which lower income housing units are being produced in accordance with the housing unit figures contained in Alternative 3 of the Board RHNA Memo.

261
A prioritized list of regional rail grade separation projects has not been created for the 2030 RTP. When a call for projects is made, local jurisdictions must satisfy the requirements of Board Policy Number 033 in order to be eligible for project funding. The Policy states that prior to January 1, 2007 jurisdictions shall have submitted a draft of its housing element to the state Department of Housing and Community Development (HCD) or have self-certified its housing element in compliance with state law by the due date for the grant application. As of January 1, 2007, jurisdictions are required to have an adopted housing element (which has been found in compliance with state law by HCD or self-certified). Additionally, those jurisdictions that were not able to identify adequate sites to meet their RHNA goals and were required to include a program in their housing elements to identify additional sites by rezoning must be able to demonstrate that they are making progress toward implementing the rezoning program in conformance with the schedule contained in their housing elements. “Making progress” toward implementing the rezoning program is defined as having demonstrated a good faith effort in undertaking the rezoning program described in the housing element. Incentive points shall be calculated as follows:
1. The jurisdiction has an adopted housing element (which has been found in compliance with state law by HCD or self-certified): Pass/Fail
2. Percentage of Alternative 3 low/very low income units produced to be calculated as follows: Percentage of allocated low/very low income units x 25 = Incentive Points Example: The score is the product of the above formula, rounded to the next whole number, up to a maximum of 25.
Example:
Jurisdiction
Alt. 3 – Low-/
Very-Low Income Units*
Annual Number
Year 1
Number Produced
Year 1**
Percentage of Alt. 3
Year 1**
Incentive Points**
A 4,322 864 300 35% 9
Jurisdiction
Alt. 3 – Low-/
Very-Low Income Units
Cum. Annual Number
Year 2
Cum. Number
Produced
Year 2**
Percentage of Alt. 3
Cum.
Year 2**
Incentive Points
Year 2**
A 4,322 1,728 400 23% 6
* 7.5 year number in RHNA Alternative 3 may be modified based on 5-year number included in local housing elements.
** These percentages and numbers are hypothetical for the purpose of explaining the methodology.

262
REGIONAL RANKING CRITERIA FOR TRANSIT CAPITAL AND REHABILITATION PROJECTS
The regional ranking criteria for transit capital and rehabilitation projects were developed by a committee of staff members from MTS, NCTD, and SANDAG. The proposed criteria are in broad categories to ensure they cover any transit-related funding sources that may become available. The twelve criteria and points assigned to each are described in Tables TA 7.16 and 7.18.
The criteria will be used to evaluate and prioritize the unfunded transit capital and rehabilitation projects for the transit operators in the San Diego region when discretionary funding becomes available, such as through the federal and state legislative processes. The transit operators will provide a list of unfunded projects to SANDAG annually in conjunction with the Capital Improvement Program (CIP) process. When funding becomes available, there will be an opportunity for the agencies to update and revise the list of unfunded projects.
The unfunded project list will be submitted each November/December which would support the annual legislative update in January. The unfunded project list shall include all known transit capital needs that are unfunded for the region. It will comprise a ten-year horizon of capital needs and will identify the state of readiness of each project. When the unfunded list is submitted, the Regional Ranking Criteria for Capital Projects Committee will reconvene to review the project rankings for consensus and consistency among the agencies then provide the final list of unfunded projects to SANDAG.
Table TA 7.16—Regional Ranking Criteria for Transit Capital Replacement and Rehabilitation Projects Definitions
1. Core Transit Assets Beyond Useful Life (Per FTA Definition where available)
Projects replacing vehicles or equipment beyond its useful life will score points with the highest point value given to projects that exceed useful life by 50% or more. The useful life assumption will be provided with the project ranking.
2. Safety
Safety projects that address specific safety hazards within facilities, infrastructure, and the operation of vehicles and equipment identified through on-going system safety management programs, hazard analyses, or similar programs are considered “Major” and would score five points in these categories. Safety projects that enhance the existing safety and security measures are considered moderate and would score three points in these categories.
3. Security
Security projects that address specific, identified security deficiencies in the detection of, or response to, threats to persons, equipment, facilities, or infrastructure from planned acts of violence, life threatening emergencies, or natural disasters identified through formal Threat and Vulnerability Assessments, security audits, or security hazard analysis programs are considered “Major” and would score five points in these categories. Security projects that enhance the existing safety and security measures are considered moderate and would score three points in these categories.

263
Table TA 7.16—Regional Ranking Criteria for Transit Capital Replacement and Rehabilitation Projects Definitions (cont’d)
4. Ridership (number of people positively impacted)
Projects would score points based on the number of people positively impacted by the project with the highest point value given to projects that impact greater than 10 million passengers annually.
5. Type of Service Impacted
Projects would score points in accordance with Yellow, Red, Blue, and Green Route definitions with the highest point value given to projects that support regional services (Yellow Routes).
6. Regulatory Requirement
Projects that help transit properties meet regulatory requirements and legal mandates resulting from the passage of laws, such as the American's with Disabilities Act and state clean air regulations, would score points with the highest point value given to projects where service is subject to elimination.
7. Operating Cost Impact (Annual Savings/Total Cost)*
Operating cost impact would be calculated by dividing the annual savings by the total project cost with the highest point value given to projects with an operating cost impact of 25% or greater. The estimated cost savings will be provided with the project ranking.
8. Air Quality
Projects that help transit properties meet CARB Urban Bus and public transit support vehicle fleet rules would score points.
9. Contractual Commitment (i.e., shared-use agreements)
Projects that have contractual commitments would score points. Contractual commitments would be e.g., shared use agreements and FFGA's. Procurement contracts would not receive points for this category.
10. Supports Regional Transportation Plan (RTP)
Projects that support the Regional Transportation Plan would score points.
11. Travel Time Savings
Projects would score points based on the travel time savings enhancement provided by the project.
12. Project Readiness
Projects would score points based on how soon it would be ready to initiate the procurement process.
* Formula may be refined as the process progresses

264
Table TA 7.17—Regional Ranking Criteria for Transit Capital Replacement and Rehabilitation Project
1. Core Transit Assets Beyond Useful Life (per FTA definition where available) Points Weight Total Score
50% beyond end of useful life 5 3 15 35 - 50% beyond the end of useful life 4 12
20 - 35% beyond the end of useful life 3 9
10 - 20% beyond the end of useful life 2 6 Less than 10% beyond end of useful life 1 3
None - new equip/expansion or does not support existing service 0 0
2. Safety Points Weight Total Score
Major 5 3 15 Moderate 3 9 None 0 0
3. Security Points Weight Total Score
Major 5 3 15
Moderate 3 9 None 0 0
4. Ridership (Number of people positively impacted) Points Weight Total Score
Impacts greater than 10 million passengers annually 5 3 15
Impacts 5 to 10 million passengers annually 4 12
Impacts 3 to 5 million passengers annually 3 9 Impacts 1 to 3 million annually 2 6 Impacts less than 1 million annually 1 3 None 0 0
5. Type of Service Impacted Points Weight Total Score
Regional Services (Yellow Routes) – Longer distance travel, 5 3 15
highest speeds with few stops, and oriented around major regional centers Corridor Services (Red Routes) – Arterial-based inter-around 4 12
community travel, higher speeds with fewer stops, oriented both community and regional destinations
Local Services (Blue Routes) – Provides basic community 3 9
mobility, community operating speeds with local stops, and provides community circulation and connections to the regional and corridor network
Neighborhood Services (Green Routes) – Provides neighborhood 2 6 circulation, network connections, and needed service coverage, and neighborhood operating speeds with frequent stops. None 0 0

265
Table TA 7.17—Regional Ranking Criteria for Transit Capital Replacement and Rehabilitation Project (cont’d)
6. Regulatory Requirement Points Weight Total Score
Subject to service elimination 5 2 10 Subject to service decrease/interruption 4 8 Significant financial impact - fines/loss of funding/remediation costs 3 6 None 0 0
7. Operating Cost Impact (Annual Savings/Total Cost) Points Weight Total Score
Operating Savings greater than 25% 5 2 10
Operating savings 20% - 25% 4 8
Operating savings 15% - 20% 3 6 Operating savings 10% - 15% 2 4 Operating savings less than 10% 1 2
No cost savings or cost increase 0 0
8. Air Quality Points Weight Total Score
Project allows transit property to meet CARB Urban Bus and public 5 2 10
transit support vehicle fleet rules
Contributes to overall air quality in region 3 6
None 0 0
9. Contractual Commitment (e.g., shared-use agreements) Points Weight Total Score
Yes 5 1 5
No 0 0 10. Supports Regional Transportation Plan (RTP)** Points Weight Total Score
Meets five or more RTP Goals 5 1 5
Meets four RTP Goals 4 4
Meets three RTP Goals 3 3 Meets two RTP Goals 2 2 Meets one RTP Goal 1 1
Does not meet any of the RTP goals 0 0 ** Mobility, Accessibility, Reliability, Equity, Livability, Sustainability, Efficiency 11. Travel Time Savings Points Weight Total Score
Travel time savings of 15% or greater 5 1 5
Travel time savings of less than 15% 3 3
None 0 0
12 Project Readiness Points Weight Total Score
Ready to initiate procurement within 6 months or less 5 1 5
Ready to initiate procurement within 6 - 12 months 3 3
Ready to initiate procurement within12 months or longer 0 0
Total Possible Score: 125

266
REGIONAL ARTERIAL SYSTEM
The Regional Arterial System constitutes that part of the local street and road network which, in conjunction with the system of highways and transit services, provides for a significant amount of mobility throughout the region. The Regional Arterial System defines roads eligible for SANDAG fund allocation and has been updated for the 2030 RTP. A Regional Arterial System has been included as part of the Regional Transportation Plan (RTP) since 1989.
A total of eight local jurisdictions requested additions and modifications to the Regional Arterial System for the 2030 RTP. Their requests were analyzed based upon revised screening criteria adopted by the Transportation Committee on October 20, 2006. The screening criteria are shown in detail below. Based upon the analysis, 86 arterials have been added or modified to the RAS for the 2030 RTP. These modifications increase the RAS mileage by 185 miles bringing the new Regional Arterial System total mileage to 1,038 miles.
Regional Arterial System Screening Criteria
Regional arterials are longer continuous routes that provide accessibility between communities within the region and which also may allow subregional trips to avoid freeway travel. In order to qualify for the updated RAS, arterials must meet at least one of four approved criteria shown below. The first criterion is that the arterial is already included in the existing RAS. Any additions to the network must meet one of the remaining three criteria:
Provides parallel capacity in high-volume corridors to supplement freeways, state highways, and/or other regional arterials (Corridor).
Provides capacity and a direct connection between freeways or other regional arterials, ensuring continuity of the freeway, state highways, and arterial network throughout the region without duplicating other regional facilities (Cross-corridor).
Provides all or part of the route for existing or planned regional and/or corridor transit service that provides headways of 15 minutes or less during the peak-period.
There are certain design characteristics that can help facilitate regional trip movements on the Regional Arterial System. These characteristics can help to facilitate trip movement and include:
Interconnection and systems management of traffic signals
Raised or striped medians
Limitation and separation of left-turn movements
Limited driveway access and other access controls
Grade separations at rail crossings
Shoulders and bikeways to accommodate bicycle movement
Pedestrian treatments at intersections
Priority traffic signal systems for transit service
Bypass or “queue-jumper” lanes for transit service at critical intersections
Enhanced transit stops
Pedestrian facilities designed according to the Regional Pedestrian Design Guidelines
Modern roundabouts and alternate intersection design where appropriate

267
Freeway interchange modifications in accordance with Caltrans standards
Regional Arterial System projects that have received regional funding programmed in the 2006 Regional Transportation Improvement Program (RTIP) are shown in Table TA 7.18. A complete listing of the Regional Arterial System is provided in Table TA 7.19 and shown in Figure TA 7.1. All freeway interchanges are considered part of the Regional Arterial System.
Table TA 7.18—Regionally Funded Arterial System Projects
SPONSOR ARTERIAL LIMITS/ DESCRIPTION FUNDS ($1,000s)
City of El Cajon Jamacha Road E. Main Street to South City Limit/Widen from four to six lanes
$490
City of Encinitas Manchester Avenue/ I-5
Lomas Santa Fe Drive to Manchester Avenue/Modify interchange, widen arterial, and add auxiliary lanes
$2,125
City of Escondido Bear Valley/ East Valley Parkway
Orleans Avenue to North City Limit/Widen from two to six lanes
$7,969
City of Escondido Nordahl Road/SR 78 Mission Avenue to Montiel Road/Widen arterial and modify interchange
$300
City of National City Plaza Boulevard Highland Avenue to Euclid Avenue/Widen from four to six lanes
$2,000
City of Poway Espola Road Twin Peaks Road to Titan Way/Widen from two to four lanes
$290
City of San Diego Friars Road/SR 163 Fashion Valley Road to Frazee Road/Widen arterial and modify interchange
$2,252
City of San Diego I-5/Genesee Replace Genesee Avenue Overcrossing $963
City of San Diego El Camino Real Via de la Valle to San Dieguito Road/Widen arterial $2,680
City of Solana Beach Lomas Santa Fe Drive/ I-5
Via De La Valle to Lomas Santa Fe Drive/Modify interchange, widen arterial, and add auxiliary lanes
$2,525
City of Vista West Vista Way Thunder Drive to Melrose Drive/Widen from two to four lanes
$990
County of SD South Santa Fe Avenue Montgomery Lane to Smilax Road/Widen from two to four lanes
$9,200
County of SD SR 67/ Bradley Avenue
Magnolia Avenue to Graves Avenue/Widen arterial and modify interchange
$750
TOTAL: $32,534


Appendix E
NON-CARRY OVER PROJECTS FROM 2006 RTIP


271
Appendix E
NON-CARRYOVER PROJECTS FROM 2006 RTIP
SANDAG has instituted a new practice for RTIP project listing wherein the status for each project from the previous RTIP is identified. If a project does not show any funding during the RTIP cycle – for the 2008 RTIP, FY 2009 to FY 2013 – then that project is considered non-active for purposes of programming. However, the sponsor agency may still consider the project active because there are ongoing activities. In order to still show these projects SANDAG has provided certain status designations as follows for purposes of programming; sponsor agency designations may differ:
Completed: the project has open to traffic or has begun construction – for federally funded projects, the project funding has been obligated, for state funded projects, the funding has been allocated;
Delayed: (1) project is ongoing but using prior year funding, or (2) the agency has determined there are other higher priority projects. Under either scenario the project may be brought back into the RTIP as appropriate.
Deleted indicates that the agency has decided to no longer pursue the project and requested the project be deleted from the program;
Split/Combine indicates that one project has either split into several projects (as project scope has been refined/expanded) or two or more projects were combined into one project (they may share funding, linkage in scope and environmental document).
The following list of projects falls under one of the above categories.

Status of Projects from Previous RTIP
San Diego Region (in $000s)2006 Regional Transportation Improvement Program - Non Carryover Projects
MPO ID:TITLE:
CAL09BInterstate 5 - HOV/Managed Lanes
Auxiliary Lanes
Caltrans
Capacity Status: NCI 06-16RTIP #:Other - Non construction related activitiesExempt Category:
COMPLETED
From Via De La Valle to Lomas Santa Fe - construct north and southbound auxiliary lanesDESCRIPTION:
EST TOTAL COST:SANDAG ID: 1200502 $9,720
CONRWPEPRIORTOTAL 06/07 07/08 08/09 09/10 10/11
SHOPP (AC) $8,410 $8,410 $8,410
SHOPP - State Cash $1,310 $220 $1,090 $220 $1,090
TOTAL $9,720 $220 $9,500 $220 $9,500
MPO ID:TITLE:
CAL26ASR 52 HOV/Managed Lanes
Capacity Status: CI 06-16RTIP #:DELAYED
From I-805 to SR 125 - construct HOV/Managed LanesDESCRIPTION:
EST TOTAL COST:EA NO: 26970
SANDAG ID: 1205201
$9,179
CONRWPEPRIORTOTAL 06/07 07/08 08/09 09/10 10/11
RSTP $2,253 $2,253 $2,253
TransNet - MC $6,926 $60 $4,582 $2,284 $6,926
TOTAL $9,179 $60 $6,835 $2,284 $9,179
MPO ID:TITLE:
CAL26CSR 52 Truck Lane
Capacity Status: CI 06-16RTIP #:COMPLETED
From Santo Road to Oak Canyon Bridge - extend westbound truck laneDESCRIPTION:
EST TOTAL COST:EA NO: 2T0200
SANDAG ID: 1205202
$8,100
CONRWPEPRIORTOTAL 06/07 07/08 08/09 09/10 10/11
SHOPP (AC) $1,771 $1,771 $1,771
SHOPP - State Cash $229 $229 $229
TransNet - MC $6,100 $6,100 $900 $5,200
TOTAL $8,100 $8,100 $900 $7,200
MPO ID:TITLE:
CAL41CHP Inspection Facility @ Tecate
Capacity Status: NCI 06-16RTIP #:Other - Truck size and weight inspection stationsExempt Category:
COMPLETED
From 0.0 to 0.2 - At Tecate, Mexican border to Humphries Road - construct a Commercial Vehicle
Enforcement Facility (CVEF) and related intersection modifications @ SR188 and Thing Road
DESCRIPTION:
EST TOTAL COST:EA NO: 25650K PPNO: 0887 $32,819
CONRWPEPRIORTOTAL 06/07 07/08 08/09 09/10 10/11
CBI $23,892 $23,892 $3,758 $20,134
SHOPP - State Cash $8,927 $8,927 $7,758 $487 $682
TOTAL $32,819 $23,892 $8,927 $7,758 $4,245 $20,816
Wednesday, June 11, 2008
272

San Diego Region (in $000s)2006 Regional Transportation Improvement Program - Non Carryover Projects
MPO ID:TITLE:
CAL43AHazard Elimination Lump Sum
Caltrans
Capacity Status: NCI 06-16RTIP #:Safety - Hazard elimination programExempt Category:
COMPLETED
Countywide - lump sum for HES program including upgrading traffic systems, installing pavement
markings and raising medians
DESCRIPTION:
EST TOTAL COST: $1,672
CONRWPEPRIORTOTAL 06/07 07/08 08/09 09/10 10/11
HES $1,672 $1,672 $1,672
TOTAL $1,672 $1,672 $1,672
MPO ID:TITLE:
CAL45SHOPP Minor Exempt Projects
Capacity Status: NCI 06-16RTIP #:Safety - Shoulder ImprovementsExempt Category:
COMPLETED
Various locations - lump sum for minor safety projects along state highwaysDESCRIPTION:
EST TOTAL COST: $8,239
CONRWPEPRIORTOTAL 06/07 07/08 08/09 09/10 10/11
Minor Program $8,239 $8,239 $8,239
TOTAL $8,239 $8,239 $8,239
MPO ID:TITLE:
CAL51Ramp Meters
Capacity Status: NCI 06-16RTIP #:Other - Traffic signal synchronization projectsExempt Category:
COMPLETED
From Telegraph Canyon Road to Bonita Road - in Chula Vista, northbound ramp meters and HOV laneDESCRIPTION:
EST TOTAL COST:EA NO: 27620 PPNO: 0932
RTP PAGE NO: 97
$9,808
CONRWPEPRIORTOTAL 06/07 07/08 08/09 09/10 10/11
SHOPP (AC) $8,115 $8,115 $1,588 $6,527
SHOPP - State Cash $1,052 $1,052 $206 $846
STIP-RIP NHS $568 $568 $568
STIP-RIP State Cash $73 $73 $73
TOTAL $9,808 $641 $9,167 $2,435 $7,373
MPO ID:TITLE:
CAL535310 Elderly and Disabled Program
Capacity Status: NCI 06-16RTIP #:COMPLETED
Purchase of vehicles and various capital equipment for the provision of transit service to the eldery and
disabled community
DESCRIPTION:
EST TOTAL COST: $1,058
CONRWPEPRIORTOTAL 06/07 07/08 08/09 09/10 10/11
FTA 5310 $850 $850 $850
Local Funds $208 $208 $208
TOTAL $1,058 $1,058 $1,058
Wednesday, June 11, 2008
273

San Diego Region (in $000s)2006 Regional Transportation Improvement Program - Non Carryover Projects
MPO ID:TITLE:
CAL54TMS on I-5, I-805 and SR-94 (Radar
Scanners)
Caltrans
Capacity Status: NCI 06-16RTIP #:Other - Traffic signal synchronization projectsExempt Category:
COMPLETED
From I-5,I-805 to SR94 - Install radar scannersDESCRIPTION:
EST TOTAL COST:EA NO: 08080K PPNO: 0800 $3,649
CONRWPEPRIORTOTAL 06/07 07/08 08/09 09/10 10/11
STIP-RIP NHS $397 $397 $397
STIP-RIP State Cash $3,252 $52 $3,200 $52 $3,200
TOTAL $3,649 $449 $3,200 $449 $3,200
MPO ID:TITLE:
CAL66State Route 11
Capacity Status: CI 06-16RTIP #:DELAYED - PENDING STATE LEGISLATION
From Border of Mexico east of SR 905/Otay Mesa Border Crossing to Future SR 125/905 junction - study
for future construction of 4-lane freeway and truck bypass road
DESCRIPTION:
EST TOTAL COST:EA NO: 05630K PPNO: 1000
RTP PAGE NO: A-6; B-5
EARMARK NO: CA393/740
$13,801
CONRWPEPRIORTOTAL 06/07 07/08 08/09 09/10 10/11
HPP $800 $800 $800
STIP-IIP NHS $6,882 $6,882 $6,882
STIP-IIP Prior State Cash $5,200 $200 $5,000 $5,200
STIP-IIP State Cash $919 $919 $919
TOTAL $13,801 $7,801 $1,000 $5,000 $13,801
MPO ID:TITLE:
CAL74Transportation Museum
Capacity Status: NCI 06-16RTIP #:Other - Transportation enhancement activitiesExempt Category:
COMPLETED
On Taylor Street in Old Town - interior rehab of existing Caltrans builidngDESCRIPTION:
EST TOTAL COST:EA NO: 26480 PPNO: 0990 $950
CONRWPEPRIORTOTAL 06/07 07/08 08/09 09/10 10/11
STIP-IIP STP TE $841 $164 $677 $164 $677
STIP-IIP State Cash $109 $21 $88 $21 $88
TOTAL $950 $185 $765 $185 $765
MPO ID:TITLE:
CAL78I-805 HOV/Managed Lanes - Split into
CAL 78B/C
Capacity Status: NCI 06-16RTIP #:Other - Engineering studiesExempt Category:
COMPLETED - SPLIT INTO CAL78B AND CAL78C
From 905 to 5 - From SR 905 to I-5 - preliminary engineering for future construction of managed lanesDESCRIPTION:
EST TOTAL COST:SANDAG ID: 1280501/2/3 $16,518
CONRWPEPRIORTOTAL 06/07 07/08 08/09 09/10 10/11
RSTP $5,889 $5,889 $5,889
TransNet - MC $10,629 $42 $4,891 $5,696 $10,629
TOTAL $16,518 $42 $10,780 $5,696 $16,518
Wednesday, June 11, 2008
274

San Diego Region (in $000s)2006 Regional Transportation Improvement Program - Non Carryover Projects
MPO ID:TITLE:
CAL81SR 54 HOV Restripe
Caltrans
Capacity Status: NCI 06-16RTIP #:Safety - Pavement marking demonstrationExempt Category:
COMPLETED
From I-805 to Briarwood Road - restripe HOV lanesDESCRIPTION:
EST TOTAL COST:EA NO: 28190 $110
CONRWPEPRIORTOTAL 06/07 07/08 08/09 09/10 10/11
SHOPP (AC) $89 $89 $89
SHOPP - State Cash $21 $10 $11 $10 $11
TOTAL $110 $10 $100 $10 $100
MPO ID:TITLE:
CAL82HOV bypass to SR 94/SR 125
Connector
Capacity Status: CI 06-16RTIP #:COMPLETED
From Grove Street to Kenwood Drive - add HOV bypass to minimize SR 94 westbound meter queuingDESCRIPTION:
EST TOTAL COST:EA NO: 28040_ $1,235
CONRWPEPRIORTOTAL 06/07 07/08 08/09 09/10 10/11
SHOPP (AC) $974 $974 $974
SHOPP - State Cash $261 $135 $126 $135 $126
TOTAL $1,235 $135 $1,100 $135 $1,100
MPO ID:TITLE:
CAL94Bridge Preventive Maintenance
Program
Capacity Status: NCI 06-16RTIP #:Other - Non construction related activitiesExempt Category:
COMPLETED
Countywide - Planning of bridge preventive maintenance program by local agencies statewide - planning
only for developing project lists
DESCRIPTION:
EST TOTAL COST: $1
CONRWPEPRIORTOTAL 06/07 07/08 08/09 09/10 10/11
HBRR $1 $1 $1
TOTAL $1 $1 $1
MPO ID:TITLE:
CAL95Statewide Scour Plan Action
Capacity Status: NCI 06-16RTIP #:Other - Non construction related activitiesExempt Category:
COMPLETED
Countywide - Scour local agency plan of action statewideDESCRIPTION:
EST TOTAL COST: $1
CONRWPEPRIORTOTAL 06/07 07/08 08/09 09/10 10/11
HBRR $1 $1 $1
TOTAL $1 $1 $1
MPO ID:TITLE:
CAL104Safe Routes to School
Capacity Status: NCI 06-16RTIP #:Air Quality - Bicycle and pedestrian facilitiesExempt Category:
COMPLETED
Various - (infrastructure) and bike/pedestrian projects to promote safetey around schoolsDESCRIPTION:
EST TOTAL COST: $3,171
CONRWPEPRIORTOTAL 06/07 07/08 08/09 09/10 10/11
SRTS $3,171 $1,551 $1,620 $3,171
TOTAL $3,171 $1,551 $1,620 $3,171
Wednesday, June 11, 2008
275

San Diego Region (in $000s)2006 Regional Transportation Improvement Program - Non Carryover Projects
MPO ID:TITLE:
CB04El Camino Real Improvements
Carlsbad, City of
Capacity Status: CI 06-16RTIP #:COMPLETED - SPLIT INTO CB04A, CB04B AND CB04C
El Camino Real from North of Faraday Avenue to North of Cougar Drive - in Carlsbad,, widen El Camino
Real along the northbound/east side to provide three travel lanes and a bike lane and sidewalk
DESCRIPTION:
EST TOTAL COST:RAS (TA 7-43) $8,720
CONRWPEPRIORTOTAL 06/07 07/08 08/09 09/10 10/11
Local Funds $6,827 $6,827 $6,827
TransNet - L $1,893 $1,893 $1,893
TOTAL $8,720 $8,720 $8,720
MPO ID:TITLE:
CB07Pavement Management Program
Capacity Status: NCI 06-16RTIP #:Safety - Pavement resurfacing and/or rehabilitationExempt Category:
COMPLETED
Various roadways throughout the pavement management zones noted on the project diagram. -
rehabilitate roadway pavement
DESCRIPTION:
EST TOTAL COST: $13,600
CONRWPEPRIORTOTAL 06/07 07/08 08/09 09/10 10/11
TransNet - L $13,600 $8,400 $2,600 $2,600 $13,600
TOTAL $13,600 $8,400 $2,600 $2,600 $13,600
MPO ID:TITLE:
CB11Cannon Road Reach 4
Capacity Status: CI 06-16RTIP #:DELAYED
College Blvd. from Cannon Road to City Limits/Mystra Drive - in Carlsbad along boundary with Oceanside,
construct a new 4-lane arterial with median, bike lanes, sidewalks/pedestrian trails
DESCRIPTION:
EST TOTAL COST:RAS (TA 7-43) $27,000
CONRWPEPRIORTOTAL 06/07 07/08 08/09 09/10 10/11
TransNet - L $1,136 $1,136 $1,136
TOTAL $1,136 $1,136 $1,136
Wednesday, June 11, 2008
276

San Diego Region (in $000s)2006 Regional Transportation Improvement Program - Non Carryover Projects
MPO ID:TITLE:
CHV29L Street Improvements from
Monserate to Nacion Avenue
Chula Vista, City of
Capacity Status: NCI 06-16RTIP #:Safety - Lighting improvementsExempt Category:
DELAYED
L Street from Monserate Ave. to Nacion Ave. - street light installation and relocation to be done in
conjunction with electric utility undergrounding project
DESCRIPTION:
EST TOTAL COST: $430
CONRWPEPRIORTOTAL 06/07 07/08 08/09 09/10 10/11
TransNet - L $430 $430 $15 $415
TOTAL $430 $430 $15 $415
MPO ID:TITLE:
CHV33School Zone Traffic Calming Program
Capacity Status: NCI 06-16RTIP #:Safety - Non signalization traffic control and operatngExempt Category:
COMPLETED
Citywide - field identification and installation/ construction of traffic calming devices in public school zones,
such as traffic control devices (for example, flashing beacons), signs, striping and minor street
improvements
DESCRIPTION:
EST TOTAL COST: $330
CONRWPEPRIORTOTAL 06/07 07/08 08/09 09/10 10/11
Local Funds $50 $25 $25 $50
TransNet - L $280 $150 $130 $280
TOTAL $330 $175 $155 $330
MPO ID:TITLE:
CHV34Neighborhood Traffic and Pedestrian
Safety Program
Capacity Status: NCI 06-16RTIP #:Safety - Non signalization traffic control and operatngExempt Category:
COMPLETED
Citywide - provide community outreach and education regarding traffic/ safety hazards; install and
construct traffic calming and pedestrian safety measures
DESCRIPTION:
EST TOTAL COST: $350
CONRWPEPRIORTOTAL 06/07 07/08 08/09 09/10 10/11
Local Funds $70 $70 $70
TransNet - L $280 $150 $130 $280
TOTAL $350 $220 $130 $350
MPO ID:TITLE:
CHV40Bayshore Bikeway
Capacity Status: NCI 06-16RTIP #:Air Quality - Bicycle and pedestrian facilitiesExempt Category:
COMPLETED
Along Bayshore Bikeway from E Street to Main Street - provide funds for preliminary engineering on
Segments 7 and 8 of the Chula Vista portion of the Bayshore Bikeway
DESCRIPTION:
EST TOTAL COST: $100
CONRWPEPRIORTOTAL 06/07 07/08 08/09 09/10 10/11
Local Funds $50 $50 $50
TransNet - L $50 $50 $50
TOTAL $100 $100 $100
Wednesday, June 11, 2008
277

San Diego Region (in $000s)2006 Regional Transportation Improvement Program - Non Carryover Projects
MPO ID:TITLE:
CHV41Western Chula Vista TDIF
Chula Vista, City of
Capacity Status: NCI 06-16RTIP #:Other - Engineering studiesExempt Category:
COMPLETED
Citywide - prepare document to enable the City to establish a western Chula Vista Transportation
Development Impact Fee (TDIF) to finance the construction of regional improvements to comply with the
RTCIP component of the TransNet Ordinance
DESCRIPTION:
EST TOTAL COST: $350
CONRWPEPRIORTOTAL 06/07 07/08 08/09 09/10 10/11
TransNet - L $350 $350 $350
TOTAL $350 $350 $350
MPO ID:TITLE:
CHV42Major Intersection Safety
Capacity Status: NCI 06-16RTIP #:Other - Intersection signalization projectsExempt Category:
COMPLETED
Citywide - This project will provide improvements such as traffic and pedestrian signals, striping, signage
and roadway improvements to increase safety and reduce congestion at high volume, high incident major
intersections (see attached list for specific locations)
DESCRIPTION:
EST TOTAL COST: $200
CONRWPEPRIORTOTAL 06/07 07/08 08/09 09/10 10/11
Local Funds $100 $100 $25 $75
TransNet - L $100 $100 $25 $75
TOTAL $200 $200 $50 $150
Wednesday, June 11, 2008
278

San Diego Region (in $000s)2006 Regional Transportation Improvement Program - Non Carryover Projects
MPO ID:TITLE:
COR06SR 75/282 Toll Removal Mitigation
Coronado, City of
Capacity Status: NCI 06-16RTIP #:Other - Intersection channelization projectsExempt Category:
COMPLETED
Traffic metering at the toll plaza; traffic signals at the intersections of B Avenue and Third and Fourth
Streets, F Avenue and Third and Fourth Streets, Alameda Boulevard and Fourts Street; bulbouts at various
locations on SR 282; and landscape enhancements. - From San Diego-Coronado bridge plaza to Naval Air
Station North Island - mitigation and enhancement measures including metering, traffic signals, bulbouts,
landscaping
DESCRIPTION:
EST TOTAL COST: $2,100
CONRWPEPRIORTOTAL 06/07 07/08 08/09 09/10 10/11
Toll - Managed Lanes $2,100 $1,400 $700 $700 $1,400
TOTAL $2,100 $1,400 $700 $700 $1,400
Wednesday, June 11, 2008
279

San Diego Region (in $000s)2006 Regional Transportation Improvement Program - Non Carryover Projects
MPO ID:TITLE:
EL10Jamacha Road
El Cajon, City of
Capacity Status: NCI 06-16RTIP #:Other - Engineering studiesExempt Category:
COMPLETED
Jamacha Road from Main St to City limits - future widening of Jamacha Road from 4 to 6 lanesDESCRIPTION:
EST TOTAL COST: $1,313
CONRWPEPRIORTOTAL 06/07 07/08 08/09 09/10 10/11
RSTP $490 $490 $490
TransNet - L $823 $535 $288 $823
TOTAL $1,313 $1,025 $288 $1,313
MPO ID:TITLE:
EL14State Route 54 Corridor Feasibility
Study
Capacity Status: NCI 06-16RTIP #:Other - Engineering studiesExempt Category:
COMPLETED
Jamacha Road from I-8 to City limits - Joint study between the City of El Cajon and the County of San
Diego to determine type of facility (freeway, expressway or other) on this important regional corridor
DESCRIPTION:
EST TOTAL COST: $100
CONRWPEPRIORTOTAL 06/07 07/08 08/09 09/10 10/11
TransNet - L $100 $100 $100
TOTAL $100 $100 $100
Wednesday, June 11, 2008
280

San Diego Region (in $000s)2006 Regional Transportation Improvement Program - Non Carryover Projects
MPO ID:TITLE:
ENC21Hall Property
Encinitas, City of
Capacity Status: NCI 06-16RTIP #:DELAYED
Santa Fe Drive from MacKinnon Ave. to Interstate 5 - reconstruction of Santa Fe Drive from MacKinnon
Avenue to the I-5 Interchange to including new curb, gutter, sidewalk, asphalt and traffic signals, medians,
new driveways, drainage improvements (including storm drains and catch basins), ADA-compliant
pedestrian ramps and new landscaping
DESCRIPTION:
EST TOTAL COST: $2,200
CONRWPEPRIORTOTAL 06/07 07/08 08/09 09/10 10/11
TransNet - L $200 $200 $200
TOTAL $200 $200 $200
MPO ID:TITLE:
ENC23Olivenhain Road
Capacity Status: CI 06-16RTIP #:COMPLETED
Olivenhain Road from Los Pinos Circle to El Camino Real - East of Los Pinos Circle, widen Olivenhain
Road to 3 lanes in the east bound direction, to include bike lane, curb, gutter, and sidewalk.
DESCRIPTION:
EST TOTAL COST: $1,552
CONRWPEPRIORTOTAL 06/07 07/08 08/09 09/10 10/11
Local Funds $252 $252 $252
TransNet - L $600 $600 $600
TransNet - L (Cash) $700 $700 $700
TOTAL $1,552 $852 $700 $1,552
MPO ID:TITLE:
ENC37Encinitas Library Off-Site Street
Improvements
Capacity Status: NCI 06-16RTIP #:Other - Intersection channelization projectsExempt Category:
COMPLETED
E Street, D Street, Cornish - Curb, gutter, sidewalk, pedestrian "pop-outs" and street and drainage
improvements along E Street, D Street and Cornish Drive, to include removal and replacement of degraded
AC pavement, installation of an underground storm drain pipe and cleanout and concrete cross gutter.
DESCRIPTION:
EST TOTAL COST: $400
CONRWPEPRIORTOTAL 06/07 07/08 08/09 09/10 10/11
TransNet - L (Cash) $400 $400 $400
TOTAL $400 $400 $400
MPO ID:TITLE:
ENC38MacKinnon Avenue Bridge
Realignment/Reconstruction PR/ED
Capacity Status: NCI 06-16RTIP #:Other - Engineering studiesExempt Category:
COMPLETED
MadKinnon Avenue Bridge - This project includes the project study report and environmental review for the
realignment and reconstruction of MacKinnon Avenue Bridge. Caltrans will be performing the construction
of this project in conjunction with the widening of I-5. (Previously listed in RTIP under project ENC21 - Hall
Property)
DESCRIPTION:
EST TOTAL COST: $250
CONRWPEPRIORTOTAL 06/07 07/08 08/09 09/10 10/11
TransNet - L $200 $200 $200
TransNet - L (Cash) $50 $50 $50
TOTAL $250 $250 $250
Wednesday, June 11, 2008
281

San Diego Region (in $000s)2006 Regional Transportation Improvement Program - Non Carryover Projects
MPO ID:TITLE:
ENC39Traffic Signal Installations
Encinitas, City of
Capacity Status: NCI 06-16RTIP #:Other - Intersection signalization projectsExempt Category:
COMPLETED
Encinitas Boulevard @ Cerro St, El Camino Real @ Willowsping, El Camino Real @ Crest Avenue -
Encinitas Boulevard at Cerro Street; El Camino Real at Willowspring Drive; and, El Camino Real at Crest
Avenue - construct three traffic signals
DESCRIPTION:
EST TOTAL COST: $700
CONRWPEPRIORTOTAL 06/07 07/08 08/09 09/10 10/11
TransNet - L (Cash) $700 $700 $700
TOTAL $700 $700 $700
MPO ID:TITLE:
ENC40Leucadia Boulevard Improvements (I-5
to Vulcan Avenue)
Capacity Status: NCI 06-16RTIP #:Safety - Pavement resurfacing and/or rehabilitationExempt Category:
COMPLETED
Leucadia Blvd. from Interstate 5 to Coast Hwy. 101 - Install curbs, sidewalks, bike lanes and minor
reconstruction including one modern roundabout. Improvements include: construction of a modern
roundabout at Hymettus and Hermes Avenue(s); street improvements of curb, gutter, sidewalk, and
landscaping from Hermes to Vulcan; construction of left-hand turn pockets on Vulcan and an asphalt
pathway on the north side of Leucadia in any missing sidewalk links
DESCRIPTION:
EST TOTAL COST: $2,822
CONRWPEPRIORTOTAL 06/07 07/08 08/09 09/10 10/11
Local Funds $251 $251 $251
TransNet - L (Cash) $2,571 $2,571 $2,571
TOTAL $2,822 $2,822 $2,822
Wednesday, June 11, 2008
282

San Diego Region (in $000s)2006 Regional Transportation Improvement Program - Non Carryover Projects
MPO ID:TITLE:
IB03Street Maintenance & Improvement -
Slurry Seal
Imperial Beach, City of
Capacity Status: NCI 06-16RTIP #:Safety - Pavement resurfacing and/or rehabilitationExempt Category:
COMPLETED
Various locations - slurry seal, curb & gutter repairsDESCRIPTION:
EST TOTAL COST: $874
CONRWPEPRIORTOTAL 06/07 07/08 08/09 09/10 10/11
TransNet - L $816 $508 $108 $200 $30 $786
TransNet - L (Cash) $58 $58 $58
TOTAL $874 $508 $108 $258 $30 $844
MPO ID:TITLE:
IB08Street Maintenance & Improvements -
Minor projects
Capacity Status: NCI 06-16RTIP #:Safety - Pavement resurfacing and/or rehabilitationExempt Category:
COMPLETED
South Seacoast Drive from 700 to 1600 - Various locations - minor repairs such as but not limited to street
repairs, striping, and sign repairs
DESCRIPTION:
EST TOTAL COST: $342
CONRWPEPRIORTOTAL 06/07 07/08 08/09 09/10 10/11
TransNet - L $342 $161 $181 $68 $274
TOTAL $342 $161 $181 $68 $274
MPO ID:TITLE:
IB09Reconfiguration of the NOLF Entrance
(Ream Field)
Capacity Status: NCI 06-16RTIP #:Other - Interchange reconfiguration projectsExempt Category:
COMPLETED
Iris Ave from 13th to Iris Ave - reconfigure the intersection at the entrance to Ream Field to increase safetyDESCRIPTION:
EST TOTAL COST: $150
CONRWPEPRIORTOTAL 06/07 07/08 08/09 09/10 10/11
TransNet - L $100 $100 $100
TransNet - L (Cash) $50 $50 $50
TOTAL $150 $100 $50 $150
Wednesday, June 11, 2008
283

San Diego Region (in $000s)2006 Regional Transportation Improvement Program - Non Carryover Projects
MPO ID:TITLE:
LG08Major Street Improvements
Lemon Grove, City of
Capacity Status: NCI 06-16RTIP #:Safety - Pavement resurfacing and/or rehabilitationExempt Category:
COMPLETED
Citywide. - Sidewalk Rehabilitation: This annually scheduled project removes/replaces various sidewalk
locations citywide including the installation of ADA compliant curb ramps. This project was advertised and
awarded for construction in February 2008. Staff expects construction to begin in April 2008 and to be
complete this fiscal year.
LGA Pavement Rehabilitation: The southbound lanes of Lemon Grove Avenue, from Central Avenue to the
southerly City limits, were rehabilitated using rubberized asphalt in October 2007 at a cost of $495,498.
Rehabilitation of the north bound lanes await the completion of the upgrade to the sewer main on Lemon
Grove Avenue. It is planned that the northbound lanes will be paved immediately after the sewer upgrade
project is complete.
LGA Realignment Project: A key project in the redevelopment of the City’s Downtown Village Specific
Plan, this project improves access to and from SR-94, reducing motorist delays and emissions, while
greatly enhancing the visual appeal of the block adjacent to the trolley station. This project utilizes funds
from multiple revenue sources including SDG&E 20A Undergrounding Funds, Prop 1B, and redevelopment
funds. This project is expected to begin in FY 09 and extend into FY 10.
Pavement Rehabilitation (Citywide): This project involves the pavement rehabilitation of several streets
within the City. Streets were prioritized for work based on levels of deterioration identified in the Pavement
Management System.
Pavement Management System: This is an annual program that updates the list of paved streets that
need to be improved within the city. This process involves a survey of City streets, assignment of an
objective score to each street based upon the observed conditions, and finally a prioritized list of needed
repairs being determined. This process should occur approximately every other year. Having this
standardized Pavement Management System in place is required by many grants that the City may seek
for road work.
Massachusetts Avenue Corridor Project: This project will design and construct improves at multiple
intersections along Massachusetts Avenue. Those intersections include Broadway Avenue, San Miguel
Avenue, and Lemon Grove Avenue/Main Street/Canton Drive/San Altos Place, all intersecting with
Massachusetts Avenue.
DESCRIPTION:
EST TOTAL COST: $2,370
CONRWPEPRIORTOTAL 06/07 07/08 08/09 09/10 10/11
TransNet - L $1,266 $650 $616 $222 $1,044
TransNet - L (Cash) $1,104 $1,104 $1,104
TOTAL $2,370 $650 $1,720 $222 $2,148
Wednesday, June 11, 2008
284

San Diego Region (in $000s)2006 Regional Transportation Improvement Program - Non Carryover Projects
MPO ID:TITLE:
LG09Traffic Improvement Projects
Lemon Grove, City of
Capacity Status: NCI 06-16RTIP #:Other - Traffic signal synchronization projectsExempt Category:
COMPLETED
Citywide - Street Stripingand legends through out the City including:
Upgrade of Signs: Remove/replace existing signs in the City. In accordance with the City’s replacement
program. Targeted signs will include needed and damaged.
Traffic Loop Replacement: Replace damaged loops as a results of weather damaged and deterioration of
the street pavement.
Traffic Signal Upgrade: Improve upon traffic signals and pedestrian activation buttons citywide. Increase
safety/responsiveness for pedestrian crosswalks with technological improvements as they become
available.
Traffic Calming: Identify excessive speed areas, alternatives analysis, and installation of traffic calming
devices such as signage, lighting, signals, speed humps, striping, or raised curbs.
DESCRIPTION:
EST TOTAL COST: $190
CONRWPEPRIORTOTAL 06/07 07/08 08/09 09/10 10/11
TransNet - L $190 $120 $70 $26 $164
TOTAL $190 $120 $70 $26 $164
MPO ID:TITLE:
LG12Street Drainage Improvements
Capacity Status: NCI 06-16RTIP #:DELETED
Citywide - Elkhorn Street Storm Drain Improvements: Install drainage pipe to convey constant spring /
ground water into a storm drain system. This will provide proper drainage from the roadway.
Chollas Creek Maintenance Program: Remove debris, vegetation control, and habitat control in order to
ensure the proper flow of surface waters draining from roadways at various locations in the City.
Storm Drain Rehabilitation Program: This will evaluate, prioritize, and implement improvements to the
City’s storm drain systems on a bi-annual basis. Staff will identify deteriorated or problematic portions of
the storm drain system perform risk assessments to prioritize need and perform necessary repairs or
replacements in order to achievement the maximum amount of flow as possible.
DESCRIPTION:
EST TOTAL COST: $285
CONRWPEPRIORTOTAL 06/07 07/08 08/09 09/10 10/11
TOTAL
Wednesday, June 11, 2008
285

San Diego Region (in $000s)2006 Regional Transportation Improvement Program - Non Carryover Projects
MPO ID:TITLE:
NC10I-805 Noise Barriers (Soundwall)
National City, City of
Capacity Status: NCI 06-16RTIP #:DELAYED
Plaza Blvd. from I-805 to I-805 - Along east side of I-805 (northbound) between Plaza Boulevard and 4th
Street - install Soundwall (DEMO ID. CA444; HPP No. 1307)
DESCRIPTION:
EST TOTAL COST: $680
CONRWPEPRIORTOTAL 06/07 07/08 08/09 09/10 10/11
HPP $680 $120 $560 $120 $560
TOTAL $680 $120 $560 $120 $560
Wednesday, June 11, 2008
286

San Diego Region (in $000s)2006 Regional Transportation Improvement Program - Non Carryover Projects
MPO ID:TITLE:
NCTD16AOceanside-Escondido Rail
Non-federal
North County Transit District
Capacity Status: CI 06-16RTIP #:COMPLETED
From Oceanside to Escondido - From Oceanside to Escondido - locally funded miscellaneous costs
associated with Sprinter project including development designs, track work, road widenings, settlements,
vehicle purchases, easement costs, and debt service during construction
DESCRIPTION:
EST TOTAL COST: $23,873
CONRWPEPRIORTOTAL 06/07 07/08 08/09 09/10 10/11
Local Funds $22,563 $18,638 $3,925 $22,563
TransNet - Transit $1,310 $1,310 $1,310
TOTAL $23,873 $19,948 $3,925 $1,310 $22,563
MPO ID:TITLE:
NCTD32Oceanside Transit Center Parking
Capacity Status: NCI 06-16RTIP #:Other - Bus terminals and transfer pointsExempt Category:
COMPLETED
From Oceanside to Oceanside - At Oceanside Transit Center - build multi-level parking structure to
accommodate multi-modal transit services
DESCRIPTION:
EST TOTAL COST:PPNO: 7309 $11,132
CONRWPEPRIORTOTAL 06/07 07/08 08/09 09/10 10/11
CMAQ $3,482 $3,482 $3,482
FTA 5309 (Bus) $2,000 $2,000 $2,000
Local Funds $2,400 $2,400 $400 $2,000
RSTP $1,232 $1,232 $1,232
TCRP $1,500 $1,500 $910 $590
TransNet - Transit $518 $518 $518
TOTAL $11,132 $10,614 $518 $910 $400 $9,822
Wednesday, June 11, 2008
287

San Diego Region (in $000s)2006 Regional Transportation Improvement Program - Non Carryover Projects
MPO ID:TITLE:
O04Miscellaneous Street Improvements
Oceanside, City of
Capacity Status: NCI 06-16RTIP #:Safety - Pavement resurfacing and/or rehabilitationExempt Category:
COMPLETED
Citywide - in Oceanside, asphalt overlay of arterial streets as a permanent road surface improvement.DESCRIPTION:
EST TOTAL COST: $7,900
CONRWPEPRIORTOTAL 06/07 07/08 08/09 09/10 10/11
TransNet - L $6,900 $2,400 $2,000 $2,500 $6,900
TransNet - L (Cash) $1,000 $1,000 $1,000
TOTAL $7,900 $2,400 $2,000 $3,500 $7,900
MPO ID:TITLE:
O13Street Rehabilitation
Capacity Status: NCI 06-16RTIP #:Safety - Pavement resurfacing and/or rehabilitationExempt Category:
COMPLETED
Various residential and collector streets throughout the city - in Oceanside, slurry seal and street
maintenance repair
DESCRIPTION:
EST TOTAL COST: $4,568
CONRWPEPRIORTOTAL 06/07 07/08 08/09 09/10 10/11
TransNet - L $2,868 $1,368 $500 $1,000 $2,868
TransNet - L (Cash) $1,700 $1,700 $1,700
TOTAL $4,568 $1,368 $500 $2,700 $4,568
MPO ID:TITLE:
O15Pacific Bridge over San Luis Rey
Capacity Status: NCI 06-16RTIP #:Safety - Non capacity widening or bridge reconstructionExempt Category:
COMPLETED
Pacific Street from Harbor Drive to 500 ft north of Breakwater St. - replace vulnerable low-water crossing
with a permanent bridge with same number of lanes and adds bikes lanes and sidewalks
DESCRIPTION:
EST TOTAL COST: $15,520
CONRWPEPRIORTOTAL 06/07 07/08 08/09 09/10 10/11
HBRR $1,735 $1,735 $1,653 $82
Local Funds $13,385 $13,385 $413 $21 $12,951
TransNet - L $400 $200 $200 $400
TOTAL $15,520 $15,120 $200 $200 $2,066 $103 $13,351
Wednesday, June 11, 2008
288

San Diego Region (in $000s)2006 Regional Transportation Improvement Program - Non Carryover Projects
MPO ID:TITLE:
SAN21Non-motorized Projects
San Diego Association of Governments
Capacity Status: NCI 06-16RTIP #:
Various locations countywide - lump sum for non-motorized projectsDESCRIPTION:
EST TOTAL COST: $11,232
CONRWPEPRIORTOTAL 06/07 07/08 08/09 09/10 10/11
Local Funds $750 $750 $750
TDA - Bicycles $5,816 $1,661 $2,106 $2,049 $1,775 $4,041
TransNet - B $4,666 $3,276 $1,300 $90 $673 $3,993
TOTAL $11,232 $4,937 $4,156 $2,139 $2,448 $8,784
Completed bike-pedestrian projects*
MPO ID:TITLE:
SAN30San Dieguito Bridge
Capacity Status: NCI 06-16RTIP #:Mass Transit - Track rehabilitation in existing right of wayExempt Category:
DELAYED
From MP 240: Del Mar to MP 245: Solana Beach - replace bridge and add new segment of main track to
connect with passing tracks
DESCRIPTION:
EST TOTAL COST: $855
CONRWPEPRIORTOTAL 06/07 07/08 08/09 09/10 10/11
STIP-IIP PTA $855 $855 $855
TOTAL $855 $855 $855
MPO ID:TITLE:
SAN35Transit First Bus Rapid Transit
Capacity Status: NCI 06-16RTIP #:Mass Transit - Reconstruction or renovation of transit
structures
Exempt Category:COMPLETED
various - Implementation of Transit First projects such as signalization, re-striping, que jumping on existing
right-or-way
DESCRIPTION:
EST TOTAL COST: $6,260
CONRWPEPRIORTOTAL 06/07 07/08 08/09 09/10 10/11
FTA 5307 $323 $323 $323
FTA 5309 (Bus) $2,521 $2,521 $2,521
Local Funds $577 $577 $577
TransNet - Transit $2,839 $2,839 $2,839
TOTAL $6,260 $6,260 $6,260
STIP-TransNet swap*
MPO ID:TITLE:
SAN36Bus/Rail Signal & Communications
Equipment
Capacity Status: NCI 06-16RTIP #:Mass Transit - Track rehabilitation in existing right of wayExempt Category:
DELAYED
Countywide - bid display module, dispatch softwareDESCRIPTION:
EST TOTAL COST: $11,766
CONRWPEPRIORTOTAL 06/07 07/08 08/09 09/10 10/11
FTA 5307 $8,301 $8,301 $8,301
FTA 5309 (FG) $1,112 $1,112 $1,112
Local Funds $2,353 $2,353 $2,353
TOTAL $11,766 $11,766 $11,766
Wednesday, June 11, 2008
289

San Diego Region (in $000s)2006 Regional Transportation Improvement Program - Non Carryover Projects
MPO ID:TITLE:
SAN41Replace Santa Margarita Bridge
San Diego Association of Governments
Capacity Status: NCI 06-16RTIP #:Mass Transit - Reconstruction or renovation of transit
structures
Exempt Category:COMPLETED
From Stuart Mesa to Fallbrook Passing Track - Near Oceanside - within the boundaries of Pendleton
USMC Base at the Santa Margarita River - replace bridge and construct double track to Stuart Mesa and
Fallbrook passing tracks
DESCRIPTION:
EST TOTAL COST:PPNO: 2006 $42,700
CONRWPEPRIORTOTAL 06/07 07/08 08/09 09/10 10/11
STIP-IIP PTA $17,193 $987 $16,206 $987 $16,206
STIP-IIP STP $2,213 $2,213 $2,213
STIP-IIP State Cash $287 $287 $287
TCRP $23,007 $23,007 $23,007
TOTAL $42,700 $2,500 $987 $39,213 $3,487 $39,213
MPO ID:TITLE:
SAN52East County Bus Maintenance
Facility
Capacity Status: NCI 06-16RTIP #:Mass Transit - Const of new bus or rail storage/maint
facilities excluded in 23 CFR part 771
Exempt Category:DELAYED
In El Cajon - construction of new bus facility to provide capacity for operation and maintenance for 100-150
vehicles
DESCRIPTION:
EST TOTAL COST: $17,440
CONRWPEPRIORTOTAL 06/07 07/08 08/09 09/10 10/11
CMAQ $50 $50 $50
FTA 5307 $5,595 $5,395 $200 $4,910 $685
FTA 5309 (Bus) $3,145 $2,945 $200 $3,145
FTA 5311 $200 $200 $200
Local Funds $2,087 $2,087 $1,628 $459
STA $500 $500 $500
TOTAL $11,577 $10,427 $950 $200 $6,538 $5,039
MPO ID:TITLE:
SAN56Signal and Communication
Equipment (Bus and Fixed Guideway)
Capacity Status: NCI 06-16RTIP #:Mass Transit - Construction or renovation of power, signal,
and communications systems
Exempt Category:DELAYED
Countywide - provide for signal and communication for bus and fixed guideway operations including, but
not limited to, signal cases, train location, train control, and radios
DESCRIPTION:
EST TOTAL COST: $280
CONRWPEPRIORTOTAL 06/07 07/08 08/09 09/10 10/11
FTA 5307 $204 $204 $204
FTA 5309 (FG) $76 $76 $76
TOTAL $280 $280 $280
Wednesday, June 11, 2008
290

San Diego Region (in $000s)2006 Regional Transportation Improvement Program - Non Carryover Projects
MPO ID:TITLE:
CNTY06Los Coches Road II
San Diego County
Capacity Status: NCI 06-16RTIP #:Other - Interchange reconfiguration projectsExempt Category:
COMPLETED
Los Coches Road from Julian Ave to Woodside Ave - Phase I: From Hwy 8 (Olde 80) to Julian Avenue;
Phase II: Julian Ave to Woodside Ave - reconstruct to provide 2 traffic lanes with left turn lane, parking
lanes, and bike lanes
DESCRIPTION:
EST TOTAL COST: $5,330
CONRWPEPRIORTOTAL 06/07 07/08 08/09 09/10 10/11
TransNet - L $5,330 $5,277 $53 $744 $4,586
TOTAL $5,330 $5,277 $53 $744 $4,586
MPO ID:TITLE:
CNTY08Mission Road
Capacity Status: CI 06-16RTIP #:COMPLETED
Mission Road from Pepper Tree Ln to Clemmens Ln - From Pepper Tree Lane to Clemmens Lane in
Fallbrook - widen from 3 to 5 lanes
DESCRIPTION:
EST TOTAL COST:RAS (A-15) $9,788
CONRWPEPRIORTOTAL 06/07 07/08 08/09 09/10 10/11
TransNet - L $9,788 $8,803 $985 $5 $9,783
TOTAL $9,788 $8,803 $985 $5 $9,783
MPO ID:TITLE:
CNTY16SR52 Forester Creek
Capacity Status: NCI 06-16RTIP #:Other - Intersection channelization projectsExempt Category:
COMPLETED
Forrester Creek from Mission Gorge to Prospect Ave - $3M County contribution to Forester Creek
Drainage project (City of Santee)
DESCRIPTION:
EST TOTAL COST: $3,000
CONRWPEPRIORTOTAL 06/07 07/08 08/09 09/10 10/11
TransNet - L $3,000 $385 $2,615 $3,000
TOTAL $3,000 $385 $2,615 $3,000
MPO ID:TITLE:
CNTY22Valley Center Road Bridge
Capacity Status: NCI 06-16RTIP #:Safety - Non capacity widening or bridge reconstructionExempt Category:
COMPLETED
Over San Luis River - At San Luis River - replace 2-lane structurally deficient bridge with a 4-lane wide
bridge, striped for 2-lanes.
DESCRIPTION:
EST TOTAL COST: $2,764
CONRWPEPRIORTOTAL 06/07 07/08 08/09 09/10 10/11
HBP $66 $66 $66
HBRR $1,151 $1,151 $1,151
Local Funds $1,547 $149 $1,398 $149 $9 $1,389
TOTAL $2,764 $1,300 $1,464 $1,300 $75 $1,389
Wednesday, June 11, 2008
291

San Diego Region (in $000s)2006 Regional Transportation Improvement Program - Non Carryover Projects
MPO ID:TITLE:
CNTY23Valley Center Road (Wohlford
Intersection)
San Diego County
Capacity Status: CI 06-16RTIP #:COMPLETED
Valley Center Road from East of Valley Center Rd to Cole Grade Rd - From East of Valley Center & Cole
Grade Road and extending approximately 6 miles to Rincon Casino - widen from 2 to 3 lanes; construct
traffic signal at North Lake Wohlford Road/Valley Center Road intersection
DESCRIPTION:
EST TOTAL COST:RAS (A-17) $1,605
CONRWPEPRIORTOTAL 06/07 07/08 08/09 09/10 10/11
TransNet - L $1,605 $454 $1,151 $264 $159 $1,182
TOTAL $1,605 $454 $1,151 $264 $159 $1,182
Wednesday, June 11, 2008
292

San Diego Region (in $000s)2006 Regional Transportation Improvement Program - Non Carryover Projects
MPO ID:TITLE:
MTS27Mission Valley East Light Rail Project
San Diego Metropolitan Transit System
Capacity Status: CI 06-16RTIP #:COMPLETED
From transit to transit - 5.8 mile extension of SD Blue Line with 4 stations, including tunnel at SD State
University campus
DESCRIPTION:
EST TOTAL COST: $505,867
CONRWPEPRIORTOTAL 06/07 07/08 08/09 09/10 10/11
CMAQ $20,227 $20,227 $20,227
FTA 5309 (NS) $329,958 $329,151 $807 $329,958
Local Funds $2,047 $2,047 $2,047
PTA $3,734 $3,734 $3,734
STIP-GF RIP State Cash $69,095 $69,095 $69,095
TransNet - Transit $80,806 $70,854 $9,952 $80,806
TOTAL $505,867 $495,108 $9,952 $807 $505,867
MPO ID:TITLE:
MTS27AMission Valley East LRT Operating
Capacity Status: NCI 06-16RTIP #:Mass Transit - Transit operating assistanceExempt Category:
COMPLETED
Blue Line - Start-up cost for the 5.8 mile extension of Blue LineDESCRIPTION:
EST TOTAL COST: $18,977
CONRWPEPRIORTOTAL 06/07 07/08 08/09 09/10 10/11
CMAQ $16,800 $7,000 $5,600 $4,200 $16,800
Local Funds $2,177 $907 $726 $544 $2,177
TOTAL $18,977 $7,907 $6,326 $4,744 $18,977
MPO ID:TITLE:
MTS41Regional Fare Technology Debt
Service
Capacity Status: NCI 06-16RTIP #:Other - Non construction related activitiesExempt Category:
COMPLETED
MTS service area - Debt service payments for bond issue for the regional fare technology project (SAN22)DESCRIPTION:
EST TOTAL COST: $4,075
CONRWPEPRIORTOTAL 06/07 07/08 08/09 09/10 10/11
FTA 5307 $3,260 $3,260 $3,260
Local Funds $815 $815 $815
TOTAL $4,075 $4,075 $4,075
Wednesday, June 11, 2008
293

San Diego Region (in $000s)2006 Regional Transportation Improvement Program - Non Carryover Projects
MPO ID:TITLE:
SD05Euclid Avenue Improvements
San Diego, City of
Capacity Status: NCI 06-16RTIP #:Other - Plantings, landscaping, etcExempt Category:
COMPLETED
Euclid Avenue from Home Avenue to El Cajon Blvd - in San Diego, street improvements including curb,
gutter, sidewalk, landscaping, paving and traffic calming installations (CIP: 52-699.0)
DESCRIPTION:
EST TOTAL COST: $892
CONRWPEPRIORTOTAL 06/07 07/08 08/09 09/10 10/11
Local Funds $587 $587 $246 $341
TransNet - L $305 $235 $70 $305
TOTAL $892 $822 $70 $246 $646
MPO ID:TITLE:
SD10Ocean Front Walk Reconstruction
Capacity Status: NCI 06-16RTIP #:Safety - Lighting improvementsExempt Category:
COMPLETED
Ocean Front Walk from San Fernando Pl to Ventura Pl - in San Diego, remove & replace exisiting pile
cap, parapet wall, lights & walkway (CIP: 52-671)
DESCRIPTION:
EST TOTAL COST: $590
CONRWPEPRIORTOTAL 06/07 07/08 08/09 09/10 10/11
Local Funds $390 $390 $390
TransNet - L $200 $17 $183 $15 $185
TOTAL $590 $390 $17 $183 $405 $185
MPO ID:TITLE:
SD13Sunset Cliffs Blvd.
Capacity Status: NCI 06-16RTIP #:COMPLETED
Sunset Cliffs Blvd from W PointLoma Dr to Nimitz Blvd - widen from two to 4-lanes (CIP 52-698)DESCRIPTION:
EST TOTAL COST: $300
CONRWPEPRIORTOTAL 06/07 07/08 08/09 09/10 10/11
Local Funds $89 $89 $89
TransNet - L $100 $100 $100
TransNet - L (Cash) $111 $111 $111
TOTAL $300 $189 $111 $300
MPO ID:TITLE:
SD24Coastal Erosion
Capacity Status: NCI 06-16RTIP #:Other - Damage repair caused by unusual disastersExempt Category:
COMPLETED
Along shorelines affecting city streets - in San Diego, correct misc erosion problems (CIP 52-545)DESCRIPTION:
EST TOTAL COST: $104
CONRWPEPRIORTOTAL 06/07 07/08 08/09 09/10 10/11
TransNet - L $104 $54 $50 $50 $54
TOTAL $104 $54 $50 $50 $54
MPO ID:TITLE:
SD43Lisbon-Imperial
Capacity Status: NCI 06-16RTIP #:Other - Noise attenuationExempt Category:
COMPLETED
Lisbon Drive from 71st Street to Imperial Ave - in San Diego, improve traffic flow by adding left turn pocket
from Imperial Ave to 71st Street (CIP 52-654)
DESCRIPTION:
EST TOTAL COST: $1,821
CONRWPEPRIORTOTAL 06/07 07/08 08/09 09/10 10/11
Local Funds $369 $369 $63 $15 $291
TransNet - L $1,452 $1,407 $45 $123 $1,329
TOTAL $1,821 $1,776 $45 $63 $138 $1,620
Wednesday, June 11, 2008
294

San Diego Region (in $000s)2006 Regional Transportation Improvement Program - Non Carryover Projects
MPO ID:TITLE:
SD54Rigel Street Bridge
San Diego, City of
Capacity Status: NCI 06-16RTIP #:Safety - Non capacity widening or bridge reconstructionExempt Category:
COMPLETED
Rigel Street from Dalbergia to I-5 - in San Diego over Chollas Creek - replace exsiting bridge (CIP 52-661)DESCRIPTION:
EST TOTAL COST: $680
CONRWPEPRIORTOTAL 06/07 07/08 08/09 09/10 10/11
Local Funds $158 $158 $158
TransNet - L $522 $522 $200 $322
TOTAL $680 $522 $158 $200 $480
MPO ID:TITLE:
SD65Torrey Pines Road Slope
Reconstruction
Capacity Status: NCI 06-16RTIP #:Safety - Pavement resurfacing and/or rehabilitationExempt Category:
COMPLETED
Torrey Pines Road from Lookout Drive to Roseland Drive - in San Diego, reconstruct 350-foot section of
slope along south side of Torrey Pines (CIP 52-674); stabilize slope (CIP 52-673)
DESCRIPTION:
EST TOTAL COST: $1,168
CONRWPEPRIORTOTAL 06/07 07/08 08/09 09/10 10/11
Local Funds $374 $374 $374
TransNet - L $794 $714 $65 $15 $794
TOTAL $1,168 $1,088 $65 $15 $1,168
MPO ID:TITLE:
SD71General Fund Reimbursement
Capacity Status: NCI 06-16RTIP #:COMPLETED
General fund reimbursement - Reimbursement to City's general fund for eligible TransNet expensesDESCRIPTION:
EST TOTAL COST: $64,551
CONRWPEPRIORTOTAL 06/07 07/08 08/09 09/10 10/11
TransNet - L $64,551 $32,328 $15,968 $16,255 $64,551
TOTAL $64,551 $32,328 $15,968 $16,255 $64,551
MPO ID:TITLE:
SD104Reo Drive Improvement
Capacity Status: NCI 06-16RTIP #:Safety - Pavement resurfacing and/or rehabilitationExempt Category:
COMPLETED
Reo Drive from Albermarle to Cumberland - in San Diego, provide improvements including relocation bus
stops, restriping, installing catch basins, replacing curb & gutter; reconstruct Reo Drive including diagonal
parking, street lights, sidewalks, pop outs and pedestrian ramps (CIP 39-233)
DESCRIPTION:
EST TOTAL COST: $1,150
CONRWPEPRIORTOTAL 06/07 07/08 08/09 09/10 10/11
TransNet - L $1,150 $190 $310 $650 $1,150
TOTAL $1,150 $190 $310 $650 $1,150
MPO ID:TITLE:
SD107North Torrey Pines Road @ Genesee
Capacity Status: NCI 06-16RTIP #:Other - Interchange reconfiguration projectsExempt Category:
COMPLETED
N Torrey Pines Rd from Genesee to Genesee - In San Diego on North Torrey Pines Road at Genesee
Avenue - Reconstruction of intersection (CIP 52-471)
DESCRIPTION:
EST TOTAL COST:RAS (TA7-48) $100
CONRWPEPRIORTOTAL 06/07 07/08 08/09 09/10 10/11
TransNet - L $100 $100 $100
TOTAL $100 $100 $100
Wednesday, June 11, 2008
295

San Diego Region (in $000s)2006 Regional Transportation Improvement Program - Non Carryover Projects
MPO ID:TITLE:
SD111Mission Beach Boardwalk
San Diego, City of
Capacity Status: NCI 06-16RTIP #:Safety - Guardrails, median barriers, crash cushionsExempt Category:
COMPLETED
Ocean Front Walk from Santa Barbara Pl to Thomas Ave - in San Diego, widen boardwalk and strenghten
seawall (CIP 52-533)
DESCRIPTION:
EST TOTAL COST: $2,281
CONRWPEPRIORTOTAL 06/07 07/08 08/09 09/10 10/11
Local Funds $685 $685 $207 $478
TEA-R $1,186 $1,186 $1,186
TransNet - L $410 $310 $100 $265 $145
TOTAL $2,281 $2,181 $100 $472 $1,809
MPO ID:TITLE:
SD113I-5/Sorrento Valley Road
Capacity Status: NCI 06-16RTIP #:Other - Engineering studiesExempt Category:
DELAYED
Interstate 5 from Sorrento Valley Rd to Sorrento Valley Rd - in San Diego, future new freeway access
interchange including ramp (CIP 52-765.0)
DESCRIPTION:
EST TOTAL COST:RAS (TA7-41) $3,600
CONRWPEPRIORTOTAL 06/07 07/08 08/09 09/10 10/11
DEMO - Sec 115 $1,500 $1,500 $1,500
STP - Sec 112 $600 $600 $600
STP - Sec 117 $1,500 $1,500 $1,500
TOTAL $3,600 $3,000 $600 $3,600
MPO ID:TITLE:
SD114Rose Creek Beach Bikeway
Capacity Status: NCI 06-16RTIP #:Air Quality - Bicycle and pedestrian facilitiesExempt Category:
COMPLETED
Rose Creek to westerly end of Pacific Beach - in San Diego, design class I bike path (581470)DESCRIPTION:
EST TOTAL COST: $350
CONRWPEPRIORTOTAL 06/07 07/08 08/09 09/10 10/11
TransNet - L $350 $100 $250 $350
TOTAL $350 $100 $250 $350
MPO ID:TITLE:
SD115La Jolla Village Drive/I-805
Interchange Ramps
Capacity Status: NCI 06-16RTIP #:Other - Interchange reconfiguration projectsExempt Category:
DELAYED
I 805 from La Jolla Village to La Jolla Village - In San Diego on I-805 at La Jolla Village Drive - reconfigure
interchange and add 220 meters of acceleration lane (524850)
DESCRIPTION:
EST TOTAL COST:RAS (TA7-47) $19,150
CONRWPEPRIORTOTAL 06/07 07/08 08/09 09/10 10/11
Local Funds $19,150 $19,150 $3,055 $16,095
TOTAL $19,150 $19,150 $3,055 $16,095
Wednesday, June 11, 2008
296

San Diego Region (in $000s)2006 Regional Transportation Improvement Program - Non Carryover Projects
MPO ID:TITLE:
SD132Bird Rock Coastal Traffic Flow
Improvement
San Diego, City of
Capacity Status: NCI 06-16RTIP #:Other - Traffic signal synchronization projectsExempt Category:
COMPLETED
La Jolla Boulevard from Turquoise to Bird Rock - in San Diego, construct 3 modern roundabouts on La
Jolla Blvd and extensive traffic calming devices; improve pedestrian, bicycle, and transit accessibility;
provide over 30 new on-street parking spaces (CIP 52-717.0)
DESCRIPTION:
EST TOTAL COST: $2,400
CONRWPEPRIORTOTAL 06/07 07/08 08/09 09/10 10/11
Local Funds $1,400 $1,400 $1,400
TransNet - L $1,000 $1,000 $1,000
TOTAL $2,400 $1,400 $1,000 $2,400
MPO ID:TITLE:
SD135North Harbor Drive Bridge over Navy
Estuary
Capacity Status: NCI 06-16RTIP #:Safety - Non capacity widening or bridge reconstructionExempt Category:
COMPLETED
On North Harbor Drive Bridge over the Navy estuary - in San Diego, seismic retrofit of the bridge which
includes stabilizing the existing piers and joing the piers together to increase support during seismic
events(530381)
DESCRIPTION:
EST TOTAL COST:RAS (TA7-48) $2,000
CONRWPEPRIORTOTAL 06/07 07/08 08/09 09/10 10/11
TransNet - L $2,000 $2,000 $2,000
TOTAL $2,000 $2,000 $2,000
MPO ID:TITLE:
SD136Ocean Beach Bike Path/Hotel Circle
North Bikeway Design
Capacity Status: NCI 06-16RTIP #:Air Quality - Bicycle and pedestrian facilitiesExempt Category:
DELAYED
Ocean Beach east to Hotel Circle along south side of San Diego River - design class I bike path (581560)DESCRIPTION:
EST TOTAL COST: $50
CONRWPEPRIORTOTAL 06/07 07/08 08/09 09/10 10/11
TransNet - L $50 $50 $50
TOTAL $50 $50 $50
MPO ID:TITLE:
SD154La Jolla Mesa Drive Sidewalk
Capacity Status: NCI 06-16RTIP #:Safety - Pavement resurfacing and/or rehabilitationExempt Category:
COMPLETED
On La Jolla Mesa Drive (east side) south of Deer Hill Court - in San Diego, install curb, gutter, sidewalk
(CIP 52-780.0)
DESCRIPTION:
EST TOTAL COST: $115
CONRWPEPRIORTOTAL 06/07 07/08 08/09 09/10 10/11
TransNet - L $115 $115 $115
TOTAL $115 $115 $115
Wednesday, June 11, 2008
297

San Diego Region (in $000s)2006 Regional Transportation Improvement Program - Non Carryover Projects
MPO ID:TITLE:
SD16062nd to 65th Street Channel
Improvements
San Diego, City of
Capacity Status: NCI 06-16RTIP #:Safety - Pavement resurfacing and/or rehabilitationExempt Category:
DELAYED
On 62nd and 65th Streets - in San Diego, improvements to existing drainage channel (CIP 52-778.0)DESCRIPTION:
EST TOTAL COST: $75
CONRWPEPRIORTOTAL 06/07 07/08 08/09 09/10 10/11
TransNet - L $75 $75 $75
TOTAL $75 $75 $75
MPO ID:TITLE:
SD162Home Avenue Street Improvements
Capacity Status: NCI 06-16RTIP #:Safety - Pavement resurfacing and/or rehabilitationExempt Category:
COMPLETED
Home Avenue from Menlo Ave to 47th St - in San Diego, install roadway improvements(CIP 29-865.0)DESCRIPTION:
EST TOTAL COST: $250
CONRWPEPRIORTOTAL 06/07 07/08 08/09 09/10 10/11
TransNet - L $250 $250 $250
TOTAL $250 $250 $250
MPO ID:TITLE:
SD165New Developments
Capacity Status: NCI 06-16RTIP #:Safety - Pavement resurfacing and/or rehabilitationExempt Category:
DELAYED
Citywide - in San Diego, street and utility improvements along City owned land (CIP 58-001.0)DESCRIPTION:
EST TOTAL COST: $150
CONRWPEPRIORTOTAL 06/07 07/08 08/09 09/10 10/11
TransNet - L $150 $150 $150
TOTAL $150 $150 $150
MPO ID:TITLE:
SD167Potomac Street Improvements
Capacity Status: NCI 06-16RTIP #:Safety - Pavement resurfacing and/or rehabilitationExempt Category:
COMPLETED
Potomac Street from Paradise Valley Rd to Alta View Rd - in San Diego, install sidewalk, curb, gutter
(CIP 52-777.0)
DESCRIPTION:
EST TOTAL COST: $380
CONRWPEPRIORTOTAL 06/07 07/08 08/09 09/10 10/11
TransNet - L $380 $380 $80 $300
TOTAL $380 $380 $80 $300
MPO ID:TITLE:
SD168Public Roads Supporting Park
Access
Capacity Status: NCI 06-16RTIP #:DELAYED
various locations citywide - In San Diego at various locations citywide - provide funding for public roadways
that support park access (CIP 29-692.0)
DESCRIPTION:
EST TOTAL COST: $250
CONRWPEPRIORTOTAL 06/07 07/08 08/09 09/10 10/11
TransNet - L $250 $250 $250
TOTAL $250 $250 $250
Wednesday, June 11, 2008
298

San Diego Region (in $000s)2006 Regional Transportation Improvement Program - Non Carryover Projects
MPO ID:TITLE:
SD169San Diego River Path Study
San Diego, City of
Capacity Status: NCI 06-16RTIP #:Air Quality - Bicycle and pedestrian facilitiesExempt Category:
COMPLETED
Along the San Diego River through Mission Valley to Mission Trails Park - in San Diego bike path study
(CIP 52-781.0)
DESCRIPTION:
EST TOTAL COST: $75
CONRWPEPRIORTOTAL 06/07 07/08 08/09 09/10 10/11
TransNet - L $75 $75 $75
TOTAL $75 $75 $75
MPO ID:TITLE:
SD170Skyline at Cardiff Improvements
Capacity Status: NCI 06-16RTIP #:Safety - Pavement resurfacing and/or rehabilitationExempt Category:
COMPLETED
On Skyline Drive at the northwest corner of Cardiff Street - in San Diego, install popouts (CIP 52-779.0)DESCRIPTION:
EST TOTAL COST: $25
CONRWPEPRIORTOTAL 06/07 07/08 08/09 09/10 10/11
TransNet - L $25 $25 $25
TOTAL $25 $25 $25
MPO ID:TITLE:
SD171Taylor Street Bikeway
Capacity Status: NCI 06-16RTIP #:Air Quality - Bicycle and pedestrian facilitiesExempt Category:
COMPLETED
Taylor Street from Presidio Drive to Hotel Circle South - in San Diego, bike lane installation (CIP 58-203.0)DESCRIPTION:
EST TOTAL COST: $250
CONRWPEPRIORTOTAL 06/07 07/08 08/09 09/10 10/11
TransNet - L $250 $250 $250
TOTAL $250 $250 $250
MPO ID:TITLE:
SD172Transportation Grant Matches
Capacity Status: NCI 06-16RTIP #:Safety - Pavement resurfacing and/or rehabilitationExempt Category:
DELAYED
various locations citywide - In San Diego at various locations citywide - provide matching fund obligations
for various types of transportation grants (CIP 59-021.0) such as roadway work, bridges, safe routes to
school, and bicycle programs
DESCRIPTION:
EST TOTAL COST: $458
CONRWPEPRIORTOTAL 06/07 07/08 08/09 09/10 10/11
TransNet - L $458 $458 $458
TOTAL $458 $458 $458
MPO ID:TITLE:
SD174Windansea Improvements
Capacity Status: NCI 06-16RTIP #:Safety - Pavement resurfacing and/or rehabilitationExempt Category:
COMPLETED
Neptune Place from Fern Glen to Westbook - in San Diego, improvements through storm drain erosion
control (CIP 29-680.0)
DESCRIPTION:
EST TOTAL COST: $350
CONRWPEPRIORTOTAL 06/07 07/08 08/09 09/10 10/11
TransNet - L $350 $350 $350
TOTAL $350 $350 $350
Wednesday, June 11, 2008
299

San Diego Region (in $000s)2006 Regional Transportation Improvement Program - Non Carryover Projects
MPO ID:TITLE:
SD187Camino de la Reina Bikeway
San Diego, City of
Capacity Status: NCI 06-16RTIP #:Air Quality - Bicycle and pedestrian facilitiesExempt Category:
COMPLETED
Camino de la Reina from Ave del Rio to SD River Bike Path - Construction of 0.2 miles of Class I bikeway
way from Avenida del Rio easterly to the existing San Diego River Bike Path (CIP 58-142.0)
DESCRIPTION:
EST TOTAL COST: $10
CONRWPEPRIORTOTAL 06/07 07/08 08/09 09/10 10/11
TransNet - L (Cash) $10 $10 $10
TOTAL $10 $10 $10
Wednesday, June 11, 2008
300

San Diego Region (in $000s)2006 Regional Transportation Improvement Program - Non Carryover Projects
MPO ID:TITLE:
SM10SR78/Smilax Interchange
Improvements
San Marcos, City of
Capacity Status: CI 06-16RTIP #:DELAYED
From Smilax Road to Smilax Road - Construct new interchange at Smilax Road and SR78DESCRIPTION:
EST TOTAL COST:RAS (202) $22,100
CONRWPEPRIORTOTAL 06/07 07/08 08/09 09/10 10/11
Local Funds $150 $150 $150
TOTAL $150 $150 $150
MPO ID:TITLE:
SM14Linda Vista Drive Realignment
Capacity Status: CI 06-16RTIP #:DELETED
Linda Vista Drive from Poinsettia Avenue to Tilley Lane - From Poinsettia Ave to Tilley Lane - construct
new secondary arterial including roadway pavement, curb gutter and sidewalk
DESCRIPTION:
EST TOTAL COST: $4,050
CONRWPEPRIORTOTAL 06/07 07/08 08/09 09/10 10/11
Local Funds $4,050 $4,050 $400 $2,050 $1,600
TOTAL $4,050 $4,050 $400 $2,050 $1,600
MPO ID:TITLE:
SM15Linda Vista Drive
Capacity Status: CI 06-16RTIP #:COMPLETED
Linda Vista Drive from Rancho Santa Fe Road to Tilley Lane - From Rancho Santa Fe Road to Tilly Lane -
design and construct secondary arterial street improvement (CIP-019)
DESCRIPTION:
EST TOTAL COST: $6,207
CONRWPEPRIORTOTAL 06/07 07/08 08/09 09/10 10/11
HUD $322 $322 $322
Local Funds $5,885 $2,835 $3,050 $5,885
TOTAL $6,207 $3,157 $3,050 $322 $5,885
Wednesday, June 11, 2008
301

San Diego Region (in $000s)2006 Regional Transportation Improvement Program - Non Carryover Projects
MPO ID:TITLE:
SNT02Forester Creek Channelization
Santee, City of
Capacity Status: CI 06-16RTIP #:COMPLETED
Forester Creek from Prospect Avenue to Mission Gorge Road - construct Olive Lane & Mission Gorge
Road bridges over flood control channel
DESCRIPTION:
EST TOTAL COST: $35,675
CONRWPEPRIORTOTAL 06/07 07/08 08/09 09/10 10/11
Local Funds $4,540 $4,540 $484 $4,056
RSTP $10,166 $10,166 $2,966 $7,200
TransNet - H $6,800 $3,900 $2,900 $6,800
TOTAL $21,506 $14,706 $3,900 $2,900 $3,450 $18,056
Wednesday, June 11, 2008
302

San Diego Region (in $000s)2006 Regional Transportation Improvement Program - Non Carryover Projects
MPO ID:TITLE:
SB05Pavement Rehabilitation
Solana Beach, City of
Capacity Status: NCI 06-16RTIP #:Safety - Pavement resurfacing and/or rehabilitationExempt Category:
COMPLETED
Various locations - pavement resurfacing and replacement of deteriorated pavements as determined by the
City's Pavement Management Program
DESCRIPTION:
EST TOTAL COST: $304
CONRWPEPRIORTOTAL 06/07 07/08 08/09 09/10 10/11
TransNet - L $304 $304 $304
TOTAL $304 $304 $304
Wednesday, June 11, 2008
303

San Diego Region (in $000s)2006 Regional Transportation Improvement Program - Non Carryover Projects
MPO ID:TITLE:
BIA01Indian Reservation Roads Program
U.S. Bureau of Indian Affairs
Capacity Status: NCI 06-16RTIP #:COMPLETED
Lump sum IRR projects in the San Diego regionDESCRIPTION:
EST TOTAL COST: $3,745
CONRWPEPRIORTOTAL 06/07 07/08 08/09 09/10 10/11
BIA $3,745 $3,630 $115 $265 $3,480
TOTAL $3,745 $3,630 $115 $265 $3,480
Wednesday, June 11, 2008
304

San Diego Region (in $000s)2006 Regional Transportation Improvement Program - Non Carryover Projects
MPO ID:TITLE:
VISTA03Street Rehabilitation & Maintenance
CIP 8037
Vista, City of
Capacity Status: NCI 06-16RTIP #:Safety - Pavement resurfacing and/or rehabilitationExempt Category:
DELAYED
Sycamore Ave from University Dr to Business Park Dr, S. Santa Fe Ave from Escondido Ave to Pala
Vista, W. Vista Way from Melrose Dr to WB SR-78 ramp, Vale Terrace Dr from Foothill to Vale Terrace
Pl, Lada de Loma from 400ft e/o Vista Village Dr to 900ft e/o Vista Village Dr, Foothill Dr from Vale
Terrace to southerly City Limits, Foothill Dr from Elm to Beverly - repair/rehabilitate distressed pavement
areas and overlay streets with asphalt/rubberized asphalt where identified as priorities in street inventory
DESCRIPTION:
EST TOTAL COST: $6,296
CONRWPEPRIORTOTAL 06/07 07/08 08/09 09/10 10/11
Local Funds $1,014 $1,014 $1,014
TransNet - L $2,987 $2,015 $436 $536 $98 $2,889
TOTAL $4,001 $3,029 $436 $536 $98 $3,903
MPO ID:TITLE:
VISTA07SR-78 Corridor Enhancement
Capacity Status: NCI 06-16RTIP #:Other - Plantings, landscaping, etcExempt Category:
DELAYED
From Smilax Rd to Thunder Dr - along SR 78, the project is separated into three phases to install freeway
landscaping and maintenance along SR-78 between Smilax Road and Thunder Drive including providing 80
acres of freeway landscaping along the SR-78 corridor, with "gateway" treatments at Vista Village Drive
and Sycamore Ave interchanges
DESCRIPTION:
EST TOTAL COST: $7,666
CONRWPEPRIORTOTAL 06/07 07/08 08/09 09/10 10/11
Local Funds $321 $321 $321
TEA-R $1,013 $1,013 $1,013
TransNet - L $4,103 $3,773 $150 $180 $4,103
TOTAL $5,437 $5,107 $150 $180 $5,437
MPO ID:TITLE:
VISTA08West Vista Way Widening, CIP 7741
Capacity Status: NCI 06-16RTIP #:Other - Engineering studiesExempt Category:
DELAYED
W. Vista Way from Melrose Dr to Thunder Dr - realign W Vista Way including providing preliminary
improvement plans, final right-of-way maps, and a metes and bounds legal description anticipated to
provide congestion relief with future widening of W Vista Way from 2 to 4 lanes
DESCRIPTION:
EST TOTAL COST:RAS (TA 7-51) $23,501
CONRWPEPRIORTOTAL 06/07 07/08 08/09 09/10 10/11
RSTP $990 $990 $990
TransNet - L $233 $233 $233
TOTAL $1,223 $1,223 $1,223
MPO ID:TITLE:
VISTA10Olive Avenue Sidewalks CIP 8043
Capacity Status: NCI 06-16RTIP #:Safety - Safety Improvement ProgramExempt Category:
DELAYED
Olive Ave from N. Melrose to Vista Village Dr - design and install improvements to widen pavement, install
bikeways & parking
DESCRIPTION:
EST TOTAL COST: $2,729
CONRWPEPRIORTOTAL 06/07 07/08 08/09 09/10 10/11
TransNet - L $1,720 $1,000 $720 $1,720
TOTAL $1,720 $1,000 $720 $1,720
Wednesday, June 11, 2008
305

San Diego Region (in $000s)2006 Regional Transportation Improvement Program - Non Carryover Projects
MPO ID:TITLE:
VISTA12East Vista Way Street Improvements
CIP 8054
Vista, City of
Capacity Status: NCI 06-16RTIP #:Other - Engineering studiesExempt Category:
DELAYED
E. Vista Way from Escondido Ave. to Arcadia Ave. - alignment study to widen E Vista Way from 2 to 4
lanes
DESCRIPTION:
EST TOTAL COST:RAS (TA 7-51) $669
CONRWPEPRIORTOTAL 06/07 07/08 08/09 09/10 10/11
TransNet - L $200 $200 $200
TOTAL $200 $200 $200
MPO ID:TITLE:
VISTA13ADA Street Sidewalk Improvements
CIP 8053
Capacity Status: NCI 06-16RTIP #:Safety - Pavement resurfacing and/or rehabilitationExempt Category:
DELAYED
Citywide - repair/replace sidewalks, curbs & gutters, and upgrade to current ADA standardsDESCRIPTION:
EST TOTAL COST: $524
CONRWPEPRIORTOTAL 06/07 07/08 08/09 09/10 10/11
Local Funds $75 $75 $75
TransNet - L $449 $449 $449
TOTAL $524 $524 $524
MPO ID:TITLE:
VISTA14Traffic Signals and Modifications
Capacity Status: NCI 06-16RTIP #:Other - Intersection signalization projectsExempt Category:
COMPLETED
Various locations - Various locations - install new traffic signals and construct minor signal modificationsDESCRIPTION:
EST TOTAL COST: $274
CONRWPEPRIORTOTAL 06/07 07/08 08/09 09/10 10/11
Local Funds $274 $174 $100 $274
TOTAL $274 $174 $100 $274
MPO ID:TITLE:
VISTA15SR 78 @ Sycamore Ramp
Improvement CIP 8107
Capacity Status: NCI 06-16RTIP #:Other - Interchange reconfiguration projectsExempt Category:
DELAYED
From SR-78 to Sycamore - construct right turn laneDESCRIPTION:
EST TOTAL COST: $1,437
CONRWPEPRIORTOTAL 06/07 07/08 08/09 09/10 10/11
Local Funds $20 $20 $20
TransNet - L $115 $115 $115
TOTAL $135 $135 $135
MPO ID:TITLE:
VISTA16HES Grapevine Road/W. Vista Way
Traffic Signal CIP 8032
Capacity Status: NCI 06-16RTIP #:Safety - Hazard elimination programExempt Category:
DELAYED
W. Vista Way from Grapevine Rd to W. Vista Way - install a new signal and construct a left turn lane and
bus stop
DESCRIPTION:
EST TOTAL COST:
CONRWPEPRIORTOTAL 06/07 07/08 08/09 09/10 10/11
TOTAL
Wednesday, June 11, 2008
306

San Diego Region (in $000s)2006 Regional Transportation Improvement Program - Non Carryover Projects
RTIP Fund Types
AC = Advanced Construction
BIA = Bureau of Indian Affairs
BIP = Border Infrastructure Program (Federal under SAFETEA-LU)
BTA = Bicycle Transportation Account (State)
CBI = Corridors and Borders Infrastructure Program (Federal under TEA-21)
CMAQ = Congestion Mitigation and Air Quality (Federal formula)
CMIA = Corrdior Mobility Improvement Account (Prop. 1B state bond)
DEMO = High Priority Demonstration Program under TEA-21 (Federal discretionary)
DEMO-Sec 115 = High Priority Demonstration Program under FY 2004 Appropriations
DEMO-Sec 117/STP = Surface Transportation Program under FHWA Administrative Program (congressionally
directed appropriations)
FSP = Freeway Service Patrol (State legislation)
HBP = Highway Bridge Program under SAFETEA-LU (Federal)
HBRR = Highway Bridge Repair and Rehabilitation under TEA-21 (Federal)
HES = Hazard Elimination System (Federal administered by Caltrans)
HPP = High Priority Demonstration Program under SAFETEA-LU (Federal discretionary)
HSIP = Highway Safety Improvement Program (State administered by Caltrans)
IBRC = Innovative Bridge Research & Construction (Federal)
IM = Interstate Maintenance Discretionary (Federal)
IRR = Indian Reservation Roads program (Federal)
ITS = Intelligent Transportation System (Federal)
NCPD = National Corridor Planning & Development (Federal - same as CBI)
PLH = Public Lands Highway (Federal)
PTA = Public Transportation Account (State)
PTMISE = Public Transportation Modernization, Improvement, and Service Enhancement (Prop. 1B state
bond)
RSTP = Regional Surface Transportation Program (Federal)
RTP = Recreational Trails Program (Federal)
SHOPP AC = State Highway Operation & Protection Program federal share (for Caltrans use only)
SHOPP State Cash = State Highway Operation & Protection Program cash match (for Caltrans use only)
SRTS = Safe Routes to School (Federal program administered by Caltrans)
STIP-IIP = State Transportation Improvement Program - Interregional Program (State)
STIP-RIP = State Transportation Improvement Program - Regional Improvement Program (State)
Section 5307 = Federal Transit Administration Urbanized Area Formula Program
Section 5309 (Bus) = Federal Transit Administration Discretionary Program
Section 5309 (FG) = Federal Transit Administration Fixed Guideway Modernization (Rail Mod)
Section 5309 (NS) = Federal Transit Administration Discretionary - New Starts Program
Wednesday, June 11, 2008
307

San Diego Region (in $000s)2006 Regional Transportation Improvement Program - Non Carryover Projects
Section 5310 = Federal Transit Administration Elderly & Disabled Program
Section 5311 = Federal Transit Administration Rural Program
Section 5316 (JARC) = Federal Transit Administration Jobs Access Reverse Commute
Section 5317 (NF) = Federal Transit Administration New Freedom
TCIF = Trade Corridor Improvement Fund (Prop. 1B state bond)
TCRP = Traffic Congestion Relief Program (State)
TCSP = Transportation & Community & System Preservation (Federal)
TDA = Transportation Development Act (State)
TDA-B = Transportation Development Act-Bicycle & Pedestrian Facilities (State)
TEA = Transportation Enhancement Activities Program (Federal)
TSM = Transportation Systems Management (State)
TransNet-78 = Prop. A Local Transportation Sales Tax - SR 78 (Local)
TransNet-ADA = Prop. A Local Transportation Sales Tax - compliance with federal Americans with Disabilities
Act (Local)
TransNet-B = Prop. A Local Transportation Sales Tax - Bike (Local)
TransNet-BRT/Ops = Prop. A Local Transportation Sales Tax - Bus Rapid Transit/New Service (Local)
TransNet-Border = Prop. A Local Transportation Sales Tax - Border, part of Major Corridor (Local)
TransNet-H = Prop. A Local Transportation Sales Tax - Highway (Local)
TransNet-L = Prop. A Local Transportation Sales Tax - Local Streets & Roads (Local)
TransNet-LSI = Prop. A Extension Local Transportation Sales Tax -Local System Improvements (Local)
TransNet-MC = Prop. A Extension Local Transportation Sales Tax - Major Corridors (Local)
TransNet-REMP = Prop. A Extension Local Transportation Sales Tax - Regional Environmental Mitigation (Local)
TransNet-S&D = Prop. A Local Transportation Sales Tax - Senior/Disabled (Local)
TransNet-T = Prop. A Local Transportation Sales Tax - Transit (Local)
TransNet-TSI = Prop. A Extension Local Transportation Sales Tax - Transit System Improvements (Local)
Wednesday, June 11, 2008
308

Appendix F
REGIONAL ARTERIAL SYSTEM


2030 Regional Transportation Plan – Technical Appendices TA 7-43
Table TA 7.19—Regional Arterials by Jurisdiction
Limits Jurisdiction
1 Cannon Road Carlsbad Boulevard to Buena Vista Drive Carlsbad
2 Carlsbad Boulevard Eaton Street to La Costa Avenue Carlsbad
3 Carlsbad Village Drive Interstate 5 to Coast Boulevard/Coast Highway Carlsbad
4 College Boulevard City of Oceanside to Palomar Airport Road Carlsbad
5 El Camino Real (S-11) State Route 78 to Olivenhain Carlsbad
6 Faraday Avenue Melrose Drive to College Boulevard Carlsbad
7 La Costa Avenue Interstate 5 to El Camino Real Carlsbad
8 Melrose Drive City of Vista to Rancho Santa Fe Road Carlsbad
9 Olivenhain Road Los Pinos Circle to Rancho Santa Fe Road Carlsbad
10 Palomar Airport Road Carlsbad Boulevard to Business Park Drive Carlsbad
11 Poinsettia Lane Carlsbad Boulevard to Melrose Drive Carlsbad
12 Rancho Santa Fe Road Melrose Drive to Olivenhain Road Carlsbad
13 Bonita Road 1st Avenue to Interstate 805 Chula Vista
14 Broadway C Street to Main Street Chula Vista
15 E Street Interstate 5 to Bonita Road Chula Vista
16 East H Street Hilltop Drive to Mount Miguel Road Chula Vista
17 H Street Interstate 5 to Hilltop Drive Chula Vista
18 Hunte Parkway Proctor Valley Road to State Route 125 Chula Vista
19 L Street Interstate 5 to Interstate 805 Chula Vista
20 La Media Road Telegraph Canyon Road to City of San Diego Chula Vista
21 Main Street Interstate 5 to Interstate 805 Chula Vista
22 Olympic Parkway Interstate 805 to State Route 125 Chula Vista
23 Orange Avenue Palomar Street to Interstate 805 Chula Vista
24 Otay Lakes Road Bonita Road to Wueste Road Chula Vista
25 Otay Valley Road (Main Street) Interstate 805 to Heritage Road Chula Vista
26 Palomar Street Interstate 5 to Orange Avenue Chula Vista
27 Paseo Ranchero (Heritage Road) East H Street to City of San Diego Chula Vista
28 Proctor Valley Road Mt. Miguel Road to Hunte Parkway Chula Vista
29 Telegraph Canyon Road Interstate 805 to Otay Lakes Road Chula Vista
30 Willow Street Sweetwater Road to Bonita Road Chula Vista
31 State Route 75 City of San Diego to City of Imperial Beach Coronado
32 Via de la Valle Highway 101 to Jimmy Durante Boulevard Del Mar
33 2nd Street Greenfield Drive to Main Street El Cajon
34 Avocado Avenue Main Street to Chase Avenue El Cajon
35 Avocado Boulevard Chase Avenue to Dewitt Court El Cajon
36 Ballantyne Street Broadway to Main Street El Cajon
37 Bradley Avenue Marshall Avenue to County of San Diego El Cajon
38 Broadway State Route 67 to East Main Street El Cajon
39 Cuyamaca Street City of Santee to Marshall Avenue El Cajon
40 E Main Street Broadway to Greenfield Drive El Cajon
Arterial
311

312
Table TA 7.19—Regional Arterials by Jurisdiction (cont’d)
41 El Cajon Boulevard Chase Avenue to Washington Avenue El Cajon
42 Fletcher Parkway City of La Mesa to State Route 67 El Cajon
43 Greenfield Drive East Main Street to Interstate 8 El Cajon
44 Jamacha Road Main Street to Grove Road El Cajon
45 Marshall Avenue Cuyamaca to Fletcher Parkway El Cajon
46 Marshall Avenue Fletcher Parkway to West Main Street El Cajon
47 Marshall Avenue West Main Street to Washington Avenue El Cajon
48 Navajo Road Fanita Drive to Fletcher Parkway El Cajon
49 Washington Avenue El Cajon Boulevard to Jamacha Road El Cajon
50 West Main Street Interstate 8 to Marshall Avenue El Cajon
51 Coast Highway City of Carlsbad to City of Solana Beach Encinitas
52 El Camino Real Olivenhain to Manchester Avenue Encinitas
53 Encinitas Boulevard Coast Highway 101 to El Camino Real Encinitas
54 La Costa Avenue Coast Highway 101 to Interstate 5 Encinitas
55 Leucadia Boulevard Coast Highway 101 to El Camino Real Encinitas
56 Manchester Avenue El Camino Real to Interstate 5 Encinitas
57 Olivenhain Road El Camino Real to Los Pinos Circle Encinitas
58 Barham Drive Los Amigos to Mission Road Escondido
59 Centre City Parkway Country Club Lane (Interstate 15) to South Escondido Boulevard/South Centre City Parkway (Interstate 15)
Escondido
60 Citracado Parkway Centre City Parkway to State Route 78 Escondido
61 East Valley Parkway Broadway to Valley Center Grade Road Escondido
62 East Via Rancho Parkway Broadway to Sunset Drive Escondido
63 El Norte Parkway Nordahl Road to Washington Avenue Escondido
64 El Norte Parkway Woodland Parkway to Rees Road Escondido
65 Felicita/17th Avenue Interstate 15 to State Route 78 Escondido
66 Grand Avenue/2nd Avenue/Valley Boulevard West Valley Parkway to East Valley Parkway Escondido
67 Hale Avenue Washington Avenue to Interstate 15 Escondido
68 Lincoln/Ash Parkway Broadway to Washington Avenue Escondido
69 Mission Avenue Andreason Drive to Centre City Parkway Escondido
70 Mission Road Barham Drive to Andreason Drive Escondido
71 Via Rancho Parkway Del Dios Highway to Sunset Drive Escondido
72 Washington Avenue State Route 78 to East Valley Parkway Escondido
73 West Valley Parkway Claudan Road to Broadway Escondido
74 State Route 75 City of Coronado to City of San Diego Imperial Beach
75 70th Street University Avenue to Colony Road La Mesa
76 70th Street Saranac Street to Interstate 8 La Mesa
77 El Cajon Boulevard 73rd Street to Interstate 8 La Mesa
78 Fletcher Parkway Interstate 8 to City of El Cajon La Mesa
79 Grossmont Center Drive Interstate 8 to Fletcher Parkway La Mesa
80 Jackson Drive La Mesa Boulevard to North City limits La Mesa

313
Table TA 7.19—Regional Arterials by Jurisdiction (cont’d)
Limits Jurisdiction
81 La Mesa Boulevard University Avenue to Interstate 8 La Mesa
82 Lake Murray Interstate 8 to Dallas Street La Mesa
83 Massachusetts Avenue State Route 94 to University Avenue La Mesa
84 Spring Street Interstate 8 to State Route 125 La Mesa
85 University Avenue 69th Street to La Mesa Boulevard La Mesa
86 Broadway Spring Street to Lemon Grove Avenue Lemon Grove
87 College Avenue Livingston Street to Federal Boulevard Lemon Grove
88 Federal Boulevard College Avenue to State Route 94 Lemon Grove
89 Lemon Grove Avenue Viewcrest to State Route 94 Lemon Grove
90 Massachusetts Avenue Broadway to State Route 94 Lemon Grove
91 Massachusetts Avenue Lemon Grove Avenue to Broadway Lemon Grove
92 Sweetwater Road Broadway to Troy Street Lemon Grove
93 30th Street National City Boulevard to 2nd Street National City
94 Euclid Avenue Cervantes Avenue to Sweetwater Road National City
95 Harbor Drive City of San Diego to Interstate 5 National City
96 National City Boulevard Division Street to 30th Street National City
97 Palm Avenue Interstate 805 to 18th Street National City
98 Paradise Valley Road 8th Street to Plaza Boulevard National City
99 Plaza Boulevard National City Boulevard to 8th Street National City
100 Sweetwater Road 2nd Street to Plaza Bonita Center Way National City
101 Coast Highway Interstate 5 to Eaton Street Oceanside
102 College Boulevard North River Road to State Route 78 Oceanside
103 El Camino Real Douglas Drive to State Route 78 Oceanside
104 Melrose Drive State Route 76 to Rancho Santa Fe Road Oceanside
105 Mission Avenue Coast Highway to Frazee Road Oceanside
106 North River Road Douglas Drive to State Route 76 Oceanside
107 North Santa Fe Avenue State Route 76 to Melrose Drive Oceanside
108 Oceanside Boulevard Hill Street to Melrose Drive Oceanside
109 Rancho del Oro Drive State Route 78 to State Route 76 Oceanside
110 Vandegrift Boulevard North River Road to Camp Pendleton Oceanside
111 West Vista Way Jefferson Street to Thunder Drive Oceanside
112 Camino del Norte World Trade Drive to Pomarado Road Poway
113 Community Road Twin Peaks Road to Scripps Poway Parkway Poway
114 Espola Road Summerfield Lane to Poway Road Poway
115 Pomerado Road Stonemill Drive to Gateway Park Road Poway
116 Poway Road Springhurst Drive to State Route 67 Poway
117 Scripps Poway Parkway Springbrook to Sycamore Canyon Road Poway
118 Ted Williams Parkway Pomerado Road to Twin Peaks Road Poway
119 Twin Peaks Road Pomarado Road to Espola Road Poway
120 1st Avenue Harbor Drive to Interstate 5 San Diego City
Arterial

314
Table TA 7.19—Regional Arterials by Jurisdiction (cont’d)
Limits Jurisdiction
121 4th Avenue Market Street to Washington Street San Diego City
122 5th Avenue Market Street to Washington Street San Diego City
123 6th Avenue Ash Street to State Route 163 San Diego City
124 10th Avenue State Route 163 to Imperial Avenue San Diego City
125 11th Avenue G Street to State Route 163 San Diego City
126 32nd Street Harbor Drive to Wabash Boulevard San Diego City
127 47th Street State Route 94 to Interstate 805 San Diego City
128 54th Street El Cajon Boulevard to Euclid Avenue San Diego City
129 70th Street Colony Road to Saranac Street San Diego City
130 A Street 11th Avenue to Kettner Boulevard San Diego City
131 Adams Avenue Park Boulevard to Interstate 15 San Diego City
132 Aero Drive State Route 163 to Interstate 15 San Diego City
133 Airway Road Caliente to State Route 125 San Diego City
134 Ash Street Harbor Drive to 10th Avenue San Diego City
135 Auto Circle Camino del Rio North to Camino del Rio South San Diego City
136 Balboa Avenue Mission Bay Drive to Interstate 15 San Diego City
137 Barnett Avenue Lytton Street to Pacific Highway San Diego City
138 Bernardo Center Drive Camino del Norte to Interstate 15 San Diego City
139 Beyer Boulevard Main Street to East Beyer Boulevard San Diego City
140 Beyer Way Main Street to Palm Avenue San Diego City
141 Britannia Boulevard Otay Mesa Road to Siempre Viva Road San Diego City
142 Black Mountain Road Del Mar Heights to Carroll Canyon Road San Diego City
143 Broadway Harbor Drive to 11th Avenue San Diego City
144 Cabrillo Memorial Drive Cochran Street to Cabrillo National Monument San Diego City
145 Camino del Norte Camino San Bernardo to World Trade Drive San Diego City
146 Camino del Rio North Mission Center Road to Mission Gorge Road San Diego City
147 Camino Ruiz Mira Mesa Boulevard to Miramar Road San Diego City
148 Camino Ruiz State Route 56 to Camino del Norte San Diego City
149 Camino Santa Fe Avenue Sorrento Valley Boulevard to Miramar Road San Diego City
150 Canon Street Rosecrans Street to Catalina Boulevard San Diego City
151 Carmel Mountain Road Camino del Norte to Rancho Peñasquitos Boulevard San Diego City
152 Carmel Mountain Road Sorrento Valley Road to El Camino Real San Diego City
153 Carmel Valley Road North Torrey Pines Road to El Camino Real San Diego City
154 Catalina Boulevard Canon Street to Cochran Street San Diego City
155 Clairemont Drive Clairemont Mesa Boulevard to Interstate 5 San Diego City
156 Clairemont Mesa Boulevard Interstate 15 to Regents Road San Diego City
157 College Avenue Navajo Road to Livingston Street San Diego City
158 Collwood Boulevard Montezuma Road to El Cajon Boulevard San Diego City
159 Convoy Street Linda Vista Road to State Route 52 San Diego City
160 Cesar E. Chavez Parkway Interstate 5 to Harbor Drive San Diego City
Arterial

315
Table TA 7.19—Regional Arterials by Jurisdiction (cont’d)
Limits Jurisdiction
161 Dairy Mart Road State Route 905 to Interstate 5 San Diego City
162 Del Dios Highway Via Rancho Parkway to Claudan Road San Diego City
163 Del Mar Heights Road Interstate 5 to Carmel Valley Road San Diego City
164 El Cajon Boulevard Park Boulevard to 73rd Street San Diego City
165 El Camino Real Via de la Valle to Carmel Mountain Road San Diego City
166 Euclid Avenue 54th Street to Cervantes Avenue San Diego City
167 F Street State Route 94 to 10th Avenue San Diego City
168 Fairmount Avenue Interstate 8 to State Route 94 San Diego City
169 Friars Road Sea World Drive to Mission Gorge Road San Diego City
170 Front Street Interstate 5 to Market Street San Diego City
171 G Street State Route 94 to 10th Avenue San Diego City
172 Garnet Avenue Balboa Avenue to Mission Bay Drive San Diego City
173 Genesee Avenue North Torrey Pines Road to State Route 163 San Diego City
174 Gilman Drive La Jolla Village Drive to Interstate 5 San Diego City
175 Grand Avenue Mission Boulevard to Mission Bay Drive San Diego City
176 Governor Drive Interstate 805 to Regents Road San Diego City
177 Grape Street North Harbor Drive to Interstate 5 San Diego City
178 Harbor Drive Pacific Highway to City of National City San Diego City
179 Hawthorn Street Interstate 5 to North Harbor Drive San Diego City
180 Heritage Road Otay Mesa Road to Siempre Viva Road San Diego City
181 Heritage Road Otay Valley Road to City of Chula Vista San Diego City
182 Imperial Avenue Park Boulevard to Lisbon Street San Diego City
183 Ingraham Street Sunset Cliffs Boulevard to Grand Avenue San Diego City
184 Kearny Villa Road Pomarado Road to Aero Drive San Diego City
185 Kettner Boulevard Interstate 5 to India Street San Diego City
186 La Jolla Boulevard Pearl Street to Turquoise Street San Diego City
187 La Jolla Parkway Torrey Pines Road to Interstate 5 San Diego City
188 La Jolla Shores Drive Torrey Pines Road to North Torrey Pines Road San Diego City
189 La Jolla Village Drive North Torrey Pines Road to Interstate 805 San Diego City
190 La Media Road Otay Mesa Road to Siempre Viva Road San Diego City
191 Lake Murray Boulevard Dallas Street to Navajo Road San Diego City
192 Laurel Street North Harbor Drive to Interstate 5 San Diego City
193 Lemon Grove Avenue Lisbon Street to Viewcrest San Diego City
194 Linda Vista Road Morena Boulevard to Convoy Street San Diego City
195 Lytton Street Rosecrans Street to Barnett Avenue San Diego City
196 Market Street Harbor Drive to Euclid Avenue San Diego City
197 Mercy Road Black Mountain Road to Interstate 15 San Diego City
198 Mesa College Drive Interstate 805 to Marlesta Drive San Diego City
199 Midway Drive West Point Loma Boulevard to Barnett Avenue San Diego City
200 Mira Mesa Boulevard Interstate 805 to Interstate 15 San Diego City
Arterial

316
Table TA 7.19—Regional Arterials by Jurisdiction (cont’d)
Limits Jurisdiction
201 Miramar Road Interstate 805 to Interstate 15 San Diego City
202 Mission Boulevard Loring Street to West Mission Bay Drive San Diego City
203 Mission Bay Drive Grand Avenue to Interstate 5 San Diego City
204 Mission Center Road Camino del Rio North to Friars Road San Diego City
205 Mission Gorge Road Interstate 8 to Highridge Road San Diego City
206 Montezuma Road Fairmount Avenue to El Cajon Boulevard San Diego City
207 Morena Boulevard Balboa Avenue to Interstate 8 San Diego City
208 Navajo Road Waring Road to Fanita Drive San Diego City
209 Nimitz Boulevard Interstate 8 to Harbor Drive San Diego City
210 North Harbor Drive Rosecrans Street to Grape Street San Diego City
211 North Torrey Pines Road (S-21) Carmel Valley Road to La Jolla Village Drive San Diego City
212 Ocean View Hills Parkway Interstate 805 to State Route 905 San Diego City
213 Otay Mesa Road State Route 905 to State Route 125 San Diego City
214 Pacific Highway Sea World Drive to Harbor Drive San Diego City
215 Palm Avenue State Route 75 to Interstate 805 San Diego City
216 Paradise Valley Road Plaza Boulevard to Meadowbrook Drive San Diego City
217 Park Boulevard Imperial Avenue to Adams Avenue San Diego City
218 Picador Boulevard Palm Avenue to Interstate 905 San Diego City
219 Pomerado Road Interstate 15 (north) to Interstate 15 (south) San Diego City
220 Poway Road Interstate 15 to Springhurst Drive San Diego City
221 Qualcomm Way Intestate 8 to Friars Road San Diego City
222 Rancho Bernardo Road Interstate 15 to Summerfield Lane San Diego City
223 Rancho Carmel Drive Carmel Mountain Road to Ted Williams Parkway San Diego City
224 Rancho Peñasquitos Boulevard State Route 56 to Interstate 15 San Diego City
225 Regents Road Genesee Avenue to Clairemont Mesa Boulevard San Diego City
226 Rosecrans Street Interstate 8 to Canon Street San Diego City
227 Ruffin Road Kearny Villa Road to Aero Drive San Diego City
228 Sabre Springs Parkway Ted Williams Parkway to Poway Road San Diego City
229 San Ysidro Boulevard Dairy Mart Road to East Beyer Boulevard San Diego City
230 Scripps Poway Parkway Interstate 15 to Springbrook Drive San Diego City
231 Sea World Drive West Mission Bay Drive to Morena Boulevard San Diego City
232 Siempre Viva Road Heritage Road to State Route 905 San Diego City
233 Sorrento Valley Boulevard Sorrento Valley Road to Camino Santa Fe Avenue San Diego City
234 Sports Arena Boulevard Interstate 8 to Rosecrans Street San Diego City
235 Sunset Cliffs Boulevard Interstate 8 to West Mission Bay Drive San Diego City
236 Ted Williams Parkway Interstate 15 to Pomerado Road San Diego City
237 Texas Street Interstate 8 to University Avenue San Diego City
238 Torrey Pines Road Girard Avenue to La Jolla Parkway San Diego City
239 University Avenue State Route 163 to City of La Mesa San Diego City
240 Valencia Parkway Market Street to Imperial Avenue San Diego City
Arterial

317
Table TA 7.19—Regional Arterials by Jurisdiction (cont’d)
Limits Jurisdiction
241 Via de la Valle Jimmy Durante Boulevard to El Camino Real San Diego City
242 Vista Sorrento Parkway Sorrento Valley Boulevard to Carmel Mountain Road San Diego City
243 Wabash Boulevard 32nd Street to Interstate 5 San Diego City
244 Washington Street Pacific Highway to Park Boulevard San Diego City
245 Waring Road College Avenue to Interstate 8 San Diego City
246 West Bernardo Drive Interstate 15 to Bernardo Center Drive San Diego City
247 West Mission Bay Drive Mission Boulevard to Sunset Cliffs Boulevard San Diego City
248 Woodman Street State Route 54 to Imperial Avenue San Diego City
249 Alpine Boulevard Interstate 8/Dunbar Lane to Interstate 8/Willows Road San Diego County
250 Avocado Boulevard Dewitt Court to State Route 94 San Diego County
251 Bear Valley Parkway City of Escondido (north) to City of Escondido (south) San Diego County
252 Bonita Road Interstate 805 to San Miguel Road San Diego County
253 Borrego Springs/Yaqui Pass Road (S-3) Palm Canyon Drive (S-22) to State Route 78 San Diego County
254 Bradley Avenue Wing Avenue to Winter Garden Boulevard San Diego County
255 Buckman Springs/Sunrise Highway (S-1) State Route 94 to State Route 79 San Diego County
256 Buena Creek Road South Santa Fe Avenue to Twin Oaks Valley Road San Diego County
257 Camino del Norte Rancho Bernardo Road to City of San Diego San Diego County
258 Campo Road Spring Street to Sweetwater Springs/State Route 54 San Diego County
259 Citracado Parkway Greenwood Place to Interstate 15 San Diego County
260 Cole Grade Road State Route 76 to Valley Center Road San Diego County
261 Deer Springs Road Twin Oaks Valley Road to Interstate 15 San Diego County
262 Dehesa Road Jamacha Road to Harbison Canyon Road San Diego County
263 Dehesa Road* Harbison Canyon Road to Sycuan Road San Diego County
264 Del Dios Highway Via Rancho Parkway to Paseo de Delicias San Diego County
265 Dye Road State Route 67 to San Vicente Road San Diego County
266 Dye Street State Route 67 to Dye Road San Diego County
267 East Vista Way State Route 76 to City of Vista San Diego County
268 El Norte Parkway Rees Road to Nordahl Road San Diego County
269 Euclid Avenue City of National City to City of National City San Diego County
270 Gamble Lane Eucalyptus Avenue to City of Escondido San Diego County
271 Gopher Canyon Road East Vista Way to Old Highway 395 San Diego County
272 Jamancha Road City of El Cajon to State Route 94 San Diego County
273 Jamancha Road State Route 125 to State Route 94 San Diego County
274 Keyes Road (Southern Traffic Bypass) San Vicente Road to State Route 78 (Julian Road) San Diego County
275 Lake Jennings Park Road State Route 67 to Interstate 8 San Diego County
276 Lake Wohlford Road Valley Center Road (north) to Valley Center Road (south) San Diego County
277 Las Posas Road City of San Marcos to Buena Creek Road San Diego County
278 Lone Star Road City of San Diego to Loop Road San Diego County
279 Mapleview Street State Route 67 to Lake Jennings Road San Diego County
280 Mar Vista Drive City of Oceanside to City of Vsita San Diego County
Arterial

318
Table TA 7.19—Regional Arterials by Jurisdiction (cont’d)
Limits Jurisdiction
281 Melrose Drive City of Oceanside to City of Vsita San Diego County
282 Mission Road (S-13) Interstate 15 to State Route 76 San Diego County
283 Mountain Meadow Road Interstate 15/Deer Springs Road to Valley Center Road San Diego County
284 Montezuma Valley/Palm Caynon (S-22) State Route 79 to Imperial County Line San Diego County
285 Nordahl Road El Norte to City of San Marcos San Diego County
286 Old Highway 80 Buckman Springs Road to Interstate 8 (In-ko-pah) San Diego County
287 Old Highway 80 State Route 79 to Sunrise Highway San Diego County
288Old Highway 395/Champagne/North Centre City
East Mission Road to City of Escondido San Diego County
289 Otay Lakes Road Wueste Road to State Route 94 San Diego County
290 Otay Mesa Road City of San Diego to Loop Road San Diego County
291 Paradise Valley Road City of San Diego to Sweetwater Road San Diego County
292 Paseo Delicias El Camino del Norte to Via de la Valle San Diego County
293 Rancho Bernardo Road City of San Diego (west) to City of San Diego (east) San Diego County
294 San Felipe Road/Overland Route (S-2) County Route S-22 to Imperial County Line San Diego County
295 San Vicente Road/10th Street State Route 67 (Main Street) to Wildcat Canyon Road San Diego County
296 Scripps Poway Parkway Sycamore Canyon Road to State Route 67 San Diego County
297 Siempre Viva Road City of San Diego to Loop Road San Diego County
298 South Santa Fe Avenue City of Vista to City of San Marcos San Diego County
299 Sunrise Highway State Route 79 to Interstate 8 San Diego County
300 Sweetwater Road (Bonita) Willow Street to City of National City San Diego County
301 Sweetwater Road (Spring Valley) Jamacha Boulevard to Broadway San Diego County
302 Sweetwater Springs Boulevard Jamacha Boulevard to State Route 94 San Diego County
303 Valley Center Road State Route 76 to City of Escondido San Diego County
304 Valley Center New Northern E to W Road Cole Grade Road to Old Highway 395 San Diego County
305 Via de la Valle City of San Diego to Paseo Delicias San Diego County
306 Via Rancho Parkway Del Dios Highway to City of Escondido San Diego County
307 Wildcat Canyon Road* Mapleview Street to San Vicente Road San Diego County
308 Willow Glen Drive Jamacha Road to Dehesa Road San Diego County
309 Willows Road Interstate 8 to Viejas Casino San Diego County
310 Winter Gardens Boulevard State Route 67 to 2nd Street San Diego County
311 Barham Drive Twin Oaks Valley Road to Los Amigos San Marcos
312 Borden Road Las Posas Road to Woodland Parkway San Marcos
313 Buena Creek Road Twin Oaks Valley Road to Sunny Vista Lane San Marcos
314 Discovery Street San Marcos Boulevard to Twin Oaks Valley Road San Marcos
315 Las Posas Road West San Marcos Boulevard to North City Limits San Marcos
316 Mission Road Pacific Street to Barham Drive San Marcos
317 San Elijo Road Twin Oaks Valley Road to Rancho Santa Fe Road San Marcos
318 Rancho Santa Fe Road Mission Road to Melrose Drive San Marcos
319 San Marcos Boulevard Business Park Drive to Mission Road San Marcos
320 South Santa Fe Avenue Smilax Road to Pacific Street San Marcos
Arterial

319
Table TA 7.19—Regional Arterials by Jurisdiction (cont’d)
Limits Jurisdiction
321 Twin Oaks Valley Road Deer Springs Road to Questhaven Road San Marcos
322 Woodland Parkway Barham Drive to El Norte Parkway San Marcos
323 Cuyamaca Street Mission Gorge Road to City of El Cajon Santee
324 Magnolia Avenue Mast Boulevard to Prospect Avenue/State Route 67 Santee
325 Mast Boulevard State Route 52 to Magnolia Avenue Santee
326 Mission Gorge Road City of San Diego to Magonia Avenue Santee
327 Woodside Avenue Magnolia Avenue to State Route 67 Santee
328 Coast Highway City of Encinitas to City of Del Mar Solana Beach
329 Lomas Santa Fe Avenue Interstate 5 to Coast Highway Solana Beach
330 Bobier Drive North Melrose Drive to East Vista Way Vista
331 Cannon Road (Mar Vista Drive) South Melrose Drive to State Route 78 Vista
332 East Vista Way Escondido Avenue to County of San Diego Vista
333 Emerald Drive Sunset Drive to State Route 78 Vista
334 Escondido Avenue State Route 78 to E. Vista Way Vista
335 North Melrose Drive State Route 78 to Bobier Drive Vista
336 North Santa Fe Avenue Main Street to North Melrose Drive Vista
337 Olive Avenue Emerald Drive to Vista Village Drive Vista
338 South Melrose Drive City of Carlsbad to State Route 78 Vista
339 South Santa Fe Avenue Main Street to County of San Diego Vista
340 Sycamore Avenue South Santa Fe Avenue to South Melrose Drive Vista
341 Thibodo Road Mar Vista Drive (Cannon Road) to Sycamore Avenue Vista
342 Vista Village Drive State Route 78 to Escondido Avenue Vista
343 West Vista Way Thunder Drive to Vista Village Drive Vista
Arterial
bold = added to Regional Arterial System with 2030 RTP
* Included in Regional Arterial System contingent upon being designated as a four-lane arterial by the County of San Diego.


Appendix G
GLOSSARY OF TERMS AND ACRONYMS


323
Appendix G
GLOSSARY OF TERMS AND ACRONYMS
A AC Advance Construction ADA Americans with Disabilities Act APCB/APCD (San Diego) Air Pollution Control Board (District) ARB Air Resources Board B BIA Bureau of Indian Affairs BIP Border Infrastructure Program C CON Construction Phase CAA 1990 Clean Air Act, as amended Caltrans California Department of Transportation CARB California Air Resources Board CBI Corridors and Borders Infrastructure CDBG Community Development Block Grant (Federal) CI Capacity Increasing CMAQ Congestion Mitigation and Air Quality Program CMIA Corridor Mobility Improvement Account – Prop 1B CMP Congestion Management Program CO Carbon Monoxide CTC California Transportation Commission D
DEMO ISTEA Special Projects/TEA-21 High-Priority Demonstration DEMO-LU SAFETEA-LU Demonstration projects/High Priority Program DOT U.S. Department of Transportation
E
EPA U.S. Environmental Protection Agency EPSP Expedited Project Selection Process
F
FHWA Federal Highway Administration FSP Freeway Service Patrol (and FSP Act) FTA Federal Transit Administration FTIP Federal Transportation Improvement Program FSTIP Federal State Transportation Improvement Program FFY Federal Fiscal Year FY Fiscal Year

324
H
HES/SR2S Hazard Elimination Safety/Safe Routes to School program HBP Highway Bridge Program HSIP Highway Safety Program HRRP High Risk Road Program HOV High Occupancy Vehicle HUD Housing and Urban Development
I
IM Interstate Maintenance IRR Indian Reservation Road ISTEA Intermodal Surface Transportation Efficiency Act of 1991 ITS Intelligent Transportation Systems
J JARC Jobs Access Reverse Commute L LRT Light Rail Transit M
MPO Metropolitan Planning Organization MTS San Diego Metropolitan Transit System
N
NAAQS National Ambient Air Quality Standards NCI Non Capacity Increasing NCTD North County Transit District NF New Freedom NHS National Highway System
P
P/PE Preliminary Engineering Phase PPNO Project Number PM Particulate Matter Prop 1B Highway Safety, Traffic Reduction, air Quality, and Port Security Bond Act for 2006 PTMISE Public Transportation, Modernization, Improvement and Service Enhancement – Prop
1B Prop 42 Proposition 42, subvention to local agencies
R
RAQS Regional Air Quality Strategy ROG Reactive Organic Gas RW/ROW Right-of-Way phase RTIP Regional Transportation Improvement Program RTP Recreational Trails Program RTP Regional Transportation Plan

325
RSTP Regional Surface Transportation Program S
SANDAG San Diego Association of Governments SAFETEA-LU Safe, Accountable, Flexible, Efficient Transportation Equity Act – a Legacy for Users SBTA State Bicycle Transportation Account SDTC San Diego Transit Corporation SDTI San Diego Trolley, Incorporated SHOPP State Highway Operation and Protection Program SIP State Implementation Plan (for air quality) SLTPP State-Local Transportation Partnership Program SR State Route (as in SR 52 - State Route 52) STA State Transit Assistance STIP State Transportation Improvement Program STIP Augmentation State Transportation improvement Program – Prop 1B STIP-IIP State Transportation Improvement Program - Interregional Program STIP-RIP State Transportation Improvement Program – Regional Improvement Program STP Surface Transportation Program
T TEA Transportation Enhancement Activities TEA-21 Transportation Equity Act for the 21st Century TCI Transit Capital Improvement TCSP Transportation Community and System Preservation TCM Transportation Control Measure TCRP Traffic Congestion Relief Program TDA Transportation Development Act TDM Transportation Demand Management TIP Transportation Improvement Program TMA Transportation Management Agency TP&D Transportation Planning and Development TransNet San Diego Region ½% Local Transportation Sales Tax Program TSM Traffic Systems Management T-1 Transportation T-tactic: Ridesharing T-2 Transportation T-tactic: Transit T-3 Transportation T-tactic: Bicycle T-5 Transportation T-tactic: Traffic Improvement
V VOC Volatile Organic Compounds