2045 Regional Transportation Plan for Santa Cruz County
278
2045 Regional Transportation Plan for Santa Cruz County December 2021 - DRAFT Santa Cruz County Regional Transportation Commission 1101 Pacific Avenue, Suite 250, Santa Cruz, California 95060 | 831.460.3200 | www.sccrtc.org
-
Upload
khangminh22 -
Category
Documents
-
view
5 -
download
0
Transcript of 2045 Regional Transportation Plan for Santa Cruz County

2045 Regional Transportation Planfor Santa Cruz CountyDecember 2021 - DRAFT
Santa Cruz County Regional Transportation Commission
1101 Paci�c Avenue, Suite 250, Santa Cruz, California 95060 | 831.460.3200 | www.sccrtc.org

2 0 4 5 R E G I O N A L T R A N S P O R T A T I O N P L A N i
2045 Santa Cruz County Regional Transportation Plan
Table of Contents
Executive Summary ..................................................................................................................................................... ES-1
Chapter 1 – Introduction
2045 Regional Transportation Plan ........................................................................................................................................... 1-1
Why Sustainability? ................................................................................................................................................................... 1-1
System Preservation .................................................................................................................................................................. 1-2
Safety ........................................................................................................................................................................................ 1-4
Congestion ................................................................................................................................................................................ 1-6
Environmental and Public Health.............................................................................................................................................. 1-7
Greenhouse Gas Emissions .................................................................................................................................................... 1-7
Air Pollutants ........................................................................................................................................................................ 1-9
Obesity .................................................................................................................................................................................. 1-9
Economy .................................................................................................................................................................................. 1-10
Transportation Funding........................................................................................................................................................... 1-11
Equity ...................................................................................................................................................................................... 1-12
Public Input is a Critical Component........................................................................................................................................ 1-12
Chapter 2 - Transportation Network
Setting ....................................................................................................................................................................................... 2-1
Transportation System .............................................................................................................................................................. 2-1
State Highways ......................................................................................................................................................................... 2-2
Highway 1 Corridor ............................................................................................................................................................... 2-3
Highway 1 Corridor Improvement Program ......................................................................................................................... 2-3
Current Highway 1 Projects .................................................................................................................................................. 2-4
Past Highway 1 Projects ........................................................................................................................................................ 2-6
Highway 17 Corridor ............................................................................................................................................................. 2-7
Highway 9 ............................................................................................................................................................................. 2-7

ii S A N T A C R U Z C O U N T Y R E G I O N A L T R A N S P O R T A T I O N C O M M I S S I O N
Highways 236 and 35............................................................................................................................................................ 2-8
Highway 129 and 152 ........................................................................................................................................................... 2-8
Transit........................................................................................................................................................................................ 2-9
Specialized Transportation ...................................................................................................................................................... 2-11
Other Providers ................................................................................................................................................................... 2-12
Identifying Needs ................................................................................................................................................................ 2-12
Santa Cruz Branch Rail Line ..................................................................................................................................................... 2-12
California State Rail Plan ..................................................................................................................................................... 2-15
High Speed Rail Plans ......................................................................................................................................................... 2-17
Active Transportation .............................................................................................................................................................. 2-19
Bike Network....................................................................................................................................................................... 2-19
Pedestrian Facilities ............................................................................................................................................................ 2-20
Identifying Needs ................................................................................................................................................................ 2-20
Bicycle and Pedestrian Projects Underway ......................................................................................................................... 2-22
Transportation Demand Management .................................................................................................................................... 2-23
Park and Ride ...................................................................................................................................................................... 2-23
Transportation System Management...................................................................................................................................... 2-24
Intelligent Transportation Systems ......................................................................................................................................... 2-25
Aviation ................................................................................................................................................................................... 2-26
Chapter 3 - Travel Patterns
Population ................................................................................................................................................................................. 3-1
Employment Opportunities ....................................................................................................................................................... 3-3
Where Are We Traveling? .......................................................................................................................................................... 3-4
County to County Commute Flows ........................................................................................................................................ 3-5
High Use Routes .................................................................................................................................................................... 3-7
How Much Are We Traveling? ................................................................................................................................................. 3-13
Vehicle Miles Traveled ........................................................................................................................................................ 3-13
Visitors ................................................................................................................................................................................ 3-13
Goods Movement ................................................................................................................................................................ 3-14
How Are We Getting Around? ................................................................................................................................................. 3-16
Bicycle Use .......................................................................................................................................................................... 3-18
School Trips ......................................................................................................................................................................... 3-19
Less Trips ............................................................................................................................................................................. 3-19

2 0 4 5 R E G I O N A L T R A N S P O R T A T I O N P L A N ii i
Transportation Equity ......................................................................................................................................................... 3-20
Chapter 4 - Vision for 2045
Goals and Policies ...................................................................................................................................................................... 4-1
Why Do Policies Matter? ............................................................................................................................................................ 4-1
Sustainable Transporation Analysis Rating System .................................................................................................................. 4-2
Key Considerations .................................................................................................................................................................... 4-4
Senate Bill 375 ...................................................................................................................................................................... 4-4
Senate Bill 32 ........................................................................................................................................................................ 4-5
Senate Bill 391 ...................................................................................................................................................................... 4-5
National Transportation Performance Measures .................................................................................................................. 4-5
Complete Streets ................................................................................................................................................................... 4-6
Health and Assembly Bill 441 ............................................................................................................................................... 4-7
Social Equity and Environmental Justice .............................................................................................................................. 4-8
Targets ....................................................................................................................................................................................... 4-8
Chapter 5 – Funding Our Transportation System
Introduction .............................................................................................................................................................................. 5-1
Available Funds ......................................................................................................................................................................... 5-1
Restricted versus Flexible Funds ........................................................................................................................................... 5-3
Measure D ............................................................................................................................................................................. 5-4
Funding Uncertainties........................................................................................................................................................... 5-5
Funding Shortfalls – A Local, State, and Federal Challenge ................................................................................................. 5-6
Potential Future Revenues .................................................................................................................................................... 5-6
Methodology for Projecting Available Funds ........................................................................................................................ 5-7
Chapter 6 - Transportation Investments
Identifying Needs ...................................................................................................................................................................... 6-1
Prioritizing Projects ................................................................................................................................................................... 6-1
Within Projected Funds (Constrained) Project List .................................................................................................................... 6-2
Summary of Constrained Projects ............................................................................................................................................. 6-2
Goal 1 – Access and Environment ......................................................................................................................................... 6-2
Goal 2 – Improve Safety ....................................................................................................................................................... 6-5
Goal 3 - Maintain the Existing Transportation System and Provide Access Equitably .......................................................... 6-7
Fund Distribution....................................................................................................................................................................... 6-8
The Need New Funds (Unconstrained) Project List ................................................................................................................... 6-8

iv S A N T A C R U Z C O U N T Y R E G I O N A L T R A N S P O R T A T I O N C O M M I S S I O N
Implementing the Investment Program ................................................................................................................................... 6-9
Project Cost ........................................................................................................................................................................... 6-9
Funding Decisions ............................................................................................................................................................... 6-11
Chapter 7 - System Performance
Goal 1. Establish livable communities ....................................................................................................................................... 7-1
Target: Improve people’s ability to meet most of their daily needs without having to drive. ............................................. 7-1
Target: Reduce smog-forming pollutants and greenhouse gas emissions. .......................................................................... 7-3
Target: Improve health and reduce greenhouse gas emissions............................................................................................ 7-7
Goal 2. Reduce transportation related fatalities and injuries .................................................................................................... 7-8
Target: Improve transportation safety, especially for the most vulnerable users. ............................................................... 7-8
Goal 3. Deliver access and safety improvements cost effectively and equitably ..................................................................... 7-10
Target: Maintain the existing system and improve the condition of transportation facilities. .......................................... 7-10
Target: Enhance healthy, safe access to key destinations for transportation-disadvantaged populations ........................ 7-12
Target: Increase transportation revenues. .......................................................................................................................... 7-13
Chapter 8 – Environmental and Air Quality Review
CEQA Required Environmental Review...................................................................................................................................... 8-1
Biological and Natural Resources .............................................................................................................................................. 8-2
Cultural Resources ..................................................................................................................................................................... 8-2
Environmental Mitigation ......................................................................................................................................................... 8-3
Regional Mitigation .............................................................................................................................................................. 8-3
Advanced Mitigation ............................................................................................................................................................. 8-4
Stormwater ........................................................................................................................................................................... 8-5
Greenhouse Gas Emissions ........................................................................................................................................................ 8-7
Air Quality Conformity ............................................................................................................................................................... 8-7
Chapter 9 - What’s Next?
Climate Adaptation and Resilience ........................................................................................................................................... 9-1
Autonomous Vehicles ................................................................................................................................................................ 9-4
Definitions ............................................................................................................................................................................. 9-4
Implementation and Timeline .............................................................................................................................................. 9-5
Infrastructure and Planning .................................................................................................................................................. 9-5
State and Federal Policy ........................................................................................................................................................ 9-6
Transportation Glossary and Acronym Guide ......................................................................................... GA-1

2 0 4 5 R E G I O N A L T R A N S P O R T A T I O N P L A N v
Appendices Appendix A – Public Outreach ...................................................................................................................................... A-1
Appendix B – Regional Transportation Commission and Partner Agency Coordination .............................................. B-1
Appendix C – 2045 RTP Goals, Policies and Targets ..................................................................................................... C-1
Appendix D – Funding Projections 2020-2045 ..............................................................................................................D-1
Appendix E – Project List ............................................................................................................................................... E-1
Appendix F – Escalated Project Costs ............................................................................................................................ F-1
Appendix G – Regional Transportation Plan Checklist .................................................................................................. G-1
Appendix H – Resolutions............................................................................................................................................. H-1

vi S A N T A C R U Z C O U N T Y R E G I O N A L T R A N S P O R T A T I O N C O M M I S S I O N
List of Figures
Figure 1.1 – Local Jurisdiction Annual Pavement Maintenance Budget vs. Annual Need ............................................................ 1-3
Figure 1.2 – Santa Cruz County Bicycle and Pedestrian Fatalities and Injuries Due to Collisions
with Motor Vehicles, 2009-2020.............................................................................................................................. 1-6
Figure 1.3 – Obesity Prevalence and Rates of Active Transportation in Countries
of Europe, North America, and Australia................................................................................................................ 1-10
Figure 1.4 – Public Participation Procedures Based on State and Federal Laws ......................................................................... 1-13
Figure 2.1 – Santa Cruz County Primary Transportation Network ................................................................................................ 2-2
Figure 2.2 – Average Pavement Condition for Local Jurisdictions ................................................................................................ 2-9
Figure 2.3 – Transit Service Provided by Santa Cruz Metropolitan Transit District (METRO)....................................................... 2-10
Figure 2.4 – Santa Cruz Branch Rail Line ..................................................................................................................................... 2-14
Figure 2.5 – Regional Rail Network Surrounding Santa Cruz County .......................................................................................... 2-16
Figure 2.6 – Proposed California High Speed Rail Line ................................................................................................................ 2-18
Figure 2.7 – Monterey Bay Sanctuary Scenic Trail Network Map ................................................................................................ 2-22
Figure 2.8 – Park and Ride Lots Serving Santa Cruz County ........................................................................................................ 2-24
Figure 3.1 – Historical and Projected Santa Cruz County Population ............................................................................................ 3-1
Figure 3.2 – Population Data for Santa Cruz County by Jurisdiction ............................................................................................. 3-2
Figure 3.3 – 2010 Population Density ........................................................................................................................................... 3-2
Figure 3.4 – Historical and Projected Number of Jobs in Santa Cruz County ................................................................................. 3-3
Figure 3.5 – Unemployment Rates by Jurisdiction within Santa Cruz County .............................................................................. 3-3
Figure 3.6 – Where People Work in Santa Cruz County ................................................................................................................. 3-4
Figure 3.7 – Workers Living in Santa Cruz County ......................................................................................................................... 3-5
Figure 3.8 – Workers Employed in Santa Cruz County .................................................................................................................. 3-6
Figure 3.9 – Average of Percentage Change in Travel ................................................................................................................... 3-7
Figure 3.10 – Annual Average Daily Traffic Volumes at Most Traveled Segments on
State Highways in Santa Cruz County ...................................................................................................................... 3-8
Figure 3.11 – Caltrans District 5 Freeway VMT by Time of Day ..................................................................................................... 3-9
Figure 3.12 – Local ADT: Average Daily Traffic Volumes at Most Traveled Segments
on Selected Local Roadways .................................................................................................................................. 3-10

2 0 4 5 R E G I O N A L T R A N S P O R T A T I O N P L A N vii
Figure 3.13 – METRO Weekday School Year Average Ridership by Route ................................................................................... 3-11
Figure 3.14 – Total Transit Ridership for Santa Cruz County Fixed Route Service ....................................................................... 3-13
Figure 3.15 – Annual Average Daily Truck Volumes on Highways in Santa Cruz County ............................................................ 3-15
Figure 3.16 – Mode Share for All Trips in California .................................................................................................................... 3-16
Figure 3.17 – Mode Share for All Trips in Santa Cruz County ...................................................................................................... 3-17
Figure 3.18 – Mode Share for Work Trips in Santa Cruz County .................................................................................................. 3-17
Figure 3.19 – Mode Share for Work Trips by City of Residence ................................................................................................... 3-18
Figure 3.20 – Countywide Bicycle Counts from 2003-2021 ........................................................................................................ 3-19
Figure 3.21 – Minority, Low Income and Poverty Areas in Santa Cruz County............................................................................ 3-21
Figure 3.22 – Communities with Low Community Engagement ................................................................................................ 3-22
Figure 3.23 – Communities with Low Mobility ........................................................................................................................... 3-23
Figure 3.24 – Distribution of Senior and Youth Populations in Santa Cruz County ..................................................................... 3-24
Figure 3.25 – Historical Trends in Licensed Drivers and Registered Vehicles in Santa Cruz County ............................................ 3-25
Figure 3.26 – Population Projections for Seniors Age 70 and Over ............................................................................................. 3-25
Figure 4.1 – Goals of the 2045 Regional Transportation Plan ....................................................................................................... 4-2
Figure 4.2 – Policies of the 2045 Regional Transportation Plan and Outcomes they Advance ..................................................... 4-4
Figure 4.3 – Complete Streets for All Users ................................................................................................................................... 4-7
Figure 4.5 – Backcasting Planning Process ................................................................................................................................... 4-9
Figure 4.6 – 2045 Regional Transportation Plan Performance Targets and
Relationship to Triple Bottom Line ........................................................................................................................ 4-12
Figure 5.1 – 25-Year Revenue Forecast. $5 Billion (2020 dollars)................................................................................................. 5-2
Figure 5.2 – Major Transportation Revenues in California ............................................................................................................ 5-3
Figure 5.3 – Funding Restrictions by Project Type ........................................................................................................................ 5-4
Figure 5.4 – Measure D Investment Categories............................................................................................................................. 5-5
Figure 6.1 – Cost of Road Maintenance ......................................................................................................................................... 6-7
Figure 6.2 – $5 Billion Fund Distribution by Mode ........................................................................................................................ 6-8
Figure 6.3 – Typical Stages of Transportation Project Development .......................................................................................... 6-10
Figure 7.1 – Percentage of Bikeway Miles Relative to Lengths of Arterials and Collectors in Urban Areas .................................. 7-2
Figure 7.2 – Santa Cruz METRO Fixed-Route Revenue Miles ......................................................................................................... 7-3
Figure 7.3 – Santa Cruz County Daily Vehicle Miles Traveled (Total and Per Capita) .................................................................... 7-4

viii S A N T A C R U Z C O U N T Y R E G I O N A L T R A N S P O R T A T I O N C O M M I S S I O N
Figure 7.4 – Historic Santa Cruz County Greenhouse Gas Emissions from Transportation ............................................................ 7-5
Figure 7.5 – 2019 CO2 lbs per Capita per Day Based on Fuel Sales ................................................................................................ 7-6
Figure 7.6 – Santa Cruz County Commute Trips Mode Share ........................................................................................................ 7-8
Figure 7.7 – Injury and Fatal Collisions – Motor Vehicle, Bicycle and Pedestrian ......................................................................... 7-9
Figure 7.8 – 2005 to 2020 Pavement Condition Indices for Jurisdictions in Santa Cruz County ................................................. 7-10
Figure 7.9 – Comparison of Santa Cruz County Pavement Condition Index with other California Counties ............................... 7-11
Figure 7.10 – Santa Cruz Metro Fixed-Route Bus Condition ....................................................................................................... 7-12
Figure 7.11 – Santa Cruz METRO Bus Travel Times ...................................................................................................................... 7-13
Figure 9.1 – Relationship of Transportation Planning Timeframe and Infrastructure Service Life
to Increasing Climate Change Impacts ..................................................................................................................... 9-3

2 0 4 5 R E G I O N A L T R A N S P O R T A T I O N P L A N ES-1
2045 Santa Cruz County Regional Transportation Plan
Executive Summary The Santa Cruz County Regional Transportation Commission (herein referred to as the “RTC” or “Commission”) periodically completes a Regional Transportation Plan according to state guidelines to guide short- and long-range transportation planning and project implementation for the county. This 2045 Regional Transportation Plan (called the “2045 RTP”) is the RTC’s comprehensive planning document that provides guidance for transportation policy and projects through the year 2045. The 2045 RTP is based on a sustainability framework using the Sustainable Transportation Analysis and Rating System (STARS) to identify the goals, policies and thus the projects and programs to achieve a more sustainable transportation system. Sustainability is defined as balancing economic, environmental and equity interests. Individual projects listed in the 2045 RTP must still undergo separate design and environmental processes, and can only be implemented as local, state and federal funds become available. This RTP, along with those from Monterey and San Benito Counties, has also been incorporated into the 2045 Metropolitan Transportation Plan/Sustainable Communities Strategy (MTP/SCS) covering the three-county Monterey Bay area that will meet state and federal guidelines.
The following is a summary of each chapter in the 2045 RTP.
Chapter 1 – Introduction
The transportation system not only enables us to get around but it is also interlinked with our health and safety, the quality of the built and natural environment, and the economic vitality of our region. The 2045 Santa Cruz County Regional Transportation Plan endeavors to work towards a sustainable transportation system that addresses the challenges that face transportation in Santa Cruz County now and in the future. The challenges discussed in Chapter 1 include:
• System Preservation – Maintenance needs for the existing transportation network are increasing.Roadway, bikeway, sidewalk, bridge and other repairs must be addressed in parallel withcapacity and operational enhancements. If ongoing routine maintenance needs are not addressed,the cost of deferred maintenance will grow exponentially, leaving little funding for new projects.
• Safety – The federal transportation act, Investing a New Vision for the Environment and SurfaceTransportation (INVEST) in America Act, identifies safety as a national goal area and requireseach state to set Safety Performance Management Targets in order to achieve a significantreduction in motorized and non-motorized traffic fatalities and serious injuries on all publicroads. The Metropolitan Planning Organizations must also establish targets in coordination withthe state.
• Congestion – Traffic congestion exists in Santa Cruz County and will not go away in theforeseeable future. Population growth and region-wide jobs to housing imbalances thatencourage driving as the mode of choice result in more drivers making more automobile trips.

EX E CU TI VE SU M M A RY
ES-2 S A N T A C R U Z C O U N T Y R E G I O N A L T R A N S P O R T A T I O N C O M M I S S I O N
The frequent traffic jams on Highway 1 are the most obvious example of congestion on county roadways.
• Environmental and Public Health - A sustainable transportation system can play a vital role inthe environmental health of Santa Cruz County and the health of its residents. Greenhouse gasemissions (GHG) have global environmental and public health effects, and air pollutants canaffect both the environment and public health on a regional scale. The link between limited use ofactive transportation, such as biking and walking, and adult and childhood obesity isincreasingly strengthened through research. Strategies for addressing this concern are beingdiscussed at federal, state and local levels.
• Economy – The economic vitality of a region can be affected by transportation in a number ofways. Improved access is likely to positively affect businesses through faster goods movementand increased tourist activity. Implementation of transportation projects can provide jobs, andthe smaller the percentage of household income that goes to transportation, the greater theamount of money that is available to go back into the local economy.
• Funding – Funding for transportation in Santa Cruz County has notably improved in recentyears. Measure D, approved by Santa Cruz County voters in 2016, provides over $20 million inrevenues per year from sales taxes that are dedicated for use on the transportation categoriesapproved by voters. In 2017, the California legislature provided more stable funding fortransportation for the first time in nearly 25 years with passage of Senate Bill 1. Despite the recentfunding improvements, there continues to be insufficient funds for all of the community’stransportation needs.
The 2045 RTP endeavors to work toward a sustainable transportation system that addresses these challenges and results in safer, healthier and more efficient travel choices that provide improved multimodal access to opportunities such as jobs, education, and healthcare for our residents.
Chapter 2 – Transportation Network
Santa Cruz County has a rich multi-modal transportation network. The county’s existing transportation network comprises a broad range of transportation facilities and modes. These include state highways, local streets and roads, an extensive bus system, a specialized transport system for seniors and people with disabilities, bikeways, sidewalks, an airport and a rail line. The most notable improvements to the highways have been on Highway 1 including Mission St, the Highway 1 and 17 interchange and auxiliary lanes between Soquel Drive and Morrissey Boulevard.
In 2012, the RTC became the owner of the Santa Cruz Branch Rail Line that extends almost 32 miles between Davenport and Watsonville. The RTC purchased the rail corridor on behalf of the community to preserve the corridor for existing and future transportation uses, including freight rail, passenger rail service/transit, and bicycle and pedestrian facilities. The Unified Corridor Investment Study performed an analysis of the options for transportation uses of the rail right-of-way as required by Measure D. The Transit Corridor Alternatives Analysis and Rail Network Integration Study accepted by the RTC in February 2021 selects electric passenger rail as the locally preferred alternative for the Santa Cruz Branch Rail Line. The Master Plan and Environmental Impact Report for the Monterey Bay Sanctuary Scenic Trail, a network of multiuse trails with the spine along the rail line, have been completed. Eighteen (18)

EX E CU TI VE SU M M A RY
2 0 4 5 R E G I O N A L T R A N S P O R T A T I O N P L A N ES-3
miles of trails along the rail right of way have been funded in full or in part, with construction to begin as soon as design, engineering and environmental permitting are completed. The first project was completed in 2020.
Transportation system management and transportation demand management programs are also components of the transportation network. Transportation System Management (TSM) projects incorporate operational improvements that improve traffic flow and safety. Examples include signal synchronization, new turning lanes, striping, auxiliary lanes and detectors for assessing real time traffic conditions. Transportation Demand Management includes strategies that reduce the number of people that are driving alone. These strategies include increasing the number of people carpooling, bicycling, telecommuting and taking transit through programs such as Cruz511 and GO Santa Cruz County commuter services.
This multi-modal transportation network is crucial to meeting the travel needs of all county residents, including drivers, non-drivers and commercial traffic.
Chapter 3 – Travel Patterns
The majority of the population in Santa Cruz County lives and travels within a small area of the county. The areas of the county with higher population density are primarily along the coast (City of Santa Cruz, Capitola, Live Oak, Soquel and Aptos), in the cities of Watsonville and Scotts Valley, and along portions of the San Lorenzo Valley. Although the distances that people travel within Santa Cruz County are not extensive, increasing the diversity of land uses within neighborhoods to improve access to goods and services can result in even greater reductions in trip lengths.
The patterns of travel within Santa Cruz County are very much dependent on the number of people who live, work and visit the county. Population growth in Santa Cruz County between 2000 and 2010 increased by only 3% but future projections indicate that population will grow by 9% between 2020 and 2045. Similarly, the number of jobs in Santa Cruz County is forecasted to increase by 9.5% between 2020 and 2045.
Much effort on this 2045 RTP and the 2045 Metropolitan Transportation Plan has been focused on prioritizing projects that will reduce greenhouse gas emissions primarily from a reduction in vehicle miles traveled (VMT). One vehicle traveling one mile equals one “vehicle mile traveled.” The 2010-2012 California Household Travel Survey (CHTS) data results for the state show that there has been a doubling of walk, transit and bike trips compared to data collected in 2000 and a reduction of drive alone trips of approximately 10%. Mode share data for Santa Cruz County from this CHTS data shows that Santa Cruz County residents’ bike more often than the state average. The American Communities Survey provides mode share data for the “typical mode taken to work” for Santa Cruz County. The ACS data from 2015-2019 shows that Santa Cruz County residents are choosing to walk and ride their bike to work more often than in 2000, but carpool less, and the percent of drive alone trips remain the same. The data also show an upward trend in working from home.
Chapter 4 – Vision for 2045

EX E CU TI VE SU M M A RY
ES-4 S A N T A C R U Z C O U N T Y R E G I O N A L T R A N S P O R T A T I O N C O M M I S S I O N
The Santa Cruz County Regional Transportation Commission utilizes a rating system called the Sustainable Transportation Analysis Rating System (STARS) to support development of the RTP. The goals, policies, performance measures and targets were developed with extensive public and partner input using STARS to form the foundation for a sustainable transportation plan. The measures are shaped by readily available data and are expected to evolve as new data becomes available. The goals for the 2045 RTP are as follows:
• Goal 1: Establish livable communities that improve people’s access to jobs, schools, recreation,healthy lifestyles and other regular needs in ways that improve health, reduce pollution andretain money in the local economy.
• Goal 2: Reduce transportation related fatalities and injuries for all transportation modes.
• Goal 3: Deliver access and safety improvements cost effectively, within available revenues,equitably and responsive to the needs of all users of the transportation system and beneficiallyfor the natural environment.
The Santa Cruz County Regional Transportation Plan identifies measurable outcomes, called targets that are each linked to a sustainability goal. Incorporating targets into the goals and policies enables the Regional Transportation Commission to assess how well the long-range plan performs over time in advancing the targets. The assessment of performance is provided in Chapter 7.
Chapter 5 – Financial Plan
Transportation programs and projects in Santa Cruz County are funded from a variety of local, state and federal funding programs. Local sources account for 46% of the transportation revenues, 39% from state and 15% from federal. Based on current and projected revenue sources, approximately $5 billion are reasonably anticipated to be available to finance transportation projects in Santa Cruz County through 2045 ($200 million per year). The vast majority of anticipated revenues are committed to specific dedicated uses. Over one third of local, state and federal funds can only be used for transit and paratransit projects and operations. A large proportion of these transit revenues come from our county’s dedicated half-cent local sales tax for transit. Airport improvements and highway safety also account for a large portion of the dedicated funds.
In response to ongoing funding shortfalls and the large backlog of maintenance and other projects, Santa Cruz County voters approved Measure D in November 2016, a 30-year half-percent sales tax dedicated to local transportation projects and programs. Measure D provides over $20 million per year in stable funding for projects in Santa Cruz County. In 2017, the California legislature passed Senate Bill 1 – The Road Repair and Accountability Act to stabilize transportation funding and help address the diminishing transportation revenues from the per gallon gasoline and diesel tax.
The Regional Transportation Commission (RTC) has discretion over less than 4% of the funds available for transportation projects in the next 25 years (approximately $8.5 million per year). These funds are from regional shares of the State Transportation Improvement Program (STIP) Surface Transportation Block Grant Program (STBG) and SB 1- Local Partnership Program.
It is important to note that transportation funding can be incredibly unpredictable. State and federal actions can result in elimination of certain funding programs or diversion of transportation funds to the

EX E CU TI VE SU M M A RY
2 0 4 5 R E G I O N A L T R A N S P O R T A T I O N P L A N ES-5
State General Fund, as has happened regularly to transit funds over the past several years. Inevitably, some of the funding sources assumed within the financial projections for this plan will not actually be realized. Even if all of the revenues assumed in this document are realized, projected funds are insufficient to keep up with the maintenance, operational, safety, and major improvement needs of the region discussed in Chapter 6. Therefore, this document identifies additional sources for new funds that could potentially become available. The RTC works with entities locally, statewide, and nationally to seek new transportation revenue sources. These could include new local or state gas taxes, transportation impact fee programs, statewide transportation bonds, special federal funding programs (such as economic stimulus bills), special state legislative budget requests, and new grants.
Chapter 6 – Transportation Investments
A list of programs, projects and actions needed to operate, maintain, and improve the transportation system in Santa Cruz County has been developed – based on input from the public and sponsoring agencies -- as part of the Action Element of the RTP. The cost of implementing this list of transportation projects in Santa Cruz County is approximately $9.7 billion, whereas the estimated funds available through 2045 is approximately $5 billion – just over half of the estimated need.
Given the significant gap between funding needs for transportation and projected revenues, the projects listed in the RTP must be divided into two groups. Transportation improvements that can be funded with foreseeable transportation revenues between 2020 and 2045 are shown as “Constrained.” This group includes projects with dedicated funding, already funded projects to be constructed in the short term, and planned projects that could be constructed anytime within the 2045 RTP’s 25-year timeline as projected funds become available. Transportation improvements to be implemented only if new revenues are generated or become available show their funding as “unconstrained.” Some projects are identified with both constrained and unconstrained funds, indicating a need for additional funds to complete the entire project, though portions of those projects may be completed using available funding.
In order to determine which projects are prioritized for the constrained list for the 2045 RTP, input was solicited from project sponsors, the public, public interest groups and RTC advisory committees throughout the process in developing the final project list that identifies the projects as either constrained and/or unconstrained.
The within projected funds or constrained project list consists of approximately 360 projects that could be fully implemented and 150 projects that could be partially implemented over the twenty-five year timeframe. These projects and programs address the region’s accessibility, economic, safety and environmental sustainability needs over the next 25 years and constitute the 2045 RTP’s constrained project list described in Chapter 6 with the full list of projects and programs provided in Appendix E. During the next 25 years, approximately $5 billion from federal, state, and local funding sources is projected to be available to finance transportation projects in Santa Cruz County. Over 290 projects are on the unconstrained list, for which additional funds will be needed in order to be implemented.
The 2045 RTP assigns future transportation funds to a range of projects and programs designed to maintain the current transportation system, and improve access, safety and environmental and public health by broadening transportation options. Key proposals, based on available funding, include:

EX E CU TI VE SU M M A RY
ES-6 S A N T A C R U Z C O U N T Y R E G I O N A L T R A N S P O R T A T I O N C O M M I S S I O N
• Maintenance of the existing transportation network including roads, highways, bike lanes, sidewalks, and transit
• Safety and operational improvements to Highways 1, 9, 17, 129 and 152
• Addition of auxiliary lanes and bus on shoulders on Highway 1 between Freedom Boulevard in Aptos and Soquel Ave
• Bicycle and pedestrian crossings over Highway 1 at Chanticleer and Mar Vista
• Modifications to major arterial roads -- including intersection improvements and bus, pedestrian and bicycle facilities
• Freeway Service Patrol along Highways 1 and 17
• Expanded bus service for high ridership routes to serve University of California Santa Cruz (UCSC), south county and San Jose commuters
• Transit queue jumps and high occupant vehicle signal priority
• Construction of the Monterey Bay Sanctuary Scenic Trail, the Pajaro River Trail, and the San Lorenzo Valley Trail
• Local bicycle and pedestrian projects and programs designed to increase bicycle commuting, and provide safe bicycle and pedestrian routes to schools and key destination areas
• Expansion of specialized transport services in response to projected increases in senior and disabled populations
• Individualized marketing programs to employers to increase carpooling and vanpooling
Development of the RTP project list is a preliminary step towards actual implementation of the projects identified in the 2045 RTP. Prior to the beginning of project construction, a number of steps must be taken which can take from 6 months to 20 years, depending on the particular project’s complexity, impacts, level of public interest, funding and environmental requirements, and availability of funds. These steps include developing a detailed project cost estimate; obtaining local, state and/or federal funds; designing the project; determining the project’s environmental impacts; securing right-of-way, if necessary; and throughout the process, incorporating public input.
Chapter 7 – System Performance
Performance-based planning is a strategic approach that uses key information to help inform investment decisions. The performance of the previous regional transportation plans for Santa Cruz County completed in 2014 and 2018 was analyzed in detail to determine how well the constrained list of transportation projects and programs advance the goals and targets established for the 2014 and 2018 RTPs and affect the county’s future. The analysis that was performed is still largely applicable to the 2045 RTP given the project list for the 2045 RTP has not changed substantially from the 2014 and 2018 versions.
The 2045 RTP focuses the system performance on presenting available data that monitors the performance of the transportation system to date. Data is not available at this time to monitor all of the measures in the 2045 RTP although many of the more fundamental indicators (safety, vehicle miles traveled, greenhouse gas emissions, pavement condition) are presented.

EX E CU TI VE SU M M A RY
2 0 4 5 R E G I O N A L T R A N S P O R T A T I O N P L A N ES-7
Chapter 8 – Environmental and Air Quality Review
The California Environmental Quality Act of 1970 (CEQA) requires that the environmental effects of the 2045 RTP be analyzed. This analysis was prepared as a separate program-level Environmental Impact Report (EIR) released along with the 2045 RTP. The EIR, prepared in coordination with the Association of Monterey Bay Area Governments (AMBAG), Transportation Agency for Monterey County (TAMC), and the San Benito County Council of Governments (SBCOG), collectively evaluates the MTP/SCS and the Regional Transportation Plans for the Monterey Bay region - Santa Cruz, Monterey, and San Benito Counties. The EIR analyzes the potential environmental impacts of the 2045 RTP, including alternative investment scenarios, and identifies potential mitigation measures for impacts of the transportation program for the whole region. The EIR does not analyze impacts of, or mitigations for, individual projects. The respective agency sponsors will conduct a project-specific review, once funding is received and the project is initiated.
Together Santa Cruz, Monterey, and San Benito Counties comprise the North Central Coast Air basin (NCCAB). Many projects in the plan implement the Monterey Bay Unified Air Pollution Control District’s (Air District) approved Transportation Control Measures for the region, which are developed to reduce transportation-related emissions by reducing vehicle use or improving traffic flow. The three-county region (or NCCAB) is an attainment area for air quality impacts and therefore exempt from the required conformity analysis.
Chapter 9 – What’s Next?
The Santa Cruz County Regional Transportation Plan is a work in progress that will be updated approximately every four years. This chapter identifies a number of considerations that will likely be prominent features of the RTP over the next couple of decades.
Santa Cruz County is susceptible to a wide range of climate change effects. The RTC is aware of the need to undertake efforts to respond to impacts of climate change along with the current effort to reduce GHG emissions. Future editions of the RTP may address the impacts of climate change by identifying areas at most risk to sea level rise as well as other additional transportation considerations.
The effects of automated vehicles on future transportation systems are under much debate. Automated vehicles (AVs) are an emerging technology that could bring a number of benefits to the transportation system including increased safety, increased throughput due to driving efficiencies, and improved system management through vehicle data. Conversely, there is also the potential of AVs to drastically increase traffic congestion and the amount of vehicle miles traveled particularly when self-driving vehicles no longer require a person on board. There are many uncertainties associated with AVs including a currently unfolding set of federal and state regulations, resolution of questions around programming ethics, solutions to liability and insurance concerns, potential criminal abuse, and market adoption rates. The RTC will be watching the evolution of this technology for incorporation into future RTPs.

2 0 4 5 R E G I O N A L T R A N S P O R T A T I O N P L A N 1-1
CHAPTER
1 Introduction
2045 Regional Transportation Plan
In the state of California, responsibility for transportation planning and coordination is assigned to regional transportation planning agencies. The Santa Cruz County Regional Transportation Commission (referred to as the “Commission” or “RTC”) is the designated regional transportation planning agency (RTPA) for Santa Cruz County. The RTC is required to periodically undertake long-range planning efforts to set the course for meeting the transportation needs of its respective communities over a 20-plus year timeframe. This long-range planning effort is called the Regional Transportation Plan, or RTP. Planning is an important component to project implementation as it provides a forum for assessing the direction of transportation in our county over the next 20-plus years. It positions our community to receive funding for projects that require a well thought out plan and helps to develop collaboration on projects.
The 2045 Santa Cruz County Regional Transportation Plan covers the period 2020 -2045 and incorporates sustainability principles in all of its elements: transportation goals and policies (policy element – Chapter 4), a financial plan for funding transportation projects (financial element – Chapter 5), and a program of short- and long-range transportation projects (action element – Chapter 6).
The RTC coordinates with the Association of Monterey Bay Area Governments (AMBAG) in developing the Metropolitan Transportation Plan/Sustainable Communities Strategy (MTP/SCS) for the tri-county area of Monterey, San Benito and Santa Cruz Counties. AMBAG also develops the population, housing and employment growth projections for the region. The 2045 RTP is consistent with both of these efforts.
Why Sustainability?
Transportation affects many aspects of our lives both directly and indirectly. The transportation system enables us to get around – to work, to school, to businesses, to recreation, etc. – but it is also interlinked with our health and safety, the quality of the natural environment, and the economic vitality of our region. The 2045 Regional Transportation Plan reflects a wide spectrum of sustainability objectives for this long-range planning effort. A sustainable transportation system requires a plan that encompasses improvements to access, mobility, the environment, public health, safety, the economy and equity, as well as preservation of our current transportation system, all

Intr o d uc t ion | C H A P T E R 1
1-2 S A N T A C R U Z C O U N T Y R E G I O N A L T R A N S P O R T A T I O N C O M M I S S I O N
within financial constraints—a challenge, no doubt, but a strategy that strives to best serve the residents and visitors of Santa Cruz County.
The California Sustainable Communities and Climate Protection Act of 2008 (SB 375) requires the establishment of regional greenhouse gas emission targets, and the 2016 California Senate Bill 32 requires the reduction of greenhouse gas emissions by 40% below 1990 levels by 2030. Greater emphasis is being placed on transportation to reduce the number of vehicle miles we travel through coordination of transportation investments and land use planning. Considering these sustainability requirements and all applicable state, federal, and regional priorities, the 2045 Santa Cruz County Regional Transportation Plan identifies infrastructure projects and programs that could be implemented through 2045 based on anticipated transportation revenues.
This chapter discusses several challenges affecting the transportation system in Santa Cruz County now and in the future. The 2045 RTP endeavors to address these challenges and to bring about safer, healthier and more efficient travel choices that provide improved multimodal access to jobs, education, healthcare, and other destinations for our residents and visitors. Addressing many of these challenges will require a significant change in how we choose to travel. One of the few positive benefits of living through the COVID-19 pandemic over the last couple of years was to see how people can change their behaviors and adapt to new ways of living. Many people who had jobs that allowed for working remotely were able to make that shift, reducing the traffic congestion for those who needed to work at their employment location. Online meetings quickly took over as the way to meet with coworkers and other partners in place of in-person meetings and sometimes attendance even increased due to ease in ability to participate. Cities closed local streets to create “slow streets” to allow for more space for people to get outdoors to exercise and follow social distancing protocols. Cities also eliminated parking spots to allow restaurants to set up outdoor seating on the streets to make it safer for restaurant employees and the public and to help to keep the businesses afloat. The RTC and local jurisdictions through development of this 2045 RTP are working to implement multimodal transportation solutions for all but your support is needed. Choosing to ride a bike, walk, take transit, or carpool, choosing to slow down and decrease distractions when driving, choosing to buy or lease an electric vehicle, planning your trips outside of peak periods, chaining your trips to reduce total miles traveled or deciding to not take a trip are all behaviors that will help Santa Cruz County meet the transportation challenges of our times.
System Preservation
A well-maintained multimodal transportation system of local roads, highways, bridges, buses, bicycle facilities, pedestrian infrastructure and other transportation components is critical to providing a reliable, seamless, interconnected system. Such a system supports the traveling public and the local economy, reduces wear-and-tear on vehicles, and operates efficiently. Unfortunately, much of the local transportation system is aging and in need of major repair. Due to increased demands on the transportation network and unreliable funding, transportation agencies, cities, counties, Caltrans, and transit providers, were not able to keep up with
Paving at State Park Drive

Intr o d uc t ion | C H A P T E R 1
2 0 4 5 R E G I O N A L T R A N S P O R T A T I O N P L A N 1-3
the increasing backlog of maintenance in the 2000s and 2010s. So, in November 2016, Santa Cruz County voters approved Measure D, and in 2017, the State Legislature approved Senate Bill 1 (SB 1) – the Road Repair and Accountability Act of 2017; these two programs have begun to enable cities and counties, Caltrans, and transit agencies to make significant progress in addressing deferred maintenance, rehabilitation, and safety needs.
On a scale of zero (failed) to 100 (excellent), the average pavement condition index (PCI) of local streets in our county’s five jurisdictions has been between 49 and 50 hovering around the boundary between the categories “poor” and “at risk” for the past 10 years. In 2020, the Pavement Condition Index for Santa Cruz County had increased slightly to 53, still the twelfth worst PCI in the state.1 Maintenance of rural and often mountainous roadways can be particularly challenging due to their remote location and susceptibility to storm damage and can have a lower priority due to low traffic volumes relative to more urban roadways. The winter storms
of 2016/2017 caused severe damage to numerous roadways in the Santa Cruz Mountains, which lowered the 2017 average PCI for roadways in unincorporated areas to 39 and kept the overall county score in the low 50s in 2020 despite the critical money coming from Measure D and SB1. Insufficient gasoline tax funding to cities and counties, as well as low-density development in the Santa Cruz Mountains, has contributed to a backlog of local road maintenance needs in Santa Cruz County that exceeds $350 million. Measure D and SB 1 provide approximately $4.5 million and $7 million, respectively, per year to local cities and the County of Santa Cruz to address the backlog. Figure 1.1 shows there is still a disparity between available funds and funds needed for local road pavement maintenance given the backlog of maintenance that has been accumulating.
Figure 1.1 – Local Jurisdiction Annual Pavement Maintenance Budget vs. Annual Need Source: California Statewide Local Streets and Roads Needs Assessment (2020) and public works departments
Caltrans has faced a similar challenge maintaining the state highway system (SHS). Deteriorating highway conditions result in lower operational performance, higher user operating costs (additional
$43,100
$550$4,348
$867$2,644
$0$5,000
$10,000$15,000$20,000$25,000$30,000$35,000$40,000$45,000$50,000
UnincorporatedCounty
Capitola City of Santa Cruz Scotts Valley Watsonville
$ in
Tho
usan
ds
Annual Budget Annual Shortfall
Santa Cruz County Road Maintenance
as of 2020 • Miles of local roads: 872
• Average Pavement Condition: PCI 55 (out of 100)
• 12th worst PCI rating out of 58 counties in the state
• $636 million backlog for the next 10 years

Intr o d uc t ion | C H A P T E R 1
1-4 S A N T A C R U Z C O U N T Y R E G I O N A L T R A N S P O R T A T I O N C O M M I S S I O N
vehicle repair costs, increased fuel consumption, increased tire wear, and accelerated vehicle depreciation), and ultimately higher overall long-term costs when needed repairs to the highway are eventually undertaken. In addition, the ever-increasing cost of meeting legal, statutory, and regulatory mandates is a significant contributor to operating and maintenance needs. Approximately 35% of SB1 revenues are invested in maintenance and rehabilitation of state highway infrastructure, including pavement, bridges, and culverts. Caltrans develops a coordinated Transportation Asset Management Plan (TAMP) with partner agencies to maintain California’s highway infrastructure assets. The TAMP is updated every four years to incorporate improvements and re-evaluate conditions, targets, and performance measures.2
Maintenance of the transit system is critical to keep existing transit vehicles running and to ensure bus service is reliable. Buses and paratransit vehicles need to be replaced on a regular basis, transit centers require regular upkeep and rehabilitation, bus stops need to be maintained, and operations facilities need to be maintained and upgraded. The Federal Transit Administration defines the useful life of buses as 12 years and 500,000 miles. The Santa Cruz Metropolitan Transit District (METRO) has over 60 fixed-route buses, with an average age of 16 and over 600,000 miles, that need to be replaced or refurbished (2017); and nearly 40 paratransit vans which need to be replaced every 5-10 years.
Safety
Safety is a significant concern in operating the transportation network. The 2021 federal transportation funding bill, Investing a New Vision for the Environment and Surface Transportation (INVEST) in America Act identifies safety as a national goal area and requires each state to set Safety Performance Management Targets (SPMTs) to achieve significant reductions in motorized and non-motorized traffic fatalities and serious injuries on all public roads. The California Department of Transportation (Caltrans), in cooperation with the Office of Traffic Safety (OTS), sets five annual Safety Performance Management Targets for all public roads in the State of California by August 31 of each year. The targets for 2021 include a 2.9% annual reduction in the number of fatalities and rate of fatalities (per 100 million VMT), a 1.3% reduction in the number of serious injuries and rate of serious injuries (per 100 million VMT), and a 2.9% reduction in the number of non-motorized fatalities and a 1.3% reduction in
2020 Collision Facts
California
• 5,018 Total Fatalities o 3,859 in Motor Vehicles o 1,015 Pedestrians o 144 Bicyclists
• 13,166 Total Severe Injury Collisions
• 4.1 % of injury/fatal crashes involve Pedestrian Fatalities and Severe Injuries
• 3.4 % involve Bicycle Fatalities and Severe Injuries
Santa Cruz County
• 19 Total Fatalities o 10 in Motor Vehicles o 8 Pedestrians o 1 Bicyclist
• 110 Total Severe Injury Collisions
• 7.8% of injury/fatal crashes involve Pedestrian Fatalities and Severe Injuries
• 12.3% involve Bicycle Fatalities and Severe Injuries
• 7 Pedestrian Fatalities
• 3 Bicyclist Fatalities

Intr o d uc t ion | C H A P T E R 1
2 0 4 5 R E G I O N A L T R A N S P O R T A T I O N P L A N 1-5
the number of non-motorized serious injuries.3 These targets are consistent with the California Strategic Highway Safety Plan (SHSP) and the California Strategic Management Plan to reduce fatalities and serious injuries on public roads. The Metropolitan Planning Organizations has also established targets for these same five measures in coordination with the state.
Primary collision factors, as identified by the California Highway Patrol, include driving under the influence of alcohol, unsafe speeds, improper turning, and distracted driving due to cell phone use. The SHSP has identified various actions that state and local agencies can perform to reduce collisions based on these factors. These include the capital projects on the state highway system funded through the State Highway Operation and Protection Program (SHOPP), added CHP enforcement – especially of vehicle speeds — and local education programs led by a coalition of police departments, health service agencies, and public works departments.
The safety of those traveling via non-motorized or active transportation needs to be emphasized. The number of bicyclist and pedestrian injuries and fatalities in the county from 2009 through 2020 is provided in Figure 1.2. All collisions presented here involve motor vehicles. The number of pedestrian fatalities has been increasing over the last decade and the number of bicycle injuries has been decreasing over the last 5 years. The California Office of Traffic Safety ranked Santa Cruz County as the 3rd worst county in the state for the number of bicyclist collisions in 2018 and 12th worst for the number of pedestrian collisions based on population.4 Santa Cruz County has a higher percentage of trips by bicycling and walking than the California state average.5 Without a better understanding of how many miles people are biking and walking, it is difficult to assess whether the collision rankings for Santa Cruz County are high relative to other regions based on use. Regardless of the rankings, reducing the number of fatalities and injuries for the most vulnerable users of the transportation system is critically important, given the multiple benefits of active transportation including public health, environmental sustainability, reduced congestion, and reduced wear and tear on roadways.
The Community Traffic Safety Coalition (CTSC) is working to address the traffic safety issues in Santa Cruz County by promoting a “Vision Zero” target for traffic fatalities and serious injuries with an emphasis on non-motorized transportation. Vision Zero is an internationally successful approach to eliminating deaths and serious injuries by making significant investments in road safety re-engineering and enforcement of dangerous driver behaviors. The goal of the CTSC’s efforts is for each jurisdiction in Santa Cruz County to adopt a Vision Zero policy and to develop strategies for preventing serious injuries and deaths among all road users. The 2045 RTP has included a “Vision Zero” target to eliminate traffic fatalities and serious injuries by 2045 for all modes. Data on serious/severe injuries is provided in Chapter 7.

Intr o d uc t ion | C H A P T E R 1
1-6 S A N T A C R U Z C O U N T Y R E G I O N A L T R A N S P O R T A T I O N C O M M I S S I O N
Figure 1.2 – Santa Cruz County Bicycle and Pedestrian Fatalities and Injuries Due to Collisions with Motor Vehicles, 2009-2020 Source: Statewide Integrated Traffic Records System (SWITRS) via UC Berkeley Transportation Injury Mapping System (TIMS)6 *Provisional data
Congestion
Traffic congestion has become considerably more difficult to avoid. Congestion nationwide has increased two to threefold over the last 30 years.7 In Santa Cruz County, segments of Highway 1 and a number of our local roads are notorious for being congested particularly at peak commute hours. Congestion on highways and arterials can encourage cut-through auto traffic on neighborhood streets which can further degrade the local road system and discourage walking and biking. During the initial months of the COVID-19 pandemic, traffic volumes decreased by more than 30% nationwide8 but since the stay-at-
0
3
6
9
12
2009 2010 2011 2012 2013 2014 2015 2016 2017 2018 2019* 2020*
Num
ber o
f Fat
aliti
es
Year
Fatalities
Pedestrians Bicyclists
0
25
50
75
100
125
150
175
200
225
2009 2010 2011 2012 2013 2014 2015 2016 2017 2018 2019* 2020*
Num
ber o
fVic
tims
with
Inju
ries
Year
Victims with Injuries
Pedestrians Bicyclists

Intr o d uc t ion | C H A P T E R 1
2 0 4 5 R E G I O N A L T R A N S P O R T A T I O N P L A N 1-7
home orders were lifted, traffic volumes have increased again but nationwide the new rush hour is shorter and less severe. The lasting impacts of the pandemic on traffic patterns are yet to be seen as employers decide on whether they will continue to allow employees to work remotely and as people decide whether they are comfortable traveling.
Santa Cruz County residents have suggested many strategies to respond to congestion and reduce
how long it takes to get places, but with declining gas tax revenues, an aging system that is already difficult to maintain, and requirements for reducing greenhouse gas emissions, it is no longer expected that the community can completely eliminate congestion. The region must find ways to operate and utilize our existing highway and transit networks more efficiently and sustainably over the long term.
Environmental and Public Health
Not only in Santa Cruz County, but all over the world, communities are working to balance the movement of people and goods with environmental and public health priorities. Greenhouse gas emissions have global environmental and public health effects, and air pollutants can affect both the environment and public health on a regional and local scale, with those living close to major arterials being exposed to more particulate matter and noise. The link between limited active transportation, such as biking and walking, and adult and childhood obesity is being strengthened as research and strategies for addressing this concern are being discussed at federal, state and local levels. A sustainable transportation system can play a vital role in the environmental health of Santa Cruz County and the health of its residents.
Greenhouse Gas Emissions
In 2005, Governor Schwarzenegger issued an Executive Order for the state of California to reduce greenhouse gas (GHG) emissions from all sectors to 1990 levels by 2020 and to 80% below 1990 levels by 2050. To support these goals, the California legislature passed the California Global Warming Solutions Act of 2006 (Assembly Bill 32) which established a statewide target to reduce GHG levels to 1990 levels by 2020.9 With transportation responsible for approximately 27% of the total GHG emissions nationally10 and approximately 60% of the total GHG emissions in Santa Cruz County,11 this bill set in motion a series of events that will change transportation planning for decades to come. In 2016, California Senate Bill 32 was passed
California Global Warming Solutions Act (AB 32)
• Reduce GHG emissions from all sectors to 1990 levels by 2020
Highway 1 congestion at peak commute hours

Intr o d uc t ion | C H A P T E R 1
1-8 S A N T A C R U Z C O U N T Y R E G I O N A L T R A N S P O R T A T I O N C O M M I S S I O N
expanding upon AB 32 by requiring the reduction of GHG emissions to 40% below 1990 levels by 2030.12 More recently in 2020, Governor Newsom issued Executive Order N-79-20 directing the state to require that by 2035, all new cars and passenger trucks sold in California be zero-emission vehicles.13
The three primary approaches for reducing greenhouse gas emissions from transportation are through:
1. Improvements in vehicle technology creating greater fuel efficiencies such as zero-emission (ZEV) and partial zero-emission vehicles (PZEV)
2. Improvements in low-carbon fuels
3. Reduction in the number of vehicle miles traveled (VMT)
None of these approaches alone will result in meeting the GHG emission reduction targets. Like other regions, pursuit of all three in combination will be necessary. Zero emission and partial zero emission vehicles have been developed to meet California’s strict air quality standards, and to reduce greenhouse gas emissions from new passenger vehicles. The Low Carbon Fuel Standard (LCFS) establishes performance standards for reductions in carbon in transportation fuels that fuel producers and importers must meet each year. These measures are anticipated to result in the greatest reductions statewide.
The third approach, reducing the number of vehicle miles that are traveled (VMT), requires changes to how much we drive. While some reductions in VMT are achievable by changes in individual travel behavior, modifications to land use patterns and the transportation system are also needed to support these changes. Reducing passenger vehicle use is supported through the requirements of the California Sustainable Communities and Climate Protection Act of 2008 (SB 375). The emphasis of this bill is to promote compact, mixed-use commercial and residential infill development and the transportation infrastructure to support it to improve people’s ability to meet many of their daily needs through walking, biking and taking transit thereby reducing the per capita number of vehicle miles traveled.
SB 375 requires each of the state’s 18 metropolitan areas to reduce per capita greenhouse gas emissions from cars and light trucks. The law requires that the Association of Monterey Bay Area Governments (AMBAG) as the metropolitan planning organization for the region develop the Sustainable Communities Strategy (SCS) as part of the Metropolitan Transportation Plan (MTP). This strategy coordinates land use and transportation planning to strive to reach the greenhouse gas (GHG) reduction target established for the region by the California Air Resources Board.
In 2018, CARB set updated targets for lowering GHG in the Monterey Bay region. They call for a three percent reduction, in per capita GHG emissions from passenger vehicles by 2020 (compared with 2005); and a six percent per capita reduction by 2035 through land use and transportation planning. SB 375 streamlines the California Environmental Quality Act (CEQA) for housing and mixed-use projects that are consistent with the SCS and meet specified criteria, such as proximity to public transportation. The
California Sustainable Communities and Climate
Protection Act of 2008 (SB 375)
AMBAG Region Targets (relative to 2005)
• 6% reduction in per capita GHG from passenger vehicle use by 2035

Intr o d uc t ion | C H A P T E R 1
2 0 4 5 R E G I O N A L T R A N S P O R T A T I O N P L A N 1-9
Santa Cruz County 2045 Regional Transportation Plan has been developed to be consistent with the SCS planning effort of AMBAG.
Senate Bill 391 required the California Department of Transportation to prepare the 2050 California Transportation Plan (CTP)14 to demonstrate how GHG emissions can be reduced to 80% below 1990 levels by 2050. The CTP provides strategies for GHG reduction and recommendations on how agencies can coordinate planning efforts to achieve critical statewide goals.
Air Pollutants
Much progress has been made in the reduction of air pollutants from transportation nationwide in the past several decades.15 Since the U.S. Clean Air Act was enacted in 1970, there has been a downward trend in the six criteria air pollutants (ozone, lead, particulate matter, carbon monoxide, sulfur oxides, and nitrogen oxides). Although substantial improvements have been made, there is still public health concern over the levels of air pollutants from transportation, and many regions in California do not meet the National Ambient Air Quality Standards for these pollutants. Respiratory illness, asthma, cardiovascular disease, and lung cancer are all associated with increased levels of air pollutants. Santa Cruz County, as part of the North Central Coast Air Basin, has met the National Ambient Air Quality Standards for all criteria pollutants and thus is not subject to Federal Clean Air Act conformity requirements in this plan. Santa Cruz County received a B grade (out of A-F) for the levels of ozone in the air and a “PASS” for the annual average particle pollution in the air but an F grade for the 24 hour particle pollution for the years 2017-2019 as published by the American Lung Association in their State of the Air 2021 report.16 Particulate matter is emitted from fuel vehicles although numerous other sources exist such as dust, sea spray and fires.
Obesity
The design of our communities influences the likelihood that people will use active transport for their daily travel.17 The act of walking or biking to school, work, the store, transit or to other places that are a part of our daily routine affects our health. Multiuse trails, bicycle paths, sidewalks, safe street crossings, and availability of public transit are all examples of transportation infrastructure that promotes greater physical activity. Combined with increased housing density and mixed land use, people more often choose active forms of transportation which have the potential to lower obesity rates. The relationship between active transportation and obesity was examined in a study published in 2008 which showed that countries with the highest levels of active transportation had the lowest obesity rates (Figure 1.3).18
Promoting active travel and public transport has both health and environmental benefits due to increased physical activity, reduced air and noise pollution, and decreased greenhouse gas emissions

Intr o d uc t ion | C H A P T E R 1
1-10 S A N T A C R U Z C O U N T Y R E G I O N A L T R A N S P O R T A T I O N C O M M I S S I O N
Figure 1.3 – Obesity Prevalence and Rates of Active Transportation in Countries of Europe, North America, and Australia Source: Journal of Physical Activity and Health19
The percentage of people in the United States that are obese has almost doubled over the last three decades. In 2017-2018, 42.4% of adults and 19.3% of children and adolescents in the United States were obese compared to 22.9% adults and 10.0% children and adolescents in 1990.20 Assembly Bill 441, championed by local Assemblyman Bill Monning and signed by Governor Brown in September, 2012, acknowledges the link between transportation infrastructure and the health of California residents and required the California Transportation Commission to promote health and health equity as part of the updated 2017 Regional Transportation Plan guidelines. The 2050 California Transportation Plan also promotes active transportation through a goal of “fostering livable and healthy communities and promoting social equity.”
In Santa Cruz County, the number of adults who are overweight or obese increased from 50% in 2007 to 62% in 2019.21 In 2003, Santa Cruz County had a higher percentage of overweight children in low-income families than more than half of the counties in California.22 The Community Assessment Project identified obesity as a key issue of concern. Currently, there are a number of efforts in the county that are working to reduce both adult and childhood obesity through promoting a healthy lifestyle that includes bicycling and walking to school, work or other daily needs.
Economy
Transportation and the economy are linked in a number of ways. Improved access and travel time reliability are likely to positively affect job markets, business delivery markets, freight supply chains, and visitor activity, all allowing businesses in the region to operate more efficiently and maintain their competitiveness. But often signs of a thriving economy include greater use of the transportation system as more people are traveling to work and more goods are being delivered, often resulting in increased levels
0
10
20
30
40
50
60
70
80
0
5
10
15
20
25
30
35
40
United States Australia Canada Great Britain Norway Netherlands Latvia
Wal
k+Bi
ke+T
rans
it Tr
ips
(%)
Obe
sity
Pre
vale
nce
(%)
% Obesity % of Walk, Bike Transit Trips

Intr o d uc t ion | C H A P T E R 1
2 0 4 5 R E G I O N A L T R A N S P O R T A T I O N P L A N 1-11
of congestion and longer travel times. The COVID-19 pandemic showed dramatic reductions in traffic volumes as the stay-at-home orders were put into place and the economy went into a recession. As lockdown measures were lifted and economy began to rebound, traffic volumes increased. Transportation and the economy are also interlinked as the greater the number of transportation projects implemented, the higher the level of employment there will be for people in this area. Over the next 25 years, this plan proposes to fund $5 billion for transportation that will provide direct economic benefits, such as new construction jobs, as well as the indirect benefits of these investments, such as the demand for services and supplies to support the construction projects. And lastly, the economy can also be affected by the percentage of household income that goes towards transportation costs. The smaller the percentage of household costs needed for transportation, the more money there is available to go into the local economy. By reducing the amount spent on fuel through a reduction in vehicle miles traveled, more dollars are on hand for the local economy. The 2045 RTP strives for a more efficient, desirable, and competitive area where businesses can thrive over the long term.
Transportation Funding
Transportation funding in Santa Cruz County comes from a combination of local, regional, state and federal sources. These include sales taxes, taxes and fees collected at the gasoline pump, vehicle registration fees, and bus rider fares, as described in Chapter 5 and Appendix D.
Measure D, approved by Santa Cruz County voters in 2016, currently provides over $20 million in revenues per year from sales taxes that are dedicated for use on the transportation categories approved by voters and cannot be taken away by the state.
In 2017, the California legislature provided more stable funding for transportation for the first time in nearly 25 years with passage of Senate Bill 1. SB 1 returned the state gas tax’s purchasing power to 1994 levels and adjusted annually for inflation starting in 2020. SB1 was needed because revenues from state gasoline taxes had been declining over the last many years for several reasons.
• The state gas tax had not been indexed to keep up with inflation and lowered the fuel tax’s purchasing power over time;
• Cars and trucks overall have become more efficient and use less gasoline than before, thus per gallon gasoline taxes and fees have not matched use of the transportation system;
• State and federal transportation funding distribution formulas favor major metropolitan areas over smaller areas such as Santa Cruz County; and
• As other parts of the state and nation grow at a faster rate than Santa Cruz County, the county’s proportional share of limited transportation funds decreases.
SB1 raised the gas tax 12 cents per gallon in 2017.

Intr o d uc t ion | C H A P T E R 1
1-12 S A N T A C R U Z C O U N T Y R E G I O N A L T R A N S P O R T A T I O N C O M M I S S I O N
Similarly, the federal gas tax has not increased since 1993 and has lost 45% of its buying power.23 This has made it impossible for the federal highway trust fund to keep up with the demands placed on it to maintain and improve the current transportation system.
Equity
Transportation planning decisions can have significant equity impacts where equity refers to the fairness with which impacts (benefits and costs) are distributed. Transportation expenditures require significant public resources which can favor some people over others especially given the cost of transportation represents a major share of most household expenditures. The quality of available transportation affects people’s economic and social opportunities. Title VI of the federal Civil Rights Act of 1964, Section 11135 of the California Government Code, and Executive Order 12898 on Environmental Justice require planning agencies to be sensitive to how all residents, particularly disadvantaged communities, may be impacted by possible transportation changes identified in the RTP. The various “costs” associated with transportation include congestion delay, risk of injury, pollution, and undesirable land use impacts. The 2045 RTP has been developed to address the transportation needs of the entire community and attempts to ensure that no one community enjoys more of the benefits or bears more of the burdens of transportation investments than any other.
Public Input is a Critical Component
One of the RTC’s primary goals is to foster broad public discussion about transportation issues in the community. This serves to deepen public understanding about the complexity of transportation issues and assists the public in providing informed input to the 2045 RTP. Public input is also important to ensure that the RTP accurately reflects the transportation issues that are of highest concern to the residents of Santa Cruz County. The RTC works to engage the public in an informed dialogue and to solicit input from a broad cross-section of the population. Public input is solicited at key stages of the plan development through email, newspaper, social media, RTC website and RTC meetings. Notifications about public hearings are provided through similar means. RTC Advisory Committees are kept informed of the development of the RTP and their input is sought at project milestones. Consistent with federal requirements (23 CFR 450.316 and 23 CFR 450.322) and the 2019 Public Participation Plan for the Monterey Bay region, input from the public and various state, federal and local entities is solicited. Figure 1.4 outlines the required procedures and methods for public participation based on state and federal laws. Refer to Appendix A for details on the public participation process including the timeline when input was solicited. See Appendix B for the roles and responsibilities of the Regional Transportation Commission and its partner agencies.
Community engagement during public event for Highway 1

Intr o d uc t ion | C H A P T E R 1
2 0 4 5 R E G I O N A L T R A N S P O R T A T I O N P L A N 1-13
Figure 1.4 – Public Participation Procedures Based on State and Federal Laws Source: AMBAG and SCCRTC 2019 Public Participation Plan24
Public Participation Procedures
• Define Purpose & Identify Stakeholders
• Consultation & Coordination with other Agencies
• Consultation with Interested Parties (Policy Bodies and Advisory Committees)
• Public Notice, Public Hearings, Comment Periods (utilizes the Brown Act)
• Use of Media & Informational Materials, and Visualization Techniques
• Encourage Bilingual Participation
• Respond to Public Comments/Input
• Web Posting/Distribution of Draft and Final Documents

Intr o d uc t ion | C H A P T E R 1
1-14 S A N T A C R U Z C O U N T Y R E G I O N A L T R A N S P O R T A T I O N C O M M I S S I O N
Notes for Chapter 1
1 “California Statewide Local Streets and Roads Needs Assessment 2020,” NCE, August 2021, http://www.savecaliforniastreets.org/read-the-report/
2 California Transportation Asset Management Plan, January 2018, Caltrans, https://dot.ca.gov/-/media/dot-media/programs/asset-management/documents/20190726-am-finalcaliforniatamp-a11y.pdf
3 California Department of Transportation, Safety Performance Management, California Target Setting, accessed September 2021, https://dot.ca.gov/-/media/dot-media/programs/federal-liaison/documents/2021-spmt-a11y.pdf
4 “2018 OTS Rankings,” California Office of Traffic Safety, accessed September 2021, http://www.ots.ca.gov/media_and_research/crash-rankings-results/.
5 “American Community Survey 5 Year-Summary,” United States Census Bureau, Means of Transportation to Work for Santa Cruz County and California, accessed September 2021, http://factfinder2.census.gov.
6 “TIMS – Transportation Injury Mapping System,” Safe Transportation Research & Education Center, University of California, Berkeley, accessed September 2021, http://tims.berkeley.edu.
7 David Schrank, Luke Albert, Bill Eisele, and Tim Lomax “Texas A&M Transportation Institute’s 2021 Urban Mobility Report,” Texas A&M Transportation Institute (June 2021), https://static.tti.tamu.edu/tti.tamu.edu/documents/mobility-report--2021.pdf
8 “Traffic Counts,” California Department of Transportation, Traffic Data Branch, accessed August 2017, http://traffic-counts.dot.ca.gov.
9 California Global Warming Solutions Act of 2006, AB 32 (2006), http://www.leginfo.ca.gov/pub/05-06/bill/asm/ab_0001-0050/ab_32_bill_20060927_chaptered.html.
10 “Sources of Greenhouse Gas Emissions: Transportation Sector Emissions,” U.S. Environmental Protection Agency, accessed September 2017, https://www.epa.gov/ghgemissions/sources-greenhouse-gas-emissions.
11 County of Santa Cruz, Planning Department, “County of Santa Cruz – Climate Action Strategy,” approved by County of Santa Cruz Board of Supervisors on February 26, 2013, http://www.sccoplanning.com/PlanningHome/LongRangePlanning/ClimateActionStrategy.aspx.
12 Senate Bill 32 (2016), California Legislative Information, accessed September 2017, https://leginfo.legislature.ca.gov/faces/billNavClient.xhtml?bill_id=201520160SB32
13 California Executive Order N-79-20, accessed September 27, 2021, https://www.gov.ca.gov/wp-content/uploads/2020/09/9.23.20-EO-N-79-20-Climate.pdf
14 CTP 2050 California Transportation Plan, Caltrans, February 2021, accessed September 2021, https://dot.ca.gov/-/media/dot-media/programs/transportation-planning/documents/ctp-2050-v3-a11y.pdf
15 “National Emissions Inventory (NEI) Air Pollutant Emissions Trends Data,” U.S. Environmental Protection Agency, accessed September 2021, https://gispub.epa.gov/neireport/2017/.
https://dot.ca.gov/-/media/dot-media/programs/transportation-planning/documents/ctp-2050-v3-a11y.pdf

Intr o d uc t ion | C H A P T E R 1
2 0 4 5 R E G I O N A L T R A N S P O R T A T I O N P L A N 1-15
16 “State of the Air 2021,” American Lung Association, accessed September 2021, https://www.lung.org/getmedia/17c6cb6c-8a38-42a7-a3b0-6744011da370/sota-2021.pdf
17 Barbara A. McCann and Reid Ewing, “Measuring the Health Effects of Sprawl: A National Analysis of Physical Activity, Obesity and Chronic Disease,” Smart Growth America, Surface Transportation Policy Project (2003).
18 David R. Bassett, Jr., John Pucher, Ralph Buehler, Dixie L. Thompson, and Scott E. Crouter, “Walking, Cycling, and Obesity Rates in Europe, North America, and Australia,” Journal of Physical Activity and Health (2008): 795-814.
19 David R. Bassett, Jr., John Pucher, Ralph Buehler, Dixie L. Thompson, and Scott E. Crouter, “Walking, Cycling, and Obesity Rates in Europe, North America, and Australia,” Journal of Physical Activity and Health (2008): 795-814.
20 Cheryl D. Fryar, Margaret D. Carroll, and Joseph Afful, “Prevalence of Overweight, Obesity, and Severe Obesity Among Adults Aged 20 and Over: United States, Trends 1960-1962 Through 2017-2018,” Centers for Disease Control and Prevention, National Center for Health Statistics, Health E-Stats (December 2020), https://www.cdc.gov/nchs/data/hestat/obesity-adult-17-18/obesity-adult.htm https://www.cdc.gov/nchs/data/hestat/obesity-child-17-18/obesity-child.htm
21 “Santa Cruz County Community Assessment Project, Year 23, 2019,” Applied Survey Research (2019), http://www.appliedsurveyresearch.org/scccap/
22 “Comprehensive Report 2006, Santa Cruz County Community Assessment Project, Year 12,” Applied Survey Research (2006), http://www.appliedsurveyresearch.org/storage/database/quality-of-life/santacruzcap/cap12_2006/CAP12_Full_Report.pdf
23 “CPI Inflation Calculator,” U.S. Bureau of Labor Statistics, accessed September 2021, https://www.bls.gov/data/inflation_calculator.htm
24 Association for Monterey Bay Area Governments, Council of San Benito Governments, Santa Cruz County Regional Transportation Commission, Transportation Agency of Monterey County, “The 2019 Public Participation Plan,” (October 2019), https://sccrtc.org/wp-content/uploads/2019/10/Final_2019_PPP_with_Appendices.pdf

2 0 4 5 R E G I O N A L T R A N S P O R T A T I O N P L A N 2-1
CHAPTER
2 Transportation Network
Setting
Santa Cruz County is one of 58 counties in the state of California, and one of the 15 counties bordering the Pacific coastline. Santa Cruz County is on the northern half of the Monterey Bay and is 65 miles south of San Francisco, 35 miles north of Monterey, and 35 miles southwest of the Silicon Valley. The county’s location is both a spectacular natural phenomenon and a limiting factor. The meeting of the redwoods and the sea is a powerful attraction which significantly affects the demand for housing, transportation, and other infrastructure. The population of Santa Cruz County in 2020 was 270,373 according to the California Department of Finance estimates, and the total area of the county is approximately 607 square miles with a land area of 445 square miles.
Transportation System
Santa Cruz County’s transportation network includes facilities for private automobiles, public transit, bicycles, pedestrians, specialized transportation for seniors and people with physical or mental disabilities, transport of goods and services, and emergency vehicles. Santa Cruz County’s main transportation corridors and facilities (Figure 2.1) are limited by the area’s physical barriers of mountains and the sea. Population settlement patterns are primarily centered along highways, major arterials, and the Santa Cruz Branch Rail Line (SCBRL). There are 1,064 total miles of publicly maintained roadway in the county. In the urban areas of the county, arterial roads, including major state highways, make up 14 percent of roadway miles but carry over 72 percent of the vehicle miles traveled (VMT).1
Santa Cruz Metropolitan Transit District (METRO) buses serve approximately 400 miles of roads throughout the county and cover the majority of roads designated as arterial and collector routes.2 There are 218 miles of bicycle lanes and bicycle paths which generally follow primary transportation corridors.
Aerial view of the City of Santa Cruz with the Santa CruzMountains in the distance.

C H AP T E R 2 | Tr a nsp or t a tion N e tw or k
2-2 S A N T A C R U Z C O U N T Y R E G I O N A L T R A N S P O R T A T I O N C O M M I S S I O N
Sidewalks and other pedestrian facilities are also an important part of the transportation network.
Figure 2.1 – Santa Cruz County Primary Transportation Network Source: Santa Cruz County Regional Transportation Commission
State Highways
There are seven state highways, or State Routes (SR), in Santa Cruz County – SR 1, 9, 17, 35, 129, 152 and 236 (Figure 2.1). Highways 1 and 17 have segments that are fully grade separated freeways. Caltrans manages the state highway system, including implementation of highway maintenance and safety projects. Because the cost of ongoing highway maintenance and operations, including safety projects, exceed the amount of funds available to Caltrans through the State Highway Operation and Protection Program (SHOPP), any additional highway projects, such as adding new travel lanes, new auxiliary lanes, or operational improvements, must be funded from other sources. This is challenging for our county because highway projects can be relatively expensive, especially compared to the region’s share of funds. Additionally, truck and automobile traffic volumes are lower than in many areas of the state or nation, which can make it difficult to compete for state and federal funds. Santa Cruz County’s local Measure D sales tax measure, passed in 2016, allocates a portion of the funds to three sets of auxiliary lanes on Highway 1 between Soquel Ave and State Park Drive as discussed below. Measure D funds provide a much-needed local source of funds that could more readily leverage additional funds from

Tr a nsp or ta tio n Ne tw o r k | CH A P T E R 2
2 0 4 5 R E G I O N A L T R A N S P O R T A T I O N P L A N 2-3
state and federal sources. Along all highways except for SR 236, the RTC oversees a system of 75 call boxes that connect the user to an operator who will contact services needed (e.g., a tow service, or a relative/friend to assist you). Operation and maintenance of the Call Box Program is funded from a $1 vehicle registration fee collected by the Department of Motor Vehicles. The RTC also manages the Freeway Service Patrol Program (FSP) which operates roving tow trucks on both Highways 1 and 17 primarily during peak commute or visitor periods to provide quick fixes or tows for stranded vehicles. Descriptions of each of the Santa Cruz County highways are provided below. For more information about the State Highway System within Santa Cruz County, see the Caltrans Transportation Concept Reports that can be accessed on the Caltrans District 5 website.
Highway 1 Corridor
Highway 1 is the key thoroughfare running through the most heavily populated areas of the county. Between Watsonville and the City of Santa Cruz, it is a separated freeway with at least two lanes in each direction, with a few auxiliary lanes that connect on-ramps with the next off-ramps. Highway 1 has the highest average daily traffic volumes (number of vehicles) of all local streets and highways, connects the region with other coastal areas to the north and south, and is roughly parallel to Highway 101 for the middle stretch of the state. Highway 1 is also the county’s premier access route to the coast. The rural sections of State Route Highway 1 in the coastal zone are scenic two-lane roads pursuant to California Coastal Act Section 30254. Over the past two decades a number of major capital projects have taken place on Highway 1 in the urban areas, in addition to operational projects to improve access and traffic flow.
Highway 1 Corridor Improvement Program
For the past two decades, the RTC, Caltrans, and the Federal Highway Administration (FWHA) have collaborated to identify improvements and funding options to reduce congestion, improve traffic flow, and increase carrying capacity and throughput along the corridor between Watsonville and the City of Santa Cruz. To that end, in 2003, preparation began for a combined Tier I and Tier II Environmental Impact Report/Environmental Assessment (EIR/EA) for the corridor, which was certified in 2019. Additionally, in 2016, Measure D passed providing a dedicated funding source for transportation improvements in Santa Cruz County, including improvements to Highway 1.
Highway 1 Tier I and Tier II Environmental Impact Report/Environmental Assessment (EIR/EA). The RTC, Caltrans, and FHWA prepared the Highway 1 EIR/EA which was divided into two components, Tier I and Tier II, for purposes of environmental analysis. The document was certified in 2019 and can be accessed on the RTC website.
Highway 1/17 Interchange. Photo Credit: Tim Cattera

C H AP T E R 2 | Tr a nsp or t a tion N e tw or k
2-4 S A N T A C R U Z C O U N T Y R E G I O N A L T R A N S P O R T A T I O N C O M M I S S I O N
Tier I is a long term, program level analysis for the future of the Highway 1 corridor between Santa Cruz and Aptos. The Tier I concept for the corridor could be built over time through a series of smaller incremental projects (referred to as Tier II projects). The preferred alternative selected was the High Occupancy Vehicle (HOV) Lane Project which adds a bus and carpool lane in both the north and southbound direction for the nine-mile corridor including auxiliary lanes (connecting on-ramps with the next off-ramps) between most interchanges and metering lights on the on-ramps.
Tier II is a project level analysis for auxiliary lanes between 41st Avenue and Soquel Drive and a pedestrian/bicycle overcrossing of Highway 1 at Chanticleer Avenue. Smaller incremental projects within the Tier I corridor will also undergo a Tier II analysis as projects move forward based on available funding. Each of the Tier II projects would have independent utility and benefit to the public and Highway 1 operations. The preferred alternative selected for the Tier II project was the Build Alternative.
Measure D. Existing federal, state, or local funding does not cover the cost to operate, maintain, and improve the existing transportation system. Measure D, a ½-cent, 30-year sales tax measure passed in November 2016 by over 2/3 of Santa Cruz County voters. Measure D supplements traditional transportation funding sources to improve the quality of transportation infrastructure and services in the county. The Measure D Expenditure Plan allocates 25 percent of revenue (approximately $125 million) over the 30-year life of the measure to corridor projects along Highways 1 and 17. The Expenditure Plan identifies the following projects on Highway 1 as means to improve regional traffic flow and safety:
• Adding auxiliary lanes between:
o Soquel Drive and 41st Avenue
o Bay Avenue/Porter Street and Park Avenue
o Park Avenue and State Park Drive
• Constructing 2 new bicycle and pedestrian bridges over Highway 1:
o In Live Oak at Chanticleer Avenue
o In Seacliff/Aptos at Mar Vista Drive
• Ongoing safety and operational services including Freeway Service Patrol, Safe on 17, andCruz511/ GO Santa Cruz County.
Current Highway 1 Projects
Highway 1 41st Avenue and Soquel Avenue/Drive Auxiliary Lanes, Bus-on-Shoulder, and Chanticleer Bicycle/Pedestrian Overcrossing Project. The project will construct northbound and southbound auxiliary lanes and bus-on-shoulder improvements between the 41st Avenue and Soquel Avenue/Drive interchanges, along with a new bicycle and pedestrian overcrossing at Chanticleer Avenue. Historically, this section of Highway 1 has been the busiest in the county, serving over 100,000 vehicles as day, providing access to the primary regional commercial/retail activity centers on 41st Avenue and regional medical facilities located on Soquel Drive.
The auxiliary lanes will connect the on-ramps with the nest off-ramp, thereby extending the weaving and merging distance between the ramps, improving traffic operations, and reducing cut-through traffic diverting to local streets and neighborhoods. And the bus-on-shoulder improvements adds infrastructure

Tr a nsp or ta tio n Ne tw o r k | CH A P T E R 2
2 0 4 5 R E G I O N A L T R A N S P O R T A T I O N P L A N 2-5
for buses to travel in the auxiliary lanes between the interchanges and on the outside shoulder through interchanges.
The bicycle/pedestrian overcrossing at Chanticleer Avenue provides an alternative route for bicyclists and pedestrians currently using the Soquel or 41st interchanges to cross over Highway 1. The overcrossing will be lighted, 12- to 14-feet wide, and will incorporate aesthetic treatments consistent with the visual character of the corridor and the adjacent community.
The RTC is leading the delivery of this project. Measure D-Highway Corridor funds and other RTC discretionary funds were used to complete the work necessary to ready the project for construction, and as a match for Senate Bill (SB) 1, the Road Repair and Accountability Act of 2017, construction grants. This project obtained environmental clearance as part of the Highway 1 Tier I/Tier II EIR/EA and received funds from Cycle 2 of the SB1 Solutions for Congested Corridors Program competitive grant.
Construction for this project is expected to begin in late 2021 and be completed by 2024.
Highway 1 Bay Avenue/Porter Street to State Park Drive Auxiliary Lanes, Bus-on-Shoulder, and Mar Vista Bicycle/Pedestrian Overcrossing Project. The project will construct northbound and southbound auxiliary lanes and bus-on-shoulder improvements between the Bay Avenue/Porter Street and State Park Drive interchanges and replace the existing Capitola Avenue local roadway overcrossing. This section of Highway 1 is one of the busiest in the county, providing access to the City of Capitola, Soquel and Aptos villages, and Cabrillo College.
The auxiliary lanes will connect the on-ramps with the next off-ramp, thereby extending the weaving and merging distance between the ramps, improving traffic operations, and reducing cut-through traffic diverting to local streets and neighborhoods. And the bus-on-shoulder improvements adds infrastructure for buses to travel in the auxiliary lanes between the interchanges and on the outside shoulder through interchanges.
The new Capitola Avenue overcrossing will include enhanced active transportation facilities to improve connectivity for bicyclists and pedestrians between Soquel Drive to the north and the future Coastal Rail Trail to the south. The overcrossing, sound walls, and retaining walls will incorporate aesthetic treatments consistent with the visual character of the corridor and the adjacent community.
The project also includes a new bicycle and pedestrian overcrossing at Mar Vista Drive to provide a safe link between schools, the beach, residential neighborhoods, and retail centers on each side of Highway 1.
The RTC is leading the delivery of this project. Measure D-Highway Corridor funds and other RTC discretionary funds are being used to complete the work necessary to ready the project for construction. RTC was successful in securing Cycle 2 SB1 Solutions for Contested Corridors and Local Partnership Program competitive funds in 2020, which fully funds construction of this project.
Environmental review for this project was completed in 2021. Final design is underway and is expected to be completed in 2022. The project is expected to be construction-ready by the end of 2022.
Highway 1 State Park to Freedom Boulevard Auxiliary Lanes, Bus-On-Shoulder, and Coastal Rail Trail Segment 12 Project. The project will construct northbound and southbound auxiliary lanes and bus-on-shoulder improvements between the State Park Drive and Freedom Boulevard interchanges, replace the two existing railroad bridges between the State Park Drive and Rio del Mar interchanges, and widen the

C H AP T E R 2 | Tr a nsp or t a tion N e tw or k
2-6 S A N T A C R U Z C O U N T Y R E G I O N A L T R A N S P O R T A T I O N C O M M I S S I O N
Aptos Creek bridge. This section of Highway 1 provides access to Aptos Village, Rio del Mar, Aptos High School, and Aptos Hills/ Corralitos.
The auxiliary lanes will connect the on-ramps with the next off-ramp, thereby extending the weaving and merging distance between the ramps, improving traffic operations, and reducing cut-through traffic diverting to local streets and neighborhoods. And the bus-on-shoulder improvements adds infrastructure for buses to travel in the auxiliary lanes between the interchanges and on the outside shoulder through interchanges.
The existing railroad bridges will be replaced with longer span bridges to accommodate the addition of auxiliary lanes on Highway 1. The Highway 1 bridge over Aptos Creek will be widened or replaced as part of the project. The new bridges, sound walls, and retaining walls will incorporate aesthetic treatments consistent with the visual character of the corridor and the adjacent community.
This project also includes construction of Segment 12 of the Coastal Rail Trail, a bicycle and pedestrian trail along an approximately 1.25-mile segment of the Santa Cruz Branch Rail Line (SCBRL) right-of-way from State Park Drive to Rio Del Mar Boulevard. The SCBRL corridor is an active freight line and is owned by the RTC.
The RTC is leading the delivery of this project. Measure D-Highway Corridor funds and other RTC discretionary funds are being used to perform the work necessary to ready the project for construction, and as a match for future SB1 and federal construction grants.
Environmental clearance for this project is anticipated to occur in 2022, which would make this project eligible to compete for Cycle 3 of the SB1 Solutions to Congested Corridors Program, Local Partnership Program, and Active Transportation Program competitive funds. This project is expected to begin the design phase in 2022 and to be construction-ready in 2025, pending availability of funds for construction.
Past Highway 1 Projects
The Highway 1 Mission Street project, finished in 2004 at a cost of $10.5 million, provided several left turn lanes and two continuous lanes for the length of this main street-type stretch of the corridor through the west side of the City of Santa Cruz. This project helped to alleviate some of the traffic congestion along Mission Street Highway 1 which is exacerbated by its proximity to the University of California, Santa Cruz and the lack of alternative parallel routes. Additions such as lighting, pedestrian crossings, and undergrounding of utilities cost an additional $3.6 million. This project included extensive community input.
The Highway 1/17 Interchange Merge Lanes project was a major project along the Highway 1 corridor. This project, completed in 2008 at a cost of $51 million, added merging lanes and sound walls between the junction of Highway 1/17 and the Morrissey Boulevard interchange. Auxiliary lanes in each direction provide longer and safer merging areas; installation of sound walls improves the quality of life for adjacent neighborhoods; and the reconstructed bridges provide improvements to the adjacent riparian corridors. The landscaping portion of the project, completed in 2010, included planting native trees and shrubs, and vines to cover the sound walls, and installation of an irrigation system to help establish the plants. Northbound Highway 1 coming off the fishhook onto Highway 17 was widened in 2016 to accommodate another merge lane for improvements to safety.

Tr a nsp or ta tio n Ne tw o r k | CH A P T E R 2
2 0 4 5 R E G I O N A L T R A N S P O R T A T I O N P L A N 2-7
In 2012 and 2013, the RTC managed the construction of the Highway 1 Soquel/Morrissey Auxiliary Lanes project which adds approximately one mile of auxiliary lanes, in both the northbound and southbound directions, between Soquel Avenue and Morrissey Boulevard. The La Fonda Avenue Bridge was rebuilt to make it wide enough for the new auxiliary lanes (and potential future High Occupancy Vehicle (HOV) lanes) and to improve sidewalks and bicycle lanes across the bridge. The purpose of the project was to improve traffic flow by extending merging areas to shorten the bottleneck and reduce vehicle delay on the corridor.
Funding for this project was awarded by the California Transportation Commission via a competitive process using Proposition 1B Corridor Mobility Improvement Account (CMIA) bond funds (approved by state voters in 2006) and the region’s share of State Transportation Improvement Program (STIP) funds.
Highway 17 Corridor
Highway 17 traverses the Santa Cruz Mountains with 2 lanes in each direction, connecting the county with Silicon Valley and the rest of the San Francisco Bay Area. Because Highway 17 straddles both Santa Cruz and Santa Clara Counties, duties such as maintenance, enforcement, transit, safety improvements, and public education are shared by entities on both sides of the summit of the Santa Cruz Mountains. Due to the steep terrain, curves, and high numbers of traffic incidents, a Safe on 17 Task Force was formed in 1998. Components of the Safe on 17 program include additional enforcement by California Highway Patrol to help enforce posted speed limits, construction projects by Caltrans to improve operational efficiency, and a public information and education campaign. Additionally, call boxes and changeable message signs were installed, and the Freeway Service Patrol (FSP) service was initiated.
In 2016, an Access Management Plan3 was conducted for State Route 17 by Caltrans in partnership with Santa Cruz County and RTC. The plan identified issues and imbalances on the SR 17 corridor between Granite Creek Road in Scotts Valley and Summit Road at the Santa Cruz/Santa Clara County line through stakeholder engagement. Short- and long-term access management strategies were identified to address access, mobility and safety needs to help preserve Highway 17 as an efficient interregional corridor.
Caltrans, RTC, Land Trust of Santa Cruz County, and resource agencies have partnered to construct a wildlife undercrossing on Highway 17 near Laurel Road in Santa Cruz County, with construction scheduled to begin in early 2022. Caltrans will construct a wildlife tunnel under Highway 17 near Laurel Curve to allow safe passage for wildlife. The wildlife corridor connects two core habitat areas that the Land Trust has protected from development. Measure D will provide $5 million for construction of this project.
Caltrans is currently developing a State Route 17 Resiliency and Adaptation Plan, which will explore the following topics for SR 17 in Santa Cruz and Santa Clara Counties: Climate Change Vulnerability and Resiliency, Emergency Management and Response, Equity and Socioeconomic Characteristics, Wildlife Habitat Connectivity, and Transportation and Land Use. The plan seeks to engage corridor stakeholders and the public to establish a collective corridor vision and recommend adaptation strategies that strengthen the resiliency of the SR 17 Corridor. The SR 17 Resiliency and Adaptation Plan is scheduled for kickoff in Summer 2022.
Highway 9

C H AP T E R 2 | Tr a nsp or t a tion N e tw or k
2-8 S A N T A C R U Z C O U N T Y R E G I O N A L T R A N S P O R T A T I O N C O M M I S S I O N
Highway 9 is a mountainous road connecting Santa Cruz to towns in the San Lorenzo Valley as well as providing another route over the Santa Cruz Mountains to Saratoga and Los Gatos in Santa Clara County. Through San Lorenzo Valley, the highway acts as a main street for the communities of Felton, Ben Lomond, and Boulder Creek. A Complete Streets Plan4 was prepared by RTC in partnership with Caltrans and County of Santa Cruz for Highway 9 and connecting county roads through San Lorenzo Valley (SLV) that identifies and prioritizes implementation of the most critical and cost-effective transportation projects. This plan focuses on safety for pedestrians, bicyclists, and motorists; access to schools, businesses, and bus stops; traffic operations, pavement conditions, drainage, and other needs in this travel corridor. Projects have been prioritized that can be implemented in the short and mid-term to address transportation challenges on the corridor. Measure D, which was approved by voters in November 2016, includes $10 million specifically earmarked for high priority transportation projects along the Highway 9 corridor. Plans for reducing congestion through the Highway 1 and Highway 9 intersection, just south of the Mission Street segment of Highway 1, are currently under development by the City of Santa Cruz. The project has received all necessary approvals and funding to construct the project starting in mid-2021 and continuing into early 2022.5
Highways 236 and 35
Highway 236 is a total of 18 miles and makes a loop connecting Highway 9 in Boulder Creek to Big Basin Redwoods State Park. A significant portion of the highway is one lane in each direction and passes through densely forested areas. In August 2020, the CZU Lightning Complex Fire burned over 86,000 acres within Santa Cruz and San Mateo Counties, causing significant damage to critical roadway facilities along segments of Highway 1, 9, and partial closure of Highway 236.
Highway 35, often referred to as “Skyline Boulevard” is a two-lane road running mostly along the ridge of the Santa Cruz Mountains weaving between Santa Cruz County and Santa Clara County. Because of its scenic views and winding roadway, Highway 35 sees substantial recreational motoring and bicycling use. The winter storms of 2016/2017 washed out a section of Highway 35 near Highway 9 that made the highway impassable.
Highway 129 and 152
Highways 129 and 152, doubling as main streets through the City of Watsonville, connect south Santa Cruz County with neighboring counties, Highway 101 and the Central Valley to the east. On the western edge, Highway 152 begins at Highway 1 and is named Main Street through the City of Watsonville, then heads up and over the Hecker Pass and county line to Gilroy in Santa Clara County and beyond. The City of Watsonville is coordinating with Caltrans options to provide context-sensitive design to enhance “walkability” and the main street character of the roadway, while maintaining operational efficiencies in the corridor. Highway 129 traverses the southern portion of the City of Watsonville and connects with Monterey County near Aromas, providing an important link to Highway 101 near San Juan Bautista. Highway 129 is heavily used for goods movement, particularly for agricultural products as this is the link from Santa Cruz County to Highway 101, a major goods-movement corridor. Caltrans has made numerous improvements to Highway 129 in recent years, including curve realignments, turnouts, additional signage, improved striping, and an increased number of roadway reflectors. Local City and County Street Network

Tr a nsp or ta tio n Ne tw o r k | CH A P T E R 2
2 0 4 5 R E G I O N A L T R A N S P O R T A T I O N P L A N 2-9
Local streets and roads -- including nearly 900 miles of roads, bridges, curbs and gutters, sidewalks, access ramps, bicycle lanes, stop signs and traffic signals -- are critical components of the region’s transportation system. The majority of travel, whether by car, bicycle, bus or foot, is done on local streets and roads. From the moment we open our front door and head towards work, school, the store, medical facilities or other destinations, we are dependent upon our local streets and roads. Increasingly, communities are calling for their local streets and roads to be designed as ‘Complete Streets’ that focus on the movement of people, including non-drivers of all ages and abilities, and the variety of travel modes they may use.
The cities of Capitola, Santa Cruz, Scotts Valley and Watsonville and the County of Santa Cruz are responsible for maintaining and improving this multimodal network in Santa Cruz County. However, with such a large network and limited revenues, local jurisdictions are challenged to maintain, reduce congestion through, and add pedestrian and bicycle facilities to the multimodal local street and road network. Each of the five local jurisdiction public works departments rates the condition of their roadways using a Pavement Condition Index (PCI) to better understand the condition of their jurisdiction’s road system and prioritize improvement projects. A PCI of 100 is in premium condition, and the optimum score is 70 or greater. The cost to rebuild roadways with lower PCI scores increases exponentially. Figure 2.2 shows the average PCI for each jurisdiction.
Figure 2.2 – Average Pavement Condition for Local Jurisdictions Source: Public Works Departments of Santa Cruz County, City of Santa Cruz, Watsonville, Scotts Valley, Capitola. Data collected from 2020.
Transit
Public transit is operated locally by the Santa Cruz Metropolitan Transit District (METRO). METRO provides four types of services: local fixed-route bus service, Highway 17 Express Bus service, ParaCruz ADA-mandated paratransit, and Cruz On-Demand microservices (Figure 2.3). METRO operates over 90 buses (including 4 all electric buses) on 24 fixed routes on approximately 400 miles of roads. Higher
6067
5965
48
0
20
40
60
80
100
Capitola Santa Cruz Scotts Valley Watsonville Unincorporated
Pave
men
t Con
ditio
n In
dex
Jurisdiction
Faile
d |
Poo
r |
At R
isk
| G
ood Optimum = 70 PCI+

C H AP T E R 2 | Tr a nsp or t a tion N e tw or k
2-10 S A N T A C R U Z C O U N T Y R E G I O N A L T R A N S P O R T A T I O N C O M M I S S I O N
frequency service routes (intersection of two or more major bus routes with a frequency of service interval of about 15 minutes during weekday morning and afternoon peak commute periods) are highlighted in Figure 2.3. METRO operates four transit centers in Santa Cruz County: Cavallaro Transit Center in Scotts Valley, Santa Cruz METRO Center in Downtown Santa Cruz, Capitola Mall Transit Center, and Watsonville Transit Center in Downtown Watsonville (Figure 2.1.). Funding for METRO is provided through ticket fare revenues, two local sales taxes (including a dedicated ½ cent sales tax and funds from Measure D), Transportation Development Act (TDA) funds, State Transit Assistance (STA) funds and various other state and federal dollars. This funding mix for local public transit is similar to that of other public transit systems across the state and nation.
Figure 2.3 – Transit Service Provided by Santa Cruz Metropolitan Transit District (METRO) Source: Santa Cruz County Regional Transportation Commission and Santa Cruz Metropolitan Transit District, 2021
Santa Cruz County is also connected to Monterey County by bus service provided by Monterey-Salinas Transit (MST) and to other parts of the state via the Highway 17 Express. The Highway 17 Express Bus – which is operated by METRO and overseen by a partnership of METRO, Amtrak, the Capitol Corridor, the San Joaquin Joint Powers Authority, and the Santa Clara Valley Transportation Authority (VTA) – provides a connection to Diridon Station in San Jose which serves the southern part of the San Francisco

Tr a nsp or ta tio n Ne tw o r k | CH A P T E R 2
2 0 4 5 R E G I O N A L T R A N S P O R T A T I O N P L A N 2-11
Bay Area and other regional passenger train services (see rail section for details) Single-ticket direct connections to Amtrak and Greyhound are available.
Santa Cruz METRO offers a selection of reloadable plastic CRUZ Cards, and disposable paper METRO Passes for use on all fixed-routes. Tickets can also be purchased in advance using METRO’s mobile ticketing app, the METRO Splash Pass. METRO’s Customer Service Department provides trip planning for the fixed route system, in addition to Cruz511 and Google Transit.
The COVID-19 pandemic and related restrictions led to major transit demand decline and impacted transit service and METRO facilities. In an effort to respond to severe decrease in ridership during the pandemic, METRO operated fewer buses with less frequency of service and later start times/ earlier end times. In response, METRO implemented a number of creative initiatives to bring back riders. In 2021, METRO established a temporary fare reduction program county-wide to provide financial relief to those who rely on METRO’s services and assist in the community’s recovery. METRO also began a new pilot microtransit service, Cruz On-Demand, throughout Santa Cruz County that lets riders book trips on-demand. The Cruz On-Demand service area extends 3/4s of a mile from any of METRO’s fixed bus routes, excluding Highway 17 and the UCSC campus. Cruz On-Demand is intended to supplement METRO’s fixed-route service in areas where service is less frequent and demand is not as great. METRO also introduced the new Watsonville Circulator Route, connecting the downtown transit center with primary retail and medical destinations in Watsonville, and serving some of the lowest income communities in METRO’s service area. METRO’s recovery from the service reductions implemented due to COVID-19 has been slow and steady with service restored service to pre-COVID levels on all routes with the exception of weekday Highway 17 and 91X service, and some school term trips. More information about this topic is discussed in Chapter 3.
Specialized Transportation
Many seniors and people living with disabilities need specialized transportation services to get around Santa Cruz County. This might include lifts or ramps for wheelchairs in vehicles, drivers with special training, or vehicles that kneel or are equipped with other accessible features. The RTC produces a Guide for Specialized Transportation Services that is regularly updated. Included in this guide is information about enrollment eligibility, schedule, service area, and fee information for over 30 transportation providers or agencies throughout Santa Cruz County.
The Americans with Disabilities Act (ADA) mandates that complementary paratransit service be provided for people unable to use the fixed route transit due to physical, cognitive and/or psychiatric disabilities. In our region, the ADA-mandated service is ParaCruz and is provided by Santa Cruz Metropolitan Transit District (METRO). METRO ParaCruz provides service to any destination within Santa Cruz County that is within three-quarters (¾) of a mile of an operating bus route. This service is a shared ride service arranged in advance. The one-way fare for METRO ParaCruz service in 2021 is $4.00 or $6.00, depending on the origin and destination of the paratransit trip.6

C H AP T E R 2 | Tr a nsp or t a tion N e tw or k
2-12 S A N T A C R U Z C O U N T Y R E G I O N A L T R A N S P O R T A T I O N C O M M I S S I O N
Another main provider is Community Bridges Lift Line. This non-profit provides or contracts a range of services including local and out-of-county medical transportation, senior center/meal site delivery, bed-to-bed medical, veterans medical transportation and taxi scrip. As the area’s designated Consolidated Transportation Services Agency, Community Bridges has a responsibility to work toward consolidating and coordinating specialized transportation services to avoid inefficient and duplicative social service transportation programs. Many of the rides provided by Lift Line are to individuals who are unable to afford ParaCruz or because their origin and/or
destination are outside the ParaCruz service area.
Other Providers
Although Metro ParaCruz and Lift Line are the two primary providers of specialized transportation services in the county, other service providers also exist. Non-profit or private for-profit entities, such as the Volunteer Center, Veterans Services, local taxi companies, and First Transit operate specialized transportation services. Each particular service program fills a unique niche for, or offers discounted services to, seniors and people with disabilities.
Identifying Needs
To gain a better understanding about potential deficiencies, the RTC conducts a regular process to solicit input about unmet specialized transportation needs in the community. Social service entities, non-profits, local transportation providers, community organizations and human service advocates, as well as members of the public identify gaps and needs in human service transportation. Input from all these and other sources is incorporated into the development of the RTC Unmet Needs List and federally mandated Monterey Bay Region Coordinated Public Transit-Human Services Transportation Plan. The most recent version of the Coordinated Plan was finalized in 2013. The plan incorporates these identified needs and presents innovative implementation strategies for closing the gaps and improving the management of mobility services. These strategies help prioritize available funding. The Coordinated Public Transit - Human Services Transportation Plan, which is an element of the Metropolitan Transportation Plan prepared by AMBAG, is available online at www.ambag.org.
Santa Cruz Branch Rail Line
On October 12, 2012, after more than ten years of extensive due diligence and negotiations, the RTC became the owner of the Santa Cruz Branch Rail Line (SCBRL), thereby placing this cross-county transportation corridor into public hands. The RTC purchased the rail corridor on behalf of the community to preserve the corridor for existing and future transportation uses, including freight rail,
Photo Credit: Community Bridges Lift Line

Tr a nsp or ta tio n Ne tw o r k | CH A P T E R 2
2 0 4 5 R E G I O N A L T R A N S P O R T A T I O N P L A N 2-13
passenger rail service/transit, and bicycle and pedestrian facilities. Since then, the RTC has ensured continuation of freight service, implemented recreational rail service, began construction of a bicycle and pedestrian path and completed studies on potential uses of the corridor.
This 135-year-old transportation corridor is a federally regulated freight railroad that parallels Highway 1, extending almost 32 miles from just south of the county line near Watsonville, to Davenport in north Santa Cruz County (Figure 2.4). The right-of-way is generally 50 to 60 feet wide with over 100 culverts and grade crossings, and 37 bridges and trestles, including major crossings of the Pajaro River, Highway 1, Soquel Creek, the Santa Cruz Yacht Harbor, and the San Lorenzo River. Adjacent land uses include residential, commercial, industrial, agricultural, and park land/open space.
The corridor links major activity centers as it traverses downtown Watsonville, Aptos Village, Capitola Village, and the Santa Cruz Beach area near downtown Santa Cruz. Also adjacent to the corridor are many parks and recreational facilities including Manresa State Beach, Seacliff State Beach, New Brighton State Park, Simpkins Swim Center, Santa Cruz Yacht Harbor, Natural Bridges State Park and Wilder Ranch State Park. The rail corridor enhances public access to the Monterey Bay National Marine Sanctuary at several key locations consistent with the CA Coastal Act objectives.
Preservation of the Santa Cruz Branch Rail Line
Measure D provides 8 percent of revenue, approximately $1.6 million a year, for rail infrastructure preservation and analyses to determine the future potential use of the corridor to better serve Santa Cruz County residents and visitors. In 2015, the RTC completed a rail transit feasibility study which analyzed a range of public transportation service scenarios on the SCBRL and how well each scenario advances community goals and objectives. In 2019, the RTC accepted the Unified Corridor Investment Study (UCS) which identified priority transportation investments on Highway 1, Soquel Avenue/Drive, Freedom Boulevard, and the SCBRL that maximize mobility and environmental benefits. The UCS also directed RTC staff to collaborate with the Santa Cruz Metropolitan Transit District (METRO) to develop a scope of work for additional analysis of high-capacity public transit alternatives on the SCBRL.
The RTC, in partnership with METRO and with funding from Measure D and a Caltrans transportation planning grant, completed the Transit Corridor Alternatives Analysis and Rail Network Integration Study (TCAA/RNIS) to evaluate transit investment options that provide an integrated transit network for Santa Cruz County utilizing all or part of the length of the SCBRL as a dedicated transit facility. The focus of the TCAA/RNIS was to identify a locally preferred transit alternative that provides the greatest benefit to county residents, businesses, and visitors in terms of the triple bottom line goals of improving economy, equity, and the environment. In February 2021, the RTC accepted the TCAA/RNIS which selects electric passenger rail as the locally preferred alternative for the SCBRL. Passenger Rail is included in this long-range plan, but on the financially unconstrained list of projects, due to the lack of identified and likelihood of available funding to the region for a passenger rail project.

C H AP T E R 2 | Tr a nsp or t a tion N e tw or k
2-14 S A N T A C R U Z C O U N T Y R E G I O N A L T R A N S P O R T A T I O N C O M M I S S I O N
Figure 2.4 – Santa Cruz Branch Rail Line Source: Santa Cruz County Regional Transportation Commission
Freight and Recreational Service
Although the SCBRL is owned by the RTC, the freight operator designated as the common carrier by the Surface Transportation Board (STB), owns a 20-foot-wide easement centered along the tracks and is responsible for the freight operations along the line. The STB is the federal agency that has regulatory jurisdiction over the interstate freight railroad network. An administration, coordination and license agreement (ACL) between the RTC and the rail operator outlines the responsibilities, obligations and rights of the operator and the RTC.
The initial freight operator was the Santa Cruz and Monterey Bay Railway (SC&MB) a company of Iowa Pacific Holdings. In addition, to providing freight service, SC&MB Railway implemented recreational rail service during the Christmas Holiday seasons of 2012 through 2016. The current freight operator as of July 2018 is Saint Paul and Pacific Railroad (SPPR) a company of Progressive Rail (PGR). SPPR entered into a separate agreement with Roaring Camp Railroads (Roaring Camp) to provide freight service in Watsonville and is currently serving those freight customers. Currently freight service operates from the western boundary of the City of Watsonville along West Beach Street east to the town of Pajaro connecting to the Union Pacific main line. Some of the goods shipped on the rail line include construction

Tr a nsp or ta tio n Ne tw o r k | CH A P T E R 2
2 0 4 5 R E G I O N A L T R A N S P O R T A T I O N P L A N 2-15
materials and agricultural products. Freight rail volumes have decreased significantly due to the COVID-19 pandemic but are starting to come back up. SPPR/PGR continues to market freight rail service and hopes that volumes will increase beyond pre-pandemic levels. Shipping goods on the rail network is more efficient, cost effective, uses less fuel, and emits significantly less greenhouse gases.
In 2017, serious storm damage put the SCBRL out of service, a few miles north of Watsonville. RTC is required in the agreement with the rail operator to complete the 2017 storm damage repairs and make initial repairs to track, bridges and culverts that are needed for freight and recreational rail service beyond Watsonville. RTC has completed storm damage repair work up to MP 7 and is under contract to construct the remaining storm damage repair work, but significant work remains to repair bridges, culverts and track.
Roaring Camp is the owner of the Felton Branch Rail Line which connects to the SCBRL near the Santa Cruz Wharf and extends up the San Lorenzo Valley to Felton. Roaring Camp Railroads operates excursion and seasonal passenger rail service between Felton and Santa Cruz during the summer and during the end of the year holidays and provides freight rail service to the San Lorenzo Valley area when needed.
California State Rail Plan
The California State Rail Plan7 (Rail Plan) establishes a long-term vision for an integrated, cohesive statewide rail system that offers efficient passenger and freight service, supports California’s economy, and helps achieve critical climate goals. A statewide rail system offers a viable alternative to driving for both local and long-distance trips for all populations, including those who lack access to or cannot afford automobiles. As shown in Figure 2.5, the Santa Cruz Branch Rail Line links to existing and proposed new passenger rail services on the state rail corridor – extending from San Diego to states north of California. The 2022 Short-Term Plan regional goals in the 2018 Rail Plan include a new station in Pajaro/ Watsonville and an analysis of opportunities to improve connections between Santa Cruz, Monterey and the High-Speed Rail Line at Gilroy. The 2027 Mid-Term Plan goals include implementation planning for connecting Santa Cruz and Monterey to the statewide rail network at Gilroy and establishment of hourly service by 2040, if recommended by the 2022 Rail Plan.
Caltrans is currently developing the 2022 California State Rail Plan8. The 2022 State Rail Plan is an update to the existing 2018 Rail Plan and aims to enhance rail service in the public interest and serves as a basis for federal and state rail investments in passenger and freight rail projects. More specifically, the 2022 Rail Plan seeks to revise the statewide vision by incorporating outputs from network integration activities and local/regional studies, advise priorities for state investment by updating operating and capital investments, and devising implementation strategies to coordinate across funding and operating agencies. It is anticipated that the 2022 California State Rail Plan will be published in mid-2022.
The Transportation Agency for Monterey County (TAMC) is actively pursuing rail service that includes local service as well as greater regional access. Regional service would entail an extension of the passenger rail service from Santa Clara County to Salinas with a stop at Pajaro Station and Castroville.
Photo Credit www.roaringcamp.com
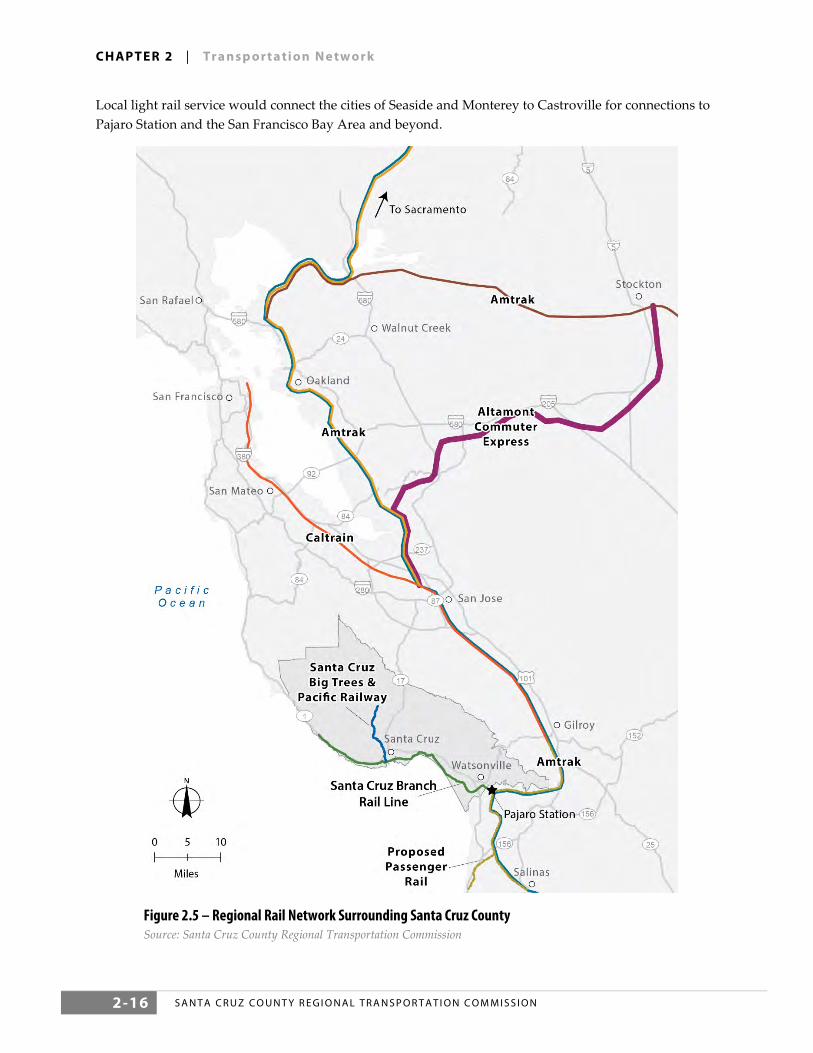
C H AP T E R 2 | Tr a nsp or t a tion N e tw or k
2-16 S A N T A C R U Z C O U N T Y R E G I O N A L T R A N S P O R T A T I O N C O M M I S S I O N
Local light rail service would connect the cities of Seaside and Monterey to Castroville for connections to Pajaro Station and the San Francisco Bay Area and beyond.
Figure 2.5 – Regional Rail Network Surrounding Santa Cruz County Source: Santa Cruz County Regional Transportation Commission

Tr a nsp or ta tio n Ne tw o r k | CH A P T E R 2
2 0 4 5 R E G I O N A L T R A N S P O R T A T I O N P L A N 2-17
There are four existing passenger rail services accessible by traveling to neighboring counties. Amtrak provides interstate and cross-country train connections with daily service on the Coast Starlight between Seattle, WA and Los Angeles, CA with stops in San Jose and Salinas. Caltrain provides commuter service to cities along the peninsula between San Francisco and San Jose with an extension to Gilroy. The Altamont Corridor Express (ACE) provides weekday service between Stockton and San Jose. The Capitol Corridor provides daily service between San Jose and Sacramento/Auburn. The closest access point for all four trains is the San Jose Diridon Station, which can be reached using the Highway 17 Express Bus. For south county
residents, Caltrain’s Gilroy or Amtrak’s Salinas station may be equally close.
A new Amtrak train between northern and southern California called the Coast Daylight is also in the planning phases. The current proposal includes one round trip per day in each direction, with a station stop in Pajaro to serve Santa Cruz County passengers.9
High Speed Rail Plans
Construction of the first segment of high-speed rail is well underway. The construction of Phase 1 began in 2015 and will connect the San Francisco Bay Area to the Los Angeles Basin through the Central Valley. Phase 2 will extend to Sacramento and San Diego (Figure 2.6). The project is funded in part by Proposition 1A, a bond measure passed by California voters in 2008. According to the State, “California high-speed rail will fundamentally transform how people move around the state, spur economic growth, create a cleaner environment, and preserve agricultural lands and natural habitat – and it has already created thousands of good-paying jobs.” The Phase 1 system will run from San Francisco to the Los Angeles basin in under three hours at speeds capable of over 200 miles per hour. The system will eventually extend to Sacramento and San Diego, totaling 800 miles with up to 24 stations.10
The closest stations for Santa Cruz County residents will be in San Jose or Gilroy. Once high-speed rail service is completed, transit connectivity to these stations will be essential in order for Santa Cruz County residents to fully benefit from this new rail system. High Speed Rail will provide important transportation alternatives for travel between San Francisco and Los Angeles.
Photo Credit: Howard Cohen

C H AP T E R 2 | Tr a nsp or t a tion N e tw or k
2-18 S A N T A C R U Z C O U N T Y R E G I O N A L T R A N S P O R T A T I O N C O M M I S S I O N
Figure 2.6 – Proposed California High Speed Rail Line Source: California High Speed Rail Authority

Tr a nsp or ta tio n Ne tw o r k | CH A P T E R 2
2 0 4 5 R E G I O N A L T R A N S P O R T A T I O N P L A N 2-19
Active Transportation
Bike Network
The region has an extensive network of bike lanes and paths for commuters and recreational riders. Currently, Santa Cruz County boasts 223 miles of bikeways: 196 miles of bike lanes and 27 centerline miles of separated paths. Bike lanes can be found on most arterials and collector roads and there are an increasing number of separated bike paths and bikeways on low traffic volume neighborhood streets. Bicycle parking, including bicycle racks and lockers, are located throughout the county.
The area has an active bicycling community which promotes the provision of dedicated bicycle facilities on a variety of roadway types to accommodate the varied ability and comfort levels of people in our community. The RTC has a Bicycle Advisory Committee which reviews RTC-funded bicycle projects and programs and advises the RTC and other entities on bicycle related issues.
Bicycle Resources and Programs. There are numerous resources and programs that educate people about bicycling and encourage them to bike in Santa Cruz County. One of the most popular outreach materials produced by the RTC is the Bicycle Map featuring bicycle paths, lanes, and alternate routes throughout the county. This map is available in a printed or electronic format from the RTC’s website. The Bicycle Map contains information on bicycling
resources and rules of the road in both English and Spanish.
In addition, there are several ongoing events promoting bicycling and bicycle safety. The RTC has been a primary funder of Ecology Action’s Bicycle to Work/School events, which are held twice a year. The events include activities at schools, coffee shops and other sites around the county and draw about 13,000 participants per year. Open Streets events - which temporarily divert automobile traffic and open entire roadways for people to bike, walk, skate in a safe and festive environment –have been occurring annually in a number of locations throughout the county.
The Community Traffic Safety Coalition and Ecology Action, both partially funded by the RTC, provide ongoing bicycle safety classes, outreach and education programs countywide.
RTC provides free countywide bike maps.
New green bike lanes installed in Watsonville Photo Credit: Tony Nuñez/The Pajaronian

C H AP T E R 2 | Tr a nsp or t a tion N e tw or k
2-20 S A N T A C R U Z C O U N T Y R E G I O N A L T R A N S P O R T A T I O N C O M M I S S I O N
Pedestrian Facilities
Whether walking to the bus stop, from a parking spot into work, or home from school, everyone is a pedestrian for some portion of their trip. The existing pedestrian network consists of sidewalks built by developers in conjunction with construction projects, private property owners, and by local jurisdictions as part of roadway projects. Ways in which local jurisdictions work towards expanding the pedestrian network is by constructing sidewalks and curb cuts in conjunction with new and redeveloped streets, considering pedestrian access in new designs, filling gaps in the sidewalk network, and working closely with the public to identify where existing pedestrian facilities need attention. In some areas, local jurisdictions are implementing projects to slow vehicular traffic and create more attractive pedestrian facilities. In recent years, more emphasis is being placed on the benefits of “walkability.” Sidewalks and pedestrian-friendly amenities – such as wide sidewalks, crosswalks, curb cuts, landscaping/ buffers and benches – are seen as beneficial additions which make communities friendly and livable.
Students walking at Watsonville High School
Despite a more recent focus on the community and personal, economic and health benefits of pedestrian travel, extensive gaps and other deficiencies in the pedestrian network still exist. The condition of a sidewalk can constitute a barrier, particularly if there are cracks, lifts, vegetation or other obstructions. Universal access standards are focused on the ease of access for pedestrian facilities, particularly for people with mobility impairments.
Additionally, property owners, not the cities and county, are responsible for maintaining sidewalks in front of their properties and are often unaware or slow to make needed repairs. Currently a significant portion of the county’s pedestrian facilities are not mapped. As additional information about the existing pedestrian network is available, agencies will be able to increase the quality of these facilities, particularly near activity centers.
Identifying Needs
Bicycling. In addition to several major bicycle projects identified individually in the Regional Transportation Plan (RTP), several local jurisdictions have developed Bicycle Plans or Active
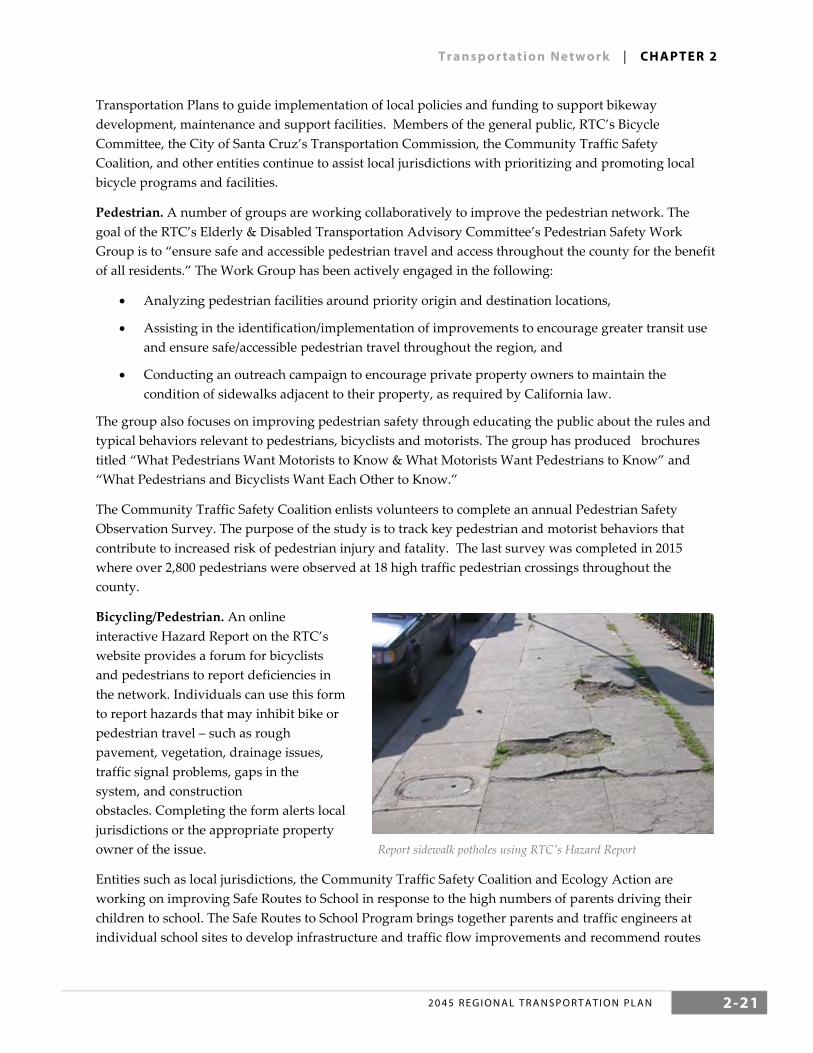
Tr a nsp or ta tio n Ne tw o r k | CH A P T E R 2
2 0 4 5 R E G I O N A L T R A N S P O R T A T I O N P L A N 2-21
Transportation Plans to guide implementation of local policies and funding to support bikeway development, maintenance and support facilities. Members of the general public, RTC’s Bicycle Committee, the City of Santa Cruz’s Transportation Commission, the Community Traffic Safety Coalition, and other entities continue to assist local jurisdictions with prioritizing and promoting local bicycle programs and facilities.
Pedestrian. A number of groups are working collaboratively to improve the pedestrian network. The goal of the RTC’s Elderly & Disabled Transportation Advisory Committee’s Pedestrian Safety Work Group is to “ensure safe and accessible pedestrian travel and access throughout the county for the benefit of all residents.” The Work Group has been actively engaged in the following:
• Analyzing pedestrian facilities around priority origin and destination locations,
• Assisting in the identification/implementation of improvements to encourage greater transit use and ensure safe/accessible pedestrian travel throughout the region, and
• Conducting an outreach campaign to encourage private property owners to maintain the condition of sidewalks adjacent to their property, as required by California law.
The group also focuses on improving pedestrian safety through educating the public about the rules and typical behaviors relevant to pedestrians, bicyclists and motorists. The group has produced brochures titled “What Pedestrians Want Motorists to Know & What Motorists Want Pedestrians to Know” and “What Pedestrians and Bicyclists Want Each Other to Know.”
The Community Traffic Safety Coalition enlists volunteers to complete an annual Pedestrian Safety Observation Survey. The purpose of the study is to track key pedestrian and motorist behaviors that contribute to increased risk of pedestrian injury and fatality. The last survey was completed in 2015 where over 2,800 pedestrians were observed at 18 high traffic pedestrian crossings throughout the county.
Bicycling/Pedestrian. An online interactive Hazard Report on the RTC’s website provides a forum for bicyclists and pedestrians to report deficiencies in the network. Individuals can use this form to report hazards that may inhibit bike or pedestrian travel – such as rough pavement, vegetation, drainage issues, traffic signal problems, gaps in the system, and construction obstacles. Completing the form alerts local jurisdictions or the appropriate property owner of the issue.
Entities such as local jurisdictions, the Community Traffic Safety Coalition and Ecology Action are working on improving Safe Routes to School in response to the high numbers of parents driving their children to school. The Safe Routes to School Program brings together parents and traffic engineers at individual school sites to develop infrastructure and traffic flow improvements and recommend routes
Report sidewalk potholes using RTC's Hazard Report

C H AP T E R 2 | Tr a nsp or t a tion N e tw or k
2-22 S A N T A C R U Z C O U N T Y R E G I O N A L T R A N S P O R T A T I O N C O M M I S S I O N
for walking and biking. In recent years, this program has developed maps indicating safe routes to school for several local elementary schools.
Caltrans is also actively planning for a multi-modal transportation network to guide the development of non-motorized transportation facilities. In 2017, Caltrans adopted the first California State Bicycle and Pedestrian Plan, Toward an Active California.11 This report lays out an ambitious plan to achieve statewide goals to double walking and triple bicycling trips by 2020.
Bicycle and Pedestrian Projects Underway
Monterey Bay Sanctuary Scenic Trail Network (MBSST). In late 2013, the RTC approved the Final Master Plan for the Monterey Bay Sanctuary Scenic Trail Network (MBSST). Master Plans for the trail in both Santa Cruz and Monterey Counties identify how a bicycle and pedestrian pathway will eventually arc the Monterey Bay coastline providing non-motorized coastal access for walkers, joggers, cyclists, people with mobility impairments, families, locals, and visitors. In Santa Cruz County, the 50-mile network can be constructed in segments as funding becomes available. The spine of the trail network in Santa Cruz County will run within the 32-mile rail right-of-way). Trail spurs provide a braided network with coastal access connections to schools, retail centers, residences and other destinations. Sections of the MBSST Network may be designated as part of the California Coastal Trail (CCT). The CCT is a network of public trails that will extend the entire 1200-mile length of the California Coast and currently is more than half complete. Eighteen (18) miles of projects along the rail right-of-way have been funded in full or in part with construction to begin as soon as design, engineering and environmental permitting are completed (Figure 2.7). These projects include the north coast from Davenport to Wilder Ranch (Segment 5); the west side of Santa Cruz from Natural Bridges Dr to the Santa Cruz Wharf (Segment 7), and from the Santa Cruz Boardwalk to 17th Ave (Segments 8-9); and the City of Watsonville from Lee Rd to Walker St (Segment 18). Portions of segments 7, 8, and 18 have been constructed as of July 2021.
Figure 2.7 – Monterey Bay Sanctuary Scenic Trail Network Map Source: Santa Cruz County Regional Transportation Commission
Wayfinding Signage. In an effort to increase bicycle ridership and improve safety, the RTC installed bicycle wayfinding signage at 303 locations throughout the county. The signs assist all types of bicycle

Tr a nsp or ta tio n Ne tw o r k | CH A P T E R 2
2 0 4 5 R E G I O N A L T R A N S P O R T A T I O N P L A N 2-23
riders – commuters, families, recreational riders and visitors – in finding and accessing 53 major destinations throughout Santa Cruz County. This program was implemented in coordination with the Monterey Bay Sanctuary Scenic Trail Network, California Coastal Trail, Pacific Coast Route, and Caltrans signage requirements. Installations were phased beginning in 2019 and completed in October 2020.
Other. Bicycling and walking is also facilitated by Safe Routes to School efforts, the UCSC Bike Trailer & Shuttle service which provides a ride up the hill to campus, and local jurisdiction’s increasing incorporation of Complete Streets principals in an effort to balance and encourage all modes of transportation.
Transportation Demand Management
Transportation Demand Management is a general term for the use of strategies that result in the more efficient use of transportation resources.12 These strategies are designed to increase the number of people using sustainable transportation options such as carpooling, bicycling, walking, telecommuting and taking transit. Since 1979, the RTC has worked with partner agencies to implement TDM strategies at a local level as well as at the regional level. Partner agencies include local jurisdictions and non-profits such as Ecology Action and Community Bridges. Regional strategies include traveler information services, carpool/vanpool matching, workplace-based commute programs, park and ride lot coordination, commute incentives, and marketing campaigns.
The RTC provides TDM services through Cruz511.org, offering dynamic ridematching, multi-modal trip planning, transit resources, and an interactive traffic map with real-time travel conditions including incident details and road or lane closures on county roads and state highways. Knowledgeable travel counselors are also available by phone or email to provide personalized trip planning and support employer commute programs.
In 2019, the City of Santa Cruz launched GO Santa Cruz, a commute incentive program for downtown employees and in 2021, the RTC expanded the program countywide. The GO Santa Cruz County program offers a variety of incentives to help commuters choose options other than driving alone to get to work or school. GO Santa Cruz County is a key part of the RTC’s ongoing effort to reduce greenhouse gas emissions and play an active role in addressing climate change. The program is partially funded by voter-approved Measure D, which provides a balanced vision to improve, operate and maintain Santa Cruz County’s transportation network.
Park and Ride
Park and Ride lots are strategically located pick up spots where commuters can park their cars during the work or school day to meet a carpool, vanpool, or ride the bus. There are five park and ride lots serving Santa Cruz County commuters (Figure 2.8) located along Highway 1 and Highway 17 and at METRO transit centers in Scotts Valley and Capitola. Parking is free for public use during specified hours, but overnight parking is prohibited. Local park and ride facilities are owned by public agencies or are shared-
Bicycle Wayfinding Sign

C H AP T E R 2 | Tr a nsp or t a tion N e tw or k
2-24 S A N T A C R U Z C O U N T Y R E G I O N A L T R A N S P O R T A T I O N C O M M I S S I O N
use lots by agreement with private lot owners. A user guide with additional information is provided on Cruz511.org.
Figure 2.8 – Park and Ride Lots Serving Santa Cruz County Source: Santa Cruz County Regional Transportation Commission
Transportation System Management
Transportation System Management (TSM) is a strategy of implementing operational projects that can enhance the efficiency of the existing transportation system. Generally, TSM techniques are designed to improve traffic flow and air quality, as well as enhance system accessibility and safety. Often, the costs associated with TSM strategies are lower in cost than constructing new facilities. Example strategies include intersection and signal improvements (e.g., signal synchronization, high-occupancy vehicle (HOV) queue jumps and signal priority, turning lanes), incident management, auxiliary lanes, and ramp metering.

Tr a nsp or ta tio n Ne tw o r k | CH A P T E R 2
2 0 4 5 R E G I O N A L T R A N S P O R T A T I O N P L A N 2-25
Intelligent Transportation Systems
Santa Cruz County’s transportation system runs more efficiently and safely due to a variety of Traffic Operation System (TOS) components. Caltrans installs, operates and maintains these systems and works in cooperation with California Highway Patrol and the RTC to assure they are being used to the greatest benefit. Components include the following:
• Changeable Message Signs (CMS) - displays messages about roadway conditions (incidents, delays)
• Dynamic Curve Warning Signs - broadcasts driver speeds and cautions drivers about safe speeds
• Closed Circuit TV (CCTV) Cameras - displays live traffic conditions online to public and Caltrans TMC
• Traffic Monitoring Stations - obtains information about traffic speeds and counts
• Traffic Management Centers (TMC) - operators at the Oakland TMC and San Luis Obispo TMC control and operate the individual TOS components
• QuickMap – mobile and desktop application (http://quickmap.dot.ca.gov/) that displays real-time traffic speeds, construction zones, incidents reported to the CHP, CMS messages and CCTV images
The Traffic Operations System, which extends along Highway 1 and Highway 17, is used to detect and verify traffic incidents and disseminate traffic information to motorists so they may adjust their travel
Auxiliary lane on Highway 1 at Morrissey Blvd in Santa Cruz

C H AP T E R 2 | Tr a nsp or t a tion N e tw or k
2-26 S A N T A C R U Z C O U N T Y R E G I O N A L T R A N S P O R T A T I O N C O M M I S S I O N
plans accordingly. This system is critical to traffic flow, since single-incident disruptions, such as crashes or construction projects, are responsible for a good portion of all freeway traffic jams. Better information and communication can improve the county’s major commute thoroughfares in an economical way.
Intelligent Transportation Systems (ITS), such as the components of the Traffic Operations System, are developed using a standardized architecture. In response to increased federal emphasis on ITS, the Central Coast ITS Strategic Deployment Plan was developed in 2000 through a multi-agency partnership of Central Coast government agencies including the RTC. The Regional ITS Architecture was later developed to ensure that any intelligent transportation system element implemented in the Central Coast considered all possible links to other aspects of the transportation network, whether the connection between these elements were based on the data they required or the data that they dispersed.
For example, information disseminated through a Changeable Message Sign is directly dependent on the roadway condition data collected by the California Highway Patrol, Caltrans or others. As such, ITS Architecture ensures that investments maximize all existing technological resources and build on existing investments. This RTP is consistent with the Regional ITS Architecture to the maximum extent practicable. The 2045 RTP includes funding for continued coordination with Caltrans and the CHP on the Traffic Operations Systems for Santa Cruz County.
Aviation
The Watsonville Municipal Airport, developed in 1947, serves business and recreational users, and is the only public use airport in Santa Cruz County. The facility serves single and twin-engine aircraft and helicopters, as well as turboprop and turbine-powered business jets. Approximately 45 percent of all general aviation activities for the Monterey Bay Area are served by the Watsonville Airport. The double-runway airport occupies 277 acres, plus has an additional 53 acres of land designated as runway protection zone. There is a helipad and fueling facilities on site. The Watsonville Municipal Airport is owned by the City of Watsonville and is a self-sustaining “enterprise operation” with a staff of thirteen full time employees.13 The airport is home to approximately 330 aircraft and over 60,000 flight operations per year. According to the Watsonville Municipal Airport annual aviation operations count, runway operations (landings and take offs) will increase to 100,000 by the year 2025, most of which will be general aviation. There are 218 hangars and 80 tie-downs on the property to store aircraft. Other structures are primarily for maintenance, flight training, and sales.
The airport serves as the airport base for several agricultural growers that distribute fruits, berries, and vegetables. In addition to use by private citizens and businesses, the airport is also used for law
Photo Credit: Watsonville Municipal Airport

Tr a nsp or ta tio n Ne tw o r k | CH A P T E R 2
2 0 4 5 R E G I O N A L T R A N S P O R T A T I O N P L A N 2-27
enforcement (County Sheriff, California Highway Patrol, Coast Guard, and California Fish and Wildlife), medical evacuation, fire suppression and flight instruction. The Regional Airports Economic Impact Study completed by AMBAG in 2006 showed that the Watsonville Airport had a total economic impact of over $650 million dollars annually for the region.
There are also three private airstrips within the county, located in Bonny Doon, at the Monterey Bay Academy, and Las Trancas/ Big Creek (the latter two operate for private uses amounting to fewer than 10 trips per month). Large passenger airports serving the region are located in San Jose, Monterey, Oakland and San Francisco. Civil aviation helipads maintained for helicopter use include those at Watsonville Community Hospital and Dominican Hospital. There is also a helicopter pad next to Highway 17 in the Santa Cruz Mountains summit area.

C H AP T E R 2 | Tr a nsp or t a tion N e tw or k
2-28 S A N T A C R U Z C O U N T Y R E G I O N A L T R A N S P O R T A T I O N C O M M I S S I O N
Notes for Chapter 2
1 “2015 California Public Road Data,” State of California, Department of Transportation (2016), http://www.dot.ca.gov/hq/tsip/hpms/hpmslibrary/prd/prd2015.pdf
2 “Santa Cruz Metropolitan Transit District Operating Financials and Statistics FY 2010-2013 (through Oct. 2012),” Santa Cruz METRO, accessed January 2014, http://www.scmtd.com/images/department/planning/transitfactsheet%2012-13.pdf.
3 “Highway 17 Access Management Plan”, Caltrans District 5 (2016), https://sccrtc.org/wp-content/uploads/2016/12/final_hwy17_amp.pdf
4 “Highway 9/ San Lorenzo Valley Complete Streets Corridor Plan”, SCCRTC (2019), https://sccrtc.org/projects/streets-highways/hwy-9-plan/
5 “Highway 1/9 Intersection Improvement Fact Sheet”, City of Santa Cruz, accessed October 2021, https://www.cityofsantacruz.com/home/showpublisheddocument/84018/637558110581700000
6 “METRO ParaCruz Customer Guide”, Santa Cruz Metropolitan Transit District, accessed October 2021, http://www.scmtd.com/images/department/paracruz/METRO_ParaCruz_Customer_Guide.pdf
7 “2018 California State Rail Plan”, Caltrans, accessed October 2017, http://www.dot.ca.gov/californiarail/
8 2022 California State Rail Plan, Caltrans, accessed October 2021, https://www.2022californiastaterailplan.org/
9 “Amtrak Coast Daylight Route, Service Ridership, and Financial Evaluation”, Amtrak (2016), accessed October 2021, https://www.slocog.org/programs/public-transportation/rail/coast-rail-coordinating-council-crcc
10 “California High-Speed Rail Authority,” State of California, accessed October 2021, http://www.hsr.ca.gov
11 “Toward and Active California -State Bicycle and Pedestrian Plan”, Caltrans, accessed October 2021, https://dot.ca.gov/-/media/dot-media/programs/transportation-planning/documents/f0020350_activeca_final-plan-2017-05-18-a11y.pdf
12 “Online TDM Encyclopedia,” Victoria Transport Policy Institute (2017), http://www.vtpi.org/tdm/.
13 Rayvon Williams, City of Watsonville Airport Manager, personal communications, October 10, 2017.

2 0 4 5 R E G I O N A L T R A N S P O R T A T I O N P L A N 3-1
CHAPTER
3 Travel Patterns
In planning for the future, an understanding of existing and projected travel patterns is necessary to determine what transportation investments are needed to meet the challenges and opportunities that face Santa Cruz County through 2045. Many factors influence the patterns of where, how much, and how we travel. The amount and distribution of traffic on highways and local roads, as well as the network of bicycle lanes, sidewalks, paths, and buses, can fluctuate based on population, the economy, location of jobs and services, public works decisions, travel choices, fuel prices, and other factors.
Population
Travel patterns within Santa Cruz County are impacted by the number of people who live, work, and visit the county. Figure 3.1 shows the historical population change in Santa Cruz County from 1950 to 2020 and forecasted population growth from 2025 through 2045. Currently home to more than a quarter-million people, the population in Santa Cruz County is expected to increase 9% between 2025 and 2045.
Figure 3.1 – Historical and Projected Santa Cruz County Population Source: CA Department of Finance, U.S. Census Bureau, AMBAG 2022 Regional Growth Forecast
Population growth rates in the five jurisdictions in Santa Cruz County have varied substantially over the last thirty years with the City of Watsonville experiencing 66% population growth between 1990 through 2020 (Figure 3.2). In the same period, the City of Santa Cruz and City of Scotts Valley populations
270,373294,967
50,000
100,000
150,000
200,000
250,000
300,000
350,000
1940 1950 1960 1970 1980 1990 2000 2010 2020 2030 2040 2050
Popu
latio
n
Year

C H AP T E R 3 | Tr av el Pa t ter n s
3-2 S A N T A C R U Z C O U N T Y R E G I O N A L T R A N S P O R T A T I O N C O M M I S S I O N
increased approximately 30%. Between 2010 and 2020, the City of Santa Cruz population increased nearly 8% while the other jurisdictions and unincorporated county experienced modest growth.
Jurisdiction 1990 2000 2010 2020* % Change (1990-2020)
Capitola 10,171 10,033 9,918 10,142 -0.3% Santa Cruz 49,711 54,593 59,946 64,547 29.8% Scotts Valley 8,667 11,385 11,580 11,714 35.2% Watsonville 31,099 44,265 51,199 51,656 66.1% Unincorporated 130,086 135,326 129,739 132,314 1.7% Santa Cruz County Total 229,734 255,602 262,382 270,373 17.7%
Figure 3.2 – Population Data for Santa Cruz County by Jurisdiction Source: U.S. Census Bureau, *2020 data are estimates from Department of Finance1
Figure 3.3 shows the location of where people live in Santa Cruz County, illustrating how the population is clustered primarily along the coast between the City of Santa Cruz and Aptos, Watsonville, Scotts Valley, and San Lorenzo Valley. A large percentage of people in Santa Cruz County live in urban areas, making it easier to promote shorter trips and active transportation options for reducing congestion and GHG emissions.
Figure 3.3 - 2010 Population Density Source: U.S. Census Bureau
1 dot = 20 people

Tr a vel P a t ter n s | CH A P T ER 3
2 0 4 5 R E G I O N A L T R A N S P O R T A T I O N P L A N 3-3
Employment Opportunities
Employment opportunities are another factor influencing travel patterns. Higher employment rates often mean greater traffic volumes as more people travel for work. Similarly, higher unemployment rates often mean less traffic volumes. The number of jobs in Santa Cruz County increased 7% between 2010 and 2015, and is expected to grow by 9.5% between 2020 through 2045 (Figure 3.4). Prior to the COVID-19 pandemic, unemployment in Santa Cruz County was relatively low at 5%. In 2020, the countywide unemployment rate increased to 9.5% with unemployment highest in the City of Watsonville at nearly 15% (Figure 3.5). The unemployment rate in Santa Cruz County reached up to 17% during the early months of the pandemic but has since fallen to near pre-pandemic levels. Middle and lower-income workers were impacted the most and saw greater employment losses than higher-earning workers.2 Figure 3.6 shows the locations of where workers are employed throughout the Santa Cruz County.
Figure 3.4 – Historical and Projected Number of Jobs in Santa Cruz County Source: U. S. Census Bureau, EDD- InfoUSA, AMBAG 2022 Regional Growth Forecast
Jurisdiction 2000 2005 2010 2015 2016 2017 2018 2019 2020
% % % % % % % % % Capitola 2.5 3.5 10.7 5.9 5.5 2.6 1.5 1.1 2.1 City of Santa Cruz 4.2 5.2 11.9 6.7 6.1 3.9 3.4 3.3 7.8 Scotts Valley 2.2 3 12.2 6.8 6.3 4.4 2.9 3.2 6.2 Watsonville 11.5 14 16.8 9.6 8.9 12.1 10.7 10.8 14.8 Santa Cruz County 5.1 6.3 13.3 7.5 6.9 5.7 5 5 9.5
Figure 3.5 – Unemployment Rates by Jurisdiction within Santa Cruz County Source: California Employment Development Department3
122,323 130,436
153,261
50,000
70,000
90,000
110,000
130,000
150,000
170,000
1990 2000 2010 2020 2030 2040 2050
Num
ber
of Jo
bs
Year

C H AP T E R 3 | Tr av el Pa t ter n s
3-4 S A N T A C R U Z C O U N T Y R E G I O N A L T R A N S P O R T A T I O N C O M M I S S I O N
Figure 3.6 – Where People Work in Santa Cruz County Source: U.S Census Bureau (On the Map), Center for Economic Studies, LEHD4, 2018
Where Are We Traveling?
Eighty percent of the population in Santa Cruz County lives in approximately 20% of the area of the county. Trips are made between where people live (Figure 3.3) and where they work (Figure 3.6), go to school, shop, socialize and recreate. Many residents living in the southern portion or more remote corners of the county often travel to job centers located in the central portions of the county near urban developments, such as downtown Santa Cruz. Increasing the diversity of land uses within neighborhoods to improve access to goods and services can reduce trip lengths, increase opportunities for bicycling and walking, and improve access to transit stops.
The 2017 National Household Travel Survey (NHTS) is the most recent national inventory of daily travel, and the authoritative source on the travel behavior of the American public. One metric the NHTS analyzes is trends in Person Miles of Travel by Trip Purpose and 2017 survey results show that the average daily miles traveled were significantly higher for shopping and errands and for social and recreational travel in 2017 compared to 2009. Of all trips reported, the national average number of miles

Tr a vel P a t ter n s | CH A P T ER 3
2 0 4 5 R E G I O N A L T R A N S P O R T A T I O N P L A N 3-5
traveled per person per year as a percentage of total trips taken was: 18% to and from work (excluding work errands), 26% for shopping and personal errands, 7% for school and church, 27% for social and recreation, and 22% other.5
County to County Commute Flows
The transportation network provides workers access to jobs throughout the region. Although many people travel outside Santa Cruz County as part of their commute, the proportion of residents who have had to do so has declined in recent years. Figure 3.7 provides the historical number of workers living in Santa Cruz County and the county where the worker is employed. The commute data presented represent typical commuting activity through 2016, the most recent year for which data are available. The data show nearly a quarter (22%) of residents have to commute outside of the County for work. Close to 100,000 people live and work in Santa Cruz County, while 21,000 travel to the Bay Area for work and 6,500 travel to Monterey County. Santa Clara County, with its numerous job centers, attracts the most workers from Santa Cruz County, capturing 14% of the county workforce. Figure 3.8 provides the historical number of workers employed within Santa Cruz County and the county where the worker lives. Of the total number of people working in the county, 18,000 or 16%, live outside Santa Cruz County; 8% travel from Monterey County, and 5% travel from the Bay Area. The number of workers living in Monterey County commuting into Santa Cruz County has increased 6% from the 2011-2015 average, and more than 30% since 2000.
County of Work
Total Commuters
2000*
Total Commuters
2006-10**
Total Commuters
2009-13**
Total Commuters
2011-15**
Total Commuters
2012-16**
% Share of Commuters
2012-16
% Change 2011-15 to 2012-
16 Santa Cruz 93,084 93,245 96,296 99,105 99,440 78% 0% Monterey 5,164 5,779 5,995 6,583 6,490 5% -1% San Benito 622 538 659 700 545 0% -22% SF Bay Area 26,243 21,184 20,790 20,619 21,090 16% 2%
San Francisco 621 832 608 714 705 1% -1% San Mateo 2,010 1,305 1,273 1,242 1,290 1% 4% Santa Clara 21,540 17,451 17,280 17,458 17,935 14% 3% Alameda 1,419 1,007 1,118 862 820 1% -5% Contra Costa 244 274 227 156 140 0% -10% Solano 24 10 46 68 70 0% 3% Napa 49 79 66 34 55 0% 62% Sonoma 142 102 100 55 55 0% 0% Marin 194 124 72 30 20 0% -33%
Elsewhere 993 7,277 734 1,138 703 1% -38% Total 126,106 128,023 124,474 128,145 128,268 100% 0%
Figure 3.7 – Workers Living in Santa Cruz County Source: Census Transportation Planning Products (CTPP), Federal Highway Administration *U.S. Census Bureau, Census long form data **U.S. Census Bureau, American Community Survey 5-year summary data, Commuting Flows

C H AP T E R 3 | Tr av el Pa t ter n s
3-6 S A N T A C R U Z C O U N T Y R E G I O N A L T R A N S P O R T A T I O N C O M M I S S I O N
County of Residence
Total Commuters
2000*
Total Commuters
2006-10**
Total Commuters
2009-13**
Total Commuters
2011-15**
Total Commuters
2012-16**
% Share of Commuters
2012-16
% Change 2011-15 to 2012-
16 Santa Cruz 93,084 93,245 96,296 99,105 99,440 84% 0% Monterey 7,601 8,551 9,178 9,640 10,175 9% 6% San Benito 714 848 848 1038 1005 1% -3% SF Bay Area 4,738 5,420 5,452 5,829 5,945 5% 2%
San Francisco 206 213 259 389 425 0% 9% San Mateo 214 441 332 475 405 0% -15% Santa Clara 3,463 3,725 4,045 4,249 4,375 4% 3% Alameda 462 522 606 410 405 0% -1% Contra Costa 141 235 100 219 235 0% 7% Solano 61 36 14 0 0 0% - Napa 30 12 5 10 10 0% 0% Sonoma 70 222 67 32 35 0% 9% Marin 91 14 24 45 55 0% 22%
Elsewhere 1,259 11,262 1,588 1,527 1,277 1% -16% Total 107,396 119,326 113,362 117,139 117,842 100% 1%
Figure 3.8 – Workers Employed in Santa Cruz County Source: Census Transportation Planning Products (CTPP), Federal Highway Administration *U.S. Census Bureau, Census long form data **U.S. Census Bureau, American Community Survey 5-year summary data, Commuting Flows
The COVID-19 pandemic upended typical commute patterns and forced many employers to shift to remote work, especially for white-collar workers. Many were forced to stop or alter their daily commute to and from work. According to movement data tracked by Google6 (Figure 3.9), travel to workplaces within Santa Cruz County dropped more than 50% at the beginning of the statewide stay-at-home order in March 2020 and remains 30% below pre-pandemic levels. Instead of completely going back to a pre-pandemic work style, many companies are adjusting to hybrid work, with a few days of teleworking and a few days of staggered in-person work schedules.

Tr a vel P a t ter n s | CH A P T ER 3
2 0 4 5 R E G I O N A L T R A N S P O R T A T I O N P L A N 3-7
Figure 3.9 – Average of Percentage Change in Travel Source: Google Community Mobility Reports
High Use Routes
Highways. Rising traffic congestion is an inescapable condition in most urban areas and on state highways, frustrating daily commuters. In Santa Cruz County, 47% of the miles driven are on state highways7. Figure 3.10 shows average annual daily traffic volumes on state highways in Santa Cruz County. Of the six state highways in the county, Highway 1 has the highest average daily traffic, as it is the primary north-south travel route in the region. Between the City of Santa Cruz and Aptos (and occasionally further south), Highway 1 is congested at peak travel times with peak periods stretched through the day. On the most congested segments of Highway 1, in the vicinity of the 41st Avenue interchange, weekday traffic volumes are 95,000. High traffic volumes on Highway 1 translate into longer travel times on both Highway 1 and parallel arterial routes (e.g., Soquel Drive and Capitola Road). It is no surprise that Highway 1 has been the focal point for much of the discussion and frustration about traffic congestion in the county. In 2011, Caltrans, in conjunction with the RTC, developed the Highway 1 Corridor System Management Plan (CSMP) and several projects resulting from the Plan are included in the Action Element of this RTP (Chapter 6).
-80
-60
-40
-20
0
20
40
60
80
Feb
Mar
Apr
May Jun Jul
Aug Se
p
Oct
Nov Dec Jan
Feb
Mar
Apr
May Jun Jul
Aug Se
p
Oct
2020 2021
Baseline
Parks Attendance
Residential
Retail & Recreation
Workplaces
Transit Stations

C H AP T E R 3 | Tr av el Pa t ter n s
3-8 S A N T A C R U Z C O U N T Y R E G I O N A L T R A N S P O R T A T I O N C O M M I S S I O N
Figure 3.10 – Annual Average Daily Traffic Volumes at Most Traveled Segments on State Highways in Santa Cruz County Source: Caltrans Traffic Data Branch
Traffic volumes on Highway 1 declined between 2005 through 2016, likely due to the increased level of congestion or delay on the highway rather than decreased demand. As traffic flow slows during peak periods, highway daily traffic volumes decrease as motorists use alternative arterial and local roads to try to find a faster route.
Traffic volumes on Highway 17 increased more than 20% between 2005 through 2016, and increased nearly 35% between 2016-2018. Congestion on Highway 17 is primarily in the northbound direction during the morning peak and in the southbound direction during the evening peak as it is the primary travel corridor for over 20,000 daily commuters going “over the hill” to jobs in the Bay Area. Congestion on Highway 17 resulting from collisions on this windy, mountainous highway, with limited access points and little or no shoulder space, can hold up traffic for long periods of time given the challenge of accessing and clearing incidents and detouring vehicles to other roads. Highways 9, 129, 152, and 236, although not as heavily traveled as Highways 1 and 17, have also seen increasing traffic volumes since 2000 (Figure 3.10).
During the pandemic, people traveled less, schools were closed, and more people worked from home. Freeway vehicle miles traveled (VMT) decreased 11% and weekday congestion decreased 53% in Santa Cruz County.8 Figure 3.11 shows pre-pandemic traffic is slowly coming back but with a more spread-out afternoon peak shifted peak.
0
20,000
40,000
60,000
80,000
100,000
120,000
1980 1985 1990 1995 2000 2005 2010 2015 2020
AV
ERA
GE
NU
MBE
R O
F V
EHIC
LES
(PER
DA
Y)
YEAR
Hwy 1
Hwy 17
Hwy 152Hwy 129
Hwy 236
Hwy 9

Tr a vel P a t ter n s | CH A P T ER 3
2 0 4 5 R E G I O N A L T R A N S P O R T A T I O N P L A N 3-9
Figure 3.11 – Caltrans District 5 Freeway VMT by Time of Day Source: Institute of Transportation Studies, UC Berkeley
Arterials. Despite high traffic volumes on state highways in Santa Cruz County, most travel occurs on the arterials, collectors and local streets and roads. Figure 3.12 provides average daily traffic volumes for motor vehicles on two, four and six lane arterials in Santa Cruz County. The most heavily traveled segment of each road is provided, where counts were available. As the only 6-lane arterial in the county, 41st Avenue in Capitola, has the highest average traffic volume at more than 40,000 vehicles per day. Mission Street and Mount Herman Road, both 4-lane arterials, follow close behind with approximately 34,000 to 37,000 vehicles per day. The Soquel corridor, a 2-to-4 lane arterial that serves as an alternate route between the City of Santa Cruz and Aptos, has traffic volumes that vary between 12,000 and 31,000 vehicles per day, depending on the location. Freedom Blvd, frequently used as an alternate route to Highway 1 between Watsonville and Aptos, provides primary access to the community of Corralitos. More than 27,000 vehicles travel through this 4-lane arterial daily. The “beach route” between the City of Santa Cruz and Capitola (Murray Street, East Cliff Drive and Portola Drive) attracts between 10,000 to 20,000 vehicles/day.

C H AP T E R 3 | Tr av el Pa t ter n s
3-10 S A N T A C R U Z C O U N T Y R E G I O N A L T R A N S P O R T A T I O N C O M M I S S I O N
Figure 3.12 – Local ADT: Average Daily Traffic Volumes at Most Traveled Segments on Selected Local Roadways Most recent year available is provided. Source: Santa Cruz County Regional Transportation Commission, Caltrans Traffic Data Branch, City of Watsonville
Transit. Santa Cruz METRO operates over 90 buses (including 4 all electric buses) on 24 fixed routes and provided over 5 million trips per year prior to COVID-19. METRO primarily serves Santa Cruz County but also operates regional service to San Jose. Numerous routes experience heavy ridership including routes serving the UCSC campus (Routes 10, 15, 18, 19, 20), routes to San Lorenzo Valley (Route 35), mainline routes between Santa Cruz and Watsonville (Routes 71, 69A and 69W, and 91X), and the Highway 17 Express. UCSC students receive free bus passes in exchange for paying a Transportation Fee with their tuition, and employees can purchase a reduced-price pass subsidize by the university. Since 2017, Cabrillo College students also receive free bus passes for paying a fee with their registration fees. In addition, METRO partnered with the City of Santa Cruz in 2020 to provide a free “Eco-Pass,” paid for by the City, to all 4,000+ downtown Santa Cruz employees through the GO Santa Cruz program.
24,60021,839
21,10020,10019,984
19,32313,025
7,855
45,20035,089
34,10027,89627,913
26,90025,12225,04424,666
23,86823,618
21,66818,86218,749
15,349
40,804
2 LANE ARTERIALSSR 9 N of SR 1 (2019)
Porter St S of Main St (2010)SR 152 (Lake) E of Beck St (2019)
Park Ave N of SR 1 (2010)Laurel St E of Front (2016)
Murray St at Harbor Br (2018)Bay St/Dr N of Mission St (2013)
W Beach St W of Ohlone Pkwy (2017)
4 LANE ARTERIALSMission St W of Chestnut St (2019)
Mt Hermon Rd S of Glen Canyon Rd (2017)SR 152 (Main) E of Green Valley Rd (2019)
Graham Hill Rd NW of Mt. Hermon Rd (2012)Freedom Blvd E of Green Valley Rd (2021)
SR 129 (Riverside) E of Main St (2019)State Park Dr. S of Soquel (2016)
Soquel Ave E of Fredrick St (2014)Water St at San Lorenzo River Bridge (2016)
Green Valley Rd S of Freedom Blvd (2021)Soquel Dr W of 41st Ave (2011)
Scotts Valley Dr E of Mt Hermon Rd (2016)Ocean St S of Water St (2014)
Airport Blvd W of Ross Ave (2017)Capitola Rd W of 17th Ave (2018)
6 LANE ARTERIALS41st Ave N of Clares St (2015)
Cavallaro Transit Center in Scotts Valley

Tr a vel P a t ter n s | CH A P T ER 3
2 0 4 5 R E G I O N A L T R A N S P O R T A T I O N P L A N 3-11
Figure 3.13 shows overall average ridership by route data for METRO transit service during the 2018-2019 school year before the COVID-19 pandemic impacted service. (although it does not distinguish where on the route passengers boarded or disembarked). UCSC boardings (approximately 10,300 riders per weekday) comprise approximately 50% of all METRO ridership when school is in session. As a result, these routes tend to be the most frequent and have the longest running spans of service in the system. Route 71, 69A and 69W between Watsonville and Santa Cruz have approximately 3,500 boardings per weekday, Route 35 between Santa Cruz and San Lorenzo Valley has approximately 1,100 boardings per weekday, and the Highway 17 Express has approximately 900 boardings per weekday. Cabrillo students comprise about 1,200 boardings per weekday.
Figure 3.13 – METRO Weekday School Year Average Ridership by Route Source: Santa Cruz Metropolitan Transit District, FY2019. Note: Line thickness is based on each route’s total average, regardless of where on route the boardings take place. On street segments where there is more than one route, the averages are summed.
METRO annual ridership peaked in 2008-09 at 6 million riders and remained steady at 5 million riders per year for three years prior to COVID-19 (Figure 3.14). METRO reduced service in 2010 and 2011 (in addition, fares were increased in 2011), and again in 2016, as a result of changing economic conditions that contributed to reduced revenues. The level of transit service (number, frequency, and areas covered by buses), fuel prices, unemployment rates, traffic congestion, and accessibility of transit stops for pedestrians can influence ridership levels. Ridership decreased after the service reduction in September

C H AP T E R 3 | Tr av el Pa t ter n s
3-12 S A N T A C R U Z C O U N T Y R E G I O N A L T R A N S P O R T A T I O N C O M M I S S I O N
2016 but severe weather conditions in January and February of 2017 may have also affected annual ridership for this service year.
The COVID-19 pandemic and related restrictions led to major transit demand decline for many public transit systems in the United States. Santa Cruz METRO ridership decreased nearly 90% during the peak of the pandemic, and overall ridership remained 80% below pre-COVID 19 levels in FY21, down from over 5,000,000 annual passenger boardings to just over 900,000 (Figure 3.14). This is a steeper decline than transit ridership nationally owing to METRO’s greater reliance on student riders. Non-student ridership, however, decreased the least and recovered the fastest, with over a third of non-student customers relying on METRO service regularly. Highway 17 ridership sustained decreases of 85% below pre-pandemic levels throughout much of FY21 whereas student ridership at UCSC and Cabrillo decreased over 95% below pre-COVID levels.9 For 14 months of the pandemic, METRO enforced strict capacity limits on all buses to protect public and driver safety, and in addition to reduced demand and reduced service, contributed to steep declines in ridership. Another effect of COVID-19, with office workers being the ones most commonly working from home during the pandemic, is that there has been less of the traditional morning and afternoon peak ridership pattern, resulting in more even demand throughout the day.
Santa Cruz METRO conducts onboard surveys of its customers to gather information regarding travel patterns, customer demographics, and overall satisfaction among METRO riders. In 2013, METRO surveyed passengers asking questions about trip purpose. The most common reason reported was travel to or from work (39%), followed by travel to or from a college or university (24%), personal business (16%), shopping (11%), K-12 schools (8%), recreation/social (6%), medical (5%), and trips to or from an airport (0.5%). Responses for “other” accounted for 5% of the total. In 2019, METRO conducted another onboard passenger survey, excluding routes that serve UCSC. The 2019 survey results found that if METRO services were not available, 17% of riders would have no other means of making their trip, and 59% of riders would have made an extra automobile trip (drive alone, get driven, or taxi/Lyft/Uber). For occasions when riders choose not to use METRO, the top reasons given were: too difficult to plan around the bus schedule (23%), bus takes too long (22%) and bus does not run often enough (20%).
Santa Cruz METRO also operates paratransit service (METRO ParaCruz) for people that are unable to use the fixed route bus system due to disabilities. This service is consistent with the Americans with Disabilities Act of 1990 (ADA). ParaCruz serves destinations within Santa Cruz County that are within three-quarter (¾) mile of a fixed bus route. Prior to 2016 service reductions, ParaCruz provided greater than 90,000 rides per year and currently provides on average about 75,000 rides per year. ParaCruz fulfills riders’ needs to get to and from work, as well as bringing them to medical appointments, grocery shopping and social events.

Tr a vel P a t ter n s | CH A P T ER 3
2 0 4 5 R E G I O N A L T R A N S P O R T A T I O N P L A N 3-13
Figure 3.14 – Total Transit Ridership for Santa Cruz County Fixed Route Service Source: Santa Cruz Metropolitan Transit District. Note: Levels dropped in FY05/06 as no service was provided in October 2005 due to a labor strike. COVID-19 measures began in March 2020, affecting FY19/20 and FY20/21.
How Much Are We Traveling?
The California Household Travel Survey collected in 2010-2012 estimated that on average each person in California takes 3.6 trips per day.10 The purpose of these trips is primarily to go to work, school, shop, and socialize/recreate. According to the five-year summary of the American Communities Survey from 2015-2019, the average travel time for traveling to work in Santa Cruz County was 27.7 minutes.11 This time is a 6.5% increase in travel time to work compared to data collected in 2011-2015. Potential reasons for the increase in average travel time to work include more people traveling during peak periods, congestion, and workers living farther from where they work.
Vehicle Miles Traveled
A common measurement for how much travel is occurring in a region is the number of “vehicle miles traveled” (VMT). One vehicle (regardless of the number of passengers) traveling one mile constitutes one “vehicle mile”. Vehicle miles traveled can be estimated on a daily per capita basis or daily for the whole region. The number of vehicle miles traveled is used in calculating greenhouse gas emissions (GHG) from transportation.
Senate Bill 375 (SB 375) requirements for the AMBAG region, require GHG per capita to be reduced by a minimum of 1% by 2020 and 6% by 2035 relative to 2005 levels. Both the 2045 RTP and the 2045 Metropolitan Transportation Plan – Sustainable Communities Strategy emphasize prioritizing projects that reduce GHG emissions primarily through a reduction in VMT. The AMBAG regional travel demand model estimates the amount of VMT based on population and traffic counts throughout the region. See Chapter 7 for a more detailed discussion on historical and projected vehicle miles traveled for Santa Cruz County.
Visitors
5.61 5.79 6.03 5.75 5.785.37 5.53 5.51 5.65 5.5
5.09 5.05 5.05
3.54
0.91
0
1
2
3
4
5
6A
nnua
l Bus
Rid
ersh
ip (i
n m
illio
ns)
Fiscal Year

C H AP T E R 3 | Tr av el Pa t ter n s
3-14 S A N T A C R U Z C O U N T Y R E G I O N A L T R A N S P O R T A T I O N C O M M I S S I O N
Santa Cruz County is a popular tourist destination that attracts many visitors to its scenic beaches, many county and state parks, and popular events such as the Santa Cruz County Fair, Capitola Art and Wine Festival, Wharf to Wharf running race, and Watsonville’s Airshow. The number of tourists to Santa Cruz County, especially in the summer and on weekends, contributes significantly to the number of cars on our roadways. The Santa Cruz Conference and Visitors Council estimates that there are approximately 3 million tourists per year to Santa Cruz County. The Boardwalk in the City of Santa Cruz attracts a large percentage of these visitors. The University of California Santa Cruz, with a population of approximately 18,000 students, also brings numerous visitors especially during spring graduation and when the new school year begins in the fall. Daily traffic volumes on Highway 17 during summer weekends are typically higher than weekday traffic. Highway 1 traffic volumes on summer weekends are similar volumes to typical weekday traffic.
Goods Movement
Another source of traffic on our roadways comes from goods movement. Nearly all commodities sold in stores or used in local manufacturing in Santa Cruz County arrive on roads by truck. Similarly, most products that are produced in Santa Cruz County are shipped out by truck. The 2020 Crop Report for Santa Cruz County shows that the agricultural gross regional product was $636 million, with steady growth through the late 2010s.12 When looking at freight volumes, sand and gravel products are the largest commodity group in the county at 35% of the total, or 9.2 million tons. Agricultural goods are the second largest commodity by volume, estimated at
2.5 million tons in 2012.13 Trucks are the preferred mode for time-sensitive agricultural products,
including fresh produce and other agricultural commodities.14 There are many refrigeration (coolers) and packing facilities for agricultural products located in and around Watsonville, contributing to increased freight traffic for farm products. Granite Rock operates a quarry in Santa Cruz and ships large quantities of sand by truck. Timber harvest volume in 2016 was 11.2 million board feet in Santa Cruz County and accounted for less than 1% of California’s total timber harvest.15 The majority (59%) of the commodities based on weight flow outbound from Santa Cruz County, with internal flows at 1.5% and shipments inbound to Santa Cruz County from other counties at 39.5%.16
U.S. Highway 101 is the primary truck route for the Central Coast region. The key routes that connect Santa Cruz County with the rest of the Central Coast region’s freight network are Highways 1, 17, and 129. Truck volume also contributes to congestion in the region. Figure 3.15 lists the annual average daily truck volumes on highways in Santa Cruz County. Truck traffic accounts for nearly 12% of overall daily
Santa Cruz Beach Boardwalk
Strawberries and other berries are the top crops grown in Santa Cruz County.

Tr a vel P a t ter n s | CH A P T ER 3
2 0 4 5 R E G I O N A L T R A N S P O R T A T I O N P L A N 3-15
traffic on Highway 129. In comparison, truck traffic on Highways 1, 17, and 152 range from 3 to 7% of overall vehicular traffic. Truck volumes on all the state highways have been increasing over the last decade. The demand for more goods into our county will likely increase as population continues to grow. Even small numbers of trucks relative to overall traffic can create traffic jams on some roads, especially in mountainous areas where there are greater differences in speed between trucks and cars.
Santa Cruz County Highway
2015 Daily Truck
Volume*
2016 Daily Truck
Volume*
2017 Daily Truck
Volume*
2018 Daily Truck
Volume*
2019 Daily Truck
Volume*
2020 Daily Truck
Volume*
% of Total
Traffic Volume
Highway 1 3760 4700 5814 6120 5604 5220 6.0% Highway 9 1820 1820 1841 1939 1722 1785 7.0% Highway 17 2100 2100 2301 2376 2142 1650 3.0% Highway 129 2478 2478 2159 2301 2537 2537 11.8% Highway 152 935 935 910 956 1085 910 3.5%
Figure 3.15 - Annual Average Daily Truck Volumes on Highways in Santa Cruz County Notes: Truck volumes are from locations with highest counts on each highway; Source: Caltrans Traffic Data Branch
Since more than 75% of goods shipped into and out of the Santa Cruz County are transported by truck, congestion is a key challenge for freight-dependent industries. It is important that these industries are able to thrive in the region as they are critical in terms of jobs and contribution to the regional economy. Local and regional governments can continue to help the goods movement industries thrive by supporting freight and transportation projects that improve the efficiency of goods movement to major destinations and intermodal facilities. This includes maintenance of key roadways, improved travel time reliability on highways and arterials, improving safety on key routes and increasing options for shipping freight by rail.
The Santa Cruz Branch Rail Line is also used for freight service. Commodities shipped by rail in 2012 accounted for about 4.9% of the County’s freight by weight and 2.4% by value.17 Prior to the closure of the Cemex cement plant in 2009, cement and coal were shipped by rail to and from the cement plant in Davenport each year. Currently, the rail line is used for freight service from Watsonville south connecting to the Union Pacific main line in Pajaro. Upward pricing pressure on the trucking industry due to rising fuel costs, congestion, additional wear and tear on roads caused by trucks, as well as safety and environmental concerns, have prompted the region’s freight and transportation stakeholders to look for alternatives for transporting goods. The rail system is one of the main options available. The 2018 California State Rail Plan and the 2020 California Freight Mobility Plan stress the importance of short line railroads, including the Santa Cruz Branch Rail Line, Santa Maria-Valley Rail, and Monterey Bay Rail Line, and the potential for rail freight to integrate with other freight modes and with passenger rail, lowering energy use and pollution, maintaining global competitiveness, and aiding in developing livable and vibrant communities.

C H AP T E R 3 | Tr av el Pa t ter n s
3-16 S A N T A C R U Z C O U N T Y R E G I O N A L T R A N S P O R T A T I O N C O M M I S S I O N
Prioritizing traffic flow improvement projects on Highways 1, 17 and 129, the main routes that connect to Highway 101, as well as freight rail service that connects to the rest of California and beyond will provide the greatest benefit to goods movement in Santa Cruz County. Air freight in 2012 accounted for negligible tonnage, but 3% of freight value in Santa Cruz County, since this mode tends to reflect the time-sensitive or higher value, but lower weight shipments made by air.19 One example is the flower industry that often ships via air cargo due to time-sensitivity. The Watsonville Airport serves many growers; however, the primary cargo airports for Santa Cruz County are located in Monterey, San Jose and San Francisco.
AMBAG completed the U.S. 101 Central Coast California Freight study in 2016 to identify short-term and long-term strategies to improve freight mobility and transportation operations along the U.S. 101 corridor from San Benito County through Santa Barbara County. The U.S. 101 corridor supports the economic vitality of the Central Coast area as a major goods movement corridor. The report recommends upgrading the rail on the Santa Cruz Branch Line to Federal Rail Administration Class 2 rail, allowing freight train speeds of up to 25 mph on sections in Santa Cruz County in order to improve freight connectivity to other regions in California and nationwide.20
How Are We Getting Around?
The California Household Travel Survey (CHTS) that was conducted between 2010 to 2012 indicates that the mode share for transit, bike and walk trips throughout California approximately doubled from survey results taken in 2000, with a decline of automobile trips by 10% (Figure 3.16). In 2010-2012, automobile trips accounted for 77% of all trips throughout California, while 18% of all trips were non-motorized and 4% of reported trips were made by public transit. The mode share for all trips in Santa Cruz County collected by the 2010-2012 CHTS is presented in Figure 3.17. Compared to statewide data, Santa Cruz County has a higher percentage of bicycle mode share and falls below the State average for walk and transit mode share. National studies show that nearly 70% of the millennial population (ages 22-38) uses multiple travel options several times or more per week.21 This flexible concept of mobility, combined with a well-designed multi-modal transportation network, could set a new direction for transportation.
Mode 2000 Mode Share
2010-2012 Mode Share
Auto 86.7% 76.9%
Transit 2.2% 4.4%
Walk 8.4% 16.6%
Bike 0.8% 1.5%
Figure 3.16 – Mode Share for All Trips in California Source: California Household Travel Survey
Freight rail on the tracks outside Watsonville. Photo credit: Howard Cohen

Tr a vel P a t ter n s | CH A P T ER 3
2 0 4 5 R E G I O N A L T R A N S P O R T A T I O N P L A N 3-17
While the mode split data in Figure 3.17 are representative of all trips, the American Community Survey (ACS) provides a comparison of the ways Santa Cruz County residents get to work (Figure 3.18). The total number of workers for the 2015-2019 estimate was 132,921, as compared to 128,145 in 2011-2015. The convenience of driving alone still attracts most people and the percentage of people driving alone to work has not changed significantly since 2000 (Figure 3.18). The chance to get some exercise, be productive while carpooling or taking transit, concerns about the environment and/or the opportunity to save some money are all reasons to consider alternatives to driving alone. There has been a slight increase in the number of people walking to work and
working from home but the number of people biking to work in Santa Cruz County has declined since the high in 2011-2015. The difference between reported results for travel by mode for all trips in Santa Cruz County and only work trips in Santa Cruz County may be explained by an increase in active transportation trips for non-work purposes such as shopping, social, and recreation trips. Non-work trips may be shorter and more readily amenable to a shift from auto to biking and walking. Higher gasoline prices, a weak economy and changing generational preferences may also result in less driving, according to a 2013 study by the U.S. Public Interest Research Group and Frontier Group.22
Figure 3.18 – Mode Share for Work Trips in Santa Cruz County Source: U.S. Census Bureau, American Community Survey
0
10
20
30
40
50
60
70
80
Drive alone Carpool PublicTransit
Bike Walk Other Work atHome
% T
rip
Mod
e Sh
are
2000 2011-2015 2015-2019
Figure 3.17 – Mode Share for All Trips in Santa Cruz County Source: 2010-2012 California Household Travel Survey
Shared Ride
42.7%
Drive Alone41.8%
Walk10.2%
Transit2.8%
Bike2.5%

C H AP T E R 3 | Tr av el Pa t ter n s
3-18 S A N T A C R U Z C O U N T Y R E G I O N A L T R A N S P O R T A T I O N C O M M I S S I O N
The 2015-2019 American Community Survey (5-year estimate) indicates that there is a significant difference between the way residents of the four cities in Santa Cruz County travel to work (). Watsonville residents used carpooling more often (14%) compared to the other cities (9% average) as an alternative to driving alone. City of Santa Cruz residents on average walk, bike, and take transit more often for work. City of Santa Cruz has the least number of drive alone trips (59%) likely due to the land use that includes proximity of jobs to housing, high bus ridership by UCSC students, lower-speed streets, and more of a connective street grid pattern. Capitola, Scotts Valley, and the unincorporated areas have the greatest number of residents working from home but also the greatest percentage of drive alone trips. This mode share data shows people’s travel preferences are influenced by the type of land use and transportation facilities that are available in their community. This information is valuable for assessing how the number of drive-alone trips could be further reduced in each area.
Figure 3.19 - Mode Share for Work Trips by City of Residence Source: 2015-2019 American Community Survey. *High margin of error for smallest cities
Bicycle Use
The RTC and Community Traffic Safety Coalition (CTSC) periodically conducts bike and pedestrian observation surveys to help identify behavior trends among cyclists, pedestrians, and motorists alike. Figure 3.20 shows countywide bicycle counts from observation surveys conducted at nearly 30 intersections throughout the county during peak travel periods on weekday afternoons between 2003 and 2021. Not all locations are counted each collection year, and one-day counts can be affected by weather or other fluctuations. Survey results show the greatest number of bicyclists in the City of Santa Cruz and mid-County. The data also show a decrease in bicycle ridership in Santa Cruz County since 2012. The
0%
10%
20%
30%
40%
50%
60%
70%
80%
90%
100%
EntireCounty
Capitola* Watsonville ScottsValley*
SantaCruz
Unincorp.County
Drove alone Carpool Public Transit Bike Walked Other Worked at Home

Tr a vel P a t ter n s | CH A P T ER 3
2 0 4 5 R E G I O N A L T R A N S P O R T A T I O N P L A N 3-19
survey results do not take into account locations near recently built or improved paved bike/ped facilities such as the Coastal Rail Trail and the Riverwalk and current bicycle ridership may be somewhat higher than indicated.
Figure 3.20 – Countywide Bicycle Counts from 2003-2021 Note: Counts were taken for 2 hours at all locations. Source: Data collected by Community Traffic Safety Coalition and RTC
School Trips
Due to safety concerns and urban sprawl, most parents drive their children to school. According to the Surface Transportation Policy Project, two-thirds of the country’s children walked or biked to school 30 years ago; now, less than 10% do so. This phenomenon has led to a sharp increase in short-distance trips made by car, evidenced by the traffic surrounding elementary and secondary schools at the beginning and end of the school day. By some estimates, 20 to 25% of rush-hour traffic on local roads and streets can be attributed to school commutes. Travel to the University of California and community college campuses also impact peak period traffic. UCSC and Cabrillo College students receive free METRO bus passes to reduce congestion, emissions, and demand for parking spaces.
Less Trips
Not only are people changing how they get around, but there are also a number of reasons why people are traveling less altogether. Technological advances, including remote connectivity, wireless networks, smart phones, and video conferencing have made it possible for individuals to work in locations other than traditional worksites. The American Communities Survey from 2015-2019 estimated that 7.8% of
0
20
40
60
80
100
120
140
160
2003 2006 2008 2010 2012 2014 2016 2018 2021
Ave
rage
Bic
ycle
Cou
nt p
er
Inte
rsec
tion
City of Santa Cruz Scotts Valley & Felton Mid-County Watsonville area
Students crossing the street at Bay View Elementary in Santa Cruz. Photo credit: Shmuel Thaler, Santa Cruz Sentinel

C H AP T E R 3 | Tr av el Pa t ter n s
3-20 S A N T A C R U Z C O U N T Y R E G I O N A L T R A N S P O R T A T I O N C O M M I S S I O N
employees residing in Santa Cruz County work at home, most or all of the time, up from 7.3% in 2011-2015 (Figure 3.18). While exact numbers are not yet available, the COVID-19 pandemic caused a major change in commute patterns, with most office workers working from home well into 2021. Avoiding traffic congestion, gas prices, and/or environmental concerns can be motivators to decide to travel closer to home or plan ahead by linking multiple trips together into one trip.
Transportation Equity
Investments in transportation determine the choices that are available for how we travel. Low-income people, people with disabilities, seniors, youth and minorities can often be disproportionately limited by the transportation choices available to them. The cost of car ownership or inability to drive, underinvestment in public transportation, and a lack of pedestrian and bicycle-accessible thoroughfares can isolate transportation disadvantaged people from jobs, services and medical care.
There are a number of ways to ascertain populations that are transportation disadvantaged. Figure 3.21 shows the areas in Santa Cruz County with the greatest populations of transportation disadvantaged people due to race and income. Figure 3.22 shows the areas of the county that have low community engagement due to a large population of the households where English is not spoken “very well” and a large population that is over 25 without a high school diploma. Figure 3.23 shows the areas of the county that have low mobility due to either a large population of people who are over 65 and have an income below poverty level, a large population of households who do not own a vehicle, or a large population of people who are disabled. All these areas meet the regional definition of Disadvantaged Community (or DAC) for Santa Cruz County and are consistent with the Environmental Justice communities identified by AMBAG in the 2045 MTP-SCS. Figure 3.24 shows the distribution of youth and senior populations in Santa Cruz County. Nearly one-third of Santa Cruz County residents—notably children, the elderly and disabled, and low-income individuals and families who cannot afford a car—do not drive a personal vehicle (Figure 3.25). For people who do not drive a personal vehicle, access to convenient transit service and safe routes to walk or ride a bike are a lifeline.

Tr a vel P a t ter n s | CH A P T ER 3
2 0 4 5 R E G I O N A L T R A N S P O R T A T I O N P L A N 3-21
Figure 3.21 – Minority, Low Income and Poverty Areas in Santa Cruz County Note: Minority areas are defined as census tracts where greater than 65% of the total population is non-white. Low-income areas are defined as census tracts where greater than 33% of residing families earn less than 200% of the 2015 federal poverty level. Poverty areas are defined as census tracts where greater than 25% of households earned less than the 2015 federal poverty level. Source: U.S. Census Bureau, AMBAG

C H AP T E R 3 | Tr av el Pa t ter n s
3-22 S A N T A C R U Z C O U N T Y R E G I O N A L T R A N S P O R T A T I O N C O M M I S S I O N
Figure 3.22 - Communities with Low Community Engagement Note: Low Community Engagement areas defined as any Census tract in which 15 percent or less of the tract were households where English is not spoken “very well” and/or 15 percent or less of the tract is over the age of 25 without a high school diploma.
Source: U.S. Census Bureau, AMBAG

Tr a vel P a t ter n s | CH A P T ER 3
2 0 4 5 R E G I O N A L T R A N S P O R T A T I O N P L A N 3-23
Figure 3.23 - Communities with Low Mobility Note: Low Mobility areas are defined as any Census tract in which 5 percent or less of the households have zero-car ownership, more than 11.35 percent of the population had a disability, and/or 15 percent of the population aged 65 and over had income below the 2015 federal poverty level.
Source: U.S. Census Bureau, AMBAG

C H AP T E R 3 | Tr av el Pa t ter n s
3-24 S A N T A C R U Z C O U N T Y R E G I O N A L T R A N S P O R T A T I O N C O M M I S S I O N
Figure 3.24 – Distribution of Senior and Youth Populations in Santa Cruz County Source: U.S. Census Bureau, 2010 Census
● Senior (70 yrs+) ● Youth (0-17 yrs+) 1 dot = 35 people

Tr a vel P a t ter n s | CH A P T ER 3
2 0 4 5 R E G I O N A L T R A N S P O R T A T I O N P L A N 3-25
Figure 3.25 – Historical Trends in Licensed Drivers and Registered Vehicles in Santa Cruz County Source: Department of Motor Vehicles, U.S. Census, California Department of Finance
Variations in growth rates between age groups are distinct in Santa Cruz County. While the Association of Monterey Bay Area Governments (AMBAG) currently projects a total population increase of 9% between 2020 and 2045, there is a projected decrease in the population under 70, and those 70 and older are expected to grow by 90% through 2045 (Figure 3.26). Seniors age 70 and over make up about 11% of the population today and will make up about 20% of the population by 2045. This demographic shift will impact both the economy and the local transportation needs of our community.
Figure 3.26 – Population Projections for Seniors Age 70 and Over Source: AMBAG. Note: forecasting was performed prior to release of 2020 census data.
As a result of this projected growth in the senior population, Santa Cruz County could potentially experience a greater demand for mobility services for aging and disabled adults. Expecting to continue
0%
10%
20%
30%
40%
50%
60%
70%
80%
90%
100%
1980 1990 2000 2010 2015 2019
Perc
enta
ge o
f Pop
ulat
ion
Licensed Drivers Registered Vehicles
0
50,000
100,000
150,000
200,000
250,000
300,000
350,000
2010 2015 2020 2025 2030 2035 2040 2045
Sant
a C
ruz
Cou
nty
Popu
latio
n
Under 70 Population 70+ Population
90% projected growth

C H AP T E R 3 | Tr av el Pa t ter n s
3-26 S A N T A C R U Z C O U N T Y R E G I O N A L T R A N S P O R T A T I O N C O M M I S S I O N
driving well into their later years, many older adults will not anticipate life without a car. Furthermore, it has been well documented that many older adults will retire in or migrate to low density suburban areas, characterized by single family homes, that are poorly served by public transit or lack adequate pedestrian facilities. Older adults no longer able to drive could face severe mobility deficiencies such as isolation, lack of access to social or medical needs, and increased risk of accidents. Survey results taken at five senior dining centers in Santa Cruz County indicate that the majority of respondents (43%) drive themselves as their primary form of transportation.23 Next to driving, the most common means of transportation is bus use at 16 percent, followed by getting a ride with friends/family and walking. While the automobile was the most common means of transportation among respondents, approximately 41 percent of respondents reported using the bus at least once in the past month.
According to the American Community Survey 2015-2019 5-year summary, 12% of the total population in Santa Cruz County has one or more disabilities. The number of seniors age 70 or greater residing in the county is expected to grow significantly by 2045 as the “Baby Boomer” population ages and seniors are living longer (Figure 3.26). This projected increase in the senior population could increase the number of individuals with disabilities in Santa Cruz County.
Providing for the needs of transportation disadvantaged individuals due to age, income, race, disability or limited English proficiency is a crucial part of the 2045 RTP. According to the Surface Transportation Policy Project’s Beyond Gridlock report (2000), unless we provide more alternative transportation facilities and services, “the next generations of California parents may well see their time spent behind the wheel continue to rise as they play chauffeur to both their kids and their own parents.”

Tr a vel P a t ter n s | CH A P T ER 3
2 0 4 5 R E G I O N A L T R A N S P O R T A T I O N P L A N 3-27
Notes for Chapter 3
1 State of California, Department of Finance, “E-1 City/County Population Estimates with Annual Percent Change January 1, 2020 and 2021,” Sacramento, California (May 2021), http://www.dof.ca.gov/Forecasting/Demographics/Estimates/E-1/.
2 “Santa Cruz County 2021 State of the Workforce,” Santa Cruz County Workforce Development Board (June 2021), https://www.santacruzhumanservices.org/Portals/0/wib/reports/2021%20SCSOW%20Report%20FINAL.pdf
3 “Unemployment Rates (Labor Force),” State of California, Employment Development Department, accessed August 2021, https://www.labormarketinfo.edd.ca.gov/cgi/dataanalysis/AreaSelection.asp?tableName=labforce
4 “OnTheMap, Area Profile Analysis in 2018 by All Jobs” U.S. Census Bureau, Center for Economic Studies, accessed September 2021, http://onthemap.ces.census.gov.
5 “Summary of Travel Trends, 2017 National Household Travel Survey,” U.S. Department of Transportation, Federal Highway Administration (July 2018), https://nhts.ornl.gov/assets/2017_nhts_summary_travel_trends.pdf.
6 “Google COVID-19 Community Mobility Reports,” Google LLC, accessed October 2021, https://www.google.com/covid19/mobility/
7 California Department of Transportation, Highway Performance Monitoring System, “2019 California Public Roads Data”, http://dot.ca.gov/hq/tsip/hpms/datalibrary.php
8 “How COVID-19 Pandemic Impacted Freeway Utilization, Performance, and the FSP program,” Institute of Transportation Studies, UC Berkeley. (October 2021)
9 “FY 21 Annual Status Report,” Santa Cruz METRO. (September 2021). https://www.scmtd.com/images/department/planning/092421_Planning_and_Development_Annual_Report_SR__db_edits_9.16.21_002.pdf
10 NuStats Research Solutions, “2010-2012 California Household Travel Survey Final Report, Version 1.0,” California Department of Transportation (2013), http://www.dot.ca.gov/hq/tsip/otfa/tab/documents/chts_finalreport/FinalReport.pdf.
11 “American Community Survey 2015-2019,” U.S. Census, http://www.census.gov/acs.
12 “Santa Cruz County 2020 Crop Report,” County of Santa Cruz, Office of the Agricultural Commissioner, http://www.agdept.com/Portals/10/pdf/2020%20Santa%20Cruz%20County%20Crop%20Report.pdf?ver=GCYvYpkg881IXnGyFcj6RA%3D%3D×tamp=1633121965062
13 “US 101 Central Coast California Freight Study Final Report”, Association of Monterey Bay Area Governments (2016). https://ambag.org/sites/default/files/2019-12/1_Finished_Final_AMBAG_US101CCCFrtStudy_FinalReportCombined_REV.pdf
14 Cambridge Systematics, “Central Coast California Commercial Flows Study,” Association of Monterey Bay Area Governments (2012).

C H AP T E R 3 | Tr av el Pa t ter n s
3-28 S A N T A C R U Z C O U N T Y R E G I O N A L T R A N S P O R T A T I O N C O M M I S S I O N
15 “California’s Forest Products Industry and Timber Harvest, 2016” United States Department of Agriculture. (2016). https://www.fs.fed.us/pnw/pubs/pnw_gtr994.pdf
16 See note 13 above.
17 See note 13 above
19 See note 13 above.
20 See note 13 above
21 “Millennials and Mobility: Understanding the Millennial Mindset,” American Public Transportation Association (2013), http://www.apta.com/resources/reportsandpublications/Documents/APTA-Millennials-and-Mobility.pdf.
22 Tony Dutzik and Phineas Baxandall, “A New Direction: Our Changing Relationship with Driving and the Implications for America’s Future,” U.S. PIRG Education Fund, and Frontier Group (Spring 2013), http://www.uspirg.org/sites/pirg/files/reports/A%20New%20Direction%20vUS.pdf.
23 Karena Pushnik and David Pape, “A Bus Use Survey of Aging and Disabled Adults Living in Santa Cruz County,” Santa Cruz County Regional Transportation Commission (January 2013).

2 0 4 5 R E G I O N A L T R A N S P O R T A T I O N P L A N 4-1
CHAPTER
4 Vision for 2045
Goals and Policies
The Santa Cruz County Regional Transportation Plan (2045 RTP), through its goals and policies, sets forth a foundation for expanding options for residents and visitors to access their daily needs in a way that is safe, equitable, protects the environment and promotes investment in the local economy. This is advanced by designing and implementing a transportation system that serves our diverse travel needs and embraces the principle that transportation is intertwined with environmental, economic and social concerns.
As discussed in Chapter 1, driven by financial limitations, environmental concern, and demographic trends, the RTC voluntarily has adopted a sustainability framework for the RTP that is based on the triple bottom line definition of sustainability. The triple bottom line concept of sustainability can be seen in every aspect of the 2045 Regional Transportation Plan starting with the goals (Figure 4.1) and policies (Figure 4.2). Systematically integrating sustainable principles into the 2045 RTP allows the RTC and the public to evaluate how well the long-term plan upholds and maintains progress towards generating safe, equitable, and cost-effective access to daily needs, while at the same time generating economic benefits and protecting the environment.
Why Do Policies Matter?
Success in advancing goals relies upon policies that provide direction to the public and decision makers about what course of action will be required to realize the greatest benefit by 2045. The policies established for the 2045 RTP support outcomes, rather than specific projects or modes. The policies (Figure 4.2) are designed to focus future investments on the best-performing strategies which generate the desired results and work within financial constraints. They are broad enough to adapt to changing conditions and take advantage of new opportunities and are not too specific to confine investments to one project or project type.
The 2045 RTP focuses on maximizing benefits to people, the planet, and prosperity.

C H AP T E R 4 | Vi sion f or 2 04 5
4-2 S A N T A C R U Z C O U N T Y R E G I O N A L T R A N S P O R T A T I O N C O M M I S S I O N
Sustainable Transporation Analysis Rating System
The RTC utilizes a rating system called the Sustainable Transportation Analysis Rating System (STARS) to support development of the RTP. Developed by the North American Sustainable Transportation Council (STC), the STARS framework provides an integrated set of sustainability performance measures and serves as a model for the RTC to better align RTP policies with desired community outcomes. A key component of the STARS system is identifying primary performance measures that achieve many sustainability objectives. These measures are referred to as “heavy-lifters” and often address multiple aspects of the Triple Bottom Line (people, planet, prosperity). The STARS framework for sustainability was first introduced in the 2014 RTP and subsequent 2040 RTP. The goals, policies and targets included in the 2045 Regional Transportation Plan are based on the 2040 RTP and have been updated based on new information. These goals and polices identified in the following sections are consistent with state and federal transportation planning policies, guidelines, and requirements including the SB 375-required Sustainable Communities Strategy, Complete Streets, and Smart Mobility Framework developed by Caltrans.
Goal #1
Establish livable communities that improve people’s access to jobs, schools, recreation, healthy lifestyles, and other regular needs in ways that improve health, reduce pollution, and retain money in the local economy.
There is a strong relationship between meeting targets and achieving access, health, economic benefit, and climate and energy goals. For example, providing more carpool, transit, and bicycle trips reduce fuel consumption, retains money in the local economy, and reduces congestion.
Goal #2
Reduce transportation related fatalities and injuries for all transportation modes.
Safety is a fundamental outcome from transportation investments and operations. Across the United States, pedestrians and bicyclists (vulnerable users) are killed and injured at a significantly higher rate than the percentage of trips they take.
Goal #3
Deliver access and safety improvements cost effectively, within available revenues, equitably and responsive to the needs of all users of the transportation system, and beneficially for the natural environment.
The manner in which access and safety outcomes referenced in Goal #1 and Goal #2 are delivered can impact cost-effectiveness, distribution of benefits amongst population groups, and ecological function.
Figure 4.1 – Goals of the 2045 Regional Transportation Plan Source: Santa Cruz County Regional Transportation Commission

Visi on for 20 4 5 | C H A P T ER 4
2 0 4 5 R E G I O N A L T R A N S P O R T A T I O N P L A N 4-3
2045 RTP Policies
Outcomes Advanced
People Prosperity Planet
Acce
ss &
M
obili
ty
Hea
lth
Safe
ty
Equi
ty
Econ
omic
Be
nefit
Cost
Ef
fect
iven
ess
Clim
ate
&
Ener
gy
Ecol
ogic
al
Func
tion
Transportation System Management: Implement Transportation System Management (TSM) programs and projects on major roadways across Santa Cruz County that increase the efficiency of the existing transportation system.
Transportation Demand Management: Expand demand management programs that decrease the number of vehicle miles traveled and result in mode shift.
Transportation Infrastructure:
Improve multimodal access to and within key destinations for all ages and abilities.
Ensure network connectivity by closing gaps in the bicycle, pedestrian, and transit networks.
Develop dedicated transit facilities that will improve transit access and travel time and promote smart growth and transit oriented development.
Land Use: Support land use decisions that locate new facilities close to existing services, particularly those that service transportation disadvantaged populations.
Goods Movement: Enhance the local economy through improving freight mobility, reliability, efficiency, and competitiveness.
Safety:
Prioritize funding for safety projects and programs that will reduce fatal or injury collisions.
Encourage projects that improve safety for youth, vulnerable users, and transportation disadvantaged.
Emergency Services: Support projects that provide access to emergency services.
System Design: Reduce the potential for conflict between bicyclists, pedestrians, and vehicles.

C H AP T E R 4 | Vi sion f or 2 04 5
4-4 S A N T A C R U Z C O U N T Y R E G I O N A L T R A N S P O R T A T I O N C O M M I S S I O N
2045 RTP Policies
Outcomes Advanced
People Prosperity Planet
Acce
ss &
M
obili
ty
Hea
lth
Safe
ty
Equi
ty
Econ
omic
Be
nefit
Cost
Ef
fect
iven
ess
Clim
ate
&
Ener
gy
Ecol
ogic
al
Func
tion
Security: Incorporate transportation system security and emergency preparedness into transportation planning and project/program implementation.
Cost Effectiveness & System Maintenance: Maintain and operate the existing transportation system cost-effectively and in a manner that adapts the current transportation system to maximize existing investments.
Coordination: Improve coordination between agencies in a manner that improves efficiencies, and reduces duplication (e.g., paratransit and transit; road repairs; signal synchronization; TDM programs).
System Financing: Support new or increased taxes and fees that reflect the cost to operate and maintain the transportation system.
Equity: Demonstrate that planned investments will reduce disparities in safety and access for transportation disadvantaged populations.
Ecological Function: Deliver transportation investments in a way that increases tree canopy, where appropriate, improves habitat and water quality and enhances sensitive areas.
Climate Resiliency: Adapt the transportation system to reduce impacts from climate change.
Public Engagement: Solicit broad public input on all aspects of regional and local transportation plans, projects, and funding actions.
Figure 4.2 – Policies of the 2045 Regional Transportation Plan and Outcomes they Advance Source: Santa Cruz County Regional Transportation Commission
Key Considerations
Senate Bill 375

Visi on for 20 4 5 | C H A P T ER 4
2 0 4 5 R E G I O N A L T R A N S P O R T A T I O N P L A N 4-5
One of the key considerations in developing the 2045 RTP goals, policies and targets was to address greenhouse gas emissions. The California Sustainable Communities and Climate Protection Act of 2008 (SB 375) requires each of the state’s 18 metropolitan areas to reduce per capita greenhouse gas emissions from cars and light trucks. AMBAG is responsible for developing a Sustainable Communities Strategy (SCS) as part of the Metropolitan Transportation Plan (MTP) that coordinates land use and transportation planning to reach the greenhouse gas (GHG) reduction target established for the tri-county region. The goals, policies and targets that were developed for the 2045 Santa Cruz County Regional Transportation Plan strive to reduce GHG emissions from transportation and are consistent with the 2045 MTP-SCS and goals of Senate Bill 375.
Senate Bill 32
The California Global Warming Solutions Act of 2016, or Senate Bill 32, expands upon Assembly Bill 32 to reduce greenhouse gas emissions. SB 32 requires California to reduce greenhouse gas emissions statewide to 40% below the 1990 levels by 2030. The achievement of these targets requires emissions reductions across all sectors of the economy at the state and local levels. The percent reduction from the transportation sector can come from a reduction in vehicle miles traveled as well as improvements in vehicle technology including electric and hybrid vehicles and improvements in fuel standards that reduce carbon levels in fuel.
Senate Bill 391
Senate Bill 391 (2009) required the California Department of Transportation to develop a California Transportation Plan (CTP) to demonstrate how California can reduce transportation sector greenhouse gas emissions to 80 percent below 1990 levels by 2050. The CTP is updated every 5 years and the current plan, CTP 2050, identifies the statewide integrated transportation system needed to achieve GHG reductions and demonstrates how major metropolitan areas, rural areas, and state agencies can coordinate planning efforts to achieve critical statewide goals. The 2045 Regional Transportation Plan is consistent with the California Transportation Plan 2050.
In addition to SB 391, notable California climate legislation includes Executive Order (EO) B-55-18 requiring carbon-neutrality by 2045, SB 100 requiring 100 percent clean energy by 2045, EO N-19-19 requiring California to redouble efforts to reduce GHG emissions, and EO N-79-20 requiring new auto sales to be 100% zero-emission vehicles (ZEV) by 2035.1
National Transportation Performance Measures
In 2012, the national transportation reauthorization bill, Moving Ahead for Progress in the 21st Century (MAP-21) was signed into law. MAP-21 requires the Federal Highway Administration (FHWA) to establish transportation performance measures that make progress toward the following national goals:
• Safety—to achieve a significant reduction in traffic fatalities and serious injuries on all public roads.
• Infrastructure condition—to maintain the highway infrastructure asset system in a state of good repair.

C H AP T E R 4 | Vi sion f or 2 04 5
4-6 S A N T A C R U Z C O U N T Y R E G I O N A L T R A N S P O R T A T I O N C O M M I S S I O N
• Congestion reduction—to achieve a significant reduction in congestion on the National Highway System (NHS).
• System reliability—to improve the efficiency of the surface transportation system.
• Freight movement and economic vitality—to improve the national freight network, strengthen the ability of rural communities to access national and international trade markets, and support regional economic development.
• Environmental sustainability—to enhance the performance of the transportation system while protecting and enhancing the natural environment.
• Reduced project delivery delays—to reduce project costs, promote jobs and the economy, and expedite the movement of people and goods by accelerating project completion through eliminating delays in the project development and delivery process, including reducing regulatory burdens and improving agencies' work practices.
MAP-21 also requires each State and Metropolitan Planning Organizations (MPO) to set performance targets for these measures. The 2015 Fixing America's Surface Transportation (FAST) Act, the successor federal act, continues MAP-21’s performance management approach, within which states invest resources in projects that collectively will make progress toward national goals. The goals, policies, targets, and project list established for the 2045 RTP are consistent with national performance measures.
Safety was the first national goal to go into effect under MAP-21 and includes five performance measures: number of fatalities, number of serious injuries, rate of fatalities per 100 million vehicle miles traveled, rate of serious injuries per 100 million vehicle miles traveled, and number of non-motorized fatalities and serious injuries. Caltrans coordinates with the Office of Traffic Safety to establish annual statewide performance management targets (SPMT).2 MPOs can decide to use the same safety targets as the state or establish their own. Additional performance measure targets that the State will be required to meet will be established in the near future.
The FAST Act requires that if the State has failed to meet (or to make significant progress toward meeting) its performance targets, the State must describe in its next performance report to FHWA the actions it will take to achieve these targets. State DOTs and MPOs will be expected to use the information and data generated as a result of the performance management regulations to inform their transportation planning and programming decisions.
Complete Streets
Complete streets planning is a key policy consideration in the 2045 Regional Transportation Plan. The California Complete Streets Act of 2008, and renewed in 2014, requires cities and counties to identify how the needs of all users of the transportation system will be accommodated in the circulation element of their general plan. This includes pedestrians, transit riders, bicyclists, and motorists, regardless of ages and abilities. Figure 4.3 illustrates this concept of complete streets for all users. Complete Streets are equitable, healthy, cost-effective, good for environment, and improve access to goods and services. Complete Streets principles are incorporated into the 2045 RTP.
The RTC, in collaboration with AMBAG, TAMC, and SBCOG, published a Monterey Bay Area Complete Streets Guidebook in 2013.3 The guidebook provides resources to local jurisdictions for developing streets

Visi on for 20 4 5 | C H A P T ER 4
2 0 4 5 R E G I O N A L T R A N S P O R T A T I O N P L A N 4-7
in the Monterey Bay Area that meet the needs of all users, including non-drivers of all ages and abilities, and help reduce greenhouse gas emissions by encouraging bicycle, pedestrian and transit usage. Items from the checklist that is included in the guidebook are integrated into RTC grant applications as a means to assist local agencies in integrating complete streets components into projects.
Figure 4.3 Complete Streets for All Users Complete Streets are designed and operated to enable safe use and support mobility for all users Source: Calbike.org
Threading complete streets throughout the goals and policies creates a shift in planning primarily for cars to increasing focus on the movement of people using all modes. One way of looking at it is: if people are the lifeblood of a community, then streets are its veins and arteries. From the complete streets perspective, streets not only serve the traditional role of connecting people to important destinations quickly, but they can serve as destination themselves, as places to walk with friends, ride a bicycle, view public art or enjoy social interactions.
Health and Assembly Bill 441
Health and health equity concerns have also been incorporated into the goals, policies and targets of the 2045 Regional Transportation Plan. Assembly Bill 441 (AB 441), championed by local Assemblyman Bill Monning and signed by Governor Brown in September 2012, acknowledges that California and the nation are facing unprecedented levels of chronic disease, which now accounts for approximately 73 percent of all deaths in California4 and 75 percent of all United States health care expenditures5.

C H AP T E R 4 | Vi sion f or 2 04 5
4-8 S A N T A C R U Z C O U N T Y R E G I O N A L T R A N S P O R T A T I O N C O M M I S S I O N
The health of California's population is largely determined by the environments in which people live. These environments, including the transportation infrastructure, shape the choices that people make every day. AB 441 requires the California Transportation Commission (CTC) to promote health and health equity as part of the Regional Transportation Plan guidelines. In the 2017 revision of the RTP guidelines, the CTC provided a summary of the policies, practices, or projects that have been employed by metropolitan planning organizations that promote health and health equity.
Social Equity and Environmental Justice
Social equity refers to the equitable distribution of impacts (benefits, disadvantages and costs) regardless of income status or race and ethnicity.6 Including a comprehensive range of community interests guides the RTP development process and is required by both federal regulation and state law. Providing more transportation and mobility choices such as increased transit, bicycle, and pedestrian facilities, benefits all segments of the population at all income levels. Title VI of the federal Civil Rights Act of 1964, Section 11135 of the California Government Code, and Executive Order 12898 on Environmental Justice require planning agencies to be sensitive to how all residents, particularly low-income communities and communities of color, may be impacted by possible transportation and land use changes identified in the RTP. Caltrans, as part of the CTP 2050 transportation plan, also includes a goal about social equity to “eliminate transportation burdens for low-income communities, communities of color, people with disabilities, and other disadvantaged groups.” Social equity factors considered in development of the 2045 RTP include transportation affordability and access to transportation.
Existing federal regulations require the RTC ensure that any planned regional transportation improvements do not have a disproportionate adverse impact on low income or other under-represented groups, and that low-income and minority populations receive equal benefits, on an equally timely basis, as other populations. The 2045 RTP has been developed to address the transportation needs of the entire community and attempts to ensure that no one community bears more of the benefits or burdens of transportation investments than any other. RTP sustainability policies and targets include specific measures focused on the needs of people who are “transportation disadvantaged”8 due to income, age, race, disability or of limited English proficiency. In accordance with Title 23 CFR Part 450.316(a)(1)(vii) the RTC has worked with the Association of Monterey Bay Area Governments (AMBAG) to develop a public participation plan9which describes explicit procedures, strategies, and desired outcomes for seeking out and considering the needs of those traditionally underserved by existing transportation systems, such as low-income and minority households, who may face challenges accessing employment and other services.
Targets
The Santa Cruz County Regional Transportation Plan identified measurable outcomes, called targets, for the first time in the 2014 RTP. Voluntarily establishing targets, each linked to a sustainability goal, utilizes performance-based planning to inform investment priorities to create the desired future. Striving to reach specific and measurable outcomes is consistent with the STARS recommended approach of backcasting.
Active transportation projects can improve public health through increased physical activity

Visi on for 20 4 5 | C H A P T ER 4
2 0 4 5 R E G I O N A L T R A N S P O R T A T I O N P L A N 4-9
Backcasting is a planning method that defines a desired future outcome, and then works back to identify policies that can be implemented in the present that will promote the defined outcome. Backcasting allows communities to collectively focus on what they want to see happen, then select, evaluate, and implement projects and programs that move the community toward these agreed upon outcomes.
Figure 4.4 – Backcasting Planning Process Backcasting is a planning method that starts with defining a desirable future and then works backwards to identify policies and programs that will connect that specified future to the present.
The targets have been updated for the 2045 RTP and are shown in Figure 4.3. The adopted targets are intended to be aggressive, but reasonably obtainable. Unlike more broadly scoped community plans, the adopted targets focus on areas that transportation policies can affect. The targets reflect community input received (Appendix A). They were carefully crafted to be consistent with state and federal goals, and to work with available data and travel demand model outputs.
The adopted goals, policies, and targets were used to prioritize projects for funding in the transportation investment program portion of the 2045 RTP. Incorporating targets into the goals and policies enables the Regional Transportation Commission to assess how well the long-range plan will perform over time. Details on monitoring performance of the transportation system in advancing the targets are discussed in Chapter 7 – System Performance. The complete list of goals, policies, and targets for the 2045 RTP can be found in Appendix C.

C H AP T E R 4 | Vi sion f or 2 04 5
4-10 S A N T A C R U Z C O U N T Y R E G I O N A L T R A N S P O R T A T I O N C O M M I S S I O N
2045 Sustainability Targets
Outcomes Advanced
People Prosperity Planet
Acce
ss &
M
obili
ty
Hea
lth
Safe
ty
Equi
ty
Econ
omic
Be
nefit
Co
st
Effe
ctiv
enes
s
Clim
ate
&
Ener
gy
Ecol
ogic
al
Func
tion
Goal #1: Establish livable communities that improve people's access to jobs, schools, recreation, healthy lifestyles, and other regular needs in ways that improve health, reduce pollution, and retain money in the local economy.
Target 1.A.1 – Increase the length of urban bikeway miles relative to total urban arterial and collector roadway miles to 85 percent by 2030 and to 100 percent by 2045.
Target 1.A.2 – Increase the transit vehicle revenue miles by 8 percent by 2030 and 20 percent by 2045 (compared to 2020).
Target 1.B.1 – Reduce per capita vehicle miles traveled by 4 percent by 2030 and by 10 percent by 2045 (compared to 2005).
Target 1.B.2 – Reduce per capita greenhouse gas emissions by 50 percent by 2030 and by 78 percent by 2045 and total greenhouse gas emissions from transportation by 40 percent by 2030 and 70 percent by 2045 (compared to 2005) through electric vehicle use, clean fuels, and other emerging technologies, reduction in vehicle miles traveled and improved speed consistency.
Target 1.B.3 – Re-invest in the local economy $8.5 million/year by 2030 and $14 million/year by 2045 (compared to 2005) from savings resulting from lower fuel consumption due to a reduction in vehicle miles traveled.
Target 1.C.1 – Improve percentage of reliable person miles traveled by 3 percent by 2030 and by 8 percent by 2045 (compared to 2020).
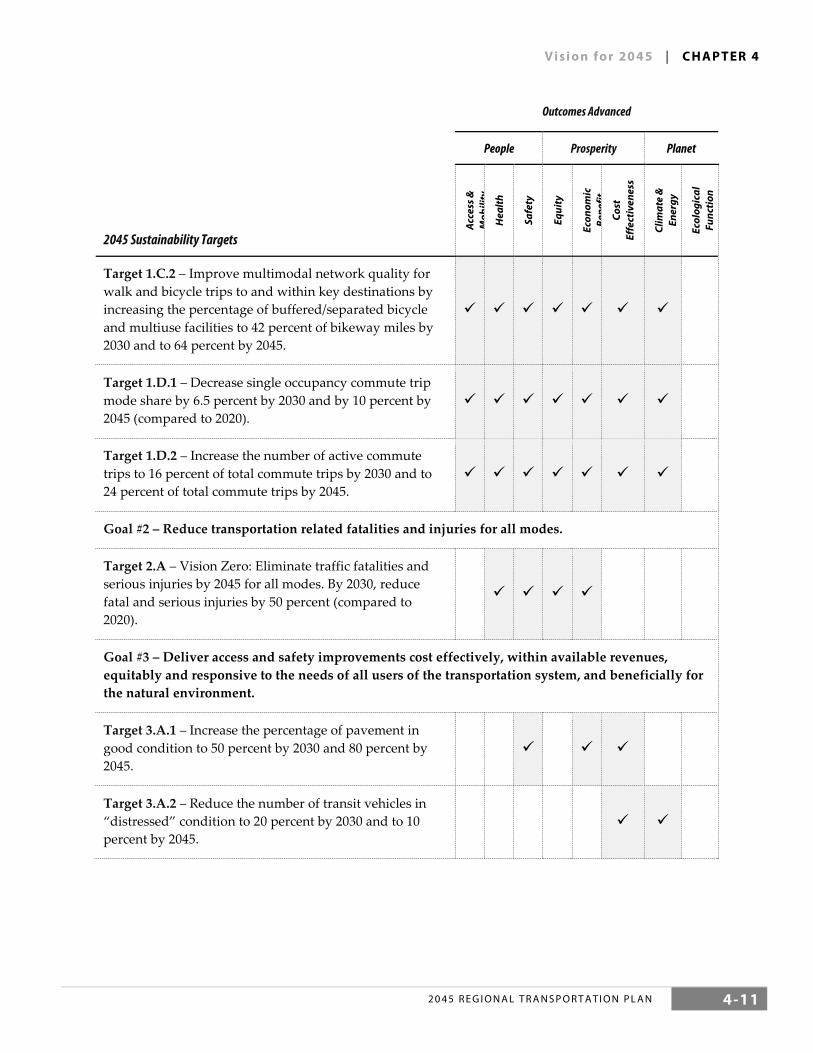
Visi on for 20 4 5 | C H A P T ER 4
2 0 4 5 R E G I O N A L T R A N S P O R T A T I O N P L A N 4-11
2045 Sustainability Targets
Outcomes Advanced
People Prosperity Planet
Acce
ss &
M
obili
ty
Hea
lth
Safe
ty
Equi
ty
Econ
omic
Be
nefit
Co
st
Effe
ctiv
enes
s
Clim
ate
&
Ener
gy
Ecol
ogic
al
Func
tion
Target 1.C.2 – Improve multimodal network quality for walk and bicycle trips to and within key destinations by increasing the percentage of buffered/separated bicycle and multiuse facilities to 42 percent of bikeway miles by 2030 and to 64 percent by 2045.
Target 1.D.1 – Decrease single occupancy commute trip mode share by 6.5 percent by 2030 and by 10 percent by 2045 (compared to 2020).
Target 1.D.2 – Increase the number of active commute trips to 16 percent of total commute trips by 2030 and to 24 percent of total commute trips by 2045.
Goal #2 – Reduce transportation related fatalities and injuries for all modes.
Target 2.A – Vision Zero: Eliminate traffic fatalities and serious injuries by 2045 for all modes. By 2030, reduce fatal and serious injuries by 50 percent (compared to 2020).
Goal #3 – Deliver access and safety improvements cost effectively, within available revenues, equitably and responsive to the needs of all users of the transportation system, and beneficially for the natural environment.
Target 3.A.1 – Increase the percentage of pavement in good condition to 50 percent by 2030 and 80 percent by 2045.
Target 3.A.2 – Reduce the number of transit vehicles in “distressed” condition to 20 percent by 2030 and to 10 percent by 2045.

C H AP T E R 4 | Vi sion f or 2 04 5
4-12 S A N T A C R U Z C O U N T Y R E G I O N A L T R A N S P O R T A T I O N C O M M I S S I O N
2045 Sustainability Targets
Outcomes Advanced
People Prosperity Planet
Acce
ss &
M
obili
ty
Hea
lth
Safe
ty
Equi
ty
Econ
omic
Be
nefit
Co
st
Effe
ctiv
enes
s
Clim
ate
&
Ener
gy
Ecol
ogic
al
Func
tion
Target 3.B.1 –
Improve travel options for people who are transportation disadvantaged due to income, age, race, disability or limited English proficiency by increasing transit vehicle revenue miles (see Target 1.A.2.) and reducing transit travel times by 15 percent by 2030 and by 30 percent by 2045 (compared to 2020).
Target 3.B.2 – Ensure that transportation benefits are equitably distributed and that transportation burdens do not disproportionally affect transportation-disadvantaged populations.
Target 3.C.1 – Maximize participation from diverse members of the public in RTC planning and project implementation activities.
Target 3.D.1 – Increase the amount of transportation funding by 20 percent by 2030 (compared to 2020) from a combination of local, state and federal funds.
Figure 4.5 – 2045 Regional Transportation Plan Performance Targets and Relationship to Triple Bottom Line Source: Santa Cruz County Regional Transportation Commission

Visi on for 20 4 5 | C H A P T ER 4
2 0 4 5 R E G I O N A L T R A N S P O R T A T I O N P L A N 4-13
Notes for Chapter 4
1 “California Transportation Plan 2050,” Caltrans. (February 2021). https://dot.ca.gov/-/media/dot-media/programs/transportation-planning/documents/ctp-2050-v3-a11y.pdf
2 “Safety Performance Management Targets for 2021,” Caltrans. (2021). https://dot.ca.gov/-/media/dot-media/programs/federal-liaison/documents/2021-spmt-a11y.pdf
3 “Monterey Bay Area Complete Streets Guidebook,” SCCRTC. (August 2013). http://sccrtc.org/projects/multi-modal/santa-cruz-county-complete-streets/monterey-bay-area-complete-streets-guidebook/
4 “The Burden of Chronic Disease and Injury – California, 2013,” California Department of Public Health (2013), http://www.cdph.ca.gov/programs/Documents/BurdenReportOnline%2004-04-13.pdf.
5 “Chronic Disease Prevention and Health Promotion,” Centers for Disease Control and Prevention, accessed December 2013, http://www.cdc.gov/chronicdisease.
6 Litman, Todd. “A New Social Equity Agenda for Sustainable Transportation,” Victoria Transport Policy Institute. (March 2012). https://www.vtpi.org/equityagenda.pdf
8 Transportation disadvantaged communities are defined as Low Income Areas: any Census tract in which 33 percent or more of residing families in an area earned less than 200% of the federal poverty level annually. Minority Areas: any Census tract in which 65 percent or more of the total population residing in an area are non-White.
9 “2019 Public Participation Plan,” AMBAG. (October 2019). https://sccrtc.org/wp-content/uploads/2019/10/Final_2019_PPP_with_Appendices.pdf
https://dot.ca.gov/-/media/dot-media/programs/transportation-planning/documents/ctp-2050-v3-a11y.pdf

2 0 4 5 R E G I O N A L T R A N S P O R T A T I O N P L A N 5-1
Introduction
In planning which programs, projects, and actions in Santa Cruz County will advance the region’s goals, policies and targets, the Regional Transportation Plan (RTP) must consider how much funding will be available to support the transportation system, including maintaining existing infrastructure and services, and new transit, highway, local road, bicycle, pedestrian, and demand management projects. The total cost of the RTP investment strategy (also referred to as the constrained project list or Action Element) must be “financially constrained” based on revenues that are reasonably expected to be available. The “Financial Element” identifies the current and anticipated public revenue sources available to fund the planned transportation investments described in Chapter 6 – Transportation Investments. Based on financial projections for local, state, and federal revenue sources, approximately $5 billion through 2045 ($200 million per year) is expected to be available to operate, maintain and improve the multi-modal transportation system in Santa Cruz County.
There are considerable challenges associated with operating, maintaining, and investing in the future transportation system. Projected revenues still only generate about half of what would be needed to fund all of the projects that have been identified through 2045 (Appendix E). While anticipated revenues are insufficient to fund all of the ongoing costs to maintain the existing transportation system and to implement the full list of projects and programs that have been identified by the community, the Regional Transportation Commission (RTC), cities, the County of Santa Cruz, Santa Cruz METRO, state agencies, and other transportation providers work with the community to set clear priorities for the constrained funds and work with state and federal
representatives to identify new and innovative ways to pay for transportation infrastructure and services.
Available Funds
Transportation programs and projects in Santa Cruz County are funded from a variety of local, state and federal funding programs. Based on current and projected revenue sources, approximately $5 billion from federal, state, and local funding sources are reasonably anticipated to be available to finance transportation projects in Santa Cruz County 2020-2045 (Figure 5.1). A list of the specific local, state, and federal funding programs and sources is shown in Appendix D.
CHAPTER
5 Funding Our Transportation System
Senate Bill 1, the Road Repair and Accountability Act of 2017

C H AP T E R 5 | F un d in g O ur Tr ans por ta ti on Sy s te m
5-2 S A N T A C R U Z C O U N T Y R E G I O N A L T R A N S P O R T A T I O N C O M M I S S I O N
Figure 5.1 - 25-Year Revenue Forecast. $5 Billion (2020 dollars) Source: SCCRTC
As shown in Figure 5.2 and Appendix D, the public and businesses contribute to transportation funding programs through taxes and fees, primarily collected at the gas pump and at cash registers. Truck weight fees and a portion of automobile registration fees also help fund some local transportation projects and repay state debt service on past state transportation bonds.
Local Revenues: Although federal and state funding for transportation is critical, nearly 50% of anticipated revenues come from local sources, primarily local sales taxes, transit fares, and city general funds. To address funding shortfall and to meet regional transportation infrastructure needs, Santa Cruz County residents approved Measure D, a 30-year half-percent sales tax dedicated to local transportation projects and programs in 2016.
State Revenues. State revenues, make up approximately 40% of revenues available for transportation projects in Santa Cruz County. These include Senate Bill 1: Road Repair and Accountability Act (2017) fuel taxes and vehicle fees, which stabilized funding to maintain local streets and roads, provided extra funding for local transit and community transportation services, maintain and repair state highways, bridges, and culverts, and adding funding for competitive grants for bicycle and pedestrian, congestion relief, and goods movement projects. It also includes state gasoline and diesel taxes and fees that are allocated by formula to cities, the County of Santa Cruz, and transit agencies. About half of state funds expected to be available in Santa Cruz County are allocated by the California Transportation Commission (CTC) to Caltrans to operate, maintain, and improve safety on the state highway system.
Federal Revenues. Federal funding is generated from per gallon federal gasoline taxes, which have not increased since 1993, and are supplemented by Federal general funds deposited in the “Highway Trust Fund” (HTF). The amount of federal funding available, types of programs funded, and rules associated with those funds is based on the federal transportation act. Federal funding amounts and programs are determined through the multi-year federal transportation act. In September 2021, the Fixing America’s Surface Transportation Act (FAST Act) expired. As part of negotiations for a multiyear federal infrastructure plan, Congress adopted a new federal transportation act (Investing in a New Vision for the Environment and Surface Transportation in America or INVEST Act) which is expected to increase
State39%
Federal15%
Local46%

Fun d ing O ur Tr a nsp or ta ti on S y s te m | C H A P T ER 5
2 0 4 5 R E G I O N A L T R A N S P O R T A T I O N P L A N 5-3
funding for transportation. Details on what this means for projects in Santa Cruz County will be integrated into RTP updates once available. The federal act depends on general fund revenues and raising the debt ceiling for funding, rather than addressing diminishing gas tax revenues with more stable funding. In Santa Cruz County, federal revenue sources total about 15% of the projected revenue through 2045, with Federal funds made available to projects in Santa Cruz County primarily through Federal Transit Administration (FTA) grant programs, safety and bridge program grants available to local jurisdictions, and federal emergency funds (FEMA).
Depending on the federal transportation act (INVEST in America Act), annual appropriations bills, state and local budgets, diesel and gasoline consumption, and the general condition of the local and global economy, funding levels for many funding programs may change significantly from year to year.
Figure 5.2 – Major Transportation Revenues in California Source: Caltrans and SCCRTC, 2021
Restricted versus Flexible Funds
As shown in Figure 5.3 of current and projected future revenue sources, most revenues available for transportation projects and programs identified in the Regional Transportation Plan (RTP) are highly restricted (or “dedicated”) by federal, state, or local regulations for use by specific jurisdictions, agencies and/or types of projects. For example, some funding sources may only be applied to projects that support transit or airport facilities, while other sources are exclusively for road maintenance or capital projects on the state highways. This includes over $900 million in State Highway Operation and Protection Program (SHOPP) funds that can only be used for maintenance and safety projects on state highways through 2045. Approximately one third (1/3) of local, state, or federal funds can only be used on transit and

C H AP T E R 5 | F un d in g O ur Tr ans por ta ti on Sy s te m
5-4 S A N T A C R U Z C O U N T Y R E G I O N A L T R A N S P O R T A T I O N C O M M I S S I O N
paratransit projects and operations, including the local ½ cent transit sales tax (approved by Santa Cruz County voters in 1978) and rider fares designated for the Santa Cruz Metropolitan Transit District (METRO), 20% of Measure D revenues, Lift Line rider fares, and funds from the Federal Transit Administration. Most funds allocated to cities and the county can be used on a variety of projects – including local road, bicycle, and pedestrian projects. In selecting projects for the constrained investment strategy, the project list must match with the funds dedicated to specific project types or agencies.
Figure 5.3 - Funding Restrictions by Project Type Source: SCCRTC
The RTC has discretion over about 4% of the funds available for transportation projects (approximately $8.5 million per year). These funds are from regional shares of the State Transportation Improvement Program (STIP), Surface Transportation Block Grant Program (STBG) and SB 1- Local Partnership Program. The RTC typically distributes these funds through a competitive process based on how well projects advance the priorities identified in the RTP policy element (Chapter 4) and criteria established by state and federal guidelines. In addition to these discretionary funds, State Transit Assistance, Transportation Development Act, and Measure D funds flow through the RTC’s annual budget to the Metro, local jurisdictions and other partner agencies by formula for purposes that are restricted by state law and the Measure D Ordinance. Other agencies are responsible for selecting projects for the remaining funds.
Measure D
In response to ongoing funding shortfalls and the large backlog of maintenance and other projects, Santa Cruz County voters approved Measure D in November 2016, a 30-year half-percent sales tax dedicated to local transportation projects and programs. Measure D provides approximately $20-25 million per year to fund projects in Santa Cruz County, which cannot be taken away by the state.
Active Transportation4%
Airport2%
Flexible8%
Highway21%
Rail1%
Local Streets-Roads28%
Project Specific4%
Transit/Paratransit32%

Fun d ing O ur Tr a nsp or ta ti on S y s te m | C H A P T ER 5
2 0 4 5 R E G I O N A L T R A N S P O R T A T I O N P L A N 5-5
Measure D provides funding for five categories of program investments, as shown in Figure 5.4. Funds are distributed by formula to cities, the County of Santa Cruz, Santa Cruz METRO, and other local transportation agencies and categories of projects, as outlined in the Measure D Ordinance and Expenditure Plan. The RTC is required to allocate, administer, and oversee the expenditure of all Measure revenues which are not directly allocated by formula to other agencies, consistent with the Expenditure Plan and the 2021 Measure D Strategic Implementation Plan. With passage of Measure D, Santa Cruz County became a “self help” county, joining 85% of California’s population that lives in counties whose voters approved transportation-sales tax measures. Because county voters have approved local sales taxes dedicated for transportation purposes, Santa Cruz County will also receive a share of $200 million that is available statewide per year through SB1. This Local Partnership Program recognizes and rewards communities that have approved local “self-help” sales taxes and fees.
Figure 5.4 – Measure D Investment Categories Source: SCCRTC
Funding Uncertainties
Financial projections developed for the RTP reflect the best estimates available in 2020/21. These projections are meant to be used as a general tool to assist the RTC, local jurisdictions and other project sponsors in determining what projects are reasonable to pursue and prioritize in the short and long term. However, forecasting the amount of funding that will be available for transportation is a challenging and somewhat speculative exercise. Actual revenues will vary from year to year.
The availability of the funding identified in the 2045 RTP is also dependent on state, federal, and local taxes, fees, and other sources continuing to exist or being replaced with other funding mechanisms. The reliability of funding projections can also be impacted by changes in the economy, state and federal laws, environmental mandates, fuel consumption, and related gas tax revenues. Since adoption of the 2010 RTP, several funding sources that agencies had historically relied upon have been eliminated, such as the
Neighborhood Projects - local streets & roads
30%
Transit & Paratransit
(METRO & Lift Line)20%
Rail Corridor (analysis and maintenance)
8%
Active Transportation/
Coastal Rail Trail17%
Highway Corridors
25%

C H AP T E R 5 | F un d in g O ur Tr ans por ta ti on Sy s te m
5-6 S A N T A C R U Z C O U N T Y R E G I O N A L T R A N S P O R T A T I O N C O M M I S S I O N
sales tax on gasoline for transportation (Proposition 42) and federal programs eliminated in 2012 with adoption of the federal transportation act MAP-21. Many local jurisdictions were particularly hard hit in 2010 by the elimination of redevelopment agencies and related funding. In Santa Cruz County, redevelopment agencies had spent millions of dollars annually on transportation projects, including roadway repairs, new sidewalks, bicycle lanes, highway projects, and transit facilities, before they were dissolved by the California State Legislature and redevelopment funds redirected to the State General Fund.
Funding Shortfalls – A Local, State, and Federal Challenge
As noted earlier, while $200 million per year and $5 billion over 25 years may seem like a lot of money, $9.7 billion in projects and programs have been identified by local agencies and the public through 2045 (Appendix E). The significant shortfall in transportation funding is not unique to Santa Cruz County. The combination of state, federal and local revenues designated for transportation no longer pay for transportation projects at the same levels they have in the past. Aging infrastructure, heavier trucks and buses, rising construction costs, and new regulatory requirements could also impact project costs. Increasing traffic, expanded use of transit service, and bicycle and pedestrian facilities also place additional demands on the transportation system.
Another major challenge is that transportation has historically been funded by revenues generated at the gas pump, which decline with better vehicle fuel efficiency. While use of transportation facilities and services is ever increasing, the purchasing power of state and federal gas taxes and fees has not kept pace with the cost to operate and maintain the transportation system. As more vehicles get better gas mileage or use alternative fuels or electricity, fewer gas taxes are collected for the same amount of vehicle miles traveled; so even when gas prices increase, gasoline tax revenues decline as compared to how much people drive, resulting in significantly less funding for transportation projects.
Since Federal gas taxes have not been increased since 1993, the Highway Trust Fund is regularly on the brink of going bankrupt, forcing Congress to repeatedly shift general funds to bail it out and Federal funds have been making up a declining percentage of transportation funding. Because Santa Cruz County does not have as many facilities that are considered “nationally significant” as some other areas (such as large metropolitan areas and areas serving ports or major truck routes), Federal funds make up only 15% of the transportation funds in Santa Cruz County. Unless Congress provides the highway trust fund with a more sustainable source of dedicated revenues, additional bailouts from other revenues will be needed to cover an ever-growing funding gap. While federal funds make up only a portion of transportation budgets, state transportation agencies and transit agencies nationwide may be forced to delay or cancel projects and services because of the long-term uncertainty in federal funding.
Since 2018, Congress has been debating a possible infrastructure funding plan, which could provide additional funding for transportation, water, and other infrastructure projects. Given uncertainties surrounding proposals, new funding from a potential infrastructure plan is not included in the 2045 RTP. If passed, new federal funds might expedite delivery of priority projects and allow additional projects to be implemented through 2045. While Congress and the President agree that the nation’s infrastructure is a priority, there has been no consensus around specific programs that would be funded or how to pay for transportation system projects.
Potential Future Revenues

Fun d ing O ur Tr a nsp or ta ti on S y s te m | C H A P T ER 5
2 0 4 5 R E G I O N A L T R A N S P O R T A T I O N P L A N 5-7
Since existing revenue sources are insufficient to address all of the needs in the region, the RTP also identifies some additional strategies that could address some of the funding gaps. Potential revenue sources that do not currently exist, but which could supply significant transportation funds for our region in the future, include new vehicle weight fees and replacement of state and federal gas taxes with road user charges.
Road User Charges. The decline in purchasing power of gas tax revenues due to inflation and decline of revenue on a per-mile basis as vehicles become more fuel-efficient has caused leaders around the U.S. to look for alternatives for funding the transportation system. A number of states are looking towards a road usage charge (a.k.a. mileage-based user fee or vehicle miles traveled-VMT fee) where drivers would pay for the roads, as they do other public utilities, based on how much they use them. With technological advancements this new approach to directly charge roadway users has become feasible. This type of system can be implemented while still protecting the privacy of road users. Road user charges will cost more to collect than the gas tax but will produce greater and more stable net revenue.
The State has been conducting a pilot program to study the feasibility of a mileage-based fee to replace existing gas taxes in California. While federal and state agencies are investigating replacing the deteriorating gas tax with a road user charge based on the number of miles driven this funding option is unlikely to be realized for many years.
Local Vehicle Registration Fees. As allowed under Senate Bill 83, the RTP also assumes that voters will approve a new local $10 vehicle registration fee that could raise $38 million by 2045.
VMT Mitigation Banks. With passage of SB743, cities, counties, regions and the state are evaluating options to allow developers to fund mitigation efforts to counter VMT impacts of their projects under CEQA, such as local or regional “banks” or “exchanges” to fund transportation projects that will reduce vehicle miles driven. Other potential revenues. While not assumed to be available for constrained projects through 2045 in this RTP, examples of some of funding mechanisms other areas and states have implemented to fund transportation projects include: special assessment districts, transit benefit districts, users fees and fares, regional development fees, state general obligation bonds, tolls, vehicle sales taxes, truck and other vehicle weight fees, utility partnerships, hotel/motel lodging fees, increased general fund investments, private investments, and special grant programs. Methodology for Projecting Available Funds
The financial projections in this RTP are based on reasonably foreseeable revenues. The projections were calculated based on a combination of historical averages, current trends, and/or state and federal actions. In most instances, base-year figures for formula funding sources (those that the region typically receives every year according to population, road miles, or fixed factors) reflect the amount of funding available in Fiscal Year 2020/21. In other instances, historical averages were used to calculate anticipated revenues. For sporadic funding sources, the RTP’s calculations use a fixed percentage of the total statewide amount available for the base-year figure, based on Santa Cruz County’s share of the state population.
Financial projections were developed in coordination with partner agencies in the Monterey Bay region, including the Association of Monterey Bay Area Governments for federally-mandated Metropolitan Transportation Plan (MTP), cities, the County of Santa Cruz, Santa Cruz METRO, and other agencies that

C H AP T E R 5 | F un d in g O ur Tr ans por ta ti on Sy s te m
5-8 S A N T A C R U Z C O U N T Y R E G I O N A L T R A N S P O R T A T I O N C O M M I S S I O N
implement transportation projects and provide transportation services. Projections are consistent with those figures shown in the California Transportation Commission’s (CTC) State Transportation Improvement Program (STIP) Fund Estimate, Interregional Transportation Improvement Program (ITIP), and Federal Transportation Improvement Program (FTIP).

2 0 4 5 R E G I O N A L T R A N S P O R T A T I O N P L A N 6-1
CHAPTER
6 Transportation Investments
Identifying Needs
The Action Element of the RTP is a list of programs, projects and actions needed to operate, maintain, and improve the transportation system in Santa Cruz County (Appendix F - Project List). The cost to implement all of these projects is $9.7 billion through 2045. The RTP project list strives to assess the full cost to operate, maintain, and improve all modes of the transportation system in Santa Cruz County. The project list encompasses nearly 650 projects aimed at meeting the transportation needs of the community through 2045.
The Action Element includes:
• Highway, local road, bicycle, pedestrian, transit, airport, goods movement, transportation demand management (e.g. carpool and traveler information), and transportation system management (e.g. signal synchronization, transit signal priority) projects;
• Operation and maintenance costs of existing transportation facilities – such as bridges, pavement, sidewalks, and public buses;
• Projects local agencies identified through their own planning processes, including transportation studies, General Plans, and capital improvement programs;
• Projects identified by members of the public and public interest groups;
• Projects recommended by RTC advisory committees;
• Projects resulting from a Complete Streets Needs Assessment, which identified projects that would increase safety and promote greater use of active transportation (biking, walking, transit) near major activity centers.
Prioritizing Projects
The transportation needs identified in the Action Element far outweigh revenues available from 2020 through 2045. As discussed in the financial section of this plan, only $5 billion in local, state, and federal funds is reasonably expected to be available through 2045, but $9.7 billion is needed to fully fund all the projects identified in the RTP. An additional $150 million per year in new taxes, fees, and other revenues
C H AP T E R 6 | Tr an sp or t a tion Inv es t me nt s
6-2 S A N T A C R U Z C O U N T Y R E G I O N A L T R A N S P O R T A T I O N C O M M I S S I O N
beyond what was identified in the Financial Element (Chapter 5) would be required to deliver all of the transportation projects identified in Appendix F. Given the significant gap between funding needs and projected revenues, the projects listed in the RTP were divided into two groups:
1. Within Projected Funds (“Constrained”) Projects —Priority projects that could be funded over the next 25 years with reasonably foreseeable transportation revenues including dedicated and already programmed funds ($5 billion).
2. Need New Funds (“Unconstrained”) Projects —Projects that cannot be implemented over the
next 25 years unless there are significant changes in the amount of local, state, and federal funding available for transportation.
Within Projected Funds (Constrained) Project List
The 2045 RTP is a minor update to the 2040 RTP. The projects on the constrained list for the 2045 RTP reflect the work performed by the RTC utilizing the Sustainable Transportation and Analysis Rating System (STARS) framework in developing the project list for the 2045 RTP. The STARS sustainability framework served as a tool to screen projects for their ability to provide the greatest benefit for our region from limited transportation dollars. RTC also worked closely with AMBAG on a scenario planning process to identify priority projects given financial constraints. The AMBAG scenario planning process supported the development of the state-mandated Sustainable Communities Strategy (SCS) to reduce greenhouse gas emissions as forecasted in the Metropolitan Transportation Plan (MTP). The preferred scenario defines the transportation projects that are on the constrained project list in the RTP (Appendix F).and MTP/SCS.
Input was solicited from project sponsors, public, public interest groups and RTC committees in developing the final project list that identifies the projects as either constrained and/or unconstrained. The within projected funds or “constrained” project list consists of over 360 projects that could be implemented over the 25 year timeframe and the need new funds or “unconstrained” list includes nearly 290 projects that will need additional funds in order to be implemented. Approximately 150 projects are identified as both constrained and unconstrained. For these projects, only a portion of a project could be funded over the next 25 years, and it will be necessary to secure and/or generate additional funding sources (beyond those identified in Appendix E) to fulfill all the needs. For some capital projects, if new funds do not become available, a project may have to be scaled back and only a portion of the project built.
Summary of Constrained Projects
In order to meet the goals and targets of the 2045 RTP, both short term and long-term strategies need to focus on developing a multimodal transportation system that provides safe choices for how people travel. The following sections provide a summary of how the transportation investments that have been prioritized for the 2045 RTP advance the sustainability goals and policies identified for this RTP.
Goal 1 – Access and Environment

Tr a nsp or ta tio n In v es t me n t s | C H A P TE R 6
2 0 4 5 R E G I O N A L T R A N S P O R T A T I O N P L A N 6-3
One of the goals of the RTP is to improve people’s access to daily needs in ways that improve health, reduce pollution and improve the economy. The constrained project lists addresses this goal through a variety of projects.
Highway. The RTC and Caltrans have made several improvements to the Highway 1 Corridor over the last decade and the 2045 RTP continues to include funding for Highway 1 improvements. The 2045 RTP includes three new auxiliary lanes projects (Soquel to 41st Ave, Bay/Porter to Park Ave, and Park Ave to State Park Drive), funded by Measure D, that are expected to smooth traffic flow and improve safety by extending the distance available for merging. The northbound auxiliary lane from San Andreas Rd to Freedom Blvd is also included on the constrained project list. The auxiliary lanes projects are stand alone projects but along with interchange reconstruction are designed to provide the additional width necessary for high occupancy vehicle lanes in the future.
High occupancy vehicle (HOV) lanes on Highway 1 are identified as a need and are listed on the full project list for the 2045 RTP. However, the cost of completing the entire HOV lanes project on Highway 1
(approximately $650 million) is beyond the amount of discretionary funding that can be used for highway projects in our county through 2045. Additional Highway 1 Corridor projects, including several new interchanges, that would need to be designed and constructed in advance of HOV lanes are identified in the unconstrained project list as needs that are not currently financially feasible with revenues projected through 2045. This is especially true given the need to maintain existing transportation facilities, including local roadways. If other revenue becomes available, it is possible that more of the Highway 1 Corridor projects on the project list could be implemented to move closer to adding HOV lanes to Highway 1. Nine percent of the projected funds are
designated for highway improvements and 13% for highway maintenance.
Transportation System Management. There is a broad array of strategies to better use capacity of the existing transportation infrastructure. These techniques improve the operation of the transportation system; reduce congestion, travel times, and fuel lost to traffic delays; and provide more consistent travel times day to day. RTP projects that support the goals of greater efficiency include:
• Incident management. Collisions and other incidents can cause travel times to be unpredictable and significantly prolonged. A variety of technologies and programs included in the RTP help identify, respond to, and clear

C H AP T E R 6 | Tr an sp or t a tion Inv es t me nt s
6-4 S A N T A C R U Z C O U N T Y R E G I O N A L T R A N S P O R T A T I O N C O M M I S S I O N
incidents, including Freeway Service Patrol, call boxes, closed-circuit TV cameras, and traffic management centers.
• Arterial management. Coordinated signal timing, separate queues, and priority at signals for high occupant vehicles/buses, roundabouts and additional intersection improvements provide for increased traffic flow and have been prioritized in the 2045 RTP.
Transit Efficiencies and Improvements. Santa Cruz Metropolitan Transit District (METRO) runs an extensive public transit system. Thirty-seven (37%) percent of the constrained RTP project list is designated for transit (Figure 6.2), with a significant portion of those funds coming from a local half-cent sales tax approved by Santa Cruz County voters in 1978. The passage of Measure D in 2016 provides the Metro with 16% of the Measure D half-cent sales tax funds over a 30-year period. This RTP includes projects focused on increasing transit ridership. Strategies include:
• Reduced Travel Times: Improve travel times through reduced headways, transit signal priority, and transit queue jumps.
• Increased Levels of Service: Increased frequency on high ridership and express service routes have been prioritized on the 2045 project list.
• Passenger amenities: Bus stop improvements totaling $500,000 are prioritized in the RTP. These improvements include shelters, benches, and lighting. Upgrades to park-and-ride lots are also prioritized in the RTP.
• Bus and Paratransit vehicle replacements: Bus and van replacement totaling over $80 million are prioritized in the 2045 RTP
• Access to Transit: Most bus riders walk to bus stops. In order to increase ridership, this RTP invests in new sidewalks, curb ramps, and improved pedestrian crossings that provide safer and more appealing access to transit.
• Traveler Information: Real time transit schedule information can be provided online, via mobile applications, and at bus stops if the infrastructure is in place. This plan calls for funding equipment to provide real time transit schedule information.
Rail. In 2012, the RTC purchased the Santa Cruz Branch Rail Line right-of-way. Measure D provides eight percent of funds for the rail right of way which includes environmental and economic analysis of future potential use to better serve Santa Cruz County residents and visitors.
Active Transportation. This RTP prioritizes numerous projects that encourage walking, bicycling, and taking transit as an alternative to driving especially near major activity centers. Approximately 12% of the constrained RTP project list is designated for pedestrian and bicycling improvements and programs (Figure 6.2). The RTP prioritizes projects that fill gaps in the bicycle network and provide separated

Tr a nsp or ta tio n In v es t me n t s | C H A P TE R 6
2 0 4 5 R E G I O N A L T R A N S P O R T A T I O N P L A N 6-5
bicycle and pedestrian paths to promote new riders and encourage physical activity. These include two new bicycle/pedestrian bridges over Highway 1 that will provide improved access over the highway.
Funding prioritized for the Monterey Bay Sanctuary Scenic Trail (MBSST), the Pajaro River Levee Trail and the San Lorenzo Valley Trail are examples of this commitment to active transportation. Investments in new bicycle lanes, bicycle parking, bike-accessible transit, and bicycle education programs are also included. Traffic calming measures in business districts and neighborhoods can make walking and bicycling more attractive by reducing automobile speeds. Several projects in the RTP include landscaping, bulb-outs, speed bumps and other traffic calming measures. The 2045 RTP strives to increase the number of people who are using active forms of
transportation through providing greater connectivity, higher quality facilities, education and encouragement programs, and evaluation of progress over time.
Transportation Demand Management. Transportation demand management (TDM) is a general term for strategies that increase transportation system efficiency through a reduction in demand, especially during peak periods. TDM strategies can reduce automobile use by making alternatives more desirable through incentives or make automobile use less desirable through disincentives such as increased travel costs.
The RTP includes several TDM strategies that increase the efficiency of existing transportation facilities by promoting carpooling, vanpooling, and use of transit, as well as increasing bicycling and walking. Rideshare matching services and individualized assistance to employers, schools, and residents facilitate use of alternatives to driving alone. TDM services that promote employers to allow a flexible work schedule or allow employees to telecommute will reduce demand during the peak hours. Providing easy access to up-to-date information about transportation options is a key component of TDM. 511 Traveler Information will provide people with information on roadway conditions as well as alternative transportation options. Motorists may change their route, when they travel, or mode to avoid congestion.
Goods Movement. Goods movement benefits from reduced congestion and predictable travel times. Projects to improve traffic flow and travel time reliability of our roadways are being prioritized in the plan including Highway 1 auxiliary lane projects, Freeway Service Patrol, intersection improvements, signal synchronization and 511 traveler information. Prioritization of active transportation projects may also reduce traffic congestion in key destination areas as people shift from driving to biking and walking.
Goal 2 – Improve Safety
Ensuring the safety of people using the transportation system is a key goal of the RTP. Safety can be improved through enforcement of traffic laws, motorist education of rules, facility design and emergency response. The 2045 RTP continues investing in programs that increase the safety of the transportation system in Santa Cruz County. These programs include

C H AP T E R 6 | Tr an sp or t a tion Inv es t me nt s
6-6 S A N T A C R U Z C O U N T Y R E G I O N A L T R A N S P O R T A T I O N C O M M I S S I O N
Motorist Aid. The RTP prioritizes programs that help remove stranded motorists from the highway to reduce the risk of collisions. The Freeway Service Patrol, which operates tow trucks that clear incidents and tow vehicles off segments of Highway 1 and Highway 17, reduce the potential for secondary collisions. The call boxes located on state highways can be used by motorists to seek help.
Enforcement. The number of injuries and fatalities can be reduced by enforcement of traffic laws on our roadways to reduce unsafe driving practices. The RTP continues to fund the California Highway Patrol to provide extra enforcement on Highway 17 and bus-on-shoulder enforcement on Highway 1.
Education. The RTP continues to invest in bicycle and walking safety education programs that result in increased use of safety equipment (helmets and lighting), increase predictable and responsible behavior and raise awareness about risk factors to decrease the risk and severity of collisions. The RTC partners with a number of agencies to promote transportation safety to Santa Cruz County residents.
Safe Routes to School. The 2045 RTP invests in programs that construct or repair crosswalks, sidewalks, trails and traffic calming measures that enable children to safely walk and bike to school.
Traffic Calming. There are a number of traffic calming projects that are prioritized in the RTP that will reduce the speed and volume of automobile traffic on local roads and thus can reduce the likelihood and severity of collisions.
Highway. The RTP invests in four Highway 1 auxiliary lanes projects that will reduce opportunities for conflicts by supplying longer distances for vehicles to merge in and out of the through lanes.
Bicycle and Pedestrian Facilities. The RTP prioritizes projects that will expand the network of sidewalks, bike lanes, bike treatments and multiuse trails which separates active transportation modes from motor vehicles thereby reducing opportunities for collisions. Intersection improvements prioritized in the RTP, with particular attention to bicycle and pedestrian movements and ADA accessibility, will help to reduce
incidents at intersections. Nationwide, roughly 50% of the serious injury collisions and 21% of the fatal collisions occur at intersections.1
Security/Emergency Services. Transportation systems can be greatly impacted by natural disasters or security incidents. Transportation systems are also a critical part of the response effort by connecting law enforcement and safety responders to the incident site and handling the public’s transportation needs in response to the incident. Consistent with the California Strategic Highway Safety Plan and emergency relief and disaster preparedness plans, the 2045 RTP continues to invest in projects that provide security and emergency services. Surveillance and communication are key components to facilitating effective response and recovery efforts. Changeable message signs and CCTV cameras on the highways provide real time incident and traffic operation information. Cameras and security lighting at transit centers and

Tr a nsp or ta tio n In v es t me n t s | C H A P TE R 6
2 0 4 5 R E G I O N A L T R A N S P O R T A T I O N P L A N 6-7
bus stops are part of METRO’s ongoing operations. A 511 Traveler Information System provides a centralized location to communicate travel conditions during an emergency. Additionally, the transit system can play an important role in assisting the public during times of emergency by helping to provide transport out of or around affected areas.
Goal 3 - Maintain the Existing Transportation System and Provide Access Equitably
System Maintenance. The cost to maintain our existing transportation system is accelerating as the backlog of roads in disrepair keeps increasing. This is due primarily to funding shortfalls for maintenance over the last many years as well as higher costs associated with maintaining an aging system. As shown in Figure 6.1, the cost to fix roadways increases exponentially as a roadway deteriorates. Note the cost difference per square yard (SY) for sealing versus overlays versus reconstruction. For that reason, it is oftentimes more cost effective to regularly repair some roadways that are in fair condition, rather than to rebuild roadways with severe deterioration. The longer there is a delay in maintenance of our streets and roads, the rate of deterioration accelerates, and the greater the future maintenance costs. Preserving the existing infrastructure is a key focus of this RTP. Local jurisdictions and Caltrans have developed Pavement Management Systems (PMS) to spread funding for maintenance as far as possible.
PCI 100 Preventative Maintenance/ Surface Seals ($4 - $6/SY)
70 Thin Overlays ($20 - $25/SY)
50 Thick Overlays ($30 - $40/SY)
25 Reconstruction ($65 - $100/SY)
0 Time (Years)
Figure 6.1 – Cost of Road Maintenance Source: 2020 California Statewide Local Streets and Roads Needs Assessment2
Highway Maintenance. The 2045 RTP also includes Caltrans State Highway Operation and Protection Program (SHOPP) projects that provide operational improvements, address collision reduction mandates, and preserve the current highway system.
Maintenance of current transit infrastructure: The transit system needs consistent funding for maintaining the system. Buses need to be replaced; transit centers updated; bus shelters, service vehicles and operations facilities need to be maintained. Fleet maintenance, bus replacements, physical plant upgrade, and transit center renovations have all been partially funded in the RTP.
66 Average PCI (statewide)

C H AP T E R 6 | Tr an sp or t a tion Inv es t me nt s
6-8 S A N T A C R U Z C O U N T Y R E G I O N A L T R A N S P O R T A T I O N C O M M I S S I O N
Equity. The RTP project list has been developed to address the transportation needs of the entire community, and attempts to ensure that no one community bears more of the benefits or burdens of transportation investments than any other. The 2045 RTP accomplishes this by soliciting broad public input, building on strong community-based partnerships, and identifying projects that support an integrated and multi-modal system that improves mobility and access for all communities in the region.
Fund Distribution
A breakdown of project costs by transportation mode for projects listed on the constrained list is shown in Figure 6.2. Many projects included in the constrained list are multimodal. For example, a project on a local road may include roadway repairs, new bicycle lanes, new sidewalks, and intersection improvements and thus funds for these projects will be distributed amongst the various modes.
Figure 6.2 – $5 Billion Fund Distribution by Mode Note: Dedicated and Discretionary Funds Source: Santa Cruz County Regional Transportation Commission
The Need New Funds (Unconstrained) Project List
While many projects can be funded within the revenues projected for the next 25 years, there are many proposed projects which still cannot be funded within projected revenues. Projects that “Need New Funds” (Appendix F – “Unconstrained” column) include projects that are not financially feasible through 2045, may be lower priority, have potentially significant environmental constraints, and/or do not
Bike6%
Pedestrian7%
Transit37%
Highway13%
Local Streets & Roads5%
Road Preservation26%
Trans Demand Mgmt1%
Trans System Mgmt1%
Other4%

Tr a nsp or ta tio n In v es t me n t s | C H A P TE R 6
2 0 4 5 R E G I O N A L T R A N S P O R T A T I O N P L A N 6-9
advance regional targets to the same level as other projects. It represents the next tier of projects and programs that could be pursued if new revenue sources are generated or become available to the region.
These additional roadway projects, public transit services, pedestrian and bicycle facilities and other projects that are important to both the public and local agencies but are feasible only if projected revenues are supplemented either through increased local taxes or other new local, state or federal funds.
Implementing the Investment Program
Together, the 2045 RTP’s constrained and unconstrained projects reflect the wide range of transportation needs in Santa Cruz County and serve as the basis for investing future transportation funds. Development of the project list, however, is just the first step towards actual implementation of the projects, as the majority of the projects are not yet scheduled to receive funding. Figure 6.3 outlines the main steps that bring a transportation project through development, funding, and implementation. Project implementation can take from six months to 20 years, depending on the size and complexity of the project, the availability of funding, and whether or not the project is exempt from certain state and federal mandates. Often, a project is delayed during the environmental phase due to the need for several levels of federal and state agency approvals. In other cases, delays may be due to public concerns with a project.
Absence of reliable funding can create stops and starts during a project’s development, which is particularly costly to transportation projects that require long lead times. A project may achieve a milestone only to find funding for the next phase has been postponed. Long lags between project phases can require project sponsors to redo costly studies to address updated conditions once funding for the subsequent phase becomes available. Reliable funding sources, as provided by Measure D, help to stabilize project costs.
Project Cost
Since most new projects must be shoe-horned into already built-up urban areas, it is not a simple or inexpensive proposition to add new highway lanes, widen city streets to add car or bicycle lanes and sidewalks, start new rail passenger service, or build new bus facilities. Additionally, project costs identified in the RTP are estimates. Once a project undergoes environmental review and final design, the project cost estimate will be updated and may differ significantly from that shown in a large scale planning document such as the RTP. For instance, the cost of implementing transportation projects is subject to fluctuations in the prices of oil, steel and cement. Project delays, environmental constraints, neighborhood opposition, and right-of-way needs can also increase costs and in some cases may even cause a funded project to be withdrawn. With limited funds available, project sponsors oftentimes are left with few options but to significantly scale back plans or to initiate environmental review and design work before construction funding is secured.

C H AP T E R 6 | Tr an sp or t a tion Inv es t me nt s
6-10 S A N T A C R U Z C O U N T Y R E G I O N A L T R A N S P O R T A T I O N C O M M I S S I O N
Figure 6.3 – Typical Stages of Transportation Project Development Source: Santa Cruz County Regional Transportation Commission
Building Transportation Projects
1. Need - Need for project identified by a public agency, member of the public, a private business, or a community group.
2. Planning - Project included in planning documents, such as the Regional Transportation Plan, State Highway Operation and Protection Program (SHOPP), General Plan, Climate Action Plan, and/or Capital Improvement Program. Public input is encouraged.
3. Scope Defined - Project sponsor prioritizes project and develops preliminary cost estimates and defines scope of project. For highway projects, a Project Initiation Document (such as a Project Study Report) is prepared by Caltrans or a local agency with Caltrans oversight to provide this information.
4. Secure Funding - Project sponsor seeks and secures funds for project. Project sponsors may approve local funds (e.g. general funds, gas taxes) in their annual budget, submit grant applications to other agencies for funds [e.g. RSTP (RTC), STIP (RTC and CTC), AB2766 (Air District), safety and bridge (Caltrans), etc], or seek voter approval for funds (e.g. sales tax measure, parcel fees). Projects approved for state or federal transportation funds are included in the Regional (RTIP), State (STIP), State Highway (SHOPP) and/or Federal Transportation Improvement Program. Public input is encouraged. Securing funding can take several years.
5. Environmental Review and Preliminary Design - Analysis to ensure consistency with local, regional and coastal plans/policies, identify environmental impacts and mitigation measures in accordance with state law (CEQA). Federally-funded projects must also undergo NEPA review. Public input is encouraged. Depending on the size and potential impacts of projects, environmental review and preliminary design can take 1 month to several years.
6. Approvals - Obtain approvals, agreements and/or permits from resource agencies. Approvals can take months to years.
7. Final Design - Development of final design, includes development of project specifications and estimates used by contractors to bid on a construction project. Design can take 1 to 3 years.
8. Right of Way Acquisition - Acquire rights of way and relocate utilities if needed. Acquisition can take months to 2 years.
9. Construction - Prepare and advertise construction contract, hire construction contractor and construct project. Construction can take months to 2 years.

Tr a nsp or ta tio n In v es t me n t s | C H A P TE R 6
2 0 4 5 R E G I O N A L T R A N S P O R T A T I O N P L A N 6-11
Funding Decisions
The 2045 RTP is an important tool for identifying the community’s transportation priorities. The policy and project lists within the 2045 RTP will help guide future funding decisions. Projects will be given priority for funds that come under the RTC’s discretion based on their ability to meet criteria established by the RTC. The analysis of project benefits will inform future funding discussion. This analysis will occur during grant cycles for new federal, state and local funds, which generally occur every two years, depending on the program. Projects eligible for other state, federal and regional funding not under the RTC’s discretion, also need to be included in the 2045 RTP project list and/or consistent with the adopted Regional Transportation Plan goals and policies. Construction of planned projects on this list is not assured until actual funds are allocated.
C H AP T E R 6 | Tr an sp or t a tion Inv es t me nt s
6-12 S A N T A C R U Z C O U N T Y R E G I O N A L T R A N S P O R T A T I O N C O M M I S S I O N
Notes for Chapter 6
1 “Intersection Safety,” U.S. Department of Transportation, Federal Highway Administration, accessed January 2014, http://safety.fhwa.dot.gov/intersection/.
2 “California Statewide Local Streets and Roads Needs Assessment,” Save California Streets. (August, 2021). https://www.savecaliforniastreets.org/wp-content/uploads/2021/08/Statewide-2020-Local-Streets-and-Roads-Needs-Assessment-Final-8-4-21.pdf

2 0 4 5 R E G I O N A L T R A N S P O R T A T I O N P L A N 7-1
CHAPTER
7 System Performance
Performance-based planning is a strategic approach that uses key information to help inform investment decisions. The 2045 Monterey Bay Area Metropolitan Transportation Plan – Sustainable Communities Strategy presents a performance measures analysis for the larger AMBAG region that includes Santa Cruz County. This analysis can be found on the AMBAG website (https://www.ambag.org). The 2045 RTP focuses the system performance on presenting available data that monitors the performance of the transportation system to date based on the goals, policies, and targets discussed in Chapter 4. Data to monitor the transportation system can be challenging and expensive to acquire. The information presented below utilizes data that was gathered from a variety of sources. Data is not available at this time to monitor all of the measures in the 2045 RTP although many of the more fundamental indicators (injuries and fatalities, vehicle miles traveled, greenhouse gas emissions, pavement condition) are presented below. Refer to Appendix C for the complete list of goals, policies, and targets identified for the 2045 RTP.
Goal 1. Establish livable communities
Establish livable communities that improve people's access to jobs, schools, recreation, healthy lifestyles and other regular needs in ways that improve health, reduce pollution and retain money in the local economy.
Target: Improve people’s ability to meet most of their daily needs without having to drive.
Target 1.A.1. – Increase the length of urban bikeway miles relative to total urban arterial and collector roadway miles to 85 percent by 2030 and to 100 percent by 20451.
The RTC tracks the length of bikeway miles throughout Santa Cruz County on an annual basis through coordination with the local jurisdictions. The percentage of urban bikeway miles is the length of bikeway miles within the urban services boundaries relative to the length of arterials and collector roadways in the county (Figure 7.1). Given data limitations, the data in Figure 7.1 is based on the assumptions that the length of the local arterials and collectors with the urban areas of the county has not changed since 2014 and that the ratio of urban to non-urban bikeways has also stayed constant. The percentage of bikeway miles relative to length of arterials and collectors within the urban areas for 2018 was 69.5%. If the current trend continues, the percentage of bikeway miles will be 74.4% in 2030 and will not meet the 85% target.

C H AP T E R 7 | S ys t e m Per for m an ce
7-2 S A N T A C R U Z C O U N T Y R E G I O N A L T R A N S P O R T A T I O N C O M M I S S I O N
Figure 7.1 – Percentage of Bikeway Miles Relative to Lengths of Arterials and Collectors in Urban Areas Source: SCCRTC
Target 1.A.2 – Increase the transit vehicle revenue miles by 8 percent by 2030 and 20 percent by 2045 (compared to 2020).
The total number of transit revenue miles is a measure of the availability of transit service to people within Santa Cruz County by tracking both the length or coverage of the routes offered and the frequency of service. The shorter the headway (time between consecutive buses at a bus stop), the higher the frequency of service, and thus the greater the transit revenue miles. It is well documented that in general, ridership increases as the frequency of transit service increases2.
Santa Cruz METRO is the only public transit service that currently operates in Santa Cruz County. METRO tracks their fixed route revenue miles on an annual basis. Data available from fiscal year (FY) 2014 through 2019 shows a decrease of 13.7% in fixed route service as measured by transit revenue miles. The 2020 coronavirus pandemic decreased the service significantly, but service was restored in Fall 2021 to pre-pandemic levels on all routes with the exception of a few routes including the Highway 17 Express. In future monitoring of this metric, the target for transit revenue miles to increase by 8% by 2030 and by 20% by 2045 will need to be compared to an adjusted 2020 value due to the Covid-19 pandemic.
60.0%
62.0%
64.0%
66.0%
68.0%
70.0%
72.0%
74.0%
76.0%
78.0%
80.0%
2010 2011 2012 2013 2014 2015 2016 2017 2018 2019 2020

Sy s te m Per for m an ce | C H A P T E R 7
2 0 4 5 R E G I O N A L T R A N S P O R T A T I O N P L A N 7-3
Figure 7.2 – Santa Cruz METRO Fixed-Route Revenue Miles Source: Santa Cruz Metropolitan Transit District *Routes and frequency of service decreased due to COVID-19 pandemic during FY 20 and FY 21
Target: Reduce smog-forming pollutants and greenhouse gas emissions.
Target 1.B.1 – Reduce per capita vehicle miles traveled by 4 percent by 2030 and by 10 percent by 2045 (compared to 2005).
If there was information for only one measure to monitor the performance of the transportation system, vehicle miles traveled is the measure to monitor. Vehicle miles traveled or VMT is the total number of miles of vehicle travel within a specified area. Changes in vehicle miles traveled provides information about whether congestion, air quality (including GHG emissions), health, and ability to walk, bike or take transit, is increasing or decreasing over time. The number of vehicle miles traveled for Santa Cruz County can be determined a few different ways. Figure 7.3 shows VMT estimates since 2005 from the Highway Performance Monitoring System (HPMS) implemented by Caltrans. The VMT data estimated through the HPMS is calculated using traffic count data collected on both the highway system and the local street and road network. Daily total VMT represents the amount of travel for all vehicles within Santa Cruz County borders. The data shows total VMT was highest in 2005, followed by a general downward trend. [Note: The 2010 data point likely represents an error in the counts used to determine the VMT.] The changes in total VMT can be due to a change in population and/or a change in the amount people driving a vehicle.
Average daily VMT per capita, calculated by dividing the total vehicle miles traveled by the population of the county, represents the average amount people drive daily. Figure 7.3 shows the highest VMT per capita occurred in 2005. The amount of driving per person has steadily decreased since 2005 and has remained relatively unchanged at 18.4 since 2016. Through prioritization of projects that promote transit use, biking, and walking, as well as changes in land use that shorten the distance people travel from
0
500,000
1,000,000
1,500,000
2,000,000
2,500,000
3,000,000
3,500,000
4,000,000
FY 14 FY 15 FY 16 FY 17 FY 18 FY 19 FY 20* FY 21*
Ann
ual R
even
ue M
iles
Local Fixed Route Highway 17 Total Fixed Route

C H AP T E R 7 | S ys t e m Per for m an ce
7-4 S A N T A C R U Z C O U N T Y R E G I O N A L T R A N S P O R T A T I O N C O M M I S S I O N
home to work and home to shopping, per capita VMT and thus per capita CO2 emissions will continue to be reduced. This RTP prioritizes numerous projects that encourage walking, bicycling, and taking transit as an alternative to driving especially near major activity centers. Approximately 13% of the constrained RTP project list is designated for pedestrian and bicycling improvements and programs and approximately 37% is designated for transit services. See Chapter 6 for more details on projects that will help to advance this goal.
Figure 7.3 shows a downward trend with projected daily VMT per capita in 2020 that is reduced by 17% compared to the 2005 base year; this will far exceed the VMT/capita target of a 1% reduction by 2020 set in the previous version of the RTP. The VMT/capita targets of a reduction of 4% by 2030 and 10% by 2045 should be exceeded if the overall trend continues.
Figure 7.3 – Santa Cruz County Daily Vehicle Miles Traveled (Total and Per Capita) Source: Highway Performance Monitoring System, Caltrans. Data from 2010 was removed from trend line calculation due to likelihood of inaccurate count data used to determine VMT.
Target 1.B.2 – Reduce per capita greenhouse gas emissions by 50 percent by 2030 and by 78 percent by 2045 and total greenhouse gas emissions from transportation by 40 percent by 2030 and 70 percent by 20453 (compared to 2005) through electric vehicle use, clean fuels, and other emerging technologies, reduction in vehicle miles traveled and improved speed consistency.
Climate change is the most significant global challenge of the 21st century. Reducing greenhouse gas emissions from all sectors in order to reduce the effects of climate change is a top priority for California.
4.0
8.0
12.0
16.0
20.0
24.0
28.0
32.0
0
1000
2000
3000
4000
5000
6000
7000
2005 2006 2007 2008 2009 2010 2011 2012 2013 2014 2015 2016 2017 2018 2019 2020
Dai
ly V
MT/
capi
ta
Dai
ly T
otal
VM
T (T
hous
ands
)
Daily VMT/capita Daily Total VMT Trendline VMT/capita

Sy s te m Per for m an ce | C H A P T E R 7
2 0 4 5 R E G I O N A L T R A N S P O R T A T I O N P L A N 7-5
Gasoline and diesel fuels used to power our cars are significant contributors to greenhouse gas emissions. Reducing these emissions is a goal of the 2045 RTP.
Data for assessing trends in greenhouse gas emissions from Santa Cruz County can be gathered from a couple of different sources. Figure 7.4 shows the total metric tons (MT) of CO2 generated from gasoline and diesel fuel sales in Santa Cruz County from 2010 to 2019. [Note: the 2014 data point is likely not representative of fuel sales for this year given the low value compared to other years.] The total metric tons of CO2 from transportation decreased nearly 11% between 2010 to 2019, likely to changes in vehicle miles traveled, speed consistency, population, and vehicle technology that affect the mix of vehicles on the road.
Figure 7.4 also shows a 14% decrease in CO2 per capita from 2010 to 2019. The per capita percent reduction is greater than the reduction in total CO2 due to an increase in population. Targets for reducing total greenhouse gasses reflect those set by the state. Based on fuel sale trends from 2010 to 2019 (excluding 2014 outlier data) and assuming similar population growth, the county is on track for a reduction of CO2 emissions per day of 35% by 2030 and 55% by 2045 relative to a 2005 base year calculated from the trendline. Greater action is needed to achieve the targets of 40% reduction by 2030 and 70% by 2045.
Figure 7.4 – Historic Santa Cruz County Greenhouse Gas Emissions from Transportation Source: California Energy Commission, Annual Retail Fuel Outlet Report Results4
Figure 7.5 provides a comparison of the CO2 per capita emissions in 2019 based on fuel sales data by county. Santa Cruz County is in the middle range of per capita GHG emissions relative to nearby counties. There is much to be done in Santa Cruz County and in the rest of California to meet the targets for total greenhouse gas emission reductions.
-
5.0
10.0
15.0
20.0
25.0
30.0
0
500
1,000
1,500
2,000
2,500
3,000
2010 2011 2012 2013 2014 2015 2016 2017 2018 2019
CO
2 (lb
s/ca
pita
/day
)
Met
ric
Tons
CO
2/da
y
CO2 lbs/capita/day MT CO2/day

C H AP T E R 7 | S ys t e m Per for m an ce
7-6 S A N T A C R U Z C O U N T Y R E G I O N A L T R A N S P O R T A T I O N C O M M I S S I O N
Figure 7.5 – 2019 CO2 lbs per Capita per Day Based on Fuel Sales Source: California Energy Commission, Transportation Fuels Data *Diesel not included
Greenhouse gas emission reductions can also be estimated using a combination of a travel demand model and the California Air Resources Board emission factors model (EMFAC2014). The travel demand model estimates vehicle miles traveled based on future transportation scenarios and the emission factors model takes the VMT data along with existing and projected vehicle fleet mix data to estimate CO2 emissions. The Association for Monterey Bay Area Governments (AMBAG) runs the travel demand model for the Santa Cruz, San Benito and Monterey Counties region. The AMBAG model is used for developing the Metropolitan Transportation Plan – Sustainable Communities Strategy which is developed in collaboration with the Santa Cruz County RTP (as well as the Monterey and San Benito RTPs). The greenhouse gas emission model results for the region can be found in the AMBAG 2045 Monterey Bay Area Metropolitan Transportation Plan – Sustainable Communities Strategy found on the AMBAG website (https://www.ambag.org).
Reduction in greenhouse gas emissions from transportation is based primarily on decreasing how much we drive and improvements in vehicle technologies that reduce the use of fossil fuels. This RTP prioritizes projects that promote transit use, biking and walking as an alternative to driving to reduce vehicle miles traveled as discussed above and in Chapter 6. Improvements in vehicle technology are not under the purview of the Regional Transportation Commission but are tracked here to provide information on how Santa Cruz County is advancing California’s GHG emission reduction goals for transportation.
In 2017, the California Air Resources Board updated the Climate Change Scoping Plan.5 This plan describes the existing and proposed strategies for reducing greenhouse gas emissions from all sectors including transportation. Strategies for transportation include reducing VMT through promotion of sustainable communities, increased active transportation and transit, and modernization of rail; implementing the advanced clean car program which requires vehicle manufacturers to produce an increasing number of low and zero emission vehicles; supporting federal and state incentive programs for increasing use of zero emission vehicles; and acceleration of clean fuel programs to name just a few of the
20.7
0 5 10 15 20 25 30
San Francisco
San Benito*
Santa Clara
Marin
Alameda
Santa Cruz
Contra Costa
San Mateo
Stanislaus
Monterey
Merced
CO2 lbs per capita per day

Sy s te m Per for m an ce | C H A P T E R 7
2 0 4 5 R E G I O N A L T R A N S P O R T A T I O N P L A N 7-7
strategies that are being addressed at the state level. Governor Newsom’s Executive Order N-79-20 has already directed the state to require that by 2035 all new cars and passenger trucks sold in California be zero-emission vehicles.
Target: Improve health and reduce greenhouse gas emissions
Target 1.D.1 – Decrease single occupancy commute trip mode share by 6.5 percent by 2030 and by 10 percent by 2045 (compared to 2020).
Target 1.D.2 – Increase the number of active commute trips to 16 percent of total commute trips by 2030 and to 24 percent of total commute trips by 2045.
Replacing trips traditionally made in a vehicle with walking, bicycling, or taking transit can lead to improved health through regular physical activity and reduced obesity rates. Increased walking, bicycling and taking transit can also reduce congestion on our roadways. Data is available for commute trip mode share from the American Community Survey (ACS). The mode share data from the ACS is presented in Figure 7.6 which shows that the percentage of drive alone trips has stayed essentially constant between 2000, 2011-2015, and 2015-2019, whereas the percentage of carpooling has decreased and the percentage of work from home have increased. Biking, walking and transit trips have not changed significantly. The 2045 RTP target to decrease single occupancy vehicle trip mode share by 6.5% by 2030 and increase active transportation trips to 16% of total commute trips by 2030 and to 24% of total commute trips by 2045 will likely not be met given this current trend.
While the network of bicycling and walking facilities throughout much of Santa Cruz County is substantial, improvements to this network could promote greater use. Separated or buffered bicycle facilities, wider bike lanes and lanes designed outside of the door zone of parked cars all encourage use of bicycles as a means of travel. Sidewalks exist in much of the more populated areas of Santa Cruz County but there are gaps, which limit access for people and are not always attractive due to little or no buffer between pedestrians and high volume traffic. The projects in this plan improve the quality of the active transportation network and thus will help to advance the goal of increasing the percentage of walk, bike and transit trips within key destinations by designing facilities that are safe, convenient and comfortable to the user.

C H AP T E R 7 | S ys t e m Per for m an ce
7-8 S A N T A C R U Z C O U N T Y R E G I O N A L T R A N S P O R T A T I O N C O M M I S S I O N
Figure 7.6 – Santa Cruz County Commute Trips Mode Share Source: U.S. Census Transportation Planning Products, American Community Survey
Goal 2. Reduce transportation related fatalities and injuries
Target: Improve transportation safety, especially for the most vulnerable users.
Targe 2.A.1 – Vision Zero: Eliminate traffic fatalities and serious injuries by 2045 for all modes. By 2030, reduce fatal and serious injuries by 50 percent (compared to 2020).
Improving the safety of transportation users, especially for the most vulnerable users, such as bicyclists and pedestrians, is a priority for Santa Cruz County as well as across California and the nation. The Statewide Integrated Traffic Records System (SWITRS) collision database tracks collision data that allows the RTC to monitor the number of collisions over time to assess how the investment of projects and programs are advancing this target. The collision data by mode is charted below. The data shows that the number of injury and fatal collisions for Santa Cruz County has increased for motor vehicles, bicyclists and pedestrians since the target base years of 2009-2011 (Figure 7.7). An increase in public awareness and a change in driving behavior will be needed in order to improve the safety of the transportation system in Santa Cruz County to reach the 2030 and 2045 targets of the 2045 RTP.
The State Highway Operation and Protection Program (SHOPP) projects which are implemented by Caltrans on Santa Cruz County Highways (1, 9, 17, 129, 152, and 236) focus on reducing collisions. Extra enforcement on Highway 17 through the Safe on 17 program, as well as separated or buffered bicycling and pedestrian facilities implemented by local jurisdictions have also been prioritized in this plan to improve safety. Educational programs such as “Vision Zero” implemented by the Community Traffic Safety Coalition are prioritized to promote driver awareness and changes in driving behavior. See Chapter 6 for more details on projects that will help to improve safety on Santa Cruz County roadways.
69.5
14.2
3.3
2.0 4.
4
1.2 5.
3
69.9
9.4
2.9 3.8
3.9
2.9 7.
3
69.0
9.2
3.0
3.0 4.9
3.0 7.
8
D r i v e a l o n e C a r p o o l P u b l i c T r a n s i t
B i k e W a l k O t h e r W o r k a t H o m e
% C
omm
ute
Trip
Mod
e Sh
are
2000 2011-2015 2015-2019

Sy s te m Per for m an ce | C H A P T E R 7
2 0 4 5 R E G I O N A L T R A N S P O R T A T I O N P L A N 7-9
Figure 7.7 – Injury and Fatal Collisions – Motor Vehicle, Bicycle and Pedestrian Source: Statewide Integrated Traffic Records System (SWITRS), California Highway Patrol available through the Transportation Injury Mapping System (TIMS), Safe Transportation Research and Education Center, University of California, Berkeley. *2019 and 2020 data is provisional
0
20
40
60
80
100
120
140
2009 2010 2011 2012 2013 2014 2015 2016 2017 2018 2019* 2020* 2030Target
2045Target
Num
ber
of C
ollis
ions
Motor Vehicle Severe Injury and Fatal Collisions
0
0
10
20
30
40
2009 2010 2011 2012 2013 2014 2015 2016 2017 2018 2019* 2020* 2030Target
2045Target
Num
ber
of C
ollis
ions
Bicyclist Severe Injury and Fatal Collisions
0
0
10
20
30
40
2009 2010 2011 2012 2013 2014 2015 2016 2017 2018 2019* 2020* 2030Target
2045Target
Num
ber
of C
ollis
ions
Pedestrian Severe Injury and Fatal Collisions
0

C H AP T E R 7 | S ys t e m Per for m an ce
7-10 S A N T A C R U Z C O U N T Y R E G I O N A L T R A N S P O R T A T I O N C O M M I S S I O N
Goal 3. Deliver access and safety improvements cost effectively and equitably
Deliver access and safety improvements cost effectively, within available revenues, equitably and responsive to the needs of all users of the transportation system, and beneficially for the natural environment.
Target: Maintain the existing system and improve the condition of transportation facilities.
Target 3.A.1 – Increase the percentage of pavement in good condition to 50 percent by 2030 and 80 percent by 2045.
A key focus of this RTP is on preserving the existing transportation infrastructure. The “pavement condition index” or PCI is a measure of the average condition of the local street and road pavement on a scale of 0 to 100 where 0-24 is failed, 25-49 is poor, 50-69 is fair, and 70-100 is good. Figure 7.8 shows the trend in the pavement condition indices for the jurisdictions in Santa Cruz County starting in 2005. A comparison of the pavement condition index for Santa Cruz County relative to other counties in California is shown in Figure 7.9. The countywide PCI score as of 2020 is 55, with an increase of 5 points since 2016. Despite a “fair” PCI rating, the need for substantial investment in pavement maintenance remains. This plan invests in pavement repairs, sidewalk and bicycle lane maintenance, bus replacements, bus stops, and transit service vehicles that need upgrades and maintenance. Measure D and Senate Bill 1 funds will provide a significant source of funding for maintaining and improving the condition of transportation facilities in Santa Cruz County. Just under 30% of the constrained RTP project list is designated for roadway maintenance.
Figure 7.8 – 2005 to 2020 Pavement Condition Indices for Jurisdictions in Santa Cruz County Source: Capitola, Unincorporated County, City of Santa Cruz, Scotts Valley, Watsonville, 2020 California Statewide Local Streets and Roads Needs Assessment6
0
10
20
30
40
50
60
70
80
90
100
2005 2008 2011 2014 2017 2020
Pave
men
t Con
ditio
n In
dex
Unincorporated County City of Santa Cruz Capitola
Scotts Valley Watsonville Countywide

Sy s te m Per for m an ce | C H A P T E R 7
2 0 4 5 R E G I O N A L T R A N S P O R T A T I O N P L A N 7-11
Figure 7.9 – Comparison of Santa Cruz County Pavement Condition Index with other California Counties Source: 2020 California Statewide Local Streets and Roads Needs Assessment, Save California Streets
Target 3.A.2 – Reduce the number of transit vehicles in “distressed” condition to 20 percent to 2030 and 10 percent by 2045.
The condition of the transit system is one indicator of the level of “distressed” transportation facilities for Santa Cruz County. The Metro buses are in need of regular maintenance and/or replacement to ensure continued and cost-effective service. Figure 7.10 shows the condition of the Metro fixed-route buses from 2005 to 2020 with targets for 2030 and 2045. The number of distressed buses has decreased 62% in 2017 to 35% in 2020. The 2045 RTP prioritizes funding for 66% of the bus replacement need over the 23-year timeframe of this plan.
0 10 20 30 40 50 60 70 80 90 100
San Benito County
Monterey County
Santa Cruz County
Napa County
Merced County
San Luis Obispo
Santa Barbara County
Alameda County
Santa Clara County
San Francisco County
2020 Pavement Condition Index

C H AP T E R 7 | S ys t e m Per for m an ce
7-12 S A N T A C R U Z C O U N T Y R E G I O N A L T R A N S P O R T A T I O N C O M M I S S I O N
Figure 7.10 – Santa Cruz Metro Fixed-Route Bus Condition Source: Santa Cruz Metropolitan Transit District
Target: Enhance healthy, safe access to key destinations for transportation-disadvantaged populations
Target 3.B.1 – Improve travel options for people who are transportation disadvantaged due to income, age, race, disability or limited English proficiency by increasing transit vehicle revenue miles (see Target 1.A.2.) and reducing transit travel times by 15 percent by 2030 and by 30 percent by 2045 (compared to 2020).
Bus travel time is a way to consider the quality of transit service available to residents of the county. Shorter travel times get people to where they need to go more quickly, respecting the value of everyone's time and potentially making a significant difference in their opportunities. Transit travel times were determined from the METRO bus schedules which are based on a realistic time for buses to travel the route. In Figure 7.11 the peak-time schedules of a select number of METRO bus routes, whose routing has been consistent for comparison purposes, were tracked over recent years. These routes also cover the most populous disadvantaged areas of the county. Fall of 2021 shows a positive change in travel times, however due to the lingering effects of the COVID-19 pandemic, much of the change is likely attributable to a temporary decrease in traffic congestion.
8165
78
3760
82100
3247
31
6133
20
11
2 0 0 5 2 0 1 0 2 0 1 3 2 0 1 7 2 0 2 0 2 0 3 0 T A R G E T
2 0 4 5 T A R G E T
Num
ber o
f Bus
es
Age ≤ 14 years "Distressed" (Age > 14 years)

Sy s te m Per for m an ce | C H A P T E R 7
2 0 4 5 R E G I O N A L T R A N S P O R T A T I O N P L A N 7-13
Figure 7.11 – Santa Cruz METRO Bus Travel Times Average run time for in- and outbound trips near peak morning (8:30am) and afternoon times (5:30pm). Source: Santa Cruz Metropolitan Transit District
The RTC in partnership with METRO are implementing a hybrid bus-on-shoulder/auxiliary lane operations on portions of Highway 1 to allow express buses to bypass some of the congestion on that freeway. The RTC and the County of Santa Cruz secured funding to implement the first bus-priority intersection signals in the county along a 5-mile portion of Soquel Drive in 2022/23. METRO is also currently working on a planning study to evaluate the primary transit corridors connecting Watsonville and Santa Cruz to identify opportunities for improving access and reliability.
Target: Increase transportation revenues.
Target 3.D. 1 – Increase the amount of transportation funding by 20 percent by 2030 (compared to 2020) from a combination of local, state, and federal funds.
After decades of state and federal underinvestment in the transportation system, a supermajority of Santa Cruz County voters approved Measure D in November 2016 which invests an additional $20 million per year into the multimodal transportation system. In April 2017, the state legislature approved Senate Bill 1 (SB1) which helps stabilize transportation funding throughout the state. SB1 is expected to provide an additional $9 million per year to the County of Santa Cruz and local cities to maintain local streets and roads, an extra $3 million per year for local transit, and significant funding to maintain and repair state highways, bridges, and culverts.
0:00 0:14 0:28 0:43 0:57 1:12 1:26
Fall 2012
Fall 2015
Fall 2018
Fall 2021
Hours:Minutes
71
69W
69A
66
15

C H AP T E R 7 | S ys t e m Per for m an ce
7-14 S A N T A C R U Z C O U N T Y R E G I O N A L T R A N S P O R T A T I O N C O M M I S S I O N
Notes for Chapter 7
1 The 2018 percentage of urban bikeway miles to urban arterials and collectors is 70 percent.
2 The Transit Ridership Recipe, Jarrett Walker, https://humantransit.org/basics/the-transit-ridership-recipe
3 Target based on the California Executive Order B-16-12 to reduce greenhouse gas emissions from transportation by 80 percent below 1990 levels by 2050, and California Executive Order B-30-15 to reduce greenhouse gas emissions by 40 percent below 1990 levels by 2030.
4 CA Energy Commission, 2019 California Annual Retail Fuel Outlet Report Results, https://www.energy.ca.gov/data-reports/energy-almanac/transportation-energy/california-retail-fuel-outlet-annual-reporting
5 CA Air Resources Board, 2017 Climate Change Scoping Plan, The Strategy for Achieving California’s 2030 Greenhouse Gas Target, accessed November 2017 (https://www.arb.ca.gov/cc/scopingplan/revised2017spu.pdf)
6 “California Statewide Local Streets and Roads Needs Assessment, Save California Streets, August 2021. https://www.savecaliforniastreets.org/wp-content/uploads/2021/09/Statewide-2020-Local-Streets-and-Roads-Needs-Assessment-Final-Report-August-2021.pdf

2 0 4 5 R E G I O N A L T R A N S P O R T A T I O N P L A N 8-1
CHAPTER
8 Environmental and Air Quality Review
Transportation investments have the potential to impact the environment both positively and negatively. The 2045 RTP is extensively evaluated for its potential impacts as part of the required California Environmental Quality Act (CEQA) environmental review. The evaluation provides an understanding of the tradeoffs between transportation and environmental impacts. This comprehensive analysis not only reflects the RTC’s diligence in meeting state requirements, but also the long-standing interest from the Santa Cruz County community in preserving natural resources.
CEQA Required Environmental Review
Environmental review of the 2045 Regional Transportation Plan (RTP) evaluates the potential environmental effects of implementing the 2045 RTP, including alternative transportation investment scenarios, and identifies potential mitigation measures. Recognizing an opportunity to achieve efficiencies, the Santa Cruz County Regional Transportation Commission, the Association of Monterey Bay Area Governments (AMBAG), the Transportation Agency for Monterey County, and the San Benito County Council of Governments decided to merge their environmental analysis for their respective RTPs and the Metropolitan Transportation Plan/Sustainable Communities Strategy (MTP/SCS). The potential environmental impacts of each plan are collectively detailed in one Environmental Impact Report (EIR) for the 2045 MTP/SCS, which encompasses the three RTPs (Santa Cruz, Monterey and San Benito Counties). The EIR can be found on AMBAG’s website (http://www.ambag.org).
As a programmatic document, the 2045 MTP-SCS Environmental Impact Report presents a region-wide assessment of the impacts of the proposed 2045 MTP-SCS. The intent of a program-level EIR is to focus, in general terms, on the probable regional environmental effects that can be identified at this point in time that are associated with the implementation of the plans. The 2045 MTP-SCS EIR does not analyze impacts of individual projects. Projects will undergo a separate environmental review process, conducted by the agency sponsor once the project is ready to be implemented.
AMBAG, as the lead agency for the 2045 MTP/SCS EIR, which includes environmental review of the Santa Cruz County 2045 RTP, will hold a 70-day public review period to receive comments on the draft EIR. The EIR is widely circulated and reviewed by RTC advisory committees representing project sponsors and transportation stakeholders; representatives of State and Federal governmental agencies; representatives of special interest groups; representatives of the private business sector; and residents of Santa Cruz County consistent with the region’s public participation plan.

C H AP T E R 8 | S u m ma r y of En vir on men ta l a nd A ir Q uali t y R evi ew
8-2 S A N T A C R U Z C O U N T Y R E G I O N A L T R A N S P O R T A T I O N C O M M I S S I O N
Biological and Natural Resources
Santa Cruz County is home to a diverse mix of habitats and species including the coastal oak woodland, second growth redwoods, coastal scrubs, Central California Coast Coho salmon and steelhead, and the California red-legged frog and Santa Cruz long-toed salamander. The rivers, watershed and drainages within Santa Cruz County, including the San Lorenzo River and the Pajaro River, drain into the Monterey Bay National Marine Sanctuary and are of biological importance as they provide valuable habitat for a variety of species and local water supplies. Farmlands, rangelands and timberlands made-up of fruit crops, nursery crops, vegetable crops, field crops, livestock and timber, are important natural resources located in Santa Cruz County and are economic generators. The transportation system can support access to these unique resources and transportation investments can benefit and/or create challenges for biological and natural resources. The 2045 RTP goals and policies consider how well transportation investments benefit the natural environment. A detailed description of biological resources and natural resources and potential impacts is described in detail in Chapter 4.4 of the 2045 MTP/SCS EIR.
Cultural Resources
Prehistoric, paleontological and other historical resources and landscapes with significance to a group of people generally make up the cultural resources present in Santa Cruz County. Cultural resources in Santa Cruz County include, but are not limited to fossils, indigenous people sites, trees and historic structures such as residences, villas, businesses, and churches. Many cultural resources in Santa Cruz County are known and identified as National Register listings, California State Landmarks or as Points of Historical Interest. It is
also possible that other cultural resources have not yet been identified. Cultural resources are non-renewable and recognition of these resources
supports a greater understanding of Santa Cruz County’s past. Transportation planning efforts can avoid conflict with cultural resources through recognition of their importance. New transportation investments are subject to laws and regulations related to cultural resources. A detailed description of cultural and potential impacts is described in detail in Chapter 4.5 of the 2045 MTP/SCS EIR.
Wetlands at Watsonville Slough
Felton Covered Bridge became a California Historic Landmark in 1957

Su m m ar y o f En vir on m ent al an d Air Q u ali t y R evie w | C H A P TE R 8
2 0 4 5 R E G I O N A L T R A N S P O R T A T I O N P L A N 8-3
Environmental Mitigation
In order to minimize the impacts of transportation projects on the environment, mitigation activities may be necessary to avoid, minimize or compensate for potential impacts to environmental resources. As appropriate, mitigation measures will be identified for potential environmental impacts and described in detail in the 2045 MTP-SCS EIR, which encompasses the three RTPs (Santa Cruz, Monterey and San Benito Counties). Mitigation measures may include: requiring project sponsors to survey a project site to determine the presence of environmental resources; development of an environmental resource management plan for impacted areas; specific project elements or design features such as landscaping, construction of sound walls or the location of ground disturbance and setbacks; specific construction activities such as watering active construction areas, fencing off designated areas and use of alternative fuel or electric construction vehicles; limit construction time periods by month, time of day or weather conditions; or compensatory measures such as tree or plant replacement at a defined ratio for replanting and removal.
Regional Mitigation
Regional mitigation efforts, rather than the traditional project-specific mitigation, can improve the quantity and quality of habitat by conserving larger, scarce, multi-resource ecosystems and increase habitat connectivity. Whereas traditional project-specific mitigation typically prioritizes on-site mitigation, regional mitigation prioritizes improvements by overall effectiveness, which can lead to compensatory off-site mitigation. Furthermore, regional mitigation programs frequently result in a coordinated effort to protect larger areas as opposed to buying land in small pieces to satisfy mitigation requirements project by project. Regional mitigation can be particularly effective in developing and maintaining wildlife corridors. Wildlife corridors connect like-habitats to facilitate the movement of certain species to allow the exchange between individual populations and reestablishment after changes to a specific geographic area.
Habitat Conservation Plans and other conservation planning efforts, such as the Conservation Blueprint, developed by the Land Trust of Santa Cruz County; the California Wildlife Habitat Connectivity Project, developed by Caltrans, California Department of Fish and Wildlife (CDFW), and partner agencies; and the Santa Cruz County Regional Conservation Investment Strategy (RCIS) support regional mitigation and can serve as a resource for future mitigation plans in Santa Cruz County. These resources can be used to determine where future mitigation efforts associated with transportation projects identified in the RTP may be required and potential areas for regional mitigation.
Conservation Blueprint: The Conservation Blueprint identifies Priority Multi-Benefit Areas, which are areas within Santa Cruz County that are most likely to provide benefits across vital aspects of conservation—biodiversity, water resources, working lands, recreation and healthy communities and Conservation Land Networks which collectively safeguards the county’s biodiversity. The Priority Multi-Benefit Areas are locations which may be considered in future regional mitigation planning programs.
California Wildlife Habitat Connectivity Project: statewide assessment of essential habitat connectivity by February of 2010, using the best available science, data sets, spatial analyses, and modeling techniques.
Santa Cruz County RCIS: The Santa Cruz County RCIS is a new conservation planning tool under development and is a joint effort between the RTC and Santa Cruz County Resource Conservation District. The Santa Cruz County RCIS is guided by Assembly Bill 2087 (AB 2087) and will be reviewed

C H AP T E R 8 | S u m ma r y of En vir on men ta l a nd A ir Q uali t y R evi ew
8-4 S A N T A C R U Z C O U N T Y R E G I O N A L T R A N S P O R T A T I O N C O M M I S S I O N
and approved by the California Department of Fish and Wildlife (CDFW). The Santa Cruz County RCIS will develop a conservation strategy that includes goals, objectives, actions, and priorities for each conservation element, addresses their respective pressures and stressors, and incorporates information from prior conservation plans. Once finalized, the Santa Cruz County RCIS may inform regional mitigation planning efforts. In 2011, RTC participated in a regional mitigation effort to restore and improve critical wetland habitat in Watsonville Sloughs. The RTC also funded restoration of 1.5 acres of wetlands as part of a larger effort by the City of Watsonville, Resource Conservation District of Santa Cruz County, and Federal, State and local natural resource agencies to restore and conserve habitat for a variety of rare local wildlife and plant species.
Advanced Mitigation
A key piece of regional mitigation efforts as identified by the Federal Transportation Act, is determining the locations of ecological importance and other environmental features in advance of pursuing transportation projects. Knowing in advance locations where impacts to species, habitat types, and other important ecological functions could be best offset within the region and establishing a range of mitigation options, should mitigation be necessary, facilitates regional mitigation. Advance planning is an effective way for incorporating natural resource considerations into transportation planning by facilitating early coordination and consultation with resource agencies, and increasing opportunities for identifying specific sensitive areas, and effective regional mitigation measures. In partnership with multiple federal, state, and local resource agencies, Caltrans, the Resource Conservation District, Santa Cruz County, and the Santa Cruz County Regional Transportation Commission, a Memorandum of Understanding has been executed which will create an advance mitigation planning framework for transportation projects countywide. The advance mitigation process is designed to encourage broader stakeholder participation, expedite delivery of transportation projects, provide more cost-effective use of public funds, and focus on addressing critical conservation priorities.
The RTC is pioneering improved ways for early mitigation planning for transportation improvements. This can be demonstrated by recent efforts to provide $5 million in funds through Measure D for construction of a wildlife crossing under Highway 17. The Highway 17 wildlife crossing is a partnership between Caltrans, the Land Trust of Santa Cruz County, and the Santa Cruz County Regional Transportation Commission. Caltrans will be constructing a wildlife undercrossing under Highway 17 near Laurel Curve to allow safe passage for wildlife. The wildlife crossing connects two core habitat areas that the Land Trust has protected from development. The Land Trust has solicited donations for land acquisition and construction of this project. Mitigation credits will be generated by the Highway 17 Wildlife Connectivity Project that can be used by future transportation projects for specified mitigation purposes.
The RTC is also working closely with Caltrans, the Resource Conservation District, County of Santa Cruz and natural resource agencies on the Scott Creek Lagoon Restoration and bridge replacement project. While Caltrans has slated the Scott Creek Bridge for replacement, natural resource and permitting agencies have expressed a need for substantial habitat restoration at the site. In 2013, Caltrans, the Regional Transportation Commission, the County of Santa Cruz, and the Resource Conservation District entered into an agreement to consider lagoon restoration and bridge design options. A technical advisory committee made-up of United States Army Corps of Engineers, National Marine Fisheries Service, United States Fish and Wildlife Service, National Oceanographic and Atmospheric Administration, Regional Water Quality Control Board, California Coastal Commission, the California Coastal Conservancy and the Nature Conservancy has been established to provide input on design concepts. By collaborating at an

Su m m ar y o f En vir on m ent al an d Air Q u ali t y R evie w | C H A P TE R 8
2 0 4 5 R E G I O N A L T R A N S P O R T A T I O N P L A N 8-5
early stage of the project, participants can work together to identify the best options for transportation, environmental benefits and cost, and identify potential funding sources for the project.
Mitigation banking, in-lieu of fees program, and conservation banking are all strategies that allow for advanced, regional and/or multiple-project mitigation to occur in a designated area. For example, agencies may acquire, in coordination with resource agencies and local jurisdictions, resource conservation areas as a bank for off-site mitigation of RTP transportation projects. Zayante Sandhill’s conservation bank is the only conservation bank established in Santa Cruz County. The region may consider supporting the development of additional site-specific mitigation banks or developing an umbrella mitigation bank which could include multiple bank sites. The 2045 RTP addresses the need for advanced mitigation with inclusion of an Environmental Mitigation Program (EMP) which is intended to make funds available to protect, preserve, and restore native habitat that are disturbed by construction of transportation projects listed in RTC’s RTP. EMP funds could be for uses such as, purchasing land prior to project development to bank for future mitigation needs, funding habitat improvements in advance of project development to leverage and enhance investments by partner agencies.
Once the Santa Cruz County RCIS is developed and approved by the California Department of Fish and Wildlife (CDFW), the RTC can prepare Mitigation Credit Agreements (MCAs). An MCA creates mitigation credits by implementing the conservation or habitat enhancement actions identified in the RCIS. Mitigation Credit Agreements are another advanced mitigation planning tool used to achieve goals specified in the RCIS.
Stormwater
Impervious surfaces in developed areas, such as pavement, prevent precipitation from naturally soaking into the ground. Instead, the rainwater washes into storm drains that lead directly to streams, rivers and coastal areas. The most significant impacts of this traditional design are pollutants that are washed directly into water bodies; a greater degree of erosion and flooding occur as a result of increased water volumes and flow speeds if there is no mechanism to slow or divert water; and groundwater aquifers are not replenished from storm water runoff.

C H AP T E R 8 | S u m ma r y of En vir on men ta l a nd A ir Q uali t y R evi ew
8-6 S A N T A C R U Z C O U N T Y R E G I O N A L T R A N S P O R T A T I O N C O M M I S S I O N
Addressing stormwater requirements associated with transportation projects can be very costly and can range between 2%-55% of project costs. Jurisdictions are developing systems to improve tracking of stormwater requirement related costs to provide more accurate cost estimates.
Design features intended to manage rainfall and mitigate stormwater impacts are commonly referred to as low impact design (LID). The goals of low impact design include improved filtration and reductions in flow and volume by mimicking the natural hydrologic function of healthy ecosystems in street landscapes. Examples of design features which reduce flow, volume and increase filtration include vegetated swales, infiltration and flow through planters, rain gardens, landscaped areas, streets trees, pervious pavement, infiltration trenches and dry wells, and vegetated buffer strips.
In the future, water quality and stormwater flows may be incorporated into the RTP’s analysis of a sustainable transportation system. Development of the goals, policies and targets of the 2045 RTP is structured to allow for measures of water quality and stormwater runoff as indicators of ecological function.

Su m m ar y o f En vir on m ent al an d Air Q u ali t y R evie w | C H A P TE R 8
2 0 4 5 R E G I O N A L T R A N S P O R T A T I O N P L A N 8-7
Greenhouse Gas Emissions
The Santa Cruz County Regional Transportation Commission is taking a proactive approach towards identifying strategies for reducing greenhouse gases (GHG) in the 2045 RTP. In addition to the analysis of greenhouse gas emission impacts included in the 2045 MTP/SCS EIR, the Santa Cruz County RTC voluntarily incorporated greenhouse gas emission reduction targets into the performance analysis of the RTP. Please refer to Chapter 7 for a more detailed discussion of the GHG performance analysis of the 2045 RTP.
Air Quality Conformity
The North Central Coast Air Basin (NCCAB) is made up of Santa Cruz, Monterey, and San Benito Counties. The NCCAB is defined as a federal air quality “maintenance area” because it currently meets federal air quality requirements, but previously did not. Federal air quality rules set forth by the Clean Air Act require that transportation activities are consistent with federally mandated air quality plans pertaining to on-road mobile sources (i.e., cars, trucks, buses, commuter rail, and motorcycles) as defined in the State Implementation Plan. As the designated Metropolitan Planning Organization within the region, the Association of Monterey Bay Area Governments (AMBAG) is responsible for conformity findings for transportation plans covering areas within the NCCAB.
The tri-county region (or NCCAB) has achieved federal-air quality conformity since 2005 for all criteria pollutants including carbon monoxide (CO), nitrogen dioxide (NO2), particulate matter (PM), lead (Pb), and sulfur dioxide (SO2), in addition to ozone (O3). For the RTP to be in conformity, the total emissions projected for the RTP are within the on-road mobile source emissions limits ("budgets") established by the State Implementation Plan. Since the region now qualifies as being in attainment, the region is no longer beholden to conformity analysis of its plans and programs and as such is no longer eligible to receive federal Congestion Mitigation and Air Quality (CMAQ) Improvement Program funds. However, several projects in the 2045 RTP implement the Air District’s approved Transportation Control Measures (TCM’s) for the region, which are developed to reduce transportation-related emissions by reducing vehicle use or improving traffic flow.
CONFORMITY
Air Quality Planning
Transportation Planning
State Implementation Plan (SIP)
Metropolitan Transportation Plan and Transportation Improvement
Program (TIP)

2 0 4 5 R E G I O N A L T R A N S P O R T A T I O N P L A N 9-1
CHAPTER
9 What’s Next?
The Santa Cruz County Regional Transportation Plan is updated approximately every four years to reflect new initiatives, priorities and requirements. It builds upon the work of previous initiatives, complements ongoing work, and lays the groundwork for the future. This chapter identifies several considerations that will likely be discussed in more detail in future editions of the RTP.
Climate Adaptation and Resilience
Santa Cruz County is susceptible to a wide range of climate change effects including increased temperatures, changing precipitation patterns, increased number and severity of wildfires, sea-level rise, extreme weather events, and numerous effects on biodiversity and habitats. The transportation sector has been identified as a major contributor of climate impacting greenhouse gas emissions, and in return the transportation system is impacted by increased flooding, landslides or mudslides, sea level rise, coastal and other erosion, and more frequent and intense heat waves or fires that cause roadways to buckle. Communities and people across our region will have to adjust how they respond to the impacts of climate change today and become more resilient as they face future impacts. Storms. The Central Coast Region Report in California's Fourth Climate Change Assessment projects that the variability in precipitation will increase substantially with extremely wet and dry years becoming more extreme, with the wettest day of the year expected to increase up to 35%. For example, the winter of 2016-2017 saw over 94 inches in the Santa Cruz Mountains, almost double the historical average. The mudslides, washouts, and other destruction caused by the record rainfall caused an estimated $130 million in damage to Santa Cruz County roadways and bridges, increasing the backlog of roadway maintenance by over 200 new damage sites. The historic rain and flooding also resulted in 2 washouts, embankment failures, fallen trees, landslides, and other damage along the Santa Cruz Branch Rail Line at seven sites, with a total estimated repair cost of $4.5 million.
Sea-Level Rise. Sea-level rise threatens coastal communities, natural resources, cultural sites, and infrastructure. This is a particularly critical climate stressor that impacts Santa Cruz County and includes
Damage to the Santa Cruz Branch Rail Line because of flooding during 2017 storms

C H AP T E R 9 | Wha t’ s Ne x t?
9-2 S A N T A C R U Z C O U N T Y R E G I O N A L T R A N S P O R T A T I O N C O M M I S S I O N
more extensive coastal flooding during storms, periodic tidal flooding and increased coastal erosion. Current research suggests that coastal California is expected to experience between 1.1 – 1.9 feet of sea level rise by 2050 (with a low-probability, but high impact extreme of 2.7 feet) and between 2.4 – 6.9 feet by 2100 (with a low-probability, but high impact extreme of 10.2 feet).1 Santa Cruz County's coastal cliffs are experiencing average erosion rates of 0.17 to 2.1 feet or more per year.2
Inundation of East Cliff Drive at Twin Lakes State Beach in Santa Cruz during elevated sea levels, high tides and storm waves in February 1998 (Photo: David Revell).
Wildfires. California is experiencing increased frequency of extreme fires and average area burned and many wildfires are burning hotter and more intensely than observed in recent history. The 2020 wildfires resulted in the largest wildfire season recorded in California’s modern history. In August 2020, a rare powerful lightning storm produced 11,000 bolts of lightning and started hundreds of fires in California, including a cluster of fires in the Santa Cruz Mountains that would merge to become the CZU Lightning Complex Fire. Over 40,000 acres burned in Santa Cruz County, destroying 1,490 structures, and causing $15 million in damage to county transportation infrastructure including destroyed guardrails, damaged drainage, and compromised embankments. Climate factors will affect decisions in every phase of the transportation management process: from long-range planning and investment; through project design and construction; to management and operations of the infrastructure; and system evaluation. To advance Santa Cruz County’s climate adaptation and resilience efforts, SCCRTC will work with local jurisdictions to advance regional projects that increase climate change resiliency, and analyze vulnerabilities of the transportation system, including which areas are prone to damage from storms and what is needed to keep critical infrastructure available during an emergency. The California Transportation Commission’s (CTC) 2017 RTP guidelines for Regional Transportation Planning Agencies (RTPAs) require that the RTP be consistent with California’s Climate
CZU Lightning Complex Fire Photo Credit: Alekz Londos, Good Times Santa Cruz

Wha t’ s N ex t ? | CH A P T E R 9
2 0 4 5 R E G I O N A L T R A N S P O R T A T I O N P L A N 9-3
Adaptation Strategy Report. This report outlines the state's key climate resilience priorities, includes specific and measurable steps, and serves as a framework for action across sectors and regions in California.3 The Santa Cruz County Regional Transportation Commission, in coordination with Caltrans and local jurisdictions, will need to consider the following to plan for impacts of climate change:
• Facilitate coordinated response from transportation providers to disruptions resulting from climate variability and extreme weather events;
• Develop transportation planning specifications in conjunction with accepted statewide practices concerning new construction and development, such as drainage capacity, location near shore lines, and materials;
• Identify transportation assets at high risk to impacts from climate change;
• For assets at risk, decide upon whether protection will be built around the facility, the facility will be redesigned to accommodate climate change impacts, or the facility will be abandoned and relocated elsewhere.
• Prioritize investments that protect evacuation routes; and,
• Provide guidance for more resilient building materials and design standards for transportation facilities.
The uncertainties inherent in projecting long-term impacts of climate changes coupled with the long service life of most transportation infrastructure present a challenge for transportation decision making. The economic cost associated with climate change impacts has yet to be fully estimated. Impending climate impacts have implications not only for the siting of new transportation infrastructure, but also maintenance and operation, design features of transportation systems, and emergency planning and response for extreme climate events. Because today’s transportation network will likely be in place for decades to come, investment and design decisions made today need to consider potential changes in climate conditions 30, 50, and sometimes 100 years or more from now (Figure 9.1).
Figure 9.1 – Relationship of Transportation Planning Timeframe and Infrastructure Service Life to Increasing Climate Change Impacts Source: Climate Change Science Program and the Subcommittee on Global Change Research4

C H AP T E R 9 | Wha t’ s Ne x t?
9-4 S A N T A C R U Z C O U N T Y R E G I O N A L T R A N S P O R T A T I O N C O M M I S S I O N
In 2019, Caltrans completed a Climate Change Vulnerability Assessment for District 5 that identifies sections of the highway system at greatest risk to extreme weather events related to climate change throughout the Central Coast. Caltrans has also prepared an Adaptation Priorities Report (2021), which evaluates at-risk assets and prioritizes exposed assets while exploring facility-level adaptation solutions. The prioritization in the report considers the timing of climate impacts, severity and extent, condition of each asset (a measure of the sensitivity of the asset to damage), the number of system users affected, and the level of network redundancy in the area. The RTC will monitor federal and state activities for addressing climate adaptation as well as the actions of local entities which have instituted policies and plans for addressing climate adaptation.
Autonomous Vehicles
The effects of autonomous vehicles on future transportation systems are under much debate. Autonomous vehicles (AVs) are an emerging technology that could bring a number of benefits to the transportation system including increased safety through a reduction of injuries and fatalities, increased throughput and mobility within existing capacity due to driving efficiencies, environmental benefits from smarter driving that releases fewer emissions, and improved system management through vehicle data. Conversely, there is also the potential of AVs to drastically increase traffic congestion and the amount of vehicle miles traveled particularly when self-driving vehicles no longer require a person on board. These potential benefits and challenges have not been integrated into the 2045 RTP for a number of reasons. There are many uncertainties associated with AVs including a currently unfolding set of federal and state regulations, resolution of questions around programming ethics, solutions to liability and insurance concerns, the impacts of AVs on transportation infrastructure needs, and market adoption rates.
The large Metropolitan Planning Organizations in California like San Diego Association of Governments (SANDAG) and Southern California Association of Governments (SCAG) are just beginning to incorporate autonomous vehicles into their regional transportation plans. The RTC will be following these efforts to determine how best to incorporate autonomous vehicle technology in transportation planning. The RTC updates the RTP every four years and will have numerous opportunities before AVs become common to consider appropriate policy and infrastructure investments.
Definitions
Generally, an AV is defined by the ability of the vehicle to control a safety-critical function such as steering, throttle, or braking without direct driver input.6 AVs may be truly autonomous (using only vehicle sensors) or may be connected (using communication systems such as vehicle-to-vehicle and vehicle-to-infrastructure technologies in addition to sensors). Connectivity is a critical feature to realizing the full potential benefits of AVs. AV technology is advancing at a rapid rate and not all AVs automate every vehicle function. Therefore, it is helpful to define various levels of automation.
The National Highway Traffic Safety Administration has adopted the Society of Automotive Engineers (SAE) definitions for automation which include five levels. Levels one through two include vehicles where some functions are automated such as assisted parking or adaptive cruise control, but still require a human driver to conduct some or most parts of the driving tasks. Level one and two vehicles are already common and available for purchase. Levels three to five are considered highly autonomous vehicles and are defined by the ability of the vehicle to conduct most or all of the driving tasks.7

Wha t’ s N ex t ? | CH A P T E R 9
2 0 4 5 R E G I O N A L T R A N S P O R T A T I O N P L A N 9-5
Implementation and Timeline
There are a number of factors that could influence the adoption rate of autonomous vehicles. Currently the cost of the technology is prohibitively expensive and some have argued that the legal issues regarding privacy and liability will delay implementation even if the costs were not so high. As demand grows and economies of scale are realized the costs will slowly go down, but some research concludes that even with “robotaxi” automated ride-hailing options, costs will still be higher than the average cost of vehicle ownership now.8 Regarding the legal and liability concerns, states have already started passing legislation that allows for testing and use of AVs on existing roadways. The legal framework around current vehicle systems is multifaceted and did not develop overnight but was rolled out as vehicles became more commonplace and attempts at regulating failed and then succeeded. Similarly, the legal framework for regulating AVs will slowly evolve over time and will, as most law does, look to the past as a starting point.9 Until then manufacturers of AVs will have to develop vehicles that comply with existing law and at least initially AVs will operated in mixed traffic.
There are also factors that may increase the speed of market adoption including a large amount of investor interest in rapidly evolving vehicle-to-vehicle and vehicle-to-infrastructure technology. The automotive industry’s introduction of a subscription based model of vehicle usage versus the traditional ownership models may also influence autonomous vehicle fleet mix by providing easier access to AVs thereby facilitating consumer acceptance.10, 11 Additionally, companies that retrofit older vehicles with autonomous features may increase the vehicle fleet more rapidly.12
The ability to program the AVs to make difficult decisions in the context of more complex roadways such as local roads is another area of uncertainty. On highways and expressways AVs have limited types of encounters, usually only maneuvering other vehicles or lanes and there is little variation in the right-of-way. On local roads, there are intersections, driveways, potholes, debris, animals, as well as people walking or riding a bike. The number of complex decision points on local roads soars due to more variation in the right-of-way and increased encounters with unpredictable objects. Programming for all these decision points can require consideration of some complicated ethical questions, making it more likely that lower level AVs requiring human interference and control for these types of driving environments will be introduced into the market first.
Based on an entry date of 2025, historic vehicle purchasing and turn-over rates, as well as the factors presented above, the Victoria Transport Policy Institute (VTPI) forecasts that market saturation would not occur until the 2070’s and that full self-driving vehicles (SAE Level 5) would not be commercially available until the 2030’s or 2040’s.13
Infrastructure and Planning
The presence of AVs has the potential to transform the way planners manage traffic and will require a number of significant investments in intelligent transportation system (ITS) architecture over the long term. In the short-term AVs will have minimal impacts on infrastructure requirements since they can operate in mixed traffic on existing roadways shared with conventional vehicles.
Vehicle-to-infrastructure technology would allow for public agencies to provide drivers with warnings based on information regarding known and predictable conditions such as signal phasing and timing (SPaT), work zones, transit signal priority, emergency vehicle preemption and sharp curves.14

C H AP T E R 9 | Wha t’ s Ne x t?
9-6 S A N T A C R U Z C O U N T Y R E G I O N A L T R A N S P O R T A T I O N C O M M I S S I O N
Autonomous vehicles have the potential to increase driving efficiency and therefore throughput or capacity as measured in vehicles per hour per lane (vphpl). However, until AVs constitute a large majority of the vehicle fleet, their roadway operational benefits to locations with recurring congestion may not be realized if they are mixed with traditional vehicles. To realize increased vphpl designated lanes or separate roadway facilities may be needed. However, increased roadway capacity in the form of additional designated lanes is costly and may be infeasible in locations where land and resources are limited. Additionally, as discussed above initially AVs may still need human interaction on more complex local roadways reducing their ability to increase driving efficiency on roadways other than highways.
Despite differences of opinions around timing and implementation much research now agrees that the introduction of AVs will increase vehicle miles traveled.15,16 Fully autonomous vehicles will increase vehicle use by people who could previously not drive and may cause an increase in the number of trips people make and thus the number of miles people travel if vehicles can be programmed to do errands without the need for people to be in the vehicle. Reductions in congestion due to driving efficiencies could be eliminated by increases in congestion due to increasing VMT. Increasing AV use will require the RTC and other public agencies to rethink investment strategies and policy decisions in order to determine how the triple bottom line of sustainability may be impacted.
State and Federal Policy
The responsibilities for the regulation of human driven vehicles are clearly delineated between the federal Department of Transportation’s National Highway Traffic Safety Administration (NHTSA) and the states. Currently the federal responsibilities for motor vehicles include setting and enforcing Federal Motor Vehicle Safety Standards (FMVSS), investigating and managing recalls and remedies for non-compliance, communicating and educating the public about safety issues, and issuing guidance for manufacturers to follow. State responsibilities include licensing drivers and registering vehicles, enacting and enforcing traffic laws and regulations, conducting safety inspections if they chose to do so, and regulating vehicle insurance and liability. With the introduction of AVs there may be new responsibilities that do not clearly fall within the existing parameters.
NHTSA released a policy document containing performance guidelines for highly autonomous vehicles (HAVs) in September 2016 with the acknowledgement that it is preliminary guidance intended to lay the foundation for future federal policy.17 While the guidance is not currently mandatory, manufacturers designing HAVs are subject to NHTSA’s defect, recall and enforcement authority. Some elements of the guidance may become mandatory in the near future and there will be additional augmentations to the guidance as NHTSA conducts more research. The NHTSA recommends maintaining a similar clear line of responsibilities with AVs as is currently provided for human driven vehicles. The policy document also provides a model state policy with the goal of encouraging consistency amongst states in their approach to regulating AVs. After the release of this policy document the United States Congress began considering legislation that would bar states from blocking AVs.
California currently allows for AV testing but requires licensing with the state and regular reporting on any system problems or incidents. As of August 2021, 53 different firms have permits to test AVs with a driver in California, 8 firms have permits to test without a driver, and one company, Nuro Inc. has a permit to deploy autonomous vehicles.18 The California Department of Motor Vehicles approved regulations establishing a path for post-testing deployment of full AVs, which was adopted February 26, 2018.

Wha t’ s N ex t ? | CH A P T E R 9
2 0 4 5 R E G I O N A L T R A N S P O R T A T I O N P L A N 9-7
Notes for Chapter 9
1 “2021 California Climate Adaptation Strategy,” State of Calfornia. (October 2021). https://resources.ca.gov/Initiatives/Building-Climate-Resilience/2021-State-Adaptation-Strategy-Update
2 Matthew Heberger, Heather Cooley, Pablo Herrera, Peter H. Gleick, and Eli Moore of the Pacific Institute, “The Impacts of Sea Level Rise on the California Coast,” California Climate Change Center, May 2009.
3 “California’s Climate Adaptation Strategy; Safeguarding California Plan – 2017 Update”, accessed October 2017, http://resources.ca.gov/climate/safeguarding/
4 U.S. Climate Change Science Program and the Subcommittee on Global Change Research, “Impacts of Climate Change and Variability on Transportation Systems and Infrastructure: Gulf Coast Study, Phase I,” U.S. Department of Transportation, Washington, D.C. (2008), http://climate.dot.gov/documents/gulf_coast_study.pdf.
6 United States Department of Transportation, “Automated Vehicle Research,” Office of the Assistant Secretary for Research and Technology, Intelligent Transportation Systems Joint Program Office, accessed August 2017, https://www.its.dot.gov/automated_vehicle/
7 National Highway Traffic Safety Administration (NHTSA), “Federal Automated Vehicles Policy: Accelerating the Next Revolution in Roadway Safety,” United States Department of Transportation (September 2016).
8 Todd Litman, “Autonomous Vehicle Implementation Predictions: Implications for Transport Planning,” Victoria Transport Policy Institute (July 18, 2017).
9 Dorothy J. Glancy, Robert W. Peterson, and Kyle F. Graham, “A Look at the Legal Environment for Driverless Vehicles,” Transportation Research Board National Cooperative Highway Research Program: Legal Research Digest 69 (February 2016).
10 Brian Fung, “Subscription-based car model gains traction in cities,” Chicago Tribune (March 22, 2017), accessed August 2017, http://www.chicagotribune.com/classified/automotive/sc-car-ownership-alternatives-autotips-0323-20170321-story.html
11 Cadillac and General Motors are already piloting subscription programs in urban areas.
12 Companies such as Autonomous Stuff and Drive.ai are already exploring and developing ways to retrofit vehicles to add autonomous features.
13 Todd Litman, ibid.
14 Federal Highway Administration, “Connected Vehicle Impacts on Transportation Planning Desk Reference,” (June 2016).
15 “Effect of Next-Generation Vehicles on Travel Demand and Highway Capacity,” Fehr and Peers. (February 2014).
16 Transportation Research Board, “Automated Vehicles Symposium 2016,” Transportation Research Circular: Number E-C22 (July 2017).
17 NHTSA, ibid.

C H AP T E R 9 | Wha t’ s Ne x t?
9-8 S A N T A C R U Z C O U N T Y R E G I O N A L T R A N S P O R T A T I O N C O M M I S S I O N
18 “Adopting and Adapting: State and Automated Vehicle Policy,” Paul Lewis, Gregory Rogers and Stanford Turner, Eno Center for Transportation (June 2017).

2 0 4 5 R E G I O N A L T R A N S P O R T A T I O N P L A N GA-1
Transportation Glossary & Acronym Guide
AASHTO: See American Association of State Highway and Transportation Officials
AB 2766 - Motor Vehicle Fee Program: A program that permits air districts to allocate vehicle registration surcharge fees of up to $4.00, per vehicle, per year to projects that reduce motor vehicle emissions, such as zero-emission vehicles, roundabouts/traffic circles, and trip reduction programs.
AB 32 (The Global Warming Solutions Act of 2006): California Assembly Bill (AB) which set goals to reduce the state’s greenhouse gas emissions to 1990 levels by 2020. Directs the California Air Resources Board (CARB) to develop regulations and establish a mandatory reporting system to track and monitor global warming emissions levels.
Accessible: A transportation vehicle, facility or program is accessible if it can be used by persons with disabilities through the provision of ramps, lifts, curb cuts and special equipment, planning or amenities.
ACOE: see Army Corps of Engineers
Action Element: The Action Element of the RTP consists of short and long-term activities that address regional transportation needs. All transportation modes (highways, local streets and roads, mass transportation, rail, maritime, bicycle, pedestrian and aviation facilities and services) are addressed. In addition, the Action Element identifies project priorities beyond what is already programmed.
Active Transportation: Active Transportation includes any method of travel that is human-powered, but most commonly refers to walking and bicycling.
Active Transportation Program: Funding program established in 2013 for projects that increase bicycling and walking. Consolidates several federal and state programs - including the federal Transportation Alternatives Program (TAP), Safe Routes to Schools, and Bicycle Transportation Account.
ADA: see Americans with Disabilities Act
ADT: see Average Daily Traffic
Air Quality Management Plan (AQMP): Prepared by the Monterey Bay Unified Air Pollution Control District (MBUAPCD), the region’s AQMP evaluates attainment of federal and state air quality standards within Santa Cruz, San Benito and Monterey counties.
Allocate: The process used to release funding to transportation projects.
Alternative Planning Scenario (APS): Scenario required to be developed by an MPO if the region’s sustainable communities strategy (SCS) falls short of meeting regional greenhouse gas reduction targets from passenger vehicles. Scenario showing how targets would be achieved through alternative development patterns, infrastructure, or additional transportation measures or policies.
Alternative Transportation Fuels: Low polluting fuels that are used to propel a vehicle, in place of petroleum-based gasoline or diesel fuels. Examples include biodiesel, electricity, ethanol, propane, compressed natural gas, and liquid natural gas.
AMBAG: see Association of Monterey Bay Area Governments
American Association of State Highway and Transportation Officials (AASHTO): A national nonprofit, non-partisan association

G LO SS A RY & A C RO N Y M G U I D E
GA-2 S A N T A C R U Z C O U N T Y R E G I O N A L T R A N S P O R T A T I O N C O M M I S S I O N
representing highway and transportation departments.
American Recovery and Reinvestment Act (ARRA): Federal bill approved in February 2009 aimed at creating jobs and spurring economic activity. Included funding for transportation infrastructure projects, among other non-transportation projects and programs. The RTC selected projects to receive $12 million from the Highway portion of the bill.
Americans with Disabilities Act (ADA): Federal legislation (1990) defining the responsibilities of and requirements for transportation providers to make transportation accessible to individuals with disabilities. Examples include public and private entities providing fixed-route or demand-responsive transportation services using accessible vehicles, complementary paratransit service for individuals who cannot use fixed-route service, curb cuts and other accessible sidewalk facilities.
APE: see Area of Potential Effect
Appropriate/Appropriation: A budgetary term that refers to an act by a governing body to provide budgeted funds to programs that have been previously authorized by other legislation. The amount of funding appropriated may be less than what was authorized.
APS: see Alternative Planning Strategy
AQMP: see Air Quality Management Plan
Area of Potential Effect (APE): Area in which resources may be affected by a project.
Army Corps of Engineers (ACOE): Federal agency responsible for providing engineering services, including the planning, design, construction, and operation of water resources and other civil works and military projects.
ARRA: see American Recovery and Reinvestment Act
Arterial Road System: Roads which provide corridors for through traffic movement, many of which feed into the highway network. Most are served by bus transit and have marked bicycle lanes.
Association of Monterey Bay Area Governments (AMBAG): A voluntary association of Santa Cruz, San Benito and Monterey counties and the cities therein. AMBAG has been designated as the Metropolitan Planning Organization (MPO) by the State of California and acts as the Council of Governments (COG) responsible for developing the Regional Housing Needs Assessment (RHNA) for Santa Cruz and Monterey counties.
ATP: see Active Transportation Program
Authorize: An act by Congress that creates the policy and structure of a program, including formulas and guidelines for awarding funds. Authorizing legislation (such as MAP-21) may set an upper limit on program spending or may be open ended. Revenues to be spent under an authorization must be appropriated annually by separate legislation.
Automated Vehicle Location (AVL): A device that uses the coordinates from satellites to determine the precise location of vehicles. AVL is often used to manage bus, taxi and commercial vehicle fleet operations.
Auxiliary Lane: Freeway lanes linking adjacent interchanges to reduce weaving conflicts between exiting and entering vehicles.
Average Daily Traffic (ADT): The 24-hour volume of traffic that passes a point on an “average” day. Depending on the location, ADT can be assumed to be a two-way volume. Annual ADT volumes or AADT estimate traffic volumes during an average day of the year, calculated using the average daily traffic and factoring in weekday and seasonal characteristics.

G LO SS A RY & A C RO N Y M G U I D E
2 0 4 5 R E G I O N A L T R A N S P O R T A T I O N P L A N GA-3
Average Vehicle Ridership (AVR): The average number of people per motorized vehicle. Also called Average Vehicle Occupancy (AVO).
AVL: see Automated Vehicle Location
AVO: Average Vehicle Occupancy
AVR: see Average Vehicle Ridership
B2W: Bike to Work
Base Year: Year used in performance analysis as a reference point for current conditions.
Baseline: Future scenario which includes only projects currently underway or programmed funds. The Baseline scenario functions as the “No Project” alternative in the MTP/RTP Program EIR.
Bikeway: Facility designated for use by bicyclists. There are three types of bicycle facilities.
1. Bike Path or Bike Trail (Class I Bikeway) — Provides a completely separated right-of-way designated for the exclusive use of bicyclists and pedestrians with cross-flows by motorists minimized.
2. Bike Lane (Class II Bikeway) —Provides a striped and/or signed right-of-way for use by bicycles, but with occasional adjacent vehicle parking and cross-flows by pedestrians and motorists permitted.
3. Bike Route (Class III Bikeway) — Highlights direct or scenic routes for bicyclists using signs or permanent markings. Routes may be shared with pedestrians or motorists.
Buffered Bike/Pedestrian Facility: A bicycle or pedestrian facility that has additional space between the motor vehicle travel lane and the bicycle and pedestrian facility. A buffered facility offers a more comfortable biking or walking environment.
Bus Rapid Transit (BRT): A broad term that, through improvements to infrastructure, vehicles and scheduling, attempt to use buses to provide a service that is of a higher quality than an ordinary bus line.
California Air Resources Board (CARB or ARB): State agency responsible for adopting state air quality standards, establishing emission standards for new cars sold in the state, overseeing activities of regional and local air pollution control agencies, and setting regional targets for reducing greenhouse gas emissions.
California Coastal Trail (CCT): The CCT is a network of public trails that will extend the entire 1200-mile length of the California Coast and currently is more than half complete.
California Department of Transportation (Caltrans or CT): State agency which builds and maintains state highways, some state railways, and administers multi-modal transportation programs within the state.
California Environmental Quality Act (CEQA): Legislation which requires private entities, state and local agencies to disclose, consider and mitigate the environmental impacts of various actions.
California State Association of Counties (CSAC): Agency representing the 58 county governments before the California Legislature, administrative agencies and the federal government.
California Transportation Commission (CTC): A board appointed by the governor and state legislature that sets spending priorities for highways and transit, reviews Regional Transportation Plans (RTPs) and Regional Transportation Improvement Programs (RTIPs) and allocates funds to transportation projects from several funding programs.
California Transportation Plan (CTP): A statewide, long-range transportation policy plan

G LO SS A RY & A C RO N Y M G U I D E
GA-4 S A N T A C R U Z C O U N T Y R E G I O N A L T R A N S P O R T A T I O N C O M M I S S I O N
that provides for the movement of people, goods, services, and information. The CTP offers a blueprint to guide future transportation decisions and investments that will ensure California’s ability to compete globally, provide safe and effective mobility for all persons, better link transportation and land-use decisions, improve air quality, and reduce petroleum energy consumption.
Call Box System: A network of roadside phones which link motorists directly with dispatchers to request assistance or emergency services.
Caltrans: see California Department of Transportation
Cap & Trade Program: The California Air Resources Board, as part of AB 32, has established a cap and trade program to reduce greenhouse gas emissions from all sectors. The program sets a limit or cap on the amount of a pollutant that may be emitted. Emissions permits are sold to firms which allow them the right to emit a specific volume of the specified pollutant. The total number of permits cannot exceed the cap. Although how the funds will be allocated has not been determined, it is reasonable to assume that low-carbon transportation improvements should receive a substantial share of the proceeds from the cap-and-trade program.
Capital Improvement Program (CIP): A document which sets forth the cost, funding and year of construction for projects over a specified number of years (typically five to seven years).
Capital Improvements: Physical infrastructure improvements such as pavement, sidewalks, bridges, signals and purchases of equipment, vehicles.
CARB: see California Air Resources Board
Carpool: An arrangement in which two or more people share the use of a privately-owned automobile to travel together to and from pre-
arranged destinations — typically between home and work or home and school.
Carsharing: Organized short-term auto rental, often located in downtowns, near public transit stations, residential communities and employment centers. Carsharing organizations operate fleets of rental vehicles that are available for short trips by members who pay a subscription fee, plus a per trip charge.
Categorical Exemption (CE): Classes of projects that are usually exempt from CEQA, provided that no exceptions apply.
CE: see Categorical Exemption
CEQA: see California Environmental Quality Act
Changeable Message Signs (CMS): Large overhead signs providing advisory information to travelers.
CHP: California Highway Patrol
CIP: see Capital Improvement Program
Climate Adaptation: Refers to efforts by society or ecosystems to prepare for or adjust to climate change and its impacts.
CMA: See Congestion Management Agency
CMAQ: see Congestion Mitigation and Air Quality Improvement Program
CMIA: see Corridor Mobility Improvement Account
CMS: see Changeable Message Signs
CNG: see Compressed Natural Gas
COG: see Council of Governments
Collector Streets: Streets that collect traffic from local streets, channeling it to arterials, freeways, or local destinations such as schools or shops.
COMMISSION: see Santa Cruz County Regional Transportation Commission

G LO SS A RY & A C RO N Y M G U I D E
2 0 4 5 R E G I O N A L T R A N S P O R T A T I O N P L A N GA-5
Community Traffic Safety Coalition (CTSC): A coalition of agencies and individuals that promotes bicycle and pedestrian safety, particularly for school children. Operated by the Santa Cruz County Health Services Agency and partially funded by the RTC.
Commute Solutions: Santa Cruz County’s rideshare program which provides information about transportation alternatives to the single occupant vehicle and carpool match lists.
Commute: The trip to/from a regular location, usually work or school.
Commuter Rail: Conventional rail passenger service within a metropolitan area. Service primarily is in the morning (home-to-work) and afternoon (work-to-home) travel periods.
Commuter: A person who travels regularly between home and work or school.
Complete Streets: Streets designed and operated to enable safe access for all users. Pedestrians, bicyclists, motorists, and bus riders of all ages and abilities are able to safely move along and across a complete street.
Compressed Natural Gas (CNG): A clean-burning alternative fuel for vehicles.
Conformity: A demonstration of whether a federally-supported activity is consistent with the Clean Air Act. Transportation conformity applies to plans, programs, and projects approved or funded by the Federal Highway Administration or the Federal Transit Administration.
Congestion Management Agency (CMA): State designated county-level policy body responsible for monitoring and developing a Congestion Management Plan (CMP) to measure levels of service on highways, roadways, and intersections. Santa Cruz County has opted out of the congestion management program.
Congestion Mitigation and Air Quality Improvement Program (CMAQ): Federal funding program established specifically for projects and programs that contribute to the attainment of a national ambient air quality standard. Funds distributed to regions based on population, Air Quality maintenance/attainment category and air pollution severity. Due to changes in federal air quality measurements, the Monterey Bay region is no longer eligible for these funds, but may be eligible in the future if federal standards are tightened.
Congestion: Congestion is usually defined as travel time or delay in excess of what is normally experienced under free-flow traffic conditions. Congestion is typically accompanied by lower speeds, stop-and-go travel conditions, or queuing, such as behind ramp meters or heavily-used intersections.
Consolidated Transportation Services Agency (CTSA): Agency responsible for coordinating specialized transportation services. In Santa Cruz County, the CTSA is Lift Line, a division of Community Bridges.
Constrained (Fiscal Constraint/Financially Constrained): Denotes a funding scenario under which projects, programs, expenditures in a plan or programming document that can be implemented within the constraints of committed, available or reasonably available revenue sources. This document also identifies constrained projects as “Within Projected Funds.”
Coordinated Public Transit-Human Services Transportation Plan (CPTP): A federally-required plan to serve as a unified, comprehensive strategy for the delivery of transportation services for people with disabilities, older adults, and low-income individuals. A three-county plan is approved by AMBAG.

G LO SS A RY & A C RO N Y M G U I D E
GA-6 S A N T A C R U Z C O U N T Y R E G I O N A L T R A N S P O R T A T I O N C O M M I S S I O N
Corridor Mobility Improvement Account (CMIA): Authorized by voters in 2006 as part of Proposition 1B bond to fund state highway projects that provide demonstrable congestion relief, enhanced mobility, improved safety, and stronger connectivity.
Corridor: A major transportation route which can consist of one or more highways, arterial streets, transit lines, rail lines and/or bikeways.
Council of Governments (COG): A voluntary organization of local governments that strives for comprehensive regional planning. AMBAG is the COG for Monterey and Santa Cruz counties.
County Shares: A formula in state law that requires a minimum return of STIP revenues to counties based on population and state highway miles.
CPTP: see Coordinated Public Transit-Human Services Transportation Plan
CSAC: see California State Association of Counties
CT: see California Department of Transportation
CTC: see California Transportation Commission
CTP: see California Transportation Plan
CTSA: see Consolidated Transportation Services Agency
CTSC: see Community Traffic Safety Coalition
Dedicated Funds: Federal, state or local funds which can be used only for specific purposes or by specific agencies.
Demand Responsive: Individualized transportation services requested by passengers, and/or where routes are developed around a group of requests, which may change on a daily basis. Oftentimes provided to people unable to use fixed-route buses by taxis or by advance reservation on paratransit vehicles.
Department of Transportation (DOT): At the federal level, the cabinet agency headed by the Secretary of Transportation that is responsible for highways, transit, aviation, and ports. The DOT includes the Federal Highway Administration (FHWA), the Federal Transit Administration (FTA), the Federal Aviation Administration (FAA), and other agencies. The state DOT is Caltrans.
Development Impact Fee: A fee charged to private developers, usually on a per-dwelling-unit or per-square-foot basis, used to pay for infrastructure improvements necessitated as a result of the development.
Discretionary Funds: Federal, state and local funds which can be used for a variety of purposes. Sometimes also referred to as “flexible funds.”
DMV: CA Department of Motor Vehicles
DOT: see Department of Transportation
EA: see Environmental Assessment
EB: Eastbound
ED: see Environmental Document
EJ: see Environmental Justice
EIR: see Environmental Impact Report
EIS: see Environmental Impact Statement
EMFAC - Emission Factor: Model that estimates on-road motor vehicle emission rates for current year as well as backcasted and forecasted inventories.
EMS: see Extinguishable Message Sign
Environmental Assessment (EA): A document that serves to briefly provide sufficient evidence and analysis for determining whether to prepare an EIS or FONSI for federal-aid projects. It is the federal equivalent of the CEQA term “initial study.”

G LO SS A RY & A C RO N Y M G U I D E
2 0 4 5 R E G I O N A L T R A N S P O R T A T I O N P L A N GA-7
Environmental Document (ED): The draft or final Environmental Impact Statement or Environmental Impact Report, Finding of No Significant Impact, Environmental Assessment or Negative Declaration.
Environmental Impact Report (EIR): An assessment of the environmental effects and mitigations for a proposal or decision which, under the California Environmental Quality Act (CEQA), has been determined may significantly impact the environment.
Environmental Impact Statement (EIS): Document that details any adverse economic, social and environmental effects of a proposed transportation project prepared pursuant to the National Environmental Policy ACT (NEPA), roughly analogous to an EIR under CEQA.
Environmental Justice (EJ): The fair treatment and meaningful involvement of all people regardless of race, color, national origin, or income with respect to the development, implementation, and enforcement of environmental laws, regulations, and policies. EJ principles include ensuring that planned transportation improvements do not have a disproportionate adverse impact on low income or other under-represented groups, and that minority and low-income populations receive equal benefits, on an equally timely basis, as other populations.
EPA - Environmental Protection Agency: Federal agency established to develop and enforce regulations that implement environmental laws enacted by Congress to protect human health and safeguard the natural environment.
Excise Tax: Excise taxes are taxes paid when purchases are made on a specific good, such as fuel. Excise taxes are often included in the price of the product.
Expenditure: In transportation terms, this is any allowable expense associated with a project or program.
Expressway: A divided highway for high-speed traffic with at least partial control of access. In some areas, expressways are divided arterial roads with limits on the frequency of driveways and intersecting cross-streets. In other area, access to expressways is limited only to grade-separated interchanges, making them the full equivalent of freeways.
Extinguishable Message Sign (EMS): Signs along roadways that provide advisory messages or direct motorists to Highway Advisory Radio broadcasting current information about traffic conditions.
FAA: see Federal Aviation Administration
Farebox Recovery Ratio: The proportion of public transit operating expenses covered by passenger fares. The ratio divides the farebox revenue (cash, tickets, and passes) by the total operating expenses.
Federal Aviation Administration (FAA): The federal agency that regulates the use of airspace and is responsible for evaluating and disseminating information about hazards and obstructions to aviation.
Federal Highway Administration (FHWA): The federal agency responsible for the approval of transportation projects related to the roadway system.
Federal Railroad Administration (FRA): Federal agency created to promulgate and enforce rail safety regulations, administer railroad assistance programs, conduct research and development in support of improved railroad safety and national rail transportation policy, and consolidate government support of rail transportation activities.

G LO SS A RY & A C RO N Y M G U I D E
GA-8 S A N T A C R U Z C O U N T Y R E G I O N A L T R A N S P O R T A T I O N C O M M I S S I O N
Federal Transit Administration (FTA): The federal agency responsible for administering federal transit funds and assisting in the planning and establishment of mass transportation systems.
Federal Transportation Improvement Program (FTIP): Federally required multi-year capital improvement program listing projects using federal funds and major highway, transit, and active transportation projects including project costs, funding sources, and development schedules. AMBAG prepares the FTIP in the Monterey Bay area and refers to this document as the Metropolitan Transportation Improvement Program (MTIP).
FHWA: see Federal Highway Administration
Financial Element: A required component of the RTP, the financial element identifies the current and anticipated revenue sources available to fund the constrained transportation investments described in the Action Element. The intent of the Financial Element is to define realistic financing constraints and opportunities.
Finding of No Significant Impact (FONSI): Federal environmental document (NEPA) term roughly analogous to Negative Declaration under CEQA.
Fiscal Year (FY): The 12-month period established for budgeting purposes. The fiscal year for state and most local governments in California begins July 1 and ends June 30. The federal fiscal year begins October 1 and ends September 30.
Fixed Guideway: A term for transportation modes that feature guidance along a fixed structure, such as a track, a concrete channel, or a cable. Examples include diesel powered railroad trains, electrified light rail trolleys,
monorails, funiculars, gondolas, and people movers.
Fixed Route Service: Service provided on a regular, fixed-schedule basis along a specific route.
Fixed Route: A fixed route is a bus transit route in which a vehicle operates on a regular, fixed- schedule along a specific route, with vehicles stopping to pick up and deliver passengers at specific locations.
Flex Hours: Work hours which allow an employee to work a non-standard work schedule and commute during non-peak hours. Common examples include the 4/10 where an individual works four 10-hour days per week or the 9/80 where an individual works longer hours each day with one day off every other week.
FONSI: see Finding of No Significant Impact
Freeway Service Patrol (FSP): Roving tow truck service that clear incidents on roadways during peak travel periods.
Freeway: A divided arterial highway designed for the unimpeded flow of large traffic volumes. Access to a freeway is controlled and intersection grade separations are required.
FSP: see Freeway Service Patrol
FTA: see Federal Transit Administration
FTIP: see Federal Transportation Improvement Program
FY: see Fiscal Year.
Gas Tax: The tax applied to each gallon of fuel sold. In California this is also call the Motor Vehicle Fuel Tax or Highway Users Tax Account (HUTA).
General Plan: A policy document required of California cities and counties by state law that describes a jurisdiction’s future development in general terms, and includes policy statements

G LO SS A RY & A C RO N Y M G U I D E
2 0 4 5 R E G I O N A L T R A N S P O R T A T I O N P L A N GA-9
and maps. Land use decisions must be derived from the document, which includes seven mandatory elements: Land Use, Circulation, Housing, Conservation, Open Space, Noise, and Safety.
GHG: see Greenhouse Gas
GIS - Geographic Information System: Mapping software that links information about where things are with information about what things are like. GIS allows users to examine relationships between features distributed unevenly over space, seeking patterns that may not be apparent without using advanced techniques of query, selection, analysis, and display.
Grade Crossing: A crossing or intersection of highways, railroad tracks, other guideways, or pedestrian walks, or combinations of these at the same level or grade.
Greenhouse Gas (GHG): Any of the atmospheric gases that contribute to the greenhouse effect by absorbing infrared radiation produced by solar warming of the Earth's surface. Include carbon dioxide, methane, nitrous oxide, hydrofluorocarbons, perfluorocarbons, and sulfur hexafluoride.
HAR: see Highway Advisory Radio
HBR: see Highway Bridge Program
HCM: see Highway Capacity Manual
Headquarters (HQ): The main offices in Sacramento of the California Department of Transportation (Caltrans), a government agency in California charged with improving mobility across the state.
Headways: Time interval between transit vehicles traveling the same direction on the same route; i.e., 15-minute or 2-hour headways indicates service every 15 minutes or every 2 hours.
High Occupancy Toll (HOT) Lanes: A lane on a multi-lane highway designated for use, primarily in the peak periods, free of charge by vehicles with two or more occupants or for single-occupant vehicles paying a toll.
High Occupancy Vehicle (HOV) Lanes (or Diamond Lanes): A lane on a multi-lane highway designated for use, primarily in the peak periods, only by vehicles with more than one (or sometimes two) occupants – such as carpools, vanpools, shuttles, and buses. In California, motorcycles, emergency vehicles, and certain low/zero emissions vehicles may also use HOV lanes.
Highway Advisory Radio (HAR): Radio station providing updated information on traffic conditions.
Highway Bridge Program (HBR): Federal funding program administered by Caltrans for bridge replacement or rehabilitation on public roads.
Highway Capacity Manual (HCM): Provides information for many transportation facilities and modes, including techniques for estimating the number of vehicles that can fit in a roadway (capacity), Level of Service, and design characteristics.
Highway Safety Improvement Program (HSIP): Formerly the Hazard Elimination and Safety Program (HES). Federal funding program administered by Caltrans for improving safety.
Highway: A general term which includes roads, streets, and parkways and all their appurtenances. In this document “highway” typically refers only to roads on the State Route System however (e.g. Highway 17).
HOT: see High Occupancy Toll Lanes
HOV: see High Occupancy Vehicle Lanes
HPMS - Highway Performance Monitoring System: A federally mandated program

G LO SS A RY & A C RO N Y M G U I D E
GA-10 S A N T A C R U Z C O U N T Y R E G I O N A L T R A N S P O R T A T I O N C O M M I S S I O N
designed by FHWA to assess the performance of the nation’s highway system. Includes data on public roadways.
HQ: Headquarters
HSIP: see Highway Safety Improvement Program
HSR - High Speed Rail: Railroad passenger service that, as defined by California state law, operates at maximum speeds of more than 200 miles per hour. Because of the speed, high speed rail normally operates on intercity (longer) routes.
HUTA: Highway Users Tax Account. See Gas Tax
Infill Development: Development of land within an established urbanized area.
Initial Study: Under CEQA, a systematic review of a proposed project undertaken to determine whether there is substantial evidence that it may result in one or more significant impacts.
In-Lieu Fee (ILF) Mitigation: A permittee pays a fee to the operator of the ILF program instead of conducting project-specific mitigation. An ILF program typically combines fees collected from a number of permittee's projects to finance a mitigation project.
Intelligent Transportation System (ITS): A general classification of transportation technologies, management tools, and services made possible through advances in computer and communication technologies. Examples include real-time information about traffic incidents, dynamic curve warning signs, and the guidance of vehicles through remotely controlled equipment.
Interagency Technical Advisory Committee (ITAC): An RTC committee consisting of representatives from planning and public works departments, transit, UCSC and Cabrillo College, transportation management
associations, the Air District, and other entities who review and make recommendations about regional plans, projects, and funding.
Intercity Rail: Railroad passenger service that primarily serves longer trips, such as those between major cities or regions.
Inter-modal: Using or addressing inter-connections between various transportation facilities or modes.
Interregional Transportation Improvement Program (ITIP): A state funding program designated to receive 25% of funds programmed in the STIP (the other 75% are RTIP funds). Available for major state highway and passenger rail routes which link regions. Projects are proposed by Caltrans and subject to CTC approval.
IS: see Initial Study
ISTEA: Inter-modal Surface Transportation Efficiency Act. Federal funding and authorization bill that governed federal surface transportation spending 1991-1997.
ITAC: see Interagency Technical Advisory Committee
ITIP: see Interregional Transportation Improvement Program
ITS: see Intelligent Transportation Systems
Jobs/Housing Balance: The interrelationship between the location and type of housing versus the location and type of jobs in a region. This interrelationship has implications for transportation demand.
JPA - Joint Powers Authority: Two or more agencies that enter into a cooperative agreement to jointly wield powers that are common to them. JPAs are a vehicle for the cooperative use of existing governmental powers to finance and provide infrastructure and/or services in a cost-efficient manner.

G LO SS A RY & A C RO N Y M G U I D E
2 0 4 5 R E G I O N A L T R A N S P O R T A T I O N P L A N GA-11
Key Destinations: Eleven locations of employment and commercial centers identified throughout Santa Cruz County for use in target analysis.
LCP: see Local Coastal Program
Level of Service (LOS): A qualitative assessment of a facility’s operating conditions. The extent or degree of service provided by, or proposed to be provided by, a facility based on and related to the operational characteristics of the facility. Level of Service indicates the capacity per unit of demand for each public facility. For automobiles, LOS ratings typically range from LOS A, which represents free-flow conditions, to LOS F, which is characterized by heavy congestion, stop-and-go traffic, and long queues forming behind breakdown points.
Light Rail: A passenger transportation system of self-propelled vehicles that operate over steel rails located in the street, on an aerial structure, or on a separated right of way.
Liquefied Natural Gas (LNG): A cleaner burning liquid fuel derived from a natural gas that is cooled to below its boiling point so it becomes a liquid. Santa Cruz METRO converts LNG to Compressed Natural Gas (CNG) to operate most of its buses.
LNG: see Liquefied Natural Gas
Local Coastal Program (LCP): Local Coastal Programs are basic planning tools used by local governments to guide development in the coastal zone, in partnership with the Coastal Commission.
Local Jurisdictions: The four cities (Capitola, Santa Cruz, Scotts Valley and Watsonville) and the (unincorporated) County of Santa Cruz, each of which has its own elected decision-makers, planning and public works departments, and control over land-use decisions within its boundaries.
Local Streets: Streets that provide direct access to adjacent residential areas, on which through traffic is generally discouraged.
Local Transportation Commission (LTC): Established under SB 325 to allocate Transportation Development Act (TDA) revenues and designated under AB 69 as the regional transportation planning agency (RTPA). The Santa Cruz County Regional Transportation Commission is the LTC for Santa Cruz County.
LOS: see Level of Service/Level of Service Standard
Low Emission Vehicles: Vehicles using alternative fuel sources which emit little or no tailpipe exhaust, e.g., electric, hybrid electric, and fuel cell.
LTC: see Local Transportation Commission
LTF: Local Transportation Funds. See Transportation Development Act
Maintenance Area: Area which, at one time did not, but now does meet current state or federal air quality standards.
Major Transportation Investment Study (MTIS): An analysis of project alternatives formerly required to receive federal and state funds. An MTIS was completed in 1999 for the Watsonville-Santa Cruz-UCSC corridor.
MAP-21 - Moving Ahead for Progress in the 21st Century: Federal transportation act signed into law on July 6, 2012. Successor bill to SAFTEA-LU (2005), MAP-21 consolidated several funding programs and establishes requirements for transportation planning and project implementation.
Mass Transit: A common carrier service provided for transporting passengers on established routes, with fixed schedules, published rates of fares. Includes buses and rail.

G LO SS A RY & A C RO N Y M G U I D E
GA-12 S A N T A C R U Z C O U N T Y R E G I O N A L T R A N S P O R T A T I O N C O M M I S S I O N
MBSST Network: see Monterey Bay Sanctuary Scenic Trail Network
MBUAPCD: see Monterey Bay Unified Air Pollution Control District
Metro: see Santa Cruz Metropolitan Transit District
Metropolitan Planning Organization (MPO): A federally-designated agency responsible for monitoring and planning associated with regional employment, residential and transportation. AMBAG is the MPO for Santa Cruz County as part of the three-county Monterey Bay region.
Metropolitan Transportation Plan (MTP): The federally-mandated transportation plan for the tri-county Monterey Bay region, composed of transportation projects from the transportation plans from Santa Cruz, Monterey and San Benito counties prepared by AMBAG. With SB375, also includes the regional Sustainable Communities Strategy (SCS).
Mitigation: Project or program intended to offset impacts of a transportation project on an existing natural resource such as a stream, wetland, and/or endangered species.
Mitigation Banking: The preservation, enhancement, restoration or creation of a wetland, stream, or habitat conservation area which offsets, or compensates for, expected adverse impacts to similar nearby ecosystems.
Mixed Flow Lane: Travel lanes shared by autos, trucks, buses, and motorcycles (as compared to restricted lanes, such as HOV lanes).
Mixed Use: Combining of commercial, office, and/or residential land uses to reduce travel distances and facilitate walking. Examples include multi-story buildings containing businesses and retail stores on the lower floors, and homes on the upper floors.
MMLOS: see Multimodal Level of Service
Mode Split or Mode Share: The proportion of total travel in each travel mode.
Mode: Method of travel, e.g., private automobile, walking, bicycle, transit, airplane, bus, train.
Monterey Bay Sanctuary Scenic Trail (MBSST) Network: A planned recreation, transportation and interpretive pathway that links existing and new trail segments into a continuous coastal trail around the Monterey Bay, from Lover’s Point in Monterey County to the San Mateo County line in Santa Cruz County.
Monterey Bay Unified Air Pollution Control District (MBUAPCD or Air District): Agency responsible for implementing and enforcing state and federal air quality regulation in Santa Cruz, Monterey and San Benito counties.
MPO: see Metropolitan Planning Organization
MTD: see Santa Cruz Metropolitan Transit District
MTIP: Metropolitan Transportation Improvement Program. See Federal Transportation Improvement Program.
MTIS: see Major Transportation Investment Study
Multimodal Level of Service (MMLOS): A way to measure the degree to which street design and operations meets the traveling needs of each user type – automobile, bus, pedestrian, bicycle, etc.
Multi-modal: Using or addressing more than one transportation mode.
National Environmental Policy Act (NEPA): Federal law identifying environmental disclosure requirements. Required to be followed on projects using federal funds.
National Highway System (NHS): A federally established national road system. In Santa Cruz County, the NHS includes sections of Highway

G LO SS A RY & A C RO N Y M G U I D E
2 0 4 5 R E G I O N A L T R A N S P O R T A T I O N P L A N GA-13
1, Highway 17, Highway 129, Highway 152, 41st Avenue, Capitola Road, Freedom Boulevard, Graham Hill Road, Mt. Hermon Road, Ocean Street, Soquel Avenue and other major arterials.
NB: Northbound
ND: see Negative Declaration
Negative Declaration (ND): A determination based upon an initial study that there is no substantial evidence that a proposed project may result in a significant effect.
NEPA: see National Environmental Policy Act
NHS: see National Highway System
Non-Attainment Area: An air basin which does not meet existing state or federal air quality standards.
O&M: Operations and Maintenance. The range of activities and services provided by the transportation system and for the upkeep and preservation of the existing system.
Obligate: The act of securing commitment from Federal or State government (e.g. FHWA or Caltrans) to pay or reimburse entities for a project's eligible costs. Many funding programs require a project sponsor to obligate funds in a timely manner or lose the funds.
Off-Peak Period: The time of day when the lowest concentration of travels are using a transportation facility. These times are generally before 6 a.m., mid-day, and after evening commute hours.
Open Space: Generally understood as any area of land or water which is not developed for urbanized uses. In General Plans areas may be designated as Open Space for the purposes of the preservation or managed production of natural resources, outdoor recreation, or the promotion of public health and safety.
Operations: On-going activities necessary to manage and perform services for a system, such
as labor costs. For transit, costs include fuel, salaries and replacement parts.
Overall Work Program (OWP): Budgetary document describing proposed activities for the upcoming fiscal year, including those required by federal and state law.
OWP: see Overall Work Program
Paratransit: Term used to describe transportation services which operate on flexible routes and/or provide demand-responsive service, and is most frequently used by elderly and disabled passengers unable to take fixed route transit. Generally vans, small buses, or taxis are used to provide this service. The ADA-mandated service in our region is ParaCruz and is provided by the METRO. Another main provider is Community Bridges Lift Line.
Park-and-Ride Lot: A facility where individuals can meet to utilize carpools, vanpools, and transit to continue traveling to their destinations.
Parking Management: Strategies which use parking supply or pricing as an incentive or disincentive to affect the demand for parking. Preferred parking for carpools is an example of a parking management incentive, and charging parking fees is an example of a disincentive.
Passenger Miles: The total number of passengers carried by a transit system, multiplied by the number of miles each passenger travels. Passenger miles are normally measured on a daily or annual basis.
Pavement Condition Index (PCI): A numerical index between 0 and 100 used to indicate the general condition of a pavement with 0 representing the worst possible condition and 100 representing the best possible condition.
Pay as You Drive (PAYD) Insurance: A type of automobile insurance whereby the costs are

G LO SS A RY & A C RO N Y M G U I D E
GA-14 S A N T A C R U Z C O U N T Y R E G I O N A L T R A N S P O R T A T I O N C O M M I S S I O N
dependent upon type of vehicle used, and measured against time, distance and location.
Peak Periods: The hours during which the greatest traffic volumes or highest transit use occur.
PeMS - Performance Monitoring System: The PeMS program uses urban freeway data collected through freeway loop detectors to provide current, ongoing data on freeway volumes and speeds that can be displayed graphically and exported to other monitoring applications.
Performance Based Planning: An approach that uses performance measures to support investment decisions to help achieve desired outcomes.
Performance Measures (or Evaluation Measures or Targets): Objective, quantifiable measures used to evaluate the performance of the transportation system, and to determine how well planned improvements to the system are achieving established objectives.
Person Trip: Any person’s one-way travel to any destination for any purpose. More specifically, a trip is the one-way movement from an origin to a destination, whereby each trip has two trip ends.
“Planned” Projects: Projects on the Constrainted/within projected funds RTP list which have not previously been approved for funding by the RTC. Projects are expected to be funded through 2035.
Policy Element: A required component of the RTP, the policy element clearly conveys the region’s transportation goals and policies.
Primary Transportation Network: Includes state highways, principal arterials and rail line in Santa Cruz County.
Program: verb- to assign funds to a project.
Program Environmental Impact Report (PEIR): Environmental review process used to evaluate the potential environmental effects of large-scale plans or programs.
“Programmed” Projects: Projects on the Constrained/within projected funds list for which funding has already been approved by the RTC. These projects will be initiated and/or completed by 2019.
Project Study Report (PSR): A preliminary engineering report that documents agreements on the scope, a set of reasonable and feasible alternatives, the schedule, and the estimated cost of a project so that the project can be included in a future State Transportation Improvement Program (STIP).
Proposition 1A: Bond measure passed by voters in November 2008 authorizing $9.95 billion to the California High-Speed Rail Authority to construct the core segments of the rail line from San Francisco to the Los Angeles area.
Proposition 1B: Bond measure passed by voters in November 2006 authorizing $27 billion in bonds distributed to highway, local road, and transit projects through a combination of competitive and formula programs.
Proposition 116: Bond measure passed by voters in June 1990 providing $1.9 billion in funds primarily for rail projects, but also included funds for paratransit vehicles, bicycle facilities, and ferries. $11 million was earmarked for Santa Cruz County rail projects.
PSR: see Project Study Report
Rail Transit: Public transportation services provided on a fixed rail line, e.g., light rail.
Ramp Metering: Electronic traffic control devices located at freeway access points to meter the entry of vehicles onto the freeway. The goal is to help optimize the movement of persons and vehicles.

G LO SS A RY & A C RO N Y M G U I D E
2 0 4 5 R E G I O N A L T R A N S P O R T A T I O N P L A N GA-15
RDA: see Redevelopment Agency
Redevelopment Agency (RDA): Originally established by local ordinances to assist a specifically designated area with capital improvement projects intended to revitalize the area, RDAs were dissolved in 2012 as part of the California State Budget Act (2011).
Regional Blueprint: Collaborative planning processes that engage residents of a region in articulating a vision for the long term future of their region. The goal of the process is to develop a preferred growth scenario that can guide regional and local land use and transportation.
Regional Housing Needs Assessment (RHNA): Quantifies the need for housing within each jurisdiction of the AMBAG region based on population growth projections. Communities then address this need through the process of completing the housing elements of their General Plans.
Regional Surface Transportation Program (RSTP): A flexible federal funding program initially established by ISTEA and distributed to regions based on population formula to fund transit, highway, and local streets and roads projects.
Regional Surface Transportation Program Exchange (RSTPX): Regional Surface Transportation Program funds (federal) exchanged for state funding.
Regional Transportation Improvement Program (RTIP): The state required multi-year capital improvement program for transportation projects using state and federal funds. The RTIP for Santa Cruz County is adopted by the SCCRTC and is submitted to the California Transportation Commission for inclusion in the State Transportation Improvement Program (STIP) and to AMBAG for inclusion in the FTIP.
Regional Transportation Plan (RTP): The state-mandated long-range plan that acts as a blueprint to guide transportation development. Developed by regional transportation planning agencies, it includes a policy, action, and financial elements. The SCCRTC prepares and adopts the RTP for Santa Cruz County. The RTP must be consistent with other local plans.
Regional Transportation Planning Agency (RTPA): Agencies designated by the State of California to provide regional transportation planning and make funding decisions, including preparation of the Regional Transportation Plan and the Regional Transportation Improvement Program. The Santa Cruz County Regional Transportation Commission is the designated RTPA for Santa Cruz County.
Regional Travel Demand Model (RTDM): A computer software program using demographic data to estimate the transportation impacts of population growth and land use decisions on the transportation system, and to assess the utility of transportation projects.
Reverse Commute: Travel in the direction opposite to the main flow of peak period commute traffic.
RHNA: see Regional Housing Needs Assessment
Ridership: The number of transit users, usually reported as a yearly total or as the average for a normal workday.
Rideshare: Alternatives to driving alone, including carpooling, vanpooling, taking the bus, bicycling, walking and telecommuting.
Right-of-Way (ROW): The area of property owned by a public or private entity used for transportation purposes.
ROW: see Right-of-Way
RPA: see Rural Planning Assistance

G LO SS A RY & A C RO N Y M G U I D E
GA-16 S A N T A C R U Z C O U N T Y R E G I O N A L T R A N S P O R T A T I O N C O M M I S S I O N
RSTP: see Regional Surface Transportation Program
RSTPX: see Regional Surface Transportation Program Exchange
RTC: see Santa Cruz County Regional Transportation Commission
RTDM: see Regional Travel Demand Model
RTIP: see Regional Transportation Improvement Program
RTP: see Regional Transportation Plan
RTPA: see Regional Transportation Planning Agency
Rural Planning Assistance (RPA): Funds awarded by the California Department of Transportation (Caltrans) annually for use by the Regional Transportation Planning Agency.
Safe Routes to Schools: Initiatives, such as education, encouragement campaigns, and infrastructure improvements, that make it easier and safer for children to walk and bicycle to school.
Safe Routes to Transit: Strategies to address the challenges of getting to and from a transit stop or station. These include sidewalks and curb cuts to bus stops, pedestrian crosswalks near transit stations, bicycle lanes that connect to transit and bike parking at transit stations, feeder-distributor bus/shuttle routes, car sharing/station cars, and ridesharing.
Safe, Accountable, Flexible, Efficient Transportation Equity Act: A Legacy for Users (SAFETEA-LU): Funding and authorization bill from 2005-2012 that governed federal surface transportation spending.
SAFE: see Service Authority for Freeway Emergencies
SAFETEA-LU: see Safe, Accountable, Flexible, Efficient Transportation Equity Act: A Legacy for Users
Santa Cruz County Regional Transportation Commission (SCCRTC or RTC): Transportation policy, planning and funding body designated as the Regional Transportation Planning Agency (RTPA), Local Transportation Commission (LTC), Rail/Trail Authority and Service Authority for Freeway Emergencies (SAFE) for Santa Cruz County.
Santa Cruz METRO: see Santa Cruz Metropolitan Transit District
Santa Cruz Metropolitan Transit District (SCMTD or METRO): The public transit operator for Santa Cruz County. Also known as Santa Cruz Metro.
SB: Southbound
SB 45: California Senate Bill (Chapter 622, Statutes of 1997, Kopp) that mandated major transportation reforms impacting transportation planning, funding and development. Transferred from the state to the regions more authority in deciding how to invest transportation funds. Established current STIP process.
SB 375 (2008): Established to implement the state’s greenhouse gas (GHG) emission-reduction goals, as set forth by AB 32, in the sector of cars and light trucks. Requires California's Air Resources Board (CARB) to develop regional reduction targets for greenhouse gas emissions (GHG), and requires MPO’s to develop "Sustainable Community Strategies" (SCS) to reduce emissions from vehicle use through integrated land use and transportation planning.
SCCRTC: see Santa Cruz County Regional Transportation Commission

G LO SS A RY & A C RO N Y M G U I D E
2 0 4 5 R E G I O N A L T R A N S P O R T A T I O N P L A N GA-17
Scenario Planning: A decision making tool to help identify the projects that are prioritized in a transportation plan. Scenario planning allows a community to evaluate the likely outcomes of a number of scenarios to explore possible benefits and costs of alternative futures.
SCMTD: see Santa Cruz Metropolitan Transit District
SCS: see Sustainable Communities Strategy
Self-Help Counties: A term used to describe counties that have enacting local voter-approved funding mechanisms -- such as half-cent sales taxes -- to pay for transportation improvements.
Service Authority for Freeway Emergencies (SAFE): As the designated SAFE for Santa Cruz County, the SCCRTC owns and manages the call box system on local state highways and other motorist aid programs. Funded by $1-per-year vehicle registration fee.
SHOPP: see State Highway Operations and Protection Program
Signal Preemption: A system used for emergency and public transit vehicles to change signal phasing from red to green allowing for more rapid crosstown access.
SOV - Single Occupant Vehicle: Privately operated vehicle that contains only one driver or occupant.
Specialized Transportation: Often used synonymously with “paratransit,” refers to vehicle and programs operated primarily for the elderly and persons living with disabilities. Service is generally provided door-to-door in vans or automobiles on a semi-fixed route or demand- responsive basis.
SRTP: see Short Range Transit Plan
STA: see State Transit Assistance
STARS: see Sustainable Transportation Analysis & Rating System (STARS)
State Highway Operation and Protection Program (SHOPP): State plan and funding program to maintain the operational integrity and safety of the state highway system. It includes primarily rehabilitation, safety, and operational improvement projects.
State Transit Assistance (STA): State funding program for mass transit operations and capital projects. As of March 2010, funds derived from statewide sales tax on diesel fuel, distributed based on population.
State Transportation Improvement Program (STIP): A multi-year program of transportation projects to be funded with various state and federal revenues. Adopted biennially by the California Transportation Commission (CTC), based on projects proposed in RTIPs and from Caltrans (ITIP). Funds distributed to regions based 75% on population and 25% on highway miles.
Statewide Integrated Traffic Records System (SWITRS): Database of collisions managed by the California Highway Patrol.
STIP: see State Transportation Improvement Program
STP: see Surface Transportation Program
Surface Transportation Program (STP): Federal flexible funding program that may be used by states and localities for projects on any federal-aid highway (includes road, bike, pedestrian, highway), bridge projects on any public road, transit capital projects, and intracity and intercity bus terminals and facilities.
Sustainability: Sustainability is defined as balancing economic, environmental and equity interests. Sustainability creates and maintains the conditions under which humans and nature can exist in productive harmony, that permit fulfilling the social, economic and other requirements of present and future generations.

G LO SS A RY & A C RO N Y M G U I D E
GA-18 S A N T A C R U Z C O U N T Y R E G I O N A L T R A N S P O R T A T I O N C O M M I S S I O N
Sustainable Community Strategies (SCS): An element of the MTP, as required by SB 375, that demonstrates how development patterns and the transportation network, policies, and programs can work together to achieve the state’s targets for reducing regional greenhouse gas (GHG) emissions from cars and light trucks in a region.
Sustainable Transportation Analysis & Rating System (STARS): An integrated planning framework for transportation plans and projects. Used by planners, communities and decision-makers to evaluate the impacts of transportation plans and projects, identify innovative strategies and improve decision-making.
System Preservation: The maintenance of the existing transportation system.
Targets: For this RTP, targets are measurable objectives for achieving goals. Targets are a decision support tool linking policies and projects to goals, assessing performance trends, and provide the opportunity to make adjustments in priorities. Consistent with backcasting, establishing targets involves setting desirable future objectives first then determining the degree to which investments will meet objectives, rather than relying on demand based forecasts to direct the planning and investments.
TAZ: see Traffic Analysis Zone
TCM: see Transportation Control Measure
TCRP: Transportation Congestion Relief Program
TDA: see Transportation Development Act
TDM: see Transportation Demand Management
TEA: see Transportation Enhancement Activities
TEA-21: see Transportation Equity Act for the 21st Century
Telecommute (or Telework): Conducting some or all of daily work activities from a location
other than the normal worksite, usually from home or remote site, and often with the assistance of telecommunications equipment. Employees sometimes referred to as teleworkers or e-workers.
TIA: see Transportation Improvement Area
TMA: see Transportation Management Association
TMC: Traffic Management Center. Monitors roadways using closed circuit cameras, loop detectors and information from the CHP and field staff. Posts and updates messages on traffic conditions on various systems, including the 511 telephone number, road signs, and websites.
TOD: see Transit-Oriented Development
TOS: see Traffic Operations System
TPP: see Transit Priority Project
Traffic Analysis Zone: A geographic unit used for transportation modeling. A TAZ is smaller than a census tract and a Trip Distribution Zone (TDZ).
Traffic Operations System (TOS): A system of highway communications equipment to monitor traffic conditions and relay traveler information in real time.
Transit: Travel by bus, rail, or other vehicle, either publicly or privately owned, that provides general or specialized service on a regular or continuing basis.
Transit Dependent: An individual who because of age, income, physical/mental condition, geographic location, or personal choice, does not have a private vehicle available and relies on transit for his/her transportation needs.
Transit-Oriented Development (TOD): Residential and employment growth that occurs near existing and planned public transit facilities.

G LO SS A RY & A C RO N Y M G U I D E
2 0 4 5 R E G I O N A L T R A N S P O R T A T I O N P L A N GA-19
Transit Priority Project (TPP): Under SB 375, a project that (1) contains at least 50 percent residential use (commercial use, if any, must have floor area ratio of not less than 0.75); (2) have a minimum net density of 20 units per acre; and (3) be located within one-half mile of a major transit stop or high-quality transit corridor included in the MTP. TPP may be exempt from CEQA.
Transportation Control Measure (TCM): A project or program intended to reduce air pollution generated by automobiles.
Transportation Demand Management (TDM): Strategies to reduce demand by automobiles on the transportation system, by promoting telecommuting, flex-time, bicycling, walking, transit use, staggered work hours, and ridesharing.
Transportation Development Act (TDA): State law enacted in 1971. Local TDA funds (or Local Transportation Funds – LTF) are generated from a one-quarter of one percent state sales tax. Revenues are allocated annually to support transportation planning and administration, transit, transportation for the elderly/disabled, bikeway and pedestrian projects, based on state law and RTC rules and regulations.
Transportation Disabled: People who cannot use public transportation easily or at all because of physical, emotional, or mental limitations.
Transportation Disadvantaged: People who have significant unmet transportation needs. May include people experiencing poverty, people experiencing language barriers, people of color, older adults, youth and people with disabilities who experience a disproportionately small share of benefits from transportation investments, particularly because traditional transportation investments prioritize vehicles.
Transportation Enhancements (TE): Former federal funding program for pedestrians and
bicycles facilities, scenic beautification, historic preservation, preservation of abandoned railway corridors, archaeological planning and research, and mitigation of water pollution due to highway runoff. Eliminated in 2012 and replaced by the Transportation Alternatives Program (TAP).
Transportation Equity Act for the 21st Century (TEA-21): Federal funding and authorization bill from 1998-2005 that governed federal surface transportation spending.
Transportation Improvement Area (TIA): Area designated by a local jurisdiction where new development is required to pay fees based on the amount of traffic it is expected to generate.
Transportation Management Association (TMA): An organized group that provides transportation services in a particular area, with a focus on TDM programs to facilitate the movement of people and goods within an area. TMAs are frequently led by the private sector in partnership with the public sector to solve transportation problems.
Transportation System Management (TSM): Strategies that improve the efficiency of the existing transportation network such as signal synchronization, HOV queue jumps and signal priority, incident management and auxiliary lanes.
Travel Time Index (TTI) - A travel time index (TTI) is a way to normalize congestion levels across facilities with different free-flow speeds. A travel time index is determined by taking average travel time divided by the free flow travel time. The free flow speed assumed here is the posted speed limit (65 mph for highways). Similarly, the 95% travel time index is the 95% travel time divided by the free flow time.
Travel Time Reliability: The consistency or dependability in travel times, as measured from

G LO SS A RY & A C RO N Y M G U I D E
GA-20 S A N T A C R U Z C O U N T Y R E G I O N A L T R A N S P O R T A T I O N C O M M I S S I O N
day-to-day and/or across different times of the day.
Trip: A one-way journey that proceeds from an origin to a destination by a single type of vehicular transportation.
TSM: see Transportation System Management
TSM: see Transportation Systems Management
TTI: see Travel Time Index
U.S. DOT: United States Department of Transportation. The federal agency responsible for highways, mass transit, aviation and ports and headed by the Secretary of Transportation. Includes the FHWA, FTA and FAA, among others.
UCSC: University of California, Santa Cruz
Unconstrained: Denotes a funding scenario not constrained by existing funding assumptions. New funds, above and beyond existing or anticipated revenues, would be needed to fund “unconstrained” projects in this RTP.
Unmet Transit Needs Findings: TDA funds can be used for local streets and roads in smaller counties only if the RTPA in their jurisdiction makes a finding that public transit service and operations in the county have no unmet needs that are reasonable to meet. RTPAs must hold public hearings prior to making such a determination.
Urbanized Area: An area with a population of 50,000 or more as designated by the U.S. Census.
V/C Ratio - Volume to Capacity Ratio: The volume of traffic divided by the capacity of a transportation facility. Traffic volume is defined as the number of vehicles passing (or projected to pass) a point or section of roadway in a given time interval. Capacity is defined as the maximum number of vehicles that reasonably can be expected to traverse that point or section of roadway during the same time period under
prevailing roadway, traffic, and control conditions.
Vanpool: A group of seven to fifteen people traveling together to work or school in a van at set times. Many vans are leased from companies which include insurance, emergency services and maintenance in the monthly rental fees.
Vehicle Miles Traveled (VMT): The term used for the total number of miles traveled by motor vehicles within a specified region during a particular time period.
Vehicle Occupancy Rate: Also known as Average Vehicle Occupancy or Ridership; the number of persons per vehicle on a given road at a given time without distinguishing trip purpose.
Vehicle Trip: A single vehicle movement from the beginning of travel to its destination, in a vehicle that is motor-driven (e.g., automobiles, motorcycles, trucks, buses, and vans).
VMT: see Vehicle Miles Traveled
VTA: Santa Clara Valley Transportation Authority
Walkability: A measure of how friendly an area is to walking. Walkability has many health, environmental, and economic benefits. Factors influencing walkability include the presence or absence and quality of footpaths, sidewalks or other pedestrian rights-of-way, traffic and road conditions, land use patterns, building accessibility, and safety, among others.
WB: Westbound
Year of Expenditure (YOE): Revenue and cost estimates for a project or program based on reasonable financial principles/information about the timeframe in which the expenditure is expected to occur.

Appendix A Public Outreach

Public Involvement for the 2045 Regional Transportation Plan
The Santa Cruz County Regional Transportation Commission’s (RTC) proactive community engagement process includes public notices, full public access to key decisions, and encourages early and continuing involvement of the public in developing plans and programming actions. Outreach for the 2045 Regional Transportation Plan (RTP) included a variety of public participation activities as outlined in the 2019 Public Participation Plan. This public participation plan is prepared in collaboration with the Association of Monterey Bay Area Governments, the Transportation Agency of Monterey County and the San Benito Council of Governments. The RTC’s public involvement process for the 2045 RTP included public meetings, virtual and in-person workshops, public hearing, committee meetings, news releases, online surveys, a plan website, social media notices (Facebook, Twitter, Nextdoor), media interviews, and email notices to a broad range of over 1000 individuals, groups, agencies, and stakeholders. Following this overview is a summary of outreach activities and sample materials.
Define Purpose & Identify Stakeholders
The RTC compiled a list of stakeholders and regularly solicited input on and disseminated Regional Transportation Plan milestone information. The list includes: interested residents, transportation partners, local jurisdictions, other public entities, technical partners, business interests, environmental groups, neighborhood/homeowner, land conservation/development interest group, environmental justice, representatives of pedestrian and bicycle transportation facilities users, advocacy, freight, non-profit, education, agriculture, youth/senior, media, state, federal and local agencies responsible for land use management, natural resources, environmental protection, conservation, and historic preservation and other interested parties.
A Fact Sheet and webpage were developed to help the community understand more about the RTP, how the plan is developed, and about the sustainability framework approach used in this RTP update. Feedback was requested at key stages of development for the Regional Transportation Plan including the draft goals, targets and policies; and the projects, as well as the draft plan.
Consultation & Coordination with other Agencies
The RTC worked closely with agencies responsible for planning and implementing transportation projects and programs. This included planning and public works representatives from each of the five jurisdictions, Caltrans, the Santa Cruz Metropolitan Transit District, the University of California-Santa Cruz, Community Bridges-Lift Line, the Volunteer Center, the Association for Monterey Bay Governments, and other transportation partners and nonprofits that provide employer transportation programs, bicycle programs, or endeavor to improve transportation options to improve the health of the community.
Consultation with Interested Parties, Boards of Directors, Advisory Committees
Decisions at key steps of RTP development were made at noticed public board meetings. Prior to key decisions, materials were shared with the RTC’s three advisory bodies (the Bicycle Advisory Committee, Elderly and Disabled Transportation Advisory Committee (E&D TAC), and Interagency Technical Advisory Committee (ITAC)) and comments were incorporated. Board and advisory committee materials

are posted on the RTC website and notices are sent to interested individuals that have signed up for RTC “enews.”
Public Input on the project list is an important part of the RTP development process. Project ideas from the public were forwarded to potential project sponsors for their consideration. The preliminary project lists were reviewed by each of the RTC’s advisory committees, posted on the RTC website and evaluated by the RTC at one of its televised meetings. The project list is also available for public review during circulation of the Draft RTP.
Public Notice, Public Hearings, Comment Periods
All RTC board and advisory committees are held in accordance with the Brown Act; therefore, agendas are posted in a public location and on the RTC website at least 72 hours in advance of the meeting. The draft RTP was released December 2, 2021 for a 60-day public comment period. Comments are due January 31st, 2022. A public hearing is scheduled for the January 13th, 2022 RTC meeting to receive comments on the draft 2045 RTP. Comments received and recommended updates in response to the comments will be presented to the RTC in Spring 2022. A public hearing will be held to consider adoption of the final 2045 Santa Cruz County Regional Transportation Plan and the environmental review findings, statement of overriding considerations, and mitigation monitoring program. Notices about public hearings are distributed to news media and the RTP “enews” subscribers in advance of the hearing. The RTC makes all decisions related to transportation planning and policy in open, noticed meetings, according to the Brown Act (California Code sections 54950-54960.5). The environmental review process, lead by AMBAG, follows requirements set forth by the California Environmental Quality Act (CEQA).
Use of Media, Informational Materials, Visualization Techniques
A number of graphic materials were adapted and/or produced for the RTP. The RTP fact sheet contains information on how the plan is developed, the focus on sustainability and how to get involved. The RTC has a website (https://sccrtc.org/2045rtp) in which the 2045 Regional Transportation Plan process is described on a page with links to the various milestones of the project. The RTC also uses social media to get information out to the public on how to get involved in the long-range transportation planning process. The RTC featured numerous discussions about the RTP on the agency’s Nextdoor social media platform that reaches 77 neighborhoods and on Facebook which provides yet another avenue for providing information to the public.
Encourage Bilingual Participation
Bilingual participation was encouraged by inviting the community to meetings, making an interpreter available, holding evening meetings at locations accessible by transit, and placing advertisements about the draft RTP availability in Spanish language media and including groups serving bilingual community members in the stakeholder list. The RTP Fact Sheet was also made available in Spanish.

Responding to Public Input
With development of key elements of the Regional Transportation Plan (RTP), the RTC solicited and received public input. Comments were shared with the RTC board throughout the process and incorporated into elements of the document. For comments focused specifically on the project list, project ideas and comments on specific projects were forwarded to the appropriate jurisdiction for their consideration. Response to comments on the Environmental Impact Report (EIR) will be included in the Final EIR.
Distribution of Final Documents
The final RTP and EIR will be available online at www.sccrtc.org/2045rtp, at local libraries, and at the RTC office in Santa Cruz.
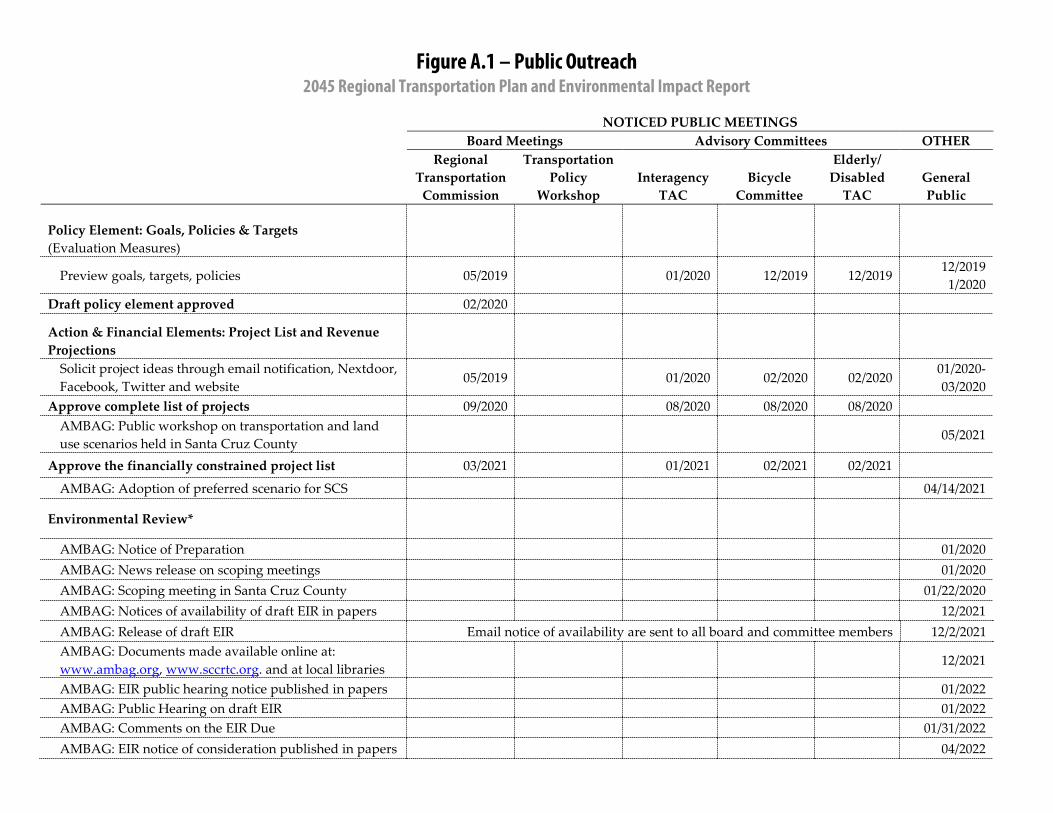
Figure A.1 – Public Outreach 2045 Regional Transportation Plan and Environmental Impact Report
NOTICED PUBLIC MEETINGS
Board Meetings Advisory Committees OTHER Regional
Transportation Commission
Transportation Policy
Workshop Interagency
TAC Bicycle
Committee
Elderly/ Disabled
TAC General Public
Policy Element: Goals, Policies & Targets (Evaluation Measures)
Preview goals, targets, policies 05/2019 01/2020 12/2019 12/2019 12/2019
1/2020 Draft policy element approved 02/2020
Action & Financial Elements: Project List and Revenue Projections
Solicit project ideas through email notification, Nextdoor, Facebook, Twitter and website
05/2019 01/2020 02/2020 02/2020 01/2020-03/2020
Approve complete list of projects 09/2020 08/2020 08/2020 08/2020
AMBAG: Public workshop on transportation and land use scenarios held in Santa Cruz County
05/2021
Approve the financially constrained project list 03/2021 01/2021 02/2021 02/2021
AMBAG: Adoption of preferred scenario for SCS 04/14/2021
Environmental Review*
AMBAG: Notice of Preparation 01/2020 AMBAG: News release on scoping meetings 01/2020 AMBAG: Scoping meeting in Santa Cruz County 01/22/2020 AMBAG: Notices of availability of draft EIR in papers 12/2021 AMBAG: Release of draft EIR Email notice of availability are sent to all board and committee members 12/2/2021 AMBAG: Documents made available online at: www.ambag.org, www.sccrtc.org. and at local libraries
12/2021
AMBAG: EIR public hearing notice published in papers 01/2022 AMBAG: Public Hearing on draft EIR 01/2022 AMBAG: Comments on the EIR Due 01/31/2022 AMBAG: EIR notice of consideration published in papers 04/2022

NOTICED PUBLIC MEETINGS
Board Meetings Advisory Committees OTHER Regional
Transportation Commission
Transportation Policy
Workshop Interagency
TAC Bicycle
Committee
Elderly/ Disabled
TAC General Public
AMBAG: Final EIR available for public review 04/2022 AMBAG: Adopt final MTP/SCS and certify EIR 06/2022 RTC Adopt final EIR 06/2022
Review of 2045 Regional Transportation Plan
RTC approve release of draft RTP 12/2/2021
Release of draft RTP Email notice of availability are sent to all board and committee members 12/02/2021 Draft RTP available online at www.sccrtc.org, local libraries, and at RTC office
12/02/2021
Email notices sent to over 1000 people, agencies, and community groups (see Appendix A for distribution list)
week of 12/06/2021
Draft RTP public hearing notice published in papers week of
12/06/2021 Email notices sent to resource agencies and tribal representatives to solicit input on draft RTP
week of 12/06/2021
Press Release on draft RTP availability week of
12/06/2021
Public Hearing on draft RTP 01/13/2022
Input solicited on draft RTP from RTC Committees 12/2021 12/2021 01/2022
Comments on the draft RTP Due 01/31/2022 Approval of revisions for final RTP 04/07/2022
Adopt final RTP 06/02/2022
Other Public Outreach Activities (some bilingual materials)
Fact Sheets: online, distributed at community meetings ongoing Presentations and/or announcements about the RTP ongoing Electronic notices: Social media (e.g., Nextdoor, Facebook, Twitter updates), emails to distribution list, newsletters for other entities
ongoing
RTP website updates: www.sccrtc.org/2045rtp ongoing

NOTICED PUBLIC MEETINGS
Board Meetings Advisory Committees OTHER Regional
Transportation Commission
Transportation Policy
Workshop Interagency
TAC Bicycle
Committee
Elderly/ Disabled
TAC General Public
News releases ongoing
Communication to Tribal Interests 03/2021 11/2021
Bold = Key Decision Points
*The CEQA required environmental review for the 2045 Regional Transportation Plan is included in the EIR for the 2045 MTP-SCS. AMBAG serves as the lead agency for the EIR and SCCRTC serves as a responsible agency.

Project Ideas Due
Present Work Plan for RTP 2045
May 2019
Approve Draft Goals, Policies, & Targets
Mar 2020
AMBAG Scenario Analysis
Oct 2020-Feb 2021
Approve Draft Financially Constrained Project List
Update Financial Projections
Approve Draft Complete Project List
Release Draft RTP/MTP-SCS/EIR
Adopt Final RTP/MTP-SCS/EIR
2045 REGIONAL TRANSPORTATION PLAN KEY MILESTONES
Santa Cruz County Regional Transportation Commission 1523 Pacif ic Ave | Santa Cruz, CA | 95060
831.460.3200 | www.sccrtc.org
2019
2022
* Pub l i c par t i c i pat ion i s a lways encouraged. Symbo l ind ica te s when pub l i c i nput
i s fo rma l l y so l i c i ted and encouraged .
KEY:
Public*
RTC Advisory Committees
Agencies & Staff
Governing Boards
Solicit Input on Goals, Policies, & Targets
April 2020
Sept 2020
Apr-Nov 2020
Nov 2019-Feb 2020
June 2022
Dec 2021
EIR/RTP Public Hearing
Mar 2022
Feb 2021
Solicit New Projects & Updates
Jan-April 2020

PROJECT FACT SHEET
Santa Cruz County Regional Transportation Commission | (831) 460-3200 | www.sccrtc.org
2045 Regional Transportation Plan
Updated January 2021
What is the RTP?The Regional Transportation Plan (RTP) is a long range (20-25 year) transportation plan for the Santa Cruz County area. The plan assesses the transportation challenges we face now and those we will face in the future. The plan includes strategies to address our transportation challenges, a list of unmet multimodal transportation needs (highway, road, transit, bicycle, pedestrian, freight, airport, etc.), and priorities for limited funds.
The RTP is updated every four or five years to address new trends, issues, and priorities, and to incorporate new state and federal regulations. The last Regional Transportation Plan (2040 RTP) was adopted in June 2018. Work is currently underway on the next plan, referred to as the 2045 RTP. Goals, Policies, and Targets were approved in February 2020 and preliminary project list approved in September 2020. The financialy constrained project list is currently under development. The final 2045 RTP is scheduled for adoption in June 2022.
Want to Get Involved?Stay informed. Review materials and provide input as elements of the plan are developed: https://sccrtc.org/rtp
Join E-News. Sign up directly at https://sccrtc.org/rtp
Send Comments. Mail comments to SCCRTC: [email protected] or 1523 Pacific Avenue, Santa Cruz, CA 95060
The RTP provides information on: X Transportation needs in the region for 20 to 25 years, based on
population growth, environmental, economic and other social trends.
X The amount of state, federal, and local funding available for transportation projects and new sources of funding needed to deliver high priority projects.
X Sustainability of the transportation system and sustainable outcomes.
X New legislative requirements, including SB375, which stipulate that regions must meet greenhouse gas reduction targets through a coordinated land use and transportation plan called the Sustainable Communities Strategy.
X “Complete Streets” as a tool for planning for a balanced and multi-modal transportation system, particularly for those transportation improvements needed to accommodate growth.
2045 Regional Transportation Planning Process
Goals, Policies,
& Targets
Funding Estimates
Project Lists
Draft RTP
Final RTP
Public and Stakeholder Participation

PROJECT FACT SHEET
Santa Cruz County Regional Transportation Commission | (831) 460-3200 | www.sccrtc.org
2045 Regional Transportation Plan
Updated January 2021
Why focus on sustainability?The RTC represents diverse transportation interests and assesses the impacts of transportation investments on environmental, economic and social concerns. A focus on sustainability can assist in providing balanced evaluation of transportation projects and programs, recognizing that these areas are intertwined, not exclusionary.
This approach evaluates how transportation investments impact people’s health and safety, the economic vitality of the region, and the universal need for a healthy planet. Some investments are win/win, but some require trade-offs in the three areas of economy, environment and people.
This focus on sustainability assists the RTC in identifying these trade-offs and achieving multiple long-term goals.
How is the long range transportation plan developed?1. The first step is to identify the objectives for the region’s transportation system and craft overarching
goals and policies, used to guide decisions. Performance measures or targets are also developed to track progress towards achieving the goals.
2. Next, an estimate of all the potential local, state and federal funding available for transportation projects is developed. Projects that advance the goals and targets are then identified by transportation agencies, local jurisdictions, and the public.
3. Based on the anticipated funding and the performance measures, the RTC prioritizes the projects that could be funded over the next 22 years. A list of additional projects that could be implemented should more funding become available is also identified.
4. The priority project list is then reviewed to identify potential environmental impacts. There are opportunities at every stage of the development of the RTP for public, agency and committee input.
5. The goals/policies, funding estimates and project lists build on each other and input at the early stages will shape the draft and final plan.

HOJA INFORMATIVA
Comisión Regional de Transporte del Condado de Santa Cruz | (831) 460-3200 | www.sccrtc.org
Plan Regional de Transporte 2045
Noviembre 2021
¿Que es el RTP?El Plan Regional de Transporte (RTP por sus siglas en inglés) es un plan a largo plazo (20-25 años) de transporte para el condado de Santa Cruz. El plan de transporte a largo plazo evalúa los retos que enfrentamos ahora y en el futuro. El plan incluye estrategias para resolver los retos, un lista de no cumplido multimodal necesidades de transporte (autopista, carretera, tránsito, bicicleta, peatones, carga, aeropuerto, etc.) y prioridades para el uso de fondos limitados. El RTP se actualiza cada cuatro o cinco años para abordar las prioridades, problemas y nuevas tendencias e incorporar nuevas regulaciones estatales y federales. El último Plan Regional de Transporte del Condado de Santa Cruz se adoptó en junio 2018. Se espera que el siguiente plan se adoptará en junio 2022 y se hará referencia a él como 2045 RTP.
¿Quieres participar?Manténgase informado. Revisar los materiales del RTP y contribuya a medida que se desarrollen los elementos del plan. https://sccrtc.org/2045rtp
Correo electrónico. Regístrese para recibir notificaciones por correo electrónico:https://sccrtc.org/2045rtp
Enviar comentarios. Envíe comentarios por correo electrónico a [email protected] o envíe por correo a 1101 Pacific Avenue, Suite 250, Santa Cruz, CA 95060
The RTP provides information on: X Las necesidades de transporte en la región por un período de 20 a 25
años, basado en el crecimiento de la población, ambiental, económico y otras tendencias sociales.
X La cantidad de fondos estatales, federales y locales disponibles para proyectos de transporte y nuevos recursos de fondos necesarios para llevar a cabo proyectos de alta prioridad.
X Sostenibilidad del sistema de transporte y resultados sostenibles.
X Nuevos requisitos legales, incluyendo SB375, que estipula que las regiones deben cumplir con metas de reducción de gases causantes del efecto invernadero, por medio del uso coordinado del suelo y un plan de transporte llamado Estrategia de Comunidades Sostenibles.
X “Calles Completas” como herramienta de planeación para un sistema de transporte balanceado y multimodal, en particular para aquellas mejoras al transporte necesarias para acomodar el crecimiento.
Proceso de planificación para el transporte regional
Metas, Normas, Objetivos
Cálculos de Fondos
Listas de Proyectos
Bosquejo del Plan
Plan Final
Participación del público y grupos interesados

HOJA INFORMATIVA
Comisión Regional de Transporte del Condado de Santa Cruz | (831) 460-3200 | www.sccrtc.org
Plan Regional de Transporte 2045
Noviembre 2021
¿Por qué un enfoque en sostenibilidad?La RTC representa diversos intereses de transporte y evalúa los impactos de inversiones de transporte en cuanto a intereses ambientales, económicos y sociales. Un enfoque en sostenibilidad puede ayudar a proveer una evaluación balanceada de proyectos y programas de transporte, reconociendo que estas áreas están entrelazadas, no son exclusivistas. Este enfoque evalúa el impacto de la inversión en el transporte, la salud, la seguridad de la población, la vitalidad económica de la región y la necesidad universal de la salud del planeta. Algunas inversiones son beneficiosas para todos, mientras otras requieren concesiones en las tres áreas de economía, medio ambiente y población. Este enfoque en sostenibilidad ayuda a la RTC a identificar estas concesiones y alcanzar múltiples metas a largo plazo.
¿Cómo se desarrolla el plan de transporte a largo plazo?1. El primer paso es identificar los objetivos para el sistema de transporte de la región y elaborar metas
globales y normas que se usarán para guiar las decisiones. También se desarrollan medidas de desempeño o metas para seguir el progreso hacia el logro de las metas.
2. Luego, se desarrolla un presupuesto de todos los posibles fondos locales, estatales y federales disponibles para proyectos de transporte. Se identifican aquellos proyectos que promueven las metas y objetivos por parte de las agencias de transporte, jurisdicciones locales y el público.
3. Basado en los fondos que se anticipan y las medidas de desempeño, la RTC identifica qué proyectos pueden financiarse durante los próximos 25 años basado en prioridades y prevé su financiación. También se identifica una lista de proyectos adicionales que pudieran implementarse si hubiera fondos disponibles.
4. Luego se revisa la prioridad de la lista de proyectos para identificar posibles impactos ambientales. En cada etapa del desarrollos del RTP hay oportunidades de aporte para el público, agencias y comités.
5. Las metas/normas, presupuestos de fondos y listas de proyectos se crean progresivamente y el aporte en las etapas primarias moldeará el borrador y plan final.

RTP New Project Idea Submission Form
https://sccrtc.org/funding-planning/long-range-plans/2045-regional-transportation-plan/new-project-ideas/

Public Outreach for the 2045 RTP
Notices or copies of the 2045 Regional Transportation Plan were distributed to the following organizations:
Partners/Resource Agencies/Media Association of Monterey Bay Area Governments Bureau of Land Management CA Dept. Conserv State Mining & Geology Board California Air Resources Board California Coastal Commission California Department of Fish and Wildlife California Department of Parks and Recreation California Dept of Resources, Recycling, and
Recovery California Energy Commission California Environmental Protection Agency California Governor’s Office of Planning &
Research California Public Utilities Commission California Natural Resources Agency California State Transportation Agency California Transportation Commission Caltrans District 5 Caltrans Headquarters Central Coast Energy Services, Inc. Central Coast Regional Water Quality Control Chambers of Commerce, Executive Directors Downtown Association Ecology Action Federal Highway Administration Federal Transit Administration Legislators, Federal Legislators, State Libraries, Main Branches Local Jurisdiction, City Clerks Local Jurisdiction, City Managers Local Jurisdiction, City Mayors Local Jurisdiction, Planning Directors Local Jurisdiction, Public Works Directors Media, Newspapers Media, Radio Media, TV Metropolitan Transportation Commission Monterey Bay National Marine Sanctuary Monterey Bay Unified Air Pollution Control
District Natural Resources Conservation Service NOAA Fisheries West Coast Region San Benito Council of Governments
San Francisco Bay Conservation & Development Santa Cruz County Business Council
Santa Cruz County Libraries Santa Cruz County Schools, K-12 Santa Cruz County Sheriff Santa Cruz County Central Fire District State Water Resources Control Board Transportation Agency for Monterey County U.S. Army Corps of Engineers U.S. Fish and Wildlife Service U.S. National Park Service
RTC Board & Committees Commission Members Interagency Technical Advisory Committee
Association of Monterey Bay Area Governments Cabrillo College Caltrans City of Capitola City of Santa Cruz City of Scotts Valley City of Watsonville County of Santa Cruz Ecology Action Monterey Bay Unified Air Pollution Control
District Santa Cruz Metropolitan Transit District University of California, Santa Cruz
Bike Committee Elderly and Disabled Transportation Advisory
Committee Safe on 17
California Highway Patrol California Office of Traffic Safety Caltrans Caltrans, District 4 Caltrans, District 5 City of San Jose City of Santa Cruz City of Scotts Valley County of Santa Clara County of Santa Cruz Ladd's Auto Body & Towing/AAA Monterey Bay Unified Air Pollution Control
District Metropolitan Transportation Commission-SAFE Mountain Network News Office of Assemblymember Mark Stone Office of Assemblymember Paul Fong

San Jose Mercury News San Jose Police Department Santa Clara County Airports and Roads Santa Cruz Sentinel Santa Cruz Metropolitan Transit District Town of Los Gatos Santa Clara Valley Transportation Authority
Transportation Operations System Association of Monterey Bay Area Governments American Medical Response California Highway Patrol Caltrans Caltrans, District 4 Caltrans, District 5 City of Santa Cruz City of Scotts Valley County of Santa Cruz Ladd's Auto Body & Towing/AAA Metropolitan Transportation Commission Monterey Salinas Transit Santa Clara Valley Transportation Authority Santa Cruz Metropolitan Transit District Santa Cruz & Monterey Bay Railroad Santa Cruz Regional 911 Santa Cruz Yellow Cab
Transportation Funding TF Members
Stakeholders, Elderly & Disabled Alcoholics Anonymous Alzheimer's Association Apria Healthcare Big Brothers Big Sisters of Santa Cruz Cabrillo College Cabrillo College Stroke California Grey Bears Californians for Disability Rights California Senior Alliance Central Coast Alliance for Health Central Coast Center for Independent Living Cindy's Celebrations Inc Coastwalk California Community Action Board of Santa Cruz County,
Inc. Community Bridges (Meals on Wheels) Community Foundation of Santa Cruz County Community Life Services Conflict Resolution Center County of Monterey County of Santa Cruz County of Santa Cruz / HRA Del Mar Caregiver Resource Center Dominican Hospital
Easter Seals Central California Elderday ETR Associates Family Service Agency of the Central Coast Goodwill Industries Greenways to School Hope Services Imagine Supported Living Services Lifespan Care Louden Nelson Community Center Metro Advisory Committee Ombudsman Advocate, Inc. Pajaro Valley Community Health Trust Pajaro Valley Unified School District Office Pula Services San Lorenzo Valley Unified School District Santa Cruz County Santa Cruz County Commission on Disabilities Santa Cruz County Cycling Club Santa Cruz County Immigration Project Santa Cruz County Office of Education Santa Cruz County Veterans Center Santa Cruz County Health Service Agency Santa Cruz Healthcare Center Santa Cruz Host Lions Club Santa Cruz Metropolitan Transit District Second Harvest Food Bank Senior Citizens Legal Services Senior Living Centers Senior Network Services Seniors Council of Santa Cruz and San Benito
Counties United Way of Santa Cruz County Valley Convalescent Hospital Veterans Services Office Watsonville Vista Center Volunteer Center of Santa Cruz County Watsonville Community Hospital WomenCARE Watsonville Dialysis Center Women's Crisis Support/Defensa De Mujeres Youth Services
Stakeholders, Environmental Agricultural History Project (AHP) Museum Arana Gulch Watershed Alliance (AGWA) California Center for Land Recycling California Coastal Commission California Native Plant Society (CNPS) California Rural Legal Assistance California State Coastal Conservancy

California Sustainable Agricultural Working Group
CalPIRG at UCSC Camp Joy Gardens California State Clearing House (CEQA) Campaign for Sensible Transportation Central Coast Water Quality Preservation, Inc. City of Santa Cruz Coastal Watershed Council Community Action Board of Santa Cruz County Community Alliance with Family Farmers Communities for Sustainable Monterey County County of Santa Cruz Ducks Unlimited, Inc.-Santa Cruz Chapter Earth First! Ecology Action Elkhorn Slough Foundation Farmer Veteran Coalition Friends of Arana Gulch Friends of Moss Landing Marine Laboratories Friends of Santa Cruz State Parks Friends of Soquel Creek Friends of the North Coast Friends of the Sea Otter Groundswell Coastal Ecology International Institute for Ecological Agriculture Island Conservation Keep the Green Belt Green La Selva Recreation District Land Watch Monterey County Land Trust of Santa Cruz County Life Lab Science Program Local Farmers Marine Mammal Center-Monterey Bay
Operations Mission Pedestrian Mission Springs Camps and Conference Center Monterey Bay Aquarium Monterey Bay National Marine Sanctuary Monterey Bay Salmon and Trout Project Mountain Bikers of Santa Cruz Mountain Parks Foundation Muwekma Ohlone Indian Tribe/SF Bay Area National Environmental Directory Nisene 2 Sea Ocean Conservancy Open Space Alliance Open Space Authority Organic Farming Research Foundation Outdoor Science Exploration and Classroom
Science Fun Otter Project, Inc. Pelagic Shark Research Foundation
Redwood Empire Rails to Trails Conservancy Rising Sun Energy Center San Andreas Land Conservancy Santa Cruz Bird Club Santa Cruz County Cycling Club Santa Cruz County Farm Bureau Santa Cruz County Horsemen’s Association Santa Cruz County Res Conservation District Santa Cruz Hub for Sustainable Living Santa Cruz Mountains Bioregional Council Santa Cruz Museum of Natural History Save Our Agricultural Land Save Our Shores Scotts Creek Watershed Council Sempervirens Fund Seymour Marine Discovery Center Sierra Club Surfrider Foundation Sustainable Conservation Sustainable Fishery Advocates Swanton Pacific Ranch-CalPoly The Monterey Bay Conservancy UCSC UCSC Institute of Marine Sciences US Geological Survey Valley Women's Club of the San Lorenzo Valley Ventana Wilderness Alliance Watsonville Waste & Recycle Watsonville Wetlands Watch Wild Farm Alliance YES! Helping Outstanding Young Leaders Zero Population Growth
Stakeholders, Transportation Groups AAA Northern California Bike Santa Cruz County CalVans California Trucking Association Campaign for Sensible Transportation Carpooltoschool.com City of Santa Cruz Community Bridges (CTSA) Courtesy Cab Ecology Action Enterprise Rideshare First Transit Services, Inc Monterey Bay Electric Vehicle Alliance Monterey Bay Unified Air Pollution Cntrl District Mission Pedestrian Mountain Bikers of Santa Cruz Santa Cruz County Cycling Club

Santa Cruz County Greenway Santa Cruz County Railroad Historical Society Trail Now Trail People Train Riders Association of California UCSC/Transportation and Parking Services Watsonville Bike Shack Cooperative
Stakeholders, Community Action Pajaro Valley Agri-Culture Arts Council Santa Cruz County Barios Unidos California Native Plants Society California Art Education Association Capitola Walks Central Coast Agricultural Task Force City of Santa Cruz City of Seaside City of South San Francisco Community Foundation of Santa Cruz County The Corralitos Cultural Center County of Santa Cruz Santa Cruz County Office of Education Employers over 100 Friends of the Santa Cruz Public Library Happy Valley Conference Center Japanese Cultural Fair Committee League of Women Voters of Santa Cruz Live Oak Family Resource Center Live Oak Neighbors Metro Advisory Committee Michael’s Transportation Service Mission Pedestrian Monterey Bay Central Labor Council Mountain Parks Foundation Neighbors of Lower Ocean Open Space Alliance Santa Cruz Organic Farming Research Foundation Pleasure Point Business Association Redwood Estates Service Association Rio Del Mar Improvement Association Roaring Camp Railroads Rotary Club of San Lorenzo Valley Rotary Club of Santa Cruz Rotary Club of Scotts Valley Rotary Club of Watsonville Santa Cruz County Business Council Santa Cruz County Confer & Visitors Council Santa Cruz County Farm Bureau Santa Cruz County Immigration Project Santa Cruz Museum of Natural History
Santa Cruz Regional 911 Santa Cruz Neighbours Santa Cruz Seaside Company Seymour Marine Discovery Center Surfrider Foundation (SC) Sumner Woods HOA UCSC Valley Women’s Club of the San Lorenzo Valley Watsonville Women's Club
Stakeholders, Economic Justice Arts Council Santa Cruz County Cabrillo College Stroke California Public Interest Research Group Child Development Resource Center City of Capitola Community Action Brd of Santa Cruz Cnty, Inc. Communities Organized for Power in Action Conflict Resolution Center Family Service Agency of the Central Coast Foster Grandparent Senior Companion Program Homeless Community Resource Center League of Women Voters Lomak Property Group Mission Pedestrian Monarch Services/Servicios Monarca Monterey Bay Central Labor Council Pajaro Valley Ohlone Indian Council Pajaro Valley Shelter Services Peace Coalition of Monterey County Santa Cruz County Farm Bureau Santa Cruz Metropolitan Transit District Senior Network Services Seniors Council United Way of Santa Cruz County Valley Churches United Volunteer Center Youth Services

From: Regional Transportation CommissionTo: Amy NaranjoSubject: RTC Seeking Public Input on 2045 Regional Transportation Plan Goals and PrioritiesDate: Friday, December 20, 2019 10:39:47 AM
RTC Seeking Public Input on 2045 RegionalTransportation Plan Goals and Priorities
The RTC is currently seeking public input to help define the Goals,Targets & Policies for the 2045 Regional Transportation Plan.Members of the public can provide input to help inform the plan bytaking a short survey and by reviewing the Draft Goals, Targets &Policies and providing input on the document. Answers from thesurvey along with comments on the draft document will help theRTC update the Draft Goals, Targets & Policies and define priorityprojects.
Survey Links:
English: https://www.surveymonkey.com/r/72CNNPZSpanish: https://www.surveymonkey.com/r/VSKHBGC
Draft Goals, Targets & Policies Links:
EnglishSpanish
Input on the Draft Goals, Targets & Polices can be submitted byemail to [email protected], mail to 1523 Pacific Ave., Santa Cruz, CA95060, or by fax to 831-460-6178. The deadline to provide publicinput is Jan. 3 at 5 p.m.
www.sccrtc.org
Santa Cruz County Regional Transportation Commissionemail: info[at]sccrtc.org
Website Funding & Planning Projects Services About the RTC

From: Regional Transportation CommissionTo: Amy NaranjoSubject: Submit new project ideas for the 2045 RTP!Date: Monday, March 02, 2020 1:24:15 PM
Hello Amy,
Your input is being requested on the long range transportation plan update:
Solicit New Projects
The deadline to submit new project ideas has been extended to March 16, 2020
Santa Cruz County2045 Regional Transportation Plan
Submit New Project Ideas for 2045 RTP
The RTC is currently accepting newproject ideas for the 2045 SantaCruz County Regional TransportationPlan (RTP). The RTP is a long rangetransportation plan that identifies multi-modal transportation needs (highway,local road, transit, bicycle, pedestrian,etc), and a financially feasible list ofpriority transportation projects for ourCounty. The plan is updated every fewyears and is required in order to receivespecific types of funding from state andfederal sources.The 2045 RTP will be a minor update to the 2040 RTP and is expected to beadopted June 2022.

Project ideas submitted will be shared with the agency who is responsiblefor transportation projects in your location of interest. Projects will then beconsidered for inclusion in the 2045 RTP.
The goals of the 2045 RTP are to prioritize projects that maintain thecurrent transportation system, improve safety and expand options for howpeople travel.
Please submit one form for each new project idea. Example projects couldinclude a street in need of a bike lane, a turn lane to improve traffic flow, aroad that needs a sidewalk, new bus services, or any other improvementsthat you would like to see happen over the next 20 years.
More information about the 2045 RTP can be found on the project web page:https://sccrtc.org/rtp
Thank you.
Submit Project Idea
Santa Cruz County Regional Transportation Commissionemail: info[at]sccrtc.org
Meetings Funding & Planning Projects Services About the RTC
SCCRTC | 1523 Pacific Avenue, Santa Cruz, CA 95060
Unsubscribe [email protected]
Update Profile | About Constant Contact
Sent by [email protected] in collaboration with
Try email marketing for free today!

Example Facebook posts


Example Notices Posted on RTC website

Appendix B Regional Transportation Commission and Partner Agency Coordination

Below is a description of the RTC, member agencies, advisory committees, and related partners. A summary chart can be found at the end of this appendix.
Santa Cruz County Regional Transportation Commission (RTC)
The RTC is responsible for delivering a full range of convenient, reliable, and efficient transportation choices for the community. While promoting long-term sustainability, the RTC provides transportation services, construction management, planning, and funding for all travel modes. The RTC is designated in state statute as the Regional Transportation Planning Agency for Santa Cruz County. Responsibilities of this designation include preparation of the long-range Regional Transportation Plan (this document), dissemination of state and federal funding, and setting local transportation policy. At the time of this writing, there are twelve (plus one ex-officio) board members and seventeen full-time equivalent staff. The RTC board meets once per month for their regular televised meetings and as needed for a Transportation Policy Workshop (TPW).
The RTC also serves as the Service Authority for Freeway Emergencies (SAFE) for Santa Cruz County. The RTC SAFE is one of 18 SAFE programs in California to reduce congestion, improve public safety, and enhance air quality. On Highway 1 and 17, the RTC SAFE provides roadside call box services and Freeway Service Patrol tow trucks that quickly respond to and clear highway incidents.
In addition, the RTC serves as the “Local Transportation Authority” responsible for implementation of Measure D, the Santa Cruz County Transportation Improvement Plan Measure, which was approved in November 2016 by over two-thirds of Santa Cruz County voters.
RTC Member Agencies
Local Jurisdictions
• City of Capitola – The RTC Board includes one member from this city of about 10,180 people occupying a coastal village of approximately 2 square miles.
• City of Santa Cruz – The RTC Board includes one member from this city of about 64,522 people occupying a coastal area of approximately 16 square miles, including the University of California, Santa Cruz.
• City of Scotts Valley – The RTC Board includes one member from this city of about 11,930 people occupying a mountainous area approximately 4.6 miles square located about 6 miles north of the City of Santa Cruz.
• City of Watsonville - The RTC Board includes one member from this city of about 53,800 people occupying a valley of approximately 6.8 square miles adjacent to agriculture lands.
• County of Santa Cruz – The RTC Board includes all five supervisors representing the unincorporated, rural, and urban areas of the county with a total population of 274,673.

Santa Cruz Metropolitan Transit District (METRO)
The RTC Board includes three members from the Metro Board. The METRO operates in Santa Cruz County with connections to transit in neighboring counties, providing both fixed route local and express bus service, and paratransit as mandated by the Americans with Disabilities Act. The METRO is a recipient of RTC-administered Transportation Development Act funds as designated by the RTC’s Rules and Regulations and is a member of the RTC’s Elderly & Disabled Transportation Advisory and Interagency Technical Advisory Committees.
Caltrans/State Department of Transportation
The RTC Board includes one ex-officio (non-voting) member from Caltrans. Santa Cruz County is in Caltrans District 5, headquartered in San Luis Obispo and covering 5 counties. Caltrans is the state agency responsible for highway, bridge, and rail transportation planning, construction, and maintenance. The RTC coordinates with Caltrans on all issues related to their role as the owner and operator of state highways. Caltrans is also a member of the RTC’s Interagency Technical Advisory Committee and the “Safe on 17” Task Force.
RTC Advisory Committees
Budget & Administration/Personnel Committee
The committee consists of 5 commissioners selected annually by the RTC and provides oversight and recommendations on Commission administration, budget, policy, finance, audit, and personnel issues.
Bicycle Committee
The committee advises the Regional Transportation Commission and its member agencies on bicycle related issues, including review of proposed bicycle related policies, programs, projects, plans, funding applications, and legislation; input on existing and future roadway/bikeway conditions affecting cycling; coordination with local jurisdictions and bicycle related organizations to promote cycling projects and programs.
Elderly & Disabled Transportation Advisory Committee (E&D TAC)
The committee advises the Regional Transportation Commission and other transportation agencies on the network of specialized transportation services for seniors and people with disabilities in Santa Cruz County as well as about the transportation needs of these members of our community. In addition, the committee serves as the local Social Services Transportation Advisory Council (SSTAC), a state-required entity and the Paratransit Advisory Council (PAC).
Interagency Technical Advisory Committee (ITAC)
Made up of staff from a variety of jurisdictions and agencies including local jurisdiction public works and planning departments, the Metro, Caltrans District 5, and Association of Monterey Bay Area Governments (AMBAG), the ITAC reviews and provides technical advice on transportation projects and programs in the region; coordinates and provides recommendations to the RTC on the use of

transportation funds; and serves as a forum for sharing information on transportation projects and federal and state requirements for project implementation.
Partner Transportation Agencies
Association of Monterey Bay Area Governments (AMBAG)
AMBAG is a voluntary association of 20 local jurisdictions in Santa Cruz, Monterey, and San Benito Counties and one associate member representing the Council of San Benito County Governments (SBCOG). AMBAG serves as a forum for discussing and making recommendations on issues of regional significance. The agency serves as the region’s Metropolitan Planning Organization, a federal designation that carries with it the responsibility for developing federally mandated transportation plans and funding programs. The agency also has the responsibility for coordinating and analyzing the Regional Travel Demand Model and ascertaining the air quality impacts of the projects within transportation plans and programs.
California Highway Patrol (CHP)
The CHP provides "Safety, Service, and Security" to Californians through active programs, task forces, community outreach, and communication. In addition, the CHP provides enforcement of traffic laws on roads and highways and safety training for all ages, including youth and seniors. The CHP are members of the ‘Safe on 17’ Task Force.
California Transportation Commission (CTC)
The California Transportation Commission is a policy-making body appointed by the Governor and Legislature. The CTC works closely with Caltrans and oversees state-level transportation planning, policy, and funding decisions. The California Transportation Commission, in consultation with Caltrans, decides how and when to allocate state funds for transportation projects through a variety of programs including the State Transportation Improvement Program (STIP), and State Highway Operation Protection Program (SHOPP) programs. One of the main sources of discretionary transportation funds available for our region is from the STIP, of which 75 percent is allocated to Regional Transportation Planning Agencies (RTPA) for regionally significant projects, and 25 percent is allocated to state highway and intercity rail programs selected by Caltrans. The CTC has final approval on local funding plans for the STIP.
Community Bridges
Community Bridges operates transportation services under the brand of Lift Line for seniors and people with disabilities; is the locally designated Consolidated Transportation Services Agency; is a recipient of RTC-administered Transportation Development Act funds as designated by the RTC’s Rules and Regulations; and is a member of the RTC’s Elderly & Disabled Transportation Advisory Committee.
Community Traffic Safety Coalition (CTSC)
The CTSC and its South County Bicycle/Pedestrian Work Group operate under the Santa Cruz County Health Services Agency. These groups represent a coalition of agencies and individuals that promote

bicycle and pedestrian safety, particularly for school children. The CTSC is a member of the RTC’s Bicycle Committee.
Ecology Action’s Transportation Program
The former Santa Cruz Area Transportation Management Association merged with the non-profit organization Ecology Action in 2005 which continues to offer workplace-based commute programs to its member employers. Ecology Action also coordinates a wide range of bike and pedestrian safety education, marketing and incentive programs including Bike to Work/School. This organization has members on both the RTC’s Bicycle Committee and Interagency Technical Advisory Committee.
Federal Highway Administration (FHWA)
This agency is within the U.S. Department of Transportation and supports State and local governments in the design, construction, and maintenance of the Nation’s highway system (Federal Aid Highway Program) and various federal and tribal owned lands (Federal Lands Highway Program). The RTC coordinates with the FHWA on all state highway projects.
Federal Railroad Administration (FRA)
The FRA was created by the Department of Transportation Act of 1966 and is one of ten agencies within the United States Department of Transportation working on intermodal transportation. The RTC coordinates with the FRA on rail issues.
Federal Transit Administration (FTA)
The FTA is one of ten agencies within the United States Department of Transportation and provides financial and technical assistance to local public transit systems. Public transportation includes buses, subways, light rail, commuter rail, monorail, passenger ferry boats, trolleys, inclined railways, and people movers. The RTC coordinates with the FTA on financial assistance to operate existing systems and to secure new transit grant funding.
Metropolitan Transportation Commission (MTC)
This Regional Transportation Planning Agency provides similar functions as the RTC for the nine-county San Francisco Bay Area. The RTC coordinates with MTC on issues related to coordination with the Bay Area (Highway 17 “Safe on 17” Task Force, commuters/rideshare, etc), funding, and statewide matters.
Monterey Bay Unified Air Pollution Control District (MBUAPCD)
The Air District oversees state and federal ambient air quality control in the Monterey Bay region. The agency develops transportation regulations and control measures to reduce vehicle emissions; helps determine whether the region is meeting and maintaining state and federal air quality standards; and ensures that state Air Resources Board regulations are followed. The air district also distributes funds from a $4 per vehicle registration fee collected by the Department of Motor Vehicles (known as AB 2766 funds) and Carl Moyer Funds, and channels them back to the region as grants for emissions-reducing transportation projects. The MBUAPCD is a member of the RTC’s Interagency Technical Advisory Committee.

Safe on 17/Traffic Operations Systems (TOS) Committee
In 1998, Highway 17 was identified as a high collision corridor. The Safe on 17 task force was formed to develop strategies for improving safety and reducing collisions through education, enforcement, and engineering. The Traffic Operations Systems Committee focuses on technological systems to improve highway operations throughout Santa Cruz County. Because these two committees have similar membership, they meet at the same time. Since Highway 17 straddles two counties, the members that attend these meetings consists of two regional transportation planning agencies, two California Highway Patrol divisions, two Caltrans districts, and two transit districts.
San Benito Council of Governments (SBCOG)
This Regional Transportation Planning Agency provides similar functions to the RTC in San Benito County. The agencies coordinate on Monterey Bay regional issues.
Transportation Agency for Monterey County (TAMC)
This Regional Transportation Planning Agency provides similar functions to the RTC in Monterey County. The agencies coordinate on Monterey Bay regional transportation issues.
University of California, Santa Cruz (UCSC)
One of the University of California’s ten campuses, UCSC aggressively encourages use of alternatives to driving alone. UCSC charges for on-campus parking and uses the funds to subsidize vanpool programs for their employees. They collect a fee from all students as part of registration and provide “free” year-long bus passes for all students for the Metro buses anywhere in the county and free shuttle service on campus. UCSC prepares a Long-Range Development Plan (LRDP), which includes a transportation element, and is similar to a city General Plan. UCSC is a member of the RTC’s Interagency Technical Advisory Committee
Valley Transportation Authority (VTA)
This agency provides oversight of transportation in Santa Clara County including operation of bus and light rail transit. Coordination with this agency is primarily focused on cross-county transit such as the Highway 17 Express and connections to Bay Area transit.
Volunteer Center’s Transportation Program
This agency oversees a transportation program using volunteer drivers to provide rides and companionship to many in the county who are ineligible for other transportation services. The Volunteer Center provides insurance coverage and reimburses gasoline costs, although many also volunteer this cost. The Volunteer Center is a recipient of RTC-administered Transportation Development Act funds as designated by the RTC’s Rules and Regulations and is a member of the RTC’s Elderly & Disabled Transportation Advisory Committee.

(agency descriptions can be found in pages before this summary)
Agency Board or Members General Meeting Times Contact Phone & Website
Santa Cruz County Regional Transportation Commission (S12 Commissioners, 1 ex-officio
1st Thursdays, 9:00 am, excluding July3rd Thursdays, as needed9:00 am
831/460-3200www.sccrtc.org
Member Agencies:
City of Capitola5 council members, 1 on RTC; DPW and Plng on ITAC
2nd & 4th Thursdays,7:00 pm
831/475-7300www.cityofcapitola.org
City of Santa Cruz7 council members, 1 on RTC; DPW and Plng on ITAC
2nd & 4th Tuesdays,3:00 pm & 7:00 pm
831/420-5030www.cityofsantacruz.com
City of Scotts Valley5 council members, 1 on RTC; DPW and Plng on ITAC
1st & 3rd Wednesdays, 6:00 pm
831/440-5602www.scottsvalley.org
City of Watsonville7 council members, 1 on RTC; DPW and Plng on ITAC
2nd & 4th Tuesdays,4:30 or 6:30 pm
831 768 3040www.cityofwatsonville.org
County of Santa Cruz5 supervisors, all 5 on RTC; DPW and Plng on ITAC
Tuesdays, 9:00 am
831/454-2200www.co.santa-cruz.ca.us
Santa Cruz Metropolitan Transit District (METRO)11 directors + 1 ex-officio, 3 on RTC; 2 staff on ITAC
4th Fridays, 9:00 am
831/426-6080www.scmtd.com
Ex-Officio: Caltrans District 5Local: 831/423-0396www.dot.ca.gov
RTC Committees:
Budget, Administration, and Personnel Committee 6 Commissioners2nd Thursday,3:30 pm, as needed
831/460-3200www.sccrtc.org
Transportation Policy Workshop 12 Commissioners3rd Thursdays, 9:00 am, as needed
831/460-3200www.sccrtc.org
RTC Advisory Committees:
Bicycle Committee 11 members2nd Monday, 6:00 pm, even numbered months
831/460-3200www.sccrtc.org
Elderly & Disabled Advisory Committee (E&DTAC) 16 members2nd Tuesday, 1:30 pm, even numbered months
831/460-3200www.sccrtc.org
Interagency Technical Advisory Committee (ITAC) 19 members, 1 ex-officio3rd Thursday, 1:30 pm, as needed
831/460-3200www.sccrtc.org
Partner Agencies/Committees:
Association of Monterey Bay Area Governments (AMBAG) 24 members, 1 associateTypically 2nd Wednesday, 6:00 pm
831/883-3750 www.ambag.org
California Highway Patrol (CHP) n/a831/662-0511www.chp.ca.gov
California Transportation Commission (CTC) 11 members + 2 ex-officio varies www.catc.ca.gov
Community Bridges/Lift Line 13 members www.communitybridges.org/liftline
Community Traffic Safety Coalition (CTSC) & South County Bicycle & Pedestrian Work Group (SCBPWG)
varies
CTSC: 1st Tue, 2:00 pm, even # months. SCBPWG: 1st Tue, 10:30 am, odd # months
831/454-4312www.sctrafficsafety.org
Ecology Action's Transportation Program 9 members ecoact.org/Programs/Transportation
Federal Highway Administration (FHWA) n/a www.fhwa.dot.gov
Federal Railroad Administration (FRA) n/a www.fra.dot.gov
Federal Transit Administration (FTA) n/a www.fta.dot.gov
Metropolitan Transportation Commission (MTC) 21 members www.mtc.ca.gov
Monterey Bay Unified Air Pollution Control District 11 members3rd Wednesday,1:30 pm
831/647-9411www.mbuapcd.org
SAFE on 17/Traffic Operations Systems Committee varies March and September831/460-3200www.sccrtc.org
San Benito Council of Governments (SB COG) 5 members3rd Thursday, 3:00 p.m.
831/637-7665www.sanbenitocog.org
Transportation Agency for Monterey Counties (TAMC) 12 members + 6 ex-officio4th Wednesday, 9:00 am
831/775-0903www.tamcmonterey.org
University of California at Santa Cruz (UCSC) n/a www2.ucsc.edu/taps/
Valley Transportation Authority (VTA) n/a www.vta.org/
Volunteer Center's Transportation Program n/a www.scvolunteercenter.com/
Summary Information for the Regional Transportation Commission, Advisory Committees, and other related agencies

Appendix C 2045 RTP Goals, Policies and Targets

2045 Santa Cruz County Regional Transportation Plan Goals, Targets and Policies
RTC approved February 2020
Goal #1 Establish livable communities that improve people's access to jobs, schools, recreation, healthy lifestyles and other regular needs in ways that improve health, reduce pollution and retain money in the local economy.
There is a strong relationship between meeting targets and achieving access, health, economic benefit, climate and energy goals. In many cases actions to achieve one goal or target will assist in achieving other goals and targets. For example, providing more carpool, transit and bicycle trips reduces fuel consumption, retains money in the local Santa Cruz County economy and reduces congestion.
Targets
1.A Improve people’s ability to meet most of their daily needs without having to drive. Improveaccess and proximity to employment centers.
1.A.1 Increase the length of urban bikeway miles relative to total urban arterial and collectorroadway miles to 85 percent by 2030 and to 100 percent by 20451.
1.A.2 Increase the transit vehicle revenue miles by 8 percent by 2030 and 20 percent by 2045(compared to 2020).
1.B Re-invest in the local economy by reducing transportation expenses from vehicle ownership,operation and fuel consumption. Reduce smog-forming pollutants and greenhouse gas emissions.
1.B.1 Reduce per capita vehicle miles traveled by 4 percent by 2030 and by 10 percent by 2045(compared to 2005).
1.B.2 Reduce per capita greenhouse gas emissions by 50 percent by 2030 and by 78 percent by2045 and total greenhouse gas emissions from transportation by 40 percent by 2030 and 70 percent by 20452 (compared to 2005) through electric vehicle use, clean fuels, and other emerging technologies, reduction in vehicle miles traveled and improved speed consistency.
1.B.3 Re-invest in the local economy $8.5 million/year by 2030 and $14 million/year by 2045(compared to 2005) from savings resulting from lower fuel consumption due to a reduction in vehicle miles traveled.3
1 The 2018 percentage of urban bikeway miles to urban arterials and collectors is 70 percent.
2 This target is based on the California Executive Order B-16-12 - reduce greenhouse gas emissions from transportation by 80 percent below 1990 levels by 2050, and California Executive Order B-30-15 - reduce greenhouse gas emissions by 40 percent below 1990 levels by 2030.
3 10 million per year equates to $100 per household per year. Assumes $4 per gallon.

1.C Improve the convenience and quality of trips, especially for walk, bicycle, transit, freight andcarpool/vanpool trips.
1.C.1 Improve percentage of reliable4 person miles traveled by 3 percent by 2030 and by 8percent by 2045 (compared to 2020).
1.C.2 Improve multimodal network quality for walk and bicycle trips to and within keydestinations by increasing the percentage of buffered/separated bicycle and multiuse facilities to 42 percent of bikeway miles by 2030 and to 64 percent by 20455.
1.D Improve health and reduce greenhouse gas emissions by increasing the percentage of tripsmade using active transportation options, including bicycling, walking and transit.
1.D.1 Decrease single occupancy commute trip mode share by 6.5 percent by 2030 and by 10percent by 2045 (compared to 2020).
1.D.2 Increase the number of active commute trips to 16 percent of total commute trips by 2030and to 24 percent of total commute trips by 2045.6
Policies
1.1 Transportation Demand Management (TDM): Expand demand management programs that decrease the number of vehicle miles traveled and result in mode shift.
1.2 Transportation System Management: Implement Transportation System Management programs and projects on major roadways across Santa Cruz County that increases the efficiency of the existing transportation system.
1.3 Transportation Infrastructure: Improve multimodal access to and within key destinations7 for all ages and abilities.
1.4 Transportation Infrastructure: Ensure network connectivity by closing gaps in the bicycle, pedestrian and transit networks.
1.5 Transportation Infrastructure: Develop dedicated transit facilities that will improve transit access and travel time and promote smart growth and transit oriented development.
1.6 Land Use: Support land use decisions that locate new facilities close to existing services, particularly those that serve transportation disadvantaged populations.
4 Travel time reliability measures the consistency or dependability in travel times, as measured from day-to-day.
5 2018 buffered/separated bike lanes is 21 percent of the total bikeway length.
6 The active transportation commute trip mode share for Santa Cruz County estimated from the 2013-2017 American Community Survey is 11% (4.5% walk, 3.7% bike and 2.8% transit). The targets are to increase the total active transportation mode share to 16% by 2030 (6.3% Walk, 5.7% bike and 3.9% transit) and increase the active transportation mode share to 24% by 2045 (9.5% Walk, 8.7% bike and 5.9% transit).
7 Key destinations for Santa Cruz County residents may include employment and commercial centers, schools, healthcare, coastal access, and parks.

1.7 Goods Movement: Enhance local economic activity through improving freight mobility, reliability, efficiency, and competitiveness.
Goal #2 Reduce transportation related fatalities and injuries for all transportation modes.
Safety is a fundamental outcome from transportation system investments and operations. Across the United States, pedestrians and bicyclists (vulnerable users) are killed and injured at a significantly higher rate than the percentage of trips they take.
Targets
2.A Improve transportation safety, especially for the most vulnerable users.
2.A.1 Vision Zero: Eliminate traffic fatalities and serious injuries by 2045 for all modes. By 2030,reduce fatal and serious injuries by 50 percent (compared to 2020).
Policies
2.1 Safety: Prioritize funding for safety projects and programs that will reduce fatal or injury collisions.
2.2 Safety: Encourage projects that improve safety for youth, vulnerable users, and transportation disadvantaged.
2.3 Emergency Services: Support projects that provide access to emergency services.
2.4 System Design: Reduce the potential for conflict between bicyclists, pedestrians, and vehicles.
2.5 Security: Incorporate transportation system security and emergency preparedness into transportation planning and project/program implementation.
Goal #3 Deliver access and safety improvements cost effectively, within available revenues, equitably and responsive to the needs of all users of the transportation system, and beneficially for the natural environment.
The manner in which access and safety outcomes referenced in Goal #1 and Goal #2 are delivered can impact cost-effectiveness, distribution of benefits amongst population groups, and ecological function.
Targets
3.A Maintain the existing system and improve the condition of transportation facilities.

3.A.1 Increase the percentage of pavement in good condition to 50 percent by 2030 and 80percent by 2045.
3.A.2 Reduce the number of transit vehicles in “distressed” condition to 20 percent by 2030 andto 10 percent by 2045.
3.B Enhance healthy, safe access to key destinations for transportation-disadvantaged populations.
3.B.1 Improve travel options for people who are transportation disadvantaged due to income,age, race, disability or limited English proficiency by increasing transit vehicle revenue miles (see Target 1.A.2.) and reducing transit travel times by 15 percent by 2030 and by 30 percent by 2045 (compared to 2020).
3.B.2 Ensure that transportation benefits are equitably distributed and that transportationburdens do not disproportionally affect transportation-disadvantaged populations.
3.C Solicit broad public input.3.C.1 Maximize participation from diverse members of the public in RTC planning and project
implementation activities.
3.D Increase transportation revenues.3.D.1 Increase the amount of transportation funding by 20 percent by 2030 (compared to 2020)
from a combination of local, state and federal funds.
Policies
3.1 Cost Effectiveness & System Maintenance: Maintain and operate the existing transportation system cost-effectively and in a manner that adapts the current transportation system to maximize existing investments.
3.2 Coordination: Improve coordination between agencies in a manner that improves efficiencies and reduces duplication (e.g., paratransit and transit; road repairs; signal synchronization; TDM programs).
3.3 System Financing: Support new or increased taxes and fees that reflect the cost to operate and maintain the transportation system.
3.4 Equity: Demonstrate that planned investments will reduce disparities in safety and access for transportation disadvantaged populations.
3.5 Ecological Function: Deliver transportation investments in a way that increases tree canopy, where appropriate, improves habitat and water quality, and enhances sensitive areas.
3.6 Climate Resiliency: Adapt the transportation system to reduce impacts from climate change.
3.7 Public Engagement: Solicit broad public input on all aspects of regional and local transportation plans, projects and funding actions.

Appendix D Funding Projections 2020-2045
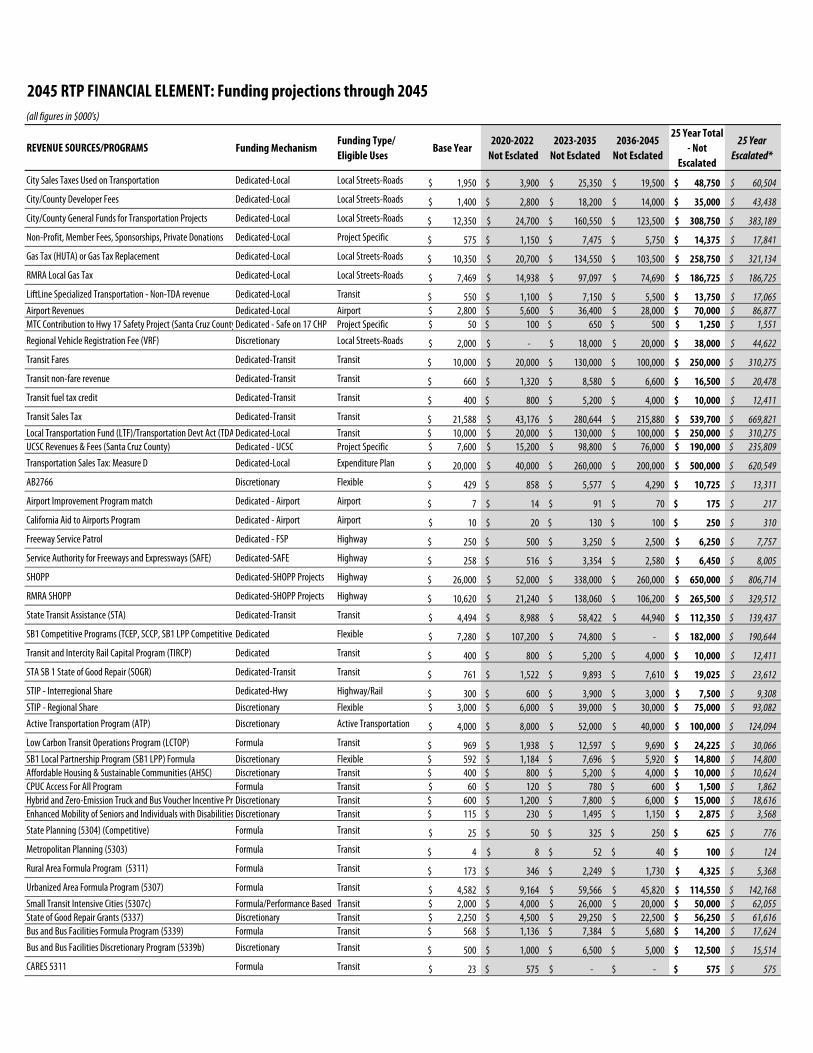
2045 RTP FINANCIAL ELEMENT: Funding projections through 2045
REVENUE SOURCES/PROGRAMS Funding Mechanism Funding Type/ Eligible Uses
Base Year 2020-2022
Not Esclated2023-2035
Not Esclated2036-2045
Not Esclated
25 Year Total - Not
Escalated
25 Year Escalated*
City Sales Taxes Used on Transportation Dedicated-Local Local Streets-Roads 1,950$ 3,900$ 25,350$ 19,500$ 48,750$ 60,504$ City/County Developer Fees Dedicated-Local Local Streets-Roads 1,400$ 2,800$ 18,200$ 14,000$ 35,000$ 43,438$ City/County General Funds for Transportation Projects Dedicated-Local Local Streets-Roads 12,350$ 24,700$ 160,550$ 123,500$ 308,750$ 383,189$ Non-Profit, Member Fees, Sponsorships, Private Donations Dedicated-Local Project Specific 575$ 1,150$ 7,475$ 5,750$ 14,375$ 17,841$ Gas Tax (HUTA) or Gas Tax Replacement Dedicated-Local Local Streets-Roads 10,350$ 20,700$ 134,550$ 103,500$ 258,750$ 321,134$ RMRA Local Gas Tax Dedicated-Local Local Streets-Roads 7,469$ 14,938$ 97,097$ 74,690$ 186,725$ 186,725$ LiftLine Specialized Transportation - Non-TDA revenue Dedicated-Local Transit 550$ 1,100$ 7,150$ 5,500$ 13,750$ 17,065$ Airport Revenues Dedicated-Local Airport 2,800$ 5,600$ 36,400$ 28,000$ 70,000$ 86,877$ MTC Contribution to Hwy 17 Safety Project (Santa Cruz CountyDedicated - Safe on 17 CHP Project Specific 50$ 100$ 650$ 500$ 1,250$ 1,551$ Regional Vehicle Registration Fee (VRF) Discretionary Local Streets-Roads 2,000$ -$ 18,000$ 20,000$ 38,000$ 44,622$ Transit Fares Dedicated-Transit Transit 10,000$ 20,000$ 130,000$ 100,000$ 250,000$ 310,275$ Transit non-fare revenue Dedicated-Transit Transit 660$ 1,320$ 8,580$ 6,600$ 16,500$ 20,478$ Transit fuel tax credit Dedicated-Transit Transit 400$ 800$ 5,200$ 4,000$ 10,000$ 12,411$ Transit Sales Tax Dedicated-Transit Transit 21,588$ 43,176$ 280,644$ 215,880$ 539,700$ 669,821$ Local Transportation Fund (LTF)/Transportation Devt Act (TDA Dedicated-Local Transit 10,000$ 20,000$ 130,000$ 100,000$ 250,000$ 310,275$ UCSC Revenues & Fees (Santa Cruz County) Dedicated - UCSC Project Specific 7,600$ 15,200$ 98,800$ 76,000$ 190,000$ 235,809$ Transportation Sales Tax: Measure D Dedicated-Local Expenditure Plan 20,000$ 40,000$ 260,000$ 200,000$ 500,000$ 620,549$ AB2766 Discretionary Flexible 429$ 858$ 5,577$ 4,290$ 10,725$ 13,311$ Airport Improvement Program match Dedicated - Airport Airport 7$ 14$ 91$ 70$ 175$ 217$ California Aid to Airports Program Dedicated - Airport Airport 10$ 20$ 130$ 100$ 250$ 310$ Freeway Service Patrol Dedicated - FSP Highway 250$ 500$ 3,250$ 2,500$ 6,250$ 7,757$ Service Authority for Freeways and Expressways (SAFE) Dedicated-SAFE Highway 258$ 516$ 3,354$ 2,580$ 6,450$ 8,005$ SHOPP Dedicated-SHOPP Projects Highway 26,000$ 52,000$ 338,000$ 260,000$ 650,000$ 806,714$ RMRA SHOPP Dedicated-SHOPP Projects Highway 10,620$ 21,240$ 138,060$ 106,200$ 265,500$ 329,512$ State Transit Assistance (STA) Dedicated-Transit Transit 4,494$ 8,988$ 58,422$ 44,940$ 112,350$ 139,437$ SB1 Competitive Programs (TCEP, SCCP, SB1 LPP Competitive)Dedicated Flexible 7,280$ 107,200$ 74,800$ -$ 182,000$ 190,644$ Transit and Intercity Rail Capital Program (TIRCP) Dedicated Transit 400$ 800$ 5,200$ 4,000$ 10,000$ 12,411$ STA SB 1 State of Good Repair (SOGR) Dedicated-Transit Transit 761$ 1,522$ 9,893$ 7,610$ 19,025$ 23,612$ STIP - Interregional Share Dedicated-Hwy Highway/Rail 300$ 600$ 3,900$ 3,000$ 7,500$ 9,308$ STIP - Regional Share Discretionary Flexible 3,000$ 6,000$ 39,000$ 30,000$ 75,000$ 93,082$ Active Transportation Program (ATP) Discretionary Active Transportation 4,000$ 8,000$ 52,000$ 40,000$ 100,000$ 124,094$ Low Carbon Transit Operations Program (LCTOP) Formula Transit 969$ 1,938$ 12,597$ 9,690$ 24,225$ 30,066$ SB1 Local Partnership Program (SB1 LPP) Formula Discretionary Flexible 592$ 1,184$ 7,696$ 5,920$ 14,800$ 14,800$ Affordable Housing & Sustainable Communities (AHSC) Discretionary Transit 400$ 800$ 5,200$ 4,000$ 10,000$ 10,624$ CPUC Access For All Program Formula Transit 60$ 120$ 780$ 600$ 1,500$ 1,862$ Hybrid and Zero-Emission Truck and Bus Voucher Incentive Pr Discretionary Transit 600$ 1,200$ 7,800$ 6,000$ 15,000$ 18,616$ Enhanced Mobility of Seniors and Individuals with Disabilities Discretionary Transit 115$ 230$ 1,495$ 1,150$ 2,875$ 3,568$ State Planning (5304) (Competitive) Formula Transit 25$ 50$ 325$ 250$ 625$ 776$ Metropolitan Planning (5303) Formula Transit 4$ 8$ 52$ 40$ 100$ 124$ Rural Area Formula Program (5311) Formula Transit 173$ 346$ 2,249$ 1,730$ 4,325$ 5,368$ Urbanized Area Formula Program (5307) Formula Transit 4,582$ 9,164$ 59,566$ 45,820$ 114,550$ 142,168$ Small Transit Intensive Cities (5307c) Formula/Performance Based Transit 2,000$ 4,000$ 26,000$ 20,000$ 50,000$ 62,055$ State of Good Repair Grants (5337) Discretionary Transit 2,250$ 4,500$ 29,250$ 22,500$ 56,250$ 61,616$ Bus and Bus Facilities Formula Program (5339) Formula Transit 568$ 1,136$ 7,384$ 5,680$ 14,200$ 17,624$ Bus and Bus Facilities Discretionary Program (5339b) Discretionary Transit 500$ 1,000$ 6,500$ 5,000$ 12,500$ 15,514$ CARES 5311 Formula Transit 23$ 575$ -$ -$ 575$ 575$
(all figures in $000's)

REVENUE SOURCES/PROGRAMS Funding Mechanism Funding Type/ Eligible Uses
Base Year 2020-2022
Not Esclated2023-2035
Not Esclated2036-2045
Not Esclated
25 Year Total - Not
Escalated
25 Year Escalated*
(all figures in $000's)
BUILD Discretionary Flexible 400$ 800$ 5,200$ 4,000$ 10,000$ 12,411$ Highway Bridge Program (HBP) Discretionary Local Streets-Roads 5,106$ 10,212$ 66,378$ 51,060$ 127,650$ 158,426$ Highway Safety Improvement Program (HSIP) Discretionary Local Streets-Roads 1,400$ 2,800$ 18,200$ 14,000$ 35,000$ 43,438$ Surface Transp. Block Grant (STBG) /Regl Surface Transptn Pgm Discretionary Flexible 3,712$ 7,423$ 48,252$ 37,117$ 92,792$ 115,164$ Federal Lands Access Program (FLAP) Dedicated- MBSST Project Specific 7,000$ 7,000$ -$ -$ 7,000$ 7,000$ FEMA/CALEMA/ER - Emergency Road Repair Funding Dedicated - (Emergency) Local Streets-Roads 10,000$ 20,000$ 130,000$ 100,000$ 250,000$ 310,275$ FAA Airport Improvement Program (AIP) Dedicated - Airport Airport 260$ 520$ 3,380$ 2,600$ 6,500$ 8,067$
TOTALS 208,290$ 498,748$ 2,588,627$ 1,939,867$ 5,027,242$ 6,141,113$ *Average escalation rate assumption: 1.75% applied to funds beyond existing programmed; except sources with set annual amount or predicted to flatline.

Appendix E Project List

2045 Regional Transportation Plan (RTP) Project List
Projects listed by lead agency, in alphabetical order by project name. Projects with a ☑ next to the project name are new projects identified in the 2045 RTP. Project IDs
without the letter "P" in front of the number have been also included in the Regional Transportatioon Improvement Program. "Constrained" represents amount of project
cost that could be funded with revenues anticipated through 2045. While some projects have secured funding, this amount does not typically represent committed funds.
"Unconstrained" represents amount of project cost that would need additional funding in order to be implemented.
Draft Constrained and Unconstrained Projects - Not Escalated
IDProject Title Project Description/ScopeTotal Cost
($1,000's)
Costs in 2020 dollars.
Constrained UnConstrained
Bike Santa Cruz Co
VAR 02Project PASEO - Open Streets, Earn-
a-Bike, Pop Up Bike Lanes, Slow
Streets
Slow Streets temporary barricades and signage on neighborhood streets aimed at
increasing space for walking and biking, reducing speeds and cutthrough traffic.
Open Streets community events temporarily open roadways to bicycle and
pedestrian travel only, diverting automobiles to other roadways. Earn-a-bike
program provides bikes, tools, safety supplies, as well as bike repair, cycling safety,
and nutrition eductation middle school students. Pop-up bike lanes is a temp demo
of a protected bicycle lane. (est. $120k/yr)
$3,000 $50 $2,950
VAR-P40Santa Cruz County Open Streets Community events promoting alternatives to driving alone as part of a sustainable,
healthy, and active life-style. Temporarily opens roadways to bicycle and pedestrian
travel only, diverting automobiles to other roadways.(Average cost ~ $25k/event)
$2,500 $250 $2,250
Bike Santa Cruz Co Total Cost $5,500 $300 $5,200
Caltrans
CT-P46Collision Reduction & Emergency
Projects
Various SHOPP projects that address collision reduction, mandates (including
stormwater mandates) and emergency projects. (Constrained=30% of total cost).$971,969 $285,569 $686,400
CT-P57Countywide Highway Rumble Strips
and Restriping
Install both centerline and edge line rumble strips and restripe with thermoplastic
stripe routes 9, 1, 17, 25, 129 and 156 in SCZ and SB counties. Caltrans EA# 1M330$4,761 $4,761 $0
CT-P66CZU August Lightning Complex Fire
Recovery
Remove fire debris, burned trees, replace guardrail, drainage systems, timber wall
lagging, and signs on Routes 1, 9 and 236 at various locations. (EA#1M650)$14,800 $14,800 $0
CT-P45Highway Preservation (bridge,
roadway, roadside)
Various SHOPP projects that address bridge preservation, roadway & roadside
preservation and some mobility improvements. (Constrained=30% of cost to
maintain). Includes repaving, culverts, etc.
$790,390 $280,000 $510,390
CT-P74Hwy 1 Capital Maintenance (SR 9 to
north of Western Drive)
Preserve pavement and replace 87 ADA ramps as needed. $10,400 $10,400 $0

IDProject Title Project Description/ScopeTotal Cost
($1,000's)
Costs in 2020 dollars.
Constrained UnConstrained
CT-P64Hwy 1 Drainage Improvements Rehabilitate drainage systems and lighting, install Transportation Management
System (TMS) elements, pave areas behind the gore and construct Maintenance
Vehicle Pullouts (MVPs) to reduce maintenance and enhance highway worker safety.
Caltrans EA# 1K640 *SB1
$16,554 $16,554 $0
CT-P75Hwy 1 Long Toed Salamander
Mitigation
Long Toed Salamander mitigation partnering (Main St interchange in Watsonville to
north of Larkin Valley Rd interchange)$2,800 $2,800 $0
CT-P01Hwy 1 Ramp Metering: Southern
Sections
Reconfigurations of ramps and installation of ramp meters at interchanges from
Hwy 129/Riverside Dr to Mar Monte Ave. Could be implemented as local lead project.$20,600 $0 $20,600
CT-P55Hwy 1 Replace Culverts Safety updates to replace culverts. Caltrans EA# 1K0600 $13,080 $13,080 $0
CT-P65Hwy 1 Roadside Safety Rehabilitate drainage systems, enhance highway worker safety, replace lighting and
install Transportation Management System (TMS) elements. Caltrans EA# 1J960 *SB1$24,021 $24,021 $0
CT 34Hwy 1 Scotts Creek Restoration and
Bridge Reconstruction
Replacement of bridge, road fill removal, and associated infrastructure to re-
establish marsh/estuarine system currently restricted by Highway 1, benefiting
multiple threatened and endangered species and resulting in a more resilient
ecosystem and transportation corridor. Anticipated to be funded in-part by
environmental resource/water grants. Partnerhip with Caltrans, CDF&W, RTC, RCD,
Coastal Conservancy, and others.
$45,500 $10,000 $35,500
CT-P56Hwy 1 Soquel Creek Scour
Protection
Place Rock Slope Protection (RSP) to protect bridge foundation. Caltrans EA# 1H480 $7,703 $7,703 $0
WAT 01AHwy 1/Harkins Slough Road
Pedestrian Bridge/Safer Access to
PVHS & Beyond
Install ped bridge over SR1, sidewalks, Class IV bike lanes, intersection modifications
at Harkins Slough Rd/Green Valley Rd/Silver Leaf, high visibility crosswalks, new and
upgraded curb extensions/ramps, and pedestrian & bike safety programs
intersection to improve bike and ped access. (Caltrans Project ID 05-1G490)
$15,800 $15,800 $0
CT-P79Hwy 129 Capital Maintenance Preserve pavement, rehabilitate 6 drainage systems. (Salsipuedes Creek to Old
Chittenden Road)$12,500 $12,500 $0
CT-P63Hwy 129 Paving, Sign Panels,
Lighting, TMS Improvement
Rehabilitate pavement and lighting, replace sign panels, and install Transportation
Management System (TMS) elements. Caltrans EA# 1J830 *SB1.$14,809 $14,809 $0
CT-P61Hwy 152 Corralitos Creek ADA Construct accessible pathway, concrete barrier, retaining wall, curb, gutter and
sidewalk to meet Americans with Disabilities Act (ADA) standards.Caltrans EA# 1F620$7,452 $7,452 $0
CT-P52Hwy 17 Access Management -
Laurel Rd/Sugarloaf Rd/Glenwood
Cutoff Area Grade Separation
Concept
New structure providing grade-separation to facilitate crossing and turnaround. $40,000 $0 $40,000

IDProject Title Project Description/ScopeTotal Cost
($1,000's)
Costs in 2020 dollars.
Constrained UnConstrained
CT-P50Hwy 17 Access Management -
Multimodal Improvements
Multimodal improvements including park and ride improvements, and facilities
serving separated bike/ped crossing or express transit route.$20,000 $5,000 $15,000
CT-P53Hwy 17 Access Management - Old
Santa Cruz Hwy Area Grade
Separation Concept
New structure providing grade-separation to facilitate crossing and turnaround. $40,000 $0 $40,000
CT-P49Hwy 17 Access Management -
Operational Improvements
Operational improvements to existing facilities including ramp modifications,
accel/decel lanes, turning lanes, driveway consolidation, driveway channelization, etc.$50,000 $10,000 $40,000
CT-P51Hwy 17 Access Management - Vine
Hill Area Grade Separation Concept
New structure providing grade-separation to facilitate crossing and turnaround. $40,000 $0 $40,000
CT-P78Hwy 17 Capital Maintenance (SR 1
to Vine Hill School Road area)
Preserve pavement, upgrade median barrier, install 12 TMS $17,200 $17,200 $0
CT-P73Hwy 17 Drainage Improvements Construct and install stormwater quality Best Management Practices (BMPs) and
rehabilitate drainage systems.(Long Lead Project)$9,502 $9,502 $0
CT-P58Hwy 17 Jarvis Slide Rock Fence Construct rock fence / barrier at Jarvis Slide. Caltrans EA#1K070 $7,438 $7,438 $0
CT-P70Hwy 17 Paving Grind pavement and place Hot Mix Asphalt (HMA), apply High Friction Surface
Treatment (HFST), and contrasting surface treatment (south of Mt Hermon Road to
0.6 mile north of Glenwood Drive).
$8,563 $8,563 $0
CT 33Hwy 17 Wildlife Crossing Construct wildlife undercrossing north of Laurel Road (CT#1G260). 60 foot long
single span bridge will extend from the existing Laurel Road Sidehill Viaduct (Br. No.
36-0111) on the west side of Route 17 to the east. The final product will provide a 16
foot wide natural soil bottom wildlife crossing under Route 17 with side slopes to
the abutment faces. The wildlife under-crossing will slope downward to the west. A
minimum vertical clearance of 10 feet will be provided.
$5,155 $5,155 $0
CT-P80Hwy 236 Drainage and System
Upgrades in Boulder Creek
Drainage System and TMS upgrades $13,400 $13,400 $0
CT-P67Hwy 236 Hazardous Tree Removal Remove hazardous trees and fire debris near Boulder Creek, from Forest Drive to
2.2 miles south of Route 9. (EA#1M790)$15,625 $15,625 $0
CT-P71Hwy 236 Heartwood Hill
Embankment Restoration
Construct retaining wall to stabilize slope, widen shoulder, repair pavement,
improve drainage systems and install erosion control.$4,855 $4,855 $0
CT-P76Hwy 9 Capital Maintenance (CapM) Preserve pavement, rehabilitate 5 drainage systems, install 2 TMS. (El Solyo Heights
in Felton to north of SR 1 in Santa Cruz)$26,400 $26,400 $0
CT-P77Hwy 9 Capital Maintenance North Preserve pavement, reconstruct guardrail, rehabilitate 6 drainage systems.
(Saratoga Toll Rd in Boulder Creek to SR 35/county line)$9,200 $9,200 $0

IDProject Title Project Description/ScopeTotal Cost
($1,000's)
Costs in 2020 dollars.
Constrained UnConstrained
CT 09Hwy 9 Felton Pedestrian Safety
Improvements
Construct pedestrian path on Route 9 from the San Lorenzo Valley (SLV) High School
to the intersection of Graham Hill Rd/Felton-Empire, plus signage and crosswalk
improvements between Kirby St and Graham Hill Road.
$15,800 $15,800 $0
CT-P68Hwy 9 Hairpin Tieback at PM19.97 Construct Soldier Tieback Retaining Wall near Boulder Creek about 1.1 mile south of
Junction 236/9.$7,630 $7,630 $0
CT-P62Hwy 9 PM 1.0 and 4.0 Viaduct Construct sidehill viaducts, restore roadway and facilities, provide erosion control.
Caltrans EA# 1K120$18,231 $18,231 $0
CT-P59Hwy 9 San Lorenzo River Bridge &
Kings Creek Bridge Replacement
Replace bridges to maintain standards of safety and reliability. Caltrans EA#1H470 $23,210 $23,210 $0
CT-P09Hwy 9 SLV Corridor Projects May be implemented by Caltrans or County of SC, in partnership with others.
Implementation of priorities identified in the Complete Streets Corridor Plan.
Includes improvements to increase safety and discourage speeding, updated and
expanded bicycle and pedestrian facilities including shoulder widening, auto turn
lanes and other auto circulation improvements, and transit improvements in SLV.
SLV Complete Streets PID development efforts underway; some may be integrated
into SHOPP projects. Capital Cost Est. TBD - preliminary estimate $100-150 million.
$10M Measure D. Some bike/ped elements also shown in CO-P46a/b.
$130,000 $30,000 $100,000
CT-P60Hwy 9 Upper Drainage and Erosion
Control Improvements
Replace failed culverts systems and construct energy dissipaters. Caltrans EA#
1G950$12,557 $12,557 $0
CT-P54Hwy 9 Viaduct Wall Extension Construct side hill viaduct extension with cutoff retaining wall, restore roadway and
facilities, and install permanent erosion control.Caltrans EA# 1K060$6,910 $6,910 $0
CT-P47Minors Various small SHOPP projects (less than $1 million) that reduce/enhance
maintenance efforts by providing minor operational, pavement rehab, drainage,
intersection, electrical upgrades, landscape and barrier improvements.
(Constrained=30% of total cost).
$11,250 $2,000 $9,250
CT-P69Pedestrian Signals #2: Hwys 1 and
129
Install Accesible Pedestrian Signal (APS) push buttons, Countdown Pedestrian Signal
(CPS) heads, pedestrian barricades, and crosswalk signage to improve pedestrian
and bicycle safety. (Project in MON, SCR, SLO and SB counties, PPNO2628).
$4,580 $4,580 $0
Caltrans Total Cost $2,510,645 $973,505 $1,537,140
CHP - California Highway Patrol
CHP-P04Hwy 1 Safety and Bus on Shoulder
Enforcement
Additional CHP enforcement and public education campaign when new bus on
shoulder facilities operational (anticipate 4 years of enforcement).$250 $250 $0
CHP-P03Hwy 129 Safety Program Additional CHP enforcement and public education campaign on Highway 129. $500 $0 $500

IDProject Title Project Description/ScopeTotal Cost
($1,000's)
Costs in 2020 dollars.
Constrained UnConstrained
CHP 01Hwy 17 Safety Program (Safe on 17) Continuation of Highway 17 Safety Program in Santa Cruz County. Includes public
education and awareness, California Highway Patrol (CHP) enhancement, pilot cars,
electronic speed signs.
$7,500 $3,750 $3,750
CHP-P02Traffic Management Patrol of state route system and unincorporated roadways aimed at minimizing
traffic collisions and traffic delays; and provide assistance to motorists. COST EST
TBD.
$0 $0 $0
CHP - California Highway Patrol Total Cost $8,250 $4,000 $4,250
City of Capitola
CAP-P4640th Ave (at Deanes Ln)Bike/Ped
connection
40th Avenue N/S bike/pedestrian connection at Deanes Lane. $10 $10 $0
CAP-P3840th Ave/Clares St Intersection
Improvements
Widen intersection and signalize. $1,550 $500 $1,050
CAP-P4741st Ave (Highway 1 South to City
Limits) Crosswalks
Evaluate and if found necessary, increase number of crosswalks on 41st to closer to
every 300 ft.$100 $100 $0
CAP-P4941st Ave (Soquel to Brommer)
Adaptive Signal Synchronization
Update synchronization of signals on 41st. $350 $350 $0
CAP-P3741st Ave/Capitola Road Intersection
Improvements
Widen intersection and reconfigure signal phasing. $520 $320 $200
CAP-P4046th/47th Ave (Clares to Cliff Dr)
Bike Lanes/Traffic Calming
46th/47th from Clares to Portola/Cliff - Add traffic calming and wayfinding signage
to connect to Brommer and MBSST.$20 $20 $0
CAP-P3047th Avenue Traffic Calming and
Greenway
Traffic calming and traffic dispersion improvements along 47th Ave from Capitola Rd
to Portola Drive and implementation of greenway, which gives priority to bicycles
and pedestrians on low volume, low speed streets including, pedestrian facilities,
way finding and pavement markings, bicycle treatments to connect to MBSST.
$100 $100 $0
CAP-P29Bay Avenue Traffic Calming and
Bike/Ped Enhancements
Traffic calming features along Bay Avenue from Highway 1 to Monterey Avenue,
including left turn pocket, buffered pedestrian facilities and bicycle treatments (such
as buffered and/or painted bike lanes, bike boxes, bike signals) to address speed
inconsistency between bicyclists and vehicles.
$410 $0 $410
CAP 16Bay Avenue/Capitola Avenue
Intersection
Modifications/Roundabout
Multimodal improvements to intersection. Roundabout. $1,500 $500 $1,000
CAP-P07Bay Avenue/Hill Street Intersection Intersection improvements to improve traffic flow. Roundabout. $210 $210 $0

IDProject Title Project Description/ScopeTotal Cost
($1,000's)
Costs in 2020 dollars.
Constrained UnConstrained
CAP-P32Bay Avenue/Monterey Avenue
Intersection Modification
Multimodal improvements to the intersection. Include signalization or roundabout
along with pedestrian, bicycle treatments (such as buffered and/or painted bike
lanes, bike boxes, bike signals) and transit access.
$310 $310 $0
CAP-P41Brommer/Jade/Topaz St Bike
Lanes/Traffic Calming (Western City
Limit on Brommer to 47thAve)
Add buffered bike lanes, traffic calming and wayfinding signage and bike/ped
priority crossing at 41st Ave, connecting the two N/S neighborhood greenways.$20 $20 $0
CAP-P18Capitola Intra-City Rail Trolley Construct & Operate Weekend Rail Trolley Service. Project includes installation of 3
stations.$14,460 $0 $14,460
CAP-P15Capitola Jitney Transit Service Purchase and operate local transit service. $1,030 $0 $1,030
CAP-P48Capitola Mall (Capitola Rd to Clares)
Bike Path
Separated bicycle facility through Capitola Mall parking lot to connect 38th Ave bike
lanes and 40th Ave.$50 $50 $0
CAP-P53Capitola Rd & 45th Avenue I/S
Improvements
Signalization or other LOS improvements $400 $400 $0
CAP 19Capitola Street Pavement
Management
Capitola Street Pavement Management- includes 41st Avenue, Clares Street, Bay
Avenue, Capitola Road and numerous residential streets including but not limited to
42nd, 47th, 48th, Fanmar, Diamond, and Ruby Court.
$1,450 $1,450 $0
CAP-P34Capitola Village Enhancements:
Capitola Ave
Multimodal enhancements along Capitola Avenue. $750 $350 $400
CAP-P04bCapitola Village Multimodal
Enhancements - Phase 2/3
Multimodal enhancements in Capitola Village along Stockton Ave, Esplanade, San
Jose Ave, & Monterey Av. Includes sidewalks, bike lanes, bike lockers, landscaping,
improve transit facilities, parking, pavement rehab and drainage.
$3,100 $0 $3,100
CAP-P50Capitola-wide HOV priority Evaluate HOV priority at signals and HOV queue bypass. $40 $40 $0
CAP-P52Citywide Bike Projects Bike projects based on needs identified through the Bicycle Plan. These projects are
in addition to projects listed individually in the RTP.$1,030 $400 $630
CAP-P06Citywide General Maintenance and
Operations
Ongoing maintenance, repair, and operation of road/street system within the City
limits. (Const=$1850K/yr; Unconst=$150K/yr).$55,050 $51,300 $3,750
CAP-P51Citywide Sidewalk Program Install sidewalks to fill gaps. Annual Cost $50k/yr. $1,250 $750 $500
CAP-P17Citywide Traffic Calming Install traffic calming/neighborhood livability improvements. $1,136 $0 $1,136
CAP-P42Clares St Bike Lanes/Sharrows
(Capitola Rd to 41st Ave)
Evaluate and if found necessary, add bike lanes/sharrows to Clares. $100 $100 $0

IDProject Title Project Description/ScopeTotal Cost
($1,000's)
Costs in 2020 dollars.
Constrained UnConstrained
CAP-P43Clares St/41st Ave Bicycle
Intersection Improvement
Bike treatments (such as buffered and/or painted bike lanes, bike boxes, bike
signals) at Clares across 41st.$200 $100 $100
CAP-P16Clares Street Pedestrian Crossing
west of 40th Ave
Construct signalized ped x-ing 0.20 miles west of 40th Ave. $520 $250 $270
CAP 11Clares Street Traffic Calming: Phase
I & II
Implementation of traffic calming measures. May include chicanes, center island
median, new bus stop, and road edge landscape treatments to slow traffic.
Construct new safe, accessible ped x-ing at 42nd and 46th Av. Ph I=traffic calming &
ped crossings; ph 2 = bike enhancements & pavement rehab.
$1,600 $1,350 $250
CAP-P05Cliff Drive Improvements Installation of sidewalks, pedestrian crossing and slope stabilization of embankment
including seawall.$1,550 $0 $1,550
CAP-P44Gross/41st Ave Bicycle Intersection
Improvement
Bike treatments (such as buffered and/or painted bike lanes, bike boxes, bike
signals) from Gross E/B to 41st N/B.$200 $100 $100
CAP-P56Monterey Avenue and Park Avenue
I/S Improvements
Signalization or other LOS improvements $500 $0 $500
CAP-P28Monterey Avenue at Depot Hill Improve vehicle ingress and egress to Depot Hill along Escalona Ave and improve
pedestrian facilities.$260 $260 $0
CAP-P12Monterey Avenue Multimodal
Improvements
Installation of sidewalks and bike lanes in area near school and parks. $360 $360 $0
CAP-P09Park Avenue/Kennedy Drive
Improvements
Construct intersection improvements, especially for bikes/peds. May include traffic
signal.$360 $360 $0
CAP-P55Porter Street and Highway 1 I/S
Improvements
Add additional dedicated right turn lane on Porter St to northbound on ramp $250 $250 $0
CAP-P07pStockton Ave Bridge Rehab Replace bridge with wider facility that includes standard bike lanes and sidewalks. $3,000 $1,500 $1,500
CAP-P57Stockton Avenue and Capitola
Avenue I/S Improvements
Signalization or other LOS improvements $500 $500 $0
CAP-P03Upper Capitola Avenue
Improvements
Installation of bike lanes and sidewalks on Capitola Av. (Bay Av.-SR 1) and sidewalks
on Hill St. from Bay Av. to Rosedale Av.$1,340 $500 $840
CAP 17Upper Pacific Cove Parking Lot
Pedestrian Trail and Depot Park
Metro Development
Construct pedestrian pathway along City owned Upper Pacific Cove Parking lot,
adjacent to rail line (680'). Includes new signal for ped crossing at Monterey Avenue.
Includes a new bus shelter located and landscaped setting along the rail corridor at
Park Ave. Part of MBSST.
$743 $743 $0

IDProject Title Project Description/ScopeTotal Cost
($1,000's)
Costs in 2020 dollars.
Constrained UnConstrained
CAP-P54Wharf Road and Stockton Avenue
I/S Improvements
Signalization or other LOS improvements $350 $350 $0
CAP-P27Wheelchair Access Ramps Install wheelchair access/curb cut ramps on sidewalks citywide. $200 $200 $0
City of Capitola Total Cost $96,879 $64,103 $32,776
City of Santa Cruz
SC-P126Almar Ave Sidewalks Fill gaps in sidewalks and access ramps to improve pedestrian safety. $200 $200 $0
SC-P107Arroyo Seco Trail (Medar St to
Grandview St)
Pave existing gravel trail and widen and pave connection to Grandview St. $500 $0 $500
SC-P77Bay Street Corridor Modifications Intersection modifications on Bay St Corridor from Mission St to Escalona Dr,
including widening at the Mission St northeast corner and widening on Bay.
Improve bike lanes and add sidewalks to west side of Bay.
$5,100 $970 $4,130
SC-P96Bay/California Traffic Signals Install traffic signals and roundabouts for safety and capacity improvements. $1,100 $100 $1,000
SC-P109Bay/High Intersection Modification Install a roundabout or modify the traffic signal to include protected left-turns and
new turn lanes. Revise sidewalks, access ramps and bike lanes as appropriate.$2,150 $2,150 $0
SC-P93Beach/Cliff Intersection Signalization Signalize intersection for pedestrian and train safety. $210 $210 $0
SC-P95Branciforte Creek Pedestrian Path
Connections
Fill gaps in pedestrian and bike paths along and across Branciforte Creek in the
Ocean-Lee-Market-May Streets area.$3,410 $0 $3,410
SC-P21Brookwood Drive Bike and
Pedestrian Path
Provide 2-way bicycle and pedestrian travel. $1,030 $0 $1,030
SC-P22Chestnut St. Pathway Install a Class 1 bicycle/pedestrian facility to connect the east side of Neary Lagoon
Park with the Depot Park path.$570 $0 $570
SC-P47Chestnut Street Bike Lanes Install Class 2 bike lanes to provide connection from existing bike lanes on Laurel
Street and upper Chestnut Street to proposed Class 1 bike path connections to Bay
Street and Pacific Avenue/Beach Street.
$100 $0 $100
SC-P07Citywide Operations and
Maintenance
Ongoing maintenance, repair, and operation of street system within the City limits.
(Const=$3.0M/yr; Unconst=$4.2M/yr)$184,000 $79,000 $105,000
SC-P125Citywide Safe Routes to School
Projects - ATP
Projects to improve pedestrian and bicycle safety near schools. $8,204 $1,404 $6,800
SC-P128Citywide Street Sweeping Ongoing street sweeping, funded from City Refuse Enterprise Fund. $22,500 $22,500 $0

IDProject Title Project Description/ScopeTotal Cost
($1,000's)
Costs in 2020 dollars.
Constrained UnConstrained
SC-P23Delaware Avenue Complete Streets Fill gaps in bicycle lanes, sidewalks and sidewalk access ramps. $150 $150 $0
SC-P129Downtown Intersection
Improvements
Modify Front/Soquel, Front/Laurel and Pacific/Front Intersections stemming from
additional residential and commercial development in the Downtown.$300 $300 $0
SC-P90High St/Moore St Intersection
Modification
Add a protected left turn to existing signalized intersection along High St at city
arterial. Project is located in high pedestrian and bicycle use activity area.$100 $100 $0
SC-P108Hwy 1 - Harvey West Area
Alternative Access
Development of an on/off ramp from NB Highway 1 to Harvey West
Boulevard/Evergreen St, to improve access, especially during peak congestion times
and emergencies.
$4,130 $0 $4,130
SC-P03Hwy 1 Sound Wall Install sound wall on Hwy 1: River to Chestnut. $520 $0 $520
SC 25Hwy 1/9 Intersection Modifications Intersection modifications including new turn lanes, bike lanes, shoulders, lighting,
sidewalks and access ramps. Includes adding second left-turn lane on Highway 1
southbound to Highway 9 northbound; second northbound through lane and
shoulder on northbound Highway 9, from Highway 1 to Fern Street; a right-turn lane
and shoulder on northbound Highway 9; through-left turn lane on northbound River
St; replace channelizers on Highway 9 at the intersection of Coral Street; sufficient
lane width along the northbound through/left turn lane on Highway 9 from Fern
Street to Encinal Street; new sidewalk along the east side of Highway 9 from Fern
Street north to Encinal Street; new through/left turn lane on southbound Highway 9;
Traffic Signal interconnect to adjacent signals. (Caltrans project ID - 05-46580)
$7,900 $7,900 $0
SC-P81Hwy 1/Mission St at
Chestnut/King/Union Intersection
Modification
Modify design of existing intersections to add lanes and upgrade the traffic signal
operations to add capacity, reduce delay and improve safety. Provide access ramps
and bike lanes on King and Mission. Includes traffic signal coordination.
$4,650 $4,650 $0
SC 38Hwy 1/San Lorenzo Bridge
Replacement
Replace the Highway 1 bridge over San Lorenzo River to increase capacity, improve
safety and improve seismic stability, from Highway 17 to the Junction of 1/9. Reduce
flooding potential and improve fish passage. Caltrans Project ID 05-0P460
$20,000 $20,000 $0
SC-P92Hwy 1/Shaffer Rd Signalization Signalization of intersection of Hwy 1 and Shaffer Rd. Project may includes some
widening of Hwy 1 to accommodate a left turn lane.$520 $0 $520
SC-P59King Street Bike Facility (entire
length)
Install Class 2 bike lanes on residential collector street which includes some parking
and landscape strip removals, and some drainage inlet modifications.$2,070 $2,070 $0
SC-P97Laurent/High Intersection
Improvements
Install Traffic Signal. $410 $0 $410
SC-P75Lump Sum Bike Projects Bike projects based on needs identified through the Active Transportation Plan and
Santa Cruz City Schools Complete Streets Master Plan. These are in addition to
projects listed individually in the RTP.
$6,800 $0 $6,800

IDProject Title Project Description/ScopeTotal Cost
($1,000's)
Costs in 2020 dollars.
Constrained UnConstrained
SC-P105Market Street Sidewalks and Bike
Lanes
Completion of sidewalks and bicycle lanes. Includes retaining walls, right-of-way,
tree removals, and a bridge modification.$1,030 $1,030 $0
TRL 07bSCMBSST (Coastal Rail Trail): Segment
7-Phase 2 (Bay/California St to
Pacific Ave/wharf)
Bicycle/pedestrian multiuse path adjacent to railroad tracks between Bay/California
streets and Pacific Ave/Beach St. MBSST Segment 7-phase 2$11,000 $11,000 $0
TRL 07cSCMBSST (Coastal Rail Trail): Segment
7-Phase 3 (Natural Bridges to
Shaffer Rd)
Bicycle/pedestrian multiuse path adjacent to railroad tracks from Natural Bridges to
Shaffer Rd crossing Antonelli Pond. MBSST Segment 7-phase 3$3,200 $200 $3,000
TRL 8-9aMBSST (Coastal Rail Trail): Segment
8 and 9
Multiuse trail along the rail corridor between Pacific Ave in the City of Santa Cruz to
17th Ave in County of Santa Cruz (2.18 miles) and non-infrastructure safety,
education, and encouragement programs.
$34,500 $34,500 $0
SC-P104Measure H Road Projects Road rehabilitation and reconstruction projects citywide to address backlog of
needs using Measure H sales tax revenues. (Some Measure H funds anticipated to
fund specific projects listed in the RTP).
$41,800 $41,800 $0
SC-P112Mission St (Hwy 1)/Laurel St
Intersection Modification
Modify traffic signal to add right-turn from Mission St to Laurel St and signal overlap
phase.$1,030 $0 $1,030
SC-P113Mission St (Hwy 1)/Swift St
Intersection Modification
Modify traffic signal to add Swift St right-turn lane and signal overlap phase. $500 $0 $500
SC-P130Mission Street Improvement Plan Evaluate and design Mission intersection improvements at Chestnut-King, Laurel,
Bay and Swift based on the General Plan.$1,500 $0 $1,500
SC-P29Morrissey Blvd. Bike Path over Hwy
1
Install a Class 1 bicycle and pedestrian facility on freeway overpass. $300 $300 $0
SC-P12Morrissey/Poplar/Soquel
Intersection Modification
Modify the roadway configuration in the Morrissey/Poplar/Soquel triangle area to
improve traffic circulation and safety for all modes.$2,070 $0 $2,070
SC 37Murray St Bridge Retrofit Seismic retrofit of existing Murray St. bridge (36C0108) over Woods Lagoon at
harbor and associated approach roadway improvements and replacement of barrier
rail. Includes wider bike lanes and sidewalk on ocean side. Include access paths to
harbor if eligible.
$11,440 $11,440 $0
SC-P30Murray St to Harbor Path
Connection
Install a Class 1 bicycle/pedestrian facility to connect the Segment 9 Rail trail project,
for the east and west side of the harbor.$1,000 $210 $790
SC-P73Neighborhood Traffic Management
Improvements
Install traffic control devices and roadway design features to manage neighborhood
traffic.$2,580 $0 $2,580

IDProject Title Project Description/ScopeTotal Cost
($1,000's)
Costs in 2020 dollars.
Constrained UnConstrained
SC-P115North Branciforte/Water
Intersection Modification
Modify traffic signal and add additional lanes per traffic study. Include signal
interconnect if applicable.$2,070 $0 $2,070
SC-P120Ocean St and San Lorenzo River
Levee Bike/Ped Connections (Felker,
Kennan, Blain, Barson Streets)
Improve pedestrian and bicycle facilities on side streets to connect Ocean Street
with San Lorenzo River Levee path system.$620 $0 $620
SC 48Ocean St Pavement Rehabilitation Pavement rehabilitation using cold-in-place recycling process; includes new curb
ramps, restriping of bicycle lanes and crosswalks.$1,030 $1,030 $0
SC-P86Ocean St Streetscape and
Intersection, Plymouth to Water
Implement this phase of the Ocean Street plan and modify Plymouth St to provide
separate turn lanes and through lanes, widen sidewalks, pedestrian
islands/bulbouts, transit improvements, street trees, street lighting and medians
landscaping improvements. This includes pedestrian and bicycle crossing
improvements and detection and connectivity to the pedestrian and bicycle path on
the San Lorenzo River and adjacent neighborhoods. Include Gateway treatment.
$4,130 $2,000 $2,130
SC-P84Ocean St Streetscape and
Intersection, Water to Soquel
Implement this phase of the adopted Ocean Street plan including adding turn lanes
on Ocean Street at the Water Street intersections, wider sidewalks, pedestrian
crossing islands/bulb outs, transit improvements, street trees, pedestrian scale
street lights, and medians improvements, way finding, and pedestrian and bicycle
connectivity to San Lorenzo Park and neighborhoods.
$6,200 $0 $6,200
SC-P122Ocean Street Corridor Multiuse
Transit Lane
Consider restricting parking to develop business access and transit (BAT) lane to
serve tourism and improving transit facilities.$410 $0 $410
SC-P66Ocean Street Widening from Soquel
to East Cliff
Implement this phase of the Ocean Street plan that includes utility undergrounding,
bike lanes, wider sidewalks, pedestrian crossing islands/bulb outs, transit
improvements, pedestrian scale street lights, street trees and left turn lanes at
Broadway and a right-turn lane at San Lorenzo Blvd. This includes pedestrian and
bicycle crossing improvements and detection and connectivity to the pedestrian and
bicycle path on the San Lorenzo River and adjacent neighborhoods.
$5,170 $0 $5,170
SC-P124Ocean Street/San Lorenzo River
Levee Area Wayfinding
Install signage on the bike/ped scale to bike/ped facilities connecting key
destinations.$150 $0 $150
SC-P134Ocean-Plymouth Multi-modal
Transportation Improvements
Improve the bike and pedestrian connections through the Ocean-Plymouth
intersection$2,000 $200 $1,800
SC 50Pacific Ave. Sidewalk Construct 200' of new sidewalk on Pacific Avenue between Front Street and 55 Front
St, including installation of a new accessible crosswalk at Front and Pacific; 150' bike
lane.
$400 $400 $0
SC-P110River (Rte 9)/Fern Intersection
Modification
Install traffic signal, sidewalk and new access ramps. Provide bike lanes on Fern. $520 $0 $520

IDProject Title Project Description/ScopeTotal Cost
($1,000's)
Costs in 2020 dollars.
Constrained UnConstrained
SC-P116River St/River Street South
Intersection Modification
Install a roundabout or traffic signal to improve access and safety to the Downtown
core, integrating bike and pedestrian facilities.$520 $0 $520
SC-P13Riverside Ave/Second St
Intersection Modification.
Modify intersection to reduce congestion and improve pedestrian crossing. $175 $175 $0
SC-P35San Lorenzo River Levee Path
Connection
Install a Multi-Use bicycle/pedestrian facility connecting the end of the San Lorenzo
River Levee path on the eastern side of the river, up East Cliff Drive near Buena Vista
Ave.
$2,070 $2,070 $0
SC-P133San Lorenzo River Walk Lighting Install pedestrian scale lighting on the Riverwalk $1,970 $970 $1,000
SC-P69Seabright Avenue Bike Lanes (Pine-
Soquel)
Install Class 2 bike lanes on arterial street to complete the Seabright Avenue bike
lane corridor and connect to bike lane corridor on Soquel Avenue and Murray.
Includes removal of some parking and some landscape strips.
$2,070 $2,070 $0
SC-P100Seabright/Murray Traffic Signal
Modifications
Remove split phasing on Seabright and add right-turn lane northbound. $1,030 $1,030 $0
SC-P99Seabright/Water Intersection
Improvements
Modify unsignalized intersection to add northbound right and extend left-turn
pocket.$100 $0 $100
SC-P91Shaffer Road Widening and Railroad
Crossing
Construction of a new crossing of the Railroad line at Shaffer Rd. and widening at
the southern leg of Shaffer in conjunction with development. Complete sidewalks
and bike lanes.
$1,000 $1,000 $0
SC-P09Sidewalk Program Install and maintain sidewalks and access ramps. $20,660 $5,500 $15,160
SC 42Soquel Ave at Frederick St
Intersection Modifications
Widen to improve eastbound through-lane transition on Soquel Ave and lengthen
right-turn pocket and bicycle lane on Frederick St. Upgrade access ramps.$350 $350 $0
SC-P87Soquel Ave Corridor Widening
(Branciforte-Morrissey)
Minor widening and signal modifications along Soquel Ave corridor from Branciforte
to Morrissey Blvd to widen sidewalks, transit improvements, improve pedestrian
and bicycle detection and crossings, add a travel lane, maintain some commercial
parking and improve existing bike lanes. Replacing the split phasing with protected
left-turns at Branciforte to reduce delays for all modes of travel and GHG.
$2,320 $0 $2,320
SC-P123Soquel/Branciforte/Water (San
Lorenzo River to Branciforte) Bike
Lane Treatments
Consider bike treatments (such as buffered and/or painted bike lanes, bike boxes,
bike signals) to address speed inconsistency and parking conflicts between bicyclists
and vehicles.
$410 $410 $0
SC-P76Storey/King Street Intersection Left-
Turn Lane
Remove parking and modify striping for second southbound left turn lane. $100 $0 $100
SC-P132Swanton Blvd. Multi-Use Trail
Connector
Install a 10-12 foot wide multi-use trail along Swanton, Delaware and Natural
bridges, completing a missing link.$1,900 $0 $1,900

IDProject Title Project Description/ScopeTotal Cost
($1,000's)
Costs in 2020 dollars.
Constrained UnConstrained
SC-P101Swift/Delaware Intersection
Roundabout or Traffic Signal
Install Traffic Signal or Roundabout at Intersection to improve capacity and safety. $500 $500 $0
SC 23West Cliff Path Minor Widening
(David Way Lighthouse to Swanton)
Improve existing path. $520 $520 $0
SC-P83West Cliff/Bay Street Modifications Install signal or roundabout to replace the all-way stop to improve safety and
capacity.$500 $500 $0
City of Santa Cruz Total Cost $447,469 $260,909 $186,560
City of Scotts Valley
SV-P55Bean Creek Rd at Bluebonnet Traffic
Circle
Install traffic circle to slow traffic and improve visibility of crosswalk. Source ATP Plan $300 $0 $300
SV-P35Bean Creek Rd Sidewalks (SVMS to
Blue Bonnet)
Fill gaps in sidewalks on Bean Creek Rd. $410 $410 $0
SV-P57Bean Creek Rd Traffic Calming and
Sidewalk Upgrades
Install traffic calming measures and upgrade to standard sidewalk on east side of
the street. Study options to install Class I facility on east side of the street. Source
ATP Plan
$650 $0 $650
SV-P65Bean Creek Rd/Camp Evers
Connection
Pave (asphalt or concrete) existing dirt paths on Bean Creek Rd. Source SRTS Plan $21 $0 $21
SV-P56Bean Creek Road at SV Middle
School driveway crosswalk
improvements
Realign crossing and rebuild ADA ramp on west side. Upgrade crosswalk to high
visibility. Source SRTS Plan$53 $53 $0
SV-P16Bean Creek Road Realignment Realign Bean Creek Road to intersect Scotts Valley Drive farther North to create a
four way intersection.$2,840 $0 $2,840
SV 30aBlue Bonnet Lane and Kings Village
Rd Sidewalk Infill
Fill gaps in sidewalks on Bluebonnet and Kings Village Rd. to improve access
between middle school, library and park.$250 $250 $0
SV-P59Bluebonnet Lane at Montevalle
Crosswalk Improvements
Install high-visibility raised crosswalk. Source ATP Plan $25 $0 $25
SV-P58Bluebonnet Lane Seperated Bikeway Install raised cycletrack or Class IV separated bikeway to narrow travel lanes and
decrease pedestrian crossing distance. Source ATP Plan$290 $0 $290
SV-P60Carbonera Creek Multi-Use Path Study options to install multi-use path connecting parks along Carbonera Creek.
Source ATP Plan$300 $0 $300
SV-P06Citywide Access Ramps Place handicap ramps at various locations. Avg annual cost: $8K/yr. $210 $210 $0

IDProject Title Project Description/ScopeTotal Cost
($1,000's)
Costs in 2020 dollars.
Constrained UnConstrained
SV-P63Citywide Bicycle Detection at
Intersections
Install bicycle detection at intersections: either in-ground detection loops, video
detection, or bicycle push-bottons. If in-ground detection loops are used, used bike
symbol to show cyclists where to position themselves. Source ATP Plan
$380 $0 $380
SV-P41Citywide Bike Lanes Construction of additional bike lanes and paths citywide (including Green Hills). $3,360 $2,060 $1,300
SV-P64Citywide Crosswalk Improvements Upgrade crosswalks near schools to high visibility. Source SRTS Plan $70 $0 $70
SV-P27Citywide General Maintenance and
Operations
Ongoing maintenance, repairs, and operation of road/street system within the City
limits. ($400K/yr const; $250/yr unconst).$19,750 $18,000 $1,750
SV-P80Citywide Pedestrian Signals Install pedestrian countdown signal heads at all signalized intersections. Source ATP
Plan$120 $0 $120
SV-P05Citywide Sidewalk Program Install sidewalks to fill gaps. Annual Cost $50k/yr $5,600 $4,000 $1,600
SV-P33Civic Center Dr Bike Lanes Add bike lanes to narrow road. $410 $0 $410
SV-P14El Pueblo Rd Ext North Connect El Pueblo Road via Janis Way to Victor Square, crossing Carbonero Creek. $1,240 $0 $1,240
SV-P15El Pueblo Rd Extensions Connect El Pueblo Road to Disc Drive. $410 $0 $410
SV-P66El Pueblo Rd Sidewalk Connections Fill sidewalk gaps and install pedestrian-scale lighting. Source ATP Plan $950 $0 $950
SV-P36El Rancho Dr Bike Lanes Add bike lanes on El Rancho within city limits. $340 $0 $340
SV-P24Emergency Access Granite
Creek/Hwy 17
Connect Granite Creek Rd to SR 17 via Navarra Drive to Sucinto Drive, for emergency
access.$570 $0 $570
SV-P25Emergency Access SV DR/Upper
Willis Dr
Connect Scotts Valley Drive to Upper Willis Road for emergency access. $1,030 $0 $1,030
SV-P26Emergency Access Whispering Pines Connect Whispering Pines Drive to Manana Woods for emergency access. $50 $0 $50
SV-P23Emergency Access-
Bethany/Glenwood
Connect Bethany Drive to Glenwood Drive. $210 $0 $210
SV-P22Emergency Access-
Sundridge/Pueblo
Connect Sunridge Drive to Disc Drive for emergency access. $410 $0 $410
SV-P68Erba Lane Sidewalk Connection Install sidewalk between Scotts Valley Drive and fire station. Source ATP Plan $85 $0 $85
SV-P67Erba Lane/ MacDorsa Sidewalk
Connection
Install pedestrian pathway/sidewalk between Erba Lane and MacDorsa Park. Source
Parks Master Plan$200 $0 $200

IDProject Title Project Description/ScopeTotal Cost
($1,000's)
Costs in 2020 dollars.
Constrained UnConstrained
SV-P10Erba Lane/Terrace View/SV Drive
Realignment
Realign Terrace View to access Scotts Valley Drive via Erba Lane. $520 $0 $520
SV-P69Glen Canyon Rd at Hwy 17
Overpass Pedestrian Bridge
Study options to install pedestrian pathway under freeway bridge. Source ATP Plan $100 $0 $100
SV-P29Glen Canyon Rd Bike Lanes Class 2 Bike lanes from Flora Lane to Green Hills. Oak Creek to Flora Ln are already
complete.$1,030 $0 $1,030
SV-P71Glendwood Dr Bicycle
Improvements
Add buffers and keep bike lanes at 5' by narrowing travel lanes to 11' and/or
expanding right of way. Source SRTS Plan$103 $0 $103
SV-P70Glenwood Dr/Meadow View Dr
Intersection Improvements
Install curb extensions to shorten crossing distance. Upgrade crosswalks to high
visibility and install LED flashing stop signs. Source SRTS Plan$117 $0 $117
SV-P73Granite Creek Rd Overpass Bike
Improvements
Narrow travel lanes to widen shoulders or add bike lanes. At the intersection of
Granite Creek Road and Scotts Valley Drive, install bike lanes in both directions,
sharrows in the right turn lane, and a bicycle box to allow access to the left turn
lane. At the intersection of Granite Creek Road at Santa's Village Road/Highway 17,
install a through bike lane for cyclists traveling to Santa's Village Road and sharrows
in the right turn lane. At both intersections, install dashed green lane treatments
where bike lane crosses the right turn lane (short term). Source ATP Plan
$50 $0 $50
SV-P72Granite Creek Rd Overpass
Bike/Ped modificaitons
Study options to rebuild overpass to widen sidewalks and install Class IV separated
bikeways. Install pedestrian-scale lighting (long term). Source ATP Plan$200 $0 $200
SV-P74Hacienda Way Intersection
Modification and Improvements
Install curb extensions to reduce crossing distance. Reduce Hacienda Way to one
lane at intersection. Look into undergrounding utility pole at northern corner of
intersection. Source SRTS Plan
$100 $100 $0
SV-P95Highway 17 On/Off Ramp Bike &
Pedestrian Improvements
Install leading pedestrian interval and curb extension at NE corner of intersection.
Upgrade all crosswalks to high visibility. Install green bike conflict markings through
intersection. Install bicycle detection at Glenwood/Scotts Valley Drive intersection
approaches. Source SRTS Plan. Short term
$207 $207 $0
SV-P94Highway 17 On/Off Ramp
Modernization & Redesign
Begin discussions with Caltrans about modernizing freeway on- and off-ramps.
Study options to redesign intersection. Source ATP Plan. long term$100 $0 $100
SV-P01Hwy 17/Midtown Interchange Construct new SR17 interchange midway between Mt. Hermon Rd and Granite
Creek Rd. Will require right-of-way.$30,990 $0 $30,990
SV-P44Hwy 17/Mt. Hermon Rd Interchange
Operations Improvement
Add lane to SB off-ramp at Hwy 17/Mt. Hermon Rd interchange. $1,030 $0 $1,030
SV-P62In-Street Pedestrian Crossing
Improvements
Install in-street pedestrian crossing signs (R1-6) at uncontrolled crossings near
schools, parks, and other areas with high pedestrian traffic. Source ATP Plan$5 $0 $5

IDProject Title Project Description/ScopeTotal Cost
($1,000's)
Costs in 2020 dollars.
Constrained UnConstrained
SV-P75Kings Village Rd Bike/Ped
Connection
Install bike/pedestrian connection between potential new development at 440 Kings
Village Road and Town Center property. Source ATP Plan$95 $0 $95
SV-P76Kings Village Rd Crosswalk
Improvements
Upgrade all crosswalks to high visibility. Install curb extensions to shorten
crosswalks where feasible. Source ATP Plan$370 $0 $370
SV-P52Kings Village Rd/Town Center
Entrance Traffic Signal
Install new traffic signal at the intersection of Kings Village Rd and new Town Center
entrance (near transit center) with protected pedestrian crossings and transit signal
priority. New Signalization of the intersection on Kings Village Rd at the transit
center exit and future Plan street connection would provide a location for protected
pedestrian crossings, and would allow transit operators to easily exit the transit
center and maintain operating schedules.
$210 $105 $105
SV-P77La Madrona Dr Bike/ Ped
Improvements
Install pedestrian improvements on La Madrona Drive between project site and
Mount Hermon Road, when Gateway South project developed. Restripe bike lanes
and continue northbound bike lane to intersection of Mount Hermon Road. Install
dashed green lane treatments where bike lane crosses right turn lane. Source ATP
Plan
$200 $0 $200
SV-P78Lockewood Lane Multi-Use Path Install Class I multi-use path between Mount Hermon Road and Whispering Pines
Drive. Source ATP Plan (long term)$1,300 $0 $1,300
SV-P79Lockewood Lanes Sidewalk &
Sharrows
Fill sidewalk gaps on south side of street. Install green backed sharrows. (short term) $90 $90 $0
SV-P37Lockhart Gulch Rd Bike Lanes Add Class 2 bike lanes to narrow, primarily residential street. $720 $0 $720
SV-P81Lockhart Gulch Road Multi-Use Path Study options to install multi-use path between Lockhart Gulch or Green Valley Road
and Coast Range Road, including an unpaved pathway. Source ATP Plan$25 $0 $25
SV-P21Lockwood Ln Pedestrian Signal
Near Golf Course
Construct a pedestrian signal at unprotected ped crossing on Lockwood Lane. $50 $50 $0
SV-P49Mt Hermon Rd and Scotts Valley
Drive - Crosswalks
Increase number of crosswalks on Mt Hermon/Scotts Valley Dr, update crosswalks
to block pattern, add pedestrian treatments where necessary at intersections to
decrease distance across using refuge islands. Add crosswalks to all sides of
intersections (particularly an issue on Scotts Valley Dr). Add HAWK signals to provide
a low delay signalized crossing opportunity at select locations. Examples include the
Safeway Driveway on Mt. Hermon Rd, at Victor Square/Scotts Valley Dr., and at
Tramell Way/Scotts Valley Dr.
$1,030 $515 $515
SV-P82Mt Hermon Rd Bike & Ped
Improvements
Install bike and pedestrian improvements including filling sidewalk gaps, high-
visibility crosswalks, green bike lane treatments, and curb radius reduction. Source
ATP Plan
$800 $0 $800

IDProject Title Project Description/ScopeTotal Cost
($1,000's)
Costs in 2020 dollars.
Constrained UnConstrained
SV-P83Mt Hermon Rd Buffered Bike Lanes Explore installation of buffered bike lanes or Class IV separated bikeways by
narrowing lane widths to 11', as recommended in Town Center Plan, or through plan
lines study to gain additional ROW as properties redevelop. Source ATP Plan
$190 $0 $190
SV-P53Mt Hermon Rd to El Rancho Drive
Bike/Ped Connection
Study options to install a new bike/ped connection between Mt Hermon Road and El
Rancho Drive which could include improved bike/ped facilities on existing
interchange or new bike/ped crossing.
$1,030 $1,030 $0
SV-P30AMt Hermon Road Sidewalk
Connections
Add sidewalks to fill gaps in business district. $520 $520 $0
SV-P13Mt Hermon, Lockewood, Springs
Lake Widening
Widen, reconstruct and improve portions of roadway and intersection. $4,130 $0 $4,130
SV-P46Mt Hermon/King's Village Rd-Transit
Signal priority
Transit signal priority at Kings Village Rd/Mt Hermon Rd. $80 $80 $0
SV-P47Mt Hermon/Scotts Valley - Transit
Queue Jump
Evaluate and if found to be beneficial, remove right turn islands at Mt Hermon
Rd/Scotts Valley Road to add transit queue jump lanes/signals. $620 $620 $0
SV-P09Mt. Hermon Rd Circulation Master
Plan
Provides various circulation and access improvements to the Mount Herman
corridor.$3,620 $0 $3,620
SV-P51Mt. Hermon Road/Town Center
Entrance Traffic Signal
Install new traffic signal at the intersection of the future Town Center road that will
accommodate increased pedestrian travel. Add a right-turn lane on the westbound
approach. New signalization of the intersection at the future Town Center's primary
access point on Mt. Hermon Road would provide protected pedestrian crossing, ADA
accessible curb ramps and detectable surfaces on all intersection corners. Permitted
left-turn phasing shall be used for the northbound and southbound approaches,
while protected left-turn phasing shall be provided on the eastbound and
westbound Mt. Hermon Road approaches.
$260 $130 $130
SV-P84N. Navarra Dr Bike/Ped Access Reconfigure gate to Sucinto Lane to allow for bike/pedestrian access. Source Parks
Master Plan$50 $0 $50
SV-P34N. Navarra Dr-Sucinto Dr Bike Lanes Add bike lanes to developing area behind commercial. $620 $0 $620
SV-P85Navarra Dr Sharrows & Wayfinding Install green backed sharrows on N. Navarra Dr. Install bike wayfinding signage on S.
Navarra Dr. to highlight Green Hills Road connection. Source ATP Plan$4 $0 $4
SV-P28Neighborhood Traffic Calming Citywide traffic calming devices. $770 $770 $0
SV-P86Quien Sabe Rd Sidewalk Install sidewalk on one side of the street between Scotts Valley Drive and Oak Creek
Boulevard. Source ATP Plan$100 $0 $100

IDProject Title Project Description/ScopeTotal Cost
($1,000's)
Costs in 2020 dollars.
Constrained UnConstrained
SV-P87Sandraya Heights Rd Crossing
Improvements
Install curb extension on northwest corner to shorten crossing. Install high-visibility
crosswalk. Source SRTS Plan (long term)$53 $0 $53
SV-P88Santa's Village Rd Sidewalk
Improvements
Widen sidewalk to Class I multi-use path to connect new housing developments with
Granite Creek Road. Source ATP Plan$400 $0 $400
SV-P91Scotts Valley Dr at Victor Square
Crosswalk/Sidewalk Improvements
Add new marked crosswalk at north leg of intersection or relocate crosswalk to
north leg to reduce vehicle/pedestrian conflicts. Install pedestrian countdown signal
heads. Install sidewalk on Victor Square between Scotts Valley Drive and shopping
center entrance. Source ATP Plan
$40 $0 $40
SV-P92Scotts Valley Dr Lane
Modifications/Pedestrian Crossing
Improvements
Reduce lane widths or reduce to one lane in each direction to reduce pedestrian
crossing distance and provide wider sidewalk, landscape strip and/or buffered bike
lanes or Class IV separated bikeway. Source ATP Plana and SRTS Plan
$516 $0 $516
SV-P89Scotts Valley Drive at Bean Creek
Road Crossing Improvements
Install high visibility crosswalks, curb extensions and median refuge islands. Install
lead pedestrian interval. Study options to eliminate or modify southbound right-turn
lane approaching Bean Creek Road to reduce crossing distrance. Source SRTS Plan
$150 $0 $150
SV-P90Scotts Valley Drive at Mount
Hermon Road Lane Modifications
Study options to redesign or modify right-turn slip lanes to improve pedestrian
visibility. Source ATP Plan$30 $0 $30
SV-P45Scotts Valley Town Center
Bicycle/Pedestrian Facilities
Bicycle and pedestrian facilities and circulation elements within planned
development.$4,130 $4,130 $0
SV 32Sidewalk Masterplan
Implementation
Installation or widening of sidewalks and ramps that are missing, damaged or do
not meet current ADA requirements. May include signage for safety.$2,700 $500 $2,200
SV-P96Siltanen Community Park
Connector Paths
Improve paths to school campus. Source SRTS Plan. Cost TBD. $0 $0 $0
SV-P11Sky Park Commercial Area
Circulation
Construct infrastructure improvement for Skypark commercial area. $2,070 $0 $2,070
SV-P97Skypark Bicycle Improvements Widen path to allow for bike and pedestrian access, or install separate path for
bicyclists to connect Skypark Drive and Kings Village Road. Source ATP Plan. Cost
TBD.
$0 $0 $0
SV-P42Synchronize Traffic Signals along
Mt. Hermon Road
Re-time to coordinate traffic signals along Mt. Hermon Road. $100 $100 $0
SV-P61Upgrade Bicycle Sharrows Upgrade all white sharrows in City limits to green backed sharrows. Source ATP Plan $12 $0 $12
SV-P99Vine Hill School Rd (Glenwood Dr-
Tabor Dr) Bike Lane Widening
Narrow travel lanes to 11' to widen bike lanes to 6'. Remove signs that indicate bike
lanes are dependent on time of day. Source SRTS Plan$44 $44 $0

IDProject Title Project Description/ScopeTotal Cost
($1,000's)
Costs in 2020 dollars.
Constrained UnConstrained
SV-P98Vine Hill School Rd Sidewalk
Improvements
Fill sidewalk gaps on north/ east side of street. Source ATP Plan $250 $0 $250
SV-P100Whispering Pines Dr (Mt Hermon-
Lundy Ln) Seperated Bikeways
Upgrade bike lanes to buffered bike lane or Class IV separated bikeway. Source SRTS
Plan$75 $75 $0
City of Scotts Valley Total Cost $102,540 $34,049 $68,491
City of Watsonville
WAT-P492nd/Maple Ave (Lincoln to Walker)
Traffic Calming and Greenway
Evaluate and if found necessary, add traffic calming/bicycle traffic priority with
wayfinding signage to provide access to MBSST and create low stress grid around
downtown.
$25 $25 $0
WAT-P505th St (Lincoln to Walker) - Traffic
Calming and Greenway
Evaluate and if found necessary, add traffic calming/bicycle traffic priority with
wayfinding signage to provide access to MBSST and create low stress grid around
downtown.
$25 $25 $0
WAT-P87Airport Blvd / Holm Road Signal
Installation
Install traffic signal $460 $460 $0
WAT-P34Airport Blvd Modifications (Hanger
Way to Ross Ave)
Reconstruct or repave roadway and bike lanes; repair, replace and install curb,
gutter, sidewalk and curb ramps; replace and upgrade signage and striping.$600 $0 $600
WAT-P88Airport Blvd Pavement
Reconstruction
Reconstruct roadway $900 $575 $325
WAT-P36Alley Improvements Repair & reconstruct some alleys. $60 $60 $0
WAT-P35Bridge Maintenance Maintenance of bridges $115 $115 $0
WAT-P30Buena Vista/Calabasas/Freedom
Connection
Construction of roadway connection from Buena Vista area to Freedom Blvd.
Reconstruct Via Nicola.$5,950 $0 $5,950
WAT-P06Citywide General Maintenance and
Operations
Ongoing maintenance, repair, and operation of road/street system, including bicycle
and pedestrian facilities.(Total Need = $2,600/year, constr=$1500/yr)$74,270 $54,270 $20,000
WAT-P15Citywide Pedestrian Facilities Construct sidewalks and curb ramps where necessary. This work is usually
combined with the annual road rehabilitation and maintenance projects. Avg annual
cost: $100/yr.
$2,380 $0 $2,380
WAT-P24Citywide Transportation Projects Lump sum of transportation projects to be identified in the future. Including major
rehabilitation and operational improvements ($1.2M/yr).$32,400 $16,200 $16,200
WAT-P75Complete Streets - Downtown Provide complete streets improvements including sidewalk, parking, bike lane,
sharrows, curb bulb outs, high visibility crosswalks, striping, signage, street trees,
pedestrian lighting, bus shelters, bike parking and benches
$27,000 $5,000 $22,000
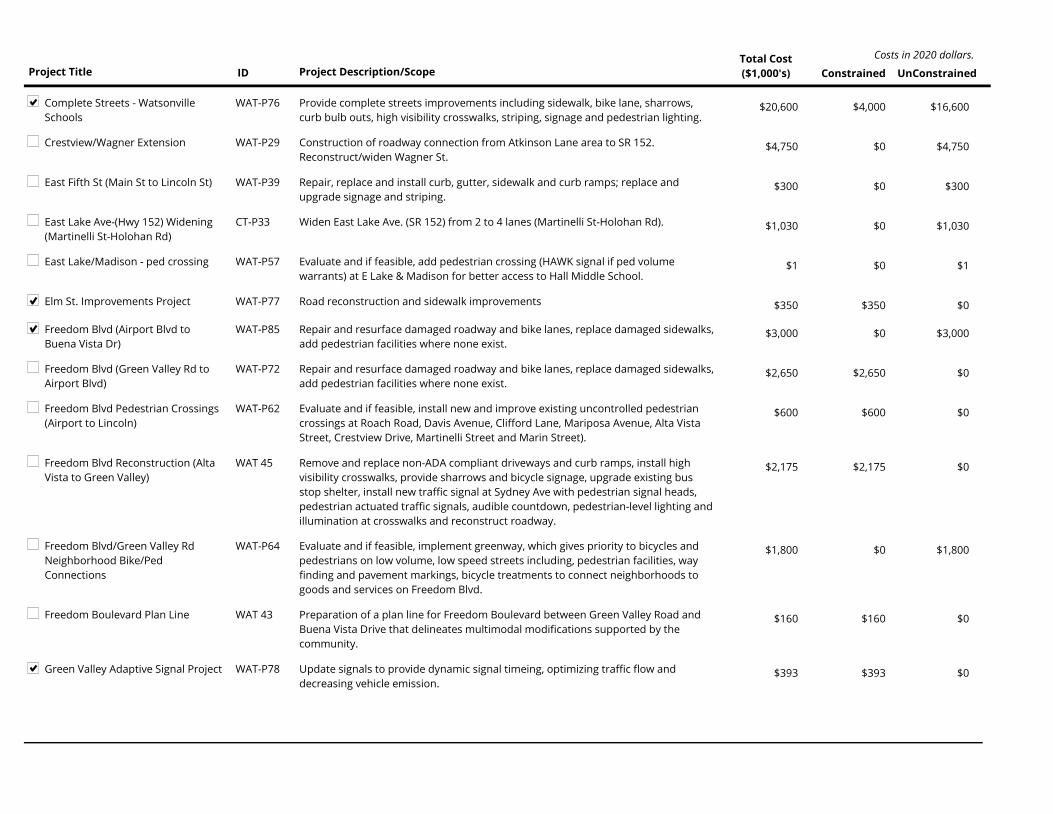
IDProject Title Project Description/ScopeTotal Cost
($1,000's)
Costs in 2020 dollars.
Constrained UnConstrained
WAT-P76Complete Streets - Watsonville
Schools
Provide complete streets improvements including sidewalk, bike lane, sharrows,
curb bulb outs, high visibility crosswalks, striping, signage and pedestrian lighting.$20,600 $4,000 $16,600
WAT-P29Crestview/Wagner Extension Construction of roadway connection from Atkinson Lane area to SR 152.
Reconstruct/widen Wagner St.$4,750 $0 $4,750
WAT-P39East Fifth St (Main St to Lincoln St) Repair, replace and install curb, gutter, sidewalk and curb ramps; replace and
upgrade signage and striping.$300 $0 $300
CT-P33East Lake Ave-(Hwy 152) Widening
(Martinelli St-Holohan Rd)
Widen East Lake Ave. (SR 152) from 2 to 4 lanes (Martinelli St-Holohan Rd). $1,030 $0 $1,030
WAT-P57East Lake/Madison - ped crossing Evaluate and if feasible, add pedestrian crossing (HAWK signal if ped volume
warrants) at E Lake & Madison for better access to Hall Middle School.$1 $0 $1
WAT-P77Elm St. Improvements Project Road reconstruction and sidewalk improvements $350 $350 $0
WAT-P85Freedom Blvd (Airport Blvd to
Buena Vista Dr)
Repair and resurface damaged roadway and bike lanes, replace damaged sidewalks,
add pedestrian facilities where none exist.$3,000 $0 $3,000
WAT-P72Freedom Blvd (Green Valley Rd to
Airport Blvd)
Repair and resurface damaged roadway and bike lanes, replace damaged sidewalks,
add pedestrian facilities where none exist.$2,650 $2,650 $0
WAT-P62Freedom Blvd Pedestrian Crossings
(Airport to Lincoln)
Evaluate and if feasible, install new and improve existing uncontrolled pedestrian
crossings at Roach Road, Davis Avenue, Clifford Lane, Mariposa Avenue, Alta Vista
Street, Crestview Drive, Martinelli Street and Marin Street).
$600 $600 $0
WAT 45Freedom Blvd Reconstruction (Alta
Vista to Green Valley)
Remove and replace non-ADA compliant driveways and curb ramps, install high
visibility crosswalks, provide sharrows and bicycle signage, upgrade existing bus
stop shelter, install new traffic signal at Sydney Ave with pedestrian signal heads,
pedestrian actuated traffic signals, audible countdown, pedestrian-level lighting and
illumination at crosswalks and reconstruct roadway.
$2,175 $2,175 $0
WAT-P64Freedom Blvd/Green Valley Rd
Neighborhood Bike/Ped
Connections
Evaluate and if feasible, implement greenway, which gives priority to bicycles and
pedestrians on low volume, low speed streets including, pedestrian facilities, way
finding and pavement markings, bicycle treatments to connect neighborhoods to
goods and services on Freedom Blvd.
$1,800 $0 $1,800
WAT 43Freedom Boulevard Plan Line Preparation of a plan line for Freedom Boulevard between Green Valley Road and
Buena Vista Drive that delineates multimodal modifications supported by the
community.
$160 $160 $0
WAT-P78Green Valley Adaptive Signal Project Update signals to provide dynamic signal timeing, optimizing traffic flow and
decreasing vehicle emission.$393 $393 $0

IDProject Title Project Description/ScopeTotal Cost
($1,000's)
Costs in 2020 dollars.
Constrained UnConstrained
WAT-P45Green Valley Rd Improvement
(Freedom Blvd to City Limit)
Reconstruct existing roadway, install a median island to encourage safer turning
movements, remove and replace existing driveways and curb ramps that do not
comply with existing accessibility standards, restripe roadway to provide striping for
bike lanes where none exist.
$2,000 $2,000 $0
WAT-P69Harkins Slough Rd (Hwy 1 to Green
Valley Rd)
Repair, reconstruct and/or upgrade pavement, bike lanes, sidewalks, transit
facilities, signage and striping$1,150 $0 $1,150
WAT-P79Harkins Slough Rd Pedestrian &
Bicycle Bridge
Install pedestrian & bicycle bridge, pedestrian path, sidewalk, striping and signage $12,000 $90 $11,910
WAT-P60Hillside Ave to Freedom Blvd
Ped/Bike Connection
Evaluate and if feasible, install new bike/ped connection from Carey Avenue to
Freedom Boulevard between Roache Road and Green Valley Road to connect
neighborhood to goods, services and transit on Freedom Boulevard. Include new
crossing from new bicycle/pedestrian facility to east side of Freedom Boulevard.
$360 $0 $360
WAT-P53Kearney/Rodriguez - Ped Crossing Evaluate and if found necessary, add pedestrian crossing at Kearney and Rodriguez
with traffic calming for access to Radcliffe Elementary. $35 $0 $35
WAT-P80Lake Avenue Underground Utilities Underground existing overhead utilities. $6,600 $2,400 $4,200
WAT-P81Lee Rd Trail Construct bike/pedestrian trail on Lee Road from Railroad Crossing to Harkins
Slough Rd. Prepare environmental documents and construction plans, secure
permits.
$20,000 $700 $19,300
WAT-P82Lincoln St Safety Improvements Pedestrian Crossing Enhancements that incorporate bulbouts, landscaping, lighting,
decorative pedestrian scale fencing, enhanced crosswalks, improved sidewalks and
pedestrian amenities, fencing, artistic enhancements by hig hschool artists and
classes in crossings and on lighting. Also includes bicycle racks, pavement sharrows,
and signage.
$600 $0 $600
WAT-P19Lump Sum Bicycle Projects Update the City Bicycle Plan and construction of additional routes and paths
(250k/yr).$6,250 $3,125 $3,125
WAT-P54Main St - 3 HAWK Signals Evaluate and if found necessary, add Hawk signals in 3 locations on Main St. $890 $890 $0
WAT-P58Main St (Freedom to Riverside)
Ped/Bike Enhancements
Evaluate and if feasible improve ped facilities and bike treatments (such as buffered
and/or painted bike lanes, bike boxes, bike signals) and bike boxes and bicycle
priority at intersections on Main Street intersections.
$890 $0 $890
WAT-P40Main St Modifications (500 Block:
Fifth St to East Lake Ave)
Repair, replace and install curb, gutter, and curb ramps; replace and upgrade
signage and striping. Evaluate and if feasible, provide bike treatments (such as
buffered and/or painted bike lanes, bike boxes, bike signals), and buffered sidewalk.
$710 $0 $710

IDProject Title Project Description/ScopeTotal Cost
($1,000's)
Costs in 2020 dollars.
Constrained UnConstrained
WAT-P47Main St Modifications (City Limit to
Lake Ave)
Repave roadway and bike lanes; repair, replace and install curb, gutter, sidewalk and
curb ramps: replace and upgrade signage and striping. Evaluate and if feasible,
provide bike treatments (such as buffered and/or painted bike lanes, bike boxes,
bike signals) and buffered sidewalks.
$1,670 $1,670 $0
WAT-P73Main St Modifications (East Lake
Ave to Freedom Blvd)
Provide complete streets improvements including but not limited to pedestrian
crossings, bicycle facilities, bus stops, parking, sidewalks and traffic management$1,000 $0 $1,000
WAT 27aMain St. (Hwy 152)/Freedom Blvd
Roundabout
Installation of a roundabout to replace the currently signalized intersection with
safety considerations for bike/ped. Caltrans Project ID - 05-0T150.$1,500 $0 $1,500
CT-P38Main St/Beach St/Lake Ave Bike
Facilities
Bicycle facilities - Main St (GV Rd to Mont Co line), Beach St (Walker to Lincoln) and
Lake Ave (Main St to fairgrounds). County/City Project - Cost unknown.$0 $0 $0
WAT-P86Main Street Traffic Study Conduct traffic study on Main Street between Freedom Blvd and Riverside Dr to
determine the feasibility of a lane reduction/road diet. Determine possible impacts
on adjacent streets and any necessary improvements. Study shall be coordinated
with 2019 Downtown Watsonville Complete Streets and 2020 Downtown Specific
Plan.
$25 $25 $0
WAT-P55Main/Rodriguez/Union/Brennan
(Freedom to Riverside) - Crosswalks
Evaluate and if found necessary, increase the number of crosswalks on Main St,
Rodriguez, and Union/Brennan to aim for 300 ft distance between crossings. Update
pattern of crosswalks to block pattern.
$115 $0 $115
WAT-P83Maintain and Improve Trails Maintain and enhance existing pedestrian and bicycle trails $400 $0 $400
TRL 18WMBSST/Rail Trail: Segment 18a -
Ohlone Pkwy to City Slough Trail
connection
Construction of pedestrian and bicycle path parallel to the existing railroad tracks
and within the rail right-of-way. Inludes public outreach and training to improve
bicycle and pedestrian safety.
$2,000 $2,000 $0
TRL 18LMBSST/Rail Trail: Segment 18b - Lee
Road-Ohlone Pkwy
Construction of pathway parallel to the railroad tracks: includes asphalt path,
retaining walls, fencing, drainage, at grade RR crossings, and installation of pathway
or sidewalk to link to the existing sidewalk at Lee Road.
$3,260 $3,260 $0
WAT-P71MBSSTN Walker St (Watsonville
Slough Trailhead to Walker St)
Construction of 2400-foot long pathway parallel to the railroad tracks. Path shall be
twelve-foot width asphalt (hma). Modify drainage facilities east of Ohlone Parkway.
Provide connection with Watsonville Slough Trail. Install at grade crossing at spur
near Walker St. Modify existing parking area and pedestrian facilities at Walker
St/West Beach St intersection.
$2,760 $0 $2,760
WAT-P04Neighborhood Traffic Plan Plan to identify and address concerns regarding speeding, bicycle and pedestrian
access and safety, and other neighborhood traffic issues ($5k/yr).$115 $115 $0
WAT-P13Neighborhood Traffic Plan
Implementation
Address concerns about traffic complaints through Education, Enforcement, and
Engineering solutions. Install traffic calming devices that do not impede bicyclist
access ($20k/yr).
$470 $470 $0
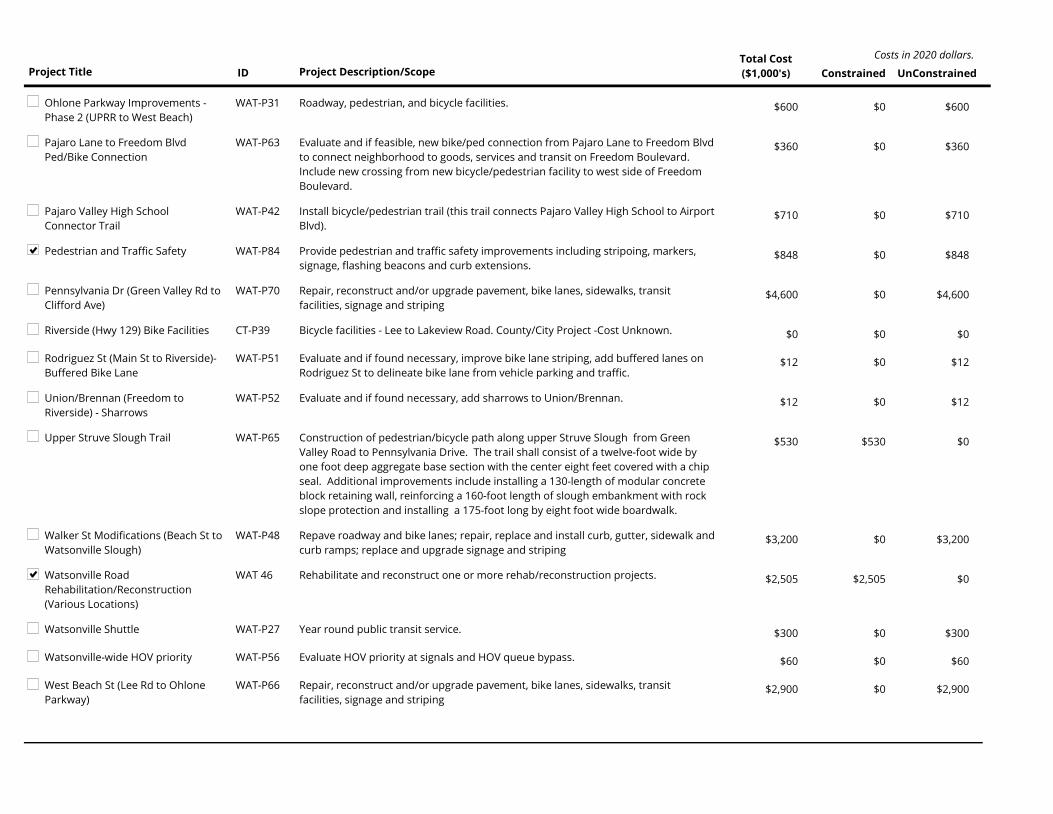
IDProject Title Project Description/ScopeTotal Cost
($1,000's)
Costs in 2020 dollars.
Constrained UnConstrained
WAT-P31Ohlone Parkway Improvements -
Phase 2 (UPRR to West Beach)
Roadway, pedestrian, and bicycle facilities. $600 $0 $600
WAT-P63Pajaro Lane to Freedom Blvd
Ped/Bike Connection
Evaluate and if feasible, new bike/ped connection from Pajaro Lane to Freedom Blvd
to connect neighborhood to goods, services and transit on Freedom Boulevard.
Include new crossing from new bicycle/pedestrian facility to west side of Freedom
Boulevard.
$360 $0 $360
WAT-P42Pajaro Valley High School
Connector Trail
Install bicycle/pedestrian trail (this trail connects Pajaro Valley High School to Airport
Blvd).$710 $0 $710
WAT-P84Pedestrian and Traffic Safety Provide pedestrian and traffic safety improvements including stripoing, markers,
signage, flashing beacons and curb extensions.$848 $0 $848
WAT-P70Pennsylvania Dr (Green Valley Rd to
Clifford Ave)
Repair, reconstruct and/or upgrade pavement, bike lanes, sidewalks, transit
facilities, signage and striping$4,600 $0 $4,600
CT-P39Riverside (Hwy 129) Bike Facilities Bicycle facilities - Lee to Lakeview Road. County/City Project -Cost Unknown. $0 $0 $0
WAT-P51Rodriguez St (Main St to Riverside)-
Buffered Bike Lane
Evaluate and if found necessary, improve bike lane striping, add buffered lanes on
Rodriguez St to delineate bike lane from vehicle parking and traffic.$12 $0 $12
WAT-P52Union/Brennan (Freedom to
Riverside) - Sharrows
Evaluate and if found necessary, add sharrows to Union/Brennan. $12 $0 $12
WAT-P65Upper Struve Slough Trail Construction of pedestrian/bicycle path along upper Struve Slough from Green
Valley Road to Pennsylvania Drive. The trail shall consist of a twelve-foot wide by
one foot deep aggregate base section with the center eight feet covered with a chip
seal. Additional improvements include installing a 130-length of modular concrete
block retaining wall, reinforcing a 160-foot length of slough embankment with rock
slope protection and installing a 175-foot long by eight foot wide boardwalk.
$530 $530 $0
WAT-P48Walker St Modifications (Beach St to
Watsonville Slough)
Repave roadway and bike lanes; repair, replace and install curb, gutter, sidewalk and
curb ramps; replace and upgrade signage and striping$3,200 $0 $3,200
WAT 46Watsonville Road
Rehabilitation/Reconstruction
(Various Locations)
Rehabilitate and reconstruct one or more rehab/reconstruction projects. $2,505 $2,505 $0
WAT-P27Watsonville Shuttle Year round public transit service. $300 $0 $300
WAT-P56Watsonville-wide HOV priority Evaluate HOV priority at signals and HOV queue bypass. $60 $0 $60
WAT-P66West Beach St (Lee Rd to Ohlone
Parkway)
Repair, reconstruct and/or upgrade pavement, bike lanes, sidewalks, transit
facilities, signage and striping$2,900 $0 $2,900

IDProject Title Project Description/ScopeTotal Cost
($1,000's)
Costs in 2020 dollars.
Constrained UnConstrained
WAT-P67West Beach St (Ohlone Parkway to
Walker St)
Repair, reconstruct and/or upgrade pavement, bike lanes, sidewalks, transit
facilities, signage and striping$4,600 $0 $4,600
WAT-P89West Beach St/Ohlone Pkwy Signal Install traffic signal $130 $130 $0
WAT-P41West Lake Ave Modifications (Main
St to Rodriguez St)
Repair, replace and install curb, gutter, sidewalk and curb ramps; replace and
upgrade signage and striping$240 $0 $240
City of Watsonville Total Cost $268,401 $106,968 $161,433
Consolidated Transportation
CTSA-P01Countywide Specialized
Transportation
Non-ADA mandated paratransit and other specialized transportation service for
seniors and people with disabilities. Includes medical service rides, Elderday, out-of-
county rides, Sr. Meal Site, Taxi Script, and same day rides etc. Constrained
annual=$2.3M; total need $3M/yr
$75,000 $45,500 $29,500
CTSA-P02Lift Line Maintenance/Operations
Center
Construct a permanent maintenance center/consolidated operations facility for
paratransit program (currently Lift Line). Measure D being used to finance.$15,500 $15,500 $0
CTSA-P06Medical Specialized Transportation
for Veterans
Non-emergency medical transportation for veterans $6,500 $0 $6,500
CTSA-P04Medically Fragile Specialized
Transportation
Non-emergency transportation service for medically fragile individuals. Includes
operations and capital.$5,000 $0 $5,000
CTSA-P03Non-ADA Paratransit Service
Expansion
Expansion of non-ADA paratransit system to meet needs of growing elderly and
disabled populations. May include pre/post natal transport to medical $21,700 $0 $21,700
Consolidated Transportation Total Cost $123,700 $61,000 $62,700
County Health Services Agency
CO 50Santa Cruz County Health Service
Agency - Traffic Safety Education
Ongoing education program to decrease the risk and severity of collisions. Includes
bicycle and pedestrian programs: Community Traffic Safety Coalition, South County
coalition, and Ride n' Stride Bicycle/Pedestrian Education Program.
$7,400 $2,500 $4,900
County Health Services Agency Total Cost $7,400 $2,500 $4,900
County of Santa Cruz
CO-P31a26th Ave Improvements (entire
length-Portola Dr to end)
Roadway and roadside improvements on various Major Collectors including
sidewalks, bike lanes, transit turnouts, left turn pockets, merge lanes and
intersection improvements.
$2,580 $0 $2,580
CO-P7826th to 30th (at Lode/Quartz)
Bike/Ped Connection
New bike/ped connection from Lode and Quartz to Moran Trail, which connects to
30th.$520 $0 $520

IDProject Title Project Description/ScopeTotal Cost
($1,000's)
Costs in 2020 dollars.
Constrained UnConstrained
CO-P27a37th/38th Ave (Brommer to
Eastcliff) Multimodal Circulation
Improvements and Greenway
Evaluate and if feasible improve vehicle and transit access on 38th Avenue from East
Cliff to Brommer and develop greenway on 37th Avenue from East Cliff to Portola.
Roadway improvements may include roadway and roadside improvements
including sidewalks, bike treatments (such as buffered and/or painted bike lanes,
bike boxes, bike signals), transit turnouts, left turn pockets, and intersection
improvement.
$2,070 $570 $1,500
CO-P26a41st Ave Improvements Phase 2
(Hwy 1 Interchange to Soquel Dr)
Roadway and roadside improvements including bike lanes, sidewalks, transit
turnouts, left turn pockets, merge lanes and intersection improvements.$1,240 $340 $900
CO-P02Airport Blvd Improvements (City
limits to Green Valley Rd)
Major rehab, addition of bike lanes, transit facilities, merge lanes, intersection
improvements, sidewalks, drainage, and landscaping.$1,240 $1,240 $0
CO-P30bAlba Rd Improvements (Empire
Grade to State Hwy 9)
Roadwork includes major rehabilitation and maintenance of the road and roadsides. $1,760 $0 $1,760
CO-P03Amesti Road Multimodal
Improvements (Green Valley to
Brown Valley Rd)
Roadway rehab and reconstruction, left turn pockets at Green Valley Road, Pioneer
Road/Varni Road. Add bike lanes, transit turnouts, sidewalks, merge lanes,
landscaping, and intersection improvements.
$6,200 $600 $5,600
CO-P27bAptos Beach Dr Improvements
(Esplanade to Rio Del Mar Blvd)
Roadway and roadside improvements on various Major Collectors including bike
lanes, transit turnouts, left turn pockets, merge lanes and intersection improvement.$1,240 $0 $1,240
CO 64Aptos Village Plan Improvements Modifications for ped, bike, bus and auto traffic. Add pedestrian facilities and
drainage infrastructure on both sides of Soquel Dr; improve bike lanes; new bike
parking; new bus pullout and shelter on north side. Trout Gulch: Replace sidewalks
with standard sidewalks on east side, ADA upgrades to west side sidewalks. Install
traffic signals at Soquel Dr/Aptos Creek Rd (CO 64c) & Soquel/Trout Gulch. Left turn
lanes on Soquel at new street - Parade St and at Aptos Creek Road. RR crossing
modifications - new crossing arms, concrete panels for vehicle and pedestrian
crossings. New RR xing at Parade St. Phase 1: Trout Gulch Rd improvements
w/traffic signal and upgraded RR xg at Soquel Dr. Pavement overlay of Soquel Dr
(Spreckels to Trout Gulch) and a portion of Aptos Creek Road.
$5,200 $5,200 $0
CO-P26bBeach Road Improvements (City
limits to Pajaro Dunes)
Roadway and roadside improvements including bike lanes, sidewalks, transit
turnouts, left turn pockets, merge lanes and intersection improvements.$1,240 $340 $900
CO-P28aBean Creek Rd Improvements
(Scotts Valley City Limits to
Glenwood Dr)
Roadway and roadside improvements on various Minor Arterials including addition
of bike lanes, transit turnouts, left turn pockets, merge lanes and intersection
improvements. Roadwork includes major rehabilitation and maintenance of the
road.
$1,760 $485 $1,275
CO-P04Bear Creek Road Improvements
(Hwy 9 to Hwy 35)
Major rehab, add bike lanes, turnouts, merge lanes, and intersection improvements.
Some landscaping and drainage improvements also.$4,750 $250 $4,500

IDProject Title Project Description/ScopeTotal Cost
($1,000's)
Costs in 2020 dollars.
Constrained UnConstrained
CO-P29bBonita Dr Improvements (entire
length)
Improvements of roadways and roadsides on various Minor Collectors including
addition of bike lanes, transit turnouts, left turn pockets, merge lanes and
intersection improvements. Roadwork includes major rehabilitation and
maintenance of the road.
$1,240 $0 $1,240
CO-P43Bonny Doon Rd Improvements
(Hwy 1 to Pine Flats Rd)
Construction of a Class 1 bike lane facility, addition of transit stops, intersection
improvements, major road rehabilitation, road maintenance, and drainage
improvements.
$8,260 $0 $8,260
CO-P33aBowker Rd Improvements (entire
length-Buena Vista Dr to Freedom
Blvd)
Roadway and roadside improvements on various Minor Collectors including
addition of bike lanes, transit turnouts, left turn pockets, merge lanes and
intersection improvements. Roadwork includes major rehabilitation and
maintenance of the road.
$620 $0 $620
CO-P30cBranciforte Dr Improvements (City
of Santa Cruz to Vine Hill Rd)
Improvements of roadways and roadsides on various Major Arterials including
addition of bike lanes, transit turnouts, left turn pockets, merge lanes and
intersection improvements. Roadwork includes major rehabilitation and
maintenance of the road and roadsides.
$1,760 $0 $1,760
CO 82Branciforte Drive Chip Seal Project
(Granite Creek Rd to SC city limits -
1.91mi)
Roadway rehabilitation: Digouts, Rubberized Chip Seal, and restriping of a portion of
Branciforte Drive$433 $433 $0
CO-P100Brimblecom Road Bridge
Replacement
The project will consist of completely replacing the existing narrow one lane
structure and roadway approaches with a two lane clear span concrete bridge and
standard bridge approaches.
$2,746 $0 $2,746
CO-P26dBrown Valley Rd Improvements
(Corralitos Rd to Redwood Rd)
Roadway and roadside improvements including bike lanes, sidewalks, transit
turnouts, left turn pockets, merge lanes and intersection improvements.$1,240 $340 $900
CO-P26eBuena Vista Rd Improvements (San
Andreas to Freedom Blvd)
Roadway and roadside improvements including bike lanes, sidewalks, transit
turnouts, left turn pockets, merge lanes and intersection improvements.$3,000 $825 $2,175
CO-P65Bulb Ave Road Improvements
(Garden St to Capitola City Limits)
Roadway and roadside improvements including curb, gutter, sidewalk, bike lanes,
left turn lanes, intersection improvements and roadway rehabilitation.$770 $0 $770
CO-P30dCabrillo College Dr Improvements
(Park Ave to Twin Lakes Church)
Improvements of roadways and roadsides on various Major Arterials including
addition of bike lanes, transit turnouts, left turn pockets, merge lanes and
intersection improvements. Roadwork includes major rehabilitation and
maintenance of the road and roadsides.
$1,240 $240 $1,000
CO-P96Capital improvement projects
consistent with the Sustainable
Santa Cruz County Plan
Construct associated multi-modal infrastructure improvements associated with the
Sustainable Santa Cruz County Plan$22,000 $7,000 $15,000

IDProject Title Project Description/ScopeTotal Cost
($1,000's)
Costs in 2020 dollars.
Constrained UnConstrained
CO-P31bCapitola Rd Ext Improvements
(Capitola Rd to Soquel Ave)
Roadway and roadside improvements on various Major Collectors including bike
lanes, transit turnouts, left turn pockets, merge lanes and intersection
improvements.
$1,240 $0 $1,240
CO-P49Carol Way/Lompico Creek Bridge
Replacement
Replace existing single span-two lane bridge construction of steel girders and long
deck with new 30 ft wide single span flat sale concrete bridge. Include (2) 11 ft lanes
and (2) 4 ft shoulders.
$1,240 $0 $1,240
CO-P26gCasserly Rd Improvements (Hwy
152 to Green Valley Rd)
Roadway and roadside improvements including bike lanes, sidewalks, transit
turnouts, left turn pockets, merge lanes and intersection improvements.$770 $208 $562
CO-P33bCathedral Dr Improvements (entire
length)
Roadway and roadside improvements on Minor Collector. Roadwork includes major
rehabilitation and maintenance of the road.$620 $0 $620
CO-P26hCenter Ave/Seacliff Dr
Improvements (Broadway to Aptos
Beach Dr)
Roadway and roadside improvements including bike lanes, sidewalks, transit
turnouts, left turn pockets, merge lanes and intersection improvements.$1,240 $340 $900
CO-P26iChanticleer Ave Improvements
(Hwy 1 to Soquel Dr)
Roadway and roadside improvements including bike lanes, sidewalks, drainage and
intersection improvements.$1,240 $340 $900
CO-P29cCliff Dr Improvements (Rio Del Mar
to Railroad Crossing)
Improvements of roadways and roadsides on various Minor Collectors including
addition of bike lanes, transit turnouts, left turn pockets, merge lanes and
intersection improvements. Roadwork includes major rehabilitation and
maintenance of the road.
$620 $0 $620
CO-P32aClubhouse Drive Improvements
(Sumner Av to Rio Del Mar Blvd)
Road rehabilitation and maintenance. Roadside improvements: left lane pockets,
sidewalks, bike lanes and transit turnouts.$1,450 $0 $1,450
CO-P23College Road Improvements (Hwy
152 to Lakeview Rd)
Major road rehab, add left turn pocket at Cutter Drive. Also add bike lanes, transit
turnouts, sidewalks, landscaping. Drainage improvements, merge lanes, and
intersection improvements may also be needed.
$1,760 $0 $1,760
CO-P28cCommercial Way Improvements
(Mission Dr. to Soquel Dr.)
Roadway and roadside improvements on various Minor Arterials including addition
of bike lanes, transit turnouts, left turn pockets, merge lanes and intersection
improvements. Roadwork includes major rehabilitation and maintenance of the
road.
$620 $170 $450
CO-P27cCorcoran Ave Improvements (Alice
St to Felt St)
Roadway and roadside improvements on various Major Collectors including bike
lanes, transit turnouts, left turn pockets, merge lanes and intersection improvement.$620 $150 $470
CO-P08Corralitos Road Rehab and
Improvements (Freedom Blvd to
Hames Rd)
Major rehab, transit, bike, and ped facilities. May also include drainage, merge
lanes, landscaping and intersection improvements.$620 $620 $0
CO-P97County wide guardrail Install guardrail on County roads $15,000 $15,000 $0

IDProject Title Project Description/ScopeTotal Cost
($1,000's)
Costs in 2020 dollars.
Constrained UnConstrained
CO-P37Countywide ADA Access Ramps Construction of handicapped access ramps countywide. $1,240 $620 $620
CO-P71Countywide Bike Projects Bike projects based on needs identified through the Santa Cruz County Bicycle Plan
and plan updates. These are in addition to projects listed individually in the RTP.$4,130 $0 $4,130
CO-P35Countywide General Road
Maintenance and Operations
Ongoing maintenance, repair, and operation of road/street system within the
unincorporated areas of the county.$515,000 $415,000 $100,000
CO-P41Countywide Sidewalks Install sidewalks. $72,310 $7,000 $65,310
CO-P31cDay Valley Rd Improvements (entire
length-Freedom Blvd to Valencia Rd)
Roadway and roadside improvements on various Major Collectors including bike
lanes, transit turnouts, left turn pockets, merge lanes and intersection
improvements.
$1,240 $0 $1,240
CO-P77East Cliff (26th to Moran Way)
Sidewalk Improvement
Install sidewalk from 26th south to link to Moran Way. $410 $0 $410
CO-P103East Cliff Dr Pedestrian Pathway
(17th-Palisades Ave)
Construct sidewalks and bike lanes on East Cliff where there are gaps $7,000 $0 $7,000
CO-P50East Cliff Dr Pedestrian Pathway
(7th-12th Ave)
Construct pedestrian pathway on East Cliff. $1,760 $1,760 $0
CO 66East Cliff Drive Cape Seal (12th-17th) Pavement maintenance, isolated section digout and asphalt replacement and cape
seal on entire roadway.$230 $230 $0
CO-P09East Cliff Drive Improvements (32nd
Ave to Harbor)
Roadway rehab, add left turn pockets at 26th and 30th Ave, fill gaps in bikeways and
sidewalks, add transit turnouts, intersection improvements. Some landscaping and
drainage improvements.
$4,750 $1,500 $3,250
CO-P26jEast Zayante Rd Improvements
(Lompico Rd to just before Summit
Rd)
Roadway and roadside improvements including bike lanes, sidewalks, transit
turnouts, left turn pockets, merge lanes and intersection improvements.$1,760 $485 $1,275
CO-P88Either Way Ln Bridge Replacement
Project
The project will consist of completely replacing the existing narrow one lane
structure and roadway approaches with a two lane clear span precast voided
concrete slab bridge and standard bridge approaches.
$2,180 $2,180 $0
CO-P67El Dorado Ave Road Improvements
(Capitola Rd to RR)
Roadway and roadside improvements including curb, gutter, buffered sidewalk,
bike treatments (such as buffered and/or painted bike lanes, bike boxes, bike
signals), left turn lanes, intersection improvements and roadway rehabilitation.
$1,810 $0 $1,810
CO-P26kEl Rancho Dr Improvements (Mt.
Hermon/Hwy 17 to SC city limits)
Roadway and roadside improvements including bike lanes, sidewalks, transit
turnouts, left turn pockets, merge lanes and intersection improvements.$2,380 $655 $1,725

IDProject Title Project Description/ScopeTotal Cost
($1,000's)
Costs in 2020 dollars.
Constrained UnConstrained
CO-P10Empire Grade Improvements Road rehab and maintenance, left turn pocket at Felton Empire Road, add bike
lanes, transit facilities, some sidewalks, landscaping. Drainage improvements,
merge lanes, and intersection improvements may also be needed.
$4,750 $1,190 $3,560
CO-P26lEureka Canyon Rd Improvements
(Hames Rd to Buzzard Lagoon Rd)
Roadway and roadside improvements including bike lanes, sidewalks, transit
turnouts, left turn pockets, merge lanes and intersection improvements.$2,380 $655 $1,725
CO-P28dFelton Empire Road Improvements
(entire length to State Hwy 9)
Roadway and roadside improvements on various Minor Arterials including addition
of bike lanes, transit turnouts, left turn pockets, merge lanes and intersection
improvements. Roadwork includes major rehabilitation and maintenance of the
road.
$2,380 $655 $1,725
CO-P90Fern Dr @ San Lorenzo River Bridge
Replacement Project
The project will consist of completely replacing the existing three span single lane
structure and roadway approaches with a new two lane clear span reinforced
concrete box girder bridge and standard bridge approaches.
$2,830 $2,830 $0
CO-P86Forest Hill Dr @ Bear Creek Bridge
Replacement Project
The Project will consist of completely replacing existing steel girder bridge crossing
Bear Creek with a new precast concrete voided slab bridge.$2,050 $0 $2,050
CO-P11Freedom Blvd Multimodal
Improvements (Bonita Dr to City of
Watsonville)
Add bike lanes, sidewalks on some segments, transit turnouts, signalization. Left
turn pockets at Bowker, Day Valley, White Rd, and Corralitos Rd. Also includes merge
lanes, intersection improvements, landscaping, major rehabilitation and
maintenance, drainage improvements.
$3,100 $775 $2,325
CO-P30fGlen Arbor Rd Improvements (State
Hwy 9 to State Hwy 9)
Improvements of roadways and roadsides on various Major Arterials including
addition of bike lanes, transit turnouts, left turn pockets, merge lanes and
intersection improvements. Roadwork includes major rehabilitation and
maintenance of the road and roadsides.
$1,240 $0 $1,240
CO-P102Glen Arbor Road Bridge
Replacement
The project will consist of replacing the existing narrow two lane structure and
roadway approaches by widening to 12 foot lanes with 8 foot shoulders and
standard bridge approaches.
$3,959 $0 $3,959
CO-P26mGlen Canyon Rd Improvements
(Branciforte Dr to City of Scotts
Valley)
Roadway and roadside improvements including bike lanes, sidewalks, transit
turnouts, left turn pockets, merge lanes and intersection improvements.$5,990 $1,640 $4,350
CO-P40Glen Coolidge Drive/Hwy 9 Bike Path Class 1 bike facility from Glen Coolidge Dr to Hwy 9 to provide eastern access to
UCSC.$2,380 $0 $2,380
CO-P61Glenwood Cutoff General
Improvements (Glenwood Dr to
Hwy 17)
Roadway and roadside improvements including bike lanes, left turn lanes,
intersection improvements and roadway rehabilitation.$3,100 $0 $3,100

IDProject Title Project Description/ScopeTotal Cost
($1,000's)
Costs in 2020 dollars.
Constrained UnConstrained
CO-P26nGlenwood Dr. Improvements
(Scotts Valley city limits to State
Hwy 17)
Roadway and roadside improvements including bike lanes, sidewalks, transit
turnouts, left turn pockets, merge lanes and intersection improvements.$3,000 $825 $2,175
CO-P12Graham Hill Road Multimodal
Improvements (City of SC to Hwy 9)
Bike lanes, sidewalks, transit turnouts, left turn pockets, merge lanes, traffic signals.
Major rehabilitation and maintenance. Drainage improvements. Signal upgrade at
SR9.
$7,020 $1,755 $5,265
CO-P30hGranite Creek Rd Improvements
(Branciforte Dr to City of Scotts
Valley)
Improvements of roadways and roadsides on various Major Arterials including
addition of bike lanes, transit turnouts, left turn pockets, merge lanes and
intersection improvements. Roadwork includes major rehabilitation and
maintenance of the road and roadsides.
$1,760 $0 $1,760
CO-P85Green Valley Rd Bridge
Replacement Project
The project will consist of completely replacing the existing two lane structure and
roadway approaches with a two lane clear span concrete slab bridge and standard
bridge approaches.
$2,110 $2,110 $0
CO 42bGreen Valley Rd Pedestrian Safety
Project
Build 6-foot wide sidewalk with some curb and gutter on NW side of Green Valley Rd
from Airport Blvd to Amesti Rd (1800 ft).$390 $390 $0
CO-P13Green Valley Road Improvements Add two-way left turn lanes from Mesa Verde to Pinto Lake on Green Valley Rd. Also
includes some road rehab and maintenance, bike lanes, sidewalks, transit facilities,
landscaping, and merge lanes.
$4,130 $1,030 $3,100
CO-P32bHames Rd Improvements (entire
length-Freedom Blvd to Eureka
Canyon Rd)
Road rehab and maint. Roadside improvements--left lane pockets, sidewalks, bike
lanes and transit turnouts.$3,620 $0 $3,620
CO-P32cHarkins Slough Rd. Improvements
(entire length-Buena Vista Dr to
State Hwy 1)
Road rehab and maint. Roadside improvements--left lane pockets, sidewalks, bike
lanes and transit turnouts.$1,760 $0 $1,760
CO-P33dHarper St Improvements (entire
length-El Dorado Ave to ECM)
Roadway and roadside improvements on various Minor Collectors including
addition of bike lanes, transit turnouts, left turn pockets, merge lanes and
intersection improvements. Roadwork includes major rehabilitation and
maintenance of the road.
$1,240 $310 $930
CO-P32dHuntington Dr Improvements
(Monroe Ave to Valencia Rd.)
Road rehab and maint. Roadside improvements--left lane pockets, sidewalks, bike
lanes and transit turnouts.$2,380 $0 $2,380
CO 84Hwy 152/Holohan - College
Intersection
Operational and school bike and pedestrian safety improvements at intersection,
including: adding a left-turn lane from Holohan to EB Hwy 152, extending existing
lanes on Holohan approach, adding merge lane to Hwy 152 WB. Sidewalk on north
(WB) side of Hwy 152 from Holohan to Corralitos Creek bridge, adds crosswalks,
bicycle facilities, and speed feedback signs.
$3,650 $3,650 $0

IDProject Title Project Description/ScopeTotal Cost
($1,000's)
Costs in 2020 dollars.
Constrained UnConstrained
CO-P46aHwy 9 - Downtown Felton Bike
Lanes & Sidewalks (San Lorenzo
Valley Trail)
Install sidewalks and bicycle lanes on Hwy 9 through downtown Felton. $3,500 $3,500 $0
CO-P46bHwy 9 - North Felton Bike Lanes &
Sidewalks (San Lorenzo Valley Trail)
Install sidewalk/pedestrian path on west side, shoulder widening to 5' for bicycle
lanes from SLV High School in Felton to Glen Arbor Road in Ben Lomond, including
frontage of SLV elementary, middle and high schools. Includes new and replacement
bike/ped bridges. (Felton-SLVHS=#CT09)
$10,000 $5,000 $5,000
CO-P32eJamison Cr Rd Improvements
(entire length-Empire Grade to Hwy
236)
Road rehab and maint. Roadside improvements--left lane pockets, sidewalks, bike
lanes and transit turnouts.$620 $0 $620
CO-P14La Madrona Dr Improvements (El
Rancho Dr to City of Scotts Valley)
Bike lanes, sidewalks, transit turnouts, left turn pockets at Sims Road, Highway 17,
and El Rancho Road), merge lanes, and intersection improvements. Also includes
major rehabilitation, drainage and maintenance.
$3,620 $905 $2,715
CO-P15Lakeview Road Improvements Major road rehab, add left turn pocket at College Road, intersection improvements
at Carlton Rd. Also add bike lanes, new transit facilities, landscaping. Drainage
improvements, merge lanes, and intersection improvements may also be needed.
$1,240 $0 $1,240
CO-P30iLarkin Valley Rd Improvements (San
Andreas Rd to Buena Vista Dr)
Improvements of roadways and roadsides on various Major Arterials including
addition of bike lanes, transit turnouts, left turn pockets, merge lanes and
intersection improvements. Roadwork includes major rehabilitation and
maintenance of the road and roadsides.
$620 $0 $620
CO-P91Larkspur Bridge @San Lorenzo River The project will consist of completely replacing the existing narrow one lane
structure and roadway approaches with a two lane bridge and standard bridge
approaches.
$3,930 $3,930 $0
CO-P30jLaurel Glen Rd Improvements
(Soquel-San Jose Rd to Mt.
View/Rodeo Gulch Rd)
Improvements of roadways and roadsides on various Major Arterials including
addition of bike lanes, transit turnouts, left turn pockets, merge lanes and
intersection improvements. Roadwork includes major rehabilitation and
maintenance of the road and roadsides.
$1,240 $0 $1,240
CO-P31dLedyard Way Improvements (entire
length-Soquel Dr to Soquel Dr)
Roadway and roadside improvements on various Major Collectors including bike
lanes, transit turnouts, left turn pockets, merge lanes and intersection
improvements.
$620 $0 $620
CO-P31eLockhart Gulch Improvements
(Scotts Valley City limits to end)
Roadway and roadside improvements on various Major Collectors including bike
lanes, transit turnouts, left turn pockets, merge lanes and intersection
improvements.
$1,240 $0 $1,240
CO-P24Lockwood Lane Improvements
(Graham Hill Rd to SV limits)
Major road rehab, add bicycle lanes, sidewalks, some transit facilities, landscaping,
and intersection improvements.$881 $243 $638

IDProject Title Project Description/ScopeTotal Cost
($1,000's)
Costs in 2020 dollars.
Constrained UnConstrained
CO-P95Lompico Rd Bridge Replacement The project will consist of replacing existing steel stringer bridge with a reinforced
concrete slab bridge$1,860 $0 $1,860
CO-P30kLompico Rd Improvements (E
Zayante Rd. to end)
Improvements of roadways and roadsides on various Major Arterials including
addition of bike lanes, transit turnouts, left turn pockets, merge lanes and
intersection improvements. Roadwork includes major rehabilitation and
maintenance of the road and roadsides.
$620 $0 $620
CO-P29eMaciel Ave Improvements (Capitola
Rd to Mattison Ln)
Improvements of roadways and roadsides on various Minor Collectors including
addition of bike lanes, transit turnouts, left turn pockets, merge lanes and
intersection improvements. Roadwork includes major rehabilitation and
maintenance of the road.
$1,450 $400 $1,050
CO-P27eMain St Improvements (Porter St to
Cherryvale Ave)
Roadway and roadside improvements on Major Collector including bike lanes,
transit turnouts, left turn pockets, merge lanes and intersection improvement.$1,760 $1,760 $0
CO-P33eManfre Rd Improvements (entire
length-Larkin Valley Rd to Buena
Vista Dr)
Roadway and roadside improvements on various Minor Collectors including
addition of bike lanes, transit turnouts, left turn pockets, merge lanes and
intersection improvements. Roadwork includes major rehabilitation and
maintenance of the road.
$620 $0 $620
CO-P30lMar Monte Ave Improvements (San
Andreas Rd to State Hwy 1)
Improvements of roadways and roadsides on various Major Arterials including
addition of bike lanes, transit turnouts, left turn pockets, merge lanes and
intersection improvements. Roadwork includes major rehabilitation and
maintenance of the road and roadsides.
$620 $0 $620
CO-P33fMar Vista Dr Improvements (entire
length-just before Seacliff Dr to
Soquel Dr)
Roadway and roadside improvements on various Minor Collectors including
addition of bike lanes, buffered sidewalks, transit turnouts, left turn pockets, merge
lanes and intersection improvements. Roadwork includes major rehabilitation and
maintenance of the road.
$300 $0 $300
CO-P26pMattison Ln Improvements
(Chanticleer Ave to Soquel Ave)
Roadway and roadside improvements including bike lanes, sidewalks, transit
turnouts, left turn pockets, merge lanes and intersection improvements.$1,450 $400 $1,050
TRL 10-11MBSST Rail Trail: 17th Ave-Jade St
Park & Monterey Ave to Aptos Crk
Road
Bicycle/pedestrian pathway parallel to railroad tracks through sections of Live Oak,
Capitola, and Aptos. Segments 10 & 11 of Monterey Bay Sanctuary Scenic Trail
Network (MBSST)/Rail Trail.
$66,000 $66,000 $0
CO-P33gMcGregor Dr Improvements
(Capitola city limits to Searidge Rd)
Roadway and roadside improvements on various Minor Collectors including
addition of bike lanes, transit turnouts, left turn pockets, merge lanes and
intersection improvements. Roadwork includes major rehabilitation and
maintenance of the road.
$1,240 $0 $1,240
CO-P31fMesa Dr Improvements (Vienna
Drive to Ledyard Way)
Roadway and roadside improvements on various Major Collectors including bike
lanes, transit turnouts, left turn pockets, merge lanes and intersection
improvements.
$1,240 $0 $1,240

IDProject Title Project Description/ScopeTotal Cost
($1,000's)
Costs in 2020 dollars.
Constrained UnConstrained
CO-P27fMill St Improvements (entire length) Roadway and roadside improvements on various Major Collectors including bike
lanes, transit turnouts, left turn pockets, merge lanes and intersection improvement.$360 $360 $0
CO-P27gMountain View Rd Improvements
(Branciforte Dr to Rodeo Gulch Rd)
Roadway and roadside improvements on various Major Collectors including bike
lanes, transit turnouts, left turn pockets, merge lanes and intersection improvement.$1,240 $0 $1,240
CO-P26qMt. Hermon Rd. Improvements
(Lockhart Gulch to Graham Hill Rd)
Roadway and roadside improvements including bike lanes, sidewalks, transit
turnouts, left turn pockets, merge lanes and intersection improvements.$3,000 $825 $2,175
CO-P39Murphy Crossing Improvements Bikeway on Murphy Crossing (Hwy 129 to Monterey Co line), major rehabilitation
and maintenance of road, drainage improvements may also be needed.$1,240 $0 $1,240
CO-P31gOpal Cliff Dr Improvements (41st Av
to Capitola City Limits)
Roadway, roadside and intersection improvements including sidewalks, bike
treatments (such as buffered and/or painted bike lanes), designed to accommodate
the number of users and link to East Cliff Drive.
$1,240 $290 $950
CO-P38Pajaro River Bike Path System Construction of a Class 1 bike path along the levees and a Class 2 bikeway on
Thurwatcher Road and Beach Road.$9,500 $2,500 $7,000
CO-P29fPaul Minnie Ave. Improvements
(Rodriguez St to Soquel Ave)
Improvements of roadways and roadsides on various Minor Collectors including
addition of bike lanes, transit turnouts, left turn pockets, merge lanes and
intersection improvements. Roadwork includes major rehabilitation and
maintenance of the road.
$1,240 $340 $900
CO-P22Paul Sweet Road Improvements
(Soquel Dr to end)
Major road rehab and maintenance. Also adds bike lanes, sidewalks, landscaping.
Drainage improvements, merge lanes, and intersection improvements, and new
transit facilities may also be needed.
$1,240 $310 $930
CO-P27hPaulsen Rd Improvements (Green
Valley Rd to Whiting Rd)
Roadway and roadside improvements on various Major Collectors including bike
lanes, transit turnouts, left turn pockets, merge lanes and intersection improvement.$1,240 $240 $1,000
CO-P28fPine Flat Rd Improvements (Bonny
Doon Rd to Empire Grade Rd)
Roadway and roadside improvements on various Minor Arterials including addition
of bike lanes, transit turnouts, left turn pockets, merge lanes and intersection
improvements. Roadwork includes major rehabilitation and maintenance of the
road.
$2,380 $655 $1,725
CO-P27iPinehurst Dr Improvements (entire
length)
Roadway and roadside improvements on various Major Collectors including bike
lanes, transit turnouts, left turn pockets, merge lanes and intersection improvement.$880 $180 $700
CO-P31hPioneer Rd Improvements (Amesti
Rd to Green Valley Rd)
Roadway and roadside improvements on various Major Collectors including bike
lanes, transit turnouts, left turn pockets, merge lanes and intersection
improvements.
$880 $0 $880
CO-P99Pleasant Way Bridge Replacement The project will consist of completely replacing the existing narrow one lane
structure and roadway approaches with a two lane clear span concrete bridge and
standard bridge approaches.
$3,740 $0 $3,740

IDProject Title Project Description/ScopeTotal Cost
($1,000's)
Costs in 2020 dollars.
Constrained UnConstrained
CO-P29gPolo Dr Improvements (Soquel Dr
to end)
Improvements of roadways and roadsides on various Minor Collectors including
addition of bike lanes, transit turnouts, left turn pockets, merge lanes and
intersection improvements. Roadwork includes major rehabilitation and
maintenance of the road.
$1,450 $0 $1,450
CO-P26rPorter St Improvements (Soquel Dr
to Paper Mill Rd)
Roadway and roadside improvements including buffered sidewalks and bicycle
treatments (such as buffered and/or painted bike lanes, bike boxes, bike signals) to
address speed inconsistency between bicyclists and vehicles, transit turnouts, left
turn pockets, merge lanes
and intersection improvements.
$1,240 $340 $900
CO-P82Quail Hollow Rd Bridge
Replacement Project
The project will consist of completely replacing the existing two lane structure and
roadway approaches with a two lane clear span concrete bridge and standard
bridge approaches.
$2,430 $0 $2,430
CO-P32fQuail Hollow Rd Improvements
(entire length- East Zayante to Glen
Arbor Rd)
Road rehab and maint. Roadside improvements--left lane pockets, sidewalks, bike
lanes and transit turnouts.$830 $0 $830
CO-P87Rancho Rio Ave @ Newell Creek
Bridge Replacement Project
The project will consist of completely replacing the existing one lane structure and
roadway approaches with a two lane clear span concrete slab bridge and standard
bridge approaches.
$1,730 $0 $1,730
CO-P51Redwood Lodge Rd (Entire Length) Roadway and roadside improvements including curb, gutter, sidewalk, bike lanes,
left turn lanes, intersection improvements and roadway rehabilitation.$3,100 $0 $3,100
CO-P30nRio Del Mar Blvd Improvements
(Esplanade to Soquel Dr)
Improvements of roadways and roadsides on various Major Arterials including
addition of bike lanes, sidewalks, transit turnouts, left turn pockets, merge lanes and
intersection improvements. Roadwork includes major rehabilitation and
maintenance of the road and roadsides.
$3,000 $725 $2,275
CO-P31iRodeo Gulch Rd Improvements (So
& North: Mt. View/Laurel Glen Rd to
Hwy 1)
Roadway and roadside improvements on various Major Collectors including bike
lanes, transit turnouts, left turn pockets, merge lanes and intersection
improvements.
$1,760 $0 $1,760
CO-P31jRoland Dr Improvements (30th to
35th)
Roadway and roadside improvements and implementation of greenway, which gives
priority to bicycles and pedestrians on low volume, low speed streets including,
pedestrian facilities, way finding and pavement markings, bicycle treatments to
connect to new bike/ped connection to 41st.
$880 $0 $880
CO-P46San Lorenzo River Valley Trail 15 mile, paved multi-use path for bicyclists and pedestrians from Boulder Creek to
Santa Cruz along SLV River corridor.$40,000 $0 $40,000
CO-P83San Lorenzo Way Bridge
Replacement Project
The project will consist of completely replacing the existing one lane structure and
roadway approaches with a two lane clear span bridge and standard bridge
approaches.
$3,190 $3,190 $0

IDProject Title Project Description/ScopeTotal Cost
($1,000's)
Costs in 2020 dollars.
Constrained UnConstrained
CO-P27jSeacliff Dr Improvements (entire
length)
Roadway and roadside improvements on various Major Collectors including bike
lanes, sidewalks, transit turnouts, left turn pockets, merge lanes and intersection
improvement.
$1,760 $0 $1,760
CO 36Seacliff Village/State Park Drive
Improvements
Construct sidewalks, bike lanes, bus turnouts/stops, central plaza, street lighting, EV
charging station, parking, landscaping, drainage and roadway overlay in Seacliff core
area- consistent with the Seacliff Village Plan adopted by the BOS in 2003.
$3,060 $3,060 $0
CO-P26sSeascape Blvd Improvements
(Sumner Ave to San Andreas Rd)
Roadway improvements and pavement rehabilitation. $620 $170 $450
CO-P17Sims Road Improvements (Graham
Hill Rd to La Madrona Dr)
Road rehab and maintenance, drainage, intersection improvements, landscaping,
add bike, ped, and transit facilities.$1,760 $440 $1,320
CO-P32gSmith Grade Improvements (entire
length-Empire Grade to Bonny
Doon Rd)
Road rehab and maint. Roadside improvements--left lane pockets, sidewalks, bike
lanes and transit turnouts.$2,380 $0 $2,380
CO-P18Soquel Ave Improvements (City of
SC to Gross Rd)
Transit turnouts, two way left turn lanes from Chanticleer to Mattison, merge lanes,
signalization and intersection improvements. Signals at Chanticleer and Gross Rd.
Roadwork: major rehabilitation and maintenance, perhaps drainage improvements.
Roadside: sidewalks, landscaping, and new transit facilities.
$3,310 $3,310 $0
CO 89Soquel Dr Buffered Bike Lane and
Congestion Mitigation Project
Adaptive traffic signal control/transit signal priority at all 23 intersections between
La Fonda Ave and State Park Dr; Protected bike lanes with striping/bollards for
approximately 2.4 miles (4.8 miles bidirectional) and buffered bike lanes with
striping for approximately 2.65 miles (5.3 miles bidirectional); 46 green bike boxes at
23 intersections for left turn movements; Pedestrian improvements including: 10
rectangular rapid flashing beacons at midblock crossings; 0.46 miles of new curb,
gutter, retaining wall and sidewalk construction; 96 crosswalk upgrades, 12 sidewalk
curb extensions; 100 ADA ramps; and reconstruction of 17 driveway and side street
connections; Cape seal of pavement for entire project length
$27,000 $27,000 $0
CO-P19Soquel Dr Improvements (Soquel
Ave to Freedom Blvd)
Major rehab, merge lanes, intersections improvements, signal coordination, transit
turnouts, fill sidewalk and bike facility gaps, some landscaping. Additional elements
shown in CO 89.
$15,000 $0 $15,000
CO-P62Soquel Dr Road Improvements
(Robertson St to Daubenbiss)
Roadway and roadside improvements including curb, gutter, sidewalk, bike
treatments (such as buffered and/or painted bike lanes, bike boxes, bike signals),
left turn lanes, intersection improvements and roadway rehabilitation.
$410 $410 $0
CO-P104Soquel Dr to 41st Ave Dedicated
Right Turn Lane
Project will add a dedicated right turn lane in the eastbound direction of Soquel Dr
to 41st Ave$550 $0 $550
CO-P105Soquel Dr to Soquel Ave Dedicated
Right Turn Lane
Project will add a dedicated right turn lane in the eastbound direction of Soquel Dr
to Soquel Ave$550 $0 $550

IDProject Title Project Description/ScopeTotal Cost
($1,000's)
Costs in 2020 dollars.
Constrained UnConstrained
CO-P58Soquel Dr Traffic Signal and Left
Turn Lane (Robertson St)
Install left turn lane at signalized intersection from Soquel Dr to Robertson St and
associated roadside improvements$1,000 $0 $1,000
CO-P36Soquel-San Jose Rd Improvements
(Paper Mill Rd to Summit Rd)
Roadway and roadside improvements including bike lanes, sidewalks, transit
turnouts, left turn pockets, merge lanes and intersection improvements.$2,580 $580 $2,000
CO-P28gSoquel-Wharf Rd Improvements
(Robertson St to Porter St)
Roadway and roadside improvements on various Minor Arterials including addition
of bike treatments (such as buffered and/or painted bike lanes, bike boxes, bike
signals), transit turnouts, left turn pockets, merge lanes and intersection
improvements. Roadwork includes major rehabilitation and maintenance of the
road.
$1,030 $515 $515
CO-P27kSpreckels Dr Improvements (Soquel
Dr to Aptos Beach Dr)
Roadway and roadside improvements on various Major Collectors including bike
lanes, transit turnouts, left turn pockets, merge lanes and intersection improvement.
Also includes improvements to pedestrian facilities.
$1,240 $340 $900
CO-P42Spreckels Dr/Treasure Island Dr
Improvements
Addition of bike lanes, intersection improvements, major road rehabilitation, road
maintenance, and possible drainage improvements.$620 $0 $620
CO-P20State Park Drive Improvements
Phase 2
Transit turnouts, two way left turn, merge lanes, intersection improvements, and fill
gaps in bike and ped facilities including pedestrian crossing improvements, bike
treatments (such as buffered and/or painted bike lanes, bike boxes, bike signals).
Plus, major rehabilitation and maintenance, drainage improvements, landscaping.
$1,340 $335 $1,005
CO-P26uSummit Rd Improvements Roadway and roadside improvements including bike lanes, sidewalks, transit
turnouts, left turn pockets, merge lanes and intersection improvements.$5,580 $1,530 $4,050
CO-P32hSumner Ave Improvements (entire
length-Rio Del Mar Blvd to end [just
past via Novella])
Road rehab and maint. Roadside improvements--left lane pockets, sidewalks, bike
lanes and transit turnouts.$1,450 $0 $1,450
CO-P94Swanton Rd Bridge Replacement The project will consist of replacing existing 3 span steel girder bridge with a single
span concrete box girder bridge$2,540 $0 $2,540
CO-P33hThompson Ave Improvements
(entire length-Capitola Rd to end)
Roadway and roadside improvements including major rehabilitation and
maintenance of road and includes implementation of greenway, which gives priority
to bicycles and pedestrians on low volume, low speed streets including, pedestrian
facilities, way finding and pavement markings, bicycle treatments to connect to
MBSST.
$1,240 $0 $1,240
CO-P28hThurber Ln Improvements (entire
length)
Roadway and roadside improvements on various Minor Arterials including addition
of bike lanes, transit turnouts, left turn pockets, merge lanes and intersection
improvements. Roadwork includes major rehabilitation and maintenance of the
road.
$1,760 $485 $1,275
CO-P68Thurwachter Road Bike Lanes Install bicycle lanes. $50 $0 $50

IDProject Title Project Description/ScopeTotal Cost
($1,000's)
Costs in 2020 dollars.
Constrained UnConstrained
CO-P30pTrout Gulch Rd Improvements
(Soquel Dr. to end)
Improvements of roadways and roadsides on various Major Arterials including
addition of bike lanes, transit turnouts, left turn pockets, merge lanes and
intersection improvements. Roadwork includes major rehabilitation and
maintenance of the road and roadsides.
$3,000 $0 $3,000
CO-P101Two Bar Road Bridge Rehabilitation The project will consist of rehabilitating the existing narrow one lane structure and
roadway approaches by widening to two lanes with shoulders and standard bridge
approaches.
$1,696 $0 $1,696
CO-P98Upper Zayante Rd Improvements Roadway and roadside improvements including bike lanes, sidewalks, transit
turnouts, left turn pockets, merge lanes and intersection improvements.$1,500 $0 $1,500
CO-P32jValencia Rd Improvements (Trout
Gulch Rd to Valencia School Rd)
Road rehab and maint. Roadside improvements--left lane pockets, sidewalks, bike
lanes and transit turnouts.$1,760 $0 $1,760
CO-P28iVarni Rd Improvements (Corralitos
Rd to Amesti Rd)
Roadway and roadside improvements on various Minor Arterials including addition
of bike lanes, transit turnouts, left turn pockets, merge lanes and intersection
improvements. Roadwork includes major rehabilitation and maintenance of the
road.
$1,240 $340 $900
CO-P30qVine Hill Rd Improvements
(Branciforte/Mt. View Rd to State
Hwy 17)
Improvements of roadways and roadsides on various Major Arterials including
addition of bike lanes, transit turnouts, left turn pockets, merge lanes and
intersection improvements. Roadwork includes major rehabilitation and
maintenance of the road and roadsides.
$1,450 $0 $1,450
CO-P33iWallace Ave Improvements (entire
length-Huntington Dr to end)
Roadway and roadside improvements on various Minor Collectors including
addition of bike lanes, transit turnouts, left turn pockets, merge lanes and
intersection improvements. Roadwork includes major rehabilitation and
maintenance of the road.
$880 $0 $880
CO-P29hWebster St Improvements (Jose Ave
to 16th St)
Improvements of roadways and roadsides on various Minor Collectors including
addition of bike lanes, transit turnouts, left turn pockets, merge lanes and
intersection improvements. Roadwork includes major rehabilitation and
maintenance of the road.
$1,240 $0 $1,240
CO-P27lWinkle Ave Improvements (entire
length from Soquel Dr)
Roadway and roadside improvements on various Major Collectors including bike
lanes, transit turnouts, left turn pockets, merge lanes and intersection improvement.$2,380 $655 $1,725
County of Santa Cruz Total Cost $1,066,005 $613,199 $452,806
Ecology Action
EA 03aBike Challenge + Online tracking and encouragement platform to encourage and reward people to
bike commute more often. Twice-a-year monthly bike challenge, year-round
encouragement tools, bike commuter workshops, marketing, group rides, and
data/survey collection.
$3,681 $181 $3,500

IDProject Title Project Description/ScopeTotal Cost
($1,000's)
Costs in 2020 dollars.
Constrained UnConstrained
RTC 26Bike To Work/School Program Countywide education, promotion, and incentive program to actively encourage
bicycle commuting and biking to school. Coordinates efforts with local businesses,
schools, and community organizations to promote bicycling on a regular basis.
Provides referrals to community resources. Avg annual cost: $140K/yr-includes in-
kind donations and staff time.
$3,870 $1,870 $2,000
RTC 17Ecology Action Transportation
Employer Membership Program
Community organization that promotes alternative commute choices. Work with
employers, incentives for travelers to get out of SOVs including: emergency ride
home, interest-free bike loans, discounted bus passes. Avg cost: $90K/yr.
Coordinates with Bike to Work program.
$2,500 $1,125 $1,375
VAR-P22Monterey Bay Electric Vehicle
Alliance (MBEVA)
Help facilitate this broad collaboration of PEV advocates, businesses, union labor,
manufacturers and public agencies to assist the adoption of PEV's in the Monterey
Bay region. EV Equity education and EV buying assistance for low and moderate
income consumers. MBEVA's main goals are to: create PEV infrastructure in this
region, educate the public on the benefits of PEV's, educate gov't agencies on ways
to streamline PEV policy, permitting, and implementation, and help train workforce
for PEV related jobs.
$2,500 $0 $2,500
EA 02SRTS Youth Pedestrian and Bicycle
Safety Education (BikeSmart and
WalkSmart)
‘Feet on the ground’ pedestrian safety education to 2nd graders and bike safety
education and ‘rodeos’ with 5th graders at schools countywide.$8,360 $440 $7,920
Ecology Action Total Cost $20,911 $3,616 $17,295
SCCRTC
RTC 16Bike Parking Subsidy Program Subsidies for bicycle racks and lockers for businesses, schools, government
agencies, and non-profit organizations are all eligible. Recipients are responsible for
installation and maintenance of the equipment. Avg annual cost: $25K/yr.
$630 $240 $390
RTC-P50County-wide Bicycle, Pedestrian and
Vehicle Occupancy Counts
Conduct counts to assess mode split over time and assess impact of new facilities. $530 $330 $200
RTC 02aCruz511 TDM and Traveler
Information
Transportation demand management including centralized traveler information
system and ride matching services. Outreach, education and incentives; multimodal
traveler information system on traffic conditions, incidents, road and lane closures;
ride matching service for carpools, vanpools, and bicyclists; services and information
about availability and benefits of all transportation modes, including sharing rides,
transit, walking, bicycling, telecommuting, alternative work schedules, alternative
fuel vehicles, and park-n-ride lots. Avg annual cost: $315k.
$7,874 $4,334 $3,540

IDProject Title Project Description/ScopeTotal Cost
($1,000's)
Costs in 2020 dollars.
Constrained UnConstrained
RTC 01Freeway Service Patrol (FSP) on Hwy
1 and Hwy 17
Ongoing system management and congestion reduction program. Maintain and
expand tow truck patrols on Highways 1 and 17. Roving tow trucks work with the
CHP to quickly remove obstructions (collisions, debris, etc) from travel lanes, and
provide assistance to motorists during peak travel periods to keep incident related
congestion to a minimum and keep traffic moving. Avg need: $300k/yr constrained
(some from SB1); $430k/yr total cost.
$10,750 $7,500 $3,250
TRL 5aMBSST - North Coast Rail Trail:
Segment 5 Phase 1
Monterey Bay Sanctuary Scenic Trail Network (MBSST) - ph. 1 Wilder Ranch-Coast
Dairies (5.4 mi)$13,500 $13,500 $0
TRL 5bMBSST - North Coast Rail Trail:
Segment 5 Phase 2
2.1 miles of Class 1, 8 to 12 foot wide multi-use bicycle/pedestrian paved path with
decomposed granite shoulders within the rail line right of way along the north coast
of Santa Cruz County from Yellowbank Beach to Davenport. Project also includes
Davenport crosswalk at Hwy 1/Ocean St and preliminary engineering and
environmental compliance for parking lots at Yellowbank Beach and Davenport
Beach and a path from the Bonny Doon parking lot to the rail trail.
$8,700 $8,700 $0
RTC-P59Measure D Administration and
Implementation
SCCRTC administration, implementation and oversight of Measure D and the
revenues generated from the 2016 Santa Cruz County Transportation Sales Tax -
Measure D. Costs include annual independent fiscal audits, reports to the public,
preparation and implementation of state-mandated reports, oversight committee,
preparation of implementation, funding and financing plans, and other
responsibilities as may be necessary to administer, implement and oversee the
Ordinance and the Expenditure Plan.
$14,375 $14,375 $0
RTC 27cMonterey Bay Sanctuary Scenic
Trail Network (Coastal Rail Trail) -
Trail Management Program
Coordinate trail implementation as it traverses multiple jurisdictions to ensure
uniformity; serve as Project Manager for construction of some segments; handle
environmental clearance; coordinate use in respect to other requirements (closures
for ag spraying, etc); solicit ongoing funding and distribute funds to implementing
entities through MOUs; coordinate with community initiatives; etc. (est. $435k/yr)
$7,550 $7,550 $0
RTC 27aMonterey Bay Sanctuary Scenic
Trail Network - Design,
Environmental Clearance, and
Construction
Design, environmental clearance and construction of balance of the 32-mile rail
component of the 50+ mile network of bicycle and pedestrian facilities on or near
the coast, with the rail trail as the spine and additional spur trails to connect to key
destinations. (Funded segments listed individually under each implementing agency.)
$242,000 $121,000 $121,000
RTC 27bMonterey Bay Sanctuary Scenic
Trail Network (Coastal Rail Trail) -
Maintenance & Operations
Ongoing maintenance rail trail corridor. Includes clean-up, trash/recycling removal,
graffiti abatement, brush clearance, surface repairs (from drainage issues, tree root
intrusion) etc. and encroachments (est. $700k/yr)
$17,500 $17,500 $0
RTC-P51Performance Monitoring Transportation data collection and compilation to monitor performance of
transportation system to advance goals/targets. Includes travel surveys of
commuters, Transportation Demand Management plan, a low-stress bicycle
network plan and parking standards plan.
$1,875 $220 $1,655

IDProject Title Project Description/ScopeTotal Cost
($1,000's)
Costs in 2020 dollars.
Constrained UnConstrained
RTC 04Planning, Programming &
Monitoring (PPM) - SB45
Development and amendments to state and federally mandated planning and
programming documents, monitoring of programmed projects. Avg annual cost:
$250k/yr.
$6,250 $5,000 $1,250
RTC-P02Public Transit on Watsonville-Santa
Cruz Rail Corridor
Design, construction, and operation of public transit between Santa Cruz and
Watsonville in the rail corridor. May be a joint project with the SCCRTC, SCMTD, and
local jurisdictions. Annual op cost est: $25M/yr; Capital: $475M (Total cost reflects
2021 TCAA est. for rail). Pending final outcome of Transit Corridor Alternatives
Analysis and environmental review. Cost shown includes 15 years of service during
RTP period; Constrained=environmental/prelim. design assessment of possible
future public transit system in the rail corridor
right-of-way.
$850,000 $25,000 $825,000
RTC 03aRail Line Repairs and Bridge
Rehabilitation
Infrastructure preservation for current uses and future transportation purposes.
Includes railroad bridge rehabilitation and and 2017 storm damage repairs.$5,800 $5,800 $0
RTC-P41Rail Line: Freight Service Upgrades Upgrade rail line to FRA Class 2 to a condition for reasonable ongoing maintenance
into the future. Upgrade crossings, replace jointed rail with continuously welded rail,
upgrade signals, and replace ties.
$25,000 $0 $25,000
RTC 03eRail Line: Pajaro River Railroad
Bridge Rehabilitation
Rehabilitate the bridge structure and tracks over Pajaro River. $670 $670 $0
RTC 03bRail Line: Track infrastructure,
signage, maintenance and repairs
Ongoing operating, maintenance, repair, rehabilitation, and oversight of railroad
track infrastructure and signage (~$175k/year)$4,375 $4,375 $0
RTC 03dRailroad Bridge Inspections &
Analysis
Railroad Bridges are required to be inspected and load rated every 540 days per
Federal Railroad Administration (FRA) requirements$6,250 $6,250 $0
RTC 25Recreational Rail Infrastructure Seasonal passenger rail service on Santa Cruz Branch rail line. Infrastructure needed
for the service is listed here (e.g. platforms, sidings, pedestrian & disabled access,
rail vehicles). Unsubsidized operations will be provided by a private operator and
operating costs are therefore not included here. All costs are estimated.
$5,340 $0 $5,340
RTC-P60Regional State Transit Assistance
Projects
State Transit Assistance (STA) eligible transit projects $33,220 $33,220 $0
RTC-P49RTC Bikeway Map Update, print and distribute free SC County Bikeway Map and update GIS files as
needed.$320 $320 $0
RTC-P01SAFE: Call Box System Along Hwys Motorist aid system of telephone call boxes along all highways plus maintenance
and upgrades. Call boxes may be used to request assistance or report incidents. Avg
annual cost: $245k/yr
$6,125 $6,125 $0

IDProject Title Project Description/ScopeTotal Cost
($1,000's)
Costs in 2020 dollars.
Constrained UnConstrained
RTC-P07SCCRTC Administration (TDA) SCCRTC as Regional Transportation Planning Agency for Santa Cruz County
distributes Transportation Development Act Local Transportation Funds and State
Assistance Funds for planning, transit, bicycle facilities and programs, pedestrian
facilities and programs and specialized transportation in accordance with state law
and the unmet transit needs process. Average annual cost: $650K/yr.
$16,250 $16,250 $0
RTC-P08SCCRTC Planning SCCRTC Planning Tasks. Includes public outreach, long and short range planning,
interagency coordination. Avg annual cost: $625k/yr.$15,625 $15,625 $0
RTC-P56Transportation Demand
Management Ordinance and User
Guide
Develop Model TDM Ordinance and User Guide to include provisions for both
residential and non-residential projects and address program and facilities
improvements in return for reductions in off-street parking requirements.
$260 $0 $260
RTC 15Vanpool Incentive Program Assist in start up and retention of vanpools. Includes financial incentives: new rider
subsidies, driver bonuses, and empty seat subsidies. Also may include installation of
wifi on vans. Avg Annual Cost: $25k/yr.
$670 $100 $570
TRL 5cYellowbank/Panther Beach parking
lot bicycle/pedestrian overcrossing
Construction of a bicycle and pedestrian crossing of the rail line and Hwy 1 to
provide access to the North Coast Rail Trail (NCRT) at formalized
Yellowbank/Panther Beach with connections to Cotoni Coast Diaries.
$2,000 $0 $2,000
SCCRTC Total Cost $1,303,439 $313,984 $989,455
SCCRTC/Caltrans
RTC 24a1 - Hwy 1 Corridor Investment
Program
Tier 1 – program level design/environmental analysis to establish a Corridor
Investment Program (CIP) to reduce congestion along the 9 mile section of Highway
1 between San Andreas Rd/Larkin Valley Rd (Aptos) and Morrissey Boulevard (Santa
Cruz). [Other RTC24_ projects are increments of the Highway 1 CIP.] Caltrans Project
ID 05-0C730
$0 $0 $0
RTC 24f2 - Hwy 1 Auxiliary Lanes & Bus on
Shoulders: 41st Ave to Soquel Ave &
Chanticleer Bike/Ped Bridge
Construct auxiliary lanes, modify shoulders for bus operations, and construct a
bicycle/pedestrian overcrossing of Hwy 1 at Chanticleer Ave. (Caltrans Project ID 05-
0C732)
$32,000 $32,000 $0
RTC 24e3 - Hwy 1-State Park Dr-Bay/Porter
Auxiliary Lanes, Bus on Shoulders,
& Mar Vista Bike/Ped Crossing
Construct approximately 2.5 miles of auxiliary lanes northbound and southbound
between State Park Dr and Park Ave interchange (1.2 miles) and the Park Ave and
Bay/Porter interchange (0.7 miles); hybrid bus-on-shoulder/auxiliary lane facility
between Bay Ave/Porter St and State Park Dr (total distance 3 miles). Includes
bicycle/pedestrian overcrossing of Hwy 1 at Mar Vista Dr with sidewalk, ADA ramps,
and intersection improvements at bridge approaches; reconstruction of Capitola
Avenue overcrossing with wider sidewalks and bike lanes; and emergency pullouts
and enforcement areas, sound wall, retaining walls, improved median barrier,
lighting, overhead signs, traffic monitoring stations, drainage, and drought tolerant
landscaping. [Part of Highway 1 CIP project (RTC 24a)]
$90,000 $90,000 $0

IDProject Title Project Description/ScopeTotal Cost
($1,000's)
Costs in 2020 dollars.
Constrained UnConstrained
RTC 24g4 - Hwy 1 Auxiliary Lanes and Bus
on Shoulders: Freedom Blvd to
State Park Dr
Construct auxiliary lanes between State Park Dr-Rio Del Mar and Rio Del Mar Blvd -
Freedom Blvd interchanges and modify shoulders to allow buses to use shoulders.
Includes soundwalls and retaining walls; widening of the bridge over Aptos
Creek/Spreckles Drive; Segment 12 of the MBSST (State Park Dr-Rio Del Mar
Blvd/Sumner); and reconstruction of two railroad bridges over Highway 1, including
bike/ped trail. [Part of Highway 1 CIP project (RTC 24a)]
$102,000 $102,000 $0
RTC 24h5 - Hwy 1: Reconstruct Morrissey
Blvd Interchange
Reconstruct Morrissey Blvd overcrossing with enhanced pedestrian and bicycle
treatments (such as buffered or painted facilities) on both sides of the overcrossing,
and/or a bicycle/pedestrian overcrossing at Trevethan Ave, reconfigure ramps and
local streets to accommodate the new interchange, and ramp metering.[Part of
Highway 1 CIP project (RTC 24a), but listed here as standalone project.]
$45,800 $0 $45,800
RTC 24i6 - Hwy 1: Reconstruct Soquel
Avenue Interchange
Reconstruct the overcrossing with enhanced pedestrian and bicycle facilities on
both sides, reconfigure ramps and local streets to accommodate the new
interchange, and ramp metering. [Part of Highway 1 CIP project (RTC 24a), but listed
here as standalone project.]
$67,330 $0 $67,330
RTC 24j7 - Hwy 1: Reconstruct Bay
Ave/Porter St and 41st Avenue
Interchange
Reconstruct highway to operate as a single interchange. Includes construction of a
frontage road that includes bike lanes and sidewalks connecting the Bay/Porter and
41st Ave intersections ; reconstruction of the Bay/Porter undercrossing and the 41st
Avenue overcrossing with enhanced pedestrian and bicycle treatments on both
sides, and reconfiguration of ramps and local streets to accommodate local traffic
and ramp metering. [Part of the Highway 1 CIP project (RTC 24a), but is listed here
as a standalone project.]
$114,000 $14,000 $100,000
RTC 24r94 - Hwy 1: Northbound Auxiliary
Lane from San Andreas Rd/Larkin
Valley Rd to Freedom Blvd
Construct northbound auxiliary lane. [Note: This project was not included as part of
Highway 1 CIP project (RTC 24a).]$10,000 $10,000 $0
RTC 24k95 - Hwy 1: Reconstruct Remaining
Interchanges
Interchange modifications not identified as separate projects (San Andreas
Rd/Larkin Valley Rd, Freedom Blvd, Rio Del Mar Blvd, State Park Dr, and Park Ave) ,
including reconfiguration of ramps and local streets for ramp meters, enhanced
pedestrian and bike treatments (such as buffered or painted facilities) in each
direction and sufficient width to allow addition of HOV lanes. [Part of the Highway 1
CIP project (RTC 24a), but is listed here as a standalone project.]
$127,200 $0 $127,200
RTC 24m96 - Hwy 1: Construction of HOV
Lanes from San Andreas Rd/Larkin
Valley Rd to Morrissey Blvd
Construction of High Occupancy Vehicle (HOV or Carpool) Lanes on Highway 1 from
San Andreas Rd/Larkin Valley Rd to Morrissey Blvd. Cost excludes auxiliary lanes,
reconstruction of interchanges for ramp metering, over and under crossings, and
traffic operation system (TOS) elements on the corridor. [These costs are listed
separately (RTC 24 a,e,f,g,h,l,j, m,n,o,p,q,r). Could be expensed under a complete
Hwy 1 HOV Lane project (RTC 24, $603,000) but currently expensed as a standalone
project.]
$61,980 $0 $61,980

IDProject Title Project Description/ScopeTotal Cost
($1,000's)
Costs in 2020 dollars.
Constrained UnConstrained
RTC 24z97 - Hwy 1: HOV Lanes from San
Andreas Rd/Larkin Valley to
Morrissey Blvd
Construct HOV or Carpool lanes on Highway 1 from San Andreas Rd/Larkin Valley Rd
to Morrissey Blvd, including auxiliary lanes, reconstruction of interchanges with
enhanced bike and pedestrian facilities, arterial and ramp modifications to allow
ramp metering, a new bike/ped crossing at Trevethan, and traffic operation system
(TOS) element. [Cost if built in entirety: $603M. See stand alone projects (RTC24-
series) for estimated cost of incremental implementation.] Caltrans Project ID 05-
0C730
$0 $0 $0
RTC 34Hwy 1 Ramp Metering: Northern
Sections Between San Andreas
Road and Morrissey Blvd
Reconfiguration of ramps and local streets to allow for ramp metering and
installation of ramp meters. Could be expensed under a separate stand alone
project ($6.7 M)
$1 $1 $0
SCCRTC/Caltrans Total Cost $650,311 $248,001 $402,310
SCMTD
MTD 18Account-based Electronic Fare
Collection System
Account-based electronic fare collection system including the ability to use a variety
of fare media including smart cards, mobile tickets on smartphones, contactless
credit and debit cards, Google Pay and Apple Pay. Replacement of fareboxes at the
end of useful life for cash acceptance onboard. Replacement Transit Fareboxes,
Ticket Vending Machines or Retail Vendor Network.
$2,250 $2,250 $0
MTD-P51ADA Access Improvements Add or improve ADA accessibility to all bus stops and METRO facilities. $4,222 $350 $3,872
MTD-P10CADA Paratransit Service -
Continuation of Existing Service
Operation & maintenance cost of existing Paratransit service. Avg Annual Cost:
$6.5M.$162,500 $162,500 $0
MTD 02ADA Paratransit Vehicle
Replacements
Replace buses/vans for ADA paratransit fleet (including Accessible Taxi program). $11,800 $5,250 $6,550
MTD-P11ADA Service Expansion Add capacity to meet increased trip demand thru 2045. Assumes 2% increase/year
starting in 2022.$4,040 $0 $4,040
MTD-P23Bike Station at Capitola Mall Establish bike station at Capitola Mall, especially to serve UCSC. Would be joint mall,
UCSC, METRO project.$1,030 $0 $1,030
MTD-P20Bikes on Buses Expansion Add additional space for bikes on articulated buses when/if METRO purchases or
leases 60-ft articulated buses.$60 $0 $60
MTD-P57Bus on Shoulders Operations Operations and transit vehicles to utilize freeway shoulders and/or auxiliary lanes to
bypass congestion on Highway 1 and possibly Highway 17 to speed inter-city bus
service.
$12,000 $0 $12,000
MTD-P15Bus Rapid Transit Transit signal priority, queue jumps, and enhanced stations to speed up major cross-
county trunk routes.$36,500 $0 $36,500
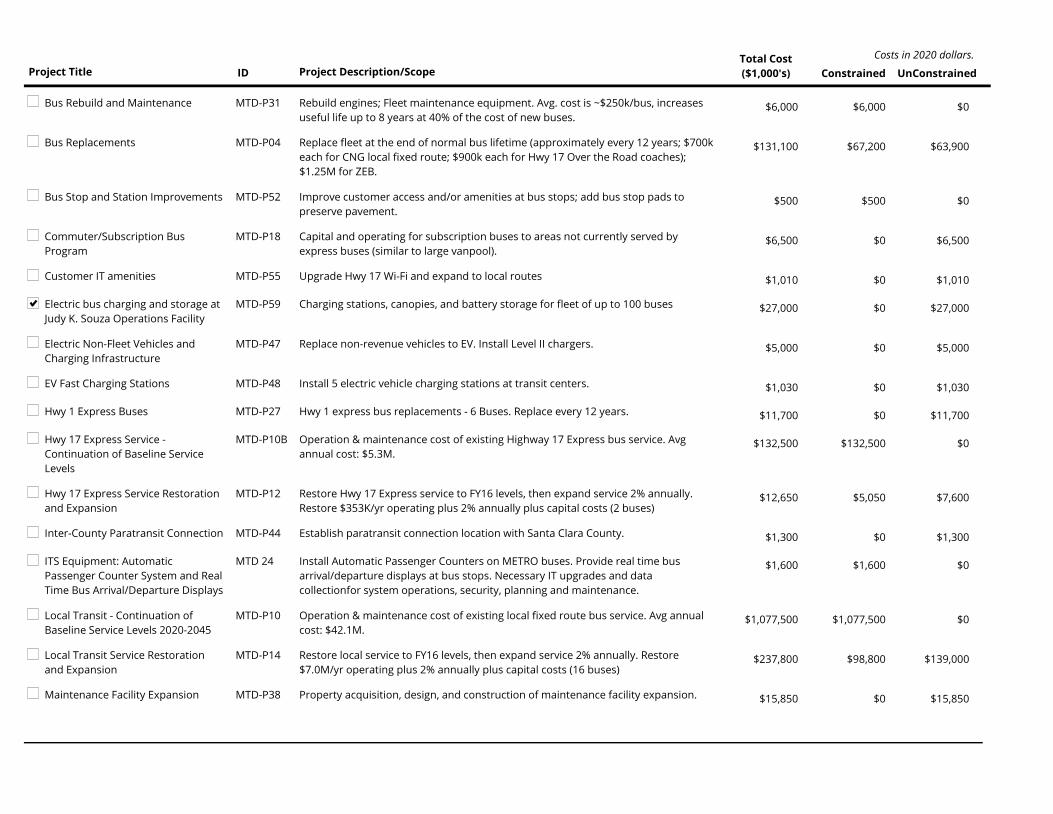
IDProject Title Project Description/ScopeTotal Cost
($1,000's)
Costs in 2020 dollars.
Constrained UnConstrained
MTD-P31Bus Rebuild and Maintenance Rebuild engines; Fleet maintenance equipment. Avg. cost is ~$250k/bus, increases
useful life up to 8 years at 40% of the cost of new buses.$6,000 $6,000 $0
MTD-P04Bus Replacements Replace fleet at the end of normal bus lifetime (approximately every 12 years; $700k
each for CNG local fixed route; $900k each for Hwy 17 Over the Road coaches);
$1.25M for ZEB.
$131,100 $67,200 $63,900
MTD-P52Bus Stop and Station Improvements Improve customer access and/or amenities at bus stops; add bus stop pads to
preserve pavement.$500 $500 $0
MTD-P18Commuter/Subscription Bus
Program
Capital and operating for subscription buses to areas not currently served by
express buses (similar to large vanpool).$6,500 $0 $6,500
MTD-P55Customer IT amenities Upgrade Hwy 17 Wi-Fi and expand to local routes $1,010 $0 $1,010
MTD-P59Electric bus charging and storage at
Judy K. Souza Operations Facility
Charging stations, canopies, and battery storage for fleet of up to 100 buses $27,000 $0 $27,000
MTD-P47Electric Non-Fleet Vehicles and
Charging Infrastructure
Replace non-revenue vehicles to EV. Install Level II chargers. $5,000 $0 $5,000
MTD-P48EV Fast Charging Stations Install 5 electric vehicle charging stations at transit centers. $1,030 $0 $1,030
MTD-P27Hwy 1 Express Buses Hwy 1 express bus replacements - 6 Buses. Replace every 12 years. $11,700 $0 $11,700
MTD-P10BHwy 17 Express Service -
Continuation of Baseline Service
Levels
Operation & maintenance cost of existing Highway 17 Express bus service. Avg
annual cost: $5.3M.$132,500 $132,500 $0
MTD-P12Hwy 17 Express Service Restoration
and Expansion
Restore Hwy 17 Express service to FY16 levels, then expand service 2% annually.
Restore $353K/yr operating plus 2% annually plus capital costs (2 buses)$12,650 $5,050 $7,600
MTD-P44Inter-County Paratransit Connection Establish paratransit connection location with Santa Clara County. $1,300 $0 $1,300
MTD 24ITS Equipment: Automatic
Passenger Counter System and Real
Time Bus Arrival/Departure Displays
Install Automatic Passenger Counters on METRO buses. Provide real time bus
arrival/departure displays at bus stops. Necessary IT upgrades and data
collectionfor system operations, security, planning and maintenance.
$1,600 $1,600 $0
MTD-P10Local Transit - Continuation of
Baseline Service Levels 2020-2045
Operation & maintenance cost of existing local fixed route bus service. Avg annual
cost: $42.1M.$1,077,500 $1,077,500 $0
MTD-P14Local Transit Service Restoration
and Expansion
Restore local service to FY16 levels, then expand service 2% annually. Restore
$7.0M/yr operating plus 2% annually plus capital costs (16 buses)$237,800 $98,800 $139,000
MTD-P38Maintenance Facility Expansion Property acquisition, design, and construction of maintenance facility expansion. $15,850 $0 $15,850

IDProject Title Project Description/ScopeTotal Cost
($1,000's)
Costs in 2020 dollars.
Constrained UnConstrained
MTD-P36Metro facilities repair/upgrades Maintain and upgrade facilities. $6,270 $4,300 $1,970
MTD-P58Metro rebranding Develop improved, mobile-friendly website, and marketing program to establish
consistent brand with uniform signage, letterhead, ads.$500 $0 $500
MTD-P43Microtransit Pilot Program Pilot project allowing smaller buses or vans to provide on-demand point-to-point
trips in areas where all-day fixed-route service is not viable.$100 $0 $100
MTD-P32Non-Revenue Vehicle Replacements Replace support vehicles. $3,000 $1,000 $2,000
MTD-P49Pacific Station- Bike Station Establish bike station at Pacific Station. $410 $0 $410
MTD-P30ParaCruz Mobile Data Terminals;
Radios
Replace mobile data terminals in vehicles $760 $400 $360
MTD-P28ParaCruz Operating Facility Design, Right-of-Way and construction for new ParaCruz Operating Facility. $12,400 $12,400 $0
MTD-P53Park and Ride Facilities Fund purchase and construction or lease of parking areas for commuter bus
patrons, either surface lot or parking structure.$29,400 $0 $29,400
MTD-P60Real-Time Transit Info Develop and maintain system for disseminating real time transit arrival and
departure information to Santa Cruz Metro users. To be developed in coordination
with Santa Cruz Metro.
$520 $220 $300
MTD-P56Replacement of Watsonville Transit
Center
Replacement transit center at existing or new location. $25,000 $0 $25,000
MTD 13Santa Cruz Metro Center/Pacific
Station Renovation
Renovate Pacific Station or construct new transit center in alternate location as part
of development partnership with the City of Santa Cruz.$25,000 $10,000 $15,000
MTD-P42Senior/Disabled/Low-Income Fixed-
Route Transit Incentives
Incentives to encourage fixed-route bus ridership. Includes existing discounts for
Seniors and persons with disabilities. May include free/reduced rates for seniors
during off-peak hours, free bus passes to ADA eligible persons, bus pass subsidies
for low income riders transportation to employment, and other incentives to
encourage use of fixed-route system.
$19,500 $0 $19,500
MTD-P21Signal Priority/Pre-Emption for
Buses
Enable coach operators to actuate traffic signals to prolong green or change red
lights to improve transit running time.$2,070 $0 $2,070
MTD-P24Small Bus Fleet Purchase smaller shuttle buses, possibly autonomous, for first mile/last mile
connections. Cost currently unknown.$1,700 $0 $1,700
MTD-P29Solar Panels for Souza Operations
Facility
Energy reduction through installation of solar panels on the Judy K. Souza
Operations Facility$2,000 $0 $2,000

IDProject Title Project Description/ScopeTotal Cost
($1,000's)
Costs in 2020 dollars.
Constrained UnConstrained
MTD-P54South County Operations and
Maintenance Facility
Acquisition of property and construction of second operations and maintenance
facilities to better serve South County.$50,000 $0 $50,000
MTD-P19Transit Mobility Training Program
Expansion
Expand public outreach and training to encourage fixed route, rather than
Paratransit, use. Outreach may also involve other partners (ex. DMV, doctors, senior
centers, etc). Avg annual cost: $80K/yr.
$2,000 $2,000 $0
MTD-P33Transit Security and Surveillance
Systems
Enhance passenger safety and facilities security. Emergency response systems. $1,140 $0 $1,140
MTD-P35Transit System Technology
Improvements
Hardware and software for essential transit operations and administration:
computer servers, networking equipment, telephones, personal computers, digital
ID processing equipment, office equipment, and software. Periodic replacement at
end of useful life.
$5,000 $0 $5,000
MTD-P06Transit Technological Improvements IT software and hardware upgrades for scheduling, customer service, planning
systems. Upgrades every 5 years.$5,170 $2,500 $2,670
MTD-P45Transit/Paratransit Driver
Emergency Training
Provide training equipment for drivers on new mobility devices (scooters, motorized
wheelchairs) plus emergency training and biohazard container and clean-up kits for
vehicles.
$295 $0 $295
SCMTD Total Cost $2,095,677 $1,592,320 $503,357
Seniors Council
RTC-P43Senior Employment Ride
Reimbursement
Reimburse low income seniors for transit expenses to/from employer sites. $1,600 $1,600 $0
Seniors Council Total Cost $1,600 $1,600 $0
UCSC
UC-P64Alternative Fuel Fleet Vehicles Purchase and upgrade fleet vehicles to alt. fueled vehicles (refuse trucks, street
sweepers, fleet cars, etc.)$3,100 $500 $2,600
UC-P22Alternative Fuel/Electric Shuttle
Vehicles
Capital acquisition of vehicles/conversion of shuttles to EV. $10,330 $0 $10,330
UC-P51Bike Shuttle Vehicle Acquisition Acquire more alt fueled vehicles for bike shuttle (and possible expansion). $520 $0 $520
UC-P62Bus Tracking and AVL Transit
Programs
GPS bus tracking and Automatic Vehicle Locator programs inform travelling
population of transit locations so they can make informed mode choices.$260 $260 $0
UC-P39College Nine/Communications
Pedestrian Bridge
Construct pedestrian bridge. $1,030 $0 $1,030

IDProject Title Project Description/ScopeTotal Cost
($1,000's)
Costs in 2020 dollars.
Constrained UnConstrained
UC-P37College Nine/Crown College
Pedestrian Bridge
Construct pedestrian bridge. $1,550 $0 $1,550
UC-P42Coolidge Overlook Improve overlook for parking, benches and signage for Sanctuary. $620 $0 $620
UC-P75Disability Van Service Operate disability van service $6,250 $6,250 $0
UC-P46East Collector Transit Hub New transit hub at East Collector (East Remote) lot. $5,170 $0 $5,170
UC-P65Electric Vehicle Charging Stations Add additional electrical infrastructure and install electric vehicle charging stations
around campus.$810 $0 $810
UC-P10Hagar/McLaughlin Intersection
Improvements
Signal, pedestrian safety improvements(including new crosswalk) and roadway
improvements.$520 $0 $520
UC-P14Hagar/Steinhart Intersection
Improvements
Signal, pedestrian safety improvements, transit, roadway improvements. $1,030 $0 $1,030
UC-P47Hagar-Coolidge Connector
Road/Hagar/East Remote
Intersection Improvements
New roadway connector, including bicycle lanes, between Hagar Drive and Coolidge,
plus Hagar/East Remote Intersection Improvements: signal, pedestrian safety
improvements and roadway improvements.
$3,100 $0 $3,100
UC-P56Heller Drive Bicycle Lanes (Empire
Grade to Porter College)
Add Class II bicycle lanes in downhill direction as feasible. $830 $0 $830
UC-P72Kerr/Porter Rd Pedestrian Bridge
ADA Upgrades
Modify bridge to improve access. $3,100 $0 $3,100
UC-P30McLaughlin Drive Bike
Lanes/Pedestrian Enhancements
Install Class 2 bike lanes and enhance pedestrian circulation on University campus
roadway.$2,580 $0 $2,580
UC-P04Meyer Drive Extension Extension of Meyer Drive from existing Meyer Drive to Hagar Drive. Includes
potential construction of two bridges, pedestrian, and bicycle facilities.$20,660 $0 $20,660
UC-P77Multimodal Hub Planning Study Study to propose concept for development of various types of multi-modal hubs for
main campus and satellite facilities to include transit, parking, bike, pedestrian and
other mobility options to meet future needs.
$750 $0 $750
UC-P08Northern Entrance Construct new access road including Cave Gulch Bridge to Empire Grade and road
and bicycle lanes to Northern Heller Dr. for access and fire safety.$10,330 $0 $10,330
UC-P07Northern Loop Roadway Construct new roadway, including bicycle lanes, on upper campus. Will be phased.
Phase I: Chinquapin Extension to support Social Science 3.$18,590 $0 $18,590
UC-P68Parking Management Technology
Improvements
Updating existing parking management technologies to allow for more effective
management.$410 $410 $0

IDProject Title Project Description/ScopeTotal Cost
($1,000's)
Costs in 2020 dollars.
Constrained UnConstrained
UC-P38Pedestrian Directional
Map/Wayfinding System
Develop and install signs throughout campus. $520 $520 $0
UC-P36Porter/Performing Arts Pedestrian
Bridge
Construct pedestrian bridge. $1,030 $0 $1,030
UC-P40Science Hill/North Academic Core
Pedestrian Bridge
Construct pedestrian bridge. $1,030 $0 $1,030
UC-P50Sidewalk/Pedestrian Improvements Widen sidewalks/improve ped access in areas of campus. $5,170 $0 $5,170
UC-P34Spring Street Bikeway Construct bikeway connecting Spring Street to Hagar Ct. $310 $0 $310
UC-P03Steinhart Way Multimodal
Improvements
Roadway improvements for shuttles, bikes and pedestrians. $2,500 $0 $2,500
UC-P19Transit Pullouts and Shelters
Enhancements
Construction and installation of transit pullouts and reconstruction of shelters
throughout campus.$1,550 $0 $1,550
UC-P23Transit Vehicles (ongoing) Ongoing capital acquisition of transit vehicles for on-campus transit and University
shuttles.$5,875 $5,875 $0
UC-P66Transportation-Related Stormwater
Management Projects
Retrofitting existing transportation facilities and developing new facilities with new
stormwater management techniques.$1,030 $1,030 $0
UC-P61Traveler Safety
Education/Information Programs
Bike/pedestrian safety programs; light and helmet giveaways, safety classes,
distracted driver programs, bus etiquette program.$660 $100 $560
UC-P48UCSC - Metro Station Bus Rapid
Transit Improvements
Bus Rapid Transit Improvements between Metro Station, Bay Street Corridor, and
UCSC Roadways.$5,170 $0 $5,170
UC-P55UCSC Bicycle Facilities Add bicycle facilities on campus roadways and paths. Lump sum of projects,
including but not limited to UCSC Bicycle Plan that are not listed individually
elsewhere in the RTP.
$1,030 $0 $1,030
UC-P33UCSC Bicycle Parking Improvements Install bicycle parking facilities to serve bicycle commuters to the University. $520 $520 $0
UC-P52UCSC Bike Loan Program Develop and implement a bike loan program for UC students. $1,030 $0 $1,030
UC-P32UCSC Bike Showers/Storage Lockers Install showers and storage facilities to serve bicycle commuters to the University. $620 $0 $620
UC-P76UCSC Campus Transit EV Bus
Charging and Parking Yard
Development of a new Electric bus Charging and Parking Yard and development of
new electrical infrastructure for EVSE for campus transit fleet.$10,000 $0 $10,000
UC-P69UCSC Commute Counseling
Program
Staffing program development to individually market to UCSC affiliates on more
sustainable means of travel to campus.$3,100 $3,100 $0

IDProject Title Project Description/ScopeTotal Cost
($1,000's)
Costs in 2020 dollars.
Constrained UnConstrained
UC-P70UCSC Commuter Incentive Provide ongoing support and development of new programs to encourage travel to
campus via sustainable modes of travel.$1,750 $1,750 $0
UC-P59UCSC Lump Sum Roadway
Maintenance
Repaving and rehabilitation of roadways on UCSC campus to maintain existing
network.$10,000 $2,275 $7,725
UC-P01UCSC Main Entrance Improvements Realign roadway, transit pullout/shelter, relocate bike parking, construct pedestrian
path, historic resource analysis. Work may be done in conjunction with City
Roundabout project.
$2,070 $2,070 $0
UC-P73UCSC Parking Operations &
Maintenance
Operate and administer the parking operations for UCSC including planning, TDM,
marketing and debt service.$80,000 $80,000 $0
UC-P58UCSC Traffic Control Non-traditional traffic control/crossing guard program at key intersections on UCSC
campus to improve pedestrian and vehicle safety, reduce conflicts, improve travel
times.
$2,580 $2,580 $0
UC-P74UCSC Transit Service Operate the on-campus shuttle service $77,750 $77,750 $0
UC-P63UCSC Vanpool Program Maintain, operate and expand upon UCSC vanpool program. $9,863 $9,863 $0
UC-P67Zimride Emergency Preparedness
Database
Creating a new database through Zimride to have emergency response evacuation
of UCSC campus.$310 $0 $310
UCSC Total Cost $317,008 $194,853 $122,155
Various Agencies
VAR-P39Active Transportation Plan Prepare Active Transportation Plans that address bicycle, pedestrian, safe routes to
schools and complete streets facilities within the jurisdictions of Santa Cruz County
as well as the Santa Cruz Harbor Port District.
$2,380 $2,380 $0
VAR-P03Bicycle Sharrows Install sharrows (shared roadway marking) designating areas where bicyclists
should ride on streets, especially when bicycle lanes are not available. To be
implemented by local jurisdictions.
$520 $520 $0
VAR-P32Bicycle Treatments for intersection
improvements (ADD)
Add painted bike treatments (such as buffered and/or painted bike lanes, bike
boxes, bike detection and signals), at major intersections. $4,130 $4,130 $0
VAR-P16Bike Share Establish and maintain an urban centered bike share program allowing county
residents to access loaner bikes at key locations such as downtowns, transit centers,
shopping districts, and tourist destinations.
$5,170 $5,170 $0
VAR-P05Bike-Activated Traffic Signal
Program
Provide traffic signal equipment to ensure that the traffic signals will detect bicycles
just as cars are detected and ensure that the appropriate traffic signal phase is
activated by the bicycles.
$1,030 $1,030 $0

IDProject Title Project Description/ScopeTotal Cost
($1,000's)
Costs in 2020 dollars.
Constrained UnConstrained
RTC 33Cabrillo College TDM Programs Provide students and employees at all four Cabrillo College campuses with
education, promotion, and incentives that support the use of sustainable
transportation modes including shared micro-mobility. Develop information,
programs and services customized to meet the transportation needs of the Cabrillo
College community. 'Provide Sustainable Transportation education, promotion, and
Go Green program enrollment to Cabrillo College students and employees. Partner
with Cabrillo staff and students to reduce SOV trips to the Aptos, Watsonville and
Scotts Valley campuses. Provided targeted information and services to Cabrillo
members.
$2,250 $890 $1,360
VAR-P06Carsharing Program Program to assist people in sharing a vehicle for occasional use. Implementing
Agency TBD, varies.$2,940 $1,470 $1,470
RTC-P48Climate Action Transportation
Programs
Projects that reduce greenhouse gas emissions through reducing vehicle trips and
vehicle miles traveled, increasing fuel efficiency and expanding use of alternatively
fueled vehicles. Includes comprehensive outreach and education campaigns, a
countywide emergency ride home for those using alternatives, and TDM incentive
programs: $100k/year.
$2,580 $2,330 $250
VAR-P28Complete Streets Area Plans Detailed complete street circulation and design plans, including consideration of
multimodal green travelways, for areas identified for intensified development in
Sustainable Communities Strategy.
$2,000 $400 $1,600
VAR-P27Complete Streets Implementation Additional projects for complete streets implementation that would fall under the
Complete Streets Guidelines.$20,000 $20,000 $0
VAR-P23Coolidge Drive Reconstruction Reconstruction of roadway and bike lane. $3,100 $0 $3,100
RTC-P26Countywide Pedestrian Signal
Upgrades
Grant program to fund installation of accessible pedestrian equipment with locator
tones including rapid flashing beacons and count down times etc. to facilitate
roadway crossings by visually and mobility impaired persons.
$2,070 $1,035 $1,035
VAR-P24Countywide Senior Driving Training Coordinate and enhance current programs that help maturing drivers maintain their
driving skills and provides transitional info about driving alternatives. (Current
programs are run by AARP and CHP.)
$910 $90 $820
VAR-P17Eco-Tourism - Sustainable
Transportation
Provide sustainable transportation information, incentives and promotions to the
estimated one million visitors to Santa Cruz County. Work with the Santa Cruz
County Conference and Visitors Council, local lodgings, and tourist attractions.
$1,030 $515 $515
VAR-P44Electric Bicycle Commuter Incentive
Program
Financial incentives, promotion and/or education to encourage residents to use
electric bikes instead of commuting by car.$3,870 $1,140 $2,730

IDProject Title Project Description/ScopeTotal Cost
($1,000's)
Costs in 2020 dollars.
Constrained UnConstrained
VAR-P38Environmental Mitigation Program Allocate funds to protect, preserve, and restore native habitat that construction of
transportation projects listed in SCCRTC’s RTP could potentially impact. EMP funds
will be for uses such as, but not limited to, purchasing land prior to project
development to bank for future mitigation needs, funding habitat improvements in
advance of project development to leverage and enhance investments by partner
agencies.
$5,680 $5,680 $0
VAR-P49EV Charging Stations for Low
Income Residents
EV charging station installation with a focus on equity so low income residents can
access home charger especially those living in apartment/multi-dwelling units.$8,000 $0 $8,000
CT-P07aHwy 1 Bike/Ped Bridge (Cabrillo-
New Brighton)
Construction of bike/ped bridge connecting New Brighton State Beach and Cabrillo
College as part of larger Nisene SP to the Sea trail concept. Lead agency TBD.$14,000 $0 $14,000
VAR-P46Live Oak Transit Hub Transfer node near rail corridor at 17th Ave - may include transit, rideshare, bicycle,
bikeshare, pedestrian to provide regional connections to/from other parts of the
county.
$530 $530 $0
VAR-P11Local Arterial ITS Infrastructure ITS (Intelligent Transportation Systems): advanced electronics and information
technologies to increase the safety and efficiency of the surface transportation
system, including vehicle detection devices along major arterials in urbanized areas
to alert motorists of incidents.
$620 $0 $620
VAR-P14Lump Sum Bridge Preservation Painting, Barrier Rail Replacement, Low Water Crossing, Rehab, and Replacement
bridges for SHOPP and Highway Bridge Program (HBP).$100,000 $100,000 $0
VAR-P13Lump Sum Emergency Response
Local Roads
Lump sum for repair of local roads damaged in emergency. (Based on average
ER/FEMA/CalEMA funds, storm damage, fire, etc. Costs of repairs assumed under
lump sum maintenance and operations within local jurisdiction listings.)
$240,000 $240,000 $0
VAR-P18Mission St/Hwy 1 Bike/Truck Safety
Campaign
Partnership with road safety shareholders including Caltrans, UCSC, City of Santa
Cruz, Ecology Action, trucking companies and others to improve bike/truck safety
along the Mission Street corridor. Provide safety presentations, videos, brochures,
safety equipment, etc.
$520 $520 $0
VAR-P04Mobility Management Center Centralized one-stop-shop for information and resources on specialized
transportation options. May be combined with 511 and local senior information and
assistance efforts. Implementing agency TBD. Est. annual cost: $100-300k/yr.
$7,750 $0 $7,750
VAR-P33Neighborhood Greenways Implement greenways which gives priority to bicycles and pedestrians on low
volume, low speed streets including, way finding and pavement markings, bicycle
treatments in areas identified for more intensified development in Sustainable
Communities Strategy.
$5,170 $0 $5,170

IDProject Title Project Description/ScopeTotal Cost
($1,000's)
Costs in 2020 dollars.
Constrained UnConstrained
VAR-P48On-Demand Wheelchair Accessible
Vehicle Program
TNC Access for All Program to implement SB1376 (Hill: 2018) which directed the
CPUC to establish a program relating to accessibility of on-damand transportation
services for persons with disabilities, including wheelchair users who need a
wheelchair accessible vehicle (WAV), to be funded in-part by Transportation Network
Companies (e.g. Lyft/Uber) that do not have WAV fleet. [constrained reflects CPUC
forcasted funds=$60k/yr]
$4,500 $1,500 $3,000
VAR-P26Park and Ride Lot Development Upgrade and maintain existing park and ride lots for commuters countywide. Secure
additional park and ride lot spaces for motorized vehicles and bicycles. Long range
plan: identify, purchase land, construct Park & Ride lots.
$9,100 $3,100 $6,000
VAR-P25Planning for Transit Oriented
Development for Seniors
Evaluate opportunities for Transit Oriented Development serving seniors including
access to medical facilities.$80 $80 $0
VAR-P21Plug-in Electric Vehicle Access,
Education & Promotion
Target motorist looking for a cleaner vehicle by providing access, education and
promotion on ever evolving plug-in electric vehicles (PEV). Provide PEV car share,
rental and demo drives, educational workshops, online, and hard copy information.
Promote through current EA groups, partners, media and other available sources.
$2,500 $0 $2,500
VAR-P20Public Transit Marketing Initiatives that increase public transit ridership including discount passes, free fare
days, commuter clubs, and promotional and marketing campaigns.$1,550 $775 $775
VAR-P29Public/Private Partnership Bicycle
and Pedestrian Connection Plan
Develop model for assisting local jurisdictions in working with private property
owners to allow bicycle and pedestrian access through private property in areas
identified for more intensified development in Sustainable Communities Strategy.
$150 $150 $0
VAR-P30Public/Private Partnership Transit
Stops and Pull Outs Plan
Develop model for assisting local jurisdictions in working with businesses to install
transit pullouts and shelters on property in areas identified as high quality transit
corridors in Sustainable Communities Strategy.
$150 $150 $0
VAR-P08Safe Paths of Travel Regional program to construct and/or repair pedestrian facilities adjacent to high
frequency use origins and destinations, particularly near transit stops.$3,100 $3,100 $0
VAR-P10Safe Routes to Schools Studies Studies to assess pedestrian and bicycle safety near schools. $210 $210 $0
VAR-P36Safety Plan Develop a safety plan that addresses traffic related injuries and fatalities for all
modes of transportation.$310 $310 $0
VAR-P35School Complete Streets Projects Implement ped/bike programs and facilities near schools. $10,330 $10,330 $0

IDProject Title Project Description/ScopeTotal Cost
($1,000's)
Costs in 2020 dollars.
Constrained UnConstrained
VAR-P19School Safety Programs Bicycle and walking safety education and encouragement programs targeting K-12
schools in Santa Cruz County including Ecology Action's Safe Routes to School and
Bike Smart programs. Provide classroom and on the bike safety training in an age
appropriate method. Provide a variety of bicycle, walking, busing and carpooling
encouragement projects ranging from bike to school events, to incentive driven
tracking, and educational support activities. Est. annual cost $150k.
$3,820 $1,910 $1,910
RTC-P54School-Based Mobility/TDM
Programs
Student transportation programs aimed at improving health and well being,
transportation safety and sustainability and that facilitate mode shift from driving
alone in a motor vehicle to active and group transportation.
$3,025 $1,150 $1,875
RTC-P53TDM Individualized
Employer/Multiunit Housing
Program
Implement individualized employer and multiunit housing TDM programs with
incentives for existing development.$4,650 $2,325 $2,325
RTC-P25Transit Oriented Development
Grant Program
Smart growth grant program to fund TODs that encourage land use and
transportation system coordination. May include joint child care/PNR/transit centers.$5,170 $2,570 $2,600
VAR-P34Transit Priority Install transit queues at major intersections. $5,170 $2,585 $2,585
VAR-P43Transit Service to San Jose Airport Provide transit service to San Jose airport from Santa Cruz. Current average annual
need $0.5M$11,000 $0 $11,000
VAR-P37Transportation Demand
Management Plan
Collaborate with other organizations to develop a coordinated plan for
transportation demand management program implementation for Santa Cruz
County.
$310 $310 $0
VAR-P42Transportation for Caregivers of
Seniors/People with Disabilities
Transportation service for caregivers of seniors or people with disabilities. Including,
but not limited to programs such as, volunteer rides, taxi script, ride to work
program. Current avg annual need $.5M. Constrained=$0M.
$11 $0 $11
VAR-P15Transportation for Low Income
Youth
Safe, reliable transportation services for foster care children to/from school. Avg
annual cost: $100k/yr.$2,580 $0 $2,580
VAR-P41Transportation for Low-Income
Families
Transportation service for low income families with children. Includes medical
service rides, out-of-county rides, volunteer rides, taxi script, ride to work program,
etc. Current avg annual need $.5M. Constrained=$0M.
$11,000 $0 $11,000
VAR-P07Transportation System
Electrification
Partnership with local gov't agencies, electric vehicle manufactures, businesses, and
Ecology Action to establish electric vehicle charging stations for EV's, plug-in hybrids,
NEV's, as well as ebikes and escooters. Work with manufacturers on developing
advanced electric vehicles and educating the public regarding the ease of use and
benefits of electric vehicles.
$51,650 $51,650 $0
VAR-P31Uncontrolled Pedestrian Crossing
Improvements
Implement improvements to uncontrolled pedestrian crossing such as painted
and/or raised crosswalks, flashing beacons and pedestrian islands.$5,170 $2,570 $2,600

IDProject Title Project Description/ScopeTotal Cost
($1,000's)
Costs in 2020 dollars.
Constrained UnConstrained
VAR-P47Watsonville Transit Hub Expand transportation mode options at transfer node near rail corridor and current
transit center to increase use of transit, rideshare, bicycle, bikeshare, pedestrian to
provide regional connections to/from other parts of the county.
$585 $585 $0
VAR-P45West Side Transit Hub Transfer node near rail corridor at Natural Bridges Dr - may include transit,
rideshare, bicycle, bikeshare, pedestrian to provide regional connections to/from
other parts of the county and the university.
$580 $580 $0
Various Agencies Total Cost $572,951 $473,770 $99,181
Volunteer Center
VC-P1Volunteer Center Transportation
Program
Program providing specialized transportation to seniors and people with disabilities.
Constrained=existing TDA allocations.$3,750 $1,640 $2,110
Volunteer Center Total Cost $3,750 $1,640 $2,110
Watsonville Airport
AIR-P01Lump Sum Watsonville Municipal
Airport Capital Projects
Projects from the Watsonville Airport Capital Improvement Program. Includes new
hangers, reconstruction of aviation apron, security features, runway rehabilitation
and extensions and surface improvements, taxiway construction and maintenance,
and signage.
$37,000 $27,000 $10,000
AIR-P02Watsonville Municipal Airport
Operations
Ongoing operations/maintenance. Average $2M/year. $49,925 $49,925 $0
Watsonville Airport Total Cost $86,925 $76,925 $10,000
Funds Needed Through 2045 $9,689,361
$5,027,242Total Within Projected Funds (Constrained)
$4,662,119Minimum New Funds Needed (Unconstrained)
Appendix F Escalated Project Costs

Escalated Project Costs
RTP # ProjectConstrained
CostCurrent Year
Escalated Cost
Rounded Estimate
2020-2022 2023 - 2035 2035-2045Potential Escalated
Cost 2020-2022 2023 - 2035 2036-2045
AIR-P01 Lump Sum Watsonville Municipal Airport Capital Proj 27,000$ 33,150$ 2,160$ 14,040$ 10,800$ 33,145$ 2,207$ 15,738$ 15,200$ AIR-P02 Watsonville Municipal Airport Operations 49,925$ 61,290$ 3,994$ 25,961$ 19,970$ 61,288$ 4,082$ 29,100$ 28,106$ CAP 11 Clares Street Traffic Calming: Phase I & II 1,350$ 1,380$ 1,350$ -$ -$ 1,380$ 1,380$ -$ -$ CAP 16 Bay Avenue/Capitola Avenue Intersection Modification 500$ 510$ 500$ -$ -$ 511$ 511$ -$ -$ CAP 17 Upper Pacific Cove Parking Lot Pedestrian Trail and D 743$ 760$ 743$ -$ -$ 759$ 759$ -$ -$ CAP 19 Capitola Street Pavement Management 1,450$ 1,480$ 1,450$ -$ -$ 1,482$ 1,482$ -$ -$ CAP-P03 Upper Capitola Avenue Improvements 500$ 510$ 500$ -$ -$ 511$ 511$ -$ -$ CAP-P06 Citywide General Maintenance and Operations 51,300$ 62,980$ 4,104$ 26,676$ 20,520$ 62,976$ 4,194$ 29,902$ 28,881$ CAP-P07 Bay Avenue/Hill Street Intersection 210$ 240$ -$ 210$ -$ 235$ -$ 235$ -$ CAP-P07p Stockton Ave Bridge Rehab 1,500$ 1,680$ -$ 1,500$ -$ 1,681$ -$ 1,681$ -$ CAP-P09 Park Avenue/Kennedy Drive Improvements 360$ 400$ -$ 360$ -$ 404$ -$ 404$ -$ CAP-P12 Monterey Avenue Multimodal Improvements 360$ 400$ -$ 360$ -$ 404$ -$ 404$ -$ CAP-P16 Clares Street Pedestrian Crossing west of 40th Ave 250$ 280$ -$ 250$ -$ 280$ -$ 280$ -$ CAP-P27 Wheelchair Access Ramps 200$ 220$ 50$ 150$ -$ 219$ 51$ 168$ -$ CAP-P28 Monterey Avenue at Depot Hill 260$ 290$ -$ 260$ -$ 291$ -$ 291$ -$ CAP-P30 47th Avenue Traffic Calming and Greenway 100$ 110$ -$ 100$ -$ 112$ -$ 112$ -$ CAP-P32 Bay Avenue/Monterey Avenue Intersection Modificatio 310$ 350$ -$ 310$ -$ 347$ -$ 347$ -$ CAP-P34 Capitola Village Enhancements: Capitola Ave 350$ 360$ 350$ -$ -$ 358$ 358$ -$ -$ CAP-P37 41st Ave/Capitola Road Intersection Improvements 320$ 330$ 320$ -$ -$ 327$ 327$ -$ -$ CAP-P38 40th Ave/Clares St Intersection Improvements 500$ 510$ 500$ -$ -$ 511$ 511$ -$ -$ CAP-P40 46th/47th Ave (Clares to Cliff Dr) Bike Lanes/Traffic Ca 20$ 20$ 20$ -$ -$ 20$ 20$ -$ -$ CAP-P41 Brommer/Jade/Topaz St Bike Lanes/Traffic Calming (W 20$ 20$ -$ 20$ -$ 22$ -$ 22$ -$ CAP-P42 Clares St Bike Lanes/Sharrows (Capitola Rd to 41st Ave 100$ 100$ 100$ -$ -$ 102$ 102$ -$ -$ CAP-P43 Clares St/41st Ave Bicycle Intersection Improvement 100$ 100$ 100$ -$ -$ 102$ 102$ -$ -$ CAP-P44 Gross/41st Ave Bicycle Intersection Improvement 100$ 100$ 100$ -$ -$ 102$ 102$ -$ -$ CAP-P46 40th Ave (at Deanes Ln)Bike/Ped connection 10$ 10$ 10$ -$ -$ 10$ 10$ -$ -$ CAP-P47 41st Ave (Highway 1 South to City Limits) Crosswalks 100$ 100$ 100$ -$ -$ 102$ 102$ -$ -$ CAP-P48 Capitola Mall (Capitola Rd to Clares) Bike Path 50$ 50$ 50$ -$ -$ 51$ 51$ -$ -$ CAP-P49 41st Ave (Soquel to Brommer) Adaptive Signal Synchro 350$ 360$ 350$ -$ -$ 358$ 358$ -$ -$ CAP-P50 Capitola-wide HOV priority 40$ 40$ -$ 40$ -$ 45$ -$ 45$ -$ CAP-P51 Citywide Sidewalk Program 750$ 920$ 100$ 350$ 300$ 917$ 102$ 392$ 422$ CAP-P52 Citywide Bike Projects 400$ 480$ -$ 300$ 100$ 477$ -$ 336$ 141$ CAP-P53 Capitola Rd & 45th Avenue I/S Improvements 400$ 450$ -$ 400$ -$ 448$ -$ 448$ -$ CAP-P54 Wharf Road and Stockton Avenue I/S Improvements 350$ 390$ -$ 350$ -$ 392$ -$ 392$ -$ CAP-P55 Porter Street and Highway 1 I/S Improvements 250$ 280$ -$ 250$ -$ 280$ -$ 280$ -$ CAP-P57 Stockton Avenue and Capitola Avenue I/S Improvemen 500$ 560$ -$ 500$ -$ 560$ -$ 560$ -$ CHP 01 Hwy 17 Safety Program (Safe on 17) 3,750$ 4,600$ 300$ 1,950$ 1,500$ 4,604$ 307$ 2,186$ 2,111$ CHP-P04 Hwy 1 Safety and Bus on Shoulder Enforcement 250$ 270$ 100$ 150$ -$ 270$ 102$ 168$ -$ CO 36 Seacliff Village/State Park Drive Improvements 3,060$ 3,430$ -$ 3,060$ -$ 3,430$ -$ 3,430$ -$ CO 42b Green Valley Rd Pedestrian Safety Project 390$ 400$ 390$ -$ -$ 399$ 399$ -$ -$ CO 50 Santa Cruz County Health Service Agency - Traffic Safe 2,500$ 3,070$ 200$ 1,300$ 1,000$ 3,069$ 204$ 1,457$ 1,407$ CO 64 Aptos Village Plan Improvements 5,200$ 5,310$ 5,200$ -$ -$ 5,314$ 5,314$ -$ -$ CO 66 East Cliff Drive Cape Seal (12th-17th) 230$ 240$ 230$ -$ -$ 235$ 235$ -$ -$ CO 82 Branciforte Drive Chip Seal Project (Granite Creek Rd t 433$ 440$ 433$ -$ -$ 442$ 442$ -$ -$ CO 84 Hwy 152/Holohan - College Intersection 3,650$ 4,090$ -$ 3,650$ -$ 4,091$ -$ 4,091$ -$ CO 89 Soquel Dr Buffered Bike Lane and Congestion Mitigatio 27,000$ 38,000$ -$ -$ 27,000$ 38,001$ -$ -$ 38,001$ CO-P02 Airport Blvd Improvements (City limits to Green Valley 1,240$ 1,390$ -$ 1,240$ -$ 1,390$ -$ 1,390$ -$ CO-P03 Amesti Road Multimodal Improvements (Green Valley 600$ 670$ -$ 600$ -$ 673$ -$ 673$ -$ CO-P04 Bear Creek Road Improvements (Hwy 9 to Hwy 35) 250$ 350$ -$ -$ 250$ 352$ -$ -$ 352$ CO-P08 Corralitos Road Rehab and Improvements (Freedom Bl 620$ 690$ -$ 620$ -$ 695$ -$ 695$ -$ CO-P09 East Cliff Drive Improvements (32nd Ave to Harbor) 1,500$ 1,820$ -$ 1,000$ 500$ 1,825$ -$ 1,121$ 704$ CO-P10 Empire Grade Improvements 1,190$ 1,450$ -$ 775$ 415$ 1,453$ -$ 869$ 584$ CO-P11 Freedom Blvd Multimodal Improvements (Bonita Dr to 775$ 870$ -$ 775$ -$ 869$ -$ 869$ -$
EscalatedUnescalatedFigures in $000s (thousands)
The Federal Transportation Act and state guidelines require that the RTP reflect the cost of implementing projects in "year of expenditure dollars" (YOE) and must be financially constrained to match escalated projected revenues. While it is unknown the exact year that most projects will be implemented, this spreadsheet demonstrates how much it would cost to implement the constrained RTP project list if the annual escalation rate were 1.75%. Since the actual year that a project will be constructed may vary and numerous economic and external factors can impact project costs, actual costs and escalation rates will likely vary. Additional information on each project is provided in a separate appendix. This list only includes "Constrained" projects which could be funded within the projected revenues identified in this document.

RTP # ProjectConstrained
CostCurrent Year
Escalated Cost
Rounded Estimate
2020-2022 2023 - 2035 2035-2045Potential Escalated
Cost 2020-2022 2023 - 2035 2036-2045
CO-P12 Graham Hill Road Multimodal Improvements (City of 1,755$ 2,470$ -$ -$ 1,755$ 2,470$ -$ -$ 2,470$ CO-P13 Green Valley Road Improvements 1,030$ 1,450$ -$ -$ 1,030$ 1,450$ -$ -$ 1,450$ CO-P14 La Madrona Dr Improvements (El Rancho Dr to City of 905$ 1,270$ -$ -$ 905$ 1,274$ -$ -$ 1,274$ CO-P17 Sims Road Improvements (Graham Hill Rd to La Madr 440$ 620$ -$ -$ 440$ 619$ -$ -$ 619$ CO-P18 Soquel Ave Improvements (City of SC to Gross Rd) 3,310$ 3,930$ -$ 2,560$ 750$ 3,925$ -$ 2,870$ 1,056$ CO-P20 State Park Drive Improvements Phase 2 335$ 470$ -$ -$ 335$ 471$ -$ -$ 471$ CO-P22 Paul Sweet Road Improvements (Soquel Dr to end) 310$ 440$ -$ -$ 310$ 436$ -$ -$ 436$ CO-P24 Lockwood Lane Improvements (Graham Hill Rd to SV 243$ 270$ -$ 243$ -$ 272$ -$ 272$ -$ CO-P26a 41st Ave Improvements Phase 2 (Hwy 1 Interchange to 340$ 380$ -$ 340$ -$ 381$ -$ 381$ -$ CO-P26b Beach Road Improvements (City limits to Pajaro Dune 340$ 380$ -$ 340$ -$ 381$ -$ 381$ -$ CO-P26d Brown Valley Rd Improvements (Corralitos Rd to Redw 340$ 480$ -$ -$ 340$ 479$ -$ -$ 479$ CO-P26e Buena Vista Rd Improvements (San Andreas to Freedo 825$ 1,160$ -$ -$ 825$ 1,161$ -$ -$ 1,161$ CO-P26g Casserly Rd Improvements (Hwy 152 to Green Valley R 208$ 290$ -$ -$ 208$ 293$ -$ -$ 293$ CO-P26h Center Ave/Seacliff Dr Improvements (Broadway to Ap 340$ 380$ -$ 340$ -$ 381$ -$ 381$ -$ CO-P26i Chanticleer Ave Improvements (Hwy 1 to Soquel Dr) 340$ 380$ -$ 340$ -$ 381$ -$ 381$ -$ CO-P26j East Zayante Rd Improvements (Lompico Rd to just be 485$ 680$ -$ -$ 485$ 683$ -$ -$ 683$ CO-P26k El Rancho Dr Improvements (Mt. Hermon/Hwy 17 to S 655$ 920$ -$ -$ 655$ 922$ -$ -$ 922$ CO-P26l Eureka Canyon Rd Improvements (Hames Rd to Buzza 655$ 920$ -$ -$ 655$ 922$ -$ -$ 922$ CO-P26m Glen Canyon Rd Improvements (Branciforte Dr to City 1,640$ 2,310$ -$ -$ 1,640$ 2,308$ -$ -$ 2,308$ CO-P26n Glenwood Dr. Improvements (Scotts Valley city limits t 825$ 1,160$ -$ -$ 825$ 1,161$ -$ -$ 1,161$ CO-P26p Mattison Ln Improvements (Chanticleer Ave to Soquel 400$ 450$ -$ 400$ -$ 448$ -$ 448$ -$ CO-P26q Mt. Hermon Rd. Improvements (Lockhart Gulch to Gra 825$ 1,160$ -$ -$ 825$ 1,161$ -$ -$ 1,161$ CO-P26r Porter St Improvements (Soquel Dr to Paper Mill Rd) 340$ 380$ -$ 340$ -$ 381$ -$ 381$ -$ CO-P26s Seascape Blvd Improvements (Sumner Ave to San And 170$ 190$ -$ 170$ -$ 191$ -$ 191$ -$ CO-P26u Summit Rd Improvements 1,530$ 2,150$ -$ -$ 1,530$ 2,153$ -$ -$ 2,153$ CO-P27a 37th/38th Ave (Brommer to Eastcliff) Multimodal Circu 570$ 640$ -$ 570$ -$ 639$ -$ 639$ -$ CO-P27c Corcoran Ave Improvements (Alice St to Felt St) 150$ 170$ -$ 150$ -$ 168$ -$ 168$ -$ CO-P27e Main St Improvements (Porter St to Cherryvale Ave) 1,760$ 2,090$ -$ 1,360$ 400$ 2,087$ -$ 1,524$ 563$ CO-P27f Mill St Improvements (entire length) 360$ 430$ -$ 280$ 80$ 426$ -$ 314$ 113$ CO-P27h Paulsen Rd Improvements (Green Valley Rd to Whiting 240$ 340$ -$ -$ 240$ 338$ -$ -$ 338$ CO-P27i Pinehurst Dr Improvements (entire length) 180$ 250$ -$ -$ 180$ 253$ -$ -$ 253$ CO-P27k Spreckels Dr Improvements (Soquel Dr to Aptos Beach 340$ 480$ -$ -$ 340$ 479$ -$ -$ 479$ CO-P27l Winkle Ave Improvements (entire length from Soquel D 655$ 920$ -$ -$ 655$ 922$ -$ -$ 922$ CO-P28a Bean Creek Rd Improvements (Scotts Valley City Limit 485$ 680$ -$ -$ 485$ 683$ -$ -$ 683$ CO-P28c Commercial Way Improvements (Mission Dr. to Soque 170$ 240$ -$ -$ 170$ 239$ -$ -$ 239$ CO-P28d Felton Empire Road Improvements (entire length to Sta 655$ 920$ -$ -$ 655$ 922$ -$ -$ 922$ CO-P28f Pine Flat Rd Improvements (Bonny Doon Rd to Empire 655$ 920$ -$ -$ 655$ 922$ -$ -$ 922$ CO-P28g Soquel-Wharf Rd Improvements (Robertson St to Porte 515$ 720$ -$ -$ 515$ 725$ -$ -$ 725$ CO-P28h Thurber Ln Improvements (entire length) 485$ 680$ -$ -$ 485$ 683$ -$ -$ 683$ CO-P28i Varni Rd Improvements (Corralitos Rd to Amesti Rd) 340$ 480$ -$ -$ 340$ 479$ -$ -$ 479$ CO-P29e Maciel Ave Improvements (Capitola Rd to Mattison Ln 400$ 450$ -$ 400$ -$ 448$ -$ 448$ -$ CO-P29f Paul Minnie Ave. Improvements (Rodriguez St to Soqu 340$ 380$ -$ 340$ -$ 381$ -$ 381$ -$ CO-P30d Cabrillo College Dr Improvements (Park Ave to Twin L 240$ 270$ -$ 240$ -$ 269$ -$ 269$ -$ CO-P30n Rio Del Mar Blvd Improvements (Esplanade to Soquel 725$ 810$ -$ 725$ -$ 813$ -$ 813$ -$ CO-P31g Opal Cliff Dr Improvements (41st Av to Capitola City L 290$ 410$ -$ -$ 290$ 408$ -$ -$ 408$ CO-P33d Harper St Improvements (entire length-El Dorado Ave 310$ 350$ -$ 310$ -$ 347$ -$ 347$ -$ CO-P35 Countywide General Road Maintenance and Operation 415,000$ 539,770$ 33,200$ 110,000$ 271,800$ 539,770$ 33,928$ 123,302$ 382,541$ CO-P36 Soquel-San Jose Rd Improvements (Paper Mill Rd to Su 580$ 670$ -$ 500$ 80$ 673$ -$ 560$ 113$ CO-P37 Countywide ADA Access Ramps 620$ 730$ 45$ 450$ 125$ 726$ 46$ 504$ 176$ CO-P38 Pajaro River Bike Path System 2,500$ 2,950$ -$ 2,000$ 500$ 2,946$ -$ 2,242$ 704$ CO-P41 Countywide Sidewalks 7,000$ 8,030$ 1,000$ 5,000$ 1,000$ 8,034$ 1,022$ 5,605$ 1,407$ CO-P46a Hwy 9 - Downtown Felton Bike Lanes & Sidewalks (Sa 3,500$ 3,920$ -$ 3,500$ -$ 3,923$ -$ 3,923$ -$ CO-P46b Hwy 9 - North Felton Bike Lanes & Sidewalks (San Lor 5,000$ 5,600$ -$ 5,000$ -$ 5,605$ -$ 5,605$ -$ CO-P50 East Cliff Dr Pedestrian Pathway (7th-12th Ave) 1,760$ 1,970$ -$ 1,760$ -$ 1,973$ -$ 1,973$ -$ CO-P62 Soquel Dr Road Improvements (Robertson St to Daube 410$ 460$ -$ 410$ -$ 460$ -$ 460$ -$ CO-P83 San Lorenzo Way Bridge Replacement Project 3,190$ 4,490$ -$ -$ 3,190$ 4,490$ -$ -$ 4,490$ CO-P85 Green Valley Rd Bridge Replacement Project 2,110$ 2,370$ -$ 2,110$ -$ 2,365$ -$ 2,365$ -$ CO-P88 Either Way Ln Bridge Replacement Project 2,180$ 3,070$ -$ -$ 2,180$ 3,068$ -$ -$ 3,068$ CO-P90 Fern Dr @ San Lorenzo River Bridge Replacement Proje 2,830$ 3,170$ -$ 2,830$ -$ 3,172$ -$ 3,172$ -$ CO-P91 Larkspur Bridge @San Lorenzo River 3,930$ 5,530$ -$ -$ 3,930$ 5,531$ -$ -$ 5,531$ CO-P96 Capital improvement projects consistent with the Susta 7,000$ 8,420$ -$ 5,000$ 2,000$ 8,419$ -$ 5,605$ 2,815$ CO-P97 County wide guardrail 15,000$ 18,250$ -$ 10,000$ 5,000$ 18,246$ -$ 11,209$ 7,037$

RTP # ProjectConstrained
CostCurrent Year
Escalated Cost
Rounded Estimate
2020-2022 2023 - 2035 2035-2045Potential Escalated
Cost 2020-2022 2023 - 2035 2036-2045
CT 09 Hwy 9 Felton Pedestrian Safety Improvements 15,800$ 17,710$ -$ 15,800$ -$ 17,711$ -$ 17,711$ -$ CT 33 Hwy 17 Wildlife Crossing 5,155$ 5,270$ 5,155$ -$ -$ 5,268$ 5,268$ -$ -$ CT 34 Hwy 1 Scotts Creek Restoration and Bridge Reconstruc 10,000$ 10,810$ 4,000$ 6,000$ -$ 10,813$ 4,088$ 6,726$ -$ CT-P09 Hwy 9 SLV Corridor Projects 30,000$ 36,960$ 2,500$ 15,000$ 12,500$ 36,962$ 2,555$ 16,814$ 17,593$ CT-P45 Highway Preservation (bridge, roadway, roadside) 280,000$ 352,870$ 21,440$ 115,000$ 143,560$ 352,868$ 21,910$ 128,906$ 202,051$ CT-P46 Collision Reduction & Emergency Projects 285,569$ 354,730$ 22,088$ 135,000$ 128,481$ 354,726$ 22,572$ 151,325$ 180,829$ CT-P47 Minors 2,000$ 2,460$ 160$ 1,040$ 800$ 2,455$ 164$ 1,166$ 1,126$ CT-P49 Hwy 17 Access Management - Operational Improveme 10,000$ 11,210$ -$ 10,000$ -$ 11,209$ -$ 11,209$ -$ CT-P50 Hwy 17 Access Management - Multimodal Improveme 5,000$ 7,040$ -$ -$ 5,000$ 7,037$ -$ -$ 7,037$ CT-P54 Hwy 9 Viaduct Wall Extension 6,910$ 7,060$ 6,910$ -$ -$ 7,061$ 7,061$ -$ -$ CT-P55 Hwy 1 Replace Culverts 13,080$ 14,660$ -$ 13,080$ -$ 14,662$ -$ 14,662$ -$ CT-P56 Hwy 1 Soquel Creek Scour Protection 7,703$ 7,870$ 7,703$ -$ -$ 7,872$ 7,872$ -$ -$ CT-P57 Countywide Highway Rumble Strips and Restriping 4,761$ 5,340$ -$ 4,761$ -$ 5,337$ -$ 5,337$ -$ CT-P58 Hwy 17 Jarvis Slide Rock Fence 7,438$ 7,600$ 7,438$ -$ -$ 7,601$ 7,601$ -$ -$ CT-P59 Hwy 9 San Lorenzo River Bridge & Kings Creek Bridge 23,210$ 23,720$ 23,210$ -$ -$ 23,719$ 23,719$ -$ -$ CT-P60 Hwy 9 Upper Drainage and Erosion Control Improvem 12,557$ 14,080$ -$ 12,557$ -$ 14,075$ -$ 14,075$ -$ CT-P61 Hwy 152 Corralitos Creek ADA 7,452$ 8,350$ -$ 7,452$ -$ 8,353$ -$ 8,353$ -$ CT-P62 Hwy 9 PM 1.0 and 4.0 Viaduct 18,231$ 20,440$ -$ 18,231$ -$ 20,436$ -$ 20,436$ -$ CT-P63 Hwy 129 Paving, Sign Panels, Lighting, TMS Improvem 14,809$ 16,600$ -$ 14,809$ -$ 16,600$ -$ 16,600$ -$ CT-P64 Hwy 1 Drainage Improvements 16,554$ 18,560$ -$ 16,554$ -$ 18,556$ -$ 18,556$ -$ CT-P65 Hwy 1 Roadside Safety 24,021$ 26,930$ -$ 24,021$ -$ 26,926$ -$ 26,926$ -$ CT-P66 CZU August Lightning Complex Fire Recovery 14,800$ 15,120$ 14,800$ -$ -$ 15,124$ 15,124$ -$ -$ CT-P67 Hwy 236 Hazardous Tree Removal 15,625$ 15,970$ 15,625$ -$ -$ 15,968$ 15,968$ -$ -$ CT-P68 Hwy 9 Hairpin Tieback at PM19.97 7,630$ 7,800$ 7,630$ -$ -$ 7,797$ 7,797$ -$ -$ CT-P69 Pedestrian Signals #2: Hwys 1 and 129 4,580$ 4,680$ 4,580$ -$ -$ 4,680$ 4,680$ -$ -$ CT-P70 Hwy 17 Paving 8,563$ 9,600$ -$ 8,563$ -$ 9,598$ -$ 9,598$ -$ CT-P71 Hwy 236 Heartwood Hill Embankment Restoration 4,855$ 5,440$ -$ 4,855$ -$ 5,442$ -$ 5,442$ -$ CT-P73 Hwy 17 Drainage Improvements 9,502$ 10,650$ -$ 9,502$ -$ 10,651$ -$ 10,651$ -$ CT-P74 Hwy 1 Capital Maintenance (SR 9 to north of Western D 10,400$ 11,660$ -$ 10,400$ -$ 11,658$ -$ 11,658$ -$ CT-P75 Hwy 1 Long Toed Salamander Mitigation 2,800$ 3,140$ -$ 2,800$ -$ 3,139$ -$ 3,139$ -$ CT-P76 Hwy 9 Capital Maintenance (CapM) 26,400$ 29,590$ -$ 26,400$ -$ 29,592$ -$ 29,592$ -$ CT-P77 Hwy 9 Capital Maintenance North 9,200$ 10,310$ -$ 9,200$ -$ 10,313$ -$ 10,313$ -$ CT-P78 Hwy 17 Capital Maintenance (SR 1 to Vine Hill School 17,200$ 19,280$ -$ 17,200$ -$ 19,280$ -$ 19,280$ -$ CT-P79 Hwy 129 Capital Maintenance 12,500$ 14,010$ -$ 12,500$ -$ 14,012$ -$ 14,012$ -$ CT-P80 Hwy 236 Drainage and System Upgrades in Boulder Cr 13,400$ 15,020$ -$ 13,400$ -$ 15,020$ -$ 15,020$ -$ CTSA-P01 Countywide Specialized Transportation 45,500$ 55,860$ 3,640$ 23,660$ 18,200$ 55,856$ 3,720$ 26,521$ 25,615$ CTSA-P02 Lift Line Maintenance/Operations Center 15,500$ 17,370$ -$ 15,500$ -$ 17,374$ -$ 17,374$ -$ EA 02 SRTS Youth Pedestrian and Bicycle Safety Education (B 440$ 510$ 50$ 300$ 90$ 514$ 51$ 336$ 127$ EA 03a Bike Challenge + 181$ 250$ -$ -$ 181$ 255$ -$ -$ 255$ MTD 02 ADA Paratransit Vehicle Replacements 5,250$ 6,440$ 420$ 2,730$ 2,100$ 6,445$ 429$ 3,060$ 2,956$ MTD 13 Santa Cruz Metro Center/Pacific Station Renovation 10,000$ 11,210$ -$ 10,000$ -$ 11,209$ -$ 11,209$ -$ MTD 18 Account-based Electronic Fare Collection System 2,250$ 2,760$ 180$ 1,170$ 900$ 2,762$ 184$ 1,311$ 1,267$ MTD 24 ITS Equipment: Automatic Passenger Counter System a 1,600$ 1,640$ 1,600$ -$ -$ 1,635$ 1,635$ -$ -$ MTD-P04 Bus Replacements 67,200$ 82,500$ 5,376$ 34,944$ 26,880$ 82,495$ 5,494$ 39,170$ 37,832$ MTD-P06 Transit Technological Improvements 2,500$ 2,940$ 227$ 1,705$ 568$ 2,943$ 232$ 1,911$ 799$ MTD-P10 Local Transit - Continuation of Baseline Service Levels 1,077,500$ 1,340,650$ 86,200$ 497,809$ 493,491$ 1,340,652$ 88,090$ 558,006$ 694,556$ MTD-P10B Hwy 17 Express Service - Continuation of Baseline Serv 132,500$ 162,660$ 10,600$ 68,900$ 53,000$ 162,658$ 10,832$ 77,232$ 74,594$ MTD-P10C ADA Paratransit Service - Continuation of Existing Serv 162,500$ 199,490$ 13,000$ 84,500$ 65,000$ 199,486$ 13,285$ 94,718$ 91,483$ MTD-P12 Hwy 17 Express Service Restoration and Expansion 5,050$ 6,200$ 404$ 2,626$ 2,020$ 6,199$ 413$ 2,944$ 2,843$ MTD-P14 Local Transit Service Restoration and Expansion 98,800$ 121,290$ 7,904$ 51,376$ 39,520$ 121,288$ 8,077$ 57,589$ 55,622$ MTD-P19 Transit Mobility Training Program Expansion 2,000$ 2,460$ 160$ 1,040$ 800$ 2,455$ 164$ 1,166$ 1,126$ MTD-P28 ParaCruz Operating Facility 12,400$ 13,310$ 6,000$ 6,400$ -$ 13,305$ 6,132$ 7,174$ -$ MTD-P30 ParaCruz Mobile Data Terminals; Radios 400$ 470$ 36$ 273$ 91$ 471$ 37$ 306$ 128$ MTD-P31 Bus Rebuild and Maintenance 6,000$ 7,370$ 480$ 3,120$ 2,400$ 7,366$ 491$ 3,497$ 3,378$ MTD-P32 Non-Revenue Vehicle Replacements 1,000$ 1,230$ 80$ 520$ 400$ 1,228$ 82$ 583$ 563$ MTD-P36 Metro facilities repair/upgrades 4,300$ 4,950$ 1,000$ 2,500$ 800$ 4,950$ 1,022$ 2,802$ 1,126$ MTD-P51 ADA Access Improvements 350$ 360$ 350$ -$ -$ 358$ 358$ -$ -$ MTD-P52 Bus Stop and Station Improvements 500$ 560$ -$ 500$ -$ 560$ -$ 560$ -$ MTD-P60 Real-Time Transit Info 220$ 260$ 20$ 150$ 50$ 259$ 20$ 168$ 70$ RTC 01 Freeway Service Patrol (FSP) on Hwy 1 and Hwy 17 7,500$ 9,210$ 600$ 3,900$ 3,000$ 9,207$ 613$ 4,372$ 4,222$ RTC 02a Cruz511 TDM and Traveler Information 4,334$ 5,320$ 347$ 2,254$ 1,734$ 5,320$ 354$ 2,526$ 2,440$ RTC 03a Rail Line Repairs and Bridge Rehabilitation 5,800$ 5,930$ 5,800$ -$ -$ 5,927$ 5,927$ -$ -$

RTP # ProjectConstrained
CostCurrent Year
Escalated Cost
Rounded Estimate
2020-2022 2023 - 2035 2035-2045Potential Escalated
Cost 2020-2022 2023 - 2035 2036-2045
RTC 03b Rail Line: Track infrastructure, signage, maintenance an 4,375$ 5,370$ 350$ 2,275$ 1,750$ 5,371$ 358$ 2,550$ 2,463$ RTC 03d Railroad Bridge Inspections & Analysis 6,250$ 7,670$ 500$ 3,250$ 2,500$ 7,673$ 511$ 3,643$ 3,519$ RTC 03e Rail Line: Pajaro River Railroad Bridge Rehabilitation 670$ 680$ 670$ -$ -$ 685$ 685$ -$ -$ RTC 04 Planning, Programming & Monitoring (PPM) - SB45 5,000$ 6,140$ 400$ 2,600$ 2,000$ 6,138$ 409$ 2,914$ 2,815$ RTC 15 Vanpool Incentive Program 100$ 120$ -$ 70$ 30$ 121$ -$ 78$ 42$ RTC 16 Bike Parking Subsidy Program 240$ 290$ 48$ 96$ 96$ 292$ 49$ 108$ 135$ RTC 17 Ecology Action Transportation Employer Membership 1,125$ 1,380$ 90$ 585$ 450$ 1,381$ 92$ 656$ 633$ RTC 24e 3 - Hwy 1-State Park Dr-Bay/Porter Auxiliary Lanes, Bu 90,000$ 100,880$ -$ 90,000$ -$ 100,883$ -$ 100,883$ -$ RTC 24f 2 - Hwy 1 Auxiliary Lanes & Bus on Shoulders: 41st Av 32,000$ 33,690$ 22,000$ 10,000$ -$ 33,692$ 22,482$ 11,209$ -$ RTC 24g 4 - Hwy 1 Auxiliary Lanes and Bus on Shoulders: Freed 102,000$ 114,330$ -$ 102,000$ -$ 114,334$ -$ 114,334$ -$ RTC 24j 7 - Hwy 1: Reconstruct Bay Ave/Porter St and 41st Ave 14,000$ 15,300$ 4,000$ 10,000$ -$ 15,297$ 4,088$ 11,209$ -$ RTC 24r 94 - Hwy 1: Northbound Auxiliary Lane from San And 10,000$ 14,070$ -$ -$ 10,000$ 14,074$ -$ -$ 14,074$ RTC 26 Bike To Work/School Program 1,870$ 2,190$ 180$ 1,300$ 390$ 2,190$ 184$ 1,457$ 549$ RTC 27a Monterey Bay Sanctuary Scenic Trail Network - Design 121,000$ 152,700$ 9,680$ 48,400$ 62,920$ 152,701$ 9,892$ 54,253$ 88,556$ RTC 27b Monterey Bay Sanctuary Scenic Trail Network (Coastal 17,500$ 21,480$ 1,400$ 9,100$ 7,000$ 21,483$ 1,431$ 10,200$ 9,852$ RTC 27c Monterey Bay Sanctuary Scenic Trail Network (Coasta 7,550$ 8,530$ 2,200$ 4,350$ 1,000$ 8,532$ 2,248$ 4,876$ 1,407$ RTC 33 Cabrillo College TDM Programs 890$ 1,090$ 71$ 463$ 356$ 1,093$ 73$ 519$ 501$ RTC 34 Hwy 1 Ramp Metering: Northern Sections Between San 1$ -$ -$ 1$ 1$ 1$ -$ 1$ 1$ RTC-P01 SAFE: Call Box System Along Hwys 6,125$ 7,520$ 490$ 3,185$ 2,450$ 7,519$ 501$ 3,570$ 3,448$ RTC-P02 Public Transit on Watsonville-Santa Cruz Rail Corridor 25,000$ 27,690$ 3,333$ 21,667$ -$ 27,693$ 3,406$ 24,287$ -$ RTC-P07 SCCRTC Administration (TDA) 16,250$ 19,950$ 1,300$ 8,450$ 6,500$ 19,949$ 1,328$ 9,472$ 9,148$ RTC-P08 SCCRTC Planning 15,625$ 19,180$ 1,250$ 8,125$ 6,250$ 19,181$ 1,277$ 9,108$ 8,796$ RTC-P25 Transit Oriented Development Grant Program 2,570$ 3,030$ 250$ 1,720$ 600$ 3,028$ 255$ 1,928$ 844$ RTC-P26 Countywide Pedestrian Signal Upgrades 1,035$ 1,220$ 100$ 685$ 250$ 1,222$ 102$ 768$ 352$ RTC-P43 Senior Employment Ride Reimbursement 1,600$ 1,880$ 150$ 1,100$ 350$ 1,879$ 153$ 1,233$ 493$ RTC-P48 Climate Action Transportation Programs 2,330$ 2,770$ 100$ 1,630$ 600$ 2,774$ 102$ 1,827$ 844$ RTC-P49 RTC Bikeway Map 320$ 380$ -$ 250$ 70$ 379$ -$ 280$ 99$ RTC-P50 County-wide Bicycle, Pedestrian and Vehicle Occupanc 330$ 410$ 30$ 150$ 150$ 410$ 31$ 168$ 211$ RTC-P51 Performance Monitoring 220$ 270$ 20$ 100$ 100$ 273$ 20$ 112$ 141$ RTC-P53 TDM Individualized Employer/Multiunit Housing Prog 2,325$ 2,740$ 200$ 1,600$ 525$ 2,737$ 204$ 1,793$ 739$ RTC-P54 School-Based Mobility/TDM Programs 1,150$ 1,410$ 92$ 598$ 460$ 1,412$ 94$ 670$ 647$ RTC-P59 Measure D Administration and Implementation 14,375$ 17,650$ 1,150$ 7,475$ 5,750$ 17,647$ 1,175$ 8,379$ 8,093$ RTC-P60 Regional State Transit Assistance Projects 33,220$ 39,100$ 3,020$ 22,650$ 7,550$ 39,101$ 3,086$ 25,389$ 10,626$ SC 23 West Cliff Path Minor Widening (David Way Lighthou 520$ 580$ -$ 520$ -$ 583$ -$ 583$ -$ SC 25 Hwy 1/9 Intersection Modifications 7,900$ 8,070$ 7,900$ -$ -$ 8,073$ 8,073$ -$ -$ SC 37 Murray St Bridge Retrofit 11,440$ 12,820$ -$ 11,440$ -$ 12,823$ -$ 12,823$ -$ SC 38 Hwy 1/San Lorenzo Bridge Replacement 20,000$ 22,420$ -$ 20,000$ -$ 22,418$ -$ 22,418$ -$ SC 42 Soquel Ave at Frederick St Intersection Modifications 350$ 360$ 350$ -$ -$ 358$ 358$ -$ -$ SC 48 Ocean St Pavement Rehabilitation 1,030$ 1,150$ -$ 1,030$ -$ 1,155$ -$ 1,155$ -$ SC 50 Pacific Ave. Sidewalk 400$ 410$ 400$ -$ -$ 409$ 409$ -$ -$ SC-P07 Citywide Operations and Maintenance 79,000$ 101,590$ 6,320$ 25,000$ 47,680$ 101,588$ 6,459$ 28,023$ 67,106$ SC-P09 Sidewalk Program 5,500$ 6,470$ 500$ 3,750$ 1,250$ 6,474$ 511$ 4,203$ 1,759$ SC-P100 Seabright/Murray Traffic Signal Modifications 1,030$ 1,150$ -$ 1,030$ -$ 1,155$ -$ 1,155$ -$ SC-P101 Swift/Delaware Intersection Roundabout or Traffic Sign 500$ 560$ -$ 500$ -$ 560$ -$ 560$ -$ SC-P104 Measure H Road Projects 41,800$ 49,200$ 3,800$ 28,500$ 9,500$ 49,200$ 3,883$ 31,946$ 13,371$ SC-P105 Market Street Sidewalks and Bike Lanes 1,030$ 1,450$ -$ -$ 1,030$ 1,450$ -$ -$ 1,450$ SC-P109 Bay/High Intersection Modification 2,150$ 2,410$ -$ 2,150$ -$ 2,410$ -$ 2,410$ -$ SC-P123 Soquel/Branciforte/Water (San Lorenzo River to Brancif 410$ 460$ -$ 410$ -$ 460$ -$ 460$ -$ SC-P125 Citywide Safe Routes to School Projects - ATP 1,404$ 1,430$ 1,404$ -$ -$ 1,435$ 1,435$ -$ -$ SC-P126 Almar Ave Sidewalks 200$ 220$ -$ 200$ -$ 224$ -$ 224$ -$ SC-P128 Citywide Street Sweeping 22,500$ 27,620$ 1,800$ 11,700$ 9,000$ 27,621$ 1,839$ 13,115$ 12,667$ SC-P129 Downtown Intersection Improvements 300$ 310$ 300$ -$ -$ 307$ 307$ -$ -$ SC-P13 Riverside Ave/Second St Intersection Modification. 175$ 180$ 175$ -$ -$ 179$ 179$ -$ -$ SC-P133 San Lorenzo River Walk Lighting 970$ 990$ 970$ -$ -$ 991$ 991$ -$ -$ SC-P134 Ocean-Plymouth Multi-modal Transportation Improve 200$ 200$ 200$ -$ -$ 204$ 204$ -$ -$ SC-P23 Delaware Avenue Complete Streets 150$ 170$ -$ 150$ -$ 168$ -$ 168$ -$ SC-P29 Morrissey Blvd. Bike Path over Hwy 1 300$ 340$ -$ 300$ -$ 336$ -$ 336$ -$ SC-P30 Murray St to Harbor Path Connection 210$ 240$ -$ 210$ -$ 235$ -$ 235$ -$ SC-P35 San Lorenzo River Levee Path Connection 2,070$ 2,910$ -$ -$ 2,070$ 2,913$ -$ -$ 2,913$ SC-P59 King Street Bike Facility (entire length) 2,070$ 2,320$ -$ 2,070$ -$ 2,320$ -$ 2,320$ -$ SC-P69 Seabright Avenue Bike Lanes (Pine-Soquel) 2,070$ 2,320$ -$ 2,070$ -$ 2,320$ -$ 2,320$ -$ SC-P77 Bay Street Corridor Modifications 970$ 1,370$ -$ -$ 970$ 1,365$ -$ -$ 1,365$

RTP # ProjectConstrained
CostCurrent Year
Escalated Cost
Rounded Estimate
2020-2022 2023 - 2035 2035-2045Potential Escalated
Cost 2020-2022 2023 - 2035 2036-2045
SC-P81 Hwy 1/Mission St at Chestnut/King/Union Intersection 4,650$ 6,540$ -$ -$ 4,650$ 6,545$ -$ -$ 6,545$ SC-P83 West Cliff/Bay Street Modifications 500$ 560$ -$ 500$ -$ 560$ -$ 560$ -$ SC-P86 Ocean St Streetscape and Intersection, Plymouth to Wa 2,000$ 2,810$ -$ -$ 2,000$ 2,815$ -$ -$ 2,815$ SC-P90 High St/Moore St Intersection Modification 100$ 100$ 100$ -$ -$ 102$ 102$ -$ -$ SC-P91 Shaffer Road Widening and Railroad Crossing 1,000$ 1,410$ -$ -$ 1,000$ 1,407$ -$ -$ 1,407$ SC-P93 Beach/Cliff Intersection Signalization 210$ 240$ -$ 210$ -$ 235$ -$ 235$ -$ SC-P96 Bay/California Traffic Signals 100$ 100$ 100$ -$ -$ 102$ 102$ -$ -$ SV 30a Blue Bonnet Lane and Kings Village Rd Sidewalk Infill 250$ 260$ 250$ -$ -$ 255$ 255$ -$ -$ SV 32 Sidewalk Masterplan Implementation 500$ 610$ 100$ 200$ 200$ 608$ 102$ 224$ 281$ SV-P05 Citywide Sidewalk Program 4,000$ 4,910$ 320$ 2,080$ 1,600$ 4,910$ 327$ 2,332$ 2,252$ SV-P06 Citywide Access Ramps 210$ 260$ 17$ 109$ 84$ 258$ 17$ 122$ 118$ SV-P100 Whispering Pines Dr (Mt Hermon-Lundy Ln) Seperated 75$ 80$ -$ 75$ -$ 84$ -$ 84$ -$ SV-P21 Lockwood Ln Pedestrian Signal Near Golf Course 50$ 60$ -$ 50$ -$ 56$ -$ 56$ -$ SV-P27 Citywide General Maintenance and Operations 18,000$ 22,100$ 1,440$ 9,360$ 7,200$ 22,097$ 1,472$ 10,492$ 10,134$ SV-P28 Neighborhood Traffic Calming 770$ 920$ 20$ 550$ 200$ 918$ 20$ 617$ 281$ SV-P30A Mt Hermon Road Sidewalk Connections 520$ 570$ 100$ 420$ -$ 573$ 102$ 471$ -$ SV-P35 Bean Creek Rd Sidewalks (SVMS to Blue Bonnet) 410$ 460$ -$ 410$ -$ 460$ -$ 460$ -$ SV-P41 Citywide Bike Lanes 2,060$ 2,530$ 165$ 1,071$ 824$ 2,529$ 169$ 1,201$ 1,160$ SV-P42 Synchronize Traffic Signals along Mt. Hermon Road 100$ 100$ 100$ -$ -$ 102$ 102$ -$ -$ SV-P45 Scotts Valley Town Center Bicycle/Pedestrian Facilities 4,130$ 4,630$ -$ 4,130$ -$ 4,629$ -$ 4,629$ -$ SV-P46 Mt Hermon/King's Village Rd-Transit Signal priority 80$ 90$ -$ 80$ -$ 90$ -$ 90$ -$ SV-P47 Mt Hermon/Scotts Valley - Transit Queue Jump 620$ 690$ -$ 620$ -$ 695$ -$ 695$ -$ SV-P49 Mt Hermon Rd and Scotts Valley Drive - Crosswalks 515$ 620$ -$ 375$ 140$ 617$ -$ 420$ 197$ SV-P51 Mt. Hermon Road/Town Center Entrance Traffic Signal 130$ 150$ -$ 130$ -$ 146$ -$ 146$ -$ SV-P52 Kings Village Rd/Town Center Entrance Traffic Signal 105$ 120$ -$ 105$ -$ 118$ -$ 118$ -$ SV-P53 Mt Hermon Rd to El Rancho Drive Bike/Ped Connectio 1,030$ 1,450$ -$ -$ 1,030$ 1,450$ -$ -$ 1,450$ SV-P56 Bean Creek Road at SV Middle School driveway crossw 53$ 60$ -$ 53$ -$ 59$ -$ 59$ -$ SV-P74 Hacienda Way Intersection Modification and Improvem 100$ 110$ -$ 100$ -$ 112$ -$ 112$ -$ SV-P79 Lockewood Lanes Sidewalk & Sharrows 90$ 100$ -$ 90$ -$ 101$ -$ 101$ -$ SV-P95 Highway 17 On/Off Ramp Bike & Pedestrian Improvem 207$ 230$ -$ 207$ -$ 232$ -$ 232$ -$ SV-P99 Vine Hill School Rd (Glenwood Dr-Tabor Dr) Bike Lane 44$ 50$ -$ 44$ -$ 49$ -$ 49$ -$ TRL 07bSC MBSST (Coastal Rail Trail): Segment 7-Phase 2 (Bay/Ca 11,000$ 12,330$ -$ 11,000$ -$ 12,330$ -$ 12,330$ -$ TRL 07cSC MBSST (Coastal Rail Trail): Segment 7-Phase 3 (Natura 200$ 200$ 200$ -$ -$ 204$ 204$ -$ -$ TRL 10-11 MBSST Rail Trail: 17th Ave-Jade St Park & Monterey A 66,000$ 73,590$ 4,000$ 62,000$ -$ 73,585$ 4,088$ 69,497$ -$ TRL 18L MBSST/Rail Trail: Segment 18b - Lee Road-Ohlone Pkw 3,260$ 3,330$ 3,260$ -$ -$ 3,331$ 3,331$ -$ -$ TRL 18W MBSST/Rail Trail: Segment 18a - Ohlone Pkwy to City S 2,000$ 2,040$ 2,000$ -$ -$ 2,044$ 2,044$ -$ -$ TRL 5a MBSST - North Coast Rail Trail: Segment 5 Phase 1 13,500$ 15,130$ -$ 13,500$ -$ 15,132$ -$ 15,132$ -$ TRL 5b MBSST - North Coast Rail Trail: Segment 5 Phase 2 8,700$ 9,750$ -$ 8,700$ -$ 9,752$ -$ 9,752$ -$ TRL 8-9a MBSST (Coastal Rail Trail): Segment 8 and 9 34,500$ 38,670$ -$ 34,500$ -$ 38,672$ -$ 38,672$ -$ UC-P01 UCSC Main Entrance Improvements 2,070$ 2,320$ -$ 2,070$ -$ 2,320$ -$ 2,320$ -$ UC-P23 Transit Vehicles (ongoing) 5,875$ 7,210$ 470$ 3,055$ 2,350$ 7,212$ 480$ 3,424$ 3,307$ UC-P33 UCSC Bicycle Parking Improvements 520$ 610$ 50$ 350$ 120$ 612$ 51$ 392$ 169$ UC-P38 Pedestrian Directional Map/Wayfinding System 520$ 610$ 50$ 350$ 120$ 612$ 51$ 392$ 169$ UC-P58 UCSC Traffic Control 2,580$ 3,040$ 240$ 1,750$ 590$ 3,037$ 245$ 1,962$ 830$ UC-P59 UCSC Lump Sum Roadway Maintenance 2,275$ 2,790$ 182$ 1,183$ 910$ 2,793$ 186$ 1,326$ 1,281$ UC-P61 Traveler Safety Education/Information Programs 100$ 120$ 10$ 65$ 25$ 118$ 10$ 73$ 35$ UC-P62 Bus Tracking and AVL Transit Programs 260$ 280$ 82$ 178$ -$ 283$ 84$ 200$ -$ UC-P63 UCSC Vanpool Program 9,863$ 12,110$ 789$ 5,129$ 3,945$ 12,108$ 806$ 5,749$ 5,553$ UC-P64 Alternative Fuel Fleet Vehicles 500$ 580$ 100$ 300$ 100$ 579$ 102$ 336$ 141$ UC-P66 Transportation-Related Stormwater Management Proje 1,030$ 1,210$ 100$ 700$ 230$ 1,211$ 102$ 785$ 324$ UC-P68 Parking Management Technology Improvements 410$ 480$ 40$ 280$ 90$ 481$ 41$ 314$ 127$ UC-P69 UCSC Commute Counseling Program 3,100$ 3,650$ 280$ 2,120$ 700$ 3,648$ 286$ 2,376$ 985$ UC-P70 UCSC Commuter Incentive Programs 1,750$ 2,150$ 140$ 910$ 700$ 2,148$ 143$ 1,020$ 985$ UC-P73 UCSC Parking Operations & Maintenance 80,000$ 98,210$ 6,400$ 41,600$ 32,000$ 98,209$ 6,540$ 46,630$ 45,038$ UC-P74 UCSC Transit Service 77,750$ 95,450$ 6,220$ 40,430$ 31,100$ 95,447$ 6,356$ 45,319$ 43,771$ UC-P75 Disability Van Service 6,250$ 7,670$ 500$ 3,250$ 2,500$ 7,673$ 511$ 3,643$ 3,519$ VAR 02 Project PASEO - Open Streets, Earn-a-Bike, Pop Up Bik 50$ 50$ 50$ -$ -$ 51$ 51$ -$ -$ VAR-P03 Bicycle Sharrows 520$ 610$ 40$ 380$ 100$ 608$ 41$ 426$ 141$ VAR-P05 Bike-Activated Traffic Signal Program 1,030$ 1,200$ 100$ 750$ 180$ 1,196$ 102$ 841$ 253$ VAR-P06 Carsharing Program 1,470$ 1,800$ 118$ 764$ 588$ 1,805$ 120$ 857$ 828$ VAR-P07 Transportation System Electrification 51,650$ 63,630$ -$ 31,650$ 20,000$ 63,626$ -$ 35,477$ 28,149$ VAR-P08 Safe Paths of Travel 3,100$ 3,650$ 280$ 2,120$ 700$ 3,648$ 286$ 2,376$ 985$

RTP # ProjectConstrained
CostCurrent Year
Escalated Cost
Rounded Estimate
2020-2022 2023 - 2035 2035-2045Potential Escalated
Cost 2020-2022 2023 - 2035 2036-2045
VAR-P10 Safe Routes to Schools Studies 210$ 250$ 20$ 140$ 50$ 248$ 20$ 157$ 70$ VAR-P13 Lump Sum Emergency Response Local Roads 240,000$ 303,400$ 17,846$ 96,000$ 126,154$ 303,399$ 18,237$ 107,609$ 177,553$ VAR-P14 Lump Sum Bridge Preservation 100,000$ 126,200$ 8,000$ 40,000$ 52,000$ 126,199$ 8,175$ 44,837$ 73,187$ VAR-P16 Bike Share 5,170$ 6,270$ -$ 3,500$ 1,670$ 6,274$ -$ 3,923$ 2,350$ VAR-P17 Eco-Tourism - Sustainable Transportation 515$ 600$ 35$ 400$ 80$ 597$ 36$ 448$ 113$ VAR-P18 Mission St/Hwy 1 Bike/Truck Safety Campaign 520$ 610$ 50$ 345$ 125$ 614$ 51$ 387$ 176$ VAR-P19 School Safety Programs 1,910$ 2,250$ 200$ 1,260$ 450$ 2,250$ 204$ 1,412$ 633$ VAR-P20 Public Transit Marketing 775$ 920$ -$ 600$ 175$ 919$ -$ 673$ 246$ VAR-P24 Countywide Senior Driving Training 90$ 110$ 18$ 36$ 36$ 109$ 18$ 40$ 51$ VAR-P25 Planning for Transit Oriented Development for Seniors 80$ 90$ 10$ 50$ 20$ 94$ 10$ 56$ 28$ VAR-P26 Park and Ride Lot Development 3,100$ 3,750$ 100$ 2,000$ 1,000$ 3,751$ 102$ 2,242$ 1,407$ VAR-P27 Complete Streets Implementation 20,000$ 24,550$ 1,600$ 10,400$ 8,000$ 24,552$ 1,635$ 11,658$ 11,259$ VAR-P28 Complete Streets Area Plans 400$ 450$ -$ 400$ -$ 448$ -$ 448$ -$ VAR-P29 Public/Private Partnership Bicycle and Pedestrian Conn 150$ 170$ -$ 150$ -$ 168$ -$ 168$ -$ VAR-P30 Public/Private Partnership Transit Stops and Pull Outs 150$ 170$ -$ 150$ -$ 168$ -$ 168$ -$ VAR-P31 Uncontrolled Pedestrian Crossing Improvements 2,570$ 3,070$ -$ 1,900$ 670$ 3,073$ -$ 2,130$ 943$ VAR-P32 Bicycle Treatments for intersection improvements (ADD 4,130$ 4,920$ -$ 3,100$ 1,030$ 4,925$ -$ 3,475$ 1,450$ VAR-P34 Transit Priority 2,585$ 3,010$ -$ 2,185$ 400$ 3,012$ -$ 2,449$ 563$ VAR-P35 School Complete Streets Projects 10,330$ 11,580$ -$ 10,330$ -$ 11,579$ -$ 11,579$ -$ VAR-P36 Safety Plan 310$ 360$ -$ 250$ 60$ 365$ -$ 280$ 84$ VAR-P37 Transportation Demand Management Plan 310$ 360$ -$ 250$ 60$ 365$ -$ 280$ 84$ VAR-P38 Environmental Mitigation Program 5,680$ 6,700$ 230$ 4,200$ 1,250$ 6,702$ 235$ 4,708$ 1,759$ VAR-P39 Active Transportation Plan 2,380$ 2,790$ 200$ 1,680$ 500$ 2,791$ 204$ 1,883$ 704$ VAR-P40 Santa Cruz County Open Streets 250$ 300$ 50$ 100$ 100$ 304$ 51$ 112$ 141$ VAR-P44 Electric Bicycle Commuter Incentive Program 1,140$ 1,400$ 91$ 593$ 456$ 1,399$ 93$ 664$ 642$ VAR-P45 West Side Transit Hub 580$ 650$ -$ 580$ -$ 650$ -$ 650$ -$ VAR-P46 Live Oak Transit Hub 530$ 590$ -$ 530$ -$ 594$ -$ 594$ -$ VAR-P47 Watsonville Transit Hub 585$ 660$ -$ 585$ -$ 656$ -$ 656$ -$ VAR-P48 On-Demand Wheelchair Accessible Vehicle Program 1,500$ 1,840$ 120$ 780$ 600$ 1,841$ 123$ 874$ 844$ VC-P1 Volunteer Center Transportation Program 1,640$ 1,910$ 240$ 1,050$ 350$ 1,915$ 245$ 1,177$ 493$ WAT 01A Hwy 1/Harkins Slough Road Interchange: Bicycle/Pede 15,800$ 17,710$ -$ 15,800$ -$ 17,711$ -$ 17,711$ -$ WAT 43 Freedom Boulevard Plan Line 160$ 160$ 160$ -$ -$ 164$ 164$ -$ -$ WAT 45 Freedom Blvd Reconstruction (Alta Vista to Green Vall 2,175$ 2,220$ 2,175$ -$ -$ 2,223$ 2,223$ -$ -$ WAT 46 Watsonville Road Rehabilitation/Reconstruction (Vario 2,505$ 2,560$ 2,505$ -$ -$ 2,560$ 2,560$ -$ -$ WAT-P04 Neighborhood Traffic Plan 115$ 130$ -$ 115$ -$ 129$ -$ 129$ -$ WAT-P06 Citywide General Maintenance and Operations 54,270$ 68,490$ 4,342$ 21,708$ 28,220$ 68,488$ 4,437$ 24,333$ 39,718$ WAT-P13 Neighborhood Traffic Plan Implementation 470$ 530$ -$ 470$ -$ 527$ -$ 527$ -$ WAT-P19 Lump Sum Bicycle Projects 3,125$ 3,840$ 250$ 1,625$ 1,250$ 3,836$ 255$ 1,822$ 1,759$ WAT-P24 Citywide Transportation Projects 16,200$ 20,200$ 1,296$ 7,336$ 7,568$ 20,199$ 1,324$ 8,223$ 10,651$ WAT-P35 Bridge Maintenance 115$ 130$ -$ 115$ -$ 129$ -$ 129$ -$ WAT-P36 Alley Improvements 60$ 70$ -$ 60$ -$ 67$ -$ 67$ -$ WAT-P45 Green Valley Rd Improvement (Freedom Blvd to City L 2,000$ 2,040$ 2,000$ -$ -$ 2,044$ 2,044$ -$ -$ WAT-P47 Main St Modifications (City Limit to Lake Ave) 1,670$ 2,350$ -$ -$ 1,670$ 2,350$ -$ -$ 2,350$ WAT-P49 2nd/Maple Ave (Lincoln to Walker) Traffic Calming an 25$ 30$ -$ 25$ -$ 28$ -$ 28$ -$ WAT-P50 5th St (Lincoln to Walker) - Traffic Calming and Greenw 25$ 30$ -$ 25$ -$ 28$ -$ 28$ -$ WAT-P54 Main St - 3 HAWK Signals 890$ 1,250$ -$ -$ 890$ 1,253$ -$ -$ 1,253$ WAT-P62 Freedom Blvd Pedestrian Crossings (Airport to Lincoln 600$ 840$ -$ -$ 600$ 844$ -$ -$ 844$ WAT-P65 Upper Struve Slough Trail 530$ 750$ -$ -$ 530$ 746$ -$ -$ 746$ WAT-P72 Freedom Blvd (Green Valley Rd to Airport Blvd) 2,650$ 2,970$ -$ 2,650$ -$ 2,970$ -$ 2,970$ -$ WAT-P75 Complete Streets - Downtown 5,000$ 6,140$ 400$ 2,600$ 2,000$ 6,138$ 409$ 2,914$ 2,815$ WAT-P76 Complete Streets - Watsonville Schools 4,000$ 4,910$ 320$ 2,080$ 1,600$ 4,910$ 327$ 2,332$ 2,252$ WAT-P77 Elm St. Improvements Project 350$ 360$ 350$ -$ -$ 358$ 358$ -$ -$ WAT-P78 Green Valley Adaptive Signal Project 393$ 400$ 393$ -$ -$ 402$ 402$ -$ -$ WAT-P79 Harkins Slough Rd Pedestrian & Bicycle Bridge 90$ 90$ 90$ -$ -$ 92$ 92$ -$ -$ WAT-P80 Lake Avenue Underground Utilities 2,400$ 2,450$ 2,400$ -$ -$ 2,453$ 2,453$ -$ -$ WAT-P81 Lee Rd Trail 700$ 720$ 700$ -$ -$ 715$ 715$ -$ -$ WAT-P86 Main Street Traffic Study 25$ 30$ 25$ -$ -$ 26$ 26$ -$ -$ WAT-P87 Airport Blvd / Holm Road Signal Installation 460$ 470$ 460$ -$ -$ 470$ 470$ -$ -$ WAT-P88 Airport Blvd Pavement Reconstruction 575$ 590$ 575$ -$ -$ 588$ 588$ -$ -$ WAT-P89 West Beach St/Ohlone Pkwy Signal 130$ 130$ 130$ -$ -$ 133$ 133$ -$ -$
Total Costs 5,027,000$ 6,142,000$ 499,000$ 2,589,000$ 1,940,000$ 6,142,000$ 510,000$ 2,902,000$ 2,730,000$ AVAILABLE FUNDS (per 2045 FE) 5,027,000$ 6,141,000$ 499,000$ 2,589,000$ 1,940,000$ 6,141,000$ 510,000$ 2,902,000$ 2,730,000$

Appendix G Regional Transportation Plan Checklist
2045 Regional Transportation Plan Checklist (Revised December 2016)
To be completed electronically in Microsoft Word format by the MPO and submitted along with the draft and final RTP to Caltrans.
Name of RTPA: Santa Cruz County Regional Transportation Commission
Date Draft RTP Completed: December 2, 2021 RTP Adoption Date: June 2, 2021 (scheduled) What is the Certification Date of the Environmental Document (ED)?
June 2, 2021 (scheduled)
Is the ED located in the RTP or is it a separate document?
Separate. Available at sccrtc.org/2045rtp
By completing this checklist, the RTPA verifies the RTP addresses all the following required information within the RTP.
Regional Transportation Plan Contents Yes/No Page # General
1. Does the RTP address no less than a 20-year planninghorizon? (23 CFR 450.216(a))
Yes ES-1; Chapter 1, 1-1; Appendix D, Appendix E
2. Does the RTP include both long-range and short-rangestrategies/actions? (23 CFR 450.324(b) “Should” forRTPAs)
Yes Chapter 6; Appendix E, Appendix F
3. Does the RTP address issues specified in the policy,action and financial elements identified in CaliforniaGovernment Code Section 65080?
Yes Chapters 4, 5, 6, 7 Appendix D, Appendix E
4. Does the RTP include Project Intent i.e., Plan LevelPurpose and Need Statements?
Yes Appendix E Project Desc.
Consultation/Cooperation
1. Does the RTP contain a documented publicinvolvement process that meets the requirements ofTitle 23, CFR part 450.210(a)?
Yes Appendix A
2. Does the documented public involvement processdescribe how the RTPA will seek out and consider theneeds of those traditionally underserved by theexisting transportation system, such as low-incomeand minority households, who may face challengesaccessing employment and other services? (23 CFR450.210(a)(1)(viii))
Yes Chapter 1, 1-12; Appendix A
3. Was a periodic review conducted of the effectivenessof the procedures and strategies contained in theparticipation plan to ensure a full and openparticipation process? (23 CFR part 450.210(a)(1)(ix))
Yes Chapter 1, 1-12; Appendix A

Regional Transportation Plan Contents Yes/No Page # 4. Did the RTPA consult with the appropriate State and
local representatives including representatives fromenvironmental and economic communities; airport;transit; freight during the preparation of the RTP? (23CFR 450.316(b) “Should” for RTPAs)
Yes Appendix A
5. Did the RTPA who has federal lands within itsjurisdictional boundary involve the federal landmanagement agencies during the preparation of theRTP? (23 CFR 450.216(j))
Yes Appendix A
6. Where does the RTP specify that the appropriate Stateand local agencies responsible for land use, naturalresources, environmental protection, conservation andhistoric preservation consulted? (23 CFR part450.216(j))
Yes Appendix A, A-14 to A-17
7. Did the RTP include a comparison with the CaliforniaState Wildlife Action Plan and (if available)inventories of natural and historic resources? (23 CFRpart 450.216(j))
Yes EIR
8. Did the RTPA who has a federally recognized NativeAmerican Tribal Government(s) and/or historical andsacred sites or subsistence resources of these TribalGovernments within its jurisdictional boundaryaddress tribal concerns in the RTP and develop theRTP in consultation with the Tribal Government(s)?(23 CFR part 450.216(i))
N/A
9. Does the RTP address how the public and variousspecified groups were given a reasonable opportunityto comment on the plan using the public involvementprocess developed under 23 CFR part 450.210(a)? (23CFR 450.210(a)(1)(iii))
Yes Appendix A
10. Does the RTP contain a discussion describing theprivate sector involvement efforts that were usedduring the development of the plan? (23 CFR part450.210(a))
Yes Appendix A
11. Is the RTP coordinated and consistent with the PublicTransit-Human Services Transportation Plan? (23 CFRpart 450.208(h))
Yes Chapter 2, 2-12
12. Were the draft and adopted RTP posted on theInternet? (23 CFR part 450.216(o))
Yes www.sccrtc.org/2045rtp

Regional Transportation Plan Contents Yes/No Page # 13. If the RTPA made the election allowed by Government
Code 65080(b)(2)(M) to change the RTP updateschedule (from 5 to 4 years) and change the localgovernment Housing Element update schedule (from5 to 8 years), was the RTP adopted on the estimateddate required to be provided in writing to StateDepartment of Housing and CommunityDevelopment pursuant to Government Code65588(e)(5) to align the Regional Housing NeedAllocation planning period established from theestimated RTP adoption date with the localgovernment Housing Element planning periodestablished from the actual RTP adoption date?
N/A
Modal Discussion
1. Does the RTP discuss intermodal and connectivityissues?
Yes Chapters 2, 3, 6
2. Does the RTP include a discussion of highways?Yes
Chapter 2, 2-2 to 2-6; Chapter 3, 3-6 to 3-7; Chapter 6, 6-3
3. Does the RTP include a discussion of masstransportation? Yes
Chapter 2, 2-8 to 2-15; Chapter 3, 3-8 to 3-10; Chapter 6, 6-4
4. Does the RTP include a discussion of the regionalairport system?
Yes Chapter 2, 2-22 to 2-23
5. Does the RTP include a discussion of regionalpedestrian needs?
Yes Chapter 2, 2-17 to 2-19; Chapter 6, 6-4 to 6-6
6. Does the RTP include a discussion of regional bicycleneeds?
Yes Chapter 2, 2-15 to 2-19; Chapter 6, 6-4 to 6-6
7. Does the RTP address the California Coastal Trail?(Government Code 65080.1) (For RTPAs located alongthe coast only)
Yes Chapter 2, 2-19
8. Does the RTP include a discussion of railtransportation?
Yes Chapter 2, 2-10 to 2-15; Chapter 6, 6-4
9. Does the RTP include a discussion of maritimetransportation (if appropriate)?
N/A -
10. Does the RTP include a discussion of goodsmovement?
Yes Chapter 3, 3-11 to 3-13
Programming / Operations 1. Is the RTP consistent (to the maximum extent
practicable) with the development of the regional ITSarchitecture? (23 CFR 450.208(g))
Yes Chapter 2, 2-21 to 2-22
2. Does the RTP identify the objective criteria used formeasuring the performance of the transportationsystem?
Yes Chapters 4, 7; Appendix C
3. Does the RTP contain a list of un-constrained projects? Yes Appendix E

Regional Transportation Plan Contents Yes/No Page # Financial
1. Does the RTP include a financial plan that meets therequirements identified in 23 CFR part 450.322(f)(10)(“Should” for RTPAs)?
Yes Chapter 5; Appendix D
2. Does the RTP contain a consistency statement betweenthe first 4 years of the fund estimate and the 4-yearSTIP fund estimate? (Government Code65080(b)(4)(A))
Yes Chapter 5, 5-8
3. Do the projected revenues in the RTP reflect FiscalConstraint? (Government Code 65080(b)(4)(A))
Yes Chapter 5; Appendix D
4. Does the RTP contain a list of financially constrainedprojects? Any regionally significant projects should beidentified. (Government Code 65080(4)(A))
Yes Appendix E, Appendix F
5. Do the cost estimates for implementing the projectsidentified in the RTP reflect “year of expendituredollars” to reflect inflation rates? (23 CFR part450.324(f)(11)(iv)) (“Should” for RTPAs)
Yes Appendix G
6. After 12/11/07, Does the RTP contain estimates of costsand revenue sources that are reasonably expected tobe available to operate and maintain the freeways,highway and transit within the region? (65080(b)(4)(A)(23 CFR 450.324(f)(11)(i))
Yes Chapter 5; Appendix F
7. Does the RTP contain a statement regardingconsistency between the projects in the RTP and theITIP? (2016 STIP Guidelines Section 33)
Yes Chapter 5, 5-8
8. Does the RTP contain a statement regardingconsistency between the projects in the RTP and theRTIP? (2016 STIP Guidelines Section 19)
Yes Chapter 5, 5-8
Environmental
1. Did the RTPA prepare an EIR or a program EIR for theRTP in accordance with CEQA guidelines?
Yes EIR
2. Does the RTP contain a list of projects specificallyidentified as TCMs, if applicable?
Yes Chapter 6, 6-3 to 6-5; Appendix E
3. Does the RTP specify mitigation activities? (23 CFRpart 450.216(k))
Yes Chapter 8, 8-2 to 8-4; EIR
4. Where does the EIR address mitigation activities? Yes EIR Executive Summary 5. Did the RTPA prepare a Negative Declaration or a
Mitigated Negative Declaration for the RTP inaccordance with CEQA guidelines?
No
6. Does the RTP specify the TCMs to be implemented inthe region? (federal nonattainment and maintenanceareas only)
N/A

12/02/2021 (Must be signed by RTPA Executive Director or designated
representative) Date
Guy Preston Executive Director Print Name Title
☐ I have reviewed the above information and certify that it is correct and complete.

Appendix H Resolutions

Resolution to be included with Final 2045 RTP