
2045 San Juan TMA Long Range Multimodal Transportation ...
363
LRTP 2045 2045 San Juan TMA Long Range Multimodal Transportation Plan Puerto Rico Highways and Transportation Authority (PRHTA) December 2018 Final Report
-
Upload
khangminh22 -
Category
Documents
-
view
1 -
download
0
Transcript of 2045 San Juan TMA Long Range Multimodal Transportation ...

LRTP2045
2045 San Juan TMA Long Range Multimodal Transportation PlanPuerto Rico Highways and Transportation Authority (PRHTA)
December 2018Final Report


Prepared by: Strategic Planning Of�ice
Puerto Rico Highway and Transportation Authority Department of Transportation and Public Works
This document is the product of a project �nanced in part by the U.S. Department of Transportation, Federal Highway Administration and Federal Transit Administration. The contents of this report re�ect views of the Puerto Rico Highway and Transportation Authority and the Department of Transportation and Public Works, and do not necessarily re�ect the views or policies of the U.S. Department of Transportation.
Steer has prepared this material for Puerto Rico Highway and Transportation Authority (PRHTA). This material may only be used within the context and scope for which Steer/PRHTA has prepared it. Permission is given to quote and reproduce parts of this document if credit is given to the source. Any person choosing to use any part of this material shall do so within the context and scope of the entire document; failure to do so may deemed to con�rm their agreement to indemnify Steer/PRHTA for all loss or damage resulting from improper use of the document content. Steer/PRHTA have prepared this material using professional practices and procedures using information available to it at the time and as such any new information could alter the validity of the results and conclusions made.
Final Report December 2018 | i
Puerto Rico Highways and Transportation Authority (PRHTA)
2045 San Juan TMA Long Range Multimodal Transportation Plan
Final Report December 2018
23028701
Prepared by: Prepared for:
Steer 1225 Ponce de León Avenue Suite 706 San Juan Puerto Rico 00907
Puerto Rico Highways and Transportation Authority (PRHTA) PO Box 41269, Minillas Station San Juan, PR00940-1269
+1 (787) 721 2002 steergroup.com

Final Report December 2018 | ii
Contents
1 CHAPTER 1 INTRODUCTION ...................................................................................................... 1
BACKGROUND ..................................................................................................................................... 3
PLAN CONTEXT AND IMPORTANCE ..................................................................................................... 5
Plans Considered as Part of the LRTP .......................................................................................... 7
2017 Context ............................................................................................................................... 9
REPORT ORGANIZATION ..................................................................................................................... 9
2 CHAPTER 2 CONTEXT: CURRENT SITUATION ASSESSMENT ....................................................... 10
THE REGION IN BRIEF ........................................................................................................................ 10
LAND USE ........................................................................................................................................... 15
Development and Urbanization ................................................................................................ 15
Land Use Patterns ..................................................................................................................... 19
Environmental Resources .......................................................................................................... 21
DEMOGRAPHICS ................................................................................................................................ 26
Population ................................................................................................................................. 26
Employment .............................................................................................................................. 30
Age ............................................................................................................................................. 37
Housing Type and Household Size ............................................................................................ 44
Puerto Rico Household Travel Survey (PRHTS) ......................................................................... 48
Household Level Demographic Data ..................................................................................... 50
Person Level Demographic Data ........................................................................................... 52
Analysis of Trip Purpose and Frequency ............................................................................... 54
Vehicle Type and Classifications ............................................................................................ 56
Focused Study – Households/People Without Access to Vehicles ....................................... 59
Focused Study – Transportation Affected by Hurricane María ............................................. 62
Forecasting ................................................................................................................................ 66
Forecasting Methodology ..................................................................................................... 68
Population ............................................................................................................................. 69
Employment .......................................................................................................................... 73

Final Report December 2018 | iii
TRANSPORTATION SYSTEM ............................................................................................................... 77
Highways ................................................................................................................................... 77
Roadway System ................................................................................................................... 77
Regional Freight Network ...................................................................................................... 91
Size and Weight Enforcement Program ................................................................................ 98
Transit ...................................................................................................................................... 100
Tren Urbano ........................................................................................................................ 100
Metropolitan Bus Authority (AMA) ..................................................................................... 105
First Transit Operated Routes ............................................................................................. 111
Públicos ............................................................................................................................... 112
Municipal Services ............................................................................................................... 115
Maritime Transportation Authority (MTA).......................................................................... 120
Bicycle and Pedestrian Facilities .............................................................................................. 122
Panoramic Route ..................................................................................................................... 126
Airports, Seaports, and Freight ............................................................................................... 129
Luis Muñoz Marín International Airport (SJU) .................................................................... 129
Fernando Luis Ribas Dominicci Airport (SIG) ....................................................................... 135
Humacao Airport (HUC) ....................................................................................................... 138
Air Passengers Movement Disruption After Hurricanes Irma and María ........................... 139
Port of Yabucoa ................................................................................................................... 146
3 CHAPTER 3 TRANSPORTATION PLANNING PROCESS FOR THE FUTURE ................................... 147
VISION, GOALS AND OBJECTIVES .................................................................................................... 147
Vision ....................................................................................................................................... 147
Goals and Objectives ............................................................................................................... 148
Goal A: To Improve Transportation System’s Performance ................................................ 150
Goal B: Focus on the Environment’s Sustainable Development ......................................... 150
Goal C: Improve Transportation Mobility and Access for the People and for Goods ......... 151
Goal D: Reinforce Economic Vitality .................................................................................... 152
PLANNING FACTORS ........................................................................................................................ 153

Final Report December 2018 | iv
STRATEGIC APPROACH TO TRANSPORTATION PLANNING IN SAN JUAN TMA ............................... 155
Strategies for Transit in San Juan TMA .................................................................................... 155
Provide New Inter-Regional Express Transit Services ......................................................... 155
Provide Enhanced and Improved Local Transit Service ...................................................... 156
Transit Asset Management Plan .......................................................................................... 156
Strategies for the San Juan TMA Roadway Network............................................................... 158
Improve, Rehabilitate and Preserve Existing Roadways ..................................................... 158
Enhance the Strategic Roadway Network and Other Key Roadways .................................. 159
Strategies for Non-Motorized Modes ..................................................................................... 159
Comply with the Complete Streets Plan and Design Guidelines ......................................... 159
Comply with the Comprehensive Bicycle and Pedestrian Plan ........................................... 160
Strategies for Freight ............................................................................................................... 161
Complete and Enhance Freight Network ............................................................................ 161
Strategies for Resilience .......................................................................................................... 161
Vulnerability Assessment .................................................................................................... 162
4 CHAPTER 4 PLANNING PROCESS, PUBLIC INVOLVEMENT, AND NEEDS ASSESSMENT FOR THE 2045 PLAN ........................................................................................................................... 163
PLANNING PROCESS ........................................................................................................................ 163
PUBLIC INVOLVEMENT PROCESS ..................................................................................................... 164
Target Audience ...................................................................................................................... 165
Open Houses ....................................................................................................................... 165
Other Engagement Initiatives .............................................................................................. 173
MODEL DEVELOPMENT AND CALIBRATION .................................................................................... 175
Socioeconomic Inputs – Base Year 2016 Update .................................................................... 176
Stage One – Municipal Methodology .................................................................................. 177
Stage Two – TAZ Specific Adjustment ................................................................................. 178
Overview of Population and Employment Change ............................................................. 178
Socioeconomic Inputs – Forecast Year 2045 ........................................................................... 179
Population and Employment Forecasts .............................................................................. 180
Overview of Population and Employment Change ............................................................. 182

Final Report December 2018 | v
Networks and Analysis ............................................................................................................ 182
TAZ Urban Density ............................................................................................................... 182
Trip Generation ....................................................................................................................... 184
Data Source Updates ........................................................................................................... 184
Re-estimation of Population Synthesizer Models ............................................................... 185
Changes to Trip Balancing Methodology ............................................................................ 185
Validation Factors in Model Update.................................................................................... 185
Truck Trip Generation ......................................................................................................... 186
Validation of Trip Generation Output ................................................................................. 186
Trip Distribution ...................................................................................................................... 187
Gravity Model ...................................................................................................................... 187
Travel Impedances .............................................................................................................. 187
Friction factors: ................................................................................................................... 189
K Factors .............................................................................................................................. 190
Model Validation ................................................................................................................. 191
Time of Day Choice .................................................................................................................. 191
Pre-Mode Choice Time-of-the-Day Trip Distribution .......................................................... 192
Time of Day Distribution for Highway Assignment ............................................................. 192
Mode Choice and Transit Assignment ..................................................................................... 194
Developments for the 2045 LRTP ........................................................................................ 195
Mode Choice ....................................................................................................................... 195
Transit Boardings ................................................................................................................. 198
Highway Path Building and Assignment .................................................................................. 198
Network Updates from 2010 ............................................................................................... 199
Speed and Capacity Estimation ........................................................................................... 202
Toll Variables ....................................................................................................................... 202
Highway Path Building ......................................................................................................... 203
Highway Assignment ........................................................................................................... 203
Calibration ........................................................................................................................... 204

Final Report December 2018 | vi
5 CHAPTER 5 FINANCE ............................................................................................................. 209
CONTEXT .......................................................................................................................................... 209
PRIORITIZATION STRATEGY ............................................................................................................. 210
FINANCIAL SUPPORT FOR DISASTER RECOVERY ............................................................................. 211
FEMA Public Assistance Grants ............................................................................................... 213
FHWA Emergency Relief Assistance ........................................................................................ 213
HUD Community Development Block Grant for Disaster Recovery ........................................ 214
Liquidity Funds: Treasury Disaster Loans ................................................................................ 215
Disaster Recovery and Emergency Relief ................................................................................ 215
SOURCES OF FUNDS ........................................................................................................................ 217
Federal Funds .......................................................................................................................... 217
FHWA Fixing American Surface Transportation Act (FAST-Act) .......................................... 217
FHWA Allocation - Asset Management and 10-year Financial Plan .................................... 219
Discretionary Federal Loan: Transportation Infrastructure Financing and Innovation Act (TIFIA) Discretionary Federal Loan ...................................................................................... 220
Discretionary Federal Grant: INFRA Grants ......................................................................... 220
Matching contribution – Toll Transportation Development Credits (Formerly Toll Revenue Credits) ................................................................................................................................ 221
Local Taxes Dedicated to Transportation and Government Transfers ................................... 222
State Funds Earmarked for Capex ........................................................................................... 222
Toll Rates and Additional Tolling Opportunities ..................................................................... 223
Toll revenues ....................................................................................................................... 223
Toll Highway Administration and Maintenance .................................................................. 223
Potential for Additional Tolling ........................................................................................... 223
P3 Project Investment ............................................................................................................. 223
New Projects ....................................................................................................................... 224
P3 Covering Existing Assets ................................................................................................. 224
Capital Improvement Program (CIP) ....................................................................................... 224
Transportation Asset Management Plan (TAMP) ................................................................... 225
Allocation of Funds - Highways ............................................................................................... 226

Final Report December 2018 | vii
Illustrative Allocation of Funds: State of Good Repair (SGR) .............................................. 226
Illustrative Allocation of Funds: Highways, Bridges ............................................................ 226
Source and Allocation of Capital: Highways FY-2018-2028................................................. 227
Source and Allocation of Capital: Highways Projections FY-2029-2045 ............................. 227
Transit Funds and Capex ......................................................................................................... 231
CAPITAL COST ESTIMATES ............................................................................................................... 233
Context .................................................................................................................................... 233
Approach ................................................................................................................................. 233
Source Data ............................................................................................................................. 233
Project Details ..................................................................................................................... 233
Costs .................................................................................................................................... 233
6 CHAPTER 6 2045 PLAN .......................................................................................................... 235
TESTED SCENARIOS ......................................................................................................................... 235
Freight Network Extension ...................................................................................................... 235
Transit Service Extension......................................................................................................... 241
Roadway Network Vulnerability Assessment.......................................................................... 243
Resilience Component for The Long-Range Transportation Plan ....................................... 243
Vulnerability Analysis Methodology .................................................................................... 248
Bottleneck Analysis ................................................................................................................. 281
Introduction ......................................................................................................................... 281
Methodology ....................................................................................................................... 281
Analysis of Results ............................................................................................................... 282
COST FEASIBILITY PLAN SCENARIOS ................................................................................................ 284
Transportation Funding Summary .......................................................................................... 284
Projects considered ............................................................................................................. 285
2045 Models ............................................................................................................................ 296
2045 No-Build (Do-Nothing Scenario) ................................................................................. 296
2045 Existing and Committed (E+C) Scenario ..................................................................... 298
2045 PR-22 Extension + PR-5 Extension .............................................................................. 303

Final Report December 2018 | viii
7 CHAPTER 7 POLICY GUIDELINES TOWARD THE TRANSPORTATION INFRASTRUCTURE ............. 309
NEW TSM&O TECHNOLOGIES FOR NEXT 5 YEARS .......................................................................... 309
Transportation Systems Management and Operations: Recent ITS Developments and Future Needs ....................................................................................................................................... 309
Deployment of ITS Devices for Traffic Incident Management and Traveler Information Dissemination ...................................................................................................................... 313
Multidisciplinary Transportation Operations – Regional Traffic Management Center....... 314
Travel Time Reliability Improvement .................................................................................. 314
Highway Safety Patrol Program (SEGURO) .......................................................................... 315
Intelligent Mobility and Disruption ..................................................................................... 316
Mode Integration ................................................................................................................ 317
CONGESTION MANAGEMENT PROCESS .......................................................................................... 319
Congestion Management System ........................................................................................... 319
FREIGHT ........................................................................................................................................... 320
2045 LRTP ................................................................................................................................ 320
National Multimodal Freight Network ................................................................................ 322
Establishment of Interim Network ...................................................................................... 322
Other Freight Provisions ...................................................................................................... 322
State Freight Plans ............................................................................................................... 323
SAFETY AND SECURITY .................................................................................................................... 325
Safety ....................................................................................................................................... 325
Security .................................................................................................................................... 326
ENVIRONMENT AND SUSTAINABILITY ............................................................................................. 326
Overview ................................................................................................................................. 326
Sustainability and the Environment ......................................................................................... 327
Air Quality ............................................................................................................................ 327
Climate Change.................................................................................................................... 329
Environmental Management and Mitigation ...................................................................... 332
Congestion Management Process ....................................................................................... 333
Social Sustainability ................................................................................................................. 333

Final Report December 2018 | ix
Livability ............................................................................................................................... 333
Transportation Demand Management ............................................................................... 334
Transportation - Land Use Linkage and Scenario Analysis .................................................. 336
Public Health ....................................................................................................................... 337
Economic Sustainability ........................................................................................................... 338
LOOKING FORWARD ........................................................................................................................ 339
Figures Figure 1.1: Planning Steps ................................................................................................................... 2
Figure 2.1: Seven Regions in Puerto Rico .......................................................................................... 12
Figure 2.2: San Juan TMA .................................................................................................................. 14
Figure 2.3: San Juan TMA Urbanized Areas, 1990 ............................................................................. 16
Figure 2.4: San Juan TMA Urbanized Areas, 2000 ............................................................................. 17
Figure 2.5: San Juan TMA Urbanized Areas, 2016 ............................................................................. 18
Figure 2.6: San Juan TMA Land Uses ................................................................................................. 20
Figure 2.7: Environmentally Sensitive Areas ..................................................................................... 23
Figure 2.8: Protected Forests and Reserves ...................................................................................... 24
Figure 2.9: Coverage of Environmental Features .............................................................................. 25
Figure 2.10: Puerto Rico Historic Population .................................................................................... 26
Figure 2.11: Comparison Puerto Rico vs San Juan TMA – Population .............................................. 27
Figure 2.12: San Juan TMA Population 2016 ..................................................................................... 28
Figure 2.13: Comparison Puerto Rico vs San Juan TMA – Employment ........................................... 31
Figure 2.14: San Juan TMA Employment 2016 .................................................................................. 32
Figure 2.15: Comparison Puerto Rico vs. San Juan TMA – Unemployment Rate ............................. 34
Figure 2.16: Unemployed (In Labor Force) Population ..................................................................... 34
Figure 2.17: San Juan TMA Unemployment Rate 2016 ..................................................................... 35
Figure 2.18: Participation Rate in Labor Force .................................................................................. 36
Figure 2.19: Age Distribution for Puerto Rico ................................................................................... 38
Figure 2.20: Comparison San Juan TMA population Older vs. Younger ............................................ 39
Figure 2.21: San Juan TMA Aging Index 2010-2016 .......................................................................... 39

Final Report December 2018 | x
Figure 2.22: Aging Index by Municipality: 2016 ................................................................................ 40
Figure 2.23: Median Age in San Juan TMA ........................................................................................ 41
Figure 2.24: Median Age by Gender .................................................................................................. 42
Figure 2.25: San Juan TMA Median Age 2016 ................................................................................... 43
Figure 2.26: Comparison PR vs. San Juan TMA – Total Households ................................................. 44
Figure 2.27: Comparison PR vs. San Juan TMA – Owner-Occupied .................................................. 45
Figure 2.28: Comparison PR vs. San Juan TMA – Renter-Occupied .................................................. 45
Figure 2.29: Comparison PR vs. San Juan TMA – 1-Unit, Detached .................................................. 46
Figure 2.30: Comparison PR vs. San Juan TMA – Average Household Size ....................................... 46
Figure 2.31 San Juan TMA Population Distribution by Gender ......................................................... 48
Figure 2.32: San Juan TMA Population Distribution by Age Brackets ............................................... 49
Figure 2.33: San Juan TMA Distribution by Employment/Student Status ........................................ 49
Figure 2.34: San Juan Household Distribution by Home Ownership Status ..................................... 50
Figure 2.35: San Juan TMA Household Distribution by Household Size ........................................... 51
Figure 2.36: San Juan TMA Household Distribution by Vehicle Ownership ...................................... 51
Figure 2.37: San Juan TMA Household Distribution by Household Type .......................................... 52
Figure 2.38: San Juan TMA Household Distribution by Household Income Brackets ....................... 52
Figure 2.39: San Juan TMA Population Distribution by Education Level .......................................... 53
Figure 2.40: San Juan TMA Employed Population Distribution by Industry ..................................... 53
Figure 2.41: San Juan TMA Employed Population Distribution by Resident Status .......................... 54
Figure 2.42: San Juan TMA Trip Distribution by Transportation Mode ............................................ 55
Figure 2.43: San Juan TMA Trip Distribution by Trip Purpose ........................................................... 55
Figure 2.44: San Juan TMA Trip Distribution by Trip Frequency Per Week ...................................... 56
Figure 2.45: San Juan TMA Vehicle Distribution by Brand ................................................................ 57
Figure 2.46: San Juan TMA Vehicle Distribution by Model Year ....................................................... 57
Figure 2.47: San Juan TMA Vehicle Distribution by Vehicle Type ..................................................... 58
Figure 2.48: San Juan TMA Vehicle Distribution by Primary User..................................................... 58
Figure 2.49: San Juan TMA Vehicle Distribution by Parking Status ................................................... 59
Figure 2.50: San Juan TMA Population Distribution, Persons Without Owned Vehicles, by Gender ........................................................................................................................................................... 60

Final Report December 2018 | xi
Figure 2.51: San Juan TMA Population Distribution, Persons Without Owned Vehicles, by Age Bracket ............................................................................................................................................... 60
Figure 2.52: San Juan TMA Population Distribution, Persons Without Owned Vehicles, by Employment/Student Status ............................................................................................................. 61
Figure 2.53: San Juan TMA Trip Distribution, Persons Without Owned Vehicles, by Transportation Mode ................................................................................................................................................. 61
Figure 2.54: San Juan TMA Trip Distribution, Persons Without Owned Vehicles, by Trip Purpose .. 62
Figure 2.55: San Juan TMA Trip Distribution, Persons Without Owned Vehicles, by Trip Frequency Per Week ........................................................................................................................................... 62
Figure 2.56: San Juan TMA Trip Distribution by “Was Trip and/or Transportation Mode Affected by Hurricane María” ............................................................................................................................... 63
Figure 2.57: San Juan TMA Population Distribution, People with Trips Affected by Hurricane María, by Gender .......................................................................................................................................... 63
Figure 2.58: San Juan TMA Population Distribution, People with Trips Affected by Hurricane María, by Age Bracket ................................................................................................................................... 64
Figure 2.59: San Juan TMA Population Distribution, People with Trips Affected by Hurricane María, by Employment/Student Status ........................................................................................................ 64
Figure 2.60: San Juan TMA Trip Distribution, Trips Affected by Hurricane María, by Transportation Mode ................................................................................................................................................. 65
Figure 2.61: San Juan TMA Trip Distribution, Trips Affected by Hurricane María, by Trip Purpose . 65
Figure 2.62: San Juan TMA Trip Distribution, Trips Affected by Hurricane María, by Trip Frequency Per Week ........................................................................................................................................... 66
Figure 2.63: Puerto Rico Average Weekly Wages (Constant 2010 Prices) ........................................ 67
Figure 2.64: Population Forecasts – San Juan TMA .......................................................................... 69
Figure 2.65: San Juan TMA Population 2045 ..................................................................................... 71
Figure 2.66: San Juan TMA Population Change 2016-2045 .............................................................. 72
Figure 2.67: Indexed Employment Forecasts – San Juan TMA – Indexed Growth (Index = 2010) .... 74
Figure 2.68: San Juan TMA Employment 2045 .................................................................................. 75
Figure 2.69: San Juan TMA Employment Change 2016-2045 ........................................................... 76
Figure 2.70: San Juan Region Roadways by NHS identification ........................................................ 81
Figure 2.71: San Juan Region Roadways by Functional Classification ............................................... 82
Figure 2.72: San Juan Region Roadways (Central Area) .................................................................... 83
Figure 2.73: San Juan TMA Traffic Volumes 2016 ............................................................................. 87

Final Report December 2018 | xii
Figure 2.74: San Juan TMA Central Area Traffic Volumes 2016 ........................................................ 88
Figure 2.75: San Juan TMA Levels of Service 2016; Average Day ..................................................... 89
Figure 2.76: San Juan TMA Central Area Levels of Service 2016; Average Day ................................ 90
Figure 2.77: San Juan TMA Freight Network ..................................................................................... 92
Figure 2.78: San Juan TMA Freight Network Central Area ................................................................ 93
Figure 2.79: San Juan TMA Existing Truck Activity ............................................................................ 94
Figure 2.80: San Juan TMA Existing Truck Activity-Central Area ....................................................... 95
Figure 2.81: San Juan TMA Freight Network Hotspots ..................................................................... 96
Figure 2.82: San Juan TMA Freight Network Hotspots Central Area ................................................ 97
Figure 2.83: Semi Permanents Weighing Stations in San Juan TMA ................................................. 99
Figure 2.84: Tren Urbano Alignment ............................................................................................... 103
Figure 2.85: Average Daily Ridership – Tren Urbano ...................................................................... 104
Figure 2.86: AMA Fixed Route Bus Routes ...................................................................................... 109
Figure 2.87: Ridership, Hours and Mileage – First Transit .............................................................. 112
Figure 2.88: Público Routes in Puerto Rico ..................................................................................... 113
Figure 2.89: Público Routes in the San Juan TMA ........................................................................... 114
Figure 2.90: Municipal Services Annual Ridership .......................................................................... 117
Figure 2.91: Municipalities with a Transit Service in Puerto Rico ................................................... 118
Figure 2.92: Municipalities with Transit Services within San Juan TMA ......................................... 119
Figure 2.93: Existing Transit Routes: Cataño – Old San Juan Ferry ................................................. 121
Figure 2.94: Bicycle Facilities by Region – San Juan TMA................................................................ 123
Figure 2.95: San Juan TMA Bicycle and Pedestrian Conceptual Network 2045 .............................. 125
Figure 2.96: Panoramic Route ......................................................................................................... 128
Figure 2.97: San Juan TMA Airports and Seaports .......................................................................... 130
Figure 2.98: SJU Passengers Departure versus Arrival .................................................................... 131
Figure 2.99: SJU Domestic versus International Passengers in 2016 .............................................. 132
Figure 2.100: Domestic versus International Passengers – SJU ...................................................... 132
Figure 2.101: Flights’ Departure versus Arrival ............................................................................... 133
Figure 2.102: Domestic versus International Flights in 2016 .......................................................... 133
Figure 2.103: Domestic versus International Flights – SJU ............................................................. 134

Final Report December 2018 | xiii
Figure 2.104: SJU Landed Weights .................................................................................................. 135
Figure 2.105: Passengers Departure versus Arrival ........................................................................ 136
Figure 2.106: Flights’ Departure versus Arrival ............................................................................... 137
Figure 2.107: Cargo Movement – SIG ............................................................................................. 137
Figure 2.108: Passengers – HUC ...................................................................................................... 138
Figure 2.109: Number of Arrivals and Departures of Puerto Rico Air Passengers in Domestic Flights and Domestic Airlines ...................................................................................................................... 139
Figure 2.110: Total Passengers – Port of San Juan .......................................................................... 141
Figure 2.111: Home Port vs. In Transit Passengers – Port of San Juan ........................................... 141
Figure 2.112: Total Trade (Imports and Exports) in Twenty-Foot Equivalent Units (TEUs) - Loaded Containers Only – Port of San Juan ................................................................................................. 142
Figure 2.113: Total Vessel Calls – Port of San Juan ......................................................................... 145
Figure 2.114: Puerto Rico General Imports - Puerto Rico Customs District of Unlading and Puerto Rico Exports - Domestic and Foreign Merchandise ......................................................................... 145
Figure 4.1: LRTP Committees .......................................................................................................... 165
Figure 4.2: Open House – San Juan TMA (Humacao) ...................................................................... 166
Figure 4.3: Total participation First Round Open Houses ............................................................... 167
Figure 4.4: Informative Boards ........................................................................................................ 168
Figure 4.5: Participants Regular Trips Before and After Hurricane María – San Juan TMA ............ 169
Figure 4.6: Transportation Investment ........................................................................................... 170
Figure 4.7: Second Open House – San Juan TMA Region (Sagrado Corazón) ................................. 170
Figure 4.8: Total Participation Second Round Open Houses ........................................................... 171
Figure 4.9: Example of the Presentation ......................................................................................... 172
Figure 4.10: Transportation Strategies ............................................................................................ 173
Figure 4.11: LRTP Model Structure.................................................................................................. 176
Figure 4.12: Population and Employment Change at the TAZ level, 2010 – 2016 .......................... 179
Figure 4.13: Area Types – San Juan TMA ........................................................................................ 183
Figure 4.14: Comparison of Friction Factors of Low Income HBW Trips (2040 LRTP vs. 2045 LRTP) ......................................................................................................................................................... 189
Figure 4.15: Comparison of Friction Factors of Medium Income HBW Trips (2040 LRTP vs. 2045 LRTP) ................................................................................................................................................ 190

Final Report December 2018 | xiv
Figure 4.16: Comparison of Friction Factors of High Income HBW Trips (2040 LRTP vs. 2045 LRTP) ......................................................................................................................................................... 190
Figure 4.17: Comparison of Time-of-Day Demand Distribution (2016 vs. 2010) - Auto Trips ........ 194
Figure 4.18: Comparison of Time-of-Day Demand Distribution (2016 vs. 2010) - Truck Trips ....... 194
Figure 4.19: Mode Choice Validation – Island-wide by Time of Day ............................................... 196
Figure 4.20: Mode Choice Validation – San Juan and Rest of Puerto Rico – Peak period .............. 197
Figure 4.21: Mode Choice Validation – San Juan and Rest of Puerto Rico – Off-peak period ........ 198
Figure 4.22: PR-66 Extension from PR-188 to PR-3 ......................................................................... 200
Figure 4.23: New Dynamic Toll Lanes on PR-22 .............................................................................. 201
Figure 4.24: San Juan TMA Counts Locations .................................................................................. 206
Figure 4.25: TMC’s Location ............................................................................................................ 207
Figure 5.1: Overview of capex prioritization ................................................................................... 210
Figure 5.2: Funding Sources: Long Range Outlook ......................................................................... 218
Figure 6.1: Freight Network ............................................................................................................ 237
Figure 6.2: BRT San Juan - Caguas ................................................................................................... 242
Figure 6.3: Puerto Rico Hurricane Map ........................................................................................... 244
Figure 6.4: Hurricane María Best Track ........................................................................................... 245
Figure 6.5: Historical Monthly Precipitations (1981-2010) – All Stations ....................................... 246
Figure 6.6: Affected roads by María Hurricane ............................................................................... 247
Figure 6.7: Examples Of effects of Hurricane María on the roadway network ............................... 248
Figure 6.8: Relevant Segments Identified by Stakeholders ............................................................. 251
Figure 6.9: Components of vulnerability ......................................................................................... 252
Figure 6.10: Hurricane María Average Flood Hazard ..................................................................... 254
Figure 6.11: Intensive Flood Hazard ................................................................................................ 255
Figure 6.12: Average Flood Hazard ................................................................................................. 256
Figure 6.13: Coastal Flood Hazard Map .......................................................................................... 257
Figure 6.14: Hurricane María Predicted Landslides ........................................................................ 258
Figure 6.15: Average Predicted Landslides ..................................................................................... 259
Figure 6.16: Vulnerability Index for Relevant Assets ...................................................................... 261
Figure 6.17: Prioritized Segments ................................................................................................... 263

Final Report December 2018 | xv
Figure 6.18: PR-20 Guaynabo .......................................................................................................... 267
Figure 6.19: PR-31: Las Piedras ....................................................................................................... 268
Figure 6.20: PR-172: Cidra/Caguas .................................................................................................. 269
Figure 6.21: PR-31 Naguabo ............................................................................................................ 270
Figure 6.22: PR-143: Orocovis / Barranquitas ................................................................................. 271
Figure 6.23: PR-2 Guaynabo ............................................................................................................ 272
Figure 6.24: PR-185: Canóvanas / Juncos ........................................................................................ 273
Figure 6.25: PR-869: Cataño ............................................................................................................ 274
Figure 6.26: PR-186: Canóvanas ...................................................................................................... 275
Figure 6.27: PR-3: Humacao ............................................................................................................ 276
Figure 6.28: PR-26: San Juan ........................................................................................................... 277
Figure 6.29: PR-146: Ciales .............................................................................................................. 278
Figure 6.30: Av. De Diego: San Juan ................................................................................................ 279
Figure 6.31: PR-2: Vega Baja ........................................................................................................... 280
Figure 6.32: San Juan TMA,Top Bottleneck Locations .................................................................... 283
Figure 6.33: 2045 Traffic on The Existing Plus Committed Network ............................................... 299
Figure 6.34: 2045 Traffic on The Existing Plus Committed Network Central Area ......................... 300
Figure 6.35: 2045 Traffic Service on the Existing Plus Committed Network ................................... 301
Figure 6.36: 2045 Traffic Service on the Existing Plus Committed Network Central Area .............. 302
Figure 6.37: 2045 Traffic on the Existing Plus Committed Strategic Projects PR-22 & PR-5 ........... 305
Figure 6.38: 2045 Traffic on the Existing Plus Committed Strategic Projects PR-22 & PR-5 Central Area ................................................................................................................................................. 306
Figure 6.39: 2045 Traffic Service on the Existing Plus Committed Strategic Projects PR-22 & PR-5 ......................................................................................................................................................... 307
Figure 6.40: 2045 Traffic Service on the Existing Plus Committed Strategic Projects PR-22 & PR-5 Central Area ..................................................................................................................................... 308
Figure 7.1: TSM&O Program Development Timeline ...................................................................... 310
Figure 7.2: Additions to Freight Network – San Juan TMA ............................................................. 324
Tables Table 2.1: San Juan TMA Population 2000-2010-2016 ..................................................................... 29

Final Report December 2018 | xvi
Table 2.2: San Juan TMA Employment by Place of Work 2010-2016 ............................................... 33
Table 2.3: Unemployed (In Labor Force) Population by Municipality ............................................... 36
Table 2.4: San Juan TMA and Puerto Rico Employment (2010 and 2016) ........................................ 37
Table 2.5: Highest Aging Index in San Juan TMA: 2016 ..................................................................... 41
Table 2.6: Lowest Aging Index in PR: 2016 ........................................................................................ 41
Table 2.7: Highest Median Age in San Juan TMA - 2016 ................................................................... 42
Table 2.8: Lowest Median Age in San Juan TMA - 2016 .................................................................... 42
Table 2.9: San Juan TMA – 2016 Total and Occupied Housing Units and Average Household Size . 47
Table 2.10: Population Forecast Growth Rates – San Juan TMA ...................................................... 70
Table 2.11: Employment Forecast Growth Rates – San Juan TMA ................................................... 74
Table 2.12: Roadway System by Functional Classification – Puerto Rico ......................................... 77
Table 2.13: Bridges Over Waterways with Reported Damages due to María in San Juan TMA ....... 84
Table 2.14: Closed Bridges Due to Collapse ...................................................................................... 85
Table 2.15: Bridges with Failure in Approach Roadways / Slab ........................................................ 85
Table 2.16: LOS Criteria as a Function of Volume Capacity Ratio ..................................................... 86
Table 2.17: Gross Domestic Product and Labor Force Composition by Economic Sector ................ 91
Table 2.18: Semi-Permanent Weighting Stations in San Juan TMA .................................................. 98
Table 2.19: 2016 Average Daily Boarding by Station – Tren Urbano .............................................. 104
Table 2.20: May 2016 Daily Passengers – AMA .............................................................................. 110
Table 2.21: Percent Change of Annual Unlinked Trips for Públicos from 2010 to 2016 ................ 115
Table 2.22: Municipalities with a Transit Service in Puerto Rico .................................................... 116
Table 2.23: San Juan TMA Most Used Roads for Walking ............................................................... 122
Table 2.24: San Juan TMA Most Used Roads for Cycling ................................................................ 123
Table 2.25: Panoramic Route Municipalities ................................................................................... 127
Table 2.26: Impact of Hurricanes Irma and María on the Air Passengers Traffic of Puerto Rico .... 140
Table 2.27: Ranking of U.S. Customs Districts by Volume of Cargo (Metric Tons, 000s) in 2016 ... 143
Table 2.28: Ranking of U.S. Customs Districts by Value of Cargo (Millions of 2016 U.S. Dollars) in 2016 ................................................................................................................................................. 144
Table 3.1: 2045 LRTP’s Goals and Objectives .................................................................................. 149
Table 3.2: Relation between Planning Factors and 2045 LRTP Goals ............................................. 154
Final Report December 2018 | xvii
Table 4.1: Transportation Issues ..................................................................................................... 169
Table 4.2: Engagements Initiatives .................................................................................................. 173
Table 4.3: Socioeconomic Variable Adjustment by Municipality with Explanation and Source ..... 177
Table 4.4: Socioeconomic Variable Adjustment by TAZ with Explanation and Source ................... 178
Table 4.5: Population and Employment –2045 LRTP Base Year 2016 ............................................. 178
Table 4.6: Socioeconomic Variable Adjustment by Municipality, Explanation, and Source ........... 181
Table 4.7 Population and Employment Change in San Juan TMA, Base Year 2016 – Forecast Year 2045 ................................................................................................................................................. 182
Table 4.8: Urban Density Area Types .............................................................................................. 182
Table 4.9: Components of Trip Generation Model ......................................................................... 184
Table 4.10: Region-Specific Trip Generation Factors ...................................................................... 186
Table 4.11: Truck Trip Generation Factors ...................................................................................... 186
Table 4.12: Comparison of Person Trip Shares and Total Trips per Household to Florida DOT Validation Standards ....................................................................................................................... 186
Table 4.13: Value of Time ($/hour, in 2016$) ................................................................................. 188
Table 4.14: Vehicle Operating Cost ($/mile, in 2016$) ................................................................... 188
Table 4.15: Coefficient of Gamma Functions of HBW Trips ............................................................ 189
Table 4.16: K Factors for 2045 LRTP Model..................................................................................... 191
Table 4.17: Daily to Peak and Off-peak Factors .............................................................................. 192
Table 4.18: Hourly to Period Capacity Factors ................................................................................ 192
Table 4.19: Peak to AM and PM Factors ......................................................................................... 193
Table 4.20: Off-peak to MD and NT Factors: ................................................................................... 193
Table 4.21: Target Mode Share Evolution. ...................................................................................... 195
Table 4.22: Island-wide Mode Choice Results by Purpose and by Period ...................................... 197
Table 4.23: Passenger Car Equivalents (PCEs) used in PR LRTP Model ........................................... 203
Table 5.1: Sources of funding for disaster recovery ........................................................................ 212
Table 5.2: Disaster recovery funding and expenditure FY-2018 - FY2021 ..................................... 216
Table 5.3: Notional Allocation of CIP Budget by Highway Classification ........................................ 225
Table 5.4: Target Standards and Actual Condition (Pre-María) ...................................................... 225
Table 5.5: State of Good Repair and Safety Project FY-2019-2028 – Balanced Scenario (Costs in $000)................................................................................................................................................ 228

Final Report December 2018 | xviii
Table 5.6: Highways – Source and Application of Funds 2018-2028 (All Figures in $000 at 2018 Prices) .............................................................................................................................................. 229
Table 5.7: Highways – Source and Application of Funds 2029-2045 (All Figures in $000 at 2018 Prices) .............................................................................................................................................. 230
Table 5.8: Transit – Source and Application of Funds (All Figures in $000 at 2018 Prices) ............ 232
Table 6.1: New Freight Corridors .................................................................................................... 236
Table 6.2: Improved Freight Corridors ............................................................................................ 236
Table 6.3: Truck VMT by Vehicle Class and by Road Type .............................................................. 239
Table 6.4: Truck VHT by Vehicle Class and by Road Type ............................................................... 239
Table 6.5: San Juan TMA Measures of Effectiveness for Freight Scenario ..................................... 240
Table 6.6: Summary of Transit Scenarios in San Juan TMA ............................................................. 243
Table 6.7: Prioritized Segments Assessment ................................................................................... 264
Table 6.8: Forecast of Regional Transportation Funds and Allocation ($000s, 2018 prices) .......... 285
Table 6.9: List of San Juan TMA projects in STIP Short Term (2017-2020) ..................................... 288
Table 6.10: List of Island-wide projects in STIP Short Term (2017-2020) ....................................... 289
Table 6.11: List of San Juan TMA Bridge Projects STIP (2017-2020) ............................................... 291
Table 6.12: List of San Juan TMA Safety Projects STIP (2017-2020) ............................................... 292
Table 6.13: List of Island-wide Safety Projects STIP (2017-2020) ................................................... 293
Table 6.14: List of San Juan TMA Committed Projects; Mid Term (2021-2030) ............................. 293
Table 6.15: List of Island-wide Committed Projects; Mid Term (2021-2030) ................................. 294
Table 6.16: List of San Juan TMA Committed Projects; Mid to Long Term (2031-2040) ................ 294
Table 6.17: List of San Juan TMA Committed Projects; Long Term (2041-2045) ............................ 295
Table 6.18: Summary of 2045 No-Build Scenario in San Juan TMA ................................................ 297
Table 6.19: Committed Projects reflected in the 2045 modeling ................................................... 298
Table 6.20: Summary of 2045 Scenarios in San Juan TMA .............................................................. 304
Table 7.1: PR-26 Sample ITS Devices Deployment .......................................................................... 313
Table 7.2: Benefits of Managed Lanes over General Purpose Lanes .............................................. 314
Table 7.3: DTL Project Sample ITS Devices ...................................................................................... 315
Table 7.4: Relation between Planning Factors and 2045 LRTP Goals ............................................. 320
Table 7.5: TDM Strategies ............................................................................................................... 335

Final Report December 2018 | xix
Table 7.6: TDM – Related Projects in Puerto Rico ........................................................................... 336
Appendices
A Review Results, Data Requirements and Model Findings
B Population and Employment Forecasting
C Comprehensive Bicycle and Pedestrian Plan for Puerto Rico
D Complete Streets Plan and Design Guidelines
E Public Involvement Plan
F Model Development and Calibration
G Model Network Comparison
H Finance
I Resilience Component for The Long-Range Transportation Plan
J Illustrative Projects
K Bottleneck Analysis
L Puerto Rico Household Travel Survey
M Detailed Map

CHAPTER 1 INTRODUCTION
Final Report December 2018 | 1
This report presents the 2045 Long Range Multimodal Transportation Plan (2045 LRTP) for the San Juan Transportation Management Area (San Juan TMA). This chapter is divided into 3 sections:
1. Background;2. Plan Context and Importance; and3. Report Organization.
The Puerto Rico Department of Transportation and Public Works (DTPW) and the Puerto Rico Highway and Transportation Authority (PRHTA) acting as the Puerto Rico Metropolitan Planning Organization (MPO) elaborated the 2045 Long Range Multimodal Transportation Plans (LRTP) consisting of two documents for the Transportation Management Areas (TMAs) for San Juan and Aguadilla, one for the Island-wide Transportation Plan, and one for the Transportation Plan for other urbanized Regions of less than 200,000 inhabitants (includes five transportation planning Regions) as required by federal regulations (23 U.S.C 134 and 135; 42 U.S.C. 7410 et seq.; 49 U. S. C. 5303 and 5304). This document represents the San Juan TMA 2045 LRTP.
San Juan TMA is the regional core of economic activity in Puerto Rico where more than 60% of the total population lives and works in the Island. Although the Region had experienced a significant decrease in population (an overall decrease of 1.6% from 2000 to 2010 and 8.2% from 2010 to 2016), it still exhibits congestion and delays. San Juan is among the top 20 urbanized area in the mainland United States with higher travel time index since 2003, ranking 14th in 20141
.
This 2045 LRTP updating process had been characterized by important challenges conforming the transportation infrastructure and its vision of developing livable and economic competitive Island. The PR MPO and its transportation agencies considered the Puerto Rico Oversight, Management, and Economic Stability Act (PROMESA), a 2016 federal law that established an oversight board, and procedures for approving critical infrastructure projects to improve the Puerto Rican government-debt crisis. As a result, the certified Fiscal Plan for the PRHTA was considered as the financial basis of this analysis. The investment plan for infrastructure in this 2045 LRTP is thus, fiscally constraint to current Puerto Rico financial and fiscal conditions.
1 Urban Mobility Report (Scorecard), Texas A&M Transportation Institute.
1 CHAPTER 1 INTRODUCTION

CHAPTER 1 INTRODUCTION
Final Report December 2018 | 2
On the other hand, the Island experienced hurricanes Irma and María impacting significantly the road infrastructure around the Island in August 2017. The 2045 Plan included a component of vulnerability analysis for resilient infrastructure integrated to assess risk of the transportation system’s conditions during and after extreme weather events. Although the specific project investment for resilient conditions needs further analysis, the 2045 Plan establishes a policy to prioritize these efforts toward reducing vulnerability in all Regions including in San Juan TMA Region.
This document reports the planning process in the following steps as set out in Figure 1.1.
Figure 1.1: Planning Steps
Source: SDG and PRHTA
Public participation is fundamental throughout the whole process in defining the vision and reviewing the order of importance of the goals and objectives for participants. The goals and objectives allowed to define the key performance indicators and weights to prioritize and establish a ranking for the list of requested projects. The representation of the extended stakeholders was done throughout pre-defined Committees.
The 2045 LRTP for San Juan TMA presents challenges and opportunities in infrastructure investment along a long-range period. This 2045 LRTP follows a performance-based planning process according to federal regulations with an average annual investment of $341M in Puerto Rico from Fiscal Year (FY)2020 until FY2045 with a firm commitment with national goals of reducing fatalities, an unprecedent emphasis on pavement and bridges preservation and rehabilitation in order to upgrade its conditions, improve freight mobility, as well as reduce congestion.

CHAPTER 1 INTRODUCTION
Final Report December 2018 | 3
BACKGROUND Since Congress’s passage of the Intermodal Surface Transportation Efficiency Act (ISTEA) in 1991, and through to the Fixing America's Surface Transportation (FAST) Act, the planning process in Puerto Rico has strived to be a comprehensive framework for making transportation investment decisions in the TMAs and Island-wide. The DTPW is the designated MPO for all urbanized areas and Island-wide. As such, it is ultimately responsible for and compliance with the US Department of Transportation (DOT) statutory requirements under the FAST-Act, and with the Rule Makings and Policy Guidance of the Federal Highway Administration (FHWA) and the Federal Transit Administration (FTA). The DTPW carries out its responsibilities as a MPO2 through Public Policy Committees whose members are the Mayors of the municipalities under the planning designation, as well as the heads of all agencies that have transportation, land use and planning tasks:
• Planning Board (PB);• Department of Environmental and Natural Resources (DENR);• Environmental Quality Board (EQB);• Puerto Rico Integrated Transit Authority (PRITA);• Public Service Commission (PSC);• Metropolitan Bus Authority (AMA);• Puerto Rico Highway and Transportation Authority (PRHTA);• Ports Authority (PA);• Maritime Transportation Authority (MTA); and• Permissions Management Office (PMO).
Additionally, the MPO encompasses Technical Committees that develop and manage federal and local programs, plans and certifications that are ultimately considered for approval by the Public Policy Committees and adopted by the MPO.
Under this institutional framework, the PRHTA staff carries out the day-to-day workings of the MPO including the oversight of the timely preparation of the LRTP. The 2040 LRTP is valid until December 2018, when an updated 2045 LRTP will be required. The 2045 LRTP must be approved in order to set out the planning framework for all transportation projects (including all modes) for Puerto Rico considering the two-large population TMAs: San Juan and Aguadilla; and the five smaller population TPRs comprising nine other Urbanized Areas; as set out here:
• San Juan Transportation Management Area (TMA);• Aguadilla Transportation Management Area (TMA); and• Transportation Planning Regions:
• East Region:- Fajardo Urbanized Area;
• North Region:- Arecibo Urbanized Area; and- Florida- Barceloneta Urbanized Area.
2 Metropolitan Planning Organization means the policy board of an organization created and designated to carry out the metropolitan transportation planning process, according to regulations (23 CFR §450.104).

CHAPTER 1 INTRODUCTION
Final Report December 2018 | 4
• Southeast Region:- Guayama Urbanized Area.
• South Region:- Ponce Urbanized Area;- Juana Díaz Urbanized; and- Yauco Urbanized Area.
• Southwest Region:- Mayagüez Urbanized Area; and- San Germán-Cabo Rojo Urbanized Area.
The 2040 plan considered the planning factors required by MAP-21 (the previous federal surface transportation funding and authorization legal framework). It recognized the “Planes de Ordenamiento Territorial” (POTs), local Environmental Laws, addressed the principles of environmental justice, and considered ongoing capital plans and projects, among many other elements, to propose, evaluate and identify future investments in mobility systems in a multimodal approach. It also considered Performance-based Planning and Programming (PBPP). Significant Island-wide projects related to highways, non-motorized facilities, ports and airports are considered in the 2040 LRTP.
The updated 2045 LRTP considered these aspects and additional key issues as set out by the new federal legislation (FAST-Act) and the local public policy (Law 201 of 20103 , Law 74 of 1965 as amended by Law 97 of 20124 and Law 225) including a wider emphasis on non-motorized modes, complete streets, freight mobility, livability, resilience infrastructure, reliability, environment, energy, tourism considerations, and principles of sustainability and smart growth. The new plan must also involve stakeholders and residents seeking social consensus through a communications strategy that aligns aspirations and policies with realistic opportunities for investment and improvements. In order to successfully have the insight from community stakeholders, the plan included comprehensive Public Involvement Process (PIP) including open houses with a more dynamic approach of going to where the people are, committee’s meetings, surveys and social media.
Considering the economic situation in Puerto Rico and the fact that the Island is facing an aging population trend, the new Plan and model paid closer attention to system preservation (considering the Asset Management Plan), the integration of alternative transportation modes and their infrastructure requirements including public transit, non-motorized modes facilities and an overall Complete Streets approach (considering the local public policy).
3 Law 201, 2010 to declare the public policy regarding the adoption of the concept of Complete Streets. 4 Law 74 of the 23 of June 1965, PRHTA Law (“Ley de la Autoridad de Carreteras y Transportación de Puerto Rico”) amended by Law 97 in 2012 to include a disposition of adding a fence to all bridges with pedestrian facilities. 5 Vehicle and Traffic Law of Puerto Rico, as amended by Law 132 of June 3, 2004 which includes the Charter of rights and obligations of cyclists and drivers.

CHAPTER 1 INTRODUCTION
Final Report December 2018 | 5
In the same context, the continuation of migration patterns exacerbated by the hurricanes Irma and María, that affected the local area in September 2017, required a strong socio-economic forecasting team that was able to rigorously-model, thoroughly thought-out scenarios to set the basis for the modeling strategy based on a well informed and researched approach in order to ensure local and federal approval of the employment and population projections.
Through the LRTP planning process, the mission, vision and development of transportation system in Puerto Rico was updated and reevaluated for the next 27 years (2045). This updated 2045 LRTP performed studies regarding to journeys and travel patterns to the whole Island in order to assess infrastructure needs, define projects to invest for construction and development over a planning period of 5 years.
The multimodal transportation system in Puerto Rico encompasses highway and roadways networks, airports, ferry systems and seaports. These facilities provide travel options for people and freight movement.
The proper calibration of a model representing this system is highly dependent on the availability of data used as inputs to the model. The modelling approach took advantage of the wealth of travel pattern information available from cell phone and Global Positioning System (GPS) sources.
The vision, goals, objectives and priorities of the LRTP influence different planning efforts and programs. The basis for the definition of these was the 2040 document, strengthened by more in-depth consideration of resilience, alternative modes of transportation, freight, intermodal improvement opportunities, and Intelligent Transportation System (ITS) technologies. Additional scope in the planning effort is to support the economic vitality of the Regions, increase safety, and promote the effective use of existing infrastructure.
The development of the LRTP followed well-established regulations and guidelines from both the Federal and the Commonwealth Governments and their agencies (FHWA, FTA, PRHTA and others). The Plan development is viewed as a continuing, cooperative and comprehensive process involving on-going communications with the public, stakeholders and responsible government officials.
PLAN CONTEXT AND IMPORTANCE In order to fulfill main elements of a performance-based transportation plan the following were considered throughout the 2045 LRTP development process:
• Performance measures, targets, system performance reports, and investment strategies;• Public, stakeholder, and agency engagement role;• Supporting materials and baseline information, which includes a description of the
multimodal transportation system, existing system performance, anticipated challenges,and revenue forecasts;
• Strategic elements of the transportation plan: Strategic Vision, Goals and Objectives;

CHAPTER 1 INTRODUCTION
Final Report December 2018 | 6
• Performance measures such as national measures established by US DOT, as well ascommunity-driven measures; and target-setting methods based on factors such asavailable resources, trend analysis, and data;
• Existing performance of the transportation system, State or Region, regarding establishedperformance measures and targets;
• Identification of investment needs to meet desired performance outcomes, screenstrategies, projects concepts, and estimate costs;
• Scenario analysis and approaches for evaluating and choosing investment priorities in thetransportation plan based on performance information; and
• Discussion about the transportation plan being translated into programming decisionsthat reflect priorities recognized over the planning process6.
Some of the resources supporting a long-range statewide transportation plan includes:
• 23 CFR 450 - Planning Assistance and Standards: are federal transportation planningregulations which announce that each state implements long range statewidetransportation plan and Statewide Transportation Improvement Program (STIP);
• FAST-Act Fact Sheet: Metropolitan, Statewide, and Non-Metropolitan Planning: is aprogram that offers funding and technical requirements for transportation planning whichresults in short-range and long-range plans programs of transportation investmentpriorities;
• FHWA FAST-Act Fact Sheet; Metropolitan Planning: is a program that give continuity tothe Metropolitan Planning Program; and
• U.S. Code Title 49, Chapter 53 - Transit: is a section of US Code regarding the transit.Includes:
• The Metropolitan Transportation Planning statute (Section 5303);• Statewide Transportation Planning (Section 5304);• Planning Programs (Section 5305); and• The Metro and Statewide Planning sections (23 U.S.C. 134 and 135)7.
According with the US Census Bureau 2010, Puerto Rico is an Island with a land area of 3,423.78 square miles where the 93.8% of its population lives in urban areas. An analysis of World Bank Data showed that Puerto Rico’s population grew at a rate of 0.7% a year from 1985 to 2004. Thereafter, a significant reversal has occurred, culminating in annual decreases of over 1% a year since 2011.
In 2013, the Puerto Rico government approved five executive orders to begin executing his environmental policy, beginning with a guideline for the Land Use Plan, which will establish the
6 US DOT FHWA, Model Long - Range Transportation Plans: A Guide for Incorporating Performance-Based Planning, 2014. 7 https://www.transit.dot.gov/regulations-and-guidance/transportation-planning/long-range-statewide-transportation-plan.

CHAPTER 1 INTRODUCTION
Final Report December 2018 | 7
parameters to achieve the Island’s economic development in a manner consistent with the protection of the environment:
• OE-2013-019: To order the Department of Natural and Environmental Resources to carryout the National Demarcation of the Maritime Terrestrial Zone;
• OE-2013-018: It orders the quantification of emissions of greenhouse gases in Puerto Ricoand the elaboration of a plan for the reduction of these emissions in order to get closer tothe carbon neutral goal;
• OE-2013-017: It orders the creation of the Action Council for the Sustainability of PuertoRico;
• OE-2013-016: It orders the development of a study on the vulnerability of publicinfrastructure to climate changes and the adoption of adaptation plans to confront thefindings of the study; and
• OE-2013-015: Orders the Planning Board to finalize and adopt the Land Use Plan of PuertoRico.
In 2015 the Puerto Rico Planning Board approved unanimously the Land Use Plan (Plan de Uso de Suelos PUT), this document defines its main goals as:
1. Concentrate development and redevelopment in communities where infrastructurealready exists and development is planned;
2. Preserve and protect natural, archaeological or agricultural resources, rural soils andenvironmentally sensitive ones from the adverse effects of uncontrolled construction; and
3. Ensure a desirable quality of life in cities, communities and neighborhoods in a sustainableand fair manner.
Plans Considered as Part of the LRTP
The 2045 LRTP is based on federal and local policies regarded sustainable development and resilience. There are several planning documents that are part of the LRTP as appendices and have been considered in the development of the documents; these are:
• Puerto Rico Complete Streets Plan and Design Guidelines;• Comprehensive Bicycle and Pedestrian Plan;• Puerto Rico Strategic Highway Safety Plan (SHSP); and• The PR Asset Management Plan.
In 2016, PRHTA developed, and the PR-MPO adopted on September 2018 the Puerto Rico Complete Streets Plan and Design Guidelines and the Comprehensive Bicycle and Pedestrian Plan.
The main objectives the Puerto Rico Complete Streets Plan and Design Guidelines are:
• “To guide state and local efforts to improve access and mobility conditions and developnew facilities to improve the quality of life of Puerto Rico communities;
• To improve and/or provide pedestrian and bicycle access to the transit system and thepublic spaces; and
• To provide safe and affordable access for people of all ages and abilities in accordancewith the FHWA’s Livability Initiative, the American with Disabilities Act of 1990, the goals

CHAPTER 1 INTRODUCTION
Final Report December 2018 | 8
set forth by the Puerto Rico Law 207 of August 25, 2000 for the development along the Tren Urbano Corridor, as well as by the Puerto Rico Law 201 of December 16, 2010 for Complete Streets”8.
The main objectives the Comprehensive Bicycle and Pedestrian Plan are:
• “Promote and increase the use of cycling and walking as alternative modes oftransportation;
• Foment the physical integration of urban centers thru a cyclist and pedestrian networkthat improves accessibility to different land uses;
• Incorporate the development of projects and bicycle/pedestrian facilities to Statewide andMunicipal Transportations Plans;
• Provide cycling and walking infrastructure to improve mobility, accessibility, and safety forall users of our public roads; and
• Develop Educational Programs for all users to share the public roads in a safely manner”9.
The SHSP states that the overall objective and public policy adopted by the Commonwealth of Puerto Rico is to reduce the number of annual traffic fatalities to less than 300 fatalities by 2018, the lowest level ever recorded. This translates to approximately a 13% annual reduction in the number of fatalities and serious injuries on the highways of Puerto Rico between 2013 and 201810. The main objectives of the Plan include:
• “Reduce the average time for crash data entry from 775 days to 400 days;• Decrease the Puerto Rico EMS Annual Average Response Time to Crash Scene to less than
11.50 min by 2018;• Reduce the 5-year moving average of unrestrained occupant fatalities from 124 to 118 by
2018;• Reduce the 5-year moving average of speeding related fatalities from 144 to 129 by 2018;• Reduce the 5-year moving average of young driver serious injuries (15-20 years) from 378
to 327 by 2018;• Reduce the 5-year moving average of serious injuries involving vulnerable users, from 758
to 554, by 2018;• Reduce fatalities involving roadway departure using 5-year moving average from 134 to
124 by 2018; and• Reduce fatalities occurring at intersections using 5-year moving average from 47 to 42 by
2018” 11.
8 PRHTA, Puerto Rico Complete Streets Plan and Design Guidelines, 2016. 9 PRHTA, Comprehensive Bicycle and Pedestrian Plan, 2016. 10 2014-2018 PR Strategic Highway Safety Plan; 2014; http://carreterasegurapr.com/Content/docs/Puerto_Rico_SHSP_2014-2018_English.pdf. 11 2014-2018 PR Strategic Highway Safety Plan; 2014; http://carreterasegurapr.com/Content/docs/Puerto_Rico_SHSP_2014-2018_English.pdf.

CHAPTER 1 INTRODUCTION
Final Report December 2018 | 9
2017 Context
The plan update kicked off in in August 2017. Hurricane María struck and affected Puerto Rico on September 20, 2017. This powerful Category 4 hurricane with 150 mph winds bisected the entire Island having catastrophic effects. This event had a direct effect on this Plan including:
• The data collection process was not possible considering that mobility patterns wereaffected by the climatic effect as the infrastructure was affected for over 8 months afterthe hurricane:• As a result, calibration of the model was made using 2016 year;
• Major source of data related impacts of major climatic event on everyday life andmobility:• Therefore, resiliency analysis was completed based on evidence; and• Household surveys and public involvement was tailored to gather this data.
Further Analysis in Appendix A.
REPORT ORGANIZATION This report will be divided in 7 main chapters:
• Chapter 1 Introduction;• Chapter 2 Context Current Situation Assessment;• Chapter 3 Transportation Planning Process for the Future;• Chapter 4 Planning Process, Public Involvement, And Needs Assessment for the 2045 Plan;• Chapter 5 Finance;• Chapter 6 2045 Plan; and• Chapter 7 Policy Guidelines Toward the Transportation Infrastructure.

CHAPTER 2 CONTEXT: CURRENT SITUATION ASSESSMENT
Final Report December 2018 | 10
This chapter presents an overview of the local context in terms of planning, demographics and transportation infrastructure; it also presents the forecasts demographics and public policy towards the 2045 horizon. This chapter is divided into 4 sections:
1. The Region In Brief;2. Land Use;3. Demographics; and4. Transportation.
THE REGION IN BRIEF As shown in Figure 2.1, there are seven planning transportation Regions under the Puerto Rico Metropolitan Planning Organization (MPO), which includes:
• San Juan TMA;• Aguadilla TMA;• North;• South;• East;• Southeast; and• Southwest.
This document specifically analyses the San Juan Transportation Management Area12,(TMA)which represents the biggest area in terms of number of Municipalities covered, population, and employment levels. It is also the main point of entry for people (passengers) and cargo into and out of Puerto Rico. San Juan TMA receives high volumes of traffic on a daily basis from all the
12 According to regulations, Transportation Management Area (TMA) means an urbanized area with a population over 200,000, as defined by the Bureau of the Census and designated by the Secretary of Transportation, or any additional area where TMA designation is requested by the Governor and the MPO and designated by the Secretary of Transportation (23 CFR §450.104.
2 CHAPTER 2 CONTEXT: CURRENT SITUATION ASSESSMENT

CHAPTER 2 CONTEXT: CURRENT SITUATION ASSESSMENT
Draft Report December 2018 | 11
other 6 Regions making its accessibility and transport particularly complex and important Island-wide.

CHAPTER 2 CONTEXT: CURRENT SITUATION ASSESSMENT
Final Report December 2018 | 12
Figure 2.1: Seven Regions in Puerto Rico

CHAPTER 2 CONTEXT: CURRENT SITUATION ASSESSMENT
Final Report December 2018 | 13
The San Juan TMA is the largest Region of Puerto Rico taking just over 1/3 of the land area, it represents over 60% of the Island total population. The San Juan TMA is the main employer of the Island having over 60% of total formal and informal employment in Puerto Rico; thus, managing the largest numbers of commuter movement internally and from the other Regions. In turn this TMA has the most complex highway system including major principal arterials and expressways and most of the toll roads within its territory. It also manages the most complex transit system on the Island having a combination of systems including the only rail system on the Island and a state manages bus network. The San Juan TMA is also the main point of goods entrance to Puerto Rico as well as air/cruise passenger arrivals/departures.
The San Juan TMA is bounded by the North Region to the West and by the East Region in the East, to the South and Southwest lie the Southeast and South Regions respectively as shown in Figure 2.1. A total of 35 municipalities make part of San Juan TMA, as shown in Figure 2.2:
• Aguas Buenas;• Aibonito;• Barranquitas;• Bayamón;• Caguas;• Canóvanas;• Carolina;• Cataño;• Cayey;• Ciales;
• Cidra;• Comerío;• Corozal;• Dorado;• Guaynabo;• Gurabo;• Humacao;• Juncos;• Las Piedras;• Loíza;• Manatí;• Maunabo;• Morovis;
• Naguabo;• Naranjito;• Orocovis;• Río Grande;• San Juan;• San Lorenzo;• Toa Alta;• Toa Baja;• Trujillo Alto;• Vega Alta;• Vega Baja; and• Yabucoa.
Further details about Barrios in Appendix M.

CHAPTER 2 CONTEXT: CURRENT SITUATION ASSESSMENT
Final Report December 2018 | 14
Figure 2.2: San Juan TMA

CHAPTER 2 CONTEXT: CURRENT SITUATION ASSESSMENT
Final Report December 2018 | 15
LAND USE Development and Urbanization
In recent years, the whole Island, including the San Juan TMA, has experienced a period of economic recession, an increasing rate of out-migration to the United States, a decline in birth rates and a decline in manufacturing employment. Those trends are resulting in lower economic and population growth in the San Juan TMA as compared with previous decades.
The identification and development of urbanized areas are key elements in the transportation planning process. Figure 2.3 to Figure 2.5 show the urbanized areas in San Juan TMA for each decade between 1990 and 201613. Between the 1990s and the 2000s the San Juan urbanized area increased notably. This expansion trend slowed and the definition of new or expanded urbanized areas surrounding San Juan was muted between the 2000s and the 2010s. From thereon, to 2016 little to no changes in urbanized areas defintions have been recorded.
13 The 2010 Census Urban Area delineation remains the same for 2016, for this reason a 2010 Census Urban Area Map was not included.

CHAPTER 2 CONTEXT: CURRENT SITUATION ASSESSMENT
Final Report December 2018 | 16
Figure 2.3: San Juan TMA Urbanized Areas, 1990

CHAPTER 2 CONTEXT: CURRENT SITUATION ASSESSMENT
Final Report December 2018 | 17
Figure 2.4: San Juan TMA Urbanized Areas, 2000

CHAPTER 2 CONTEXT: CURRENT SITUATION ASSESSMENT
Final Report December 2018 | 18
Figure 2.5: San Juan TMA Urbanized Areas, 2016

CHAPTER 2 CONTEXT: CURRENT SITUATION ASSESSMENT
Final Report December 2018 | 19
Land Use Patterns
Growth and urban development resulted historically in urban sprawl in the region and across the island. At first, town centers were developed to concentrate housing, jobs, businesses and services for its population. Over the years, this dynamic changed, from urban centers to suburban developments; which has resulted in significant impacts to the Island’s land use patterns.
The Island’s natural topography has also contributed to the urban development patterns. Within the San Juan TMA there is a part of the central mountains range; these mountains create a natural barrier within the Region resulting in areas with different urban characteristics.
As shown in Figure 2.3 and Figure 2.4 above, the urbanized area of the San Juan TMA experienced significant growth between 1990 and 2000. However, growth had been moderate over the following decades due to economic recession, out-migration to the United States and other related variables.
Within the San Juan TMA, one can find a diverse mix of urban and suburban settlements. The TMA includes the highly densified city areas in San Juan, traditional town centers, such Caguas and Humacao, and semi-rural towns, such as, Ciales and Orocovis. This diversity presents transportation challenges to the Region as a whole in addition each settlement itself. Figure 2.6 shows recent land use patterns in the Region. In recent years, these municipalities showed a variety of land uses and community types.
The Region includes a central urbanized area composed mainly by: San Juan, Carolina, Trujillo Alto, Guaynabo, Cataño, Bayamón, Toa Baja and Toa Alta. These municipalities concentrate 49.9% of the total population of San Juan TMA14. Also, these municipalities, contain the largest regional employment (private and public sector), the main universities and colleges, the Hato Rey financial and business district, hospitals, medical centers, the international airport and main seaport facilities, and shopping centers.
Beyond the main urbanized area, suburban developments have been occurring through the rest of the municipalities that compose the Region, but in a smaller scale. They have each of the main development elements including business, employment and services (including government facilities) centers.
It is important to mention that the Puerto Rico Planning Board approved the first Land Use Plan for Puerto Rico in 2015 with the objective of establishing the public policy on the management of land use that allows to maximize the potential of the Puerto Rican soil within a framework that guarantees the protection of natural resources and sustainable development. It is the framework that guides the public policy on land use for Puerto Rico.
14 U.S. Census Estimates, 2016.

CHAPTER 2 CONTEXT: CURRENT SITUATION ASSESSMENT
Final Report December 2018 | 20
Figure 2.6: San Juan TMA Land Uses

CHAPTER 2 CONTEXT: CURRENT SITUATION ASSESSMENT
Final Report December 2018 | 21
The Land Use Plan for Puerto Rico in 2015 was a collaborative process where the Municipal land use plans or already autonomous municipalities and its Territorial Plans (Plan de Ordenamiento Territorial), where considered or integrated since the Planning Board regulates and approves the Territorial Plan process for the municipalities. This is required so that all municipalities move towards achieving the goals of: “(1) development and redevelopment in communities where infrastructure already exist, (2) preserve and protect the natural, archeological, agricultural, rural soils, and sensitivity environments to the adverse effects of uncontrolled construction, and (3) ensuring a desirable quality of life within cities, communities and neighborhoods in a fair and sustainable way”15.
The Comprehensive Bicycle and Pedestrian Plan and the Complete Street Plan and Design Guidelines adopted on September 2018 will also foster a positive impact on the land use patterns. Both documents aim to encourage a physical integration of urban centers by providing alternatives modes of transportation.
Environmental Resources
Although Puerto Rico covers a small land area, it possesses a diversity of natural resources and ecosystems, which are the result of its geological evolution across the ages. These features are a direct consequence of the sharp differences in ground elevations observed between the coastal plains and the central mountainous part of the Island. This variability in the topography, establishes the conditions for a variable rainfall patterns observed between the different Regions, which in turn provides adequate conditions for biodiversity and different landscapes. Therefore, it is possible to observe within a Region, a high degree of variability in the environmental settings.
The northern parts of the San Juan TMA are characterized by variable elevations from low elevations at the coast to the highest elevation located toward the center part of the Island. This central mountainous ridge is divided into what is known as Cordillera Central and the Sierra Luquillo range which is located toward the east side of the Cordillera Central. Municipalities such as Aibonito, Barranquitas, Cayey, and Orocovis abound in this mountainous southwest part of the San Juan TMA. In general, both mountainous systems run along an east to west direction. It is precisely at the eastern part of this mountainous systems that El Yunque forest is found. This is the location, within the Region as well as the entire Island, that exhibits the highest rainfall intensity (Pico del Este in Ceiba).
El Yunque forest is also known as The Caribbean National Forest and has the distinction of being the only rainforest of the U.S. National Forest System. It is a protected scientific reserve which is managed by the International Institute of Tropical Forests, whose headquarters are located in Rio Piedras (in San Juan Municipality).
There are many reserves and forests distributed across the San Juan TMA, like the Humacao Natural Reserve in the eastern part of the TMA, the Carite Forest in Cayey, and a cluster of forests located in the western part of the TMA, in Ciales and the Espiritu Santo river and Las Casas de La Selva in the northeast part of the TMA in Río Grande.
15 Quoted from the Puerto Rico Land Use Plan approved November 19, 2015.

CHAPTER 2 CONTEXT: CURRENT SITUATION ASSESSMENT
Final Report December 2018 | 22
Many creeks, rivers and streams are observed across the entire San Juan TMA, because of the relatively high intensity and frequent rain events. This condition has also resulted in the formation of several wetland systems which are ubiquitous along the north coastal plains of the Region. These systems in turn, house unique habitats for critically endangered and threatened species protected under local and federal regulations. It shall be noted however, that emerging wetlands as well as other sensitive areas are observed within the Region.
Land uses within the TMA reflect the presence of concentrated extensive urbanized areas in the municipalities of Bayamón, Cataño, Carolina, Guaynabo, San Juan and Trujillo Alto. There are other municipalities that also show extensive urbanized areas such as Dorado, Humacao, Toa Alta, and Toa Baja, but not to the same extent. In contrast with this observation, there are significant areas within the San Juan TMA, that have been designated for uses aimed to protect lands for agricultural, hydric and landscape purposes. The later uses are observed mostly forming a semicircular pattern that surrounds the area. In most instances, the designated land uses correspond to the presence of sensitive locations previously discussed, therefore, signaling the desire to protect these areas from further development.
Improvements of existing roadways as well as the construction of new transportation related infrastructure requires the consideration of the natural resources present at each discrete location, to minimize potential direct and indirect impacts to their integrity and to foster their preservation and functionality for future generations. In pursuing this goal, many environmental laws and regulations have been approved and are in place to facilitate compliance with this goal. The National Environmental Policy Act (NEPA) of 1970, and the Environmental Policy Law (Law #416 of September 20014) enforced by the Puerto Rico Environmental Quality Board (EQB) are examples of laws that have established the procedural scheme that requires to address the environmental impacts associated with the construction of transportation projects, and requires their avoidance, minimization and mitigation as the last resort. This process requires the coordination of many local and federal environmental agencies. The MPO fully supports and promotes this coordination between local and federal agencies.
Figure 2.7 through Figure 2.9 illustrate the main environmental features of the San Juan TMA.
Further details about Protected Forests and Reserves in Appendix M.

CHAPTER 2 CONTEXT: CURRENT SITUATION ASSESSMENT
Final Report December 2018 | 23
Figure 2.7: Environmentally Sensitive Areas

CHAPTER 2 CONTEXT: CURRENT SITUATION ASSESSMENT
Final Report December 2018 | 24
Figure 2.8: Protected Forests and Reserves

CHAPTER 2 CONTEXT: CURRENT SITUATION ASSESSMENT
Final Report December 2018 | 25
Figure 2.9: Coverage of Environmental Features

CHAPTER 2 CONTEXT: CURRENT SITUATION ASSESSMENT
Final Report December 2018 | 26
DEMOGRAPHICS Population
The population growth trend is fundamental in estimating travel patterns and its impact on the operation performance in terms of congestion and reliability of the transportation system. The Population in Puerto Rico had experienced a decreasing trend since 2005 when the Island started to register an economic recession along with other countries and the United States. This trend on population had continued from an annual trend of 0.5% between 2005 and 2010 to over 1% after 2010 as shown in Figure 2.10.
According to the US Census Bureau and the Puerto Rico Statistic Institute, the population of Puerto Rico is projected to be less than three million people (2,980,532 people) by the year 2025. In its previous projection, this happened for the year 2050. For the year 2050, the new projection is only two million people (2,089,492 people) in Puerto Rico16.
Between 2010 and 2016, the San Juan TMA’s population declined 8.2% from 2,241,938 to 2,058,458, a loss of 183,480 people, as can be seen in Figure 2.11.
Figure 2.10: Puerto Rico Historic Population
Source: SDG analysis of US Census Data
16 U.S. Census Bureau projects population in Puerto Rico will be below 3 million inhabitants in just 8 years (2025). (September 2017) Press Release. Red State Data Center of Puerto Rico (SDC-PR). https://censo.estadisticas.pr/Comunicado-de-prensa/2017-09-17t125335.

CHAPTER 2 CONTEXT: CURRENT SITUATION ASSESSMENT
Final Report December 2018 | 27
Figure 2.11: Comparison Puerto Rico vs San Juan TMA – Population
Source: SDG analysis of US Census Bureau Estimates
San Juan TMA (2,058,458) represented 60.3% of the Island total population (3,411,307) in 2016.
The population in the San Juan TMA has been decreasing since 2000 with an overall decrease of 1.6% from 2000 to 2010 and a more severe 8.2% from 2010 and 2016.
As shown in Figure 2.12, the most populated municipalities within the San Juan TMA are San Juan followed by Bayamón, Carolina and Caguas.
From 2000 to 2010 there was a mix of population losses and gains within the San Juan TMA municipalities with 17 of the 35 losing population between -1.2% in Humacao to -9.1% in San Juan. Increases in population were observed in the remaining 18 municipalities from 0.04% in San Lorenzo to as high as 22.6% in Gurabo.
Between 2010 and 2016, Gurabo was the only municipality in the Region where population growth occurred (4.2%); meanwhile San Juan exhibited the largest reduction in population (12.2%) followed by Loíza (11.6%). Population changes are shown in Table 2.1.

CHAPTER 2 CONTEXT: CURRENT SITUATION ASSESSMENT
Final Report December 2018 | 28
Figure 2.12: San Juan TMA Population 2016

CHAPTER 2 CONTEXT: CURRENT SITUATION ASSESSMENT
Final Report December 2018 | 29
Table 2.1: San Juan TMA Population 2000-2010-2016
Municipality 2000 2010 2000-2010 % Change 2016 2010-2016
% of Change Aguas Buenas 29,199 28,659 (1.85%) 26,471 (7.63%)
Aibonito 26,600 25,900 (2.63%) 23,605 (8.86%)
Barranquitas 29,044 30,318 4.39% 28,977 (4.42%)
Bayamón 224,162 208,116 (7.16%) 184,374 (11.41%)
Caguas 140,704 142,893 1.56% 132,164 (7.51%)
Canóvanas 43,553 47,648 9.40% 46,477 (2.46%)
Carolina 185,765 176,762 (4.85%) 158,457 (10.36%)
Cataño 30,020 28,140 (6.26%) 24,968 (11.27%)
Cayey 47,416 48,119 1.48% 44,796 (6.91%)
Ciales 19,912 18,782 (5.67%) 17,021 (9.38%)
Cidra 43,012 43,480 1.09% 40,599 (6.63%)
Comerío 20,057 20,778 3.59% 19,699 (5.19%)
Corozal 37,015 37,142 0.34% 34,408 (7.36%)
Dorado 34,157 38,165 11.73% 37,536 (1.65%)
Guaynabo 100,280 97,924 (2.35%) 89,307 (8.80%)
Gurabo 36,995 45,369 22.64% 47,269 4.19%
Humacao 59,158 58,466 (1.17%) 53,895 (7.82%)
Juncos 36,566 40,290 10.18% 39,477 (2.02%)
Las Piedras 34,578 38,675 11.85% 38,049 (1.62%)
Loíza 32,522 30,060 (7.57%) 26,583 (11.57%)
Manatí 45,498 44,113 (3.04%) 39,941 (9.46%)
Maunabo 12,682 12,225 (3.60%) 11,074 (9.42%)
Morovis 29,988 32,610 8.74% 31,603 (3.09%)
Naguabo 23,708 26,720 12.70% 26,448 (1.02%)
Naranjito 29,658 30,402 2.51% 28,805 (5.25%)
Orocovis 23,815 23,423 (1.65%) 21,529 (8.09%)
Río Grande 52,429 54,304 3.58% 51,009 (6.07%)
San Juan 434,747 395,326 (9.07%) 347,052 (12.21%)
San Lorenzo 41,043 41,058 0.04% 38,174 (7.02%)
Toa Alta 64,348 74,066 15.10% 73,980 (0.12%)
Toa Baja 94,066 89,609 (4.74%) 80,207 (10.49%)
Trujillo Alto 75,981 74,842 (1.50%) 68,242 (8.82%)
Vega Alta 37,890 39,951 5.44% 38,230 (4.31%)
Vega Baja 61,962 59,662 (3.71%) 53,674 (10.04%)
Yabucoa 39,210 37,941 (3.24%) 34,358 (9.44%) Total 2,277,740 2,241,938 (1.57%) 2,058,458 (8.18%)
Source: US Census Bureau Estimates 2000-2016

CHAPTER 2 CONTEXT: CURRENT SITUATION ASSESSMENT
Final Report December 2018 | 30
Employment17
In 2016, the San Juan TMA contained 610,178 jobs counting for 61.9%of total formal and informal employment in Puerto Rico18. The San Juan municipality accounts for most of the employment in the Region with 20% of the employment, followed by Bayamón, Carolina, Guaynabo and Caguas at 10%, 9%, 7% and 7% respectively, as shown in Figure 2.14.
Puerto Rico lost 7.1% of its employment between 2010 and 2016, which amounts to 74,905 jobs and a Compound Annual Growth Rate (CAGR) of -1.2%. In the same 6-year period, the San Juan TMA lost 7.23% of its employment, which amounts to 47,571 jobs and a CAGR of -1.2%. Figure 2.13, showing employment by place of residence, helps depict this trend.19
17 Employment Data used to graph trends in this section showing intermediate years between 2010 to 2016 is by Place of Residence and covers all employment sectors including agricultural employment and the self-employed. In employment tables showing just the years 2010 and 2016, employment is by place of work, and covers all the employment sectors noted above. The sourcing under each table or graph, will note whether the data is by Place of Residence or Place of Work.
18 This data is obtained from the Bureau of Labor Statistics Local Area Unemployment Statistics (LAUS) program. This program relies heavily on the Current Population Survey (CPS); a monthly survey consisting of in-person and telephone visits to a rotating sample of the population. Because the CPS occurs at individuals home locations, it is adept at capturing both formal and informal employment. The definition of employment by the BLS is:
“All persons who, during the reference week, (a) did any work at all (at least 1 hour) as paid employees, worked in their own business, profession, or on their own farm, or worked 15 hours or more as unpaid workers in an enterprise operated by a member of the family, and (b) all those who were not working but who had jobs or businesses from which they were temporarily absent because of vacation, illness, bad weather, childcare problems, maternity or paternity leave, labor-management dispute, job training, or other family or personal reasons, whether or not they were paid for the time off or were seeking other jobs”.
Quoted from Bureau of Labor Statistics, U.S. Department of Labor, Household Data, Current Population Survey, on the Internet at https://www.bls.gov/cps/eetech_methods.pdf (visited May 29, 2018). 19 As employment was only transformed from Place of Residence to Place of Work for the spot years 2010 and 2016. Employment data by Place of Residence has been utilized to depict historical trends over time.

CHAPTER 2 CONTEXT: CURRENT SITUATION ASSESSMENT
Final Report December 2018 | 31
Figure 2.13: Comparison Puerto Rico vs San Juan TMA – Employment
Source: SDG analysis of Bureau of Labor Statistics (BLS) Local Area Unemployment Statistics (LAUS) by Place of Residence

CHAPTER 2 CONTEXT: CURRENT SITUATION ASSESSMENT
Final Report December 2018 | 32
Figure 2.14: San Juan TMA Employment 2016

CHAPTER 2 CONTEXT: CURRENT SITUATION ASSESSMENT
Final Report December 2018 | 33
Between 2010 and 2016, notable employment increases were noted in Dorado and Guaynabo. Maunabo exhibited the largest reduction (25.0%) followed by Yabucoa (18.6%) as shown in Table 2.2
Table 2.2: San Juan TMA Employment by Place of Work 2010-2016 Municipality 2010 2016 2010 to 2016 Percent Change
Aguas Buenas 7,348 6,435 (12.4%)
Aibonito 5,918 5,733 (3.1%)
Barranquitas 6,672 5,665 (15.1%)
Bayamón 65,180 61,884 (5.1%)
Caguas 42,045 40,164 (4.5%)
Canóvanas 11,043 9,744 (11.8%)
Carolina 61,125 52,512 (14.1%)
Cataño 5,963 5,533 (7.2%)
Cayey 11,184 9,370 (16.2%)
Ciales 3,812 3,283 (13.9%)
Cidra 12,994 11,661 (10.3%)
Comerío 2,730 2,770 (1.5%)
Corozal 8,155 7,991 (2.0%)
Dorado 10,208 11,566 (13.3%)
Guaynabo 36,458 41,042 (12.6%)
Gurabo 12,418 11,351 (8.6%)
Humacao 15,549 14,272 (8.2%)
Juncos 10,121 10,167 (0.4%)
Las Piedras 9,917 8,719 (12.1%)
Loíza 6,637 6,311 (4.9%)
Manatí 11,176 11,962 (7.0%)
Maunabo 2,629 1,971 (25.0%)
Morovis 6,959 5,762 (17.2%)
Naguabo 5,520 5,240 (5.1%)
Naranjito 6,647 5,417 (18.5%)
Orocovis 4,162 3,393 (18.5%)
Río Grande 13,998 13,461 (3.8%)
San Juan 135,295 121,899 (9.9%)
San Lorenzo 11,165 10,184 (8.8%)
Toa Alta 24,443 22,776 (6.8%)
Toa Baja 28,237 27,054 (4.2%)
Trujillo Alto 28,666 25,671 (10.5%)
Vega Alta 9,592 8,510 (11.3%)
Vega Baja 15,834 14,233 (10.1%)
Yabucoa 7,950 6,475 (18.6%) San Juan TMA Total 657,750 610,178 (7.2%) Puerto Rico 1,061,056 986,151 (7.1%)
Source: 2010 2040 LRTP and 2016 SDG Analysis of Bureau of Labor Statistics Local Area Unemployment Statistics, adjusted to be by Place of Work

CHAPTER 2 CONTEXT: CURRENT SITUATION ASSESSMENT
Final Report December 2018 | 34
In 2016, Puerto Rico and San Juan TMA unemployment rates, 13.4% and 9.9% respectively, have decreased from 2010 to 2016, as shown in Figure 2.15 and Figure 2.16.
Figure 2.15: Comparison Puerto Rico vs. San Juan TMA – Unemployment Rate
Source: SDG analysis of Bureau of Labor Statistics Local Area Unemployment Statistics by Place of Residence
Table 2.3 and Figure 2.16 display the unemployed population by municipality per years. San Juan TMA represents a 53.4% of the unemployed (in labor force) population in Puerto Rico, where San Juan Municipality contributes with a 15.2%. In Figure 2.17, Maunabo has the highest unemployment rate, but is the smallest municipality in terms of labor force in the TMA. The three largest municipalities in terms of labor force, San Juan, Bayamon, and Carolina all have unemployment rates below 10%.
Figure 2.16: Unemployed (In Labor Force) Population
Source: SDG analysis of Bureau of Labor Statistics Local Area Unemployment Statistics by Place of Residence

CHAPTER 2 CONTEXT: CURRENT SITUATION ASSESSMENT
Final Report December 2018 | 35
Figure 2.17: San Juan TMA Unemployment Rate 2016

CHAPTER 2 CONTEXT: CURRENT SITUATION ASSESSMENT
Final Report December 2018 | 36
The LAUS survey does not distinguish between informal and formal employment, as questions of taxation or method of payment do not determine whether someone is counted as employed.
Unemployment has declined as employment declined because population and the labor force decreased at a faster rate than employment losses. This is highly related to the migration of individuals in the labor force out of the Island and the effect of low birth rates over the past 20 years starting to affect the workforce. San Juan’s participation rate, calculated as labor force as a portion of population over 16 years old, and shown in Figure 2.18, has consistently outpaced Puerto Rico as a whole.
Figure 2.18: Participation Rate in Labor Force
Source: SDG analysis of ACS population estimates and BLS LAUS employment data
Table 2.3: Unemployed (In Labor Force) Population by Municipality
Municipality 2010 2011 2012 2013 2014 2015 2016
Aguas Buenas 1,767 1,579 1,368 1,196 1,147 1,002 975
Aibonito 1,467 1,466 1,376 1,196 1,202 973 996
Barranquitas 1,443 1,378 1,274 1,198 1,187 986 962
Bayamón 9,922 9,318 7,943 7,040 6,999 6,283 5,973
Caguas 8,525 7,956 7,059 6,024 5,751 5,036 4,996
Carolina 9,272 8,251 7,034 6,128 6,215 5,567 5,388
Cataño 1,408 1,351 1,174 1,104 1,009 844 796
Cayey 2,882 2,795 2,594 2,296 2,081 1,750 1,745
Ciales 1,292 1,090 929 1,148 967 682 621
Cidra 2,745 2,639 2,448 2,070 1,894 1,550 1,599
Comerío 1,303 1,190 1,134 1,097 1,000 788 685
Corozal 1,762 1,780 1,572 1,463 1,447 1,271 1,139
Dorado 1,624 1,414 1,181 1,137 1,111 1,005 1,045
Guaynabo 3,506 3,159 2,586 2,294 2,314 2,174 2,221
Gurabo 2,475 2,276 1,954 1,841 1,809 1,508 1,491

CHAPTER 2 CONTEXT: CURRENT SITUATION ASSESSMENT
Final Report December 2018 | 37
Municipality 2010 2011 2012 2013 2014 2015 2016
Humacao 4,272 4,200 3,789 3,399 3,116 2,611 2,470
Juncos 2,508 2,402 2,103 1,974 1,926 1,741 1,649
Las Piedras 2,388 2,306 2,273 2,070 1,847 1,598 1,534
Loíza 1,717 1,456 1,206 1,141 1,187 1,036 982
Manatí 2,545 2,238 1,875 1,657 1,628 1,388 1,357
Maunabo 875 867 765 697 670 562 556
Morovis 2,119 1,841 1,589 1,676 1,561 1,148 1,095
Naguabo 1,947 1,676 1,461 1,392 1,266 1,068 1,000
Naranjito 1,669 1,520 1,314 1,267 1,249 1,003 944
Orocovis 1,361 1,197 1,138 1,036 1,027 860 809
Río Grande 2,876 2,633 2,223 2,077 2,049 1,770 1,797
San Juan 15,939 14,781 12,791 11,246 11,020 10,356 10,693
San Lorenzo 2,325 2,287 2,003 2,098 1,916 1,574 1,496
Toa Alta 3,286 3,105 2,685 2,452 2,386 2,203 2,214
Toa Baja 4,304 4,016 3,375 3,288 3,103 2,724 2,689
Trujillo Alto 3,176 2,876 2,395 2,101 2,108 1,911 1,958
Vega Alta 1,859 1,753 1,456 1,437 1,379 1,157 1,141
Vega Baja 3,372 2,863 2,361 2,403 2,296 1,906 1,909
Yabucoa 2,793 2,706 2,399 2,427 2,104 1,611 1,540
Canóvanas 3,156 2,794 2,324 2,151 2,119 1,918 1,875
Total 115,880 107,159 93,151 85,221 82,090 71,564 70,340
Source: Bureau of Labor Statistics Local Area Unemployment Statistics by Place of Residence
In Puerto Rico, in recent history, overall the number of people employed has decreased while employment rates have increased, as shown in Table 2.4. This is due to population losses, which occur at a faster rate than employment. All Regions have lost over 10% of their labor forces between 2010 and 2016, while the San Juan TMA Region lost 11.4%.
Table 2.4: San Juan TMA and Puerto Rico Employment (2010 and 2016)
Region Name
2010 - Labor Force
2010 - Employment
2010 - Employment
Rate
2016 - Labor Force
2016 - Employment
2016 Employment
Rate
% Change in Labor
Force
% Change in Employment
San Juan TMA 805,825 689,945 86% 714,088 643,748 90% (11.4%) (6.7%)
Puerto Rico 1,268,673 1,061,056 84% 1,117,928 986,151 88% (11.9%) (7.1%)
Source: Bureau of Labor Statistics (BLS) Local Area Unemployment Statistics (LAUS) by Place of Residence
Age
In 2010 Puerto Rico had an elderly population, individuals 65 years and older, of 541,998 people, representing the 14.6% of the Island inhabitants. By the year 2016, the population of individuals 65 years and over was estimated at 645,887 people, which represents 18.9% of the total residents. Puerto Rico’s elderly population holds a more significant share of total population,

CHAPTER 2 CONTEXT: CURRENT SITUATION ASSESSMENT
Final Report December 2018 | 38
18.9%, compared to the young segment (under 15 years) who made up 16.3% of the population in 2016, as shown in Figure 2.19.
Figure 2.19: Age Distribution for Puerto Rico
Source: SDG analysis of US Census Bureau Estimates 2010-2016
In 2010, the elderly population in the San Juan TMA reached 322,121 people, representing 8.7% of the Island population. By the year 2016, the population of individuals 65 years and over was estimated at 382,340 which represents a 11.2% share of the Puerto Rico population. Between 2010 and 2016, population share of individuals under 15 years decreased from 11.80% to 9.8%. Therefore, San Juan TMA’s elder population holds a more significant share of total population (11.2%) compared to the young segment (9.8% under 15 years) in 2016.
Figure 2.20 shows that the share of the elderly population grew larger than the share of youths starting in 2015, with the gap continuing to widen. The proportion of the population aged between 20 and 59 years has been maintained, changing slightly from 31.8% to 31.6% during the period 2010-2016.
Figure 2.21 shows the trend of the San Juan TMA’s Aging Index20 since 2010. In July 2016, in the San Juan TMA, the index was above 100 representing more senior than youth inhabitants in 20 of 35 municipalities as seen in Figure 2.22.
20 Aging Index: “relates the most dynamic groups of population and that most influence the structure and evolution of a population. This index relates the old population, which can be 60 years or more (P60+) or 65 years or more (P65+) with the population of minors that is generally below the age of 15 years (P0-14) in order to see if the oldest population of a particular place is more, equal or less than the youngest population. The utility of the Aging Index is to observe the amount of old population per 100 young, that is, try to measure the weight that one sector falls on another sector”. http://demografia.rcm.upr.edu/index.php/indicadores-en-demografia/i-composicion/i-viejos.

CHAPTER 2 CONTEXT: CURRENT SITUATION ASSESSMENT
Final Report December 2018 | 39
Figure 2.20: Comparison San Juan TMA population Older vs. Younger
Source: SDG analysis of US Census Bureau Estimates 2010-2016
Figure 2.21: San Juan TMA Aging Index 2010-2016
Source: SDG analysis of US Census Bureau Estimates 2010-2016
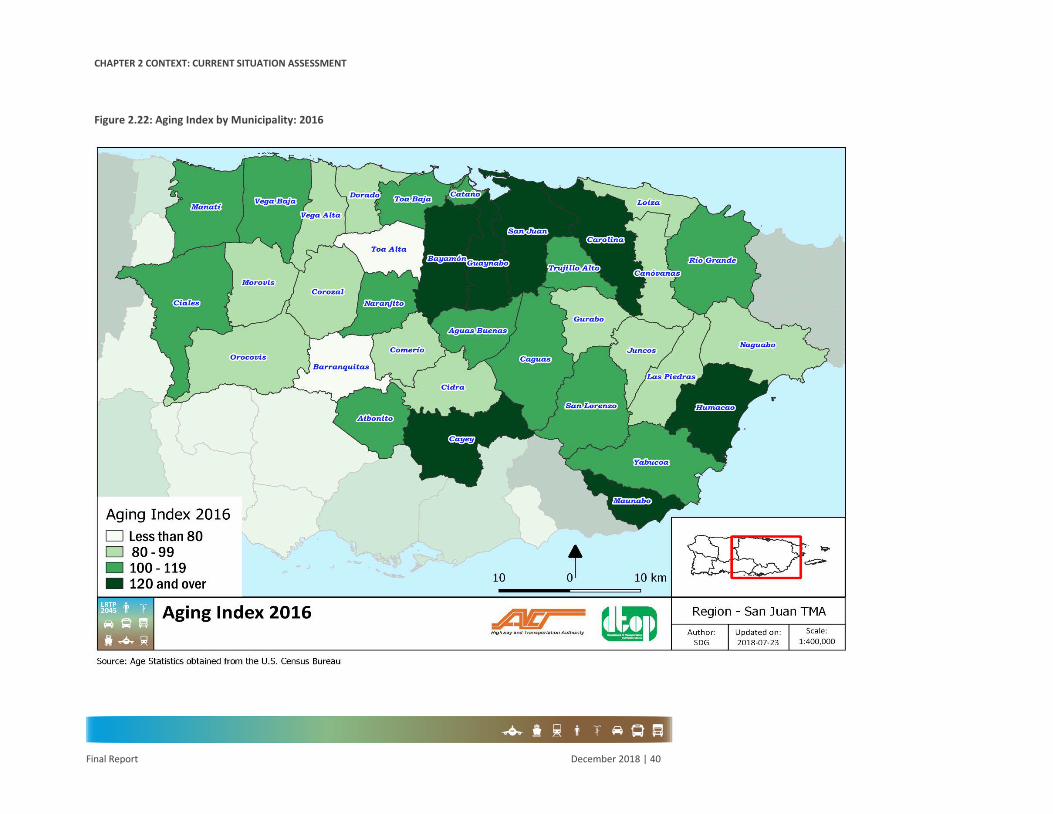
CHAPTER 2 CONTEXT: CURRENT SITUATION ASSESSMENT
Final Report December 2018 | 40
Figure 2.22: Aging Index by Municipality: 2016

CHAPTER 2 CONTEXT: CURRENT SITUATION ASSESSMENT
Final Report December 2018 | 41
In the San Juan TMA, the five highest ranking municipalities in terms of aging index are shown in Table 2.5.
Table 2.5: Highest Aging Index in San Juan TMA: 2016
Municipality Aging Index
Guaynabo 146
San Juan 139
Carolina 136
Bayamón 135
Humacao 126
Source: SDG analysis of US Census Bureau Estimates 2010-2016
The five lowest ranking municipalities in terms of aging index are shown in Table 2.6.
Table 2.6: Lowest Aging Index in PR: 2016
Municipality Aging Index
Toa Alta 74
Barranquitas 76
Morovis 82
Juncos 82
Gurabo 85
Source: SDG analysis of US Census Bureau Estimates 2010-2016
Regarding the median age, the San Juan TMA’s population continued to be very similar to that for all of Puerto Rico with a median age of just under 41 in 2016, as shown in Figure 2.23.
Figure 2.23: Median Age in San Juan TMA
Source: SDG analysis of US Census Bureau Estimates 2010-2016

CHAPTER 2 CONTEXT: CURRENT SITUATION ASSESSMENT
Final Report December 2018 | 42
Regarding the median age by gender, San Juan TMA’s female population continued to have a median age higher than the male population. The 2016 median age for females was 42 years while the median age for males was 39, as shown in Figure 2.24.
Figure 2.24: Median Age by Gender
Source: SDG analysis of US Census Bureau Estimates 2010-2016
Within the Region, 16 Municipalities out of 35, showed a median age of 40 years and over in their population highlighted in Figure 2.25. Table 2.7 and Table 2.8 show the top five municipalities within San Juan TMA with the highest and lowest median age populations in 2016 respectively.
Table 2.7: Highest Median Age in San Juan TMA - 2016
Municipality Median Age
Guaynabo 43.6
Maunabo 43.4
Aibonito 42.5
San Juan 42.4
Humacao 42.3
Source: SDG analysis of US Census Bureau Estimates 2010-2016
Table 2.8: Lowest Median Age in San Juan TMA - 2016
Municipality Median Age
Barranquitas 36.3
Naguabo 37.6
Morovis 37.7
Juncos 37.8
Toa Alta 38.0
Source: SDG analysis of US Census Bureau Estimates 2010-2016

CHAPTER 2 CONTEXT: CURRENT SITUATION ASSESSMENT
Final Report December 2018 | 43
Figure 2.25: San Juan TMA Median Age 2016

CHAPTER 2 CONTEXT: CURRENT SITUATION ASSESSMENT
Final Report December 2018 | 44
Housing Type and Household Size
For the analysis of household type and size, U.S. Census estimates from 2016 indicated there were 1,237,180 households in Puerto Rico and households in the San Juan TMA represented a 60.9% (753,913) of the total Island, as shown in Figure 2.26.
Figure 2.26: Comparison PR vs. San Juan TMA – Total Households
Source: SDG analysis of ACS 5-Year Estimates (2012-2016)
In 2016 San Juan TMA had 932,744 housing units. Of these, 68.6% (517,304) owned their homes, 31.4% (236,609) were renters and mostly (61.3%) are 1-unit detached structures21 This information is shown in Figure 2.27 to Figure 2.29.
In the San Juan TMA, the percentage of household owners (homeownership rate) decreased from 72.3% to 68.6% between 2010 and 2016 and an increase in the corresponding rate for the households that are rented, 27.7% to 31.4%, was observed. Within these 6-years, the number of housing units increased by 6.5%.
21 Definition by U.S. Census Bureau: “This is a 1-unit structure detached from any other house; that is, with open space on all four sides”.

CHAPTER 2 CONTEXT: CURRENT SITUATION ASSESSMENT
Final Report December 2018 | 45
Figure 2.27: Comparison PR vs. San Juan TMA – Owner-Occupied
Source: SDG analysis of ACS 5-Year Estimates (2012-2016)
Figure 2.28: Comparison PR vs. San Juan TMA – Renter-Occupied
Source: SDG analysis of ACS 5-Year Estimates (2012-2016)
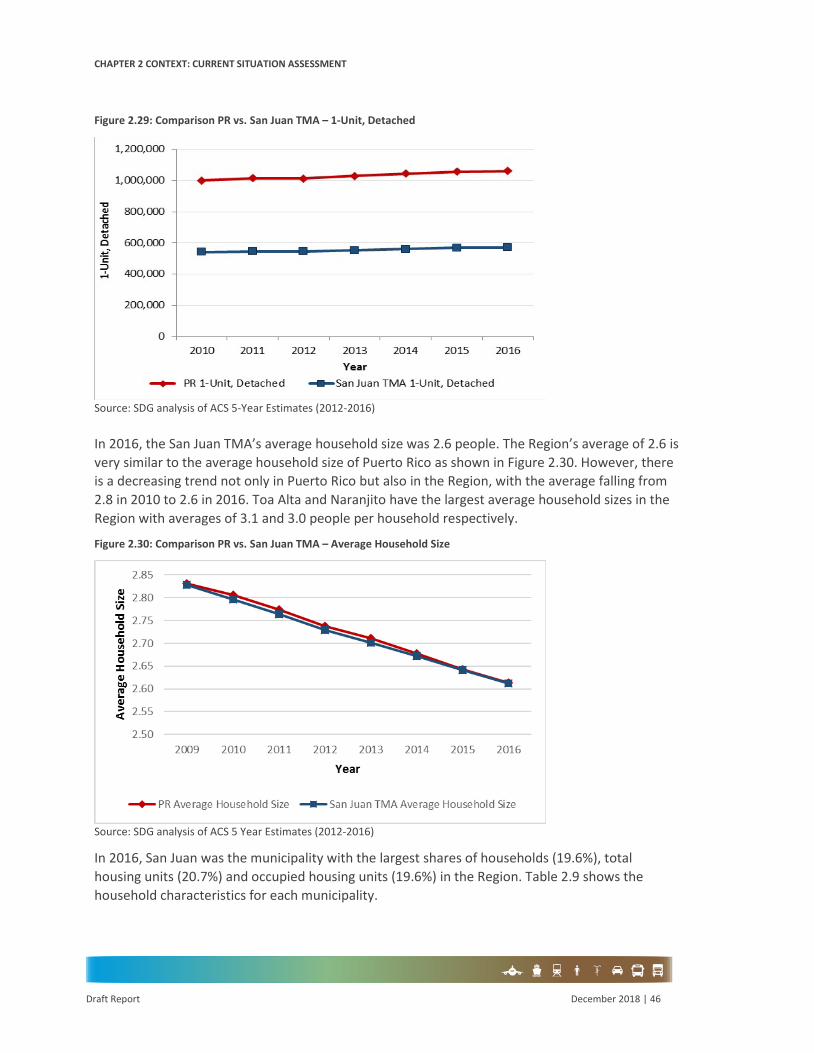
CHAPTER 2 CONTEXT: CURRENT SITUATION ASSESSMENT
Draft Report December 2018 | 46
Figure 2.29: Comparison PR vs. San Juan TMA – 1-Unit, Detached
Source: SDG analysis of ACS 5-Year Estimates (2012-2016)
In 2016, the San Juan TMA’s average household size was 2.6 people. The Region’s average of 2.6 is very similar to the average household size of Puerto Rico as shown in Figure 2.30. However, there is a decreasing trend not only in Puerto Rico but also in the Region, with the average falling from 2.8 in 2010 to 2.6 in 2016. Toa Alta and Naranjito have the largest average household sizes in the Region with averages of 3.1 and 3.0 people per household respectively.
Figure 2.30: Comparison PR vs. San Juan TMA – Average Household Size
Source: SDG analysis of ACS 5 Year Estimates (2012-2016)
In 2016, San Juan was the municipality with the largest shares of households (19.6%), total housing units (20.7%) and occupied housing units (19.6%) in the Region. Table 2.9 shows the household characteristics for each municipality.

CHAPTER 2 CONTEXT: CURRENT SITUATION ASSESSMENT
Final Report December 2018 | 47
Table 2.9: San Juan TMA – 2016 Total and Occupied Housing Units and Average Household Size
Municipality Total Housing Units Occupied Housing Units Average Household Size Aguas Buenas 10,790 8,675 2.67 Aibonito 9,961 8,569 2.67 Barranquitas 11,034 9,376 2.79 Bayamón 83,785 70,950 2.64 Caguas 58,356 50,327 2.65 Canóvanas 18,012 14,664 2.81 Carolina 77,771 64,408 2.60 Cataño 10,849 9,190 2.72 Cayey 20,106 16,629 2.58 Ciales 7,322 5,883 2.72 Cidra 16,213 13,519 2.80 Comerío 7,625 6,249 2.60 Corozal 13,063 11,011 2.89 Dorado 15,803 12,036 2.91 Guaynabo 40,303 34,724 2.56 Gurabo 17,568 15,473 2.75 Humacao 26,899 18,763 2.60 Juncos 15,723 12,746 2.70 Las Piedras 15,634 12,876 2.79 Loíza 11,588 8,810 2.74 Manatí 18,799 15,946 2.64 Maunabo 5,353 4,035 2.75 Morovis 11,661 9,827 2.85 Naguabo 11,555 8,586 2.63 Naranjito 10,605 8,645 2.96 Orocovis 8,514 6,858 2.70 Río Grande 23,191 16,292 2.70 San Juan 192,766 147,790 2.31 San Lorenzo 16,434 13,716 2.62 Toa Alta 25,726 22,375 3.05 Toa Baja 34,592 28,261 2.62 Trujillo Alto 29,505 24,660 2.73 Vega Alta 16,128 12,677 2.74 Vega Baja 24,739 17,356 2.62 Yabucoa 14,771 12,011 2.59 Total 932,744 753,913 2.61
Source: SDG analysis of ACS 5-Year Estimates (2012-2016) 22
22 ACS household data provides percentage of households that are 1-person, 2-person, 3-person, and 4-person plus. Using an assumed average value of 5 people for the 4-person plus households. SDG Team produced Weighted averages of household size by municipality. were produced. Because household data comes from the 5-year estimated dataset while population is from 2016 data only along with the weighted average calculation, multiplying number of households by the household size in table 3.11 will not be exactly equal to municipality population.

CHAPTER 2 CONTEXT: CURRENT SITUATION ASSESSMENT
Final Report December 2018 | 48
Puerto Rico Household Travel Survey (PRHTS)
Household surveys were completed as part of the 2045 PRLRTP (please, see details in Appendix L). Overall sample size was 2,784 households participating in the survey resulting in 1,663 households for the San Juan TMA included in this section.
Weighted survey results from the PRHTS are displayed with real 2016 data, but are not meant for direct comparison, as the survey results were weighted to 2015 household and population levels; this provides a check, looking for general proximity, to support the claim that the survey sampling distribution was representative of the population.
The weighted survey results of the PRHTS, which were weighted using 2015 US Census data, showed that San Juan had 2,152,632 inhabitants, representing 61.5% of the island population. In 2016, the U.S. Census shows that San Juan TMA (2,058,458) represented 60.3% of the Island total population (3,411,307). Figure 2.31 shows the distribution by gender, where over 48% were female and close to 41% of people were male.
Figure 2.31 San Juan TMA Population Distribution by Gender
Source: SDG – Using Weighted Survey Results
The weighted survey results showed that in 2015 for San Juan TMA, just 23.8% of the population fall under the age of 20, 34.7% are between 20 and 49 years of age, and 34.7% are older than 50. The population of individuals 65 years and over was 329,863 which represents 15.3% (Figure 2.32) of the total San Juan population. In 2016, the U.S. Census show that the population of individuals 65 years and over was estimated at 382,340 which represents a 11.2% share of the Puerto Rico population.

CHAPTER 2 CONTEXT: CURRENT SITUATION ASSESSMENT
Final Report December 2018 | 49
Figure 2.32: San Juan TMA Population Distribution by Age Brackets
Source: SDG – Using Weighted Survey Results
Figure 2.33, using weighted survey results, shows that in San Juan TMA 31.2% of the Region’s population are employed (Figure 2.33). In 2016, using BLS employment by residence and U.S. Census population, data shows that 31.3% of the population are employed.
Figure 2.33: San Juan TMA Distribution by Employment/Student Status
Source: SDG – Using Weighted Survey Results
At the Puerto Rico level, shown in Figure 2.34, using weighted survey results, over 73% of all households own and have either paid in full or are currently paying for their residence, while just under 24% are renting their current residence (Figure 2.34). From the American Community Survey, in 2016, close to 69% and just under 32% of San Juan housing units were owner-occupied and renter-occupied respectively.

CHAPTER 2 CONTEXT: CURRENT SITUATION ASSESSMENT
Final Report December 2018 | 50
Figure 2.34: San Juan Household Distribution by Home Ownership Status
Source: SDG – Using Weighted Survey Results
Household Level Demographic Data
Household demographic data was captured for the 1,663 households in the San Juan TMA who participated in the survey. Results are shown in Figure 2.35 to Figure 2.38.
• Household Occupants: Just over 23% of San Juan TMA’s households have 4 or moreoccupants (Figure 2.35);
• Vehicles per Household: At the San Juan TMA level 60.7% of households have 1 or lessavailable vehicles, with just under 13.5% of households without access to a private vehicle(Figure 2.36);
• Housing Structure: In San Juan TMA, just over 77% of households live in single-familyhomes, with 17.4% living in multi-family homes (Figure 2.37); and
• Income: With just 58.8% of the population’s income unknown due to survey respondent’schoice to not disclose, this is unable to provide as much information as would be desired.Of those who disclosed income the majority of household incomes fall under $25,000(Figure 2.38).

CHAPTER 2 CONTEXT: CURRENT SITUATION ASSESSMENT
Final Report December 2018 | 51
Figure 2.35: San Juan TMA Household Distribution by Household Size
Source: SDG – Using Weighted Survey Results
Figure 2.36: San Juan TMA Household Distribution by Vehicle Ownership
Source: SDG – Using Weighted Survey Results

CHAPTER 2 CONTEXT: CURRENT SITUATION ASSESSMENT
Final Report December 2018 | 52
Figure 2.37: San Juan TMA Household Distribution by Household Type
Source: SDG – Using Weighted Survey Results
Figure 2.38: San Juan TMA Household Distribution by Household Income Brackets
Source: SDG – Using Weighted Survey Results
Person Level Demographic Data
Person level demographic data was captured for the 4,171 people from the San Juan Region who participated in the survey.
• Education Level: Just over 65% of the San Juan population have achieved High Schoolcompletion or above (Figure 2.39);
• Industry Level Employment: Most people work in Other Services, 25.7%, with the secondlargest employment industry from the survey results being Health, 11.2% (Figure 2.40);and

CHAPTER 2 CONTEXT: CURRENT SITUATION ASSESSMENT
Final Report December 2018 | 53
• Resident Status: In San Juan TMA, just under 7% of residents are proclaimed as temporaryhousehold members (Figure 2.41).
Figure 2.39: San Juan TMA Population Distribution by Education Level
Source: SDG – Using Weighted Survey Results
Figure 2.40: San Juan TMA Employed Population Distribution by Industry
Source: SDG – Using Weighted Survey Results

CHAPTER 2 CONTEXT: CURRENT SITUATION ASSESSMENT
Final Report December 2018 | 54
Figure 2.41: San Juan TMA Employed Population Distribution by Resident Status
Source: SDG – Using Weighted Survey Results
Analysis of Trip Purpose and Frequency
The trip level data for participants with completed travel diaries is analyzed in this section, there were 6,405 trips made in the San Juan Region and their respective details captured by the survey.
• Trips Per Household: the mean trips generally increase with growth in household size.Looking at all households in Puerto Rico, they make an average of 3.93 daily trips; 2-person households, representing over 30% of all households make a mean of 3.48 tripsper day;
• Transportation Mode: Close to 90% of trips in San Juan TMA are made in private vehiclesas either the driver or as a passenger. San Juan has the highest portion of trips on publictransit with 2.6% of trips on either bus or train (Figure 2.42);
• Trip Purpose: Over 60% of trips in San Juan are related to work commute and returninghome; trips made to drop off individuals, other, and shopping make up close to 24% oftrips (Figure 2.43); and
• Trip Frequency: In Puerto Rico, just over 60% of all specific trips are recurring andcompleted 5 times or more a week (Figure 2.44).

CHAPTER 2 CONTEXT: CURRENT SITUATION ASSESSMENT
Final Report December 2018 | 55
Figure 2.42: San Juan TMA Trip Distribution by Transportation Mode
Source: SDG – Using Weighted Survey Results
Figure 2.43: San Juan TMA Trip Distribution by Trip Purpose
Source: SDG – Using Weighted Survey Results

CHAPTER 2 CONTEXT: CURRENT SITUATION ASSESSMENT
Final Report December 2018 | 56
Figure 2.44: San Juan TMA Trip Distribution by Trip Frequency Per Week
Source: SDG – Using Weighted Survey Results
Vehicle Type and Classifications
Vehicle data was logged by survey participants for 2,748 vehicles in the San Juan Region.
• Vehicle Brand: Over 30% of vehicles in San Juan TMA are manufactured by Toyota, withMitsubishi in second place with 10% of total vehicles (Figure 2.45);
• Model Year: In San Juan TMA, just over 25% of vehicles were manufactured prior to 2000.The largest portion of vehicles manufactured in any 5-year window were between 2011and 2015, at close to 24% of total vehicles (Figure 2.46);
• Vehicle Type: In San Juan TMA, close to 59% of vehicles are standard cars/sedans, whileover 32% are SUV’s (Figure 2.47);
• Primary User: Over 80% of the time, the primary users of vehicles are the head ofhousehold or spouse/partner. With under 15% of vehicles being primarily used by childrenin a household (Figure 2.48); and
• Parking Status: Just over 81% of all vehicles are stored in personal garages/driveways inSan Juan TMA, with close to 11% stored on street-parking (Figure 2.49).

CHAPTER 2 CONTEXT: CURRENT SITUATION ASSESSMENT
Final Report December 2018 | 57
Figure 2.45: San Juan TMA Vehicle Distribution by Brand
Source: SDG – Using Weighted Survey Results
Figure 2.46: San Juan TMA Vehicle Distribution by Model Year
Source: SDG – Using Weighted Survey Results

CHAPTER 2 CONTEXT: CURRENT SITUATION ASSESSMENT
Final Report December 2018 | 58
Figure 2.47: San Juan TMA Vehicle Distribution by Vehicle Type
Source: SDG – Using Weighted Survey Results
Figure 2.48: San Juan TMA Vehicle Distribution by Primary User
Source: SDG – Using Weighted Survey Results
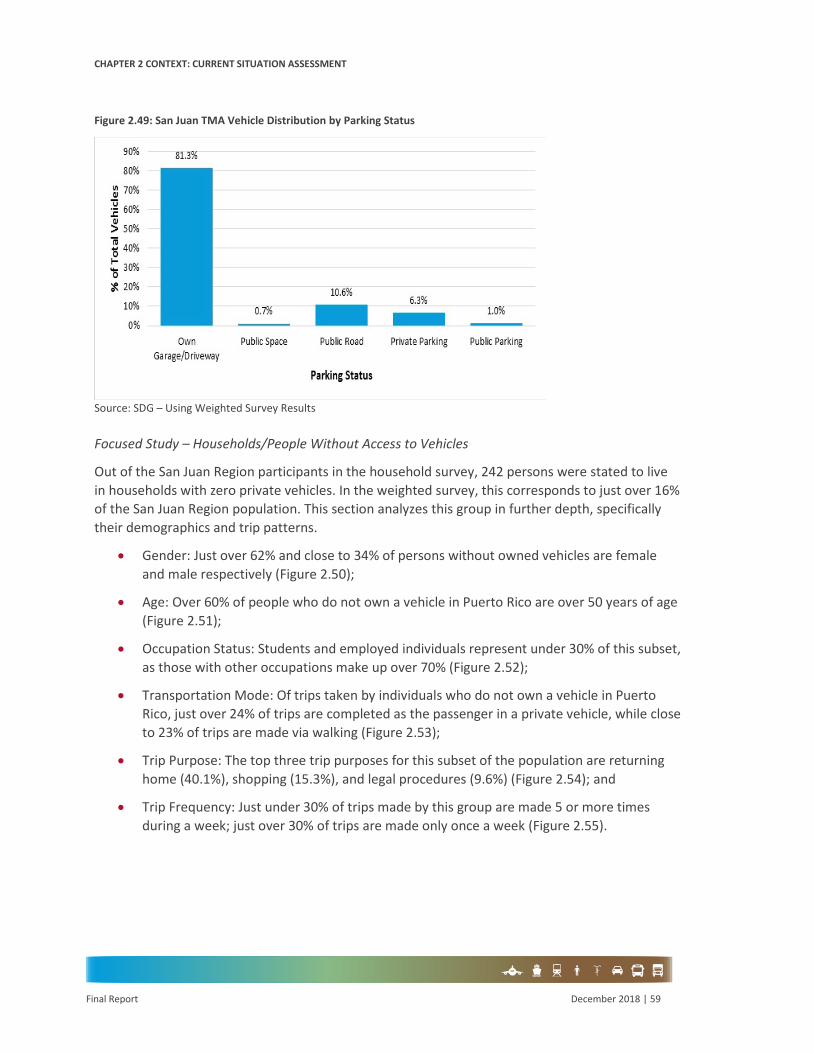
CHAPTER 2 CONTEXT: CURRENT SITUATION ASSESSMENT
Final Report December 2018 | 59
Figure 2.49: San Juan TMA Vehicle Distribution by Parking Status
Source: SDG – Using Weighted Survey Results
Focused Study – Households/People Without Access to Vehicles
Out of the San Juan Region participants in the household survey, 242 persons were stated to live in households with zero private vehicles. In the weighted survey, this corresponds to just over 16% of the San Juan Region population. This section analyzes this group in further depth, specifically their demographics and trip patterns.
• Gender: Just over 62% and close to 34% of persons without owned vehicles are femaleand male respectively (Figure 2.50);
• Age: Over 60% of people who do not own a vehicle in Puerto Rico are over 50 years of age(Figure 2.51);
• Occupation Status: Students and employed individuals represent under 30% of this subset,as those with other occupations make up over 70% (Figure 2.52);
• Transportation Mode: Of trips taken by individuals who do not own a vehicle in PuertoRico, just over 24% of trips are completed as the passenger in a private vehicle, while closeto 23% of trips are made via walking (Figure 2.53);
• Trip Purpose: The top three trip purposes for this subset of the population are returninghome (40.1%), shopping (15.3%), and legal procedures (9.6%) (Figure 2.54); and
• Trip Frequency: Just under 30% of trips made by this group are made 5 or more timesduring a week; just over 30% of trips are made only once a week (Figure 2.55).

CHAPTER 2 CONTEXT: CURRENT SITUATION ASSESSMENT
Final Report December 2018 | 60
Figure 2.50: San Juan TMA Population Distribution, Persons Without Owned Vehicles, by Gender
Source: SDG – Using Weighted Survey Results
Figure 2.51: San Juan TMA Population Distribution, Persons Without Owned Vehicles, by Age Bracket
Source: SDG – Using Weighted Survey Results

CHAPTER 2 CONTEXT: CURRENT SITUATION ASSESSMENT
Final Report December 2018 | 61
Figure 2.52: San Juan TMA Population Distribution, Persons Without Owned Vehicles, by Employment/Student Status
Source: SDG – Using Weighted Survey Results
Figure 2.53: San Juan TMA Trip Distribution, Persons Without Owned Vehicles, by Transportation Mode
Source: SDG – Using Weighted Survey Results

CHAPTER 2 CONTEXT: CURRENT SITUATION ASSESSMENT
Final Report December 2018 | 62
Figure 2.54: San Juan TMA Trip Distribution, Persons Without Owned Vehicles, by Trip Purpose
Source: SDG – Using Weighted Survey Results
Figure 2.55: San Juan TMA Trip Distribution, Persons Without Owned Vehicles, by Trip Frequency Per Week
Source: SDG – Using Weighted Survey Results
Focused Study – Transportation Affected by Hurricane María
Out of the San Juan TMA participants in the household survey, 791 persons stated that their trips were affected by Hurricane María. This section analyzes this group in further depth, specifically their demographics and trip patterns.
• Trip Affected by Hurricane María: Just under 24% of all trips made by individuals in theSan Juan TMA were affected by Hurricane María. (Figure 2.56);
• Gender: Of those in the San Juan TMA with trips affected by Hurricane María, just over61% and 37% were female and male respectively (Figure 2.57);

CHAPTER 2 CONTEXT: CURRENT SITUATION ASSESSMENT
Final Report December 2018 | 63
• Age: Close to 55% of individuals in the San Juan TMA whose trips were affected byHurricane María are over 50 years of age (Figure 2.58);
• Occupation Status: Just over 40% of these individuals are employed, while only around 6%were students (Figure 2.59);
• Transportation Mode: Close to 87% of trips affected by Hurricane María were completedas either driver or passenger of a private vehicle (Figure 2.60);
• Trip Purpose: Returning home (40.8%), commuting to work (19.1%), and shopping (12.5%)were the three major trip purposes (Figure 2.61); and
• Trip Frequency: Just under 50% of all trips were made 5 times or more a week; over 23%of trips were made only once a week (Figure 2.62).
Figure 2.56: San Juan TMA Trip Distribution by “Was Trip and/or Transportation Mode Affected by Hurricane María”
Source: SDG – Using Weighted Survey Results
Figure 2.57: San Juan TMA Population Distribution, People with Trips Affected by Hurricane María, by Gender
Source: SDG – Using Weighted Survey Results

CHAPTER 2 CONTEXT: CURRENT SITUATION ASSESSMENT
Final Report December 2018 | 64
Figure 2.58: San Juan TMA Population Distribution, People with Trips Affected by Hurricane María, by Age Bracket
Source: SDG – Using Weighted Survey Results
Figure 2.59: San Juan TMA Population Distribution, People with Trips Affected by Hurricane María, by Employment/Student Status
Source: SDG – Using Weighted Survey Results

CHAPTER 2 CONTEXT: CURRENT SITUATION ASSESSMENT
Final Report December 2018 | 65
Figure 2.60: San Juan TMA Trip Distribution, Trips Affected by Hurricane María, by Transportation Mode
Source: SDG – Using Weighted Survey Results
Figure 2.61: San Juan TMA Trip Distribution, Trips Affected by Hurricane María, by Trip Purpose
Source: SDG – Using Weighted Survey Results

CHAPTER 2 CONTEXT: CURRENT SITUATION ASSESSMENT
Final Report December 2018 | 66
Figure 2.62: San Juan TMA Trip Distribution, Trips Affected by Hurricane María, by Trip Frequency Per Week
Source: SDG – Using Weighted Survey Results
Forecasting
This section outlines the 2045 LRTP forecasts for population and employment in the San Juan TMA. The forecasts were produced using a combination of regional economic forecasting techniques and demographic analysis. For additional details on socio-economic forecasting see Appendix B.
The analysis follows standard practice in regional economic forecasting by focusing on the relationship between population growth (or decline) and economic growth (or decline). The approach focuses on the interplay between population, employment and the cost-of-doing business, as measured by regional wage rates. Wage costs are important to Puerto Rico, as they play a key role in attracting mainland US firms by providing a relatively competitive labor force. Figure 2.63 shows Puerto Rico’s average weekly wages by Region.

CHAPTER 2 CONTEXT: CURRENT SITUATION ASSESSMENT
Final Report December 2018 | 67
Figure 2.63: Puerto Rico Average Weekly Wages (Constant 2010 Prices)
Source: SDG analysis of Bureau of Labor Statistics Data
The process of forecasting population and employment growth in Puerto Rico needed to contend with the fact that the Island has been undergoing structural changes in its employment base. This change, coupled with several other events both discussed below and in previous sections, have led to a decrease in both employment and population within the last decade. This was shown above in Figure 2.10 and Figure 2.13.
It was found the reversal to be rooted in several factors, including:
• A significant decline in birth rates;• A decline in manufacturing employment, tied to changes in federal taxation policy,
international competition and the fact that manufacturing productivity growth with tendto decrease employment through automation; and
• An increase in the rate of out-migration to the rest of the United States.
This trend is likely to continue and, from initial estimates, has already been exacerbated by a series of impactful exogenous events, including:
• The recent Hurricane María (Sept. 2017) that gravely disrupted economic activity; and• A long-running fiscal imbalance that culminated in the appointment of the federal
oversight board in 2017. The financial crisis has exacerbated the economic challenges onseveral fronts, forcing cuts in public sector spending and employment and increasing theperceived risk of investing in Puerto Rico’s economy.
The forecasts described below suggest that Puerto Rico will recover from recent events, most notably Hurricane María, but will continue to see employment levels declining but at a much slower rate. Population growth will continue to be negative (but at a much slower rate than recent experience), as lower Birth rates will tend to amplify the long-standing pattern for Puerto Rico of net out-migration, principally to the United States mainland.

CHAPTER 2 CONTEXT: CURRENT SITUATION ASSESSMENT
Final Report December 2018 | 68
Puerto Rico is expected to lose nearly 520,000 persons and over 90,000 jobs by 2045. This corresponds to an 15.2% decline in population and an 10.4% decline in employment from Puerto Rico’s 2016 figures.
The forecasting approach, described below, does not include scenarios, in the sense that the forecasts do not consider various changes in policy given their uncertainty, such as:
• The possibility that debt restructuring for Puerto Rico could yield a relaxation of fiscalconstraints for the government of the Island;
• The possibility that changes in the structure of Federal taxes affects Puerto Rico’scompetitive position negatively; or
• The possibility that Puerto Rico develops new sources of employment and growth, forexample in high technology sectors.
Forecasting Methodology
The models developed for Puerto Rico build “bottom-up” from separate models for the seven Regions in Puerto Rico.
Description of Econometric Models
The econometric models used for this exercise consider population, employment, and wages. The models can be understood to be a representation of labor market conditions. These models use past values of related variables to predict future ones, while also incorporating the dynamics of regional economies and labor markets.
While growth tends to follow a general trend, high wages will, at the margin, act as a break on growth and investment. Similarly, lower wages will tend to attract investment. The model structure is therefore grounded in regional economic theory and is capable of predicting beyond trend growth.
Specifically, the models were used to estimate in the growth rates for each of the seven Regions in Puerto Rico. Forecasted growth rates are then applied to base historic levels of population and employment. The models also use manufacturing value added as an exogenous predictor.
The general system of equations takes the following form:
𝑃𝑃𝑃𝑃𝑃𝑃𝑃𝑃𝑃𝑃𝑃𝑃𝑃𝑃𝑃𝑃𝑃𝑃𝑃𝑃𝑡𝑡 = 𝛼𝛼0 + 𝛼𝛼1𝑃𝑃𝑃𝑃𝑃𝑃𝑃𝑃𝑃𝑃𝑃𝑃𝑃𝑃𝑃𝑃𝑃𝑃𝑃𝑃𝑡𝑡−1 + 𝛼𝛼2𝐸𝐸𝐸𝐸𝑃𝑃𝑃𝑃𝑃𝑃𝑝𝑝𝐸𝐸𝑝𝑝𝑃𝑃𝑃𝑃𝑡𝑡−1 + 𝛼𝛼3𝑅𝑅𝑝𝑝𝑃𝑃𝑃𝑃 𝑊𝑊𝑃𝑃𝑊𝑊𝑝𝑝𝑊𝑊𝑡𝑡−1 + 𝛼𝛼4𝑀𝑀𝑃𝑃𝑃𝑃𝑃𝑃𝑀𝑀 𝑉𝑉𝑃𝑃𝑃𝑃𝑃𝑃𝑝𝑝 𝐴𝐴𝐴𝐴𝐴𝐴𝑝𝑝𝐴𝐴𝑡𝑡−1+ 𝑃𝑃𝑝𝑝𝑡𝑡
𝐸𝐸𝐸𝐸𝑃𝑃𝑃𝑃𝑃𝑃𝑝𝑝𝐸𝐸𝑝𝑝𝑃𝑃𝑃𝑃𝑡𝑡 = 𝛽𝛽0 + 𝛽𝛽1𝑃𝑃𝑃𝑃𝑃𝑃𝑃𝑃𝑃𝑃𝑃𝑃𝑃𝑃𝑃𝑃𝑃𝑃𝑃𝑃𝑡𝑡−1 + 𝛽𝛽2𝐸𝐸𝐸𝐸𝑃𝑃𝑃𝑃𝑃𝑃𝑝𝑝𝐸𝐸𝑝𝑝𝑃𝑃𝑃𝑃𝑡𝑡−1 + 𝛽𝛽3𝑅𝑅𝑝𝑝𝑃𝑃𝑃𝑃 𝑊𝑊𝑃𝑃𝑊𝑊𝑝𝑝𝑊𝑊𝑡𝑡−1 + 𝛽𝛽4𝑀𝑀𝑃𝑃𝑃𝑃𝑃𝑃𝑀𝑀 𝑉𝑉𝑃𝑃𝑃𝑃𝑃𝑃𝑝𝑝 𝐴𝐴𝐴𝐴𝐴𝐴𝑝𝑝𝐴𝐴𝑡𝑡−1+ 𝑃𝑃𝑒𝑒𝑡𝑡
𝑅𝑅𝑝𝑝𝑃𝑃𝑃𝑃 𝑊𝑊𝑃𝑃𝑊𝑊𝑝𝑝𝑊𝑊𝑡𝑡 = 𝛾𝛾0 + 𝛾𝛾1𝑃𝑃𝑃𝑃𝑃𝑃𝑃𝑃𝑃𝑃𝑃𝑃𝑃𝑃𝑃𝑃𝑃𝑃𝑃𝑃𝑡𝑡−1 + 𝛾𝛾2𝐸𝐸𝐸𝐸𝑃𝑃𝑃𝑃𝑃𝑃𝑝𝑝𝐸𝐸𝑝𝑝𝑃𝑃𝑃𝑃𝑡𝑡−1 + 𝛾𝛾3𝑅𝑅𝑝𝑝𝑃𝑃𝑃𝑃 𝑊𝑊𝑃𝑃𝑊𝑊𝑝𝑝𝑊𝑊𝑡𝑡−1 + 𝛾𝛾4𝑀𝑀𝑃𝑃𝑃𝑃𝑃𝑃𝑀𝑀 𝑉𝑉𝑃𝑃𝑃𝑃𝑃𝑃𝑝𝑝 𝐴𝐴𝐴𝐴𝐴𝐴𝑝𝑝𝐴𝐴𝑡𝑡−1+ 𝑃𝑃𝑤𝑤𝑡𝑡
Estimation of Impact of Hurricane María
One advantage of using these models for this exercise is their ability to predict impacts of exogenous shocks. In addition to forecasting long-term growth, these models are used to estimate the persistent effects of an event such as Hurricane María. Studies of other Regions suffering

CHAPTER 2 CONTEXT: CURRENT SITUATION ASSESSMENT
Final Report December 2018 | 69
natural disasters show that post-disaster population can be slow to recover to pre-disaster trends. These models first estimate long-term population and employment forecasts based on pre-Hurricane levels, then separately estimate the impact of Hurricane María. What these models can do is tell us the trajectory of outmigration specifically due to the Hurricane, followed by the return of some residents. They determine how long population and employment levels should take to return to the trends forecasted without the impact of the Hurricane. Specifically, the model captures the persistence effect of the hurricane’s impact (generally estimated to have been a 7.7% reduction population23 in 2017).
Population
Figure 2.64 presents the formal population forecasts for the San Juan TMA. This includes historical population trends, the impacts of Hurricane María and the subsequent return to a forecasted population trend of slower population decline24.
Figure 2.64: Population Forecasts – San Juan TMA
Source: SDG Population Forecast
Table 2.10 breaks down the population forecast into temporal segments. Over the 29-year timespan, 2016-2045, population is forecasted to decline by 17.4% and analysis of CAGR points to focused population decline from 2016 to 2020. Population during this 4 year-period is forecasted to decline 1.9% annually, a reduction of close to 150,000 people. It is important to note that historically, employment in the Region has not declined at the same rate as population.
23 PR Fiscal Board 24 SDG developed its forecasting models using decennial and annual population estimates spanning 2001-2016 from the U.S. Census Bureau. Following the release of the decennial census, preceding annual population estimates are adjusted to produce intercensal estimates. SDG models do not use intercensal estimates, choosing to specify models on annual estimates, and are presented in graphics from 2010-2045.

CHAPTER 2 CONTEXT: CURRENT SITUATION ASSESSMENT
Final Report December 2018 | 70
Over the time-scale, 2016-2045, the population CAGR is reduced to -0.6%. This slowing population decline results from the relationship between employment, population, and wages present in the forecast models and discussed in the model development section. Figure 2.65 to Figure 2.66 show the forecasted 2045 population and population changes respectively.
Table 2.10: Population Forecast Growth Rates – San Juan TMA
Year PR Population Percent Change from 2016
CAGR from 2016
San Juan Population
Percent change from 2016
CAGR from 2016
2016 3,411,307 - - 2,058,458 - -
2020 3,168,498 (7.1%) (1.8%) 1,907,174 (7.3%) (1.9%)
2025 3,094,020 (9.3%) (1.1%) 1,875,705 (8.9%) (1.0%)
2040 2,929,693 (14.1%) (0.6%) 1,750,807 (14.9%) (0.7%)
2045 2,893,950 (15.2%) (0.6%) 1,712,058 (16.8%) (0.6%)
Source: SDG Population Forecast
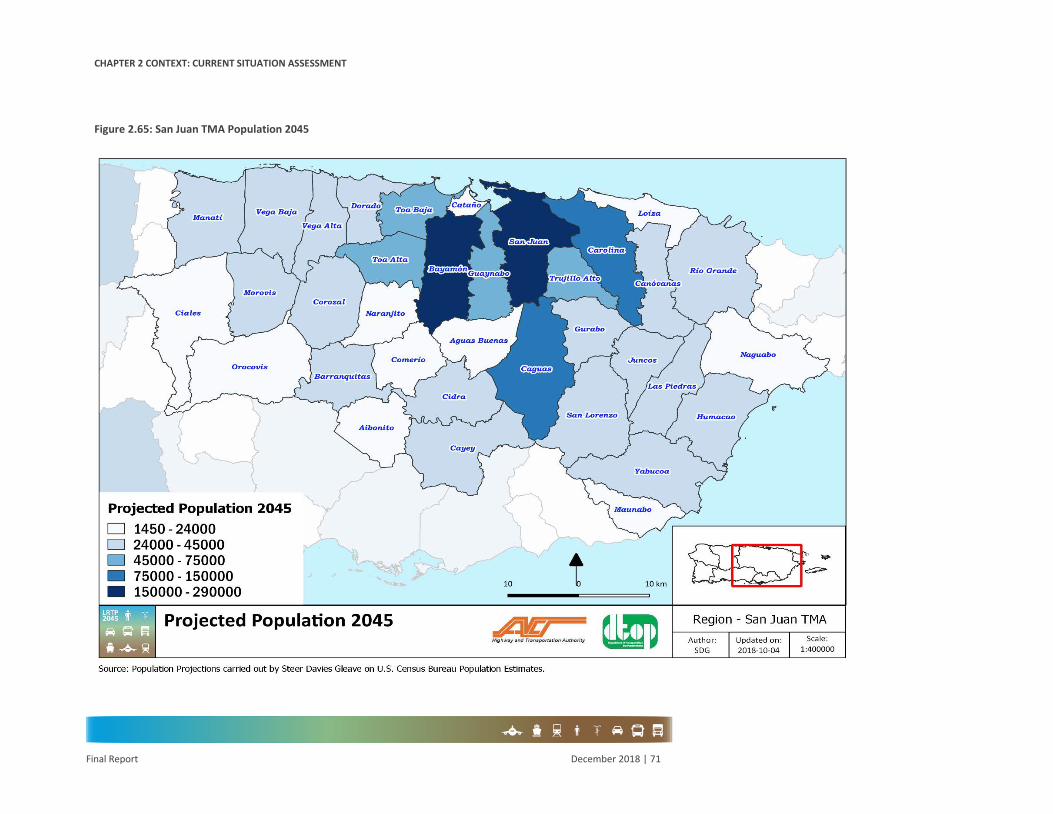
CHAPTER 2 CONTEXT: CURRENT SITUATION ASSESSMENT
Final Report December 2018 | 71
Figure 2.65: San Juan TMA Population 2045

CHAPTER 2 CONTEXT: CURRENT SITUATION ASSESSMENT
Final Report December 2018 | 72
Figure 2.66: San Juan TMA Population Change 2016-2045

CHAPTER 2 CONTEXT: CURRENT SITUATION ASSESSMENT
Final Report December 2018 | 73
Employment
Two employment data sources were used to produce final forecasts of employment by municipality. The ultimate data source was the BLS -LAUS which encompasses all employment including agricultural employment and the self-employed. BLS LAUS displays employment by place of residence. While useful for many types of analyses, employment by home location was not ideal for much of the modelling, which required employment by place of work. For example, employment by place of work is required as inputs to the trip generation phase.
The LAUS data was the reference point in terms of total employment for Puerto Rico, as it includes the broadest coverage of employment categories. In the base 2010 dataset at the Traffic Analysis Zone (TAZ) level, the BLS LAUS employment was the reference data but it was transformed into employment by place of work using journey-to-work information. The approach is to base the analysis on this 2010 employment transformed from place of residence to place of work which matches the 2010 employment totals for Puerto Rico reported in the LAUS.
The BLS Quarterly Census of Employment and Wages (QCEW) was used to update the 2010 base data to 2016, however the dataset does not include agricultural employment or the self-employed. The BLS QCEW is reported by place of work and is available for historical years 2001-2016, which allowed for the generation of forecasting models to update the 2010 data by TAZ. The QCEW was not used for employment totals, as the coverage is more limited than the LAUS.
In short, while the QCEW is preferable to generate models of growth it is not preferable as an indicator of total employment (which is essential for trip generation). For this reason, the total employment numbers for 2016 used in the econometric models for forecasting are lower than the total 2016 employment numbers from the 2016 TAZ level employment dataset.
Figure 2.67 presents the formal employment forecasts for the San Juan TMA. This includes historical employment trends, the impacts of Hurricane María, and a slight forecasted employment decline into the future. The impacts of Hurricane María were less dramatic in San Juan than in other Regions. San Juan, as an economic hub, and where initial efforts for hurricane recovery were focused, was more insulated to the economic shock of María than other regional areas.

CHAPTER 2 CONTEXT: CURRENT SITUATION ASSESSMENT
Final Report December 2018 | 74
Figure 2.67: Indexed Employment Forecasts – San Juan TMA – Indexed Growth (Index = 2010)
Source: SDG Employment Forecast
Table 2.11 breaks down the employment forecast dynamics into temporal segments. Over the timespan, 2016-2045, employment is forecasted to decline by 14.6%, with focused employment decline from 2016-2020, a reduction of just over 30,000 jobs. This is largely a result of Hurricane María impacts compounding upon existing trends. Over the time-scale, 2016-2045, the employment CAGR is reduced close to -0.5%, a display of slowing employment decline and the potential for eventual economic growth. Figure 2.68 and Figure 2.69 show forecasted employment totals and changes over time respectively.
Table 2.11: Employment Forecast Growth Rates – San Juan TMA
Year Employment Percent change from 2016 CAGR from 2016
2016 610,178 - -
2020 578,312 (5.2%) (1.3%)
2025 569,214 (6.7%) (0.8%)
2040 532,579 (12.7%) (0.6%)
2045 520,792 (14.6%) (0.5%)
Source: SDG TAZ Level Employment Forecast

CHAPTER 2 CONTEXT: CURRENT SITUATION ASSESSMENT
Final Report December 2018 | 75
Figure 2.68: San Juan TMA Employment 2045

CHAPTER 2 CONTEXT: CURRENT SITUATION ASSESSMENT
Final Report December 2018 | 76
Figure 2.69: San Juan TMA Employment Change 2016-2045

CHAPTER 2 CONTEXT: CURRENT SITUATION ASSESSMENT
Final Report December 2018 | 77
TRANSPORTATION SYSTEM Highways
Roadway System
The San Juan TMA model network for 2016 has a total of 4,371 route miles (bi-directional), 5,636 lane miles and 29.9 Million daily vehicle miles, as extracted from the 2016 LRTP model calibration25. Figure 2.70 show the San Juan TMA regional highway system as defined by the Transportation National Highway System (NHS) system and non-NHS system.
For an additional level of detail; Table 2.12 and Figure 2.71 display roadway network functional classifications according to the Puerto Rico Department of Transportation NHS information layer. The goal of this classification is to define the role of a roadway in the overall roadway network.
Table 2.12: Roadway System by Functional Classification – Puerto Rico
Functional Classification Route Miles Interstate 221.75 Freeways and Expressways 96.98 Principal Arterials 387.49 Local Principal Arterials 5.47 Minor Arterials 3.36
Source: 2045 LRTP Plan Development
FHWA defined each one of the functional classification categories as follows:
• Interstate: they are designed and built considering mobility and long-distance travel, andthey are the highest classification of Arterials;
• Other Freeways and Expressways: They are designed and built to increase mobility function,and adjoining land uses are not directly served by them; access and egress points are limitedto on- and off-ramp locations or a limited number of at-grade intersections; and they havedirectional travel lanes, usually separated by some type of physical barrier;
• Principal Arterials: serve main centers of metropolitan areas, offer both high mobilitydegree and mobility through rural areas; and adjoining land uses can be served directly;
• Minor Arterial: provide connectivity to the higher Arterial system and service for trips ofmoderate length; also serve geographic areas;
• Major Collector: provide more mobility, might have more travel lanes, have higher annualaverage traffic volumes and speed limits, have lower connecting driveway densities, arelonger in length and are spaced at greater intervals than their Minor Collector counterparts;and
• Minor Collector: offer less mobility and more access than their Major Collectorcounterparts. Also, they serve both land access and traffic circulation in lower density
25 These include all classifications but connectors therefore minor road values are omitted in these numbers.

CHAPTER 2 CONTEXT: CURRENT SITUATION ASSESSMENT
Final Report December 2018 | 78
residential and commercial/industrial areas instead of the higher density service in Major Collectors.
There is a complex non-NHS system within the Island (local system) due to their provision of direct access to adjoining land, they are not intended for use in long distance travel, except at the origin or destination end of the trip26
The San Juan TMA map shown in Figure 2.71 illustrates the 2016 road network in the San Juan TMA Region as it is described on the National Highway System 2018 layer; more detail of the San Juan Municipality and surrounding Municipalities (San Juan TMA Central Area) roadways is shown in Figure 2.72. The Region has an extensive network of principal arterials and expressways interconnecting the three primary interstates that lead into/out of San Juan. The main highways extending within the San Juan metropolitan area and into the south, east and west municipalities are Interstates PRI-1: composed of PR-52 and PR-18; PRI-2: composed of PR-22 and PR-2; PRI-3: composed of PR-3, PR-26, PR-53 and PR-66; PR-18 serves as a connecting expressway for PR-22, PR-23, PR-21, PR-17, PR-1 and PR-52. East of San Juan Central Area the main roads are PR-26, PR-3 and PR-66 with PR-5, PR-20 and PR-22 to the west.
A description of the interstate, freeways and expressway and principal arterial roads for the San Juan TMA is included below:
Interstates
• PRI-1:• PR-18: A north to south 6 km long expressway which runs through the heart of the San
Juan municipality perpendicular to PR-23 and PR-17 and ending on PR-1 at km 6; itconnects PR-22 to PR21, PR-1 and PR-52.
• PR-52: Highway PR-52 (Luis A. Ferré Highway), commences at the intersection of PR-18and PR-1 and runs south and then west for 108.3 km, it connects the municipality of SanJuan with the municipalities of Trujillo Alto, Caguas, Cayey within the San Juan TMA andleading into Salinas, Santa Isabel, Juana Díaz and ends in Ponce outside the Region.
• PRI-2:• PR-2: The road travels the whole north and west of the Island starting in Santurce (San
Juan) intersecting PR-22 at various points along the way. It connects the municipalities ofGuaynabo, Bayamón, Toa Baja, Dorado, Vega Alta, Vega Baja and Manatí which lie insidethe San Juan Region. The road extends beyond the San Juan Region to Hatillo where ittakes over PR-22 as Interstate and it keeps going west until it reaches Aguadilla then itturns south to Mayagüez and Hormigueros after which it turns east to Ponce andconnects with PR-52.
• PR-22: Also known as José De Diego Expressway, PR-22 is 83.7 km long highway thatoriginates at PR-26, it connects San Juan to the west municipalities traveling through
26 U.S. Department of Transportation. Federal Highway Administration. Office of Planning, Environment, and Realty (HEP).

CHAPTER 2 CONTEXT: CURRENT SITUATION ASSESSMENT
Final Report December 2018 | 79
Cataño, Bayamón, Toa Baja, Dorado, Vega Alta, Vega Baja and Manatí eventually reaching Barceloneta, Arecibo and Hatillo which lie outside the Region.
• PRI-3:• PR-3: PR-3 is a 159.2 km road that connects the San Juan TMA where it runs for 38.8 km
with the east and south municipalities, it connects San Juan, Carolina, Canóvanas, RioGrande, Luquillo, Fajardo, Ceiba, Naguabo, Humacao, Yabucoa, Maunabo, Patillas,Arroyo, Guayama and Salinas. It alternates between various classifications but it isprimarily a primary arterial that forms part of the interstate system from PR-66intersection in Rio Grande to Fajardo and intermittently from Yabucoa to Guayama.
• PR-26: Román Baldorioty de Castro Expressway runs for 15.5 km between San AntonioBridge in San Juan and the start of PR-3 in Carolina. The road has a tangent segment withPR-37 at Cangrejo Arriba Barrio27 and exits to PR-187 which leads to Loíza.
• PR-53: José Celso Barbosa Highway is a 59.3 km long road that commences in Fajardo andintersects the San Juan Region after exiting Ceiba on the southeast corner, in here it goesfrom Naguabo to Yabucoa where it connects to Maunabo through PR-901. This highwayis incomplete, as of 20176 it has additional intermittent segments on the municipalitiesof Salinas, Guayama, Arroyo and Patillas.
• PR-66: Roberto Sánchez Vilella Highway, leads east with 14.1 km in length. The roadstarts at the PR-3 Intersection and extends through Carolina, Canóvanas and ends on PR-3 in Rio Grande.
Freeways and Expressways
• PR-5: Is classified as an expressway but also as a principal arterial that is 14.8 km in length, itstarts at Puntilla in Cataño and heads southwest intersecting PR-165 and PR-22 where it becomesan expressway for 2.4 km then it becomes a toll road between PR-2 and PR-199 where it ends.This is an unfinished expressway which has proposed plans to connect directly to PR-167.
• PR-17: Avenida Jesús T. Piñero, also colloquially as Avenida Central, is an 11.6 principal arterialthat runs from PR-20 in San Juan extending north across the San José Lagoon through theTeodoro Moscoso Toll Bridge and ending on PR-26 in Carolina at the Luis Muñoz MarinInternational Airport. (Within the HPMS 2017 layer the road combines a 4.2 km principal arterialstreet into an expressway that runs for 7.46 km from San Juan at the PR-18 Intersection andextends north across the San José Lagoon).
• PR-21: Jose Kiko Custodio Avenue is a 1.2 km Expressway that runs from PR-1 to PR-18 in SanJuan (Within the HPMS layer the road then turns into an arterial street that ends at PR-20)
• PR-30: Cruz Ortiz Stella Expressway starts at PR-1 in Caguas and extends 30.7 km ending in PR-53in Humacao, the road effectively connects Caguas to Gurabo, Juncos, Las Piedras and Humacao.
28 Highway Capacity Manual (2010).

CHAPTER 2 CONTEXT: CURRENT SITUATION ASSESSMENT
Final Report December 2018 | 80
Principal Arterials
• PR-23: Franklin Delano Roosevelt Avenue is a principal arterial that starts at Hato Rey Central, itgoes west for 5.7 km toward PR-2 and intersects PR-21 along the way.
• PR-165: Also named El Caño Avenue is a 5.78 km road that is classified as an Expressway (on the2017 Highway Performance Monitoring System or HPMS it is classified as both a Principal Arterialoutside of Guaynabo and an Expressway within Guaynabo), it starts at PR-888 in Cataño, itconnects Bayamón and Guaynabo and ends at the intersection of PR-22 and PR-23 in San Juan.
• PR-167: A 28.6 km long northbound principal arterial that commences in Comerío it passesthrough Naranjito, Toa Alta and crosses through the middle of Bayamón until it reaches PR-165.
• PR-177: Starts at Minillas Barrio in Bayamón at the intersection with PR-174; it goes east towardsSan Juan for 10.8 km and it has access and egress points on PR-20, PR-1 and PR-52 and ends atPR-176.
• PR-181: Is a 72.8 km long road that starts at Patillas, it travels north through San Lorenzo,Gurabo, Trujillo Alto and into San Juan. It is classified as a principal arterial at km 65 past theIntersection with PR-175 in Trujillo Alto. (within the HPMS the last kilometers are classified as anExpressway and is also known as Manuel Rivera Morales-El Olímpico Expressway.)PR-199: At present, PR-199 starts at PR-167 in Bayamón where it runs for 6.9 km and connectsPR-167 to the PR-5 Toll Road. The road is interrupted here and continues in Guaynabo at the startof Connector Los Filtros, the road then continues east towards Trujillo Alto, it crosses PR-20, PR-1,PR-52, PR-176, PR-845, PR-846 and ends at PR-181 in Trujillo Alto.

CHAPTER 2 CONTEXT: CURRENT SITUATION ASSESSMENT
Final Report December 2018 | 81
Figure 2.70: San Juan Region Roadways by NHS identification

CHAPTER 2 CONTEXT: CURRENT SITUATION ASSESSMENT
Final Report December 2018 | 82
Figure 2.71: San Juan Region Roadways by Functional Classification

CHAPTER 2 CONTEXT: CURRENT SITUATION ASSESSMENT
Final Report December 2018 | 83
Figure 2.72: San Juan Region Roadways (Central Area)

CHAPTER 2 CONTEXT: CURRENT SITUATION ASSESSMENT
Final Report December 2018 | 84
Effect of Hurricane María on Roadway System
As a consequence of Hurricane María’s landfall in Puerto Rico on September 2017, the roadway infrastructure was damaged by flooding, debris and landslides. 388 bridges (189 in San Juan TMA) were reported with damages out of which 26 of these were reported as collapsed, 31 with failure in approach and the rest with other reported damages. Damaged bridges by municipalities are included in Table 2.13.
Table 2.13: Bridges Over Waterways with Reported Damages due to María in San Juan TMA
Municipality Bridges with Reported Damages due to María Total Number or Bridges
Percentage of Damaged Bridges
Aguas Buenas 5 13 38.5%
Aibonito 5 15 33.3%
Barranquitas 10 14 71.4%
Bayamón 12 62 19.4%
Caguas 8 58 13.8%
Canóvanas 12 25 48.0%
Carolina 6 47 12.8%
Cayey 10 56 17.9%
Ciales 6 18 33.3%
Cidra 3 19 15.8%
Comerío 1 16 6.3%
Corozal 6 25 24.0%
Guaynabo 3 33 9.1%
Humacao 9 46 19.6%
Las Piedras 10 18 55.6%
Loíza 3 5 60.0%
Manatí 1 7 14.3%
Maunabo 2 19 10.5%
Morovis 8 14 57.1%
Naguabo 11 40 27.5%
Naranjito 2 17 11.8%
Orocovis 11 18 61.1%
Río Grande 5 37 13.5%
San Juan 6 91 6.6%
San Lorenzo 7 50 14.0%
Toa Alta 4 14 28.6%
Toa Baja 6 20 30.0%
Trujillo Alto 2 11 18.2%
Vega Alta 2 10 20.0%
Vega Baja 1 13 7.7%
Yabucoa 12 38 31.6%
Total 189 869 21.7%
Puerto Rico 388 1774 21.9%
Source: Puerto Rico Highways and Transportation Authority
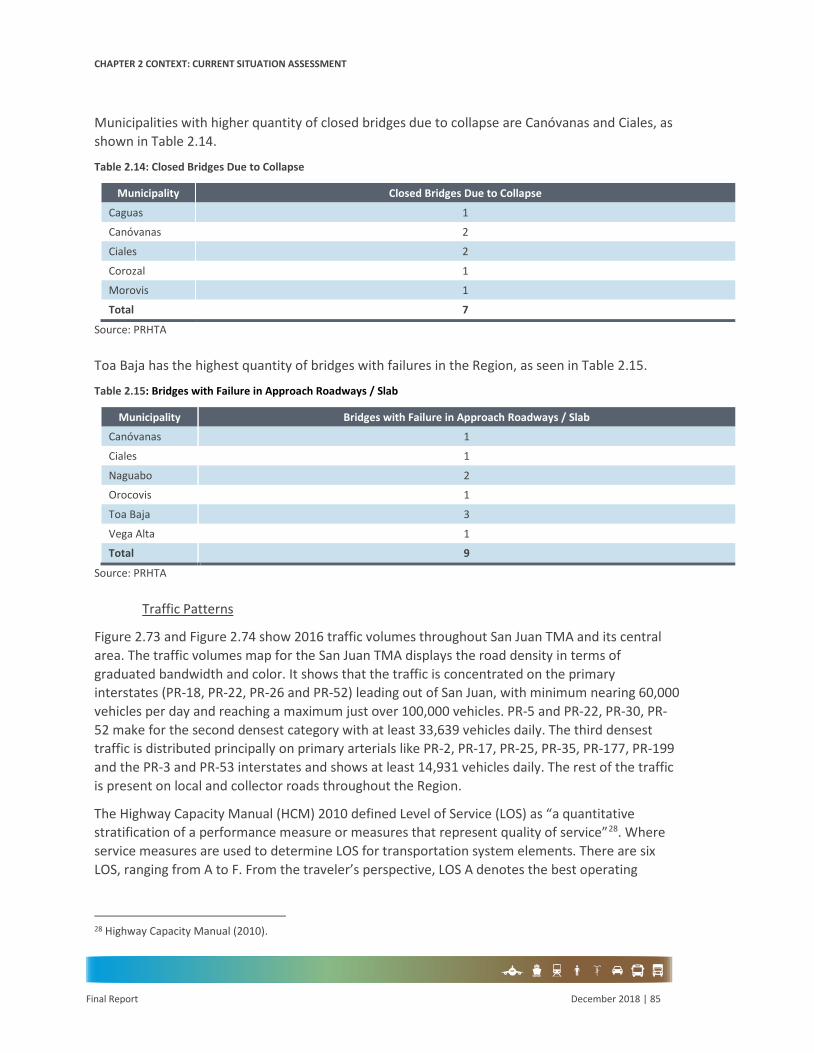
CHAPTER 2 CONTEXT: CURRENT SITUATION ASSESSMENT
Final Report December 2018 | 85
Municipalities with higher quantity of closed bridges due to collapse are Canóvanas and Ciales, as shown in Table 2.14.
Table 2.14: Closed Bridges Due to Collapse
Municipality Closed Bridges Due to Collapse
Caguas 1
Canóvanas 2
Ciales 2
Corozal 1
Morovis 1
Total 7
Source: PRHTA
Toa Baja has the highest quantity of bridges with failures in the Region, as seen in Table 2.15.
Table 2.15: Bridges with Failure in Approach Roadways / Slab
Municipality Bridges with Failure in Approach Roadways / Slab
Canóvanas 1
Ciales 1
Naguabo 2
Orocovis 1
Toa Baja 3
Vega Alta 1
Total 9
Source: PRHTA
Traffic Patterns
Figure 2.73 and Figure 2.74 show 2016 traffic volumes throughout San Juan TMA and its central area. The traffic volumes map for the San Juan TMA displays the road density in terms of graduated bandwidth and color. It shows that the traffic is concentrated on the primary interstates (PR-18, PR-22, PR-26 and PR-52) leading out of San Juan, with minimum nearing 60,000 vehicles per day and reaching a maximum just over 100,000 vehicles. PR-5 and PR-22, PR-30, PR-52 make for the second densest category with at least 33,639 vehicles daily. The third densest traffic is distributed principally on primary arterials like PR-2, PR-17, PR-25, PR-35, PR-177, PR-199 and the PR-3 and PR-53 interstates and shows at least 14,931 vehicles daily. The rest of the traffic is present on local and collector roads throughout the Region.
The Highway Capacity Manual (HCM) 2010 defined Level of Service (LOS) as “a quantitative stratification of a performance measure or measures that represent quality of service”28. Where service measures are used to determine LOS for transportation system elements. There are six LOS, ranging from A to F. From the traveler’s perspective, LOS A denotes the best operating
28 Highway Capacity Manual (2010).

CHAPTER 2 CONTEXT: CURRENT SITUATION ASSESSMENT
Final Report December 2018 | 86
conditions and LOS F the worst. LOS for vehicles are determined, based on the HCM, using density calculation; nonetheless, a volume over capacity (v/c) calculation was used to determine LOS in the model considering the model does not provide link specific volumes but rather trip volumes between nodes. Table 2.16 shows LOS criteria for Freeway facilities as a function of volume to capacity ratio based on HCM 2000 that interrelate v/c LOS with (HCM 2010) Density LOS definitions.
Table 2.16: LOS Criteria as a Function of Volume Capacity Ratio
Level of Service v/c A < 0.34 B 0.34 - 0.56 C 0.56 - 0.76 D 0.76 - 0.90 E 0.90 - 1 F > 1
Source: HCM 2000
Figure 2.75 and Figure 2.76 present 2016 LOS throughout the San Juan TMA and its central area based on information from the calibrated network model for the average day period. LOS E and F are mainly observed on the Freeways, Highways and Principal Arterials within the San Juan TMA including:
• PR-2;• PR-3;• PR-5;• PR-8;• PR-17;• PR-18;• PR-20;• PR-22;• PR-26;• PR-30;
• PR-52;• PR-142;• PR-165;• PR-167;• PR-174;• PR-177;• PR-181;• PR-199;• PR-861; and• PR-867.

CHAPTER 2 CONTEXT: CURRENT SITUATION ASSESSMENT
Final Report December 2018 | 87
Figure 2.73: San Juan TMA Traffic Volumes 2016

CHAPTER 2 CONTEXT: CURRENT SITUATION ASSESSMENT
Final Report December 2018 | 88
Figure 2.74: San Juan TMA Central Area Traffic Volumes 2016

CHAPTER 2 CONTEXT: CURRENT SITUATION ASSESSMENT
Final Report December 2018 | 89
Figure 2.75: San Juan TMA Levels of Service 2016; Average Day

CHAPTER 2 CONTEXT: CURRENT SITUATION ASSESSMENT
Final Report December 2018 | 90
Figure 2.76: San Juan TMA Central Area Levels of Service 2016; Average Day

CHAPTER 2 CONTEXT: CURRENT SITUATION ASSESSMENT
Final Report December 2018 | 91
Regional Freight Network
Puerto Rico’s freight comes mainly from San Juan TMA since this is the location of the main cargo port of the Island (load movement in Region’s ports will be explained later in this section). Supplies for markets enters Puerto Rico through seaports and airports. Trade represent 7.5% of the Puerto Rico’s GDP using 23.7% of labor force, as shown in Table 2.17.
Table 2.17: Gross Domestic Product and Labor Force Composition by Economic Sector
Economic Sector GDP Composition by Sector (2015) Labor Force by Occupation (2016)
Manufacturing 46.9% 8.4%
Finance, Insurance and Real State 20.9% 4.3%
Services 12.9% 34.9%
Trade 7.5% 23.7%
Government 7.1% 18.9%
Transportation and Other Public Utilities 2.9% 4.3% Construction and Mining 1.1% 3.4% Agriculture 0.8% 1.5%
Source: Puerto Rico Fiscal Agency and Financial Advisory Authority
Figure 2.77 and Figure 2.78 show the freight network in the San Juan TMA and its central area. The network is shown as defined from the FHWA and consists of the primary interstate system and other principal arterials that provide access to town centers. The primary highways that make up the network are: PR-3, PR-17, PR-18, PR-20, PR-22, PR-26, PR-30, PR 52, PR-53 and PR 66. In addition, it also has the following principal arterials: PR-2, PR-5, PR-60 PR-165, PR-199.
Figure 2.79 and Figure 2.80 display truck activity in the San Juan TMA Region as a graduated color graph that represents daily vehicle traffic in terms of a truck volume to total vehicle volume ratio, categorized in three classes: Less than 5%; Between 5% and 10%; and Greater than 10%.
The map illustrates how truck traffic is increased on the primary interstate highways. It can also be observed increased traffic around ports, industrial zones which is expected and perhaps less obvious in minor arterial roads crossing town centers. Some roads outside of the defined freight network with long segments have over 10% truck traffic for example PR-185.
Figure 2.81 and Figure 2.82 show freight network hotspots in the San Juan TMA, indicating sections of the road where traffic is operating at or over the capacity of the road and at the same time being highly used by trucks. These roads mainly include the interstate roads PR-22 and PR-52 in addition to other Principal Arterials like PR-1, PR-2, PR-3, PR-20, PR-26 and PR-177. There are also hotspots in other minor arterials throughout the region.

CHAPTER 2 CONTEXT: CURRENT SITUATION ASSESSMENT
Final Report December 2018 | 92
Figure 2.77: San Juan TMA Freight Network

CHAPTER 2 CONTEXT: CURRENT SITUATION ASSESSMENT
Final Report December 2018 | 93
Figure 2.78: San Juan TMA Freight Network Central Area

CHAPTER 2 CONTEXT: CURRENT SITUATION ASSESSMENT
Final Report December 2018 | 94
Figure 2.79: San Juan TMA Existing Truck Activity
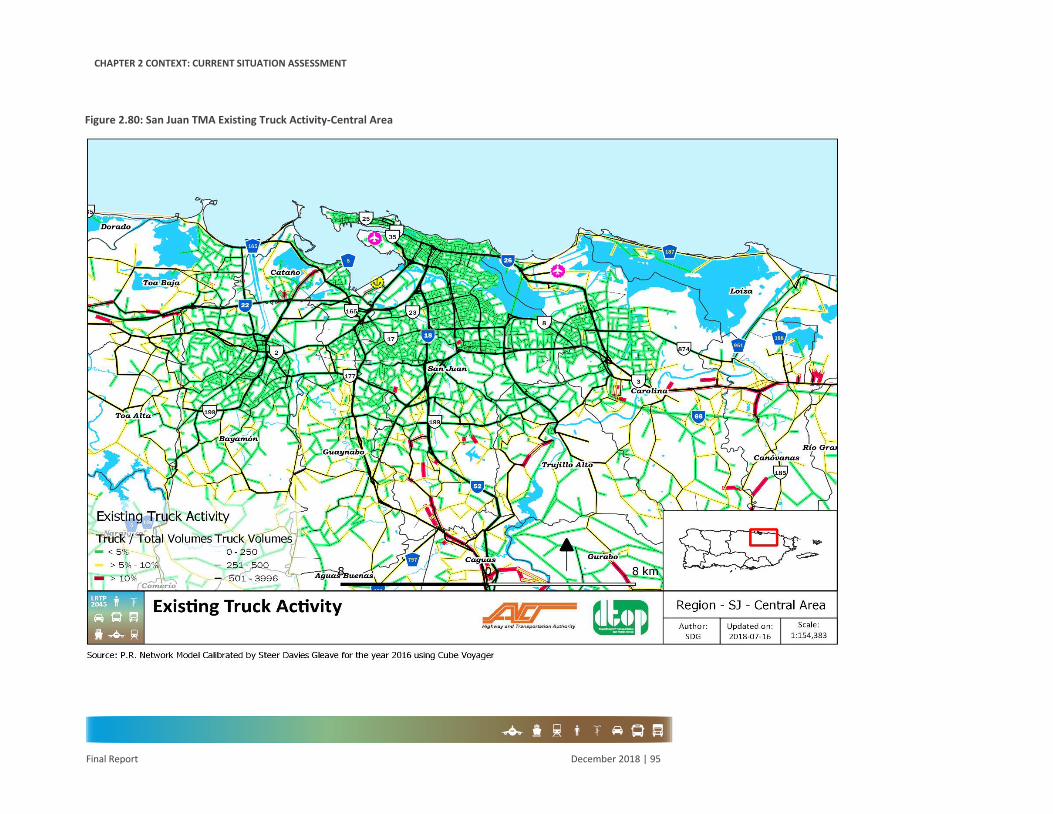
CHAPTER 2 CONTEXT: CURRENT SITUATION ASSESSMENT
Final Report December 2018 | 95
Figure 2.80: San Juan TMA Existing Truck Activity-Central Area

CHAPTER 2 CONTEXT: CURRENT SITUATION ASSESSMENT
Final Report December 2018 | 96
Figure 2.81: San Juan TMA Freight Network Hotspots

CHAPTER 2 CONTEXT: CURRENT SITUATION ASSESSMENT
Final Report December 2018 | 97
Figure 2.82: San Juan TMA Freight Network Hotspots Central Area
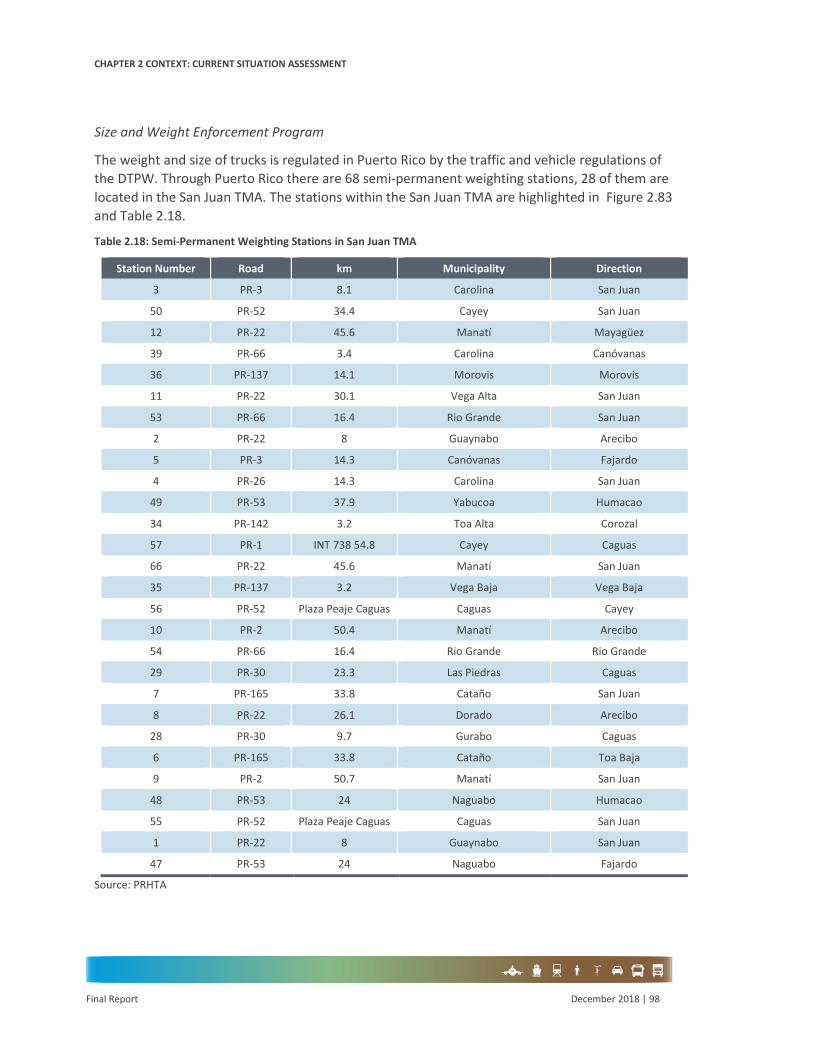
CHAPTER 2 CONTEXT: CURRENT SITUATION ASSESSMENT
Final Report December 2018 | 98
Size and Weight Enforcement Program
The weight and size of trucks is regulated in Puerto Rico by the traffic and vehicle regulations of the DTPW. Through Puerto Rico there are 68 semi-permanent weighting stations, 28 of them are located in the San Juan TMA. The stations within the San Juan TMA are highlighted in Figure 2.83 and Table 2.18.
Table 2.18: Semi-Permanent Weighting Stations in San Juan TMA
Station Number Road km Municipality Direction
3 PR-3 8.1 Carolina San Juan
50 PR-52 34.4 Cayey San Juan
12 PR-22 45.6 Manatí Mayagüez
39 PR-66 3.4 Carolina Canóvanas
36 PR-137 14.1 Morovis Morovis
11 PR-22 30.1 Vega Alta San Juan
53 PR-66 16.4 Rio Grande San Juan
2 PR-22 8 Guaynabo Arecibo
5 PR-3 14.3 Canóvanas Fajardo
4 PR-26 14.3 Carolina San Juan
49 PR-53 37.9 Yabucoa Humacao
34 PR-142 3.2 Toa Alta Corozal
57 PR-1 INT 738 54.8 Cayey Caguas
66 PR-22 45.6 Manatí San Juan
35 PR-137 3.2 Vega Baja Vega Baja
56 PR-52 Plaza Peaje Caguas Caguas Cayey
10 PR-2 50.4 Manatí Arecibo
54 PR-66 16.4 Rio Grande Rio Grande
29 PR-30 23.3 Las Piedras Caguas
7 PR-165 33.8 Cataño San Juan
8 PR-22 26.1 Dorado Arecibo
28 PR-30 9.7 Gurabo Caguas
6 PR-165 33.8 Cataño Toa Baja
9 PR-2 50.7 Manatí San Juan
48 PR-53 24 Naguabo Humacao
55 PR-52 Plaza Peaje Caguas Caguas San Juan
1 PR-22 8 Guaynabo San Juan
47 PR-53 24 Naguabo Fajardo
Source: PRHTA

CHAPTER 2 CONTEXT: CURRENT SITUATION ASSESSMENT
Final Report December 2018 | 99
Figure 2.83: Semi Permanents Weighing Stations in San Juan TMA

CHAPTER 2 CONTEXT: CURRENT SITUATION ASSESSMENT
Final Report December 2018 | 100
Transit
Law 123-2014 created the Puerto Rico Integrated Transit Authority (PRITA) and authorizes the PRHTA to transfer operations, assets, rights, obligations, and funds related to Tren Urbano (TU) and the transit programs. In addition, it included the Metropolitan Bus Authority (Autoridad Metropolitana de Autobuses, AMA) bus routes and the Maritime Transportation Authority (MTA) to this new Authority. As provided by the law, PRITA works with the management and operational aspects of integration, to obtain the required state and federal consents and approvals that make it possible to formalize the corresponding transit systems integration. The mission of the agency is to provide the citizens with greater and better facilities for transit to ensure the effective mobility of people and goods; promote economic and social growth in the areas around the TU stations, AMA bus terminals and intermodal or multimodal stations29.
The San Juan TMA is the Region with the most varied transit services provision in Puerto Rico. It includes the only rail system in the Island (TU), as well as all the AMA bus routes, Público service and Municipal services.
Tren Urbano
Tren Urbano is a mass transportation system that connects the municipalities of San Juan, Guaynabo and Bayamón, running on a 17.52km (10.7 miles) line. This transit system has 16 stations (elevated, at level and underground), as shown in Figure 2.84.
San Juan
San Juan is the municipality that contains the most TU stations, with a total of 12. These stations include:
• Sagrado Corazón: This elevated station is located to the south of Santurce Barrio,between two major Avenues: Ponce de León (PR-25) and Manuel Fernández Juncos (PR-35). The station serves as a major intermodal transit station, including a bus terminal withmore than 10 AMA bus routes and some Público routes as well. It is the station with thehighest average daily passenger boarding with almost 3,00030. Also, it is one of thestations with a park and ride facility.
• Hato Rey: This elevated station is one of three that is located in Hato Rey Norte. It islocated in Arterial B Avenue, parallel to Luis Muñoz Rivera Avenue (PR-1), right in thefinancial district of Hato Rey. A major attraction of this station is it closeness to theColiseum José Miguel Agrelot. There are no direct connections from any AMA bus routesto the station but there are 4 routes that have stops close by. There is a connection tothe ferry services which has a route from Hato Rey to Old San Juan, however this route isnot operating as of July 2018.
• Roosevelt: Also located in Hato Rey Norte, at the intersection of Luis Muñoz RiveraAvenue (PR-1) and Franklin Delano Roosevelt Avenue (PR-23). The station serves someprivate universities and colleges in the area including the Puerto Rico Polytechnic
29 http://www2.pr.gov/presupuestos/Presupuesto2015-2016/PresupuestosAgencias/285.htm.
30 According to the SDG Analysis of Indicadores PR.

CHAPTER 2 CONTEXT: CURRENT SITUATION ASSESSMENT
Final Report December 2018 | 101
University. There is one AMA service that connects with the station, Route T-2 and another route that passes close to the station, Route C-1.
• Domenech: This elevated station is one of three that is located in Hato Rey Norte, at LuisMuñoz Rivera Avenue (PR-1) in the intersection of Guayama Street; right in front of thestation are the administrative offices of the Department of Labor and Human Resources.There is one AMA bus route that connects directly with the station, Route C-1.
• Piñero: This elevated station is located in the Hato Rey Sur Barrio, between two majorAvenues: Ponce de León (PR-25) and Luis Muñoz Rivera (PR-1), north of Jesus T. PiñeroAvenue (PR-17). The station has a AMA bus terminal that includes 4 routes: Route E-40,Route T-8, Route T-41 and Route D-26.
• Universidad: This underground station is located in Universidad Barrio, in Ponce de LeónAvenue (PR-25) underneath the University of Puerto Rico (UPR) Rio Piedras Campus. Thethree AMA bus routes that serve this station are Route T-8, Route D-26 and Route C-1.
• Río Piedras: This underground station is located in Pueblo Barrio, in Ponce de LeónAvenue (PR-25) in the urban center of Río Piedras. This station has the second highestaverage daily boarding in San Juan Municipality with almost 2,00031. However, the stationis 4th in total daily boarding in the whole system. There are no direct AMA bus routes thatconnect with the station but there are 2 routes that are very close in José N. GándaraAvenue. Also, less than ½ mile away there are three different transit terminals (TerminalSur, Terminal Este and Capetillo) which include AMA bus routes, some Público routes andRed Conecta trolley routes (San Juan Trolley System).
• Cupey: This elevated station is located in el Cinco Barrio, between Luis Muñoz RiveraAvenue (PR-1) and José Kiko Custodio Avenue (PR-21). The station is located betweenUniversidad Metropolitana (UMET) Campus and the community of Villa Nevarez.Additionally, there are some government buildings including Molecular Sciences andResearch Building from the UPR and the Department of Natural Resources. This is amultimodal transfer station that connects 5 AMA bus routes including Route D-13, RouteD-15, Route D-18, Route T-7, and Route T-9. Also, this station has a park and ride facility.
• Centro Médico: This ground level station is one of two stations located in MonacilloUrbano Barrio, in one of the main entrances of Centro Médico, the biggest and mostimportant hospital conglomerates in Puerto Rico also holding the School of Medicine ofthe UPR. There are no AMA Bus routes that pass through this station, there is however atrolley transit route from the Municipality of San Juan that passes through this station.
• San Francisco: ln Monacillo Urbano Barrio, in José de Diego Avenue with the intersectionof José Kiko Custodio Avenue (PR-21). There are no AMA bus routes that service thisstation. It’s one of the stations with a park and ride facility.
• Las Lomas: This elevated station is one of two stations located in Gobernador PiñeroBarrio, in Street 31 SO. This station is in the residential area of Las Lomas. It’s one of thestations with the lowest average daily boarding (third to last) from the system. There areno AMA bus routes that connect with the station, but there is one route close by (RouteD-27). There is also a San Juan trolley service that connects to the station.
31 According to the SDG Analysis of Indicadores PR.

CHAPTER 2 CONTEXT: CURRENT SITUATION ASSESSMENT
Final Report December 2018 | 102
• Martínez Nadal: This at level station in Gobernador Piñero Barrio, between RafaelMartínez Nadal Expressway (PR-20) and José Kiko Custodio Avenue (PR-21). As of July2018, there are three AMA bus routes that connect with the station. They are Route T-4,Route T-8, and Route D-27. There are some trolley services that connect to the stationfrom the municipalities of Guaynabo and San Juan. This station is right next to themaintenance and garage facilities of Tren Urbano. Also, it’s one of the stations that has apark and ride facility.
Guaynabo
Guaynabo has only one station of Tren Urbano:
• Torrimar: This elevated station is located in Pueblo Viejo Barrio, between Ramírez deOrellano Avenue and Oviedo Street. It is located in a residential area (Torrimar), veryclose to a sports complex. This station is the second to last on average daily boarding. It isnot served with any other transit routes. This station has a park and ride facility.
Bayamón
Bayamón is served by three Tren Urbano stations; these are:
• Jardínes: This at ground level station is located in Juan Sánchez Barrio, between MarginalNorth Street and Marginal South Street. It is located in the residential area of Jardínes. Ithas the lowest total of average daily boardings of all the TU stations. It is not served withany other transit routes and has a park and ride facility.
• Deportivo: This elevated station is one of two located in Pueblo Barrio, within theBayamón’s sport complex parallel to PR-2. It is the third in number of average dailyboardings of the whole system. There are no direct connections with AMA bus routes,but there are two AMA services that pass close: Route T-2, Route D-92.
• Bayamón: This elevated station is located in Pueblo Barrio, parallel with Rio HondoExpressway (PR-5) in the intersection with Bobby Capó o Avenue. It is the end terminalsof Tren Urbano in the west and is the second station in total average daily boardings.There are four AMA bus services covering this point, including: Route T-2, Route D-91,Route D-92 and Route E-20 to Toa Baja (formerly known as Metro Urbano). The stationhas a park and ride facility.

CHAPTER 2 CONTEXT: CURRENT SITUATION ASSESSMENT
Final Report December 2018 | 103
Figure 2.84: Tren Urbano Alignment
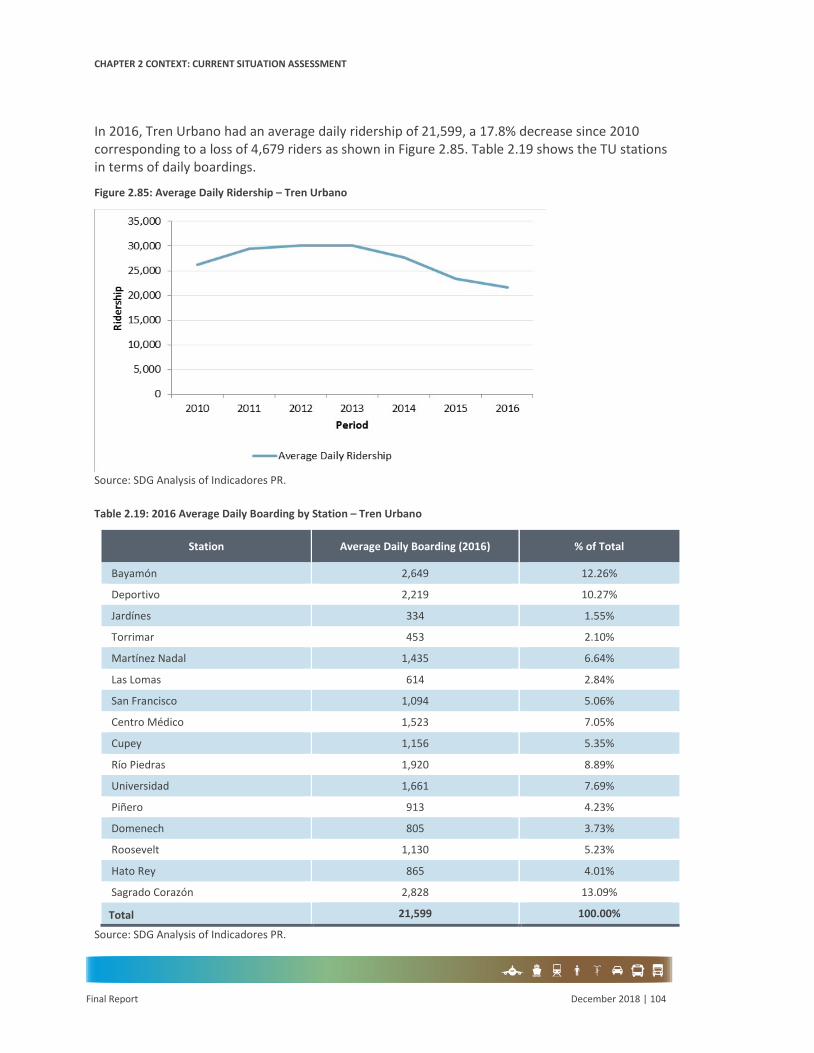
CHAPTER 2 CONTEXT: CURRENT SITUATION ASSESSMENT
Final Report December 2018 | 104
In 2016, Tren Urbano had an average daily ridership of 21,599, a 17.8% decrease since 2010 corresponding to a loss of 4,679 riders as shown in Figure 2.85. Table 2.19 shows the TU stations in terms of daily boardings.
Figure 2.85: Average Daily Ridership – Tren Urbano
Source: SDG Analysis of Indicadores PR.
Table 2.19: 2016 Average Daily Boarding by Station – Tren Urbano
Station Average Daily Boarding (2016) % of Total
Bayamón 2,649 12.26%
Deportivo 2,219 10.27%
Jardínes 334 1.55%
Torrimar 453 2.10%
Martínez Nadal 1,435 6.64%
Las Lomas 614 2.84%
San Francisco 1,094 5.06%
Centro Médico 1,523 7.05%
Cupey 1,156 5.35%
Río Piedras 1,920 8.89%
Universidad 1,661 7.69%
Piñero 913 4.23%
Domenech 805 3.73%
Roosevelt 1,130 5.23%
Hato Rey 865 4.01%
Sagrado Corazón 2,828 13.09%
Total 21,599 100.00%
Source: SDG Analysis of Indicadores PR.

CHAPTER 2 CONTEXT: CURRENT SITUATION ASSESSMENT
Final Report December 2018 | 105
Metropolitan Bus Authority (AMA)
The AMA transit bus service offers daily bus transportation in San Juan, Guaynabo, Bayamón, Cataño, Levittown (Toa Baja), Trujillo Alto, Carolina and Loíza.
The service is divided in the following 4 categories:
• Express Routes (starting with an E): limited number of stops, headways between 10 to 30minutes in peak periods and route mostly on exclusive lanes or expressways allowing forhigher speeds. This category consists of 3 services: E-10, E-20, E-40.
• Trunk routes (starting with a T): primary routes connecting Tren Urbano stations andtransit terminals with headways between 20 and 30 minutes in peak periods. Thiscategory consists of 10 routes: T-2, T-3, T-4, T-5, T-6, T-7, T-8, T-9, T-21, T-41.
• Circulation routes (starting with a C): short length routes around Tren Urbano stations ortransit terminals operating at headways between 20 and 30 minutes in peak periods. Thiscategory consists of 7 routes: C-1, C-22, C-35, C-36, C-43, C-44, C-51.
• Distribution routes (starting with a D): connecter routes between Tren Urbano or transitterminals to sub-urban or rural areas with frequencies between 30 and 90 minutes inpeak periods. Some of these routes were intended to be shared with Público services.This category consists of 10 routes: D-13, D-15, D-18, D-26, D-27, D-37, D-45, D-53, D-91,D-92.
There are a total of 30 bus routes, with 23 being operated by the AMA and 7 ran by private operator First Transit, which are divided into three categories: Metrobus, TU CONEXION, Metro Urbano. A brief description of the routes is presented here and the route alignments are shown in Figure 2.86.
• T-2: TU Bayamón Station – TU Sagrado Corazón Station
This route travels from the municipality of Bayamón onto the municipality of San Juan inSanturce. Its journey and some principal stops include the TU Bayamón station, BayamónPueblo Barrio, PR-2/Santa Rosa mall/Villa Caparra, FD Roosevelt Avenue – PR-23 / SanPatricio / Las Américas, Roosevelt TU station, Hato Rey – Milla de Oro (financial district)and Sagrado Corazón TU.
• T-4: TU Martínez Nadal Station – Cataño
This route travels from the municipality of San Juan onto the municipality of Cataño atthe ferry terminal. Its journey and some principal stops include the TU Martínez NadalStation, Altamira shopping center, Piñero Avenue (PR-17), San Patricio Avenue, PR-24 /Metro Office / City View Park, Cataño Pueblo Barrio and finally the ferry terminal ofCataño.
• T-5: Iturregui – Old San Juan
This route travels from the municipality of Carolina onto the municipality of San Juan. Itsjourney and some principal stops include the AMA bus terminal in Iturregui (Carolina),Laguna Gardens, airport Luis Muñoz Marín, Isla Verde Avenue, Loíza Street, Roberto

CHAPTER 2 CONTEXT: CURRENT SITUATION ASSESSMENT
Final Report December 2018 | 106
Sánchez Vilella Minillas Government Center, Ponce de León Avenue (PR-25), Puerta de Tierra - Del Tren Street and finally Covadonga AMA bus terminal in Old San Juan.
• T-6: Iturregui – Carolina Pueblo
This route travels across the municipality of Carolina. Its journey and some principalstops include the AMA bus terminal in Iturregui (Carolina), El Comandante Avenue,Campo Rico Avenue, Universidad del Este (UNE) Campus, Sánchez Osorio Avenue, PlazaCarolina, Roberto Clemente Avenue, Guillermo Angulo Coliseum, and finally the AMAbus terminal in Carolina Pueblo Barrio.
• T-7: Carolina Pueblo – Cupey
This route travels from the municipality of Carolina onto the municipality of San Juan inCupey. Its journey and some principal stops include the AMA bus terminal in CarolinaPueblo Barrio, Carolina city hall, 65 de Infantería Avenue (PR-3), UPR University inCarolina, Plaza Escorial, and finally the TU Cupey Station.
• T-8: Martínez Nadal – Piñero
This route travels across the municipality of San Juan. Its journey and some principalstops include the Sagrado Corazón TU station, Piñero Avenue(PR-17), Luis Muñoz Marínpark, Barbosa Avenue (PR-27), UPR University in Río Piedras, Ponce de León Avenue (PR-25) and finally Piñero TU station.
• T-9: Río Piedras – Old San Juan
This route travels across the municipality of San Juan. Its journey and some principalstops include the AMA bus terminal in Capetillo (Río Piedras), Barbosa Avenue,Borinquen Avenue, Sagrado Corazón TU Station, Fernández Juncos Avenue (PR-35)Convention Center District, Puerta de Tierra - Del Tren Street and finally Covadonga AMAbus terminal in Old San Juan.
• T-21: TU Sagrado Corazón – Old San Juan
This route travels across the municipality of San Juan. Its journey and some principalstops include the Sagrado Corazón TU station, Ponce de León Avenue (PR-25 Santurce),Roberto Sánchez Vilella Minillas Government Center, Condado sector, Ashford Avenue,Puerta de Tierra (Del Tren Street), and finally Covadonga AMA bus terminal in Old SanJuan.
• T-41: Iturregui – TU Piñero
This route travels from the municipality of Carolina onto the municipality of San Juan. Itsjourney and some principal stops include the AMA bus terminal in Iturregui (Carolina),Campo Rico Avenue, Ramal PR-8, Mall of San Juan, Simón Madera Street, De DiegoStreet, PR-47, Barbosa Avenue (PR-27), Mayagüez Street, Auxilio Mutuo Hospital, andfinally Piñero TU station.
• C-1: TU Sagrado Corazón – Río Piedras

CHAPTER 2 CONTEXT: CURRENT SITUATION ASSESSMENT
Final Report December 2018 | 107
This route travels across the municipality of San Juan. Its journey and some principal stops include the Sagrado Corazón TU station, Hato Rey – Milla de Oro (Financial District), Polytechnic University, San Juan Judicial Center, UPR Río Piedras Campus, José Gándara Avenue and finally Capetillo AMA bus terminal.
• C-43: Iturregui – Vista Mar (Carolina)
This route travels across the municipality of Carolina. Its journey and some principalstops include the AMA bus terminal in Iturregui (Carolina), Pontezuela Avenue, Vista MarExtension, Jardínes de Country Club, Galicia Avenue, Universidad del Este (UNE) CampusUniversity, PR-190 and finally El Comandante Avenue.
• C-44: Carolina – Villa Carolina
This route travels across the municipality of Carolina. Its journey and some principalstops include the AMA bus terminal in Carolina Pueblo, Sánchez Castaño Avenue, VillaCarolina, Roberto Clemente Avenue, Julia de Burgos Park, Campo Rico Avenue, Museodel Niño, and finally Calderón Avenue.
• C-51: Carolina – UPR / Escorial
This route travels across the municipality of Carolina. Its journey and some principalstops include the AMA bus terminal in Carolina Pueblo, Sánchez Castaño Avenue, Lagosde Blasina residential area, Plaza Carolina shopping center, Figaldo Díaz Avenue, Julia deBurgos Park, Monserrate Avenue, Villa Fontana residential area, PR-190, Villa Floresresidential area, UPR Carolina Campus and finally Plaza Escorial shopping center.
• D-13: TU Cupey – Interamericana
This route travels across the municipality of San Juan. Its journey and some principalstops include the Cupey TU Station, PR-176, Universidad Metropolitana (UMET), LomasVerdes Avenue(PR-177), Señorial Plaza shopping center, Interamericana University, PR-1,Las Cumbres Avenue and finally Emiliano Pol Avenue.
• D-15: TU Cupey Station – TU Sagrado Corazón Station
This route travels across the municipality of San Juan. Its journey and some principalstops include the Cupey TU station, Río Piedras, De Diego Avenue, San FranciscoHospital, PR-181N, Manuel A. Pérez housing project, Barbosa Avenue (PR-27), BoliviaStreet, Hato Rey TU Station and finally Sagrado Corazón TU Station.
• D-18: TU Cupey – Riveras de Cupey
This route travels across the municipality of San Juan. Its journey and some principalstops include the Cupey TU station, Paraná Street, Señorial Plaza shopping center,Winston Churchill Avenue, Las Cumbres Avenue (PR-199) and finally Campanilla Street.
• D-26: TU Piñero Station – Trujillo Alto
This route travels from the municipality of San Juan onto the municipality of Trujillo Alto.Its journey and some principal stops include the Piñero TU Station, Ponce de León

CHAPTER 2 CONTEXT: CURRENT SITUATION ASSESSMENT
Final Report December 2018 | 108
Avenue (PR-25), UPR University in Río Piedras, AMA bus terminal in Capetillo Río Piedras, De Diego Street, PR-181, Park Gardens and finally Venus Gardens.
• D-27: TU Martínez Nadal Station – Guaynabo
This route travels from the municipality of San Juan onto the municipality of Guaynabo. Itsjourney and some principal stops include the Martínez Nadal TU Station, MetropolitanHospital, Paz Granela Avenue, Lomas Verdes Avenue (PR-177), Camino Alejandrino Roas,PR-838, Esmeralda Avenue, Los Jardínes Shopping Center, Quijote Morales Coliseum andfinally Guaynabo Pueblo.
• D-37: Cataño – Levittown
This route travels from the municipality of Cataño onto the municipality of Toa Baja. Itsjourney and some principal stops include the ferry terminal of Cataño, Las NereidasAvenue, Vistas del Morro residential area, Comerío Avenue, PR-165, PR-167, Sábana SecaAvenue, Levittown and finally Toa Baja Governmental Center.
• D-45: TU Sagrado Corazón Station – Loíza
This route travels from the municipality of San Juan onto the municipality of Loíza. Itsjourney and some principal stops include the Sagrado Corazón TU station, SagradoCorazón, Román Baldorioty de Castro Expressway marginal, Isla Verde, Balneario deCarolina, Piñones, PR-187 and finally Loíza CDT (Medical Center).
• D-53: Old San Juan – Luis Muñoz Marín Airport
This route travels from the municipality of San Juan onto the municipality of Carolina. Itsjourney and some principal stops include the Covadonga AMA bus terminal in Old SanJuan, Puerta de Tierra – Del Tren Street, Convention Center, Condado, McLeary Street,Loíza Street, Isla Verde and finally Luis Muñoz Marín International Airport.
• D-91: TU Bayamón Station – Santa Juanita
This route travels across the municipality of Bayamón. Its journey and some principal stopsinclude the Bayamón TU Station, Bobby Capó Avenue, HIMA San Pablo Hospital, SantaRosa, Main Avenue, UPR Bayamón Campus, Driver Services Centers (Centro de Servicios alConductor, CESCO), Laurel Avenue, Santa Juanita Avenue, Hostos Avenue and finallyBayamón Regional Hospital.
• D-92: TU Bayamón Station – Magnolia
This route travels across the municipality of Bayamón. Its journey and some principal stopsinclude the Bayamón TU Station, Bayamón sports complex, PR-174, Lomas Verdes Avenue(PR-177), Bayamón lineal park, and finally Magnolia Gardens urbanized area.

CHAPTER 2 CONTEXT: CURRENT SITUATION ASSESSMENT
Final Report December 2018 | 109
Figure 2.86: AMA Fixed Route Bus Routes

CHAPTER 2 CONTEXT: CURRENT SITUATION ASSESSMENT
Final Report December 2018 | 110
Table 2.20 shows passengers per day for each AMA route from May 2016.
Table 2.20: May 2016 Daily Passengers – AMA
Routes Direction or Terminal Passengers per day
T-2 SC-BAY Sagrado Corazón to Bayamón 1,919
T-2 BAY-SC Bayamón to Sagrado Corazón 1,873
T-4 Martínez Nadal 1,130
T-5 SJ-ITU San Juan to Iturregui (Carolina) 1,789
T-5 ITU-SJ Iturregui (Carolina) to San Juan 2,303
T-6 CAR-ITU Carolina to Iturregui (Carolina) 904
T-6 ITU-CAR Iturregui (Carolina) to Carolina 996
T-7 CAR-CU Carolina to Cupey 718
T-7 CUP-CAR Cupey to Carolina 783
T-8 MN-PIÑ Martínez Nadal to Piñero 493
T-8 PIÑ-MN Piñero to Martínez Nadal 512
T-9 SJ- CUP San Juan to Cupey 1,379
T-9 CUP-SJ Cupey to a San Juan 1,329
T-21 SJ-SC San Juan to Sagrado Corazón 687
T-21 SC-SJ Sagrado Corazón to San Juan 1,057
T-41 PIÑ-ITU Piñero to Iturregui (Carolina) 916
T-41 ITU-PIÑ Iturregui to Piñero 859
C-1 Sagrado Corazón 1,464
C-43 Iturregui (Carolina) 251
C-44 Carolina 256
C-51 Carolina 137
D-13 Cupey 496
D-15 CUP-SC Cupey a Sagrado Corazón 243
D-15 SC-CUP Sagrado Corazón to Cupey 310
D-18 Cupey 272
D-26 Piñero 799
D-27 Martínez Nadal 302
D-37 ATM Cataño 186
D-45 Sagrado Corazón 656
D-53 San Juan 853
D-91 Bayamón 674
D-92 Bayamón 263
Source: Sample Data taken from AMA Report (Data from April-May 2016)

CHAPTER 2 CONTEXT: CURRENT SITUATION ASSESSMENT
Final Report December 2018 | 111
First Transit Operated Routes
First Transit operates 7 bus routes under contract with AMA including Metrobus, TU Conexión and the Metro Urbano BRT:
Metrobus
• E-10: TU Sagrado Corazón Station– Covadonga San Juan
This direct route travels across the municipality of San Juan. Its journey includes theSagrado Corazón TU Station, Puerta de Tierra - del Tren Street, and finally the AMA busterminal in Covadonga Old San Juan.
• T-3: TU Sagrado Corazón Station – Old San Juan
This route travels across the municipality of San Juan. Its journey and some principalstops include the Sagrado Corazón TU Station, Ponce de León Avenue (PR-25 Santurce),Centro de Bellas Artes, Ponce de León Avenue (PR-25 Miramar), Puerta de Tierra –DelTren Street and finally the AMA bus terminal Covadonga in Old San Juan (Figure 2.86).
TU CONEXIÓN
• E-40: TU Piñero Station – Luis Muñoz Marín Airport
This direct route travels from the municipality of San Juan onto the municipality ofCarolina. Its journey and some principal stops include the Piñero TU Station, Mall of SanJuan, and finally the Luis Muñoz Marín International Airport’s departures terminal.
• C-22
This route travels across the municipality of San Juan. Its journey and some principalstops include the Sagrado Corazón TU Station, Chardón Street, Hostos Avenue, Arterial BAvenue and finally Plaza Las Américas.
• C-35: TU Sagrado Corazón Station – Convention Center
This route travels across the municipality of San Juan. Its journey and some principalstops include the Sagrado Corazón station of Tren Urbano, Fernández Juncos Avenue(PR-35), Hipódromo Street, Hoare Street, Convention Center District, Miramar, Santurce,and finally Ponce De León Avenue (PR-25).
• C-36: TU Sagrado Corazón Station – Llorens Torres housing community
This route travels across the municipality of San Juan. Its journey and some principalstops include the Sagrado Corazón TU Station, Borinquén Avenue, Eduardo CondeAvenue, Degetau Street, Llorens Torres housing community, Loíza Street, Tapia Street,Ponce De León Avenue (PR-25 Santurce).
Metro Urbano
• E-20: TU Bayamón Station – Toa Baja

CHAPTER 2 CONTEXT: CURRENT SITUATION ASSESSMENT
Final Report December 2018 | 112
This direct route travels from the municipality of Bayamón onto the municipality of Toa Baja. Its journey is from the Bayamón TU Station to Campanilla Toa Baja (PR-22 - lot, Park-and-Ride).
Figure 2.87 shows ridership for these routes. In fiscal year 2016-2017, the highest ridership took place in May, with Metrobus routes having higher passenger loads.
Figure 2.87: Ridership, Hours and Mileage – First Transit
Source: SDG Analysis of First Transit Report (Fiscal Year 2016-2017)
Públicos
Públicos are privately owned and operated services regulated under the Public Service Commission. Services are allowed to operate specific routes but without a specific schedule. Públicos are operated under individual or franchise agreements, with fares regulated by route and special insurance requirements. Vehicle capacity varies from eight 8 to 24, and the vehicles may be owned or leased by the operator. Públicos services have charged a variety of fares and do not have specific stops.
From data obtained from the National Transit Database (NTD), it is quite evident that the Públicos system has had a significant drop in trips made in between 2010 and 2016. This can be seen in Table 2.21. From 2010 to 2016 there have been more than 20 million fewer trips carried by Públicos across Puerto Rico, a drop of nearly 50%. Another summary statistic that shows a significant reduction is the annual passenger miles which has shown a decrease from 122,570,478 in 2013 to 90,291,870 in 2016.

CHAPTER 2 CONTEXT: CURRENT SITUATION ASSESSMENT
Final Report December 2018 | 113
Figure 2.88: Público Routes in Puerto Rico

CHAPTER 2 CONTEXT: CURRENT SITUATION ASSESSMENT
Final Report December 2018 | 114
Figure 2.89: Público Routes in the San Juan TMA

CHAPTER 2 CONTEXT: CURRENT SITUATION ASSESSMENT
Final Report December 2018 | 115
Also, between Fiscal Year 2012 and Fiscal Year 2016, the Público system has lost 23% of its routes, down from 453 to 346. In the same five-year period the number of vehicles available to provide transportation services have decreased by 31%32. Similarly, sponsorship has also seen a significant decline, and is expected to continue to decrease in the absence of policies and programs aimed at stabilizing this transportation service. Figure 2.88 presents the Público routes in Puerto Rico.
Table 2.21: Percent Change of Annual Unlinked Trips for Públicos from 2010 to 2016
2010 2011 2012 2013 2014 2015 2016
Público (annual unlinked trips)
42,134,000 38,706,000 32,670,000 27,021,382 27,881,893 25,796,436 21,353,376
Change - (3,428,000) (6,035,000) (5,649,000) 861,000 (2,085,000) (4,443,000)
% Change - (8.1%) (15.6%) (17.3%) 3.2% (7.5%) (17.2%)
Source: Prepared by SDG with data from the National Transit Database (NTD)
In the San Juan TMA there are approximately 200 Público routes. These routes have at least one terminal in almost all the municipalities on the Region. All of the municipalities of the Region have at least one route. There were at least 13,483,01533 annual unlinked passenger trips for the San Juan TMA. Figure 2.89 presents the Público routes in the San Juan TMA.
Municipal Services
According to information obtained from the National Transit Database (NTD), there are 19 Municipalities within the San Juan TMA that provide and operate transit services for their citizens that use diverse types of vehicles (locally these services are called trolley services); predominantly motor trolleys.
All of these services in the San Juan TMA are free of charge, fixed routes with pre-defined34 stops within the municipal limits. In some cases, there are fixed routes without predefined stops; and as long as users in the established route request a stop the driver will pick-up/drop-off them (highly common in rural communities). Additionally, in the aftermath of Hurricane María, some of the infrastructure from stops was destroyed or badly damaged (signage poles, signs, shelters, etc.).
All of the municipalities with these services provide demand responsive paratransit services within ¾ of a mile of their regular routes. Figure 2.91 shows the municipalities that provide transit service
32 Based on information provided by MTCG, Inc. 33 According to data obtain from MTCG, Inc. 34 In some cases, there are fixed routes without predefined stops (as long as a user it’s in the establish route the driver picks up the passenger – request stop service) especially in rural communities. Additionally, in the aftermath of Hurricane María, some of the infrastructure from stops was destroyed or badly damaged (signage poles, signs, shelters, etc.).

CHAPTER 2 CONTEXT: CURRENT SITUATION ASSESSMENT
Final Report December 2018 | 116
in Puerto Rico. Table 2.22 and Figure 2.92 present the Municipalities with a transit service in the San Juan TMA.
Table 2.22: Municipalities with a Transit Service in Puerto Rico
# Municipalities with a transit service in Puerto Rico 1 Bayamón
2 Caguas
3 Carolina
4 Cataño
5 Cayey
6 Cidra
7 Comerío
8 Dorado
9 Guaynabo
10 Gurabo
11 Humacao
12 Juncos
13 Manatí
14 Orocovis
15 San Juan
16 San Lorenzo
17 Toa Baja
18 Vega Alta
19 Vega Baja
Source: Prepared by SDG with data from the National Transit Database (NTD).
Additionally, there are several Municipalities that provide paratransit services to the elderly and people with disabilities regardless of providing municipal transit services.
In 2016, within the Region, there were approximately 5,064,339 total annual unlinked passenger trips35, with 4,989,428 for the regular transit service and 74,911 for the demand response service (paratransit), as shown in Figure 2.90. Figure 2.92 presents the Municipalities from San Juan TMA with transit service. Trips on these services have been increasing in the recent years.
35 According to NTD, 2016 data.

CHAPTER 2 CONTEXT: CURRENT SITUATION ASSESSMENT
Final Report December 2018 | 117
Figure 2.90: Municipal Services Annual Ridership
Source: National Transit Database (NTD)
0
2000000
4000000
6000000
Total UPT2012
Total UPT2013
Total UPT2014
Total UPT2015
Total UPT2016
Ride
rs
Years
Bayamón Caguas Carolina Cataño
Cayey Cidra Comerío Dorado
Guaynabo Gurabo Humacao Juncos
Manatí Orocovis San Juan San Lorenzo
Toa Baja Vega Alta Vega Baja TOTALS

CHAPTER 2 CONTEXT: CURRENT SITUATION ASSESSMENT
Final Report December 2018 | 118
Figure 2.91: Municipalities with a Transit Service in Puerto Rico

CHAPTER 2 CONTEXT: CURRENT SITUATION ASSESSMENT
Final Report December 2018 | 119
Figure 2.92: Municipalities with Transit Services within San Juan TMA

CHAPTER 2 CONTEXT: CURRENT SITUATION ASSESSMENT
Final Report December 2018 | 120
Maritime Transportation Authority (MTA)
The MTA Act is a public corporation which controls, administers, operates and maintains the maritime transportation service to Fajardo, Vieques, Culebra, San Juan, and Cataño. The service of MTA in the San Juan TMA consists of a line between Cataño Pier and Old San Juan Pier as can be seen on Figure 2.93 below and it is mostly used by commuters and tourists. Since February 2018 the service works from Monday to Friday from 5:45 AM to 10:00 PM; on weekends the services work from 8:00 AM to 10:00 PM.

CHAPTER 2 CONTEXT: CURRENT SITUATION ASSESSMENT
Final Report December 2018 | 121
Figure 2.93: Existing Transit Routes: Cataño – Old San Juan Ferry
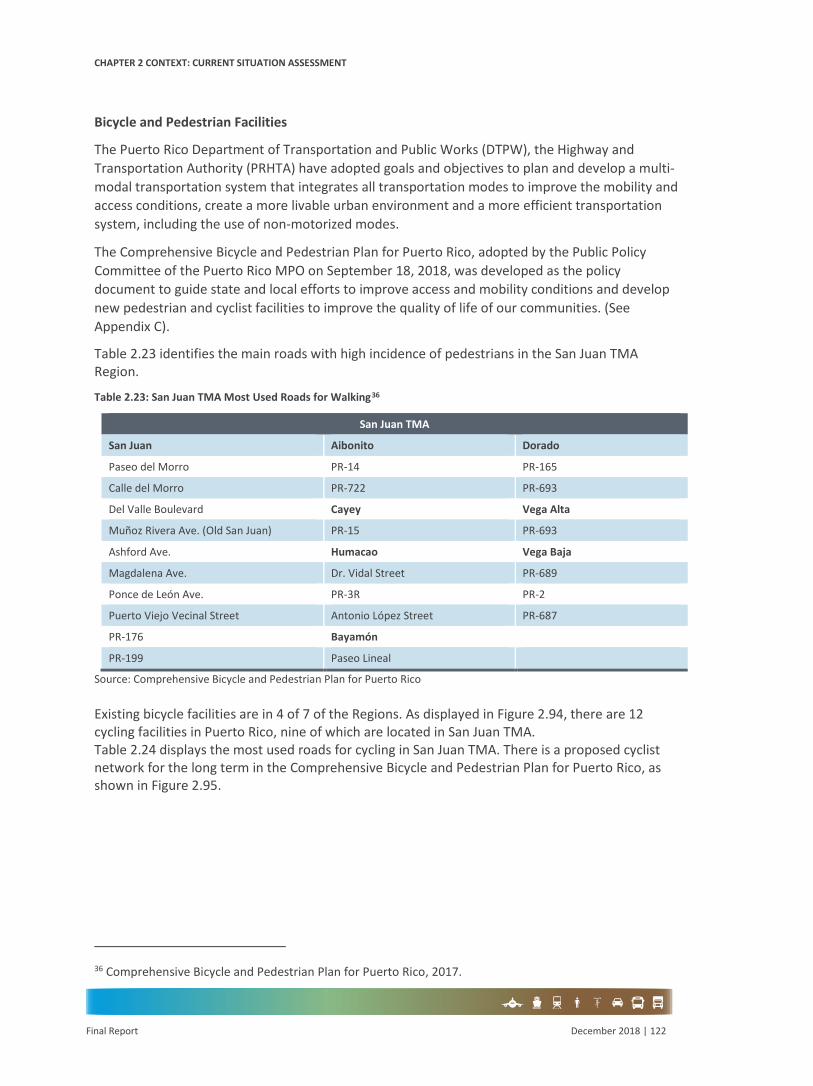
CHAPTER 2 CONTEXT: CURRENT SITUATION ASSESSMENT
Final Report December 2018 | 122
Bicycle and Pedestrian Facilities
The Puerto Rico Department of Transportation and Public Works (DTPW), the Highway and Transportation Authority (PRHTA) have adopted goals and objectives to plan and develop a multi-modal transportation system that integrates all transportation modes to improve the mobility and access conditions, create a more livable urban environment and a more efficient transportation system, including the use of non-motorized modes.
The Comprehensive Bicycle and Pedestrian Plan for Puerto Rico, adopted by the Public Policy Committee of the Puerto Rico MPO on September 18, 2018, was developed as the policy document to guide state and local efforts to improve access and mobility conditions and develop new pedestrian and cyclist facilities to improve the quality of life of our communities. (See Appendix C).
Table 2.23 identifies the main roads with high incidence of pedestrians in the San Juan TMA Region.
Table 2.23: San Juan TMA Most Used Roads for Walking36
San Juan TMA
San Juan Aibonito Dorado
Paseo del Morro PR-14 PR-165
Calle del Morro PR-722 PR-693
Del Valle Boulevard Cayey Vega Alta
Muñoz Rivera Ave. (Old San Juan) PR-15 PR-693
Ashford Ave. Humacao Vega Baja
Magdalena Ave. Dr. Vidal Street PR-689
Ponce de León Ave. PR-3R PR-2
Puerto Viejo Vecinal Street Antonio López Street PR-687
PR-176 Bayamón
PR-199 Paseo Lineal
Source: Comprehensive Bicycle and Pedestrian Plan for Puerto Rico
Existing bicycle facilities are in 4 of 7 of the Regions. As displayed in Figure 2.94, there are 12 cycling facilities in Puerto Rico, nine of which are located in San Juan TMA. Table 2.24 displays the most used roads for cycling in San Juan TMA. There is a proposed cyclist network for the long term in the Comprehensive Bicycle and Pedestrian Plan for Puerto Rico, as shown in Figure 2.95.
36 Comprehensive Bicycle and Pedestrian Plan for Puerto Rico, 2017.

CHAPTER 2 CONTEXT: CURRENT SITUATION ASSESSMENT
Final Report December 2018 | 123
Figure 2.94: Bicycle Facilities by Region – San Juan TMA
Source: Comprehensive Bicycle and Pedestrian Plan for Puerto Rico
Table 2.24: San Juan TMA Most Used Roads for Cycling
San Juan TMA San Juan Trujillo Alto Cataño Vega Baja Caguas
Del Morro Street PR-181 PR-165 PR-2 PR-189
Del Valle Boulevard Carolina Toa Baja PR-686 Gurabo
Luis Muñoz Rivera Ave. PR-37 PR-165 Sol Ave. PR-189
Ponce de León Ave. PR-187 Dorado Manatí Juncos
Ashford Ave. Loíza PR-165 PR-686 PR-189
Magdalena Ave. PR-187 PR-693 PR-685 PR-31
McLeary Ave. Río Grande PR-696 PR-2 PR-162
Linderberg Street PR-187 PR-6693 Aguas Buenas PR-722
Cagual Street PR-3 PR-695 PR-174 Las Piedras
Miraflores Street Guaynabo PR-694 PR-173 PR-31
José N. Gándara Street PR-165 PR-659 Aibonito Humacao
PR-47 PR-23 Vega Alta PR-14 PR-3

CHAPTER 2 CONTEXT: CURRENT SITUATION ASSESSMENT
Final Report December 2018 | 124
San Juan TMA PR-27 PR-833 PR-693 PR-718 Yabucoa
PR-3 PR-834 PR-689 Naguabo PR-3
PR-181 Bayamón Cidra PR-31 Maunabo
S. Alcides Reyes Street Paseo Lineal PR-173 PR-192 PR-3
Source: Comprehensive Bicycle and Pedestrian Plan for Puerto Rico

CHAPTER 2 CONTEXT: CURRENT SITUATION ASSESSMENT
Final Report December 2018 | 125
Figure 2.95: San Juan TMA Bicycle and Pedestrian Conceptual Network 2045

CHAPTER 2 CONTEXT: CURRENT SITUATION ASSESSMENT
Final Report December 2018 | 126
Panoramic Route
The DTPW and the PRHTA completed the Corridor Management Plan (CMP) for the Panoramic Route in 1998 with an allocation of National Scenic Byways Program FHWA. The Update of the CMP for the Panoramic Route includes goals for the preservation of the cultural and scenic values of the Route, as well as for the safety of its users.
• Conservation: To conserve the significant quality of the Panoramic Route’s scenic beautyand views, and the outstanding value of its natural and cultural resources for the futuregenerations of users of the Route;
• Safety: To ensure the safety of the Route for all users by adopting compatible andappropriate design standards for scenic roads, by providing adequate information,signage, and security measures, in a way that enhances its natural and scenic qualities;and
• Education and Information: To educate and inform Panoramic Route users about theCorridor’s cultural and historic values, as well as the scenic and natural qualities for theirenrichment, and so that they engage in the Route’s preservation and become satisfiedtourists of the Route.
The Update of CPM should be a community-based strategy to conserve the intrinsic resources of the scenic byways in a sustainable balance with economic development and tourism. The plan consists of a broad conceptual vision of a comprehensive action plan that calls both for immediate action within a long-range program. The CMP should meet the following objectives:
• To preserve the intrinsic qualities of the Route• To preserve scenic views• To improve the conservation and maintenance of roads• To protect the easement• To encourage the appropriate use of adjacent land• To promote socio-economic development
The Panoramic Route provides visitors of all ages diverse opportunities to explore the Island’s cultural, historical, natural, scenic and recreational resources as well as to experience local traditions and the rural way of life. Serving as a gateway, connecting the traveler to other regions (Table 2.25 includes a list of the Panoramic Route municipalities within the Sa Juan TMA and Other Urbanized Areas Regions) in a safe and coherent manner, educating the users about its resources, the Route preserves and enhances the natural beauty of the interior of Puerto Rico for residents and visitors, while represented an opportunity of socio-economic development. Figure 2.96 shows the Panoramic route in Puerto Rico

CHAPTER 2 CONTEXT: CURRENT SITUATION ASSESSMENT
Final Report December 2018 | 127
Table 2.25: Panoramic Route Municipalities
Regions Municipalities State Roads Length in km
San Juan TMA
Maunabo 3, 901, 760 11.6
Yabucoa 3, 182, 181, 901 32
San Lorenzo 181, 7740 7.3
Cayey 184, 179, 742, 7741, 741, 15, 715, 1, 7722 29.35
Aibonito 7722, 722, 7718, 725, 14, 723 20
Barranquitas 143 2.3
Orocovis 143 16.7
UZA Southeast Region
Patillas 7740, 184 3.9
Guayama 179, 742, 7741 13.3
UZA South Region
Coamo 723, 143 16.2
Villalba 143 2.3
Juana Diaz 143 1.2
Ponce 143 7.6
UZA North Region
Jayuya 143 6.8
Adjuntas 143, 123, 518, 131, 525, 135 31.4
Utuado 143 3.8
UZA Southwest Region
Maricao 128, 105, 365, 366, 120 26.8
Sabana Grande 366, 120 2.5
Mayagüez 119, 339, 105 16.6
Aguadilla TMA Lares 135, 128 8.5
Las Marías 120, 106 6.7
21 Municipalities 40 state roads 266.85
Source: CMP

CHAPTER 2 CONTEXT: CURRENT SITUATION ASSESSMENT
Final Report December 2018 | 128
Figure 2.96: Panoramic Route

CHAPTER 2 CONTEXT: CURRENT SITUATION ASSESSMENT
Final Report December 2018 | 129
Airports, Seaports, and Freight
Movement of passengers and goods in the Region occurs through three airports and two seaports as shown in Figure 2.97. The three airports are Luis Muñoz Marín International Airport in Carolina, Fernando Luis Ribas Dominicci Airport, and Humacao Airport. The two seaports are San Juan and Yabucoa. Each facility is discussed in detail below.
Luis Muñoz Marín International Airport (SJU)
This airport is located in Carolina, 3 miles (5 km) southeast of San Juan, and serves as the main airport of the Puerto Rico. In 2012, this airport was granted a 40-year lease to be operated under a public-private partnership (P3) by Aerostar Airport Holdings, LLC. It is categorized as a commercial service facility by the Federal Aviation Administration’s National Plan of Integrated Airport Systems (NPIAS), for the period 2017-202137.
Operations
Of the 24 airlines that operate out of SJU38. Taxis, AMA and car rentals provide transportation to the airport. There are also charter and cargo operations in this facility. For the 12 months ending in March 2016, SJU registered 170,508 operations classified as follows:
• 67,896 from air carrier;• 81,903 from air taxis;• 441 from local general aviation39;• 17,849 from itinerant general aviation40; and• 2,419 from military41.
95 aircraft are based at the airport; 5 of them are military. This airport manages an average of 467 aircraft operations per day42. In terms of departing passengers SJU is ranked 43th within the nation.
37 www.faa.gov/airports/planning_capacity/npias/reports. The Plan identifies existing and proposed airports that are significant to national air transportation and thus eligible to receive federal grants under the Airport Improvement Program (AIP). 38 Sourced from Aerostar Airport Holdings LLC. 39 Definition from Federal Aviation Administration: “Local operations are those operations performed by aircraft that remain in the local traffic pattern, execute simulated instrument approaches or low passes at the airport, and the operations to or from the airport and a designated practice area within a 20−mile radius of the tower”. 40 Definition from Federal Aviation Administration: “Itinerant operations are operations performed by an aircraft, either Instrument Flight Rules (IFR), Special Visual Flight Rules (SVFR), or Visual Flight Rules (VFR), that lands at an airport, arriving from outside the airport area, or departs an airport and leaves the airport area”. 41 AirportIQ 5010 Airport Master Records. 42 AirNav.com.
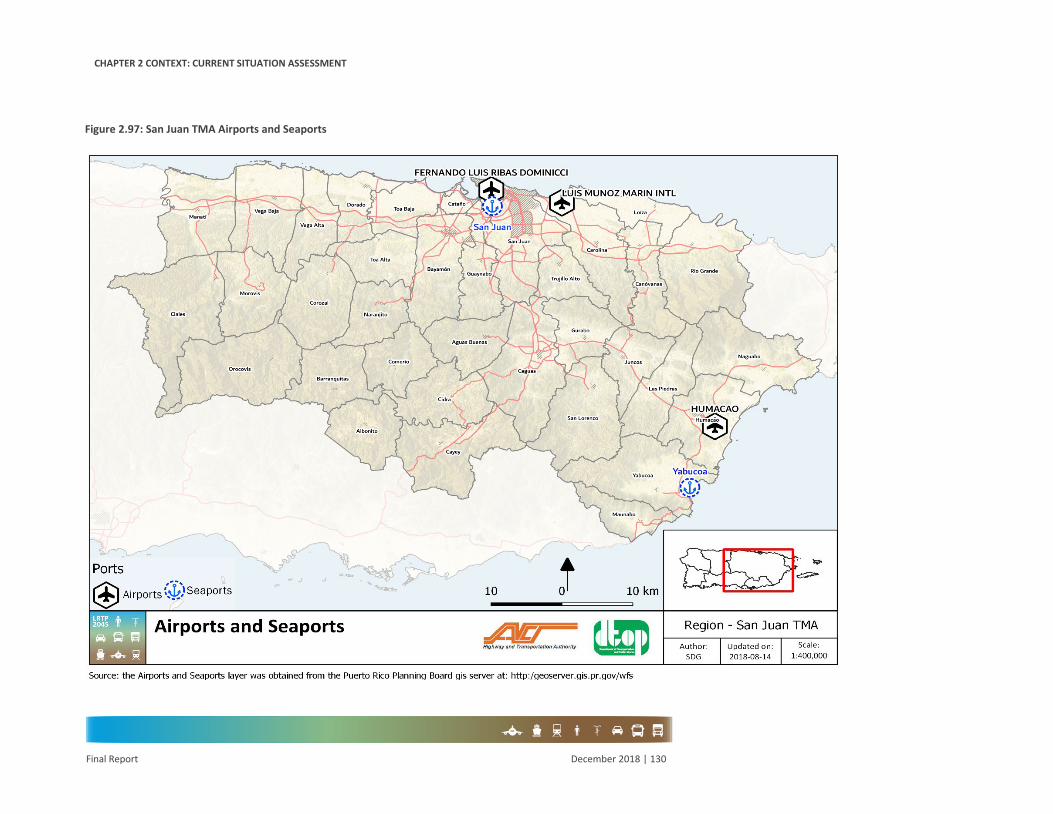
CHAPTER 2 CONTEXT: CURRENT SITUATION ASSESSMENT
Final Report December 2018 | 130
Figure 2.97: San Juan TMA Airports and Seaports

CHAPTER 2 CONTEXT: CURRENT SITUATION ASSESSMENT
Final Report December 2018 | 131
Passengers
In 2016 SJU served the following volumes of scheduled enplaned revenue passengers43: 4,246,525 arriving passengers and 4,315,855 departing passengers.
Between 2010 and 2016, there was a 2.02% increase in total passengers, both arriving and departing. Of the passengers in 2016, 50.40% correspond to passengers’ departure and 49.60% to passengers’ arrival. Between 2010 and 2016, there were increases of 2.4% in departing passengers and 1.6% in arriving passengers, as shown in Figure 2.98.
Figure 2.98: SJU Passengers Departure versus Arrival
Source: SDG Analysis of Bureau of Transportation Statistics
In 2016, 89% of the passenger movement in the airport were domestic. This is illustrated in Figure 2.99.
43 According to 14 CFR 152.3 [Title 14 Aeronautics and Space; Chapter I Federal Aviation Administration, Department of Transportation; Subchapter I Airports; Part 152 Airport Aid Program; Subpart A General], Passengers Enplaned means— “(1) United States domestic, territorial, and international revenue passenger enplanements in scheduled and nonscheduled service of air carriers; and (2) Revenue passenger enplanements by foreign air carriers in intrastate and interstate commerce”.

CHAPTER 2 CONTEXT: CURRENT SITUATION ASSESSMENT
Final Report December 2018 | 132
Figure 2.99: SJU Domestic versus International Passengers in 2016
Source: SDG Analysis of Bureau of Transportation Statistics
Between 2010 and 2016, there was a 5.7% or 410,704 increase in domestic passengers and a 20.4% or 241,127 decrease in international passengers. This is shown in Figure 2.100.
Figure 2.100: Domestic versus International Passengers – SJU
Source: SDG Analysis of Bureau of Transportation Statistics
Flights

CHAPTER 2 CONTEXT: CURRENT SITUATION ASSESSMENT
Final Report December 2018 | 133
In 2016, SJU served 107,216 total flights, including both arriving and departing flights. Since 2010 to 2016, there was a 1.68% reduction of total flights. Between 2010 and 2016, there were decreases of 1.7% in departing flights and 1.6% in arrivals, as shown in Figure 2.101.
Figure 2.101: Flights’ Departure versus Arrival
Source: SDG Analysis of Bureau of Transportation Statistics
In 2016, most of the flight movements in the airport were domestic (74.1%), as shown in Figure 2.102. Similar to the passengers, the majority of flights are domestic in nature. However, the split between domestic and international is different for flights compared with passengers. While 11% of passengers are international. 26% of the flights are international flights.
Figure 2.102: Domestic versus International Flights in 2016
Source: SDG Analysis of Bureau of Transportation Statistics

CHAPTER 2 CONTEXT: CURRENT SITUATION ASSESSMENT
Final Report December 2018 | 134
Between 2010 and 2016, there were decreases in both domestic and international flights. Domestic flights declined 0.8% or 603 while international flights declined 4.3% or 1,231, as shown in Figure 2.103.
Figure 2.103: Domestic versus International Flights – SJU
Source: SDG Analysis of Bureau of Transportation Statistics
Cargo
Regarding cargo the airport ranked 34th nationally in 201644. This relatively high ranking is an indicator of the key role the airport plays as a cargo terminal for the Island and TMA. There were 1,084,961,328 pounds of landed weight45, a 7.6% increase over 2015, as shown in Figure 2.104. Between 2010 and 2016, there was a 22.9% increase in cargo volumes at the airport.
44 Aeroweb Forecast International’s Aerospace Portal. 45 Definition from Federal Aviation Administration: “Landed weight means the weight of aircraft transporting only cargo in intrastate, interstate, and foreign air transportation. An airport may be both a commercial service and a cargo service airport”.

CHAPTER 2 CONTEXT: CURRENT SITUATION ASSESSMENT
Final Report December 2018 | 135
Figure 2.104: SJU Landed Weights
Source: SDG Analysis of Federal Aviation Administration
Fernando Luis Ribas Dominicci Airport (SIG)
This airport is located in Isla Grande, a sub-district of Santurce, in San Juan and owned by the Puerto Rico Ports Authority. It is classified as a commercial (small/non-hub facility) by the Federal Aviation Administration’s National Plan of Integrated Airport Systems (NPIAS), for the period 2017-202146.
Operations
For the 12 months ending in December 2016, SIG registered 95,797 operations classified as follows:
• 12,837 from air taxis;• 37,076 from local general aviation;• 43,375 from itinerant general aviation; and• 2,509 from military47.
210 aircraft are based at the airport, where 18 of them are military. This airport manages an average of 262 aircraft operations per day48.
46 www.faa.gov/airports/planning_capacity/npias/reports. The Plan identifies existing and proposed airports that are significant to national air transportation and thus eligible to receive federal grants under the Airport Improvement Program (AIP). 47 AirportIQ 5010 Airport Master Records. 48 AirNav.com.

CHAPTER 2 CONTEXT: CURRENT SITUATION ASSESSMENT
Final Report December 2018 | 136
Passengers
In 2016 SIG served the following volumes of total scheduled enplaned revenue passengers:
• 21,604 arriving passengers; and• 23,699 departing passengers.
From 2010 to 2016, there was a 41.2% decrease in total passengers, both arriving and departing. Of those, 52.3% correspond to departing passengers while 47.7% were arriving passengers. Between 2010 and 2016 both there were reductions in both arriving and departing passengers of 37.9% and 44.4% respectively. This is illustrated in Figure 2.105.
In 2016, all passenger movement in the airport were domestic.
Figure 2.105: Passengers Departure versus Arrival
Source: SDG Analysis of Bureau of Transportation Statistics
Flights
In 2016, SIG had 8,038 flights including both arriving and departing flights. From 2010 to 2016, there has been a 12.3% reduction in total flights. Of those, 49.3% correspond to flights’ departure and 50.7% to flights’ arrival. Since 2010 to 2016, there were decreases in departures of 13% and in arrivals of 11.6%, as shown in Figure 2.106.

CHAPTER 2 CONTEXT: CURRENT SITUATION ASSESSMENT
Final Report December 2018 | 137
Figure 2.106: Flights’ Departure versus Arrival
Source: SDG Analysis of Bureau of Transportation Statistics
In 2016, most, 74.1%, of the flight movements at the airport were domestic. Since 2010 to 2016, there was a 12.3% decrease in domestic flights.
Cargo
According to operational reports between the 2013 and 2016 fiscal years49, there was an increase of 54.2% in cargo volumes, as shown in Figure 2.107.
Figure 2.107: Cargo Movement – SIG
Source: SDG Analysis of Porths Authority Operational Reports
49 The fiscal year runs from July to June of the following year.

CHAPTER 2 CONTEXT: CURRENT SITUATION ASSESSMENT
Final Report December 2018 | 138
Humacao Airport (HUC)
Dr. Hermenegildo Ortiz Quiñones Airport is located one mile southeast of Humacao’s Central Business District. It is owned by the Puerto Rico Ports Authority. This airport does not support cargo movements and it is categorized as a non-primary commercial (local/basic) facility by the Federal Aviation Administration’s National Plan of Integrated Airport Systems (NPIAS) for the period 2017-202150.
Operations
For the 12 months ending on December 2016, HUC registered 2,527 operations classified as follows:
• 1,000 from air taxis;• 1,222 from local general aviation;• 59 from itinerant general aviation; and• 246 from military51.
20 aircraft are based at the airport. This airport manages an average of 48 aircraft operations per week52.
Passengers
According to operational reports between the 013 and 2016 fiscal years, there has been an increase of 63.1% in passenger movements, as shown in Figure 2.108.
Figure 2.108: Passengers – HUC
Source: SDG Analysis of Porths Authority Operational Reports
50 www.faa.gov/airports/planning_capacity/npias/reports. The Plan identifies existing and proposed airports that are significant to national air transportation and thus eligible to receive federal grants under the Airport Improvement Program (AIP). 51 AirportIQ 5010 Airport Master Records. 52 AirNav.com.

CHAPTER 2 CONTEXT: CURRENT SITUATION ASSESSMENT
Final Report December 2018 | 139
Air Passengers Movement Disruption After Hurricanes Irma and María
The Puerto Rico Statistics Institute used Air Carrier Statistics Data from the U.S. Bureau of Transportation Statistics (BTS) analyze air traffic in Puerto Rico. According to their findings, in September 2017 the number of arrivals were 46.6% lower than in September 2016. Likewise, for the same period, the number of departures fell by 33.8%. This is shown in .
Figure 2.109: Number of Arrivals and Departures of Puerto Rico Air Passengers in Domestic Flights and Domestic Airlines
Source: Puerto Rico Statistics Institute Analysis of U.S. Bureau of Transportation Statistics, Air Carrier Statistics, T-100 Domestic Segment (U.S. Carriers).
The impact of Hurricanes Irma and María on domestic passenger traffic between Puerto Rico and US states and other territories is shown below in Table 2.26.
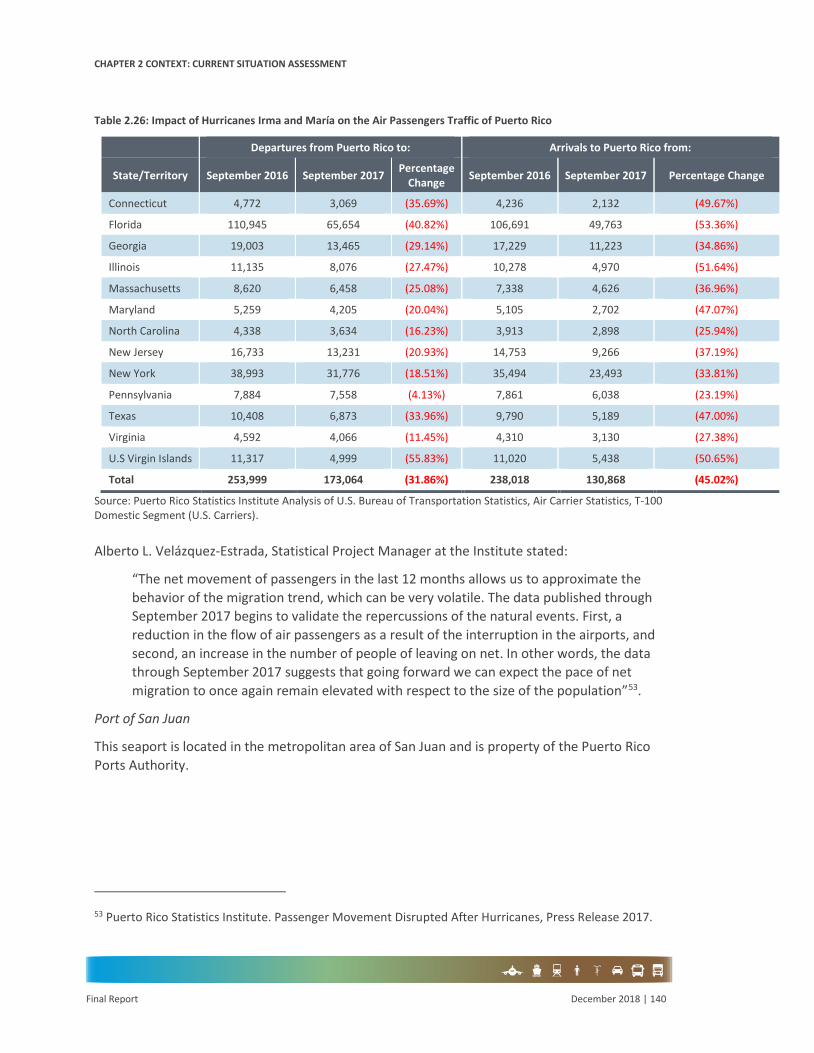
CHAPTER 2 CONTEXT: CURRENT SITUATION ASSESSMENT
Final Report December 2018 | 140
Table 2.26: Impact of Hurricanes Irma and María on the Air Passengers Traffic of Puerto Rico
Departures from Puerto Rico to: Arrivals to Puerto Rico from:
State/Territory September 2016 September 2017 Percentage Change September 2016 September 2017 Percentage Change
Connecticut 4,772 3,069 (35.69%) 4,236 2,132 (49.67%)
Florida 110,945 65,654 (40.82%) 106,691 49,763 (53.36%)
Georgia 19,003 13,465 (29.14%) 17,229 11,223 (34.86%)
Illinois 11,135 8,076 (27.47%) 10,278 4,970 (51.64%)
Massachusetts 8,620 6,458 (25.08%) 7,338 4,626 (36.96%)
Maryland 5,259 4,205 (20.04%) 5,105 2,702 (47.07%)
North Carolina 4,338 3,634 (16.23%) 3,913 2,898 (25.94%)
New Jersey 16,733 13,231 (20.93%) 14,753 9,266 (37.19%)
New York 38,993 31,776 (18.51%) 35,494 23,493 (33.81%)
Pennsylvania 7,884 7,558 (4.13%) 7,861 6,038 (23.19%)
Texas 10,408 6,873 (33.96%) 9,790 5,189 (47.00%)
Virginia 4,592 4,066 (11.45%) 4,310 3,130 (27.38%)
U.S Virgin Islands 11,317 4,999 (55.83%) 11,020 5,438 (50.65%)
Total 253,999 173,064 (31.86%) 238,018 130,868 (45.02%)
Source: Puerto Rico Statistics Institute Analysis of U.S. Bureau of Transportation Statistics, Air Carrier Statistics, T-100 Domestic Segment (U.S. Carriers).
Alberto L. Velázquez-Estrada, Statistical Project Manager at the Institute stated:
“The net movement of passengers in the last 12 months allows us to approximate the behavior of the migration trend, which can be very volatile. The data published through September 2017 begins to validate the repercussions of the natural events. First, a reduction in the flow of air passengers as a result of the interruption in the airports, and second, an increase in the number of people of leaving on net. In other words, the data through September 2017 suggests that going forward we can expect the pace of net migration to once again remain elevated with respect to the size of the population”53.
Port of San Juan
This seaport is located in the metropolitan area of San Juan and is property of the Puerto Rico Ports Authority.
53 Puerto Rico Statistics Institute. Passenger Movement Disrupted After Hurricanes, Press Release 2017.

CHAPTER 2 CONTEXT: CURRENT SITUATION ASSESSMENT
Final Report December 2018 | 141
Passengers
From 2012 to 2016, there has been an increase of 33.9% in total passenger movements as shown in Figure 2.110. 32.2% are Home Port passengers54 and 67.8% were in-transit passengers55, as shown in Figure 2.110. Figure 2.111: Home Port vs. In Transit Passengers – Port of San Juan shows the home port vs the in-transit passengers in the Port of San Juan.
Figure 2.110: Total Passengers – Port of San Juan
Source: SDG Analysis of Puerto Rico Tourism Company
Figure 2.111: Home Port vs. In Transit Passengers – Port of San Juan
Source: SDG Analysis of Puerto Rico Tourism Company
54 Homeport (SJ) = “These are passengers who start and finish their cruise trip in the port of San Juan”. Puerto Rico Tourism Company. 55 In Transit: “These are passengers who begin their cruise trip in other foreign port, dock for a short period of time in San Juan Port, and then continue to other destinations”. Puerto Rico Tourism Company.
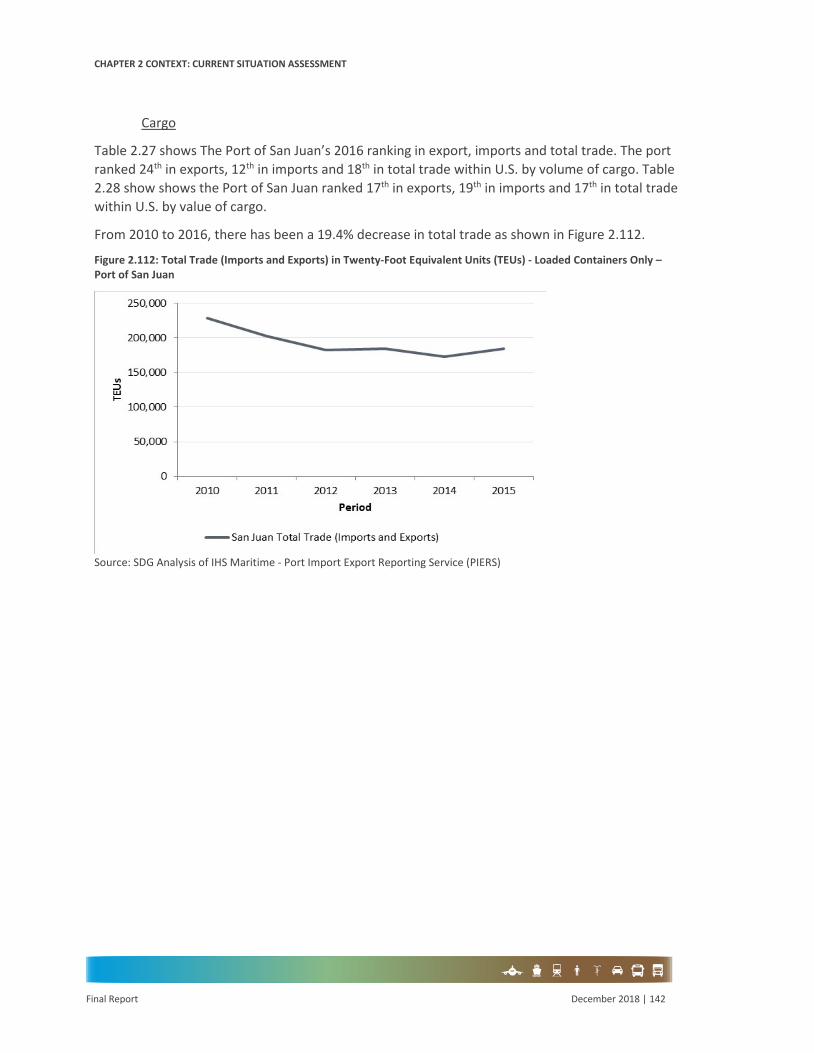
CHAPTER 2 CONTEXT: CURRENT SITUATION ASSESSMENT
Final Report December 2018 | 142
Cargo
Table 2.27 shows The Port of San Juan’s 2016 ranking in export, imports and total trade. The port ranked 24th in exports, 12th in imports and 18th in total trade within U.S. by volume of cargo. Table 2.28 show shows the Port of San Juan ranked 17th in exports, 19th in imports and 17th in total trade within U.S. by value of cargo.
From 2010 to 2016, there has been a 19.4% decrease in total trade as shown in Figure 2.112.
Figure 2.112: Total Trade (Imports and Exports) in Twenty-Foot Equivalent Units (TEUs) - Loaded Containers Only – Port of San Juan
Source: SDG Analysis of IHS Maritime - Port Import Export Reporting Service (PIERS)

CHAPTER 2 CONTEXT: CURRENT SITUATION ASSESSMENT
Final Report December 2018 | 143
Table 2.27: Ranking of U.S. Customs Districts by Volume of Cargo (Metric Tons, 000s) in 2016
Exports Imports TOTAL TRADE
Rank Customs District 2016 2015 Change Rank Customs District 2016 2015 Change Rank Customs District 2016 2015 Change
1 New Orleans, LA 148,354 134,523 10.3% 1 New Orleans, LA 106,799 101,790 4.9% 1 New Orleans, LA 255,153 236,312 8.0%
2 Houston-Galveston, TX 135,531 133,824 1.3% 2 Houston-Galveston, TX 106,514 114,708 (7.1%) 2 Houston-Galveston, TX 242,045 248,532 (2.6%)
3 Columbia-Snake, OR 41,130 34,991 17.5% 3 Los Angeles, CA 85,780 83,039 3.3% 3 Los Angeles, CA 124,928 122,242 2.2%
4 Los Angeles, CA 39,149 39,203 (0.1%) 4 New York City, NY 63,962 59,277 7.9% 4 New York City, NY 79,844 75,068 6.4%
5 Norfolk, VA 35,501 38,060 (6.7%) 5 Philadelphia, PA 44,742 36,578 22.3% 5 Port Arthur, TX 68,185 70,653 (3.5%)
6 Port Arthur, TX 33,212 33,257 (0.1%) 6 Port Arthur, TX 34,973 37,396 (6.5%) 6 Philadelphia, PA 52,449 43,185 21.5%
7 Seattle, WA 30,713 26,265 16.9% 7 San Francisco, CA 34,215 34,769 (1.6%) 7 San Francisco, CA 51,946 53,603 (3.1%)
8 Mobile, AL 20,611 22,576 (8.7%) 8 Mobile, AL 28,159 27,331 3.0% 8 Mobile, AL 48,770 49,907 (2.3%)
9 San Francisco, CA 17,730 18,834 (5.9%) 9 Tampa, FL 19,937 20,503 (2.8%) 9 Seattle, WA 48,022 43,797 9.6%
10 Savannah, GA 16,738 17,652 (5.2%) 10 Savannah, GA 17,330 16,719 3.7% 10 Norfolk, VA 46,099 47,955 (3.9%)
11 Baltimore, MD 16,359 16,008 2.2% 11 Seattle, WA 17,309 17,532 (1.3%) 11 Columbia-Snake, OR 45,880 40,020 14.6%
12 New York City, NY 15,883 15,792 0.6% 12 San Juan, PR 12,529 12,259 2.2% 12 Savannah, GA 34,067 34,371 (0.9%)
13 Tampa, FL 8,226 8,362 (1.6%) 13 Baltimore, MD 12,521 13,380 (6.4%) 13 Baltimore, MD 28,880 29,388 (1.7%)
14 Philadelphia, PA 7,706 6,607 16.6% 14 Boston, MA 12,466 13,512 (7.7%) 14 Tampa, FL 28,163 28,866 (2.4%)
15 Charleston, SC 7,254 7,269 (0.2%) 15 Charleston, SC 11,930 11,649 2.4% 15 Charleston, SC 19,183 18,919 1.4%
16 Miami, FL 5,723 6,347 (9.8%) 16 Norfolk, VA 10,599 9,895 7.1% 16 Miami, FL 16,296 18,535 (12.1%)
17 Detroit, MI 5,520 6,967 (20.8%) 17 Miami, FL 10,573 12,188 (13.3%) 17 Boston, MA 14,249 15,068 (5.4%)
18 Cleveland, OH 5,418 4,784 13.3% 18 Honolulu, HI 6,520 6,569 (0.8%) 18 San Juan, PR 14,227 13,497 5.4%
19 Buffalo, NY 3,932 3,499 12.4% 19 Portland, ME 6,262 7,246 (13.6%) 19 Detroit, MI 9,151 11,416 (19.8%)
20 Anchorage, AK 3,520 3,839 (8.3%) 20 Columbia-Snake, OR 4,750 5,029 (5.6%) 20 Cleveland, OH 8,926 10,033 (11.0%)
21 Wilmington, NC 2,236 2,358 (5.2%) 21 Wilmington, NC 3,854 4,036 (4.5%) 21 Honolulu, HI 7,357 7,619 (3.4%)
22 Minneapolis, MN 1,950 2,256 (13.6%) 22 Providence, RI 3,774 4,126 (8.5%) 22 Portland, ME 6,889 8,001 (13.9%)
23 Boston, MA 1,783 1,556 14.5% 23 Detroit, MI 3,630 4,449 (18.4%) 23 Wilmington, NC 6,090 6,394 (4.8%)
24 San Juan, PR 1,699 1,238 37.2% 24 Cleveland, OH 3,508 5,249 (33.2%) 24 Anchorage, AK 5,151 5,431 (5.2%)
25 Ogdensburg, NY 1,563 3,910 (60.0%) 25 Chicago, IL 3,002 4,011 (25.2%) 25 Buffalo, NY 4,659 4,121 13.1%
Source: U.S. Census Bureau, U.S. Merchandise Trade, Selected Highlights (Report FT 920)
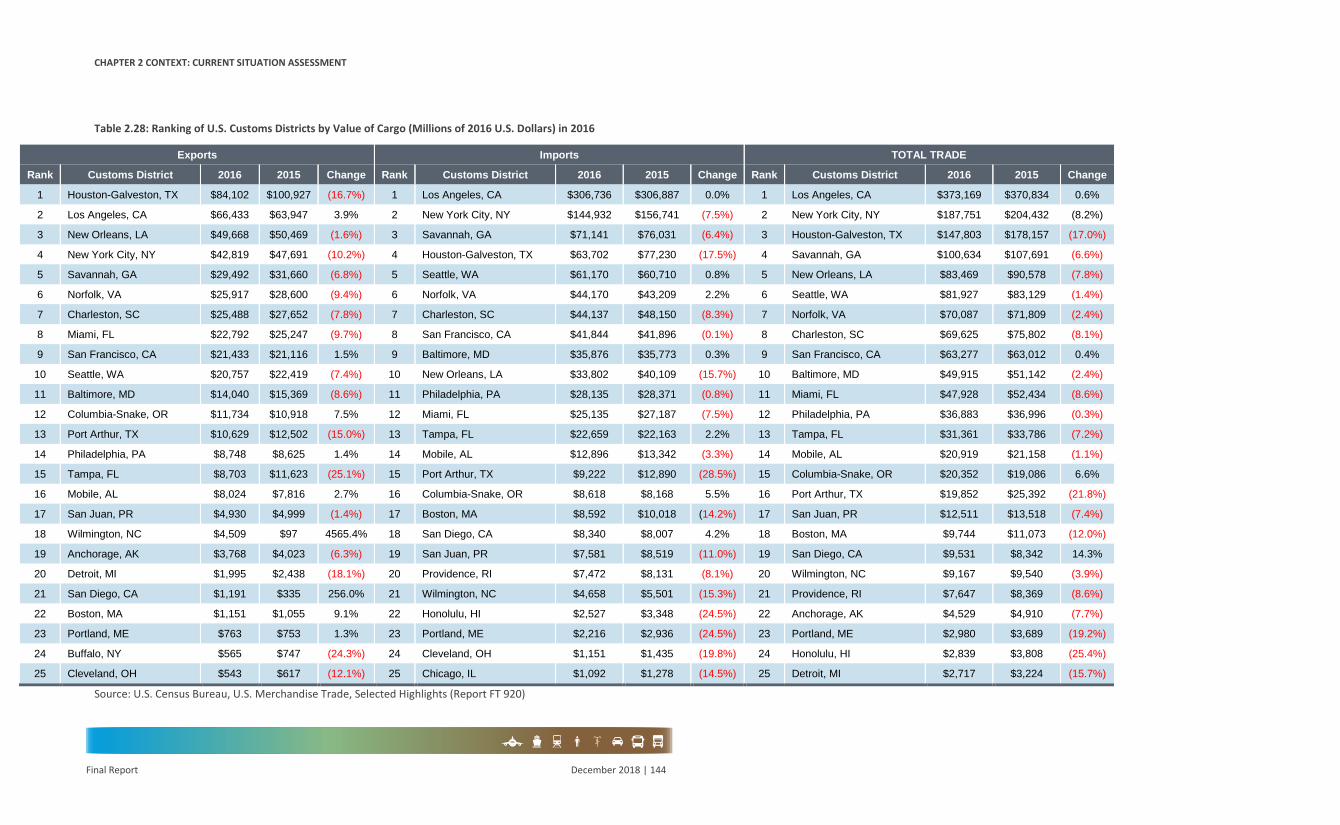
CHAPTER 2 CONTEXT: CURRENT SITUATION ASSESSMENT
Final Report December 2018 | 144
Table 2.28: Ranking of U.S. Customs Districts by Value of Cargo (Millions of 2016 U.S. Dollars) in 2016
Exports Imports TOTAL TRADE
Rank Customs District 2016 2015 Change Rank Customs District 2016 2015 Change Rank Customs District 2016 2015 Change
1 Houston-Galveston, TX $84,102 $100,927 (16.7%) 1 Los Angeles, CA $306,736 $306,887 0.0% 1 Los Angeles, CA $373,169 $370,834 0.6%
2 Los Angeles, CA $66,433 $63,947 3.9% 2 New York City, NY $144,932 $156,741 (7.5%) 2 New York City, NY $187,751 $204,432 (8.2%)
3 New Orleans, LA $49,668 $50,469 (1.6%) 3 Savannah, GA $71,141 $76,031 (6.4%) 3 Houston-Galveston, TX $147,803 $178,157 (17.0%)
4 New York City, NY $42,819 $47,691 (10.2%) 4 Houston-Galveston, TX $63,702 $77,230 (17.5%) 4 Savannah, GA $100,634 $107,691 (6.6%)
5 Savannah, GA $29,492 $31,660 (6.8%) 5 Seattle, WA $61,170 $60,710 0.8% 5 New Orleans, LA $83,469 $90,578 (7.8%)
6 Norfolk, VA $25,917 $28,600 (9.4%) 6 Norfolk, VA $44,170 $43,209 2.2% 6 Seattle, WA $81,927 $83,129 (1.4%)
7 Charleston, SC $25,488 $27,652 (7.8%) 7 Charleston, SC $44,137 $48,150 (8.3%) 7 Norfolk, VA $70,087 $71,809 (2.4%)
8 Miami, FL $22,792 $25,247 (9.7%) 8 San Francisco, CA $41,844 $41,896 (0.1%) 8 Charleston, SC $69,625 $75,802 (8.1%)
9 San Francisco, CA $21,433 $21,116 1.5% 9 Baltimore, MD $35,876 $35,773 0.3% 9 San Francisco, CA $63,277 $63,012 0.4%
10 Seattle, WA $20,757 $22,419 (7.4%) 10 New Orleans, LA $33,802 $40,109 (15.7%) 10 Baltimore, MD $49,915 $51,142 (2.4%)
11 Baltimore, MD $14,040 $15,369 (8.6%) 11 Philadelphia, PA $28,135 $28,371 (0.8%) 11 Miami, FL $47,928 $52,434 (8.6%)
12 Columbia-Snake, OR $11,734 $10,918 7.5% 12 Miami, FL $25,135 $27,187 (7.5%) 12 Philadelphia, PA $36,883 $36,996 (0.3%)
13 Port Arthur, TX $10,629 $12,502 (15.0%) 13 Tampa, FL $22,659 $22,163 2.2% 13 Tampa, FL $31,361 $33,786 (7.2%)
14 Philadelphia, PA $8,748 $8,625 1.4% 14 Mobile, AL $12,896 $13,342 (3.3%) 14 Mobile, AL $20,919 $21,158 (1.1%)
15 Tampa, FL $8,703 $11,623 (25.1%) 15 Port Arthur, TX $9,222 $12,890 (28.5%) 15 Columbia-Snake, OR $20,352 $19,086 6.6%
16 Mobile, AL $8,024 $7,816 2.7% 16 Columbia-Snake, OR $8,618 $8,168 5.5% 16 Port Arthur, TX $19,852 $25,392 (21.8%)
17 San Juan, PR $4,930 $4,999 (1.4%) 17 Boston, MA $8,592 $10,018 (14.2%) 17 San Juan, PR $12,511 $13,518 (7.4%)
18 Wilmington, NC $4,509 $97 4565.4% 18 San Diego, CA $8,340 $8,007 4.2% 18 Boston, MA $9,744 $11,073 (12.0%)
19 Anchorage, AK $3,768 $4,023 (6.3%) 19 San Juan, PR $7,581 $8,519 (11.0%) 19 San Diego, CA $9,531 $8,342 14.3%
20 Detroit, MI $1,995 $2,438 (18.1%) 20 Providence, RI $7,472 $8,131 (8.1%) 20 Wilmington, NC $9,167 $9,540 (3.9%)
21 San Diego, CA $1,191 $335 256.0% 21 Wilmington, NC $4,658 $5,501 (15.3%) 21 Providence, RI $7,647 $8,369 (8.6%)
22 Boston, MA $1,151 $1,055 9.1% 22 Honolulu, HI $2,527 $3,348 (24.5%) 22 Anchorage, AK $4,529 $4,910 (7.7%)
23 Portland, ME $763 $753 1.3% 23 Portland, ME $2,216 $2,936 (24.5%) 23 Portland, ME $2,980 $3,689 (19.2%)
24 Buffalo, NY $565 $747 (24.3%) 24 Cleveland, OH $1,151 $1,435 (19.8%) 24 Honolulu, HI $2,839 $3,808 (25.4%)
25 Cleveland, OH $543 $617 (12.1%) 25 Chicago, IL $1,092 $1,278 (14.5%) 25 Detroit, MI $2,717 $3,224 (15.7%)
Source: U.S. Census Bureau, U.S. Merchandise Trade, Selected Highlights (Report FT 920)

CHAPTER 2 CONTEXT: CURRENT SITUATION ASSESSMENT
Final Report December 2018 | 145
There has been an increase of 10.5% in all vessel calls since 2010 to 2016, as shown in Figure 2.78. These included calls from vessels over 10,000 deadweight tons (DWT): tankers (tankers (<60,000 DWT), tankers (>60,000 DWT)), containers, gas (LPG/LNG), roll-on/roll-off, bulk and general cargo, as shown in Figure 2.113. Figure 2.114 shows that since 2010 to 2016 imports have decreased in 12.5%, and exports have decreased in 20.6%.
Figure 2.113: Total Vessel Calls – Port of San Juan
Source: SDG Analysis of U.S. Maritime Administration
Figure 2.114: Puerto Rico General Imports - Puerto Rico Customs District of Unlading and Puerto Rico Exports - Domestic and Foreign Merchandise
Source: U.S. Census Bureau, U.S. Merchandise Trade, Selected Highlights (Report FT 920)

CHAPTER 2 CONTEXT: CURRENT SITUATION ASSESSMENT
Final Report December 2018 | 146
Port of Yabucoa
Law No. 255 of 2015, designated the port of the Municipality of Yabucoa with the name of Teófilo Morales-Rodríguez Port, after Yabucoa’s mayor. The seaport is located in Yabucoa Municipality. The port is a major fuel port, receiving approximately 33% of all Puerto Rico’s fuel56. When hurricane María hit Puerto Rico, the port suffered damages. This facility has an approximate capacity of 4.6 million barrels of storage for refined products like fuel oil and crude oil57.
56 El Nuevo Día Newspaper, September 27, 2017. 57 Buckeye Global Marine Terminals.

CHAPTER 3 TRANSPORTATION PLANNING PROCESS FOR THE FUTURE
Final Report December 2018 | 147
This chapter presents the 2045 LRTP’s planning process, starting with the definition of its vision, goals and objectives. Also, this chapter will cover how the latest Fast-Act planning factors are being considered in the plan, the strategic approach in terms of transportation modes and to mitigate the effects of extreme weather events through a resilience infrastructure. This chapter is divided into 3 sections:
1. Vision, Goals and Objectives;2. Planning Factors; and3. Strategic Approach to Transportation Planning in San Juan TMA.
VISION, GOALS AND OBJECTIVES Vision
The 2045 Long Range Transportation Plan for the San Juan TMA Region should guide the development of its multimodal transportation system to build up livable communities and contribute to a strong competitive economy of the Region and the Island. Current changing trends in Puerto Rico require a comprehensive plan to address infrastructure needs that best contribute to conform the city envisioned for the future. The 2045 Plan is a platform that analyzes and develop the policies and strategies toward transportation investment in the Island for the next 27 years through a participatory process integrating the diversity of the economic, social, functional abilities as well as ages and different needs in the community. This planning process attempted to reach out the general public and key stakeholders, in conformance with regulations allowing effective citizen participation to assist the process of defining the path towards an integrated and multimodal transportation system.
The first step in this process was to define how our citizens foresee the future of the Region and Puerto Rico; how we envision our communities to be in terms of our living spaces which include where do we live, work, recreate, shop, and how do we travel to those daily destinations.
A San Juan TMA Region LRTP should guide the development of the Region’s multimodal transportation system. As future trends are ever changing, a comprehensive plan is required to attend to those needs and changes. This Plan is the principal guide for investing in the Island’s transportation infrastructure over the next 27 years. It has been developed through
3 CHAPTER 3 TRANSPORTATION PLANNING PROCESS FOR THE FUTURE

CHAPTER 3 TRANSPORTATION PLANNING PROCESS FOR THE FUTURE
Final Report December 2018 | 148
interaction with the public and key stakeholders, in conformance with regulations. These interactions enable effective citizen participation to assist the process of defining the path towards an integrated and multimodal transportation system.
The 2045 LRTP vision was originally based on the 2040 LRTP and was revisited in a consulting participatory process developed through active participation with the public and the committees that supported development of this document. Also, the importance of resilience (especially after Hurricane María) is considered. The plan’s Vision states:
“The Puerto Rico multimodal transportation system will offer safe, efficient, and effective accessibility and mobility for people and goods; focusing on infrastructure resilience, promoting livable and accessible communities and the sustainable socioeconomic development”.
The 2045 LRTP’s framework is multimodal in nature and focusses on meeting the Island’s need for resilient and sustainable transportation options for all its residents. This framework will support the definition of specific interventions within each Region to: (1) rehabilitate existing roadway network, or complete the current strategic highway network; (2) improve transit services; (3) consider non-motorize accessibility infrastructure and interventions; (4) allow for proper access to air, and sea ports; (5) allow for more efficient freight movements, while working to integrate and interconnect the respective modes considering the complete street principles.
Goals and Objectives
To aid the implementation of the 2045 LRTP Vision; four goals were developed with specific objectives. The updated 2045 LRTP goals and objectives are focused on four general topics, or the four E’s: Efficiency, Environment, Effectiveness and Economy.
The 2045 LRTP’s goals and objectives were updated to reflect the interests and views of the citizens, while continuing the previously set goals in the Island’s 2040 LRTP and following modern planning trends and requirements. These updated goals and objectives also emphasize the imperative to adapt to climate change, and the capability of the transportation infrastructure to withstand extreme weather events.
Several open houses and interactive technical workshops were held as part of the required public involvement (the public involvement process is detailed in Chapter 4), which ensured that decisions were made considering the public insight. The Island’s 2045 LRTP goals and objectives were presented in interactive materials, informational boards and surveys for the citizens, municipalities and advisory committees to assess the priorities of each group and to all them to propose changes. The results supported a project rating methodology towards future investment in transportation infrastructure.
Table 3.1 presents the resulting updated goals and objectives that guided the development of the 2045 LRTP. All goals and objectives play a specific role in fulfilling the vision’s intent and complement each other. These goals and their supporting objectives are clearly described, along with narrative to amplify their meaning.
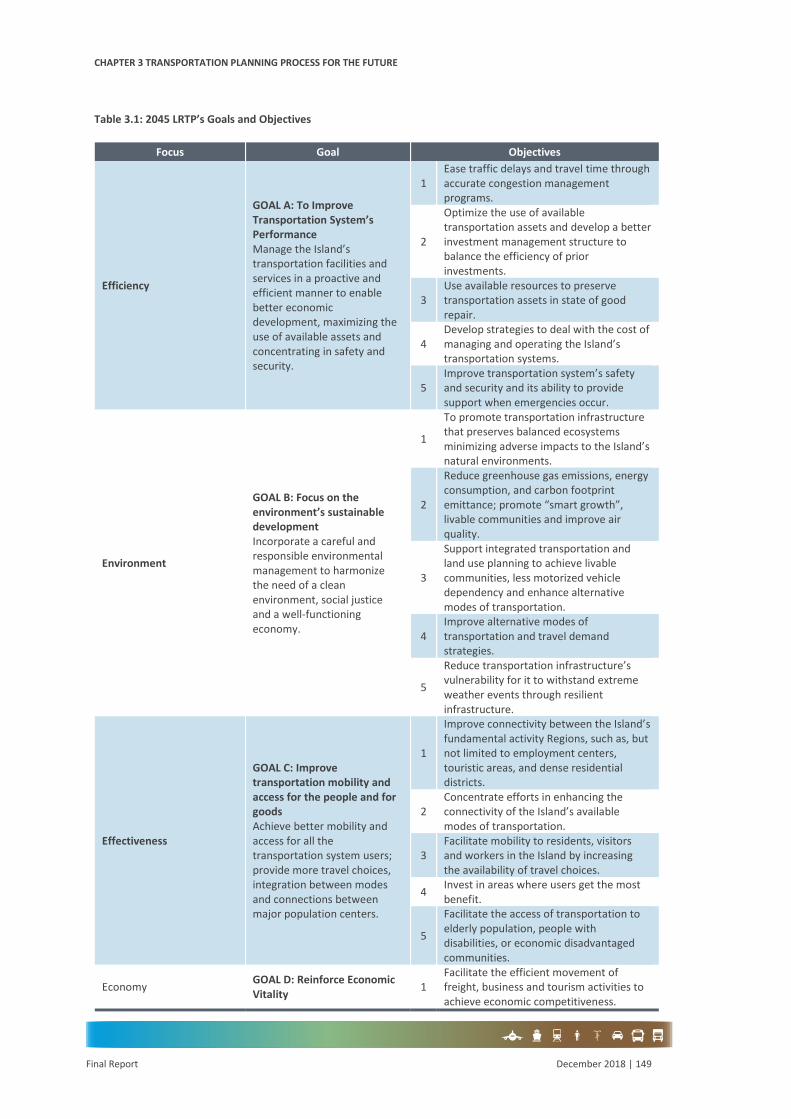
CHAPTER 3 TRANSPORTATION PLANNING PROCESS FOR THE FUTURE
Final Report December 2018 | 149
Table 3.1: 2045 LRTP’s Goals and Objectives
Focus Goal Objectives
Efficiency
GOAL A: To Improve Transportation System’s Performance Manage the Island’s transportation facilities and services in a proactive and efficient manner to enable better economic development, maximizing the use of available assets and concentrating in safety and security.
1 Ease traffic delays and travel time through accurate congestion management programs.
2
Optimize the use of available transportation assets and develop a better investment management structure to balance the efficiency of prior investments.
3 Use available resources to preserve transportation assets in state of good repair.
4 Develop strategies to deal with the cost of managing and operating the Island’s transportation systems.
5 Improve transportation system’s safety and security and its ability to provide support when emergencies occur.
Environment
GOAL B: Focus on the environment’s sustainable development Incorporate a careful and responsible environmental management to harmonize the need of a clean environment, social justice and a well-functioning economy.
1
To promote transportation infrastructure that preserves balanced ecosystems minimizing adverse impacts to the Island’s natural environments.
2
Reduce greenhouse gas emissions, energy consumption, and carbon footprint emittance; promote “smart growth”, livable communities and improve air quality.
3
Support integrated transportation and land use planning to achieve livable communities, less motorized vehicle dependency and enhance alternative modes of transportation.
4 Improve alternative modes of transportation and travel demand strategies.
5
Reduce transportation infrastructure’s vulnerability for it to withstand extreme weather events through resilient infrastructure.
Effectiveness
GOAL C: Improve transportation mobility and access for the people and for goods Achieve better mobility and access for all the transportation system users; provide more travel choices, integration between modes and connections between major population centers.
1
Improve connectivity between the Island’s fundamental activity Regions, such as, but not limited to employment centers, touristic areas, and dense residential districts.
2 Concentrate efforts in enhancing the connectivity of the Island’s available modes of transportation.
3 Facilitate mobility to residents, visitors and workers in the Island by increasing the availability of travel choices.
4 Invest in areas where users get the most benefit.
5
Facilitate the access of transportation to elderly population, people with disabilities, or economic disadvantaged communities.
Economy GOAL D: Reinforce Economic Vitality 1
Facilitate the efficient movement of freight, business and tourism activities to achieve economic competitiveness.

CHAPTER 3 TRANSPORTATION PLANNING PROCESS FOR THE FUTURE
Final Report December 2018 | 150
Source: SDG/PRHTA
Goal A: To Improve Transportation System’s Performance
Description
Manage the Island’s transportation facilities and services in a proactive and efficient manner to enable better economic development, maximizing the use of available assets and concentrating in safety and security.
Supporting Objectives
Objective A.1: Ease traffic obstruction delays and travel time through accurate congestion management programs:
Assess congestion management needs by using objective criteria, analysis and evaluation on a small scale to improve intersections and transit access; and on a larger scale to address system bottlenecks.
Objective A.2: Optimize the use of available transportation assets and develop a better investment management structure to balance the efficiency of prior investments:
Concentrate investment to achieve a better use of existing significant infrastructure, increase available street’s capabilities and corridor person capacity, in a cost-effective manner.
Objective A.3: Use available resources to preserve transportation assets in state of good repair:
Allow investment and available economic resources to preserve and rehabilitate existing transportation infrastructure in good service condition to extend its life and provide a safe and secure operating environment for users.
Objective A.4: Develop strategies to deal with the cost of managing and operating the Island’s transportation systems:
Increase the possibility of (1) achieving better project definition; (2) targeting priority projects; and (3) maximize benefits in relation to costs, by utilizing infrastructure inventories, asset management plans and congestion management network data files.
Objective A.5: Improve transportation system’s safety and security and its ability to provide support when emergencies occur:
Provide investment to promote safe-secure transportation facilities, better services before and after emergencies, resilience-redundancy capabilities to resist or assist during extreme climatic events, incidents and system blockage.
Goal B: Focus on the Environment’s Sustainable Development
Description
Procure the sustainment of livable and viable communities by encouraging economic strength, economic competitiveness and the flexibility to withstand economic difficulties.
2 Encourage potential public-private collaborations.
3 Focus in providing commercial connectivity throughout the Island.
CHAPTER 3 TRANSPORTATION PLANNING PROCESS FOR THE FUTURE
Final Report December 2018 | 151
Incorporate a careful and responsible environmental management to harmonize the need of a clean environment, social justice and a well-functioning economy.
Supporting Objectives
Objective B.1: To promote a transportation infrastructure that preserves balanced ecosystems minimizing adverse impacts to the Island’s natural environments:
Develop transportation related solutions focused in minimizing adverse impact to the natural environments, including better use of existing infrastructure
Objective B.2: Reduce greenhouse gas emissions, energy consumption, and carbon footprint emittance; promote “smart growth”, livable communities and improve air quality:
Pursue projects and programs that reduce reliance on motorized travel and better manage vehicle congestion; promote the use of energy efficient products and more “reduce, reuse, recycle” practices in infrastructure projects.
Objective B.3: Support integrated transportation and land use planning to achieve livable communities, less motorized vehicle dependency and enhance alternative modes of transportation:
Invest in the redevelopment of Traditional Urban Centers, with higher population density, to facilitate access to alternative modes of transportation and make them pedestrian/transit friendly. Intensify interagency coordination to focus on better land use, travel efficiency and easier access to businesses.
Objective B.4: Improve alternative modes of transportation and travel demand strategies:
Use Congestion Management Programs or transportation network analysis to manage travel demands and improve the coverage, capacity and service of alternative modes of transportation.
Objective B.5: Reduce transportation infrastructure’s vulnerability for it to withstand extreme weather events through a resilience and reliable infrastructure:
Develop plans and design/reconstruction approaches to reduce the chance that transportation infrastructure gets damaged during hurricanes or severe weather events, through focusing primarily on resiliency and redundancy. Meet the needs of the citizens by enabling emergency services and the flow of goods in the event of any extreme climate conditions.
Goal C: Improve Transportation Mobility and Access for the People and for Goods
Description
Achieve better mobility and access for all the transportation system users; provide more travel choices, integration between modes and connections between major population centers.
Supporting Objectives
Objective C.1: Improve connectivity between the Island’s fundamental activity Regions, such as, but not limited to employment centers, touristic areas, and dense residential districts:
Address the Island’s most important transportation corridors, their infrastructure and surroundings, and help serve numerous travel demand markets such as commercial centers,

CHAPTER 3 TRANSPORTATION PLANNING PROCESS FOR THE FUTURE
Final Report December 2018 | 152
employment areas, dense housing districts, education facilities, airports, seaports, industrial and distribution districts and tourism hubs.
Objective C.2: Concentrate efforts in enhancing the connectivity of the Island’s available modes of transportation:
Improve connectivity and continuity of the Island’s transportation networks, establish links for easier movement from a non-motorized transportation area to a motorized area; promote use of the bicycle not only for recreational activities, but as part of the transportation chain. Facilitate connections between pedestrian and/or bicycle establishments and transit.
Objective C.3: Facilitate mobility to residents, visitors and workers in the Island by increasing the availability of travel choices:
Focus in promoting the use of non-vehicular modes of transportation, improving designated facilities, their connections and their capability to function as a dependent way to address citizens’ needs.
Objective C.4: Invest in areas where users get the most benefit:
Investment will be directed taking first into account the citizens’ traveling tendencies and needs.
Objective C.5: Facilitate the access of transportation to elderly population, people with disabilities, or economic disadvantaged communities:
The 2045 LRTP will continue to provide mobility for citizens with imminent needs such as, but no limited to people with functional diversity, the elderly, those with no accesso to a private vehicle and/or with income limitations.
Goal D: Reinforce Economic Vitality
Description
Procure the sustainment of livable and viable communities by encouraging economic strength, economic competitiveness and the flexibility to withstand economic difficulties.
Supporting Objectives
Objective D.1: Facilitate the efficient movement of freight, business and tourism activities to achieve economic competitiveness:
Analyze the Island’s principal freight corridors and travel tendencies to manage traffic congestion and improve the efficiency of deliveries and goods movement
Objective D.2: Encourage potential public-private collaborations:
Consider private sector collaborations when appropriate to work as a partner with the public sector in successful project implementation, investment effectiveness and achieve costs-effective of capital and operating expenditures
Objective D.3: Focus in providing commercial connectivity through the Island:
Invest in the completion of projects that facilitate connections to airports, seaports, distribution areas, and commercial/industrial districts. Improve effectiveness of the commercial distribution process through the Island. Invest in completing the Island’s strategic highway network.

CHAPTER 3 TRANSPORTATION PLANNING PROCESS FOR THE FUTURE
Draft Report December 2018 | 153
PLANNING FACTORS The Fixing America’s Surface Transportation Act, also known as the FAST-Act, was signed into law in December 2015 and replaces the previous Moving Ahead for Progress in the 21st Century Act (MAP-21). This legislation, like its predecessor, outlines the requirements for the transportation planning process, including the compliance with planning factors. Although planning factors have been part of previous highway legislation, the FAST-Act added some factors, for a total of ten planning factors, two more than the previously stated by MAP-21. Key transportation planning factors of the FAST-Act are, resiliency and reliability, the mitigation of storm water impacts and the enhancing of travel and tourism
Planning factors identify the most important aspects of the transportation development. All projects, strategies, goals and objectives considered in developing the 2045 LRTP were designed to meet the FAST-Act required planning factors. Taking this into account, the ten identified factors in this legislation were considered when analyzing the Island’s economic development patterns, the path to achieve a more efficient use of the transportation system and resilience capabilities and the possible strategies to attend congestion issues, improve safety and mobility. The 2045 LRTP goals and objectives considered the planning factors. The FAST-Act is the authorizing legislation in the development of Puerto Rico’s 2045 LRTP. Table 3.2 summarizes how the Island’s 2045 LRTP goals and objectives will meet the planning factors as required by the referred legislation. All planning factors where adequately considered by relating them to two or more goals/objectives. These key objectives will determine the priority of the projects included in the plan’s financial analysis and help secure the proposed investment on the short, mid and long-term compliance with the FAST-Act Planning Factors.

CHAPTER 3 TRANSPORTATION PLANNING PROCESS FOR THE FUTURE
Final Report December 2018 | 154
Table 3.2: Relation between Planning Factors and 2045 LRTP Goals
Source: SDG and PRHTA
Planning Factors 2045 LRTP Goals related to Planning Factor
1 Support the economic vitality of the metropolitan area, especially by enabling global competitiveness, productivity, and efficiency
Goal A: considers traffic congestion reduction, optimize use of assets and use of resources and existing infrastructure while dealing with efficient cost management. Goal C: considers improving and enhancing connectivity, increase travel choices, and invest in higher cost/benefit initiatives. Goal D: considers improving economic competitiveness thru movement, private investment in infrastructure and improving commercial connectivity.
2 Increase the safety of the transportation system for motorized and nonmotorized users.
Goal A: considers state of good repair maintenance and improving safety. Goal B: considers integrated transportation and land use planning to achieve enhance alternative modes of transportation. Goal C: considers improving access to elderly population, people with disabilities.
3 Increase the security of the transportation system for motorized and nonmotorized users.
Goal A: considers state of good repair maintenance and improving security. Goal B: considers integrated transportation and land use planning to achieve livable communities. Goal C: considers improving access to activity centers, improving and increasing people movement populating the streets.
4 Increase the accessibility and mobility of people and freight.
Goal A: considers managing the Island’s transportation facilities and services. Goal B: considers developing transportation related solutions by better use of existing infrastructure. Goal C: considers better mobility and access for all the transportation system users. Goal D: considers facilitating efficient movement of freight, business and tourism activities.
5
Protect and enhance the environment, promote energy conservation, improve the quality of life, and promote consistency between transportation improvements and state and local planned growth and economic development patterns.
Goal A: considers extending its life and provide a safe and secure operating environment for users. Goal B: considers incorporating a careful and responsible environmental management to harmonize the need of a clean environment, social justice and a well-functioning economy. Goal C: considers better mobility and access for all the transportation system users; provide more travel choices, integration between modes and connections between major population centers. Goal D: considers sustainment of livable and viable communities by encouraging economic strength, economic competitiveness and the flexibility to withstand economic difficulties.
6 Enhance the integration and connectivity of the transportation system, across and between modes, for people and freight.
Goal B: considers projects and programs that reduce reliance on motorized travel and better manage vehicle congestion; promote the use of energy efficient products and more “reduce, reuse, recycle” practices in infrastructure projects and improve alternative modes of transportation and travel demand strategies. Goal C: considers improving and enhancing connectivity, increase travel choices, and invest in higher cost/benefit initiatives. Goal D: considers providing commercial connectivity Island-wide.
7 Promote efficient system management and operation.
Goal A: considers managing the Island’s transportation facilities and services in a proactive and efficient manner to enable better economic development, maximizing the use of available assets and concentrating in safety and security. Goal B: considers applying Congestion Management Programs or transportation network analysis to manage travel demands and improve the coverage, capacity and service of alternative modes of transportation. Goal C: considers addressing the Island’s most important transportation corridors, their infrastructure and surrounding developments. Goal D: considers investing in the completion of projects that facilitate commercial connections.
8 Emphasize the preservation of the existing transportation system. Goal A: considers optimizing the use of available transportation assets and preservation of these assets. Goal D: considers congestion management on the Island’s main freight network.
9 Improve the resiliency and reliability of the transportation system and reduce or mitigate storm water impacts of surface transportation.
Goal A: considers investment to promote better services before and after emergencies, resilience-redundancy capabilities to resist or assist during extreme climatic events, incidents and system blockage. Goal B: considers reducing transportation infrastructure’s vulnerability for it to withstand extreme weather events for a resilience and reliable infrastructure.
10 Enhance travel and tourism Goal A: considers traffic congestion reduction, optimize use of assets and use of resources and existing infrastructure while dealing with efficient cost management. Goal C: considers facilitating mobility to visitors in the Island by increasing the availability of travel choices. Goal D: considers facilitating the efficient movement of tourism activities to achieve economic competitiveness.

CHAPTER 3 TRANSPORTATION PLANNING PROCESS FOR THE FUTURE
Final Report December 2018 | 155
STRATEGIC APPROACH TO TRANSPORTATION PLANNING IN SAN JUAN TMA The envisioned planning approach for the updated 2045 LRTP focuses on enhancing the quality of life through management of assets, environmental and social justice, improved accessibility and better economic development. This section presents the strategies needed to address transportation planning in San Juan TMA considering:
• Transit;• Traffic;• Non-motorized modes;• Freight; and• Resiliency.
Strategies for Transit in San Juan TMA
Transit has an important role, specifically as an alternative mode reducing congestion and pollution. As mentioned in Chapter 2, there is a tendency showing local population is aging which presents the need to increase accessible transit services widely Island-wide to provide alternatives to those with no access to private vehicle or who cannot drive (including the elderly, the young and people with disabilities). It is important to make transit a more available, attractive and competitive alternative to the private automobile. Also, there is a need to maintain transit assets in a state of good repair as required by Transit Management Plans (TAM58). Therefore, the LRTP has set out the following strategies:
Provide New Inter-Regional Express Transit Services
Rehabilitate, expand, and develop the transit system through the development of an inter-regional express transit service. This service will provide connections between major destinations within and between the Regions resulting in an Island wide transit network.
This service should be associated with mix-use developments. It would be important to support this service with incentives to encourage walking and the use of transit throughout community and land use planning from a local and regional perspective. This service will not be successful in isolation. It would require municipal-level local bus feeder services that would provide users with comprehensive transit networks beyond the main corridors. Such a network of services would be a competitive alternative to motor vehicles by providing access between major residential areas or municipal centers to major destinations including work, educational and service areas.
Another key element that would allow a successful new service is the use of exclusive transit managed lanes. For example, a contraflow bus lane along main corridors, would allow buses to avoid traffic congestion which can improve reliability of road transit services. Another example is allowing transit services use to managed lanes such as the dynamic toll lanes (DTL) along tolled roads within the highway system.
58 Transit Asset Management Plan, the official acronym is TAMP, but is the same acronym as the Transportation Asset Management Plan (TAMP), so in this report the term TAM is used.

CHAPTER 3 TRANSPORTATION PLANNING PROCESS FOR THE FUTURE
Final Report December 2018 | 156
Provide Enhanced and Improved Local Transit Service
As previously mentioned, support from local transit services is required for the support inter-regional services. As stated early in Chapter 2, Públicos have experienced a significant drop in ridership, routes and trips. A trend that is expected to continue in the absence of policies and programs aimed at stabilizing the services. The municipalities have been increasing their offering of transit services due to the needs of their communities in response to the reduction of Público services. As a result, ridership on municipal services has been increasing. Municipal services operations are paid by the municipalities and tend to be free of charge. The lack of fares possesses challenges to the services’ coverage areas and long-term funding. As a result, it is important to provide recommendations about how to strengthen and support these services.
The integration of both Municipal and Públicos to the transit network system could be a practical alternative for many reasons including better use of resources, economic development alternatives and cost-effectiveness. Municipal and Públicos drivers in some municipalities have already entered into agreements. Agreements could include provisions such as:
1. Provide drivers with an economic incentive suitable for the specific route to ensureminimum income levels;
2. Stablish the service requirements including vehicles/drivers available to a particular route,fares, standards of service and frequencies;
3. Provide savings in mechanical and maintenance service consolidation; and4. Define the required improvements for vehicles and costs of the responsible parties.
Transit Asset Management Plan
In 2016, the Federal Transit Administration (FTA), established a requirement for all public transportation providers that receive federal transit assistance to develop a TAM. According to 49 CFR Section 625.5, transit asset management is:
“the strategic and systematic practice of procuring, operating, inspecting, maintaining, rehabilitating, and replacing transit capital assets to manage their performance, risks, and costs over their life cycles, for the purpose of providing safe, cost-effective, and reliable public transportation”.
The goals and objectives defined by the LRTP must be followed by strategies that will help achieve a State of Good Repair (SGR) established by the TAM. The Final Rule for the TAM requires transit providers to collect and use asset condition data, set targets, and develop strategies to prioritize investments to meet their goals. The PRHTA will serve as the sponsor for the group plan that will include, the 78 municipalities and the Metropolitan Bus Authority (MBA). The Maritime Transport Authority (MTA) and the Tren Urbano will have their individual TAM under the PRHTA.
Following the principles of Performance-Based Planning for management of transit assets, systems and networks must be part of the planning and management process for the PRHTA. Performance Measures and Targets must be implemented to help analyze and improve the decision-making process for the transit systems. The Performance Measures and Targets for the TAM are divided into four categories of transit assets: rolling stock, facilities, infrastructure and equipment. The performance measures on Table 3.3 are based on FTA regulations.

CHAPTER 3 TRANSPORTATION PLANNING PROCESS FOR THE FUTURE
Final Report December 2018 | 157
Table 3.3: TAM Performance Measures
Type of Assets Performance Measure Rolling Stock % of revenue vehicles that exceeded the Useful Life Benchmark (ULB).
Equipment % of non-revenue vehicles that exceeded the Useful Life Benchmark (ULB).
Facilities The percentage of facilities (by group) that are rated less than 3.0 on the Transit Economic Requirements Model (TERM) Scale.
Infrastructure The percentage of track segments (by mode) that have performance restrictions. Track segments are measured to the nearest 0.01 of a mile.
Source: TAM Performance Measures Fact Sheet https://www.transit.dot.gov/TAM/FTAOutreachMaterials/perfmsrFS
As part of the Final Rule for the TAM, PRHTA established performance targets for these performance measures. The targets were developed using data from capital assets that was collected from transit operators (26 municipalities and 3 agencies in total). Each inventory was analyzed and validated to determine the performance measure for each type of asset. The targets developed are shown in the Table 3.4:
Table 3.4: Targets for PR TAM
PRHTA Group Plan Fleet Size FTA Default ULB FY18 Base FY19 Targets
Asset-Rolling Stock
Articulated Bus (AB) 2 14 0% 0%
Bus (BU) 184 14 9% 10%
Cutaway bus (CU) 100 10 6% 6%
Minibus (MB) 33 10 27% 14%
Minivan (MV) 2 8 0% 0%
Trolleybus (TB) 16 13 44% 44%
Van (Van) 80 8 39% 27%
Automobile (AO) 25 8 0% 0%
Asset-Equipment
Automobile (AO) 40 8 53% 53%
Truck and other rubber vehicles 20 14 45% 45%
Maritime Transit Authority
Asset Rolling Stock
Ferryboat (FB) 14 41 0% 0%
ATI-TU
Asset Rolling Stock
Heavy Rail Passenger Car (HR) 74 31 0% 0%
Asset-Equipment
Automobile (AO) 32 8 28% 34%
Trucks and other rubber vehicles 14 14 64% 56%
Asset-Facilities
Facilities TERM Scale (below 3) FY18 Base FY19 Targets
Passenger/Parking 16 3 0% 0%

CHAPTER 3 TRANSPORTATION PLANNING PROCESS FOR THE FUTURE
Final Report December 2018 | 158
Administrative/Maintenance 2 3 0% 0%
Asset-Infrastructure
Track Segments FY18 Base FY19 Targets
Rail Fixed Guideway-Performance Restriction 262 1.65% 5%
Source: PRHTA
The performance measures and targets will become part of the planning process in the programming documents of the PRHTA, including the TIP and STIP. The future updates of the performance targets will be included in the TIP/STIP documents.
Strategies for the San Juan TMA Roadway Network
The strategies for San Juan TMA roadway network aim to improve and maintain roadways and bridges in the Region. Since most of the road network is in need of preservation and improvements; the costs to repair these may be beyond the capacity of the government making this strategy very important considering all transportation modes depends on a safe and efficient roadway network that allows mobility.
To accomplish that, it is necessary to follow the strategies described below.
Improve, Rehabilitate and Preserve Existing Roadways
The PRHTA has developed a Transportation Asset Management Plan (TAMP) aiming to accomplish a systematic process of operating, preserving, and improving physical assets. Specifically, the plan seeks to rehabilitate pavements conditions and bridges to get the infrastructure to a state of good repair. As a federal requirement the NHS cannot have more that 5% of the pavement in a poor condition. That represents a challenge that needs to be addressed given that in 2016 the 16.2% of NHS pavement was estimated to be in poor condition. In the case of bridges, the target is of no more than 10% of the bridges on the NHS be in poor condition.
The objectives established to guide the TAMP are59:
1. “Improve and implement a comprehensive pavement management process that allow toachieve the condition targets while managing pavements with effective life-cyclestrategies;
2. Improve and implement a comprehensive bridge management process to achieve andsustain a state of good repair, reduce life-cycle costs, and capitalize on effectivepreservation strategies;
3. In partnership with the MPO integrate effective asset management projects into theTransportation Improvement Program (TIP); and
4. Implement long-term pavement and bridge programs and strategies to address safety andachieve and sustain a state of good repair”.
In order to meet the objectives, it will be necessary to:
1. “Focus on achieving bridge and pavement conditions targets;
59 Initial Transportation Asset Management Plan, April 2018; PRHTA.

CHAPTER 3 TRANSPORTATION PLANNING PROCESS FOR THE FUTURE
Final Report December 2018 | 159
2. Invest more in preserving assets in good condition and avoid higher future costs;3. Continue to replace deteriorated pavements and bridges that are too damaged to benefit
from preservation;4. Rely on documented processes to select projects and treatment strategies that reduce
life-cycle costs;5. Develop a better data on the conditions of pavements and bridges, particularly to identify
those assets that can benefit from preservation;6. Use modern bridge and pavement computer models to estimate needed investment
levels and select projects, and;7. Improve bridge and pavement conditions and then sustain them in a state of good
repair60”.
Enhance the Strategic Roadway Network and Other Key Roadways
As part of continuing enhancement of the strategic road network on the Island, it is important to identify projects that will promote economic development and reduce congestion. This continuing enhancement is especially important because this network connects much of the Island with a high-capacity and high-speed expressway. There are several priorities roadway projects that are aligned with the PRHTA strategy to promote economic development and reduce congestion (Appendix J includes the list of Illustrative projects).
A project under development is the DTL between Caguas and San Juan to alleviate congestion levels on the road and provide access to a Bus Rapid Transit (BRT) system.
Public-private partnerships, also known as P3s; an alternative source of federal funding (competitive or loans), will represent the alternative solution mostly for large scale, complex projects such as the following within the San Juan TMA:
• PR-5 Extension Toa Alta – Bayamón; and• Congestion relieve projects on grade separated intersections (flyovers).
Strategies for Non-Motorized Modes
The strategy for Non-motorized modes aims to develop a multi-modal transportation system that integrates all transportation modes to improve mobility and access conditions and to create a more livable urban environment and a more efficient transportation system. To accomplish this, it is necessary to follow the strategies described below.
Comply with The Puerto Rico Complete Streets Plan and Design Guidelines
In September 2018, the MPO adopted the Puerto Rico Complete Streets Plan and Design Guidelines. The Complete Street are defined “as those designed to allow safe, comfortable and convenient access for pedestrians, cyclists, drivers, and public transport users, regardless of age, abilities or capacities”. “Also, a complete street implies that mobility in all its forms, is safe, it has the infrastructure to make travel enjoyable, is aesthetically pleasing and promotes the social and economic exchange”61. This document considers the Americans with Disabilities Act (ADA) legislation which defines the responsibilities of, and requirements for,
60 Initial Transportation Asset Management Plan, April 2018; PRHTA. 61 Puerto Rico Complete Streets Plan and Design Guidelines, Final Document; September 2018; PRHTA.

CHAPTER 3 TRANSPORTATION PLANNING PROCESS FOR THE FUTURE
Final Report December 2018 | 160
transportation providers to make transportation accessible to individuals with disabilities. This document makes part of this LRTP as Appendix D.
The main objectives of this plan and design guidelines are:
1. Guide state and local efforts to improve access and mobility conditions and develop newfacilities to improve the quality of life of our communities;
2. Improve and/or provide pedestrian and bicycle access to the transit system and the publicspace; and
3. Provide safe and “affordable access for people of all ages and abilities” 62.
The strategy of this Plan makes part of the strategies for non-motorized modes of this 2045 LRTP; which includes:
1. Updating decision-making processes;2. Modifying approaches for measuring performance;3. Types of complete streets measures – align with goals above;4. Incorporating complete streets into the development process;5. Providing ongoing community, stakeholders/institutional and professional education and
training;6. Internal and external communication and collaboration; and7. Implementation of Plan through “project delivery, design and funding”63.
Comply with the Comprehensive Bicycle and Pedestrian Plan
In September 2018, the MPO adopted the Comprehensive Bicycle and Pedestrian Plan for Puerto Rico. The Plan “aims to make bicycling and walking safe, accessible and integrated transportation choices for residents and visitors”64.
The main objectives of this plan are:
1. “Promote and increase the use of cycling and walking as alternative modes oftransportation;
2. Enable the physical integration of urban centers through a cycling and pedestrian networkthat improves accessibility to different land uses;
3. Incorporate the development of projects and bicycle/pedestrian facilities into statewideand municipal transportation plans;
4. Provide cycling and walking infrastructure to improve mobility, accessibility, and safety forall users of public roads; and
5. Develop and educational program for all users to share the public roads in a safemanner”65.
62 Puerto Rico Complete Streets Plan and Design Guidelines, Final Document; September 2018; PRHTA. 63 Puerto Rico Complete Streets Plan and Design Guidelines, Final Document; September 2018; PRHTA.
64 Comprehensive Bicycle and Pedestrian Plan for Puerto Rico Final Document; September 2018; PRHTA.
65 Comprehensive Bicycle and Pedestrian Plan for Puerto Rico Final Document; September 2018; PRHTA.

CHAPTER 3 TRANSPORTATION PLANNING PROCESS FOR THE FUTURE
Final Report December 2018 | 161
The strategies of this Plan make part of the strategies for non-motorized modes of this 2045 LRTP; this includes:
1. “Identification of improvements for pedestrian and bicycle facilities;2. Set up a timeframe to accomplish the improvements;3. Development of a monitoring and evaluation process; and4. Identification of many sources of grant funding available to advance walking and
cycling”66.
Strategies for Freight
Complete and Enhance Freight Network
The access route for the seaports and airports within the Region and Island-wide is the main highway network. This network provides the key connection between these facilities with the rest of the Region being important for the cargo movements and economic development.
As discussed with various stakeholders of cargo movement within the Island, there is a need to consider the addition of some main roads to the freight network. These are mainly roads providing access to/from ports and distribution centers to the strategic highway network.
Another important aspect is to continue considering strategies to reduce congestion on the strategic highway network. It is a key element within the Congestion Management Plan, which has the following objectives:
• “Monitor and evaluate performance of multimodal transportation system;• Identify the causes of congestion;• Identify and evaluate alternative actions that provide information supporting the
implementation of actions; and• Evaluate the efficiency and effectiveness of implemented actions”67.
As part of this strategy, freight interventions should seek to incorporate, as possible, recommendations such as, bottleneck and capacity improvements and travel demand management that will enhance access between freight facilities and distribution centers.
Strategies for Resilience
Due to its geographical location, Puerto Rico is highly exposed to extreme weather events such as, tropical storms and hurricanes passing near or thru the Island every year usually between July and November. This exposure to heavy rains, high speed winds and storm surge, causes landslides and flooding which effects the transportation infrastructure (as proven by the recent severe damages from Hurricane María). It is very important to develop a transportation system able to “anticipate, prepare for, and adapt to changing conditions and withstand, respond to, and recover rapidly from disruptions”68.
Damages to the transportation resulted in the isolation of communities that in many cases limited their ability to obtain supplies and services in the recovery phase after the hurricane in
66 Comprehensive Bicycle and Pedestrian Plan for Puerto Rico Final Document; September 2018; PRHTA. 67 Congestion Management Progress Report, October 2012; PRHTA. 68 FHWA’s Vulnerability Assessment and Adaptation Framework, 3rd Edition, December 2017.

CHAPTER 3 TRANSPORTATION PLANNING PROCESS FOR THE FUTURE
Final Report December 2018 | 162
an efficient and timely manner. Therefore, incorporation of resilience and vulnerability of infrastructure systems into planning is paramount.
Vulnerability Assessment
In order to incorporate actions into decision making process, it is key to understand the existing transportation infrastructure’s vulnerabilities. Such an understanding would serve as basis for developing the resiliency strategy as stated by the FHWA framework: “assessing and addressing vulnerabilities allows agencies to build their resilience, or the ability to anticipate, prepare for, and adapt to changing conditions and withstand, respond to, and recover rapidly from disruptions”69. For the first time the LRTP incorporates a vulnerability assessment. This assessment was mainly triggered by the effects of Hurricane María on the transportation infrastructure. The assessment is focused in hurricane-related hazards (refer to Chapter 6).
A more comprehensive analysis should be completed not only considering flooding and landslides but also earthquakes given the possibilities of tectonic events in the Island. Additionally, analysis of design and construction elements that will make for a more resilient transportation infrastructure is recommended.
69 FHWA’s Vulnerability Assessment and Adaptation Framework, 3rd Edition, December 2017.

CHAPTER 4 PLANNING PROCESS, PUBLIC INVOLVEMENT, AND NEEDS ASSESSMENT FOR THE 2045 PLAN
Final Report December 2018 | 163
The 2045 LRTP, and in this case the San Juan TMA metropolitan plan, involves that urbanized areas in the Region should carry out a continuing, cooperative, and comprehensive performance-based multimodal transportation planning process. The Plan 2045 document is the result of this complex process of identifying priorities for investment in surface transportation that will lead toward the economic development and mobility of the metropolitan area in the short term and at least 20 years horizon in the future (27 in this case). This chapter presents the methodology and how this process and framework was developed leading to define the criteria to identify project priorities including needs assessment toward the 2045 LRTP. This chapter is divided into 3 sections:
1. Description of the Planning Process;2. Description of the Public Involvement Process; and3. How to evaluate Infrastructure’s Needs Assessment: Model Development and
Calibration And overview of the technical approach.
PLANNING PROCESS The San Juan TMA incorporated the following steps as an analytical framework toward a comprehensive process for the implementation of the 2045 LRTP considering continuing elements from the previous 2040 Plan:
1. Reviewing the plan’s vision;2. Clarifying the plan’s vision by redefining goals and objectives;3. Infrastructure needs assessment based on a travel demand model analysis and public
involvement;4. Develop a financial resources analysis; and5. Set project options and cost-feasible plans.
The first two steps have already been discussed in this document Chapter 10 and Chapter 3. The financial analysis and project options will be discussed in 5 and Chapter 6.
4 CHAPTER 4 PLANNING PROCESS, PUBLIC INVOLVEMENT, AND NEEDS ASSESSMENT FOR THE 2045 PLAN

CHAPTER 4 PLANNING PROCESS, PUBLIC INVOLVEMENT, AND NEEDS ASSESSMENT FOR THE 2045 PLAN
Final Report December 2018 | 164
As shown in Figure 1.1, all steps were approached through an analytical process that considered the public involvement requirements and continuous coordination with the Island’s MPO. The following sections provide detailed information on this involvement process.
PUBLIC INVOLVEMENT PROCESS Public participation is an important aspect of any planning process. It is an integral part of the transportation system’s improvement by helping to ensure that decisions are made in consideration to and for the benefit of the public needs and preferences. This public input helps agencies to: (1) make better informed decisions through collaboration, (2) build mutual understanding and trust between agencies and citizens.
Gathering this collaborative information, as part of the MPO’s planning process, requires obtaining a broad insight from the public, professional and civic organizations, private companies and key governmental stakeholders. It is compulsory to consider all sectors for a final determination, especially those traditionally underserved by existing transportation systems, such as low-income and minority households.
The 2045 LRTP public involvement plan (PIP) was developed early in the process and was developed into a PIP report (complete version included in Appendix E).
The vision goals and objectives of the PIP are:
Vision: Involve and enable agencies, the interested parties and the community to provide meaningful input to the LRTP.
Goals
• Consult with the public and stakeholders to gather their ideas for solutions to theLRTP; and
• Inform and involve the public throughout the planning process.
Objectives
• Develop an effective, and proactive participation process that includes agencies,stakeholders, interested parties70 and the public;
• Create communication channels with the public to encourage public participation andobtain input;
• Use of innovative tools and media to inform the public of upcoming planning activities; and
• Encourage the participation of minority and low-income populations in the LRTPdevelopment process.
70 The FAST-Act explicitly adds public ports and certain private providers of transportation, including intercity bus operators and employer-based commuting programs to the list of interested parties that an MPO must provide with reasonable opportunity to comment on the transportation plan.

CHAPTER 4 PLANNING PROCESS, PUBLIC INVOLVEMENT, AND NEEDS ASSESSMENT FOR THE 2045 PLAN
Final Report December 2018 | 165
Target Audience
While the communications thru digital and written media seeks to involve residents across the Island, targeted efforts were made to engage a wider group of stakeholders. Figure 4.1 illustrates the defined committees involved in the process.
Figure 4.1: LRTP Committees
Source: SDG
Committees were designated to ensure the participation of key stakeholders and as an outreach effort to capture the impressions and needs from elderly population, persons with physical disabilities, low income communities, academia and professional organizations, as well as freight mobility, technical advice, and vulnerability analysis through the Resilience committee. Meeting with the defined committees and the MPO were held regularly to inform progress and gather insight during the planning process. Open houses were organized to engage the public in the LRTP planning process throughout the San Juan TMA and the Island.
Open Houses
While all aspects of community engagement and outreach are important, nothing can replace an open community forum where individuals can come and hear information about the study process and provide input regarding their specific needs and concerns. Two rounds of open houses were held to inform and received input from public. The first round took place during December 2017, and the second one between March and April 2018. Each open house round had a specific purpose.
First Round
The first round of open houses served as an educational process where citizens received information about the LRTP and provided input about their mobility needs. Considering Hurricane María had recently affected Puerto Rico’s transportation infrastructure three months earlier, these open houses focused on gathering input on how this situation changed people’s trips and which areas were most affected by the storm. For the same reason, the

CHAPTER 4 PLANNING PROCESS, PUBLIC INVOLVEMENT, AND NEEDS ASSESSMENT FOR THE 2045 PLAN
Final Report December 2018 | 166
location of these open houses where at places attracting many people such as the CESCOs, transit hubs and universities to facilitate participation of a varied demographic. A total of 566 participants were registered in 11 locations. The locations and number of participants at each open house is shown in Figure 4.4.
Figure 4.2: Open House – San Juan TMA (Humacao)
Source: SDG
These open houses had two main stations: one informative and the other interactive. The objective was to give the participants a way to receive information about the plan and to provide information regarding their needs and concerns about transportation issues. The structure allowed participants to interact by their own interest and time.
The informative stations had the general objective of informing participants about the development of a Long-Range transportation plan and to fulfill the public involvement requirements. An example is shown in Figure 4.4.

CHAPTER 4 PLANNING PROCESS, PUBLIC INVOLVEMENT, AND NEEDS ASSESSMENT FOR THE 2045 PLAN
Final Report December 2018 | 167
Figure 4.3: Total participation First Round Open Houses

CHAPTER 4 PLANNING PROCESS, PUBLIC INVOLVEMENT, AND NEEDS ASSESSMENT FOR THE 2045 PLAN
Final Report December 2018 | 168
Figure 4.4: Informative Boards
Source: SDG

CHAPTER 4 PLANNING PROCESS, PUBLIC INVOLVEMENT, AND NEEDS ASSESSMENT FOR THE 2045 PLAN
Final Report December 2018 | 169
The interactive stations had the objective of gathering information about participants’ transportation needs and concerns. Participants provided their input through questionnaires, boards and maps. Through the questionnaire, participants had the opportunity to indicate their mobility needs, and transportation infrastructure effected by Hurricane María. Citizens were asked if changes were made to their regular trips because of the effects of this atmospheric event. Additionally, people had the opportunity to identify areas were the transportation infrastructure was significantly affected by the hurricane through an interactive map. For a complete report of results see Appendix E. Figure 4.5 shows participants regular trips before and after Hurricane María within the San Juan TMA. It is evident non-motorized modes became more efficient alternatives after the event since these are non-dependent on fuels and provide more route alternatives.
Figure 4.5: Participants Regular Trips Before and After Hurricane María – San Juan TMA
Source: SDG
As part of the interactive process, participants were asked to select five main transportation issues from twenty-five possible issues. Citizens had the opportunity to identify these issues based on different modes of transportation and level of priority. Table 4.1 shows the results for San Juan TMA.
Table 4.1: Transportation Issues
Priority level San Juan TMA
Urgent Bad condition of roads
High Lack of sidewalks
Medium Lack of lighting
Low Lack of cyclist infrastructure
Very Low Insufficient routes/poor coverage
Source: SDG

CHAPTER 4 PLANNING PROCESS, PUBLIC INVOLVEMENT, AND NEEDS ASSESSMENT FOR THE 2045 PLAN
Final Report December 2018 | 170
Transportation investment was another topic of interest approached. Participants were asked how they would spend $100 on a list of transportation needs. Figure 4.6 shows the average results from San Juan TMA. Road maintenance was the main concern of the public followed by improvements to transit services.
Figure 4.6: Transportation Investment
Source: SDG
Second Round
The second round of open houses had the objective of: (1) informing the progress of the LRTP and (2) the validation of the citizens ideas and suggestions. These were published in the localnewspapers and social media and were held at specific activity centers at municipalities withineach Region. For example, see Figure 4.7. A total of 160 participant attended to the 8 locations asshown in Figure 4.8. The second round was also structured in two main stations: informative andinteractive. This design followed the first round’s method in which the participants receivedinformation about the plan, provided their needs and concerns about transportation issues andinteracted by their own interest and time.
Figure 4.7: Second Open House – San Juan TMA Region (Sagrado Corazón)
Source: SDG
$ 32.21
$ 7.51 $ 16.13
$ 5.49
$ 5.01
$ 5.58 $ 2.63 $ 4.19 Road maintenance
Reduce congestion
Public transportationimprovements
More sidewalks
Signal timing andintersectionsimprovements

CHAPTER 4 PLANNING PROCESS, PUBLIC INVOLVEMENT, AND NEEDS ASSESSMENT FOR THE 2045 PLAN
Final Report December 2018 | 171
Figure 4.8: Total Participation Second Round Open Houses

CHAPTER 4 PLANNING PROCESS, PUBLIC INVOLVEMENT, AND NEEDS ASSESSMENT FOR THE 2045 PLAN
Final Report December 2018 | 172
The informative station included the same data from the first round in benefit of new participants. It also included a presentation showing updates and results from the first open house as shown in Figure 4.9.
Figure 4.9: Example of the Presentation
Source: SDG
The interactive station’s objective was to gather information about the plan’s vision, goals, objectives and strategies. Participants provided their input through questionnaires, and interactives boards.
The main interactive exercise intended to validate the plan’s vision and goals. Each participant had the opportunity to approach the vision as presented and provide recommendations on how to improve it. Also, they had the opportunity to organize the goals and objectives in terms of priority.
Most, 75%, of the participants agree with the LRTP’s vision as presented. Most of the recommendations provided considered the following aspects:
• Transit and non-motorized modes emphasis;• Adaptation of the transportation system to the Island’s geography; and• Promote livability and land use within urban centers.
As part of this open house’s second round of interactive exercises, participants had the opportunity to identify and organize their main strategies when investing in transportation infrastructure. This input needs to be analyzed considering funding limitations and transportation challenges. Figure 4.10 shows these results for San Juan TMA. Top ranked include the vulnerability, transit service improvements and the good conditions of the existing facilities.

CHAPTER 4 PLANNING PROCESS, PUBLIC INVOLVEMENT, AND NEEDS ASSESSMENT FOR THE 2045 PLAN
Final Report December 2018 | 173
Figure 4.10: Transportation Strategies
Source: SDG
Other Engagement Initiatives
Individuals, organizations and stakeholders were provided with alternatives to engage in the plan’s process and development. Table 4.2 summarizes those initiatives. These sectors were invited to committee meetings to inform on up-to-date on issues and decisions and to provide their inputs.
Table 4.2: Engagements Initiatives
Effort Description
Household Travel Survey
An exercise in which citizens are asked to provide information about their households’ composition, available vehicles and information on their typical trips. The objective of the survey is to collect information that will characterize urban mobility patterns in Puerto Rico. Results are presented in Chapter 2 and in Appendix L.
Resilience Webinar
Members of the Resilience Committee took a webinar from the Federal Highway Administration (FHWA) to know how by federal requirements transportation planning process could integrate mechanism to develop a more resilience transportation system. This committee the supported the development of a vulnerability analysis prepared as part of the LRPS.
MPO Meetings Meetings to kept updated the MPO participants on the LRTP process and to gathered inputs and recommendations.
Municipal Sustainable Infrastructure Workshop
MPO participants had the opportunity to present their needs and alternatives for improvements to their Municipal transportation system. The main objective of this workshop was to identify projects alternatives with a regional impact. This identification process was made in collaboration with the municipalities.
INSEC
In order to reach a broader participation to validate the vision, goals and objectives, a short version of the second open house was presented at the training activity for community leaders by the Socio-Economic Community Institute, Inc (Instituto Socio-Económico Comunitario, Inc., INSEC).
Facebook Page Digital platform to inform about the process and to gather inputs from the public.
29%
0%
14%
21%
1%
24%
10% 1%
Infrastructure Vulnerability
Environment &Sustainability
Balance TransportationSystem
Good Conditions Facilities
Non-motorizedImprovements
Transit Improvements -publico
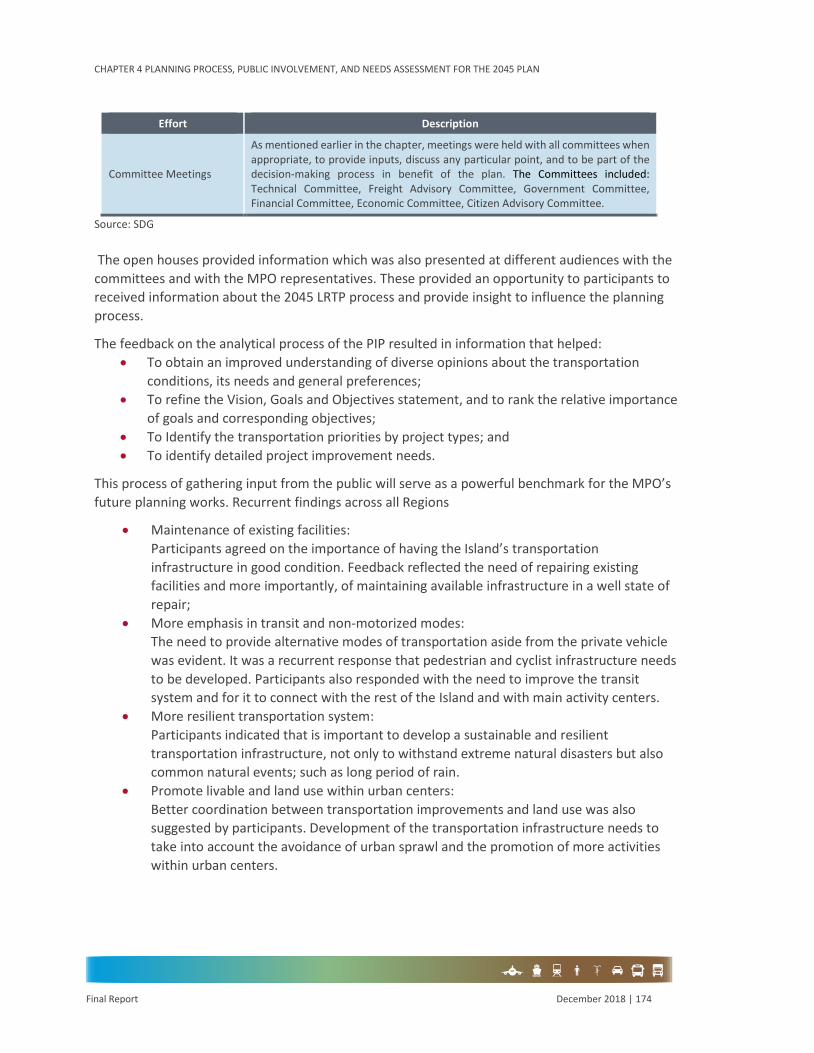
CHAPTER 4 PLANNING PROCESS, PUBLIC INVOLVEMENT, AND NEEDS ASSESSMENT FOR THE 2045 PLAN
Final Report December 2018 | 174
Effort Description
Committee Meetings
As mentioned earlier in the chapter, meetings were held with all committees when appropriate, to provide inputs, discuss any particular point, and to be part of the decision-making process in benefit of the plan. The Committees included: Technical Committee, Freight Advisory Committee, Government Committee, Financial Committee, Economic Committee, Citizen Advisory Committee.
Source: SDG
The open houses provided information which was also presented at different audiences with the committees and with the MPO representatives. These provided an opportunity to participants to received information about the 2045 LRTP process and provide insight to influence the planning process.
The feedback on the analytical process of the PIP resulted in information that helped: • To obtain an improved understanding of diverse opinions about the transportation
conditions, its needs and general preferences;• To refine the Vision, Goals and Objectives statement, and to rank the relative importance
of goals and corresponding objectives;• To Identify the transportation priorities by project types; and• To identify detailed project improvement needs.
This process of gathering input from the public will serve as a powerful benchmark for the MPO’s future planning works. Recurrent findings across all Regions
• Maintenance of existing facilities:Participants agreed on the importance of having the Island’s transportationinfrastructure in good condition. Feedback reflected the need of repairing existingfacilities and more importantly, of maintaining available infrastructure in a well state ofrepair;
• More emphasis in transit and non-motorized modes:The need to provide alternative modes of transportation aside from the private vehiclewas evident. It was a recurrent response that pedestrian and cyclist infrastructure needsto be developed. Participants also responded with the need to improve the transitsystem and for it to connect with the rest of the Island and with main activity centers.
• More resilient transportation system:Participants indicated that is important to develop a sustainable and resilienttransportation infrastructure, not only to withstand extreme natural disasters but alsocommon natural events; such as long period of rain.
• Promote livable and land use within urban centers:Better coordination between transportation improvements and land use was alsosuggested by participants. Development of the transportation infrastructure needs totake into account the avoidance of urban sprawl and the promotion of more activitieswithin urban centers.

CHAPTER 4 PLANNING PROCESS, PUBLIC INVOLVEMENT, AND NEEDS ASSESSMENT FOR THE 2045 PLAN
Final Report December 2018 | 175
MODEL DEVELOPMENT AND CALIBRATION This chapter summarizes the model update and calibration efforts of the Puerto Rico travel demand model for the 2045 LRTP.
The Puerto Rico travel demand model (LRTP Model), also named as Island-wide model, spans the main Island of Puerto Rico and the Islands of Culebra and Vieques. It includes seven Regions which are subdivided into 4,296 transportation analysis zones (TAZ).
The model is a traditional trip-based model which has four sequential steps: trip generation, trip distribution, mode choice and assignment, as shown in Figure 4.11. The forecasting process classifies all trips into one of six cores trip purposes or commercial vehicle trips:
• Home-based work (HBW), further disaggregated into three subgroups based uponincome level - including trips from home to work place or from work place to home;
• Home-based retail (HBR) – including trips from home to shops or restaurants;• Home-based school (HBS) – including school trips from home to K-12;• Home-based university (HBU) – including trips from home to university, mainly during
off-peak;• Home-based other (HBO) – including all home-based trips beginning or ending at places
not listed above;• Non-home based (NHB) – including trips with home as neither the origin nor the
destination; and• Non-household based vehicle classes – including commercial vehicles, medium weight
trucks71, and heavy trucks72.
This section includes separate sections on each major model component, as follows:
• Socioeconomic inputs;• Socioeconomic forecast;• Trip generation;• Trip distribution;• Time of day choice;• Mode choice and transit assignment; and• Highway path building and assignment.
71 Medium trucks are single-unit trucks with two or three axles in FHWA vehicle classifications 5-7.
72 Heavy trucks include all single-trailer and multi-trailer combinations defined in FHWA vehicle classifications 8-13.

CHAPTER 4 PLANNING PROCESS, PUBLIC INVOLVEMENT, AND NEEDS ASSESSMENT FOR THE 2045 PLAN
Final Report December 2018 | 176
Figure 4.11: LRTP Model Structure
Source: SDG
Socioeconomic Inputs – Base Year 2016 Update
This section focuses on the process for updating the socioeconomics inputs of the 2045 LRTP Model from the 2010 calibrated scenario (in the 2040 LRTP Model) to new Base Year 2016. A two-stage process was completed:
• Stage One: Update all 4,296 Travel Analysis Zones (TAZs) from 2010 to 2016 levels usingtheir corresponding municipal level growth from household, employment, and schooldata sources; and
• Stage Two: Holding municipal level control totals from the first stage constant, adjustindividual TAZ’s household and employment variables using TAZ specific information onnew/closed employment centers, housing permits, and school closings/openings.

CHAPTER 4 PLANNING PROCESS, PUBLIC INVOLVEMENT, AND NEEDS ASSESSMENT FOR THE 2045 PLAN
Final Report December 2018 | 177
Stage One – Municipal Methodology
To properly capture socioeconomic change in the 78 municipalities from 2010 to 2016, the 2010 population was updated with real 2016 estimates from the U.S. Census Bureau and growth rates were applied to additional variables in the Base Year 2010 socioeconomic dataset, bringing them to 2016 figures. Table 4.3 outlines the data sources and methods used to update each socioeconomic variable. Growth rates were used instead of levels due to an inability to directly match original data sources on employment from the 2040 LRTP 2010 Base Year.
Table 4.3: Socioeconomic Variable Adjustment by Municipality with Explanation and Source
Socioeconomic Variables Explanation of Adjustment Source
Population Used Municipality Level Population Estimates from U.S Census Bureau Annual estimates to update Population.
U.S. Census Bureau Annual Estimates
Households
The (2012-2016) ACS 5-year dataset provided number of occupied units and percent of occupied units that are 1-persion, 2-person, 3-person, and 4-person plus households. From this a weighted average household size by municipality from (2012-2016) ACS 5-year dataset was calculated73. This was then applied to the already adjusted population to produce the number of households by TAZ.
American Community Survey (2012-2016 5-Year Estimates) (ACS) with SDG Analysis
Total Employment
Calculated growth rates by municipality between 2010 and 2016 using BLS QCEW total employment estimates, then applied to Base Year 2010 total employment. After which, used BLS LAUS total employment to scale up to 2016 reals as the LAUS accounts for agricultural and self-employment.
BLS Quarterly Census of Employment and Wages (QCEW), BLS LAUS
Retail, Service, Manufacturing, Government, and Other Employment Industries
Assumed constant share of employment by industry, used existing industry shares from 2010 Base Year, then applied these shares to adjusted Base Year 2016 total employment. Assumption was made after analysis of BLS QCEW data by industry, which supports this assumption.
BLS
Income Calculated growth rates by municipality between (2006-2010) and (2012-2016) ACS 5-year datasets, then applied to Base Year 2010 income.
ACS
Students Calculated growth rates by municipality between (2009-2010) and (2015-2016) school year data sets, then applied to Base Year 2010 students.
National Center for Education Statistics (NCES)
College
Calculated Compound Annual Growth Rate (CAGR) by College between 2010 and 2018 enrolment datasets. Matched colleges to their corresponding TAZ from Base Year 2010 and applied calculated CAGR over 6-years to make the proper transformation to 2016 college enrolment.
NCES
Dorms Unchanged from Base Year 2010 (not used as inputs in trip generation model) N/A
Source: SDG
73 For households with 4-plus persons, an assumed average of 5 people per household was used to produce the weighted average calculation. This is different than the average household size by municipality discussed in Chapter 3, because these are weighted averages, and this process is more closely aligned to the work done in the 2040 LRTP report 2010 data.

CHAPTER 4 PLANNING PROCESS, PUBLIC INVOLVEMENT, AND NEEDS ASSESSMENT FOR THE 2045 PLAN
Final Report December 2018 | 178
Stage Two – TAZ Specific Adjustment
While Stage One accurately reflects municipality-level growth, it does not capture TAZ-level changes regarding new housing complexes and new or closed employment centers. Because municipal growth rates capture these internal dynamics at an overall level, it is important to redistribute the change across the other TAZ units in the corresponding municipality so that total employment and population are not affected. This process was completed after applying the methods outlined in Table 4.4.
Table 4.4: Socioeconomic Variable Adjustment by TAZ with Explanation and Source
Socioeconomic Variables Explanation of Adjustment Source
Households
Calculated the number of expected apartments for each permit. Developed metric of ‘project cost per apartment’, from publicly available data on completed projects. Used this metric to determine number of apartments for permit projects where not data was publicly available. Each new apartment was assumed equal to a new household. This was applied to the TAZ corresponding to each permit location.
Permit Management Office of Puerto Rico, (2010-2015) housing permits
Population Population was adjusted for the inclusion of new households by applying the household size by municipality to the new Base Year household’s variable.
ACS (2012-2016 5-Year Estimates)
Retail Employment
Calculated the estimated number of employees for each retail permit. Determined which shopping centers were completed prior to 2016 via research. Developed a metric of ‘project cost per employee’ from publicly available data on completed retail centers. Used this metric to determine employees for projects where employee data was not publicly available. This was applied to the TAZ corresponding to each retail permit location.
Permit Management Office of Puerto Rico, (2010-2015) housing permits
Service Employment
Accounted for new major hotels (defined as having over 100 rooms) and applied the associated employment change to the TAZ corresponding to each hotel location.
Puerto Rico Industrial Development Corporation (PRIDCO)
Manufacturing Employment
Accounted for closed manufacturing companies and applied the associated change in employment to the TAZ corresponding to each firm location. PRIDCO
Source: SDG
Overview of Population and Employment Change
The geography of the seven Regions in Puerto Rico is displayed in Figure 2.1. The resulting population and employment by Region from the updates discussed above are shown in Table 4.5. These and 2045 LRTP 2016 socioeconomic datasets are by place of work. Population has declined Island wide, as has employment, albeit, at a slower rate.
Table 4.5: Population and Employment –2045 LRTP Base Year 2016
Region Population - Base Year 2016 Employment - Base Year 2016 Aguadilla 288,777 81,952
East 73,438 22,329
North 284,567 69,443
San Juan 2,058,458 610,178
South 371,347 112,846

CHAPTER 4 PLANNING PROCESS, PUBLIC INVOLVEMENT, AND NEEDS ASSESSMENT FOR THE 2045 PLAN
Final Report December 2018 | 179
Region Population - Base Year 2016 Employment - Base Year 2016 Southeast 106,617 22,565
Southwest 228,103 66,837
Puerto Rico 3,411,307 986,151
Source: SDG
Figure 4.12 displays changes at the TAZ level between 2010 and 2016. It also shows that below the regional level, there are some municipalities that have experienced slight population and employment growth. The change between 2010 and 2016 is discussed in further depth in Chapter 2 during the DEMOGRAPHICS, Population and Employment sections.
Figure 4.12: Population and Employment Change at the TAZ level, 2010 – 2016
Source: SDG analysis
Socioeconomic Inputs – Forecast Year 2045
This section details the processes of distributing these forecasts to the transportation analysis zone (TAZ) level, forecasting additional input variables, and producing final constrained models. The 2016 base socioeconomic inputs serve as the origin point for these processes.

CHAPTER 4 PLANNING PROCESS, PUBLIC INVOLVEMENT, AND NEEDS ASSESSMENT FOR THE 2045 PLAN
Final Report December 2018 | 180
Population and Employment Forecasts
As explained in Chapter 2, Employment in the 2045 LRTP 2016 base socioeconomic inputs are produced with BLS - LAUS. The LAUS employment is reported by “place of residence, an adjustment is carried out to convert to employment by place of work.”74 The 2045 LRTP econometric forecasts were produced using the BLS Quarterly Census of Employment and Wages (QCEW), also by place of work, allowing growth rates from the 2045 LRTP employment forecasts to be applied the 2016 base socioeconomic inputs.
Detailed in Table 4.6 are the methods used to implement 2045 LRTP forecasts in producing forecasts for socioeconomic variables at the TAZ level, and other processes completed to finalize the 2045 socioeconomic inputs. The purpose of producing inputs at the TAZ level is for their use in the trip generation phase of the network model. They additionally serve as an insightful baseline for discussions around existing trends and potential alternative scenario’s that would shift the trajectory outlined here.
74 The adjustment is described in the 2010 report by 2040 LRTP. 2045 LRTP 2016 socioeconomic inputs applied growth rates to the 2040 LRTP 2010 data as noted in the chapter on Socioeconomic Inputs – Base Year 2016, making it also by Place of Work.

CHAPTER 4 PLANNING PROCESS, PUBLIC INVOLVEMENT, AND NEEDS ASSESSMENT FOR THE 2045 PLAN
Final Report December 2018 | 181
Table 4.6: Socioeconomic Variable Adjustment by Municipality, Explanation, and Source
Socioeconomic Variables Explanation of Adjustment Source
Population
Distributed population from forecasts by Region down to their respective municipalities using the shares established in the base year 2016 socioeconomic inputs. After 2030, in the constrained forecasts, population is tied to forecasted employment growth.75
SDG Population Forecast
Households
Utilizing the average year over year growth rates from 2005-2016 for the Island of Puerto Rico, household size by municipality from the 2016 base year socioeconomic inputs was forecasted out until 2030, at which point rates were frozen.76
Forecast – Produced from ACS, Public Use Microdata Sample (PUMS) and SDG analysis
Total Employment
Applied growth rates by Region from the employment forecasts to the base 2016 socioeconomic inputs, distributing growth rates to the municipalities and TAZ corresponding to their associated Region.
Bureau of Labor Statistics (BLS) Quarterly Census of Employment and Wages (QCEW), BLS Local Area Unemployment Statistics (LAUS)
Retail, Service, Manufacturing, Government, and Other Employment Industries
With the basis of historical trends at industry level employment the technical team assumed a 10% decline by 2045 in manufacturing and government employment. This employment was redistributed to the retail, service, and other employment sectors, based on each TAZ’s relative loss and the breakdown of employment in the retail, service and other employment sectors. Because of this, total municipality employment is left unaffected.
SDG Analysis
Income
Growth rates stemming from wage rate forecasts produced as part of the population and employment econometric models, were applied uniformly across incomes by municipality in the Base Year 2016 dataset, to adjust income out to 2045.
SDG Analysis and Forecast
Students
Student to population rates were forecasted and applied uniformly across the # of students by municipality in the base year 2016 dataset, to realize the impact of population loss and birth rate decline in Puerto Rico.
SDG Analysis and forecast
College
College students to population rates were forecasted and applied uniformly across the # of college students by municipality in the base year 2016 dataset, adjusting the college student population to forecasted 2045 levels.
SDG Analysis and Forecast
Dorms Unchanged from Base Year 2010 (not used as inputs in trip generation model) N/A
Source: SDG
75 The constrained forecast methodology is discussed further in the technical forecasting note in Appendix B. 76 After analysis of the declining birth rate in Puerto Rico, the assumption of constant household size, population/household ratio, did not reasonably hold. Forecasts were developed for household size using their historical trend, carrying out the final year over year growth rate between 2015 and 2016. It was assumed that at 2030, birth rates would not continue to decline, as they are approaching a floor, being already one of the lowest in the world. Which is why the decline in household size is discontinued at 2030 levels as the forecasts continue.

CHAPTER 4 PLANNING PROCESS, PUBLIC INVOLVEMENT, AND NEEDS ASSESSMENT FOR THE 2045 PLAN
Final Report December 2018 | 182
Overview of Population and Employment Change
In the San Juan TMA, from 2016 to 2045 seen in Table 4.7, population is forecasted to decline by just over 300,000 as employment declines by just under 100,000. Both of which represent higher percentage declines than at the Island-wide level. This data is visually mapped in Chapter 2, from Figure 2.65 to Figure 2.69.
Table 4.7 Population and Employment Change in San Juan TMA, Base Year 2016 – Forecast Year 2045
Region 2016 Pop 2045 Pop Change 2016 Emp. 2045 Emp. Change San Juan TMA 2,058,458 1,712,058 (16.8%) 610,178 520,792 (14.6%)
Puerto Rico 3,411,307 2,893,950 (15.2%) 986,151 897,987 (8.9%)
Source: SDG Forecast
Networks and Analysis
TAZ Urban Density
Figure 4.13 represents population density by square mile, allowing a visual distribution of population throughout municipalities and larger Regions. With public transportation’s ridership base generally focused and made sustainable by high population densities, this can be a helpful and guiding graphic to identify corridors or areas to be assessed. The designations described in the graphic were guided by the U.S. Census Bureau’s urban and rural classifications, and it is important to note that the map does not distinguish between land use, being strictly defined by population density. The ranges of the designations are defined in Table 4.8 below.
Table 4.8: Urban Density Area Types
Area Type Population by Square Mile
Rural (0-300) Exurban (300-1000) Suburban (1000-2000) Suburban Dense (2000-3000) Urban (3000-5000)
High Density Urban (5000-20000)
High Density Urban Core (20000+)
Source: 2016 population from Bureau of Census estimates, distributed to TAZ by SDG. Ranges produced by SDG guided by Bureau of Census definitions.

CHAPTER 4 PLANNING PROCESS, PUBLIC INVOLVEMENT, AND NEEDS ASSESSMENT FOR THE 2045 PLAN
Final Report December 2018 | 183
Figure 4.13: Area Types – San Juan TMA

CHAPTER 4 PLANNING PROCESS, PUBLIC INVOLVEMENT, AND NEEDS ASSESSMENT FOR THE 2045 PLAN
Final Report December 2018 | 184
Trip Generation
This section describes the modifications made to the trip generation component of the 2045 LRTP Model. The effects of those modifications are illustrated on the end-result of trip generation, i.e. the balanced productions and attractions by trip purpose. The modifications consisted of:
• Updates to some of the source data;• Re-estimation of the models that support the population synthesizer with the updated
data; and• Miscellaneous changes to the general methodology which the technical team considered
were appropriate.
Data Source Updates
The data sources that serve as input to the population synthesizer component of the trip generation models were updated, but no changes to the production or attraction models were introduced. Table 4.9 shows the components of the trip generation model, the purpose of each component, and the nature of the updates made, if any.
Table 4.9: Components of Trip Generation Model
Source: SDG
77 National Cooperative Highway Research Program (NCHRP) Report 365: Travel Estimation Techniques for Urban Planning, 1998 (http://onlinepubs.trb.org/onlinepubs/nchrp/nchrp_rpt_365.pdf).
Model(s) Dataset Estimation Method Purpose Update
Household size and income group models
Census Tract
Linear regression of average household size / income on size / income group distribution
Disaggregate households into the 384 types by size, income group, numbers of workers, children, and seniors
Replaced 2010 Census with 2016 ACS 5-
Year Data
Household composition models PUMS
Cross-classification with household size and income group Replaced 2006-
08 with 2012-16 PUMS Data Household auto
ownership model PUMS Logit
Estimate probability of having 0, 1, 2 or 3+ autos per household for each household type
Production models for each trip purpose (other than truck trips)
2011 Puerto Rico
Household Travel Survey
(HHTS)
Linear regression of trips generated on household characteristics derived from PUMS / IPF process
Generate productions by TAZ None
Attraction models for each trip purpose (other than truck trips)
NCHRP 36577 n/a Generate attractions by TAZ None
Truck productions / attractions model
External Models n/a Generate truck productions
and attractions by TAZ None

CHAPTER 4 PLANNING PROCESS, PUBLIC INVOLVEMENT, AND NEEDS ASSESSMENT FOR THE 2045 PLAN
Final Report December 2018 | 185
As described in the prior section, the TAZ data from the prior model base year 2010 to 2016 was updated. This data serves as the backbone to trip generation.
Re-estimation of Population Synthesizer Models
Since the census tract and PUMS data serve as inputs to the models which support the population synthesizer, those models were re-estimated to reflect changes in demographics. These models estimate:
• The distribution of household sizes as a function of a zone’s average household size;• The distribution of income groups as a function of a zone’s average household income;• Numbers of workers, children and seniors as a function of a household’s average size
and income group; and• Auto ownership as a function of household demographics.
Detailed information on the re-estimation of the population synthesizer process is included in Appendix F.
Changes to Trip Balancing Methodology
In addition to updating the data and re-estimating the population synthesizer models as discussed above, a full review of the methodology was conducted finding several items to be addressed, all related to balancing productions and attractions. These included:
• A “validation factor” of 1.45 for home-based work attractions;• The balancing alternative (balancing to productions vs attractions) for several trip
purposes; and• Trip balancing within each Region individually.
Detailed information on the changes to trip balancing is included in Appendix F.
Validation Factors in Model Update
After applying all of the above changes, the resultant Island-wide average number of trips per household had decreased from 5.29 in the 2040 LRTP Model to 4.34 in the 2045 LRTP Model update. This is, by most sources, a very low number – the Florida Department of Transportation Travel Demand Model Validation Standards78, used to validate the prior LRTP model’s trip generation output, suggests a range of 8 to -10 person-trips per household. Although Puerto Rico travel per household may be lower, it seems unlikely that it would only be 50% as much as in Florida. To corroborate that difference, initial runs of the model produced traffic volumes that were generally significantly lower than observed traffic counts across the whole Island.
Thus, Region-specific factors to increase all trips were implemented (both productions and attractions), based on the general level of modeled traffic volumes, as compared to traffic counts. Table 4.10 presents those factors.
78 Florida Travel Demand Model Validation Standards, Cambridge Systematics, Inc. for Florida Department of Transportation, 2009.

CHAPTER 4 PLANNING PROCESS, PUBLIC INVOLVEMENT, AND NEEDS ASSESSMENT FOR THE 2045 PLAN
Final Report December 2018 | 186
Table 4.10: Region-Specific Trip Generation Factors
Region Factor Aguadilla 1.960
East 1.843
North 1.940
San Juan 1.186
South 1.323
Southeast 1.303
Southwest 1.803
Source: SDG
Truck Trip Generation
Due to the lack of the survey data, the production or attraction models for commercial and truck trips in the 2045 LRTP model were not updated, although global factors to adjust the trip productions and attractions based upon the general level of modeled truck volumes, as compared to the observed counts, were introduced. See Table 4.11. The resulting medium and heavy truck demand in 2016 increased by approximately 40,500 and 1,200 from the 2010 traffic conditions, respectively.
Table 4.11: Truck Trip Generation Factors
Vehicle Type Factor Commercial Vehicles 1.00
Medium Truck 1.31
Heavy Truck 1.10
Source: SDG
Validation of Trip Generation Output
Table 4.12 presents a comparison of the trip shares within each trip purpose, for the 2040 LRTP model (prior to any of the changes discussed in this report), and for the 2045 LRTP Model update, prior to and after the regional validation factors from Table 4.10.
Table 4.12: Comparison of Person Trip Shares and Total Trips per Household to Florida DOT Validation Standards
Florida DOT
Standard
2040 LRTP Model
2045 LRTP Model Update –
Before Regional Validation Factors
After Regional Validation Factors
Home-Based Work 12%-24% 31% 27% 27%
Home-Based Retail 10%-20% 17% 20% 20%
Home-Based School 5%-8% 18% 7% 7%
Home-Based Other (includes University) 23%-40% 20% 28% 28%
Non-Home Based 20%-33% 15% 18% 18%
Total Number of Person Trips Per Household 8.0 – 10.0 5.29 4.34% 5.87%
Source: SDG

CHAPTER 4 PLANNING PROCESS, PUBLIC INVOLVEMENT, AND NEEDS ASSESSMENT FOR THE 2045 PLAN
Final Report December 2018 | 187
Table 4.12 shows that in the 2040 LRTP Model, both work and school trips were a much larger share of overall trips than in the validation standards, while home-based other and non-home-based trips had shares below the lower ends of their ranges. Balancing home-based school trips to attractions rather than productions and making school enrollment control the total trips addressed that inconsistency and brought the share of home-based school trips into the recommended range. Reductions to home-based work trips due to the census data update helped bring the share of home-based work trips closer to the recommended range, albeit still slightly above. Finally, the regional validation factors did not affect relative shares between trip purposes, but increased the number of trips per household to 5.87, a level still below the Florida standard, but much closer, as opposed to 50% below the low end of the range.
Overall, the trip generation updates bring both the relative numbers of trips between purposes and the total numbers of trip generated closer to well-established standards.
Trip Distribution
This section focuses on the updates and the calibration of the trip distribution component of the 2045 LRTP Model. Trip distribution links trip productions in the model Region with trip attractions to create matrices of inter and intra-zonal travel flows. The results of trip distribution will be used as inputs to mode choice and later assigned to highways and/or transit systems to determine the travel demand constrained by the supply capacities of the underlying facilities.
Gravity Model
The LRTP Model uses a standard gravity model to distribute trips from each origin zone to each destination zone in the model Region. The number of trips between zones is a function of the attractiveness of a zone and the travel impedance between zones:
𝑇𝑇𝑃𝑃𝑖𝑖 = 𝑃𝑃𝑃𝑃 𝐴𝐴𝑖𝑖𝐹𝐹(𝐶𝐶𝑃𝑃𝑖𝑖)𝐾𝐾𝑃𝑃𝑖𝑖
∑ 𝐴𝐴𝑖𝑖𝐹𝐹(𝐶𝐶𝑃𝑃𝑖𝑖)𝐾𝐾𝑃𝑃𝑖𝑖nj=1
Where:
• Tij: trips from zone i to zone j;• Pi: trips produced from zone i;• Aj: trips attracted to zone j;• F(Cij): generalized cost friction factor; and• Kij: zone-to-zone calibration factor, which adjusts the attractiveness from zone i to
zone j.
Travel Impedances
The trip distribution uses the minimum travel impedances among the generalized costs of auto trips, transit trips, and non-motorized trips from an origin zone to a destination zone. The travel impedances of auto, transit and non-motorized travel are functions that convert all measures, namely vehicle journey time, operating costs, highway tolls, transit fares, and walk distances, into equivalent minutes.
To accurately estimate the travel cost, it is essential to use the up-to-date value of time (VOT) to calculate the travel impedance. The 2040 LRTP Model assumed the VOTs at $12 and $21 per hour

CHAPTER 4 PLANNING PROCESS, PUBLIC INVOLVEMENT, AND NEEDS ASSESSMENT FOR THE 2045 PLAN
Final Report December 2018 | 188
for a car trip and a truck trip, respectively. These values seemed slightly high related to the median household income of the Island79. Based upon US Department of Transportation (USDOT) revised VOT Guidance 201680, the VOT of a business traveler is assumed to be equal to a median hourly gross wage, while the VOT of local personal travel is typically estimated at 50 percent of hourly median household income. The VOT of both passenger car and truck travelers were re-estimated, resulting in values presented in Table 4.13.
Table 4.13: Value of Time ($/hour, in 2016$)
Vehicle Class 2040 LRTP 2045 LRTP Auto 12.0 10.10
Truck 21.0 17.68
Source: SDG analysis of value of time
The auto operating cost (AOC) was set at $0.20/mile based upon the American Automobile Association (AAA) 2016’s Your Driving Costs81 for gas, maintenance, and tires, with adjustment to the average gas price in Puerto Rico in 2016. This value is comparable to the auto operating costs implemented in the Southeast Florida Regional Planning Model (SERPM 7.0)82. For trucks, it was assumed a truck operating cost (TOC) of $0.80/mile. The truck value comes from a combination of trucking industry interviews, which suggested a cost range from $0.80 to $1.75, and the fuel, maintenance, and tires costs published in American Transportation Research Institute (ATRI) 2012 Cost of Trucking83. Table 4.14 shows the vehicle operating costs used in the 2040 LRTP Model and the updated values.
Table 4.14: Vehicle Operating Cost ($/mile, in 2016$)
Vehicle Class 2040 LRTP 2045 LRTP Auto 0.1625 0.20
Truck 0.5833 0.80
Source: SDG analysis of vehicle operating cost
79 Median household income and Gini Index in the past 12 months in 2016 in Puerto Rico is $20,078 (https://www.census.gov/content/dam/Census/library/publications/2017/acs/acsbr16-02.pdf).
The BLS’s third quarter (2016) county employment and wages in Puerto Rico is $524/week. (https://www.bls.gov/Regions/new-york-new-jersey/news-release/countyemploymentandwages_puertorico.htm).
80 The Value of Travel Time Savings: Departmental Guidance for Conducting Economic Evaluations Revision 2 (2016 Updates), September 2016 (https://www.transportation.gov/office-policy/transportation-policy/revised-departmental-guidance-valuation-travel-time-economic). 81 Available at https://exchange.aaa.com/wp-content/uploads/2017/05/2016-YDC-Brochure.pdf. 82 SERPM 7.0 uses an assumed auto operating cost of 19.80 cents/mile, including 13.50 cents/mile of fuel cost, and 6.30 cents/mile of maintenance cost (in 2009 dollars). 83 American Transportation Research Institute, “An Analysis of the Operational Costs of Trucking: A 2012 Update”.
https://www.bls.gov/regions/new-york-new-jersey/news-release/countyemploymentandwages_puertorico.htm

CHAPTER 4 PLANNING PROCESS, PUBLIC INVOLVEMENT, AND NEEDS ASSESSMENT FOR THE 2045 PLAN
Final Report December 2018 | 189
The highway costs did not include parking costs in the 2045 LRTP Model since uniform data was not available for the entire Island.
Friction Factors
The gamma function from the 2040 PR LRPT Model to calculate friction factions was adopted:
𝐹𝐹𝐹𝐹 = 𝑃𝑃𝑏𝑏 × 𝑝𝑝𝑐𝑐𝑡𝑡
Where 𝑃𝑃 is the travel impedance, and 𝑏𝑏 and 𝑐𝑐 are parameters to be calibrated.
During the calibration process, due to the lack of observed data, only the coefficients of gamma function for the home-based work trips were re-estimated, in order to keep the average travel time and travel time distribution close to that of the 2040 LRTP Model. Table 4.15 presents the changes of coefficients made for the 2045 LRTP Model.
Table 4.15: Coefficient of Gamma Functions of HBW Trips
Trip Purpose 2040 LRTP Model 2045 LRTP Model
b c b c
HBW Low Income 0 (0.064) 0 (0.07)
HBW Medium Income 0 (0.048) 0 (0.056)
HBW High Income 0 (0.04) (0.01) (0.055)
Source: SDG 2045 LRTP model update
The resulting friction factors of the HBW trips and the comparison between the 2040 and 2045 LRTP models for low, medium, and high income travel are presented in Figure 4.14, Figure 4.15, and Figure 4.16 respectively.
Figure 4.14: Comparison of Friction Factors of Low Income HBW Trips (2040 LRTP vs. 2045 LRTP)
Source: SDG analysis of friction factors
0
20,000
40,000
60,000
80,000
100,000
0 12 24 36 48 60 72 84 96 108
120
132
144
156
168
180
192
204
216
228
240
Fric
tion
Fact
ors
Travel Time (minute)
HBW1 - 2040 LRTP HBW1 - 2045 LRTP

CHAPTER 4 PLANNING PROCESS, PUBLIC INVOLVEMENT, AND NEEDS ASSESSMENT FOR THE 2045 PLAN
Final Report December 2018 | 190
Figure 4.15: Comparison of Friction Factors of Medium Income HBW Trips (2040 LRTP vs. 2045 LRTP)
Source: SDG analysis of friction factors
Figure 4.16: Comparison of Friction Factors of High Income HBW Trips (2040 LRTP vs. 2045 LRTP)
Source: SDG analysis of friction factors
K Factors
The K factor is a zone-to-zone trip adjustment coefficient that modifies the attractiveness of one trip attraction to trip production. Normally, the use of K factors helps to capture certain characteristics that influence travel patterns, from which a gravity model cannot directly estimate. Examples of these characteristics include tax policies that reduce or support travel to certain Regions, travel time reliability that affects the likelihood of travel, and geographic and/or topographical features, namely large water bodies, reserved/restricted areas, and mountain ranges as intermediate stops which may prevent travel. These limitations introduce an inconsistency into the distribution process and may further justify the use of k factors for some situations.
0
20,000
40,000
60,000
80,000
100,000
0 12 24 36 48 60 72 84 96 108
120
132
144
156
168
180
192
204
216
228
240
Fric
tion
Fact
ors
Travel Time (minute)
HBW2 - 2040 LRTP HBW2 - 2045 LRTP
0
20,000
40,000
60,000
80,000
100,000
0 12 24 36 48 60 72 84 96 108
120
132
144
156
168
180
192
204
216
228
240
Fric
tion
Fact
ors
Travel Time (minute)
HBW3 - 2040 LRTP HBW3 - 2045 LRTP

CHAPTER 4 PLANNING PROCESS, PUBLIC INVOLVEMENT, AND NEEDS ASSESSMENT FOR THE 2045 PLAN
Final Report December 2018 | 191
The 2040 LRTP model did not have K factors in place. After reviewing the 2016 traffic flows from highway assignment on screenlines, new coefficients were introduced to the 2045 LRTP Model to adjust the municipality-to-municipality trip flows. Table 4.16 presents the K factors developed for home-based work, home-based other, home-based retail, and non-home-based trips. With them, the attractiveness of travel within San Juan and between North Region and San Juan was increased, while reduced between Aguadilla and San Juan.
Table 4.16: K Factors for 2045 LRTP Model
Region Aguadilla East North San Juan South Southeast Southwest
Aguadilla 1.00 1.00 1.00 0.85 1.00 1.00 1.00
East 1.00 1.00 1.00 1.00 1.00 1.00 1.00
North 1.00 1.00 1.00 1.10 1.00 1.00 1.00
San Juan 0.85 1.00 1.10 1.10 1.00 1.00 1.00
South 1.00 1.00 1.00 1.00 1.00 1.00 1.00
Southeast 1.00 1.00 1.00 1.00 1.00 1.00 1.00
Southwest 1.00 1.00 1.00 1.00 1.00 1.00 1.00
Source: SDG 2045 LRTP Model update
Model Validation
The trip distribution of 2040 LRTP Model was calibrated by the average trip lengths and the trip length frequency distributions calculated from the 2011 Puerto Rico household survey. To examine the changes of travel patterns in the past 5-years (2011 – 2016), it was proposed to conduct a new household survey for information on origin-destination travel data for all trip purposes. However, due to Hurricane Irma and Hurricane María in Summer 2017 causing great damage to the Island, the planned Island-wide household survey was postponed. Because of this delay, it was not possible to update the trip length frequency distribution calculation, or re-estimate coefficients of the gamma function from the survey results.
A limited validation to the trip distribution step with three measures was conducted:
• Region-to-Region travel patterns;• Average trip length; and• Trip length frequency distribution.
Detailed information on this validation process is included in Appendix F.
Time of Day Choice
This section describes the methodologies available to segment the daily demand into peak and off-peak periods in preparation for mode choice, and after mode choice, further disaggregate the auto and truck trips into finer time periods for highway assignment.
Both trip generation and trip distribution were developed on a daily basis. In the 2040 LRTP Model, the mode choice was also performed on a daily basis. As the outputs of mode choice process, the daily vehicle trips were then disaggregated into four periods (AM Peak, midday, PM Peak, and night) for highway assignment. In reality, the choice of travel mode made by individuals

CHAPTER 4 PLANNING PROCESS, PUBLIC INVOLVEMENT, AND NEEDS ASSESSMENT FOR THE 2045 PLAN
Final Report December 2018 | 192
would vary by time due to the changes of level of service and congestion. Thus, in the 2045 LRTP Model, the mode choice model was modified from daily basis to peak and off-peak periods.
Pre-Mode Choice Time-of-the-Day Trip Distribution
In preparation for mode choice, diurnal factors were applied to subdivide the daily trips by purpose into peak and off-peak trips. These factors, as presented in Table 4.17, were initially adopted from the 2040 LRTP Model, by combining the AM and PM peak factors to derive peak period, and midday and night factors to derive off-peak factors. During the model calibration, these were adjusted upon the observed traffic data.
Table 4.17: Daily to Peak and Off-peak Factors
Trip Purpose Peak Off-Peak HBW – Low Income 0.500 0.500
HBW – Medium Income 0.500 0.500
HBW – High Income 0.500 0.500
HBO 0.201 0.799
HBR 0.100 0.900
HBS 0.720 0.280
HBU 0.420 0.580
NHB 0.190 0.810
COM 0.400 0.600
MTK 0.330 0.670
HTK 0.350 0.650
Source: SDG 2045 LRTP Model update
Time of Day Distribution for Highway Assignment
The transit trips estimated by the mode choice process were retained in peak and off-peak designations for purposes of assignment. The highway assignment was performed by finer time-of-day breakdowns to account for congestion effects and the subsequent diversion of trips caused by that congestion. The 2045 LRTP Model adopts four periods covering the AM and PM peak, the Midday period, and the other off-peak periods.
Peak periods comprise of multiple hours. Since link capacity is normally defined hourly, peak period factors were developed to convert hourly capacities to period capacities. Table 4.18 presents the period definition, the length of each period, and the hourly-to-period capacity factors.
Table 4.18: Hourly to Period Capacity Factors
Period Timeframe Number of Hours Period Capacity Factor AM Peak 7am – 9am 2 2.0 Midday 9am – 3pm 6 5.8
PM Peak 3pm – 6pm 3 2.9 Other Off-peak (Night) 6pm – 7am 13 6.2
Source: 2045 LRTP Model
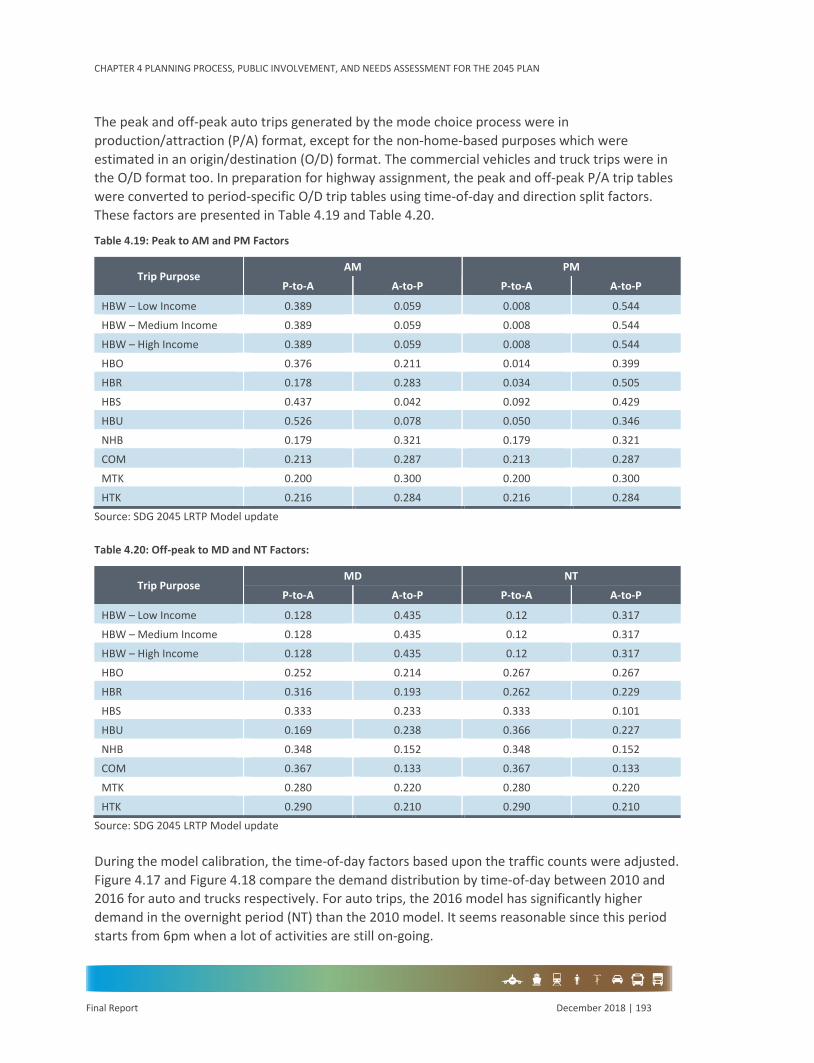
CHAPTER 4 PLANNING PROCESS, PUBLIC INVOLVEMENT, AND NEEDS ASSESSMENT FOR THE 2045 PLAN
Final Report December 2018 | 193
The peak and off-peak auto trips generated by the mode choice process were in production/attraction (P/A) format, except for the non-home-based purposes which were estimated in an origin/destination (O/D) format. The commercial vehicles and truck trips were in the O/D format too. In preparation for highway assignment, the peak and off-peak P/A trip tables were converted to period-specific O/D trip tables using time-of-day and direction split factors. These factors are presented in Table 4.19 and Table 4.20.
Table 4.19: Peak to AM and PM Factors
Trip Purpose AM PM
P-to-A A-to-P P-to-A A-to-P
HBW – Low Income 0.389 0.059 0.008 0.544
HBW – Medium Income 0.389 0.059 0.008 0.544
HBW – High Income 0.389 0.059 0.008 0.544
HBO 0.376 0.211 0.014 0.399
HBR 0.178 0.283 0.034 0.505
HBS 0.437 0.042 0.092 0.429
HBU 0.526 0.078 0.050 0.346
NHB 0.179 0.321 0.179 0.321
COM 0.213 0.287 0.213 0.287
MTK 0.200 0.300 0.200 0.300
HTK 0.216 0.284 0.216 0.284Source: SDG 2045 LRTP Model update
Table 4.20: Off-peak to MD and NT Factors:
Trip Purpose MD NT
P-to-A A-to-P P-to-A A-to-P
HBW – Low Income 0.128 0.435 0.12 0.317
HBW – Medium Income 0.128 0.435 0.12 0.317
HBW – High Income 0.128 0.435 0.12 0.317
HBO 0.252 0.214 0.267 0.267
HBR 0.316 0.193 0.262 0.229
HBS 0.333 0.233 0.333 0.101
HBU 0.169 0.238 0.366 0.227
NHB 0.348 0.152 0.348 0.152
COM 0.367 0.133 0.367 0.133
MTK 0.280 0.220 0.280 0.220
HTK 0.290 0.210 0.290 0.210Source: SDG 2045 LRTP Model update
During the model calibration, the time-of-day factors based upon the traffic counts were adjusted. Figure 4.17 and Figure 4.18 compare the demand distribution by time-of-day between 2010 and 2016 for auto and trucks respectively. For auto trips, the 2016 model has significantly higher demand in the overnight period (NT) than the 2010 model. It seems reasonable since this period starts from 6pm when a lot of activities are still on-going.

CHAPTER 4 PLANNING PROCESS, PUBLIC INVOLVEMENT, AND NEEDS ASSESSMENT FOR THE 2045 PLAN
Final Report December 2018 | 194
Figure 4.17: Comparison of Time-of-Day Demand Distribution (2016 vs. 2010) - Auto Trips
Source: SDG analysis of auto trip shares by time period
Figure 4.18: Comparison of Time-of-Day Demand Distribution (2016 vs. 2010) - Truck Trips
Source: SDG analysis of auto trip shares by time period
Mode Choice and Transit Assignment
In this section the update to the mode choice and transit assignment is presented. Following this introduction, the section continues with a brief review of the mode choice framework established for 2040 LRTP, including a summary of the level of validation reported for the 2040 RP LRTP Model development. Improvements and updates undertaken for the 2045 LRTP are presented, followed by the calibration and validation of these improvements. The Appendix F includes a final part for this section presenting a range of sensitivity tests to show how responsive the model is to changes in input assumptions.
0%5%
10%15%20%25%30%35%40%45%
AM MD PM NT
Shar
es
Time Period
2010 Share 2016 Share
0%5%
10%15%20%25%30%35%40%45%
AM MD PM NT
Shar
es
Time Period
2010 Share 2016 Share

CHAPTER 4 PLANNING PROCESS, PUBLIC INVOLVEMENT, AND NEEDS ASSESSMENT FOR THE 2045 PLAN
Final Report December 2018 | 195
The 2040 LRTP model includes a complicated three-tiered nested multinomial mode choice model. The structure of the model, which is used for each of the eight trip purposes, is shown in Figure 2.1.
Note, however, that no data collection was undertaken for the estimation of the model with all parameters instead based on US benchmark values extracted from various Transportation Research Board (TRB) publications.
All-purpose target mode shares for each of the 10 modes were estimated from the household travel survey data which was collected as part of the 2040 LRTP Model, infilled with observed transit ridership and on-board survey data. Constants were applied to the final outputs of the mode share model in order to align the mode share forecasts with 2040 LRTP’ target.
The mode share of the 2040 LRTP Model shows a reasonably match to the HTS data which is to be expected as it was used to derive the target mode shares. The model is better at capturing the mode choice decision in the San Juan Region compared to the performance across the rest of Puerto Rico. No details have been provided by 2040 LRTP regarding the reasonableness of the model in “forecasting mode” or if there are any possible weaknesses which need to be accounted for in the future years.
Developments for the 2045 LRTP
As a result of Hurricane María, no data collection proposed as part of the original project scope would be available for the model updates. In particular, the household travel survey data would not be completed and analyzed in time to update the relevant model inputs. As such, model development was relatively limited in scope. The main tasks are summarized as follows.
• Updated inputs where new data is available;• Updated hierarchy of PT modes within the transit assignment;• Mode choice modelling of the peak and off-peak periods for each trip purpose; and• Revalidation for Base Year 2016.
Each of these tasks is discussed further in Appendix F.
Mode Choice
The target mode share for Auto, Transit, and Nonmotorized modes was estimated using the combined dataset, as shown in Table 4.21.
Table 4.21: Target Mode Share Evolution.
Scenario HTS only With On Board Transit Survey And Journey to Work
Auto 90.2% 91.3% 91.4%
Transit 4.2% 3.0% 2.8%
Non-Motorized 5.6% 5.7% 5.8%
Source: SDG combined data set
Given the nature of the data, only limited information was available regarding mode choice at lower levels of the nested structure. In Figure 4.19 the mode choice model results are compared to the observed data at an Island wide level for both the peak and off-peak periods.

CHAPTER 4 PLANNING PROCESS, PUBLIC INVOLVEMENT, AND NEEDS ASSESSMENT FOR THE 2045 PLAN
Final Report December 2018 | 196
Figure 4.19: Mode Choice Validation – Island-wide by Time of Day
Source: 2045 P LRTP Model
Several data sources were combined to create a multimodal, island-wide ‘observed’ dataset for model calibration. The 2012-2016 American Community Survey Journey to Work data, the 2040LRTP 2010 Household Travel Survey, and On Board Transit Survey were adjusted and compiled to form a representative set of trip matrices by TMA, split by journey purpose and mode of travel.
From Figure 4.20 it is observed that during both the peak and off-peak periods the mode share for auto is slightly high at the expense of non-motorized trips. Transit trips show a good match to observed data. The overallocation of auto trips is not considered to be a concern for the following reasons:
• Given that auto demand makes up over 90% of the observed travel demand, it is prudentto focus on this market segment. Indeed, a good match for auto trips is shown;
• The combined dataset represents one point of reference for travel demand. This datasetis made up of relatively subjective and sparse data when compared to other sources suchas toll road transactions and other highway count data. The latter two data sources formthe basis of the highway validation and insight from this stage of work indicated that thehighway demand coming out of the mode choice was too low. Thus, there is a tradeoff tobe made between the various data sources. For this reason, the mode choice was revisedto increase the auto mode share to improve the highway validation at the expense of themode choice validation; and
• The forecasting for the 2045 LRTP is focused on auto and transit schemes. The schemesto be tested are not expected to have a significant impact on non-motorized trips. Assuch the validation of non-motorized trips is not considered to be a priority.
The mode choice for the key trip purposes at an Island wide level is shown in Table 4.22.

CHAPTER 4 PLANNING PROCESS, PUBLIC INVOLVEMENT, AND NEEDS ASSESSMENT FOR THE 2045 PLAN
Final Report December 2018 | 197
Table 4.22: Island-wide Mode Choice Results by Purpose and by Period
Peak Off peak
Purpose Auto Transit Non-motorized Auto Transit Non-
motorized Home-based work 95.6% 1.5% 2.8% 95.8% 1.4% 2.8%
Home-based other 93.2% 3.5% 3.3% 93.2% 3.5% 3.3%
Non-home based 94.6% 0.3% 5.2% 94.6% 0.2% 5.1%
Source: 2045 LRTP model
From Table 4.22 the following findings are observed:
• Auto share is high for all trip purposes and highest for home-based work trips;• Home-based other trips are the most likely to use transit with a mode share of 3.5%, over
double that of home-based work;• Non-home based other trips are the most likely to use a non-motorized mode. This is
likely due to the short distance of most of these trips; and• As observed in other comparisons, the mode shares do not vary much between the peak
and off-peak periods.
Overall these results make sense, with users with a higher value of time favoring the faster auto mode, while the shorter distance trips are more likely to walk or cycle.
Given that transit is more widely available within San Juan Region, the mode shares are validated separately for San Juan and the Rest of Puerto Rico. These results are Figure 4.20 and Figure 4.21.
Figure 4.20: Mode Choice Validation – San Juan and Rest of Puerto Rico – Peak period
Source: SDG 2045 LRTP calibration of Mode Choice

CHAPTER 4 PLANNING PROCESS, PUBLIC INVOLVEMENT, AND NEEDS ASSESSMENT FOR THE 2045 PLAN
Final Report December 2018 | 198
Figure 4.21: Mode Choice Validation – San Juan and Rest of Puerto Rico – Off-peak period
Source: SDG 2045 LRTP calibration of Mode Choice
In general, the mode choice model is providing a good representation of the choices made between auto, transit, and nonmotorized modes. Consistent results are seen across each geography and each trip purpose with no erroneous behavior in the model.
Transit Boardings
Transit services exist across the entire Island of Puerto Rico. However, outside of San Juan these are limited to Públicos and local services (trolleys) only. The Puerto Rico multi-modal model uses a simple uncrowded transit assignment to allocate the Premium, Local, and Público transit demand onto the relevant services.
Only limited data is available regarding transit ridership in Puerto Rico. The sources available for this work are summarized below:
• AMA bus ridership extracted from April-May 2016 AMA report;• Monthly Ridership for First Transit operated services for July 2016 to June 2017 –
Metrobus, TU Conexión, Metro Urbano;• Público ridership by time period (6-9am, 9am-3pm, 3pm-6pm) collected for National
Transit Data Base. Final Report. October 2015; and• Tren Urbano boardings by station for 2010 as used in the 2040 LRTP. This was cross
checked against total boardings in 2016 Q4 American Transit Association report whichhad an identical total ridership.
Highway Path Building and Assignment
This section contains a description of the updates made in the highway network coding, the highway path building and assignment process, and summarizes the highway assignment calibration in the model base year of 2016. More detail is included in Appendix F.

CHAPTER 4 PLANNING PROCESS, PUBLIC INVOLVEMENT, AND NEEDS ASSESSMENT FOR THE 2045 PLAN
Final Report December 2018 | 199
Network Updates from 2010
• When creating the updated base year 2016 network, extensive review to examinenetwork coding accuracy and to ensure proper network connectivity was conducted. Thenetwork was compared against Google Maps imagery and a list of recently completedprojects from PRHTA. Two major roadway improvements that have been completedsince the 2010 model version were identified and coded into the 2016 highway network.Figure 4.22 and Figure 4.23 show these new roadway segments in the 2016 network: PR-66 extension from PR 188 to PR-3, partially tolled; and
• PR-22 reversible toll lane with dynamic toll varied by time period (DTL) from PR-693 toPR-167.
A detailed network comparison was shown in Appendix G.

CHAPTER 4 PLANNING PROCESS, PUBLIC INVOLVEMENT, AND NEEDS ASSESSMENT FOR THE 2045 PLAN
Final Report December 2018 | 200
Figure 4.22: PR-66 Extension from PR-188 to PR-3

CHAPTER 4 PLANNING PROCESS, PUBLIC INVOLVEMENT, AND NEEDS ASSESSMENT FOR THE 2045 PLAN
Final Report December 2018 | 201
Figure 4.23: New Dynamic Toll Lanes on PR-22

CHAPTER 4 PLANNING PROCESS, PUBLIC INVOLVEMENT, AND NEEDS ASSESSMENT FOR THE 2045 PLAN
Final Report December 2018 | 202
Speed and Capacity Estimation
Speed and capacity variables are two primary inputs of highway path building and assignment processes. During the course of the model update and calibration, the hourly lane capacities for the 2016 highway network were adjusted based upon professional judgement introducing only minor changes to previous values.
The uncongested speeds were updated using the average speeds in the night period from 2017 National Performance Management Research Data Set (NPMRDS) travel time data84. Note that these speeds represent theoretical upper limits before taking the road topographic features into account. Based upon the terrain classification, the following reductions to the uncongested speeds were applied:
• Level: 0%;• Rolling: 5%; and• Mountain: 30%.
The estimates of congested speeds were used as inputs to the very first iteration of the highway path building process. To create a pseudo congested condition (a so-called warm-up condition), the input speeds were assumed to be approximately 20 percent lower than the uncongested speeds during peak periods, and 10 percent lower than the uncongested speeds during off-peak periods.
The hourly lane capacities were defined by facility type and by area type. These initial hourly capacities per lane were adjusted to consider geometric constraints or other impedances along the link, such as number of lanes, and the condition of the approaching intersection or ramp configuration.
Toll Variables
The LRTP model network incorporates all toll facilities. Most of the toll roads in Puerto Rico have fixed toll rates throughout the day. The locations rates of toll plazas coded in the network were updated to 2016 conditions.
In April 2013, a new dynamic toll lane was opened between the Buchanan and Toa Baja toll stations on PR-22. The DTL comprises two reversible lanes located in the PR-22 median, which are opened for eastbound travel in AM peak, and for westbound travel in PM peak. During midday and night periods, the DTL is closed for a few hours to facilitate the switch of travel directions. The toll rates on the DTL are determined by traffic volumes, ranging from $0.50 to $6.00 per trip. To simulate the change of direction in DTL during the day, reductions of lane capacities in the off-peak periods were assumed to replicate the partial lane closure. To model the various toll rates on DTL, new link variables to the 2016 highway network were introduced to contain the average toll rates of passenger cars during each period.
84 NPMRDS travel time data are in February, March, and April of 2017.

CHAPTER 4 PLANNING PROCESS, PUBLIC INVOLVEMENT, AND NEEDS ASSESSMENT FOR THE 2045 PLAN
Final Report December 2018 | 203
Highway Path Building
The highway path building process provides necessary travel time, distance, and cost estimates for several model components, such as trip distribution and mode choice. This process was performed for both peak and off-peak periods, based upon the minimum generalized cost between each zonal pair.
𝑃𝑃𝑃𝑃𝑃𝑃𝑃𝑃 𝐺𝐺𝐶𝐶 = 𝑐𝑐𝑃𝑃𝑃𝑃𝑊𝑊𝑝𝑝𝑊𝑊𝑃𝑃𝑝𝑝𝐴𝐴 𝑃𝑃𝑃𝑃𝐸𝐸𝑝𝑝 × 𝐴𝐴𝑉𝑉𝐴𝐴𝑇𝑇 + 𝐴𝐴𝑃𝑃𝑊𝑊𝑃𝑃𝑃𝑃𝑃𝑃𝑐𝑐𝑝𝑝 × 𝐴𝐴𝑉𝑉𝐴𝐴𝐶𝐶 +auto toll
𝑃𝑃𝑡𝑡𝑃𝑃𝑐𝑐𝑡𝑡 𝐺𝐺𝐶𝐶 = 𝑐𝑐𝑃𝑃𝑃𝑃𝑊𝑊𝑝𝑝𝑊𝑊𝑃𝑃𝑝𝑝𝐴𝐴 𝑃𝑃𝑃𝑃𝐸𝐸𝑝𝑝 × 𝑇𝑇𝑉𝑉𝐴𝐴𝑇𝑇 + 𝐴𝐴𝑃𝑃𝑊𝑊𝑃𝑃𝑃𝑃𝑃𝑃𝑐𝑐𝑝𝑝 × 𝑇𝑇𝑉𝑉𝐴𝐴𝐶𝐶 +truck toll
Where:
𝑃𝑃𝑃𝑃𝑃𝑃𝑃𝑃 𝐺𝐺𝐶𝐶: generalized cost of a passenger car ($)
𝑃𝑃𝑡𝑡𝑃𝑃𝑐𝑐𝑡𝑡 𝐺𝐺𝐶𝐶: generalized cost of a truck ($)
𝐴𝐴𝑉𝑉𝐴𝐴𝑇𝑇: auto value of time ($/hour)
𝐴𝐴𝑉𝑉𝐴𝐴𝐶𝐶: auto vehicle operating cost ($/mile)
𝑇𝑇𝑉𝑉𝐴𝐴𝑇𝑇: truck value of time ($/hour)
• 𝑇𝑇𝑉𝑉𝐴𝐴𝐶𝐶: truck vehicle operating cost ($/mile).
The intrazonal time and distance were estimated in the final step of the highway path building process, using half of the sum of time from the two closest nonzero zones.
Highway Assignment
The 2045 LRTP model incorporates a multiclass assignment combining the passenger trip tables with truck trip tables. For use in the highway assignment, vehicles were converted into Passenger Car Equivalents (PCEs85), using the factors described in Table 4.23, commonly used in transportation modeling:
Table 4.23: Passenger Car Equivalents (PCEs) used in PR LRTP Model
Vehicle Class PCE
Auto (SOV, HOV2, HOV3+) 1.0
Commercial Vehicle 1.0
Medium truck 1.5
Heavy truck 2.0
Source: PR LRTP Model
85 PCEs are used in transportation modeling to reflect the greater amount of highway capacity utilized by trucks.

CHAPTER 4 PLANNING PROCESS, PUBLIC INVOLVEMENT, AND NEEDS ASSESSMENT FOR THE 2045 PLAN
Final Report December 2018 | 204
Travel times are estimated based on the volume-delay relationship, which is implemented through the volume-to-capacity (V/C) ratio on each link of the network. The 2045 LRTP model uses the traditional Bureau of Public Road (BPR) formula.
Calibration
The following section describes how the 2016 Base Year model’s highway trip assignment has been validated to observed conditions.
Observed Data
Due to consequences of Hurricane Irma and Hurricane María, it was not possible to collect traffic counts on the roads in fall 2017 as originally proposed. The best available vehicle classification counts were gathered from various data sources. The observed data used for model calibration contained the following sets:
• 2015 – 2017 vehicle classification counts from various months;• One month of transaction data by vehicle class in September of 2015 and 2016; and• NPMRDS travel time data in February, March, and April of 2017.
Figure 4.25 depicts the distribution of traffic counts. Among 368 one-way count locations on the entire Island, more than 55% of counts were on freeways and expressways. Approximately 15% were on principal arterials and only about 26% were on minor arterials or local roads. These counts are not evenly distributed by road type.
Figure 4.25 highlights corridors on which travel time data was obtained from NPMRDS. Similarly, to traffic count data, most of the travel times were collected on freeways and expressways. On some road segments, the average travel speed during the night period is slower than peak periods. Therefore, travel time was not used as a primary calibration target.
Existing Traffic Counts and Travel Time Databases
This chapter provides an overview of the data collection databases on main roads in the Puerto Rico road network. Specifically, describing traffic counts and travel times collection efforts, which were essential inputs in the model development and calibration process.
Taking into consideration the recent events in Puerto Rico (i.e. Hurricanes Irma and María) and understanding that traffic patterns were not representative of pre-hurricane travel patterns; these historical datasets are the best source of information for this study. This chapter aims to describe the available traffic count and travel time data.
Traffic Counts
The traffic counts were performed by the PRHTA traffic data collection office thru their internal and subcontracted data collection resources. There were 133 counts locations identified in the San Juan TMA. The locations of each counts are presented in Figure 4.24.
Travel Times
The available travel time information was obtained from the National Performance Management Research Data Set (NPMRDS), through their analytics webpage. NPRMDS provides vehicle probe-

CHAPTER 4 PLANNING PROCESS, PUBLIC INVOLVEMENT, AND NEEDS ASSESSMENT FOR THE 2045 PLAN
Final Report December 2018 | 205
based travel time data for passenger autos and trucks. The real-time probe data is collected from a variety of sources including mobile devices, connected autos, portable navigation devices, commercial fleet and sensors. NPMRDS includes historical average travel times in 5 minutes increments on daily basis covering the National Highway System (NHS). The data is provided in two parts. The first part is a Traffic Message Channel (TMC) static file that contains TMC information. The second part includes travel times and identifies roadways geo-referenced to TMC location codes. The two datasets need to be joined in Global Information System (GIS)-based software to provide the full picture.
A total of 32 corridors are identified in the platform, as shown in Figure 4.25. Data was collected for pre-hurricane conditions for the months of February, March and April of 2017, for a period of 24 hours for 15-minute intervals.

CHAPTER 4 PLANNING PROCESS, PUBLIC INVOLVEMENT, AND NEEDS ASSESSMENT FOR THE 2045 PLAN
Final Report December 2018 | 206
Figure 4.24: San Juan TMA Counts Locations

CHAPTER 4 PLANNING PROCESS, PUBLIC INVOLVEMENT, AND NEEDS ASSESSMENT FOR THE 2045 PLAN
Final Report December 2018 | 207
Figure 4.25: TMC’s Location

CHAPTER 4 PLANNING PROCESS, PUBLIC INVOLVEMENT, AND NEEDS ASSESSMENT FOR THE 2045 PLAN
Final Report December 2018 | 208
Calibration Results
The calibration of highway assignment focused on the standard comparison of the modeled volumes to the observed counts by using various classifications and statistical measures of fit such as Percent Error (%Error) and Percent Root Mean Squared Errors (%RMSE) by volume group. Both %Error and %RMSE are commonly used to determine how closely estimated volumes replicate observed count data.
The overview highway assignment statistics were summarized Appendix F to depict different aspects and levels of comparison, including:
• Volumes vs. counts by facility types;• Volumes vs. counts by sub-Regions;• Volumes vs. counts by area types;• Volumes vs. counts on screen lines latter described; and• Truck volumes vs counts by facility types.

CHAPTER 5 FINANCE
Final Report December 2018 | 209
This chapter is divided into 5 sections:
1. Context;2. Prioritization Strategy;3. Financial Support for Disaster Recovery;4. Sources of Funds; and5. Capital Cost Estimates.
CONTEXT The impact of Hurricane María on Puerto Rico was devastating and it seriously damaged much of the Island’s critical transportation infrastructure. For the immediate future, the primary HTA and DTPW’s focus must be on disaster recovery and repair. However, this is also the time to be planning and investing in mitigation measures, in order to be prepared for any future catastrophic natural events and ensure greater resilience of the Commonwealth’s key infrastructure.
The critical nature of the local economic situation requires economic/financial analysis to help define the available budget and minimum spending obligations, prior to defining the alternatives to be modeled.
A strategic review of funding and financing options has been prepared to provide a prudent and realistic assessment of potential financial resources likely to be accessible to PRHTA over the coming years. The financial team have identified and reviewed the availability and eligibility of various capital grants and loan programs available for transportation infrastructure and transit initiatives, including both apportionment and discretionary/competitive funds.
The PRHTA and the DTPW jointly prepare a STIP, which sets out the proposed distribution by project of federal funds assigned to Puerto Rico, covering highways and transportation related funding from the FHWA, and transit related funding from the FTA.
PRHTA’s also produces a 5-year Capital Improvement Program (CIP) which is the basis for preparation of TIP for FHWA federal aid-projects. PRHTA has evaluated the condition of its highways assets, allowing it to identify and prioritize major needs given the limitations on resources, and the associated construction costs. The CIP is subject to approval by the PROMESA Oversight and Management Board.
5 CHAPTER 5 FINANCE

CHAPTER 5 FINANCE
Final Report December 2018 | 210
The CIP estimates the steady state costs for FY22+ amounting to $261.8M per annum, including $130M for pavement, $86M for bridges and $33M for safety. These CIP figures exclude soft costs (in the range 10-18.5% of capital expenditure (capex). There is a separate budget for transit CIP projects. The level of projected costs implies a more than doubling of expenditure on pavement and five-fold increase in the amount allocated for bridges compared with recent STIPs86.
For operational expenditure and construction in progress, PRHTA relies on funds from toll revenues, transit revenues, federal funds from the FHWA and FTA, and a transfer from the central Government of Puerto Rico (part of which is earmarked).
PRIORITIZATION STRATEGY The high-level prioritization of projects, as shown in Figure 5.1, follows the PRHTA objectives set out in the Fiscal Plan87 (page 21), to address immediate needs and backlog, and is further informed by stakeholder consultation.
Figure 5.1: Overview of capex prioritization
Source: SDG analysis
The initial focus is on emergency repairs, developing resilient infrastructure to modern standards, and meeting FHWA targets for condition of interstate and NHS pavements and bridges. Many federal programs require some degree of local match. This could be provided by drawing on toll
86 Source: PRHTA Initial Transportation Asset Management Plan; April 2018; PRHTA.
87 PRHTA Revised Financial Plan 2018-2023; As certified by the Financial Oversight and Management Board for PR; Revised HTS Fiscal Plan; June 29, 2018.

CHAPTER 5 FINANCE
Draft Report December 2018 | 211
revenue credits, although there will also be a need for actual funding in order to achieve key targets for state of good repair.
In view of the lack of access to bond markets (due to default on existing bond issues), combined with the government’s clawback arrangements for tax streams previously dedicated to transportation, there is no alternative source of funds to provide the local contribution other than specific government transfers.
Demand for construction and project management resources are likely to drive up costs in short term. This is already being reflected in levels of construction cost inflation, which will inevitably reduce the amount of work possible within a fixed, finite budget. Timescales for project start dates may therefore be extended.
A number of possible P3 (Public-Private Partnership) projects have been identified, but their scope for covering financing charges and cost recovery through user fees is limited, which implies a requirement either an upfront capital contribution from the Government or commitment to on-going availability payments. The former is likely to be a more attractive option for investors but would depend on the ability of PRHTA to secure a project specific, discretionary federal loan, which will require time to process and with an uncertain degree of success.
FINANCIAL SUPPORT FOR DISASTER RECOVERY The Central Office of Recovery, Reconstruction and Resiliency was created to coordinate all sources of federal funding approved for Hurricane María recovery. It estimates that the reconstruction process will take around 10 years.
Preliminary damage assessment for highways totals $652M, of which $642M is expected to be covered by federal funds. There are further costs of $114M for damage to non-highway and transit assets, of which $108M are expected to be covered by a combination of federal funds and insurance claims. It should be noted that the funding allocation is based on a preliminary damage assessment, which may need to be updated. In addition, the costs of repairs could increase, given inflationary trends, and timescales be extended.
Nationally available funding sources are set out in Table 5.1.

CHAPTER 5 FINANCE
Final Report December 2018 | 212
Table 5.1: Sources of funding for disaster recovery
Approved/ obligated funds $M
Local match required Notes Allocation to highways
and local transportation Potential
contribution $M
FEMA Public Assistance grants 2,432 25% May use HUD CDBG-DR88 funds as match
Contribution to non-Federal aid road infrastructure
59.5 (authorized) -220* (implied)
FHWA Emergency Relief Assistance 142.5 0%
100% Federal funding authorized by Bipartisan Budget Act of 2018
100% 142.5
FTA Emergency Relief 198 10% Authorized to use Toll Credits as match 100% 198
FTA Resilience 26 20% Authorized to use Toll Credits as match 100% 26
HUD CDBG-DR 18,438 n/a Estimated allocation to infrastructure repairs
0.3% 55
Treasury Disaster Relief Loan 2,065 Unknown
Total 23,231
* Value implied by local match assumed from HUD CDBG-DRSource: SDG analysis
88 U.S. Department of Housing and Urban Development's (HUD's) Community Development Block Grant for Disaster Recovery (CDBG-DR).

CHAPTER 5 FINANCE
Final Report December 2018 | 213
FEMA Public Assistance Grants
Public Assistance (PA) grants typically represent the largest disbursement of federal funds for short- and long-term disaster recovery. They are the primary form of assistance offered by FEMA (Federal Emergency Management Agency) for the repair, replacement, or restoration of public infrastructure.
FEMA obligates funds for PA projects based on detailed cost estimates derived from damage assessments. FEMA’s PA program has (up to July 16, 2018) obligated $2.6 billion in total funding departments and municipalities for debris removal and emergency protective measures related to Hurricane María.
Usually FEMA provides 75% of estimated costs, with the remaining 25% from local sources, although the local contribution may be covered by funds from other federal grant programs, including the U.S. Department of Housing and Urban Development's (HUD's) Community Development Block Grant for Disaster Recovery (CDBG-DR).
Public Assistance funds are intended to be applied to restore facilities to their pre-disaster state and function, and only allow for upgrades where necessary to meet applicable codes and standards.
Hazard mitigation add-on funding (designated as PA 406 program funds) may be sought for improvements designed to make the facilities more resilient and better able to withstand equivalent hazardous events, subject to a cost-benefit analysis to demonstrate cost effectiveness.
FHWA Emergency Relief Assistance
FHWA provides emergency relief (ER) assistance for repair of roads and bridges on federal-aid highways. These funds can be used for improvements that increase resilience of the infrastructure, if the additional costs can be justified based on the potential/expected future damage arising from a similar disaster.
ER funds are normally made available at the normal pro-rata share for federally funded assets: 90% for interstate highways and 80% for other highways the requirement for a local share has been waived in this instance under the terms of the Bipartisan Budget Act of 2018, which authorizes 100% Federal share for projects in construction within 2 years of the Hurricane. This covers both emergency and permanent repairs.
A total of $142.5M has so far been allocated to Puerto Rico in respect of damage caused by Hurricanes Irma ($2.5M) and María ($40M on September 27, 2017, followed by another $30M on November 16, 2017, and $70M in April 2018) as ER13 and quick release funds. “Quick release” funds are applied to restoring essential traffic and repairs to bridges, guardrails, traffic signal systems and to address mudslide and flooding damage. An additional $130M has been requested.
In addition, in response to a request from PR DTOP, FHWA received $59.5 million in reimbursable authority from FEMA to assist DTOP in completing emergency repairs to road infrastructure not eligible for Federal aid. FTA Emergency Relief Program (Statute 49 USC, s 5324).
CHAPTER 5 FINANCE
Final Report December 2018 | 214
The FTA’s program provides grant funding for capital projects to repair, reconstruct or replace transit equipment and facilities which have suffered serious damage as a result of an emergency, or to protect the same if they are in danger of serious damage. Allocation of Emergency Relief is based upon review and validation of preliminary damage assessment.
The federal share is 90% of permanent or emergency repairs incurred more than 270 days after the disaster declaration date. The funds can also be applied to 100% of transit operating costs of evacuation services and temporary emergency service in the area affected by the emergency.
Funding for resilience – including flood protection, covered storage or power line protection – is available with an 80% federal share. These projects can include elements to bring facilities up to a state of good repair.
Costs already reimbursed by FEMA (or other federal agency) are not eligible, and any FEMA PA Grants approved or in progress which relate to transit costs will be transferred to the FTA Emergency Relief Program.
In response to Hurricane María, FTA allocated to Puerto Rico:
• $197.8M for emergency relief; and• $25.7M for resilience, subject to approval of the program of projects.
Repair costs incurred within 1 year of the disaster do not need to be included in the TIP/STIP, but resilience projects must be.
HUD Community Development Block Grant for Disaster Recovery
HUD awarded a total of $18.44 Billion (B) to Puerto Rico in April 2018 under the CDBG-DR for the purposes of addressing unmet housing needs, economic development, and infrastructure repair (including bridges and roads). Of the total, $10.2B was allocated for meeting remaining 2017 unmet needs, and $8.3B is for mitigation activities designed to limit future damage. A key priority is the resilience of the electrical power supply system which is nominally apportioned $2B within the total.
The CDBG-DR allocation should be read in the context of the Government’s preliminary damage estimate of $31.5B (Nov 27, 2017), and its request for $94.4B to rebuild the Island’s infrastructure with adequate resilience to cope with future natural disasters¹.
CDBG-DR funds can be applied only to address needs created as a direct result of a disaster, not for general improvements. 80% of these recovery funds must also be spent in the "most impacted" areas.
PRHTA’s Fiscal Plan for 2018-2023 (published April 20, 2018) indicates that it intends to target a 0.3% share of these funds, with potential to generate over $50M over 6 years (at a run rate of up to $15M). Given the importance of road infrastructure and public transportation to economic development and access to employment, it is arguable that the potential claim on available funding could be higher. However, it must be recognized the range of competing demands and the modest scale of funding available relative to the assessed needs.

CHAPTER 5 FINANCE
Final Report December 2018 | 215
As a prudent assumption, it is assumed that CDBG-DR funds will, as a minimum, be made available to provide local match for FEMA PA grants related to transportation89.
Liquidity Funds: Treasury Disaster Loans
The U.S. Treasury initially made available $4.9B in disaster loans, although this was subsequently cut back to $2.06B. Terms have been under negotiation since October 2017 and the proposed conditions prevent access to the facility until the PR Government’s cash balance falls below $1.1B.
The Treasury has indicated that it expects the loan to be paid ahead of other creditors, with reporting, collateral and security requirements made explicit. Although historically 90-95% of such debt has ultimately been forgiven, there is no guarantee that this precedent will be followed in the case of Puerto Rico.
For the purposes of this review it is assumed that these funds will not be applied to transportation projects.
Disaster Recovery and Emergency Relief
Access to disaster recovery and emergency relief funding requires satisfying strict conditions and making appropriately evidence-based applications. Although the majority of the expenditure on disaster recovery is expected to be covered by a combination of federal funds or insurance, there will be a requirement for some local funding. The gap may be closed by drawing on other Federal allocations but this would effectively imply reduction in funds notionally allocated to capital improvements and addressing the maintenance/renewal backlog.
For the purposes of preparing the 2045 LRTP Financial Plan the disaster recovery components of funding and expenditure over the next 4 years have been treated as ring-fenced. This approach is intended to provide greater clarity around the long-term capital expenditure required to achieve and sustain minimum asset condition thresholds, address the backlog of renewals and fund a prioritized program of enhancements, given the potential availability of funds. See Table 5.2.
89 Source: 1. www.aafaf.pr.gov/assets/newfiscalplanforpuerto-rico-2018-04-05.pdf.
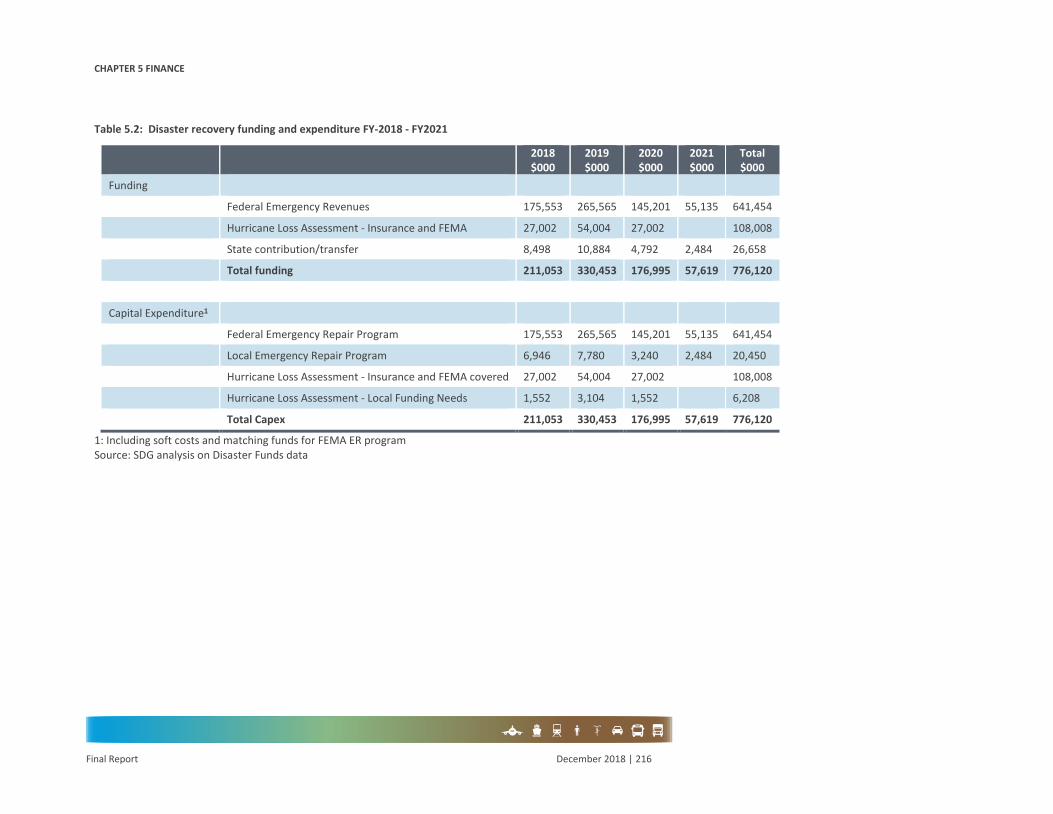
CHAPTER 5 FINANCE
Final Report December 2018 | 216
Table 5.2: Disaster recovery funding and expenditure FY-2018 - FY2021
2018 $000
2019 $000
2020 $000
2021 $000
Total $000
Funding
Federal Emergency Revenues 175,553 265,565 145,201 55,135 641,454
Hurricane Loss Assessment - Insurance and FEMA 27,002 54,004 27,002 108,008
State contribution/transfer 8,498 10,884 4,792 2,484 26,658
Total funding 211,053 330,453 176,995 57,619 776,120
Capital Expenditure1
Federal Emergency Repair Program 175,553 265,565 145,201 55,135 641,454
Local Emergency Repair Program 6,946 7,780 3,240 2,484 20,450
Hurricane Loss Assessment - Insurance and FEMA covered 27,002 54,004 27,002 108,008
Hurricane Loss Assessment - Local Funding Needs 1,552 3,104 1,552 6,208
Total Capex 211,053 330,453 176,995 57,619 776,120
1: Including soft costs and matching funds for FEMA ER program Source: SDG analysis on Disaster Funds data
CHAPTER 5 FINANCE
Final Report December 2018 | 217
SOURCES OF FUNDS Figure 5.2 sets out the outlook for long range funding of operations and capital expenditure.
There are several sources of funds available to the PRHTA:
• Federal Funds;• State Funds;• Local Taxes;• Tolls and farebox income; and• P3 project Investment
The formal documents that define the shorter-term investment regarding the PRHTA available funds are:
• The Capital Improvement Plan (CIP);• The Statewide Transportation Improvement Program (STIP); and• The TAMP.
Federal Funds
FHWA Fixing American Surface Transportation Act (FAST-Act)
As mentioned in Chapter 3; the FAST-Act establishes and funds new programs to support critical transportation projects to ease congestion and facilitate the movement of freight on the Interstate System and other major roads. It requires improvements to the resilience and reliability of the transportation system, storm water mitigation, and enhancements to travel and tourism.
The FAST-Act provides apportioned funding to states/territories for federal-aid highway programs over a 5-year period (at the time FY-2016 through FY-2020). The Highway Trust Fund is the source of funding for most of the programs in the act. However, the FAST-Act also transfers additional funds to the Highways Trust Fund to keep it solvent.
Although Puerto Rico is included in the definition of “state” for most purposes under title 23, it is not eligible to receive funds apportioned among states. Specific authorization for the Puerto Rico Highway Program (PRHP) is provided, with an allocation of $158M annually for fiscal years 2016 through 2020. Penalties are imposed because of the lower minimum drinking age and minimum penalties for repeat offenders due to driving while intoxicated, reducing the available funds to $138.8MM. Section 1115 of the FAST-Act amends the PRHP under 23 U.S.C. 165, which sets out program requirements.
The lump sum payments for each year cover all the apportioned highway programs combined, including pre-defined allocations to:
• National Highway Performance Program (NHPP) [under 23 U.S.C. 119] 50%;• Highway Safety Improvement Program (HSIP) [under 23 U.S.C. 148] 25%;• Puerto Rico Highway 25%
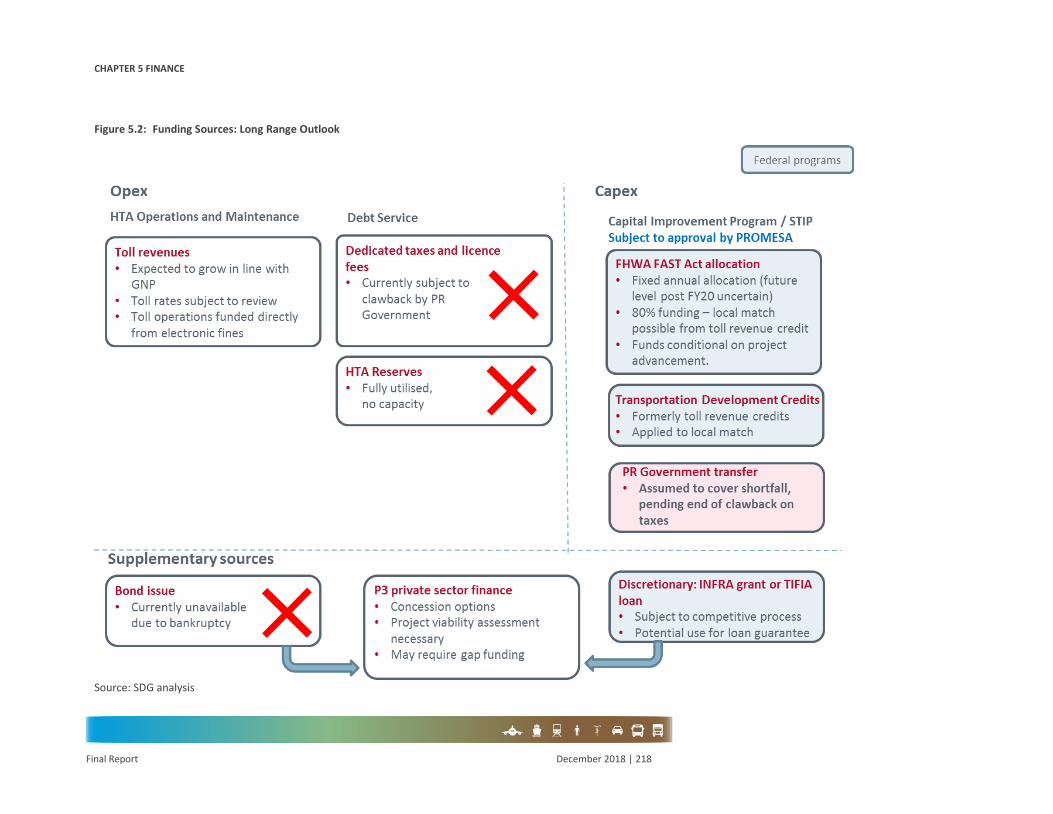
CHAPTER 5 FINANCE
Final Report December 2018 | 218
Figure 5.2: Funding Sources: Long Range Outlook
Source: SDG analysis

CHAPTER 5 FINANCE
Final Report December 2018 | 219
The Federal share of funding for projects is governed by 23 U.S.C. 120. Although generally limited to 80 percent, it can be up to 100 percent in the case of traffic control signalization, pavement marking, commuter carpooling and vanpooling, installation of traffic signs, traffic lights, guardrails, impact attenuators, concrete barrier end treatments, breakaway utility poles, or priority control systems.
Funds are available for obligation for a period of 3 years after the last day of the fiscal year for which the funds are authorized. Any authorized funds that exceed the amount of obligation will be deducted for re-distributed to the States for Surface Transportation Block Grant Program funded projects90.
A condition of funding is that the grantee demonstrates specific and well defined technical, financial and organizational capabilities. Historically, more than $400MM in available funding was not deployed due to delayed processes for project advancement, project completion and provider payments. PRTHA and FHWA signed a Memorandum of Understanding (MoU) in February 2016 with the objective of implementing enhancements to PRTHA’s Project and Program Delivery capabilities.
The default by PRHTA in terms of bond debt obligations could potentially raise questions as to its financial capacity and could put federal funding at risk if the debt restructuring process should breakdown91.
FHWA Allocation - Asset Management and 10-year Financial Plan
Federal grant funding typically falls into two categories: apportioned and allocated, depending on the manner in which the funds are distributed. The federal aid provided to Puerto Rico is not determined by the standard formula apportionment (which applies to states), but instead by a fixed term allocation.
The FHWA requires a (minimum) 10-year financial plan to be developed which sets out how the authority expects to fund future work and investment as set out in the asset management plan. The plan is to be based on funding levels that can be expected to be “reasonably available” by year, with the planning process required to address the anticipated sources of funding.
The FHWA acknowledges that future funding amounts may be uncertain, and in these circumstances, allows the financial plan to use estimates based on historical values. In the case of apportionment, the potential variance is reasonably limited, with the base allocation to each state typically reflecting their respective share of prior year funding92. With a fixed allocation (rather than a formula-based apportionment) it is extremely difficult to predict the future level of funding
90 Sources: www.fhwa.dot.gov/fastact/summary.cfm.
www.fhwa.dot.gov/specialfunding/prhp/160224.pdf.
www.aafaf.pr.gov/assets/fiscal-plan---pr-highway-and-transportation-authority.pdf. 91 Source: www.aafaf.pr.gov/assets/fiscal-plan---pr-highway-and-transportation-authority.pdf. 92 Initial Transportation Asset Management Plan; April 2018; PRHTA.

CHAPTER 5 FINANCE
Final Report December 2018 | 220
beyond the current commitments. The fiscal plan assumes that funding for the period up to 2023 will continue at the current level of $138.8M per year net of penalties.
For the purposes of the 2045 LRTP Financial Plan, it has been assumed that the level of funding will be maintained at its current level in real spending terms. In practice this could imply an uplift of 20% to allow for the surge in construction prices post Hurricane María. Much of this could be covered simply by removing penalties. The available transportation development (toll revenue) credits would be adequate to provide the required 20% local match, allowing projects to be fully federally funded.
Discretionary Federal Loan: Transportation Infrastructure Financing and Innovation Act (TIFIA) Discretionary Federal Loan
The TIFIA loan program was established to provide federal credit assistance to eligible transportation projects. The objective is to provide access to funding for large scale transportation projects which are dependent on user (toll) revenues, but where the future revenue stream is subject to uncertainties which would make alternative financing options expensive.
The FAST-Act authorized $1.43 billion in capital over the five years 2016-20 for the program. Direct loans can be for a period of up to 35 years, with repayments starting up to 5 years after opening, to allow for ramp up. TIFIA can also provide loan guarantees for non-Federal financing. The FAST-Act also authorizes payment of subsidy cost (similar to a commercial bank’s loan reserve requirement) of supporting Federal credit.
Given that dynamic toll lanes are already in the spending program, and that other funding sources are potentially committed to achieving a state of good repair and improving resilience, this type of loans could be aimed at supporting P3 projects, although the principal amounts of credit assistance are generally limited to 33% of eligible project costs93.
Discretionary Federal Grant: INFRA Grants
The Nationally Significant Freight and Highway Projects (NSFHP) program was established by the FAST-Act to provide competitive grants, known as INFRA grants, to support regionally significant highway, bridges and freight projects that align with the program goals which include:
• improving the safety, efficiency, and reliability of the movement of freight and people;• generating national or regional economic benefits;• reducing highway congestion and bottlenecks;• improving connectivity between modes of freight transportation;• enhancing resiliency of critical highway infrastructure and help protect the environment.
An INFRA grant may not exceed 60% of the total eligible project costs, although a further 20% of project costs may be funded with other Federal assistance.
Of the $1 billion funding available in FY-2020, 90% will be allocated to projects which represent more than 30% of the Federal highway aid apportionment, and 10% for smaller projects (with a
93 Sources: www.fhwa.dot.gov/fastact/summary.cfm.

CHAPTER 5 FINANCE
Final Report December 2018 | 221
minimum value of $5 million). It is also stipulated that there should be access to additional stable and dependable source(s) of funding and financing to support the construction, maintenance and operation of the project.
PRHTA was unsuccessful in its application for INFRA grants to support several Dynamic Toll Lanes projects in FY-2017-2018. Successful applicants typically sought a smaller percentage grant contribution, but this approach would not be viable given the financial situation of Puerto Rico.
Matching contribution – Toll Transportation Development Credits (Formerly Toll Revenue Credits)
Section 120(i) of Title 23 of the United States Code permits states to substitute certain previous toll-financed investments for state matching on current Federal-aid projects. The non-federal share of a project's cost may be met through a "soft match" of toll credits. This means the federal share can effectively be increased to 100 percent of the total project cost. The credits can be applied for the construction of new infrastructure, or the maintenance or improvement of existing public highways, including those which have received federal-aid funding in the past.
It should be noted that although these credits are often referred to as a source of funding, they do not represent actual available funding. They are typically applied in order to free local funds (which would otherwise need to be committed), allowing the flexibility to fund other transportation projects (which may not themselves be eligible for federal funds), or to support operating costs.
Toll credits may be claimed only for the share of a project’s capital expenditures which are supported by toll revenues accruing to a toll authority (public agency or private entity). The allowable credit excludes revenues needed for debt service, returns to investors, or the operation and maintenance of toll facilities.
In addition, an annual maintenance of effort (MOE) test is applied, which must certify that the toll facilities are being properly maintained in the year to which the credit relates before excess revenues can be credited. The actual level of maintenance spend in relation to initial estimates is also monitored and any shortfall will result in a requirement to replace federal funds with local funds on projects where the credit was applied. Future ability to accrue additional credits will therefore depend on meeting the MOE requirements.
The amount of credit earned equals the amount of excess toll revenues spent on Title 23 highway capital improvement projects. However, if federal funds were used for the project which generates the tolls, then the available credit is reduced by the percentage of the total project cost sourced from federal funds, i.e. if 80% of the original project was federally funded, the toll credit is reduced by 80%. Once approved the credit remains available until used.
In the PRHTA Fiscal Plan 2017-2023 it was stated that there was an outstanding balance of $665M toll credits. In Q1 2016, PRHTA validated compliance with FHWA guidance. The use of these credits as matching contributions is estimated at approximately $30M per year based on the

CHAPTER 5 FINANCE
Final Report December 2018 | 222
current level of allocated funding, implying potential for these credits to be applied over the next 20 years94.
Local Taxes Dedicated to Transportation and Government Transfers
The Authority’s funding originally included a range of pledged tax and licence revenue streams. However, starting in 2016 these revenues have been subject to government clawback, being used instead to make payments on bonds of the Government Development Bank (GDB), guaranteed by the government. The clawback covers: Gasoline tax; Diesel tax; Petroleum products tax; Vehicle license fees; and Cigarette tax.
However, in Puerto Rico these allocations are not constitutionally dedicated and the funds can be re-purposed by the government, as is the case under the “clawback” arrangement now applied. At the present time there is no end date for the clawback and, as a prudent and conservative approach, it has been assumed that these funds will not be available over the term of the 2045 LRTP.
The net result of the clawback to date is that PRHTA has been unable to make interest or principal payments on bonds, or interest payments due to the former GDB. PRHTA initially continued to make bond payments using reserve funds, but they were unable to do so beginning in July 2017. The result has been PRHTA filing for bankruptcy under Title III of PROMESA.
The clawback has also resulted in an overall shortfall against approved expenditures. To address the shortfall there is expected to be transfer payments from the Commonwealth, amounting to 26% of the clawback in FY-2017-18 but averaging 30% over the term of the current Fiscal Plan and projected to rise to over 40% by FY-2022-23. The advice from DTOP is that this it should be assumed that such transfers will continue at a similar rate after the Fiscal Plan period ends95.
State Funds Earmarked for Capex
PRHTA has received a one-off appropriation of $75M for capital expenditure from the Central Government. This includes a contribution to local construction and other projects beyond the limit of federal funding. It expects to receive $475M from state funds for matching of federal funds, for maintenance related activities and to cover soft costs (although notionally earmarked for Capex) during the period of the fiscal plan. However, the profile of payments shows a fall from $160M in 2017-18 to $53M in the last two years of the plan96.
94 Sources: www.fhwa.dot.gov/fastact/summary.cfm. 95 Sources: PRHTA Initial Asset Management Plan, April 2018. 96 Sources: PRHTA Revised Financial Plan 2018-2023; As certified by the Financial Oversight and Management Board for PR; Revised HTS Fiscal Plan; June 29, 2018.

CHAPTER 5 FINANCE
Final Report December 2018 | 223
Toll Rates and Additional Tolling Opportunities
Toll revenues
The level of tolls in Puerto Rico is low in absolute terms but at upper levels in relation to incomes, in comparison to US states (Fiscal Plan 2018 p.4997).
Toll revenue estimates included in the Fiscal Plan are based on a tiered catch-up of historical CPI since the last toll raise, plus an average CPI of 1.62% to account for current year(s), over the 5 years to FY2023. Subsequent years assumed tolls would continue to be increased by CPI plus 1.5%. The revenue was expected to contribute $167M in FY2023, up from $120M in FY-2018.
However, plans to increase tolling above CPI have been abandoned, for at least the next five years, as being inconsistent with the public policy of PRHTA and the Government of Puerto Rico. Future increases are now seen as conditional on improving road conditions.
Toll Highway Administration and Maintenance
Toll highway administration and maintenance costs are estimated at around $35M per year. This was largely offset by electronic toll fines in FY-2018, but this contribution is expected to decline to $19M per year subsequently, only partly compensated by rising ancillary revenues (for example, advertising signage). This will leave a cumulative shortfall of around $41M by FY-2023.
Potential for Additional Tolling
Federal law limits the imposition of tolls on existing highways which have been built or maintained using federal funds. Tolls can be imposed for single occupant use of HOV lanes or with the objective of congestion pricing. In other circumstances, tolls can only be levied on existing roads following reconstruction (e.g. for capacity expansion or other improvements).
If the authority certifies that the facility is being adequately maintained, and generating sufficient revenue to pay for operations, the surplus can be applied to contribute to the cost of other highway activities or support public transportation operations, provided that the application would not be in violation of the authority’s bond covenants.
The fiscal plan includes a $5M contribution up to FY-2023 but opportunities may be limited unless the approach included ways to protect residents with no other access routes.
P3 Project Investment
Encouraging private sector capital investment would appear to offer a means of implementing projects whilst minimising the dependence on government funding. The Puerto Rico Government is proposing to further strengthen the P3 legal framework to facilitate critical infrastructure investments.
97 PRHTA Revised Financial Plan 2018-2023; As certified by the Financial Oversight and Management Board for PR; Revised HTS Fiscal Plan; June 29, 2018.

CHAPTER 5 FINANCE
Final Report December 2018 | 224
The P3 Authority is focused on developing critical infrastructure projects, and unsolicited private sector proposals can be submitted. The success of toll road concessions for PR-22 and PR-5 would appear to provide a successful precedent. Current priority projects in development include a concession to modernise, operate and maintain government-owned parking facilities.
New Projects
Any investor in a P3 will have expectations of a return over the duration of a concession, either from user fees or availability or service fees payable by PRHTA or the PR Government. A complicating factor is that there is considerable uncertainty associated with forecasts of future usage of any infrastructure, given the outlook for the macro-economic environment and a decline in population through continued net migration.
At the same time, PRHTA is unlikely to be able to provide cast iron assurances with regard to providing either a minimum revenue guarantee or making availability and service payments without access to additional funds. The Government is equally unlikely to be able to offer such guarantees as a backstop given other demands on its finite resources. Similarly, there may be concern about the ability of PRHTA to fund the construction or maintenance of essential related infrastructure (e.g. roads which feed or distribute traffic using the tolled facilities).
The potential return for investors could be improved by an upfront government contribution to offset capital costs. This might be recovered in the longer term by a revenue sharing mechanism. In these circumstances, it may be possible to apply for a discretionary TIFIA loan with appropriate grace period (during construction) and a 35-year repayment term, as discussed earlier. The credit contribution from a TIFIA loan is typically limited to 33% of eligible project costs which may prove a significant constraint, given the relatively low levels of revenue generated by potential highway projects identified by PRHTA.
In these circumstances, the potential to secure P3 investment is likely to be a binary option, depending on whether an application for a TIFIA loan is granted (or not). Given the time required to make an application, and for its evaluation, it is suggested that any associated projects cannot begin before FY2024.
P3 Covering Existing Assets
The option of transferring existing highway infrastructure assets with a proven history of toll revenue generation is subject to uncertainty in view of the associated direct loss of a revenue stream supporting PRHTA’s activities, and because of potential competing claims to the associated cash flow from PRHTA’s creditors. However, there would be more certainty if the proposed transactions and associated asset transfers as part of a P3 were to be included in a fiscal plan certified by the PROMESA Board.
Capital Improvement Program (CIP)
The Fiscal Plan approved and certified by the Financial Oversight and Management Board (FOMB) on June 29, 2018 covers anticipated revenues and capital and operating spending through to FY-2023. It includes completion of current projects and a projected level of transfers from the Government, in addition to state funds already earmarked for capex.

CHAPTER 5 FINANCE
Final Report December 2018 | 225
The construction program reflects the Capital Improvement Program (CIP) budget produced by PRHTA. The projected “steady state” run rate of $261.8MM in hard costs per year, which reflects the level of spending deemed necessary to keep the National Highway System (NHS) and Interstate system in a state of good repair compliant with federal standards, but only a minimal level of intervention on non-NHS roads. An average of $129.6M is allocated to pavement works, $85.5M to bridges, $33.5M to safety and $13.2M to traffic signalling (in 2018 USD).
The implied breakdown by highway classification is shown in Table 5.3.
Table 5.3: Notional Allocation of CIP Budget by Highway Classification
Highway classification Lane-kms Anticipated spend per annum $M
Equivalent spend/km $000
Toll roads 874 35 40.0
Primary roads 2225 32 14.4
Urban Primary 2052 29 14.1
Secondary 5936 61 10.3
Tertiary 8049 85 10.6
All highways 19136 242 12.6
Source: Based original CIP budget of $242MM (the validated version of CIP totals $262MM and includes a higher allocation to bridges with reduction in funds for pavements and safety).
Transportation Asset Management Plan (TAMP)
The TAMP is designed to provide a comprehensive management program to address the backlog of pavements and bridges in poor condition, bringing them up to standards which meet FHWA targets and sustaining a state of good repair.
Development of TAMP is a federally mandated requirement: failure to produce a plan would have resulted in substantial penalties, increasing the local match for use of Federal funds.
In view of the expected levels of available financing, PRHTA is only seeking to meet the minimum standards for pavements and bridges. Even before Hurricane María, the condition of interstate pavements was well below target, and bridges close to the maximum permitted level in poor condition as shown in Table 5.4.
Table 5.4: Target Standards and Actual Condition (Pre-María)
Poor condition - FHWA target
Poor condition - PRHTA target
Poor condition - actual (2016)
Interstate Pavement <5% 16.2% (19.4% lane miles)
Non-Interstate NHS Pavement <20% 7.4% measured
(+12.9% non-measured)
NHS Bridges (by deck area) <10% 9.5%
Source: PRHTA Initial Asset Management Plan, April 2018
Failure to meet the standards over 2 consecutive years for pavements (and 3 years for bridges) will lead to penalties which are likely to restrict the potential obligation of NHPP and STP funds, forcing their allocation to remedial works to bridges and pavements. The reality is that PRHTA

CHAPTER 5 FINANCE
Final Report December 2018 | 226
expects to take over 10 years to bring the interstate pavements up to standard, and is already proposing to allocate all the available federal funds in this manner, plus meeting the obligation with respect to the funding allocation to safety projects.
The backlog of highway pavement work is estimated at $185M for interstates and $342M for NHS.
A number of scenarios were considered as part of the TAMP, reflecting more or less aggressive strategies for the replacement, rehabilitation and renewal of assets, from an unconstrained budget case with a 5-year time horizon, through to less expensive, longer term options intended to allow an alternative distribution of available finance. All cases imply a higher level of spending than historic levels, and spending will peak before reverting to a level necessary to sustain steady state condition.
The TAMP did not settle on any scenario, as it needed to align with the CIP, which was not yet accepted at the TAMP date of publication (April 2018).
For bridge works TAMP Scenario 5 (Table 7.5) was applied for the purposes of the financial plan, reflecting the “preferred” scenario which spent the allocation in the fiscal plan as quickly as reasonably possible, starting with light rehabilitation and allowing time to develop more ambitious projects. Within this total, the allocation to non-NHS bridges follows TAMP Scenario 4 (Table 7.10). For pavements, the profile of spending followed the balanced scenario set out in PRHTA 2019-2028 Capital Improvement Program Validation (June 22, 2018) report.
Allocation of Funds - Highways
Illustrative Allocation of Funds: State of Good Repair (SGR)
The 2045 LRTP assumes that the first priority, post disaster recovery, will be to meet federal targets for the interstate and NHS bridges. Failure to meet the targets will, in any case, oblige all Federal funding would be directed towards these efforts. The assume spending profile is based on PRHTA’s “balanced” scenarios, which seek to apply a realistic approach to a ramp up of work. 25% of the available FHWA funds also need to be committed to safety projects. See Table 5.5.
There are sufficient toll revenue credits available as local match over the next 20 years, so the available level of federal funding should not be available in full, irrespective of the level of local contribution. However, the level of funding currently provided by FHWA is below the level of expenditure required to deliver the state of good repair (SGR) program over the next 10 years. This means there will be a continuing need for Government of Puerto Rico to transfer funds to balance the books, beyond the period covered by the present fiscal plan.
Illustrative Allocation of Funds: Highways, Bridges
Post-2028 there is expected to be a levelling off in expenditure on SGR for interstate and NHS pavements, and reduction in allocation to NHS bridges, assuming the catch-up is largely completed. However, the initial funding allocation had a minimal allocation to the non-NHS network, which also faces a substantial renewal backlog. It is envisaged that an increase of 25% in the allocation to non-NHS pavements and bridges is likely to be required, as a minimum, going forward.
CHAPTER 5 FINANCE
Final Report December 2018 | 227
In overall terms, the allocation to interstate and NHS highways and bridges is projected to continue at around $128M per year in real terms, which is above the notionally available FHWA funding of $102M (after deducting the $37M which must be allocated to safety measures). A continuing level of state contributions is therefore inevitable if SGR targets are to be met.
Any additional capex on non-SGR projects is going to depend on the ability of the government to either relax the clawback on taxes/license fees, or willingness to continue to make funds available via a transfer payment.
As an illustrative case, a prioritized list of capex projects has been developed, with estimated start dates, indicative timeline (1-5 years depending on project scope) and cost profiles to arrive at a broadly even rate of annual spend. Expenditure on safety related projects, bike and pedestrian interventions and resilience studies was excluded, as these are assumed to be covered by specific allocations from within the FHWA budget.
The net result is project spending in the immediate post Fiscal Plan period FY 2024-2028, rising from $10M in 2025 to $20M by 2028. Spending is then assumed to ramp up to an average of $25M per year through to 2045. This illustrative scenario implies transfers from Government at a broadly consistent rate of $200M per year in real terms (2018 prices) through to the end of the LRTP, which is less than half of the amount of clawback of taxes and fees. It should be noted that the affordability of priority projects is based on cost estimates at 2018 prices with 20% inflation, and makes no allowance for further cost inflation.
Source and Allocation of Capital: Highways FY-2018-2028
Table 5.6 sets out the anticipated level of funding and capital expenditure during the period of the current fiscal plan (to FY-2023) and the following 5 years, based on the TAMP balanced scenarios to achieve target state of good repair.
Source and Allocation of Capital: Highways Projections FY-2029-2045
Table 5.7 sets out the anticipated level of funding and capital expenditure in the period FY-2029 to FY-2045, assuming continued expenditure to sustain SGR on interstates and NHS, and start to address the backlog on non-NHS highways. Modest levels of funding are allocated to identified priority projects. It is recognized that there is potential for some slippage in the planned timeline for project start and completion, particularly in view of construction community capacity and resource constraints.

CHAPTER 5 FINANCE
Final Report December 2018 | 228
Table 5.5: State of Good Repair and Safety Project FY-2019-2028 – Balanced Scenario (Costs in $000)
FY 2019 2020 2021 2022 2023 2024 2025 2026 2027 2028 Interstate Pavement Asphalt SGR 14,228 6,693 6,693 66,93 6,693 6,693 30,681 30,681 30,681 30,681
Interstate Pavement Concrete SGR 16,940 16,613 3,271 44,171 44,171 44,171 44,171 44,171 27,416 27,416
NHS Pavement Asphalt SGR 53,758 53,233 51,152 51,152 51,152 51,152 28,685 28,685 28,685 28,685
NHS Pavement Concrete SGR 12,610 16,058 12,611 12,611 12,611 12,611 2,205 2,205 2,205 2,205
Non-NHS Pavement SGR 28,784 30,238 28,396 28,396 28,396 28,396 28,396 28,396 35,209 35,209
All Pavement 126,320 122,835 102,123 143,023 143,023 143,023 134,138 134,138 124,196 124,196
NHS Bridges (Scen 5-Scen 4 non-NHS) SGR 10,000 28,000 26,000 41,000 61,000 52,000 52,000 52,000 52,000 52,000
Non-NHS Bridges (TAMP Table 7.10, Scenario 4) SGR 17,000 17,000 24,000 24,000 24,000 34,000 34,000 34,000 34,000 34,000
All Bridges (TAMP Table 7.5, Scenario 5) SGR 27,000 45,000 50,000 65,000 85,000 86,000 86,000 86,000 86,000 86,000
TAMP - Interstate and NHS Pavements & Bridges SGR 107,536 120,597 99,727 155,627 175,627 166,627 157,742 157,742 140,987 140,987
TAMP - Non-Interstate Pavements & Bridges SGR 55,784 75,238 78,396 93,396 113,396 114,396 114,396 114,396 121,209 121,209
Traffic signals SGR 13,229 13,229 13,229 13,229 13,229 13,229 13,229
Safety projects 36,649 36,649 36,649 36,649 36,649 36,649 36,649
Total 163,320 195,835 178,123 298,901 338,901 330,901 322,016 322,016 312,074 312,074
Source: PRHTA 2019-2028 Capital Improvement Program Validation (June 22, 2018)

CHAPTER 5 FINANCE
Final Report December 2018 | 229
Table 5.6: Highways – Source and Application of Funds 2018-2028 (All Figures in $000 at 2018 Prices)
Fiscal Plan TAMP scenarios (balanced) FY 2018 2019 2020 2021 2022 2023 2024 2025 2026 2027 2028
Funding sources
FWHA - after penalty 132,766 401,926 313,922 168,768 138830 138,830 138,830 138,830 138,830 138,830 138,830
State Funds Earmarked for Capex 159,963 82,073 67,334 59,067 53020 53,761
Transfer from PR Govt (balancing item) 31,288 109,898 145075 144,031 203,253 194,368 203,253 203,768 206,368
Total Capex Funding - Highways 324,017 483,999 381,256 337,733 336925 336,622 345,198 344,256 342,344 323,256 323,256
Capital Expenditure
FHWA FHWA Construction Spend 95,768 340,801 255,567 140,769 120009 117,156
FHWA Construction Soft Costs 36,260 51,315 49,614 22,967 18821 21,674
FWHA Capex projects
FHWA contribution to SGR Pavements & Bridges 102,181 102,181 102,181 102,181 102,181
FHWA Safety projects (based on req funding allocation) 36,649 36,649 36,649 36,649 36,649
State Non-Federal Construction Projects 111,750 20,796 27,606 129,169 152734 152,734
Non-Federal Construction Soft Costs 14,153 6,800 6,481 22,556 24989 24,686
Construction Local 23,160 9,190 9,190 9,190 9190 9,190
State Capex projects
State contribution to Interstate and NHS SGR 64,446 64,446 55,561 55,561 38,806
State contribution to non-NHS SGR 114,396 114,396 114,396 121,209 121,209
Prioritized highways projects (excl safety) 9,400 12,000
Traffic signals SGR 13,229 13,229 13,229 13,229 13,229
Design 23,000 7,769 10,716 7,882 7882 7,882 7,882 7,882 7,882 7,882 7,882
Right of Way 3,300 3,300 3,300 3,300 3300 3,300 3,300 3,300 3,300 3,300 3,300
Right of Way Payments 16,626 12,736 7,068 1,900
Total Capital Expenditure - Highways 324,017 452,707 369,542 337,733 336925 336,622 342,083 342,598 345,198 344,256 342,344
Source: SDG analysis

CHAPTER 5 FINANCE
Final Report December 2018 | 230
Table 5.7: Highways – Source and Application of Funds 2029-2045 (All Figures in $000 at 2018 Prices)
Projections Average year 2029 2030 2031 2032 2033 2034 2035 2036 2037 2038 2039 2040-45
Funds
FWHA - after penalty 138,830 138,830 138,830 138,830 138830 138,830 138,830 138,830 138,830 138,830 138,830 138,830
State Funds Earmarked for Capex
Transfer from PR Govt allocated to Capex (balancing item) 195,962 198,557 198,208 200,448 203,686 198,870 203,284 200,237 197,416 199,167 204,597 201,798
Total Capex Funding - Highways 334,792 337,387 337,038 339,278 342,516 337,700 342,114 339,067 336,246 337,997 343,427 340,628
Capital Expenditure
FHWA FHWA Construction Spend
FHWA Construction Soft Costs
FWHA Capex projects
FHWA contribution to SGR Pavements & Bridges 102,181 102,181 102,181 102,181 102181 102,181 102,181 102,181 102,181 102,181 102,181 102,181
FHWA Safety projects (based on req funding allocation) 36,649 36,649 36,649 36,649 36649 36,649 36,649 36,649 36,649 36,649 36,649 36,649
State Non-Federal Construction Projects
Non-Federal Construction Soft Costs
Construction Local
State Capex projects
State contribution to Interstate and NHS SGR 25,806 25,806 25,806 25,806 25,806 25,806 25,806 25,806 25,806 25,806 25,806 25,806
State contribution to non-NHS SGR 125,511 125,511 125,511 125,511 125,511 125,511 125,511 125,511 125,511 125,511 125,511 125,511
Prioritized highways projects (excl safety) 20,234 22,829 22,480 24,720 27,958 23,141 27,556 24,509 21,687 23,439 28,868 26,069
Traffic signals SGR 13,229 13,229 13,229 13,229 13,229 13,229 13,229 13,229 13,229 13,229 13,229 13,229
Design 7,882 7,882 7,882 7,882 7,882 7,882 7,882 7,882 7,882 7,882 7,882 7,882
Right of Way 3,300 3,300 3,300 3,300 3,300 3,300 3,300 3,300 3,300 3,300 3,300 3,300
Right of Way Payments
Total Capital Expenditure - Highways 334,792 337,387 337,038 339,278 342,516 337,700 342,114 339,067 336,246 337,997 343,427 340,628
Source: SDG analysis

CHAPTER 5 FINANCE
Final Report December 2018 | 231
Transit Funds and Capex
Transit capital funding comes principally through the FTA 5339 allocation for bus and bus facilities. The associated capex can therefore be treated separately from highway expenditures. See Table 5.8
A series of service expansion projects are envisaged with associated investment in buses, route infrastructure and terminal facilities. The level of expenditure is presented in five-year intervals from the end of the current Fiscal Plan.
There also needs to be continued investment in renewal of the existing fleet and refurbishment of facilities.
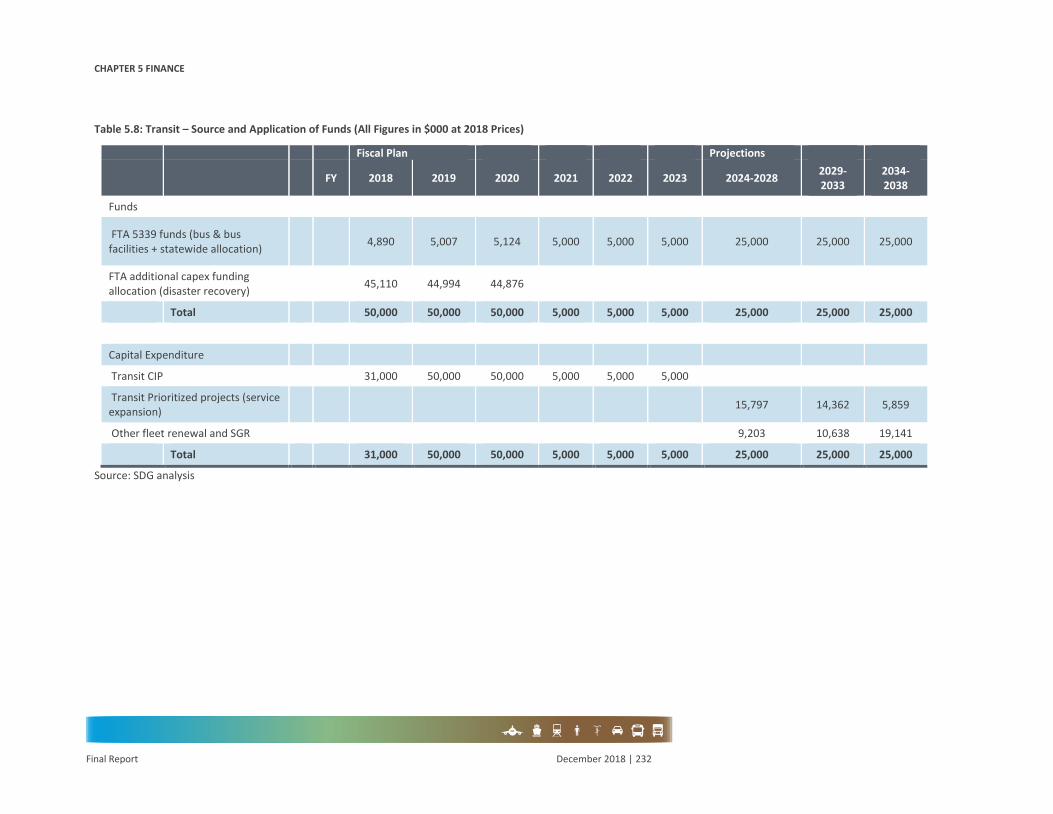
CHAPTER 5 FINANCE
Final Report December 2018 | 232
Table 5.8: Transit – Source and Application of Funds (All Figures in $000 at 2018 Prices)
Fiscal Plan Projections
FY 2018 2019 2020 2021 2022 2023 2024-2028 2029-2033
2034-2038
Funds
FTA 5339 funds (bus & bus facilities + statewide allocation) 4,890 5,007 5,124 5,000 5,000 5,000 25,000 25,000 25,000
FTA additional capex funding allocation (disaster recovery) 45,110 44,994 44,876
Total 50,000 50,000 50,000 5,000 5,000 5,000 25,000 25,000 25,000
Capital Expenditure
Transit CIP 31,000 50,000 50,000 5,000 5,000 5,000
Transit Prioritized projects (service expansion) 15,797 14,362 5,859
Other fleet renewal and SGR 9,203 10,638 19,141
Total 31,000 50,000 50,000 5,000 5,000 5,000 25,000 25,000 25,000
Source: SDG analysis

CHAPTER 5 FINANCE
Final Report December 2018 | 233
CAPITAL COST ESTIMATES Context
A list of potential projects for inclusion in the LRTP was prepared based on:
• Needs of the Municipalities to comply with their land use and transport plans;• Existing projects requiring further investments; and• Projects included in 2040 LRTP that are in the pipeline.
As explained earlier, the list of potential projects was analysed based on the priorities defined for the Goals and Objectives of this 2045 LRTP. The projects were then ranked (the methodology applied is described in Appendix H). The project identification and ranking process were discussed in detail with the Technical Committee and the leadership of the PRHTA.
Approach
Capital costs were calculated for each individual investment being considered, reflecting the key project characteristics regarding the scope and scale of the project (for example, the extent and length of highway widening).
The project phasing was based on the combination of rankings with the expected availability of funds, and the combination of anticipated construction periods and assumed spread of costs by construction year. Projects were added up to the level of funding assumed be available in each year.
Source Data
Project Details
A wide range of projects have been included in the LRTP, covering investments in the following categories:
• Operations;• Reconstruction;• Technologies;• Improvements;• Capacity Increases;• New Construction;• Congestion Management; and• Preservation.
In each case, information is provided including a description of the project, and key statistics regarding the scale and scope of the project.
Costs
Estimated costs associated with the project metrics have been developed based on:
• Estimates of capital costs associated with projects included within the PRHTA CapitalImprovement Program (CIP) database, June 2017;

CHAPTER 5 FINANCE
Final Report December 2018 | 234
• Costs associated with project metrics included within the PRHTA Initial TransportationAsset Management Plan (TAMP), April 2018;
• Unit costs associated with project metrics included within the PRHTA 2019-2028 CapitalImprovement Program Validation report, June 22, 2018;
• Estimates of capital costs associated with projects included within the State-wideTransportation Improvement Program (STIP), Fiscal Years 2017-2020, Amendment #2report, February 23, 2018.
The reference costs are intended to reflect latest estimates at 2018 prices, allowing for 20% cost inflation, post Hurricane María, which reflects the combination of a relatively small Island, limited construction community and rapid increase in demand for services. Full project cost tables are included in Appendix H.

CHAPTER 6 2045 PLAN
Final Report December 2018 | 235
This chapter presents the 2045 LRTP. It is divided into 2 main sections that include the conclusion of the scenarios analysis, the definition of project priorities and the modelling results for the future 2045:
1. Tested Scenarios:a. Freight Network Extension;b. Transit Service Extension;c. Roadway Network Vulnerability Assessment; andd. Bottleneck Analysis.
2. Cost Feasibility Plan Scenarios:a. Transportation Funding Summary; andb. 2045 Models.
TESTED SCENARIOS As part of the development of this 2045 LRTP, 4 scenarios were analyzed based on the planning approach discussed earlier. These scenarios are:
• Freight network extension;• Transit service extension;• Roadway network vulnerability assessment; and• Bottle neck identification.
The results from these scenarios are discussed in more detail in the next sub-sections.
Freight Network Extension
The planning factors include the priority of increasing accessibility and mobility of freight and the integration and connectivity of the transportation system, across and between modes, for people and freight.
Based on this planning factor, the 2045 LRTP model was tested considering an extended truck network system defined beyond the FHWA network presented in Figure 6.1; the map represents suggested key freight network roads based on inputs from the Freight Advisory Committee meetings with cargo movement experts as part of the engagement process of this Plan. This scheme includes access to/from port zones and major cargo mobility areas as well as the
6 CHAPTER 6 2045 PLAN

CHAPTER 6 2045 PLAN
Final Report December 2018 | 236
completion of the strategic roadway system based on the results of the Freight Advisory Committee meetings discussions. Table 6.1 and Table 6.2 list the new freight corridors and other roadways that were coded as freight corridors within the Island wide model. This analysis was performed with the travel demands under the condition of 2016 population and employment. Table 6.1: New Freight Corridors
Name Distance (mile) Facility Type
PR-22 Extension to Aguadilla 27.63 Freeway
PR-53 Extension Patillas to Maunabo 8.38 Freeway
PR-2 convert to Freeway 17.83 Freeway
PR-10 Extension 4.52 Principal Art
PR-53 Extension from Humacao and Maunabo 3.54 Freeway
Source: SDG analysis
Table 6.2: Improved Freight Corridors
Name MPO
PR-2 Aguadilla
PR-111 Aguadilla/North
PR-129 Aguadilla/North
PR-106/PR-120 Southwest/Aguadilla
PR-137 San Juan
PR-155 San Juan
PR-142 San Juan
PR-839/PR-861 San Juan
PR-5 San Juan
PR-28 San Juan
PR-21 San Juan
PR-172 San Juan
PR-1 San Juan
PR-14 San Juan
PR-143 South/San Juan
PR-140 North
Source: SDG analysis

CHAPTER 6 2045 PLAN
Final Report December 2018 | 237
Figure 6.1: Freight Network

CHAPTER 6 2045 PLAN
Final Report December 2018 | 238
Presented in Table 6.3 through Table 6.5, the resulting statistics were compared to the 2016 base condition, namely the Base Case. The Base Case can be described as the 2016 population and employment operating on the 2016 transportation system. The truck vehicle mile traveled (VMT) and truck vehicle hours traveled (VHT) on freeways have minor increases from the Base Case, while VMTs and VHTs on the expressways have slightly decreased. Since some minor arterials are upgraded to principal arterials and added to the freight corridor, the truck VMTs and VHTs increased significantly on the principal arterials. The speeds are slightly increased in the San Juan TMA in the freight scenario.
As presented in Table 6.5, the tested scenario results in a slight reduction of trips and road usage in terms of time spent by drivers on the network. At the same time a marginal increase of miles traveled is observed.
As expected, no material changes in terms of cost or accessibility are seen with the introduction of the freight scenario. The most significant benefit that results from this proposal is an optimized distribution of trucks on roadways; according to Table 6.3 and Table 6.4, freight related vehicles are moving from minor, local roads to those offering better and most suitable capacity as expressways and major arterials. It is likely that this spreading of heavy traffic could result in positive effects on other road users, resulting in better LOS, more reliable travel times and ideally, improved road safety. Not all of these effects are reflected in previously mentioned statistics.

CHAPTER 6 2045 PLAN
Final Report December 2018 | 239
Table 6.3: Truck VMT by Vehicle Class and by Road Type
Medium Truck Heavy Truck Total Truck
Base Case Freight Scenario % Change Base
Case Freight Scenario % Change Base Case Freight Scenario % Change
Freeway 373,644 390,204 4.4% 129,056 135,109 4.7% 502,701 525,313 4.5%
Expressway 141,128 140,438 (0.5%) 54,345 54,097 (0.5%) 195,473 194,536 (0.5%)
Principal Arterial 120,095 143,564 19.5% 44,070 51,856 17.7% 164,165 195,420 19.0%
Minor Arterial 284,978 257,952 (9.5%) 97,235 87,564 (9.9%) 382,212 345,516 (9.6%)
Ramps 28,884 29,715 2.9% 9,978 10,241 2.6% 38,862 39,957 2.8%
Local Roads 394,841 390,040 (1.2%) 124,779 123,021 (1.4%) 519,621 513,061 (1.3%)
Total 1,343,570 1,351,913 0.6% 459,463 461,889 0.5% 1,803,034 1,813,802 0.6%
Source: SDG on PRHTA Island-wide Model
Table 6.4: Truck VHT by Vehicle Class and by Road Type
Medium Truck Heavy Truck Total Truck Base Case Freight Scenario % Change Base Case Freight Scenario % Change Base Case Freight Scenario % Change
Freeway 10,647 10,983 3.2% 3,720 3,843 3.3% 14,366 14,825 3.2%
Expressway 6,991 6,947 (0.6%) 2,676 2,659 (0.6%) 9,667 9,606 (0.6%)
Principal Arterial 5,464 6,717 22.9% 1,955 2,372 21.3% 7,420 9,089 22.5%
Minor Arterial 13,598 12,380 (9.0%) 4,600 4,172 (9.3%) 18,198 16,551 (9.0%)
Ramps 1,300 1,340 3.0% 454 466 2.5% 1,755 1,805 2.9%
Local Roads 19,018 18,679 (1.8%) 5,976 5,859 (2.0%) 24,993 24,538 (1.8%)
Total 57,018 57,045 0.0% 19,380 19,370 0.0% 76,398 76,416 0.0%
Source: SDG on PRHTA Island-wide Model

CHAPTER 6 2045 PLAN
Final Report December 2018 | 240
Table 6.5: San Juan TMA Measures of Effectiveness for Freight Scenario
Measures of Effectiveness Base Case Freight Scenario
% Change (Freight vs. Base)
System Performance
Average network speed (mph) 23.5 23.6 0.5%
Total transit passengers per route mile 24.3 24.3 0.0%
% non-motorized trips 4.0% 4.0% 0.0%
% transit trips 3.2% 3.2% 0.2%
Average highway trip cost $0.79 $0.79 0.0%
Average transit trip cost $1.20 $1.20 0.0%
% Population within 0.5-mile walk to transit 25.4% 25.4% 0.0%
% Employment with 0.5-mile walk to transit 43.1% 43.1% 0.0%
Vehicles hours of delay 249,780 250,319 0.2%
Vehicle hours of travel/1000 vehicle miles of travel 42.6 42.4 (0.5%)
VMT above capacity 884,364 924,143 4.5%
Speed on limited access roads and expressways 29.7 30.0 0.9%
Gallons of fuel consumed98 1,498,478 1,505,084 0.4%
System Usage
Vehicle miles of travel 34,614,850 34,767,451 0.4%
Vehicle hours of travel 1,475,628 1,474,977 (0.0%)
Average network speed 23.5 23.6 0.5%
Person trips 4,361,830 4,361,561 (0.0%)
Vehicular trips99 3,212,353 3,211,318 (0.0%)
Truck trips3100 162,543 162,448 (0.1%)
Source: SDG analysis of freight scenario on Island-wide Model
98 Gallons of fuel consumed were calculated using AAA miles per gallon in 2016 at 23.1 mpg. 99 Vehicle trips exclude commercial vehicles, medium trucks and heavy trucks. 100 Truck trips include medium trucks and heavy trucks.
CHAPTER 6 2045 PLAN
Final Report December 2018 | 241
Transit Service Extension
The planning factors include the priority of enhancing the integration and connectivity of the transportation system, across and between modes, for people and freight; the goals and objectives of the 2045 LRTP consistently indicate the importance of accessibility, connectivity, mode choice. Considering the importance of strengthening the local transit services in Puerto Rico, multiple scenarios were tested using the Island-wide model.
Two transit scenarios were tested under the 2016 travel demand situation. One scenario looked at the impacts of introducing a Caguas BRT connecting between Caguas and San Juan along PR-52 (see Figure 6.2). The other scenario tested an enhanced San Juan local bus network together with the Caguas BRT route.
Results of the 2016 scenarios are presented in Table 6.6. The addition of the BRT service increases the number of transit trips within the San Juan TMA by 4.5%. This represents a slight mode shift away from cars and a 2.2% increase in transit passengers per route mile. This means that the new BRT service will be busier than the existing transit network on a per mile basis. The BRT also improves transit access in San Juan TMA by increasing the coverage of population by 0.7% and of employment by 1.7%.
A revised bus network was also specified to complement the BRT service in the scenario of BRT plus enhanced bus network. The impacts of these changes on transport provision in the San Juan TMA are as follows. Network coverage improves, relative to the Base Year, by 0.8% of population and 4.0% of employment; an increase on the BRT only scenario. On the other hand, the increase in total passengers per route mile is less than the BRT scenario at 1.3%, suggesting that the local bus services are less busy than the BRT.
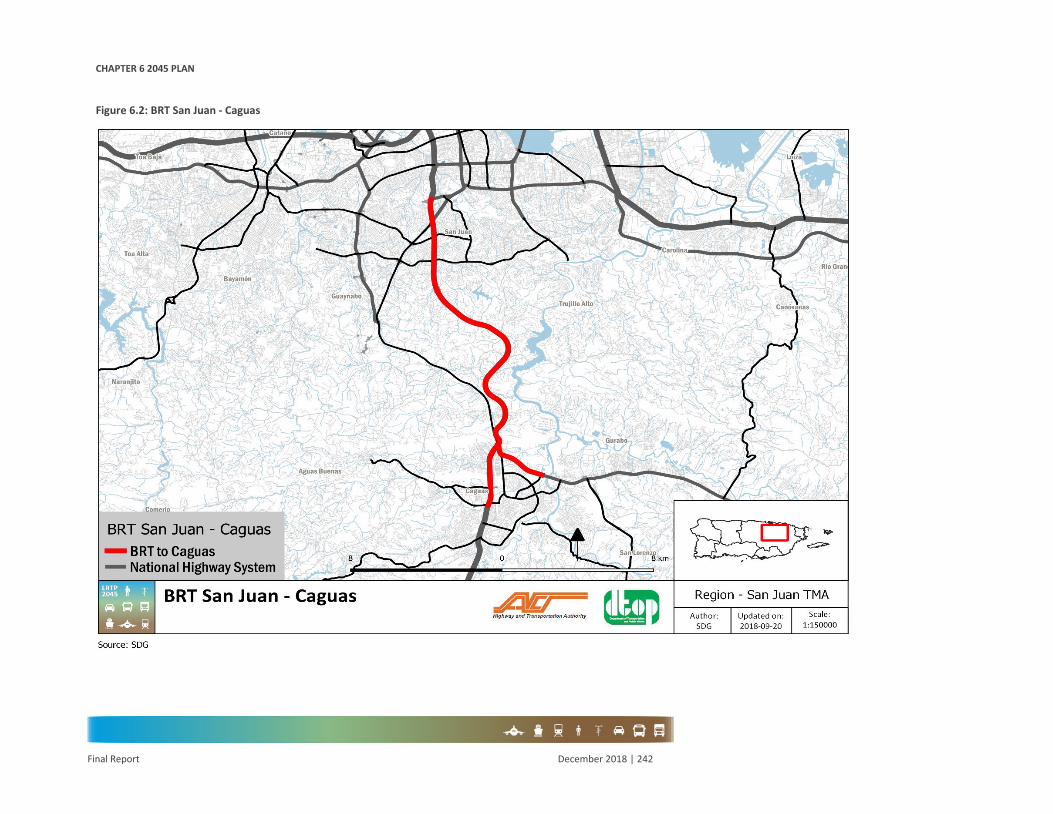
CHAPTER 6 2045 PLAN
Final Report December 2018 | 242
Figure 6.2: BRT San Juan - Caguas

CHAPTER 6 2045 PLAN
Final Report December 2018 | 243
Table 6.6: Summary of Transit Scenarios in San Juan TMA
Measures of Effectiveness Base Case BRT Service
% Change (BRT vs.
Base)
BRT + Local Bus Service
% Change (BRT + Local vs.
Base)
System Performance
Average network speed (mph) 23.5 23.5 0.0% 23.5 0.1%
Total transit passengers per route mile 26.1 26.6 2.2% 26.4 1.3%
% non-motorized trips 4.0% 4.0% (0.1%) 4.0% (0.1%)
% transit trips 3.2% 3.3% 2.8% 3.3% 4.5%
Average highway trip cost $0.79 $0.79 0.0% $0.79 0.0%
Average transit trip cost $1.20 $1.20 0.0% $1.20 0.0%
% Population within 0.5-mile walk to transit 25.4% 25.5% 0.7% 25.6% 0.8%
% Employment with 0.5-mile walk to transit 43.1% 43.8% 1.7% 44.9% 4.0%
Vehicles hours of delay 249,780 248,996 (0.3%) 248,264 (0.6%)
Vehicle hours of travel/1000 vehicle miles of travel 42.6 42.6 0.0% 42.6 (0.1%)
VMT above capacity 884,364 906,722 2.5% 904,090 2.2%
Speed on limited access roads and expressways 29.7 29.8 0.1% 29.8 0.1%
Gallons of fuel consumed 1,498,478 1,497,674 (0.1%) 1,497,042 (0.1%)
System Usage
Vehicle miles of travel 34,614,850 34,596,279 (0.1%) 34,581,673 (0.1%)
Vehicle hours of travel 1,475,628 1,474,254 (0.1%) 1,473,017 (0.2%)
Average network speed 23.5 23.5 0.0% 23.5 0.1%
Person trips 4,361,830 4,361,837 0.0% 4,361,834 0.0%
Vehicular trips 3,212,353 3,209,632 (0.1%) 3,207,932 (0.1%)
Truck trips 162,543 162,542 0.0% 162,544 0.0%
Source: SDG analysis of transit scenarios on PRHTA Island-wide Model
Roadway Network Vulnerability Assessment
Resilience Component for The Long-Range Transportation Plan
Due to its location, Puerto Rico is highly exposed to hurricanes passing by the island every year usually between July and November. The hurricane season is characterized by heavy rain, high-velocity winds and storm surge, causing flooding and landslides in different areas of the island. However, the extent of damage varies depending on different variables such as track, intensity, size, forward speed of the hurricane, geotechnical conditions of each area, land elevation, etc. Additionally, hurricane season presents different characteristics each year, for example shifts in track, as presented in Figure 6.3 and Figure 6.4, duration and intensity as it can be seen by the dispersion in the historical average shown in Figure 6.5.

CHAPTER 6 2045 PLAN
Final Report December 2018 | 244
Figure 6.3: Puerto Rico Hurricane Map
Source: USGS, Puerto Rico Hurricanes Map, 2018. https://www.usgs.gov/media/images/puerto-rico-hurricanes-map

CHAPTER 6 2045 PLAN
Final Report December 2018 | 245
Figure 6.4: Hurricane María Best Track
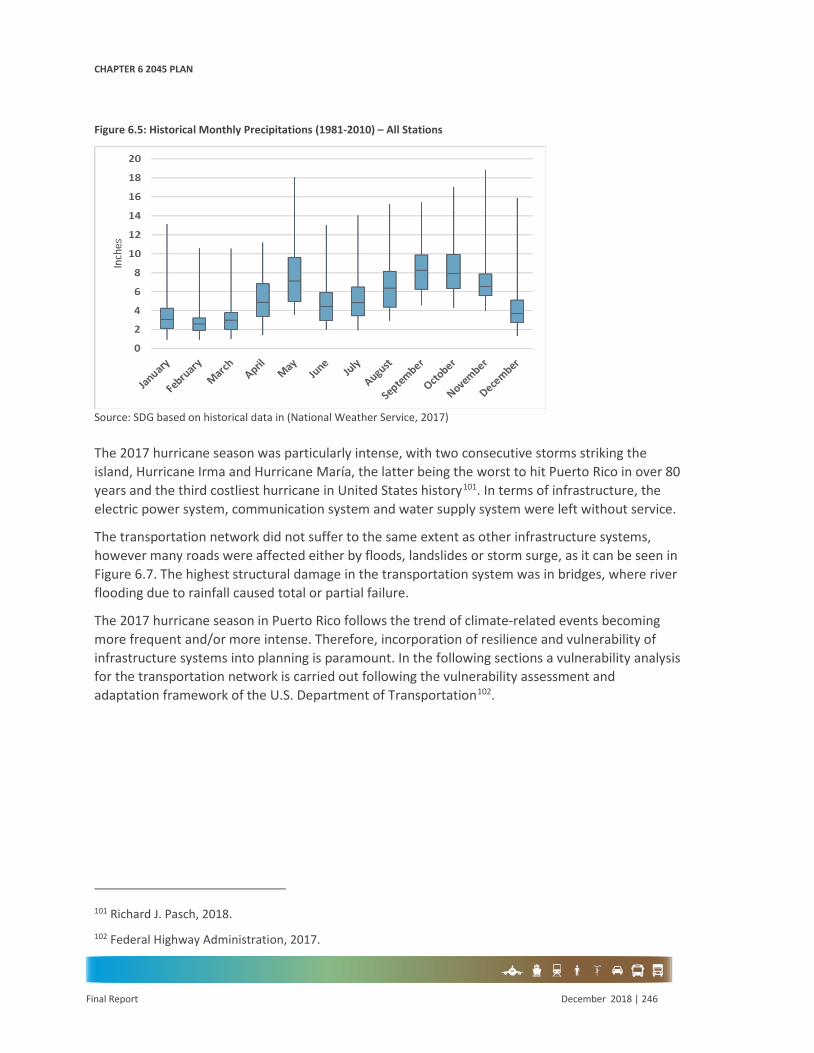
CHAPTER 6 2045 PLAN
Final Report December 2018 | 246
Figure 6.5: Historical Monthly Precipitations (1981-2010) – All Stations
Source: SDG based on historical data in (National Weather Service, 2017)
The 2017 hurricane season was particularly intense, with two consecutive storms striking the island, Hurricane Irma and Hurricane María, the latter being the worst to hit Puerto Rico in over 80 years and the third costliest hurricane in United States history101. In terms of infrastructure, the electric power system, communication system and water supply system were left without service.
The transportation network did not suffer to the same extent as other infrastructure systems, however many roads were affected either by floods, landslides or storm surge, as it can be seen in Figure 6.7. The highest structural damage in the transportation system was in bridges, where river flooding due to rainfall caused total or partial failure.
The 2017 hurricane season in Puerto Rico follows the trend of climate-related events becoming more frequent and/or more intense. Therefore, incorporation of resilience and vulnerability of infrastructure systems into planning is paramount. In the following sections a vulnerability analysis for the transportation network is carried out following the vulnerability assessment and adaptation framework of the U.S. Department of Transportation102.
101 Richard J. Pasch, 2018. 102 Federal Highway Administration, 2017.

CHAPTER 6 2045 PLAN
Final Report December 2018 | 247
Figure 6.6: Affected roads by María Hurricane

CHAPTER 6 2045 PLAN
Final Report December 2018 | 248
Figure 6.7: Examples Of effects of Hurricane María on the roadway network
Source: Federal Highway Authority, 2018
Vulnerability Analysis Methodology
According to (Proag, 2014), vulnerability is defined as “the degree to which a system, or part of it, may react adversely during the occurrence of a hazardous event”, therefore, vulnerability analysis includes: a characterization of the system, its response to a hazard and, the “likelihood of occurrence” of such hazard. As it can be seen, this is a broad concept that involves different aspects of interaction between hazard and infrastructure.

CHAPTER 6 2045 PLAN
Final Report December 2018 | 249
On the other hand, resilience is a more specific characterization of a system and complements vulnerability in the context of hazard management and climate change. It can be defined as “[The systems’] ability to reduce both the magnitude and duration of a deviation (caused by a disruptive event) as efficiently as possible to its usual targeted system performance levels”103. Incorporation of resilience policies into transportation planning allows a long-range improvement of the system to respond to a hazard, which is part of the system’s vulnerability.
In concordance with these definitions, the FHWA in 2017 released a Vulnerability Assessment and Adaptation Framework for carrying out vulnerability analysis in transportation infrastructure. The framework includes a five-step process:
1. Definition of objectives and scope2. Data compilation3. Vulnerability assessment4. Analysis of adaptation options5. Incorporation of results into decision-making
A description of each step is included in Appendix I. A complete explanation and examples are available within the framework’s document.
Objective and Scope
The vulnerability assessment is a component of the 2045 LRTP and as a result of the plan’s time horizon the vulnerability assessment is limited to a system-level decision-making context. Furthermore, the transportation infrastructure that can be analyzed from a system-level perspective is limited to roads, which are relevant for emergency response, distribution of goods and connectivity of municipalities.
The incorporation of a vulnerability assessment component into the 2045 LRTP was mainly triggered by the devastating effects of Hurricane María on the transportation infrastructure. Therefore, in terms of climate variables, this study focuses in hurricane-related hazards. It explicitly excludes other hazards such as earthquakes though they are also present in the Island.
As previously mentioned, hurricanes are characterized by high-speed winds, rain and storm surge. These features while not generally direct threats to roads pose a major hazard as they trigger landslides and floods. Specifically, rainfall is the most common trigger for both hazards. Large volumes of precipitations over a short period increases water levels in rivers, lakes and any other bodies of water leading to overflows that when combined with uneven topography lead to floods. Additionally, the accumulation of water in soil may result in landslides. This is especially dangerous in soil that is highly susceptible to landslides. As a result, the vulnerability assessment is mainly focused on the variables related to floods and landslides.
103 Taken from PROAG, 2014.

CHAPTER 6 2045 PLAN
Final Report December 2018 | 250
The key climate variables identified for this analysis are:
1. Landslides in Hurricane María2. Flooding data3. Weather stations4. Rainfall historic data5. Slope6. River map7. Land use8. Susceptibility to landslides9. Infrastructure damage due to Hurricane María10. Coastal floods
Regarding infrastructure, a stakeholders-input methodology was sought (see Appendix I for details) and through a series of workshops with several participants, 49 segments were identified as the most critical assets, as seen in Figure 6.8. The vulnerability assessment focused on identifying the vulnerability components of these facilities.
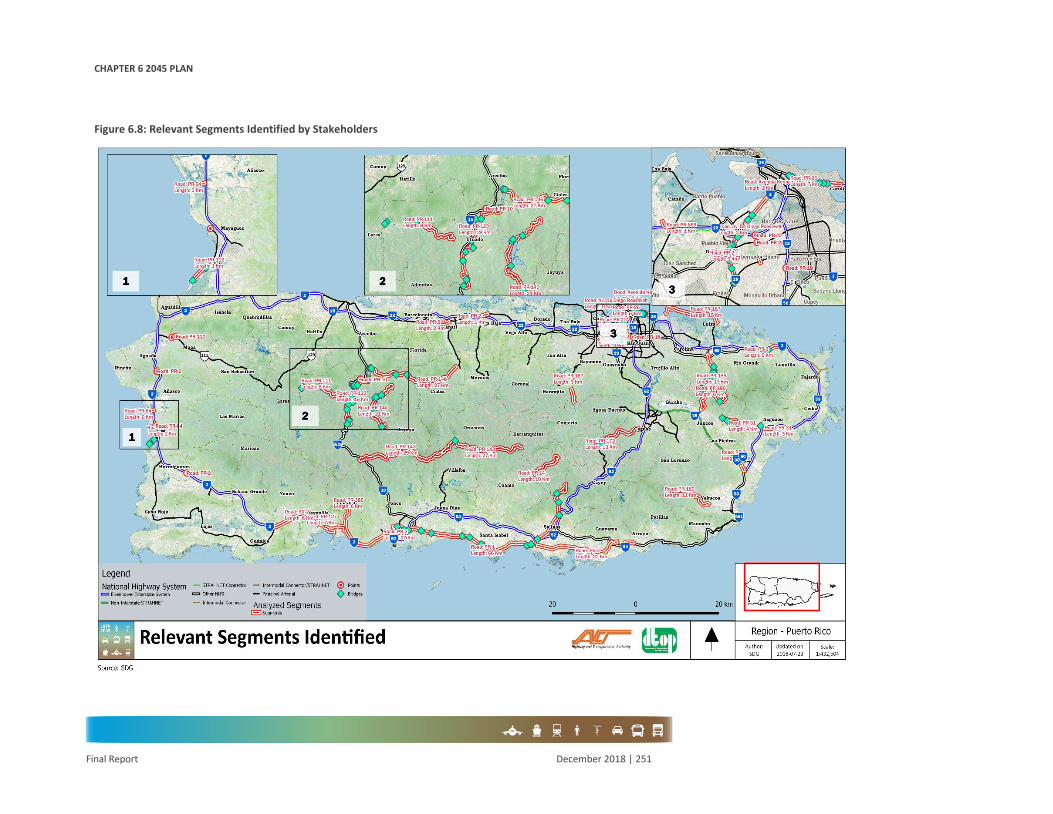
CHAPTER 6 2045 PLAN
Final Report December 2018 | 251
Figure 6.8: Relevant Segments Identified by Stakeholders

CHAPTER 6 2045 PLAN
Final Report December 2018 | 252
Vulnerability Assessment
According to the FHWA, vulnerability can be expressed in terms of: Exposure, Sensitivity, and Adaptive capacity. Exposure is the representation of hazard and can be obtained from the hazard maps and hazard information available. Sensitivity should reflect the asset’s state and resistance to failure; this information is represented mainly by stakeholder input. Finally, Adaptive capacity is a system-level indicator and can be calculated from data given by the transportation model. Figure 6.9 summarizes the three components of the vulnerability assessment.
Figure 6.9: Components of vulnerability
Source: SDG
The following sections explain the procedure to calculate each component of the vulnerability assessment for the 2045 LRTP.
Exposure
• Trigger: Rainfall
As the precipitation levels are not constant over the year, neither periodical between years, due to climate change, it is paramount to examine multiple hazard scenarios. For this analysis three scenarios were defined according to their corresponding level of hazard to reflect an average scenario, a critical scenario and the worst-case scenario (from historical data). The three scenarios, from minimum to maximum, are (all in inches per day):
1. Average scenario: Corresponds to the average annual precipitation for Puerto Ricoobtained from an historical data in a 1981 to 2010 period104.
2. Intensive scenario: Corresponds to the cumulative precipitation of the months withthe higher levels of rainfall during the 1981 – 2010 period: September, October andNovember103.
104 National Weather Service, 2017.

CHAPTER 6 2045 PLAN
Final Report December 2018 | 253
3. Hurricane María scenario: Corresponds to the precipitation levels estimated duringthe Hurricane María, obtained from a 48-hour total data from September 19 to 21,2017103.
The precipitation data for each weather station was georeferenced and using an inverse distance weighted (IDW) process, the precipitations level for the entire island were obtained (the resulting maps and detailed procedure is explained in Appendix I for details).
• Floods
The flood hazard is based on precipitation levels and the flood zones identified by FEMA‘s Flood Insurance Rate Map (FIRM). Rainfall is the critical trigger for the occurrences of flooding. Therefore, each of the rainfall scenarios were intersected with the FIRM layer, resulting in three flood hazard scenarios, as seen in Figure 6.10 through Figure 6.12.
These maps show the level of flood hazard for each area in Puerto Rico, joining the exposure of flood (i.e., FIRM map) with the amount of water in each scenario. Each area is susceptible to flooding according to flooding data from FEMA and the severity of the flooding is obtained from the rainfall scenario that is being evaluated.
The coastal flood maps were adapted from the coastal flood frequency produced by the National Oceanic and Atmospheric Administration (NOAA, 2017), in which the potential impact associated with coastal flood advisories for the 3 ft. and 6t. sea level rise were obtained; the resulting hazard map is shown in Figure 6.13.
• Landslides
The landslide analysis was based on the creation of a model that can model the landslides that occurred during Hurricane María, using the listed variables as triggers:
• Slope;• Proximity to rivers: Binary variable that indicates if within a unit of analysis (100m X
100m) there is a relevant water body;• Land use data: Categorical variable indicating the areas of each land use
classification;• Landslide susceptible zones from the Planning Board: Categorical variable that
indicate the level of susceptibility for a landslide event ranging from 1 (the lowestsusceptibility) to 4 (the highest susceptibility); and
• Precipitation levels for Hurricane María and Average seasons in inches.
A binomial logistic regression model was used to predict the concentration of landslides for the Hurricane María rainfall scenario. The accuracy obtained with this model was 0.741 (see Appendix I for details), which corresponds to a fair error rate given the scope of this study. After this model was developed, the precipitation levels were changed to the average rainfall scenario and a second landslide hazard map (i.e., concentration of landslides) was obtained, as shown in Figure 6.14 and Figure 6.15.

CHAPTER 6 2045 PLAN
Final Report December 2018 | 254
Figure 6.10: Hurricane María Average Flood Hazard

CHAPTER 6 2045 PLAN
Final Report December 2018 | 255
Figure 6.11: Intensive Flood Hazard

CHAPTER 6 2045 PLAN
Final Report December 2018 | 256
Figure 6.12: Average Flood Hazard

CHAPTER 6 2045 PLAN
Final Report December 2018 | 257
Figure 6.13: Coastal Flood Hazard Map

CHAPTER 6 2045 PLAN
Final Report December 2018 | 258
Figure 6.14: Hurricane María Predicted Landslides

CHAPTER 6 2045 PLAN
Final Report December 2018 | 259
Figure 6.15: Average Predicted Landslides

CHAPTER 6 2045 PLAN
Final Report December 2018 | 260
Sensitivity
According to FHWA, Sensitivity is defined as “how the asset or system fares when exposed to a climate variable”. The response of the asset to certain climate variables can be expressed in terms of the probability of certain magnitudes of failure, given some magnitude of hazard. Since the scope of this analysis is not to characterize each segment of road in the Puerto Rico transportation system, but to give a broad assessment regarding vulnerability, this probability of failure will be broken down into three components: frequency of failure, magnitude of failure and criticality index.
For each segment analyzed. frequency of failure provides insights regarding asset state and where the segment is in its lifecycle. Typically, towards the end of design life, assets tend to have higher maintenance costs as their failure rate increases. Therefore, this measure, even in a qualitative scale, should quantitative measures not be available, gives a sense on the general state of the infrastructure.
The magnitude of failure provides information regarding how well the asset withstands a disturbance due to a climate event. The failure can be a result of the original design, where resistance to the identified hazard was not strongly included, or it might be related to the age of the asset, and it continuous exposure to the hazard. In most cases, this measure provides an insight on how the asset is affected each time it interacts with the hazard.
Finally, a criticality index is included in the study as a measure of the level of use of each analyzed segment and its importance in the overall network This allows the measure to differentiate between two assets in terms of how significant they are in terms of the networks dynamics. This index is developed for every link of the transportation network and was also used as part of the Adaptive Capacity analysis.
For each identified asset, stakeholders provided input in terms of frequency of failure and magnitude of failure. This data was transformed into a score between 1 and 5 depending on the level of each response. These two scores are averaged with the criticality index and for each asset a final score is given (see Appendix I for details).
Adaptive Capacity
The final component of the vulnerability analysis is the Adaptive Capacity analysis. This is a system-level measure and aims at measuring how a failure in one element of the system reflects in the overall performance. There are two possible approaches for this measure:
• Direct: Using the transportation model, each segment is removed from the network andthe model demand is assigned again. Using performance statistics of the transportationmodel (e.g. average volume/capacity ratio), the effect of the removal of such link ismeasured.
• Indirect: Using graph theory, the transportation model is represented by a weighted-directed graph and a centrality statistic (before and after removal) is used to measure theeffect of a link failure in the system.

CHAPTER 6 2045 PLAN
Final Report December 2018 | 261
The indirect measure was selected to measure adaptive capacity because it is less time intensive than the direct measure and the centrality measures successfully captures the global effect of removing a segment from the network. Detailed methodology can be found in Appendix I.
As a result, a score between 1 and 5 was developed for each asset depending on the resulting index.
Results
The vulnerability index was obtained by combining the three components: Exposure, Sensitivity and Adaptive Capacity. A simple average might hide single-component criticalities that is why the scoring for vulnerability index followed these rules:
• Score=5: If the three components had score of 5• Score=4: If two out of three had a score equal or higher than 4• Score=3: If at least one of the components had score equal or higher than 4, or the
average is above 3• Score=2: If the average is above 2 and below 3• Score=1: Any other case
The results for each component and the final vulnerability index for the selected segments is shown in Figure 6.16.
Figure 6.16: Vulnerability Index for Relevant Assets
Source: SDG
Due to the level of detail defined in this analysis, the vulnerability index is defined as a discrete scale from 1 to 5, where “1” is the lowest score and “5” the highest. It is important to note that three of the selected segments where given a score of “0” because there was no evidence of Exposure and without it, there is no vulnerability. However, these might be due to uncertainties in the location or type of hazard responsible for failure. Therefore, it is important to re-visit these points and develop further hazard analysis.

CHAPTER 6 2045 PLAN
Final Report December 2018 | 262
These results were shared with the stakeholders in a final workshop, where the top 21 segments (i.e., score 4 and 5) were selected for further analysis and definition of mitigation analysis. The prioritized projects are shown in Figure 6.17 shows a brief description of each prioritized segment for the San Juan TMA. For all the identified segments a detailed study needs to be carried out to identify the appropriate adaptation option. For the San Juan TMA, 14 priorities were identified as shown in Table 6.7.

CHAPTER 6 2045 PLAN
Final Report December 2018 | 263
Figure 6.17: Prioritized Segments

CHAPTER 6 2045 PLAN
Final Report December 2018 | 264
Table 6.7: Prioritized Segments Assessment
Road name Location AADT Length (km) Hazard Vulnerability index
PR-20 Guaynabo 51,337 2 Floods 5
PR-31 Las Piedras 9,633 4 Floods 4
PR-172 Cidra/Caguas 9,504 13 Landslides 4
PR-31 Naguabo 15,670 2.8 Floods 4
PR-143 Orocovis / Barranquitas 3,208 27 Landslides 4
PR-2 Guaynabo 51,337 4 Floods 4
PR-185 Canóvanas / Juncos 11,521 17 Landslides 4
PR-869 Cataño 57,104 1 Floods 4
PR-186 Canóvanas 4,369 6 Landslides 4
PR-3 Humacao 14,985 2 Floods 4
PR-26 San Juan 75,190 3 Floods 4
PR-146 Ciales 1,444 27 Landslides 4
Av. De Diego Roosevelt San Juan 8,536 1.1 Floods 4
PR-2 Vega Baja 34,127 1 Floods 4
Source: SDG. Note: The AADT presented for each segment was estimated using an annualization factor and it is shown in Passenger Car Unit (PCU). This factor converts toll revenue from the weekday values derived from the study area forecast models to an equivalent annual total. SDG set this factor based on available observed toll transaction data and SDG estimate of the number of weekdays, weekends and a weekend day’s share of weekday transactions in 2016. Assuming a weekend has one-third of a weekday’s transactions, SDG Team estimated a revenue factor of 296 (261 weekdays plus 104 weekends * 1/3).
The description and location of the San Juan TMA priority segments are the following:
1. PR-20: Guaynabo, as seen in Figure 6.18:• AADT: 51,337;• Segment: km 0.0 a km 2.0;• Hazard: Floods; and• Vulnerability index: 5.
2. PR-31: Las Piedras, as seen in Figure 6.19:• AADT: 9,633;• Segment: km 14.9 a km 18.9;• Hazard: Floods; and• Vulnerability index: 4.
3. PR-172: Cidra/Caguas, as seen in Figure 6.20:• AADT: 9,504;• Segment: km 13.0 to 26.0;• Hazard: Landslide; and• Vulnerability index: 4.
4. PR-31: Naguabo, as seen in Figure 6.21:• AADT: 15,670;• Segment: km 6.0 to 8.8;

CHAPTER 6 2045 PLAN
Final Report December 2018 | 265
• Hazard: Floods; and• Vulnerability index: 4.
5. PR-143: Orocovis / Barranquitas, as seen in Figure 6.22:• AADT: 3,208;• Segment: km 30.0 to 57.0;• Hazard: Landslide; and• Vulnerability index: 4.
6. PR-2: Guaynabo/San Juan, as seen in Figure 6.23:• AADT: 51,337;• Segment: km 2 to 6.3;• Hazard: Floods; and• Vulnerability index: 4.
7. PR-185: Canóvanas / Juncos, as seen in Figure 6.24:• AADT: 11,521;• Segment: km 2.0 to 19.0;• Hazard: Landslide; and• Vulnerability index: 4.
8. PR-869: Cataño, as seen in Figure 6.25:• AADT: 57,104;• Segment: km 0.0 to 1.0;• Hazard: Floods; and• Vulnerability index: 4.
9. PR-186: Canóvanas, as seen in Figure 6.26:• AADT: 4,369;• Segment: km 4.0 to 10.0;• Hazard: Landslide; and• Vulnerability index: 4.
10. PR-3: Humacao, as seen in Figure 6.27:• AADT: 14,985;• Segment: km 82.9 to 84.0;• Hazard: Floods; and• Vulnerability index: 4.
11. PR-26: San Juan, as seen in Figure 6.28:• AADT: 75,190;• Segment: km 2.0 to 5.5;• Hazard: Floods; and• Vulnerability index: 4.
12. PR-146: Ciales, as seen in Figure 6.29:• AADT: 1,444;• Segment: From Utuado to Ciales;• Hazard: Landslide; and• Vulnerability index: 4.
13. Av. De Diego: San Juan, as seen in Figure 6.30:• AADT: 8,536;

CHAPTER 6 2045 PLAN
Final Report December 2018 | 266
• Segment: Intersection Ave. De Diego and Ave. Jesús T. Piñero;• Hazard: Floods; and• Vulnerability index: 4.
14. PR-2: Vega Baja, as seen in Figure 6.31:• AADT: 34,127;• Segment: km 40.5 to 41.5;• Hazard: Floods; and• Vulnerability index: 4.

CHAPTER 6 2045 PLAN
Final Report December 2018 | 267
Figure 6.18: PR-20 Guaynabo
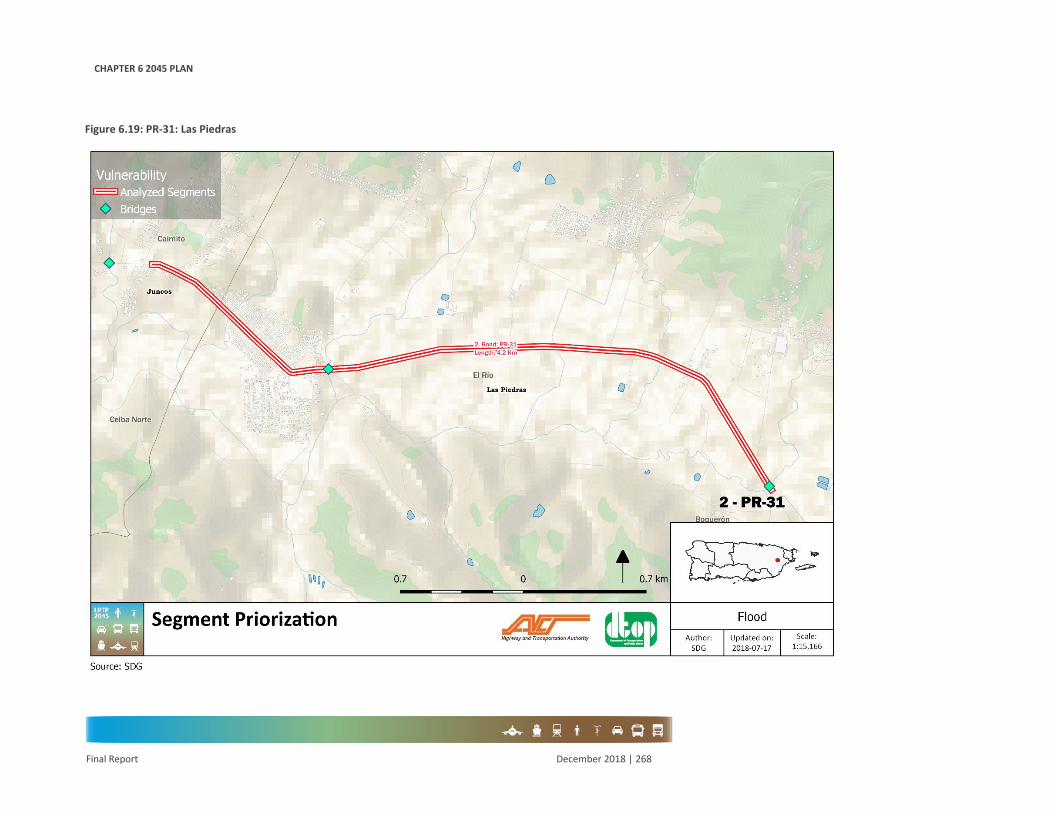
CHAPTER 6 2045 PLAN
Final Report December 2018 | 268
Figure 6.19: PR-31: Las Piedras

CHAPTER 6 2045 PLAN
Final Report December 2018 | 269
Figure 6.20: PR-172: Cidra/Caguas

CHAPTER 6 2045 PLAN
Final Report December 2018 | 270
Figure 6.21: PR-31 Naguabo

CHAPTER 6 2045 PLAN
Final Report December 2018 | 271
Figure 6.22: PR-143: Orocovis / Barranquitas

CHAPTER 6 2045 PLAN
Final Report December 2018 | 272
Figure 6.23: PR-2 Guaynabo

CHAPTER 6 2045 PLAN
Final Report December 2018 | 273
Figure 6.24: PR-185: Canóvanas / Juncos

CHAPTER 6 2045 PLAN
Final Report December 2018 | 274
Figure 6.25: PR-869: Cataño
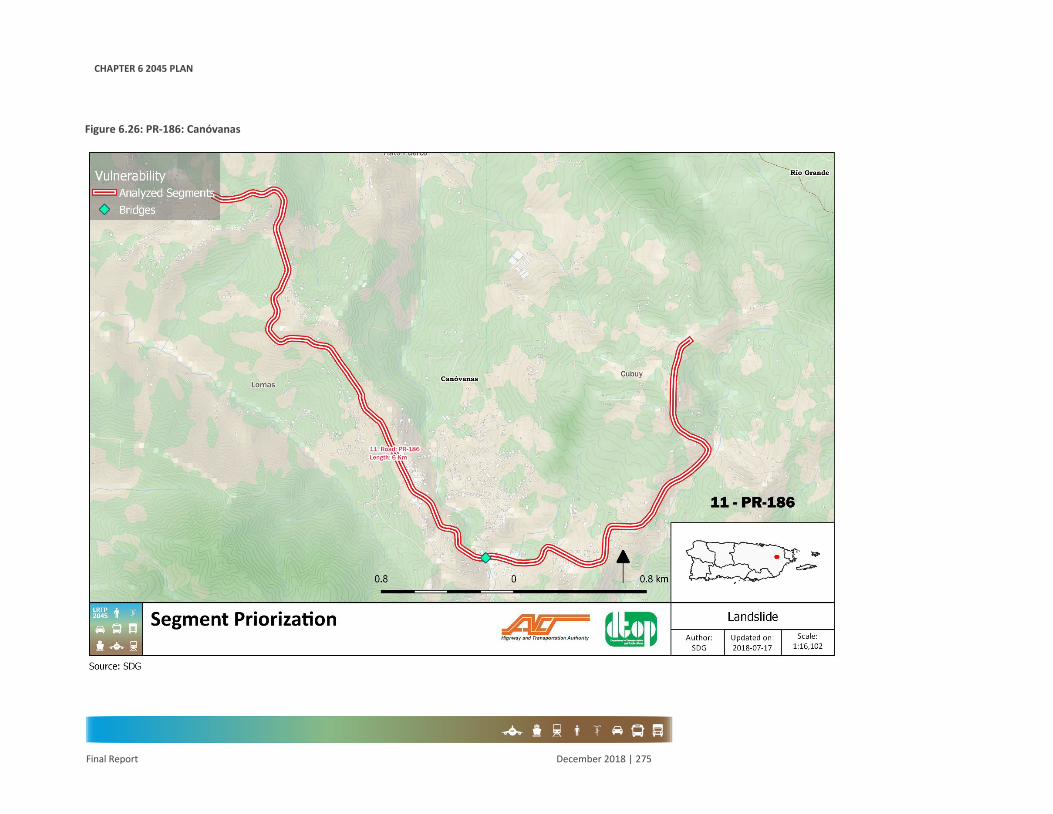
CHAPTER 6 2045 PLAN
Final Report December 2018 | 275
Figure 6.26: PR-186: Canóvanas

CHAPTER 6 2045 PLAN
Final Report December 2018 | 276
Figure 6.27: PR-3: Humacao

CHAPTER 6 2045 PLAN
Final Report December 2018 | 277
Figure 6.28: PR-26: San Juan
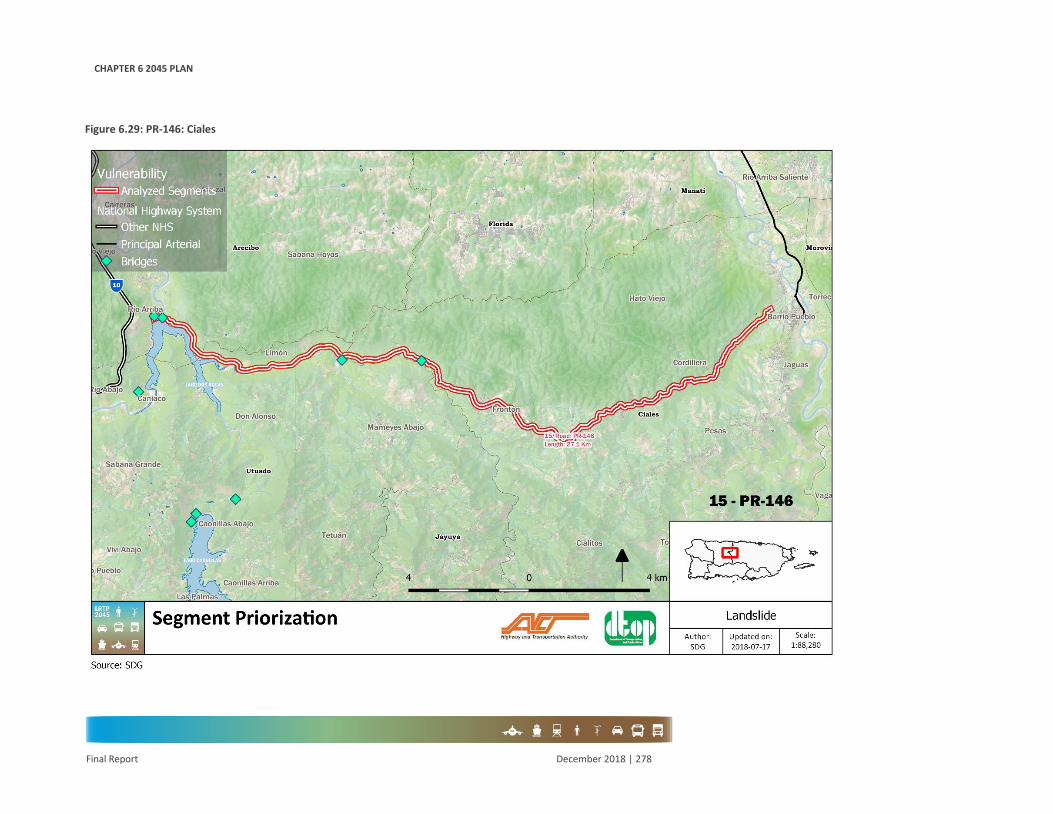
CHAPTER 6 2045 PLAN
Final Report December 2018 | 278
Figure 6.29: PR-146: Ciales

CHAPTER 6 2045 PLAN
Final Report December 2018 | 279
Figure 6.30: Av. De Diego: San Juan

CHAPTER 6 2045 PLAN
Final Report December 2018 | 280
Figure 6.31: PR-2: Vega Baja

CHAPTER 6 2045 PLAN
Final Report December 2018 | 281
Bottleneck Analysis
Introduction
The planning factors include the priority of supporting the economic vitality, especially by enabling global competitiveness, productivity, and efficiency as well as promoting efficient system management and operation. Congestion management and reduction is an important factor to consider within this 2045LRTP.
Typically, road congestion is associated with traffic volume, level of service (LOS), and speed. These indicators can be measured considering the following key performance indicators (KPIs): delay, queue, LOS, volume to capacity ratio (V/C), speed, travel time or density.
As part of the 2045 LRTP, a bottleneck analysis based on delays identification was performed for the NHS. For this analysis, data from NPMRDS corresponding to years 2016-2018 was utilized for extracting speed and distance of TMC coded segments, in order to calculate travel time. The variable delay was obtained through comparing travel time at reference speed and travel time at traffic speed, to assess the time of delay for all segments, per period of day.
Travel Time Reliability
Generally, urban areas face congestion during peak hours. As a result, citizens are required to adjust the travel time to account for the estimated delay and ensure arriving at their destination on time. The reliability of this travel time adjustment influences user’s decision on whether to leave early to account for that delay or risk being late to their destination. Travel time dependability affects citizen’s everyday life factors such as value of time, quality of life and well-being.
Bottleneck Analysis
According to FHWA, bottlenecks are recurring congestion events, and considered “active if traffic is detected to be queued upstream of the location and unqueued downstream (page 106)”.105 As opposed to nonrecurring events of congestion attributed to traffic anomalies such as car accidents, bottlenecks are predictable in cause, location, time of day and approximate duration. This specific bottleneck analysis focuses on identifying segments with major delays along the NHS in Puerto Rico. By identifying these segments, there can be a determination of: specific locations where congestion is highest along a road and the daily period of occurrence.
Methodology
Segment Identification
To identify possible bottlenecks, it is necessary to consider segments with travel times higher than the expected at reference speed for a road segment or TMC. Subsequently, vehicle delays per segment were obtained in minutes by subtracting the average travel and reference travel time. By
105 Daganzo, C.F. (1999). “Remarks on Traffic Flow Modeling and its Applications,” Traffic and Mobility, 105–115, Springer Berlin Heidelberg, Berlin, Germany.
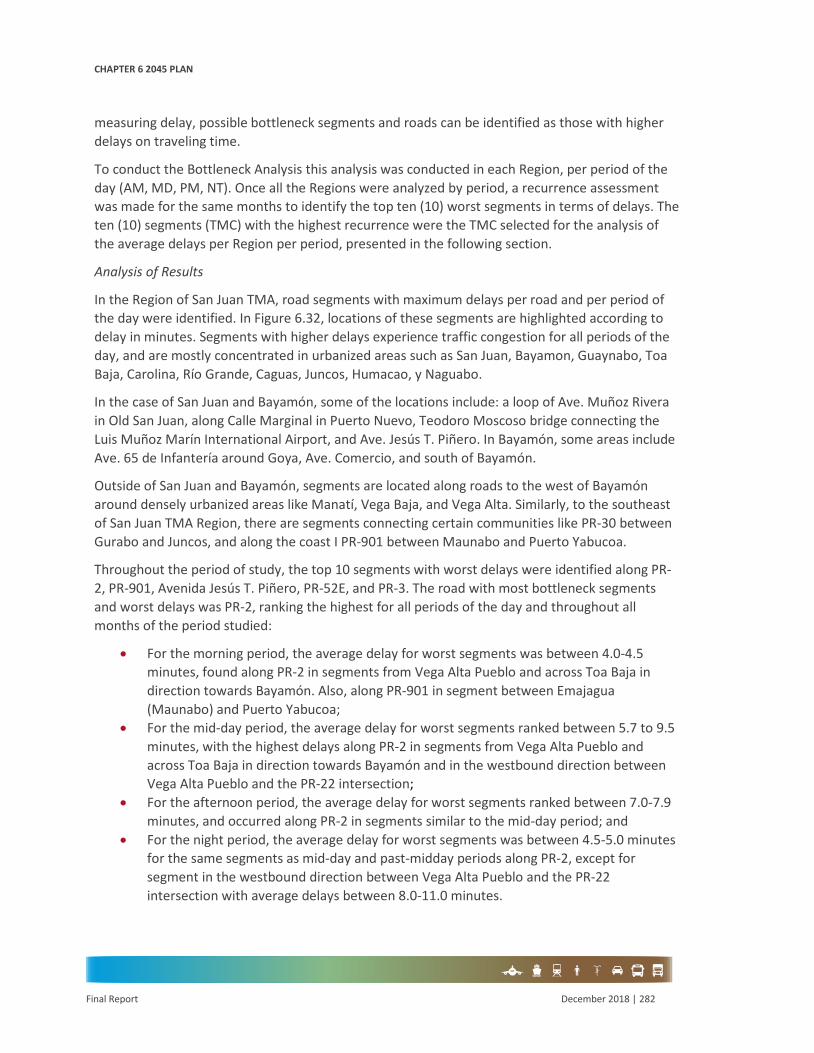
CHAPTER 6 2045 PLAN
Final Report December 2018 | 282
measuring delay, possible bottleneck segments and roads can be identified as those with higher delays on traveling time.
To conduct the Bottleneck Analysis this analysis was conducted in each Region, per period of the day (AM, MD, PM, NT). Once all the Regions were analyzed by period, a recurrence assessment was made for the same months to identify the top ten (10) worst segments in terms of delays. The ten (10) segments (TMC) with the highest recurrence were the TMC selected for the analysis of the average delays per Region per period, presented in the following section.
Analysis of Results
In the Region of San Juan TMA, road segments with maximum delays per road and per period of the day were identified. In Figure 6.32, locations of these segments are highlighted according to delay in minutes. Segments with higher delays experience traffic congestion for all periods of the day, and are mostly concentrated in urbanized areas such as San Juan, Bayamon, Guaynabo, Toa Baja, Carolina, Río Grande, Caguas, Juncos, Humacao, y Naguabo.
In the case of San Juan and Bayamón, some of the locations include: a loop of Ave. Muñoz Rivera in Old San Juan, along Calle Marginal in Puerto Nuevo, Teodoro Moscoso bridge connecting the Luis Muñoz Marín International Airport, and Ave. Jesús T. Piñero. In Bayamón, some areas include Ave. 65 de Infantería around Goya, Ave. Comercio, and south of Bayamón.
Outside of San Juan and Bayamón, segments are located along roads to the west of Bayamón around densely urbanized areas like Manatí, Vega Baja, and Vega Alta. Similarly, to the southeast of San Juan TMA Region, there are segments connecting certain communities like PR-30 between Gurabo and Juncos, and along the coast I PR-901 between Maunabo and Puerto Yabucoa.
Throughout the period of study, the top 10 segments with worst delays were identified along PR-2, PR-901, Avenida Jesús T. Piñero, PR-52E, and PR-3. The road with most bottleneck segments and worst delays was PR-2, ranking the highest for all periods of the day and throughout all months of the period studied:
• For the morning period, the average delay for worst segments was between 4.0-4.5minutes, found along PR-2 in segments from Vega Alta Pueblo and across Toa Baja indirection towards Bayamón. Also, along PR-901 in segment between Emajagua(Maunabo) and Puerto Yabucoa;
• For the mid-day period, the average delay for worst segments ranked between 5.7 to 9.5minutes, with the highest delays along PR-2 in segments from Vega Alta Pueblo andacross Toa Baja in direction towards Bayamón and in the westbound direction betweenVega Alta Pueblo and the PR-22 intersection;
• For the afternoon period, the average delay for worst segments ranked between 7.0-7.9minutes, and occurred along PR-2 in segments similar to the mid-day period; and
• For the night period, the average delay for worst segments was between 4.5-5.0 minutesfor the same segments as mid-day and past-midday periods along PR-2, except forsegment in the westbound direction between Vega Alta Pueblo and the PR-22intersection with average delays between 8.0-11.0 minutes.

CHAPTER 6 2045 PLAN
Final Report December 2018 | 283
Figure 6.32: San Juan TMA,Top Bottleneck Locations106
106 The Cayey segment of the PR-52 that is categorized with a delay between 10.1 – 18.75 min; construction in the area has been constant since early 2016 which increase travel times in this segment beyond regular levels.
CHAPTER 6 2045 PLAN
Final Report December 2018 | 284
COST FEASIBILITY PLAN SCENARIOS Transportation Funding Summary
This section describes the Cost-Feasible Plan recommendations from 2019 to 2045, a 27-year period. The initial period of 2019-2023 is covered by the PRHTA Revised Fiscal Plan 2018-2023 as certified by the Financial Oversight and Management Board for Puerto Rico on June 29, 2018, including completion of current projects. The requirements of the TAMP then dominate the spending projections through to 2028. From 2029 to 2045 the projections will remain cost-constrained, depending on the combination of future FHWA funding allocation and potential transfers from the Government of Puerto Rico.
As outlined in Chapter 5, the forecasts of the sources and allocation of transportation revenues were developed though to 2045, the horizon year of this plan. It is necessary for the LRTP to be developed as fiscally constrained, and to only recommend projects and improvements where there is identified funding to support their implementation. In practice there is no certainty around any of the funding streams except in the very short term, and prudent assumptions are therefore required.
It has been assumed that the level of Federal funding available will remain constant in real terms, and that the PR Government transfers will be maintained at around $200m per year in real terms, in order to maintain the SGR targets for interstates and NHS, and to progressively address the SGR backlog on non-NHS highways. The limited remaining highways funds are then applied to address the prioritized list of projects, including studies; operational improvements; and limited new construction for capacity improvement. A specific allocation is made towards safety including bicycle and pedestrian projects, for design and right of way for enhanced bicycle/pedestrian facilities. All available FTA 5339 funds are assumed to be dedicated to transit fleet renewal and SGR of transit facilities.
During the period through to 2028, the pattern of transportation system expenditure follows the TAMP balanced scenarios, and reflects an obligation to apply all available FHWA funds to achieve minimum required condition of interstate pavements and NHS bridges condition, and to work towards the PRHTA specified target for the condition of non-interstate NHS pavements. A specific mandatory allocation of FHWA funds is also made towards safety projects. There will also need to be state contributions to interstate and NHS SGR projects during this period, and towards SGR on the non-NHS network. During this period the scope to undertake additional highways projects will be extremely limited, although initial work could start from 2025 and gradually ramp up.
Both the available funding and costs are expressed in 2018 prices rather than Year of Expenditure estimates, given the significant uncertainties around both funding and construction price inflation over the medium and longer term. It is implicitly assumed that inflationary pressures will be compensated by increases in the level of funding made available. To the extent that this presumption is not met, it will be necessary to either postpone or delay projects. The over-riding priority to achieve SGR targets could mean that there is minimal funding available for other long-term projects unless there is either scope for an increase in PR Government transfers, or a restoration of the taxes and levies previously made available to PRHTA which are currently the subject of a clawback.

CHAPTER 6 2045 PLAN
Final Report December 2018 | 285
The projected allocation of funding is summarized in Table 6.8 below.
Table 6.8: Forecast of Regional Transportation Funds and Allocation ($000s, 2018 prices)
2019-23 Fiscal Plan
2024-28 TAMP 2029-33 2034-39 2040-45
FHWA FHWA Construction Spend 974,302
FHWA Construction Soft Costs 164,391
FHWA contribution to SGR Pavements & Bridges 510,905 510,905 613,086 613,086
FHWA Safety projects 183,245 183,245 219,894 219,894
State Non-Federal Construction Projects 483,039
Non-Federal Construction Soft Costs 85,512
Construction Local 45,950
State contribution to Interstate and NHS SGR 253,180 129,030 154,836 154,836
State contribution to non-NHS SGR 585,606 627,556 753,068 753,068
Prioritized highways projects 61,488 118,220 149,201 156,416
Traffic signals SGR 66,145 66,145 79,374 79,374
Design 42,131 39,410 39,410 47,292 47,292
Right of Way 58,631 16,500 16,500 19,800 19,800
Total Capital Expenditure - Highways 1,833,529 1,716,479 1,691,012 2,036,550 2,043,765
FTA Transit CIP 115,000
Transit fleet renewal and SGR 25,000 25,000 30,000 30,000
Total Capital Expenditure - Transit 115,000 25,000 25,000 30,000 30,000
Source: SDG analysis of fiscal plan, TAMP and priority project list
Projects considered
Projects considered for the 2045 LRTP are detailed in Appendix H. This list was compiled during the meetings with different committees (primarily the Freight Advisory Committee and the technical committee), list sent in by municipalities and revision of projects in the STIP that will not be completed within the STIP (current STIP project list relevant to San Juan TMA included in Table 6.9 to Table 6.10 and for Bridges and Safety Projects in Table 6.11 to Table 6.13) timeframe (more detail on the list of projects in Appendix H). The list of projects underwent a detailed revision with the Technical Team of the PRHTA to eliminate those projects already considered as part of other streams of funds such as:
• Under construction or will be within the next 5 years as defined in the STIP or thepipeline of the PRHTA; and

CHAPTER 6 2045 PLAN
Final Report December 2018 | 286
• Considered within emergency funding such as the FHWA Emergency funding, DetailedDamage Inspection Reports (DDIR lists) – the lists used are included in Appendix H.
Projects falling within the following classifications were compiled a list of projects that will be candidates for funding under their respective funding allocations:
• Pavement and Bridge Preservation;• Safety (according to Strategic Highway Safety Plan);• Pavement and Bridge Reconstruction• Bridges107;• Transit; and• Intelligent Traffic System.
There is a series of projects identified to be considered for CDBG-DR funding that will potentially have access to additional funds in the short to mid-term; these are:
1. PR-10 (AC-100069, AC-100071, AC-100055, AC-100076) Adjuntas-Utuado; 2. San Lorenzo South Bypass, from PR-183/ PR-181 to PR-745 (AC-918101) San Lorenzo;3. Aguas Buenas North Bypass, from PR-156 East to PR-156 West (AC-020802, AC-020803)
Aguas Buenas; 4. PR-158 Connector, Phase I and Phase II from PR-52 to PR-1, (AC-015802) Cayey;5. PR-122, Lajas-San German Connector from PR-321 to PR-166, (AC-012201) Lajas-San
German;6. PR-18N to PR-21E ramp and Medical Center Connector San Juan; 7. Extension PR-5, from PR-199 to PR-167, Bayamón-Toa Alta;8. Isabela Connector, from PR-472 to PR-112 (AC-047205) Isabela; 9. Expressway Conversion of PR-2 Ponce-Mayagüez; 10. Higuilar Avenue from PR-696 to PR-22/PR-694 Dorado; 11. PR-22 extension, Hatillo- Aguadilla from PR-22/PR-2 to PR-2/PR-111 Hatillo-Aguadilla;12. Cidra Connector, from Avenida Industrial to PR-184 (AC-017242, AC-017246, AC-017247)
Cidra; 13. Relocation of PR-111 from PR-111/PR-448 to PR-111/PR-111R San Sebastián-Lares; 14. Barranquitas Bypass from PR-156 to PR-759 (AC-010194) Barranquitas;15. Villalba Bypass, from PR-151 to PR-150, (AC-556103) Villalba; 16. Improvements to Aguadilla’s Airport Access, from PR-110 to PR-107, includes Burns Street
Connector (AC-000218) Aguadilla;17. Loíza Bypass, from PR-188 to PR-187, (AC-018760) Loíza;18. Widening PR-845, from PR-844 to PR-199, (AC-084511) San Juan-Trujillo Alto; 19. Widening PR-545, from PR-52 to PR-14, Coamo; and20. 1. Peñuelas South Bypass (PR-3132) from its intersection with PR-3132 (Northwest limit) to
existing PR-3121 (Northeast Limit) Peñuelas.
107 The list of bridges from the STIP identified as critical at the moment of this publication is constantly changing and priorities evolve depending on critical finding; hence priorities of funding for interventions on bridges should be able to change as needed and the list of critical projects presented here may change to include more critical bridges; for the full list of bridges in PR (Appendix H).
CHAPTER 6 2045 PLAN
Final Report December 2018 | 287
Additionally, list of vulnerable roads and cycling safety projects are referred to in Appendix H, as these can be apportioned as part of safety, emergency or reconstruction projects. Illustrative major projects requiring funding identification thru P3 alternative and federal loans are included in Appendix J. It is considered a systematic preservation program is continued beyond reaching SGR.
There are initiatives underway for repair work in the entire Island road network such as State Road Modernization Program (PEMOC – in spanish Programa Estatal de Modernización de Carreteras) and “Abriendo Caminos”; the full list of projects under these two initiatives are included in Appendix H.
Other agencies such as the Eastern Federal Lands Highway Division (EFLHD) develop improvement programs including transportation infrastructure. Appendix H includes the FY 2019-2022 EFLHD Transportation Improvement Program for Puerto Rico.
The rest of the projects were considered within the main list of projects which were ranked based on the how these responded to the 2045LRTP Goals and Objectives. Costs were assigned to these projects determining when in time these projects will have funding available. For the San Juan TMA, the projects and their expected year of construction start are included in Table 6.14 to Table 6.17 for the Medium to Long Term periods.
These projects have been assigned based on the ranking (Appendix H) and funding available; nonetheless, if additional funding becomes available these could be developed at an earlier stage.

CHAPTER 6 2045 PLAN
Final Report December 2018 | 288
Table 6.9: List of San Juan TMA projects in STIP Short Term (2017-2020)
AC # Description Municipality STIP Total Costs
000259 Construction of Noise Barrier, Los Almendros Development, PR-22 km 12.2 to km 12.7 Bayamon $787,750
000533 Environmental Study Extension PR-5 From PR-199 to PR-167 Bayamon $2,076,369
010166 Additional Funds for the Construction of a new Recreational Trail for Bicycles and Pedestrians from Rio Bayamon to PR-165 Toa Baja $1,000,000
010194 Barranquitas South Bypass LP-9999(189) Barranquitas $300,000
015801 Construction of PR-158, from PR- 743 to Parque Tecnológico Entrance - Phase 1 Cayey $13,000,000
015802 Construction of PR-158, from Parque Tecnológico to PR-1, Cayey - Phase 2 Cayey $1,306,583
017242 Cidra East Connector form #2 Street (Industrial Avenue) to PR-734 (Phase 1) Length 1.38 Cidra $3,000,000
018760 Feasibility Study and Design PR-187 Bypass Feasibility and Update Environmental Study South Bypass from PR-188 to Mediania Baja (PR-187) (CFHWA) Loíza $1,494,103
019143 Replacement of Bridge #194 PR-31 km 8.8 Naguabo $7,289,814
020802 Aguas Buenas Bypass from PR-156, KM 53 to PR-173, Length 3.1 Aguas Buenas $2,275,000
084511 Widening PR-845 from Pasternak Street to Int. PR-199 San Juan / Trujillo Alto $375,000
300124 Congestion Managed Lanes - Phase 5 - PR-30-San Juan (km 0.30 to km. 7.20) - reversible lane using reversible lane barrier system on PR-30 from Km. 0.30 to Km. 7.20
San Juan / Trujillo Alto / Caguas $7,521,640
301133 Additional Funds for the Feasibility Study RFP - Improvements PR-3 Río Grande - Fajardo Corridor Including Access Management Plan from its intersection with PR-66 Municipality of Rio Grande to its intersection with PR-53 Municipality of Fajardo
Rio Grande / Fajardo $764,169
520130 Congestion Managed Lanes -Phase 1 - PR-52 -San Juan (km.0.30 to km. 9.16) - Two additional lanes on the median of PR-18 and PR-52 from San Juan to Caguas. These lanes will be managed using dynamic tolling to provide a reliable travel time for users. These lanes will be reversible (AM northbound and PM
San Juan / Trujillo Alto / Caguas $32,369,532
800480 Technical Studies NEPA San Lorenzo Bypass from PR-181 Int. PR-183 to PR- 181 Int. PR-9912 (AC-918101) San Lorenzo $478,149
800497 New Connector (Cancer Comprehensive Center) between PR-18 and PR-21 (includes new bridge over PR-18 and a new ramp from PR-18 to PR-21) San Juan $24,525,750

CHAPTER 6 2045 PLAN
Final Report December 2018 | 289
AC # Description Municipality STIP Total Costs
800508 Congestion Managed Lanes - Phase 4 - PR-52 /PR-30 - Caguas (km. 13.96 to km 16.63) - Improve the PR-52/PR-30 Interchange by providing a bridge interconnecting both roadways. The bridge will improve access from PR-1 to PR-52 northbound for all users, and provide access from PR-30 to PR-52 (AM) and from PR-52 to PR-30 (PM) for users of the dynamic toll facility. This phase will also provide open road tolling at the Caguas Norte Toll Plaza.
San Juan / Trujillo Alto / Caguas $28,039,829
800509 Congestion Managed Lanes - ITS (All Phases) - will provide ITS instrumentation for all phases of the Congestion Managed Lanes projects for the operation of the dynamic toll and traffic incident management.
San Juan / Trujillo Alto / Caguas $11,736,421
800510 Congested Managed Lanes - Noise Barriers - Vista Alegre Community, Borinquen Gardens, Parque Forestal, Berm- Residential Area, Quintas de San Luis, Berm-Villa Parana - will provide the noise abatement measures recommended as part of the environmental exclusion document prepared for the Congestion Managed Lanes project.
San Juan / Trujillo Alto / Caguas $5,375,345
800523 Noise Barriers at PR-22 Paco Davila km 19.2 - km 19.5, El Patio km. 16.5 - km 17.1, Monte Claro km.14.1 - km 14.6, Rio Hondo 1 km. 12.8 - km 13.6 (Eastbound), Rio Hondo 2 km. 13.0 - km 13.25 (Westbound), Rio Hondo 3 km. 12.5 - km 12.9
Bayamon / Toa Alta $3,345,496
TOTAL $147,060,950
Source: STIP 2017-2020; Feb 2018
Table 6.10: List of Island-wide projects in STIP Short Term (2017-2020)
AC # Description STIP Total Cost
800474 Rehabilitation of Complex Bridge #300, Naranjito $13,341,876
800477 PR-52 from km 66 to km 71.6 to km 77 $32,172,982
900123 SPR-54 - State Planning and Research Program (2017) $6,000,000
900124 Bridge Critical Findings (2017) ROW - Bridge #547 over Cruz Creek at PR-824, km 2. 8, Toa Alta; Construction - Bridge #547 over Cruz Creek at PR-824, km 2. 8, Toa Alta ROW - Bridge #780 over Matrullas River at PR-143, km 36, Orocovis ROW - Bridge #2314 over Cayaguas River, off PR-902, km 0.1, San Lorenzo
$579,434
990133 Intelligent Transportation System (ITS) (2017) Reversible Lane Barrier Operation PR-18 and PR-52 $900,000
992477 Bridge Inventory System NBIS (33) (2018) $1,874,961
990134 Upgrade of Safety Devices in the Highway System (2017) PR-66 km 0 to km 20 $7,173,465

CHAPTER 6 2045 PLAN
Final Report December 2018 | 290
AC # Description STIP Total Cost
990135 Island-wide Road wide Traffic Signals, Pavement Marking, Signing and Geometric Safety Improvements Projects (2017) PR-52, from km 49 to km 52.3, Salinas -PR-52, from km 55.3 to km 61, Salinas -PR-20 from km 0 to km 10, Guaynabo -PR-152 from km 0 to km 11.5, Barranquitas - Naranjito PR-152 km 13.65 to km 20.5, Barranquitas - Naranjito
$27,431,780
800485 Pavement Rehabilitation and Reconstruction of Roads (2018) $50,211,087
800486 Rehabilitation and Replacement of Bridges (2018) $9,316,000
900128 SPR-55 - State Planning and Research Program (2018) $6,000,000
900129 Bridge Critical Findings (2018) Island-wide $6,268,000
990146 Intelligent Transportation System (ITS) (2018) $2,375,000
800487 Systematic Bridges Preservation Program (2018) $3,094,000
992478 Bridge Inventory System NBIS (33) (2019) $1,791,141
800493 Implementation of Strategic Highway Safety Plan (2018) $2,500,000
990144 Upgrade of Safety Devices in the Highway System (2018) $14,356,261
990145 Island-wide Road wide Traffic Signals, Pavement Marking, Signing and Geometric Safety Improvements Projects (2018) $6,459,210
990152 Highway Safety Improvements - Puerto Rico Section 154 and 164 Penalty (HSIP- Eligible Activities) (2018) $3,800,000
800511 Pavement Rehabilitation and Reconstruction of Roads (2019) $14,820,069
800512 Rehabilitation and Replacement of Bridges (2019) $13,307,000
900132 SPR-56 - State Planning and Research Program (2019) $6,000,000
990153 Intelligent Transportation System (ITS) (2019) $3,400,000
900133 Bridge Critical Findings $2,800,000
992479 Bridge Inventory System NBIS (33) (2020) $1,750,000
800514 Island-wide Road wide Traffic Signals, Pavement Marking, Signing and Geometric Safety Improvements Projects (2019) $12,519,684
800515 Implementation of Strategic Highway Safety Plan (2019) $6,000,000
990155 Upgrade of Safety Devices in the Highway System (2019) $13,454,000
990154 Highway Safety Improvements - Puerto Rico Section 154 and 164 Penalty (HSIP- Eligible Activities) (2019) $3,800,000
800516 Rehabilitation and Replacement of Bridges (2020) $12,490,000

CHAPTER 6 2045 PLAN
Final Report December 2018 | 291
AC # Description STIP Total Cost
800518 Pavement Rehabilitation and Reconstruction of Roads (2020) $40,107,356
900134 Upgrade of Safety Devices in the Highway System (2017); PR-66 km 0 to km 20 $6,000,000
900135
Island-wide Road wide Traffic Signals, Pavement Marking, Signing and Geometric Safety Improvements Projects (2017) PR-52, from km 49 to km 52.3, Salinas - PR-52, from km 55.3 to km 61, Salinas - PR-20 from km 0 to km 10, Guaynabo - PR-152 from km 0 to km 11.5, Barranquitas - Naranjito PR152 km 13.65 to km 20.5, Barranquitas - Naranjito
$3,594,000
990156 Intelligent Transportation System (ITS) (2020) $5,736,842
TBD Upgrade of Safety Devices in the Highway System (2019) NBISNBIS $2,000,000
800519 Upgrade of Safety Devices in the Highway System (2020) $5,000,000
800520 Implementation of Strategic Highway Safety Plan (2020) $3,801,628
800521 Island-wide Road wide Traffic Signals, Pavement Marking, Signing and Geometric Safety Improvements Projects (2020) $24,948,372
990157 Highway Safety Improvements - Puerto Rico Section 154 and 164 Penalty (HSIP- Eligible Activities) (2020) $3,800,000
TOTAL $380,974,148
Source: STIP 2017-2020; Feb 2018
Table 6.11: List of San Juan TMA Bridge Projects STIP (2017-2020)
Bridge ID Road Km Municipality Costs
547 PR 824 2.80 Toa Alta $ 523,820
1058 PR 9912 0.10 San Lorenzo $ 1,698,000
3000 PR 5 18.75 Naranjito $ 13,225,001
780 PR 143 36.00 Orocovis $ 98,000
2314 Off PR 902 0.10 San Lorenzo $ 195,000
1131 PR 29 Eastbound 1.40 Bayamón $ 2,885,000

CHAPTER 6 2045 PLAN
Final Report December 2018 | 292
Bridge ID Road Km Municipality Costs
1343 Local Road 0.20 San Lorenzo $ 196,000
2511 PR 9916 0.02 San Lorenzo $ 290,000
1132 PR 29 Westbound 1.40 San Lorenzo $ 2,677,000
1657 PR 861 11.00 Toa Alta $ 2,500,000
122 PR 3 68.10 Naguabo $ 3,500,000
1130 PR 145 1.00 Ciales $ 5,845,000
2508 PR 913 1.10 San Lorenzo $ 126,000
443 PR 951 4.90 Loíza $ 335,000
176 PR 14 57.25 Aibonito $ 238,000
574 PR 971 17.30 Naguabo $ 250,000
2479 PR 174 14.00 Bayamón $ 2,622,000
Source: STIP 2017-2020; Feb 2018
Table 6.12: List of San Juan TMA Safety Projects STIP (2017-2020)
Program/Project Municipality Costs AC- 990134 Upgrade of Safety Devices in the Highway System
Upgrade of Safety Devices in the Highway System PR-66 km 0 to km 20 Carolina - Canóvanas $7,173,465 AC-990135 Safety Improvements Island-wide
Safety Corridor PR-20 Km 0 to km 10 Guaynabo $16,976,051
Safety Improvements PR-152 from km 0 to km 11.5 Barranquitas / Naranjito $1,980,001
Safety Improvements PR-152 from km 13 to km 20.5 Barranquitas / Naranjito $1,375,001
AC-990145 Safety Improvements Island-wide Safety Corridor PR-173 km 0 @ km 9 Aibonito - Cidra $2,025,940
AC-800493 SHSP Funds
Safety Corridor PR-152 Km 11 @ Km 13.5 Barranquitas - Naranjito $3,800,000
AC-990155 Upgrade of Safety Devices in the Highway System

CHAPTER 6 2045 PLAN
Final Report December 2018 | 293
Program/Project Municipality Costs Safety Corridor PR-167 km 0 @ km 9 Comerío $4,170,000 Safety Corridor PR-52 Km 38 @ Km 49 Cayey - Salinas $9,284,000
AC-800514 Safety Improvements Island-wide Safety Corridor PR-149 Km 0 @ Km 12.8 Manatí - Ciales $4,269,684 Geometric Improvements on De Diego Avenue (PR-37) San Juan $2,250,000
AC-800519 Upgrade of Safety Devices in the Highway System Safety Corridor PR-137 KM 0 @ 9 Vega Baja - Morovis $5,000,000
AC-800521 Safety Improvements Island-wide Safety Corridor PR-203 Km 0 @ Km 7.1 Gurabo - San Lorenzo $6,196,000 Safety Corridor PR-189 KM 0 @ 11 Gurabo $4,000,000 Safety Corridor PR-176 Km 0 @ Km 4 San Juan $1,100,000 Safety Corridor PR-183 Km 0 @ Km 10 Caguas - San Lorenzo $5,406,372
AC-800520 SHSP Funds Geometric and Safety Improvements Intersection PR-29 Bayamon $1,000,000
Source: STIP 2017-2020; Feb 2018
Table 6.13: List of Island-wide Safety Projects STIP (2017-2020)
Program/Project Municipality Region Costs
RFP SHSP Update and Implementation All Island-wide $ 2,500,000
Source: STIP 2017-2020; Feb 2018
Table 6.14: List of San Juan TMA Committed Projects; Mid Term (2021-2030)
Project Name Reference Cost Municipality Start
Date Feasibility Study, Capacity Increase of PR-181 $400,000 Trujillo Alto 2025
Construction of Ramp PR-22 and Avenue Trio Vegabajeño (Ramps side west for the PR-22 with the Avenue Trio Vegabajeño) $1,500,000 Vega Baja 2029
Feasibility Study, PR-28 km 0-6 Improvements to heavy traffic mobility $900,000 Bayamón, Guaynabo, San Juan 2029
Feasibility Study, PR-37 to manage cargo $900,000 San Juan 2029

CHAPTER 6 2045 PLAN
Final Report December 2018 | 294
Project Name Reference Cost Municipality Start
Date Reconstruction, PR-15 KM 24.9-25.7 $531,589 Cayey 2029
Feasibility study and reconstruction to elevate pedestrian bridge over PR-18 $2,000,000 San Juan 2029
Environmental Study/ROW/Design/Construction start-up, Extension PR-5 From PR-199 to PR-167 (AC-000533) $82,400,000 Bayamon 2029
Source: PRHTA technical team with SDG support
Table 6.15: List of Island-wide Committed Projects; Mid Term (2021-2030)
Project Name Reference Cost Municipality Start Date
Vulnerability Study, Island-wide 1,000,000 Island-wide 2029
Source: PRHTA technical team with SDG support
Table 6.16: List of San Juan TMA Committed Projects; Mid to Long Term (2031-2040)
Project Name Reference Cost Municipality Start Date
Feasibility and Update Environmental Study, South Bypass from PR-188 to Mediania Baja (PR-187) (CFHWA) (AC-018760) $10,650,000 Loíza 2034
Construction Cidra East Connector form #2 Street (Industrial Avenue) to PR-734 (Phase 1) Length 1.38 (AC-017242) $18,000,000 Cidra 2034
Feasibility Study, Improvements at intersection of PR-5 with PR-24 $900,000 Cataño 2036
Route Location and NEPA Process Compliance, Higuillar Avenue extension to PR-22 $2,000,000 Dorado 2036
Feasibility Study, PR-865 and PR-2 Elevated intersection $1,000,000 Toa Baja 2036
Completion of Cidra connector from PR-734 to PR-1 and PR-7787 Phase II $666,127 Cidra 2036
Completion of Cidra connector from PR-734 to PR-1 and PR-7788 Phase III; $395,513 Cidra, Cayey 2036
Tunel Minillas conditions assessment $1,000,000 San Juan 2036
Construction, Cayey Connector, Connector PR-15, phase II (from Parque Tecnológico PR-1, Cayey Connector PR-158) (AC-015802) $12,000,000 Cayey 2036
Study to evaluate evacuation route to the Húcares Community (detour from the Húcares Parcelas to PR-3) $208,165 Naguabo 2037
ROW and Construction, Barranquitas South Bypass (From PR-156 to PR-719) (AC-010194) $12,600,000 Barranquitas 2037
ROW and Construction, Isabela Connector from PR-472 to PR-113 (AC-100055) $42,195,000 San Juan 2037

CHAPTER 6 2045 PLAN
Final Report December 2018 | 295
Project Name Reference Cost Municipality Start Date
Feasibility Study, Collector PR-30 - widening $900,000 Gurabo 2038
Source: PRHTA technical team with SDG support
Table 6.17: List of San Juan TMA Committed Projects; Long Term (2041-2045)
Project Name Reference Cost Municipality Start Date
Route Location and NEPA Compliance Study, PR-9187, Rio Grande; Int PR-3 with PR-187 and PR-956 to PR-3 $1,000,000 Río Grande 2041
Construction, Aguas Buenas Bypass from PR-156, km 53 to PR-173, Length 3.1 km (AC-020802) $36,000,000 Aguas Buenas 2041
Feasibility Study, PR-203 Extension $900,000 San Lorenzo 2041
ROW and Construction, Widening PR-845 from Pasternak Street to Int. PR-199 (AC-084511) $4,650,000 Trujillo Alto 2045
Feasibility Study, new construction of PR-183 to PR181 Int. PR-9912 $2,000,000 San Lorenzo 2045
Feasibility Study, Access Ramp to Country Estate, PR-167 $900,000 Bayamon 2045
Feasibility Study, Access/Exit Ramps to/from AEMEAD to/from PR-6 $900,000 Bayamon 2045
Yabucoa Connector (completing the connector between Calle Cataina Morales and Avenida Los Veteranos) $208,1645 Yabucoa 2045
Source: PRHTA technical team with SDG support

CHAPTER 6 2045 PLAN
Draft Report December 2018 | 296
2045 Models
Using the calibrated 2016 model and updating the socioeconomic inputs for 2045; 2045 scenarios models were prepared. These included the base scenario considering:
• No changes in the roadway network (No-Build Scenario);• The scenario considering the committed roadway projects (2045 Existing and Committed
(E+C); and• The scenario with committed projects plus the new construction projects included in the
Fiscal Plan as strategic/P3 projects (2045 E+C plus PR-22 and PR-5).
2045 No-Build (Do-Nothing Scenario)
Land use patterns, growths in population and employment, and trends in travel patterns will affect the demand on the Region’s transportation system in different ways. In order to understand the future demands on the transportation system for the 2045 LRTP, a No-Build scenario in 2045 travel demand situation was firstly analyzed. The No-Build condition in 2045 assumes that there are no improvements to the existing transportation system in the next 27-year horizon. Only the land use patterns, population, and employment are changed based upon our socioeconomic forecasts presented in Chapter 2. Table 6.18 presents the statistics of performance measures of the 2045 No-Build and the results comparisons to the Base Case.
With the long-term decrease of population and employment, in 2045, the person trips and vehicle trips within San Juan TMA have reduced by approximately 20% and 21%, respectively. Trucks trips also decreased by 12%. Therefore, the vehicle miles traveled and fuel consumption decreased as well.
Both vehicle hours traveled and vehicle miles traveled on the roadway segment with volumes exceeding its capacity in San Juan dropped significantly by over 40%. The average travel speed on the overall roadway system and on the limited access roads increased. These results indicate a better highway level of service (LOS) in 2045 without any improvements to transportation system.
Due to the improved highway LOS, the overall transit shares in San Juan slightly decrease by 0.2%.

CHAPTER 6 2045 PLAN
Final Report December 2018 | 297
Table 6.18: Summary of 2045 No-Build Scenario in San Juan TMA
Measures of Effectiveness Base Case (2016) 2045 No-Build % Change (No-Build vs. Base Case)
System Performance Average network speed (mph) 23.5 25.5 8.6% Total transit passengers per route mile 26.1 19.2 (26.4%) % non-motorized trips 4.0% 4.4% 9.3% % transit trips 3.2% 3.0% (6.2%) Average highway trip cost $0.79 $0.80 1.1% Average transit trip cost $1.20 $1.20 (0.6%) % Population within 0.5-mile walk to transit 25.4% 25.4% 0.0% % Employment with 0.5-mile walk to transit 43.1% 43.1% 0.0% Vehicles hours of delay 249,780 147,319 (41.0%) Vehicle hours of travel/1000 vehicle miles of travel 42.6 39.3 (7.9%) VMT above capacity 884,364 462,431 (47.7%) Speed on limited access roads and expressways 29.7 32.5 9.2% Gallons of fuel consumed 1,498,478 1,285,560 (14.2%) System Usage Vehicle miles of travel 34,614,850 29,696,425 (14.2%) Vehicle hours of travel 1,475,628 1,165,839 (21.0%) Average network speed 23.5 25.5 8.6% Person trips 4,361,830 3,501,362 (19.7%)
Vehicular trips 3,212,353 2,542,713 (20.8%)
Truck trips 162,543 142,535 (12.3%)
Source: SDG analysis of 2045 No-Build scenario on PRHTA Island-wide Model

CHAPTER 6 2045 PLAN
Draft Report December 2018 | 298
2045 Existing and Committed (E+C) Scenario
This model considers the list of projects presented in Table 6.19. This model considers the effect of the road improvement project in the roadway network.
Table 6.19: Committed Projects reflected in the 2045 modeling
SAN JUAN TMA
Construction of Ramp PR-22 and Avenue Trio Vegabajeño (Ramps side west for the PR-22 with the Avenue Trio Vegabajeño)
Construction Cidra East Connector form #2 Street (Industrial Avenue) to PR-734 (Phase 1) Length 1.38 (AC-017242)
Completion of Cidra connector from PR-734 to PR-1 and PR-7787 Phase II
Completion of Cidra connector from PR-734 to PR-1 and PR-7788 Phase III;
Construction, Cayey Connector, Connector PR-15, phase II (from Parque Tecnológico PR-1, Cayey Connector PR-158) (AC-015802)
ROW and Construction, Barranquitas South Bypass (From PR-156 to PR-719) (AC-010194)
ROW and Construction, Isabela Connector from PR-472 to PR-113 (AC-100055)
Construction, Aguas Buenas Bypass from PR-156, km 53 to PR-173, Length 3.1 km (AC-020802)
ROW and Construction, Widening PR-845 from Pasternak Street to Int. PR-199 (AC-084511)
Yabucoa Connector (completing the connector between Calle Cataina Morales and Avenida Los Veteranos)
Source: PRHTA technical team with SDG support
The 2045 E+C scenario results (Table 6.14) in the trips shift away from roadway to transit in San Juan TMA. Vehicle trips reduced by approximately 11,600 in an average weekday compared to the No-Build scenario. This represents an increase in passengers per route mile by approximately 12%.
The overall mode share of transit trips within the San Juan TMA on an average weekday was increased from 3.0% in the No-Build scenario to 3.5%. This mode shift occurs in tandem with increases in roadway travel speeds. This result indicates that local bus services in San Juan are also benefitting from the increase roadway travel speed by being faster and more reliable, mitigating some of the potential mode shift away from transit.
The incremental impacts of both highway and transit improvements causes a significant decrease in VMT above capacity by approximately 29%. The overall VMT and VHT decrease and the average
roadway network speeds increase. All these suggest that highway LOS is improving (Figure 6.35 to Figure 6.36). Figure 6.33 through Figure 6.34 show the average weekday traffic and the volume-to capacity ratios of the 2045 Existing Plus Committed scenario in broader San Juan TMA and in the central area of San Juan, respectively.

CHAPTER 6 2045 PLAN
Final Report December 2018 | 299
Figure 6.33: 2045 Traffic on The Existing Plus Committed Network

CHAPTER 6 2045 PLAN
Final Report December 2018 | 300
Figure 6.34: 2045 Traffic on The Existing Plus Committed Network Central Area
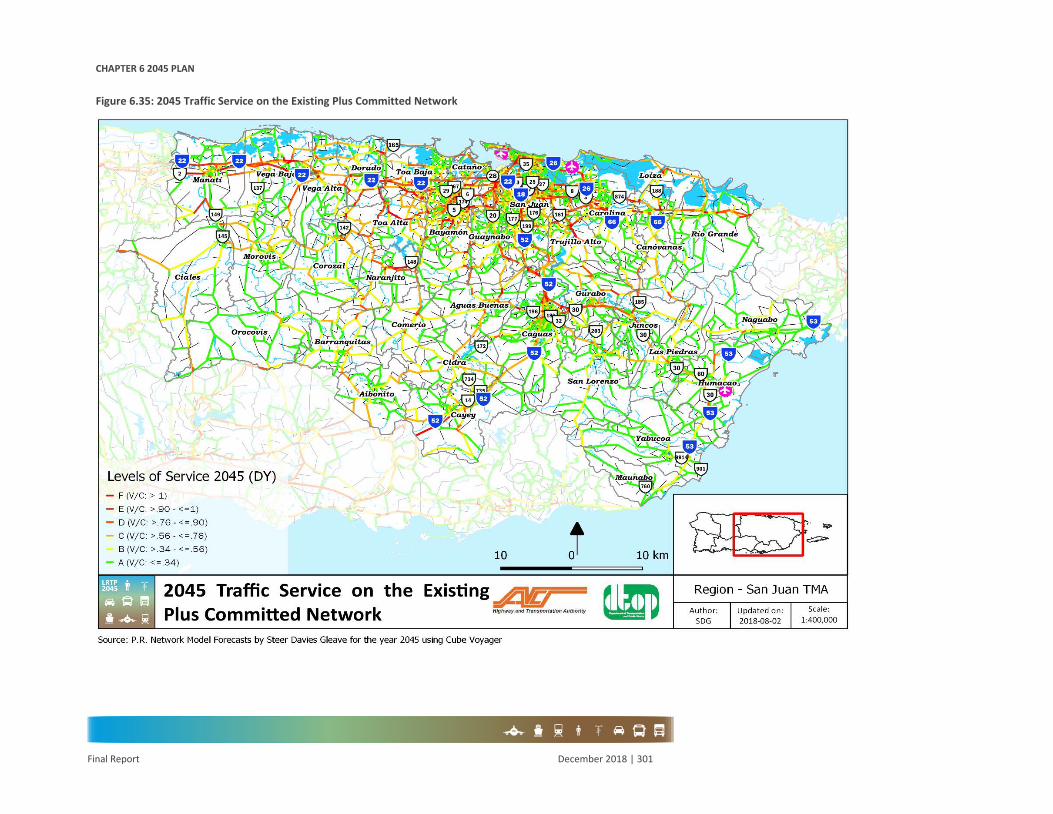
CHAPTER 6 2045 PLAN
Final Report December 2018 | 301
Figure 6.35: 2045 Traffic Service on the Existing Plus Committed Network
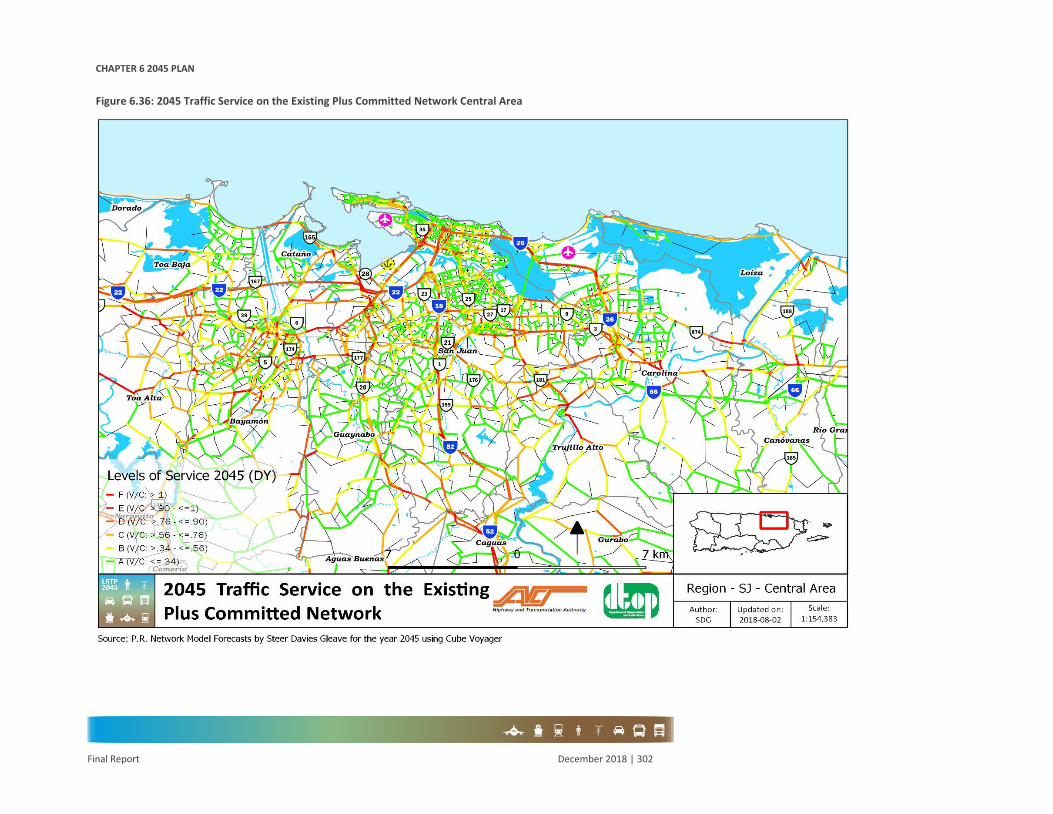
CHAPTER 6 2045 PLAN
Final Report December 2018 | 302
Figure 6.36: 2045 Traffic Service on the Existing Plus Committed Network Central Area

CHAPTER 6 2045 PLAN
Final Report December 2018 | 303
2045 PR-22 Extension + PR-5 Extension
This scenario considers the E+C plus the strategic/P3 projects for extensions of PR-22 from Hatillo to Camuy and PR-5 Toa Alta to Bayamón.
The results of this scenario are shown in Table 6.20. Overall in the San Juan TMA, approximately 10,700 vehicle trips are eliminated in this scenario. Traffic shifts to transit in San Juan due to the transit improvements in the Region. As a result, the transit passengers per route miles an approximate uplift in transit passengers of 11%. There is a slight decrease in trip lengths due to the transit scenario, suggesting that, on average, the shorter drive trips are shifting to transit. The impact of the E+C scenario is an overall decrease in vehicle trip length.
Figure 6.37 and Figure 6.38 show the average weekday traffic of this scenario while Figure 6.39 and Figure 6.40 present the roadway level of service in San Juan TMA and in the central area, respectively.

CHAPTER 6 2045 PLAN
Final Report December 2018 | 304
Table 6.20: Summary of 2045 Scenarios in San Juan TMA
Measures of Effectiveness 2045 No Build 2045 E+C
% Change (E+C vs. No-
Build)
2045 PR-22 Ext. & PR-5
Ext
% Change (PR-22 Ext & PR-5 Ext
vs. No-Build)
System Performance Average network speed (mph) 25.5 25.7 0.8% 25.6 0.4% Total transit passengers per route mile 19.2 21.4 11.5% 21.3 11.3% % non-motorized trips 4.4% 3.9% (11.1%) 3.9% (11.1%) % transit trips 3.0% 3.5% 14.8% 3.4% 14.3% Average highway trip cost $0.80 $0.79 (1.1%) $0.79 (1.1%) Average transit trip cost $1.20 $1.20 0.4% $1.20 0.4% % Population within 0.5-mile walk to transit 25.4% 25.6% 0.9% 25.6% 0.9% % Employment with 0.5-mile walk to transit 43.1% 44.9% 4.1% 44.9% 4.1% Vehicles hours of delay 147,319 131,584 (10.7%) 131,103 (11.0%) Vehicle hours of travel/1000 vehicle miles of travel 39.3 39.0 (0.8%) 39.1 (0.4%) VMT above capacity 462,431 329,373 (28.8%) 347,922 (24.8%) Speed on limited access roads and expressways 32.5 33.1 1.9% 32.8 1.1% Gallons of fuel consumed 1,285,560 1,272,785 (1.0%) 1,265,879 (1.5%) System Usage Vehicle miles of travel 29,696,425 29,401,330 (1.0%) 29,241,794 (1.5%) Vehicle hours of travel 1,165,839 1,145,240 (1.8%) 1,142,996 (2.0%) Average network speed 25.5 25.7 0.8% 25.6 0.4% Person trips 3,501,362 3,501,481 0.0% 3,501,592 0.0%
Vehicular trips 2,542,713 2,531,138 (0.5%) 2,532,040 (0.4%)
Truck trips 142,535 142,542 0.0% 142,568 0.0%
Sources: SDG analysis of 2045 scenarios on PRHTA Island-wide Model

CHAPTER 6 2045 PLAN
Final Report December 2018 | 305
Figure 6.37: 2045 Traffic on the Existing Plus Committed Strategic Projects PR-22 & PR-5

CHAPTER 6 2045 PLAN
Final Report December 2018 | 306
Figure 6.38: 2045 Traffic on the Existing Plus Committed Strategic Projects PR-22 & PR-5 Central Area

CHAPTER 6 2045 PLAN
Final Report December 2018 | 307
Figure 6.39: 2045 Traffic Service on the Existing Plus Committed Strategic Projects PR-22 & PR-5

CHAPTER 6 2045 PLAN
Final Report December 2018 | 308
Figure 6.40: 2045 Traffic Service on the Existing Plus Committed Strategic Projects PR-22 & PR-5 Central Area

CHAPTER 7 POLICY GUIDELINES TOWARD THE TRANSPORTATION INFRASTRUCTURE
Final Report December 2018 | 309
The DTPW along with its affiliated agencies, the PRHTA and the Puerto Rico MPO face an unprecedented future that requires policy direction. This 2045 LRTP update, by following the national transportation goals, emphasizing in safety (reduce fatalities), improving asset conditions to state of good repair, reducing congestion, improving freight mobility, and maintaining the environment and air quality. This section mentions policies defined to address these challenges in the incoming future.
This chapter is divided into 6 sections:
1. New TSM&O Technologies for Next 5 Years;2. Congestion Management Process;3. Freight;4. Safety and Security;5. Environment and Sustainability; and6. Looking Forward.
NEW TSM&O TECHNOLOGIES FOR NEXT 5 YEARS Transportation Systems Management and Operations: Recent ITS Developments and Future Needs
This section provides an overview of recent ITS developments in Puerto Rico, as well as upcoming projects – both in place and recommended for the next 5 years. It also touches on mobility of the future, and how any new technologies should be firmly focused on the end-user and their needs. Topics include:
• Advanced Traffic Signals Systems;• Traffic Incident Management and Traveler Information Dissemination;• Travel Time Reliability Improvement;• Highway Safety Patrol Program (SEGURO); and• Intelligent Mobility and Disruption.
7 CHAPTER 7 POLICY GUIDELINES TOWARD THE TRANSPORTATION INFRASTRUCTURE

CHAPTER 7 POLICY GUIDELINES TOWARD THE TRANSPORTATION INFRASTRUCTURE
Final Report December 2018 | 310
The Puerto Rico DTPW and the PRHTA during recent years have performed several activities to move forward with the implementation of the Transportation Systems Management and Operations (TSM&O) Program in the San Juan TMA, and other urbanized areas in Puerto Rico. The most important activities related to the TSM&O Program performed in recent years are presented in Figure 7.1.
Figure 7.1: TSM&O Program Development Timeline
Source: PRHTA
During summer 2015, the PRHTA completed the revision to the San Juan Metropolitan Area ITS Regional Architecture which is the cornerstone of the implementation of ITS in the San Juan TMA. The resulting document contains a detailed evaluation of the Region’s needs, capabilities, as well as a roadmap on how to fulfill those needs. This road map is comprised of several infrastructure projects and implementation of services and protocols, in order to reach the Region’s established transportation goals.
The needs identified for the San Juan TMA Region provided an initial framework of the areas for project implementation. These are included below:
• Traffic Management:• Effectively manage arterials system-wide;• Improve traffic flow monitoring;• More widespread centralized computer control;• Improve ability to remotely modify signal timing;• Reduce emergency vehicle delays at signals;• Improve detection of incidents on roadways;• Improve management of incident response;• Improve inter-jurisdictional continuity for traffic management;• Upgrade signal hardware;• Improve signal coordination;• Better management of periods of high traffic demand;• Improve the quality real-time congestion information;• Communicate with adjacent cities;• Monitor emissions and air conditions along roadways;• Improve control of lighting along roadways;• Automate local parking management;• Enable regional coordination for parking;• Monitor vehicular speed along highways and arterials;• Improve management of roadway closures; and

CHAPTER 7 POLICY GUIDELINES TOWARD THE TRANSPORTATION INFRASTRUCTURE
Final Report December 2018 | 311
• Alert drivers to approaching roadway hazards.
• Electronic Payment:• Capability for drivers to pay tolls without stopping their vehicles (open road tolling);
and• Integration of electronic payment for transit, toll roads, and parking.
• Regional Traveler Information:• Provide real time congestion information;• Provide real time transit vehicle arrival/departure information;• Expand traveler information delivery methods;• Disseminate static and real-time traffic information through a variety of methods;• Improve/simplify procedure to obtain travel information;• Provide information to private information service providers;• Better road construction information;• Provide in-route traveler information; and• Improve inter-agency operational data sharing and coordination.
• Transit Management:• Improve regional trip planning;• Improve patron safety (in-vehicle and at stations);• Implement transit vehicle location and tracking;• Implement transit dispatching and management;• Implement automatic passenger counting;• Coordinate with roadway agencies regarding incident and construction information;• Implement Transit Signal Priority at signalized intersections; and• Enable real-time transit information, including dissemination/display of bus
arrival/departure times.
• Maintenance and Construction Operations:• Provide location and tracking of maintenance vehicles and field equipment;• Improve provision of real-time information on maintenance and construction
activities to the public and other agencies;• Increase application of smart work zone technology to provide real-time work zone
information and increase safety for field staff;• Improve coordination of construction and maintenance activities;• Improve fleet management and vehicle diagnostic capabilities;• Increase application of portable traffic control devices;• Coordinate traffic control plans among different agencies and jurisdictions; and• Improve weather data collection and processing capabilities.
• Emergency Management:• Increase broad understanding of existing incident management procedures;• Improve incident detection and verification;

CHAPTER 7 POLICY GUIDELINES TOWARD THE TRANSPORTATION INFRASTRUCTURE
Final Report December 2018 | 312
• Improve coordination of incident response;• Improve real-time traveler information regarding incidents, special events, and
emergencies; and• Sharing of real-time and data to support inter-agency incident and emergency
response.
• Commercial Vehicle Operations:• Review opportunities for CVISN implementation; and• Explore opportunities for Weigh-In-Motion sensors.
• Advanced Traffic Signal Systems:
In 2010, the PRHTA started with the modernization of many of the traffic signal systems around the Island to improve the safety and operation of signalized intersections. This effort started with the update of traffic signal systems on highway PR-2 from Moca to Hormigueros on the west-northwest area of Puerto Rico. These projects consisted in setting up modern traffic signals components, including controllers, to allow for remote systems configuration and monitoring. The projects also included the installation of other devices, such as CCTV surveillance cameras and microwave radar vehicle detection systems for queue detection and intersection surveillance. All these devices were interconnected via wireless communication which in turn connect via other means to the Traffic Management Center (TMC), located in San Juan.
Other projects developed as part of the traffic signal update effort included:
• PR-2 from Hatillo to Isabela;• PR-3 from Rio Grande to Fajardo;• Rio Mar – including PR-1, PR-25, and PR-35 in San Juan;• PR-1 from San Juan to Caguas;• PR-23 from San Juan to Guaynabo;• PR-181 from San Juan to Trujillo Alto; and• PR-199 from Trujillo Alto to Guaynabo.
These projects were completed or at advance construction stages as of late 2017. In Q1 2016, as part of the TSM&O Program activities, the PRHTA started the evaluation of the traffic signals systems operation on the PR-2 Moca to Hormigueros section with the purpose of performing a signal timing optimization project. This effort however was not able to be completed due to several problems that were affecting the remote communication with ITS devices, which disturbed configuration and monitoring capabilities. During this period, the PRHTA also started the procurement of a Preventive Maintenance and Emergency Repair Services contract to improve the uptime and upkeep of the ITS devices installed as part of the traffic signals systems update projects.
On September 2017, Puerto Rico was affected by hurricanes Irma and María, which rendered most of the traffic signals systems inoperable due to the lack of electrical power in the Island. Other impacts associated with the hurricanes include the displacement of wireless communication antennas affecting the communication line of sight, rendering the ITS network inoperable. Taking

CHAPTER 7 POLICY GUIDELINES TOWARD THE TRANSPORTATION INFRASTRUCTURE
Final Report December 2018 | 313
into consideration these situations, the PRHTA will perform an evaluation on how to restore the advanced traffic signal systems network. This evaluation will take into consideration the lessons learned from recent atmospheric events to improve its resiliency.
Once this evaluation is performed, the PRHTA plans to modify the traffic signals systems project delivery procedures to implement a systems engineering approach. Based on this new method, the PRHTA will continue to implement advanced traffic signal systems on the most important corridors but the focus of the project delivery will shift towards improving the testing, verification, and validation of the systems being implemented. Another important aspect is that the PRHTA will provide special emphasis on measuring the performance of the signalized corridors to reduce delays and improve mobility.
Deployment of ITS Devices for Traffic Incident Management and Traveler Information Dissemination
As mentioned, recently the focus of the TSM&O Program has been to improve the management of events that affect travel time reliability. The effort to improve the management of these events can be divided in two categories: (i) implementation of ITS technologies to aid in the management of traffic incidents, and (ii) the deployment of services and protocols to expedite traffic incident clearance.
The implementation of ITS technologies to aid in the management of traffic incidents began with the deployment of advanced traffic signal systems. These projects included the installation of CCTV cameras, and microwave radar vehicle detection systems which the PRHTA leveraged the TMC personnel to identify incidents on signalized roads and expressways/freeways. This approach, however, was altered due to the impacts of Hurricane María on September 2017. Due to the loss of communication with ITS field devices most of the installations were rendered inoperable.
Recently, the PRHTA initiated the deployment of ITS Devices on expressways/freeways with the purpose of traffic incident management and dissemination of traveler information. The first project of this kind started construction in Q1 2017 on Baldorioty de Castro Expressway (PR-26). The intervention will deploy ITS devices on PR-26, as shown in Table 7.1:
Table 7.1: PR-26 Sample ITS Devices Deployment
ITS Device Type Expected Functionality
CCTV Surveillance Cameras Traffic incident detection, verification and monitoring, and video streaming for traveller information.
Microwave Radar Vehicle Detectors Traffic incident detection, traffic data collection, and speed map display.
Bluetooth readers Travel time calculation.
Dynamic Message Signs Traveller information dissemination (traffic incident information, alternate and emergency routes and travel time display).
Source: PRHTA
Other projects that will deploy these devices are in various procurement and design stages within the PRHTA. These devices are likely to be deployed as part of the Congestion Managed Lanes / Dynamic Toll Operation for the San Juan – Caguas corridor, which include highways PR-18, PR-30, and PR-52. Other facilities, such as expressways Luis Muñoz Rivera (PR-1), John F. Kennedy (PR-2),

CHAPTER 7 POLICY GUIDELINES TOWARD THE TRANSPORTATION INFRASTRUCTURE
Final Report December 2018 | 314
and Rafael Martínez Nadal (PR-20), and freeway Roberto Sánchez Vilella (PR-66) are at the planning stage.
The traveler information component of these projects will also aid the PRHTA in complying with federal regulations, especially 23 CFR 511.
The PRHTA has staffed (outsourced) the TMC to cover the functions of traffic incident management and traveler information dissemination. The current operational period covers Monday to Friday from 6:00 am to 9:00 pm and is expected to expand with time to a 24/7 schedule, as the PRHTA TSM&O program evolves.
The O&M lifecycle stages are crucial to the continued success of the TSM&O Program and shall be budgeted into the recurring costs of the transportation systems expenditures. Therefore, the PRHTA will evaluate different funding sources to cover the cost of the O&M expenditures.
Multidisciplinary Transportation Operations – Regional Traffic Management Center
The PRHTA is currently building a Regional Traffic Management Center (RTMC) at the PR-52 Caguas Norte Toll Plaza. The RTMC will be the hub for Puerto Rico’s traffic management activities, including but not limited to traffic incident management, and traveler information dissemination. The RTMC will be co-located with the Puerto Rico Police and Medical Emergencies Bureaus, and will be the central location for coordination for major incidents and emergencies affecting the surface transportation network.
The PRHTA expects that the expansion of the ITS network in Puerto Rico will be integrated into this RTMC to continue with the centralized management and operation of the surface transportation network. The PRHTA will also evaluate the possibility of center-to-center interaction between different facilities, such as the Metropistas PR-22 TMC and other emergency management complexes to continue promoting a multidisciplinary approach to the transportation network management.
Travel Time Reliability Improvement
The PRHTA is in the final stages of design of the Congestion Managed Lanes / Dynamic Toll Operation for the San Juan – Caguas Corridor. This project will provide two dynamic toll lanes to be built on the median of PR-18 and PR-52 highways between Caguas and San Juan. See Table 7.2.
Table 7.2: Benefits of Managed Lanes over General Purpose Lanes
Building General Purpose Lane Building Managed Lanes
Short Term Average vehicle speeds about the same.
Medium Term • Congestion builds in all lanes; and • Benefits of the new capacity diminish.
• Travel time benefits on the express lanesmaintained; and
• Overall shorter average travel times acrossthe whole corridor.

CHAPTER 7 POLICY GUIDELINES TOWARD THE TRANSPORTATION INFRASTRUCTURE
Final Report December 2018 | 315
Building General Purpose Lane Building Managed Lanes
Long Term • Congestion returns to all lanes; and• No measurable benefit in travel time from
new capacity.
• Congestion returns only to general purpose lanes;
• Managed lanes continue to serve morevehicles at higher speeds; and
• Greater overall corridor travel benefits.
Source: PRHTA
This project will deploy several ITS technologies for monitoring the traffic conditions within the dynamic toll lanes, as well as the general-purpose lanes. Table 7.3 provides a description of the types of functions to be performed by the ITS devices for dynamic toll operation only. Other functions could be performed as well, such as those presented in the table for traffic incident management and traveler information dissemination.
Table 7.3: DTL Project Sample ITS Devices
ITS Device Type Expected Functionality (for DTL functions only)
Microwave Radar Vehicle Detectors Determination of vehicle volumes and speed for price algorithm calculations.
Bluetooth readers Travel time calculation to confirm reliability.
Dynamic Message Signs Provide travellers with toll price.
Source: PRHTA
The PRHTA has already started implementing other activities related to improving the travel time reliability such as the traffic incident management strategies to expedite the clearance of events. The PRHTA plans to continue to implement other travel time reliability improvements, including Active Traffic Management (ATM) projects, such as Managed Lanes, Freeway Management, and Bus Rapid Transit, and Integrated Corridor Management (ICM) projects.
Highway Safety Patrol Program (SEGURO)
On April 2017, the PRHTA started the operation of the highway safety patrols program (SEGURO, for its Spanish acronym). The main purpose of this service is to provide safety to road users while they are involved in traffic incidents (vehicle breakdowns and crashes) and collection of data related to performance measures in these events. A second phase of the program started on June 2018, which expanded coverage to expressways segments of PR-1 and PR-2 in San Juan, as well as on PR-20.
The SEGURO program is an extension of the TMC operations dealing directly with response activities to traffic incidents. SEGURO operators are responsible for providing firsthand help to travelers, such as changing flat tires, and setting traffic control devices at incident scenes. SEGURO operators in coordination with TMC staff collect traffic incident data using a mobile application. Data obtained through the app is later analyzed and presented for the TMC monthly performance measurement reports.
The PRHTA expects to continue and expand the area covered by SEGURO. It is expected that the program will expand to highway PR-66, and other expressways/freeways not currently under

CHAPTER 7 POLICY GUIDELINES TOWARD THE TRANSPORTATION INFRASTRUCTURE
Final Report December 2018 | 316
coverage. The PRHTA also expects to expand the operational schedule to 24/7 while the TMC operation is modified.
Intelligent Mobility and Disruption
Mobility is expanding globally. With the rise of the smartphone, access to mobility is becoming simpler and more ‘on demand’. New modes, such as Transportation Network Companies (TNCs), electric bike share, electric scooters etc. are mixing with more traditional modes such as transit, providing a much broader ‘transportation ecosystem’ to the user. In many cases, these new services are providing ‘first/last mile’ solutions for riders who live a distance from transit stops and stations. Much progress has been made with transportation ‘user experience’ through the release of app-based services such as Uber, and the user now expects a much more fluid and seamless interaction with transportation services. In the future, these systems are expected to deliver ‘autonomy’ – driverless vehicles that provide a door to door service without the need for human interaction.
It is important that the 20415 LRTP builds on the progress made with ITS, that has primarily focused on congestion management in key corridors and focuses on non-car mode trips to influence behavior change – for residents and visitors to San Juan. This should include transit as well as new modes and consider how the two will integrate. The smartphone, and the opportunities that it could bring, should be carefully considered.
Consideration has already been given to a new Advanced Traveler Information System (ATIS) website to promote multi-modal trip planning, and provide the public with real time information. The implementation of version 2.0 was delayed due to the impact that the hurricanes had over the ITS network. The PRHTA expects that the implementation of the most recent version will be carried out once the ITS projects already in deployment start coming on-line. Future version of the ATIS website could include features towards improving the transit user experience, such as providing trip planners, parking management information, real-time routing information, among other value-added features.
However – serious consideration should also be given to third party applications for traveler information, that source data from ITS systems. With the availability of free to use navigation apps and websites such as Waze, Google Maps, Apple Maps, Transit App and Citymapper, it is now very easy to plan a trip from A to B using only addresses and a set of best available options. The standardization of transit data, via the GTFS feed approach, has meant that it is relatively simple for a large city to provide its citizens with point to point trip planning, without investing in expensive web technologies. Google Maps (and similar apps) will do this for free if the data is made available; apps tend to be global in approach, so the ‘user experience’ is the same for someone visiting San Juan from London than it is for a local resident.
Like the traffic information provided on Google Maps overlay, these tools can also provide ‘real time’ updates on transit services (alerts and departures) and shared mobility (i.e. number of bikes at a station). Apps will consume data provided by the city and third parties in an appropriate format such as GTFS-RT, via Automatic Vehicle Location (AVL) and Automatic Passenger Counter (APC) systems. There are huge opportunities for San Juan in this arena.

CHAPTER 7 POLICY GUIDELINES TOWARD THE TRANSPORTATION INFRASTRUCTURE
Final Report December 2018 | 317
Overall, navigation apps make it easy for riders (or potential riders) to see where local bus stops and stations are, the routes they serve and importantly, services on route. This type of information provides confidence to the rider and encourages users to leave their car at home. Currently, Google Maps or any other GTFS-powered app are extremely unreliable in San Juan. This is frustrating for many types of user, including those who are tempted for mode alternatives different from cars.
Mode Integration
The integration of all transportation modes to ITS is paramount to achieve a successful implementation in Puerto Rico. Looking ahead, accurate trip planning will form the backbone of a ‘mobility as a service’ delivery model - to encourage multi-modal travel considered on trip by trip basis, rather than growth in car ownership and TNC trips.
Key improvements should at least include:
Currently, most transit services operate somewhat independently from each other, resulting in reduced ridership on public transportation modes and a higher number of trips on private vehicles. These effects in turn contribute to congestion problems in many parts of the Island, specifically in the San Juan TMA. The PRHTA plans to implement ITS strategies included in the Public Transportation Management User Services Bundle to integrate information collected from different transportation modes and present it to travelers so they can make an informed decision as to which transportation mode is better at a certain moment in time. It is desirable that an integrated system is open to:
• Provide real time information about multi-modal transportation services on kiosks, websitesand apps – and present in GTFS-RT format;
• Dynamic signage at bus stops and trains stations to provide travelers with information aboutexpected arrival times;
• Ability for users to reliably plan a complete trip using online electronic tools (Tren Urbano,Metro Urbano and AMA Metrobus websites), including accessible trips (wheelchair usersetc.). This will require the integration of different data sets, via GTFS;
• Ability for the rider to purchase tickets online or via smartphone;• Ability for the rider to understand in real time train or bus location. In the future, this could
also include availability of bikes, scooters and car shares;• Provide real time parking information in terms of availability, costs and payment methods –
particularly at parking serving public transportation services; and• Ability for the city to understand transit ridership through better data collection and analysis.
For improvements to happen, the Long-Range Transportation Plan should take the following into consideration:
Carry Out User Research
How do people use the system? What are the flaw points? What can be learned from user behaviors? Interview riders and create user personas to better understand user profile, and what changes are needed to increase ridership.
The Creation of a Strategic Roadmap for Passenger Information

CHAPTER 7 POLICY GUIDELINES TOWARD THE TRANSPORTATION INFRASTRUCTURE
Final Report December 2018 | 318
The PRHTA should focus on becoming a ‘platform’ for the delivery of transportation modes, through the provision of data to third parties. To do this a product roadmap should be developed in the short term – this will set expectations and user requirements for future mobility.
The Development of an AVL/APC System for All Buses
Key to the delivery of a more open and accessible transit network is the provision of real time information for all vehicles. This data should then be made available publicly via the platform. Ideally, the data collected by these systems should be feedback to the agency for further analysis – using performance data to better improve the transit network.
Creation of a GIS Database of Geo-Located Bus Stops/Stations and Routes
Another key item is the creation of a GIS layer for transit assets – including bus stop locations. Innovative approaches have been taken globally to capture bus stop locations via smart phone apps.
The Creation of GTFS Data for All Buses Operating in San Juan, Including Connector Services
A project should focus on the creation of GTFS data for bus services in San Juan. There are many innovative approaches to capturing and processing this data. Once collected and published, this information can then be used for a broad range of navigation services, often for free.
Creation of a Central Transportation Website/App, with Integrated Trip Planner
There is currently no single user resource for accessing online transportation information, formatted for smart phones. As a priority, a new website should be developed that provides key information to transit riders, including trip planning, fare purchase and service alerts.
Incorporation of Accurate GTFS Data, and Transit Mapping, into Google Maps
Once complete, and a robust updating procedure is in place, regular checks should be made to Google Maps, Apple Maps and others. Feedback should be sought from end-users. Importantly, this information needs to be accurate and well maintained.
A Centralized Platform for the Dissemination of Transit ‘Rider Alerts’ to All Media Sources and User Groups
Another key element of a passenger information system is regularly updated Rider Alerts (GTFS-RT Alerts). This system will provide timely updates for users, via dedicated transit websites, apps and other sources such as Google and Apple Maps. Often, this system will form part of a software service connected with the creation and management of GTFS.
Interactions with Key Stakeholders Such as Google, Waze, Uber etc. to Better Understand What Services Could Be Provided.
Establish effective collaborative relationships with data collection agencies and private companies.
Consider strategies to ensure that new mobility services, such as dockless bike share and scooters can be managed to promote a more sustainable transport, in line with the benefit of users and a larger mode shift from car trips.

CHAPTER 7 POLICY GUIDELINES TOWARD THE TRANSPORTATION INFRASTRUCTURE
Final Report December 2018 | 319
Development of a Digital Mobile Ticketing System, Potentially Integrated with Existing Tolling Accounts.
Make it easier for riders to purchase and use tickets. Allow for multiple points of purchase – including app and web-based systems. Where possible, tie to existing payment accounts.
Integrations with the Broader ITS Community/Stakeholders, as Stated in the ITS Regional Architecture.
Work closely with other key departments, data providers and consumers to share silos of information and knowledge.
CONGESTION MANAGEMENT PROCESS Congestion Management System
The Congestion Management Process (CMP), previously known as Congestion Management System, is an essential part of the planning process. The CMP is a methodical approach for managing congestion to obtain up to date information of a Region’s transportation system tendencies and performance. It uses analytic tools to address congestion within a territory, activity center, or corridor and to establish the method for reducing or eliminating traffic congestion issues. The FAST-Act’s CMP suggests new management techniques, direct links to the planning process and to environmental considerations, as well as to travel demand reduction.
The general purpose of the Congestion Management Process appoints to: (i) apply an organized and systematic approach to traffic congestion in a metropolitan Region; (ii) reduce travel demand; (iii) address congestion management through effective administration and planningconsiderations; and (iv) help enhance the mobility of people and goods.
The previously discussed FAST-Act, as the binding law for the Island’s 2045 LRTP, requires the Puerto Rico jurisdiction (San Juan TMA and Aguadilla TMA) to develop a Congestion Management Process as part of its planning operations. New and existing facilities in the Island will benefit from its results, for example by maximizing their use and by helping in the decision-making. See Table 7.4.
In summary, the CMP is being added to the roadmap established in the PRTHA’s 2010 Congestion Management Plan Report, with benchmark measures of congestion established through the 2012 Congestion Management Process Report. This latter report identified and quantified measures for all road segments on the congestion management network; these links were characterized in terms of average speed, travel times and delays, traffic volumes and traffic service, safety conditions, transit ridership and other transit measures. With this frame of reference in place, the effect of congestion management improvements can be gauged in terms of the extent and degree of their positive impact on transportation system conditions. To advance the CMP, a technical committee is being formed to identify and prioritize new projects to address the highest need congestion management components.
Development of projects that contribute to congestion management is currently in progress. Significantly, one of the more important groups of projects in the FY2013-2017 period involves

CHAPTER 7 POLICY GUIDELINES TOWARD THE TRANSPORTATION INFRASTRUCTURE
Final Report December 2018 | 320
development of the ITS network, with an emphasis on the incident management component. The PRHTA has also established an interim traffic center in its headquarters building for management of the traffic signal system. There are also many capacity and non-capacity projects in the 2013-2017 CIP program that address elements of congestion management as highlighted in Chapter 5.
Table 7.4: Relation between Planning Factors and 2045 LRTP Goals
Source: SDG and PRHTA
FREIGHT 2045 LRTP
The movement of goods (freight) is an important contributor to the economy of Puerto Rico. Freight’s mobility affects the competitiveness of individual businesses and residents throughout the Island. The importance of freight in the Island wide transportation system is recognized in the Congestion Management Process (CMP) and in the 2045 LRTP’s vision, goals, and objectives framework (specifically with the focus of Economy, the goal of Reinforce Economic Vitality and the objective of Facilitate the efficient movement of freight, business and tourism activities to achieve economic competitiveness). As part of the public outreach program, targeted efforts were made to engage a wider group of stakeholders (LRTP committees), freight interests were considered during the Plan development process with the establishment of the Freight Advisory Committee.
This Advisory Committee responds to the needs of the freight industry to be a proactive participant in the transportation planning process. The comments that the members of the Freight Advisory Committee mentioned are included in the appendices; some of these comments include the need to improve access to major airports/distribution centers and the need to complete the road network in the Island including:
• PR-5 extension;• PR-22 extension;• Mayagüez to Aguadilla corridor;• Completing PR-10;• PR-53 completion; and• Also, the need to improve cargo services to Vieques and Culebra.
Also, the Advisory Committee had some specific suggestions on an extension of the freight network, some of these sections are presented in Figure 6.1.
CONGESTION MANAGEMENT GOALS 2045 LRTP GOALS Improve intermodal connectivity A, B, C and D Minimize delays caused by accidents A, C and D Optimize average travel time A and C Reduce traffic demand A and C Maximize existing capacity A, B, C and D Provide reliable travel times A, B, C and D Improve travel safety and security A, C and D

CHAPTER 7 POLICY GUIDELINES TOWARD THE TRANSPORTATION INFRASTRUCTURE
Final Report December 2018 | 321
Regional and national economic factors affect how freight moves. A shift between freight modes is not relevant in Puerto Rico once are transported by air of maritime shipments as trucking is the only mean of distribution in the island. For this reason, freight mobility becomes an economic factor tied to the performance of highways, particularly the strategic network. Improvements made to the network will benefit the freight industry as well as the other highway users.
Separate from the internal movement of freight in Puerto Rico there are also the Island’s freight links to the Caribbean, continental United States, Latin America, and trans-Atlantic markets. These occur through Puerto Rico’s primary airports and seaports, which carry air cargo, and serve as portals for the import and export of goods. Various government initiatives have focused on expanding these air and sea cargo hubs and the essential land access connections to them.
The new federal transportation legislation, the FAST-Act includes several provisions to improve the condition and performance of the national freight network and to support investment in freight-related surface transportation projects. The FAST-Act establishes a national policy of maintaining and improving the condition and performance of the National Multimodal Freight Network, one that provides a foundation for the U.S. to compete in the global economy. The FAST-Act specifies goals associated with this national policy related to the condition, safety, security, efficiency, productivity, resiliency, and reliability of the network, and in the reduction of adverse environmental impacts related to freight. FAST-Act requires DOT to establish (and publish on its website) a national freight strategic plan. The DOT will develop (and update) the plan in consultation with State DOTs, MPOs, and other appropriate public and private transportation stakeholders.
The national freight strategic plan will include:
• An assessment of:• The condition and performance of the network; and• Barriers to improved freight transportation performance and opportunities to overpass
them;• Forecasts of freight volumes for the succeeding 5-, 10-, and 20-year periods;• An identification of:
• Major trade gateways and national freight corridors that connect major populationcenters, trade centers, and other major freight generators;
• Bottlenecks on the network that create significant freight congestion;• Corridors that access energy exploration, development, installation, or production areas;• Corridors that access major areas for manufacturing, agriculture, or natural resources;• Best practices for improving the performance of the network, including critical commerce
corridors and rural and urban access to critical freight corridors; and• Best practices to mitigate the impacts of freight movement on communities;
• A process for addressing multistate projects and encouraging jurisdictions to collaborate; and• Strategies to improve freight intermodal connectivity.
Within 5 years of completing the national freight strategic plan, and every 5 years thereafter, DOT must update the plan and publish it on its website.

CHAPTER 7 POLICY GUIDELINES TOWARD THE TRANSPORTATION INFRASTRUCTURE
Final Report December 2018 | 322
National Multimodal Freight Network
Goals of the Network
The FAST-Act directs DOT to establish a National Multimodal Freight Network to:
• “Assist States in strategically directing resources toward improved system performance forthe efficient movement of freight on the Network;
• Inform freight transportation planning;• Assist in the prioritization of federal investment; and• Assess and support federal investments to achieve the goals of the National Multimodal
Freight Policy established in 49 U.S.C. 70101 and of the National Highway Freight Programdescribed in 23 U.S.C. 167”108.
Establishment of Interim Network
The DOT must establish an interim Network, that includes:
• “The National Highway Freight Network that DOT establishes under the National HighwayFreight Program (23 U.S.C. 167);
• The freight rail systems of Class I railroads;• U.S. public ports that have total annual foreign and domestic trade of at least 2 million short
tons;• U.S. inland and intracoastal waterways;• The Great Lakes, the St. Lawrence Seaway, and coastal and ocean domestic freight routes;• The 50 U.S. airports with the highest annual landed weight; and• Other strategic freight assets, including strategic intermodal facilities and other freight rail
lines”109.
Other Freight Provisions
State Freight Advisory Committees
The FAST-Act requires DOT to encourage each State to establish a local freight advisory committee, to consist of a representative cross-section of public and private freight stakeholders. The role of a State freight advisory committee is to:
• “Advise the State on freight-related priorities, issues, projects, and funding needs;• Serve as a forum for discussion for State transportation decisions affecting freight mobility;• Communicate and coordinate regional priorities with other organizations;• Promote the sharing of information between the private and public sectors on freight issues;
and• Participate in the development of the freight plan of the State”110.
10849 U.S. Code § 70103 - National Multimodal Freight Network. 109 49 U.S. Code § 70103 - National Multimodal Freight Network. 110 49 USC 70201: State freight advisory committees.

CHAPTER 7 POLICY GUIDELINES TOWARD THE TRANSPORTATION INFRASTRUCTURE
Final Report December 2018 | 323
State Freight Plans
To receive funding under the National Highway Freight Program (23 U.S.C. 167), the FAST-Act requires each state to develop a local freight plan, which must comprehensively address the State’s freight planning activities and investments (both immediate and long-range). A state may develop its freight plan either separately from, or incorporated within, its statewide strategic long-range transportation plan required by 23 U.S.C. 135. Among other requirements, a state freight plan must:
• “Cover a 5-year forecast period;• Be fiscally constrained;• Include a “freight investment plan” with a list of priority projects; and• Describe how the State will invest and match its National Highway Freight Program funds”111.
The state must update its freight plan at least every 5 years, and may update its freight investment plan more frequently than the overall freight plan.
The FAST-Act includes many provisions that modify federal requirements regarding the size and weight of vehicles that may travel on the Interstate System and the National Network.
For the San Juan Region (almost two-thirds of the Island’s economic activity), efficient freight movement equates to reduced business costs and improved competitiveness. Its importance is recognized as part of this 2045 LRTP as part of the MPO’s planning processes. The establishment of a Freight Advisory Committee as part of this plan and its continuation will facilitate a more targeted and prioritized approach to addressing freight mobility, and in cross-connecting transportation system planning, project definition and priorities, and coordination with congestion management initiatives. Figure 7.2 presents some of the logistics road additions that the freight network that the Advisory Committee suggested for the San Juan TMA.
111 49 USC 70202: State freight plans.
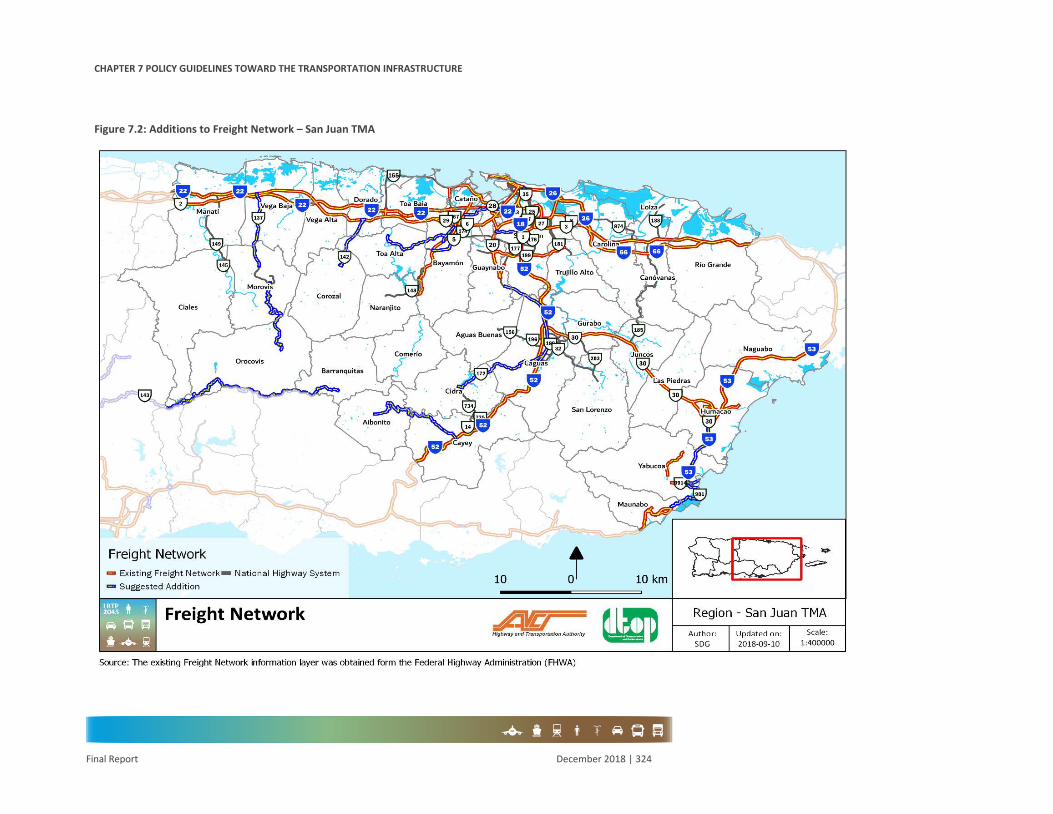
CHAPTER 7 POLICY GUIDELINES TOWARD THE TRANSPORTATION INFRASTRUCTURE
Final Report December 2018 | 324
Figure 7.2: Additions to Freight Network – San Juan TMA

CHAPTER 7 POLICY GUIDELINES TOWARD THE TRANSPORTATION INFRASTRUCTURE
Final Report December 2018 | 325
SAFETY AND SECURITY Safety
Security based initiatives are intended to cover all existent modes of transportation. This aspect is a priority for the PRHTA and therefore related enterprises have been constantly developing.
Transportation service’s operators apply specific security measures based on the mode’s demands. This security plan is broadened and designed based on the FTA’s guides. Every service operator has a duty to execute the plan to achieve all defined security goals and objectives.
Puerto Rico has been the object of countless efforts to improve the security of its roads and highways. For the PRHTA, road security is an essential topic of discussion and priority. For this reason, security measures need to be included in the Highway Work Program, where, among others, geometric intersection improvement, traffic controls and highway reconstruction are analyzed.
Additionally, Puerto Rico’s Transit Security Commission has the duty to implement and develop security measures and traffic accident prevention programs. Its main mission is to reduce the number of transportation related casualties and damage to property. The latter is achieved by establishing educational programs and proactive efforts to inform citizens about existent transit laws and regulations112.
The commission’s effort, through all of its related programs, has helped reduce the rates in transit related accidents and addressed numerous security concerns. This has been achieved as a collaborative work between the PRHTA, other agencies and organizations.
The National Road Security Plan (HSP) is the guide by which the commission, along with the PRHTA, identify security problems, define transportation objectives and goals and presents its project implementation. The Puerto Rico Strategic Highway Safety Plan113 comprehend the following areas:
• Traffic Records & Information System;• Emergency Medical Response;• Occupant Protection;• Alcohol Impaired Driving;• Aggressive Driving;• Vulnerable Road User;• Young Drivers;• Roadway Departure; and• Intersections.
112 Norms and Procedures for the Administration of Federal Resources Manual, Transit Security Commission, reviewed June 2016.
http://comisionparalaseguridadeneltransito.com/wp-content/uploads/2017/02/MANUAL-DE-PROC-Y-NORMAS-DE-FONDOS-FEDERALES.pdf. 113 Puerto Rico Strategic Highway Safety Plan 2014-2018.

CHAPTER 7 POLICY GUIDELINES TOWARD THE TRANSPORTATION INFRASTRUCTURE
Final Report December 2018 | 326
Security
Security plans and concerns focus primarily on safer transportation facilities, crime prevention and addressing possible terrorist threats. All agencies responsible for managing transportation issues, including those in charge of ports and airports, have a duty to integrate and comply with the federal requirements established by TSA.
The Strategic Highway Network is relevant when considering security issues. This facility provides access and continuity for the movement of citizens, goods, services and freight, not only in a daily basis, but during war, threats or emergencies. Its importance resides in its capability to serve as a connection between the principal cities and is an asset in terms of defense.
Coordination between the DTPW/PRHTA, the state and municipal police departments is a must. This is essential to maintain security along the Island’s principal roads and highways. Implementation of applications such as the ITS will expand or amplify the transportation facilities’ capabilities to provide security services.
ENVIRONMENT AND SUSTAINABILITY Overview
The San Juan TMA is a composite of land forms ranging from dense urban development to pristine natural settings including the El Yunque National Forest. From the surveys conducted with the public during the planning process, considerable interests and concerns were expressed about preserving environmental quality and fostering a more sustainable environment. The governor has established three initiatives, discussed below, that respond to the importance that Puerto Rico and its citizens place on the environment. Consequently, the topics discussed in this section – environmental sustainability, social sustainability, and economic sustainability are vital and relevant to transportation planning across the San Juan Region. As the largest planning Region on the Island, San Juan is well positioned to capture the opportunities of its urban structure to evolve a more livable urban environment.
Conservation and protection of the environment have been a long-standing principle of the Puerto Rico Commonwealth. Concern for the environment has been embraced within the broader concept of sustainability, which is defined by the U.S. Environmental Protection Agency (EPA) as a process that “creates and maintains the conditions under which humans and nature can exist in productive harmony, that permit fulfilling the social, economic and other requirements of present and future generations.” Sustainability is focused on managing what we consume, how we consume it, and the byproducts of our consumption, in such a way that resources are preserved, regenerated, renewed, and available to those who follow.
From a review of several transportation agencies, their treatment of sustainability in relation to the transportation planning process encompasses environmental sustainability, social sustainability, and economic sustainability. Within this framework, sustainability can be viewed as including the following facets:
• Environmental sustainability:
CHAPTER 7 POLICY GUIDELINES TOWARD THE TRANSPORTATION INFRASTRUCTURE
Final Report December 2018 | 327
• Air quality;• Climate change;• Environmental management and mitigation;• Travel demand management; and• Congestion management.
• Social sustainability:• Livability: travel choices (transit, bicycles and pedestrians);• Transportation and land use linkage; and• Public health.
• Economic Sustainability.
As evidence of the continuing commitment to sustainability in Puerto Rico, the government issued in 2013 Executive Order (OE-2013-017), calling for the creation of a Sustainability Action Council with responsibility for:
• Formulating strategies to reduce reliance on carbon-based energy;
• Advising the Governor on climate change mitigation and response;
• Proposing laws for further protection of environmental resources;
• Identifying ways to create “green” jobs related to new forms of energy andenvironmental restoration;
• Supporting the development and implementation of policies and laws, strategies andprograms, and communications between academic centers for ongoing technicalexchange of sustainability advances.
The Council was established to comprise a cross-section of membership drawn from academics, environmentalists, economists, businesses that have embraced the concept, technical professionals, and the public. This council on sustainability presents an opportunity for the MPO and PRHTA to provide input and information on an ongoing basis as it relates to the transportation system.
The following sections describe how the activities of the MPO and its transportation partners relate to the important environmental topics that are essential components of a well-rounded transportation planning and transportation system management framework.
Sustainability and the Environment
Air Quality
This section summarizes the status of air quality for the San Juan TMA, which has been included in this LRTP due to the organization of the PRHTA and its oversight of the Island’s 7 transportation related Regions.
Pursuant to the provisions of the Clean Air Act (CAA) and its subsequent amendments, the EPA has established the National Ambiental Air Quality Standards (NAAQS) for six criteria pollutants. These standards have been established to protect the public health. When an area meets a particular standard, it is stated that it is an “Attainment” area. Otherwise it is designated as a “Non-Attainment” area, which implies that a compliance plan shall be developed until the “Attainment”

CHAPTER 7 POLICY GUIDELINES TOWARD THE TRANSPORTATION INFRASTRUCTURE
Final Report December 2018 | 328
status is obtained. Nevertheless, transportation sources contribute to four of the six criteria pollutants for which EPA has established standards to protect public health and/or safety. The pollutants are: ozone (O3), carbon monoxide (CO), particulate matter (PM10 and PM2.5), and nitrogen dioxide (NO2). Until 1991, the entire Island was designated as one in which all the NAAQS were met. In September 2005, the 2030 San Juan LRTP was found in transportation conformity since requirements of the federal CAA PM10 emissions associated with the surface transportation network were less than the SIP emissions inventory established in 1993.
However, an exceedance of the Particulate Matter (PM10) was verified in the municipality of Guaynabo, after which the Urbanized area of this municipality was places under a “Non-Attainment” status. After developing and implementing compliance measures that were incorporated in the State Implementation Plan (SIP), air quality monitoring data provide support for a delisting request that was submitted and approved by the EPA in January 12, 2010. The decision was published in the Federal Register (Volume 75, No. 7, pages 1543 and 1544) and is part of the required conformity analysis which established a maximum level of PM10 pollutants that may be emitted by the area’s transportation system. LRTPs for areas where attainment for any of the pollutants does not exist must show that the implementation of the plan will not exceed the allowable level of emissions.
The responsible agencies and officials in the Commonwealth have committed to policies, specific projects, and a general course of action that promote good development, efficient transportation systems, and protection of the environment. This in turn contributes to improved air quality and creates more sustainable communities. A variety of concerted actions and policies such as pedestrian friendly land uses and improvement of pedestrian facilities, intersection improvements and other low-cost transportation measures, covering of loads on trucks, stabilizing the sides of roadways, paving parking areas, street cleaning and removal of road dust, and restoring roads to good repair can help in this endeavor. The increased emphasis on and implementation of transit improvements is a major commitment that will bring benefits for many years to come. These and other actions of the responsible agencies and officials will serve to improve the air quality.
The importance of air quality and the need of addressing the issue of greenhouse gases prompted the issuance of Executive Order (EO-2013-018). This EO required to perform a study of greenhouse gases in Puerto Rico to was to be jointly led by the Energy Affairs Administration, the EQB, and the Department of Natural Resources and Environment. The purpose of the study was to provide a profile of the level and sources of greenhouse gases in Puerto Rico, the impact on the environment of these carbon emissions, and strategies to reduce the emissions. The MPO and PRHTA participated in this effort as the emission of greenhouse gases from the transportation system contributes to the overall mix of gas sources. In September 2014, the agencies issued the Puerto Rico Greenhouse Gases Baseline Report. Perhaps the most relevant conclusion of the report is that the Green House Gases (GHG) emissions in Puerto Rico rose faster than the US average through 2005, falling and stabilizing afterwards. However, future emission levels are predicted to be significantly higher than 1990 levels in 2020 and beyond. These levels are higher than many subnational, national, and international targets for GHG emission reduction. The EO provides strategies targeting the two (2) primary emitting sectors: the electric power generation and the transportation and land use.

CHAPTER 7 POLICY GUIDELINES TOWARD THE TRANSPORTATION INFRASTRUCTURE
Final Report December 2018 | 329
Regarding to the transportation and land use sector, which are the one pertinent to this report, the forecasts for emission reductions are encouraging, even before the establishment of a concerted local policy adoption. The emissions from the on-road fleets (light duty cars and trucks as a well as heavy-duty trucks), reached peak levels during the 2000-2010 decades and are being predicted to fall over time. This trend is the result of the expectation that the total amount of driving (VMT) has been holding steady without growth in recent years. This observation is compatible with the one observed on a nationwide basis in the United States, due to higher fuel prices and greater levels of urbanization, and has broken decades-long linkages between economic and VMT growth. Also, the expected dramatic improvement of light duty vehicles is expected to play a starring role in the predicted emissions due to the relatively great number of them constitute a primary source of on-road fuel use. Mandated federal corporate average fuel economy (CAFE) standards, require new vehicles average the emissions equivalent of 54.5 miles driven per gallon of gasoline combusted by year 2025. For heavy trucks, there is also a forecast to achieve higher efficiency gains.
Even though that projected emissions reductions are expected, they are not sufficient to reach the desired goal which is to have emission levels comparable to 1990 levels. Additionally, the most significant driver for the reductions in emissions, new fuel efficiency standards, are not predicted to continue up to 2050. Therefore, additional measures shall be implemented. The most promising of them is the adoption of a local strategy that provides incentives for the conversion of the auto fleet to electric vehicles. Potential candidates for this strategy are:
• Provide vehicles charging infrastructure;• Easing of the permitting process for the construction of private charging facilities;• Establishing or enhancing subsidies for charging equipment and/or vehicles; and• Enhancing tax credits for electric vehicles purchases.
The MPO is already and continue to be involved with transportation planning and management activities that should be an integral part of the study recommendations.
Climate Change
Climate change issues and their effects on developed environments are a rapidly emerging consideration in LRTP documents across coastal areas and specially in Puerto Rico in the aftermath of Hurricane María. The relation to transportation is through transportation greenhouse emissions from vehicles using the transportation system. Overall, transportation accounts for 29 percent of all greenhouse gas emissions. The EPA reports that the average car owner releases 4.8 million metric tons of carbon dioxide each year by driving. The total amount of carbon generated by the transportation system is a function of the vehicle mix in the fleet, the fuels used, and the operational efficiency of the system (network travel speed). The federal government has recently approved new Corporate Average Fuel Economy (CAFE) standards for new vehicles, which will further reduce emissions. Changing vehicles and their emission rates is reasonably manageable. Changing how well the system moves these vehicles and how people change their needs to consume transportation mobility is more challenging.
There are two dimensions to the transportation reach: mobility and accessibility. Mobility refers to how much ground or distance can be covered rapidly; thus, vehicle miles of travel is a positive

CHAPTER 7 POLICY GUIDELINES TOWARD THE TRANSPORTATION INFRASTRUCTURE
Final Report December 2018 | 330
indicator of this dimension. Automobiles on uncongested freeways greatly expanded urban mobility, encouraging suburbanization. Accessibility, the other dimension, means the ability to reach a desired range of various needs (shopping, services, schools, work, recreation) within a relatively short distance. If such resources, or at least many of them, are available within a short reach, then overall vehicle miles of travel can be reduced, so strategies and policies to adjust personal decisions about place of residence, place of work, and place of other destinations can influence trip lengths and travel mode choices, thus reducing the amount of travel and the environmental consequences of that travel. And if that travel involves more non-motorized travel by walking or bicycling, a collateral benefit that has been demonstrated in the literature is improved personal health and better quality of life.
The publication by the FHWA, Integrating Climate Change Considerations into the Transportation Planning Process: Final Report (2008) discusses how acknowledgement of climate change concerns can be coordinated with transportation planning processes. Regarding the LRTP process, climate change can be reflected in the plan vision, goals, and objectives; it can be connected to projects that provide benefit in terms of reduced vehicle miles of travel and reduction in greenhouse gas emissions; and it can be monitored in terms of performance measures of programs and projects.
Under Goal 4 of this 2045 LRTP—promote environmental sustainability—the four stated objectives address minimizing adverse impacts to the natural and built environments; reducing greenhouse gas emissions and energy consumption, and improve air quality; supporting integrated transportation and land use planning for more livable communities and reduced travel; and enhancing alternative modes and travel demand strategies. All of these objectives interface with climate change concerns. Other plan objectives also connect to climate change as discussed in the FHWA report. Various projects in the plan relate to reduced vehicle miles traveled and emissions, and the outputs from the travel demand model include a number of useful performance measures that relate to climate change impacts.
In terms of the planning process, the FHWA report notes there are avenues to integrate climate change into the MPO’s ongoing activities; these are related to coordination with other agencies, land use planning and integration, and funding linkages. On these fronts, the MPO has opportunities to introduce climate change into to its coordination with the Island planning and environmental agencies, in its coordination with the Planning Board regarding regional land use planning that is presently underway, and in linking funding decisions in part to climate change considerations.
This impact of transportation activity can be addressed through the following means:
• Reducing the direct emissions from vehicles:• Improving vehicle miles per gallon via the CAFE standards established by the
EPA and USDOT); and• Improving traffic conditions by reduced congestion and improved signal timing.
• Reducing vehicle miles of travel:• By reducing trip length;• By increasing vehicle occupancy through higher automobile occupancy
(carpooling);

CHAPTER 7 POLICY GUIDELINES TOWARD THE TRANSPORTATION INFRASTRUCTURE
Final Report December 2018 | 331
• By increasing vanpooling;• By increasing use of transit;• By decreasing required trip lengths by improved land use decisions;• By promoting more non-motorized travel by walking and bicycling;• By eliminating the need for travel (compressed days of work and telecommuting);
and• By promoting the development of walkable, mixed land use activity centers
with access to transit for longer distance trips.• Reducing congestion on major travel corridors:
• By improving travel speeds; and• By providing competitive transit service.
PRHTA has been active on a number of these fronts with projects that contribute to reduced transportation impacts on the environment, through its development of the CMP and through the implementation of other projects that address traffic operations. In addition, PRHTA has been coordinating with various municipalities and regional economic development organizations on potential transit projects as well as trails and greenways projects.
One of the primary concerns of climate change besides air quality is the longer-term effect of rising sea levels due to increases in atmospheric temperatures and the melting of the arctic icepack. Since 1880, sea levels have risen by 8 inches. Some projections say sea level will rise by a foot by 2040 and by up to two feet by 2060. According to climatologists at Climate Central (www.climatecentral.org)), as reported in their peer-reviewed surging seas report, 55 sites across the United States were analyzed to evaluate the level at which the “storm of the century” would normalize, determining that most major storm events would normalize at about four feet above the high tide line. Of the vulnerable populations in the United States, half of those living in Florida and eight of the top ten cities determined to be in Florida. It was found that two counties in South Florida, Broward and Miami-Dade, each have more people living below four feet of elevation than any state other than Louisiana. The recent storm event Sandy, impacting New Jersey and New York, is further demonstration of the devastating impact of such events.
As a result of this concern, the four counties in Southeast Florida entered into the Southeast Florida Regional Climate Change Compact to work cooperatively to address climate and the resulting sea level concerns. These issues are problematic in terms of their solution, but planning and policy development, as reflected in transportation system planning and management, is a proactive approach that was acknowledged by FHWA for its vision. As an example of the complexity in dealing with climate change effects, a recent combination of tropical storm surge and high tides caused considerable damage to the Florida State Route A1A roadway on the Fort Lauderdale beach, triggering an expensive refurbishing project to put the roadway corridor back into operational use. Various reaches of Southeast Florida beaches have experienced recurring issues with beach erosion and beach replenishment. These same issues can confront Puerto Rico’s coastal realms.
Advance planning for sea rise and climate change contingencies is a proactive measure that enhances the development of evacuation planning for low-lying coastal areas. A number of low-elevation communities in Puerto Rico coastal areas are susceptible to marginal increases

CHAPTER 7 POLICY GUIDELINES TOWARD THE TRANSPORTATION INFRASTRUCTURE
Final Report December 2018 | 332
in sea rise over the long term or to combinations of high tide and storm-related water elevation increases and surges. In addition, the Puerto Rico State Agency for Emergency and Disaster Management (PRSAEDM) and partners have recognized the potential for tsunami events within the Region and have done advance planning to support the preparedness and response elements of such events. PRSAEDM coordinates programs addressing disaster preparedness, response, recovery, and mitigation across focus areas including earthquake safety and risk reduction, the National Flood Insurance Program, the National Hurricane Program, Mitigation Grant Program, Assistance Program for Flood Mitigation, and Pre-Disaster Mitigation Program.
The significance of pursuing climate change response strategies was authenticated by the Governor of Puerto Rico, who issued Executive Order (EO-2013-016). This EO designated the Department of Natural and Environmental Resources (DNER) as the lead agency with the responsibility to perform an analysis of the climate of Puerto Rico and assess and identify vulnerabilities of the infrastructure with the goal to establish and develop an Adaptation Plan to cope with such findings. All local infrastructure government agencies as well as some private entities were addressed by this order. In June 2016, with the assistance of the DNER, the DTPW published a report entitled Climatic Change- Adaptation Plan. This plan established a road map that shall be followed in order to successfully adapt the agency infrastructure to the potential adverse impacts resulting from the climate change. This is an on-going multi-year process that will require the identification of economic resources and modifications to the current transportation infrastructure at some specific locations.
It is recommended that the MPO and PRHTA participate in this effort as transportation infrastructure that may be vulnerable along the coasts and elsewhere is ubiquitous. The MPO is already involved with transportation planning and management activities that should be an integral part of the study recommendations. The PRHTA and MPO, working together, could advance an analysis of the transportation network using Geographic Information System databases, including topographic information, to perform a susceptibility analysis for transportation infrastructure due to increases in seawater elevation. This analysis would provide a starting point for further discussion of land use and infrastructure concerns resulting from rising seas and related issues, and could inform certain decisions about how to invest in at-risk roadways, for example. The MPO looks to build on its current collective efforts that relate to climate change, both in terms of the processes that it is involved in, and in the planning documents that are produced.
Environmental Management and Mitigation
Another important facet of transportation is the impact of transportation projects on the environment. The prevalence of environmental assets across the Island heightens the need to plan projects to avoid or minimize environmental impacts, and to devise proactive mitigation strategies to compensate properly for needed improvements with unavoidable impacts. As individual projects are developed, they are subjected to the required environmental scrutiny, complying with both federal and Commonwealth laws and regulations. Puerto Rico has traditionally placed a high value on its environmental resources and has in place its own robust environmental impact review process that, in tandem with National Environmental

CHAPTER 7 POLICY GUIDELINES TOWARD THE TRANSPORTATION INFRASTRUCTURE
Final Report December 2018 | 333
Policy Act (NEPA) requirements for environmental assessment of qualifying projects, creates a framework for minimizing environmental harm.
These process tools include agreements between PRHTA and other local and federal agencies, including the Permits Management Office, the Department of Natural Resources and Environment, the Planning Board, the State Historic Preservation Office, the Puerto Rico Culture Institute, and the EQB. Puerto Rico also recently created a Permits Management Office, which is designated to issue construction and development permits, and provides a consolidated clearinghouse for the rules and requirements of other government agencies under a Joint Permit Regulation for Construction Works and Land Uses. For federally funded projects with required environmental documentation, the PRHTA coordinates with the EQB regarding compliance with Commonwealth environmental regulations.
Congestion Management Process
As described separately in this chapter, the PRHTA has embarked on the development of its Congestion Management Plan and Process as required under federal regulations. The plan development process thus far has defined the congestion management network for the San Juan and Aguadilla Regions; established goals, objectives, and measures; developed a set of toolbox strategies to address congestion management; and identified target locations for further analysis. The identified strategies are multimodal and span a spectrum of capacity, throughput efficiency, and alternative mode approaches. The next phase of work should identify specific priority congestion management projects that can be incorporated into the 5-Year TIP and the long-range transportation plan process. The CMP should prove to be aneffective channel for prioritizing high-impact projects into the transportation system, and as aresult, contributing to improved air quality, reduced fuel consumption, and more efficient useof transportation assets.
Social Sustainability
Livability
Livability is planning concept that seeks to interconnect decisions about the transportation system with land use planning, environmental protection, and economic development to promote communities where reliance on the auto is greatly diminished, where a variety of mixed uses of sufficient density are highly accessible by walking or bicycling, and where quality of life is enhanced by improving environmental quality. As noted in the publication Livability in Transportation Guidebook: Planning Approaches that Promote Livability (FHWA/FTA, 2010), there are a number of allied urban planning initiatives that interface with livability, including smart growth, walkable communities, transit-oriented development, life-long communities, complete streets, and new urbanism. This planning concept has received renewed visibility with the initiation in 2009 of the Interagency Partnership for Sustainable Communities formed between three (3) important United States agencies (U.S. Department of Housing and Urban Development, U.S. Environmental Protection Agency, and U.S. DOT). This partnership has advanced six (6) livability principles that are being reflected in

CHAPTER 7 POLICY GUIDELINES TOWARD THE TRANSPORTATION INFRASTRUCTURE
Final Report December 2018 | 334
existing and new federal programs across these three agencies, reflecting initiatives through transportation, housing, and the natural and built environments114.
The six livability principles are:
• Provide more transportation choices to decrease household transportation costs,reduce our dependence on oil, improve air quality, and promote public health;
• Expand location- and energy-efficient housing choices for people of all ages,incomes, races, and ethnicities to increase mobility and lower the combined cost ofhousing and transportation;
• Improve economic competitiveness of neighborhoods by giving people reliable accessto employment centers, educational opportunities, services and other basic needs;
• Target federal funding toward existing communities – through transit-oriented andland recycling – to revitalize communities, reduce public works costs, and safeguardrural landscapes;
• Align federal policies and funding to remove barriers to collaboration, leveragefunding and increase the effectiveness of programs to plan for future growth; and
• Enhance the unique characteristics of all communities by investing in healthy, safeand walkable neighborhoods, whether rural, urban or suburban.
The federal, Commonwealth, and local governments have differing roles and responsibilities in relation to the application of these principles. The Puerto Rico’s Land Use Plan promotes the development of more livable communities. This plan acknowledges the role of the transportation system as supportive to workers and to the creation of an overall better quality of life. The Plan and Guide for the Design of Complete Streets from PRHTA also recognizes the important role of transportation development for development for the creation of better and livable societies. The Plan’s goals and objectives pretend to achieve habitable communities by improving the transportation system
The framework of vision, goals, and objectives for the 2045 LRTP include Objective 4.3 which relates to “integrated transportation and land use planning for more livable communities and reduced (automobile) travel.” Several other objectives are also supportive of livability in terms of improved connectivity, enhanced integration between and within modes, increased travel choices, reduced congestion and travel time, leveraging the efficiency of prior infrastructure investments, minimizing adverse environmental impacts, reducing greenhouse gas emissions and energy consumption, and enhancing alternative modes and travel demand strategies.
Transportation Demand Management
Transportation demand management (TDM) refers to a set of strategies that are focused on influencing individual travel choices relating to the need for a trip, the Origen and Destination points for the trip, how and when the trip is made. The intention of TDM is to help alleviate travel congestion through lower cost means than major capital investments for physical system capacity.
114 Livability in Transportation Guidebook: Planning Approaches that Promote Livability (FHWA/FTA, 2010).

CHAPTER 7 POLICY GUIDELINES TOWARD THE TRANSPORTATION INFRASTRUCTURE
Final Report December 2018 | 335
Additionally, it provides strategies to increase shared and non-motorized forms of transportation, while addressing the need to reduce congestion and air pollution.
The TDM is an integral component of a Congestion Management Process (CMP). Many TDM strategies can be employed to affect travel demand, Table 7.5 presents these strategies.
Table 7.5: TDM Strategies
TDM Strategies Definitions
Ridership programs Trip matching, carpooling, vanpooling, high-occupancy vehicle lanes.
Transit Usage Improved or new transit services, favourable transit pricing through passes and fares.
Alternatives Modes Encouraging more trips by bicycling and walking, to reduce vehicular trips and to support improved public health.
Telework/Telecommute Programs Replacing commuting with remote work sites relying on telecommunications.
Compressed work weeks Variable work hours to take commute trips out of the peak hour, or to reduce the number of trips.
Parking management Managing parking supply and cost to influence travel choices.
Park & ride facilities Built to support increased use of connecting transit services.
Congestion pricing Dynamic pricing of toll facilities to discourage peak-period trips.
Transit oriented development Mixed-use developments at transit nodes to reduce auto-based trips and increase transit and non-motorized travel.
Source: SDG/PRTHA
The TDM strategies mentioned, are included in the CMP developed for the San Juan TMA and Aguadilla TMA. As that process begins to find specific congestion management projects for implementation, TDM approaches will be considered. Table 7.6 presents several TDM-related projects that have been implemented in Puerto Rico.

CHAPTER 7 POLICY GUIDELINES TOWARD THE TRANSPORTATION INFRASTRUCTURE
Final Report December 2018 | 336
Table 7.6: TDM – Related Projects in Puerto Rico
TDM strategy Project & location
Transit Usage
There has been an increase on the usage of municipal transit services (contrasting a decreased on Público services), most of these services are free to the public. Also, there was a new restructuration of some routes from AMA (routes that were eliminated, were again established), with the purpose of capturing a higher ridership and expanding the coverage of the system.
Congestion Pricing, Transit Usage, and Park-and-Ride Facilities
The reversible dynamic-tolled lanes project on PR-and a new BRT-style Metro Urbano transit service, connecting from the Bayamón Tren Urbano station and a similar project proposed for PR-52.
Transit Oriented Development
PRHTA sponsored several planning studies of TOD development around Tren Urbano stations, and there is supporting legislation in place. It is the hope that, as real estate market conditions improve, results from this planning will begin to be realized.
Alternative modes
PRHTA has develop a Comprehensive Bicycle and Pedestrian Plan as well a Complete Street Plan and Design Guidelines. Both plans promote alternative modes trough a various initiative, publicity and educational campaign.
Source: SDG/PRTHA
Transportation - Land Use Linkage and Scenario Analysis
The prior discussions of livability and transportation demand management highlight the importance of the transportation and land use linkages. In the new era of reduced new construction funding, rising costs for transportation projects, managing an aging population Rico and considering the impacts of natural disasters in accessibility, focusing a portion of transportation project investment on projects that support community development, economic revitalization, and multimodal accessibility can be more effective than conventional roadway capacity projects. These initiatives must be coupled with land use projects that promote affordable housing with mixed land uses and access to transit, in order to effectively reduce the amount of travel needed per person and increase modal split reducing auto dependency. This in turn reduces pollution and energy use. More use of active transportation, such as walking and bicycling, also generates benefits to personal health. Interactions between transportation and land use enhances quality of life, reduces public infrastructure costs, and makes the transportation system more efficient.
One of the challenges is in taking the first few steps toward livability and sustainability. The existing transportation and land use fabric has evolved over decades and represents the collective result of millions of individual decisions about where employment is located, where people choose to live, where they shop and go to school, and how they choose to travel between these places. Changing the shape and character of this urban landscape likewise will require the first successful steps on prototype projects under improved economic and real estate market conditions. Unfortunately, Puerto Rico has experienced a population decline over the last decade, and continued reporting indicates that the decline has continued. The population forecasts for the Island to 2045, as prepared for this LRTP, do forecast an eventual return to a population growth trend, albeit a modest one compared with the present. This will limit to some extent the opportunities for development. There is always, of

CHAPTER 7 POLICY GUIDELINES TOWARD THE TRANSPORTATION INFRASTRUCTURE
Final Report December 2018 | 337
course, movement in the housing, retail, and employment market places even with a stable population as housing stock ages and younger consumers seek different housing and lifestyle options.
Cities across the Island are investigating and investing in the reinvigoration of their traditional town centers, either by renovation of old underutilized buildings or by planning and developing “in-town” projects that offer new development in the city center on vacant and underused land. Some of the several examples across the Island include Fajardo, Bayamón, Caguas, San Juan, Humacao, Carolina, Ponce, and Aguadilla. As noted, even in no growth or slow growth situations, submarkets of the population can be looking for these types of live-work-shop-play walkable community lifestyles. Often such projects can serve as the nucleus for adjacent redevelopment that expands on the success of the initial phase.
Public Health
Numerous studies exist that corroborates the relationship between transportation and health. There is an overall notion that recognizes the importance of promoting active transportation, walking and bicycle riding to develop healthier and more sustainable societies.
The American Public Health Association (APHA)115 reasserts this principle by stating that transportation related decisions affect the citizen’s quality of life: “poor transportation decisions can harm health and are not always fair across all communities”
The APHA has drafted a document116 to suggest the collaboration that needs to exist between this institution and the Metropolitan Planning Organizations (MPOs). Its main objective is to establish a symbiotic relationship between the public health and the transportation sectors. This relationship can be summarized as follows: persons are inclined to walk or use a bicycle if there are (1) available facilities and (2) an adequate and safe environment to perform the activity.
On the other hand, the Federal Highway Administration (FHWA) also recognizes the relationship between transportation and public health. The FHWA highlights the importance of working with professionals in both transportation and health fields to make better decisions in transportation related matters. There is a plan to develop transportation options that help provide citizens with a better quality of life. A resulting healthier society is part of this goal. The referred plan needs to focus in the following117.
• Promote safety;• Improve air quality;• Respect the natural environment;• Improve social equity;• Create additional opportunities for the positive effects of walking, biking, public
transportation, and ride-and vehicle-sharing; and
115 https://www.apha.org/topics-and-issues/transportation.
116https://www.apha.org//media/files/pdf/topics/transport/health_primer_designed.ashx?la=en&hash=532EC626D143DF99445C0726665550CC9BEB0CAD.
117 https://www.fhwa.dot.gov/planning/health_in_transportation/.

CHAPTER 7 POLICY GUIDELINES TOWARD THE TRANSPORTATION INFRASTRUCTURE
Final Report December 2018 | 338
• Conduct research on transportation’s role in improving quality of life.
The FHWA, in collaboration with the Center for Disease Control and Prevention (CDC), has created an important instrument, the Transportation and Health Tool (THT), to provide access to data that can be useful to study how the transportation system is affecting the citizen’s health.
Both, The Complete Street Plan and Design Guidelines and The Cyclist and Pedestrian Integral Plan recognize the benefits of using alternative modes of transportation to help improve people’s health and overall quality of life. These plans seek to improve physical and mental health while promoting more accessible facilities and nonpolluting activities.
The LRTP’s recognition and promotion of the relationship between alternative modes of transportation and public health, through its goals, objectives, The Complete Street Plan and Design Guidelines, The Cyclist and Pedestrian Integral Plan, contributes to achieve the intent stated by the Puerto Rico’s Land Use Plan118, which also advances better health possibilities.
Economic Sustainability
The PRTHA has the duty to develop multimodal transportation projects for the entire Island of Puerto Rico. This agency has faced important challenges in recent years, due to lack of funding for project maturation or expansion.
The PRTHA’s revenue comes primarily from petroleum taxes. This revenue is adversely affected by inflation over time, but also by the development of new technologies that promote more efficient use of fuels. Together with the Island’s economic depression for the last years, the increase in preservation costs and project growth and the agency’s debt that requires large budget designations there are some crucial issues affecting multimodal transportation these days.
In order to improve its fiscal stance, the PRTHA has to comply with the Certified Fiscal Plan from the Fiscal Control Board of Puerto Rico. This certified plan provides special guides to transform the agency’s structure along with the transportation facilities in the Island. The plan establishes that the PRTHA must:
• Transform drastically to achieve its goals;• Improve governance and performance management;• Pursue grater revenue opportunities;• Focus on operational excellence including capital efficiency; and• Reduce traffic to drive economic growth.
To continue developing cost management and debt reduction strategies will help the agency to achieve better financial status in the long term.
118 Puerto Rico’s Land Use Plan – Territory Organization Guides (Board of Planning, 2015).

CHAPTER 7 POLICY GUIDELINES TOWARD THE TRANSPORTATION INFRASTRUCTURE
Final Report December 2018 | 339
LOOKING FORWARD The plan’s main goal is that all users and interested parties benefit from its results. Beyond all financial challenges presented, the LRTP has the interest of improving the transportation system in the Island.
It is crucial to be aware of new legal requirements and federal politics regarding transportation. In this context, the most recent federal transportation legislation, The FAST-Act, in force since December 4, 2015, contains updated guides to assign and manage transportation funds. This recent legislation also presents new concepts to include in the transportation planning process.
The PRTHA needs to improve its financial status to fulfill its role to maintain, administrate and develop the Island’s transportation system. Once a reasonable financial status is achieved, other important actions can be managed through the MPOs. These actions will promote better land use, transportation politics and the foundation for a multimodal transportation orientation. Evolution is always required to continue improving investment capabilities and the transportation system in general.
The following are some important initiatives that the MPOs can trigger in the future:
• Project funding
• Identify local financial sources to assist with federal investment; and• Identify new opportunities in the private and public sectors to finance projects and
accelerate implementation.
• Transportation management
• Maintain the non-motorized transportation crew in order to promote pedestrianand bicycle network improvements, requirements and programs;
• Monitor The Complete Street Plan and Design Guidelines and The Cyclist andPedestrian Integral Plan implementation;
• Create, formalize and administrate a freight transportation work crew;• Active participation in the development of collective and non-motorized
transportation plans;• Coordinate CMP’s integration in transportation planning;• Promote the implementation of ITS applications; and• Support the coordination between DTPW/PRHTA, transportation agencies and the
MPO to improve performance metrics and monitoring, as stated by federalrequirements.
• Sustainability and Livability
• Establish a work crew to help improve land use planning while allowing the PRTHAand the Board of Planning to continue their efforts;
• Identify strategies to promote an intelligent and sustainable growth; and• Promote coordination with federal programs such as the habitability initiative from
HUD/DOT/EPA.
• Communication and Coordination

CHAPTER 7 POLICY GUIDELINES TOWARD THE TRANSPORTATION INFRASTRUCTURE
Final Report December 2018 | 340
• Continue developing the Citizen’s Participation Plan (CPP) to incorporate initiativesin the Island’s communities;
• Develop a digital communication program to allow access to information, meetingcoordination and record keeping of programs and activities; and
• Allow the MPO to serve as an information center and as a coordination entitythrough its committees, by defining its new capabilities.

CHAPTER 7 POLICY GUIDELINES TOWARD THE TRANSPORTATION INFRASTRUCTURE
Final Report December 2018 | 341
CONTROL INFORMATION
Prepared by Prepared for
Steer 1225 Ponce de León Avenue Suite 706 San Juan Puerto Rico 00907 +1 (787) 721 2002 steergroup.com
Puerto Rico Highways and Transportation Authority (PRHTA) PO Box 41269, Minillas Station San Juan, PR00940-1269
SDG project/proposal number Client contract/project number
23028701
Author/originator Reviewer/approver
Yesenia Cruz Cantillo Yilia Baucage-Bou
Other contributors Distribution
Client: SDG:
Version control/issue number Date