Regional Transportation Plan 2005-2030 - Scholars' Bank
354
Rogue Valley Council of Governments Rogue Valley Metropolitan Planning Organization Regional Transportation Plan 2005-2030 April 5, 2005
-
Upload
khangminh22 -
Category
Documents
-
view
0 -
download
0
Transcript of Regional Transportation Plan 2005-2030 - Scholars' Bank

Rogue Valley
Council of Governments
Rogue Valley Metropolitan Planning
Organization
Regional Transportation
Plan 2005-2030
April 5, 2005


i
ACKNOWLEDGMENTS
ROGUE VALLEY
REGIONAL TRANSPORTATION PLAN
Prepared for
ROGUE VALLEY METROPOLITAN PLANNING ORGANIZATION
the City of Medford the City of Central Point
the City of Phoenix the City of Ashland the City of Talent
the City of Jacksonville the City of Eagle Point
White City Urban Renewal Agency Jackson County
Rogue Valley Transportation District Oregon Department of Transportation
and
ROGUE VALLEY COUNCIL OF GOVERNMENTS Board of Directors
Rogue Valley Council of Governments MPO/ Transportation Department
155 North 1st Street / PO Box 3275 Central Point, Oregon
The preparation of this report has been financed in part by funds from the Federal Highway Administration and the Federal Transit Administration, U.S. Department of Transportation and the Oregon Department of Transportation (ODOT), Region 3. The RVMPO and the authors of
this document are solely responsible for the material contained herein.

ii
WWhhoo iiss tthhee RRVVMMPPOO??
Following the 1980 Census, the Greater Medford urbanized area was designated a Metropolitan Statistical Area (an urbanized area with a population in excess of 50,000 persons). Transportation planning activities in such areas must be coordinated through a Metropolitan Planning Organization (MPO). The Rogue Valley Council of Governments (RVCOG) was designated by the Governor of Oregon as the Rogue Valley MPO (RVMPO) in July 1982. Local jurisdictions initially involved in the planning activities of the RVMPO were Central Point, Jackson County and Medford. Phoenix was added to the UZA in 1990 and subsequently became a member of the RVMPO. In the Federal Register, published on May 1, 2002, the Census Bureau added Ashland, Talent, and Jacksonville to the Medford UZA. The Medford UZA now includes; Ashland, Talent, Phoenix, Jacksonville, Medford, Central Point and the unincorporated community of White City, represented by its Urban Renewal Agency. (See Figure 1). The addition of these jurisdictions to the Medford UZA required that the MPO boundaries be expanded 23 USC 134 (c). In addition, the Oregon Department of Environmental Quality, Oregon Department of Transportation, Oregon Department of Land Conservation and Development, Federal Highway Administration, and Federal Transit Administration participate in the MPO process. The total population of the RVMPO portion of the county today is approximately 146,000.
Federal and state transportation planning responsibilities for the RVMPO can generally be summarized as follows:
Develop and maintain a Regional Transportation Plan (RTP) and Transportation Improvement Program (TIP) consistent with state and federal planning requirements.
Perform regional air quality conformity analyses for carbon monoxide (CO), for which the Medford area is a Maintenance Area, and particulate matter (PM10) for which an area corresponding roughly to the expanded MPO boundary is a Non-attainment Area.
Review specific transportation and development proposals for consistency with the RTP.
Coordinate transportation decisions among local jurisdictions, state agencies and area transit operators.
Develop an annual work program.
House and staff the regional travel demand model for the purposes of assessing, planning and coordinating regional travel demand impacts. (NOTE: RVMPO currently contracts with ODOT s Transportation Planning Analysis Unit for modeling services).
The RVCOG Board of Directors has delegated responsibility for RVMPO policy functions to a committee of elected and appointed officials from Central Point, Medford, Phoenix, Ashland, Talent, Eagle Point, Jacksonville, Jackson County, White City Urban Renewal Agency, the Oregon Department of Transportation and Rogue Valley Transportation District. The Policy Committee considers recommendations from advisory committees as an integral part of its decision-making process. RVMPO advisory committees include: the Public Advisory Council (PAC), made up of representatives from a broad range of constituencies; and the Technical Advisory Committee (TAC), made up of jurisdictional Public Works and Planning staff and ODOT.

iii
2005 RVMPO Policy Committee
Art Anderson ODOT Carol Bennett RVTD Dale Petrasek (alternate) Jackson County David Gilmour Jackson County Jim Lewis City of Jacksonville John Morrison City of Ashland Marian Telerski City of Talent Mike Quilty City of Central Point Otto Caster City of Phoenix Russ Groves City of Eagle Point Skip Knight, Vice Chair City of Medford
RVMPO Technical Advisory Committee
Voting Members:
Ashland Maria Harris: Planning Ashland Karl Johnson: Public Works Central Point Tom Humphrey: Community Development Central Point Bob Pierce: Public Works DLCD John Renz Eagle Point Dave Hussell, City Administrator Eagle Point Gary Shipley: Public Works Jackson County Alwin Turiel: Planning Jackson County Veronica Smith: Planning (alternate) Jackson County Dale Petrasek: Roads and Parks Jackson County Paul Korbulic: Roads and Parks (alternate) Jacksonville Jeff Alvis: Public Works Jacksonville Paul Wyntergreen: City Administrator Medford Mark Gallagher: Planning Medford Alex Georgevitch: Public Works Phoenix Denis Murray: Planning Phoenix Jim Wear: Public Works ODEQ Keith Tong ODOT Dan Dorrell: District 8 ODOT Shirley Roberts Talent John Adam: Planning Talent Betty Wheeler: City Administrator RVTD Scott Chancey RVTD Paige West White City Urban Renewal Kelly Madding: Jackson County Urban
Renewal (White City)

iv
Non-voting members:
Federal Highway Administration Jon Young RVMPO Dan Moore
Other participants:
Angela Harding City of Phoenix: Planning Art Anderson ODOT: District 8 Cory Crebbin City of Medford: Public Works Dave Arkens City of Central Point: Community Development David Collier ODEQ David Nordberg ODEQ Eric Niemeyer Jackson County: Roads and Parks Joe Strahl Cities of Talent and Ashland: Public Works John McLaughlin City of Ashland: Planning Jon Young Federal Highway Administration (FHWA) Ken Gerschler City of Central Point: Community Development Ken Norton Oregon Department of Transportation Kurt Olsen City of Medford: Public Works Mike Baker ODOT: Region 3 Paula Brown City of Ashland: Public Works Pieter Smeenk City of Ashland: Public Works Ray Smith City of Ashland: Public Works Sam Ayash ODOT/ Transportation and Analysis Unit (TPAU) Satvinder Sandhu Federal Highway Administration (FHWA) Scott Clay City of Jacksonville: Planning Sherrin Coleman ODOT Steve Oulman DLCD Terry Harbour ODOT, Region 3 Vacant FTA Wayne Elson US Environmental Protection Agency (EPA)
Public Advisory Council
Jim Roos White City Mike Montero Central Point Kay Harrison Central Point Porter Lombard East Medford Glen Anderson East Medford J. Winter Salsig East Medford Walter Wassum West Medford James Kuntz West Medford Steve Roesler West Medford

v
Ed Danehy Jacksonville Mark Earnest Jacksonville John Graves Phoenix Thad Keays Talent Dave Chapman Ashland Andrew Bangsberg Ashland Michael Card Freight Industry Al Willstatter Mass Transit
RVMPO Transportation Planning Department
Dick Converse Craig Anderson Dan Moore Vicki Guarino Chris Olivier Kathy Helmer Pat Foley
RVCOG Administration
Michael Cavallaro, Executive Director Karen Lollis, Administrative Services Coordinator René Sjothun, Office Specialist

vi
Regional Transportation Plan 2005-2030
TABLE OF CONTENTS
Who is the RVMPO?............................................................................................................... ii
Chapter 1: Introduction .......................................................................................................... 1
Chapter 2: The Planning Process.......................................................................................... 14
Chapter 3: Guiding Principles .............................................................................................. 24
Chapter 4: Evaluation Criteria.............................................................................................. 35
Chapter 5: Forecasts of Activity........................................................................................... 38
Chapter 6: Transportation System Management and ITS Element ...................................... 45
Chapter 7: Transportation Demand Management Element .................................................. 57
Chapter 8: Street System Element........................................................................................ 70
Chapter 9: Parking Element ................................................................................................. 84
Chapter 10: Bicycle and Pedestrian System Element........................................................... 90
Chapter 11: Transit System Element.................................................................................. 106
Chapter 12: Land Use Element........................................................................................... 126
Chapter 13: Air Transportation Element ............................................................................ 133
Chapter 14: Rail Transportation Element........................................................................... 150
Chapter 15: Freight Transportation Element...................................................................... 169
Chapter 16: Multimodal Safety Element............................................................................ 189
Chapter 17: Multimodal Security Element......................................................................... 206
Chapter 18: Financial Element ........................................................................................... 220
Appendix A: TPR and TEA-21 Compliance
Appendix B: ODOT / OTC STIP Project Selection Criteria
Appendix C: Alternative Measures
Appendix D: Alternative Highway Mobility Standards
Appendix E: Public Involvement Plan for the MPO
Appendix F: Selected Regional Projects with Long Term Potential
Appendix G: Public Comments and Responses
Appendix H: Agency Comments and Responses
Appendices bound
separately

1
11.. IINNTTRROODDUUCCTTIIOONN
WWhhoo aanndd WWhhaatt iiss tthhee RRoogguuee VVaalllleeyy MMeettrrooppoolliittaann PPllaannnniinngg OOrrggaanniizzaattiioonn??
The Rogue Valley Metropolitan Planning Organization (RVMPO) is a consortium of seven cities and the surrounding area of Jackson County that is within or adjacent to the Medford urban area, plus the Oregon Department of Transportation and Rogue Valley Transportation District. In addition, the Oregon Department of Environmental Quality, Oregon Department of Transportation, Oregon Department of Land Conservation and Development, Federal Highway Administration, and Federal Transit Administration participate in the RVMPO process. Governed by federal law, the RVMPO is responsible for developing long-range, regional transportation planning, and assuring that transportation plans meet federal Clean Air Act standards.
Metropolitan areas of at least 50,000 population are required to form Metropolitan Planning Organizations for transportation planning. The Medford area reached that population threshold in the 1980 Census, and was designated a Metropolitan Statistical Area. As a result, the Rogue Valley Council of Governments (RVCOG) was designated by the Governor of Oregon as the Rogue Valley MPO (RVMPO) on July 27, 1982. Local jurisdictions initially involved in the planning activities of the RVMPO were Central Point, Jackson County and Medford. Phoenix was added to the UZA in 1990 and subsequently became a member of the RVMPO. In the Federal Register, published on May 1, 2002, the Census Bureau added Ashland, Jacksonville, and Talent to the Medford UZA. The Medford UZA now includes; Ashland, Central Point, Eagle Point, Jacksonville, Medford, Phoenix, Talent, and the unincorporated community of White City (see Figure 1-1). Based on the 2000 Census, the population of the Medford UZA is now 128,780. The addition of these jurisdictions to the Medford UZA required that the MPO boundaries be expanded 23 USC 134 (c).

2
FFiigguurree 11--11 RRVVMMPPOO SShhoowwiinngg CCuurrrreenntt aanndd FFoorrmmeerr BBoouunnddaarriieess
Federal and state transportation planning responsibilities for the RVMPO can generally be summarized as follows:
Develop and maintain a Regional Transportation Plan (RTP) and Transportation Improvement Program (TIP) consistent with state and federal planning requirements.
Perform regional air quality conformity analyses and create an air quality conformity determination for carbon monoxide (CO) and particulate matter (PM10) that indicates the RTP is in conformity with the State Implementation Plans (SIPs) for these pollutants.
Review specific transportation and development proposals for consistency with the RTP.
Coordinate transportation decisions among local jurisdictions, state agencies, and area transit operators.
Develop an annual work program.
House and staff the regional travel-demand model for the purposes of assessing, planning, and coordinating regional travel demand impacts.1
The RVCOG Board of Directors has delegated responsibility for RVMPO policy functions to a Policy Committee of elected and appointed officials from Ashland, Central Point, Eagle Point,
1 The RVMPO currently contracts with ODOT s Transportation Planning Analysis Unit (TPAU) for modeling services
3
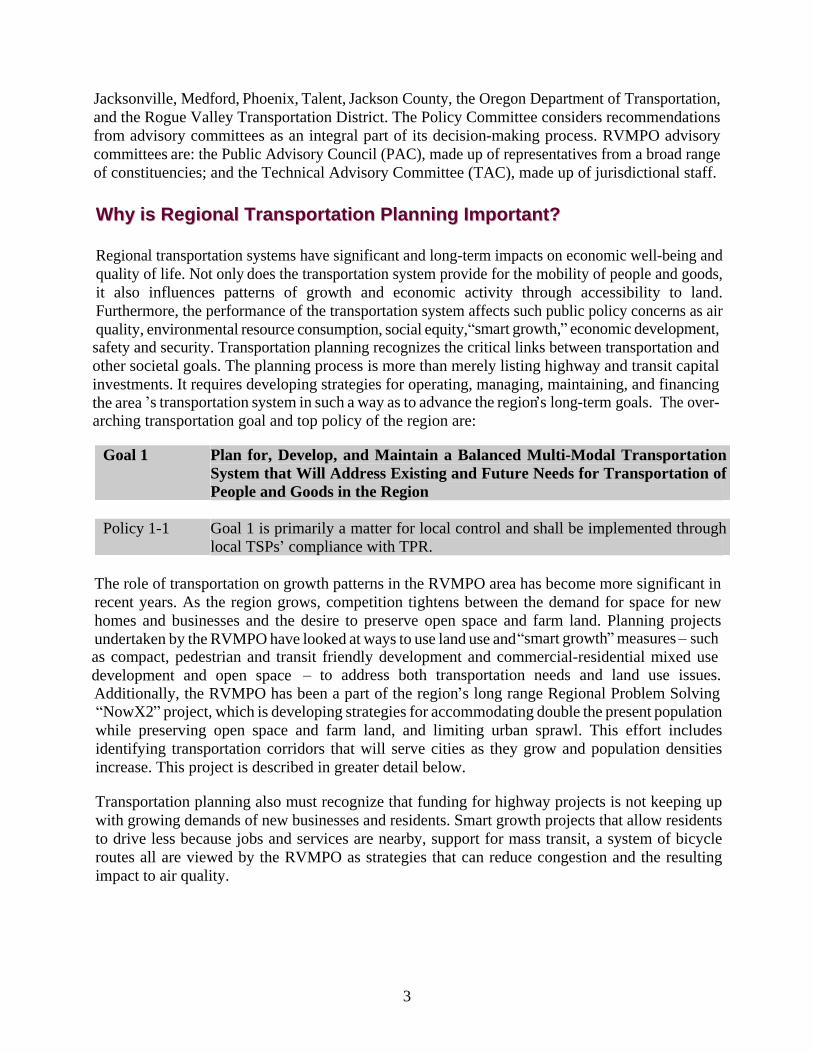
Jacksonville, Medford, Phoenix, Talent, Jackson County, the Oregon Department of Transportation, and the Rogue Valley Transportation District. The Policy Committee considers recommendations from advisory committees as an integral part of its decision-making process. RVMPO advisory committees are: the Public Advisory Council (PAC), made up of representatives from a broad range of constituencies; and the Technical Advisory Committee (TAC), made up of jurisdictional staff.
WWhhyy iiss RReeggiioonnaall TTrraannssppoorrttaattiioonn PPllaannnniinngg IImmppoorrttaanntt??
Regional transportation systems have significant and long-term impacts on economic well-being and quality of life. Not only does the transportation system provide for the mobility of people and goods, it also influences patterns of growth and economic activity through accessibility to land. Furthermore, the performance of the transportation system affects such public policy concerns as air quality, environmental resource consumption, social equity, smart growth, economic development, safety and security. Transportation planning recognizes the critical links between transportation and other societal goals. The planning process is more than merely listing highway and transit capital investments. It requires developing strategies for operating, managing, maintaining, and financing the area s transportation system in such a way as to advance the region s long-term goals. The over-arching transportation goal and top policy of the region are:
Goal 1 Plan for, Develop, and Maintain a Balanced Multi-Modal Transportation System that Will Address Existing and Future Needs for Transportation of People and Goods in the Region
Policy 1-1 Goal 1 is primarily a matter for local control and shall be implemented through local TSPs compliance with TPR.
The role of transportation on growth patterns in the RVMPO area has become more significant in recent years. As the region grows, competition tightens between the demand for space for new homes and businesses and the desire to preserve open space and farm land. Planning projects undertaken by the RVMPO have looked at ways to use land use and smart growth measures such as compact, pedestrian and transit friendly development and commercial-residential mixed use development and open space
to address both transportation needs and land use issues. Additionally, the RVMPO has been a part of the region s long range Regional Problem Solving
NowX2 project, which is developing strategies for accommodating double the present population while preserving open space and farm land, and limiting urban sprawl. This effort includes identifying transportation corridors that will serve cities as they grow and population densities increase. This project is described in greater detail below.
Transportation planning also must recognize that funding for highway projects is not keeping up with growing demands of new businesses and residents. Smart growth projects that allow residents to drive less because jobs and services are nearby, support for mass transit, a system of bicycle routes all are viewed by the RVMPO as strategies that can reduce congestion and the resulting impact to air quality.

4
WWhhaatt iiss tthhee RReellaattiioonnsshhiipp bbeettwweeeenn TTrraannssppoorrttaattiioonn PPllaannnniinngg aanndd MMaaiinnttaaiinniinngg tthhee RRoogguuee VVaalllleeyy ss QQuuaalliittyy ooff LLiiffee??
This section discusses the relationship between density, sprawl and travel patterns. A business-as-usual, auto dominated trend projection won t achieve the region s adopted access and livability goals as expressed in the following policy:
Policy 1-2 Local governments shall improve the equitable accessibility, availability, efficiency, and viability of public and private transportation systems for all users (including disabled, elderly, and children).
This approach is important for a variety of reasons including congestion and the sheer cost of acquiring rights-of-way and building roads to accommodate demand as the population grows to double or more of its present level. Growth trends are continuing strongly, and many jurisdictions feel that state forecasts of population for this region are on the conservative side. The factors that attract inflow of new households to the region do not appear to be abating.
The region has an opportunity, because it is still small, of exploring the option of approaching regional transportation and growth differently than the world s major metropolitan areas, and particularly, differently that most of the U.S. s big cities. The Rogue Valley Metropolitan Area has the opportunity to learn from 50+ years of car-dominated culture across this country and possibly, avoiding some of the mistakes made elsewhere.
Although the horizon year for this Regional Transportation Plan is 2030, growth for the period well beyond is being explored by the RVCOG s Regional Problem Solving Project (RPS). The RPS project seeks to identify issues that must be addressed by the time the region doubles its current population thought to be in the 2050 time frame, although no exact year can be put on this event. A major aspect of the RPS project is land use planning, something not typically undertaken by most Metropolitan Planning Organizations (whose mandate is usually, with some exceptions, transportation planning). In the RPS project, local jurisdictions are determining by what year their current Urban Growth Boundaries (UGBs) will need to be expanded to accommodate growth, or, put another way, they are looking at how much of the anticipated growth can be accommodated within existing UGBs through infill, denser development of vacant land, and denser redevelopment of older properties.
The RPS project has identified a number of transportation facilities that it feels may be needed to serve new growth areas, but until these areas and their densities -- are finalized, the transportation requirements cannot be quantified. As time goes by and the RPS project refines its concepts, it and the RTP will become more closely integrated.
Although the quality-of-life issues motivate much of the RVMPO planning, there also are legal requirements, including Oregon s Transportation Planning Rule (discussed in Appendix A) that prompt the RVMPO to look at a future that s different than the past.

5
WWhhaatt iiss tthhee RRoogguuee VVaalllleeyy RReeggiioonnaall TTrraannssppoorrttaattiioonn PPllaann??
The Rogue Valley Regional Transportation Plan (RTP) is a multi-modal transportation plan designed to meet the anticipated 25-year transportation needs within the Rogue Valley Metropolitan Planning Organization (RVMPO) planning area boundary. The RTP serves as a guide for the management of existing transportation facilities and for the design and implementation of future transportation facilities through the year 2030. The plan is intended to provide the framework and foundation for our transportation future. Policies and project descriptions are provided to enable the governments and residents of the region to understand and track projects that will be needed within the next 25 years. As a regional plan, this document does not provide designs for individual projects. Such details are not within the scope of a regional plan and will be completed on a project-by-project basis with the necessary community involvement and, where necessary, project level air quality determinations.
Figure 1-2 shows the MPO with the basic street and highway hierarchy and Figure 1-3 shows the region s topography.
The RTP uses the best possible projections for future growth and development based on current trends and approved land uses, policies and ordinances. The plan looks at different types of transportation opportunities that are available and potentially beneficial the future, and considers how these various elements could fit together to foster a coordinated system. The RTP focuses on intra-regional (within the region) travel, but also addresses inter-regional (through the region) travel. The street and highway elements of the plan are emphasized in recognition that automobiles and trucks are the predominant mode of transportation today; however, the highway element also plans for connectivity to other modes of travel. The highway system provides for bicycle travel through the addition of upgraded urban streets with bike lanes or other provisions for safe bike travel. The rural roadway improvements specify street widths to accommodate bike lanes or shared shoulders for safe bike travel. Throughout the urban area, sidewalks are proposed for accessible and safe pedestrian travel. In many cases, highway improvements projects include improvements for transit, such as bus pull-out lanes. All of these factors are critical when describing the transportation system. Other elements of the plan cover important aspects of the overall system including transportation system management (TSM), transportation demand management (TDM), freight, rail, air travel, and traffic safety.
Two significant requirements are imposed on the RTP by federal and state mandates. The plan must meet air quality conformity rules and must be financially constrained.
The entire Metropolitan Planning Organization (MPO) is within the Medford-Ashland Air Quality Maintenance Area (AQMA), which is considered in non-attainment for particulate matter (PM10). The Medford Urban Growth Boundary, fully contained within the RVMPO boundary, is a maintenance area for carbon monoxide. These boundary areas are shown in Figure 1-2, AQMA. Because the Rogue Valley MPO is within an air quality maintenance area, the transportation improvements considered and ultimately approved must not degrade air quality. The financial constraint requirements are linked to air quality requirements. The plan must be able to meet the air quality standards with projects and recommended policies that can be implemented within the current funding trends of the region.

§̈¦5
§̈¦5
tu238
tu140
tu66
tu62
Medford
Ashland
Central Point
Eagle Point
Talent
Phoenix
White City
Jacksonville
Gold Hill
Butte Falls
HIGHWAY 140
AG
ATE
HIG
HW
AY 6
2
TAB
LE R
OC
K
MAIN
VILAS
FOO
THI L
L
HIGHWAY 66
PACIFIC
STAGE
HIGHWAY 234
HIG
HW
AY 2
38
BLACKWELL
PINE
KIRTLAND
MEA
DO
WS
PHO
ENIX
HANLEY
CR
ATER
LA
KE
BUTTE FALLS
OLD STAGE
SISKIYOU
8TH
BEALL
BARNETT
ANTELOPE
BROWNSBORO
STEWART
CENTRAL
RIVERSIDE
CO
LUM
BU
S
SAGE
KIN
GS
AVENUE G
TALENT
FRONT
JACKSONVILLE
SHASTA
CADY
ASHLAND
BID
DLE
RILEY
LINN
5TH
NICK YOUNG
TRESHAM
GREGORY
WILSON
ROSSANLEY
2ND
RO
GU
E R
IVER
COLVER
ROGUE VALLEY
UPTON
TAYLOR
HIGHWAY 99
WAGNER CREEK
ROSS
ALTA VISTA
MCANDREWS
10TH
VOO
RH
IES
LITHIA
CALIFORNIA
REE
SE
CR
EEK
HA
MR
ICK
LEA
R
BELLINGER
KER
SHA
W
BROAD
HILTON
LEIGH
OLD S
TAGE
MAIN
MAINMAIN
CR
ATER
LA
KE
HIGHWAY 99
PACIFIC
OLD STAG
E
HIGHWAY 234
HIGHW
AY 238
PACIFIC
HIGHWAY 234
STAGE
O0 1 2 3 4
Miles
Map created on Febuary 16th, 2004
RVMPO 2005 REGIONAL TRANSPORTATION PLAN
L
E
G
E
N
D
Road Classification
Urban Growth Boundary
Water Features
Interstate
Collector
Arterial
Street Classification
AQMA Boundary
Railroad
Medford Airport
F i g u r e 1 - 2
Freeway Ramp
State Highway Local
MPO Boundary

§̈¦5
§̈¦5
tu238
tu140
tu66
tu62
tu234
Medford
Ashland
Central Point
Eagle Point
Talent
Phoenix
White City
Jacksonville
Gold Hill
Butte Falls
AG
ATE
TAB
LE R
OC
K
VILAS
FOO
THI L
L
MAIN
MEA
DO
WS
STAGE
ANTELOPE
B
BLACKWELL
CR
ATER
LA
KE
BEALL
PINE
BUTTE FALLS
KIRTLAND
PHO
ENIX
OLD STAGE
COREY
A
AVENUE G
TALENT
8TH
CO
LVE
R
BARNETTSTEWART
HILLCREST
BROWNSBORO
HOLLY
JACKSON
CO
LUM
BU
S
HA
NLE
Y
RO
GU
E RIV
ER
SPRINGSAGE
MO
UN
TAIN
3RD
KIN
GS
UPT
ON
SHASTA
RILEY
TAYLOR
WAGNER CREEK
ROSS
CHERRYSISKIYOU
D
AR
NO
LD
ROSE
EAGLE MILL
BID
DLE
ALTA VISTA
LINN
RO
YAL
TRESHAM
GREGORY
WILSON
GIBBON
RAPP
E
GR
AN
T
WA
LKE
R
OA
K
JACKSONVILLE
PEA
CH
HU
LL
PIONEER
11TH
DELTA WATERS
LOZI
ER
PENINGER
SCENIC
LONE PINE
POPLA
R
IOWA
HA
MR
ICK
BLA
CK
OA
K
GR
I FFI
N C
REE
K
DUM
P
CLA
YDAKOTA
2ND
MCANDREWS
ATLA
NTI
C
G
VOO
RH
IES
FOSS
CEDAR LINKS
CENTRAL
PAR
K
PAC
IFIC
KE R
S HA
W
CRYSTAL
MU
RPH
Y
FRONT
GRA
NITE
LEA
R
OREGON
WIMER
MERRIM
AN
CROWSON
HOPKINS
BARTON
TOLM
AN
CR
EEK
GO
L F V
IEW
LAU
RE
L
HOLMES
4TH
7TH
LEIGH
STAGE
3RD
CLA
Y
RO
SS
4TH
OLD
STA
GE
BUTTE FALLS
OLD STAG
E
GR
AN
T
MAIN
O0 1 2 3 4
Miles
Map created on January 5th, 2004
RVMPO 2005 REGIONAL TRANSPORTATION PLAN
L
E
G
E
N
D
Urban Growth Boundary
Water Features
Interstate
Highways
Streets
MPO Boundary
Topographical
Rogue Valley International Airport
F i g u r e 1 - 3

8
The plan identifies the basic assumptions through the year 2030, including forecasts of future population and employment, and the resulting demand on the regional arterial and collector street system. The resulting travel demand was determined through a best practices EMME/22 travel demand model. The model is a widely-used, sophisticated planning tool and will be continually refined and updated to ensure that it serves as an effective tool for future updates. The demographic assumptions used with the model are presented in the Forecast Demographics and Travel Demand Element. Other aspects of the model will be described in technical reports and memoranda available from RVCOG.
Ultimately, a 2030 financially constrained transportation system improvement strategy was developed to meet the transportation needs of the region. It is designed to meet the overall transportation needs of the region, based on financial capabilities. The transportation system improvement strategy was reviewed by the TAC and PAC and presented at a public open house.
WWhhyy IIss TThhee RRTTPP NNeecceessssaarryy,, AAnndd WWhhaatt PPllaannnniinngg HHaass BBeeeenn DDoonnee TToo DDaattee??
The RTP is required to ensure that the area remains eligible to receive state and federal funding. The federal and state rules requiring completion and adoption of the plan include the Transportation Efficiency Act for the 21st Century (TEA-21), the Clean Air Act Amendments of 1990, and Oregon s Transportation Planning Rule (TPR). The RTP serves as the regional transportation system
plan required under the TPR. A synopsis of TPR and RTP requirements is included in Appendix A.
To meet federal and state financial requirements, as well as local expectations, the RTP divides the region s transportation projects into two lists, or tiers, relating to the region s financial capability. Projects in the Tier 1 list are within the present financial capabilities of the agencies, meeting the requirement for a constrained plan. Projects in the Tier 2 list are beyond current financial capabilities. The required air quality analysis addressed only the Tier 1 projects. Nonetheless, the entire plan
both tiers of projects
provides the overall vision for the region, taking into consideration the needs anticipated because of planned growth.
Completing and adopting the RTP provides us with a comprehensive guide for the future. By undertaking this plan, we have been compelled to look beyond the three to five years for which we are accustomed to planning and to think in a longer-term perspective. We have tailored our plan to meet the federal and state rules, and we have developed a vision for the future beyond the RTP. Without a clear vision of the future, significant changes to our transportation system will not be possible. The plan is also intended to help us make wise use of limited financial resources.
TThhee RRTTPP iinn aa SSttaatteewwiiddee PPllaannnniinngg CCoonntteexxtt
Several different perspectives have grown from the federal and state guidelines on transportation planning. Oregon has been progressive in its view of land use planning as depicted in the TPR. The
2 EMME/2 is a sophisticated computer model for creating transportation forecasts. It is used in many metropolitan planning organizations and lends itself to testing of scenarios or what-ifs that assume various development patterns, rates of population growth and choices of travel mode. For a more detailed explanation see Appendix E.
9
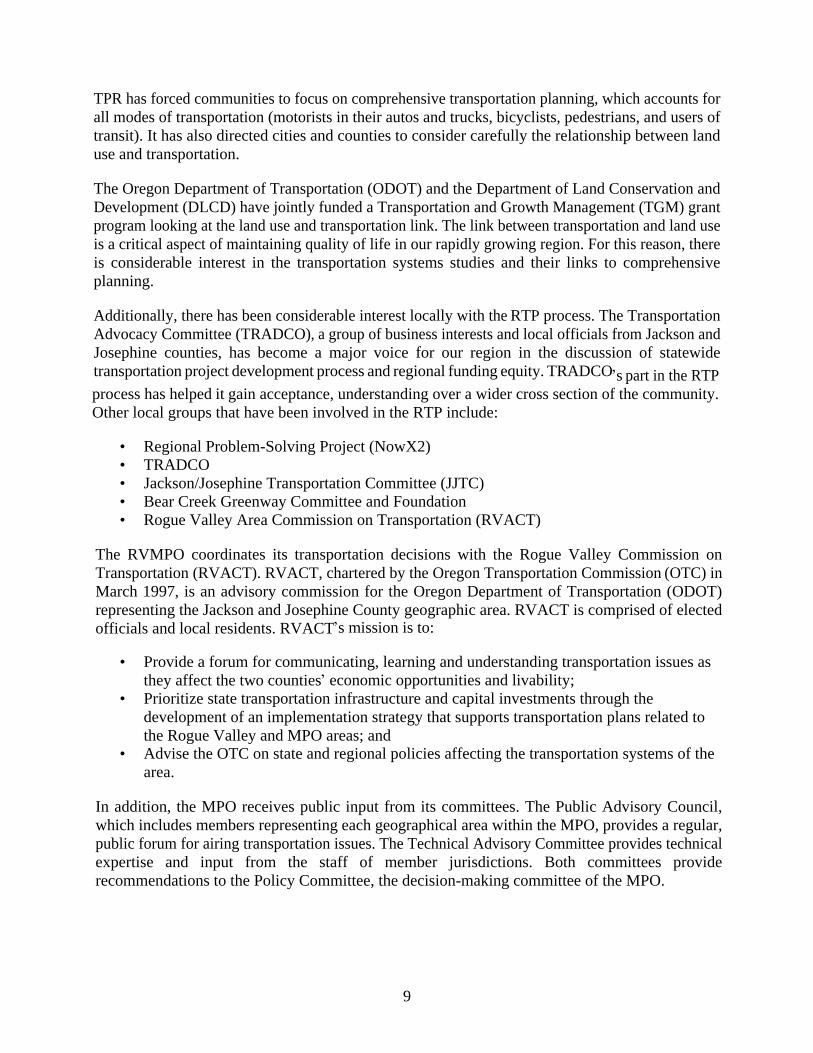
TPR has forced communities to focus on comprehensive transportation planning, which accounts for all modes of transportation (motorists in their autos and trucks, bicyclists, pedestrians, and users of transit). It has also directed cities and counties to consider carefully the relationship between land use and transportation.
The Oregon Department of Transportation (ODOT) and the Department of Land Conservation and Development (DLCD) have jointly funded a Transportation and Growth Management (TGM) grant program looking at the land use and transportation link. The link between transportation and land use is a critical aspect of maintaining quality of life in our rapidly growing region. For this reason, there is considerable interest in the transportation systems studies and their links to comprehensive planning.
Additionally, there has been considerable interest locally with the RTP process. The Transportation Advocacy Committee (TRADCO), a group of business interests and local officials from Jackson and Josephine counties, has become a major voice for our region in the discussion of statewide transportation project development process and regional funding equity. TRADCO s part in the RTP process has helped it gain acceptance, understanding over a wider cross section of the community. Other local groups that have been involved in the RTP include:
Regional Problem-Solving Project (NowX2)
TRADCO
Jackson/Josephine Transportation Committee (JJTC)
Bear Creek Greenway Committee and Foundation
Rogue Valley Area Commission on Transportation (RVACT)
The RVMPO coordinates its transportation decisions with the Rogue Valley Commission on Transportation (RVACT). RVACT, chartered by the Oregon Transportation Commission (OTC) in March 1997, is an advisory commission for the Oregon Department of Transportation (ODOT) representing the Jackson and Josephine County geographic area. RVACT is comprised of elected officials and local residents. RVACT s mission is to:
Provide a forum for communicating, learning and understanding transportation issues as they affect the two counties economic opportunities and livability;
Prioritize state transportation infrastructure and capital investments through the development of an implementation strategy that supports transportation plans related to the Rogue Valley and MPO areas; and
Advise the OTC on state and regional policies affecting the transportation systems of the area.
In addition, the MPO receives public input from its committees. The Public Advisory Council, which includes members representing each geographical area within the MPO, provides a regular, public forum for airing transportation issues. The Technical Advisory Committee provides technical expertise and input from the staff of member jurisdictions. Both committees provide recommendations to the Policy Committee, the decision-making committee of the MPO.

10
WWhhaatt DDooeess TThhee CCoommmmuunniittyy GGeett FFrroomm TThhee RRTTPP??
The community gets the benefit of a planned transportation system that incorporates all of the various transportation modal needs with the existing system. It is expected to provide a solid foundation for continuing our transportation system planning. We must use this foundation to strive for measures that will make a difference for the region. Many of the individual communities have implemented many of the proposed policies outlined in the RTP. Their efforts demonstrate that the transportation improvements really do work. The RTP will provide additional support and strengthen those efforts.
HHooww DDoo TThhee AAffffeecctteedd AAggeenncciieess AAnndd TThhee CCoommmmuunniittyy UUssee TThhee RRTTPP??
Communities should integrate the RTP policies and recommendations into their own comprehensive planning documents, incorporate local needs with the pending regional strategies, and coordinate project completion with other affected agencies. The RTP provides support and validation of some of the local transportation needs. The Transportation Planning Rule requires that each RVMPO member jurisdiction adopt the RTP as a regional plan, and then tailor its comprehensive plan updates to meet the goals and policies identified in the RTP. The Rogue Valley Transportation District (RVTD) is also expected to adopt the updated RTP.
WWhhaatt WWiillll HHaappppeenn TToo TThhee RRTTPP IInn TThhee FFuuttuurree??
The MPO Policy Committee guides the development, updates, and amendments of the plan and serves as the coordinating and problem-solving body during the RTP planning processes. The Policy Committee is in a position to help as the agencies seek to implement essential provisions and to seek ways to build the projects listed in it. Because of the strong implications for funding our transportation needs, we must ensure this document remains alive and is not just a reference or study. Taking current information and priorities into consideration, this document will be adjusted over time under the guidance of our community leaders.
RRTTPP UUppddaattee CCyyccllee
Every three years (as long as we remain in an air quality non-attainment area), we are required to review, validate, and update the plan. Plan updates give the MPO the opportunity to evaluate past projections for growth and anticipated use of the system. During the plan update process, we compare the existing land use, recent development trends, and the use of the different modal components of the transportation system. We use this new perspective to refine growth projections and determine their implications. This provides a basis on which to modify the plan. These minor changes are essential to protecting the accuracy of the plan. In addition, planning sometimes requires a change of direction, including updated goals, policies, or other fundamentals. Such changes require a more in-depth planning process, and, therefore, constitute a major plan update. The following update cycle reflects these varying needs by allowing for major and minor updates as needed. The TEA-21 Reauthorization bills now before Congress acknowledge that a 2-year update cycle for the TIP, coupled with a 3-year update cycle for the RTP, leads to a difficult amalgam of dates. Congress may shift to a 5-year cycle for both, in non-attainment areas. If this happens, the next RTP will be due in 2010; if the 3-year cycle remains in place the next update will be required in early 2008.
11
Amendments to the plan can be made between the updates. Each time a major amendment is made, the plan must go through the rigors of an air-quality conformity determination and a financial-constraint determination. It is anticipated that only large projects that would conceptually change the RTP would require a plan amendment.
The region also has the Transportation Improvement Program (TIP) that dovetails with the State s Transportation Improvement Program (STIP), which is updated every two to three years. The STIP primarily sets the funding direction for transportation projects using federal and state funds.
SSuummmmaarryy
Change is inevitable. The question is not if growth will occur, or even when it will occur. The question is how best to manage the impact of growth as it happens. Can we progress from potential gridlock toward a thoughtful, systematic, and affordable plan to keep people and goods moving efficiently from one place to another? Can we address the air quality issues facing the valley? The RTP is an attempt to plan in a different way. The plan represents thousands of hours of community, staff, and elected officials time. It provides a coordinated, comprehensive look into the future as our communities continue to grow.
This RTP takes all of the ideas, all of the potential growth factors, and all of the desires from the various communities and entities, and provides a sense of structure. It is a solutions guide for the Metropolitan Planning Organization. Not just a road and highway plan, the RTP looks at all of the transportation opportunities - cars, buses, bicycles, pedestrian paths, air travel, rail, and various combinations of transportation methods. The RTP is not just a wish list; it is a financially constrained plan, meaning that the projects proposed can be financed with existing and anticipated resources. Although not all of the needs can be funded, the RTP identifies concerns and projects beyond the immediate availability of known funding trends. The RTP also meets federal and state air quality requirements.
The RTP provides answers and potential solutions, yet places the burden of implementation back into the hands of the community and our elected officials. Individual project designs are left to the respective communities to develop over time according to their needs and opportunities. Policies are identified throughout the plan that address alternative transportation uses, land use changes, agency coordination, system management and other transportation related concerns.
TThhee RRTTPP iinn aa NNuuttsshheellll
Areas served:
Cities of Ashland, Central Point, Eagle Point, Jacksonville, Medford, Phoenix, and Talent.
Jackson County area roughly within the Air Quality Maintenance Area and including the White City urbanized area.

12
Metropolitan Planning Organization Agency Members:
Ashland
Central Point
Eagle Point
Jacksonville
Medford
Phoenix
Talent
Jackson County
RVTD
ODOT
MPO Population:
Current population (2005) within the MPO is around 154,000, projected to rise to around 214,000 by 2030.
Transportation System Improvement Strategy:
Ensure most efficient use of current practices for transportation system management
Maximize efforts through transportation demand management
Reduce overall travel or shift from single auto use
Encourage telecommuting, carpooling, and transit use
Promote staggered work hours or different work schedules
Expand pedestrian and bicycle facilities and connectivity
Modify land use options to encourage mixed land use
Higher priority shall be placed on preservation of the existing street system through maintenance than on added capacity.
Transportation System Improvements:
All projects identified are considered regionally beneficial. They include road, bicycle and pedestrian improvements. Transit improvements are detailed separately in Chapter 8.
FFiigguurree 11--44 RRTTPP PPrroojjeecctt LLiisstt SSuummmmaarryy Location Phase # Projects Cost Ashland Tier 1 Short Range 18 $3,545,000
Tier 1 Medium Range 4 $2,035,000
Tier 1 Long Range 13 $6,048,000
Tier 2 22 $32,411,000
Central Point Tier 1 Short Range 8 $5,547,000
Tier 1 Medium Range 6 $2,050,000
Tier 1 Long Range 7 $5,588,000
Tier 2 8 $7,455,000
Eagle Point Tier 1 Short Range 4 $1,053,000
Tier 1 Medium Range 1 $150,000

13
Location Phase # Projects Cost Tier 1 Long Range 0 0
Tier 2 15 $11,772,000
Jacksonville Tier 1 Short Range 1 $15,000
Tier 1 Medium Range 0 0
Tier 1 Long Range 1 0
Tier 2 0 $6,000,000
Medford Tier 1 Short Range 51 $47,365,000
Tier 1 Medium Range 16 $21,205,000
Tier 1 Long Range 11 $11,555,000
Tier 2 19 $67,370,000
Phoenix Tier 1 Short Range 7 $1,567,000
Tier 1 Medium Range 7 $1,290,000
Tier 1 Long Range 11 $4,650,000
Tier 2 0 $20,000,000
Talent Tier 1 Short Range 11 $2,530,000
Tier 1 Medium Range 5 $1,840,000
Tier 1 Long Range 4 $3,950,000
Tier 2 5 $5,200,000
Jackson County Tier 1 Short Range 18 $33,620,000
Tier 1 Medium Range 11 $13,155,000
Tier 1 Long Range 22 $38,990,000
Tier 2 0 0
ODOT Tier 1 Short Range 13 $184,826,000
Tier 1 Medium Range 2 $13,100,000
Tier 1 Long Range 3 $46,940,000
Tier 2 14 $107,930,000
Tier 1 total
$452,614,000
Tier 2 total
$258,138,000
When the RTP was first drafted in 1995, the majority of projects that fell within the definition of the financially constrained plan were within Medford s city boundaries, followed by the next largest grouping of projects for ODOT facilities and Jackson County facilities. The smaller jurisdictions, Central Point and Phoenix, had extremely limited capabilities to match funds.
Since 1995, Central Point, Phoenix, Ashland and Talent have implemented street System Development Charges (SDCs). Implementation of SDCs has significantly changed the financial forecast for each of these cities. In addition, several jurisdictions have funds available for transportation from their Urban Renewal agencies. Also, many jurisdictions are encouraging a growing number of developer-financed projects. With this improved funding outlook, communities can better meet their forecast transportation system needs.

14
22.. TTHHEE PPLLAANNNNIINNGG PPRROOCCEESSSS
IInnttrroodduuccttiioonn
The 2005-2030 RTP update builds upon a series of technical analyses documented in technical reports from the 1995, 2000, and 2002 RTP planning processes. The current process was guided by systematic input and reviewed by the staff of the RVMPO, the MPO Technical Advisory Committee, the MPO Public Advisory Council, and the public. The steps of the planning process are summarized in the following discussion.
GGuuiiddiinngg PPrriinncciipplleess
The following goal and policies guide the planning process3:
Goal 7 Provide an Open, Balanced, and Credible Process for Planning and Developing a Transportation System that Complies With State and Federal Regulations
Policy 7-1 Local governments shall reduce reliance on the automobile as required by the Transportation Planning Rule.
Policy 7-2 Coordinate the planning for existing and future land use and development with the planning of the transportation system.
Policy 7-3 Provide a process to encourage a representative cross-section of the regions residents in planning the regional transportation system -- ensuring that plans address public values and are responsive to changing needs. Through policies and procedures that encourage cooperation and coordination, build ongoing
3 See Chapter 3 for the entire list of RTP goals and policies.

15
communication and education among communities and among residents within each community.
Policy 7-4 The Rogue Valley Regional Transportation Plan shall be consistent with the adopted elements of the Oregon Transportation Plan.
Policy 7-5 Local transportation plans will be consistent with those developed at the regional and state level.
Policy 7-6 Local governments shall coordinate transportation planning and construction efforts with those of the RVMPO.
FFeeddeerraall RReeqquuiirreemmeennttss aanndd MMeettrrooppoolliittaann PPllaannnniinngg OOrrggaanniizzaattiioonn ((MMPPOO)) DDeessiiggnnaattiioonn
The 1962 Federal Aid Highway Act required that all federally funded highway projects be based on a continuing, comprehensive, and coordinated (3-C) planning process involving states and local agencies. States may designate MPOs to carry out the 3-C planning process in urban areas with populations of at least 50,000 people.
Medford became a Census defined Urbanized Area (UZA) in 1980. In 1982, the Governor designated the Rogue Valley Council of Governments as the MPO for the greater Medford area. The area became eligible for this designation following the 1980 census, when the urbanized area population surpassed 50,000 for the first time. The Rogue Valley Metropolitan Planning Organization (RVMPO) was formed in 1981 with membership including: Medford, Central Point, Jackson County, RVTD and ODOT.
RVCOG's Board of Directors delegated responsibility for policy functions to a committee of elected officials representing the MPO communities and affected agencies. Phoenix was added to the UZA in 1990 and also became a member of the MPO. In the Federal Register, published May 1, 2002, the Census Bureau added the cities of Ashland, Talent and Jacksonville to the Medford UZA. The City of Eagle Point elected to join the RVMPO on a voluntary basis in 2003. In 2005, the RVMPO includes Ashland, Talent, Phoenix, Jacksonville, Medford, Central Point, Eagle Point, Jackson County, RVTD and ODOT.
Under existing federal and state legislation, the MPO is responsible for some transportation planning functions, including development and maintenance of a Regional Transportation Plan (RTP). Following is a brief discussion of these issues to illustrate how the RTP fits into the MPO process.
OOrreeggoonn TTrraannssppoorrttaattiioonn PPllaannnniinngg RRuullee CCoommpplliiaannccee
In order to carry out Statewide Planning Goal 12: Transportation, the State of Oregon developed the Transportation Planning Rule (TPR). The TPR requires MPO areas to avoid principal reliance on any one mode of transportation and to reduce principal reliance on the automobile. In December of 2001, the MPO adopted a set of alternative measures to show how this requirement is being

16
met. Figure 2-1 shows the measures. The MPO will need to work closely with the jurisdictions to implement and track these changes. See Appendix B for more information on the alternative measures.
FFiigguurree 22--11 AAlltteerrnnaattiivvee MMeeaassuurreess SSuummmmaarryy
Measure How Measured 2000 2005 Benchmark 2010
Benchmark 2015
Target 2020
Measure 1: Transit and bicycle/pedestrian mode share
The percent of total daily trips taken by transit and the combination of bicycle and walking (non-motorized) modes. Determined from best available data (e.g., model output and/or transportation survey data).
% daily trips
transit:
% daily
trips
transit:
% daily trips
transit:
% daily trips
transit:
% daily
trips
transit:
Measure 2: % Dwelling Units (DUs) w/in ¼ mile walk to 30-min. transit service
Determined through GIS mapping. Current estimates are that 12% of DUs are within ¼ mile walking distance of RVTD transit routes.
12% 20% 30% 40% 50%
Measure 3: % Collectors and arterials w/ bicycle facilities
Determined through GIS mapping. Current estimates are that 21% of collectors and arterials in the MPO have provisions for bicyclists.
21% 28% 37% 48% 60%
Measure 4: % Collectors and arterials in TOD areas w/ sidewalks
Determined through GIS mapping. Current estimates are that 46% of collectors and arterials in TOD areas have sidewalks.
47% 50% 56% 64% 75%
Measure 5: % Mixed-use DUs in new development
Determined by tracking building permits - the ratio between new DUs in TODs and total new DUs in the region.
0% 9% 26% 41% 49%
Measure 6: % Mixed-use employment in new development
Estimated from annual employment files from State
represents the ratio of new employment in TODs over total regional employment.
0% 9% 23% 36% 44%
Measure 7: Alternative Transportation Funding
Funding committed to transit or bicycle/pedestrian/TOD projects. Amounts shown represent ½ of the MPO s estimated accumulation of discretionary funding (STP).
N/A $950,000
$2.5 Million $4.3 Million $6.4 Million
TThhee CCoommmmiitttteeee PPrroocceessss
The RVMPO functions under the guidance and direction of three committees that meet regularly and address all decision issues relating to the RVMPO s function. Each committee operates under its own set of bylaws, last updated and adopted in June 2003. Committee makeup, roles and responsibilities are described below. Committee memberships were listed in the opening pages of this document.

17
Policy Committee
The Policy Committee is the decision-making body for the RVMPO. It is composed of elected officials from each of the affected jurisdictions, Medford, Central Point, Ashland, Talent, Jacksonville, Eagle Point and Phoenix, Jackson County, Rogue Valley Transportation District (RVTD), plus an ODOT representative. The Policy Committee continued to meet generally monthly, during the update of the RTP.
Technical Advisory Committee
The Technical Advisory Committee (TAC) is responsible for gathering, reviewing, and validating technical information and data used in RVMPO functions, including this update of RTP. The TAC includes staff members from Medford, Central Point, Ashland, Talent, Jacksonville, Eagle Point and Phoenix, Jackson County, White City Urban Renewal Agency, RVTD, ODOT, the Department of Environmental Quality (DEQ), the Department of Land Conservation and Development (DLCD), and the Federal Highway Administration (FHWA).
Public Advisory Council
The RVMPO s Public Advisory Council (PAC) makes recommendations independently to the Policy Committee from the public s perspective on proposed long-range transportation plans and priorities for state and federal funding and other transportation issues. The MPO planning area is subdivided into nine Citizen Involvement Areas (CIAs). These areas are shown on Figure 2-2. From each CIA, the RVMPO identified Public Advisory Council (PAC) representatives, based on population. PAC members are appointed by the Policy Committee to serve two-year terms. In addition, at-large PAC positions represent mass transit, freight industry, minority community and low-income community interests.
PPuubblliicc IInnvvoollvveemmeenntt
RVMPO Public Involvement Plan
In May of 2001, the RVMPO adopted a Public Involvement Plan (See Appendix E) with the goal to provide a cooperative and collaborative transportation planning process that gives residents a voice in shaping the region s future. The plan also allows for the MPO to meet the requirements of the Transportation Efficiency Act for the 21st Century (TEA-21), which calls for a proactive public involvement process that provides complete information, timely public notice, full public access to key decisions, and supports early and continuing involvement of the public in developing plans. In addition, the RVMPO completed a Citizens Guide to Transportation Planning, which provides an easily understandable overview of the regional transportation planning process.

18
Public Involvement for the RTP Update Process
Public involvement and community input were important factors in updating the RTP. Through the public involvement program, transportation needs were identified and consensus was developed on system improvement strategies. Local public agency staff, the Public Advisory Council, the Policy Committee and public participants guided the planning effort for the 2005- 2030 RTP. Representatives from all member agencies participated in and contributed to the update.
Community outreach for the RTP update included an Open House in December 2004 and regular updates to RVMPO member jurisdictions. In addition, the Public Advisory Council (PAC) helped review technical work forming part of the update. TRADCO, primarily a group of business and community leaders, along with elected officials and city staffs of Jackson and Josephine counties, also was a sounding board for the RTP update process.
The PAC served as the community forum to gather information from their constituent base and to help develop public consensus on the updated plan and the planning process. They also helped the RVMPO define local issues and potential solutions to transportation problems. Recommendations from PAC meetings were provided to the Policy Committee, particularly on the Guiding Principles, where they worked jointly with the TAC to craft a final proposal.
RVCOG staff made a variety of presentations at city council and board of directors meetings, planning commission meetings, Jackson County Board of Commissioners discussions, an open house, and various other meetings to discuss the plan and receive input from community members. The public involvement program also included public notices of all TAC and Policy Committee meetings during the RTP update. A public open house and public hearing with extensive displays and opportunities for the public to comment were held at the Medford public library. The public involvement process, in addition to being a federal and state planning requirement, was a high priority of RVMPO and all of the local agencies involved in the update of the RTP.

§̈¦5
§̈¦5
tu238
tu140
tu66
tu62
tu234
Medford
Ashland
Central Point
Eagle Point
Talent
Phoenix
White City
Jacksonville
Butte Falls
20
AG
ATE
HIGHWAY 140
HIG
HW
AY 6
2
TAB
LE R
OC
K
ANTELOPE
ANTIOCH
MO
DOC
VILAS
HIG
HW
AY 66
FOO
THIL
L
MAIN
PACIFIC
PIONEER
HIGHWAY 234
WA
GN
ER C
REE
K
STAGE
HIG
HW
AY 2
38
BLACKWELL
STERLIN
G C
REEK
BEALL
KIRTLAND
MEA
DO
WS
PINE
PHO
ENIX
HA
NLE
Y
SCENIC
TOLO
OLD STAGE
CRATER LAKE
COREY
AVENUE G
BUTTE FALLS
SISKIYOU
COLVER
8TH
BARNETTSTEWART
HILLCREST
REE
SE C
REE
KPA
YNE
CENTRAL
JACKSON
HOLLY
BEAVER CREEK
SPRINGM
OU
NTA
INSAGE
KIN
GS
UPT
ON
3RD
RILEY
GR
IFFI
N C
REE
K
CHERRYJACKSONVILLE
ROSS
FOSS
CADY
AR
NO
L D
EAGLE MILL
ROSE
D
ALTA VISTA
AVENUE A
GREGORY
RO
GU
E R
IVER
WILSON
RAPP
CARPENTER HILL
OAK
LOZI
ER
PENINGER
HA
MR
ICK
HIGHWAY 99
BLA
CK
OA
K
CLA
Y
ATL A
NT I
C
CEDAR LINKS
LAKE CREEK
KER
SHAW
CRYSTAL
MU
RPH
Y
WIMER
BU
RSE
LL
FS 20
ELM
SISKIYOU
HIGHWAY 99
PACIFIC
OLD STAGE
HIGHWAY 234
RO
SS
STAGE
BUTTE FALLS
ANTELOPEANTELOPE
O0 1 2 3 4
Miles
Map created on Febuary 22, 2004
RVMPO 2005 REGIONAL TRANSPORTATION PLAN
L
E
G
E
N
D
Road Classification
Freeway RampUrban Growth Boundary
Water Features
Interstate
Major Collector
Minor Arterial
Citizen Involvement Areas
Citizen Involvement Areas
Streets (Lower Tier Collectors and Local)
F i g u r e 2 - 2
Principal Arterial

20
DDooccuummeenntt RReeqquuiirreemmeennttss
The update of the RTP is designed to meet the requirements of the federal TEA-21, and the Statewide Planning Goal 12 and its implementing division, the Transportation Planning Rule (OAR Chapter 660, Division 12). In addition, the regional plan must be consistent with the Oregon Transportation Plan. This set of relationships is described more fully below and in Figure 2-3.
Transportation System Plan Hierarchy a) Oregon Transportation Plan (OTP)
Includes goals & policies for all modes of transportation, i.e., highways, aviation, freight, rail, transit, bicycle/ pedestrian, etc.
b) Oregon Highway Plan (OHP)
Guides how the state highways will develop and be managed over a 20-year period. c) State Transportation Improvement Program (STIP)
Covers three years; updated every two years d) Regional Transportation Plan (RTP)
Multi-modal transportation plan designed to meet the anticipated 20-year transportation needs within the MPO boundary
e) (Metropolitan) Transportation Improvement Plan (M) (TIP)
Covers the first three years of the RTP; updated every two years and must be consistent with the STIP.
f) Local TSPs
Plans that meet 20-year transportation needs within jurisdiction boundaries; updated every 5-10 years.
Consistency Requirements (examples) a) TPR Consistency
OTP, RTP & TSPs must be consistent; no timetable in place for how soon after publication the other plans must be made consistent.
b) Local & regional TSPs consistency with OHP policies including:
OHP Highway Mobility Standards
Access Management
Policy 1B - Land Use & Transportation (integrating land use and transportation)
Policy 1G Investment Policy (improve system efficiency and management before adding capacity).
c) TSP consistency with RTP
RTP is TSP for the MPO
TSPs needs to be consistent with RTP policies, strategies (i.e., alternative measures, population/employment projections, modeling)
Financial constraint - Tier 1 & 2 project lists (should be the same as the RTP, unless new revenue is identified)
d) RTP consistency with TSP
Changes to local project lists (amend RTP)
MPO involved in TSP development (review and comment)

21
FFiigguurree 22--33 OOrreeggoonn TTrraannssppoorrttaattiioonn SSyysstteemm HHiieerraarrcchhyy
CCoooorrddiinnaattiioonn ooff TTrraannssppoorrttaattiioonn DDeecciissiioonnss
A significant responsibility of the MPO is to coordinate transportation discussions and decisions among the public and appropriate federal, state, and local agencies. The RTP provides a framework for these discussions.
Local, state, and federal representatives sit at the table together in two forums. The Technical Advisory Committee comprises staff members from local MPO agencies and jurisdictions, the Oregon Department of Transportation, Oregon Department of Environmental Quality, Department of Land Conservation and Development, and the Federal Highway Administration. This group is responsible for providing technical guidance and input into the MPO planning process, and for making formal recommendations to the Policy Committee. Staff members bring their individual community issues to the technical review discussions. The MPO Policy Committee is responsible for balancing specific jurisdictional concerns with the overall regional needs. Both groups have helped complete the RTP, and will assist with the implementation of the plan once it is adopted.
AAnnnnuuaall PPllaannnniinngg WWoorrkk PPrrooggrraamm
The MPO is required to develop an annual Unified Planning Work Program (UPWP) that details planning projects and studies to be undertaken during the fiscal year. Agencies that review and approve the work program are the MPO Policy Committee and Technical Advisory Committee, Oregon Department of Transportation, Federal Highway Administration, and Federal Transit Administration. The work program provides the framework for managing the MPO and establishing direction for future activities. Future updates to the Regional Transportation Plan will be identified and included in the UPWP.
Oregon Transportation Plan
(OTP)
Oregon Highway Plan (OHP)
Rogue Valley Regional Transportation Plan (RVRTP)
Oregon Department of Land
Conservation and Development
Transportation Planning Rule
(TPR)
Local Transportation System Plans (TSPs) MPO Member Jurisdictions:
RVTD, Medford, Jackson County, White City Urban Renewal Agency, Central Point, Eagle Point, Phoenix, Talent, Ashland, & Jacksonville
22
TTrraannssppoorrttaattiioonn IImmpprroovveemmeenntt PPrrooggrraamm
The Transportation Improvement Program (TIP) is a schedule of transportation projects for the MPO area. Federal rules require development of a coordinated, prioritized, and financially constrained TIP. Participants in this process must include the MPO, ODOT, DEQ, DLCD, and affected transit operators. Once developed and approved, the TIP is updated at least every two years and approved by the MPO and the Governor. The MPO is responsible for administering all amendments to the TIP, including consultation with the appropriate agencies and providing opportunities for public comment.
All projects scheduled in the TIP must first be included in the RTP. Only projects included in the short-range list of the financially constrained plan were considered for inclusion in the 2006-2009 TIP. The TIP includes a four-year forecast of transportation projects.
AAiirr QQuuaalliittyy CCoonnffoorrmmiittyy AAnnaallyysseess
The Rogue Valley has been designated by the US Environmental Protection Agency (EPA) as a non-attainment area for carbon monoxide (CO) and particulate matter (PM10). The specific boundaries for these areas are shown in Figure 1-1 in Chapter 1, Introduction.
Federal rules require completion of an air quality conformity determination as part of the RTP and TIP approval process. Simply put, the conformity determination must demonstrate that the RTP and the TIP do not include projects that will degrade the air quality of the region. The conformity determination is made by the MPO Policy Committee, and then evaluated for completeness and reasonableness by the USDOT (Federal Highway Administration and Federal Transit Administration), with consultation from the Environmental Protection Agency. The MPO confers with the Oregon Department of Environmental Quality to develop the conformity document. Regionally significant projects in the RTP and within the PM10 non-attainment area, whatever the funding source, cannot be constructed until the conformity determination is acknowledged by FHWA.
LLooccaall TTrraannssppoorrttaattiioonn SSyysstteemm PPllaannss
The RTP will be implemented by local jurisdictions through individual transportation system plans and the development review processes. Some implementation work has already been completed. The MPO Policy Committee and Technical Advisory Committee will serve as the regional forums to discuss RTP implementation and links to individual transportation plans. The projects in the RTP are derived in major part from local TSPs, which have had extensive local discussion and review.
TTrraannssppoorrttaattiioonn DDeemmaanndd FFoorreeccaassttss
A new best practices travel demand model was developed prior to the 2002 RTP update. RVMPO staff developed the model with the assistance of ODOT s Transportation Planning and Analysis Unit (TPAU). The model is sophisticated and requires significant data definition and input.

23
A travel demand model is a tool that can accurately replicate existing transportation conditions and evaluate future year development and infrastructure scenarios. To replicate traffic patterns as they are today, essential inputs include the existing roadway network, recent traffic counts, and current population and employment information. Once these data have been entered, the model simulates current traffic patterns within a small percentage of error of those observed. Comparing its results to actual known levels is a way to validate the model.
The next step in the modeling process involves projections for future population distribution, employment locations, and any changes in travel behavior. Household and employment data are forecast for target future years. Using these inputs, the model is able to derive future capacity limitations relative to the current roadway system. Once these deficiencies are identified, potential network changes are evaluated by rerunning the model with the modified transportation network. A range of different street networks, and even different land use patterns, may be tested this way. Although this description is somewhat over-simplified, it demonstrates the usefulness of the model as a tool. Future-year traffic projections are based on numerous assumptions about how population, employment, automobile operating costs and other factors, will change over time. As such, future year projections are only as good as the assumptions that are made. Every effort has been made to ensure that the assumptions used in the development of RVCOG's travel demand model are as reasonable and accurate as possible.
For the purposes of evaluating the future year roadway improvements, a series of model runs, for 2005, 2008, 2015, 2020 and 2030 was conducted. A complete analysis of the future conditions required the preparation of future year street networks and land use scenarios that are based on the RTP project list and the population and employment assumptions described above. The baseline network is comprised of the road system as it existed in 2002, plus all regionally significant projects that are under construction. This represents the baseline, or no-build network, against which the
build networks are evaluated.
In parallel with this analysis, a financially constrained transportation system improvement strategy was developed. This was done by estimating the availability of transportation funding for projects in the RVMPO and then comparing these amounts to the estimated project costs. The initial wish list of potential projects was thereby winnowed down to those these that can be built within the Plan s timeframe. This is known as the financially-constrained or Tier 1 list and is divided into short (2005-2009), medium (2010 to 2015) and long range (2016 to 2030) timeframes. Projects which have been identified but for which there is no available funding in the period through 2030 are shown unfunded or Tier 2 which immediately follows the projects on Tier 1 list for each RVMPO jurisdiction. Tier 2 projects are not considered planned projects and are included for informational purposes only.
Transportation system transportation system improvements were developed by starting with local Transportation System Plans (TSPs) in conjunction with the goals and policies (detailed in Chapter 3: Guiding Principles) and the evaluation criteria (described in Chapter 4: Evaluation Criteria). The recommended transportation system improvement strategy forms the basis for the updated RTP. The projects that occupy the main part of this strategy are identified in Chapter 8: Street System Element and, in particular, in the Figure in that Chapter titled RVMPO 2005-2030 Street System Projects.

24
33.. GGUUIIDDIINNGG PPRRIINNCCIIPPLLEESS
IInnttrroodduuccttiioonn
The Guiding Principles direct the development and evaluation of the Regional Transportation Plan. They also serve to guide the implementation of the Plan. They will be used as a measuring stick to judge how well the final plan reflects values expressed by the community.
The Metropolitan Planning Organization (MPO) Policy Committee, with recommendations and suggestions from the Technical Advisory Committee and the Public Advisory Committee, developed and adopted the Guiding Principles at the start of the project. As part of the most recent update, the Guiding Principles were reviewed and updated to assure that they reflect current regional priorities for the RTP. This was a very extensive review of the 2002 Goals and Objectives, together with the 2002 Policies expressed in each pert inent chapter.
As part of this process, staff went back to the guiding principles provided by the higher levels of government that direct the production and content of this regional Plan. The work began by examining the planning factors required of MPOs under TEA 21, which are as follows:
1. Support the economic vitality of the metropolitan area, especially by enabling global competitiveness, productivity, and efficiency.
2. Increase the safety and security of the transportation system for motorized and non-motorized users.
3. Increase the accessibility and mobility options available to people and for freight. 4. Protect and enhance the environment, promote energy conservation, and improve quality
of life. 5. Enhance the integration and connectivity of the transportation system, across and
between modes, for people and freight. 6. Promote efficient system management and operations, and 7. Emphasize the preservation of the existing transportation system.
Next the guidelines from the state level were factored in; the Transportation Planning Rule (TPR) requires three main elements:

25
1. Less auto dependency 2. Consistency among local, regional, and state transportation planning, and 3. A coordinated planning process.
Thirdly, the work reviewed TSPs that have been prepared since the 2002 RTP and identified policies worthy of adding at the regional level. Finally, the analysis re-examined the goals, objectives, and policies contained in the 2002 RTP.
Using these various source materials, the goals were finalized into ten areas, each with a subset of related policies. The TAC performed initial review; the PAC was briefed and added some ideas. A Goals Subcommittee of the TAC reviewed the PAC s ideas, met with them and these two groups jointly developed the document shown here.
The Guiding Principles are the foundation of the updated Regional Transportation Plan.
The seven TEA 21 Planning Guidelines and the three Transportation Planning Rule directives provided the basis for ten regional goals. Under each of those goals is a series of related policies that were derived from the 2002 polices and objectives, with considerable refinement, rewording and re-ordering. In developing the policies, a review was undertaken of the goals, objectives, and policies in local TSPs, both to gather ideas and to seek consistency. However, the regional guiding principles (Goals and Policies) seek NOT to include directives that should be left to local discretion.
OOrrddeerr ooff tthhee GGooaallss aanndd PPoolliicciieess
In the 2002 RTP, the policies were numbered according to the chapter in which they appeared. This did not reflect any order of importance. The ten goals and related policies in this chapter did not originally have any order of priority, because some participants felt that some goals may be competing and trade-offs must be made case by case. This makes it difficult to rank-order the goals. Ultimately, however, it was decided to place what (randomly) had been goal three (relating to quality of life) first, and what had been goal one (relating to economic development), last. The goals and policies have thus been renumbered accordingly.
Goal / Policy RTP Chapter
Goal 1 Plan for, Develop, and Maintain a Balanced Multi-Modal Transportation System that Will Address Existing and Future Needs for Transportation of People and Goods in the Region
Policy 1-1 Goal 1 is primarily a matter for local control and shall be implemented through local TSPs compliance with TPR.
1
Policy 1-2 Local governments shall improve the equitable accessibility, availability, efficiency, and viability of public and private transportation systems for all users (including disabled, elderly, and children).
1
Policy 1-3 Local governments shall utilize the opportunity created by the development of transportation facilities in urban areas, to provide landscaping designs, suitable plantings, and other amenities, such as
12

26
Goal / Policy RTP Chapter
street trees and furniture, to enhance the user s experience and encourage people to walk.
New Policy 1-4: Local jurisdictions should plan projects with appropriate space reserved for current and future multi-modal transportation infrastructure connections required to create adequate access for the project.
Policy 1-5 Long term
Goal 2 Optimize Safety and Security on the Transportation System
Policy 2-1 Local governments, and ODOT where appropriate, shall work with other agencies to promote traffic safety education and awareness, including enforcing the City and State motor vehicle codes.
16
Policy 2-2 Improving vehicular, bicycle and pedestrian safety shall be a high priority consideration in the selection, design, development, and construction of street projects.
16
Policy 2-3 Working with ODOT where appropriate, local governments should ensure the safety of all current and future travel modes. This includes inventorying accident-prone areas and developing solutions.
16
Policy 2-4 Local governments and ODOT shall design and operate the transportation system to facilitate the safe and rapid movement of emergency first responders, and the evacuation of businesses and homes in the event of emergency. Transportation agencies shall coordinate with emergency evacuation and disaster planning agencies.
16
Policy 2-5 Local governments shall provide for safe intermodal connections. 16
Policy 2-6 The Regional Transportation Plan shall support transportation security issues of local jurisdictions.
17
Goal 3 Use Transportation Investments to Foster Compact, Livable Communities. Develop a Plan That Builds on the Character of the Community, is Sensitive to the Environment, and Enhances Quality of Life
Policy 3-1 Local governments shall create a transportation system that clearly recognizes the connection between land use density and transportation efficiency.
12

27
Goal / Policy RTP Chapter
Policy 3-2 Local governments shall consider amending plan -use and/developments
in urban areas to lower the vehicular demand on the regional transportation system. These plans will facilitate transit-oriented development (TOD) in current and future RTP designated TOD areas.
12
Policy 3-3 Local governments, and ODOT where appropriate, shall plan for the
protection of corridors for transportation purposes. The Regional Transportation Plan shall explore usage of non-road linear corridors for bicycle, equestrian, and pedestrian paths.
12
Policy 3-4 Local governments shall discourage cul-de-sac or dead-end street designs whenever an interconnection alternative exists. Development of a street pattern shall be encouraged that connects new and existing neighborhoods during land divisions. Wherever possible, land divisions and any approved cul-de-sacs shall be designed to provide pedestrian and bicycle connectivity among neighborhoods.
10
Policy 3-5 Prioritize investments to ensure existing transportation system preservation.
18
Goal 4 Develop a Plan that Can Be Funded and that Reflects Responsible Stewardship of Public Funds
Policy 4-1 Local governments, ODOT and the MPO shall develop innovative and sound funding policies to implement the Regional Transportation Plan.
18
Policy 4-2 Local governments, ODOT and the MPO shall ensure that the costs of planned improvements are consistent with transportation policies.
18
Policy 4-3 Local governments, ODOT and the MPO shall maximize efficient use of all transportation resources: for planning, design, project development, construction management, and construction itself with contemporary, state of the art approaches including public-private partnerships and design-build, and create projects that maximize the value of public investments.
18
Policy 4-4 Local governments should develop, fund and implement maintenance programs for the transportation facilities they build.
18
Policy 4-5 Local governments should establish and maintain funding mechanisms, such as System Development Charges, to collect a proportionate share of the cost of facility improvements from new developments.
18

28
Goal / Policy RTP Chapter
Goal 5 Maximize the Efficient Utilization of Existing and Future
Transportation Infrastructure to Facilitate Smooth Movement of People and Motorized and Non-motorized Vehicles
Policy 5-1 Where appropriate and cost-effective, local governments and ODOT shall
update existing signals and signal systems (including bike sensitizing signals) to improve mobility. This may include coordinating and linking signals to a master control system to optimize system efficiency.
6
Policy 5-2 Local governments, and ODOT where appropriate, shall provide regular maintenance to all of the traffic control devices within their inventory to optimize their functionality.
6
Policy 5-3 Local governments, and ODOT where appropriate in consultation with local governments, shall remove traffic signals where they are no longer justified due to land use changes and the resultant change in traffic patterns.
6
Policy 5-4 Local governments, and ODOT where appropriate, shall consider intersection geometric improvements and shall consider prohibition of turn movements at major intersections, where such actions would increase the capacity and safety for all road users, including motorists, pedestrians, and bicyclists.
6
Policy 5-5 Local governments shall manage access points (curb cuts) for their major street systems.
6
Policy 5-6 When warranted for major at-grade intersections, local governments and ODOT shall consider the installation of new traffic signals. New traffic signal locations shall be identified based on guidelines established in the Manual on Uniform Traffic Control Devices (MUTCD).
6
Policy 5-7 ODOT, in consultation with local governments, shall consider the installation of ramp signals at freeway on-ramps to meter the amount of traffic entering the freeway, thereby maintaining acceptable flow conditions on the freeway system.
6
Goal 6 Through the Use of Incentives, Encourage Regional Multi-Occupant and Non-Motorized Vehicle Facilities and Services, so That These are the Choice for an Increased Percent of Regional Trips
Goal 6.A Foster Increased Transportation Demand Management (TDM) to Reduce SOV Reliance
Policy 6.A-1 The implementation of a regional Transportation Demand Management (TDM) program shall be an important component of a comprehensive strategy to reduce demands placed on the transportation system. Special
7

29
Goal / Policy RTP Chapter
TDM activities shall be utilized to address unusual special and recurring events such as fairs, festivals, and other cultural and large-scale activities.
Policy 6.A-2 Transportation Demand Management measures should be considered
before transportation capacity expansion is determined to be necessary. 7
Policy 6.A-3 Local governments and ODOT shall support and encourage the growth of the Rogue Valley Transportation Management Associations (TMAs). The purpose of a TMA is to encourage the policies under RTP Goal 6 and to work with major employers to adopt trip reduction goals, policies and programs designed to reduce site vehicular trip generation, and to offer specific incentives in partnership with regional TDM projects.
7
Policy 6.A-4 Federal, state, regional, and local government agencies should become role models in demonstrating effective and extensive TDM. This includes encouraging alternatives to private auto use through incentive programs within their own places of employment. These may include: flexible work schedules, staggered work hours, compressed workweeks, subsidizing ridesharing or by making ridesharing more convenient through [for example] preferential parking spaces, fare subsidies, increased vacation time , promotion of telecommuting and other techniques to encourage transit, carpool, bicycle and walking trips. Commuting TDM programs should accommodate a guaranteed ride home program to further encourage their use.
7
Policy 6.A-5 Develop public-private partnerships with employers to adopt trip reduction goals, policies and programs designed to reduce site vehicular trip generation, and to offer specific incentives to foster TDM.
7
Goal 6.B Manage Parking Supply in a Manner that Discourages SOV Reliance
Policy 6.B-1 Local governments shall consider the adoption of maximum parking requirements (or parking caps) in their zoning codes to reduce excessive off-street parking supply.
9
Policy 6.B-2 Local governments should establish low minimum parking requirements in their zoning codes to encourage in-fill development.
9
Policy 6.B-3 Local governments should redesignate existing, general-use parking spaces to a different, special use so as to encourage the use of alternative transportation modes.
9
Policy 6.B-4 Local governments, and ODOT where appropriate, shall manage the roadway space so as to eliminate excess on-street parking in the region in favor of such projects as bike lanes, bus stops, and narrower street widths that promote use of alternative modes.
9

30
Goal / Policy RTP Chapter
Policy 6.B-5 Local governments shall utilize and encourage appropriate parking
policies and strategies to reduce auto-dependence and discourage auto use where other alternative modes of access are possible. Where appropriate, parking needs to be oriented to the back or side with entrances to the front for pedestrian access.
9
Policy 6.B-6 Local governments and ODOT shall plan park and ride facilities near transit routes and major transportation connections to encourage transit and shared rides to discourage single occupancy vehicles.
9
Goal 6.C Enhance Bicycle and Pedestrian System and Enhance the Provision of Bicycle and Pedestrian Amenities
Policy 6.C-1 Local governments shall work toward building a regional network of off-street multi-use facilities with connections to the local street network in addition to on-street bike/pedestrian accommodations. Off-street facilities should have a minimal number of at-grade roadway crossings.
10
Policy 6.C-2 The MPO should create a region-wide functional classification system, mirroring the roadway hierarchy, for pedestrian / bicycle routes.
10
Policy 6.C-3 Local governments, and ODOT where appropriate, shall complete a year-round bikeway network that serves bicyclists needs, especially for travel to employment centers, commercial districts, transit centers, institutions, and recreational destinations. In all areas, paved bike lanes shall be provided on all arterial and major collector streets; all other urban streets shall be constructed such that the pavement is wide enough to allow safe travel by both motor vehicles and bicycles on the shared roadway (OAR 660-12-0045(6)).
10
Policy 6.C-4 Where suitable, local governments shall revise their zoning codes to require the provision of bicycle oriented design and amenities to help meet bicyclist needs. This includes the provision of bike parking at park-and-rides, transit centers, workplaces, retail and commercial developments, multi-family residential areas and neighborhood activity centers such as schools.
10
Policy 6.C-5 Local governments, and ODOT where appropriate, shall seek to provide regular maintenance of existing bicycle facilities, including pavement management and regular sweeping.
10
Policy 6.C-6 Local governments, and ODOT where appropriate, shall foster maximum year-round pedestrian access by seeking to require or provide continuous, gap-free sidewalks/ pedestrian pathways along all urban streets except where special conditions prevail such as historic districts. Sidewalks and walkways should be required in new developments in the metropolitan area and they should be included with major street improvement projects
10

31
Goal / Policy RTP Chapter
(OAR 660-12-045 (3) (B)).
Policy 6.C-7 Where pedestrian access ways are called for, require their construction simultaneous with roadway construction / subdivision development, not on a frontage-by frontage basis. This ensures fully-functioning connected systems that do not wait for homesites or projects to occur.
10
Policy 6.C-8 RVTD shall continue to provide bicycle racks on buses, and bicycle racks and lockers at transit stations and bus stops to improve bicycle access to transit.
10
Policy 6.C-9 The location and design of all sidewalks shall comply with the requirements of the Americans with Disabilities Act, and local jurisdictions and ODOT shall work with RVTD to design and locate bus stops in accordance with ADA. Local governments, and ODOT where appropriate, shall provide sidewalks and other amenities to make pedestrian access to bus stops easier.
10
Policy 6.C-10 Local governments, and ODOT where appropriate, shall support bicycle and pedestrian safety, both through enforcement of safety laws and regulations and through support of programs that provide bicycle and pedestrian safety education.
10
Policy 6.C-11 All signalized intersections in urban areas shall have marked crosswalks to ease crossing convenience and safety for bicyclists and pedestrians.
10
Goal 6.D Foster Increased Transit Service, Facilities and Usage to Reduce SOV Reliance
Policy 6.D-1 Local funding actions should be taken to ensure a long term stable operating and capital-funding basis for RVTD.
11
Policy 6.D-2 Local governments shall, through RVTD, continue provision of transportation services and facilities that enhance mobility/livability and quality of life options for the transportation-disadvantaged.
11
Policy 6.D-3 RVTD shall continue to provide pleasant, aesthetically pleasing, clean, safe, comfortable vehicles, and shelters along transit lines.
11
Policy 6.D-4 Local governments, RVTD, and ODOT where appropriate, shall consider the development of park-and-ride facilities as a cost-effective means of increasing the efficiency of the existing transportation system.
11
Policy 6.D-5 The Rogue Valley Transportation District (RVTD) should periodically review ridership and service throughout the region, adjusting routing to maximize ridership potential, increase the area of coverage, and ensure service availability. Where practical, RVTD should route transit services
11
32
Goal / Policy RTP Chapter
to provide service coverage within ¼-mile walking distance of urban area residences. Service should be comfortable, convenient, and efficient.
Policy 6.D-6 RVTD shall operate all transit routes with route headways no greater than one-half hour during peak periods, and supply transit service on weekends and evenings.
6 / 11
Policy 6.D-7 RVTD shall continue to provide off-peak mid-day services on all routes, or a guaranteed ride home program should be available and publicized.
11
Policy 6.D-8 Local governments, ODOT where appropriate, and RVTD should support transit-friendly design including appropriate inclusion of bus-only lanes on arterial streets, bus bays or turnouts on district level State highways, arterial and collector streets as a means of facilitating traffic flow during peak travel periods, and should revise building codes that enhance pedestrian access to major destination buildings. This transit-friendly design approach will also encourage connectivity to transit by enhancing pedestrian, wheelchair and bicycle access to bus stops.
11
Policy 6.D-9 Where warranted by traffic speed, volume, and average bus schedule dwell time; where consistent with maintaining a positive pedestrian environment; and where approved by RVTD, local governments, and ODOT where appropriate, shall facilitate implementation of bus bays on congested arterial streets as a means of facilitating traffic flow during peak travel periods.
11
Policy 6.D-10 RVTD should be encouraged to implement express commuter service between cities in the Rogue Valley as funds become available and all other operational goals are met, such as headway, hours of service and days of week.
11
Goal 7 Provide an Open, Balanced, and Credible Process for Planning and Developing a Transportation System that Complies With State and Federal Regulations
Policy 7-1* Local governments shall reduce reliance on the automobile as required by the Transportation Planning Rule.
2
Policy 7-2 Coordinate the planning for existing and future land use and development with the planning of the transportation system.
2
Policy 7-3 Provide a process to encourage a representative cross-section of the region s residents in planning the regional transportation system -- ensuring that plans address public values and are responsive to changing needs. Through policies and procedures that encourage cooperation and coordination, build ongoing communication and education among
2

33
Goal / Policy RTP Chapter
communities and among residents within each community.
Policy 7-4 The Rogue Valley Regional Transportation Plan shall be consistent with the adopted elements of the Oregon Transportation Plan.
2
Policy 7-5* Local transportation plans will be consistent with those developed at the
regional and state level. 2
Policy 7-6* Local governments shall coordinate transportation planning and construction efforts with those of the RVMPO.
2
*Note: these next 3 policies were added 2/2/05 Goal 8 Provide Environmentally Sensitive and Healthy Transportation
Options
Policy 8-1 Provide transportation systems that minimize air, water, and noise pollution while maintaining/enhancing the surrounding environmental and historic resources to the greatest extent possible.
Policy 8-2 Provide a Regional Transportation Plan that can meet Air Quality Conformity standards set by EPA.
Policy 8-3 Minimize negative impacts to neighborhoods and local business communities while addressing regional transportation needs.
Policy 8-4 Local governments shall design and operate transportation systems with a view to maximizing the attractiveness of non-motorized transportation modes to maximize their health benefits.
These policies pervade
the entire RTP
Goal 9 Encourage Use of Cost-Effective Emerging Technologies Where Appropriate to Achieve Regional Transportation Goals and Policies
Policy 9-1 Implement a comprehensive Intelligent Transportation Systems (ITS)4
program. 6
Policy 9-2 The MPO shall encourage exploration and monitoring of emerging transportation technologies wherever suitable to achieve regional transportation goals. It shall plan a transportation system for the future that takes advantage of market-ready and cost-effective new technologies, which may include low-speed vehicles and non-fossil fuel sources. The MPO shall encourage consideration of innovative infrastructure e.g. roundabouts, flyovers, underpasses, and other alternative design elements.
These policies pervade
the entire RTP
4 ITS is a highway-oriented program that seeks to optimize use of technology to improve transportation safety, security, flow and efficiency. See Chapter 6.

34
Goal / Policy RTP Chapter
Policy 9-3 The MPO shall undertake market studies and prepare strategies for
dealing with growth in Slow Moving Vehicles (e.g. golf carts, tricycles) (SMVs), more motorized scooters, skateboards etc. as market conditions change.
Goal 10 Use Transportation Investments to Foster Economic Opportunities
Policy 10-1 ODOT and local governments shall accommodate commercial, retail, and industrial traffic flows and shall create a regional transportation system that supports local economic goals.
15
Policy 10-2 Local governments shall work with ODOT to examine options for designated freight routes, balanced with the needs for local circulation and non-motorized transportation, and shall consider goods-movement management strategies along the major arterial streets in commercial, retail, and industrial areas.
6 / 15
35
44.. EEVVAALLUUAATTIIOONN
IInnttrroodduuccttiioonn
WWhhaatt iiss EEvvaalluuaattiioonn??
Evaluation divides into two areas, here termed, input evaluation and outcome evaluation. This chapter primarily addresses input evaluation.
Input evaluation is about evaluating the merits of and prioritizing, the various projects and programs that are inputs to, or ingredients of transportation Plan. How great a contribution does each project or program make toward accomplishing the Plan s stated goals and policies (its Guiding Principles, described in Chapter 3)? How important is that program or project in relation to others? How good a value for money spent [ bang for the buck ], does it represent, given its likely outcomes? What is the opportunity cost of making input A instead of input B? Clearly, plan inputs can be evaluated, weighted, scored, and ranked if so desired. Alternatively, a less regimented process can be used. The latter is recommended here.
Outcome evaluation is about how well the Plan through its projects and programs has actually yielded the desired results, as expressed by the Plan s guiding principles. Thus, outcome evaluation is performance evaluation, and takes place after the Plan has been implemented or partially implemented. This RTP in Appendix C contains an outcome evaluation discussion limited only to the Alternative Measures and their performance to date. Future RTP work programs will explore in greater depth how to build outcome or performance evaluation into the planning process.
EEvvaalluuaattiioonn PPrroocceessss ffoorr RRTTPP PPrroojjeeccttss
The RTP requires a recommended project list. Projects included in this RTP were developed and selected in a number of ways that do not lend themselves to a highly formal testing process against the above concepts. This evolves out of a compilation of the following:
Projects listed in jurisdiction members adopted TSPs5, and RVTD s plans;
5 The Policy Committee in fall 2004 adopted rules for what projects can be considered and determined that only projects in adopted TSPs can be included.

36
Proposed projects from the Tier 1 and Tier 2 lists of the previous RTP;
New projects that may arise out of local or regional-level transportation planning, or from the private sector, and
ODOT proposed projects.
The RTP Tier 1 list represents those projects that it is expected can be funded that is, for which funding sources are predictable and reasonable, within the timeframe of the plan, which is by 2030 for the 2005 RTP. Even though this period will see many projects built, some may not be possible. Hence the second, or Tier 2 list, which contains desirable and often ready-to-go projects that have been evaluated as lower priorities, and yet for which funding has not been identified in the Plan6.
Certain funds are regional rather than local in nature, and a wider process is needed to set input priorities. One example is Oregon Department of Transportation (ODOT) modernization funds. These funds are used for short-term projects appearing in the regional Transportation Improvement Program (TIP), and are scored and weighted by the Rogue Valley Metropolitan Planning Organization (RVMPO) Technical Advisory Committee (TAC).
Another regional fund is the Surface Transportation Program (STP) fund. The TAC has undertaken several policy discussions to determine allocation of these funds and selection of appropriate STP projects. Commitments are now in place through 2008, at which time a new STP project evaluation process will be needed. A regional summit is planned to discuss this issue prior to 2008.
Congestion Mitigation and Air Quality (CMAQ) projects also undergo a regional discussion and prioritization using a scoring and weighting process. Two other types of project, the RVMPO Freight Study and the Rogue Valley Intelligent Transportation Systems (RVITS) project have undertaken a prioritization process and created a project list without relating this list of priority projects directly to available funds.
In this RTP, as in the previous RTP, an informal process was used whereby RVCOG staff identified available funding levels and compared those against the desired project list coming from each community. Priorities were set based on funding availability, consistent with local plans and the Guiding Principles of Chapter 3.
The RTP process evaluates the merits of all these projects and develops one master project list. The funnel diagram shown in Figure 4-1 describes how the process works, through informal
negotiation. This approach is the best one, in the context of the expanded MPO, given that most of the funding sources are targeted to specific types of projects and much of the funding comes from jurisdictional sources.
6 The RTP is not required to have a Tier 2 list, but Projects Considered but not Included are presented in Appendix F. Some members of the TAC believe that a Tier 2 list is comprised strictly of projects that are ready to go, held back only by lack of funding. A Tier 2B or Tier 3 list would then consist of projects that are regionally significant and desirable but for which not all planning has been done, and which are not ready to go if extra funding is found. Nevertheless, there is no formal agreement on anything other than what can be in Tier 1.

37
FFiigguurree 44--11 DDeevveellooppmmeenntt ooff RRTTPP TTiieerr 11 LLiisstt
Alt. Measures projects
ITS
Projects
ODOT Modern- ization
Projects
Bicycle and ped. projects
Freight study
projects
Juris-dictional
TSPs projects
STP projects (short range)
CMAQ projects (short range)
ODOT maintenance
projects
Other
RTP project lists (Tier 1 and 2)
Transit projects:
TDM, TMA, park & rides, bus services

38
55.. FFOORREECCAASSTTIINNGG FFUUTTUURREE TTRRAAVVEELL AANNDD AAIIRR
QQUUAALLIITTYY
IInnttrroodduuccttiioonn
This chapter describes how projections of growth in the region s population and economic activity were used as the basis for calculating future travel and transportation related air quality impacts (emissions).
The Rogue Valley will continue to experience relatively rapid growth, based on the available evidence. People are attracted to Southern Oregon because of the high quality of life enjoyed here, which has resulted in relatively high population growth rates. The region has received a good deal of national publicity about its livability and become home to a number of in-migrating retires as well as wage earners, as a result. Factors driving growth natural increase, the tourist industry; the health care industry, the attractiveness of the region for retirees are likely to continue strongly into the future.
The population of the Rogue Valley region is expected to increase by 46 per cent during the next 25 years. This increase in growth is a major factor for the transportation needs of the region. The transportation needs of the population will be changing as well. An aging population will be more reliant on alternative modes of transportation. At the same time, the rapid growth of the high tech electronic substitutes for face to face communications -- of e-mail document transfer, of web-based
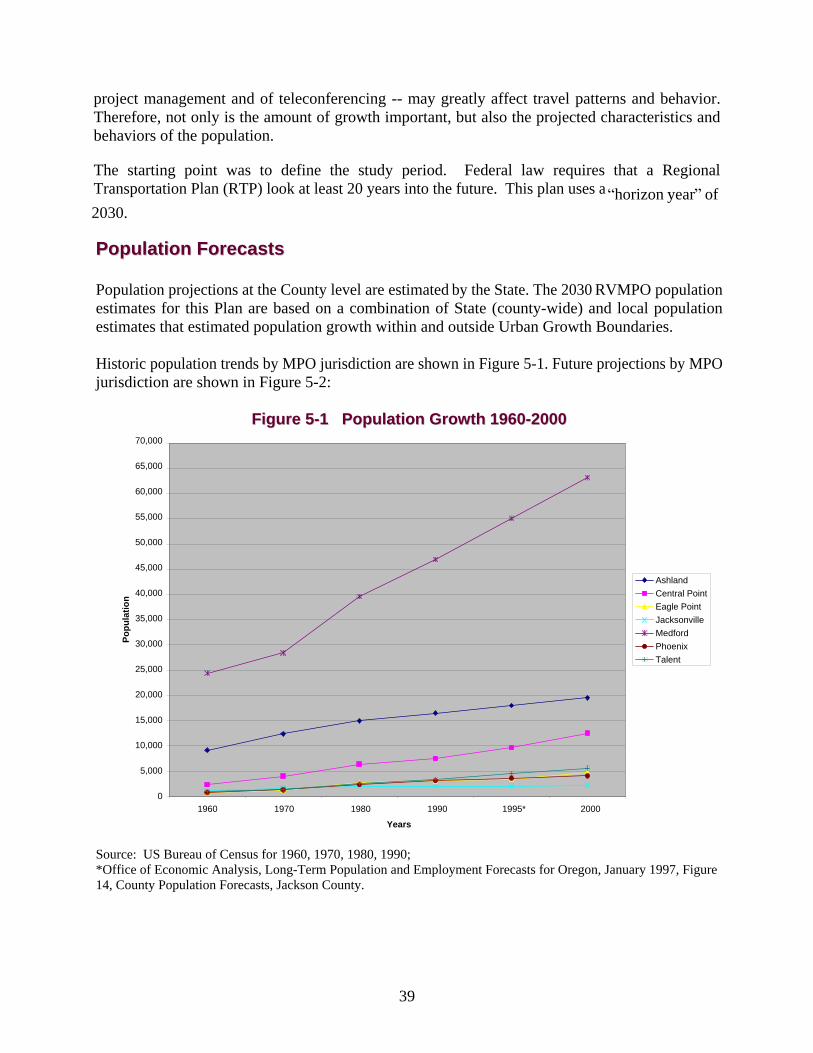
39
project management and of teleconferencing -- may greatly affect travel patterns and behavior. Therefore, not only is the amount of growth important, but also the projected characteristics and behaviors of the population.
The starting point was to define the study period. Federal law requires that a Regional Transportation Plan (RTP) look at least 20 years into the future. This plan uses a horizon year of 2030.
PPooppuullaattiioonn FFoorreeccaassttss
Population projections at the County level are estimated by the State. The 2030 RVMPO population estimates for this Plan are based on a combination of State (county-wide) and local population estimates that estimated population growth within and outside Urban Growth Boundaries.
Historic population trends by MPO jurisdiction are shown in Figure 5-1. Future projections by MPO jurisdiction are shown in Figure 5-2:
FFiigguurree 55--11 PPooppuullaattiioonn GGrroowwtthh 11996600--22000000
Source: US Bureau of Census for 1960, 1970, 1980, 1990; *Office of Economic Analysis, Long-Term Population and Employment Forecasts for Oregon, January 1997, Figure 14, County Population Forecasts, Jackson County.
0
5,000
10,000
15,000
20,000
25,000
30,000
35,000
40,000
45,000
50,000
55,000
60,000
65,000
70,000
1960 1970 1980 1990 1995* 2000
Years
Po
pu
lati
on
Ashland
Central Point
Eagle Point
Jacksonville
Medford
Phoenix
Talent

40
FFiigguurree 55--22 FFuuttuurree YYeeaarr RRVVMMPPOO PPooppuullaattiioonn AAllllooccaattiioonn
JURISDICTION 2000 2002 2005 2008 2010 2015 2020 2025 2030
Ashland 18,966 19,573 20,006 20,440 20,729 21,451 22,174 22,897 23,619
Central Point 12,857 14,484 15,333 16,182 16,748 18,164 19,579 20,995 22,410
Eagle Point 4,969 6,121 6,821 7,521 7,987 9,153 10,320 11,486 12,652
Jacksonville 2,564 2,700 2,826 2,952 3,036 3,246 3,455 3,665 3,875
Medford 67,952 67,077 68,062 74,889 80,704 85,463 90,223 94,982 99,742
Phoenix 4,965 5,325 5,543 5,761 5,907 6,270 6,634 6,997 7,361 Rural JaCo within MPO
21,948 21,396 21,369 21,343 21,325 21,280 21,236 21,191 21,147
Talent 5,712 5,643 6,022 6,401 6,654 7,286 7,918 8,550 9,182
White City 6,665 7,188 7,907 8,626 9,106 10,304 11,502 12,701 13,899
TOTAL 146,600 149,507 153,889 164,114 172,195 182,618 193,041 203,464 213,887
Source: RVCOG
EEmmppllooyymmeenntt
In recent years, the Rogue Valley has undergone a dramatic shift in its economic structure. Due to a reduction in commercial timber available from federal lands, employment in the lumber industry has declined sharply. The timber industry has experienced a massive drop in total employment in the Jackson-Josephine County region. However, state projections indicate the region should have an increase in overall employment. Most of this growth is expected to occur in the trade and service sectors. Growth in tourism has had a significant impact on both the statewide and local economies. Economic development efforts have changed Southern Oregon from a stopover for travelers to a tourist destination.
A growing number of all visitors to the region made Southern Oregon their primary vacation destination, up from just 9 percent in 1981. Because of its central location to many cultural and recreational activities, the MPO area frequently serves as the home base for tourists during their stay in Southern Oregon.
Structural changes in the local economy impact the demand placed on the transportation system. For example, industrial employment generates 2.5 trips per employee, whereas retail employment generates 15 trips per employee. If, for example, 100 industrial employees are shifted to new retail sector positions, there would be 1,250 additional trips placed on the transportation system. In addition, the geographic distribution of retail and service employment is typically more dispersed than traditional, large industrial sites. Because of these factors, future travel demand will change significantly as the economy continues to evolve.
The long-range employment forecast was created using the Oregon Office of Economic Analysis (OEA) Long-Range Employment Forecast Years 2000-2040. The OEA forecast is on a countywide basis. A comparison of 2002 Base Year employment for the study area (MPO area) to county-wide employment (interpolated for 2000-2005) showed 93 percent of Jackson County employment is located within the MPO area. It was assumed that this ratio will remain constant through the planning horizon Year 2030. The OEA 2030 forecast will be the control total for the Future Year 2030.
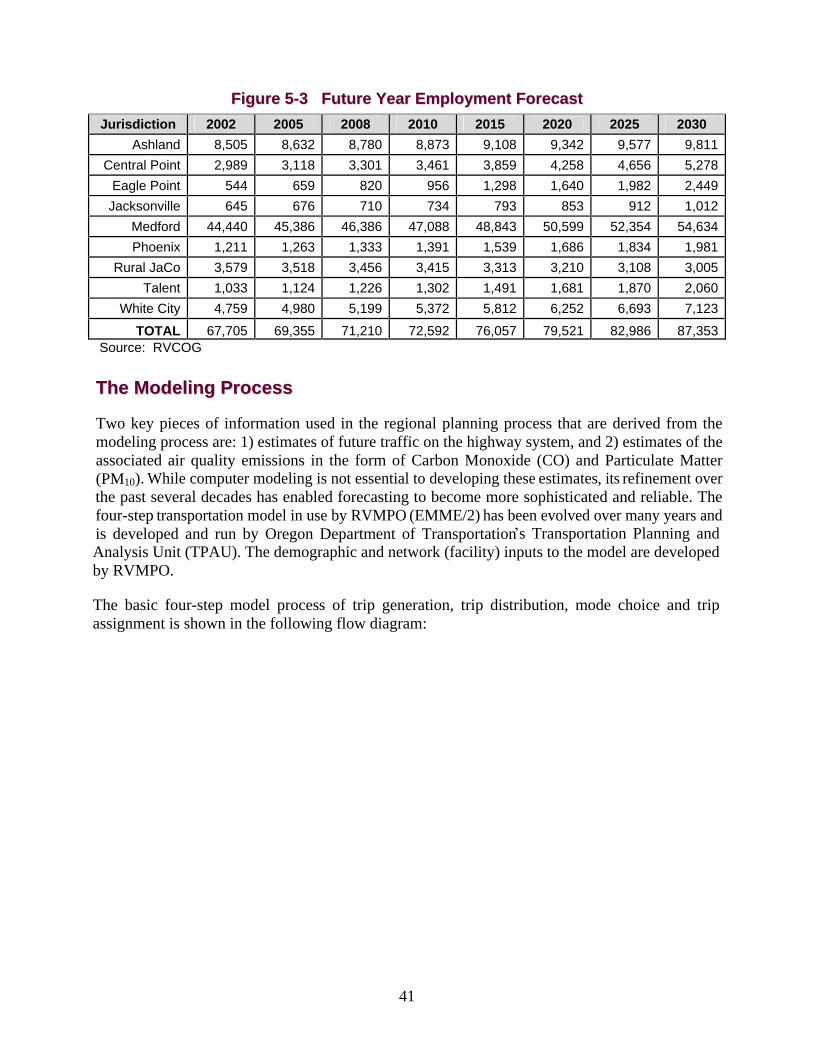
41
FFiigguurree 55--33 FFuuttuurree YYeeaarr EEmmppllooyymmeenntt FFoorreeccaasstt
Jurisdiction 2002 2005 2008 2010 2015 2020 2025 2030
Ashland
8,505
8,632
8,780
8,873
9,108
9,342
9,577
9,811
Central Point
2,989
3,118
3,301
3,461
3,859
4,258
4,656
5,278
Eagle Point
544
659
820
956
1,298
1,640
1,982
2,449
Jacksonville
645
676
710
734
793
853
912
1,012
Medford
44,440
45,386
46,386
47,088
48,843
50,599
52,354
54,634
Phoenix
1,211
1,263
1,333
1,391
1,539
1,686
1,834
1,981
Rural JaCo
3,579
3,518
3,456
3,415
3,313
3,210
3,108
3,005
Talent
1,033
1,124
1,226
1,302
1,491
1,681
1,870
2,060
White City
4,759
4,980
5,199
5,372
5,812
6,252
6,693
7,123
TOTAL
67,705
69,355
71,210
72,592
76,057
79,521
82,986
87,353
Source: RVCOG
TThhee MMooddeelliinngg PPrroocceessss
Two key pieces of information used in the regional planning process that are derived from the modeling process are: 1) estimates of future traffic on the highway system, and 2) estimates of the associated air quality emissions in the form of Carbon Monoxide (CO) and Particulate Matter (PM10). While computer modeling is not essential to developing these estimates, its refinement over the past several decades has enabled forecasting to become more sophisticated and reliable. The four-step transportation model in use by RVMPO (EMME/2) has been evolved over many years and is developed and run by Oregon Department of Transportation s Transportation Planning and Analysis Unit (TPAU). The demographic and network (facility) inputs to the model are developed by RVMPO.
The basic four-step model process of trip generation, trip distribution, mode choice and trip assignment is shown in the following flow diagram:

42
FFiigguurree 55--44 TThhee TTrraannssppoorrtt MMooddeelliinngg PPrroocceessss
Source: TPAU
[The abbreviations stand for Home-Based Work, School, Shopping, Other. NHB=non-home-based].
MMooddeell DDaattaa IInnppuutt
Demographic Data
The transport model breaks the region down into Transportation Analysis Zones (TAZs). TAZs are the fundamental geographic unit of analysis used in the RVMPO travel demand model. Year 2030 projections were developed for individual TAZs covering the MPO planning area. The current
Trip Generation
(Internal trips)
Trip Rates
HBW
HBSC
HBSH
HBO
NHB
HBW
Production
HBSC
Production
HBSH
Production
HBO
Production
NHB
Production
HBW
Attraction
HBSC
Attraction
HBSH
Attraction
HBO
Attraction
NHB
Attraction
HBW
Utility
HBSC
Utility
HBSH
Utility
HBO
Utility
NHB
Utility
Trip Distribution
External Trip Model
Trip Assignment
External Trip
Distribution Model
Optimize Travel Time Feed Back
Land Use
Data
Submodels
Income, Worker, HH Size
HBW
Utility
HBNW
Utility
NHB
Utility
Mode Choice
Vehicle
Occupancy
Peak Hour
Factor(s)
Diurnal
Factoring
Other
Modes
No
Yes
Household
Demographics

43
model, which includes the inner area of the MPO, includes 316 TAZs7. These are geographic units for which housing and employment data are gathered in order to develop a relatively fine-grained data set of trips generated at and attracted to each other geographic area or TAZ.
Considerable work went into forecasting TAZ-level data to 2030, with data for each of the intervening analysis years used in the conformity determination of 2010, 2015 and 2015. Building permit data, zoning data, taxlot data, aerial photography, buildable lands inventories and other data sources were tapped to arrive at an accurate estimate of base year demographics and to create future forecasts at the TAZ level based on each jurisdiction s control total . Several iterations were conducted and corrected.
Traffic Count Data
The model is validated by generating base year output and comparing that against know base year traffic flows. RVMPO gathered over 200 traffic counts performed by member jurisdictions and supervised the taking of a small number of additional counts. TPAU assembled the count data and created a regional traffic flow map.
Network Data
The transportation network -- highways and transit are part of the model. Trips are assigned to the network. The future year networks were generated in consultation with local jurisdictions, based on their most recent Transportation System Plans (TSPs) and other inputs, as well as with ODOT. The TSPs are almost all recent and have themselves been the subject of extensive local discussion and review. Here too, several iterations were conducted to ensure that all possible future projects were not only listed, but correctly described in terms of any new lanes, and other parameters that might generate new emissions. RVMPO supplied data files about the base and future year networks to TPAU for inclusion in the model.
To accomplish this, the proposed network had first to be verified against funding. Only financially constrained , that is, projects for which funding can be identified, may be included in the RTP under federal law. Extensive discussion and negotiation took place with local jurisdictions to ensure that their top priority projects were appropriately included in this Tier 1 list, and in the right phase. The final network is shown in Figure 8-3, Tier 1 project List.
Air Quality Modeling
In the RVMPO 2005 Conformity Determination, emissions estimates are required for Particulate Matter (PM 10) and Carbon Monoxide (CO), for different areas. The Medford Urban Growth Boundary (UGB), the inner ring of the metropolitan area, is coterminous with the Carbon Monoxide Maintenance Area.
The wider Air Quality Maintenance Area (AQMA), within which PM10 must be estimated, applies to an area coterminous with the RVMPO i.e. Central Point, Eagle Point, White City, all of Medford,
7 The new model now being developed for the entire MPO has 744 TAZs

44
Phoenix, Jacksonville, Talent and Ashland. The difference between these two areas or the outer ring, is called the donut area .
The results of the emissions modeling are compared with the emissions budgets permitted in the CO and PM10 State implementation Plans. These findings are discussed in depth in a separate document, the RVMPO 2005 Air Quality Conformity Determination (AQCD), co-published with this RTP.
45
66.. TTRRAANNSSPPOORRTTAATTIIOONN SSYYSSTTEEMM MMAANNAAGGEEMMEENNTT
EELLEEMMEENNTT
IInnttrroodduuccttiioonn
The Oregon TPR defines Transportation System Management (TSM) strategies as techniques for increasing the efficiency, safety, capacity, or level of service of a transportation facility without increasing its size. TSM strategies are aimed at making the most efficient use of the existing transportation infrastructure, thus reducing the need for more costly projects, such as roadway capacity expansion. Example techniques include coordinating traffic signals, re-striping lanes, and channelizing intersections. TSM strategies can be an important component in maintaining mobility standards.
DDaattaa CCoolllleeccttiioonn//IInnvveennttoorryy
Locally, TSM strategies are considered first whenever system deficiencies are encountered. Local agencies have a good record of implementing TSM projects, and they are expected to continue to do so during the implementation period of the plan. Many TSM projects have relatively low capital costs in comparison to construction of new streets. TSM projects seldom require right-of-way acquisition, a sometimes lengthy and expensive process. Some TSM projects do not even require any physical construction. Because of their relative simplicity, TSM projects often can be implemented soon after a problem is analyzed and a solution is developed. These are among the factors that make TSM projects as attractive as methods of improving the transportation system of the region.
TSM needs examined in this chapter include:

46
Intersection traffic control needs and improvements including signal coordination, signal upgrades and new signal installation or modifications;
Intelligent Transportation System (ITS) needs and improvements; and
Continuing traffic monitoring.
Coordination of traffic signals, for example, can bring immediate congestion and air quality benefits. Coordinated signal timing in Oregon has produced 10- to 40-percent reductions in stops and 15- to 45-percent reductions in delays, yielding 5- to 25-percent reduction in travel time and up to 15-percent reduction in fuel consumption. Traffic signals within the RVMPO are operated by ODOT, Medford and Jackson County. They are owned by Ashland, Central Point, Medford and Jackson County and ODOT.
The Rogue Valley Intelligent Transportation System (RVITS) Plan, completed in 2004, contributes to TSM in areas of traffic operations and management, traveler information, incident management, public transportation management, emergency management, information management, and maintenance and construction management. RVITS is a 20-year plan for the installation and use of advanced technologies and management techniques to improve the safety and efficiency of the transportation system. This plan was developed collectively by the RVMPO, member jurisdictions, including Rogue Valley Transportation District and the Oregon Department of Transportation in response to the following policy:
Policy 9-1 Implement a comprehensive Intelligent Transportation Systems (ITS)8 program.
RVITS-related equipment currently in use is summarized in Figure 6-1, and Figure 6-2 shows proposed improvements.
FFiigguurree 66--11 RRVVIITTSS--RReellaatteedd EEqquuiippmmeenntt Device Number
Location Owner CCTV Cameras 6 Medford ODOT CCTV Cameras 2 Medford Medford
Dynamic Message Signs 4 Medford, Ashland, Phoenix
ODOT Automatic Traffic Recorders 3 Medford, Talent ODOT Automatic Traffic Recorders 6 Medford Medford
Weather Station 1 Medford ODOT Mayday Phone 2 Medford ODOT Hwy. Advisory Radio 1 Ashland ODOT Truck Weigh-in Motion 2 Ashland ODOT Red-Light Enforcement Camera
2 Medford Medford
FFoorreeccaasstt ooff 2200--yyeeaarr DDeemmaanndd
Other chapters of this plan address future-year demand across the entire regional transportation system. Additionally, RVMPO member jurisdictions have identified long-range system needs in their Transportation System Plans.
8 ITS is a highway-oriented program that seeks to optimize use of technology to improve transportation safety, security, flow and efficiency.

D
!.D
D
I- D
!.!.D
D
!.ÅB!.
ÅB
!.ÅBÅB !.!.D
!.?
DD!.
DD
?
IA
kh
89:=89:=
D
!.ÅB
I-
D
!.
a
I-
!.
?kh!.D
D IA
!.
D
D
D
IA
D
!.
!.D
D
D
D
!.
D
!.
kh
?
D
!. !.
!.
D
!.
D
D!.D
D !.
D
?
kh
kh!.
D
!.D
!.
a
!.D!.D
khD
!.D
!.
kh
!.D
D
!.
!.D
!.
!.D
a
D
kh!.D!.
!.(Î!.DD
!.a_I-
!._D!. DD DD
D
÷?kh
!.
kh
Da
§̈¦5
C E N T R A LM E D F O R D
I N S E T
S I S K I Y O U P A S SI N S E T
MEDFORD
ASHLAND
CENTRALPOINT
EAGLE POINT
TALENT
PHOENIX
WHITE CITY
JACKSONVILLE
FOO
THI L
L
PACIFIC
INTERSTATE 5
TAB
LE R
OC
K
HIGHW
AY 62
INTERSTATE 5
N P
HO
ENIX
CR
ATE
R L
AK
E
MAIN
KIRTLAND
MCANDREWS
BID
DLE
PINE
ANTELOPE
SISKIYOU
FRONT
5TH
HANLEY
ROSSANLEY
ROGUE VALLEY
HIGHWAY 99
BLACKWELL
HIGHWAY 238PACIFIC
PACIFIC
MAIN
0 2 41Miles
D
!. ÅB
!.
ÅB
!.ÅB
ÅB
?
DD!.
DD
D
!.
ÅB
D
D
!.
!.
D
!. !.
!.
!.
D
!.
D
!.
!.(Î !. DD
!.a_
I-
!._D
!.
D
§̈¦5
KIN
GS H
WY
MCANDREWS
STEWART
RIVERSIDE
CENTRAL
JACKSON
CO
UR
T
BID
DLE
HWY 238
INTERSTATE 5
CO
LUM
BU
S
MAIN
GARFIELD
CR
ATE
R L
AK
E
ITS Device Legend:
89:=89:=
a?
!.
!.
?
a!.
!.
§̈¦5
MT ASHLAND RD
OLD H IGHW
AY 99 S
41-2E
-9
D
OL D SISKIYOU HWY 273
STEINM
AN DR
SISKIYOU PASS
Existing
Proposed 0 - 5 Years
Proposed 6 - 10 Years
Proposed 11 - 20 Years
_ Mayday Phone
÷ Weigh-in-Motion
kh Dynamic Message Sign
!. CCTV Camera
IA Parking Management System
ÅB Trailblazer Sign
a Weather Station89:= Curve Warning System
I- Traveler Information Kiosk
D Automatic Traffic Recorder
? Highway Advisory Radio Transmitter
Red-light Running Enforcement Camera(Ó
CENTRAL MEDFORD
!._DD
E 12TH STI - 5
!.a
_
E JACKSON ST
INTER
STATE 5
RVMPO 2005 REGIONAL TRANSPORTATION PLAN
F i g u r e 6 - 2 Intelligent Transportation Systems (ITS)
OMap created on Febuary 22th, 2005
L
E
G
E
N
D
Streets
UGB & UCB
RVMPO Boundary
ITS Corridors
ITS Device Phasing:

48
The jurisdictions TSPs identify numerous needs that can be met, at least in part, by TSM measures. Operational/capacity problems at intersections (volume-capacity ratio exceeding 1.0) can be addressed by intersection improvement projects. Medford will install at least one roundabout as a way of improving intersection flow during the life of this Plan. Channelization might also alleviate such problems. Widening intersection approaches to provide left- and right-turn lanes can increase the approach capacity by up to 25 percent. Turn lanes also allow for simplified and more efficient signal timing.
Illustrating the potential effectiveness of TSM measures, Ashland in the early 2000s examined 20-year growth projections and determined that a combination of TSM measures, and an effective, area-wide travel demand management (TDM) policy (TDM is discussed in Chapter 7), would yield an overall street system that operates within acceptable levels. TSM measures included in this analysis were:
New traffic signals and signal coordination;
Intersection approach enhancements (separate turn lanes); and
Access management of private driveways and public streets.
Jurisdictions have identified signalization and other intersection-improvement projects, which are listed in the Street System Element. Medford, for example, has identified 38 intersections that will need signalization or other improvements in the next 20 years. These projects are part of an overall strategy to maximize the capacity of the existing street system.
SSyysstteemm DDeeffiicciieenncciieess//SSttrreennggtthhss aanndd WWeeaakknneesssseess AAsssseessssmmeenntt
Recurrent congestion for the most part is limited to morning and/or peak periods today. Most congestion falls within the moderate to high congestion range. The three trouble spots that fall into the severe congestion category are Fern Valley Road between Highway 99 and the Interstate 5 interchange, and Interstate 5 interchanges in Medford at Barnett Road and Highway 62. Although the two Medford interchanges are problem areas today, reconstruction of the North Medford interchange is under way to improve operations, and construction is planned to relocate and improve the South Medford interchange.
The street element provides greater detail about anticipated growth and resulting anticipated demands on the transportation system. The Financial Element provides information about anticipated revenues. Given the expense of most systems-expansion projects when compared to TSM projects, these projects can be thrifty alternatives for increasing capacity and improving safety.
PPoolliiccyy IIssssuueess aanndd AAccttiioonnss
The potential benefits of TSM measures both alone and in conjunction with other kinds of projects will keep them at the forefront of system-improvement options. And as with other system needs,
funding is not expected to keep pace with demand. The funding problem is not unique to the Rogue Valley region. In the area of updating and improving traffic signals, for instance, it has been estimated that approximately two-thirds of the urban signalized intersections in the United States need upgrading of physical equipment and changes to current timing. Generally, an inventory of

49
traffic control devices is made to determine the need for replacement with new, more modern equipment. After the inventory is complete, comprehensive planning for signal systems can take place to improve traffic operations. Among the potential benefits of improved signal systems is a reduction in congestion, with a corresponding improvement in air quality.
Statewide, while the population is expected to increase about 30 percent over the next 20 years, traffic volume is expected to increase 100 percent. This increase requires a transportation system that is efficiently operated and responsive to increasing demands.
The expected growth will put an enormous burden on the existing transportation system. Public agencies must realize that high land and construction costs and environmental constraints make it difficult to build new transportation infrastructure as the single means of relieving congestion. Therefore, a systematic approach is necessary to effectively manage the region s transportation system and capitalize on the existing infrastructure as the region grows. This will have to include a wide range of system management tools.
FFaacciilliittyy RReeqquuiirreemmeennttss
TSM measures most applicable to the RVMPO Region are presented below. Where possible, specific projects have been identified. This discussion of TSM strategies does not represent any priority order. A broad range of strategies must be considered for the individual problems at each location.
Traffic Control Devices
Policy 5-1 Where appropriate and cost-effective, local governments and ODOT shall update existing signals and signal systems (including bike sensitizing signals) to improve mobility. This may include coordinating and linking signals to a master control system to optimize system efficiency.
Policy 5-2 Local governments, and ODOT where appropriate, shall provide regular maintenance to all of the traffic control devices within their inventory to optimize their functionality.
The twin purposes of traffic signals (traffic lights) are a) to provide safety at intersections where volumes are considerable on at least one of the roads and b) to enhance smooth traffic flow through signal synchronization over several miles of arterial highway9. Synchronization through use of a master control system is discussed in the next section. Local governments traditionally base their decisions concerning the installation of traffic signals on the Manual on Uniform Traffic Control Devices. They also have a good record of using signals to help achieve optimum traffic flow. Local governments should continue to give priority to improving existing traffic signal systems. Such improvements should include regular signal maintenance, updating the signal equipment and signal timing plan improvements.
9 In a synchronized system, the driver, after once getting a green light should be able to travel uninterrupted through a series of green lights, if he or she stays at the speed limit.
50
The need for traffic signal equipment updates, timing plan improvements, and traffic signal removal should be evaluated based on detailed analyses of traffic operations at individual intersections.
The coordination of new traffic signals through interconnection with existing and other new traffic signals should be considered to improve corridor-level traffic operations. Whenever additional intersections are signalized, agencies need to consider how they are best integrated with nearby signalized intersections. In some cases, signals operate most efficiently as independent signals, but in other cases, they are best integrated into a signal system.
The City of Medford already uses traffic signal systems and coordinated traffic signals in several locations. Experience in Medford and other communities has shown an eight to ten percent improvement in travel time along arterials after interconnected systems have been installed. Reduction of some types of automobile emissions is another possible benefit of improved signal systems.
Installation of master controllers, interconnection systems, and other equipment may help to achieve increased efficiency and reduce congestion of the street system.
Eliminate Unnecessary Traffic Signals
Policy 5-3 Local governments, and ODOT where appropriate in consultation with local governments, shall remove traffic signals where they are no longer justified due to land use changes and the resultant change in traffic patterns.
Intersection traffic-control improvements such as traffic signals are generally based on identified traffic congestion and safety problems. Over time, a change in the surrounding land use or street system may reduce travel demand at the signalized intersection, or geometric improvements may mitigate the safety problems at the intersection. Such changes may make the signal unnecessary, thereby requiring that the signal be removed for optimum system performance.
Intersections requiring removal of traffic signals may be converted to two-way stop control with free flow in the major direction of travel, or they may be converted to all-way stop control.
Intersection Geometric Improvements
Policy 5-4 Local governments, and ODOT where appropriate, shall consider intersection geometric improvements and shall consider prohibition of turn movements at major intersections, where such actions would increase the capacity and safety for all road users, including motorists, pedestrians, and bicyclists.
Intersection improvements such as the provision of turning lanes, traffic islands, channelization, and improved design can generally be implemented at relatively modest cost depending on their complexity. The benefits, though, in the form of improved vehicular traffic flow and pedestrian safety, are substantial.
51
Local governments have a good record of developing intersections that function well. Local agencies should consider following recognized national standards for geometric improvements at intersections. The following are eleven guidelines established by the Institute of Transportation Engineers in designing and improving arterial intersections at grade:
Reduce the number of conflicts among vehicular movements.
Control the relative speed of vehicles both entering and leaving the intersection.
Coordinate different type of traffic control devices used with the traffic volume at the intersection.
Select proper type of intersection to serve the traffic volume. Low volumes can be served with minimal control, whereas higher volumes require turning lanes and sophisticated actuated signal operations.
Use separate left- and right-turn lanes at high volume intersections.
Avoid multiple and compound merging and diverging maneuvers. These require complex driver decisions and create additional conflicts.
Separate conflict points. Intersection hazards and delays are increased when intersection maneuver areas are too close together or overlap.
Favor the heaviest and fastest flows.
Reduce areas of conflict by channelization (striping, islands, etc.).
Segregate non-homogenous flows. Separate lanes should be provided where appreciable volumes of traffic are traveling at different speeds (e.g. turning lanes for slowing vehicles).
Consider the needs of pedestrians and bicyclists.
Intersection Turning Movement and Lane-Use Restrictions
Left-turning vehicles along major undivided highways can impede the flow of through traffic, especially when storage lanes are not provided for left-turning traffic. Turning movements are sometimes prohibited at arterial intersections to minimize conflict between turning vehicles and pedestrians, and between turning vehicles and other vehicles approaching from the opposite direction, thereby reducing delay and safety problems. In such cases, the turn movements should be prohibited during those hours when study data indicate that a significant capacity or safety problem exists, provided a suitable alternative route is available.
Alternatively, at signalized intersections, turning movements can be restricted to certain phases of the signal operation by use of separate displays and appropriate signs. This type of turn restriction is most effective only when a separate lane is provided for the use of turning vehicles.
Turn prohibition studies should consider the following:
Amount of congestion and delay caused by turning movements;
Number of collisions involving vehicles making the turning movements;
Possible impact of traffic diversion on congestion and accidents at intersections required to accommodate traffic diverted by the prohibition;
Reaction from local property owners;
Possible adverse environmental impacts caused by re-routed traffic; and

52
Feasibility of alternative solutions, such as providing separate storage lanes for turning movement, and separate turn-movements phasing at signalized intersections.
The metropolitan area currently has few intersections where left-turns are prohibited. Additional candidate locations may be identified as the region grows. Turn prohibitions may be a viable solution where a separate left-turn lane and signal protection cannot be provided because of expense or right-of-way constraints.
Access Management
Policy 5-5 Local governments shall manage access points (curb cuts) for their major street systems.
Roadways have two principal functions: the provision of access to adjacent properties and the provision of mobility for traffic already on the street. Streets of different categories have different blends of access and mobility functions. These functions are illustrated in Figure 6-3.
FFiigguurree 66--33 AAcccceessss FFuunnccttiioonn
Access management involves the balance between access to adjacent parcels and accommodating the flow of traffic. Not all of the local governments of the region have adopted access management plans. However, access management standards are a required component of local Transportation System Plans (TSPs). Currently, RVMPO member jurisdictions are in different phases of developing and implementing TSPs.
Access issues can be highly controversial since access management often regulates and limits access to individual businesses or requires access from side streets or frontage roads. Access issues must be
53
handled individually for existing business sites. Significant concerns have been raised in Phoenix along Fern Valley Road, in Medford at the planned new South Medford Interchange, and in Medford and Jackson County along Highway 62. Other local access issues are raised on arterial and collector streets.
Experience throughout the United States has shown that a well managed access plan for a street system can:
Minimize the number of potential conflicts between all users of the street system, providing a safer and more efficient system; and
Minimize local costs for transportation improvements needed to provide additional capacity and access improvements.
Without an access management program along arterials and collectors, roadways may need to be periodically widened to accommodate demands of increased development. This cycle is a result of continually trying to satisfy traffic demands resulting from increased business activity. In turn, improved traffic conditions lead to further traffic demands. The number of vehicle conflict points rises because of an increase in the number of driveways, causing road capacity to diminish. Vehicle delay increases, and safety and comfort are reduced. The cost of allowing unplanned development to occur along arterials can be great because the inevitable solution calls for more capital expenditure, as the traffic conditions reach intolerable proportions. However, if proper planning in the form of an access management system is used, costs can be minimized.
The following are some of the more important components of an access management strategy that would be applicable to the metropolitan area:
Regulate minimum spacing of driveways.
Regulate maximum number of driveways per property frontage.
Require access on adjacent cross street (when available).
Consolidate access for adjacent properties.
Encourage connections between adjacent properties that do not require motorists to traverse the public streets.
Require adequate internal site design and circulation plan.
Regulate the maximum width of driveways.
Improve the vertical geometrics of driveways.
Optimize traffic signal spacing and coordination.
Install raised median divider with left-turn deceleration lane.
Install continuous two-way left-turn lane.
Install New Traffic Signals at Intersections
Policy 5-6 When warranted for major at-grade intersections, local governments and ODOT shall consider the installation of new traffic signals. New traffic signal locations shall be identified based on guidelines established in the Manual on Uniform Traffic Control Devices (MUTCD).
54
Traffic control improvements in the form of new signals are estimated to be required at approximately 40 intersections in the Rogue Valley metropolitan planning region. These locations, along with other street system improvements, are identified in the Street System Project List (Table 8-2) in the Street System Element of the plan.
Ramp Metering
Policy 5-7 ODOT, in consultation with local governments, shall consider the installation of ramp signals at freeway on-ramps to meter the amount of traffic entering the freeway, thereby maintaining acceptable flow conditions on the freeway system.
Ramp meters are employed at freeway on-ramp entrances with the objective of optimizing throughput capacity on the mainline freeway. The optimization is achieved by regulating the entry of vehicles onto the freeway during the peak hours of operation with ramp signals at the on-ramps. Very often, optimization of freeway throughput capacity is achieved at the expense of additional delays at the metered on-ramps. Another important consideration is the ability to provide adequate queuing or storage capacity for the stopped vehicles on the ramps leading to the through road.
Ramp metering has proven to be one of the most cost-effective techniques to improve traffic flow on the freeway. A Federal Highway Administration study of seven ramp-metering sites in the United States and Canada revealed that average highway speeds increased by 29 percent after installing ramp metering. An analysis of the system in Seattle revealed that in addition to speed and corresponding travel time improvements, highway volumes increased between 12 and 40 percent because of ramp metering. Also, accident rate reductions between 20 and 58 percent have been recorded as a result of improved merging operations associated with ramp metering at freeway and on-ramp merge points.
The need for metering on-ramps to I-5 should be evaluated by ODOT in cooperation with local governments as the region grows and travel-demands increase along I-5. Although I-5 and the ramps are under the jurisdiction of ODOT, it will be important for agencies to work cooperatively to balance the competing demands on the interstate system and to ensure that ramp back-ups can be accommodated by the local street system.
Goods Movement Management
Policy 10-2 Local governments shall work with ODOT to examine options for designated freight routes, balanced with the needs for local circulation and non-motorized transportation and shall consider goods-movement management strategies along the major arterial streets in commercial, retail and industrial areas.
The efficient movement of goods into and out of urban areas is essential for the economic vitality of the region. Goods-movement management strategies are aimed at improving congestion and safety conditions along the arterials. Strategies include restricting truck deliveries and pick-ups to off-peak periods, using alleys for loading and unloading, and providing additional curb space for loading and
55
unloading operations. Such strategies should be investigated in commercial areas along heavily congested roads.
Issues associated with goods movement management strategies include traffic management, improvements at shipping/receiving points, reductions in operational and physical constraints, changes in business operating practices, and changes in public policy. During the 1988 Los Angeles Olympic Games, a goods-movement management program was conducted to help reduce traffic congestion. That experience showed that goods-movement management during peak period traffic can effectively reduce overall traffic congestion through the removal of trucks. Shifting goods movement activities to off-peak hours through various incentives (tax and otherwise) assists in the reduction of peak period traffic congestion. Traffic management strategies include incident management, night shipping and receiving, and peak-period truck bans.
Restricting deliveries or trucking activities in locations where it has long been conducted with little regulation may be unpalatable. It may, however, be possible to require on-site loading and unloading as a design feature for new developments. It is recognized that existing businesses will strenuously object to any restriction on deliveries or any change to the way in which they have been doing business. It is particularly difficult to implement a strategy that gives one business a real or perceived advantage over a competitor. It is also difficult for an agency to justify removal of on-street parking and, potentially, the loss of meter revenue, to accommodate more or larger truck loading zones. The implementing agencies need to evaluate these concerns in light of the advantages and disadvantages.
Bus Bays
Policy 6.D-6 Where warranted by traffic speed, volume, and average bus schedule dwell time; where consistent with maintaining a positive pedestrian environment; and where approved by RVTD, local governments, and ODOT where appropriate, shall facilitate implementation of bus bays on congested arterial streets as a means of facilitating traffic flow during peak travel periods.
Bus bays are areas along a roadway that allow buses to pull out of the travel lane while boarding or discharging passengers. They may be used to relieve congestion and to reduce the interference between buses and other traffic. Buses stopping frequently in through traffic lanes may frustrate the vehicle drivers who are following, possibly causing a following driver to take unsafe risks to overtake the bus. Bus bays may also prevent following traffic from stopping in intersections. Bus bays are more effective on heavily traveled arterials or collectors, where their use may be an effective TSM strategy.
A potential disadvantage of bus bays is that it may be difficult for buses to re-enter the stream of traffic once they have stopped in the bus bay. This can slow transit service considerably, making it a less viable mode of transportation. Currently, Oregon has a Yield to the Bus Law requiring drivers to yield to buses that are trying to merge back into traffic. Potential disadvantages to bus bays can be mitigated by equipping RVTD s fleet with electronic yield signs, using public service announcements to explain the law, and enforcement of the law by local officers.

56
Intelligent Transportation Systems
In 2004 the RVMPO completed a comprehensive Intelligent Transportation Systems plan (RVITS). This 20-year plan identifies advanced technologies and management techniques that can relieve traffic congestions, enhance safety, provide services to travelers, and assist transportation system operators in implementing suitable traffic management strategies. The project is part of a federal initiative to use ITS to increase the efficiency of existing transportation infrastructure, improving overall system performance and reducing the need to add capacity. Efficiency is achieved by providing services and information to travelers so that they can make better travel decisions and to transportation system managers so they can better manage the system. To assure the development of a relevant plan, RVITS was produced with guidance from RVMPO member jurisdictions and key stakeholders from emergency services and communications agencies.
The RVITS plan provides a framework of policies, procedures and strategies for integration of ITS with the region s existing resources to meet future regional transportation needs and expectations. The plan includes the continuation and expansion of TSM projects and programs that have been under way for some time, such as coordination of traffic signals.
RVITS projects address the following categories:
Travel and Traffic Management
Communications
Public Transportation Management
Emergency Management
Information Management
Maintenance and Construction Management.
57
77.. TTRRAANNSSPPOORRTTAATTIIOONN DDEEMMAANNDD MMAANNAAGGEEMMEENNTT
EELLEEMMEENNTT
IInnttrroodduuccttiioonn ---- WWhhaatt iiss TTrraannssppoorrttaattiioonn DDeemmaanndd MMaannaaggeemmeenntt ((TTDDMM))??
The region s TDM program, spearheaded by Rogue Valley Transit District, has several aspects. Its goal is reducing Single-Occupant-Vehicle (SOV) trips and Vehicle Miles Traveled (VMT) by encouraging the use of other modes of travel. It seeks to achieve these changes through better non-SOV facilities and education aimed at making the use of these modes more attractive than driving alone. TDM therefore includes ride-sharing, trip reduction and also transit, cycling and walking. For a fuller discussion of transit activities and issues, see Chapter 11, Transit System Element, and for a fuller discussion of bicycle and pedestrian systems see Chapter 10, Bicycle and Pedestrian Element. The counties served by TDM funding are Jackson, Josephine, Klamath and Siskiyou although most activities fall within Jackson County as this is where the majority of VMT occur.
TDM is important because of the lack of adequate funds and space to maintain and expand road infrastructure nationwide. The traffic capacity of existing roads is quickly filling up; the auto encourages sprawl that requires extra facilities and more VMT per household; the auto is the largest producer of harmful emissions; and the largest consumer of petroleum-based fuels. TDM can benefit society at a very reasonable cost compared to the cost of continuing on an SOV-focused system.
SSttaattee RReeqquuiirreemmeennttss
Goal 4 of the Oregon Highway Plan is:
To optimize the overall efficiency and utility of the state highway system through the use of alternative modes and travel demand strategies.

58
Urban areas with populations over 25,000 are required by the Oregon Transportation Planning Rule to address Transportation Demand Management in their Transportation System Plans. For these reasons, TDM strategies are an integral part of the transportation planning being pursued in the Rogue Valley s Regional Transportation Plan. As expressed in the following policy:
Policy 6.A-1 The implementation of a regional Transportation Demand Management (TDM) program shall be an important component of a comprehensive strategy to reduce demands placed on the transportation system. Special TDM activities shall be utilized to address unusual special and recurring events such as fairs, festivals, and other cultural and large-scale activities.
Because of this, the RVMPO has adopted the following overall policy regarding TDM:
Policy 6.A-2
Transportation Demand Management measures should be considered before transportation capacity expansion is determined to be necessary.
The purpose of Transportation Demand Management (TDM) is to reduce the number of single-occupant vehicles using the road system while offering travel options. TDM employs a variety of improvements both structural changes such as parking areas for carpoolers, and bike lanes, as well as policy initiatives such as staggered work schedules to increase the capacity of the transportation system without the expense and inconvenience of major highway expansion. If implemented on an area-wide basis and actively supported by agencies, businesses, and residents, TDM strategies may be able to reduce or delay the need for street improvements, save travelers some money, reduce energy consumption and improve air quality.
These benefits become increasingly important as the region continues to develop, and both the land and the funding for roadway construction grow scarcer. The Federal Highway Administration predicts that strategies to manage demand will be more critical to transportation operations than strategies to increase capacity (supply) of facilities. The inability to easily and quickly add new infrastructure, coupled with the growth in passenger and freight travel, are forcing metropolitan areas to pay more attention to managing demands.
HHooww DDooeess TTDDMM WWoorrkk??
The current transportation system in much of the US is built around the automobile with wide streets, high speeds, sprawling development, and a lack of pedestrian, bicycling and transit-supporting infrastructure. TDM seeks to revitalize urban centers and assist rural areas to become friendlier to the pedestrian and bicyclist, making the auto less attractive. TDM requires an approach using both incentives, such as bus pass programs, and disincentives such as SOV parking surcharges. Government agencies have expended considerable effort encouraging major trip generators such as universities and major employers to take the initiative in developing TDM programs. Past experience however has shown that employers need encouragement and incentives to adopt TDM measures affecting the work commute a major target of TDM programs.

59
Stakeholders in the transportation system may not see the true costs of an auto based society and observe many actions resulting in the majority of transportation funding being dedicated toward expanding and improving the road system.
The affected public needs to continue efforts to mobilize their public officials to provide adequate transportation facilities and services for pedestrians, cyclists and transit service. Stakeholders also need to become part of a critical mass to show that non-SOV modes have interest, feasibility and merit.
An illustration of TDM s effectiveness comes from Ashland, where an examination of long-term growth projections and travel demand led to a determination that an area-wide TDM policy, combined with a set of Transportation System Management (TSM) measures (TSM is discussed in Chapter 6), would yield an overall street system that operates within capacity. TDM measures considered in Ashland s analysis were:
Improved pedestrian and bicycle system connectivity, access and circulation;
Enhanced transit coverage and service;
Employer-based transit subsidy (e.g. university student pass program);
Rideshare, carpool and vanpool programs; and
Mixed use land development.
TDM strategies are aimed at minimizing travel or encouraging travel by a mode other than a single-occupant automobile. A community or an employer could take a number of approaches to accomplish this. First, a community could attempt to decrease peak demand, either by shifting person-trips from the peak hour of demand, or by eliminating person-trips. (Person-trips represent the number of trips made by an individual, while vehicle trips account for multiple person trips depending upon the number of people traveling in the vehicle.) Second, for the person-trips that are necessary during the peak hours of demand, a community may encourage alternatives to Single-Occupant Vehicles (SOVs).
There is a difference between TDM outreach strategies for the employers and for the public Employers can undertake a variety of marketing or promotional activities to support their employees not using a SOV, such as flyers, trip-reduction programs, incentives, and using the other modes themselves as a role model.
By contrast, not being organized around a workplace, the general population needs to be attracted into non-SOV travel with public outreach through special events such as Car Free Day. They can also take advantage of transportation-efficient mortgages, the real estate profit of having greenways nearby, feeling secure about their kids walking to school on a sidewalk. Reaching this population relies on general marketing such as brochures, commercials, etc. and being available to be a personal consultant if needed.
Bicycling and walking are most applicable for short trips, while ridesharing and transit may be preferable for intermediate and long trips. Telework may be used as a trip alternative regardless of the distance. Finally, a community may reduce the demand on its surface transportation system by decreasing the distances traveled by vehicle trips. Some methods for reducing trip lengths include transit-oriented designs and compact, mixed-use developments. There is an important inter-

60
relationship between the transportation demand management and land use. Some of the implications of land use changes are presented in the Land Use Element.
The following are examples of policies and programs that can support TDM.
Alternative Work Arrangements
Local governments and major employers (greater than 50 employees) encourage work arrangements providing an alternative to the 8-to-5 work schedule. These arrangements may include employee flextime programs, staggered work hours and compressed work weeks.
Employee Flex-Time Programs
One opportunity employers have to affect total trip demand is through influencing their own employees peak versus off-peak travel behavior. A flexible schedule may allow employees to match their work hours with transit schedules, make carpool arrangements, or merely avoid peak congestion times. Active promotion of alternative schedules might slightly decrease total peak hour traffic.
Flextime is most useful in offices, particularly for administrative and information workers. It may not be as applicable for non-office employers since their employees often have to work hours that are not during the peak hour of traffic demand anyway (e.g., retail employers), or because their work requires continuous communication between workers. In addition, flextime may be difficult for small employers to implement.
Staggered Work Hours
Staggered work hours is a policy of established starting and finishing times for different groups of employees. Unlike flextime, the employer, not the employee, determines the staggered work hours. Like flextime, this tool has greater applicability to employees of large offices, since many non-office employees already work staggered work hours, or work in an interdependent manner. Currently, some metropolitan area employers have staggered work hours due to the nature of their business. To have a significant impact on peak period traffic, however, a change in work hours would need to be much more widespread than it is today.
Government agencies could take a lead by establishing a standard work schedule that differs from the typical 8 a.m.-5 p.m. schedule. For example, employees can be encouraged to work a 7-to-4 or 9-to-6 day work schedule. This is often done for the street and parks crews in public works situations because of summer hours and weather conditions. It might also be established for other employees although some agencies and local governments have encountered opposition from employee groups claiming they should have additional compensation for unusual work hours. Staggered work hours have to be considered in light of the need to have service desk hours that meet the needs of residents, but could actually increase the opportunities for resident contact.

61
Compressed Work Week
Compressed workweeks involve employees working fewer days and more hours per day. One common form of this policy is the 4-day/40-hour week where the employee works four 10-hour days. A second common form is the 9-day/80 hour schedule, in which the employee works 9 days and 80 hours over a two-week period. With the 4/40 schedule, the employee gets one business day off each week; with the 9/80 schedule, the employee gets one business day off each two weeks.
Because of the extended hours, both policies usually shift one leg of a work trip per working day (either the arriving or departing leg) out of the peak hours. The 4/40 policy additionally eliminates an entire work trip every five business days (1/5 of the work trips). The 9/80 policy eliminates an entire work trip every 10 business days (1/10 of the work trips).
One of the problems with a compressed work schedule is the potential for increases in non-work trips during the off day. Increases in non-work travel may offset reductions in work related driving. Such trips, however, are often taken during non-peak periods and can be expected to provide benefits by reducing peak hour congestion and by improving air quality.
Telecommuting
Telecommuting is another way employers can reduce total trip demand. Telecommuting or telework is work done away from the worksite with the assistance of telecommunications technologies, serving to reduce trips to and from the worksite. Phones, pagers, faxes, emails, computers, and the Internet all are telework tools. Telecommuting for one or two days per week could save significant trip miles and still allow the benefits of working at the central work site. Telecommuting arrangements also may involve more than one employee, e.g., when an employer provides a satellite work center connected to the principal work center. Another telecommuting alternative is a neighborhood work center operated by more than one employer, or by an agency. Recent advances in communications technology should greatly enhance telecommuting options.
Due to the distance and volume of trips between Medford and Ashland, trips between these two cities may be the easiest to replace with telecommuting. Southern Oregon State College in Ashland would be a logical site for a telecommuting center if sufficient demand exists among Medford employers. Similarly, Rogue Community College in Grants Pass might be able to service telecommute trips between Grants Pass and Medford.
Ridesharing
Ridesharing includes two principal categories: carpooling and vanpooling. Carpooling uses an employee s private vehicle to carry other people to work or other destination, either by using one car and sharing expenses, or by rotating driving responsibilities and vehicles. Vanpooling involves the use of a passenger van consistently driven by one or more of the participating employees, with the costs partially paid by the other riders through monthly fares. A common feature of vanpooling is that the van is often owned by the employer, a public agency (such as a transit district), or a private, non-profit corporation set up for that purpose. Otherwise a lease agreement can be set up.

62
Ridesharing can be greatly influenced by special treatment at the work place. Participation can be increased by employer actions that make ridesharing more convenient, such as providing guaranteed ride home services, preferential car/vanpool parking, and area-wide and employer-based commuter matching services.
Guaranteed Ride Home
A guaranteed ride home often makes ridesharing more attractive. Surveys have shown that many employees drive to work because they feel they need their automobile during the day or because they may work late. In some cases, they need their automobile for work trips or errands or want it available for emergencies. Therefore, provision of daytime and emergency transportation, by allowing use of a company vehicle or employer-sponsored free taxi, can encourage ridesharing. RVTD began a GRH program in 2004 and it can be used by any employer that adopts TDM strategies. The program is set up so that the employer must be the first responsible party for securing a ride home and if this is not an option RVTD s Translink call service for the Valley Lift program will schedule a taxi for the employee at no charge to the employee.
Preferential Parking
Preferential carpool and vanpool parking is another simple, inexpensive way for an employer to encourage employees to rideshare by increasing the ease of access to the workplace. Ideally preferential carpool and vanpool parking spaces are provided close to the building entrance to provide convenient access to the building, particularly during inclement weather conditions. Adequate enforcement strategies need to be in place so that the spaces are not filled with SOV.
Ride-matching
Commuter matching services, whether area-wide or employer-based, help commuters find others with similar locations and schedules. An employer-based matching service offers the advantage of a shared destination, but presents the disadvantage of limiting the pool of potential riders. A carpool matching service can be one-time or continuous. For the study area, the Rogue Valley Transportation District serves as the carpooling agency and performs a variety of services to support and encourage the use of carpools, including matching of potential riders. They lease a website created by the City of Portland (www.CarpoolMatchNW.org) and offer it for free to participating counties.
Trip-Reduction Ordinance
In the spectrum on incentives and disincentives (or carrots and sticks ) to foster TDM, a Trip Reduction Ordinance such as the one in place in Portland Trip-Reduction Ordinance (TRO) could be put in place in the Rogue Valley. [Julie: you need to state what it is/does.]In Portland it is applicable to employers with more than 500 employees; in the Rogue Valley a threshold of 100 employees might be more appropriate. Such an ordinance would apply to both existing and proposed development, thereby distributing the responsibility equitably between existing and future development.

63
Ordinances are usually phased into many communities slowly as a way of easing the compliance burden. A voluntary compliance period is initially implemented for employers to voluntarily adapt to the requirements and learn the various demand management tools, such as promoting ridesharing, subsidizing transit passes, and developing parking incentives. During this period, studies are conducted to determine whether voluntary compliance is meeting the community trip-reduction goals. If the goals are not met, then a community may choose to make the trip reduction goals mandatory for major employers and/or expand the Ordinance to smaller ones.
SSuuppppoorrtt ffoorr TTDDMM
Oregon State, County and City policies and goals include provisions to embrace TDM measures. Health officials, real estate professionals, insurance companies, credit agencies, environmental stewards, people under the age of 16, people with disabilities, low-income populations can all benefit from TDM measures.
RVTD has had a TDM program in place since 1993. Current TDM activities include:
Alternative Transportation education programs that reached over 6,000 students in the 2003-4 school year and is now moving into a Senior Education program;
Public outreach activities to promote TDM and non-SOV transportation modes;
Employer bus-pass programs;
Free assistance with carpools, vanpools, Business Energy Tax Credits, telework, and trip-reduction incentives;
Free employer trip-reduction analysis;
On site transportation fairs for employers;
Distribution of free materials in the community such as pedestrian and cycling reflectors, brochures, water bottles, bicycle helmets;
Government outreach to educate officials about TDM measures including attending meetings to promote the use of TDM measures, and reviewing planning documents and site design for TDM-supportive policies and infrastructure;
Supporting parking construction mitigation- reducing the need for parking expansion with TDM measures;
Bicycle parking review and site design;
Trip Reduction Incentive Programs- Creating and assisting with building and maintaining a Trip Reduction program that tracks employees trips and rewards those who use non-SOV modes;
64
Coordination of events to raise awareness of efficient transportation such as Car Free Day, Reflect on Walking, Safe Routes to School; and
Marketing of TDM through general advertising in various media.
Since one major implementation tool for a TDM program is a Transportation Management Association (TMA), this topic is discussed in depth in the next section.
TThhee RRoogguuee VVaalllleeyy TTrraannssppoorrttaattiioonn MMaannaaggeemmeenntt AAssssoocciiaattiioonn
Policy 6.A-3 Local governments and ODOT shall support and encourage the growth of the Rogue Valley Transportation Management Association (TMA). The purpose of a TMA is to encourage the policies under RTP Goal 6 and to work with major employers to adopt trip reduction goals, policies and programs designed to reduce site vehicular trip generation, and to offer specific incentives in partnership with regional TDM projects.
The Rogue Valley Transportation Management Association (RVTMA) is a voluntary association of private and public sector parties. Its mission is to increase the efficiency of the local transportation system, often through programs that reduce SOV reliance. The RVTMA was established in 2002 to meet one of the requirements of the Alternative Mobility Standards for the South Medford interchange. The standards, approved by the Oregon Transportation Commission, imposed certain conditions on growth in the interchange area, including the formation of the RVTMA to address traffic congestion problems. The RVTMA also has added the goals of improving air quality, enhancing transportation efficiency and maintaining the quality of life by reducing SOVdependence.
As of September 2004, there were three private sector and five public sector members. Private Sector Public Sector Bear Creek Operations City of Medford Asante Jackson County Rogue Community College Rogue Valley Transportation District
Oregon Dept. of Transportation
Rogue Valley Council of Governments Advanced Business Teleservices is not a member but they have a bus pass program, similar to SOU s. Reasons for employers to join the TMA and / or become more involved in TDM programs include:
Reduced demand on parking;
Having to construct less parking in the future;
Tax breaks at both state and federal levels;
A healthier workforce with improved productivity and decreased absence;
Being a business that is good for the community s well being.

65
Some recent activities of the RVTMA include:
Assisting Asante with setting up vanpools and carpools to decrease the number of employee vehicles at the work site while the new parking garage was being built;
Assisting Rogue Community College with managing its parking issues; and
Hosting a public forum on parking and transportation in downtown areas.
Short-range plans for the RVTMA include a comprehensive survey of the regions largest employers to introduce them to the opportunities and potential benefits of TDM, gauge their interests and needs, and encourage their participation in the association.
The availability of information about transportation services and conditions has been shown to influence travel demand. Information affects demand by influencing the choices that people make about how, when, where, whether, and which way they travel to their destinations. The need to deliver information to help manage transportation demand will grow and be supported by Intelligent Transportation Systems (ITS), which is discussed in the Transportation Management Element.
EEdduuccaattiioonn && MMaarrkkeettiinngg
Policy 6.A-4 Federal, state, regional, and local government agencies should become role models in demonstrating effective and extensive TDM. This includes encouraging alternatives to private auto use through incentive programs within their own places of employment. These may include: flexible work schedules, staggered work hours, compressed workweeks, subsidizing ridesharing or by making ridesharing more convenient through [for example] preferential parking spaces, fare subsidies, increased vacation time, promotion of telecommuting and other techniques to encourage transit, carpool, bicycle and walking trips. Commuting TDM programs should accommodate a guaranteed ride home program to further encourage their use.
Public agencies can obtain guidance and assistance in implementing TDM programs through participating in the Rogue Valley TMA.
Policy 6.A-5 Develop public-private partnerships with employers to adopt trip reduction goals, policies and programs designed to reduce site vehicular trip generation, and to offer specific incentives to foster TDM.
Education and marketing are important parts of any TDM program. It is possible for education by itself to be an incentive or disincentive that causes positive transportation behavior changes. Education and marketing complement any incentive/disincentive programs in place by increasing awareness and understanding of those programs. Education can be hands-on such as supporting a bus/bike-buddy program or it can be through traditional media such as newspaper, radio and TV

66
advertisement, flyers and brochures, transportation exhibits, attending public meetings and giving testimony to public officials. Education that would promote using alternative modes of transportation would consist of highlighting the health and economic benefits, the environmental benefits as well as the facilities that a person can use. Marketing that would make driving a car less attractive are to show the true cost of owning a car, the environmental impact, how it increases sprawl and the US dependence on foreign oil to name a few. Although education and marketing are basic building blocks to a successful program it can only supply so much initiative for using alternative transportation. An example would be that many people know what times to catch a bus and where the bus stop is from successful education and marketing but they cannot use it because their work schedule runs after service hours, or possibly there is not connected sidewalk access from their work to the bus stop and they feel unsafe.
RVTD is home to the first Interactive Bus program in the nation. Gus Rides the Interactive Bus takes children, adults and seniors on a bus ride to give them hands-on education about riding the bus safely and easily. The program reaches over 6000 children a year alone and has a very successful record for creating new bus riders.
FFaacciilliittyy RReeqquuiirreemmeennttss
TDM addresses travel behavior the choices people make and seeks to establish conditions under which people will change a long-established habit of driving themselves to destinations. Providing the right kinds of facilities and services are crucial to the success of many of the policy changes and programs described in the preceding section. Several of those strategies are closely tied to land use planning and the provision of adequate pedestrian/bicycle facilities and transit services, and modifying parking requirements. Another example is that TDM could include constructing of High Occupancy Vehicle (HOV) or diamond lanes or an exclusive busway. Other pavement includes sidewalks and bikeways.
Specific actions related to parking are included in the Parking Element. Strategies aimed at improving pedestrian and bicycle facilities are discussed separately in the Bicycle and Pedestrian System Element. Transit service improvements are discussed in the Transit System Element.
Key to the success of several TDM strategies is establishment of park-and-ride facilities. These facilities increase efficiency of the transportation system, reduce energy consumption and provide options to the single-occupant vehicle trip. Park-and-ride facilities increase the effectiveness of transit service by expanding the area from which a transit draws riders. Patrons living beyond walking distance of an established transit stop can drive or bike to the park-and-ride and use transit or meet carpool partners, instead of driving alone or cycling long distances to their destination. Having free easy-to-access, security and safety, easy to understand layouts, and direct pedestrian and bicyclist connections make the use of park-and-ride lots desirable.
Park-and-rides are frequently located near freeway interchanges or at transit stations and may be either shared-use, such as at a church or Transit Oriented Development (TOD) center, or exclusive-use. Shared-use facilities are generally designated and maintained through agreements reached between the local transit operator and nearby businesses, churches, or other entities.

67
PPrrooggrraamm AAsssseessssmmeenntt
The scale of the RVTD outreach and education activities are strengths. RVTD currently focuses on public and government outreach more than on private sector employers. RVTD has contacted every major employer and hundreds of small employers in the Valley but has not spent a great deal of time on those who are not interested at first glance. The deployment of RVTD-TDM staff time, education and experience are very efficient, being able to oversee various programs and meet deadlines while being responsive to new opportunities. Bus ridership is increasing an average of 15% per year for the past 4 years. RVTD just needs to secure funding to expand service. Route 10 to Ashland often has standing passengers.
The TDM program s weaknesses are not internal to the program but due to the context in which it operates, including:
The current transportation system is built almost entirely for the automobile- this is the number one wall that TDM faces every day of operations
The RVTMA is a fledgling organization, and its efforts have been hampered by a lack of funding for necessary outreach efforts;
Lack of government staff to help support the programs; RVTD has found that developers who are interested in designing TDM features into their projects are often unable to get any information from City staff. When trying to change zoning or plan elements to be more TDM-responsive, developers may be turned down because of unsupportive city policies;
Lack of support for TDM in local government; TDM has little recognition by local officials;
Lack of safe and accessible pedestrian and bicycling facilities;
The limited transit service, due to insufficient funding; and
The tendency until recently to focus on bedroom community development (outside of Medford) instead of self-sufficient communities with greater jobs-housing balance and less need for regional travel.
All funds for management of the RVTMA and delivery of Transportation Demand Management (TDM) services come through the Rogue Valley Transportation District. The TDM funds originate with ODOT and the funds for RVTMA management are CMAQ (Congestion Mitigation and Air Quality) funds from the U.S. Department of Transportation. Until 2003 TMA funds came from RVTD TDM. CMAQ began funding the TMA via RVTD in 2003; this will continue through 2006.
The expansion of transit, a key TDM strategy element, likewise is limited by funding constraints. The limitations on RVTD are more fully discussed in the Transit System Element. Funding problems aside, public interest in expanded bus service (nights, weekends, greater frequency, and expanded

68
routes) is high. In RVMPO-sponsored focus groups and an Open House session during 2004, improving bus service was viewed as key to increasing bus ridership and making the bus a viable alternative to the SOV.
Public opinion also has indicated that SOV use continues to be the desirable option at least in part because of the relative lack of serious highway congestion and safety problems in the region. In short, driving isn t difficult enough to force people to look for alternatives. While that attitude speaks well of our roads, it indicates that success with TDM measures will be difficult. A challenge for the region in the short-term will be to set the conditions in place now to support greater transit use in the future when more drivers will be looking for easier traveling alternatives. Those conditions include reserving space for High-Occupancy Vehicle (HOV), Bus Rapid Transit (BRT) or carpool lanes, and park-and-ride areas, as well as securing funds to expand transit service for those who need it.
FFuuttuurree OOuuttllooookk
TDM relies on efficient land use planning, education, and making the use of walking, cycling, carpooling and transit attractive. The 25-year outlook for TDM should focus on how the cities in the MPO can begin having incentives for developers to make compact development accessible for pedestrians and bicyclists, and on how education can promote the use of these facilities. By doing these things, driving a car will become less and less attractive as an option. Transit is only ONE component of TDM; pedestrians and cyclists need to be part of the program also.
Home-to-work and return trips comprise about one-fifth of total daily trips, and about half of the peak period traffic. Although all other types of trips are potential targets for TDM alternatives, the effect is likely to be considerably less because the trips are not as regularly scheduled (e.g., shopping or business trips), often already have a higher vehicle occupancy (e.g., school trips), and sometimes involve the transfer of goods (e.g., shopping trips). Therefore, TDM strategies recommended for the metropolitan area focus primarily on home-to-work and return trips. Strategies include establishing alternative work arrangements, promoting telecommuting and ridesharing, and, possibly, adopting a trip reduction ordinance.
Informal public survey activities have shown that transit could become an alternative to driving to and from work, easing the most serious of the region s traffic congestion problems if transit service were improved in key areas. These improvements include greater bus frequency, availability of evening service, and availability of park-and-ride facilities, which also would support carpooling. As the region grows, these improvements will become more economically viable.
PPoolliiccyy IIssssuueess aanndd AAccttiioonnss
There are several actions that can be taken to further the aims of TDM.
Identifying, encouraging and assisting role models who use alternative transportation. This can be done through awards, incentives and events.
Encouraging developers to build high-density, multi-use buildings.

69
Adopting maximum parking space requirements and an option to decrease parking further with the use of TDM measures such as having attractive bicycle and pedestrian facilities, and carpool spaces within ¼ mile of transit service.
Partnering with city government to encourage employers with more than 50 employees to adopt TDM strategies.
Prioritizing all city and county TSP bicycle and pedestrian construction projects to be complete in the earlier phases of this Plan.
Encouraging developments with a large footprint to have a bicycle and pedestrian circulation plan.
Securing funding for street aesthetics such as street furniture, landscaping, lighting, and creating dispersed tiny public places.
Supporting the use of transit among major employers by encouraging the purchase of individual or subsidized group transit passes, having a bus shelter added nearby or other actions to reduce commuting trips;
Encouraging development of discount transit fare programs and shuttle services by event sponsors; and
Engaging in public, government and employer outreach to raise awareness about the use of TDM strategies, including actively marketing to groups that have the greatest potential for reducing SOV trips.
70
88.. SSTTRREEEETT SSYYSSTTEEMM EELLEEMMEENNTT
IInnttrroodduuccttiioonn
The Street System Element of the RTP consists of a list and maps of proposed projects relating to the street system that provide facilities for motorists, buses, bicyclists, and pedestrians. The list identifies projects on the arterial and collector street system to serve long-range needs for mobility and accessibility based upon anticipated development through the year 2030.
In many cases, the street system improvements provide for upgrades to urban and rural streets that will include bicycle lanes or wider shoulders for safe bicycle travel, and the addition of sidewalks to allow for safe and accessible pedestrian use. Accessibility to transit routes is materially improved by the construction of sidewalks.
GGuuiiddiinngg PPrriinncciipplleess
The process of developing the Street System started with the Guiding Principles shown in Chapter 3. Of particular relevance are the goals and policies relating to making the most efficient use of the existing transportation infrastructure and to providing adequate mobility, safety, and accessibility for all modes of transportation. The Transportation Equity Act for the 21st Century (TEA-21) contains a number of planning factors to be considered in assessing projects within the MPO. One of these factors is emphasis on preservation of the existing transportation system. Maintenance is also an important component of the Oregon Transportation Plan. Its policy 4G states: It is the policy of the State of Oregon to manage effectively existing transportation infrastructure and services before adding new facilities.
In addition, Oregon s Transportation Planning Rule requires Regional TSPs to be consistent with the State Planning Goal 12 - Transportation.
PPrroojjeecctt PPrriioorriittiieess
Figures 8-1 and 8-2, which show the list of street system projects scheduled for construction in the RVMPO between the years 2005 and 2030, have been developed in close coordination with RVMPO

!(
!(!(
!(
!(
!(
!(
!(
!(
!(
!(
!(
!(
!(
!(
!(
!(
!(
!(
!(!(
!(
!(
!(
!(
!(
§̈¦5
tu238
tu62
tu234
tu99
303
302
304
301
911
810
820
566
538
509
532
540 531
508
533
536
537
552
561
503
216
202
211
912
203
217
215
205
204
539 562
Medford
Central Point
Eagle Point
Phoenix
White City
Jacksonville
8 12
545
801
811
806
810
803
816
903
808
804
809
800904
901
807
534
814
535
504
522
805
300
902
507
517
207
914
821
819
559
818
823
557
551
560
558
915
567
831
568
832
918
837
214
401
917
833
835
219
834
577
615
569
848
916
614
575
849
918
516541
514
512
513
511
510
802
905
554
822
213
212
208
576
574
573
572
571570
830
829218
HIG
HW
AY 6
2
F OO
T HIL
L
STAGE
TAB
LE R
OC
K
PINE
PHO
ENI XPACIFIC
CR
ATE R
LA
KE
8TH
BEALL
VILAS
BARNETT
STEWART
HIGHWAY 234
CENTRAL
RIVERSIDE
CO
LUM
BU
S
SAGE
KIN
GS
FRONT
JACKSONVILLE
SHASTA
BID
DLE
GARFIELD
5TH
HANLEY
HIG
HW
AY 2
38
WILSON
ROSSANLEY
HIGHWAY 140
ROGUE VALLEY
UPT
ON
MAIN
CO
UR
T
ALTA VISTA
MCANDREWS
10TH
CALIFORNIA
REE
S E C
RE E
K
APPLEGATE
LEA
R
ORE
GO
N
COREY
ROYAL
STEVENS
HILTON
LEIGH
MAIN
PACIFIC
HIGHWAY
238
CR
ATER
LA
KE
HIGHWAY 140
STAGE
HIGHWAY 234
O0 0.5 1 1.5 2
Miles
Map created on April 8th, 2005
RVMPO 2005 REGIONAL TRANSPORTATION PLAN
L
E
G
E
N
D
Urban Growth Boundary
Bear Creek
Interstate
Highways
Streets
MPO Boundary
Short (2005-2009)
Medium (2010-2015)
Long (2016-2030)
Project Timing
Streets Signals !(
!(
!(
Fig u r e 8 - 1
Rogue River
Street Projects - Northern MPO (Eagle Point, White City, Central Point, Medford and Jacksonville)

!(
!(
!(
!(
!(
!(
!(
!(
!(
!(
!(
§̈¦5
tu66
tu99
902
813
615
710
836
908
Ashland
Talent
Phoenix
MAIN
PACIFIC
HIG
HW
AY 6
6
SISKIYOU
PHO
ENIX
BARNETT
TALENT
ASHLAND
STAGE
HIGHWAY 99
LITHIA
CEN
TER
V ALL
EY V
IEW
BO
LZ
HIGHWAY 99
MAIN
PACIFIC
907
901
913
702
709
708
901
711
559
560
717
132
131
133
7 19
124
125
575
849
514
715
121
120
119
134
129
128
127
122
830
O0 0.5 1 1.5 2
Miles
Map created on Febuary 24th, 2005
RVMPO 2005 REGIONAL TRANSPORTATION PLAN
L
E
G
E
N
D
Urban Growth Boundary
Bear Creek
Interstate
Highways
Streets
MPO Boundary
Short (2005-2009)
Medium (2010-2015)
Long (2016-2030)
Project Timing
Streets Signals !(
!(
!(
F i g ur e 8 - 2
Rogue River
Street Projects - Southern MPO (Phoenix, Talent and Ashland)

73
member jurisdictions. It shows both Tier 1
the financially constrained project list and Tier 2,
projects for which funding cannot be identified within the 2030 timeframe. It has been based on:
an evaluation of the existing roadway system
member jurisdictions identified long-range needs
RTP Guiding Principles, and on
relevant state and federal goals, policies, and regulations.
In order to be included in the RTP projects must first meet the following criteria:
1) Upon demonstration of available funding through an analysis included in the RTP projects from city/county-adopted plans, projects will be considered for inclusion in the RTP s financially-constrained (Tier 1) planned project list.
2) Projects from city/county-adopted plans for which available funding is not identified in the RTP and/or which require goal exceptions from the state will be considered for the illustrative (Tier 2) project list. Such projects cannot be relied upon for purposes of meeting state planning requirements (e.g., Transportation Planning Rule) and are not considered planned projects in the RTP.
3) Projects developed through Regional Problem Solving (RPS) or any other process that has not been formally adopted by an RVMPO agency will not be considered for Tier 1 inclusion unless such projects can meet criterion #1 above. Such projects may be considered for inclusion on the Tier 2 list if a potential source of funding (and/or sponsoring agency) can be identified.
The street and highway project list has been developed as a two-tiered list. Tier 1 projects represent projects for which funding is available based on existing known revenue streams. These projects meet federal financial constraint criteria through the planning horizon of 2030. Tier 1 projects are the region s highest priority for funding.
Tier 2 projects are those that exceed current financial projections (please refer to Chapter 18
Financial Element for a detailed discussion of financial constraint of the RTP.). The Tier 2 project list thereby identifies projects that are lower in priority to those on the Tier 1 list and are not considered planned projects. These projects illustrate the region s priorities should unanticipated additional revenue sources become available.
RRTTPP SSttrreeeett aanndd HHiigghhwwaayy PPrroojjeecctt LLiisstt
The list of street system projects (comprised of both Tier 1 and Tier 2 projects) includes 332 projects that fall under the jurisdiction of ten agencies including: the cities of Ashland, Central Point, Eagle Point, Jacksonville, Medford, Phoenix and Talent, as well as Jackson County and the Oregon Department of Transportation (ODOT). Projects that are funded by the White City Urban Renewal Agency are included within the Jackson County list of projects. Tier 1 projects have been divided into short, medium, and long-range phases.

74
Figure 8-3 shows the 332 projects scheduled for construction in the RVMPO between 2005-2030. These projects have been listed under the agency that will have principal jurisdiction over construction. They have then been sorted according to timing phase and tier. With the exception of a few short-term projects that include federal funding sources, projects listed are those on the RVMPO s major street network, defined as collector and arterial streets.
The following information is included for each project in Figure 8-3:
project location;
project description;
timing (short, medium, long range) and
project cost.
Figure 8-3 also provides total project cost and funding availability per timing phase. Further information about funding availability can be found in Chapter 18 Financial Element.
PPrroojjeecctt LLooccaattiioonn
For most projects, the location is a street segment defined by the street name along with project termini. For others, the location is an intersection. Specific location information will often be refined when further analysis and preliminary engineering are conducted prior to construction.
PPrroojjeecctt DDeessccrriippttiioonn
A general description of each project is included and has been based on the best available information. Project information will often be refined between a project s inclusion in this list and its construction. The vast majority of listed projects include urban upgrade types of improvements, which generally include installation of sidewalks and pavement widening to accommodate bicycle lanes and turning lanes.
The planning of projects listed in Figure 8-3 has considered many variables including: traffic volumes and turning movements, truck and bus routing, the location of intersecting streets and driveways, the available right-of-way, topographic constraints, accident history, utility conflicts, and impacts on property owners. Such information is typically refined during the engineering phase of project implementation, which often immediately precedes construction.
TTiimmeeffrraammee
Projects in the list are divided into three general categories, according to the phase in which construction itself is expected to take place. The short-range phase includes projects expected to be completed between 2005-2009; the medium-range phase includes projects scheduled between 2010-2015; and the long-range phase includes projects scheduled for more than ten years after plan adoption, or years 2016-2030.
Since environmental analysis, design, engineering work, and right-of-way acquisition precede construction, these activities may be undertaken in the phase preceding that listed for construction.

Figure 8-3 - RVMPO RTP Street System Project List
RTP# Location Description Timing CostCost by Phase
Funds Avail
Ashland100 C St., Eureka St. and Walnut St. Pave and improve (CMAQ) short $818,000101 Jackson Rd. to Laurel St. N. Ashland multi-use pathway short $646,000102 A St., Oak St. to Third St. Overlay short $105,000103 B St., Fifth St. to Third St. and Oak St. to First St. Overlay short $131,000104 Granite St., Nutley St. to Winburn Way Overlay short $156,000105 Beach Ave., Gresham St. to Hargadine St. Overlay short $114,000106 Hargadine St., Gresham St. to Second St. Overlay short $38,000107 Beach St., Siskiyou Blvd. to Henry St. Overlay short $33,000108 Harrison St., Siskiyou Blvd. to Iowa St. Overlay short $43,000109 Harrison St., Iowa St. to Euclid Ave. Overlay short $75,000110 Taylor St., Holly St. to Ashland St. Overlay short $136,000111 Helman St., Hersey St. to Orange St. Overlay short $55,000112 Iowa St., Siskiyou Blvd. to Gresham St. Overlay short $275,000113 Allison St., Union St. to Sherman St. Overlay short $60,000114 Oak St., Lithia Way to R/R Overlay short $250,000115 Allison St., Sherman St. to Gresham St. Overlay short $150,000116 S. Mountain Ave., Ashland St. to Prospect St. Overlay short $310,000117 W. Nevada St., Cambridge St.to Helman St. Overlay short $150,000 $3,545,000 $3,592,000118 E. Hersey St., Ann St. to N. Mountain Ave. Bike lanes and sidewalks medium $315,000119 N. Main at Hersey St. and Wimer St. Intersection enhancements w/ signalization medium $725,000120 Oak St. at R/R X-ing R/R X-ing improvements, signals and surface medium $770,000121 E. Main at R/R X-ing R/R X-ing improvements, surface improvement medium $225,000 $2,035,000 $2,039,000122 Walker Ave. at R/R X-ing R/R X-ing improvements, surface improvement long $225,000123 Laurel St., Hersey St. to Randy St. Sidewalk upgrade long $125,000124 Beach St., Glenwood Dr. to end of street Extend paved street long $125,000125 Liberty St., Clarence Ln. to end of street Extend paved street long $105,000126 Tolman Creek Rd. from OR 66 to E. Main St. Overlay long $200,000127 Oak St. at Hersey St. Signalize intersection long $225,000128 Siskiyou Blvd. at Normal Ave. Signalize intersection long $225,000129 Siskiyou Blvd. at Tolman Creek Rd. Signalize intersection long $225,000130 Tolman Creek Rd. at Siskiyou Blvd. Intersection improvements long $290,000131 Tolman Creek Rd., Greenmeadows Way to Siskiyou Blvd. Urban upgrade w/ bike lanes and sidewalks long $1,053,000132 Granite St., current terminus to Glenview St. Street upgrade w/ curb, gutter, sidewalk etc long $250,000133 N. Mountain Ave., Bear Creek Bridge to E. Nevada St Urban upgrade w/ bike lanes and sidewalks long $1,500,000134 Hersey St. & Laurel St. intersection R/R X-ing improvements, signals and surface long $1,500,000 $6,048,000 $6,130,000135 Fox St., Ashland Mine Rd. to city limits Street upgrade w/ curb, gutter, sidewalk etc. Tier 2 $120,000136 Ashland St. at I-5 overcrossing Signalize off-ramps Tier 2 $450,000137 Normal Ave., from current terminus to E. Main St. Extend street Tier 2 $1,262,000138 Clay St., Siskiyou Blvd. to E. Main St. Urban upgrade w/ bike lanes and sidewalks Tier 2 $2,806,000139 Nevada St. at Bear Creek Bridge construction Tier 2 $2,700,000140 E. Nevada St., Bear Creek to N. Mountain Ave. Extend street Tier 2 $1,198,000141 Ashland St. at I-5 overcrossing Widen overcrossing Tier 2 $5,000,000142 N. Ashland Bikeway, Laurel St. to Jackson Rd. Multi-use pathway Tier 2 $870,000143 Bear Creek Greenway, Valley View Rd. to W Nevada St. Extend path Tier 2 $1,093,000144 Mistletoe Rd., Siskiyou Blvd. to Tolman Creek Rd. Urban upgrade w/ bike lanes and sidewalks Tier 2 $1,656,000145 E. Main St., Walker Ave. to Clay St. Urban upgrade w/ bike lanes and sidewalks Tier 2 $1,500,000146 Grandview Dr., Scenic Dr. to Sunnyview Dr. Urban upgrade w/ bike lanes and sidewalks Tier 2 $800,000
Short Range (2005-2009) - Medium Range (2010-2015) - Long Range (2016-2030) Page 1 of 8

Figure 8-3 - RVMPO RTP Street System Project List
RTP# Location Description Timing CostCost by Phase
Funds Avail
Ashland (continued)147 Washington St., Ashland St. to E. Jefferson St. Urban upgrade w/ bike lanes and sidewalks Tier 2 $500,000148 N. Main St., OR 99 to Fox St. Urban upgrade w/ bike lanes and sidewalks Tier 2 $150,000149 Ashland Mine Rd., city limits to .5 miles west Urban upgrade w/ bike lanes and sidewalks Tier 2 $700,000150 E. Main St., city limits to Normal Ave. extension Urban upgrade w/ bike lanes and sidewalks Tier 2 $544,000151 E. Main St., Normal Ave. extension to Ashland St. Urban upgrade w/ bike lanes and sidewalks Tier 2 $6,383,000152 E. Main St. at Tolman Creek Rd. Realign intersection Tier 2 $272,000153 Crowson Rd., Siskiyou Blvd. to OR 66 Urban upgrade w/ bike lanes and sidewalks Tier 2 $1,970,000154 OR 66, Dead Indian Mem. to Crowson Rd Urban upgrade w/ bike lanes and sidewalks Tier 2 $2,045,000155 Dead Indian Mem., Approach to OR 66 Upgrade intersection and approach Tier 2 $92,000156 Terrace St., Glenview Dr. to Summit St. Extend paved street Tier 2 $300,000 $32,411,000 $0
Central Point200 Laurel St., N. 9th to N. 10th Pave and improve (CMAQ) short $168,000201 N. 9th St., Laurel St. to Cherry St. Pave and improve (CMAQ) short $489,000202 Haskell St., Pine St. to Snowy Butte Rd. Widen to add continuous turn lane with bike lanes and sidewalks short $750,000203 10th St., Hazel St. to Scenic Ave. Widen to add continuous turn lane with bike lanes and sidewalks short $1,250,000204 R/R X-ing between Pine St. and Scenic Rd. At-grade R/R X-ing short $1,600,000205 Upton Rd., approaches to I-5 overcrossing Widen to two lanes with bike lanes and sidewalks short $775,000206 Intersection of Upton Rd., 3rd St., Scenic Ave. and Tenth St. Change alignment at intersection, add sidewalks & bike lanes short $375,000207 E. Pine St., Bear Creek Bridge to Peninger Rd. Widen for turn lanes and bike lanes, add sidewalks short $140,000 $5,547,000 $5,555,000208 E. Pine St. Remove 4th St. signal, add new signals at 2nd St. and 6th St. medium $400,000209 E. Pine St. and Third St. intersection Upgrade traffic signals medium $250,000210 OR 99, Pine St. to Griffin Creek Rd. Provide bike lanes and sidewalks medium $450,000211 Pine St. traffic calming Construct bulb outs, and bike lanes and sidewalk improvements medium $450,000212 New Haven Rd. and Hamrick Rd. intersection Add signal for pedestrian crossing medium $250,000213 Beebe Rd. and Hamrick Rd. intersection Add signal for pedestrian crossing medium $250,000 $2,050,000 $2,087,000214 Freeman Rd., Oak St. to Hopkins Rd. Widen to add continuous turn lane with bike lanes and sidewalks long $1,898,000215 Scenic Ave., Mary's Way to Scenic Middle School Change alignment, widen to add bike lanes & sidewalks long $630,000216 Taylor Rd., Valley Oak Dr. to Haskell St. Replace box culvert and transition to new E-W sections long $1,000,000217 Scenic Ave., 10th St. to Scenic Middle School Widen to add continuous turn lane with bike lanes and sidewalks long $1,035,000218 OR 99 and Beall Lane intersection Change alignment and upgrade signals and R/R X-ing long $500,000219 Hazel St., 3rd St. to 10th St. Provide sidewalks, repair curb and gutter long $300,000220 3rd St., E. Pine St. to Hazel St. Add bike lanes and sidewalks long $225,000 $5,588,000 $5,597,000221 E. Pine St., Hamrick Rd. to Bear Creek Bridge Widen for decel/accel lanes, add bike lanes and sidewalks Tier 2 $355,000222 Gebhard Rd., UGB limits to Beebe Rd. Widen to add continuous turn lane with bike lanes and sidewalks Tier 2 $1,817,000223 Beebe Rd., Hamrick Rd. to Gebhard Rd. Widen to add continuous turn lane with bike lanes and sidewalks Tier 2 $934,000224 Bursell Rd., Beall to Hopkins Widen to two lanes with bike lanes and sidewalks Tier 2 $1,262,000225 W. Pine St., Hanley Rd. to Haskell St. Widen to add continuous turn lane with bike lanes and sidewalks Tier 2 $1,312,000226 10th St., E. Pine St. to Hazel St. Widen to add continuous turn lane with bike lanes and sidewalks Tier 2 $500,000227 Scenic Ave. and OR 99 intersection Add traffic signal and change alignment at intersection Tier 2 $375,000228 OR 99, Beall Ln. to Pine St. Widen to provide bike lanes and sidewalks Tier 2 $900,000 $7,455,000 $0
Eagle Point300 Crystal Dr. at OR 62 Extend Crystal Dr. west to OR 62 - w/ intersection improvement short $750,000301 Main St., Royal Ave. intersection Intersection reconfiguration short $150,000302 Main St. at N. Buchanan Ave. Intersection reconfiguration and improvements short $75,000303 Linn Rd. at S. Buchanan Ave. Widen box culvert and add turn lane short $78,000 $1,053,000 $1,053,000304 Shasta Ave. at Arrowhead Trail Intersection improvements medium $150,000 $150,000 $183,000
No projects due to lack of available funding long -$110,000
Short Range (2005-2009) - Medium Range (2010-2015) - Long Range (2016-2030) Page 2 of 8

Figure 8-3 - RVMPO RTP Street System Project List
RTP# Location Description Timing CostCost by Phase
Funds Avail
Eagle Point (continued)305 Royal Ave. at Old Highway 62 Realign intersection and other intersection improvements Tier 2 $500,000306 OR 62 frontage road Crystal Dr. to Barton Rd. (city share) Tier 2 $50,000307 Stevens Rd. to Onyx Rd. Connect streets Tier 2 $1,000,000308 OR 62 frontage road Barton Rd. to Rolling Hills Dr. (city share) Tier 2 $50,000309 Bigham Brown Rd. to Robert Trent Jones Way Arterial connection south - (city share) Tier 2 $100,000310 Loto St. extension Extend Loto St. from Shasta Ave. to Stevens Rd. Tier 2 $2,372,000311 Buchanan Ave. at Main St. Intersection improvements with signals Tier 2 $250,000312 Buchanan Ave. at Loto Rd Intersection improvements with signals Tier 2 $300,000313 Alta Vista Rd. at Shasta Ave. Intersection improvements with signals Tier 2 $350,000314 From Idlewood Rd. to future Arrowhead Trail Connect streets Tier 2 $300,000315 Bigham Brown Rd. at Alta Vista Rd. Realign intersection and other intersection improvements Tier 2 $200,000316 Brownsboro Rd. to northern city limits Widen to add bike lanes and sidwalks (urban upgrade) Tier 2 $750,000317 Robert Trent Jones Way at Alta Vista Rd. Intersection improvement - add signals Tier 2 $250,000318 N. Shasta Ave. to Teakwood Ave. Add bridge connecting Teakwood Ave. and Shasta Ave. Tier 2 $2,800,000319 Royal Ave. to S. Shasta Connection Construct bridge from Royal Ave. to Shasta Ave. between Main & Nita Tier 2 $2,500,000 $11,772,000 $0
Jacksonville400 Pair-a-Dice Ranch Rd., OR 238 to Westmont Dr. Install walkways short $15,000 $15,000 $393,000
No projects identified in medium range medium $0 $783,000No projects identified in the long range long $0 $2,952,000
401 Pair-a-Dice Ranch Rd., OR 238 to city limits Construct five lane truck route connection (city share w/ in UGB) Tier 2 $6,000,000 $6,000,000 $0Medford
500 West Medford Alleys Pave and improve (CMAQ) short $639,000501 Oak St., McAndrews Rd. to Taft St. Pave and improve (CMAQ) short $452,000502 Various locations in city Construct sidewalks, storm drains, curbs short $1,250,000503 Garfield St., Peach St. to King St. Widen to add continuous turn lane with bike lanes and sidewalks short $1,600,000504 Jackson St., Berkeley Way to Valley View Dr. Re-align and widen to add center turn lane, bike lanes and sidewalks short $2,750,000505 Peach St., Stewart Ave. to Garfield Ave. Widen to two lanes with bike lanes and sidewalks short $1,700,000506 S. Holly St., Garfield Ave. to Holmes Way Construct new three lane street with bike lanes and sidewalks short $3,700,000507 Columbus Ave., McAndrews Rd. to Sage Rd. Extend Columbus to Sage, with center turn lane, bike lanes, sidewalks short $3,000,000508 Crater Lake Ave. and McAndrews Rd. Minor instersection reconfiguration to add turning lane(s) short $1,600,000509 Siskiyou Blvd. at Highland Dr. Intersection reconfiguration - roundabout short $800,000510 Table Rock Rd. and Merriman Rd. Signalize w/ intersection improvements or roundabout short $1,600,000511 Jackson St. at Sunrise Ave. Install new traffic signal short $225,000512 4th St. and Oakdale Rd. Install new traffic signal short $225,000513 Springbrook Rd. at Spring St. Install new traffic signal short $225,000514 Barnett Rd. at Golf View Dr. Install new traffic signal short $225,000515 Biddle Rd., Midway St. to Morrow St. Restripe for bike lanes short $10,000516 Hillcrest Rd., at Pierce St. Install new traffic signal short $225,000517 Delta Waters Rd., Provincial St. to Foothill Rd. Widen to add continuous turn lane with bike lanes and sidewalks short $1,000,000518 Hillcrest Rd., N. Phoenix Rd. to Highcrest Rd. Add sidewalks short $150,000519 Siskiyou, Jackson, Highland, Juanipero and Murphy Remove on-street parking and add bicycle lanes short $41,000520 10th St., Dakota St. and 4th St. Remove on-street parking and add bicycle lanes short $41,000521 Royal, Morrow, Cedar Links and Springbrook Remove on-street parking and add bicycle lanes short $32,000522 Jefferson School Area (Holmes Ave., Kenyon St.) Install sidewalks short $75,000523 Lone Pine School Area (Spring St.) Install sidewalks short $150,000524 Washington School area (Withington St., Plum to Hamilton) Install sidewalks short $35,000525 Washington School area (Newtown St., Dakota to Stewart) Install sidewalks short $30,000
Short Range (2005-2009) - Medium Range (2010-2015) - Long Range (2016-2030) Page 3 of 8
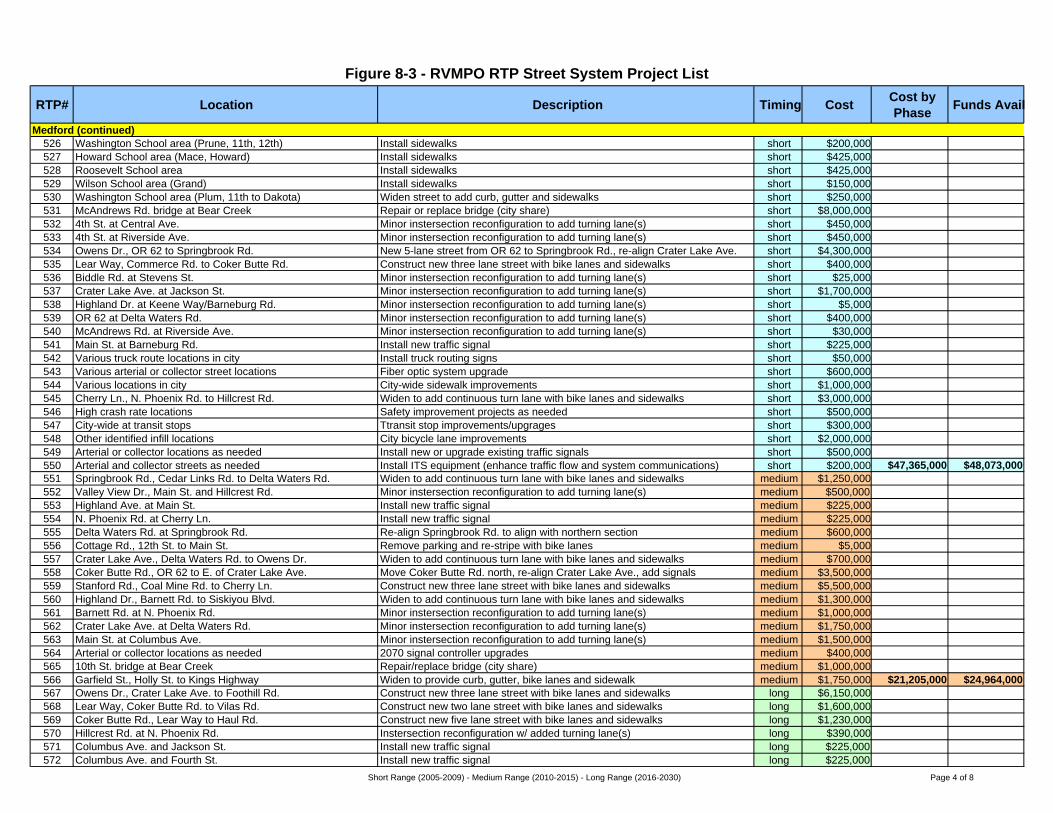
Figure 8-3 - RVMPO RTP Street System Project List
RTP# Location Description Timing CostCost by Phase
Funds Avail
Medford (continued)526 Washington School area (Prune, 11th, 12th) Install sidewalks short $200,000527 Howard School area (Mace, Howard) Install sidewalks short $425,000528 Roosevelt School area Install sidewalks short $425,000529 Wilson School area (Grand) Install sidewalks short $150,000530 Washington School area (Plum, 11th to Dakota) Widen street to add curb, gutter and sidewalks short $250,000531 McAndrews Rd. bridge at Bear Creek Repair or replace bridge (city share) short $8,000,000532 4th St. at Central Ave. Minor instersection reconfiguration to add turning lane(s) short $450,000533 4th St. at Riverside Ave. Minor instersection reconfiguration to add turning lane(s) short $450,000534 Owens Dr., OR 62 to Springbrook Rd. New 5-lane street from OR 62 to Springbrook Rd., re-align Crater Lake Ave. short $4,300,000535 Lear Way, Commerce Rd. to Coker Butte Rd. Construct new three lane street with bike lanes and sidewalks short $400,000536 Biddle Rd. at Stevens St. Minor instersection reconfiguration to add turning lane(s) short $25,000537 Crater Lake Ave. at Jackson St. Minor instersection reconfiguration to add turning lane(s) short $1,700,000538 Highland Dr. at Keene Way/Barneburg Rd. Minor instersection reconfiguration to add turning lane(s) short $5,000539 OR 62 at Delta Waters Rd. Minor instersection reconfiguration to add turning lane(s) short $400,000540 McAndrews Rd. at Riverside Ave. Minor instersection reconfiguration to add turning lane(s) short $30,000541 Main St. at Barneburg Rd. Install new traffic signal short $225,000542 Various truck route locations in city Install truck routing signs short $50,000543 Various arterial or collector street locations Fiber optic system upgrade short $600,000544 Various locations in city City-wide sidewalk improvements short $1,000,000545 Cherry Ln., N. Phoenix Rd. to Hillcrest Rd. Widen to add continuous turn lane with bike lanes and sidewalks short $3,000,000546 High crash rate locations Safety improvement projects as needed short $500,000547 City-wide at transit stops Ttransit stop improvements/upgrages short $300,000548 Other identified infill locations City bicycle lane improvements short $2,000,000549 Arterial or collector locations as needed Install new or upgrade existing traffic signals short $500,000550 Arterial and collector streets as needed Install ITS equipment (enhance traffic flow and system communications) short $200,000 $47,365,000 $48,073,000551 Springbrook Rd., Cedar Links Rd. to Delta Waters Rd. Widen to add continuous turn lane with bike lanes and sidewalks medium $1,250,000552 Valley View Dr., Main St. and Hillcrest Rd. Minor instersection reconfiguration to add turning lane(s) medium $500,000553 Highland Ave. at Main St. Install new traffic signal medium $225,000554 N. Phoenix Rd. at Cherry Ln. Install new traffic signal medium $225,000555 Delta Waters Rd. at Springbrook Rd. Re-align Springbrook Rd. to align with northern section medium $600,000556 Cottage Rd., 12th St. to Main St. Remove parking and re-stripe with bike lanes medium $5,000557 Crater Lake Ave., Delta Waters Rd. to Owens Dr. Widen to add continuous turn lane with bike lanes and sidewalks medium $700,000558 Coker Butte Rd., OR 62 to E. of Crater Lake Ave. Move Coker Butte Rd. north, re-align Crater Lake Ave., add signals medium $3,500,000559 Stanford Rd., Coal Mine Rd. to Cherry Ln. Construct new three lane street with bike lanes and sidewalks medium $5,500,000560 Highland Dr., Barnett Rd. to Siskiyou Blvd. Widen to add continuous turn lane with bike lanes and sidewalks medium $1,300,000561 Barnett Rd. at N. Phoenix Rd. Minor instersection reconfiguration to add turning lane(s) medium $1,000,000562 Crater Lake Ave. at Delta Waters Rd. Minor instersection reconfiguration to add turning lane(s) medium $1,750,000563 Main St. at Columbus Ave. Minor instersection reconfiguration to add turning lane(s) medium $1,500,000564 Arterial or collector locations as needed 2070 signal controller upgrades medium $400,000565 10th St. bridge at Bear Creek Repair/replace bridge (city share) medium $1,000,000566 Garfield St., Holly St. to Kings Highway Widen to provide curb, gutter, bike lanes and sidewalk medium $1,750,000 $21,205,000 $24,964,000567 Owens Dr., Crater Lake Ave. to Foothill Rd. Construct new three lane street with bike lanes and sidewalks long $6,150,000568 Lear Way, Coker Butte Rd. to Vilas Rd. Construct new two lane street with bike lanes and sidewalks long $1,600,000569 Coker Butte Rd., Lear Way to Haul Rd. Construct new five lane street with bike lanes and sidewalks long $1,230,000570 Hillcrest Rd. at N. Phoenix Rd. Instersection reconfiguration w/ added turning lane(s) long $390,000571 Columbus Ave. and Jackson St. Install new traffic signal long $225,000572 Columbus Ave. and Fourth St. Install new traffic signal long $225,000
Short Range (2005-2009) - Medium Range (2010-2015) - Long Range (2016-2030) Page 4 of 8

Figure 8-3 - RVMPO RTP Street System Project List
RTP# Location Description Timing CostCost by Phase
Funds Avail
Medford (continued)573 Springbrook Rd. and Cedar Links Rd. Install new traffic signal long $225,000574 10th St. and Columbus Ave. Install new traffic signal long $225,000575 Barnett Rd. at Black Oak Dr. Instersection reconfiguration w/ added turning lane(s) long $540,000576 McAndrews Rd. at Royal Ave. Instersection reconfiguration w/ added turning lane(s) long $420,000577 Black Oak Dr., Hillcrest Rd. to Acorn Dr. Widen to add sidewalks long $325,000 $11,555,000 $11,560,000578 6th St. and Central Ave. Signal upgrade Tier 2 $130,000579 10th St. at Central Ave. Instersection reconfiguration w/ added turning lane(s) Tier 2 $50,000580 McAndrews Rd. at Biddle Rd. Minor instersection reconfiguration to add turning lane(s) Tier 2 $1,800,000581 McAndrews Rd. at Springbrook Rd. Minor instersection reconfiguration to add turning lane(s) Tier 2 $390,000582 Manzanita St. to Spring St. connection, crossing with I-5 Construct new grade-separated crossing Tier 2 $15,000,000583 Lone Pine Rd., Foothill Rd. to Cherry Ln. Construct new three lane street with bike lanes and sidewalks Tier 2 $8,200,000584 Tamarack Rd., Mc Andrews Rd. to Lone Pine Rd. extension Construct new two lane street with bike lanes and sidewalks Tier 2 $5,850,000585 Bellinger-Cunningham, Hull Rd. to Orchard Home Rd. Construct new three lane street with bike lanes and sidewalks Tier 2 $3,280,000586 Springbrook Rd., Blackthorn Way to Coker Butte Rd. Construct new three lane street with bike lanes and sidewalks Tier 2 $2,870,000587 Ross Ln., Jacksonville Highway to McAndrews Rd. Widen to five lanes with bike lanes and sidewalks Tier 2 $2,560,000588 Manzanita St., extension from Riverside Rd. to Spring St. Construct new five lane street with bike lanes and sidewalks Tier 2 $2,500,000589 Diamond St., Orchard Home Dr. to Peach St. Construct new two lane street with bike lanes and sidewalks Tier 2 $2,340,000590 McAndrews Rd., Ross Ln. to Jackson St. Widen to five lanes with bike lanes and sidewalks Tier 2 $1,600,000591 Cherry Ln., Hillcrest St. to Lone Pine Rd. Construct new two lane street with bike lanes and sidewalks Tier 2 $1,560,000592 Cunningham Rd., Orchard Home Dr. to Columbus Ave. Widen to five lanes with bike lanes and sidewalks Tier 2 $1,280,000593 Hillcrest Rd., Foothill Rd. to N. Phoenix Rd. Re-align and widen to add center turn lane, bike lanes and sidewalks Tier 2 $1,280,000594 Stewart Ave., Lozier Ln. to Dixie St. Widen to five lanes with bike lanes and sidewalks Tier 2 $960,000595 Highland Dr., Siskiyou Blvd. to Keene Way Widen to three lanes with curb, gutter, bike lanes and sidewalks Tier 2 $720,000596 South Stage Rd., OR 99 to east of I-5 Construct three lane street and overpass (city share w/ in UGB) Tier 2 $15,000,000 $67,370,000 $0
Phoenix600 4th St., OR 99 (SB) to OR 99 (NB) Widen to provide bike lanes short $253,000601 4th St., Rose St. to Colver Rd. Widen to provide bike lanes and sidewalks short $289,000602 1st St., Rose St. to OR 99 (SB) Widen to provide bike lanes and sidewalks short $250,000603 Rose St., First St. to Fifth St. Widen to provide bike lanes short $250,000604 Oak St., Rose St. to OR 99 (NB) Bike lane striping short $25,000605 Bolz Rd., OR 99 to Fern Valley Rd. Widen to provide bike lanes and sidewalks short $350,000606 Oak St., Rose St. to OR 99 (NB) Add sidewalks short $150,000 $1,567,000 $1,755,000607 Cheryl Ln., Rose St. to OR 99 Widen to provide bike lanes and sidewalks medium $250,000608 Rose St., Fifth St. to OR 99 Bike lane striping medium $25,000609 Rose St., First St. to Elm St. Bike lane striping medium $25,000610 Rose St., southern terminus to Cheryl Ln. Sidewalks both sides medium $250,000611 Colver Rd., First St. to southern UGB limits Widen to provide bike lanes and sidewalks medium $450,000612 Bolz Rd., Rose St. to OR 99 Widen to provide bike lanes and sidewalks medium $200,000613 Camp Baker Rd., Hilsinger Rd. to Colver Rd. Sidewalks both sides medium $90,000 $1,290,000 $1,292,000614 3rd St., existing terminus to OR 99 (NB) Construct new street with bike lanes and sidewalks long $500,000615 Parking St., OR 99 (NB) to Third St. Construct new street with bike lanes and sidewalks long $1,500,000616 Colver Rd., Houston Rd. to First St. Widen to provide bike lanes and sidewalks long $450,000617 OR 99, Bolz Rd. to North "Y" Sidewalks both sides long $300,000618 OR 99, North "Y" to North UGB Bike lane striping long $25,000619 OR 99, Fern Valley Rd. to Bolz Rd. Sidewalks east side long $250,000620 OR 99, South "Y" to S. Phx UGB Widen to provide bike lanes long $500,000621 Main St. (OR 99 SB), South "Y" to North "Y" Bike lane striping long $25,000
Short Range (2005-2009) - Medium Range (2010-2015) - Long Range (2016-2030) Page 5 of 8

Figure 8-3 - RVMPO RTP Street System Project List
RTP# Location Description Timing CostCost by Phase
Funds Avail
Phoenix (continued)622 Bear Creek Dr., N. "Y" to S. "Y" Sidewalks both sides long $300,000623 OR 99, Rose St. to Cheryl Ln. Sidewalks both sides long $300,000624 Bear Creek across from First St. Bicycle / pedestrian bridge long $500,000 $4,650,000 $4,675,000625 Oak St., OR 99 to Fern Valley Rd. Extention of Oak St., including I-5 overcrossing Tier 2 $20,000,000 $20,000,000 $0
Talent700 Bear Creek Greenway at W. Valley View Rd. Construct new 10-foot wide multi-modal path short $425,000701 W. Valley View Rd., OR 99 to Talent Ave. Urban upgrade w/ bike lanes and sidewalks short $200,000702 Wagner St., R/R tracks to Main St. Urban upgrade w/ bike lanes and sidewalks short $255,000703 Wagner St., Talent Ave. to R/R tracks Urban upgrade w/ bike lanes and sidewalks short $50,000704 4th St., West St. to cul-de-sac Overlay short $25,000705 3rd St., West St. to cul-de-sac Overlay short $25,000706 West St., N. 2nd St. to W. Main St. Partial street reconstruction short $50,000707 Rapp Rd., OR 99 to Talent Ave. Rebuild and upgrade to urban major collector standard short $400,000708 Rapp Rd., Talent Ave. to R/R X-ing Rebuild and upgrade to urban major collector standard short $400,000709 Talent Ave., Colver Rd. to Lapree St. Rebuild and upgrade to minor arterial standard short $450,000710 Creel Rd., Talent Ave. to OR 99 Street reconstruction short $250,000 $2,530,000 $2,565,000711 Talent Ave., Rogue River Parkway to Creel Rd. Rebuild and upgrade to urban major collector standard medium $640,000712 OR 99 to Bear Creek Greenway (at Creel Rd.) Construct new 10-foot wide multi-modal path medium $250,000713 Talent Ave. to Bear Creek Greenway (at Suncrest Rd.) Construct new 10-foot wide multi-modal path medium $250,000714 Talent Ave. to Bear Creek Greenway (at Wagner Creek) Construct new 10-foot wide multi-modal path medium $250,000715 Wagner St. R/R X-ing Upgrade crossing and warning devices medium $450,000 $1,840,000 $1,842,000716 Alongside R/R tracks, northern to southern UGB Construct new 10-foot wide multi-modal path long $750,000717 Rapp Rd., R/R X-ing to Wagner Creek Rd. Rebuild and upgrade to urban major collector standard long $1,500,000718 Rapp Rd. R/R X-ing Upgrade crossing and provide for pedestrians and bicyclists long $750,000719 Wagner Creek Rd., Christian St. to Rapp Rd. Rebuild and upgrade to urban major collector standard long $500,000 $3,950,000 $4,033,000720 Helms/Hilltop, Rapp Rd. to Belmont St. Construct new major collector street Tier 2 $2,000,000721 Rogue River Parkway at Talent Ave. Realign and rebuild intersection Tier 2 $500,000722 Rogue River Parkway, OR 99 to Talent Ave. Construct new street or upgrade existing street to major collector Tier 2 $1,500,000723 Belmont R/R X-ing Construct new R/R X-ing w/ gates, new collector street Tier 2 $750,000724 Belmont Rd., Talent Ave. to R/R X-ing Rebuild and upgrade to urban major collector Tier 2 $450,000 $5,200,000 $0
Jackson County800 Ave. A, Atlantic Ave. to Kershaw Rd. Pave and improve (CMAQ) short $800,000801 Agate Rd., OR 62 to Ave. G New three lane industrial collector short $1,500,000802 Agate Rd. and Antelope Rd. Install new traffic signal short $380,000803 Antelope Rd., Table Rock Rd. to 7th St. Widen to five lanes with bike lanes and sidewalks short $3,750,000804 Atlantic Ave., Ave. A to Ave. G New three lane urban major collector short $3,000,000805 Ave. G/Kirtland Rd., Pacific Ave. to Table Rock Rd. New two lane urban industrial collector short $1,500,000806 Ave. G, OR 62 to Atlantic New three lane urban major collector short $2,600,000807 Ave. H, Wilson Way to WCUCB New two lane urban minor collector short $400,000808 Beall Lane, OR 99 to Merriman Rd. Widen to add continuous turn lane with bike lanes and sidewalks short $1,120,000809 Foothill Rd., Corey Rd. to Atlantic St. New two lane rural major collector short $1,500,000810 Jacksonville Hwy, Oak Grove Rd. to Elm St. Widen to add continuous turn lane with bike lanes and sidewalks short $1,600,000811 Table Rock Rd., Biddle Rd. to Wilson St. Widen to five lanes with bike lanes, sidewalks short $3,900,000812 Table Rock Rd., Wilson St. to Antelope Rd. Widen to five lanes with bike lanes, sidewalks short $2,940,000813 West Valley View Rd. at Bear Creek Replace bridge, adding bike lanes and sidewalks short $4,000,000814 Wilson Way, Ave. H to Dutton Rd. Urban upgrade in WCUUCB / rural outside WCUUCB short $300,000815 Bear Creek Greenway, Talent to Medford Complete County portions of the Bear Creek Greenway short $2,000,000
Short Range (2005-2009) - Medium Range (2010-2015) - Long Range (2016-2030) Page 6 of 8

Figure 8-3 - RVMPO RTP Street System Project List
RTP# Location Description Timing CostCost by Phase
Funds Avail
Jackson County (continued)816 Ross Lane North, McAndrews Rd. to Rossanley Rd. Widen to add continuous turn lane with bike lanes and sidewalks short $1,750,000817 East West Pathway, Division Rd. to north of 29th Ave. New multi-use pathway short $580,000 $33,620,000 $33,714,000818 Leigh Way, Agate Rd. to Antelope Rd. New three lane street w/shoulder bikeway medium $2,200,000819 Lozier Ln, Stewart Ave. to Jacksonville Highway Widen to add continuous turn lane with bike lanes and sidewalks medium $1,500,000820 Stewart Ave., Hull Rd. to Thomas St. Widen to add continuous turn lane with bike lanes and sidewalks medium $800,000821 Table Rock Rd., Bear Creek to Biddle Rd. Widen to add continuous turn lane with bike lanes and sidewalks medium $1,750,000822 Table Rock Rd. at Wilson Rd. New traffic signal medium $230,000823 Pine St., Haskell St. to Hanley St. Widen to add continuous turn lane with bike lanes and sidewalks medium $1,250,000824 Carpenter Hill Rd., Voorhies Rd. to Coleman Creek Rd. Widen to rural two lane with shoulder bikeways medium $300,000825 East Pine St., Table Rock Rd. to Hamrick Rd. Add bike lanes and sidewalks medium $75,000826 Foothill Rd., Delta Waters Rd. to Coker Butte Rd. Widen to rural two lane with shoulder bikeways medium $800,000827 Foothill Rd., Coker Butte Rd. to Corey Rd. Widen to rural two lane with shoulder bikeways medium $1,500,000828 Old Stage Rd., Winterbrook Rd. to MPO Limits Widen to rural two lane with shoulder bikeways medium $2,750,000 $13,155,000 $13,200,000829 Bursell Rd. at Beall Ln. New traffic signal long $230,000830 Fern Valley Rd. at North Phoenix Rd. New traffic signal long $380,000831 Foothill Rd., McAndrews Rd. to Delta Waters Rd. Widen to add continuous turn lane with bike lanes and sidewalks long $2,240,000832 Foothill Rd., Hillcrest Rd. to McAndrews Rd. Widen to add continuous turn lane with bike lanes and sidewalks long $3,020,000833 Hanley Rd., Beall Ln. to Pine St. Widen to add continuous turn lane with bike lanes and sidewalks long $750,000834 Kings Highway, South Stage Rd. to UGB limits Widen to add continuous turn lane with bike lanes and sidewalks long $250,000835 Lakeview Dr., re-aligned Lakeview Dr. to McLoughlin Dr. New two lane rural minor collector long $1,800,000836 South Valley View Rd., I-5 to OR 99 Widen to five lanes with bike lanes, sidewalks long $14,000,000837 Vilas Rd., Haul Rd. to Crater Lake Ave. Widen to five lanes with bike lanes, sidewalks long $2,500,000838 Griffin Creek Rd., Pioneer Rd. to South Stage Rd. Widen to two lane with bike lanes and sidewalks long $1,170,000839 Hillcrest Rd., Cherry Ln. to Gardener St. Widen to rural two lane with shoulder bikeways long $250,000840 Hull Rd., South Stage Rd. to Stewart St. Widen to rural two lane with shoulder bikeways long $400,000841 Pioneer Rd. (Phase1), Colver Rd. to Coleman Rd. Widen to rural two lane with shoulder bikeways long $1,500,000842 Pioneer Rd. (Phase2), Griffin Creek Rd. to Carpenter Hill Rd. Widen to rural two lane with shoulder bikeways long $1,500,000843 Taylor Rd., Old Stage Rd. to Grant Rd. Widen to rural two lane with shoulder bikeways long $1,000,000844 Upton Rd., Raymond St. to Gibbon Rd. Widen to rural two lane with shoulder bikeways long $700,000845 VA Domicillary to Antelope Rd. Upgrade pathway to ODOT's standards long $650,000846 Voorhies Rd., Carpenter Rd. to S. Stage Rd. Widen to rural two lane with shoulder bikeways long $450,000847 Bigham Brown Rd., Antelope Rd. to City of Eagle Point Widen to rural two lane with shoulder bikeways long $950,000848 Wilson Way, Ave. G to Ave. F New two lane urban minor collector long $1,500,000849 Fern Valley Rd., N. Phoenix Rd. to eastern Phoenix UGB Widen to five lanes with bike lanes and sidewalks long $2,500,000850 Coleman Creek Rd., Carpenter Hill Rd. to Pioneer Rd. Widen to rural two lane with shoulder bikeways long $1,250,000 $38,990,000 $39,000,000
Oregon Department of Transportation (ODOT)900 OR 99: Colver Rd. to Rapp Rd. (Talent) Widen to add continuous left turn lane and sidewalks short $5,770,000901 I-5: South Medford Interchange Relocate and construct new interchange short $52,450,000902 I-5: Fern Valley Interchange, Unit 2 Widen I-5 bridge and Fern Valley Rd. to five lanes; replace Bear Creek bridge short $32,160,000903 OR 62: Corridor Solutions Unit 2 Construct limited access expressway from Poplar/Hilton to Delta Waters short $38,000,000904 OR 140 Freight Extension Lane and shoulder widening for freight movements short $6,600,000905 OR 140 at Kershaw (White City) Install advance hazard I.D. beacon short $570,000906 OR 99: Jurisdictional Transfer (Central Point) Transfer jurisdiction over portion of OR 99 in Central Point short $1,032,000907 OR 99: Walker Ave. to I-5 (Ashland) Grind and inlay/overlay, add sidewalks short $1,749,000908 I-5: Bear Creek Bridges NB and SB Replace both structures short $7,599,000909 I-5/OR 66: Bridge Bundle 301 Replace bridges @ Neil Ck, OR 66, Bear Ck (2), and Eagle Mill short $17,187,000910 I-5: Bridge Bundle 302 Replace bridges at Central Pt. Connector and Upton Rd. short $13,768,000
Short Range (2005-2009) - Medium Range (2010-2015) - Long Range (2016-2030) Page 7 of 8

83
The proposed phasing is not an implementation schedule since no priorities have been set within each phase. The actual timing for project implementation will be determined later via semi-annual updates of the four-year Transportation Improvement Program (TIP). The construction of any project is contingent upon the availability of revenues. Thus, inclusion of a project in a particular phase does not represent a commitment to complete the project during that phase. It is expected that some projects may be accelerated and others delayed.
The project phasing is based on a year 2005 estimate of project need and justification, funding availability, and rate of land development. Should any of the factors that influence phasing prove different than expected, changes in phasing may be required.
PPrroojjeecctt CCoosstt
The costs shown in the project list are preliminary planning estimates calculated in 2005 dollars. The estimates include the cost of construction, engineering, and right-of-way acquisition, where applicable. Cost estimates are often based upon costs of similar street and highway projects constructed in recent years.
Cost estimates are typically refined as the construction date approaches. Precise cost estimates are prepared when projects are proposed for inclusion in local agencies capital improvement programs. Estimates that are even more detailed are made during preparation of design engineering and construction specifications.

84
99.. PPAARRKKIINNGG EELLEEMMEENNTT
IInnttrroodduuccttiioonn
Oregon s Transportation Planning Rule (TPR) requires that metropolitan area jurisdictions reduce their overall parking capacity over the next 30 years. A reduction in parking is part of an overall strategy to reduce reliance on automobiles as the principal mode of travel and to help achieve a reduction in per capita vehicle travel. The challenge of this goal is to reduce the amount of parking in ways that help achieve the travel-reduction goal and are equitable for all parties involved.
Parking reduction strategies are proposed to help the metropolitan area meet the TPR requirements. Strategies include changes to parking codes and policies, redesignation of existing parking, and management of roadway space. Next, the potential impacts of strategies are calculated, given the limited availability of data. Finally, some parking optimization techniques are presented, which may make it easier for residents, employers, and employees to make use of available parking.
PPaarrkkiinngg SSttaannddaarrddss
The state Transportation Planning Rule requires implementation of a parking plan that achieves a 10 percent reduction in the number of parking spaces per capita in the MPO area over the planning period. This may be accomplished through a combination of restrictions on development of new parking spaces and requirements that existing parking spaces be redeveloped to other uses.
Ultimately, the parking plan must aid in achieving the overall requirement to reduce vehicle miles traveled per capita (VMT) in the MPO area. In MPO areas of less than 1 million population, including the RVMPO, a 5 percent VMT reduction is required.
It is anticipated that metropolitan areas will accomplish reduced reliance by changing land use patterns and transportation systems so that walking, cycling, and use of transit are highly convenient and so that, on balance, people need to and are likely to drive less than they do today.
The requirement to reduce VMT as it relates to parking offers some options. Local jurisdictions may set minimum and maximum parking standards in appropriate locations, such as downtowns, designated regional or community centers and transit centers.
As an alternative, jurisdictions may instead revise ordinance requirements for parking as follows:
85
Reduce minimum off-street parking requirements for all non-residential uses from 1990 levels;
Allow provision of on-street parking, long-term lease parking, and shared parking to meet minimum off-street parking requirements;
Establish off-street parking maximums in appropriate locations, such as downtowns, designated regional or community centers, and transit-oriented developments;
Exempt structured parking and on-street parking from parking maximums;
Require that parking lots over 3 acres in size provide street-like features along major driveways (including curbs, sidewalks, and street trees or planting strips); and
Provide for designation of residential parking districts.
The following sections discuss some parking strategies in detail.
PPaarrkkiinngg CCooddee aanndd PPoolliiccyy CChhaannggeess
Current parking regulations specify only minimum standards, thereby implicitly encouraging some developments, such as retail stores, to provide an excess of parking supply. Furthermore, codes sometimes leave little flexibility to allow parking reduction strategies such as shared parking or on-street parking. Establishing maximums or caps on parking and lowering minimum parking requirements would have a direct, quantifiable impact on parking supply. Some other suggested parking code and policy changes include parking fees and decreased building setbacks.
Maximum Parking Requirements
Policy 6.B-1 Local governments shall consider the adoption of maximum parking requirements (or parking caps) in their zoning codes to reduce excessive off-street parking supply.
As indicated above, current parking regulations specify minimum numbers of spaces for a development, but not the maximum. Existing codes can be amended to specify a maximum parking requirement (or a parking cap). This could apply to all developments or only to new developments that are constructed following adoption of the implementing ordinances.
The main benefit with applying parking caps to only new development is that existing developments and jurisdictions are spared the expense of time and labor involved in tabulating each developments
parking lot capacity and policing the sites. However, the policy may place new developments at a competitive disadvantage in relation to existing businesses.
Some types of development appear to build at least twice as much parking as the minimum required by the code. Depending upon how the code was structured, the amount of parking built in connection with new development could be reduced by as much as 30 percent. The exact levels of parking permitted for new development would be figured on the rate of expected construction by land use type.
86
Lower Minimum Parking Requirements
Policy 6.B-2 Local governments should establish low minimum parking requirements in their zoning codes to encourage in-fill development.
Lower parking minimums could have an impact on the total parking inventory, but there is no guarantee that developments would choose fewer parking spaces for their developments. Lower minimum parking requirements, however, might encourage some in-fill development. In-fill development can be encouraged to increase densities and remove land from its temporary status as parking lots. Both the reduction of existing parking and increasing building densities will help lead to a more pedestrian friendly environment and encourage transit ridership a primary goal of the TPR.
Parking Fees
Establishment of parking fees is not a policy of the RVMPO, but fees can be useful in some jurisdictions. Fees imposed on developers for each parking space are an indirect way of reducing the amount of parking provided by new developments. Fees can be levied on the developer, the tenant, or the end-user. These are fees for either the use or provision of each parking space. Fees levied on the developer may lead to smaller parking lots due to monetary considerations when building the project. Fees on the tenant may encourage them to seek out retail or office space in areas with smaller lots, thus putting market pressure on developers to build with less parking. Fees on end-users may result in different modal choices, bringing down parking demand and leaving land open for in-fill development or smaller parking facilities. Fees are an indirect strategy and may be difficult or impossible to implement as a stand-alone TPR-compliance parking reduction measure.
RReeddeessiiggnnaattiioonn ooff EExxiissttiinngg PPaarrkkiinngg
Policy 6.B-3 Local governments should redesignate existing, general-use parking spaces to a different, special use so as to encourage the use of alternative transportation modes.
Changing existing, general-use parking spaces, to special-use parking can be used to promote the use of alternative modes and meet the requirements of the TPR. General parking provided on-street or in lots could be reclassified as preferential parking for carpools, or the handicapped. Preferential parking, especially close to building entrances, for carpooling or vanpooling is a common way of helping to promote these as alternatives to driving alone. Carpool parking need not be limited to parking lots. On-street parking spaces, including metered spaces, may be restricted to carpools. Typically, monthly permits are obtained and displayed when parked in a reserved carpool space in a lot or on the street.
As a side benefit, reclassification from general parking to carpool parking may help meet TPR requirements. Under TPR definition 660-12-005 (13) 10, park and ride lots, handicapped parking and parking spaces for carpools and vanpools are not considered parking spaces for purposes of the
10 May 1, 1995 Draft as quoted in the Transportation Planning Rule Bulletin.
87
TPR. The reclassification of a portion of the parking supply as permanent high occupancy vehicle (HOV) space may satisfy the TPR s parking reduction requirement.
In areas where easy access to free or low-cost parking has always been readily available, restrictions on parking may be poorly received by the public. Widespread conversion of general-use parking spaces to reserved parking for carpools or other restricted uses may lead to a high level of parking violations. This may place an undue burden on agencies for the enforcement of parking regulations at the expense of other activities.
MMaannaaggeemmeenntt ooff RRooaaddwwaayy SSppaaccee
Policy 6.B-4 Local governments, and ODOT where appropriate, shall manage the roadway space so as to eliminate excess on-street parking in the region in favor of such projects as bike lanes, bus stops, and narrower street widths that promote use of alternative modes.
There is considerable competition for use of the paved roadway space: through lanes and turn lanes for motor vehicles, bicycle lanes, on-street parking spaces, loading zones, and bus stops. Management of the roadway space and the allocation for these uses can have a measurable impact on the amount of parking in the region. Changing parking spaces to travel lanes can help improve traffic flow, promote use of alternative modes, and meet the TPR requirements.
Bike Lanes
Bike lanes on arterial and major collector streets are required under the provisions of the TPR. In many locations throughout the Rogue Valley region, this will be accomplished by parking removal and re-striping of the street, rather than by widening the roadway.
Turn Lanes
Re-striping for turn lanes is a transportation system management strategy that can be used to increase the capacity of intersections. In many cases, queuing distances at stop signs or traffic signals will require that no-parking zones be extended for more than 100 feet from the intersection. This could require removal of parking, which is sometimes permitted as close as 20 feet from a crosswalk at an intersection.
No-Parking Zones
Designating larger no-parking zones to increase sight distances at intersections is already implied in the vehicle code. Parking is not permitted within 50 feet of a stop sign, yield sign, or other traffic control device where such parking hides it from view. A blanket prohibition on parking within 50 feet of a corner would have a measurable impact on the number of parking spaces and would have other benefits related to sight distance.

88
Street Standards
Adopting new street standards for residential streets could include reducing street width to the extent that on-street parking would be permitted only on one side or eliminated.
PPaarrkkiinngg OOppttiimmiizzaattiioonn
Policy 6.B-5 Local governments shall utilize and encourage appropriate parking policies and strategies to reduce auto-dependence and discourage auto use where other alternative modes of access are possible. Where appropriate, parking needs to be oriented to the back or side with entrances to the front for pedestrian access.
There are techniques that can be used to make better use of parking, which may make it easier for residents, businesses, and employees to live with the parking reduction requirements of the TPR. However, optimizing the use of parking may defeat the other goal of the TPR, namely the reduction in per capita vehicle miles of travel. This is because the easy availability of free or low cost parking remains a significant factor in the individual s choice of mode for trips to work, shopping, etc.
Shared Parking
Shared parking is the use of one or more parking facilities between developments with similar or different land uses. Each land use experiences varying parking demand depending on the time of day and the month of the year. It is possible for different land uses to pool their parking resources to take advantage of different peak use times.
Traditionally, parking lots have been sized to accommodate at least 90 percent of peak hour and peak month usage and serve a single development. For the most part, these lots are operating at a level considerably less than this amount. Shared parking schemes allow these uses to share parking facilities by taking advantage of different business peak parking times.
For example, a series of buildings may include such land uses as restaurants, theaters, offices, and retail all of which have varying peak use times. A restaurant generally experiences parking peaks from 6 to 8 p.m., while offices typically peak around 10 a.m. and again around 2 p.m. on weekdays. Some retail establishments have their peak usage on weekends. Theaters often peak from 8 to 10 p.m. Without a shared parking plan, these uses would develop parking to serve each of their individual peaks. This generally results in each lot being heavily used while the other lots operate at far less than capacity. Depending upon the combination of uses, a shared parking plan may allow some developments to realize a parking reduction of 10-15 percent without a significant reduction in the availability of parking at any one time. This is possible due to the different peak periods for parking.
Some of the major obstacles to implementing shared parking schemes are the codes of local jurisdictions themselves. Quite often, parking codes are written to express parking minimums as opposed to maximums. Although Medford does allow shared parking, not all agencies do. In some cases, the implementation of shared parking strategies may require changes to the minimum parking requirements contained in the parking policies of the metropolitan area jurisdictions.

89
Other issues surrounding shared parking are liability, insurance and the need for reciprocal access agreements allowing patrons of one establishment to cross land owned by another.
Parking Management and Parking Management Associations
Parking management and parking management associations (PMAs) are mechanisms that can facilitate shared parking among non-adjacent land uses by providing off-site central parking facilities. These facilities can be large parking structures or surface lots. Parking management can employ a wide range of techniques that will result in the efficient use of existing parking facilities. These include facilities like short-term on-street parking, medium-term nearby lot parking, High Occupancy Vehicle (HOV) priority parking, and long-term parking.
PMAs are entities responsible for conducting this management and providing access to resources that will ease the burden on the parking supply. Often PMAs are non-profit groups supported by retail or business district associations. PMAs can incorporate such programs as providing bus passes or tokens in lieu of parking validation, delivery services, shuttle buses from remote lots, clear and consistent signage for parking facilities, etc.
An effective PMA benefits its members and its district by functionally increasing the parking supply for all uses and creating a parking plan that provides adequate parking for the area in a compact and coherent way. A PMA increases the efficiency of the use of land for parking, which helps reduce wasted space previously dedicated to underutilized parking. This, in turn, frees up land for further development. In the end, a successful PMA can create an area where parking is easier and more convenient, while using less land.
Development of a Regional Park and Ride System
Policy 6.B-6 Local governments and ODOT shall plan park-and-ride facilities near transit routes and major transportation connections to encourage transit and shared rides to discourage single occupancy vehicles
This important new policy was added in 2004, since the provision of parking to support ride-sharing and transit use is not just a transit agency issue, but one that all transportation agencies should address.

90
1100.. BBIICCYYCCLLEE AANNDD PPEEDDEESSTTRRIIAANN SSYYSSTTEEMM
EELLEEMMEENNTT
IInnttrroodduuccttiioonn
This Element provides an overview of bicycle and pedestrian needs, current facilities, improvement plans and issues. It connects closely to Chapter 7, Transportation Demand Management. The cycling and pedestrian systems are both integrated, that is, sharing the street system with motorized traffic, and separate, using dedicated rights-of-way. On urban streets, pedestrians and cyclists are separated, with the former being required to use sidewalks, and the latter being provided where possible with bike lanes alongside motorized traffic. The place for skateboards and other fast human-powered vehicles such as inline skates tends to be ambiguous and will need addressing more fully as these activities grow. These modes (skateboarders and in-line skates) are often allowed to be on the surface streets in restricted areas such as downtowns, although they are not considered safe with medium to high-speed traffic. Otherwise, they are allowed to use sidewalks.
The value of non-motorized alternatives is discussed, along with results to date in improving the Rogue Valley non-motorized transportation system, and future plans. Last but not least, the chapter discusses how bicycle and pedestrian needs and amenities must be linked to the fixed transit system, since cycling and walking are the primary ways that customers access the bus system. Transportation Demand Management (TDM) research has estimated that a bicycle trip is reasonable for the commuter if within 3 miles; and a pedestrian trip , if it is to be attractive , to be within a mile assuming adequate facilities are available for the entire length of the trip. Further distinctions between non-motorized modes are difficult. Census 2000 data shows journey-to-work bicycle trips at less than 1 percent in the Rogue Valley metropolitan area. A much higher level of bicycle use is anticipated in the future for both journey-to-work and non-work trips through an expansion of the
91
bicycle system, correction of some existing deficiencies, and the provision of secure locking areas protected from weather.
Walking currently accounts for about 3.5 percent of the journey-to-work trips in the metropolitan area. Upgrading pedestrian facilities is planned to help continue to raise the mode share for journey-to-work trips as well as non-work trips. The upgrading of pedestrian facilities will include the infill of missing sidewalk links, and changes in subdivision layout, providing for non-roadway pedestrian links between subdivisions and neighborhood commercial areas and schools.
IImmppoorrttaannccee ooff nnoonn--MMoottoorriizzeedd TTrraannssppoorrttaattiioonn MMooddeess
The RTP recommends development of integrated bicycle and pedestrian networks to make it more convenient for people to bike and walk. The bicycle and pedestrian system depicted here is aimed at increasing the mode share that is, the slice of the total travel pie, being handled by non-motorized modes of travel. Journey-to-work trips are particularly important because many occur during times of peak traffic during the morning and afternoons, although work trips account for only about one of five trips in the region.
Six important purposes served by users of bicycle and pedestrian facilities include:
Relieving congestion on the motorized portion of the system;
Improving air quality, since they generate zero emissions;
Improving people s health as they go about their daily business and travel by providing exercise simultaneous with travel;
Providing a transportation choice for those who may not be able to afford a car for every adult in the house;
Providing the essential link between homes and other trip origins/destinations, and the bus transit system; and
Decreasing sprawling land use.
Improvements to congestion and air quality are discussed in many other portions of the RTP. Transit access issues are discussed below.
Health through one s choice of transportation is a topic that is growing in interest and support. The picture below, Figure 10-1, subtitled Only in America says better than a thousand words how ironic it is that we are concerned with health and appearance and despite going to the gym, too lazy to really integrate healthy forms of transportation into our entire lifestyles.

92
FFiigguurree 1100--11 EEssccaallaattoorr ttoo tthhee GGyymm
Regular physical activity is good for overall health. Physical activity decreases the risk for many forms of cancer, diabetes, and high blood pressure. It also helps to control weight, contributes to healthy bones, muscles, and joints; reduces falls among the elderly; and helps to relieve the pain of arthritis. Physical activity does not have to be strenuous to be beneficial. Moderate physical activity, such as 30 minutes of brisk walking five or more times a week, also has health benefits.
Despite all the benefits of being physically active, most Americans are sedentary. Technology has created many time and labor saving products. Some examples include cars, elevators, computers, dishwashers, and televisions. Cars are used to run short distance errands instead of people walking or riding a bicycle. As a result, these recent lifestyle changes have reduced the overall amount of energy expended in our daily lives. According to the Behavioral Risk Factor Surveillance System, in 2000 more than 26 percent of adults reported no leisure time physical activity.
Obesity is of great public health concern, because it is directly related to diabetes, heart disease, cancer, stroke, hypertension, osteoarthritis, and other chronic conditions. Moreover, obesity, as well as other conditions for which it serves as a major risk factor, is highly prevalent in all groups of the population. The Center for Disease Control found that in 2000 15 percent of children aged 6-19 are overweight and predicts that these children will be economically unproductive by time they reach the age of 40 due to health problems. The obesity trends in Oregon over the past decade have climbed rapidly; the rate of obesity has nearly doubled from 1991 to 2001, as shown in Figure 10-2. The Centers for Disease Control estimated in 2000 that the cost of obesity in the US was more than $117 billion. Land use and planning that inhibit active lifestyles are not only a detriment to our health but also for the economy.
FFiigguurree 1100--22 OOrreeggoonn OObbeessiittyy TTrreennddss 1991 1995 1998 1999 2000 2001
11.2 14.7 17.8 19.6 21 20.7

93
People may make decisions based on their environment or community. Home, work, school and community can provide either barriers to or opportunities for an active lifestyle. For example, a person may choose not to walk to the store or work because of a lack of sidewalks. When new sidewalks go in that are well-connected at each end, walking goes up. Communities, homes, and workplaces each shape health decisions. With fewer options for physical activity and healthy eating, it becomes more difficult for people to make good choices. The Surgeon General s Call to Action to Prevent and Decrease Overweight and Obesity 2000 identified several action steps to prevent and decrease obesity and overweight. Promoting healthy lifestyles to prevent obesity in a community involves the creation of a healthy environment. The first step is to provide a community with safe, easy, affordable access to destinations.
BBiiccyyccllee SSyysstteemm
The region s bicycle system reflects a two-pronged approach. First are integrated bicycle systems. Second are stand-alone dedicated bike-and-pedestrian ways, most notably the Bear Creek Greenway; however, early planning is also under way for a Rogue River Greenway connecting the existing Bear Creek Greenway from near Central Point to the City of Rogue River.
To address this strategy, RVMPO has adopted the following policies:
Policy 6.C-1 Local governments shall work toward building a regional network of off-street multi-use facilities with connections to the local street network in addition to on-street bike/pedestrian accommodations. Off-street facilities should have a minimal number of at-grade roadway crossings.
Policy 6.C-2 The MPO should create a region-wide functional classification system, mirroring the roadway hierarchy, for pedestrian / bicycle routes.
Integrated Bikelanes
Communities have been actively striping bike lanes on existing streets that are wide enough to accommodate them, and inclusion of bike lanes in new and reconstructed streets is required under Oregon law as indicated in the following policy:
Policy 6.C-3 Local governments, and ODOT where appropriate, shall complete a year-round bikeway network that serves bicyclists needs, especially for travel to employment centers, commercial districts, transit centers, institutions, and recreational destinations. In all areas, paved bike lanes shall be provided on all arterial and major collector streets; all other urban streets shall be constructed such that the pavement is wide enough to allow safe travel by both motor vehicles and bicycles on the shared roadway (OAR 660-12-0045(6)).

94
Infrastructure
All streets in the metropolitan area should be designed to accommodate bicyclists safely. A bikeway network that provides a higher level of service for bicyclists should be implemented along major travel corridors to encourage bicycle use. The RTP includes projects along collector and arterial streets within the MPO boundaries. Consistent with the TPR, the RVMPO s policy is for these facilities to include bicycle lanes or, in rural areas, shoulders with a width greater than four feet. The RVMPO, as part of the Alternative Measures (See Appendix B) is tracking the progress of including these facilities on the MPO s street network. Currently, 21 percent of arterials and collectors include these facilities.
The target for 2020 is 61 percent. Projects that address improvements in the bike and pedestrian system are shown in Figures 10-3 and 10.4. Improvements include:
Rural upgrade projects for all but very low volume streets outside the Urban Growth Boundary (UGB) that consist of pavement widening to provide four-to-six-foot wide shoulders on both sides of the road. Shoulders make the roads safer for bicyclists and pedestrians as well as motorists.
Urban upgrade projects for streets within the UGB that convert two-lane rural roads to urban streets with drainage facilities, sidewalks, and in most places, bike lanes.
Bicycle improvement projects may also include roadway widening to accommodate on-street bike lanes, or some locations where parking or travel lanes are changed to bike lanes.
Bicycle parking is particularly important if bicycling is to become a viable mode of transportation and carry the expected percentage of trips specified in the plan. The city of Medford zoning code currently requires bicycle parking but this code is often not enforced and bicycle parking is not consistently installed. Other municipalities need to review their zoning codes and revise them to include requirements for bicycle parking. Bicycle parking needs include short-term parking for customers or visitors and all-day parking for employees or students. Bicycle parking requirements can be specified in the municipal code as a percentage of automobile parking. For some uses, relatively little bicycle parking needs to be provided, but it is rarely justified to have no bicycle parking at all. The code can also specify locations that make parking areas safe, convenient, and secure. For example, it is preferable for bicycle parking to be located in high-visibility areas near often-used public entrances of buildings. To address this need the RVMPO adopted the following policy:
Policy 6.C-4 Where suitable, local governments shall revise their zoning codes to require the provision of bicycle oriented design and amenities to help meet bicyclist needs. This includes the provision of bike parking at park-and-rides, transit centers, workplaces, retail and commercial developments, multi-family residential areas and neighborhood activity centers such as schools.
Trip reduction ordinances or other code provisions can be used to promote bicycle and pedestrian travel for major employers (50 or more employees). Major employers can be encouraged or required to provide amenities that would make it safe and convenient for bicyclists or pedestrians to commute

95
to work. Showers, lockers, and related facilities should be included in new construction by major employers. These facilities are popular among bicyclists and pedestrians who commute to work.

§̈¦5
§̈¦5
tu238
tu140
tu66
tu62
tu234
tu99
tu99
Medford
Ashland
Central Point
Eagle Point
Talent
Phoenix
White City
Jacksonville
815
812
545
811
520810 519
803
816
808
521515
81750
5
203
534
535
504
522
300
202
702
709
603
710
604
507
708
517
205
813
521
815
521
521
520
519
519
519
519
520
842
716
847
833
850
845
567
841
831
838
846
843
568
832
840
717
836
131
837
839
844
618
214
401
620
220
133
834
217828
827
914
826
821
711
823
819
559
818
608
557
566
820
551
611
825
713
824
118
HIGHWAY 140
MAIN
FOO
THIL
L
PACIFIC
HIG
HWAY
62
STAGE
TAB
LE R
OC
K
PINE
PHO
ENIX
CR
ATE R
LA
KE
SISKIYOU
8TH
BEALL
VILAS
BARNETT
HIGHWAY 234
ANTELOPE
STEWART
CENTRAL
RIVERSIDE
CO
LUM
BU
S
SAGE
KIN
GS
JACKSONVILLE
SHASTA
ASHLAND
BID
DLE
HIG
HW
AY 2
38
5TH
HANLEY
WILSON
ROSSANLEY
UPT
ON
HIGHWAY 99
CO
UR
T
ALTA VISTA
MCANDREWS
10TH
LITHIA
CALIFORNIA
REE
SE C
REE
K
LEA
R
4TH
COREY
LINN ROYAL
FRONT
STEVENS
HILLCREST
HIGHWAY 234
PACIFIC
PACIFIC
MAIN
CRAT
ER L
AKE
STAGE
O0 1 2 3 4
Miles
Map created on Febuary 24th, 2005
RVMPO 2005 REGIONAL TRANSPORTATION PLAN
L
E
G
E
N
D
Urban Growth Boundary
Bear Creek
Interstate
Highways
Streets
MPO Boundary
Bicycle Facilities
Short (2005-2009)
Medium (2010-2015)
Long (2016-2030)
Project Timing Bicycle Facilities
F i g ur e 1 0 - 3
Rogue River

98
Another policy that relates to urban design and infrastructure is:
Policy 3-4
Local governments shall discourage cul-de-sac or dead-end street designs whenever an interconnection alternative exists. Development of a street pattern shall be encouraged that connects new and existing neighborhoods during land divisions. Wherever possible, land divisions and any approved cul-de-sacs shall be designed to provide pedestrian and bicycle connectivity among neighborhoods.
SSeeppaarraattee FFaacciilliittiieess
Separate bicycle and pedestrian facilities have the merit of providing a quieter, cleaner, safer and more rural atmosphere for users. The creation of a potentially 30-mile greenway link between Ashland, and ultimately the City of Rogue River, with good and frequent connections to local streets, means that both short-distance and long-distance users can benefit from a true alternative to sharing the highway and street system for much of their activity.
Greenways provide natural routes for multi-use paths. Because they often follow creek drainages, the potential exists to connect paths with the greenway path system. These paths provide an alternative to bicycle and pedestrian systems associated with the street system.
Infrastructure
The Bear Creek Greenway has been a project in progress since 1973. When complete, the Greenway will provide a 19.5-mile, multi-use path from the I-5/Seven Oaks Interchange in Central Point to North Mountain Park in Ashland. It serves as an important facility for intercity travel in the I-5/OR 99 corridor. The Regional Transportation Plan includes connections to the Greenway that will improve its function as a transportation alternative.
The Greenway currently includes three primary sections: 1) Pine Street in Central Point to Barnett Road in Medford; 2) Suncrest Road in Talent to Nevada Street in Ashland; and 3) Medford Sports Park to Blue Heron Park in Phoenix. Two more sections, connecting Blue Heron Park to Suncrest Road and Barnett Road to Medford Sports Park, will be completed in 2006.
Construction of these trail segments is being funded with federal Transportation Enhancement funds, federal earmarked funds, and Congestion Mitigation and Air Quality Improvement Program (CMAQ) funds. The City of Medford is providing part of the required local funding match. The private Bear Creek Greenway Foundation helped raise match money and encouraged the legislative dialog to earmark funds.
Avid commuters have stated that they do not use some sections of the Greenway due the need to travel at slow speeds to address safety concerns while sharing the path with those traveling at lower speeds. These commuters generally travel on surface streets, particularly Hwy 99, which does not have bicycle lanes.
99
The need should be further explored for bicycle lanes along the Hwy 99 corridor, east-west greenways, and surface street routes that connect to the Bear Creek Greenway. Until these facilities exist commuting by bicycle will remain at levels that some cyclists feel are insufficient.
Operations
Provision of the basic infrastructure is a necessary, but not a sufficient condition, of enthusiastic and growing non-motorized vehicle use. Good design and provision of amenities such as restrooms are important. However, equally important is good operation of the system. In a 2004 focus group conducted by RVMPO, lack of a sense of security was the greatest deterrent to greater Greenway use. Safe operations also require that pavement be kept in good repair and free of bulging root systems (a common problem in some sections) or potholes, since slender bicycle tires are much more at risk for catching a hole or obstruction and causing a spill than are wider automotive tires encountering similar obstacles on the highway. A Management Plan for the Bear Creek Greenway is being developed by RVMPO in FY 2004-5 and will, when implemented, enable more coordinated operations to be provided. Operations are divided into facility maintenance, facility repair, and security.
Surface street operations also need to be enhanced. There are many portions of the Greenway that have a connector in place but do not have curb cuts, signage or signalized access. These are deterrents to using the facility and require minimal work as enhancements to make the connections adequate for use.
Entities Involved
The nature of the Greenway, which passes through several jurisdictions and properties, means that several entities are involved in its governance, operations and management, unlike integrated bike and pedestrian facilities, which generally come under a single local government. Figure 10-5 lists those entities for the Bear Creek Greenway. Given such a large number of involved parties, it is apparent that management of and policy development for a regional greenway is a complex undertaking.
Maintenance Issues
Maintenance is another important part of accommodating bike traffic, since bikeways with debris or broken pavement are hazards to cyclists. Minimal street improvements such as chip-sealing also cause cyclists to take another route or choose to not cycle. A desirable size for the chip-sealing material is 3/8 inch whereas currently many municipalities are using up to 1 ½ inch size material that makes for an uncomfortable ride and can ruin tires.
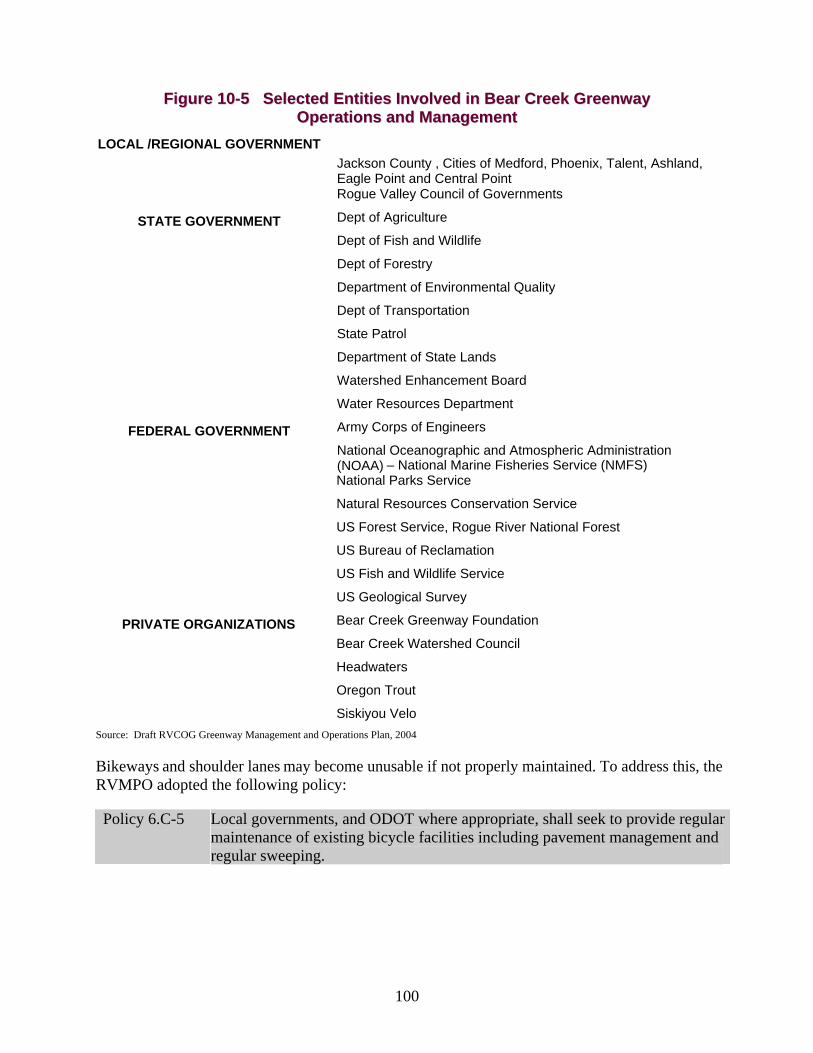
100
FFiigguurree 1100--55 SSeelleecctteedd EEnnttiittiieess IInnvvoollvveedd iinn BBeeaarr CCrreeeekk GGrreeeennwwaayy OOppeerraattiioonnss aanndd MMaannaaggeemmeenntt
LOCAL /REGIONAL GOVERNMENT Jackson County , Cities of Medford, Phoenix, Talent, Ashland, Eagle Point and Central Point Rogue Valley Council of Governments
STATE GOVERNMENT Dept of Agriculture
Dept of Fish and Wildlife
Dept of Forestry
Department of Environmental Quality
Dept of Transportation
State Patrol
Department of State Lands
Watershed Enhancement Board
Water Resources Department
FEDERAL GOVERNMENT Army Corps of Engineers
National Oceanographic and Atmospheric Administration (NOAA) National Marine Fisheries Service (NMFS) National Parks Service
Natural Resources Conservation Service
US Forest Service, Rogue River National Forest
US Bureau of Reclamation
US Fish and Wildlife Service
US Geological Survey
PRIVATE ORGANIZATIONS Bear Creek Greenway Foundation
Bear Creek Watershed Council
Headwaters
Oregon Trout
Siskiyou Velo
Source: Draft RVCOG Greenway Management and Operations Plan, 2004
Bikeways and shoulder lanes may become unusable if not properly maintained. To address this, the RVMPO adopted the following policy:
Policy 6.C-5 Local governments, and ODOT where appropriate, shall seek to provide regular maintenance of existing bicycle facilities including pavement management and regular sweeping.

101
SSeeccuurriittyy IIssssuueess
Separate bicycle / pedestrian facilities have unique security issues since they are, by definition, remote from passing automobiles and thus from quickly arriving potential sources of help. On the Bear Creek Greenway, security concerns include the presence of homeless people who sometimes camp in the vegetation adjacent to the trail system. While these individuals are generally anxious to be left undisturbed, their evident presence can be a deterrent to potential Greenway users. For the Greenway to become a genuine transportation alternative, it needs to be able to offer a comfortable experience not only to enthusiasts, but also to average cyclists.
In the report, Conflicts on Multiple-Use Trails: Synthesis of the Literature and State of the Practice by the Federal Highway Administration, examples of common sources of conflict among greenway users include:
Disorderly behavior;
Graffiti;
Inadequate communication between management authorities;
Lack of respect for others;
Lack of courtesy;
Littering;
Noise;
Speed;
Surprise;
Trail damage (e.g., erosion, root growth, etc.);
Unclear signage;
Uncontrolled dogs;
Uncontrolled vegetation, and
Uncoordinated uses (special events vs. regular users).
Some solutions may include: more bicycle officer patrols, cadet or volunteer programs, improved sight-lines, better distance and exit markers, provision of periodic emergency call phones, trash receptacles, and landscaping.
DDeeddiiccaatteedd PPeeddeessttrriiaann SSyysstteemm
General
The Oregon Transportation Planning Rule (TPR) requires sidewalks along all collector and arterial streets within an urban growth boundary. Streets and public spaces can be designed to promote pedestrian use, with important .pedestrian-friendly amenities including street trees, park strips, on-street parking, adequate unobstructed sidewalk width, pedestrian-scale lighting, and locating buildings near the street. Enhanced crosswalk facilities such as islands, medians and lighting beacons can also improve the pedestrian s safety.

102
The RVMPO adopted the following policy to respond to the TPR and the needs of pedestrians:
Policy 6.C-6 Local governments, and ODOT where appropriate, shall foster maximum year-round pedestrian access by seeking to require or provide continuous, gap-free sidewalks/ pedestrian pathways along all urban streets except where special conditions prevail such as historic districts. Sidewalks and walkways should be required in new developments in the metropolitan area and they should be included with major street improvement projects (OAR 660-12-045(3)(B)).
Sidewalk System Continuity
Most local governments already require new developments to include sidewalks and walkways. Where such provisions are not required, this requirement should be adopted. Sidewalks are also generally provided with most major street improvement projects. One issue, which should be made a priority, is to develop a systematic approach to filling gaps in the sidewalk system. To accomplish this, an annual allocation for construction is recommended. The highest priority for sidewalk construction should be given to locations near schools, public facilities, and heavily used transit corridors. Safety should be a prime consideration in evaluation and design. To reflect this approach, the RVMPO adopted the following policy:
Policy 6.C-7 Where pedestrian access ways are called for, require their construction simultaneous with roadway construction / subdivision development, not on a frontage-by frontage basis. This ensures fully functioning connected systems that do not wait for homesites or projects to occur
TTrraannssiitt--RReellaatteedd BBiiccyyccllee aanndd PPeeddeessttrriiaann IIssssuueess
The provision of sidewalks is vitally important to transit, too. Pedestrian access to transit stops can be the determining factor as to whether or not an individual chooses a trip via transit or automobile. RVTD makes the point very succinctly; Transit relies upon pedestrians for ridership. Priority
should be given to provision of sidewalks where they can benefit fixed route transit.
Current efforts at providing both pedestrian and bicyclist access to transit could be significantly expanded by providing better walkways to commercial centers and providing walkways from subdivisions to bus stops on arterials. As recommended in Policy 6.C-8, bicycle racks and lockers should be provided at transit stations, and bicycle racks should be provided on buses to promote the use of bicycles and transit for commuting. All of RVTD buses are equipped with 2-bike bicycle carriers. The Federal Transit Administration (FTA) provides 100 percent federal funding and no local match for bicycle/transit facilities. To reflect this concern the RVMPO in consultation with RVTD has adopted the following policy:
Policy 6.C-8 RVTD shall continue to provide bicycle racks on buses, and bicycle racks and lockers at transit stations and bus stops to improve bicycle access to transit.

103
It is vitally important to RVTD that its riders have safe convenient access to bus stops and passenger shelters. The provision of sidewalks is expected to increase significantly the ability of RVTD to attract riders. For its part, RVTD intends to implement high quality transit service between high activity centers (see the RTP Transit Element), but needs the cooperation of other area governments with infrastructure improvements, especially sidewalks.
AAmmeerriiccaannss wwiitthh DDiissaabbiilliittiieess AAcctt ((AADDAA))
Disabled people may be on crutches, in wheelchairs, using a walker or having no visible sign of disability but suffering from heart disease, emphysema or other illness that limits how far and how easily they can walk. The ADA requires attention to the special mobility needs of this population. To reflect this, the RVMPO adopted the following policy:
Policy 6.C-9 The location and design of all sidewalks shall comply with the requirements of the Americans with Disabilities Act, and local jurisdictions and ODOT shall work with RVTD to design and locate bus stops in accordance with ADA. Local governments and ODOT where appropriate, shall provide sidewalks and other amenities to make pedestrian access to bus stops easier.
BBiiccyyccllee aanndd PPeeddeessttrriiaann SSaaffeettyy
Policy 6.C-10 Local governments, and ODOT where appropriate, shall support bicycle and pedestrian safety, both through enforcement of safety laws and regulations and through support of programs that provide bicycle and pedestrian safety education.
Drivers also of course need educating, especially as the number of cyclists sharing the road increases. For example, inadvertent and careless opening of a driver s car door can cause a cyclist to get seriously hurt. In many other street settings, cyclists feel invisible despite road use rules that provide equal access.
Policy 6.C-11 All signalized intersections in urban areas shall have marked crosswalks to ease crossing convenience and safety for bicyclists and pedestrians.
Because cyclists and pedestrians are the most physically vulnerable users of the transportation system, safety is a significant issue in making the system accessible to these modes. The maintenance of bike paths can have a significant impact on bicycle safety as mentioned in the section of this Element titled Bikeway Requirements. Another major issue for bicycle safety is motorists and cyclists not following the rules of the road. A common driver error is failing to yield to bicycles. Bicyclists riding the wrong way (against the traffic) are the leading cause of crashes in which the cyclist is at fault because it makes them less visible to drivers.
While only 15 to 35 percent of bicycle crashes involve motor vehicles, most pedestrian crashes are collisions with cars. Most vehicle/pedestrian crashes occur as pedestrians are attempting to cross roadways. Speed is an important factor in the severity of car and pedestrian crashes, as shown by the

104
following figure. Reduced traffic speeds prevent pedestrian deaths. One method for reducing traffic speeds and thereby increasing bicycle and pedestrian safety is traffic calming, that is, application of a choice of street redesign techniques to allow safer pedestrian and cycling activity and slow down the flow of traffic.
FFiigguurree 1100--66 EEffffeecctt ooff SSppeeeedd oonn PPeeddeessttrriiaann CCrraasshheess
Pedestrians chance of death if hit by a motor vehicle.Source: Killing Speed and Saving Lives, UK Department of Transportation
In addition, bike and pedestrian safety can influence planning for other modes. For instance, enhancing bicycle and pedestrian facilities around schools could reduce the number of motor vehicle trips.
BBiiccyyccllee aanndd PPeeddeessttrriiaann SSyysstteemm PPllaannss
Improvement projects are listed in Figure 8-3 in Chapter 8, Street System Element.
Figure 10-7 shows the existing and future bicycle facilities and Figure 10-8 shows the existing and future pedestrian facilities.
PPrroommoottiioonnaall aanndd EEdduuccaattiioonnaall PPrrooggrraammss
Promotional campaigns and other strategies that encourage the use of bicycling and walking for transportation can have shown to have a positive impact. RVTD s TDM program conducts numerous public outreach efforts such as transportation exhibits, coordinating events, education on health and cost savings and much more. Education programs are discussed in the TDM section of the RTP. Promotional programs have the additional benefit of improving driver awareness of bicycles and pedestrians and their right to the road. Bicycle suitability maps or bicycle system maps can help cyclists choose the most appropriate route and can be used for educational purposes. In addition to RVTD s promotional efforts, local governments should also be concerned with education and publicity, using the media, their transportation committees, their bicycle elements of TSPs and other methods to promote bicycling and walking.

105
Other groups involved with Bicycle and Pedestrian activities include at least the following:
Ashland Bicycle and Pedestrian Commission;
Medford Bicycle and Pedestrian Task Force11;
Siskiyou Velo Club;
Jackson County Bicycle Advisory Committee;
Safe Kids Rogue Valley; and
Bicycle Transportation Alliance.
11 This is a group whose purpose is to review the projects in the Medford TSP and will then disband unless the Council adopts them as a full time commission. This group may be needed, to continue in the future as a public voice and technical and policy review board.
106
1111.. TTRRAANNSSIITT SSYYSSTTEEMM EELLEEMMEENNTT
IInnttrroodduuccttiioonn
This chapter addresses the long-term potential role for transit and related services in the region. At present, transit coverage is at a modest level due to a lack of funding. RVTD provides bus service all day on weekdays only. Users tend to be the transit-dependent riders, which includes low income, young, old and disabled residents of the region. Much has been said, in this Plan and elsewhere, about policies and programs to encourage greater usage of transit (as well as walking, bicycling and carpooling) in order to reduce dependency on the single occupant vehicle.. The region must consider greater financial support for transit, so that the system can expand substantially, in order to have greater success in achieving such aims.
Reasons for the current modest use in transit include:
The region is small and does not suffer from long delays caused by major traffic congestion;
Growth is occurring at the urban fringe at relatively low densities (3-4 housing units per acre) whereas the transit industry s national standard is that a density of about 7 housing units per acre is needed to generate enough riders to warrant a bus line. Viable bus transit does not mean self-supporting financially, only that the route will have riders and be productive;
Another factor militating against transit growth is that new bus hours require new funding. Even the nation s most successful transit systems achieving only a little over 40 percent return on farebox revenues. Lower density systems such as RVTD achieve

107
around 20 percent on farebox, which means that every dollar in RVTD fare revenue must be supplemented by $4 in funding from other sources.
RVTD s lack of a stable long-term funding base is the biggest reason for the limited transit service levels. Unmet demands of many types have been identified, but cannot yet be satisfied.
And yet, the outlook for the future is very promising, as indicated by just a few trends and actions:
RVTD s increased productivity and ridership trends over the last three years indicate that the agency can do more with less;
Local decision-makers have agreed to spend a large portion of the regions federal Surface Transportation Program (STP) funds on RVTD fixed route headway improvements, for at least the next decade.
The region, led by the MPO, undertook a study of Transit-Oriented Development (TOD) in the late 1990s that has yielded proposals for 8 TOD sites and implementation thus far of three of them.
A Transportation Management Association of major regional employers has been formed to help organize specific transit, carpooling and vanpooling assistance to key work sites.
RVTD has increased the scope and scale of its Transportation Demand Management (TDM) program.
RVTD is far from being just a fixed route bus agency, as the following paragraphs will demonstrate. The agency is also developing services and programs more suited to low density, scattered development as well as being an active partner in helping to create pockets and corridors of greater density that can be more readily served by conventional transit.
SSeerrvviiccee OOvveerrvviieeww
RVTD provides public transportation to the southern Oregon cities of Ashland, Talent, Phoenix, Medford, White City, Central Point, and Jacksonville, and is a growing transportation element of the Rogue Valley. It offers a variety of community transportation programs discussed in more detail below. These include fixed route bus service with a fleet of 23 buses; a paratransit service, Valley Lift, and a non-emergency medical regional ride brokering operation called TransLink. RVTD also functions as the region s transportation demand management (TDM) agency. TDM is discussed in more detail in Chapter 7.
RVTD's main office and bus barn are located at 3200 Crater Lake Avenue, in Medford, Oregon. Two other facilities are key to its operations: a fixed route bus Transfer Center located at 200 S. Front Street in Medford, and TransLink located at 518 W. 6th Street in Medford.

108
Fixed Route Services
Eight fixed route services are operated, requiring 37 fixed route drivers. There is no service on weekends; service hours are from 5:00 am to 8:00 pm Monday through Friday. Only two routes have service frequency greater than 30 minutes. One is hourly and the Jacksonville route has just 9 runs per day. Ridership in 2003 was 1,145,479, up 16 percent from 2002, and ridership in 2004 is project to exceed 1.2 million Some 39,917 revenue service hours are provided annually. RVTDs
current vehicle occupancy is averaging approximately 68 percent daily. As ridership continues to grow more funds will be needed to provide service to accommodate the increased passenger loads.
RVTD has one major transfer point, the Front Street Transfer Station in downtown Medford. The Front Street Transfer Station can accommodate up to ten transit vehicles at any give time. RVTD currently utilizes seven of the spaces for the regular fixed route service. An intercity connection is provided at the station through Amtrak s bus service. Additional intercity connection can be made from RVTD s fixed route system to the Greyhound depots in Medford and Ashland.
Paratransit Service
The Americans with Disabilities Act (ADA) ensures that people with disabilities receive public transportation comparable to the public transportation available to people without disabilities. RVTD provides curb-to-curb service, called Valley Lift, to people who are unable to use a fixed-route lift-equipped bus because of a disability. The Valley Lift service is intended only for those trips that an individual cannot make on the fixed route bus system. It serves areas ¾ mile beyond the fixed routes to meet ADA requirements, and is contracted to a variety of local providers including taxicab companies. An application form is required to determine when and under what circumstances the applicant can use buses and when Valley Lift service is required. Anyone with a disability which prevents them from getting to or from a regular bus stop, or from independently (without assistance of another person besides the driver) boarding, riding or getting off a regular lift-equipped bus is eligible for this service. RVTD s Valley Lift program has 1400 registered clients and provided 94,563 trips in 2003.
Job Access Reverse Commute (JARC) and Related Welfare to Work Transportation
RVTD s Job Access Reverse Commute program provides transportation services to connect welfare recipients and low-income individuals to employment and support services such as childcare and jobs training. These transportation services include fixed route enhancements, shuttles, carpools, vanpools, and contracts with private transportation providers. Most of the transportation services developed to serve welfare to work clients and low-income persons will also be accessible to the general public including the newly unemployed and others who may be in a position to need welfare, RVTD s JARC program helps reduce Vehicle Miles Traveled (VMT) and improves the overall economy in the region.

109
RVTD s Group Bus Pass Program
RVTD provides fixed route fare discounts for schools, non-profit groups, employers, and government agencies. Group Bus Pass Participants are Bear Creek Corporation (BCC), Rogue Community College (RCC), and Southern Oregon University (SOU). BCCs pass program provides in excess of 35,000 rides per year on a seasonal basis. RCC s program provides approximately 48,000 rides per year. Ridership can t be tracked on the SOU program.
TransLink
The TransLink Call Center is a centralized transportation brokerage facility. It operates in a much larger service area than the bus system
the five counties of Coos, Douglas, Curry, Jackson and Josephine. It offers ride reservation, scheduling, and financial management services under contract to the Oregon Medical Assistance Program (OMAP), to handle non-emergency medical rides. It takes all calls for medical access in this 5-county area, making sure the passenger is eligible, scheduling him or her with the lowest cost provider; and arranging for the 3rd party payments. TransLink is thus a brokerage of many services, including Valley Lift. Soon it will also dispatch the RVTD Guaranteed Ride Home Program.
Transportation Demand Management
In addition, RVTD operates a growing Transportation Demand Management (TDM) program, also known as Transportation Options. This program is a free information, planning and trip reduction support service available to residents and employers in Jackson and Josephine Counties, who are interested in carpooling, vanpooling, bicycling, walking and other commuting alternatives.
This TDM program examines the behavioral side of transportation and focuses on reducing Single Occupancy Vehicle (SOV) trips by changing transportation behavior. TDM programs and services include; carpool and vanpool services, Bikes on Buses, Reflect on Walking Day, Group Bus Pass programs, bicycle and appropriate transportation education, assistance with Oregon Office of Energy Tax Credits, Telework support, employee trip reduction planning and employee trip reduction fairs. The TDM service area includes not only the Rogue Valley but also all of Jackson, Josephine, Klamath, and Siskiyou Counties. TDM is discussed more fully in Chapter 7.
FFiixxeedd RRoouuttee BBuuss OOppeerraattiioonnss OOvveerrvviieeww
RVTD s fixed route operations are in many ways typical of other bus systems in the same size range. Most fixed route buses pulse in and out of the main downtown core (i.e. in this case, the South Front Street Transfer Center in Medford) with timed meets so that passengers can easily make connections from one part of the region to another. As mentioned, this fixed-route bus system is supplemented by a variety of demand-responsive systems that seek to serve segments of the market not readily able to reach bus stops. Paratransit dispatching is currently done by the taxi companies.
From the drivers standpoint, also, RVTD operates a typical system, with drivers selecting their preferred routes four times a year based on seniority (longevity). This bid is one of management s

110
opportunities to add and modify routes, including any running time adjustments that may be required as traffic density grows in the region. In some systems, drivers pick up their bus from the base and
deadhead to some portion of the service area to start their route. In RVTD s case, almost all buses are pulled out at Crater Lake Avenue, deadheaded to downtown Medford at the transfer center, where they go into passenger service. This is where drivers come in and out all day. Buses traveling from Medford deadhead from downtown Medford to Ashland, but Route 5 is based in Ashland all day. The drivers are thus only at the Crater Lake Avenue bus depot at the start and end of their workday, except for any that work a split shift (for example, four hours in the morning split by a several-hour break and followed by four more hours in the afternoon). Buses come in and out of service at the Transfer Center. Buses re-fuel during the day by returning to the Crater Lake Avenue depot at least once; these additional deadhead trips are written into the schedule.
RRiiddeerrsshhiipp FFoorreeccaassttss
The 2002 RTP s Transit Element goal was to accommodate three percent of the metropolitan-area daily trips by transit by the planning horizon year 2023 when the population had been projected to reach 136,000 people. Currently, RVTD carries over 4,000 trips per day of the MPO area daily trips, or less than one percent of all trips.
The primary goal is to connect activity centers with high quality transit service. RVTD seeks to attract all types of trips rather than just work trips or trips made by persons who presently have little choice in their mode of travel.
This large increase in transit ridership from current ridership levels is not so much a forecast as a contingent projection. To meet the projection, the following contingencies will have to be fulfilled:
RVTD will require substantially more service hours, buses, and facilities than are currently available.
It will also require intensive community support.
It will require strong adherence to the policies set forth in this Element.
It will need strict adherence also to the policies in the Transportation Demand Management, Bicycle and Pedestrian, and Land Use Elements.
The Land Use Element will be a key to strengthening the activity centers where RVTD intends to emphasize high quality service.
RVTD intends to replace the current radial pulse system with a system that connects activity centers. This is RVTD s recommended solution and is based on the Transit Oriented Development and Transit Corridor Strategies Plan.
To achieve the plan s transit ridership goals, RVTD must significantly increase the amount of service within the RVMPO area.
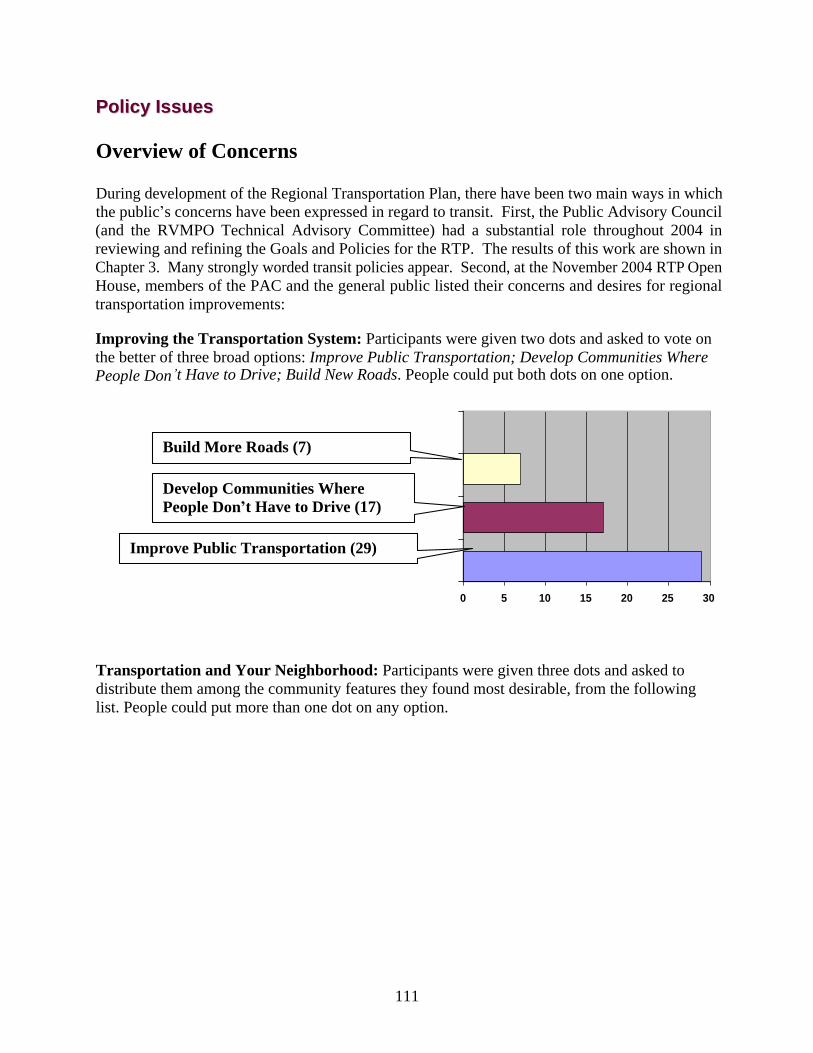
111
PPoolliiccyy IIssssuueess
Overview of Concerns
During development of the Regional Transportation Plan, there have been two main ways in which the public s concerns have been expressed in regard to transit. First, the Public Advisory Council (and the RVMPO Technical Advisory Committee) had a substantial role throughout 2004 in reviewing and refining the Goals and Policies for the RTP. The results of this work are shown in Chapter 3. Many strongly worded transit policies appear. Second, at the November 2004 RTP Open House, members of the PAC and the general public listed their concerns and desires for regional transportation improvements:
Improving the Transportation System: Participants were given two dots and asked to vote on the better of three broad options: Improve Public Transportation; Develop Communities Where People Don t Have to Drive; Build New Roads. People could put both dots on one option.
0 5 10 15 20 25 30
Transportation and Your Neighborhood: Participants were given three dots and asked to distribute them among the community features they found most desirable, from the following list. People could put more than one dot on any option.
Improve Public Transportation (29)
Develop Communities Where People Don t Have to Drive (17)
Build More Roads (7)

112
Goals Prioritization: The draft RTP goals were presented on posters. Participants were given four dots and asked to put them next to the goals they felt were most important. People could put more than one dot on any one goal.
Votes Goal 28 Foster increased transit service, facilities, and usage to reduce reliance on single-
occupancy vehicle
19 Use transportation investments to foster compact, livable communities. Develop plan that builds on community character, is sensitive to environment, and enhances quality of life
15 Maximize the efficient use of existing and future infrastructure to facilitate smoother movement of people, and motorized and non-motorized vehicles
13 Enhance bicycle and pedestrian systems; enhance the provision of bicycle and pedestrian amenities
9 Provide environmentally sensitive and healthy transportation options
8 Use incentives to encourage regional multi-occupant and non-motorized vehicle facilities and services, so they are the choice for an increased percent of regional trips
The need for a long-term Stable Funding Base for transit and TDM services has already been discussed in the Funding section of this chapter. Other issues are discussed below.
0 2 4 6 8 10 12 14 16 18 20
Being within a 20-min. commute to work (3)
Easy access to highway (4)
Sidewalks & places to take walks (19)
Living in a place that's away from it all (.5)
Living in a place that's at center of all (.5)
Having a large house, acre+ land (0)
Walking distance to stores (11)
Walking distance to school (4)
Walking distance to public transport (15)

113
Target Markets
Service to Transportation-Disadvantaged Markets
Policy 6.D-2 Local governments shall, through RVTD, continue provision of transportation services and facilities that enhance mobility/livability and quality of life options for the transportation-disadvantaged.
An important target market for transit services is the region s transit dependent population. RVTD is already, with its current funding base, providing a baseline level of service to the various segments of this population.
Service to New Markets
But for transit to attract riders who are not transit-dependent but use the system by choice, and thus for it to make a real impact on regional travel choices and VMT, a number of changes must come about. The following policies and related discussions identify specific areas for change.
Policy 6.D-3 RVTD shall continue to provide pleasant, aesthetically pleasing, clean, safe, comfortable vehicles, and shelters along transit lines.
RVTD does an excellent job in the service being provided with the resources at hand. It has demonstrated an ability to handle greater levels of operations.
Actions Required to Expand Ridership
Priority should be given to improving the quality of service on existing routes by adjusting route alignments, increasing the frequency of service, expanding the hours of service, changing to seven day per week operations, and to dense neighborhoods such as new TODs currently without transit services. Support of other RTP Elements, especially the Land Use Element, will be required.
The following paragraphs summarize these changes. These recommendations begin by upgrading the level of service currently provided on existing fixed routes, including establishing minimum standards for headways, service days, and service hours. The level of service provided on proposed new routes includes minimum service standards.
Park-and-Ride Facilities
Policy 6.D-4 Local governments, RVTD, and ODOT where appropriate, shall consider the development of park-and-ride facilities as a cost-effective means of increasing the efficiency of the existing transportation system.
RVTD has established park and rides already in White City, Jacksonville and Talent. Funds have been identified for an additional one or two near Ashland.

114
Route Alignments
Policy 6.D-5 The Rogue Valley Transportation District (RVTD) should periodically review ridership and service throughout the region, adjusting routing to maximize ridership potential, increase the area of coverage and ensure service availability. Where practical, RVTD should route transit services to provide service coverage within ¼-mile walking distance of urban area residences. Service should be comfortable, convenient and efficient.
The intent of this policy is not that bus service should embrace an ever-widening area, but that housing should densify within ¼ mile radius of existing bus corridors.
Route Headways
Policy 6.D-6 RVTD shall operate all transit routes with route headways no greater than one-half hour during peak periods, and supply transit service on weekends and evenings.
While there are many factors that contribute to transit ridership, the level and frequency of service are important factors in attracting and maintaining a ridership base All but two routes currently have 30 minute service frequency. Weekday evening service is available on all routes. The Public Advisory Council recommends increasing service to 15-minute headways as soon as possible.
Service Hours
Policy 6.D-7 RVTD shall continue to provide off-peak mid-day services on all routes, or a guaranteed ride home program should be available and publicized.
Currently, six of eight of the RVTD routes provide thirty minute service from 5:00 a.m. to 8:00 p.m. during weekdays. In addition, RVTD works with major employers in the area to provide a variety of incentives, including a guaranteed ride home program, to increase alternative transportation use by employees.
An assertive approach is recommended to expand the number of hours that RVTD buses operate. It has been determined that the hours of operation do not fully meet the demand for general public transit service, particularly for Southern Oregon University and Rogue Community College students, Bear Creek Corporation employees, Rogue Valley Medical Center, Providence Hospital, residents of the Veteran s Domiciliary in White City, and the Rogue Valley Manor in Medford. Modifications are needed to provide transportation to employees whose shifts begin early in the morning and for employees who work graveyard shifts.
On average, the preferred transit plan would begin service at 4:00 a.m. and continue until 11:30 p.m. On average, weekend service (including Sundays) would begin at 6:30 a.m. and operate until 10:00 p.m.TODs and Transit-Friendly Land Use
TOD or Transit-Oriented Development means the development of higher density nodes of mixed use activity that that lend themselves to easier transit service and higher transit ridership. As mentioned

115
in the preface to this chapter, the industry rule of thumb is that 7 houses per acre are required to generate enough riders to justify a bus route. There are 3 active TOD sites in the region: Central Point, Southeast Medford, and Phoenix. Five more that have been identified but not yet implemented: Delta Waters, Highway 62 and 99, Downtown Medford, Barnett/Gateway, and West Medford.
However, TODs are not the only solution to easier transit access. The RTP Policy 6.D-5 described above has a system-wide focus on density. Its aim to maximize service to provide service coverage within ¼-mile walking distance of urban area residences means that housing should ideally densify along transit routes to maximize the number of people living within ¼ mile of a bus route. Ideally all new urban development should be designed in such a manner as to facilitate maximum bus usage. Transit-Friendly Roadway and Building Access Design
Policy 6.D-8 Local governments, ODOT where appropriate, and RVTD should support transit-friendly design including appropriate inclusion of bus-only lanes on arterial streets, bus bays or turnouts on district level State highways, arterial and collector streets as a means of facilitating traffic flow during peak travel periods, and should revise building codes that enhance pedestrian access to major destination buildings. This transit-friendly design approach will also encourage connectivity to transit by enhancing pedestrian, wheelchair and bicycle access to bus stops.
Policy 6.D-9 Where warranted by traffic speed, volume, and average bus schedule dwell time; where consistent with maintaining a positive pedestrian environment; and where approved by RVTD, local governments, and ODOT where appropriate, shall facilitate implementation of bus bays on congested arterial streets as a means of facilitating traffic flow during peak travel periods.
As indicated elsewhere in this plan, including the Bicycle and Pedestrian Element, transit relies upon pedestrians for ridership. This makes it particularly important that roadway projects include provisions for sidewalks.
Other features need to be considered when planning for roadway projects. These features might include thicker pavement at transit stops; transit-only right-of-way at congested intersections; construction of bus turnouts; construction of transit passenger shelters; wider sidewalks at transit stops; bicycle facilities near transit stops; and bike racks at transit stations. Consideration of transit infrastructure and capital needs early in street project planning may eliminate redundancy and reduce future expenditures. The construction of a new roadway that makes specific provisions for transit may allow RVTD to leverage funds or switch funds for the construction of transit infrastructure along that roadway. When possible, roadway and transit projects should be coordinated and constructed at the same time.

116
Partnerships and Supporting Activities
Employer-Subsidized Transit
In addition to the efforts made by RVTD through its TDM and TMA programs, local governments can be instrumental in helping to increase transit usage, by working actively and supportively with employers in their areas. Subsidizing transit passes is a proven way for employers to increase transit use by their employees. Some employers find that costs are comparable to or less than the cost of providing free employee parking. Shifting subsidies away from employee parking and towards transit saves land that would otherwise be paved and promotes better land use practices. Transit passes purchased by employers for employees (up to $100/month) are not taxed as employee income. Group bus pass programs qualify for the Oregon Office of Energy Business Energy Tax Credit (BETC). The program requires pre-authorization and will reimburse eligible projects up to 35% over a period of three years. For institutions that do not have a tax liability the BETC also offers pass-through partners often banking establishments. The pass-through partner will receive the 35% tax credit and reimburse the project owner. Southern Oregon University, Rogue Community College, Bear Creek Operations and Advanced Business Teleservices have all received the BETC tax credit for their bus pass programs. For more information about BETC please refer to their website at http://egov.oregon.gov/ENERGY/CONS/BUS/BETC.shtml.
Transportation Management Associations (TMAs)
A TMA is an organization of employers, in this case managed by RVMPO in collaboration with RVTD. Its aim is to help employers provide programs and information to their employees that will increase transit, bicycling, carpooling and vanpooling to work.
Promotional Programs
It is necessary to attract riders who currently use other modes of transport in order to significantly increase ridership. In order for these people to consider transit as a viable option, there must be sufficient public information about the services available. Encouraging new riders to try the transit option is the vital next step after any service improvements are made. RVTD has an extensive and long-standing marketing program with six major goals:
1. The Marketing Plan must increase public awareness in the many communities in which RVTD operates.
2. The plan must create a favorable climate that will help facilitate a tax ballot measure for added revenues for the transportation district. RVTD is reaching the 95 percent of the public that does not ride the bus, but still pays taxes and vote on ballot measures.
3. The Marketing Plan must create a constituency of supportive grassroots leaders and key community supporters of transportation.
4. Marketing must always create and earn credibility, goodwill and equity in order to withstand the occasional (and inevitable) miscalculation or setbacks that will occur.
5. The goal of any marketing program is to be able to influence perceptions and attitudes in the community and to shape a positive opinion no matter the circumstances in which the transportation district finds itself.
117
6. Marketing tries to combat the misconception that transit only serves the poor. It increases employee retention and recruitment. Takes cars off the road, decreases sprawl and improves air quality.
RVTD s Marketing program has successfully accomplished the six marketing goals by instituting the following programs:
1. Nine years ago an RVTD public speaking program was instituted and still functions today. RVTD delivers specific messages to specific audiences. The agency has developed presentation tools and a very specific delivery system. A series of pamphlets, fact sheets and transportation media overviews are all in play and part of RVTD s Marketing Plan.
2. RVTD understands that only 5 to 7 percent of the public in the communities served ride the transit bus system. It was decided that a system must be developed that would enable the general public s perception of RVTD to be one of service to the community and to feel ownership of the public transportation system whether they rode or not. To accomplish this and many of the other marketing goals the Interactive Bus Marketing Program was developed. This program system was created to broadcast the correct message about its attitudes, competence, and intent helping to create a positive public image. It is in its ninth year and has become an international award winning program teaching from 5,000 to 7,000 students a year in the public school system about public transportation. Its influence is felt locally, statewide, national and internationally. This year will see the start of the Senior Interactive Bus Education Program. RVTD s marketing and education program reaches and influences people of all ages. Literally thousands of people a year are introduced for the first time to the RVTD transportation system through the Interactive Bus Marketing Program.
3. To supplement the Interactive Bus Marketing Program and to allow RVTD s concepts to work their way into the public consciousness, RVTD ads are on TV at least 5 to 9 times a day with TDM, RVTD and direct marketing messages. Ad contracts are for 12 months and payment is in trade not cash. Radio and print round out RVTD s multi-media format.
4. In the final analyses RVTD marketers are in the business of selling change not to just a few but to all that live in the transportation district. The change the Marketing Department must sell involves the public s perception of RVTD s role as the transit provides in the community. It involves our credibility in our ability to resolve the issues of air quality, traffic congestion, and to do it within the constraints of budget and community tolerance.
OOtthheerr SSyysstteemm IImmpprroovveemmeennttss
RVTD Facilities Analysis
In 2003-4, with assistance from the MPO, RVTD began a preliminary examination of its facilities to determine whether the Crater Lake Avenue site should be redeveloped, rejected in favor of a new site, or its functions split. Facility needs are substantially affected by system growth rates
for instance rapid growth means not only the need to house and maintain more buses, but may also mean an increased number of overnight layover sites so that buses can pull into service without as much

118
deadheading. This study will continue in FY 2004-05 and be integrated into the RVTD Long Range Plan.
Deployment of New Technologies
ITS
ITS or Intelligent Transportation Systems is an umbrella term that covers electronic and high tech installations that can help transportation efficiency and safety. In FY 2003-4, RVMPO completed its first regional ITS plan which lists a number of potential ITS projects that would aid transportation in the region. This topic is discussed more fully in Chapter 6. An example is highway variable message signs that can warn of road construction or an accident ahead and encourage detours. In the transit realm, two important ITS installations that can help RVTD are:
Automatic Vehicle Location technology using GPS, a gadget on the bus reports its location and can be used to monitor and inform riders (at the bus stop or online) about delays and wait times. Such systems also play a vital in transit safety and security issues.
Traffic signaling devices that can enable a traffic signal to be tripped in favor of the bus and speed up its trip. Such systems are widely used along with bus-only turn lanes and other traffic management techniques designed to give buses priority over other traffic. The most well-known vendor is Opticom® and these systems are already in use in the region by emergency vehicles (ambulances and fire). (RVTD is testing this technology in conjunction with the Hwy 62 unit one project corridor.)
Other Emerging Technologies
While the region is too small to lead new research and development, it can easily monitor and take advantage of emerging technology research and testing being undertaken by larger organizations. The most promising of these technologies is Personal Rapid Transit or PRT, which is a cross between a taxi and a small elevated rail system, being designed for low density corridors. The system is fully automated and passengers traveling together enter a small vehicle (usually 4 seats) and punch in their destination. The vehicle travels directly to that stop, bypassing intermediate stations, which are off-line like freeway exits. Stations generally have empty cars waiting, so the system is quick. The guideway is small enough (because the cars are small and light) that it can be installed within buildings, for example connecting a theater or convention complex with parking and hotels, always within building lobbies and connected to elevator systems. Vendors worldwide are developing alternative versions of this technology.
Potential New Services and Facilities
Bus Rapid Transit (BRT)
BRT is an intermediate transit technology now being developed in a number of locations including Eugene. It consists of high quality buses (reclining seats, tinted windows, air conditioning, tray tables etc) using a special lane on the roadway. A full transitway is a two-way corridor, usually in the median of a freeway, that has flyover ramps to enable buses and other permitted vehicles (e.g.

119
vanpools and carpools) to enter and exit the transitway without having to weave through traffic in the other freeway lanes. Locations where a BRT system could work well in the Rogue Valley include:
Highway 62 Expressway median;
Highway 99 / rail corridor between Ashland and Grants Pass or a portion thereof, such as between Medford and Central Point along 99.
There also needs to be an E/W connection in Medford, particularly in the SE Medford area.
RVMPO proposes to undertake investigation of BRT with RVTD in the region in its 2005-06 Unified Planning Work Program.
Vanpools
The nation s largest and arguably most successful vanpool program operates in the Metro Transit area of Greater Seattle. It was begun by Boeing to serve its three major locations in Everett, Seattle and Renton and passed over to the transit agency to operate during the 1980s. The employer or the transit agency purchases a ten or more-seat van and makes it available for commuting to the worksite.
Driver training is required and most vans have a lead and a backup driver. The driver starts and ends the route, making pickups and drop-offs and takes the vehicle home at nights and weekends. He or she is responsible for taking care of fuel, oil and vehicle washing. He or she will also manage the regular maintenance visits to the transit agency maintenance shop or other location. In exchange he or she gets to ride free.
The other riders pay a share of operating costs resulting in all out-of-pocket costs being covered. The transit agency or employer pays for the initial capital cost of the vehicle and provides work place assistance in finding riders and supporting the program. The precise array of operating costs coved by rides may vary
just fuel, oil and washing, or also insurance, regular maintenance and repairs.
Vanpool programs work best when a number of workers are going to the same or nearby sites, yet there is not enough demand to run a fixed route bus to that location. Examples in the Rogue Valley include various major employers in White City, Bear Creek Corporation and some employers in Medford.
No market studies exist, here or elsewhere, defining the maximum market penetration of vanpools obviously only a percentage of the region s workers have the shared destination, fixed shift schedules and long distance commutes that can make vanpools really successful. But because they can break even in terms of operating costs, they are well worth exploration on an incremental basis.

120
Worker-Driver Buses
Worker-driver buses are operated very similarly to vanpools and are successful when even larger numbers of employees (30-40 instead of the 10-15 of a vanpool) want to go to the same worksite at the same time. There is the added challenge of the driver finding adequate parking for a bus near his/her home. In the Rogue Valley it seems likely that vanpools are a better place to start, reserving the idea of worker-driver buses for the future if high density vanpool demand emerges.
Subscription Bus Routes
A subscription bus route is a form of demand-responsive transit. The route is tailored to the pick-up locations of a specific group of riders. Unlike the vanpool or worker-driver bus, a subscription bus has a transit agency driver and thus costs more. There have been many requests for Grants Pass to Medford bus service; a subscription bus route might be the answer. However, a smaller scale and less expensive answer would be to start with vanpool services. Institutional changes would be needed since RVTD cannot provide service to Grants Pass under current law and district configuration.
Universal Guaranteed Ride Home and Universal Pass
At present, RVTD has a Guaranteed Ride Home program by agreement with specific employers that have group passes. A guaranteed ride home in the middle of the day is an important inducement to trying and using shared ride transportation for if you are in a carpool, vanpool or ride the bus, what otherwise will you do when a call comes from your child s school saying she has broken her arm? A universal guaranteed ride home program provides taxi scrip or other financing to enable a person to get home in a hurry to deal with an emergency. Safeguard need to exist that the program won t be abused; systems that have these programs report that very few requests are made. It s the assurance that a person CAN get home if necessary that encourages people to try a shared commute trip. To avoid abuses by the occasional rider who is just tired of waiting for a late bus to show up, the Guaranteed Ride Home program needs to be limited to a small number of uses per year.
New Routes
Policy 6.D-10 RVTD should be encouraged to implement express commuter service between cities in the Rogue Valley as funds become available and all other operational goals are met, such as headway, hours of service and days of week.
Existing routes meet only basic transportation needs for people to travel between and within cities throughout the Rogue Valley. To improve transit ridership within cities, new or more frequent routes need to be established .The following routes are examples of those that could be added if the preferred transit plan is implemented:
1. Expand service to Rogue Valley International Airport. 2. SE Medford - Add transit trunk route between Rogue Valley Medical Center and South
Gateway. 3. Add service route from Medford Central Business District (CBD) to Roxy
Anne/Brookdale neighborhoods via Spring Street.

121
4. Add service route from Rogue Valley Mall to Cedar Links/Lone Pine neighborhoods. 5. Add service route from Medford CBD to Sage Road Industrial Area.
Medford CBD - Add transit trunk route from Rogue Valley Mall to South Gateway, also serving Medford s Civic and Business Centers.
6. Add service route from Medford CBD to Hillcrest area via Jackson Street/Hillcrest. 7. White City - Add service route that travels between the White City s industrial and
residential areas. 8. Ashland - Add service route that travels from Tolman Creek Plaza to Railroad District via
East Main Street. 9. E. Central Point/N. Medford/White City - Add service route that travels from Rogue
Valley Mall to White City via Table Rock Road. 10. Express commuter service between Ashland and Medford, Medford and Central Point,
and Medford and White City. 11. Expand service to other cities such as Eagle Point.
All new routes would attempt to provide greater than the minimum level of service described in the sections on headways, service hours, and service days.
FFuunnddiinngg OOvveerrvviieeww
As discussed in the preface, the lack of a sufficiently-scaled long term funding base is one of the biggest obstacles to more extensive transit and TDM services. It is the number one priority as expressed by the RVMPO Policy Committee:
Policy 6.D-1 Local funding actions should be taken to ensure a long term stable operating and capital-funding basis for RVTD.
Without such a funding base, which could be achieved through a payroll tax or an increase in the property tax, most of the improvements that RVTD might pursue are not possible. A more detailed analysis of RVTD s forecast revenues and expenses is presented in Chapter 18, Financial Element.
Adding new communities to the service district is discussed from time to time, and will likely come with population growth such funds would provide a partial means of adding service from those communities to Medford and elsewhere in the RVMPO area. Unfortunately, simply adding new communities doesn t add enough funds from those jurisdictions to the RVTD tax roll to provide for new service. At best, if service was added in new locations it would have to be reduced somewhere else, given the current funding arrangements. Thus, such a step could not provide more coverage within the current service area.
A possibility is for more jurisdictions to follow the lead of the City of Ashland with respect to funding transit. Ashland provides $240,000 per year for added bus service beyond the basic service level it would otherwise receive. It also reduced the basic fare from .25 cents to free within the city limits. The purpose of Ashland s spending is primarily to reduce traffic and parking problems caused by having a large University within city limits and a large tourist influx. It is open to all users, however, and provides a valuable added level of connectivity for all city residents and visitors. The result for Ashland of this extra funding has been a tripling of ridership, an additional 80,000 trips per year within the city limits.

122
There has also been some discussion, both regionally and at state level, of the merits of combining school bus and general public transit services for greater efficiency and coverage. This idea could be explored further.
Grant-Seeking
While permanent long-term funding is needed to bring RVTD services to a level that will attract discretionary riders (as opposed to only the transit dependent), grant-seeking can assist for one-time and limited project funding. This exploration includes both public and private sector funding sources. One such example is the proposed Bus Buddy program, which has been very successful in other transit systems, using trained personnel to guide new bus riders through the process. It can pay for itself through increased ridership and revenues and shifting some more costly ADA paratransit trips to the less expensive fixed route. This is the main source of revenue for the program to pay for itself.
Grant-seeking on a larger and more general scale, however, is not an option that RVTD is willing to pursue. Past experience has shown that service expansions should be permanent, not limited in duration. When a grant expires and service is reduced back to prior levels, the communities blame RVTD, and not the funding expiration.
Operational Plans for Transit Service
Like the Street System Element, this Transit System Element presents a two-tiered approach. However, rather than presenting only a list of capital projects, the Transit System Element presents two operational plans with varying service levels - a financially-constrained Tier 1 plan, and a (Tier 2) financially-unconstrained plans.
The Tier 1, fundable ( financially constrained ) plan represents a modest increase in current service levels but which still falls far short of meeting the transit needs in the RVMPO. It is shown in Figures 11-1 and 11-2.
The Tier 2 (desirable but not currently fundable) plan would result in a significant expansion of current service levels, and represent a system that would better serve the needs of residents in the RVMPO.

123
FFiigguurree 1111--11 RRVVMMPPOO TTrraannssiitt SSyysstteemm PPrroojjeecctt LLiisstt FFFFYY 22000066--22000099
An extensive analysis of both Tier 1 and Tier 2 revenues and expenses is included in the Financial Element of the RTP (Chapter 18). Figure 11-2 shows the RVTD Tier 1 level of service, which consists of current operational levels. Minor increases in service occurred along three routes, starting in 2003. The improvements were made possible through the MPO allocation of STP funds for public transit services. Figure 11-3 shows the RVTD Tier 2 level of service, which provides a substantial expansion of routes as well as increased levels of operational service. (hours of operation, frequency of buses, etc.).

§̈¦5
tu140
tu62
tu4
Medford
Ashland
Central Point
Eagle Point
Talent
Phoenix
White City
Jacksonville
MAIN
FOO
THIL
L
HIGHWAY 140
PACIFIC
STAGE
TAB
LE R
OC
K
HIG
HWAY
62
PINEPH
OEN
IX
CR
ATER
LA
KE
SISKIYOU
8TH
BEALL
VILAS
BARNETT
ANTELOPE
STEWART
CENTRAL
RIVERSIDE
CO
LUM
BU
S
SAGE
KIN
GS
TALENT
FRONT
JACKSONVILLE
SHASTA
ASHLAND
BID
DLE
HIGHWAY 66
GARFIELD
5TH
HANLEY
WILSON
ROSSANLEY
HIGHWAY 234
ROGUE VALLEY
UPT
ON
HIGHWAY 99
CO
UR
T MCANDREWS
10TH
LITHIA
CALIFORNIA
HA
MR
ICK
APPLEGATE
LEA
R
COREY
LINN ROYAL
CEN
TER
STEVENS
VALL
EY V
IEW
FERN VALLEY
FREE
MA
N
HILTON
LEIGH
HILLCREST
PACIFIC
STAGE
STEVENS
MAIN
PACIFIC
HIGHWAY 140
CR
ATER
LA
KE
MAIN
MAIN
10TH
VALLEY VIEW
O0 1 2 3
Miles
Map created on April 12th, 2005
RVMPO 2005 REGIONAL TRANSPORTATION PLAN
L
E
G
E
N
D
Urban Growth Boundary
Water Features
Interstate
Highways
Streets
MPO Boundary
Tier 1 Transit Network (RVTD)
Transit Routes ROUTE
1
1dem
and 2 4 5 10 30 40 60
60de
mand
F i g u r e 1 1 - 2
126
1122.. LLAANNDD UUSSEE EELLEEMMEENNTT
IInnttrroodduuccttiioonn
Total metropolitan employment and population are essential factors determining travel demand in the Rogue Valley region. As indicated in The Forecast Demographics and Travel Demand Element, the population of the Rogue Valley metropolitan planning region is forecast to increase from 84,765 in 1995 to 135,930 in 2020. The regional employment is projected to increase from 50,301 in 1995 to 75,404 in 2025 (year was changed but not yet stats).
RReeggiioonnaall LLaanndd UUssee DDeevveellooppmmeenntt PPaatttteerrnnss
Policy 3-1 Local governments shall create a transportation system that clearly recognizes the connection between land use density and transportation efficiency.
In addition to developing specific TOD centers, cities are fostering increased densities by integrating land use and transportation. To promote this integration, the RVMPO adopted alternative measures, which received LCDC acknowledgment on April 3, 2002. The entire alternative measures document is in Appendix B, but several of the seven adopted measures emphasize the effect of the land use pattern on the transportation system:
Measure 2: Percentage of Dwelling Units within ¼-Mile Walking Distance of 30-Minute Transit
This measure is intended to demonstrate improvements in transit accessibility. A walking distance of ¼ mile from a dwelling is assumed to provide reasonable pedestrian access to a transit line. Only those transit lines that provide at least 30-minute service will be counted towards meeting the benchmarks and target shown in Table B-4. Progress on this measure would be tracked through GIS.
A GIS analysis of current tax lot, street, geographic and transit data was used to determine the percentage of dwelling units in the MPO that are within ¼-¼ mile walking distance to RVTD transit lines. The result of this effort is shown on a map included as Attachment A Existing and Future

127
Transit Service. The GIS analysis showed that 12% of dwelling units in the MPO are currently within ¼-¼ mile walking distance to 30-minute transit service.
Today, two of RVTD s transit lines provide 30-minute service, one provides 45-minute service, three provide 60-minute service, and one provides 90-minute service. During the 20-year planning period, all of these routes are planned to go to at least 30-minute service frequency with 15-minute service during the peak hours to routes serving TOD areas (assuming increased transit revenues). In addition, a large percentage of new development in the RVMPO area is planned to occur along existing or future transit lines. These changes are expected to result in an increase in the transit accessibility measure from 12% to 50% over the 20-year planning period. Table B-4 shows the 5-year benchmarks and 20-year target for the adopted measure.
FFiigguurree 1122--11 AAddoopptteedd 2200--YYeeaarr TTaarrggeett ffoorr TTrraannssiitt AAcccceessssiibbiilliittyy Measure How Measured 2000 2005 Benchmark
2010 Benchmark
2015 Target 2020
Measure 2: % Dwelling Units (DUs) w/in ¼ mile walk to 30-min. transit service
Determined through GIS mapping. Current estimates are that 12% of DUs are within ¼-¼ mile walking distance of RVTD transit routes.
12% 20% 30% 40% 50%
Measure 5: Percent of New Dwelling Units in Mixed Use/Pedestrian-Friendly Areas and Measure 6: Percent of New Employment in Mixed Use/Pedestrian-Friendly Areas
The objective of these measures is to demonstrate progress towards creating mixed use, pedestrian-friendly developments in the MPO. Progress towards meeting the benchmarks and targets for this measure would be determined by monitoring development after the appropriate land use and development regulations have been adopted. Mixed use, pedestrian-friendly development occurring within downtown areas in Medford, Central Point, and Phoenix, as well as within proposed TOD sites, would count towards meeting the benchmark and target figures shown below in Table B-8. The benchmarks and targets shown in the table represent the accumulated development occurring since year 2000.
FFiigguurree 1122--22 AAddoopptteedd 2200--YYeeaarr TTaarrggeettss ffoorr MMiixxeedd--UUssee PPeeddeessttrriiaann FFrriieennddllyy DDeevveellooppmmeenntt
Measure How Measured 2000 2005 Benchmark 2010
Benchmark 2015
Target 2020
Measure 5: % Mixed-use DUs i n new development
Determined by tracking building permits - the ratio between new DUs in TODs and total new DUs in the region.
0% 9% 26% 41% 49%
Measure 6: % Mixed-use employment in new development
Estimated from annual employment files from State
represents the ratio of new employment in TODs over total regional employment.
0% 9% 23% 36% 44%
Tables B-9 and B-10 show mixed-use housing (dwelling unit) and employment projections by RVMPO jurisdiction. Numbers shown in the tables represent the accumulated increase from year

128
2000 base year conditions. The unincorporated portion of Jackson County is not anticipated to include any mixed-use development during the planning period. Detailed population, employment, and housing information from the 2000-2020 RVMPO travel demand model was used to estimate the figures shown in these tables. Downtown and future TOD areas were analyzed for new dwelling units and employment. Agricultural and industrial employment was not included in the calculations due to the unlikelihood of these uses locating in either a downtown or a TOD.
FFiigguurree 1122--33 MMiixxeedd UUssee HHoouussiinngg PPrroojjeeccttiioonnss
RRVVMMPPOO JJuurriissddiiccttiioonnss
Jurisdiction Category 2005 2010 2015 2020 2020%
New DU (total) 1578 4126 5667 7581 Medford Mixed-Use DU 158 1238 2834 4604
61%
New DU (total) 555 1098 1715 2423 Central Point Mixed-Use DU 55 274 600 945
39%
New DU (total) 179 345 514 738 Phoenix Mixed-Use DU 18 103 180 302
41%
New DU (total) 386 638 930 1225 Jackson County Mixed-Use DU 0 0 0 0
0%
New DU (total) 2697 6206 8827 11967 MPO Total Mixed-Use DU 231 1616 3614 5851
49%
FFiigguurree 1122--44 MMiixxeedd UUssee EEmmppllooyymmeenntt PPrroojjeeccttiioonnss
RRVVMMPPOO JJuurriissddiiccttiioonnss Jurisdiction Category 2005 2010 2015 2020 2020%
New Emp (total) 3078 6156 9234 12312 Medford Mixed-Use Emp 308 1539 3694 5956
48%
New Emp (total) 405 811 1216 1622 Central Point Mixed-Use Emp 41 243 486 778
48%
New Emp (total) 165 330 495 660 Phoenix Mixed-Use Emp 8 50 99 173
26%
New Emp (total) 273 546 820 1093 Jackson County Mixed-Use Emp 0 0 0 0
0%
New Emp (total) 3922 7843 11765 15686 MPO Total Mixed-Use Emp 357 1832 4279 6907
44%
RVMPO Transit-Oriented/Mixed-Use, Pedestrian-Friendly Development12
Transit-oriented development (TOD) is a way to locate people near transit services while decreasing their dependency on automobiles. While sprawling development patterns necessitate use of automobiles for virtually every trip, TODs - through the creation of higher-density, mixed-use, pedestrian districts - increase the convenience of walking, bicycling, and transit and thereby reduce automobile dependency.
12 For the purposes of this proposal, the term TOD is used interchangeably with the Mixed-Use, Pedestrian Friendly Development term used in the Transportation Planning Rule (TPR).

129
In 1999, the RVMPO undertook a Transit-Oriented Design and Transit Corridor Development Strategies Study (TOD Study). The TOD Study outlined recommendations for ten TOD sites in Central Point, Medford, Phoenix, and White City (in unincorporated Jackson County). The study was intended to provide an alternative land use scenario that would bring the MPO into compliance with the TPR s VMT reduction requirement. Although modeling of the TOD Study s recommended land use patterns did not yield the TPR-mandated 5% reduction in VMT per capita, many of the Study s land use recommendations are being implemented.
In Appendix B, Figure B-1 provides an illustration of the TOD locations currently under consideration. The boundaries for the TOD areas shown in Figure B-1 correspond to transportation analysis zones (TAZs) used by the RVCOG model to estimate future population and employment. The boundaries are close approximations of planned TOD areas for purposes of estimating 20-year population and employment figures.
Ten candidate high-growth areas, previously identified in the 1995 RTP, were analyzed in the TOD Study. Of the original ten TOD sites, three are proceeding towards development, three are undergoing analysis and four have been removed from consideration. The three TOD sites closest to development are the Central Point TOD, the Medford SE Plan, and the Phoenix City Center Plan. The following is a brief summary of the current status of TOD development in the RVMPO.
Central Point TOD - Status
Central Point completed amendments to its official maps and implementing ordinances establishing a fully compliant TOD center in the northwest section of the city. Infrastructure needs, particularly transportation, have been thoroughly reviewed. Residential neighborhoods have been constructed in the southern half of the development, with public and commercial phases expected to be developed when a new rail crossing is completed.
Medford TOD Development - Status
The City of Medford has applied for a TGM grant to implement the four TOD sites under consideration within the City. These four sites include Downtown, Southeast, Delta Waters, and West Medford. The City is committed to TOD concepts, and is already working to implement its adopted Southeast Plan, a large development employing Smart Development principles.
Phoenix City Center TOD - Status
Phoenix has developed a mixed-use plan for the City Center area that incorporates TOD policies and standards consistent with the MPO s TOD Study. The TOD site includes much of the existing downtown area, and the City is committed to urban-centered, pedestrian-friendly growth. The City has conducted a marketing feasibility study for an independently prepared City Center Plan and will adopt amendments to its municipal code that foster transit-oriented development.
The MPO audited member jurisdiction planning documents in FY 2005 to recommend amendments that promote compliance with these measures.

130
Jacksonville North Fifth Street Gateway TOD Status
The City of Jacksonville adopted measures to enhance the northern entrance to the city, focusing on transportation and land use issues affecting a group of commercial properties, one of which is the site of a new senior housing complex. Ordinances, street design standards, development opportunities that support transit development, pedestrian-oriented environment, and multi-modal access were among the goals of the project. The plan recommended improvements to circulation and safety at the intersection of Shafer Lane and North Fifth Street, and included conceptual renderings for capital improvements showing sidewalk locations, walkways, crosswalk locations, lighting, potential entry sign designs, and other pedestrian amenities.
TTrraannssiitt--OOrriieenntteedd DDeessiiggnn ((TTOODD))
Policy 3-2 Local governments shall consider amending plan-use and/developments in urban areas to lower the vehicular demand on the regional transportation system. These plans will facilitate transit-oriented development (TOD) in current and future RTP designated TOD areas.
Transit-Oriented Design and Development (TOD) is a general description of a set of development strategies that are designed to encourage the use of public transit by creating an atmosphere that is safe, convenient, and easily accessible by foot, bicycle, and transit. One purpose of transit-oriented design is to increase ridership by shaping and intensifying land use through the integration of transit stops with other activities of the community such as banking and shopping. Transit Oriented Development (TOD) is a concept that promotes neighborhood livability and increased use of the transit system. A mix of residential, public, and commercial uses, a diverse range of dense housing types, and a pedestrian-oriented environment characterize TOD sites. This pattern is a departure from traditional zoning that separates residential and commercial uses.
Urban design strategies associated with transit-oriented development also encourage bicycle and walk travel modes. By reducing reliance on single-occupant vehicles, TOD improves air quality by reducing the number of vehicle trips. Another benefit of TOD is the promotion of economic development by attracting businesses and consumers to the area surrounding the transit stop. By encouraging mixed-use development, transit-oriented design strategies can also increase housing options.
In 1999, RVMPO undertook the Transit-Oriented Design and Transit Corridor Development Strategies Study (TOD Study). The intent of the TOD Study was to provide an alternative land use scenario that would bring the region into compliance with the Transportation Planning Rule (TPR) vehicle miles traveled (VMT) reduction requirements.
The TOD Study analyzed the nine candidate high-growth areas previously identified in the 1995 RTP. Through the TOD analysis, two of the potential TOD sites were dropped from further consideration due to TOD supportive housing densities that could not be achieved in the 20-year planning horizon. Because modeling analysis indicated that the alternative land use patterns identified in the TOD Study would not yield the TPR mandated 5% reduction in VMT per capita, the

131
RVMPO adopted, and the Land Conservation and Development Commission (LCDC) approved (December 2001), a set of alternative measures to the TPR s 5% VMT reduction requirement. These alternative measures include the implementation of six of the proposed TOD sites Central Point, West Medford, Downtown Medford, Delta Waters, SE Medford, and Phoenix. An in-depth description of the TOD Study is included in the August 1999, Transit Oriented Development and Transit Corridor Design Strategies Final Report.
Ten candidate high-growth areas, previously identified in the 1995 RTP, were analyzed in the TOD Study. Of the original ten TOD sites, three are being developed, three are undergoing analysis and four have been removed from consideration. The four active TOD sites are Downtown Medford, the Central Point TOD, the Medford SE Plan, and the Phoenix City Center Plan. Alternative measures approved by LCDC in December 2001 and the analysis developed for the RTP assume that the six TOD sites identified in the Cities of Central Point, Medford and Phoenix will be implemented by 2025 (year was changed but not yet stats). The following is a brief summary of the current status of TOD development in the RVMPO.
Central Point completed amendments to its official maps and implementing ordinances establishing a fully compliant TOD center in the northwest section of the city and along its main transportation corridors Infrastructure needs, particularly transportation, have been thoroughly reviewed. Residential neighborhoods have been constructed in the southern half of the development, with public and commercial phases expected to be developed when a new rail crossing is completed.
The City of Medford applied for a TGM grant to implement the four TOD sites under consideration within the City. These four sites include Downtown, Southeast, Delta Waters, and West Medford. The City is committed to TOD concepts, and is already working to implement its adopted Southeast Plan, a large development employing Smart Development principles.
Phoenix has developed a mixed-use plan for the City Center area that incorporates TOD policies and standards consistent with the MPO s TOD Study. The TOD site includes much of the existing downtown area, and the City is committed to urban-centered, pedestrian-friendly growth. The City has conducted a marketing feasibility study for an independently prepared City Center Plan and will adopt amendments to its municipal code that foster transit -oriented development.
OOtthheerr UUrrbbaann DDeessiiggnn CCoonnssiiddeerraattiioonnss
Policy 1-3 Local governments shall utilize the opportunity created by the development of transportation facilities in urban areas, to provide landscaping designs, suitable plantings, and other amenities, such as street trees and furniture, to enhance the user s experience and encourage people to walk.
Smart development concepts help make streets attractive, convenient, and safe for pedestrians, cyclists, and motorists. Landscaping, including street trees where appropriate, public art, and places for people to congregate all contribute to the desirability of a neighborhood or commercial center. These concepts increasingly are being incorporated into communities comprehensive plans and zoning regulations.

132
PPrrootteeccttiioonn ooff TTrraannssppoorrttaattiioonn CCoorrrriiddoorrss
Policy 3-3 Local governments, and ODOT where appropriate, shall plan for the protection of corridors for transportation purposes. The Regional Transportation Plan shall explore usage of non-road linear corridors for bicycle, equestrian, and pedestrian paths.
The preservation of corridors may prove to have significant financial benefits for local agencies. By identifying needed corridors for streets, bicycle/pedestrian ways, transit corridors, railroad corridors, and other uses, agencies may be able to avoid development on or loss of access to these corridors. This saves the expense of having to compensate landowners for the value of these developments when the right of way is needed for transportation. Regional corridors also merit protection, particularly in areas likely to urbanize during the planning period. The Regional Problem Solving effort, coordinated by RVCOG, identified existing corridors to be upgraded to urban standards and new connections to accommodate urban levels of development. When enacting ordinances or making plan changes, agencies must comply with applicable laws regarding property rights and may incur financial obligations as a result.
Separated multi-use bike/pedestrian paths are safest if they do not cross local streets at grade. Creating underpasses or overpasses for multi-use paths is very expensive. Typically, multi-use paths are only practical along barriers such as lakes, rivers, cliffs, or airports. Local governments should develop policies to preserve barrier edges for use as multi-use paths.
LLooccaall SSttrreeeett CCoonnnneeccttiivviittyy
Policy 3-4 Local governments shall discourage cul-de-sac or dead-end street designs whenever an interconnection alternative exists. Development of a street pattern shall be encouraged that connects new and existing neighborhoods during land divisions, and any approved cul-de-sacs shall be designed to provide pedestrian and bicycle connectivity among neighborhoods.
Poor connections between people and destinations often result in longer trip lengths and more vehicle miles traveled. Cars must travel farther to reach a destination that has no direct route from their point of origin. In addition, poor connectivity makes travel by alternative modes difficult or impossible, since longer trip lengths making biking and walking impractical.
TTrraaffffiicc CCaallmmiinngg
Where appropriate, local governments should consider the use of traffic calming techniques and reduced street widths to minimize negative impacts of traffic on neighborhoods. Traffic calming is a strategy that can improve livability in residential neighborhoods, by reducing motor vehicle speeds, traffic hazards, and noise. Some traffic calming strategies include traffic circles, speed bumps, street trees, road surface modifications, and narrowing of residential streets. While designed primarily for pedestrian safety, sidewalk bump-outs at downtown street intersections also have a traffic calming function.

133
1133.. AAIIRR TTRRAANNSSPPOORRTTAATTIIOONN
EELLEEMMEENNTT
IInnttrroodduuccttiioonn
This chapter addresses activities, issues and needs at the region s airports, dominated by Rogue Valley International-Medford airport but also including Ashland Municipal Airport. In addition there are 16 private / private-but-public-use airfields and helipads in Jackson County, including six within the RVMPO boundary, as shown in Figure 13-1. The focus of the chapter is both passenger and freight activities; air freight is also touched on briefly in the Freight Transportation Element Chapter 15 of this Plan.
RRoollee ooff AAiirrppoorrttss iinn tthhee RReeggiioonnaall TTrraannssppoorrttaattiioonn // DDeevveellooppmmeenntt PPllaann
While airports are funded independently from other public transportation (primarily through the Aviation Trust Fund and other user fees), they are relevant to the regional transportation system from the standpoint of:
Air access within and more importantly, beyond the region, connecting business and social travelers to the wider world;
A growing air freight / cargo industry that can play a modest role in the regions economy, especially the new economy;
Ground access and congestion for airport users; and
The interface between airports and their communities from the standpoint of compatible land use and aviation noise impacts.

p
Ðf
p
Ðf
Ðf
Ðf
Ðf
p
§̈¦5
§̈¦5
tu238
tu140
tu66
tu62
tu234
Medford
Ashland
Central Point
Eagle Point
Talent
Phoenix
White City
Jacksonville
Gold Hill
Butte Falls
Medford International Airport
Ashland Municipal Airport
Burrill Airport
Timberland Shop
Erickson Heliport
Croman Helipad
Rogue Valley Medical Center
Providence Medford Medical Center
AGAT
E
TAB
LE R
OC
K
VILAS
FOO
THI L
L
MEA
DO
WS
MAIN
STAGE
ANTELOPE
BLACKWELL
CR
ATER
LA
KE
BEALL
BUTTE FALLS
KIR
TLA
ND
PHO
ENIX
PINE
B
OLD STAGE
COREY
AVENUE G
TALENT
CO
LVER
BARNETT
A
8TH
STEWART
HILLCREST
BROWNSBORO
JACKSON
HOLLY
RO
GU
E RIVER
HA
NLE
Y
MO
UN
TAIN
SAGE
UPT
ON
KIN
GS
3RD
SHASTA
WAGNER CREEK
TAYLOR
RILEY
SISKIYOU
CHERRY
ROSS
VALLEY VIEW
AR
NO
L D
EAGLE MILL
GARFIELD
ROSE
ALTA VISTA
LINN
TRESHAM
GREGORY
D
WILSON
GIBBON
WA
LKER
JACKSONVILLE
GR
AN
T
RAPP
PIONEER
OA
K
DELTA WATERS
HU
LL
LOZI
ER
PENINGER
F
SCEN
IC
LONE PINEPOPL
AR
HA
MR
ICK
FISH LAKE
IOWA
GR
IFFI
N C
REE
K
MCANDREWS
CLA
Y
ATLA
NTI
C2ND
VOO
RH
IES
CEDAR LINKS
KER
SHAW
CRYSTAL
FOSS
PAR
K
MERRIM
AN
GRANITE PIT
CROWSON
HOPKINS
BARTON
TOLM
AN
CR
EEK
LAU
REL
NUTLEY
LEIGH
GR
AN
T
3RD
STAGE
MAIN
OLD
STA
GE
OLD STAG
E
BUTTE FALLS
O0 1 2 3 4
Miles
Map created on January 20th, 2005
RVMPO 2005 REGIONAL TRANSPORTATION PLAN
L
E
G
E
N
D
Urban Growth Boundary
Water Features
Interstate
Highways
Streets
MPO Boundary
Airport System
p Airport
Ðf Heliport
Airport Property
F i g u r e 1 3 - 1
135
BBaacckkggrroouunndd
In the century since the Wright brothers historic first powered flight at Kittyhawk, aviation has shifted from being the realm of entrepreneurs and enthusiasts pursuing a new but disparate obsession, to being a highly developed and regulated major industry with major impacts on the US economy, and indeed, its entire way of life. Coast to coast travel before (jet) airline service was a three-day affair, and now is matter of five to six hours. This has changed our entire way of life in the past 100 years.
While airline aviation is the element with which most of the public is familiar, airlines own less than 10 percent of the civil aircraft fleet and fly into fewer than ten percent of the public use airports in the country. General aviation is extremely important for various types of aerial application, from construction to forestry to photography to fire control, as well as being a major regional and national private transportation system, carrying private pilots and businesspeople to destinations for work and recreation every day of the week.
Airport planning in this regulated and highly prioritized industry is conducted at three levels
individual airports do Master Plans and Airport Layout Plans under Federal Aviation Administration (FAA) guidance that address their 20-year future. States do airport system planning by establishing a hierarchy of public use airports within the state, setting priorities for investment and management based on an array of goals and policies. The federal government through the FAA not only regulates the airport system, but also manages the en route air traffic control centers, and the en route and airport-specific navigational aids and air traffic control towers, so FAA does its own airport-related planning through (among other documents) the National Plan of Integrated Airport Systems (NPIAS) in order to set its own funding and management priorities.
Suffice it to say, with these various actors performing regular aviation planning, the regional level of government, as characterized by MPOs, does not routinely perform its own independent aviation planning. It may from time to time do special studies and performs planning relating to integration of aviation with other modes and protection of the aviation system. This chapter therefore draws heavily from the State Aviation System Plan and the Rogue Valley International-Medford and Ashland Airport Master Plans.
PPoolliiccyy CCoonntteexxtt
The region does not set aviation-specific guiding principles but includes airports in its goals and policies as described in Chapter 3 of this Plan. The individual airports have their own policies, goals and objectives and are also guided by these nine state aviation goals:
Preserve investment in Oregon s system of airports and its level of service.
Protect airports from incompatible land uses.
Maintain Oregon s public-use airports so that they are safe, and ensure that the airport system can fulfill its role in the state s emergency response system.
Support economic development by providing access to regional, state, national, and international markets.

136
Provide access to the air transportation system and its connections with other modes for people and freight throughout the state.
Comply with state and federal environmental protection requirements.
Support efforts to ensure sufficient system capacity and airport modernization.
Seek adequate and stable statewide funding to preserve system airports.
Provide advocacy and technical assistance (from the State Aviation Department) for airports and their users.
In the post-9/11 world, a goal about aviation security would also be appropriate and no doubt will be added in the next state plan.
IInnvveennttoorryy
There are two publicly owned airports in the MPO region, as well as a number of privately owned landing fields and helipads, some of which are open to public use. Figure 13-2 shows these facilities by owner, shop, and type. Rogue Valley International-Medford is one of eight County-owned airports in the state. Some 30, including this region s Ashland Municipal Airport Sumner Parker Field are City-owned. Both of the region s airports are of national significance and are included in the National Plan of Integrated Airport Systems (NPIAS). The Medford airport is classified by the State and FAA as a non-hub air carrier facility, and the Ashland Airport as Community General Aviation airport in the State system, defined as serving more than 10 based aircraft and 2,500 annual operations. An operation is a landing or a takeoff.
Rogue Valley International-Medford
The Rogue Valley International-Medford, located north and east of I-5, on Biddle Road between Crater Lake Highway and Table Rock Road, is the region s only air carrier airport, serving the Rogue Valley. The airport staff includes management, fire fighting and rescue, maintenance of the airfield and all support services.
Non-stop passenger service is to nine destinations, as shown in Figure 13-3 below, with approximately 28 departing flights daily. Passenger carriers include United Airlines, United Express (operated by Skywest Airlines), Horizon Air, Delta, and America West Airlines.

137
FFiigguurree 1133--22 PPuubblliicc aanndd PPrriivvaattee AAiirrffiieellddss iinn tthhee RRVVMMPPOO
OWNER AGENCY NAME TYPE AVAILABLE
Jackson County Jackson County Medford International Airport Airport Public Erickson Air-Crane Co, LLC Erickson Air-Crane Co, LLC Erickson Heliport Heliport
Private
Eugene F Burrill Lumber Co Eugene F Burrill Lumber Co Burrill Airport Airport Private Sisters Of Providence In Oregon
Sisters Of Providence In Oregon
Providence Medford Medical Center
Heliport
Private
Rogue Valley Medical Center Rogue Valley Medical Center Rogue Valley Medical Center Heliport
Private
Croman Corp Croman Corp Croman Helipad Heliport
Private
Ferreira Ferriera Timberland Shop Heliport
Private City Of Ashland City Of Ashland Ashland Municipal Airport Airport Public
FFiigguurree 1133--33 NNoonn--SSttoopp AAiirrlliinnee DDeessttiinnaattiioonnss oouutt ooff MMeeddffoorrdd1133
AIRLINE DESTINATION # FLIGHTS/DAY
Las Vegas 1 America West Phoenix 2 Los Angeles 2 Eugene 2 Portland 5
Horizon
Seattle 3 Portland 5 Denver 1
United Express
San Francisco 7 Delta Salt Lake City 2
TOTAL 30
13 Source: Telephone calls to airline reservation agents, Nov 11, 2004.

138
FFiigguurree 1133--44 RRoogguuee VVaalllleeyy IInntteerrnnaattiioonnaall
MMeeddffoorrdd AAiirrppoorrtt OOppeerraattiioonnss DDaattaa 11999999
22000044
YEAR AIR CARRIER AIR TAXI GENERAL AVIATION
MIL TOTAL ITINERANT
CIVIL MIL TOTAL LOCAL
TOTAL OPS
2004* 1,445 18,337 19,868 302 39,952 11,672 64 11,736 51,688
2003 1,688 20,722 23,118 146 45,674 17,178 208 17,386 63,060
2002 2,386 17,196 22,756 291 42,629 18,364 240 18,604 61,233
2001 2,113 18,195 24,100 286 44,694 17,380 183 17,563 62,257
2000 2,509 19,203 24,181 368 46,261 20,901 96 20,997 67,258
1999 16,724 25,648 350 45,001 25,862 442 26,304 71,305 71,305
Source: Airport Monthly Statistics * Through October 31
FFiigguurree 1133--55 RRoogguuee VVaalllleeyy IInntteerrnnaattiioonnaall
MMeeddffoorrdd AAiirrppoorrtt MMaaiill aanndd FFrreeiigghhtt DDaattaa 11999999
22000044 Year Mail Freight
ON OFF TOTAL ON OFF TOTAL 2004* 0 1,235 1,235 2,996,928 4,013,278 7,010,206 2003 47,463 16,883 64,346 2,970,042 3,982,865 6,952,907 2002 519,062 31,093 550,155 3,191,520 4,027,595 7,219,115 2001 393,454 60,967 454,421 3,062,367 3,848,590 6,910,957 2000 588,735 51,110 639,845 3,584,127 5,908,274 9,492,401 1999 576,907 42,511 619,418 331,624 634,978 966,602 * Through November

139
As shown in Figure 13-4, airline landings and takeoffs, including freight operations, numbered 1,688 in 2003. There were 20,722 air taxi operations. Some 233,077 departing passengers were enplaned, with a slightly larger number deplaning. Enplaned passengers are climbing again after the drop in activity that was seen by airlines nationwide after 9/11/01.
Air freight and cargo operators play an important role and include Ameriflight, Empire Air (a subcontractor for Federal Express), Air Pac Airlines, Sky Way Airlines, and Aeroflight. Their operations are included in the air carrier total. Some 2.9 million tons of air freight and cargo were boarded, and 3.9m tons deplaned in 2003. Figure 13-5 shows mail and freight by year.
Commodity flow data are available for 1997 (and may soon be available for 2000). In 1997, freight valued at $17 million was moved into or out of the region by air. Two thirds of this was outbound. Air freight was characterized in 1997, as might be expected, by high-value, low-weight commodities whose value per ton was seven times the overall rate. Machinery was the leading commodity group transported by air, comprising 28% of air freight tonnage and 35% of its value. Electrical, transportation, photo and optical equipment and instruments summed to 17% of air freight tonnage and 55% of its value. Together these commodities represented nearly half of air freight tonnage (45%) and a decisive majority of air freight value (90%).
FFiigguurree 1133--66 VVaalluuee ppeerr TToonn bbyy FFrreeiigghhtt MMooddee,, RRoogguuee VVaalllleeyy,, 11999977
Total Commodity Value per TonComparison of Modes (1997)
$1,300 $1,315$714
$9,077
$0
$2,000
$4,000
$6,000
$8,000
$10,000
All Modes Truck Rail Air
Source: Cambridge Systematic / Rebecca Reid Consulting

140
FFiigguurree 1133--77 IInnbboouunndd aanndd OOuuttbboouunndd AAiirr FFrreeiigghhtt,, RRoogguuee VVaalllleeyy,, 11999977
Source: Cambridge Systematics / Rebecca Reid Consulting
General aviation activities at Rogue Valley International-Medford include about 160 based aircraft, both business and private. GA operations totaled 23,118 in 2003.
The airport has two runways, the longer of which was expanded a few years ago to its current 8,800 feet. It has three landside zones passenger terminal, air cargo area and general aviation areas, as well as a site designated for US Customs and Immigration (currently inactive).
The airport has 1,000 acres, of which approximately 200 are in use and 200 could be developed. Some 600 acres are unavailable for use, due to FAA-mandated building setbacks and / or wetlands.
Ashland Municipal Airport
Ashland s airport serves business and personal general aviation14. It has about 15,000 annual operations, although this is an estimate since non-towered airports do not have any regular method of counting operations. Oregon was a leader in developing the RENS airport activity counter, a simple piece of equipment that marries a rubber hose traffic counter to a tape recorder so that aircraft operations trigger the counter and identify the type of aircraft by its noise signature. RENS counts at Ashland have been as high as 20,000 operations, but since a single runway such as Ashland s has a capacity for about 100,000 annual operations, the precise number of operations is not material from a system planning standpoint.
Ashland has a 3,603-foot long primary runway that can serve most, if not all, small aircraft up to 15,000 pounds gross landing weight and some small business jets. It has the usual array of lighting and navigational guidance systems for Visual Flight Rules operations, but no instrument operations capability, plus limited potential to acquire this (due to terrain and other factors). Nevertheless, because it is less fog-bound than Medford, it sometimes serves as an alternate airport for cargo operators.
14 A catch-all term meaning any aviation that s not military or airline.
Air Commodity Tonnage & Value
Medford-Ashland Metro Area (1997)
Outbound
69% Tonnage
(64% Value)
Inbound
31% Tonnage
(36% Value)
141
Ashland has about 83 based aircraft according to its Airport Layout Plan Update, in progress in fall 2004. These are housed in closed hangars, open hangars and tiedowns.
The airport has 94 acres, with about 60 acres of its area available for additional development. However, some of this land, about 20 acres, is sloping so taxiway / runway access would require significant earth moving.
As the airport has become busier, the main entrance is becoming unsafe due to turning traffic and it has been suggested improvements may soon be needed at this location on Hwy 66.
Forecasts
The Oregon State Aviation System Plan discusses five trends that will cause growth in aviation activity in the state, and these trends are all apparent in the Rogue Valley:
Migration to Oregon;
Growth in high-tech and export-oriented industries;
Growth in tourism;
Increase in air travel by general population; and
Increase in number of retirees with high discretionary incomes.
According to the most recent Rogue Valley International Medford Airport Master Plan Update, passenger enplanements are forecast to increase substantially from the current level of approximately 230,000 . Future enplanements and operations are shown below in Figure 13-8. Air freight and general aviation are also forecast to increase significantly, as shown in the Figure.

142
FFiigguurree 1133--88 MMeeddffoorrdd AAiirrppoorrtt FFoorreeccaassttss
Actual Forecasts 1998 2005 2010 2020
Passenger Enplanements 218,593 260,000 300,000 380,000
Annual Operations Passenger Airlines 14,664 18,120 19,100 21,900 General Aviation Total 51,523 56,000 60,000 69,000
Itinerant 26,133 28,000 30,000 34,500 Local 25,390 28,000 30,000 34,500
Misc. Air Taxi 3,466 4,000 4,500 5,500 Military Total 564 575 575 575
Itinerant 340 375 375 375 Local 224 200 200 200
Total Airport Operations 70,217 78,695 84,175 96,975
Air Freight and Air Mail (pounds) Freight On 3,397,785 4,980,000 6,540,000 11,280,000 Freight Off 4,362,396 6,390,000 8,390,000 14,470,000 Air Mail On 678,770 864,000 1,026,000 1,450,000 Air Mail Off 27,569 35,000 42,000 59,000
Based Aircraft (Civilian) Total Aircraft 150 160 168 184 Single-Engine 124 128 129 132 Multi-Engine 15 17 20 25 Jet 7 9 11 15 Helicopter 4 6 8 12 Source: Rogue Valley International Medford Airport Master Plan, Coffman Associates / David Evans/ Lee McPheters. 2001.
These forecasts of airport characteristics were accounted for in developing the multi-modal RTP. Both the airline passenger traffic forecasts and employment were taken account of at the airport and the surrounding zones. These employment assumptions are critical inputs into the regional traffic model. The employment assumptions led directly to increased traffic volumes on the airport access road and all the roadways leading to the airport and the Foreign Trade Zone. The roadway traffic increases caused by forecast airport and FTZ activity includes both trips inbound and outbound from the airport and includes destinations in the Rogue Valley region as well as all of southern Oregon.

143
FFiigguurree 1133--99 AAsshhllaanndd MMuunniicciippaall AAiirrppoorrtt ddrraafftt ffoorreeccaassttss
Base Year 2003/04
2009 2014 2019 2024
2004 ALP Forecast (Preferred) Based Aircraft Single Engine 79 91 96 104 110 Multi Engine Piston/Turbine 5 7 7 7 8 Helicopter 2 2 2 2 3 Other (ultralights, etc.) 3 3 4 4 4 Total 89 103 109 117 125 Aircraft Operations Local (15%) 3,130 3,630 3,840 4,125 4,400 Itinerant (85%) 17,748 20,575 21,775 23,370 24,975 Average Operations per Based Aircraft
235 235 235 235 235
Operations by Critical Aircraft B-1 (piston/turbine twin)
1,250 1,450 1,540 1,650 1,750
FAA TAF Based Aircraft Single Engine 79 84 87 91 92 Multi-Engine 5 6 7 8 9 Jet 0 0 0 0 0 Helicopter 2 2 2 2 2 Other 3 3 3 3 3 Total 89 95 99 104 105 Aircraft Operations Local 2,156 2,156 2,156 2,156 2,156 Itinerant 1,527 19,345 20,027 20,709 20,846 Total 20,683 21,501 22,183 22,865 23,002 Average Operations per Based Aircraft
232 226 224 220 217
Source: Century West Engineering, Aron Faegre & Associates, Gazeley & Associates
Note that the development of very light jet aircraft coming into production in 2-3 years could increase the mix of small personal jets and that, also, helicopter activity is growing in the region. The forecasts for both airports should be revisited at frequent intervals to ensure reflection of these and other emerging trends.
Airport Economic Contribution
The Rogue Valley International-Medford Airport already provides substantial economic benefit to the region, both through providing connectivity to the rest of the country and through the spending it brings to the region. The 2001 Airport Master Plan included a survey to address part of this issue. Its findings are shown in Figure 13-10, below:
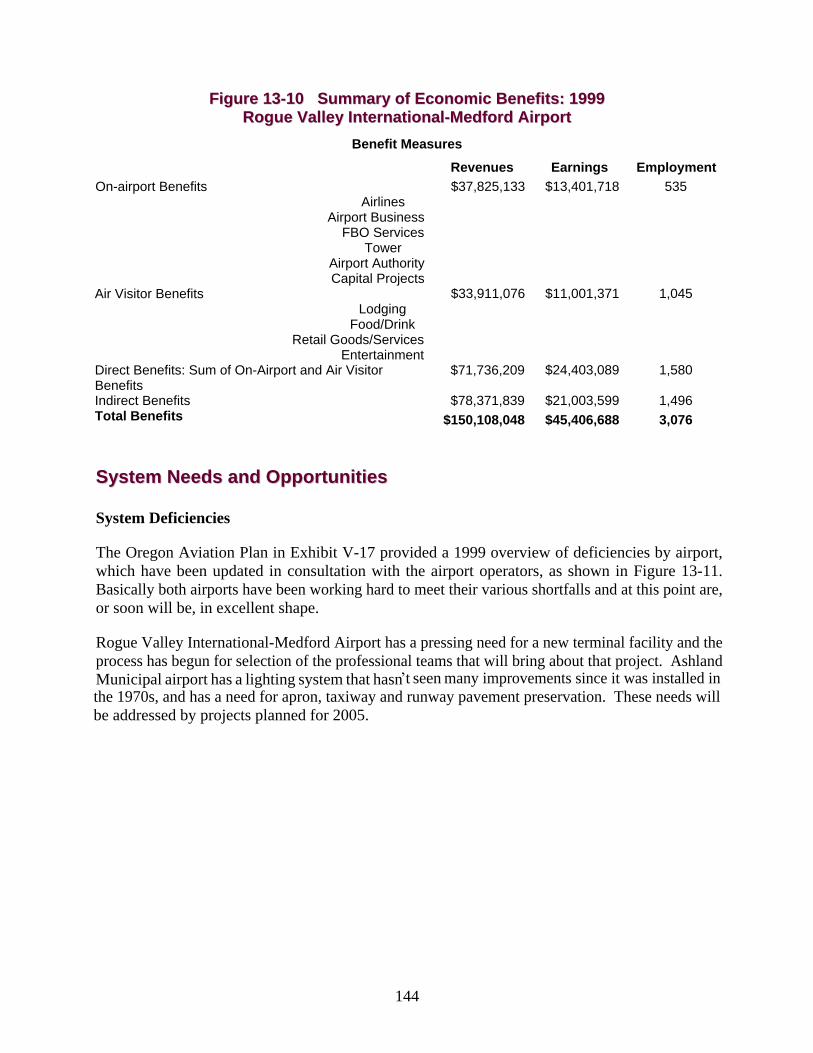
144
FFiigguurree 1133--1100 SSuummmmaarryy ooff EEccoonnoommiicc BBeenneeffiittss:: 11999999 RRoogguuee VVaalllleeyy IInntteerrnnaattiioonnaall--MMeeddffoorrdd AAiirrppoorrtt
Benefit Measures
Revenues Earnings Employment On-airport Benefits
Airlines Airport Business
FBO Services Tower
Airport Authority Capital Projects
$37,825,133
$13,401,718
535
Air Visitor Benefits Lodging
Food/Drink Retail Goods/Services
Entertainment
$33,911,076
$11,001,371
1,045
Direct Benefits: Sum of On-Airport and Air Visitor Benefits
$71,736,209
$24,403,089
1,580
Indirect Benefits $78,371,839
$21,003,599
1,496 Total Benefits $150,108,048
$45,406,688
3,076
SSyysstteemm NNeeeeddss aanndd OOppppoorrttuunniittiieess
System Deficiencies
The Oregon Aviation Plan in Exhibit V-17 provided a 1999 overview of deficiencies by airport, which have been updated in consultation with the airport operators, as shown in Figure 13-11. Basically both airports have been working hard to meet their various shortfalls and at this point are, or soon will be, in excellent shape.
Rogue Valley International-Medford Airport has a pressing need for a new terminal facility and the process has begun for selection of the professional teams that will bring about that project. Ashland Municipal airport has a lighting system that hasn t seen many improvements since it was installed in the 1970s, and has a need for apron, taxiway and runway pavement preservation. These needs will be addressed by projects planned for 2005.

145
FFiigguurree 1133--1111 OODDOOTT 11999999 RRoogguuee VVaalllleeyy AAiirrppoorrttss DDeeffiicciieennccyy SSuummmmaarryy,, UUppddaatteedd
TYPE OF FACILITY MEDFORD ASHLAND
Primary Runway Length/ Width Now adequate Adequate Rwy Pavement Strength Adequate Adequate Taxiway Access Now adequate Adequate Runway Lighting Adequate Taxiway Lighting Adequate
Will be addressed in 2005
Visual Guidance Indicator (VGI) Now adequate Adequate REILS15 Now adequate Approach Lighting Adequate Instrument Approach Adequate
Terrain renders improvements difficult
24-hour Weather Adequate Not required Aviation Services Adequate Adequate Airfield Capacity Adequate Adequate Runway Safety Area Adequate Runway Object-Free Area Adequate Runway Protection Zones Now adequate
Now adequate
Parallel Taxiway Separation Adequate Adequate Source: Oregon Aviation Plan /RVCOG
Economic Development Opportunities
FTZ: The airport s Foreign Trade Zone (FTZ) was designed to help the airport develop to its fullest potential and boost the local economy in the southern Oregon region. The FTZ on its inception was projected to boost employment in the immediate vicinity of the airport and to produce an annual increase in revenue of more than $3 million. Those who work in the FTZ were expected to live throughout the region, as do workers at the Rogue Valley Mall or any other employer in the region. Yet, this potential has not yet been fulfilled because the advent of NAFTA removed the competitive advantage of FTZs.
Since the Rogue Valley International Medford Airport has major potential for expanded air cargo and airport industrial park activity, it can become an instrument in aiding the region to broaden its economic base, supporting high tech industry and high paying / family wage jobs, as the Oregon Aviation Plan notes. This potential is as yet largely unrealized and if the focus is domestic markets, does not require an FTZ for its success.
Ground Access is another regional issue. While the 2005 forecast of 260,000 passenger enplanements and a matching number of deplanements translates into only 1,425 passengers on an average day, this is beginning to be quite significant in terms of auto access to the airport. The size of the average travel party is not known; we assume it to be 1.5 people (since so many travelers are making solo trips). Thus, 1,425 passengers translates into 950 departing and arriving travel groups per day. When the travel group is dropped off and picked up, this creates four ground trips per travel group. We assume half the air trips or 475 travel groups involve being picked up and dropped off by a taxi, van service or family member, while the other 475 either self-park or use rental cars. The total daily airport trips not even including 500-600 employee commuting round-trips16 is 2,375 (475
15 Runway End Lighting System 16 The 2001 Master Plan indicated 535 employees at the airport.

146
self parking and rental car using travel groups + 1,900 travel group trips being dropped off and picked up). The ground travel picture is summed up in Figure 13-12:
FFiigguurree 1133--1122 RRoogguuee VVaalllleeyy IInntteerrnnaattiioonnaall--MMeeddffoorrdd GGrroouunndd AAcccceessss RReeqquuiirreemmeennttss,, 22000055
TRIP TYPE INBOUND DAILY AUTO TRIPS
OUTBOUND DAILY AUTO
TRIPS
TOTAL DAILY AUTO TRIPS
Travel groups being dropped off 950 950 1,900 Travel groups self-parking or using rental cars
237.5 237.5 475
Commute trips 600 600 1,200 Air cargo trips NA NA NA General aviation trips NA NA NA
TOTAL 1,787.5 1,787.5 3,575+ Source: RVCOG
The ground access crunch is apparent from the airport s provision of several overflow parking lots to serve peak periods of auto accumulation. Bus access is limited to the airport, being a request stop only. Transit access tends not to be the mode of choice for any airport travel, because of luggage.
Air cargo / air freight are growing rapidly, and although only a small percentage of the region s freight is handled by air, it has its own unique impacts on the highways system. Most freight operators (UPS, DHL and FedEx, for example) transport the unsorted incoming packages to a warehouse location, from which product is sorted into different van routes and distributed around the region. The same vans make pickups and return outbound materials to the warehouse for sorting by flight and delivery back to the airport. Thus each packet is carried by two different vehicles. The small local delivery vans used by such carriers as UPS and FedEx are a model for the region, as they are able to access tight downtown streets without the difficulty encountered by some of the major trucking companies. The warehouse sort and transfer function is necessary because the commodity arrives by air, but more sorting and transfer to smaller vans by highway carriers would also greatly benefit the region.
PPoolliiccyy IIssssuueess aanndd AAccttiioonnss
Key regional policy issues for Rogue Valley International-Medford Airport include:
As air freight activity and the airport industrial park areas develop, what improved links for trucks are needed to the regional transportation system? What road access is needed to access the land east of the runway?
How can the airport play a greater role in the economy, for example by becoming a greater catalyst for growth in family wage jobs in the region?
How can the airport solve its current and likely future ground access / parking congestion Can it take advantage of the RVTD Transportation Demand Management and Transportation Management Association services (see Chapter 6, of this Plan, Transportation Demand Management) to reduce its parking and ground access crunch times, without undue loss of anticipated parking revenues? And how can this assistance

147
particularly be used during the upcoming terminal reconstruction phase, when land now in use for overflow parking may be needed for construction staging?
What is the airport doing to address heightened security and should more be done? (see Chapter 17 of this Plan, Transportation Security); and
How can the airport ensure that encroachment of incompatible land uses into its noise-sensitive environs does not occur?
FFaacciilliittyy RReeqquuiirreemmeennttss
Rogue Valley International-Medford Airport has announced plans for a new terminal, as well as a new control tower. The airport is in the process of selecting a design team, with construction beginning as quickly as possible and continuing for about 5 years. The original hope was for the final phases to be completed in approximately 2009, but this may be extended because of more complex procurement requirements. This will be Jackson County s largest-ever project undertaken.
Other requirements pale beside this major undertaking but include security upgrades and pavement maintenance programs.
Ashland airport has not completed its facility requirements analysis but is not likely to pursue radical changes in the airport s role, opting rather for modest landside development and for maintenance of existing pavement. Existing services will be expanded, and the landside available area will be developed to serve local businesses with an aviation need. The airport will stay under 15,000 Gross Landing Weight and will not be planned to accommodate large jets.
EEnnvviirroonnmmeennttaall PPllaannss
The State Aviation Plan provides several charts assessing airport status with regard to environmental and other issues. The protection of the region s
and the nation s airports from encroachment by incompatible uses cannot be overemphasized as a needed strategy Nationwide it is one of the single biggest causes of airport closure. Airport noise on the ground is deemed the purview of the airport operator /owner, but once an aircraft is airborne, all aspects of its operation rest with FAA. FAA has been a leader in the development of requirements for quieter aircraft, yet has no regulatory requirements for quieter flight operations. Local land use is usually not the purview of the airport operator but of other neighboring jurisdictions and agencies. Even where the agency is the same, different departments within that agency may see different priorities and goals
economic development, use of developable land for housing, vs. protection of a swath in the airport s noise path. If nobody lives in the noise-affected areas around an airport, there are unlikely to be noise complaints. Unfortunately, since an airport requires one half to two miles of wide, flat land for its runways, and freedom from obstructions in its approaches, as well as proximity to its market base, airports tend to want to locate
and indeed, have been sited over the past century, on prime developable lands. These land requirements, coupled with the patchwork quilt of noise regulations, means that nationwide the stage is set for airport / community problems.
That said, both the Medford and Ashland airports have been fortunate thus far in avoiding many noise complaints. Neither currently sees noise problems as a hindrance to operations or to their modest growth plans. The runway at Medford was able to expand without major objections about

148
noise; this is a most unusual achievement compared with similar situations around the country. Protecting the land use development around each airport is key to protecting each s long-term role. Fortunately, the state of Oregon is a national leader on this issue and has developed some creative tools. Both airports conduct reviews of proposed developments within the approach path zones and seek noise waivers or avigation easements from such projects if they proceed.
The Oregon Aviation Plan in Exhibit V-18, updated here as Figure 13-13, provides an assessment that is summarized here for Medford and Ashland:
FFIIGGUURREE 1133--1133 OODDOOTT 11999999 AAiirrppoorrtt NNeeiigghhbboorrhhoooodd DDeeffiicciieenncciieess,, UUppddaatteedd TYPE OF DEFICIENCY MEDFORD ASHLAND
Overlay Zoning Deficiency Now adequate Adequate 55 DNL Contour off Airport adequate Adequate Incompatible Land Uses Nearby Now adequate Adequate Water Impoundments Near Airport Continuing Continuing Open Land Fills Near Airport Now adequate Now adequate Bird Migratory Areas Near Airport continuing Now adequate
Source: Oregon Aviation Plan /RVCOG
PPrrooggrraamm CCoossttss aanndd TTiimmiinngg
The individual airport master plans and supporting documents set forth their capital improvement programs. Aviation projects are funded primarily through the Aviation Trust Fund, which collects a passenger ticket tax as well as taxes on aviation fuel, tires, and other items. This Trust Fund is a means of cross-subsidy between the commercial airline / air carrier airports and the smaller, less financially viable general aviation airports. In addition, individual air carrier airports are permitted to levy their own Passenger Facility Charges (PFCs) which enable them to address their more substantial needs.
The air carrier airports of the nation are generally self-sustaining for both operating and capital needs through these user fees and their rents, concession revenues, parking income and landing fees. Typically, these airports use the residual method of setting landing fees, in which they compare all non-landing fee costs and revenues, and then set landing fees at a rate of so many dollars or cents per 1,000 pounds of gross landing weight, and thus the airlines pick up the residual portion of costs not covered by other revenues. Medford uses a partial residual method. The only area where public non-Aviation Trust Fund monies have been used for airports benefit is in a few isolated areas of ground access improvements, where Highway Trust Fund monies may have been used.
Airport revenues cannot be used for other local needs (transportation or otherwise). The competition for Trust Fund dollars means that for the past 15 years or so the General Accounting Office has stringently monitored the use of aviation revenues and seeks to ensure through enforcement actions that they are only used for the airport.
Smaller airports such as Ashland s may be subsidized in part by their owner jurisdiction. For instance Ashland s Public Works Department is the official airport manager, supplemented in key functions by Skinner Aviation as part of their lease agreement. Such arrangements are common at smaller airports. Grass-cutting, crack-sealing, tree trimming, emergency response and other services are provided by city Public Works and other personnel and monitored through cost allocation

149
accounting. Major capital projects compete for federal funds with a 10% local match. Needs, always greater than available funds nationwide, may be postponed until the federal grant (out of the Aviation Trust Fund) can be obtained. The Oregon Aviation Department may also provide some modest assistance from time to time, but its resources are limited to such income as aircraft registration fees. Ashland airport does not charge a landing fee, as the revenue would likely cost more to collect than it would yield.
Because the financing of the region s two airports is watertight and separate from other transportation financing, the needs and priorities are not included in this regional Transportation Plan.

150
1144.. RRAAIILL EELLEEMMEENNTT
IInnttrroodduuccttiioonn
Rail currently plays an important and unique role in the region s transportation system because some commodities flowing in and out of this region are uniquely suited to rail shipment. The main Union Pacific rail line through Southern Oregon runs via Klamath Falls. The rail corridor between the Rogue Valley and Eugene, and the Rogue Valley and Northern California, is limited in its functionality due to the presence of tunnels, as well as tight grades and curves. However, it is the Rogue Valley s link to the national rail freight system and is depended on by an extensive list of the valley s employers.
Under the right conditions, rail in the Rogue / Bear Creek Valley can be viewed as a potential source of new north-south freight and possibly passenger-capacity as I-5 becomes more congested. For there to be radical growth in rail freight activity in the region, or for there to be rail passenger operations, paradigm shifts are needed almost as much as investments of funds.
Major rail-related issues faced by the region include the following:
The congestion caused by through truck traffic, some 50 percent of all trucking, which has little or no direct benefit for the region;
The under-utilization of rail for traditional rail products due to need for infrastructure and operational improvements; and
Airshed issues reduction of truck traffic through the Medford Air Quality Maintenance Area and its replacement by rail would reduce air pollution because of the greater fuel efficiency per ton hauled, of the rail system.
Some of the benefits of putting more freight volume on rail in and out of S. Oregon include that:
Population is set to continue to grow and there will likely be greater traffic impacts;
Diverting a portion of freight growth to rail will dampen the road congestion growth;

151
Using the rail system to handle more freight will help the highway system last longer by reducing wear and tear;
The situation is serious enough currently that an argument needs to be made for system preservation.
With continued rail service in Southern Oregon, there is the opportunity to substantially grow good paying local manufacturing jobs. This has a positive ripple effect on Southern Oregon s economy.
The Rail Transportation Element of the Plan addresses both freight and passenger components.
This Element is a snapshot in time and raises a number of questions and issues where further analysis and policy adoption may be appropriate during future MPO work programs.
RRaaiill SSyysstteemm DDeessccrriippttiioonn aanndd AAccttiivviittyy LLeevveellss
Southern Oregon is served by two short line railroads -- the Central Oregon & Pacific Railroad (CORP), Oregon s largest short line, has track that passes through the Rogue and Bear Creek Valleys, and the WCTU Railway Company, which operates about 12 miles of industrial trackage serving the White City area. The former Southern Pacific Railroad Siskiyou Line (CORP) runs from Springfield, Oregon to Black Butte, California. CORP s only Class 1 connections are with UP at Black Butte, CA and Eugene, OR. These interchanges with the Union Pacific are the only rail links for S. Oregon to the national network, providing a very important connection also for the entire State network. The total length is a little more than 300 miles, of which about 250 miles are in Oregon. Steep grades and tight turns currently limit operating speeds to about 25 to 35 miles per hour. A map of the CORP and WCTU lines is shown in Figure 14-1 and the Rogue Valley portion of the system is shown in Figure 14-2.
The interchange situation means that CORP is dependent on the Union pacific and its schedule for improvement projects, to access all of the system improvements needed to serve its customers. The Oregon Rail Users Group (ORULE) has identified statewide a list of these improvements.
A major issue for Oregon is car size growth. The ORULE packet just mentioned sums it up:
"The 286,000 Pound Car Problem
"The major railroads are increasing their use of newer and heavier rail cars that weigh a maximum of 286,000 pounds. These cars are becoming the standard for the industry and Oregon's shippers are demanding their use. However, these heavier cars cause significantly more stress and wear and tear on rail track and bridges. Much of Oregon's branch and shortline trackage dates from the early 1900s when cars weighed considerably less.
"The cars are tearing up the physical plant significantly faster than the shortlines ability to earn the necessary revenue to fix the problem. The Oregon Rail Plan estimates that the need to address this track and bridge problem is in the neighborhood of $154 million statewide."

152
FFiigguurree 1144--11 CCOORRPP
WWCCTTUU SSyysstteemm MMaapp
Note: CORP is now owned by RailAmerica

§̈¦5
§̈¦5
tu238
tu140
tu66
tu62
tu234
Medford
Ashland
Central Point
Eagle Point
Talent
Phoenix
White City
Jacksonville
Gold Hill
Butte Falls
AGAT
EHIGHWAY 140
HIG
HW
AY 6
2
TAB
LE R
OC
K
MAIN
HIGHWAY 66
VILAS
FOO
THI L
L
PACIFIC
HIGHWAY 23
4
MEA
DO
WS
STAGE
BLACKWELL
BUTTE FALLS
KIRTLAND
PHO
ENIX
PINE
HANLEY
CR
ATER
LA
KE
OLD STAGE
SISKIYOU
BEALL
HIG
HW
AY 2
38
BARNETT
8TH
BROWNSBORO
ANTELOPE
STEWART
CENTRAL
RIVERSIDE
RO
GU
E RIVER
SAGE
AVENUE G
KIN
GS
2ND
TALENT
JACKSONVILLE
ASHLAND
GARFIELD
RILEY
LINN
TRESHAM
GREGORY
ROSSANLEY
WILSON
5TH
ROGUE VALLEY
COLVER
TAYLOR
VALL
EY V
IEW
HIGHWAY 99
WAGNER CREEK
ALTA VISTA
MCANDREWS
ROSS
VOO
RH
IES
10TH
REE
S E C
REE
K
LITHIA
HA
MR
ICK
BELLINGER
GRANITE PIT
KER
SHAW
STEVENS
HILTON
PACIFIC
BUTTE FALLS
MAIN
MCANDREWS
2ND
OLD STAG
E
HIGHWAY 140
PAC
IFIC
HIGHWAY 234
CR
ATER
LA
KE
OLD
STAG
E
MAIN
STAGE
HIGHWAY 234
PACIFIC
O0 1 2 3 4
Miles
Map created on Febuary 22, 2005
L
E
G
E
N
D
Urban Growth Boundary
Water Features
Interstate
Highways
Railroad
Streets
MPO Boundary
Rail SystemF i g ur e 1 4 - 2
RVMPO 2005 REGIONAL TRANSPORTATION PLAN

154
FFrreeiigghhtt
In December 1994, the Siskiyou line was taken over by Central Oregon & Pacific (CORP). The CORP has been undertaking an aggressive maintenance program and strives to keep operating speeds at 25 miles per hour throughout. Height restrictions associated with tunnels are a major problem with a big price tag north and south of the Rogue Valley.
A fire in Tunnel 13 in the Siskiyous started in mid-November 2003 and ultimately gutted the entire length of the mostly timber-lined 3,100-foot long tunnel. In November 2004 CORP estimated the cost of restoring the tunnel at $13.75 million; CORP has currently spent over $12 million towards reopening Tunnel 13. Of the 3100 foot tunnel about 240 feet remains to be opened.
The tunnel is not open at this writing and probably won't be before early 2005. The detour to the Rogue Valley from northern California is via Klamath Falls, Eugene and Roseburg. It adds considerable mileage, time and cost to freight making the detour.
Market Share
ODOT data and discussions with CORP suggest that there is a very large volume of wood and paper products that are moving by truck and not by rail and that a significant portion of that could be converted to rail with strategic investment and some operational changes. Statewide, rail represents 18% of total freight volume, so the 1% in the Rogue Valley area shown below, which is based on a 1997 survey, may be based on flawed information and need substantial updating. New commodity flow data for 2002 will shortly be forthcoming from ODOT but was not available for this chapter.
The 1997 Study reported as follows:
Some 38.8 million tons of freight, valued at $50.42 billion moved through, in, out, or within the Ashland/Medford area in 1997, the most recent year for which data is available. Trucking was the prevailing mode of moving freight, moving 98% of all freight tonnage and 99% of freight values. Rail freight moved 383,719 tons, valued at $274 million in the Rogue Valley MPO area. Lumber and wood products accounted for the largest share of rail freight, most of which was transported out of the area. Four commodity groups, chemicals or allied products, lumber and wood products, fabricated metal products and transportation equipment, totaled 97 percent of rail freight value. Though rail freight comprised only 0.5% of freight tonnage and 0.3% of freight values, rail transport is the lowest-cost means of moving heavy and bulky materials.

155
FFiigguurree 1144--33 11999977 RRaaiill TToonnnnaaggee aanndd VVaalluuee
Four major commodity groups sum to 89% of total rail freight tonnage and 97% of value. The largest of these was the lumber and wood products group, accounting for two out of three tons of rail freight, and over 20% of its value. Virtually all lumber and wood products were transported by rail out of the area (93%). All chemicals or allied products were railed in, accounting for 16% of rail freight tonnage and a sizeable 32% of rail freight value. Shipped both into and out of the region, fabricated metal products made up 6% of rail freight tonnage and nearly one quarter of freight value. Transportation equipment, though bulky and relatively lightweight (.01% of rail tonnage), contributed 19% to the value of all rail freight. All was shipped out of the region.
Commodity Types and Customers
Rail service provides specific advantages for various bulk commodities or loads longer than those normally permitted on highways. Lumber and other wood products are the principal commodities transported over the Siskiyou Line. Rail can handle heavier
as well as longer loads than those normally permitted on highways. A modern rail car can handle the same cargo that would require three to four trucks to handle.
A list of 2004 shippers, together with inbound and outbound carloads on CORP is shown in Figure 14-4. Of the 4,122 carloads to and from CORP-served customers, 2,989 carloads were outbound shipments. Of the 3,265 shipments to and from WCTU-served customers, 2,396 carloads were outbound shipments. In 2003 CORP system wide handled a total of 49,446 carloads and in 2004 CORP handled a total of 46,187 carloads.
Rail Commodity Tonnage & Value
Medford-Ashland Metro Area (1997)
Inbound
32% Tonnage
(44% Value)
Outbound
68% Tonnage
(56% Value)

156
FFiigguurree 1144--44 CCOORRPP CCuussttoommeerrss CCOOMMPPAANNYY LLOOCCAATTIIOONN AANNNNUUAALL 22--WWAAYY CCAARRSS AMERIGAS PHOENIX 17 CARS ASSOCIATED FRUIT PHOENIX 11 CARS BOISE CASCADE MEDFORD 1002 CARS CERTAINTEED WHITE CITY 839 CARS FARWEST STEEL MEDFORD 25 CARS GRANGE CO-OP CENTRAL POINT 161 CARS G. PASS HARDW MEDFORD 90 CARS HAMBRO FOREST GRANTS PASS 333 CARS MEDITE MEDFORD 411 CARS MEDFORD READYMIX MEDFORD 32 CARS HAYS OIL MEDFORD 5 CARS NAUMES MEDFORD 3 CARS ODOT ASHLAND 4 CARS OR NATL GUARD MEDFORD 39 CARS PACIFEX FERT. MEDFORD 4 CARS PANEL PRODUCTS ROGUE RIVER 42 CARS SABROSO MEDFORD 33 CARS SUBURBAN PRO. MEDFORD 38 CARS TIMBER PRODS. MEDFORD 1,019 CARS TOLO FOR. PRODS. CENTRAL POINT 14 CARS
TOTALS 4,122 Cars
WCTU s customers are shown in Figure 14-5:
FFiigguurree 1144--55 WWCCTTUU CCuussttoommeerrss aanndd CCaarrllooaaddss 22000044 CCOOMMPPAANNYY LLOOCCAATTIIOONN OOUUTTBBOOUUNNDD IINNBBOOUUNNDD TTOOTTAALL BOISE CASCADE WHITE CITY
272
0
272
BOISE LVL WHITE CITY
712
515
1227
BOISE PLYWOOD WHITE CITY
0
3
3
BENSON SURF. WHITE CITY
0
2
2
GARRIS ENV. WHITE CITY
0
5
5
GEORGIA PACIFIC WHITE CITY
0
16
16
KODAK (IMATION) WHITE CITY
1
92
93
LTI WHITE CITY
103
34
137
MED. READYMIX WHITE CITY
0
433
433
MEDPLY WHITE CITY
160
121
281
MORGAN EMUL. WHITE CITY
0
59
59
PANEL CRAFTERS WHITE CITY
0
5
5
ROYAL OAK WHITE CITY
0
155
155
SCHNITZER STEEL WHITE CITY
16
0
16
SPECTRUM/ MEDITE WHITE CITY
238
129
367
W.C. PLY WHITE CITY
194
44
238
WILLAMETTE. EGG FARMS EAGLE POINT
1
64
65
TOTAL
1,697
1,677
3,374
Figure 14-6 summarizes gross revenue and carload data for CORP, WCTU and statewide since 1992.

157
FFiigguurree 1144--66 SS.. OOrreeggoonn SShhoorrttlliinneess -- RReevveennuuee aanndd CCaarrllooaaddss vvss.. SSttaattee TToottaallss GROSS REVENUE
CARLOAD INFORMATION
% Revenue
RAILROAD Psgr Frt Total %
Chg. Interchanged Intraline Bridged
Total % Chg. to MofW
YEAR Prev.Yr.
Originated Terminated Prev.Yr.
CORP $22,486,907 $23,677,963 6.5% 33,648 7,968 2,315 1,681 45,612 3.1% 12.7%
2003 WCTU $648,290 $648,290 4.2% 1,533 2,072 3,605 3.7% 3.5%
State Totals $1,972,780 $60,087,104 $64,169,327 10.9%
90,964 64,018 19,153 4,351 178,486
25.7%
CORP $22,122,097 $22,226,597 6.8% 32,828 7,416 2,315 1,681 44,240 20.4% 9.8
2002 WCTU $622,267 $622,267 3.3% 1,425 2,051 3,476 3.7% 1.8
State Totals $1,997,735 $54,680,375 $57,866,270 4.7% 81,566 43,940 12,400 4,126 142,032
13.4%
CORP $21,892,939 $21,892,939 7.8% 26,037 6,205 2,073 2,437 36,752 -14.3% 9.0
2001 WCTU $602,406 $602,406 -2.3%
1,314 2,037 3,351 -3.7% 1.0
State Totals $1,739,195 $53,559,888 $55,299,083 3.5% 68,081 41,194 10,904 5,017 125,196
-7.6%
CORP $20,307,299 $20,307,299 -7.6%
31,394 5,324 3,030 3,127 42,875 -3.1% 10.1
2000 WCTU $616,462 $616,462 0.6% 1,323 2,157 3,480 3.6% 1.4
State Totals $1,690,062 $51,832,963 $53,423,025 0.6% 77,034 40,916 10,657 5,353 135,481
-1.8%
CORP $21,984,983 $21,984,983 69.5%
N/A N/A 44,250 0.6% 11.7
1999 WCTU $613,051 $613,051 17.9%
1,184 2,174 3,358 19.7% 1.0
State Totals
CORP $12,983,781 $12,973,781 -33.6%
N/A N/A 43,972 7.0% 12.8
1998 WCTU $519,857 $519,857 1.7% 1,180 1,626 2,806 9.5% 1.6
State Totals
CORP $19,542,101 $19,542,101 9.3% N/A N/A 41,095 14.8% 11.5
1997 WCTU $511,082 $511,082 16.4%
1,427 1,135 2,562 -14.5% 2.3
State Totals $848,173 $45,521,464 $46,369,637 10.6%
41,227 31,471 296 5,316 121,504
12.6%
CORP $17,874,612 $17,874,612 17.2%
N/A N/A 35,789 11.8% 23.0

158
GROSS REVENUE
CARLOAD INFORMATION
% Revenue
RAILROAD Psgr Frt Total %
Chg. Interchanged Intraline Bridged
Total % Chg. to MofW
YEAR Prev.Yr.
Originated Terminated Prev.Yr.
1996 WCTU $439,000 $439,000 55.7%
1,951 1,046 2,997 7.4% 7.0
State Totals $675,502 $41,247,055 $41,922,556 14.8
% 38,372 30,667 280 2,841 107,949
13.8%
CORP $15,249,142 $15,249,142 N/A N/A 32,005 99.7% 22.5
1995 WCTU $282,000 $282,000 38.7%
1,907 884 2,791 -55.8% 21.0
State Totals $724,155 $35,874,550 $36,508,705 68.7%
36,012 25,481 406 84,851 27.6%
CORP $45,095 $45,095 0 96 96 0.0
1994 WCTU $460,000 $460,000 -10.7%
2,828 1,521 4,349 21.0
State Totals $769,572 $20,873,267 $21,642,839 34.9%
45,198 22,583 852 65 68,698 55.6%
1993 WCTU $515,000 $515,000 29.4%
N/A N/A N/A N/A
State Totals $752,931 $15,295,057 $16,047,988 212.3%
26,668 13,067 271 44,161 408.5%
1992 WCTU $398,000 $398,000 N/A N/A N/A N/A
State Totals $690,534 $4,447,873 $5,138,407 7,978 674 8,685
CORP = Central Oregon & Pacific Railroad (est. 12/31/1994) WCTU = WCTU Railway

159
Thus, total Rogue Valley originating and arriving carloads for both railroads in 2004 numbered 7,387. CORP and WCTU have been doing well but do not provide long-term forecasts that are available outside the companies; a cautious guess is that they are in a similar position to most railroads nationwide
faced with potentially major growth in demand but scarce resources to
address needs on a facility that in some places is 130 years old. CORP freight service has been increased and is now being offered seven days per week.
Employment figures associated with these companies which are utilizing rail have not been generated and would be a useful addition to this summary.
As may be observed from the Figure, CORP since its takeover of the line in the mid-1990s has shown increasing gross revenues and carloads. Between 1995 and 2003 CORP s gross annual revenue grew though not steadily -- from $15.2m to $23.7m and annual carloads grew from 32,000 to over 45,600. During the period of CORP s steady growth, statewide carloads grew from 84m to 178m.
Passenger
Rail passenger service is not available between Eugene and Medford. North-south passenger service in the California-Oregon-Washington corridor is provided through Klamath Falls, bypassing the Rogue Valley region on the way to Eugene. In 2000, the State began supporting a long distance bus service (one bus a day) between Ashland and Eugene, where it feeds into the Amtrak operation.
FFoorreeccaassttss ooff DDeemmaanndd
Freight
Both truck and rail volumes are forecast to double by 2020 both in the state of Oregon and nationally. Overall, rail freight in Oregon is projected to be the second fastest growing mode of transportation and a multi-modal approach to solutions is needed and is moving forward. Rail infrastructure across the country is strained and will not be adequate to meet demand. The railroads have spent billions on their physical plants in the past 10 years, but most of that has been in the high volume corridors particularly in the southern California to the Gulf and Chicago areas.
The Class I railroads do not cover their cost of capital which is why public investment is important, but even more so in rail dependent states such as Oregon, where the lower volume levels will not attract the massive capital investment by the railroads that the large population centers have been able to attract, such as the Port of Long Beach s Alameda corridor, one of the largest public-private rail infrastructure investments ever to be made.
Thus, finding the capital for the needed growth in facilities to support the carload growth is a major challenge. Nationally, in the opinion of industry consultants, the profit margin for railroads in the past few decades has been very small, often less than 5 percent, as development of the highway system and competition from trucking have eroded rail s market base. Despite massive streamlining and internal reorganizations, the nation s railroads still face tough competition from highways. In such situations, with little capital to spare for anything but essential maintenance, little is available

160
for consideration of long-range plans and planning time horizons tend to be very short. CORP and WCTU have been doing well but do not provide long-term forecasts that are available outside the companies; a cautious guess is that they are in a similar position to most railroads nationwide faced with potentially major growth in demand but scarce resources to address needs on a facility that in some places is 130 years old.
In CORP s opinion, rail volumes could certainly more than double in the Rogue Valley area given organic growth as well as tapping into the existing market potential.
One major new source of rail traffic in the region and rail availability was a key reason for their choice of this location -- is Amy s Kitchen, an organic food processing company, coming to White City. They have purchased 50 acres of land, and CORP is building a new spur to their planned plant. They estimate that 2 cars/week of frozen entrées will be shipped out, plus 2 cars / wk of bottled / canned sauces. The plant is expected to be open by late 2006. Amy s kitchen hasn t yet furnished estimates of inbound trucking volumes but does not expect to use rail for its raw materials.
Passenger rail
Not applicable since there is no passenger service in the Rogue Valley.
SSyysstteemm DDeeffiicciieenncciieess // SSttrreennggtthhss aanndd WWeeaakknneesssseess AAsssseessssmmeenntt
Freight
WCTU is a local provider of switching services at White City. Its tracks are on basically level terrain and have no tunnels or bridges. However, since WCTU must connect with CORP and from there, to the UP system, the CORP limitations become the WCTU s limitations too. The biggest system deficiencies on the CORP line are:
Steep gradients both north and south of the Rogue Valley
Sharp curvatures both north and south of the Rogue Valley; and
Tunnels with limited height clearance both north and south of the Rogue Valley.
The first two restrictions affect travel time and shipper cost, and curvature adds a penalty to track maintenance due to uneven wear of trackage on the outside curve compared with the inside. The restricted tunnel clearances preclude the use of a significant number of common modern rail car types and also preclude passage of many types of intermodal cars, including double-stacked containers. Intermodal (i.e. container) service per se on the CORP is felt by the railroad to be a non issue. Even if CORP tunnels could accommodate this kind of traffic, it would not be likely that the UP has interest in diverting any portion of their intermodal service to CORP. Moreover, with the gradients, track speed and the amount of locomotive power necessary to go over the Siskiyous, CORP does not foresee this as being a viable economic option any time soon. The opportunities lie with greater accommodation of non -intermodal traffic.

161
The main impediment to carload growth on the CORP is lack of tracks and infrastructure to handle the ever-increasing carload volumes. CORP is looking to build a new 9000 foot log track near Roseburg early in 2005. Also, CORP urgently needs a new classification rail yard near Roseburg, OR, and the railroad is starting to investigate options to do this. While these facilities are beyond the Rogue Valley, they do, like all the CORP s mainline activities, affect Rogue Valley customers.
Figure 14-7 indicates what a scenario without these restrictions might be like.
The above reasons combine with the general slowness of rail nationwide compared with trucking, to make rail less competitive than trucking for many products. The Rogue Valley s economic base is gradually shifting from resource industries such as timber products, agriculture and aggregate extraction, to low bulk, high value products such as drill bit sharpening, software and beads. Thus, fewer and fewer local manufacturers produce the low-value, high-bulk, non-time sensitive products that are rail s natural customers. Despite increasing tonnage over the past few years, the freight rail system continues to see declining market share.
It is likely that CORP was a profitable venture for its parent, RailAmerica, at least until the Tunnel 13 fire required major capital expenditure to repair. CORP does have insurance but, like most railroads, it comes with high deductibles. With respect to insurance on structures (the tunnel) CORP had $10 million of coverage with a $500,000 deductible. After spending over $12 million, CORP has exhausted its insurance coverage and is paying the overage itself while looking for financial assistance from other outside sources.
Passenger
There does not seem to be any likelihood of long distance passenger rail service in the Rogue Valley, given the region s relatively small population and the fact that that long-haul intercity passenger rail (Amtrak) already operates via Klamath Falls.
However, local passenger rail on the CORP tracks could have a somewhat more promising outlook. The 1999 session of the Oregon Legislature instructed the Oregon Department of Transportation to examine the potential introduction of frequent local passenger service (commuter rail) between Grants Pass and Ashland, a distance of approximately 45 miles. The operation being contemplated would, if pursued, operate on trackage owned by CORP.
The Federal Railroad Administration has designated the condition of the majority of the trackage in this area as Class 1 and Class 2, which permits top passenger train speeds of 15 and 30 mph, respectively. Freight train service consists of several local switchers plus through trains providing service to CORP trackage in California and northerly through Glendale to Roseburg.

162
FFiigguurree 1144--77 WWiitthhoouutt TTuunnnneell HHeeiigghhtt RReessttrriiccttiioonnss ..oorr
OOrreeggoonn ss OOwwnn AAllaammeeddaa CCoorrrriiddoorr ??
CORP rail users would gain the immediate advantage of being able to access the entire North
American freight car fleet, including hundreds (if not thousands) of high capacity box cars, tank cars and hopper cars (open-top and covered) that now cannot reach the Medford Basin because they're too big to fit through the tunnels.
What effect this would have is hard to say but because the bigger cars would enable more product to be shipped in a single shipment by rail than is possible now, it could stimulate development of additional freight for CORP through improved economics for present and potential customers.
It would also make possible development of intermodal traffic, but this would be slower to develop and trickier to promote. For one thing, there would be a need for some front end capital to develop intermodal facilities at, say, Roseburg and Medford, where trailers and containers would be lifted on and off rail cars by either giant forklifts (called "packers") or straddle cranes. These machines aren't cheap and neither are the tracks and asphalt areas where the "swap" between road and rail takes place.
Secondly, CORP could not cultivate intermodal traffic independently. A 300-mile-long railroad simply can't do this. Intermodal traffic would have to be developed in concert with Union Pacific, which lies at both ends of CORP (Eugene and Black Butte, CA).
Moreover, UP would have to be willing to support such service with rates, schedules and rolling stock. In reality, it would be more of a UP market than it would be CORP, but it could only come to pass as a cooperative venture once the physical restrictions imposed by the tunnels are lifted.
If there were intermodal facilities at Medford and Roseburg, the potential markets are to/from these points and: Portland, Seattle, Oakland/Bay Area, southern California (Los Angeles), the Midwest, the Southwest and points East.
There would have to be enough potential new intermodal revenue to make it profitable for both UP and CORP.
The market is most likely there and, properly done, it could take a lot of trucks off I-5.
But the immediate gain to the shipping community would be full access to the national fleet of bigger high-capacity freight cars.
Developing the intermodal market would require some study, thought and nurturing. This would play well with the Port of Portland's desire to "drive more traffic to its marine portals from the Oregon hinterlands," as containers could be shuttled back and forth between this region and Portland.

163
The commuter rail study was published in June 2001 and key findings include:
With substantial upgrading of the track and signal system to allow competitive travel times, the rail line connecting the eight Rogue / Bear Creek Valley communities of Grants Pass, Rogue River, Gold Hill, Central Point, Medford, Phoenix, Talent and Ashland is well suited to serve as the backbone of an effective commuter transportation system for the region.
With top speeds of up to 60 miles per hour, commuter trains could travel the 45-mile corridor from Ashland to Grants Pass in about 80 minutes, making seven intermediate stops.
The estimated costs for upgrading the rail infrastructure, including track, ties, switches, a new 1.5-mile track through Medford Yard, new sidings, a modern train movement signaling system, for grade crossing safety improvements, for acquiring passenger equipment, and for operating the system at three potential levels of service are summarized in Figure 14-8 below.
FFiigguurree 1144--88 EEssttiimmaatteedd SSyysstteemm CCaappiittaall EExxppeennddiittuurreess aanndd OOppeerraattiinngg CCoossttss Level of Service*
Capital Expenditures
Annual Operating Costs
Level 1 $42,737,000 $3,977,000
Level 2 $70,410,000 $4,552,000
Level 3 $96,671,000 $8,077,000
*Levels of Service Explained: Level 1: Full service (6 round trips in the morning and 6 in the evening) between Ashland and Central Point Level 2: Level 1, plus limited service (2 round trips in the morning and 2 in the evening) between Central Point
and Grants Pass. Level 3: Full service (6 round trips in the morning and 6 in the evening) between Ashland and Grants Pass.
Daily ridership estimates ranged from a low of 475 to a high of 850. Daily ridership estimates were calculated for new riders only, and did not include current bus riders. The study also briefly explored the possibility of a seasonal excursion service over the line during times when commuter trains are not operating. In summary, the study found no fatal flaws to prevent operating a commuter service over the existing railroad line between Ashland and Grants Pass.
It concluded:
While only a field environmental review has been made to date, it is very unlikely that a full Environmental Impact Statement (EIS) would alter this conclusion. It is likely that the main issues that will need to be addressed if the study moves beyond the preliminary investigation stage will be those related to financing capital costs and operating subsidies.
In the opinion of CORP and the Port of Portland (who reviewed a working draft of this chapter):
With regard to the passenger agenda in the Rogue Valley area, it appears that the public benefit for the money invested would be minimal until there is a dramatic rise in the population base.

164
An important next step could thus be to revisit and update ridership forecasts so the capital cost per new rider can be determined. A consideration in favor of the system is, it would be one of the few commuter operations in the nation with ridership in both directions during each peak period. Workers could travel from homes in Grants Pass to Ashland and points between in the morning, and back at night, while Ashland workers would be doing the reverse. This means much less
deadheading of empty cars and thus, higher revenues in relation to unavoidable costs.
The opportunity remains for this regional high capacity transit option to be explored and for the region to get in line for scarce New Start17 federal funding. In 2003 the RVMPO Policy Committee, responding to comments from TRADCO, expressed concerns about proceeding with the project, due to its high costs and modest benefits, but no formal policy action has yet been taken on the study. Steps that could be taken to explore the project further, prior to a decision to proceed or drop the concept, are listed below.
PPoolliiccyy IIssssuueess
Freight
More research is needed on the issues discussed in this section. Governor s Connect Oregon Initiative and Growing Truck Traffic on I-5
In fall 2004, Governor Kulongoski issued a policy statement, Connect Oregon, in support of non-highway modes of travel. Since this proposal has yet to be acted upon by the State Legislature, it is too soon to tell the nature of the program or where its primary focus will be. However, support for the state s rail system seems a likely target. One reason for this is ODOT forecasts that truck traffic on I-5 will double within 20 years, such that major capacity problems will ensue. Since the state already has a substantial rail network, using these corridors to more substantially supplement freight transport seems likely. Relieving I-5 congestion makes sense. CORP in particular has a rail corridor that virtually parallels I-5 for a great deal of its length.
General Public Investment Question
Public-private partnerships are a key part of the Connect Oregon initiative. Public agencies can help rail operators improve their operations by reducing private rail crossings, providing signals and gates at public cost for needed public rail crossings, and by cost-sharing in track and signal improvements that facilitate regional transportation objectives.
Given the US s massive imbalance of ocean trade, with eastbound freight across the Pacific far surpassing westbound, and given the Port of Portland s key role in handling that freight, how to drive more traffic to the marine portals from the Oregon hinterlands is a question receiving growing attention. An intermodal terminal in the Rogue Valley may be a possibility. This initiative ties
17 FTA s New Start program requires a 20% or better match and is substantially oversubscribed. Funds may be used for commuter rail, light rail or even Bus Rapid Transit (BRT). The new TEA-21 Reauthorization legislation expected in 2005 may change this program.

165
closely to the Governor s Connect Oregon plan. The legislative agenda for this next session is to get State investment in rail operations, facilities and infrastructure.
Tunnel Fire and Other Infrastructure Costs and Needs
The CORP Tunnel 13 fire has proven challenging and costly to repair. Not only is the cost of reconstruction high, but the cost of lost and slower rail connections have been felt by all CORP shippers and customers. The only silver lining to this cloud appears to be the resulting greater recognition of the value of the short line to the state.
Southern Oregon s Changing Economic Base
Southern Oregon s economic base is changing from a resource-based (forestry, mining) to a more complex system (medical, tourism, retirement). The types of industry that use rail are declining; even if they were growing, the region has a relatively small economy. More research is needed regarding the shipping needs of the limited number of current rail-dependent industries. It is important to forecast what these needs will be and where these companies will be heading, in 5 years or 10 years. Freight rail has the capacity to grow (supply side) but does the market have potential to grow (demand side)?
Relating to this issue, does the region need programs to preserve former rail yards and track spurs for rail-related purposes, or can these sites be recycled for non-rail related manufacturing or for residential or other development?
Fossil Fuel Consumption and Fuel Efficiency
Even though the cost of gasoline has been rising in recent months, and more and more experts are predicting the depletion in coming decades of petroleum-based fossil fuels, the fuel efficiency of freight rail compared with trucking has received little attention in recent times. Yet, railroads are also dependent on fossil fuels given current technology.
Potential Areas for Freight Rail Research
Several areas of work could be undertaken, building on the findings of the 2003- 2004 freight study:
Conduct broad-brush engineering cost analysis for upgrading the rail tunnel system between Eugene, OR and Black Butte, CA to cure the restricted tunnel problem and enable all types and sizes of today's modern rail cars, including intermodal cars with stacked containers, or at least higher weight bearing and cubic capacity cars ( high cap ) cars, to move via the Siskiyou line, as well as render the tunnels less earthquake-prone.
This would allow current shippers and potential shippers fuller utilization of the national rail car fleet and thus provide national access to the economies of rail transportation. It also would open a viable alternative route for traffic now moving over the UP main line via Klamath Falls. While this initially might be an "emergency only" route for the freight moving over the main rail corridor, as capacity issues develop on that line, some of the less important through traffic might be diverted to the Siskiyou line.

166
Develop information on the capacity of the rail freight system, the shippers and types of products inbound and outbound to the region, and summarize key policy and planning issues.
Compare these costs with the potential market benefits, over 20+ years, assuming maximum mode split to rail / maximum utilization of an expanded tunnel system. If it proved cheaper to use "excess" capacity existing on CORP than spending scarce capital to build otherwise-needed new capacity between Black Butte and Eugene on the Klamath Falls line, then the project could have merit.
Determine under what market and other conditions, various levels of rail upgrade could be cost-effective.
Refine the above into a phased action plan.
Passenger
Freight-passenger Compatibility and System Cost Issues
Track Costs: The CORP line does not currently have high enough operating speeds for commuter trains to compete effectively with highways, thus a commuter rail operation without improved track speeds would not likely generate enough riders to warrant the program. The cost of this portion of a startup was estimated to be $6.9m out of the total track and signal costs of $38.4m18 for the segment between Ashland and Central Point, and an additional $16.4m out of $45.7m for the segment from Central Point to Grants Pass.
Car and Signalization Costs: The Federal Railroad Administration (FRA) sets standards for shared passenger-freight use of railroad tracks. For example, the buff strength or crushability of passenger cars must be such that they can withstand a collision with a freight train. Vehicles are being explored that have reinforced crush zones at each end, enhancing safety but also adding to cost. State of the art signalization must separate passenger and freight trains.
Such elements add to the already high start-up capital costs for commuter rail systems. Yet, the CORP line is a very low traffic line compared with other areas around the country (e.g. Chicago; Northeast Corridor) that safely combine heavy volumes of freight trains with similarly heavy volumes of freight trains. It may be worthy of investigation to determine whether certain blocks of time on CORP could be exclusively committed to passenger operations, allowing more flexible vehicle and signalization standards.
Value Engineering: There may be other cost aspects of the proposed commuter rail project that should be revisited and value-engineered to determine if lower startup costs are possible. If so, this would alter the (capital) cost per new transit rider calculations and enable the project to rank higher for FTA New Start funding. On the other hand, CORP track capacity is being used up by growth, and a re-examination of commuter rail capital costs might lead to a conclusion that a third mainline
18 The larger number in each case includes not only track reconstruction, but also passing sidings, CTC, new track in Medford Yard, grade crossing improvements and a maintenance facility costing $3m.
167
or additional siding tracks would be needed to accommodate commuter rail in addition to freight growth.
Commuter Rail Market Development
Market analysis would be performed to explore the market and net revenue potential not only for weekday bi-directional commuter rail service but also for special events. The commuter rail study touched on but did not analyze these. They could include winery tours, a dinner train, and tourist packages such as river-rafting/ Shakespeare combinations that would be facilitated by easy public transportation between Grants Pass and Ashland.
Commuter Rail Station Footprint Preservation
Commuter rail cannot be successful without provision for a wide array of access modes including feeder bus, shuttle van, park-&-ride, drive-thru, bike and walk access. Station footprints tend to be larger in the 21st century than they were in the 19th, due to a higher percentage of park-&-ride access and a lower percent of walk/bus/tram access. Some new start east coast rail systems have seen initial ridership constrained due to insufficient parking, and have had to quickly remedy the lack. While further commuter rail studies are currently on hold, technical and policy work needs undertaking to implement preservation of sufficiently sized footprints around all potential commuter rail stations.
Planning for station areas can also include TOD projects in the areas ½ mi or less from potential commuter rail stations. Rail would enhance regional Transit-Oriented Development (TOD) and density goals; it would create its own high value residential / mixed-use areas from which riders can walk to rail service. Such development strategies also reduce the need for feeder-distributor transit.
Conditions under Which Commuter Rail Could Be Further Considered
RVMPO Policy Committee votes to make it part of the region s plans and policies;
CORP expresses enthusiasm for continued exploration of possible service;
Funding is obtained for additional analyses, as listed here:
Value engineering of track, signal and rolling stock costs to see if they can be reduced for a first phase or demonstration project;
Costing is undertaken for meeting ADA and these costs factored in;
Two-way ridership is re-evaluated upward giving the growing population, increased numbers of people living near stations; higher cost of gasoline and greater concern for air quality.
A rail consultant verifies and updates the work in the above and other ways and indicates his/her professional opinion that the project is worth pursuing, and the conditions that must be met for success;
RVTD or other public agency applies for New Start FTA funding and earmark funding;
Local decision-makers actively lobby for federal funding;
Trackage rights can be cost-effectively obtained from CORP;
CORP or another cost-effective commuter train service operator steps up in response to a public solicitation;
The local jurisdictions take steps to protect needed station foot prints; and to implement new station-area TODs in order to maximize walk-in train ridership;

168
Widespread local enthusiasm and support is generated, including interest on the part of the private sector for special events trains, and for private shuttle services to and from trains for shoppers, tourists, etc.
Conclusion
Under the right conditions, both passenger and freight rail have the potential for significantly reducing highway congestion in the Rogue Valley in the 25-year timeframe of this Plan. Special funding and policy actions will be required for either, as well as further analyses.
169
1155.. PPRROOFFIILLEE OOFF FFRREEIIGGHHTT TTRRAANNSSPPOORRTTAATTIIOONN IINN TTHHEE
RROOGGUUEE VVAALLLLEEYY
IInnttrroodduuccttiioonn
Freight transportation in the Rogue Valley metropolitan planning region takes place primarily via the highway, but also via rail, air, and pipeline modes. The Regional Transportation Plan (RTP) includes elements that describe the street system, air transportation, and rail transportation, but this element highlights the role of these modes in moving freight. Information in this element reflects existing national and statewide literature about freight, but more directly builds on several local sources. The Rogue Valley Council of Governments conducted an MPO Freight Study that inventoried the existing freight systems and identified constraints to freight movement. Shippers and haulers participated in surveys and interviews. A freight advisory committee composed of government agencies and industry representatives met to identify problems of area-wide significance and identify solutions. Open houses offered an opportunity for the public to participate as well.
The importance of freight to the local economy was highlighted in 1999 in a document titled Freight Moves the Oregon Economy, published by the Oregon Department of Transportation (ODOT). The report describes the various modes of freight transportation and summarizes their relative importance to the state, nation, and world. The report notes that each 100 jobs in Oregons transportation-dependent sectors generate 85 to 154 additional jobs. Transportation-related sectors include manufacturing, transportation, communication, public utilities, and wholesale trade. The Oregon Employment Department figures for 2001 showed 14,500 transportation-related jobs in Jackson County. Using the multiplier listed previously, the 14,500 jobs translate to a range of 12,325 to nearly 22,330 additional transportation-dependent jobs in Jackson County.
Also in 1999, the Oregon Highway Plan elevated the importance of freight in transportation planning and provided guidance on the standards of performance necessary for freight movements. The Plan

170
added a policy to maintain and improve the efficiency of freight movement on the state highway system and access to intermodal connections. The State shall seek to balance the needs of long distance and through freight movements and local transportation needs on highway facilities in both urban areas and rural communities.
MMPPOO AArreeaa FFrreeiigghhtt SSyysstteemm
Policy 10-1 ODOT and local governments shall accommodate commercial, retail, and industrial traffic flows and shall create a regional transportation system that supports local economic goals.
Policy 10-2 Local governments shall work with ODOT to examine options for designated freight routes, balanced with the needs for local circulation and non-motorized transportation, and shall consider goods-movement management strategies along the major arterial streets in commercial, retail, and industrial areas.
In 2002 and 2003, the Rogue Valley Metropolitan Planning Organization (RVMPO) conducted a survey of the existing freight transportation system. This profile provides an assessment of current freight practices in the Rogue Valley, including highway, railway, and air infrastructure; pipelines; intermodal connectors and facilities; principal manufacturing facilities; warehouses, and distribution centers; the principal transportation providers; and the nature of the services provided. The inventory includes an overview of how the existing local and regional freight systems are part of the larger statewide, national, and international freight/transportation system, and considers their future role. RVCOG staff interviewed shippers and haulers to gain a better sense of the issues facing users of the freight system. The interviews served as a foundation for a Strengths and Weaknesses evaluation that is included as an addendum to this Freight Element.
After the Element was prepared, the MPO expanded to include Eagle Point, Jacksonville, Talent, and Ashland. A fiscal year 2004 Freight Study updated information for the entire area. Staff prepared four memoranda in the third phase of the study:
1. Freight Issues and Needs in the Expanded MPO 2. A Medford-Ashland Metro Area Commodity Flow Analysis 3. Updated Project List 4. Updated Project Selection Criteria
This report incorporates the memoranda or includes them by reference.

171
Several factors, including cargo value, volume, and distance, affect choices for freight movement:
FFiigguurree 1155--11 FFrreeiigghhtt MMoovveemmeenntt OOppttiioonnss
Cargo Value Cargo Volume Distance
Air High Small. Often <100 lbs. Average >1,300 miles
Truck Moderate to high Loads < 50,000 lbs 100-400 miles
Rail Moderate to low No weight restrictions 670-800 miles. Short lines less
This chart illustrates that trucks generally carry freight of a mid-value and size, traveling a medium distance. Freight having a higher value and smaller size, traveling a longer distance, is more appropriate for air transport, while rail freight concentrates on bulky goods with lower value.
Bear Creek Corporation, Boise Cascade, Medford Fabrication, Sabroso, and Naumes are among the largest shippers in study area. Harry & David sends specialty food products worldwide. Sabroso and Naumes distribute fruit, primarily pears, nationwide. Sabroso also trucks ocean containers of fruit pulp to Oakland or Portland, where much of the product goes to Australia. Boise Cascade continues to be a large manufacturer of wood products, and Medford Fabrication specializes in steel manufacturing. Alstom T&D, Inc. is an example of a firm that receives ceramics from Poland, which arrive in Portland by train, and then transfer to trucks for the trip to Medford.
Eastman-Kodak in White City manufactures health-imaging products. Their market is worldwide, first trucked to Portland, where it is put on the train to New Jersey and then flown to France. Other loads are trucked to Tacoma, where they are transported to Japan and China by ship. FedEx carries overnight letters and small machine parts.
CCoommmmooddiittyy FFllooww AAnnaallyyssiiss
A critical part of a study of freight transportation in the Rogue Valley is an understanding of commodities that move in, out, within and though the region. A commodity flow analysis helps to evaluate the impacts of freight movements on the region s infrastructure. For instance, an analysis of commodities weight is important in developing an understanding of the way in which freight vehicles affect roads and highway infrastructure though pavement consumption and bridge stress. An understanding of freight movement, whether it travels in- or outbound, internal to the region or through it, is critical when addressing such factors as congestion, capacity, infrastructure, investment, economic development and quality of life. An evaluation of the type and value of freight, in particular in- and outbound freight, leads to a better understanding of the regional economy and an appreciation the role of transportation in it.
In 2004, the Oregon Department of Transportation, through a contract with Cambridge Systematics, Inc., developed detailed estimates for 1997 and forecasts for 2005 of commodity flows for the state, metro areas, and selected counties. The estimates feature weighs and values of 32 commodities (STCC2) by transportation mode, and freight movement within each mode.
With this rich data set, questions central to freight transportation planning may be addressed such as: What are the major commodities that flow into and out of the region?; What modes of transport are employed for given commodities?; What role does Interstate 5 play in the movement of freight

172
through the region?; What commodities move within the area, accessing secondary roads and impacting urban traffic flows?; and How does the -Ashland Metro area compare with other metro areas outside Portland in terms of freight movements, tonnage and commodity value? The appendix to the freight study reports major findings of an analysis of the commodity flows database by mode, by commodity type, and by movement, and then compares freight characteristics of the Rogue Valley Metro area with those of other metro areas outside of the Portland area.
Key Findings
In 1997, nearly 40 million tons of freight, valued at over $50 billion, moved in, out, within or through the Medford-Ashland Metro area. In terms of both tonnage (99%) and value (98%), trucks moved most freight. Major commodities moved in terms of weight included lumber and wood products, food and kindred products, and in terms of value were transportation and electrical equipment and machinery. Figure 15-2 shows key findings of the commodity flow analysis:
FFiigguurree 1155--22 CCoommmmooddiittyy FFllooww DDaattaa iinn RRoogguuee VVaalllleeyy
Trucked Freight
Trucks transported freight in, out, within and through the metro area. Because of the proximity of Interstate 5, freight conveyed through the region comprised the largest share by movement, accounting for nearly half of all truck freight, and 70% of truck freight value. Freight moved within the region, 8% of freight tonnage, was dominated by low-value, high-weight commodities, such as non-metallic minerals and waste and scrap materials. The remaining 43% of trucked freight moved into or out of the region. Using a trade balance concept, the region was a net exporter in terms of tonnage, and a net importer in terms of commodity values.
Major Commodities* by Tonnage and Value
Medford-Ashland Metro Area (1997)
0%
5%
10%
15%
20%
25%
30%
35%
40%
45%
50%
Instrum, Photo, Optical
Machinery
Electrical Equipment
Transportation Equip.
Primary Metal Products
Clay, Concr, Glass, Stone
Petroleum Or Coal Prod.
Pulp, Paper, Allied Prod.
Food Or Kindred Prod.
Lumber Or Wood Prod.
% Total Tonnage
% Total Value
*Listed
Commodities
Account for
77% Tonnage
83% Value

173
FFiigguurree 1155--33 CCoommmmooddiittyy VVaalluueess aanndd TToonnnnaaggee
Commodity Tonnage & Value by Movement: Trucks
Medford-Ashland Metro Area (1997)
Through49% Tonnage(70% Value)
Outbound25% Tonnage(12% Value)
Inbound18% Tonnage(17% Value)
Internal8% Tonnage (1% Value)
Comparisons with other Metro Areas
Commodity flows for Medford-Ashland were compared to those four other metro areas outside of Portland: Eugene-Springfield, Salem, Corvallis, and Bend. In terms of total tonnage, Medford-Ashland ranks third. Its 39 million tons of freight are about one-third the freight weights of Eugene and Salem, and well above the tonnages for Corvallis (10 million) and Bend (26 million). However, values per ton of Medford-Ashland freight, $1300 per ton, far exceeded those of all the other metro areas, which ranged from $869 for Salem to $553 for Bend. All the metro areas, except Corvallis, are located on major highways, and all these areas had high shares of through freight. Nearly three-quarters of Eugene-Springfield s freight was transported though the area, over half for Salem, and nearly half for Medford-Ashland.
Other Findings
Most freight was moved by truck in all five metro areas, ranging from 84%-98% of freight tonnage. Rail and pipeline moved 7% of Eugene s freight and 15% of freight in Bend.
Rail freight moved 383,719 tons, valued at $274 million in the Medford-Ashland Metro area. Lumber and wood products accounted the largest share of rail freight, most of which was transported out of the area. Four commodity groups, chemicals or allied products, lumber and wood products, fabricated metal products and transportation equipment, totaled 97% of rail freight value.
In 1997, 1,895 tons of freight was moved into or out of the region by air, valued at $17 million, two-thirds of which was outbound. Machinery, electrical, transportation, photo and optical equipment and instruments accounted for 45% of air freight tonnage and 90% of value.

174
Roads
National and state transportation agencies have established a hierarchy of highways. The federal government developed a National Highway System (NHS) intended to include the most significant highways for moving people and freight. This system includes Interstate 5, Highway 62, Highway 99, and Highway 140, portions of which are located in the study area. Most truck freight moves on the National Highway System, which accounts for about 49 percent of Oregon s total highway mileage. The 1999 Oregon Highway Plan designated a State Highway Freight System based on
freight volume, connectivity, and linkages to major intermodal facilities. Interstate 5 is the only Rogue Valley highway in the State Highway Freight System.
The 1999 Oregon Highway Plan sets mobility standards using volume-to-capacity ratios (v/c), rather than Level of Service letters, to identify the presence of congestion. If the v/c ratio for a highway segment exceeds the v/c ratio established in the plan, then the highway segment does not meet ODOT s minimum operating conditions. Acceptable v/c ratios are higher for the MPO than for sparsely settled rural areas, which means that relatively greater congestion is acceptable in the MPO area than in rural areas. Acceptable v/c ratios for freight routes are slightly lower than for other highways. This means that freight routes should be less congested than non-freight routes. The maximum acceptable v/c ratio for the MPO ranges from 0.80 for I-5 to 0.85 for Highway 62.
The Regional Transportation Plan (RTP) identifies ten intersections in the MPO area with the highest volumes of truck traffic:
Highway 99 and McAndrews Road
Highway 99 and Fern Valley Road
Highway 99 and Pine Street (Central Point)
Interstate 5 ramp terminals and Pine Street
Biddle Road and Table Rock Road
Highway 62 and Highway 99
Interstate 5 ramp terminals and Highway 62
Court Street and Main Street (Medford)
Highway 62 and Highway 140
Biddle Road and Airport Road
Truck traffic at these major arterial street intersections varies between three and five percent of the traffic during the morning and afternoon peak periods, and between five and ten percent during the off-peak periods.
The largest freight haulers carriers include Combined Transport, USF Reddaway, Cross Creek Trading Company, Oldland, Gordon, Timber Products Trucking, Plunk Transport, Yellow Freight, FV Martin, and Assurance Trucking. Several of these carriers use their location to reduce the size of southbound rigs from three trailers to two before crossing into California, which prohibits triple-

175
trailer rigs. Northbound trucks add a trailer for transport through Oregon. Aggregate companies such as LTM and Rogue Aggregates also haul extensive volumes on the area s street system. The Freight Study Survey asked haulers to list by volume the top five commodities they bring into the area and ship to other destinations. Not all the haulers who responded to the survey were willing to divulge this information. Three haulers who did respond indicated the following figure:
FFiigguurree 1155--44 IInnbboouunndd aanndd OOuuttbboouunndd FFrreeiigghhtt Inbound Freight Outbound Freight
Produce, nuts, candies, chocolates, fish, juices (for Bear Creek Corporation) Raw logs, veneer, wood products
Pears, potatoes, lumber
Raw logs, veneer, wood products Beams, plywood, particle board
Glass, heavy equipment, lumber, steel, plastic pipe
Wood products, including plywood and lumber Steel, plastic and steel pipe, wood products
The Freight Study identified other routes that compose the freight system. Earlier versions of the Regional Transportation Plan identified all collectors and arterials in the MPO as freight system roads. The maps in this element reflect a reduction to those routes currently used for freight transportation or expected to accommodate future freight transportation. The following figure lists the routes, moving generally from north to south.
FFiigguurree 1155--55 EExxiissttiinngg FFrreeiigghhtt SSyysstteemm RRooaaddss Route Location by jurisdiction
State Highway 62 Jackson County, Medford Agate Road Jackson County, White City Royal Avenue Eagle Point Reese Creek Road Jackson County Brownsboro-Eagle Point Highway Jackson County Agate Road Eagle Point, Jackson County Bigham-Brown Road Jackson County Table Rock Road Jackson County, White City, Medford, Central Point Kirtland Road Jackson County Pacific Ave Jackson County, White City Avenue G Jackson County, White City Antelope Road Jackson County, White City Leigh Way White City State Highway 140 (portion) Jackson County, White City Kershaw Road Jackson County Corey Road (portion) Jackson County Crater Lake Ave Jackson County, Medford Foothill Road Jackson County, Medford Blackwell Road (portion) Jackson County Tolo Road Jackson County
State Highway 99 Jackson County, Central Point, Medford, Phoenix, Talent, Ashland
Interstate 5 Jackson County, Central Point, Medford, Phoenix, Talent, Ashland
Scenic Ave Jackson County Old Stage Road Jackson County
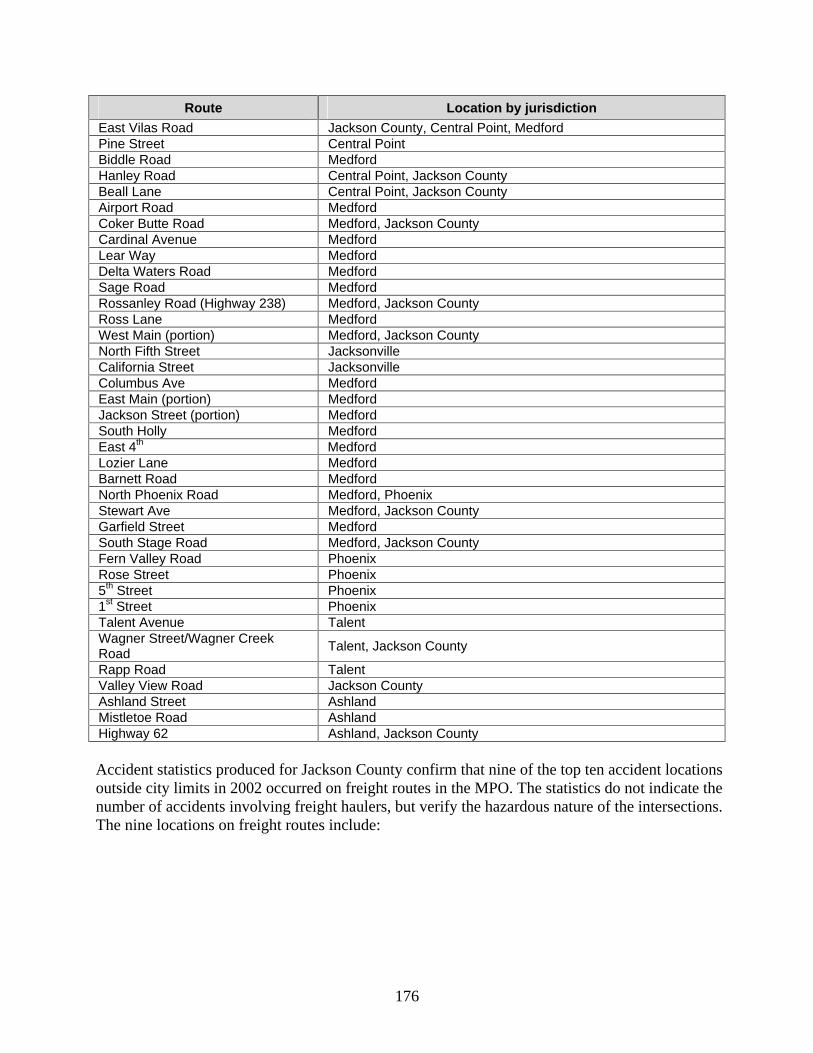
176
Route Location by jurisdiction
East Vilas Road Jackson County, Central Point, Medford Pine Street Central Point Biddle Road Medford Hanley Road Central Point, Jackson County Beall Lane Central Point, Jackson County Airport Road Medford Coker Butte Road Medford, Jackson County Cardinal Avenue Medford Lear Way Medford Delta Waters Road Medford Sage Road Medford Rossanley Road (Highway 238) Medford, Jackson County Ross Lane Medford West Main (portion) Medford, Jackson County North Fifth Street Jacksonville California Street Jacksonville Columbus Ave Medford East Main (portion) Medford Jackson Street (portion) Medford South Holly Medford East 4th Medford Lozier Lane Medford Barnett Road Medford North Phoenix Road Medford, Phoenix Stewart Ave Medford, Jackson County Garfield Street Medford South Stage Road Medford, Jackson County Fern Valley Road Phoenix Rose Street Phoenix 5th Street Phoenix 1st Street Phoenix Talent Avenue Talent Wagner Street/Wagner Creek Road Talent, Jackson County
Rapp Road Talent Valley View Road Jackson County Ashland Street Ashland Mistletoe Road Ashland Highway 62 Ashland, Jackson County
Accident statistics produced for Jackson County confirm that nine of the top ten accident locations outside city limits in 2002 occurred on freight routes in the MPO. The statistics do not indicate the number of accidents involving freight haulers, but verify the hazardous nature of the intersections. The nine locations on freight routes include:

177
FFiigguurree 1155--66 HHiigghh AAcccciiddeenntt LLooccaattiioonnss oonn FFrreeiigghhtt RRoouutteess
Intersection Number of Accidents
Vilas and Figure Rock Road 11 Lozier and West Main 10 Biddle and Figure Rock Road 9 Blackwell and Kirtland 9 Kirtland and Figure Rock Road 8 Lozier and Stewart 7 Agate and Antelope 7 Highway 62 and Highway 140 6 Antelope and Highway 62 6
Areas with significant commercial and manufacturing enterprises are found generally near the freeway interchanges, along the Highway 99 and Highway 62 corridors, and White City, which has the greatest concentration of industrial zoning in the study area. This land use pattern, which is illustrated on the preceding trucking company and industrial sites map leads to a triangle of heaviest truck freight hauling. The legs of the triangle are: 1) the parallel I-5 and Highway 99 corridors, 2) the Highway 62 corridor, and 3) a northerly connection from Highway 62 to Interstate 5, using Antelope Road, Kirtland Road, and Blackwell Road. Highway 140, Figure Rock Road, Biddle Road, and Vilas Road also experience high volumes of freight traffic.
The Rogue Valley Freight Study involved extensive contact with shippers and haulers, who completed questionnaires and talked with RVCOG staff about their concerns with the existing transportation system. Common themes identified by shippers, haulers, and the freight advisory committee centered on a need for more direct routes to industrial sites and more north-south alternatives to Interstate 5 that do not pass through town centers. Many identified intersections where freight flow is constricted. While problem areas exist throughout the study area, four major freight routes and the railroad system were identified as areas where improvements would be most beneficial to freight movements. The road systems include Kirtland/ Blackwell Roads, Figure Rock Road, East Pine/Central Point Interchange, and Highway 62.
Kirtland/Blackwell Road Connection.
How it serves freight:
To avoid congestion at other local interchanges, freight trucks heading north connect with I-5 at the Seven Oaks Interchange by taking the Kirtland/ Blackwell route.
Freight coming long distances west on Highway 140 often connects to I-5 via Kirtland/Blackwell Roads.
Haulers bring materials from local warehouses to industrial sites in White City via this route, rather than risk the congestion on Pine Street and Figure Rock Road.
Several businesses that ship bulk freight (aggregate, lumber, sand and gravel) are located along Kirtland/Blackwell Roads.
Issues:
The Kirtland/Blackwell route to I-5 requires several stops and sharp turns that wear on trucks.
178
The Kirtland/Blackwell route is circular and takes time.
There are narrow shoulders and deep ditches along Kirtland and Blackwell Roads.
Numerous driveway accesses onto Kirtland and Blackwell Roads are unmarked and hidden by brush.
By taking this route, trucks avoid the congestion found on more direct routes from their warehouses to plants, but they drive longer distances to do so.
Shippers and carriers want a more direct route to I-5 from Highway 140 than this provides.
Figure Rock Road
How it serves freight:
Freight from the north and south travels Figure Rock Road to reach the Central Point Interchange.
Freight moving to and from industrial sites, retail and wholesale establishments in White City and Medford flows along Figure Rock Road.
Freight heading to the Central Point Interchange from the east on Vilas Road converges with these north/south freight movements at the Vilas Road/Figure Rock Road intersection. Freight coming from the east on Biddle Road converges at the Biddle Road/Pine Street/Figure Rock Road intersection.
Issues:
Several businesses are located along Figure Rock Road. A turning lane for deliveries is needed along its entire stretch for safety purposes.
Congestion makes it difficult to enter Figure Rock Road from its several crossroads.
The combination of speed, congestion and numerous businesses onto Figure Rock Road creates safety hazards.
The Figure Rock Road/Vilas Road intersection cannot accommodate larger freight rigs. An inadequate turning radius causes rigs to go outside travel lanes.
Congestion makes it difficult for trucks to move through the intersection within the signal cycle time.
East Pine Street/Central Point Interchange
How it serves freight:
Freight trucks heading south on I-5 often choose to connect with I-5 via this interchange, rather than face the congestion on Highway 62 en route to the North Medford Interchange.
USF Reddaway, the largest break bulk facility in the Rogue Valley, is located off Pine Street on Hamrick Road. Counting just Reddaway traffic, 300 trucks per day exit from I-5 and another enter I-5. Gordon Trucking, a long haul company, is likely to relocate near this interchange.
California does not allow triple trailers, so trucks arriving from or departing for California stop at trucking terminals to add or subtract a trailer before continuing their trips.

179
East Pine Street connects freight on Highway 99 with Figure Rock Road, the route to industrial sites in White City.
The City of Central Point is completing a master plan for the area that identifies eleven improvements to enhance capacity and circulation, and allow additional development along the Pine Street corridor.
Issues
High levels of congestion leading to and occurring within the area.
Freight companies are concerned that conditions at the Central Point Interchange are starting to mirror those at the north and south Medford interchanges. This is troublesome, since the Central Point Interchange is currently their only viable alternative south of the Seven Oaks Interchange.
Not enough stacking space (room for vehicles) on the off ramps.
Existing commercial developments near the interchange create high traffic volumes at peak hours.
Carriers are concerned that plans for future development will heighten congestion issues.
Highway 62
How it serves freight
Highway 62 provides access to manufacturing and industrial sites in White City, the big box retail centers on Highway 62, scores of enterprises along the highway, commercial centers in Medford, and the North Medford Interchange.
Traffic volume on Highway 62 in the year 2000:
Delta Waters - 41,000 average daily trips (ADTs)
Vilas Road intersection, 32,000 ADTs
Lake of the Woods Highway intersection, 28,500 ADTs
Highway 62 connects the traveling public with Highway 140 and destinations east.
The highway connects freight to I-5 at the North Medford Interchange and to the Central Point Interchange via Vilas Road.
Issues
It is difficult to make a safe left turn in the face of oncoming traffic.
Congestion all along Highway 62 from the combined traffic of shoppers, commuters, vacationers, and freight.
Stop and go traffic, created by numerous stoplights, wears on truck brakes and transmissions.
Signal cycles are not suited to the extra time trucks need to move through intersections.
Severe congestion at the intersection with Delta Waters Road.
It is hard to maneuver trucks from the Crater Lake Avenue frontage road onto the highway at the Vilas Road intersection.
A later section of this report speaks more specifically about intermodal facilities, but in all situations, the common connection is to the road system. Air cargo transfers to trucks on the east side of the airport, and requires efficient street connections to Highway 62 for distribution throughout the

180
region. Connecting rail and the road system is possible along the length of the railroad, but most sidings are at lumber product manufacturing sites. A dedicated intermodal transfer site should benefit this segment of freight management.
Rail
Two firms provide rail transportation in the Rogue Valley. Central Oregon & Pacific Railroad (CORP) purchased the Southern Pacific Line in 1995. Known as the Siskiyou Line, it was originally part of the main line between Oregon and California, completed in the 1880s. The portion of the line south from Medford is one of the steepest rail lines in the western part of the nation with gradients that approach 3.25 percent. In 1926, Southern Pacific completed a new line between Eugene and Black Butte, California, via Oakridge and Klamath Falls, relegating the Siskiyou Line to secondary status. CORP owns the line extending from Eugene west to Coos Bay and south through the Rogue Valley to Black Butte near Weed, California, and covering 449 miles. The line s volume has grown from 30,000 carloads per year to 50,000 carloads.
Listed according to volume, CORP delivers sand and gravel from Gold Hill to Certainteed in White City, veneer to various mills, feed, and fertilizer to Grange Co-op, and a nearly even volume of asphalt and propane. Outgoing products include lumber and plywood, oriented strand board, products from Certainteed, and particle board. Nearly 90 percent of transfers are rail-to-rail, typically switching full carloads from one train to another.
Poor track conditions and inadequately sized tunnels to both the north and south hamper rail traffic growth in the Rogue Valley. While there is a growing market in piggyback containers, tunnel diameters are too small to accommodate them. CORP is investigating the cost/benefits of enlarging at least the tunnels to the south to improve access to California markets. At this time, the cost of enlarging tunnels between the Rogue Valley and Roseburg reduces the viability of making similar improvements to the north.
White City Terminal Utility (WCTU) manages a spur line extending from Tolo (near the intersection of Blackwell Road and Kirtland Road) to White City. The following figure lists the commodities transported by WCTU.

181
FFiigguurree 1155--77 CCoommmmooddiittiieess fflloowwiinngg ttoo aanndd ffrroomm WWhhiittee CCiittyy IInndduussttrriiaall AArreeaa vviiaa WWCCTTUU ((rraaiill)) iinn 22000011
Firm Commodity Received
Origin, if Identified Commodity Sent
Spectrum (Boise Cascade Veneer Particle Board White City Plywood (BC) Veneer Yreka, Weed Plywood Medply Veneer Plywood Medford Ready Mix (LTM) Cement, fly ash Cement
Waver Forest Products (mill) Strandboards British Columbia Lumber; strandboard beams
LTI Methanol, urea Fertilizer; glue; formaldehyde
Georgia Pacific Veneer Plywood Boise Cascade; Boise Cascade LVL Strandboards Strandboard beams
Willamette Egg Farm Corn; mash
Garris Environmental Caustic soda Oils, antifreeze to recyclers
Royal Oak Charcoal
VSS Emultech Lignite; Asphalt Montana Asphalt; lignin sulfanate
Kodak Imation Methyl ethyl ketone (MEK) Baton Rouge MEK
Public funding for rail improvements lags behind public funding for highway improvements. The state legislature recently passed a bill that provides grant funds for shortline track improvements. Congress is also considering a Railroad Modernization Act. It would provide funds for shortline railroads to make system changes allowing them to handle larger cars.
Aging tracks slow rail transport on many segments of the rail system serving the Rogue Valley. A study published in 2001 evaluated the benefits of providing a commuter rail line between Grants Pass and Ashland. A commuter rail system using an existing corridor would support efficient freight movement by improving track conditions, thus permitting greater speeds and safety through much of the Rogue Valley.
The Freight Study concluded that the rail system was among five crucial transportation improvements that would most benefit freight movements in the Rogue Valley. Following are findings from the study:
The local rail system consists of the Central Oregon and Pacific Railroad (CORP) and a small branch off CORP called the White City Transportation Utility (WCTU) that serves many of the users in White City.
Heavy bulk items are most often shipped by rail. Top inbound shipments in White City consist of sand, veneer, feed, and fertilizer. Top outbound shipments consist of lumber and plywood, sand, clay, cement, siding, and particle board.
One railroad car holds the same volume as 2.5 truckloads, providing relief to the road system.
According to one CORP official, 10,000 cars per year move through the region, carrying approximately 85 million pounds of freight.

182
Issues
The size and curvature of tunnels on the rail system heading south to California do not allow the transport of ocean-going containers, piggybacks , or the largest models of railroad cars. This keeps freight on the roads, rather than distributing it over both rail and road systems. Estimated cost for tunnel work: $7 million.
Railroad tracks, originally constructed with the goal of reaching a number of timber producing properties, wind through the countryside. Those indirect routes now cost companies time and make them less competitive. Constructing new, straighter lines would decrease delivery times and costs. Estimated cost for track work: $5 million.
The rail system suffers from basic infrastructure in need of repair and modernization. Railroad companies believe that government should support rail improvements to the same degree that it supports other parts of the transportation system, such as the interstate highway system.
Air
Rogue Valley International-Medford Airport serves as a primary commercial service airport for southwest Oregon. It is located in the northwest corner of Medford and its service area extends into northwest California. The airport has two main runways, the longest being 8,800 feet. A 3,155-foot auxiliary runway provides service to smaller planes during periods of crosswinds. The Airport Master Plan published in February 2001 reported that approximately 200,000 passengers boarded flights from Medford in 1998. There were 61,223 annual operations (landings and takeoffs) in 2002, down 1.64 percent from 2001. Horizon Air, United Express, and America West combine to provide 52 daily passenger trips.
Rogue Valley International-Medford Airport is one of ten airports in Oregon with scheduled freight service exceeding 50 tons per year. Air freight carrier facilities based at the airport include Airborne Express, Federal Express, Horizon Airlines, and United Airlines. Local freight carriers who use the airport are Air Enterprises, Ameriflight, Avery Air Express, Delivery Express, DHL Express, H&S Package Delivery, Medford Air Cargo, ORCA, RJ Fulk, Secured Carrier, Summit Trade Systems, Swift Couriers, Trans Box Systems, UPS Medford and Grants Pass, United Couriers, U.S. Mail Contractors, Velocity Express, and Western Parcel Service.
Separate from the freight study survey, a shippers survey conducted by Coffman Associates in October 2000 evaluated the airport s market potential. Companies provided the principal destinations of their outbound shipments and the point of origin for incoming shipments. The following figure lists the top five responses in each category:

183
FFiigguurree 1155--88 AAiirr FFrreeiigghhtt OOrriiggiinnss aanndd DDeessttiinnaattiioonnss
ORIGINS AND DESTINATIONS TO/FROM MEDFORD/JACKSON COUNTY
Destinations Origins
Domestic International Domestic International
Minnesota Canada California Thailand Colorado England Nebraska India Alaska Germany Colorado France California Switzerland Florida Germany Illinois Mexico New York England Source: Coffman Associates Survey
Based on cargo weight estimates supplied by shippers, the consultant concluded that 200 tons are shipped domestically and 180 tons are shipped internationally per year.
Volumes of freight passing through the airport are relatively small, but the designation in 1995 of a portion of the airport property as Foreign Trade Zone (FTZ) No. 206 increases the potential for growth. Foreign Trade Zones are specially designated areas, in or adjacent to a U.S. Customs Port of Entry, which are by definition outside the Customs Territory of the U.S. The designation has a major related benefit of requiring the presence of local customs agents who, because they are available to inspect FTZ products, can also inspect items flowing into the market for which duty is paid. Other services available at what is known as the Airport Commerce Park are the U.S. Immigration and Naturalization Service, U.S. Department of Agriculture, U.S. Fish and Wildlife, Southern Oregon International Trade Council, Foreign Commercial Service/Export Assistance, and the International Wildlife Recovery Center. The facility is positioned to become an increasingly significant intermodal facility, permitting transfers between trucks and planes. The loss in January 2003 of a customs official at the FTZ was a significant blow to immediate growth of international freight trade, but the loss is considered temporary until demand exists for an on-site agent. For very large shipments, it would still be possible to bring a customs agent to Medford for a fee.
Surface connections are vital to the efficient function of air cargo. Connectors to the FTZ headquarters include Commerce Drive, Vilas Road, Figure Rock Road, and the Medco Haul Road. Vilas Road was widened to accommodate increased traffic, and Coker Butte Road is being extended west of Crater Lake Highway to serve the vicinity of the air cargo center.
Recently extended runways and other improvements allow larger planes to land, improving cargo capabilities. For example, runway expansion has allowed a large Antonov jet to transport Erickson Air Crane products worldwide. An apron constructed at the Foreign Trade Zone facility can accommodate three large planes at a time.
Pipeline
A natural gas line managed locally by Avista Corporation is the only pipeline serving the Rogue Valley. While national security risks prevent Avista from providing details about the location of the facility, the pipeline originally extended from Portland to Medford. A subsequent project connected

184
Medford to a line that crosses central Oregon, permitting a loop system to exist. The value of completing a loop system was confirmed when the original line was disabled by an explosion near Wolf Creek, yet service to the Rogue Valley remained uninterrupted.
Avista provided the following information:
FFiigguurree 1155--99 CCoonnssuummppttiioonn ooff nnaattuurraall ggaass iinn tthhee ggrreeaatteerr MMeeddffoorrdd aarreeaa
Year Therms Consumed
1997 69 million therms 1998 77 million therms 1999 78 million therms 2000 77 million therms
FFiigguurree 1155--1100 PPrroojjeecctteedd ccoonnssuummppttiioonn ooff nnaattuurraall ggaass iinn tthhee ggrreeaatteerr MMeeddffoorrdd aarreeaa Year Therms Consumed
2002 73 million therms 2003 75 million therms 2004 77 million therms 2005 80 million therms 2010 95 million therms 2015 113 million therms
Since 1997, the use of natural gas as a motor fuel for vehicles in the greater Medford area has offset the transport of 668,000 gallons of gasoline and diesel fuel. Rogue Valley Transportation Districts
use of natural gas has also offset the transport of 579,000 gallons of diesel needed for bus transport.
Intermodal Facilities
Section 1006 of the Intermodal Surface Transportation Efficiency Act (ISTEA) provided for the creation of a National Highway System (NHS), the purpose of which "is to provide an interconnected system of principal arterial routes which will serve major population centers, international border crossings, ports, airports, public transportation facilities, and other intermodal transportation facilities and other major travel destinations." The NHS Intermodal Connectors in the study area include East Pine Street from Interstate Highway 5 to Hamrick Road, Airport Road, and Biddle Road between Hamrick Road and Oregon Highway 62. These are the main access routes between Medford-area highways and the region's primary intermodal facility: the Rogue Valley International-Medford Airport.
Secondary intermodal facilities exist at rail sidings, where goods brought by rail are transferred to trucks. Most of this activity occurs at wood products facilities. Improvements to intermodal facilities will enhance efficient freight transportation throughout the region.
Recommendations
The Freight Advisory Committee and MPO Technical Advisory Committee developed a priority ranking of freight improvement projects identified during shipper and hauler interviews. The ranking

185
culminates a process of identifying issues and problem routes that led to a list of specific potential projects. The following factors guided the scoring and ranking process:
Assign higher priority to projects on routes that are important to freight mobility. (maximum 30 points) While the freight map in the Regional Transportation Plan included all arterials and collectors as freight routes by definition, maps for the freight study have been refined to reduce the number of routes. Because the freight routes will accommodate the majority of freight trips, the most efficient expenditure of funds will usually be on established routes. Projects on other routes may qualify if they can be shown to directly support freight mobility.
Select projects serving commercial, industrial, or resource extraction land, where an inadequate transportation network impedes freight-generating development. (maximum 30 points) White City has significant areas that are not yet developed, some of which will be limited by environmental issues, but other areas near the airport are vacant and available for industrial use, limited at this time by access.
Assign higher priority to projects that would support multimodal freight transportation movement. (maximum 10 points) A single project, such as an intersection improvement, may improve the geometrics for turning movements at the specific intersection, but may also provide better access to the airport or to rail, increasing connections with other travel modes.
Assign higher priority to projects that would remove identified barriers to the safe, reliable, and efficient movement of goods. (maximum 30 points)
Staff applied the criteria to the master project list and prepared a preliminary scoring of the projects for advisory committee review. The project rankings are the result of the final two FAC meetings.
The priority list does not carry an assumption that projects must be completed in sequence, but it does establish the committee s assessment of what is most important to improve freight movements in the Rogue Valley. Only the projects listed in Tier 1 of the 2001-2003 RTP are constrained , with funding identified. The Policy Committee will need to determine if any of the any of the following projects, which the Freight Committee identified as important for improving freight transport, should replace any of the existing Tier 1 projects. Because of funding limitations, it is not possible simply to add the recommended projects to the Tier 1 list. Project numbers in the following figure 15-11 reflect the numbers on the map titled Problem Routes, Intersections and Potential Solutions. Figure 15-12 shows the same information in map form.

186
FFiigguurree 1155--1111 RReeccoommmmeennddeedd PPrroojjeeccttss
Rank Project Number Project Importance
to Freight
Create and
Sustain Jobs
Multi-modal
Remove Barriers
Total Score
1 15 Coker Butte at Highway 62 30 25 6 24 85
2 7 Southbound Loop Ramp, Blackwell Interchange
30 24 0 30 84
3 9 Figure Rock Road, Pine Street/Biddle Road to Wilson
30 22 0 30 82
4 2 Smooth Avenue G and Kirkland Road Intersection 30 20 0 30 80
5 4 Figure Rock Road and Blackwell Road Intersection 30 20 0 30 80
6 10 Figure Rock Road and West Vilas Road Intersection 30 14 0 30 80
7 17 Figure Rock Road and Hamrick Road Intersection Improvements 20 30 0 30 80
8 12 East Vilas Road: Haul Road to Crater Lake Avenue 30 12 6 30 78
9 21 Improve east/west flow on Pine Street 30 10 6 30 76
10 22 Improve traffic flow at Central Point 1-5 interchange 30 10 6 30 76
11 27 Fern Valley 99 to North Phoenix 30 15 0 30 75
12 6 Widen Avenue G and Highway 62 Connection 30 20 0 24 75
13 16 Delta Waters at Highway 62 30 10 4 30 74 14 1 Rehabilitate Avenue G 30 30 3 5 68
15 8 Figure Rock Road; Wilson to Antelope Road 30 22 0 12 64
16 28 Phoenix: Houston Road to industrial site 20 20 6 18 64
17 3 Antelope Road: Figure Rock to 7th
Street 30 0 2 30 62
18 11 New Traffic Signal at East Vilas Road and Airway Drive 15 30 3 12 60
19 5 Widen Kirtland Road- High Banks to Blackwell Road 30 10 0 18 58
20 13 North Runway Drive Extension 0 30 3 22 55
21 18 Repair Hamrick Road, south of Pine Street
5 30 0 18 53
22 19 Figure Rock Road intersection with Airport Road
20 10 2 18 50
23 23 East Pine and Peninger intersection
10 10 0 30 50
24 26 Highway 238, Jacksonville and west of Jacksonville
20 10 0 20 50
25 25 Ross Lane: (Old) Jacksonville Hwy to McAndrews Road 25 0 0 24 49
26 29 Hersey Street at North Maine 20 10 0 18 48
27 20 Figure Rock Road: Bear Creek to Pine Street/ Biddle Road 20 10 0 10 40
28 14 Extend Owen Drive 0 0 5 30 35
29 24 Ross Lane: McAndrews Road to Rossanley Road
10 0 0 18 28
Conclusions
The freight transportation industry is strong in Jackson County, building on its proximity to California as a staging area for modifying trucks from two to three trailers and vice versa. The vibrant agriculture and forest products industries continue to require transportation services and a

187
growing segment of manufacturers not using farm or forest resources are replacing job and freight volume losses in the resource-based industries.
Air freight is poised for continued growth. Expansion of the runway enables larger planes to use the airport, and development of high technology products can take advantage of the faster delivery times provided by air delivery. The Foreign Trade Zone stands ready to accommodate international trade, and will play a more significant role when freight volumes again warrant the presence of a customs agent.
Aging infrastructure and inability of tunnels to accommodate containers (piggyback) and longer cars with greater weight allowances hamper rail freight. Potential improvements to the south through the Siskiyous would open the Rogue Valley to improved rail technology. High costs for similar improvements diminish rail potential to the north, but if the commuter rail proposal moves forward, the necessary track improvements between Grants Pass to Ashland would also benefit rail freight.
Pipelines remain a smaller component of freight movement in the Rogue Valley, but use of natural gas is projected to grow. Gas delivered by pipeline reduces to a small extent the number of fuel-delivery trucks on highways and local roads.
In addition to the freight profile, the freight study includes documents outlining the strengths, weaknesses, and possible improvement to the area s freight system.

§̈¦5
§̈¦5
tu238
tu140
tu66
tu62
tu234
Medford
Ashland
Central Point
Eagle Point
Talent
Phoenix
White City
Jacksonville
Gold Hill
Butte Falls
AGAT
E
TAB
LE R
OC
K
VILAS
FOO
THI L
L
MAIN
STAGE
MEA
DO
WS
BLACKWELL
PINE
KIRTLAND
PHO
ENIX
BUTTE FALLS
OLD STAGE
8TH
BEALL
BARNETT
ANTELOPE
BROWNSBORO
STEWART
CO
LUM
BU
S
HA
NLE
Y
SAGE
KIN
GS
AVENUE G
TALENT
RO
GU
E R
IVER
SHASTA
CADY
CR
ATER
LA
KE
BID
DLE
RILEY
LINN
TRESHAM
GREGORY
WILSON
JACKSONVILLE
COLVER
UPTON
TAYLOR
VALL
EY V
IEW
WAGNER CREEK
DUM
P
JACKSON
ALTA VISTA
MCANDREWS
2ND
10TH
SCENIC
VOO
RH
IES
PAC
IFIC
REE
S E C
REE
K
HA
MR
ICK
LEA
R
BELLINGER
ORE
GO
N
KER
SHAW
BROAD
HILTON
LEIGH
MAIN
STAGE
MAIN
OLD S
TAGE
OLD STAG
E
O0 1 2 3 4
Miles
Map created on January 24th, 2005
RVMPO 2005 REGIONAL TRANSPORTATION PLAN
L
E
G
E
N
D
Urban Growth Boundary
Water Features
Interstate
Highways
Streets
MPO Boundary
Freight Projects
Freight Project
Opportunity Site
F i g u r e 1 5 - 1 2

189
1166.. TTRRAANNSSPPOORRTTAATTIIOONN SSAAFFEETTYY EELLEEMMEENNTT
IInnttrroodduuccttiioonn
Safety [with security] comprises one of seven planning factors in TEA 21 that must guide state and regional transportation planning. According to the Bureau of Transportation Statistics(BTS) Safety data Action Plan:
Deaths and injuries are a major cost in transportation. Transportation fatalities rank third as the cause of lost years of life in the U.S. (behind heart disease and cancer). Several travel modes have death counts whose impact exceeds that of AIDS. But the Department of Transportation has not yet responded to this public health threat by developing data programs as capable as those used in the federal medical community.
This transportation safety chapter covers the following:
The context for Rogue Valley transportation safety;
A discussion of the potential role of the MPO in transportation safety planning;
Rogue Valley modal safety data, where available; and
Recommendations for further RVMPO safety work.
The chapter seeks to address all major modes of transportation.
The ideal situation is that all elements of the multi-modal transportation system are safe. However, that is not always the case and plans must be made for elimination of physical transportation infrastructure hazards and problems to create a safer travel environment.
190
TEA-21 in 1998 required that both safety and security be addressed. While related, they are not the same and are tackled in two separate chapters. The simplest distinction between safety and security is that safety problems-- accidents are just that unpremeditated unfortunate events. As such, they may be caused driver error or impairment, adverse weather, a temporary hazard in the right-of-way, poor infrastructure, poor vehicle design, inadequate vehicle maintenance, or all of the above. By contrast, security events always connote a negative intention. (See Security Chapter)
NNaattiioonnaall AAcccciiddeenntt RRaatteess aanndd DDaattaa
At present, accident data comes from many varied sources. Figure 16-1 below summarizes the key sources:

191
FFiigguurree 1166--11 DDaattaa SSoouurrcceess oonn TTrraannssppoorrttaattiioonn
Data Source Agency Scale Frequency Coverage Contents Uses Availability
Fatality Analysis Reporting System
U.S. DOT, NHTSA
National
Continuous
All fatal crashes involving motor vehicles on public roads
Attributes of crash, vehicle, person, driver (100+attributes)
Fatal Crash Analysis
-Web query -CD-ROM -Summary tables: www.nhtsa.dot.gov/people/ncsa
National Automotive Sampling System-General Estimates System
US DOT, NHTSA
National
Continuous
Sample of police accident reports for motor vehicle crashes
Attributes of crash, vehicle, person, driver, (approx. 90 attributes)
Crash analysis
-CD-ROM -Summary tables: www.nhtsa.dot.gov/people/ncsa
National Transportation Statistics
US DOT, Bureau of Transportation Statistics
National
Annual Summary statistics bases on General Estimates System
Motor vehicle accidents by type; costs; trends
Conditions and Trends analysis
Published www.bts.gov
National Vital Statistics System
CDC, National Center for Health Statistics
National
Annual All deaths in United States
Cause, circumstances Conditions and trends analysis
Data and summary tables: www.cdc.gov/nchs
National Hospital Ambulatory Medical Care Survey
CDC, National Center for Health Statistics
National Annual Samples of injuries in
United States Cause (including motor vehicle)
Conditions and trends analysis
Data and summary tables: www.cdc.gov/nchs
Accident Facts
National Safety Council
National
Annual
Based on General Estimates System, National Center for Health Statistics data
Summary statistics on pedestrian, bicyclists, motor vehicle injuries
Conditions and trends analysis
www.nsc.org

192
Data Source Agency Scale Frequency Coverage Contents Uses Availability
National Electronic Injury Surveillance System
CPSC National Annual
Samples of injuries associated with consumer products
Injury characteristics and circumstances
Bicycle injury analysis
Request from CPSC
State Data System
US DOT, NHTSA
17 states
Data from police accident reports for motor vehicle crashes
Varies by state -Crash analysis -Conditions and trends analysis
-Data files available with state permission and fee -Summary information: www.nhtsa.dot.gov/people/ncsa
Crash Outcome Data Evaluation System
US DOT, NHTSA
States (19 currently)
Continuous/ annual
Links highway crash data to medical and financial outcome data
Cost, cost burden analysis
Contact individual states
State-level crash databases
State DOTs
State Continuous
Federal, state highways Crashes (location, characteristics
-Deficiency and needs identification -Crash analysis
Varies
Police accident reports
State, local police agencies
Local Continuous
All crashes with minimum damage value
Crashes (location, characteristics)
Crash analysis Varies
Safety Management Information Statistics
US DOT, Federal Transit Administration
National
Continuous/ annual
Incidents on transit property Incident characteristics
Pedestrian incidents involving transit vehicles, property
transit.safety.volpe.dot.gov
Federal Railroad Administration
US DOT, Federal Railroad Administration
National
Continuous/ annual
Incidents on railroad property/ right-of-way
Incident characteristics Pedestrian incidents involving railroad vehicles, property
safetydata.fra.dot.gov
Source: BTS

193
This, it may be observed that even obtaining good baseline data on accident rates is challenging, let alone relating transportation improvements to high accident infrastructure.
Figure 16-2 shows national 2000 fatality rates19. As may be observed from this figure and the next one, highway fatalities are by far the dominant type of transportation fatality, and thus preventive efforts tend to be focused on this mode above all others.
Safety is an important component of any effort to improve transportation operations, whether at the federal, state, regional or local level. According to a public information fact sheet on traffic safety published in 2000 by the National Highway Traffic Safety Administration: Deaths and injuries resulting from motor vehicle crashes are the leading cause of death for persons of every age from 4 through 33 years old (based on 1998 data). Traffic fatalities account for more than 90 percent of transportation-related fatalities. Safety measures do make a difference, however. According to the National Highway Traffic Safety Administration, conditions improved in the last decade:
Fortunately, much progress has been made in reducing the number of deaths and serious injuries on our nation s highways. In 2000, the fatality rate per 100 million vehicle miles of travel fell to a new historic low of 1.5, down from 1.6, the rate from 1997 to 1999. The 1990 rate was 2.1 per 100 million vehicle miles traveled. A 71 percent safety belt use rate nationwide and a reduction in the rate of alcohol involvement in fatal crashes
to 40 percent in 2000 from 50 percent in 1990
were significant contributions to maintaining this consistently low fatality rate.
20
19 2001 was the latest year of complete data available but the air carrier fatalities in that year are significantly distorted by 9/11. 20 U.S. Department of Transportation. National Highway Traffic Safety Administration s National Center for Statistics and Analysis. Traffic Safety Facts 2000. 2000.

194
FFiigguurree 1166--22 NNaattiioonnaall TTrraannssppoorrttaattiioonn FFaattaalliittiieess,, bbyy MMooddee,, YYeeaarr 22000000
Mode Number Percentage of Total
TOTAL fatalities 44,333 100.00%
Air, all 763 1.72%
U.S. air carrier 92 0.21%
Commuter carrier 5 0.01%
On-demand air taxi 71 0.16%
General aviation 595 1.34%
Highway, all 41,945 94.61%
Passenger car occupants 20,699 46.69%
Truck occupants, light 11,526 26.00%
Truck occupants, large 754 1.70%
Motorcyclists 2,897 6.53%
Bus occupants 22 0.05%
Pedestrians 4,763 10.74%
Pedalcyclists 693 1.56%
Other 591 1.33%
Railroad, all 937 2.11%
Highway-rail grade crossing 425 0.96%
Railroad 512 1.15%
Transit 295 0.67%
Waterborne, all 838 1.89%
Vessel-related 49 0.11%
Not related to vessel casualties 88 0.20%
Recreational boating 701 1.58%
Pipeline, all 38 0.09%
Hazardous liquid pipeline 1 0.00%
Gas pipeline 37 0.08% Source: Bureau of Transportation Statistics. For more detailed explanation of data, see Transportation Fatalities by Mode table in Appendix A
Figure 16-3 selects from this data the top transportation fatality areas as follows:
FFiigguurree 1166--33 YYeeaarr 22000000 NNaattiioonnaall TTrraannssppoorrttaattiioonn FFaattaalliittiieess iinn RRaannkk OOrrddeerr Mode Number Percent Rank
Trucks and Autos 32,979 74.39 1 Pedestrians 4,763 10.74 2 Motorcyclists 2,897 6.53 3 Railroad, all 937 2.11 4 Air, all 763 1.72 5 Recreational Boating 701 1.58 6
Source: Figure 16-2

195
Assuming these national figures hold approximately true for the Rogue Valley, then the ranking above should help set regional priorities for accident prevention, meaning that after highway safety, pedestrian safety should receive the highest attention.
RRVVMMPPOO SSaaffeettyy GGooaallss aanndd PPoolliicciieess
The RTP policies regarding traffic safety are consistent with the safety goals of the local MPO jurisdictions. These policies attempt to address safety in a range of areas, allowing for a balanced approach to reducing crashes.
As discussed in Chapter 3, the RVMPO Technical Advisory Committee, assisted by the RVMPO Public Advisory Council expended considerable effort in 2004 reviewing the goals and policies, and developed the following guidelines for safety:
Goal 2 Optimize Safety and Security on the Transportation System
Policy 2-1 Local governments, and ODOT where appropriate, shall work with other agencies to promote traffic safety education and awareness, including enforcing the City and State motor vehicle codes.
Policy 2-2 Improving vehicular, bicycle and pedestrian safety shall be a high priority consideration in the selection, design, development, and construction of street projects.
Policy 2-3 Working with ODOT where appropriate, local governments should ensure the safety of all current and future travel modes. This includes inventorying accident-prone areas and developing solutions.
Policy 2-4 Local governments and ODOT shall design and operate the transportation system to facilitate the safe and rapid movement of emergency first responders, and the evacuation of businesses and homes in the event of emergency. Transportation agencies shall coordinate with emergency evacuation and disaster planning agencies.
Policy 2-5 Local governments shall provide for safe intermodal connections.
RRoogguuee VVaalllleeyy MMooddaall SSaaffeettyy DDaattaa
Trucks and Autos
RVCOG has been investigating better methods of tabulating and mapping highway accident data in three major corridors in the Rogue Valley. The project aims to combine ODOT accident data with GIS mapping and database compilation. This ability is still evolving as data sources improve. The corridors are shown in Figure 16-4.

")
")
")
")
")
")
")
")
")
")
")
")
")
")
")")
")
")
")
")
")
")
")
")
")
")
")
")
")
")
!(
!(!(!(
!(
!( !(!(
!(
!(
!(
!(
!(
!(
!(
!(
!(
!(!(!(!(
!( !(!(!(
!(
#*
#*#*
#*
#*#*#*
#*
#*#*
#*
#*
#*#*#*
#*#*
#*#*
#*
#*
#* #* #* #* #*#*#*
#*#*#*#*#*
#*#*#*#*
#* #*#*#*#*
#*#*
#*#*
#* #*
tu62
Rogue Valley InternationalMedford Airport
Medford
Central Point
White City
TAB
LE R
OC
K
VILAS
CR
ATER
LA
KE
BEALL
KIRTLAND
PINE
AG
ATE
ANTELOPE
MCANDREWS
JACKSON
HA
NLE
Y
SAGE
AVENUE G
UPT
ON
SPRING
TAYLOR
ROSS
BID
DLE
GREGORY
WILSON
GIBBON
GR
AN
T
OLD
STAGE
BLACKWELL
11TH
MAIN
PENINGER
COREY
3RD
SCENIC
POPL
AR
S PR
ING
BR
OO
K
HAMRICK
GEB
HA
RD
10TH
DIVISION
2ND
CENTRAL
PAC
IFIC
DELTA WATERS
STEVENS
AVENUE C
LEA
R
MERRIM
AN
HOPKINS
BEEBE
BU
LLO
CK
SUN
RIS
E
HOLLY
RO
YAL
8TH
AVENUE A
OREGON
ROBERTS
BU
RSE
LL
HAZEL
MORROW
CO
LUM
BU
S
LONE PINE
GLA
DST
ON
E
FRE E
MA
N
CEDAR LINKS
HILTON
LEIGH
4TH
7TH
EDWARDS
CARDINAL
OA
KD
ALE
MANZANITA
LAWNSDALE
NA
PLES
BIDDLE CLH OFF
HILLCREST
SPR
ING
BR
OO
K
10TH
RO
SS
OLD
STA
GE
3RD
SPR
ING
BR
OO
K
OLD STAGE
MAIN
RO
SS
FREE
MA
N
4TH
GR
AN
T
4TH
O0 0.25 0.5 0.75 1
Miles
Map created on January 4th, 2004
L
E
G
E
N
D
Urban Growth Boundary
Water Features
Interstate
Highways
Safety Study Corridors
Streets
MPO Boundary
Safety Study Corridors
!( 2000
#* 2001
") 2002
Safety Study CorridorTraffic Accidents
with injuries +/or fatalities
RVMPO 2005 REGIONAL TRANSPORTATION PLAN
F i g ur e 1 6 - 4

197
Two examples of the type of cause data are shown below in Figures 16-5 and 16-6. The first diagram shows a breakdown of driver error into more detail, on one specific corridor.
FFiigguurree 1166--55 CCaauusseess ooff AAcccciiddeennttss oonn TTaabbllee RRoocckk RRooaadd CCoorrrriiddoorr YYeeaarrss 22000000,, 22000011 && 22000022
The second shows a more detailed breakdown of driver error, in all corridors. These two diagrams indicate the type of accident data that will be available through better software applications.
FFiigguurree 1166--66 CCaauussee ooff IInnjjuurryy AAcccciiddeenntt ""DDrriivveerr EErrrroorr"" ffoorr tthhee YYeeaarr 22000000 AAllll CCoorrrriiddoorrss
RVCOG has also been examining the region s highest accident locations.
5
5
2
1
1
12
3
12
1
1
1
1
Speed Too Fast for Conditions
Did not Yield Right-of-Way
Disregarded Traffic Signal
Drove Left of Center on 2-way Road
Improper Overtaking
Followed Too Closely
Made Improper Turn
Other Improper Driving
Mechanical Defect
Other (not improper driving)
.05 - .07 Blood Alcohol Content
.20 - up Blood Alcohol Content
1
1
2
1
6
6
1
2
1
4
Left Turn into Oncoming Vehicle
Driving Unsafe Vehicle
Disregard Traffic Signal
Disregard Stop Sign
Failed to Avoid Stopped Vehicle
Did not have ROW
Failed to Decrease Speed for Slower Moving
Vehicle
Following too closely
Driving on Wrong Lane
Driving too fast

198
BBiiccyycclliinngg aanndd WWaallkkiinngg
For the most part, bicycle and pedestrian accident data exists only in raw form in the regions municipal and county police reports. The City of Medford is the exception
since 1996 in some
cases they have been gathering and entering pedestrian and bicycle accident data. It is available by intersection and a notation indicates if a fatality occurred and if alcohol was involved. No other details are currently available. Medford indicates that bike and pedestrian accidents are few and far between, with the vast majority of accidents being vehicular only. If so, this is not consistent with national data, as shown in Figures 16- 2 and 16-3 and Appendix A.
Beyond Medford, accident data would need gathering from individual police reports. There are many issues of compatibility of report formats, optimal software for extracting and tabulating or mapping data, and inconsistencies in reporting of street names and the like. A project in future years would be to work with police departments to establish standardized pedestrian and bicycle accident reporting formats and software, and to create a regional database.
RRaaiill
Rail Accidents and Incidents
Rail accidents and incidents include any collision between railroad on-track equipment and other vehicles or pedestrians at grade crossings; any event involving operation of railroad on-track equipment that results in damages to railroad property; and any event arising from railroad operations that results in death or injury, or, in the case of railroad employees, an occupational illness. Nationally, as shown in Figure 16-7, rail accidents are going down most likely because rail miles traveled have been going down.

199
FFiigguurree 1166--77 NNaattiioonnaall RRaaiill AAcccciiddeennttss aanndd IInncciiddeennttss aanndd HHiigghhwwaayy--RRaaiill IInncciiddeennttss
(Monthly data, not seasonally adjusted)
Central Oregon & Pacific Railroad (CORP) has had its share of accidents although only one since its takeover of the Siskiyou line involved injuries. A review of FRA records since 1995 indicates the following:

200
FFiigguurree 1166--88 CCOORRPP AAcccciiddeennttss iinn JJaacckkssoonn CCoouunnttyy 11999955 ttoo 22000033
Year Date Track Type
Primary Cause
Equipment Damage
Track Damage Killed Injured Railroad
Equipment
Speed in
Mph
Loco-motives Derailed
Cars Derailed
1995 No Jackson County Accidents
June 27 Main Equipment 62,000 15,000 0 0 Freight Train 17 0 7
1996 July 20 Main Human
Factor 75,000 10,000 0 0 Freight Train 20 0 5
1997 April 7 Main Track 133,000 160,000 0 0 Freight Train 11 0 9
1998 October 15 Main Track 45,000 3,000 0 0 Freight
Train 20 0 4
1999 No Jackson County Accidents
2000 No Jackson County Accidents
2001 March 26 Main Track 26,000 15,000 0 0 Freight
Train 10 0 6
2002 March 4 Main Equipment 50,000 20,000 0 0 Freight
Train 18 0 5
2003 March 4 Main Equipment 50,000 20,000 0 0 Freight
Train 18 0 5
*Primary cause of accident defined by first position of cause

201
Aviation
Aviation safety focuses on two groups of people
the flying public, and the overflown public.
Aviation safety is a highly regulated activity, managed by the Federal Aviation Administration and involving aircraft construction, repair, operations in flight, the airway system, airport design and airport operations. In flight, restrictions are less stringent on those flying independently (such as a private pilot with no passengers) and progressively more stringent as more passengers are carried. On the ground, the airport operator or manager can provide a well-designed and safe facility, but of course, this alone cannot assure safety since pilot error, equipment problems, weather and the like can also be major contributors to aviation accidents.
Rogue Valley International-Medford Airport consistently achieves high scores for a safe, well-run facility in its annual Part 1391 21 inspections. Furthermore, the new terminal, now about to go into design-build, is being planned partly for safety reasons, since aircraft currently must park too near the active runway and a greater parking apron space and thus, setback for parked aircraft, will be provided.
To protect the overflown public, the airport has Airport Approach (AA) and Airport Concern (AC) overlay zones, as shown in Figure 16-9. This means that the regular county and city land use zoning is supplemented or overlaid by an additional zone around the airport that seeks to ensure that major populations and tall buildings do not get located in the airport safety approach areas. The AA zone restricts the height of structures or activities that could be a hazard to aircraft taking off or landing. The AC overlay follows the requirements of Federal Air regulations Part 77 and permits the uses of the underlying zoning district, but prevents airspace obstructions, has eight restrictions, and requires a deed declaration to recognize the airport s preexistence for all single family dwellings .
Rogue Valley International-Medford Airport has seen only one fatal air crash of a private plane
since 1995, and only one scheduled carrier accident, which was not fatal.
21 Code of Federal Regulations (CFR) part 139

202
FFiigguurree 1166--99 RRoogguuee VVaalllleeyy IInntteerrnnaattiioonnaall--MMeeddffoorrdd AAiirrppoorrtt AArreeaa ZZoonniinngg

203
FFiigguurree 1166--1100 RRoogguuee VVaalllleeyy IInntteerrnnaattiioonnaall--MMeeddffoorrdd AAiirrppoorrtt AAcccciiddeennttss SSiinnccee 11999955
Current Synopsis
PDF Report(s)
Event Date
Probable Cause
Released Location Make /
Model Regist. Number
Event Severity
Type of Operation and Name
(Doing Business
As)
Probable Cause
Factual , Probable Cause
9/18/2003 12/30/2003 Medford, OR
Cessna A150K
N8351M Nonfatal Part 91: General Aviation
Probable Cause
Factual , Probable Cause
4/15/2003 12/30/2003 Medford, OR
Herb Six Northstar
N606HS Nonfatal Part 91: General Aviation
Probable Cause
Factual , Probable Cause
9/29/2002 7/23/2003
Medford, OR
Cessna 172S
N514SP Fatal(2) Part 91: General Aviation
Probable Cause
Factual , Probable Cause
7/22/2002 9/30/2003
Medford, OR
McDonnell Douglas 369D
N58295 Nonfatal Part 91: General Aviation
Probable Cause
Factual , Probable Cause
6/18/2002 9/30/2003
Medford, OR
Cessna 441 N564AC Nonfatal Part 91: General Aviation
Probable Cause
Factual , Probable Cause
5/5/2001 4/8/2003 Medford, OR
MBB BO-105C
N105RH Nonfatal NSCH Part 135: Air Taxi & Commuter
Probable Cause
Factual , Probable Cause
9/27/1998 1/11/2000
MEDFORD, OR
Piper PA-16 N5932H Nonfatal Part 91: General Aviation
Source: Bureau of Transportation Statistics
Ashland Municipal Airport has less stringent inspection requirements but design and operations requirements are essentially the same as for any public-use airport of its size and the airport regularly does a Master Plan and an Airport layout Plan update to address physical improvement needs.
However, as a smaller, rural airport with a shorter runway, Ashland Municipal has a potential for more safety problems, including trees off the runway as well as deer on the runway as possible safety hazards.22
FFoorreeccaassttss ooff 2200--YYeeaarr AAcccciiddeenntt GGrroowwtthh
Accident rate projections are not available for the region. On the one hand some of the highest priorities for transportation investment are to improve safety. On the other hand, growth and congestion tend to militate against greater safety and to indicate higher accident levels (if not RATES).
SSttrraatteeggiieess
Education
Since driver error and the failure of bicyclist and pedestrians to obey the rules of the road are factors in most crashes, traffic safety education can play a significant role in crash reduction. In addition,
22 FAA Form 5010

204
children, who are among the most vulnerable pedestrians, can be better protected through increasing their awareness of traffic hazards and safety rules. The City of Medford has begun an intersection camera program that should assist in improving safety.
Enforcement
According to the Oregon Department of Transportation:
Research indicates a direct relationship between traffic law enforcement and crash rates. At 1.63 officers per 1,000 population, Oregon is significantly below the national rate of 2.2.
23
Two common infractions that have a significant impact on traffic crash rates and severity are red-light running and speeding. These can be reduced through the consistent enforcement of safety-related traffic laws. Currently, the City of Medford is implementing an intersection camera program that should improve road safety.
Visibility
Visibility is important, especially at intersections, to allow motorists a clear view of signs, cyclists, pedestrians, and other cars. While vegetation is important, it cannot be allowed to obstruct a clear line of sight when needed for traffic safety purposes.
Project Selection
The RVMPO has surveyed the local jurisdictions street networks to determine areas where there is the most potential for safety improvement projects. Analysis has provided preliminary information to determine areas where safety projects may be most needed. Further investigation into the causes of crashes at these sites and possible projects to address those causes should be included in future planning, both at the regional and local level. This process will resume when ODOT s new safety database is in place.
PPoolliiccyy IIssssuueess aanndd AAccttiioonnss
The RVMPO should:
Using published sources, create annual tables of transportation accident and incident data by mode.
As resources and source agency databases allow, create Geographic Information Systems (GIS) related database files and maps of accident and incident data by mode.
23 PTS Statistics 2002 Goals. ODOT Transportation Safety Division Web Page. http://www.odot.state.or.us/transafety/Police (14 January, 2002)

205
Coordinate with appropriate lead agencies, with the primary focus being on highway and pedestrian safety improvements accidents since those constitute the highest number of accidents, but also focusing on transit safety needs.
Do not develop new policies and actions regarding rail and aviation safety as the entities responsible for those modes already address needs. Monitor this issue as programs evolve, including addressing the safety of airport ground access (see Chapter XX, Aviation Element).
Continue the work begun in FY 2004 to examine the nature of highway accidents in the region and possible hazard and design related mitigations.
Continue Intelligent Transportation Systems planning and project programming, particularly with a view to investments that will enhance safety.
Review with the Technical Advisory Committee the TIP scoring matrix and other specific funding program scoring matrices to ensure that safety projects receive appropriate weighting and priority in the TIP.
Regularly review the Tier 1 and Tier 2 project development process for the Regional Transportation Plan (RTP) to ensure that safety receives adequate priority in the development of the long-range project lists.
Identify additional transportation funding sources that are specifically targeted at safety projects to supplement the limited funds from conventional transportation sources.
Continue to stay abreast of research on transportation safety developed by national and regional agencies around the country, seeking out best practices that can be applied to the Rogue Valley.

206
1177.. TTRRAANNSSPPOORRTTAATTIIOONN SSEECCUURRIITTYY
IInnttrroodduuccttiioonn
For the first time at the federal level, TEA- 21, passed in 1998, called for states and MPOs to address transportation security issues. With safety, security comprises one of seven planning factors that must guide state and regional transportation planning. Furthermore, in 2002 Transportation Security Administration (TSA) was created with extensive requirements for operational and capital improvements relating to security. While the public s eye has been on passenger aviation, TSA s
mission relates to all modes.
A study done 7 months after 9/11/01 found that few MPOs or states had progressed in the direction of more focus on transportation security. Since then, several national and regional research efforts have been created to address the transportation security issue in more depth, but MPO work in this area is still limited.
This paper is a first step by the MPO to address transportation security in more depth in the Rogue Valley. It covers the following:
The context for Rogue Valley transportation security;
A discussion of the potential role of the MPO in transportation security planning;
Rogue Valley modal security data, where available;
Recommendations for further RVMPO security work; and
A bibliography.
The chapter addresses security, and addresses all modes of transportation.
207
NNaattiioonnaall BBaacckkggrroouunndd
Why are the Issues of Security Important to Regional Transportation Planning?
Safety and security are closely related, although distinct, aspects of all transportation modes
aviation, transit, highways, rail, pedestrian and biking systems. The ideal situation is that all elements of the multi-modal transportation system are both safe and secure. However, that is not always the case and plans must be made for prevention and readiness to address security and safety problems.
A recent study summarizes the evolving awareness:
Prior to September 11th, ..security issues were not an issue in most state and MPO surface transportation planning processes. Transportation Improvement Programs (TIPs) at the state and MPO levels did not contain allocations for security related issues. Agencies are now faced with determining how security concerns should be integrated into how we plan, design, implement and operate transportation facilities and services. Is security simply another goal for our transportation system that can be integrated into our planning similarly to how we accommodate safety concerns today, or does addressing security require more radical changes including such actions as redefining organizational structures, modifying basic planning processes and developing or refining planning methods, models and tools?
It concludes:
Over the next several years, security considerations will result in changes in how transportation is planned, designed, implemented and operated. Transportation goals, planning processes, databases, analytical tools, decision-making considerations, and organizational structures will change due to security concerns. Transportation will be on the front line in responding to security risks. The response to security concerns will cross-jurisdictional and functional lines and be among the most complex and important challenges to transportation professionals. While it may be too early to begin changing our long-range infrastructure network plans in response to security risks, there will be changes in spending priorities in the near term and most probably over a longer period of time .
Definitions
The simplest distinction between safety and security is that safety problems- accidents
are just that unpremeditated unfortunate events. As such, they may be caused driver error or impairment, adverse weather, a temporary hazard in the right-of-way, poor infrastructure or vehicle design, or all of the above. By contrast, security events always connote a negative intention, whether the perpetrator is a disgruntled single individual, a member of a gang, or a member of a political organization, that is, a terrorist. In number, terrorist attacks on transportation systems are few, with the vast majority of security breaches being perpetrated by non-political actors. But terrorist events, when they do occur, can be much more dramatic, harm many more people, and require much more

208
to address. Figure 17-1 provides a description of various types of security problems that can arise in transportation.
FFiigguurree 1177--11 TTyyppeess ooff TTrraannssppoorrttaattiioonn SSeeccuurriittyy PPrroobblleemmss
EVENT DESCRIPTION
Aggravated Assault
An unlawful attack by 1 person upon another for the purpose of inflicting severe or aggravated bodily injury. This type of assault usually is accompanied by the use of a weapon or by means likely to produce death or great bodily harm.
Arson To unlawfully and intentionally damage, or attempt to damage, any real or personal property by fire or incendiary device.
Burglary
The unlawful entry of a structure to commit a felony or a theft. This includes offenses known locally as burglary (any degree), unlawful entry with intent to commit a larceny or felony, breaking and entering with intent to commit a larceny, housebreaking, safe cracking and all attempts at these offenses.
Larceny/Theft
The unlawful taking, carrying, leading or riding away of property from the possession or constructive possession of another. This includes pocket picking, purse snatching, shoplifting, thefts from motor vehicles, thefts of motor vehicle parts and accessories, theft of bicycles, theft from buildings, theft from coin operated devices or machines, and all other theft not specifically classified.
Trespass To unlawfully enter land, a dwelling or other real property.
Vandalism
The willful or malicious destruction, injury, disfigurement or defacement of any public or private property, real or personal, without consent of the owner or person having custody or control by cutting, tearing, breaking, marking, painting, drawing, covering with filth, or any other such means as may be specified by local law.
Terrorism The willful or malicious destruction, injury, disfigurement or defacement of any public or private property [etc. as above] by domestic or foreign nationals for the purpose of making a political impact.
Source: Adapted from National Transit Database
Both accidents and security breaches may have similar consequences and the tools for their prevention overlap, so these two issues are treated side by side in this report.
Creation of TSA
On November 19 2001, in the wake of 9/11/01, the President signed into law the Aviation and Transportation Security Act (ATSA), which among other things removed security functions from FAA and established a new Transportation Security Administration (TSA) within the Department of Transportation. Subsequently it was transferred to the newly created Department of Homeland Security DHS). At the same time, many new security requirements for airports were added, and aviation has been TSA s primary focus thus far, although its mission is multimodal.
In 2004 DHS inherited the professional workforce, programs and infrastructure of the Coast Guard, Customs Service, Immigration and Naturalization Service, and the Transportation Security Administration. Collectively these public servants are responsible for protecting the nation's transportation systems and supervising the entry of people and goods into the United States. This is no easy task given that 730 million people travel on commercial aircraft each year and that there are

209
now more than 700 million pieces of baggage being screened for explosives each year. Additionally, there are 11.2 million trucks and 2.2 million rail cars that cross into the US each year. Also, 7,500 foreign flagships make 51,000 calls in US ports annually.
The DHS is responsible for protecting the movement of international trade across US borders, maximizing the security of the international supply chain, and for engaging foreign governments and trading partners in programs designed to identify and eliminate security threats before these arrive at US ports and borders.
ITS Program
In the past decade or so, a new federal transportation program focusing on information technology to address problems has been developed. This Intelligent Transportation Systems program can make a major contribution toward transportation security.24
ITS projects can assist in all four phases of security: planning, preparedness, response and recovery.
Key National Issues
Aviation
Immediately after 9/11/01, many restrictions came into place on both commercial and general Aviation (GA). One of the more significant is upgraded passenger screening. At this point, plans have been implemented to federalize all 429 commercial airports, that is, all security screeners now work for TSA rather than for contractors. Other changes include airport passenger lane reconfiguration and implementing new security technologies at security checkpoints at the nations
airports 25. The planned upgrades yet to come fall under the general label of CAPPS II.
The enhanced Computer Assisted Passenger Prescreening System (CAPPS II) is a limited, automated prescreening system authorized by Congress in the wake of the Sept. 11, 2001 terrorist attacks. The system, developed with the utmost concern for individual privacy rights, modernizes the prescreening system currently implemented by the airlines. It seeks to authenticate travelers' identities and perform risk assessments to detect individuals who may pose a terrorist-related threat or who have outstanding Federal or state warrants for crimes of violence.
CAPPS II will become a critical element in TSA's "system of systems" approach to security which includes thorough screening of baggage and passengers by highly trained screeners, fortified cockpit doors in all airliners, thousands of Federal Air Marshals aboard a record number of flights, and armed Federal Flight Deck Officers.
Under CAPPS II, airlines ask passengers for a slightly expanded amount of reservation information, including full name, date of birth, home address, and home telephone number. With this expanded information, the system can quickly verify the identity of the passenger and conduct a risk
24 Although it is also true that because of ITS installations dependence on computers and electrical power, they are also more vulnerable to security threats than are many other transportation elements. 25 See http://www.tsa.gov/public/display?theme=44&content=09000519800ac831

210
assessment utilizing commercially available data and current intelligence information. The risk assessment results in a recommended screening level, categorized as no risk, unknown or elevated risk, or high risk. The commercially available data will not be viewed by government employees, and intelligence information will remain behind the government firewall. The entire prescreening process is expected to take as little as five seconds to complete.
Once the system has computed a traveler's risk score, it will send an encoded message to be printed on the boarding pass indicating the appropriate level of screening. Eventually, the information relevant to the appropriate screening process will be transmitted directly to screeners at security checkpoints.
In the rare instances where a particular traveler has been identified as having known or suspected links to terrorism or has an outstanding Federal or state warrant for a crime of violence, appropriate law enforcement officers will be notified. A small percentage of passengers will require additional screening at the security checkpoint. The vast majority of travelers will go through the normal screening process.
Under the terms of a competitively awarded contract, Lockheed Martin Management and Data Systems (Lockheed) will assist TSA in developing the passenger risk assessment and prescreening system. Lockheed will develop, integrate, deploy and operate for TSA, a Risk Assessment System through a five-year task order contract that provides flexibility to TSA to accomplish the goals as outlined in the Aviation and Transportation Security Act.
A vital element of TSA's layered approach to security is to ensure that travelers who are known or potential threats to aviation are stopped before they or their baggage board an aircraft. CAPPS II is an integral part of that approach. It provides:
A stronger prevention system - CAPPS II will provide a more reliable screening result than is provided by the current airline operated prescreening system. It will seek to authenticate a passenger's identity and conduct a risk assessment. It also allows for updates as new intelligence is received and the threat level is modified.
Shorter waits at checkpoints -- By reducing the number of selectees requiring additional screening, CAPPS II will help speed up the screening process for the vast majority of travelers.
Focus for resources -- CAPPS II will enable DHS to focus its screening resources and as DHS is better able to assess the potential risks to passengers and aircraft, it will be able to allocate resources such as the Federal Air Marshals.
CAPPS II is scheduled to be implemented after testing and after Congressional requirements are met.
Most passengers will notice little change in the check-in process. Many will actually see improvements. For example, some travelers who receive secondary screening today because they are flagged in the outdated CAPPS I system will no longer be flagged and inconvenienced under the more sophisticated CAPPS II system. CAPPS II will improve aviation security because screening decisions will be more closely aligned with current intelligence information and threat levels.

211
HHiigghhwwaayyss
One of TSA s goals is ensuring that the security of the drivers and the cargo are not compromised. For more information, visit the Federal Motor Carrier section of the Department of Transportation website (need citation).
Field officials with the Federal Motor Carrier Safety Administration will be reviewing security measures with motor carriers and shippers that may be the target of terrorist attack. Its mission is to increase the level of awareness of hazardous materials carriers to terrorist threats. The FMCSA field staff will be providing information in the form of recommendations and suggestions, except those regulatory requirements affecting the actual movement of hazardous materials. Highlights of the Security Talking Points are outlined below. These recommendations may not apply to all carriers, based on their size and scope of operation. Additionally, this list is not all-inclusive and will be changed based on future priorities to address terrorist threats26.
USDOT / TSA plan to recommend to the carriers that a security plan be developed and implemented. It should include:
Personnel Security
Hazardous Materials and Package Control
En Route Security
Technical Innovations
Management Prerogatives
Communications
Reassessment Based Upon Current Conditions
They also recommend that management encourage input and participation in the development and implementation of the company's security program.
TTrraannssiitt
By law, 1 percent of urbanized funds / formula funds for transit are to be used for safety and security. More funding has been assigned since 9/11. The focus thus far from TSA has been on Greyhound and other Intercity Bus systems. Security Grants totaling $15 million will enhance security for intercity bus operations by focusing on protecting the driver; monitoring and communicating with over-the-road buses; implementing and operating passenger and baggage screening programs; assessing critical security needs and vulnerabilities; and training transportation personnel to recognize and respond to criminal attacks and terrorist threats, as well as in evacuation procedures. For more information, visit the Department of Transportation
and House of Representatives websites.
However, the security threat to bus operations is by no means limited to intercity services. A report prepared pre-9/11 brings home the fact that transit-related terrorism is nothing new:
26 More detailed guidelines for motor vehicle carriers are found at http://www.fmcsa.dot.gov/Aboutus/testimonies/SSV_Talk_Pts_Update.htm
212
Contemporary terrorists have made public transportation a new theater of operations. Algerian extremists set off bombs on the subways of Paris in 1995 and 1996; the Irish Republican Army has waged a long-running terrorist campaign against both passenger trains in England and London's subways; Palestinian terrorists have carried out suicide bombings on Israel's buses; an individual or a group calling itself "Sons of the Gestapo" derailed a passenger train in Arizona in 1995. Islamic extremists planned to set off truck bombs in New York's tunnels and bridges in 1993, and in 1997, they plotted suicide bombings in New York's subways. The nerve gas attack on Tokyo's subways by members of the Aum Shinrikyo sect in 1995 raised the specter that terrorists in the future might resort to weapons of mass destruction to which public transportation is uniquely vulnerable. Recent events make it clear that the threat continues: 1998 saw an attempt to derail Japan's bullet train and a threatened poison gas attack on Moscow's subway. In 1999, a bomb injured three persons at a Sydney rail station. In 2000, bomb threats shut down London's Underground; one bomb injured nine in Dusseldorf's Underground; another bomb killed nine and injured 60 on the Metro in Manila.
The authors go on to say that prior volumes of their research:
.contain a chronology of approximately 900 terrorist attacks and other significant criminal incidents involving public surface transportation systems. The chronology runs from 1920 to 2000; however, all but 14 of the events listed occurred after 1970, the year that marks the beginning of modern terrorism ..Despite efforts to include all significant incidents, the chronology should be considered representative rather than comprehensive. Thousands of incidents of ordinary crime, such as individual murders, rapes, armed robberies, and other assaults, are not included. Nor does the chronology report all the many bomb threats that are a common headache for transportation system operators.
While most of these reports are from overseas and depict a level of activity that had not been encountered in the US, in today s global society no country can consider itself immune from terrorism, while the traditional crimes of assault and vandalism must also be handled.
Recommended Approach to Transportation Security Planning
A TCRP report27 as well as many other sources group security planning into four subject areas:
Prevention activities;
Preparation activities;
Response activities; and
Recovery activities.
Within the highway mode, a summation of security risks, applicable to all modes, is shown in Figure 17-2. One source provides some general guidelines for security conscious planning that will likely have significant capital and operating cost implications, for it includes:
27 TCRP International Transit Studies Program. Safety and Security Issues at All-Bus Systems in Small to Medium Sized Cities in Western Europe. Research Results Digest, June 2003.

213
Security as a factor in design of all facilities
Fencing and other physical barriers
Access control and alarm systems
Closed circuit TV (CCTV)
Bomb shelter areas
Limiting availability of trash containers as receptacles for explosive devices
Emergency evacuation routes (both within building complexes and on the street network)
Handling of unattended items
Table top crisis response games AND field exercises.
TThhee PPootteennttiiaall RRoollee ooff tthhee MMPPOO iinn TTrraannssppoorrttaattiioonn SSeeccuurriittyy PPllaannnniinngg
Despite the requirements of TEA 21 to address security [as one of its seven planning factors], most MPOs did little until 9/11/01. One writer sums up the overall safety and security environment:
Prior to September 11th most concerns were focused on how best to include safety considerations in the transportation planning process. For example, many MPOs and DOTs have fairly advanced methodologies for selecting projects to be included in the Transportation Improvement Program (TIP) or Statewide Transportation Program (STIP). Scoring techniques are frequently used by MPOs in prioritizing projects for inclusion in TIP. From a sample of 13 MPOs, it was not uncommon for safety concerns to represent 10 to 20 percent of the point allocation for highway projects, but little recognition was given to security issues. Safety was defined as, actions required to reduce roadway crashes. Also, it was found that safety and security were frequently ignored in the prioritization of transit, intermodal, or enhancement projects. Those agencies that select all projects from one funding pot and do not stratify their programming evaluation into predefined modal or funding categories were more likely to explicitly include safety or security considerations when selecting non roadway projects. One interesting issue is how security measures can be defined and quantified for project selection. (1)
The first two of the four steps, prevention and preparation, are the primary focus for MPOs; while transportation systems and facilities, particularly transit systems, may be called upon to help move personnel in response to a security event, such a response will be coordinated by a higher level of government serving as Incident Command. Transportation agencies are unlikely to be lead agencies in such situations. Furthermore, Response and Recovery are operational activities not appropriately addressed in this Regional Transportation Plan. To address the transportation security issue for the first time, the RVMPO has adopted the following policy:
Policy 2-6 The Regional Transportation Plan shall support transportation security issues of local jurisdictions.
Nevertheless, Prevention and Preparation may require substantial resources, both for training and for capital purchases, and these projects and programs, with their costs, must be considered and ranked in the RTP.

214
FFiigguurree 1177--22 SScceennaarriiooss CCoonnssiiddeerreedd iinn tthhee UU..SS.. DDOOTT VVuullnneerraabbiilliittyy AAsssseessssmmeenntt
Physical Attacks
Car bomb at bridge approach Series of small explosives on highway bridge Single small explosive on highway bridge Single small explosive in highway tunnel Car bomb in highway tunnel Series of car bombs on adjacent bridges or
tunnels Bomb(s) detonated at pipeline compressor
stations Bomb detonated at pipeline storage facility Bomb detonated on pipeline segment Simultaneous attacks on ports Terrorist bombing of waterfront pavilion Container vessel fire at marine terminal Ramming of railroad bridge by maritime vessel
Attack on passenger vessel in port Shooting in rail station Vehicle bomb adjacent to rail station Bombing of airport transit station Bombing of underwater transit tunnel Bus bombing Deliberate blocking of highway-rail grade crossing Terrorist bombing of rail tunnel Bomb detonated on train in rail station Vandalism of track structure and signal system Terrorist bombing of rail bridge Explosives attack on multiple rail bridges Explosive in cargo of passenger aircraft
Biological Attacks
Biological release in multiple subway stations Anthrax release from freight ship
Anthrax release in transit station Anthrax release on passenger train
Chemical Attacks
Sarin release in multiple subway stations Physical attack on railcar carrying toxics
Cyber and C3 Attacks
Cyber attack on highway traffic control system Cyber attack on pipeline control system Attack on port power/telecommunications
Sabotage of train control system Tampering with rail signals Cyber attack on train control center
Source: National Research Council, Improving Surface Transportation Security, A Research and Development Strategy, Washington D.C: National Academy Press, 1999. One writer28 raises questions about how the new focus on security will be dealt with:
Are existing planning tools and models altered? Is the process amended to incorporate security? Is security another goal to add to the list along with subsequent objectives and performance measures? Can one simply screen all the jargon in plans and replace the term safety with safety/security , or is there a distinct difference? Do security concerns merit
changes in organizational charts, and how do the security responsibilities get spread across the federal, state, regional and local agencies involved in delivering transportation planning? Is security something that gets addressed in the public participation part of planning? How do the financial commitments to security initiatives get evaluated and how are tradeoffs made to reflect security concerns? And, is it premature to draw conclusions about how security impacts transportation planning?
This writer offers five Simplified Planning Process Steps:
1. Goal Development 2. Conditions Assessment 3. Needs Assessment 4. Project Identification

215
5. Project Programming
Another researcher addresses the funding priorities that are central to an MPO s work:
Investment Priorities -- Speculation has centered on whether security risks will have an influence on public attitudes toward transportation investments. Some have suggested that the economic value of transportation is being recognized, and this will aid efforts to increase investment in transportation. Others anticipate a renewed interest in having transportation choices; specifically enhanced funding for rail modes. Still others worry that diversions of dollars to enhance security will detract from capacity improvements. The Bush administration proposal for the 2003 budget suggests(Ed) at the aggregate level, overall national priorities for enhanced security may put pressure on available transportation resources in the short term. Transportation investment priority changes could result from a number of considerations.
Transportation Resource Pressures Resulting from Security Concerns
Diversion of resources to security needs outside of transportation programs
Diversion of funds to operating security enforcement/policing/planning/training
Diversion of funds to capital investments in security (barriers, fencing, inspection, etc.)
Use of funds to support network redundancy/connectivity
Use of funds to support modal choice/redundancy
Diversion of funds to design changes/enhancements to increase security.
Another source comments:
Post September 11th, actions suggest a variety of possible investment needs as a result of increased sensitivity to security risks. These needs range from near-term initiatives to conduct strategic planning and assessments to supporting enhanced enforcement levels such as those found at airports, to longer-term needs to alter the physical characteristics of individual transportation investments and the system or network of investments. Changes could range from rerouting roadway alignments from sensitive sites to removing trash containers from rail station platforms. Enhancements to ITS technology as a tool to utilize in incident prevention and incident response have been contemplated and simple design changes to enable additional vehicle inspection queues at border crossings or luggage and passenger scanning capacity at airports may be necessary. Revisiting the capability of our transportation network to handle special vehicles or military equipment in response to incidents or the exploration of modifications in our roadway network to more easily enable mass exodus from an urban area in response to a crisis are among the more complex and expensive strategies that might be pursued. Other major financial obligations could occur if decisions to change the connectivity or range of modal options in our transportation system were to move forward. Several interests, for example, have proposed major investments in high-speed rail in order to provide an alternative to dependency on air travel for longer distance trips. Additionally, certain travel behavior changes could result in different demands for transportation by various modes than are currently anticipated. This could result in changes in modal priorities, shifting geographic priorities, changes in project costs due to
216
design or other security related changes, or other shifts in long-range transportation facility and service plans.
RRoogguuee VVaalllleeyy MMooddaall SSeeccuurriittyy DDaattaa
Summary information is below:

217
FFiigguurree 1177--33 SSuummmmaarryy ooff RRoogguuee VVaalllleeyy,, OORR MMooddaall SSeeccuurriittyy IInnffoorrmmaattiioonn MODE PREVENTION PREPARATION RESPONSE RECOVERY
Transit - RVTD Facilities and equipment audits need formalizing.
Bus security enhancements are planned with next fleet acquisition. TransLink building is a secure site. Crater Lake Avenue and Front Street premises require improved security installations.
Response plan is in place. RVTD may assist in movement of people during response.
Recovery plan is in place.
New procedures are in place for passenger screening, baggage screening, vehicle drop-off zone controls, key card access to airside and other TSA requirements since 9/11/01.
Tabletop exercises (roughly 3 yr) are conducted with all emergency service agencies involved with aviation response. New terminal with state of the art security setup is under way (design-build contract to be let in fall 2004) and new biometrics keylock system planned for airside.
MFR works with other regional first responders in mutual aid agreements to respond to incidents and emergencies. TSA is a partner in planning the security aspects.
Airport resources may be part of a regional or local recovery plan and preparations are in place for such an event.
Aviation -Medford International
Ashland TSA reaching out to GA airports to assist them in appropriate planning.
Procedures for derailments in place. Emergency response planning is carried out on an ongoing basis. Reporting systems are in place for unauthorized access to hazardous materials. Hiring practices seek to ensure security through personnel screening.
See Prevention
Emergency response plans in place including a procedure to cooperate with local emergency responders.
Recovery plan is in place.
Rail - CORP
White City RR

218
MODE PREVENTION PREPARATION RESPONSE RECOVERY
Highway
ODOT is working with local and state emergency managers, Oregon State Police, USDOT and others to identify transportation facilities that may require special consideration in planning for response to terrorist incidents.
All ODOT employees have taken terrorism awareness training.
Phase 1: In crisis management is to report concerns to law enforcement and to cooperate with law enforcement as requested. Phase 2: In consequence management is described in the ODOT Emergency Operations Plan.
ODOT will continue to provide essential services to the public by identified critical business functions. Annex T, Critical Business Functions are in the ODOT Emergency Operations Plan.
Pipe and Power lines: Pacific Power
The Medford District Operations Center houses the Regional Emergency Action Center. Grants Pass, Crescent City, Yreka, Roseburg, Coos Bay, and Klamath Falls operations centers are subordinate to the Medford REAC. A failure to a portion of the system leading to power outages, is isolated from the entire system by a series of relays and circuit breakers. The National Electric Safety Code sets the ground rules for practical safeguarding of persons during installation, operations, and maintenance of electric supply and associated equipment. The NESC contains the basic provisions that are considered necessary for safety to employees and the public under specified conditions.
Trees are responsible for approximately half of all outages to Jackson County customers.
Overall service reliability is 99.96 percent.
Local Operation Managers are responsible for developing and
implementing emergency response plans. The plans
provide guidelines regarding responses to specific
emergencies to protect life, property, and the environment. The plans must also conform to
Superfund Amendment and Reauthorization Act Title III laws,
and comply with OSHA regulations. Medford serves as a
Regional Emergency Action Center to coordinate materials, personnel, and equipment to respond to major outages in
southern Oregon and northern California.
Pacific Power coordinates with other response agencies.
Crews are on call round the clock.

219
RReeccoommmmeennddaattiioonnss
The RVMPO should:
Using published sources, create annual tables of transportation security incident data by mode.
Analyze the available databases for policy and program directions and review conclusions with appropriate lead agencies.
Continue Intelligent Transportation Systems planning and project programming, particularly with a view to investments that will enhance security.
Working with regional lead agencies, assist in conducting security assessments / audits for each of the transportation modes in the region , addressing physical facilities and equipment, training levels, table top exercises and response / recovery plans. The role of the MPO in these audits should be to provide a source of information on national developments and guidelines, and to encourage a degree of consistency among modes in terms of the quantity and quality of data collected.
Regularly review with the Technical Advisory Committee the TIP scoring matrix and other specific funding program scoring matrices to ensure that security projects receive appropriate weighting and priority in the TIP.
Regularly review the Tier 1 and Tier 2 project development process for the Regional Transportation Plan (RTP) to ensure that security receives adequate priority in the development of the long range project list.
Identify transportation funding sources that are specifically targeted at security projects, so that the limited funds from conventional transportation sources are not inappropriately redirected to this area.
Continue to stay abreast of research on transportation security developed by national and regional agencies around the country and seek out best practices that can be applied to the Rogue Valley.

220
1188.. FFIINNAANNCCIIAALL EELLEEMMEENNTT
IInnttrroodduuccttiioonn
This chapter provides an overview of the funding required to implement the capital projects in the Street and Transit System Elements described in this Plan. Funding has been estimated over the 25-year duration of the plan and is linked to projects that comprise the Tier 1 (financially constrained) project lists. Tier 2 (financially unconstrained) projects cannot be funded with anticipated revenues and are shown in Appendix F.
The 25-year planning period has been divided into two three phases. These phases correspond to the years 2005-2009 (short-range), 2010-15- (medium-range) and 2016-2030 (long-range). Tier 1 projects have been included based on their ability to be implemented and funded during these phases. Tier 2 projects are not associated with a time phase due to the uncertainty of their implementation.
This element has been developed in consultation with the Oregon Department of Transportation, Jackson County and the cities of Medford, Central Point, and Phoenix, Ashland, Talent, Jacksonville, Eagle Point and the White City Urban Renewal Area. The development of this Element has also been guided by the following documents:
Ashland Ashland TSP April 1998
Talent Talent TSP, June 2001
Medford City of Medford TSP, Nov. 20, 2003
Eagle Point City of EP TSP 1997-2017, Rev. 6/2001
Jackson County Jackson Co TSP 3/2004 ; White City TSP 3/2004
Financial Assumptions for the Development of Metropolitan Transportation Plans, Oregon Department of Transportation, December 2004
This Element describes the financially constrained Street and Transit Elements project lists in conformance with both Federal and State air quality requirements (OAR 342-252-0090).
221
GGuuiiddiinngg PPrriinncciipplleess
Several policies and goals guide this Element:
Policy 3-5 Prioritize investments to ensure existing transportation system preservation.
Goal 4 Develop a Plan that Can Be Funded and that Reflects Responsible Stewardship of Public Funds
Policy 4-1 Local governments, ODOT and the MPO shall develop innovative and sound funding policies to implement the Regional Transportation Plan.
Policy 4-2 Local governments, ODOT and the MPO shall ensure that the costs of planned improvements are consistent with transportation policies.
Policy 4-3 Local governments, ODOT and the MPO shall maximize efficient use of all transportation resources: for planning, design, project development, construction management, and construction itself with contemporary, state of the art approaches including public-private partnerships and design-build, and create projects that maximize the value of public investments.
Policy 4-4 Local governments should develop, fund and implement maintenance programs for the transportation facilities they build.
Policy 4-5 Local governments should establish and maintain funding mechanisms, such as System Development Charges, to collect a proportionate share of the cost of facility improvements from new developments.
SSttrreeeett SSyysstteemm RReevveennuuee SSoouurrcceess
The Federal, State and local revenue sources that are used to fund Street System projects are described below. Estimates of capital funding availability required for Medford, Central Point, and Phoenix, Ashland, Talent, Jacksonville, Eagle Point and the White City Urban Renewal Area projects are shown in Figure 18-1.
Figure 18-1 shows how the various revenue sources are expected to contribute as a percentage of total revenues to the jurisdictions through 2030. As the Figure shows, the primary transportation funding source in the region is the State Highway Fund, which varies from 23 to 53 percent of the annual revenues for the RVMPO cities.

222
FFiigguurree 1188--11 PPeerrcceennttaaggee ooff FFoorreeccaasstt 22000055--22003300 RRVVMMPPOO CCiittyy RReevveennuueess FFrroomm AAllll SSoouurrcceess
Revenues Local Jurisdiction
Federal State SDCs Fees Other
Totals
Ashland 6% 31% 12% 42% 10% 100%
Central Point 14% 53% 33% 0% 0% 100%
Eagle Point 6% 23% 57% 11% 2% 100%
Jacksonville 25% 26% 14% 35% 0% 100%
Medford 1% 26% 19% 43% 10% 100%
Phoenix 23% 32% 12% 19% 14% 100%
Talent 17% 37% 25% 11% 10% 100%
Federal Revenue Sources
Federal Earmarks
Earmarks are funding allocations that are tied directly to a project through the legislative process. For example, Congressional authorization of TEA-21 in 2004 included $2 million to fund completion of the Bear Creek Greenway. These are the only projects in the RTP that are being funded through this source. Although additional earmarks may be awarded in future years, no such assumption has been made to estimate future revenues.
Interstate Maintenance --USC Title 23.119
With funding from the Highway Trust Fund, this program funds resurfacing, restoring, rehabilitating, and reconstructing the Interstate Highway program in the continental United States, Alaska and Puerto Rico. Expansion of the capacity of any Interstate highway or bridge, where such new capacity consists of one or more new travel lanes [that are not high-occupancy vehicle lanes or auxiliary lanes,] is not eligible for funding under this section.
Surface Transportation Program (STP)
The STP, an intermodal block-grant-type program, provides funds for a broad range of transportation uses. Projects can include highway and transit capital projects, carpool projects, bicycle and pedestrian facilities, planning, and research and development. STP funds are allocated to the State and sub-allocated to MPOs, cities (outside of an MPO), and counties on a formula basis by the Oregon Transportation Commission.
223
Congestion Mitigation and Air Quality Improvement Program (CMAQ)
The Intermodal Surface Transportation Efficiency Act (ISTEA) created the CMAQ program to deal with transportation related air pollution. States with areas that are designated as non-attainment for ozone or carbon monoxide (CO) must use their CMAQ funds in those non-attainment areas. A state may use its CMAQ funds in any of its particulate matter (PM
10) non-attainment areas if certain requirements are met. The projects and programs must either be included in the air quality State Implementation Plan (SIP) or be good candidates to contribute to attainment of the National Ambient Air Quality Standards (NAAQS). If a state does not have any non-attainment areas, the allocated funds may be used for STP or CMAQ projects. CMAQ requires a 20 percent local match unless certain requirements are met.
STP Transportation Enhancements Program
Each state must set aside 10% of its yearly STP revenues for Transportation Enhancement Activities, which comprise a broad range of projects. Enhancement funds are allocated to local jurisdictions throughout the state on a competitive basis. Eligible transportation enhancement projects include pedestrian and bicycle facilities; preservation of abandoned railway corridors; landscaping and other scenic beautification; control and removal of outdoor advertising; acquisition of scenic easements and scenic or historic sites; scenic or historic highway programs; historic preservation; rehabilitation and operation of historic transportation buildings, structures, or facilities; archaeological planning and research; and mitigation of water pollution due to highway runoff. Enhancement projects require a 20-percent non-federal match.
STP Safety Funds
Each state must set aside 10 percent of its base STP funds for safety programs (hazard elimination, rail-highway crossings, etc.). The match rate for safety projects is 80 percent federal, 20 percent state or local.
Highway Bridge Replacement and Rehabilitation Program (HBRR)
The HBRR Program provides funds to replace or maintain existing bridges; new bridges are not eligible for funding under this program. Currently, Bridge Replacement and Rehabilitation funds are distributed through the STIP process. In the future, these funds will be distributed according to the Unified Bridge Program, a rating system that indicates the condition and traffic level on each bridge in the State.
Hazard Elimination Program (HEP)
The HEP provides funding for safety improvement projects on public roads. Safety improvement projects may occur on any public road and must be sponsored by a County or City. To be eligible for federal aid, a project should be part of either the financial element of a Transportation System Plan or the annual listing of rural projects by ODOT. However, they do not have to be part of the approved STIP to receive STIP funding.

224
Timber Receipts
The United States Forest Service (USFS) shares 25 percent of national forest receipts with counties. By Oregon law (ORS 294.060), counties then allocate 75 percent of the receipts to the road fund and 25 percent to local school districts. Counties share of USFS timber receipts is no longer directly tied to the level of timber harvests. Under current legislation, counties are guaranteed payments on a schedule that reduces this support by 3% annually over the next decade. The guaranteed payments are now considered minimums, so actual receipts could be greater if timber harvest levels increase.
State Revenue Sources
State Highway Fund
The major source of funding for transportation capital projects statewide is the State Highway Fund. The Highway Fund derives its revenue through fuel taxes, licensing and registration fees, and weight-mile taxes assessed on freight carriers. Revenues have historically been divided as follows: 15.57% to cities, 24.38% to counties, and 60.05% to ODOT. Revenue from increased tax rates will be shared on a 20-30-50% basis, respectively. County shares of the Fund are based on the number of vehicle registrations, while the allocations to the cities are based on population.
OTIA Oregon Transportation Investment Act
The 2001 Legislature took the first two of three major steps toward solving Oregons highway infrastructure problems. House Bill 2142, also referred to as the Oregon Transportation Investment Act I (OTIA I), increased several Driver and Motor Vehicle fees to secure $400 million in bonds to increase lane capacity and improve interchanges ($200 million), repair and replace bridges ($130 million), and preserve road pavement ($70 million).
Favorable bond rates resulted in the passage of the second phase of the OTIA program during the first legislative session in 2002. OTIA II added $50 million for projects to increase lane capacity and improve highway interchanges, $45 million for additional bridge projects, and $5 million to preserve road pavement.
The $500 million in bonds from OTIA I and II was combined with matching funds from local governments. This allowed ODOT and local governments to deliver transportation projects across Oregon worth a total of $672 million.
Projects for the first two phases of the OTIA program were selected through an extensive public input process. Local governments and area commissions on transportation worked together to forward project lists to the Oregon Transportation Commission, which approved the final choices. The OTC received requests for about five times as much funding as was available an indication of the unmet needs that still exist. It is estimated that 100 percent of the projects in the first two phases of the OTIA program will be open to traffic by 2009.
Building on the success of the first two phases of the OTIA program, the 2003 Legislature addressed Oregon s problems of aging, bridges and the state s economic downturn. Signed into law by Gov. Kulongoski on July 28, 2003, the third phase of the OTIA program uses existing ODOT funds and

225
federal advance construction money, as well as increases in title, registration, and other Driver and Motor Vehicle fees, to bond a total of $2.46 billion. During the short-range time period (2005-2009) of this plan, OTIA I, II and III provide approximately $130 million for projects in the RVMPO. Further information about OTIA can be found at: http://www.oregon.gov/ODOT/HWY/OTIA/
Special Public Works Fund (SPWF)
The State of Oregon allocates a portion of state lottery revenues for economic development. The Oregon Economic Development Department provides grants and loans through the SPWF program to construct, improve and repair infrastructure in commercial/industrial areas to support local economic development and create new jobs. The SPWF provides a maximum grant of $500,000 for projects that will help create or retain a minimum of 50 jobs.
Traffic Control Projects (TCP)
The State maintains a policy of sharing installation, maintenance, and operational costs for traffic signals and luminar units at intersections between State highways and city streets (or county roads). Intersections involving a State highway and a city street or county road that are included on the statewide priority list are eligible to participate in the cost sharing policy. ODOT establishes a statewide priority list for traffic signal installations on the State Highway System. The priority system is based on warrants outlined in the Manual for Uniform Traffic Control Devices. Local agencies are responsible for coordinating the statewide signal priority list with local road requirements.
State Highway Fund Bicycle/Pedestrian Program
ORS 366.514 requires at least 1% of the Highway Fund received by ODOT, counties, and cities be expended for the development of footpaths and bikeways. ODOT administers its bicycle/pedestrian funds, handles bikeway planning, design, engineering, and construction, and provides technical assistance and advice to local governments concerning bikeways.
Immediate Opportunity Fund (IOF)
The IOF is intended to support economic development in Oregon by funding road projects that assure job development opportunities by influencing the location or retention of a firm or economic development. The fund may be used only when other sources of funding are unavailable or insufficient, and is restricted to job retention and committed job creation opportunities. To be eligible, a project must require an immediate commitment of road construction funds to address an actual transportation problem. The applicant must show that the location decision of a firm or development depends on those transportation improvements, and the jobs created by the development must be primary jobs such as manufacturing, distribution, or service jobs.
Special City Allotment (SCA)
ODOT sets aside $1 million per year to distribute to cities with populations less than 5,000. Projects to improve safety or increase capacity on local roads are reviewed annually and ranked on a statewide basis by a committee of regional representatives. Projects are eligible for a maximum of $25,000 each.

226
LLooccaall RReevveennuuee SSoouurrcceess
System Development Charges (SDCs)
Systems Development Charges are fees paid to local jurisdictions by developers and are intended to reflect the increased capital costs incurred by a jurisdiction or utility as a result of a development. Development charges are calculated to include the costs of impacts on adjacent areas or services, such as parks and recreation use, streets or utilities. The SDC typically varies by the type of development.
Within the RVMPO, virtually all jurisdictions now have SDCs in place, at varying levels.
Street Utility Fees (SUFs)
Most city residents pay water and sewer utility fees. Street utility fees apply the same concepts to city streets. A fee is assessed to all businesses and households in the city for use of streets based on the amount of traffic typically generated by a particular use. Street utility fees differ from water and sewer fees because usage cannot be easily monitored. Street user fees are typically used to pay for maintenance projects.
Revenue Bonds
Revenue bonds are financed by user charges, such as service charges, tolls, admissions fees, and rents. Revenue bonds could be secured by a local gas tax, street utility fee, or other transportation-related revenue stream.
Special Assessments/Urban Renewal Agency/Local Improvement Districts (LIDs)
Special assessments are charges levied on property owners for neighborhood public facilities and services, with each property assessed a portion of total project cost. They are commonly used for such public works projects as street paving, drainage, parking facilities and sewer lines. The justification for such levies is that many of these public works activities provide services to or directly enhance the value of nearby land, thereby providing direct financial benefits to its owners.
Urban renewal agencies are essentially a form of a special assessment district. Areas having thus funding mechanism in place include Medford, Talent, Jacksonville and the White City Area of Jackson County. Phoenix is in the process of adopting an Urban Renewal Area and expects it to be in place by April 2005
Local Improvement Districts are legal entities established by local government to levy special assessments designed to fund improvements that have local benefits. Through an LID, streets or other transportation improvements are constructed and a fee is assessed to adjacent property owners. LIDs are currently being used by MPO jurisdictions.
Developer-Paid Improvements
To an increasing degree, developers are funding the entire or a major portion of transportation improvements required to make a specific development project possible. Many Tier 2 projects

227
assume developer financing that is not yet committed. This financial plan includes only developer-funded projects for which written agreements have already been put in place.
SSttrreeeett SSyysstteemm RReevveennuuee PPrroojjeeccttiioonnss
Projecting revenues over long time periods in this case, 25 years necessarily involves making several assumptions that may or may not prove valid. For example, changing social, economic and political conditions cannot be predicted, yet these factors play important roles in determining future funding levels for Street System projects. In general, revenue projections for federal and state revenue sources described here rely on information provided by RVMPO member jurisdictions and ODOT.
Figure 18-2 on the following page shows the projected 25-year capital funding scenario for Street System projects. Transportation revenue estimates for RVMPO cities are shown by funding source. The estimated non-capital needs (e.g., operation and maintenance) are then subtracted to yield the final column
capital funds available - which will be used to fund the projects identified in the Street System Element, Chapter 8. Because the RVMPO comprises only a portion of the Jackson County and Oregon Department of Transportation (ODOT) jurisdictional boundaries, revenue estimates have not been similarly identified for these agencies. Rather, projections of capital funding availability for RVMPO projects funded by these agencies have been made based on agency-provided documentation and historical revenues. Capital funding availability for Jackson County and ODOT assumes that non-capital (operation and maintenance) needs are fully funded, consistent with Jackson County and ODOT policies.
In addition to 25-year revenue projections, Figure 18-2 shows estimated costs for implementation of the Tier 1 Street System Element in the column marked Tier 1 Projects.
The final column Tier 2 Projects demonstrates the funding levels necessary to complete all the projects identified in the Street System Element. For a more detailed description of the assumptions that were used to develop Figure 18-2, please refer to Figure 18-5. Amounts shown in the table are in 1,000 s.

228
FFiigguurree 1188--22 PPrroojjeecctteedd CCaappiittaall FFuunnddiinngg SScceennaarriioo -- SSttrreeeett SSyysstteemm PPrroojjeecctt LLiisstt (in yr. 2005 dollars X 1,000)
Revenues
Local Jurisdiction
Time
Frame Federal
State
SDCs Fees Other Total
Non-Capital Needs
Capital Funds Avail.
Tier 1 Projects (financially-constrained)
Tier 2 Projects (unfunded)
short $2,057
$4,667
$1,498
$4,972
$1,337
$14,531
$10,939
$3,592
$3,545
medium
$519
$6,008
$2,089
$6,953
$1,680
$17,249
$15,210
$2,039
$2,035
Ashland
long $2,538
$17,111
$6,800
$25,142
$5,469
$57,060
$50,930
$6,130
$6,048
$32,411
short $2,203
$3,273
$3,370
$0
$0
$8,847
$3,292
$5,555
$5,547
medium
$519
$4,214
$2,002
$0
$0
$6,736
$4,649
$2,087
$2,050
Central Point
long $2,538
$12,003
$6,874
$0
$0
$21,414
$15,817
$5,597
$5,588
$7,455
short $286
$1,379
$3,532
$594
$478
$6,269
$5,216
$1,053
$1,053
medium
$405
$1,776
$3,975
$817
$90
$7,063
$6,880
$183
$150
Eagle Point long $1,407
$5,058
$12,941
$2,659
$225
$22,289
$22,399
-$110
$0
$11,772
short $133
$552
$252
$684
$15
$1,636
$1,243
$393
$15
medium
$519
$710
$347
$916
$0
$2,493
$1,709
$783
$0
Jacksonville long $2,538
$2,022
$1,129
$2,828
$0
$8,517
$5,564
$2,952
$0
$6,000
short $2,183
$15,322
$12,545
$26,525
$29,002
$85,577
$37,503
$48,073
$47,365
medium
$519
$19,725
$16,428
$36,780
$3,390
$76,843
$51,879
$24,964
$21,205
Medford long $2,538
$56,179
$36,950
$88,171
$4,425
$188,262
$176,702
$11,560
$11,555
$67,370
short $1,383
$1,029
$250
$435
$350
$3,447
$1,693
$1,755
$1,567
medium
$519
$1,325
$465
$715
$595
$3,619
$2,327
$1,292
$1,290
Phoenix long $2,538
$3,771
$1,555
$2,580
$1,807
$12,251
$7,576
$4,675
$4,650
$20,000
short $400
$1,280
$804
$349
$1,467
$4,300
$1,735
$2,565
$2,530
medium
$519
$1,647
$1,088
$472
$500
$4,227
$2,385
$1,842
$1,840
Talent long $2,538
$4,692
$3,187
$1,381
$0
$11,798
$7,764
$4,033
$3,950
$5,200
short $33,714
$33,620
medium
$13,200
$13,155
Jackson Co. (RVMPO Area) long
These figures are not applicable to the MPO area - see assumptions table. $39,000
$38,990
$0
short $184,897
$184,826
medium
$13,112
$13,100
ODOT (RVMPO Area) long
These figures are not applicable to the MPO area - see assumptions table. $46,944
$46,940
$107,930
Totals $9,680
$97,351
$68,193
$155,206
$39,569
$369,998
$277,680
$461,880
$452,614
$258,138

229
SSttrreeeett SSyysstteemm IImmpplleemmeennttaattiioonn CCoossttss
As indicated in the Street System Element, the capital funding needs in the RVMPO exceed anticipated revenues. A two-tiered approach is therefore presented in order to separate projects linked to anticipated revenues (Tier 1) from projects that require new revenue sources (Tier 2). The Street System project list (Figure 8-3) is based on the revenue projections as shown in Figure 18-2.
Figure 18-3 below summarizes the 25-year capital funding availability for each agency and then adds Tier 2 project costs to Tier 1 costs, demonstrating the revenue shortfalls that will result. Jacksonville, Phoenix and Jackson County have no Tier 2 projects.
FFiigguurree 1188--33 SSttrreeeett SSyysstteemm PPrroojjeecctteedd RReevveennuuee SShhoorrttffaallll oovveerr 3300--YYeeaarr PPllaannnniinngg PPeerriioodd
(in yr. 2005 dollars X 1,000)
Jurisdiction Available Capital Funding
Tier 1 and Tier 2 Project Costs
Revenue Shortfall
Ashland $11,761
$44,039
$32,278
Central Point $13,238
$20,640
$7,402
Eagle Point $1,125
$12,975
$11,850
Jacksonville $4,129
$6,015
$1,886
Medford $84,597
$147,495
$62,898
Phoenix $7,721
$27,507
$19,786
Talent $8,440
$13,520
$5,080
Jackson Co. (MPO Area) $85,914
$85,765
n/a
ODOT (MPO Area) $244,953
$352,796
$107,843
Totals $460,249
$685,421
$227,350
SSttrreeeett SSyysstteemm FFuunnddiinngg SShhoorrttffaallll aanndd PPootteennttiiaall RReevveennuuee SSoouurrcceess
Figure 18-3 shows the revenue shortfall that is anticipated in order to fund both Tier 1 and 2 Street System projects. Revenue sources that can potentially be used to make up the funding shortfall for Tier 2 projects are shown in Figure 18-4 and summarized below by jurisdiction. The column 25-
Year Potential Funding in Figure 18-4 shows that the potential Increased annual funding will cover the anticipated revenue shortfalls over the 23-year planning period.

230
FFiigguurree 1188--44 PPootteennttiiaall RReevveennuuee SSoouurrcceess ffoorr TTiieerr 22 SSttrreeeett SSyysstteemm PPrroojjeeccttss (in current / yr. 2000 dollars X 1,000)
Jurisdiction Fund Source
Current Annual
Revenues
Annual Funding Increase
30-Year Potential Funding
Revenue Shortfall
System Development Charges $280
$550
Ashland Street Utility Fee $950
$550
$33,000
$32,278
System Development Charges $250
$50
Central Point Street Utility Fee $0
$200
$7,500
$7,402
System Development Charges $550
$250
Eagle Point Street Utility Fee $113
$150
$12,000
$11,850
Jacksonville System Development Charges $48
$65
$1,950
$1,886
System Development Charges $2,500
$1,000
Medford Street Utility Fee $5,000
$1,100
$63,000
$62,898
System Development Charges $40
$500
Phoenix Street Utility Fee $77
$175
$20,250
$19,786
System Development Charges $150
$125
Talent Street Utility Fee $65
$45
$5,100
$5,080
ODOT (MPO Area)
Gas Tax Increase n/a
$3,988
$119,640
$107,843
Totals $240,240
$227,350
City of Ashland
The funding required to construct the projects over the 30-year planning period in Ashland exceeds their projected revenues by over $32 million. Ashland's current system development charge (SDC) generates approximately $280,000 per year and their street utility fee (SUF) generates approximately $950,000 per year. An increase in each of these revenue sources by $550,000 per year would generate an additional $33 million over the 30-year planning period.
City of Central Point
The funding required to construct the projects over the 30-year planning period in Central Point exceeds their projected revenues by over $7 million. Central Point's current SDC generates approximately $250,000 per year. Unlike most RVMPO jurisdictions, there is currently no street utility fee (SUF) in Central Point. An increase in SDC revenue of $50,000 per year along with the establishment of an SUF of $200,000 per year would generate an additional $7.5 million over the 30-year planning period.
231
City of Eagle Point
The funding required to construct the projects over the 30-year planning period in Eagle Point exceeds their projected revenues by nearly $12 million. Eagle Point's current SDC generates approximately $550,000 per year and their SUF generates approximately $113,000 per year. An increase in the SDC of $250,000 per year plus an increase in the SUF of $150,000 per year would generate an additional $12 million over the 30-year planning period.
City of Jacksonville
The funding required to construct the projects over the 30-year planning period in Jacksonville exceeds their projected revenues by nearly $2 million. Jacksonville s current SDC generates approximately $48,000 per year. An increase in the SDC of $65,000 per year would generate an additional $1.95 million over the 30-year planning period.
City of Medford
The funding required to construct the projects over the 30-year planning period in Medford exceeds their projected revenues by about $63 million. Medford's current SDC generates approximately $2.5 million per year and their SUF generates approximately $5 million per year. An increase in each of these revenue sources by about $1 million per year would generate an additional $63 million over the 30-year planning period.
City of Phoenix
The funding required to construct the projects over the 30-year planning period in Phoenix exceeds their projected revenues by nearly $20 million. Phoenix's current SDC generates approximately $40,000 per year and their SUF generates approximately $77,000 per year. An increase in the SDC of $500,000 per year plus an increase in the SUF of about $175,000 per year would generate an additional $20.25 million over the 30-year planning period.
City of Talent
The funding required to construct the projects over the 30-year planning period in Talent exceeds their projected revenues by over $5 million. Talent's current SDC generates approximately $150,000 per year and their SUF generates approximately $65,000 per year. An increase in the SDC of $125,000 per year, as well as an increase in the SUF of $45,000 per year would generate an additional $5.1 million over the 30-year planning period.
ODOT (RVMPO)
The funding needed to construct the projects over the 30-year planning period for which ODOT is the lead jurisdiction exceeds their projected revenues by about $108 million. A 2.5 cent per gallon raise in the State s gas tax would result in an annual funding increase of about $4 million in the RVMPO area. Over the 30-year planning period this would amount to an additional $120 million available to fund Tier 2 projects.

232
ODOT s ability to fund local projects could also be dramatically affected by Federal earmarks in future transportation legislation. Historically, earmarks have reached levels of up to $20 million per legislative period. There will be four opportunities for earmarks during the 30-year planning period. If earmarks were granted during each of these legislative periods at historic funding levels, ODOT would have an additional $80 million for projects in the RVMPO.

233
FFiigguurree 1188--55 22000011--22002255 RReevveennuuee AAssssuummppttiioonnss Revenues
Local
Jurisdiction
Federal State SDCs
Fees
Other
Non-Capital Needs
Capital Funds Avail.
Ashland
SDCs are expected to be about $280K per year in 2005 and increase at 3% through 2009, 2.5% thereafter.
Street Utility Fees are expected to be about $946K per year in 2005 and increase by 2.5% per year through 2009, 3.5% thereafter.
Other revenues include intergovernmental and misc. and are expected to average about $327K per year and contribute about $8.5 million between 2005 and 2030.
2005 expenses include: admin ($750K), maintenance ($1.1M) and RVTD service ($260K). An annual increase of 3.5% and 2.5% has been assumed for these expenses, respectively, through 2030.
Central Point
SDCs are expected to be about $250K per year in 2005 and increase by 10% in 2006, 3% per year thereafter.
Not applicable. Not applicable.
2005 expenses include administration and maintenance ($620K). An annual increase of 3% has been assumed for these expenses through 2030.
Eagle Point
SDCs are expected to be about $550K per year in 2005 and increase at 2.5% per year. Includes about $650K in accumulated revenues for short-term projects.
Street Utility Fees are expected to be about $113K per year in 2005 and increase by 2.5% per year.
Other revenues will contribute about $15K per year and total about $390K between 2005 and 2030. Also includes $153K in accumulated revenues and $250K from developers for short-range projects.
2005 expenses include: admin ($187K) and maintenance ($765K). An annual increase of 2.5% has been assumed for these expenses through 2030. Also includes $212K debt service in short-range.
Jacksonville
SDCs are expected to be about $48K per year in 2005 and increase at 2.5% per year.
Franchise Fees are expected to be about $132K per year in 2005 and increase by 2% per year.
Other revenues include $15K for urban renewal in the short-range.
2005 expenses include: admin ($30K) and maintenance ($207K). An annual increase of 2.5% has been assumed for these expenses through 2030.
Medford
SDCs are expected to be about $2.5M per year in 2005 and increase at about 0.5% per year.
Street Utility Fees are expected to be about $5M per year in 2005 and increase by bout 1.2% per year.
Short-range includes $10 million balance carried forward, $4 million bond (sidewalks), $8 million from OTIA III (for McAndrews Bridge), $3.5M from OTIA III (for Owens Dr.). All years assume $700K from sources including CDBG, MURA and jurisdictional transfers from Jackson Co.
2005 expenses include: admin ($1M), and maintenance ($3.7M). An annual increase of 5% has been assumed for these expenses through 2030. Other expenses include $13.7M for debt service and $8M for local match payments.
Phoenix
SDCs are expected to be about $40K per year in 2005 and increase at an average of 6% per year.
Street Utility Fees are expected to be about $77K per year in 2005 and increase by about 5.6% per year.
Includes $100K in developer contributions and $250K for a bike/ped grant in short range, $595K in developer contributions in medium range and $1.807M from Urban Renewal in long range.
2005 expenses include: admin ($30K) and maintenance ($292K). An annual increase of 2.5% has been assumed for these expenses through 2030.
Talent
ODOT (December 2004) estimates that $45.4 million in STP
funds will be available to the
RVMPO from 2005-2030. 50% of these
funds have been committed to transit (RVTD) through the year 2020 and, for
the purposes of this plan, are assumed to
continue to be allocated the same way through 2030.
$2.8M of the MPO's short term STP has been programmed for specific projects
in the RTP. $797K in STP remains
unprogrammed through the short-
range (through 2009). Short-range
unprogrammed STP, as well as all
medium and long-range STP funds are
assumed to be available for projects included in the RTP.
Other federal sources have been
assumed for the short-range period only. These include CMAQ ($2.438M),
Transportation Enhancement ($580K) and a
$1.25M earmark for sidewalk projects in
Medford.
ODOT (December 2004) has provided estimates through
the 2030 for Highway Fund and
OTIA III City Allocation funding
on a statewide basis (total =
$3.26B). Cities are allocated these
revenues on a per capita basis.
Estimates assume that current population
distributions in the RVMPO remain
constant throughout the
planning period. These percentages
of the statewide incorporated city total are: Ashland
(0.8522%), Central Point (0.5978%),
Eagle Point (0.2519%), Jacksonville (0.1003%),
Medford (2.7980%),
Phoenix (0.1871%), Talent
(0.2337%). Per capita allocations
of Small City Allotment funds are
assumed to be made to both Phoenix and Jacksonville
through the 2030 planning period.
SDCs are expected to be about $150K per year in 2005 and increase at 3.5% through 2009, 1.5% thereafter.
Street Utility Fees are expected to be about $65K per year in 2005 and increase by 3.5% per year through 2009, 1.5% thereafter.
Includes $375K for jurisdictional transfer, $230K for bike/ped grant, $862K in urban renewal funds for short-range projects. Medium-range includes $500K in urban renewal funds.
2005 expenses include: admin ($100K) and maintenance ($230K). An annual increase of 2.5% has been assumed for these expenses through 2030.
Capital funds
available for cities in
the RVMPO equal the
amounts in the
"Revenues" column
minus the amounts in the "Non-Capital Needs" column.
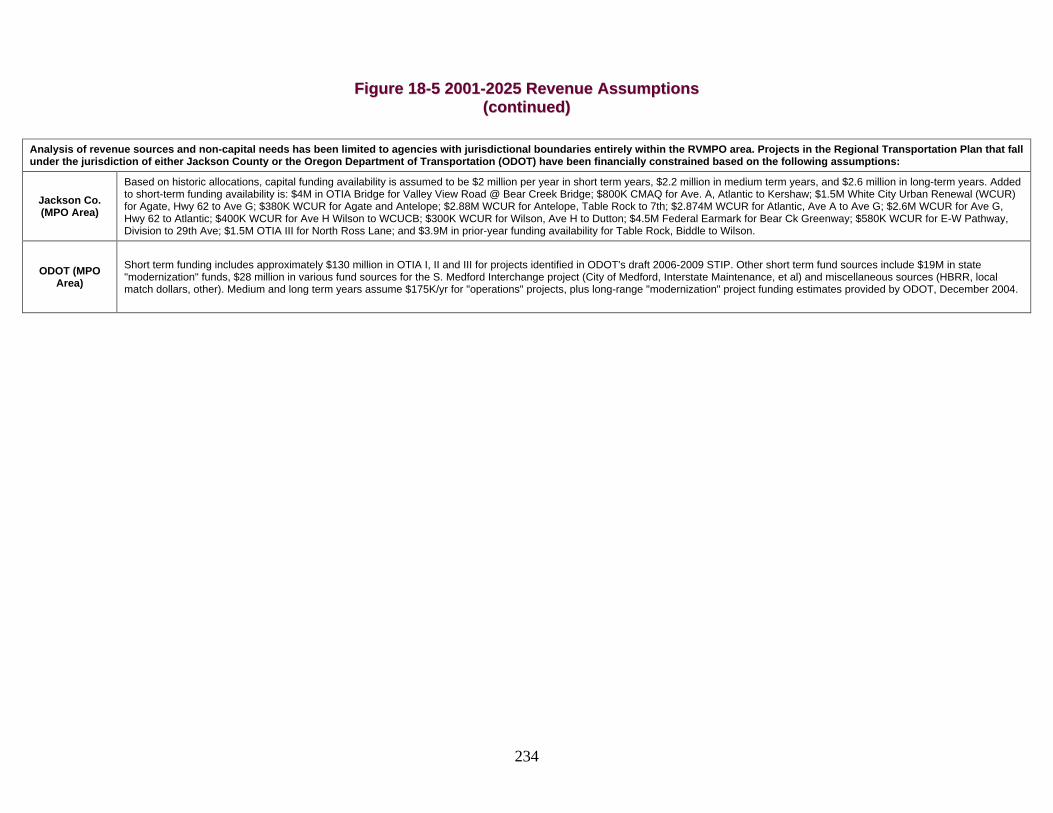
234
FFiigguurree 1188--55 22000011--22002255 RReevveennuuee AAssssuummppttiioonnss ((ccoonnttiinnuueedd))
Analysis of revenue sources and non-capital needs has been limited to agencies with jurisdictional boundaries entirely within the RVMPO area. Projects in the Regional Transportation Plan that fall under the jurisdiction of either Jackson County or the Oregon Department of Transportation (ODOT) have been financially constrained based on the following assumptions:
Jackson Co. (MPO Area)
Based on historic allocations, capital funding availability is assumed to be $2 million per year in short term years, $2.2 million in medium term years, and $2.6 million in long-term years. Added to short-term funding availability is: $4M in OTIA Bridge for Valley View Road @ Bear Creek Bridge; $800K CMAQ for Ave. A, Atlantic to Kershaw; $1.5M White City Urban Renewal (WCUR) for Agate, Hwy 62 to Ave G; $380K WCUR for Agate and Antelope; $2.88M WCUR for Antelope, Table Rock to 7th; $2.874M WCUR for Atlantic, Ave A to Ave G; $2.6M WCUR for Ave G, Hwy 62 to Atlantic; $400K WCUR for Ave H Wilson to WCUCB; $300K WCUR for Wilson, Ave H to Dutton; $4.5M Federal Earmark for Bear Ck Greenway; $580K WCUR for E-W Pathway, Division to 29th Ave; $1.5M OTIA III for North Ross Lane; and $3.9M in prior-year funding availability for Table Rock, Biddle to Wilson.
ODOT (MPO Area)
Short term funding includes approximately $130 million in OTIA I, II and III for projects identified in ODOT's draft 2006-2009 STIP. Other short term fund sources include $19M in state "modernization" funds, $28 million in various fund sources for the S. Medford Interchange project (City of Medford, Interstate Maintenance, et al) and miscellaneous sources (HBRR, local match dollars, other). Medium and long term years assume $175K/yr for "operations" projects, plus long-range "modernization" project funding estimates provided by ODOT, December 2004.

235
TTrraannssiitt SSyysstteemm EElleemmeenntt
Transit System Revenue Sources
Transit services in the RVMPO are provided by the Rogue Valley Transportation District (RVTD), which relies on Federal, State, and local funding sources. Revenues from these sources have been estimated for the 23-year planning period in Figure 18-6 and are described below. Further information on the assumptions used to estimate revenues are located at the end of this section.
FFiigguurree 1188--66 PPrroojjeecctteedd 2255--YYeeaarr RReevveennuueess -- TTrraannssiitt SSyysstteemm EElleemmeenntt (in yr. 2001 dollars X 1,000)
Time Frame Revenue Source Fund Short
(2005-2009) Medium
(2010-2015) Long
(2016-2030)
Totals
S5307 $7,806
$10,447
$32,253
$50,506
Title XIX $624
$836
$2,580
$4,041
Federal
TDM/Rideshare $668
$847
$2,353
$3,868
STF $1,051
$1,407
$4,343
$6,802
State In-Lieu-of (Tax) $1,300
$1,560
$3,900
$6,760
Property Taxes $7,831
$11,061
$37,974
$56,866
Farebox Returns $3,716
$5,249
$18,022
$26,987
RVMPO STP $3,090
$4,388
$15,226
$22,703
Local
Other $1,000
$1,200
$3,000
$5,200
Totals $27,087 $36,994
$119,651
$183,733
Federal Revenue Sources
The Federal Transit Administration (FTA) carries out the federal mandate to improve public transportation systems. It is the principal source of federal assistance to help urban areas (and, to some extent, non-urban areas) plan, develop, and improve comprehensive mass transportation systems. The FTA provides all but one source (TDM/Rideshare) of Federal funding to the RVTD. The FTA s programs of financial assistance to the RVTD include Section 5307 and Title XIX programs. TDM/Rideshare funding is provided by the Federal Highway Administration (FHWA). Federal grant funds are allocated to transit districts and other eligible providers by ODOT through the State Transportation Improvement Plan (STIP) process.
Transit Section 5307 Funds
The Section 5307 Formula Grant Program makes funds available based on a statutory formula to urbanized areas (over 50,000 population). For capital projects, the match rate is 80% federal, 20% state or local. Capital funds can be used for any capital and planning activity. For operating assistance, the match rate is 50% federal, 50% state or local Operating assistance is capped at a percentage of the total Section 5307 apportionment for each urban area.

236
Title XIX
This fund source pays for non-medical transportation services for those with disabilities.
TDM/Rideshare
This funding is received from the Federal Highway Administration to promote Transportation Demand Management and Ridesharing activities managed by RVTD. Ridesharing activities sponsored by RVTD include their carpool matching service for commuters in the District. Other TDM activities undertaken by RVTD include the monitoring and promotion of the group pass program such as those offered by Bear Creek Corporation and Rogue Community College and the School Education Program.
RVMPO STP Funding
In December 2001, the Land Conservation and Development Commission (LCDC) approved the RVMPO s Alternative Measures proposal (described in detail in Appendix C).Among other provisions of this proposal was to direct one-half of the RVMPO s STP funds toward transit through the year 2020. At this point, it is unclear whether the MPO will extend this funding commitment through the 2030 planning horizon. In the absence of such a decision, this plan assumes that it will.
The RVMPO s STP funding availability is estimated to be approximately $45.4 million between 2005 and 2030. Thus, assuming that RVTD will continue to receive half this amount, this would provide nearly $23 million in funding over the planning period of this RTP. STP funds are to be used for funding transit capital or maintenance and cannot be directly used to fund transit operations. However, the effect of this increased funding will be to free up funding for transit operations.
SSttaattee RReevveennuuee SSoouurrcceess
State Special Transportation Fund (STF)
ODOT s Public Transit section administers a discretionary grant program derived from state cigarette-tax revenues that provides supplementary support for transit-related projects serving the elderly and disabled. RVTD uses their allocation for Valley Lift operational support. A competitive process has been established for awarding STF funds, which are programmed on an annual basis.
In-Lieu-of (Tax)
In some areas of Oregon, a payroll tax is levied to support transit. In areas without this payroll tax, such as the area within RVTD s boundaries, the State pays an in-lieu of tax to transit districts equal to the amount that would have been paid by State employees who work within the District s boundaries.

237
LLooccaall RReevveennuuee SSoouurrcceess
Property Taxes
Within the Rogue Valley Transportation District, a portion of the property tax revenue (18 cents per $1000 assessed valuation) collected by the County goes to RVTD. RVTD currently levies a property tax base of about $1.3 million, which can increase 3% each year.
Farebox Revenues and Bus Pass Revenues
Farebox revenues - fares paid by users of transit systems - and bus pass revenues are fees paid directly by users of the transit system. Such fees cover only about 20% of RVTDs operating costs.
Other
Other funding includes interest on investments, sale of surplus equipment, sale of compressed natural gas (CNG), vehicle leasing, advertising, marketing, and an STF administrative allotment.
FFiigguurree 1188--77 PPrroojjeecctteedd 2255--YYeeaarr EExxppeennsseess -- TTrraannssiitt SSyysstteemm EElleemmeenntt (in yr. 2000 dollars X 1,000)
Time Frame
Expenses Short (2005-2009)
Medium (2010-2015
Long (2016-2030)
Totals
Operations $9,367
$12,536
$38,704
$60,608
Alt Operations $5,840
$8,249
$28,320
$42,408
Maintenance $7,433
$10,498
$36,043
$53,974
Administration $3,417
$4,698
$15,293
$23,408
Legislative $250
$300
$750
$1,300
Capital Match $160
$192
$480
$832
Sub-total $26,467
$36,473
$119,590
$182,530
Transit System Element Implementation Costs
Like the Street System Element, the Transit System Element also contains two tiers or funding scenarios. The Tier 1 transit system is the financially constrained system. This system represents a minimal level of transit service levels, given the lack of funding available for transit operations in the RVMPO area. The Tier 2 transit system is the illustrative or preferred transit system for the RVMPO area. In order to implement this system, a substantial increase in revenues would be required. Further information on how implementation costs were estimated for the various tiers can be found in Figure 18-10.

238
In contrast to the capital projects listed in the Street System, implementing the Transit System primarily involves operational expenditures. Figure 18-7 shows the costs of implementing the Tier 1 (financially constrained) Transit System.
Figure 18-8 shows the implementation costs for the Tier 2 transit plan and the revenue shortfall that would exist over currently projected revenues (shown in Figure 18-6). The Tier 2 plan represents a significant expansion of transit service as described in the Transit System Element.
FFiigguurree 1188--88 TTiieerr 22 -- EExxppaannddeedd SSeerrvviiccee IImmpplleemmeennttaattiioonn CCoossttss (in yr. 2000 dollars X 1,000)
Time Frame
Expenses Short (2005-2009)
Medium (2010-2015
Long (2016-2030)
Totals
Operations $16,818
$28,834
$89,019
$134,671
Alt Operations $10,529
$18,972
$65,135
$94,636
Maintenance $9,728
$15,747
$54,065
$79,540
Administration $4,467
$7,046
$22,940
$34,453
Legislative $250
$300
$750
$1,300
Capital Match $158
$192
$480
$830
Sub-total $41,950
$71,091
$232,390
$345,431
Funding Shortfall ($14,863) ($34,097) ($112,738) ($161,698)
Transit System Element Funding Shortfall and Potential Revenue Sources
As indicated in Figure 18-8, a significant gap exists between projected revenues (as shown in Figure 18-6) and the implementation costs for the Tier 2 transit system. There are principally two sources of potential funding to implement the Tier 2 Transit System: property tax increases or implementation of a new payroll tax. A payroll tax works by assessing a fixed amount to be paid for each dollar of covered payroll within the District and goes directly to fund the transit system. A transit excise tax functions as the major funding mechanism for transit services in Portland and Eugene. Implementation of either increased property taxes or a new payroll tax would require passage by local voters to be put in effect. Figure 18-9 shows the revenue.

239
FFiigguurree 1188--99 TTiieerr 22 RReevveennuueess
PPrreeffeerrrreedd
TTrraannssiitt SSyysstteemm
Time Frame (in yr. 2000 dollars)Revenue
Source Fund Short
(2005-2009) Medium
(2010-2015) Long
(2016-2030)
Totals
S5307 $7,806
$10,447
$32,253
$50,506
Title XIX $624
$836
$2,580
$4,041
Federal
TDM/Rideshare $668
$847
$2,353
$3,868
State STF $1,051
$1,407
$4,343
$6,802
Property Taxes $7,831
$11,061
$37,974
$56,866
Farebox Returns $3,716
$5,249
$18,022
$26,987
RVMPO STP $3,090
$4,388
$15,226
$22,703
Payroll Tax $17,301
$36,458
$118,691
$172,450
Local
Other $1,000
$1,200
$3,000
$5,200
Totals $43,088
$71,892
$234,442
$349,422
FFiigguurree 1188--1100 TTrraannssiitt SSyysstteemm RReevveennuuee aanndd EExxppeennssee AAssssuummppttiioonnss Revenues Tier 1 Assumptions Tier 2 Assumptions
S5307 $1.5M in 2005; 2% annual increase same as Tier 1
Title XIX $120K in 2005; 2% annual increase same as Tier 1
TDM/Rideshare $131K in 2005; 1% annual increase same as Tier 1
STF $202K in 2005; 2% annual increase same as Tier 1
In-Lieu-of (Tax) $260K per year not applicable due to payroll tax
Property Taxes $1.475M in 2005; 3% annual increase same as Tier 1
Farebox Returns $700K in 2005; 3% annual increase same as Tier 1
RVMPO STP 50% of RVMPO projected STP allocation through 2030 same as Tier 1
Payroll Tax not applicable $1M in 2006, $5.3M in 2007, then 2.5% annual increase
Other $200K per year same as Tier 1
Expenses Tier 1 Assumptions Tier 2 Assumptions
Operations $1.8M in 2005; 2% annual increase 130% increase/yr over Tier 1 in 2007; then 2% annual increase
Alt Operations $1.1M in 2005; 3% annual increase 130% increase/yr over Tier 1 in 2007; then 3% annual increase
Maintenance $1.4M in 2005; 3% annual increase 50% increase/yr over Tier 1 in 2007; then 3% annual increase
Administration $650K in 2005; 2.5% annual increase 50% increase/yr over Tier 1 in 2007; then 2.5% annual increase
Legislative $50K per year same as Tier 1
Capital Match $32K per year same as Tier 1

240
Other Plan Elements
Projects listed in the RTP and funded under RVMPO jurisdictions are limited to those identified in the Street System Element and the Transit System Element. Other elements of the plan either do not share the same direct relationship with funding or are financed as a component of these two elements.

Rogue Valley
Council Of Governments
Rogue Valley Metropolitan Planning
Organization
Regional Transportation
Plan 2005-2030
APPENDICES
APRIL 5, 2005

Regional Transportation Plan 2005-2030
APPENDICES
TABLE OF CONTENTS
Appendix A: TPR and TEA-21 Compliance .......................................................................... 1
Appendix B: ODOT / OTC STIP Project Selection Criteria .................................................. 9
Appendix C: Alternative Measures....................................................................................... 24
Appendix D: Alternative Highway Mobility Standards ....................................................... 60
Appendix E: Public Involvement Plan for the MPO ............................................................ 76
Appendix F: Selected Regional Projects with Long Term Potential ..................................... 80
Appendix G: Public Comments and Responses ................................................................... 85
Appendix H: Agency Comments and Responses ................................................................. 96
1
AAppppeennddiixx AA
TTRRAANNSSPPOORRTTAATTIIOONN PPLLAANNNNIINNGG RRUULLEE AANNDD TTEEAA--2211 CCOOMMPPLLIIAANNCCEE FFOORR TTHHEE 22000055 -- 22003300 RREEGGIIOONNAALL
TTRRAANNSSPPOORRTTAATTIIOONN PPLLAANN UUPPDDAATTEE
PPrreeffaaccee
Federal and state planning guidelines are specified for the transportation planning conducted in urban areas including the Rogue Valley MPO area.
This Appendix explains how the federal and state guidelines were met in the preparation of the 2005 -2030 Regional Transportation Plan (RTP) update. The first portion of this Appendix deals with the 2005-2030 RTP update and how the plan complies with the Oregons Transportation Planning Rule (TPR) and the seven planning factors from the Transportation Efficiency Act for the 21st Century (TEA-21).
A major step for the 2005-2030 RTP is that it overhauled the goals and policies guiding the plan, and the seven TEA-21 Planning Factors and the state TPR were the framework for an expansion from four regional goals to ten, and to policies that fall under each of these goal areas. The new Guiding Principles (Goals and Policies) appear in Chapter 3.
AA.. RREEGGIIOONNAALL TTRRAANNSSPPOORRTTAATTIIOONN PPLLAANN ((RRTTPP)) CCOOMMPPLLIIAANNCCEE WWIITTHH TTHHEE TTRRAANNSSPPOORRTTAATTIIOONN PPLLAANNNNIINNGG RRUULLEE ((OOAARR 666600--1122--000000)) AANNDD AACCKKNNOOWWLLEEDDGGMMEENNTT BBYY DDLLCCDD..
On April 12, 2000, the RVMPO Policy Committee adopted the Interim 2000-2020 Regional Transportation Plan (RTP), the 2000-2003 TIP and air quality conformity determination to meet federal requirements as defined in TEA-21. One outstanding state Transportation Planning Rule (TPR) issue remained to be addressed: the Interim plan did not meet the 5% vehicle miles traveled (VMT) reduction requirement.
2
The RVMPO addressed this TPR-related issue during the 2001-2023 RTP update. The DLCD authorized the MPO to pursue alternative measures (OAR 660-12-035 (5)), to address the TPR issue. The RVMPO developed an Alternative Measures proposal that includes strategies that reduce reliance on the automobile by increasing the attractiveness of alternative modes of transportation. The RVMPO s Alternative Measures proposal was approved by the Land Conservation and Development Commission on December 13, 2001 (see Appendix B).
Finding: The MPO Policy Committee finds that compliance with the Vehicle Miles Traveled (VMT) reduction requirement of the Transportation Planning Rule (TPR) has been addressed through the LCDC s approval of the RVMPO s Alternative Measures proposal.
BB.. CCOOMMPPLLIIAANNCCEE WWIITTHH TTEEAA--2211 PPLLAANNNNIINNGG RREEQQUUIIRREEMMEENNTTSS -- 22000055 -- 22003300 RRTTPP UUPPDDAATTEE
Federal transportation planning rules require that MPOs designated as non-attainment or maintenance areas update their regional transportation plans (RTP) every three years (23 CFR 450 Subpart C, 450.322). The intent of the 2005-2030 RTP Update is to comply with the federal regional transportation plan update requirements. This major RTP update includes:
Revised population and land use forecasts
Updated financial forecasts and transportation project lists
Updated RTP goals and policies
Updated Transit, Freight, Aviation, Rail and Traffic Safety elements
A Public Involvement Plan
Adopted Alternative Measures (approved by LCDC on December 13, 2001)
Updated Alternative Mobility Standards for the South Medford Interchange Area
An air quality conformity determination
CC.. RRTTPP CCOONNSSIISSTTEENNCCYY WWIITTHH TTHHEE 77 TTEEAA--2211 PPLLAANNNNIINNGG FFAACCTTOORRSS ((RREEFF:: 2233 UUSSCC 113344((FF)) AANNDD 2233 CCFFRR 445500..331166((AA))))
The RVMPO planning process addresses the seven TEA-21 planning factors in all projects and policies. The following is a description of these considerations, and a brief explanation of how the factors are addressed in the RTP.
1. TEA-21 #1: Support the economic vitality of the metropolitan area, especially by enabling global competitiveness, productivity, and efficiency.
The RVMPO transportation program and its deliverables support the economic vitality of the region by planning for a balanced transportation system that supports the economy of the Rogue Valley urbanized area and provides for the movement of goods and services into, out of, and through the area. The goal of the RVMPO is to plan a transportation system that effectively meets the current and project employment needs of the area.
The RVMPO in FY 2004 conducted Phase III of a freight study that identifies problem areas and opportunities related to freight and goods movements. The study provides recommendations for improvements to the highway freight system that will help to

3
maintain a viable, local economy, which enables global competitiveness, productivity, and efficiency.
Several major highway projects included in the RTP are planned for construction that will help support the vitality of the local, regional and state economy. These projects are:
Fern Valley Interchange, Phoenix, (now in planning phase)
South Medford Interchange (now in planning phase)
North Medford Interchange (now under construction)
Hwy 238 Unit #2 (Medford) (now in planning phase)
2. TEA-21 #2: Increase the safety and security of the transportation system for motorized and non-motorized users.
Safety concerns are a paramount concern in the metropolitan area. The RVMPO addresses safety through the project selection process. Safety concerns are also addressed for all bicycle and pedestrian projects. Transit safety is being addressed by the addition of shelters, lights, and uniform light standards, and RVTD is seeking GPS systems on buses to track them in the system. The City Medford has a school sidewalk construction program that improves pedestrian safety in school neighborhoods. In addition, the RVMPO will be working with the ODOT Transportation Safety Division on a traffic safety project during FY 2003 that will identify high hazard locations, and develop and prioritize safety projects in the MPO area. Finally, this RTP for the first time also examines transportation security issues, in Chapter 17.
3. TEA-21 #3: Increase the accessibility and mobility options available to people and for freight.
Freight Issues: Freight issues are addressed in Section 15.0 of the RTP and also in the Aviation and Rail chapters, 13 and 14 respectively. The street improvement list (Table 8-2 in Volume II) identifies projects that will benefit the movement of freight. As mentioned, the RVMPO has completed three phases of a freight study and will undertake additional studies in FY 2006. The 2004 study identified problem areas and opportunities related to freight and goods movement, and suggested and evaluated potential solutions and strategies.
Mobility Options: The RTP recommends development of integrated bicycle and pedestrian networks to make it more convenient for people to bike and walk. The region was proud in 2004 to receive a $2m allocation for completion of the Bear Creek Greenway, an important regional bicycle and pedestrian spine. The original RVMPO member jurisdictions have agreed to dedicate 50% of their STP funds, through 2023, to help RVTD increase transit service within the MPO area. [This commitment will be revisited by all members of the expanded MPO at a Summit Meeting in early 2006]. The RVMPO adopted Alternative Measures, to comply with the Oregon Transportation Planning Rule (TPR), which commits the RVMPO member jurisdictions to increasing the number of sidewalks and bike lanes over the next 25 years.

4
4. TEA-21 #4: Protect and enhance the environment, promote energy conservation, and improve quality of life.
The RTP is consistent with member jurisdiction adopted comprehensive plans, with Transportation System Plans and with the TPR, which in turn, are consistent with the Goal 4 Planning Factor. The transportation planning process of the RVMPO includes minimizing adverse impacts to the environment. All regionally significant projects must meet air quality standards. Planning for a multi-modal transportation system helps promote energy conservation and improves the quality of life in the area.
RVTD s TDM programs help to reduce vehicle trips, which in turn, helps to improve air quality by reducing vehicle emissions. A multi-modal transportation system helps to improve quality of life by providing area residents with transportation choices that do not consume energy or create pollution.
5. TEA-21 #5: Enhance the integration and connectivity of the transportation system, across and between modes, for people and freight.
Integration and connectivity of the various modes are provided through the park-and-ride lots, pedestrian access to transit, connectivity among modes (such as bikes on buses), and freight transfer facilities.
The RVMPO is working with the Oregon Modeling Steering Committee to explore ways to improve the regional travel demand model to more accurately project the benefits of mixed-use pedestrian friendly developments, bicycling, and transit usage. This will help the RVMPO project the benefits of mixed-use, pedestrian friendly development in terms of reducing reliance on the automobile.
The Freight Study will identify specific projects that will improve the freight transportation system in the MPO area. The RVMPO will develop a process to prioritize freight transportation improvement projects as part of the study.
The RVMPO is closely monitoring the Governor s fall 2004 Connect Oregon Initiative, which seeks to connect all modes within the State.
6. TEA-21 #6: Promote efficient system management and operations.
Medford has signal timing plans for many of the major corridors in the city. The RVMPO has just completed an Intelligent Transportation Systems (ITS) study which has identified projects to increase safety and efficiency in the area. Also, the RTP includes many TSM projects that will improve traffic flow and enhance safety.
The RTP promotes a multi-modal transportation system. This approach helps to maximize the transportation investment by providing options to travelers, which enhances access to areas through other modes of transportation. This reduces the demand on the highway system, which increases roadway capacity and reduces maintenance costs.

5
7. TEA-21 #7: Emphasize the preservation of the existing transportation system.
The RVMPO project selection process strongly emphasizes preservation of the existing transportation system.
In addition, the MPO addresses the seven (7) TEA-21 Planning Factors through its Livability and Economic Opportunities project selection criteria. The selection criteria are used to rank and prioritize regional projects. Regional projects included in the RVMPO Transportation Improvement Program (TIP) and State Transportation Improvement Program (STIP) must address seven regional goals and several evaluation criteria. All projects must support the economy, increase safety, improve mobility and accessibility, protect the environment, promote energy conservation, improve the quality of life, enhance connectivity, promote efficient system management and operations, and emphasize the preservation of the existing transportation system.
As mentioned, the RTP s Goals and Policies address the seven planning factors. In addition, the MPO Policy Committee utilizes a project scoring matrix (Table A-2), as a tool to select projects for the TIP. Table A-1 cross-references each of the seven planning factors with relevant RTP policies and TIP project selection goals.
FFiigguurree AA--11 CCrroossss--RReeffeerreenncciinngg ooff SSeevveenn TTEEAA--2211 PPllaannnniinngg FFaaccttoorrss wwiitthh tthhee RRVVMMPPOO GGuuiiddiinngg PPrriinncciipplleess aanndd TTIIPP PPrroojjeecctt SSeelleeccttiioonn GGooaallss
TEA-21 Planning Factor Addressed by RTP Goal:
RVMPO TIP Project Selection Goals from Scoring Matrix
Support the economic vitality of the metropolitan area, especially by enabling global
competitiveness, productivity, and efficiency; 5,10
Goal 1- Use of Transportation investments to foster economic
opportunities. Increase the safety and security of the
transportation system for motorized and non-motorized users;
2 Goal 2- Optimize safety on the transportation system
Increase the accessibility and mobility options available to people and for freight;
1,6,9
Goal 3 - Access to alternative modes of transportation and
reduced reliance on the automobile
Protect and enhance the environment, promote energy conservation, and improve the quality of
life; 3,8
Goal 4 To provide environmentally-sensitive
transportation options
Enhance the integration and connectivity of the transportation system, across and between
modes, for people and freight; 1
Goal 5 Access to alternative modes of transportation and reduced reliance on single-
occupant automobiles 1. Promote efficient system
management and operation; 4 Goal 6 Efficient utilization of
existing & future transportation infrastructure
Emphasize the efficient preservation of the existing transportation system.
5 Goal 7 Efficient utilization of existing & future transportation
infrastructure

6
FFiigguurree AA--22 TTIIPP PPrroojjeecctt SSccoorriinngg MMaattrriixx Goal
Selection Criteria
Evaluation Method
Allowable
Points
Will the project extend the life of the facility without construction of new facilities? 2 Will the project upgrade or refurbish existing transit facilities or transit routes? 1
1.1
Preservation of
Transportation Facilities Will the project upgrade or refurbish existing bicycle and/or pedestrian facilities? 1
Total Points for 1.1 Preservation of Transportation Facilities 4 1.2
Local Connectivity Does the project preserve the function of the State transportation system by encouraging local use of the
local transportation system? 2
Total Points for 1.2 Local Connectivity 2 Does the project improve the volume/capacity ratio on this facility and/or nearby facilities? 6
No change or decrease = 0 Up to 0.05 = 2 0.06 to .1 = 4
Greater than .1 = 6 Does the project result in a regional VMT reduction? 2
Yes = 2 No = 0
Level of Service Forecast 2 LOS F is forecast within 10 years = 1 point
1.3
Congestion Relief
Project will delay LOS F within the planning horizon of the TSP or 15 years, whichever is greater = 1 point Total Points for 1.3 Congestion Relief 10
Are land use alternatives existing or proposed that reduce auto trips? 2 Alternative land uses are proposed = 1
1.4
Balance of Jobs, Housing and Commercial Uses to
Reduce Auto Trips Alternative land uses exist and/or are codified = 2
Total Points for 1.4 Balance of Jobs, Housing, and Commercial Uses to Reduce Auto Trips 2 Does the project provide excess capacity beyond the 20-year horizon? 1 1.5
Flexibility Does the project include actions that result in the preservation capacity or corridor preservation? 1
Efficient Utilization of Existing & Future
Transportation Infrastructure
Total Points for 1.5 Flexibility 2 Efficient Utilization of Existing & Future Transportation Infrastructure goal scores can be up to 20% of project score 20
Does the project promote compact development within urban growth boundaries to minimize the costs of providing public services and infrastructure and to protect resource land outside urban growth boundaries?
1.5
Does the project give priority to a quality mix of development that addresses the economic and community goals of a community and region?
1.5
Does the project encourage mixed use, energy-efficient development designed to encourage walking, biking and transit use (where transit is available)?
1.5
Does the project support development that is compatible with a community's ability to provide adequate public facilities and services?
1.5
Does the project facilitate development that is compatible with community and regional environmental concerns and available natural resources (e.g., available water, air quality, etc.)
1.5
Does the project support development that provides for a balance of jobs and affordable housing within a community to reduce the need to commute long distances between home and work, thereby minimizing
person commuting costs as well as the public and social impacts of driving?
1.5
2.1
Quality Development Objectives
Does the project promote sustainable local and regional economies in order to provide jobs for residents and financial support for community services?
1.5 (bonus)
Use of Transportation Investments to
Foster Compact, Livable
Communities
Total Points for 2.1 Consistency with Appropriate Local, Regional & State Plans 9

7
Goal
Selection Criteria
Evaluation Method
Allowable
Points
Project analysis has been performed and is complete. 1 2.2
Impacts on Neighborhoods
and Local Businesses. Property owners and affected parties have been notified, an opportunity to comment was provided, and comment was recorded.
1
Total Points for 2.2 Impacts on Neighborhoods and Local Businesses 2 A transportation related project which enhances the community appearance or urban design (such as,
architectural design, street trees, etc.) 4 2.3
Aesthetics/Historical/Cultura
l Does the project enhance access to a historically/culturally significant area? 4
Total Points for 2.3 Aesthetics/Historical/Cultural 8 Use of Transportation Investments to Foster Compact, Livable Communities goal scores can be up to 19% of project score 19
3.1 Economic Opportunity Will the project create significant economic development opportunities? 2 Total Points for 3.1 Economic Opportunity 2
3.2 Linkages to the Marketplace Does the project improve access and/or travel time to a commercial/industrial center? 4 Total Points for 3.2 Linkages to the Marketplace 4
3.3 Linkages to Freight Corridors Does the project improve access and/or travel time to an established truck route, airport, railroad, or port? 3 Total Points for 3.3 Linkages to Freight Corridors 3
3.4 Supports Community Economic Base
Is there evidence that the project will support existing businesses and/or industry? 6
Total Points for 3.4 Supports Community Economic Base 6 3.5 Preservation of Freight Corridors Does the project enhance a designated truck/freight route? [The designation must be approved by the state.] 3
Use of Transportation Investments to
Foster Economic Opportunities
Total Points for 3.5 Preservation of Freight Corridors 3 Use of Transportation Investments to Foster Economic Opportunities scores can be up to 18% of project score 18
4.1 Benefits to Transit System Does the project benefit the Public Transit System? 2 Total Points for 4.1 Benefits to Transit System 2
4.2
Alternative Modes of Transportation
Project increases alternative mode options for transportation system users. 2 points are awarded for each of the following modes that are included in the project scope, to a maximum of 7 points: bike lanes, sidewalks,
park and ride facilities, bus stops
7
Total Points for 4.2 Alternative Modes of Transportation 7 4.3
Unique Alternative Mode Projects
Project improves bike, pedestrian and/or transit access to a CBD or industrial area 2
Access to Alternative Modes of Transportation
and Reduced Reliance on the Single-Occupant
Auto Total Points for 4.3 Unique Alternative Mode Projects 2
Access to Alternative Modes of Transportation and Reduced Reliance on Single-Occupant Auto goal scores can be up to 11% of project score 11 Project reduces CO emissions 1 5.1
Impacts to Air Quality Project reduces PM-2.5 and/or PM-10 emissions 1
Total Points for 5.1 Impacts to Air Quality 2 Does the project minimize impacts to wetlands, water bodies and riparian corridors? Yes = 2; No = 0 2 5.2 Impacts to Wetlands, Water Bodies
and Riparian Corridors Does the project avoid impacts to water bodies? Yes = 1; No = 0 1 Total Points for 5.3 Impacts to Wetlands, Water Bodies, and Riparian Corridors 3
5.3 Noise Level Impacts Will the project increase noise levels in noise sensitive areas? 1 Total Points for 5.4 Noise Level Impacts 1
Categorical Exclusion = 2 2 Environmental Assessment = 1
To Provide Environmentally-
Sensitive Transportation
Options
5.4
Environmental Impact Statement
Environmental Impact Statement = 0
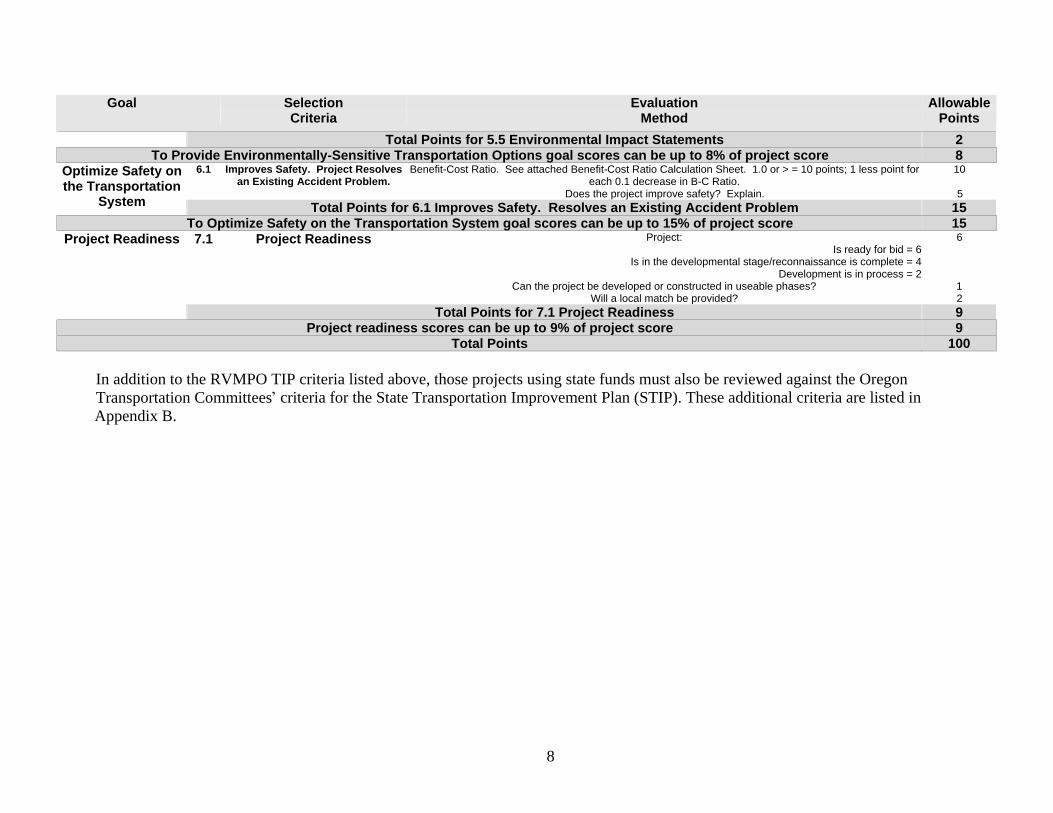
8
Goal
Selection Criteria
Evaluation Method
Allowable
Points
Total Points for 5.5 Environmental Impact Statements 2 To Provide Environmentally-Sensitive Transportation Options goal scores can be up to 8% of project score 8
Benefit-Cost Ratio. See attached Benefit-Cost Ratio Calculation Sheet. 1.0 or > = 10 points; 1 less point for each 0.1 decrease in B-C Ratio.
10 6.1 Improves Safety. Project Resolves an Existing Accident Problem.
Does the project improve safety? Explain. 5
Optimize Safety on the Transportation
System Total Points for 6.1 Improves Safety. Resolves an Existing Accident Problem 15 To Optimize Safety on the Transportation System goal scores can be up to 15% of project score 15
Project: 6 Is ready for bid = 6
Is in the developmental stage/reconnaissance is complete = 4 Development is in process = 2
Can the project be developed or constructed in useable phases? 1
7.1
Project Readiness
Will a local match be provided? 2
Project Readiness
Total Points for 7.1 Project Readiness 9 Project readiness scores can be up to 9% of project score 9
Total Points 100
In addition to the RVMPO TIP criteria listed above, those projects using state funds must also be reviewed against the Oregon Transportation Committees criteria for the State Transportation Improvement Plan (STIP). These additional criteria are listed in Appendix B.

9
AAppppeennddiixx BB
SSTTIIPP CCRRIITTEERRIIAA
PPrroojjeecctt EElliiggiibbiilliittyy CCrriitteerriiaa aanndd PPrriioorriittiizzaattiioonn FFaaccttoorrss ffoorr tthhee 22000066--22000099 DDeevveellooppmmeenntt SSTTIIPP aanndd CCoonnssttrruuccttiioonn SSTTIIPP
FFiigguurree BB--11 EElliiggiibbiilliittyy CCrriitteerriiaa Development STIP Construction STIP*
Major Projects Modernization Projects
Preservation Projects
Bridge Replacement/ Rehabilitation
Projects Development work on major projects may be eligible for funding if it:
Supports the definition of Development STIP approved
by the Oregon Transportation Commission
Addresses an unmet transportation need in the applicable acknowledged transportation system plan(s) (TSP) or, in the absence of an applicable acknowledged TSP(s), the applicable acknowledged comprehensive plan and any applicable adopted TSP(s).
or
Addresses project need, mode, function and general location for a transportation need identified in an acknowledged TSP
or
Is identified as project of statewide significance or as a federal discretionary project.
Has funding adequate to complete the identified milestone.1
Modernization projects may be eligible for funding if they:
Are consistent with the applicable acknowledged transportation system plan (TSP) or, in the absence of an applicable acknowledged TSP, the applicable acknowledged comprehensive plan and any applicable adopted TSP.5
Are consistent with the Oregon Highway Plan policy on Major Improvements (Policy 1G, Action 1.G.1) were applicable.6
Pavement Preservation projects may be eligible for funding if they:
Are identified through the Pavement Management System process.11
Bridge replacement projects may be eligible for funding if they:
Are identified through the Bridge Management System Process.15
Are improvements or work needed to rebuild or extend the service life of existing bridges and structures (includes replacement of an existing bridge).
*To the extent that legislative action (e.g. HB 2041) applies, the criteria in the legislation will control in the event of a conflict.

10
FFiigguurree BB--22 PPrriioorriittiizzaattiioonn FFaaccttoorrss UUsseedd ttoo SSeelleecctt PPrroojjeeccttss ffoorr FFuunnddiinngg ffrroomm tthhee PPooooll ooff EElliiggiibbllee PPrroojjeeccttss
Development STIP Construction STIP
Major Projects Modernization Projects Preservation Projects
Bridge Replacement/ Rehabilitation
Projects Priority shall be given to:
D-STIP project suitability (an assessment of the level of work completed to achieve the planned D-STIP milestone)
Projects that best support the policies of the Oregon Highway Plan.2
Projects that have already completed on or more D-STIP milestones
Projects that have funding identified for development or construction.3
Major Modernization Projects that leverage other funds and public benefits.4
Priority shall be given to:
Project readiness (an assessment of the likelihood of a project getting to construction in the timeframe contemplated).7
Projects that best support the policies of the Oregon Highway Plan.8
Projects that leverage other funds and public benefits.9
Class 1 and 3 projects that have completed an environmental milestone of a Record of Decision (ROD) or Finding of NO Significant Impact (FONSI)10
Priority shall be given to:
Project readiness (an assessment of the likelihood of a project getting to construction in the timeframe contemplated)12
Projects that best support the policies of the Oregon Highway Plan.13
Projects that leverage other funds and public benefits.14
Priority shall be given to:
Projects that support the approved Bridge Options Report (This prioritization factor is not intended to limit bridge projects to those identified in the Bridge Options Report, but to give priority to those identified in the report)16
Projects that leverage other funds and public benefits.17
PPrroojjeecctt EElliiggiibbiilliittyy CCrriitteerriiaa aanndd PPrriioorriittiizzaattiioonn FFaaccttoorrss PPrroocceessss DDeessccrriippttiioonn aanndd GGuuiiddaannccee 22 ffoorr tthhee 22000066--22000099 DDeevveellooppmmeenntt SSTTIIPP aanndd CCoonnssttrruuccttiioonn SSTTIIPP
I. Introduction
The Oregon Transportation Commission (OTC) approved the Project Eligibility Criteria and Prioritization Factors to assist Area Commissions on Transportation (ACTs), Metropolitan Planning Organizations (MPOs), or regional or statewide advisory groups advising the OTC on the selection of Statewide Transportation Improvement Program (STIP) projects. The document gives basic definitions and funding information and provides guidance pertaining to roles and responsibilities, project selection and documentation. More information about the ACT process, advisory committees, Oregon transportation management systems, other STIP programs, and funding is available on the Internet.

11
The OTC establishes program goals, funding levels and regional funding distribution at the start of each two-year STIP update. These policy decisions are made separate from these eligibility criteria and prioritization factors and are not part of this document.
A. Roles and Responsibilities
The OTC will make the final selections for all projects included in the STIP. The Commission will consider the advice and recommendations that it receives from ACTs, MPOs and regional or statewide advisory groups. ODOT will provide tools necessary to enable an ACT to carry out its responsibilities under these criteria. Geographic areas that do not have an ACT must adhere to the same standards of accountability as ACTs (Policy on Formation and Operation of the Area Commissions on Transportation, Section VI, Basis for Decision Making) and demonstrate to the OTC that recommendations were developed in accordance with these criteria and factors. In making final project selections, the OTC will ensure that ACTs, MPOs and regional or statewide advisory groups have based their considerations on the criteria and will ensure projects are distributed according to the funding allocations approved by the OTC for the 2006 2009 STIP.
In making decisions, the OTC applies both regional and statewide perspective, optimizes system effectiveness in decisions for the state system, and strives to develop and operate an integrated intermodal transportation system that facilitates the safe, efficient, and economic movement of people and goods. (Policy on Formation and Operation of the Area Commissions on Transportation, Section III. Authority)
B. Definitions
STIP includes both the Development and Construction sections of the Statewide Transportation Improvement Program. The D-STIP houses projects that require more than 4 years to develop or for which construction funding needs to be obtained. Projects that can complete the development process and be ready for bid within 4 years or less may be placed directly into the C-STIP.
Development STIP (D-STIP)
The Oregon Transportation Commission approved the following definition for the D-STIP:
Projects approved and funded for development through specific milestones and within specific timeframes, which include the following characteristics:
Projects approved for funding through specific milestones such as National Environmental Policy ACT (NEPA) design-level environmental documents, right of way acquisition, and final plans; or
Projects for which needed improvements have been identified but a final solution either has not been determined or needs further design and analysis.
The types of projects that tend to have one or more of the above characteristics include large statewide significant projects, federally earmarked or demonstration projects, modernization or major bridge replacement projects, and discretionary projects (projects eligible to receive federal discretionary funds).

12
Construction STIP (C-STIP)
The C-STIP identifies project scheduling and funding for the state s transportation preservation and capital improvement program for a four-year construction period. This program meets the requirements of the Transportation Equity Act for the 21st Century (TEA-21), the federal act that provides funds to states for transportation projects. For application of these criteria and prioritization factors, C-STIP means Modernization, Preservation and Bridge projects.
Other STIP Programs
Other STIP programs (examples include Safety, Bicycle/Pedestrian, Transit, Congestion Mitigation/Air Quality Improvement, Transportation Enhancement, and Scenic Byways) are not addressed in this document. More information about programs funded in the STIP is available in the Draft 2004-2007 STIP.
C. Project Selection
Eligibility Criteria and Prioritization Factors have been developed for both the Development STIP (D-STIP) and the Construction STIP (C-STIP). ACTs, MPOs and others, including those where an ACT does not exist, shall apply both regional and statewide perspectives in making their recommendations. The Commission anticipates that most projects considered by ACTs, MPOs and regional or statewide advisory groups would be the outcomes of planning and the transportation management systems maintained by ODOT. ODOT Region staff shall assist the ACT in developing recommendations as described in the Policy on Formation and Operation of the ACTS, Section II. D, Role of ODOT Staff.
ACTs, MPOs and regional or statewide advisory groups should use this document as a guide when they evaluate projects for the STIP on the state highway system and for off-system projects that support implementation of the Oregon Highway Plan (OHP). Projects recommended for funding in the STIP should have consistent application of the project eligibility criteria and prioritizing factors. ACTs, MPOs and regional or statewide advisory groups may use additional criteria to select and rank projects provided the criteria are consistent with the project eligibility criteria and prioritization factors adopted by the OTC. If requested, ODOT staff will provide a model to assist with project ranking. This process recognizes regional differences and is consistent with the Oregon Transportation Plan (Policy 2G) and the Policy on Formation and Operation of the Area Commissions on Transportation, Section VI, Basis for Decision-making.
In MPO areas designated as Transportation Management Areas (TMA), all projects using federal title 23 or Federal Transit Act funds, except projects on the NHS and projects funded under the Bridge, Interstate Maintenance and Federal Lands Highways programs, shall be selected by the MPO in consultation with the State and transit operator from the approved metropolitan Transportation Improvement Program (TIP). Projects on the NHS and projects funded under the Bridge and Interstate Maintenance programs shall be selected by the State, in cooperation with the MPO, from the approved metropolitan TIP.
In MPO areas not designated as TMAs, projects using federal title 23 or Federal Transit Act funds, other than Federal Lands Highways program funds, shall be selected by the State and/or the transit operator, in cooperation with the MPO, from the approved metropolitan TIP.

13
Outside MPO areas, transportation projects undertaken on the NHS and projects funded under the Bridge and Interstate Maintenance programs will be selected by the State in consultation with the affected local officials. Other transportation projects undertaken with funds administered by FHWA, other than federal lands highway projects, shall be selected by the State in cooperation with the affected local officials and projects undertaken with Federal Transit Act funds shall be selected by the State in cooperation with the appropriate affected local officials and transit operators (23 Code of Federal Regulations Part 450).
ACTs and MPOs should coordinate their efforts to assure a better decision-making process that results in better coordination of projects. When ACT and MPO boundaries overlap, a higher level of clearly defined coordination is needed. Where this occurs, the MPO and ACT should jointly agree on a process for maintaining consistency between ACT recommendations and the MPO Plan and TIP (Policy on Formation and Operation of the Area Commissions on Transportation, Section VII. G, Coordination).
Project Eligibility Criteria
ACTs, MPOs, or regional or statewide advisory groups advising the OTC on the selection of STIP projects for funding on the state highway system or for off-system projects that support implementation of the OHP shall apply the project eligibility criteria. The project eligibility criteria are a first screen so that additional efforts can be focused to determine which projects they will evaluate further for funding. The eligibility criteria are not listed in any particular order. Projects must satisfy these criteria, at a minimum, before they are given further consideration.
Prioritization Factors
The prioritization factors are to be used to ensure consistent consideration of the relative merits of projects by ACTs, MPOs and regional or statewide advisory groups. With the exception of project readiness which shall have greater weight, the prioritization factors are not listed in any particular order and do not have any implied weight. To provide for regional differences, ACTs, MPOs and regional or statewide advisory groups may use additional factors to rank projects provided the factors are consistent with the factors adopted by the OTC. If an ACT, MPO or regional or statewide advisory group chooses to use additional prioritization factors, they must inform those developing project proposals about the factors prior to the beginning of the project submittal period. When developing a tool to evaluate OHP policies, OHP Appendix A2 provides definitional information to facilitate shared understanding of the goals, policies, and actions of the OHP policy element.
D. Project Documentation
ACTs, MPOs and regional or statewide advisory groups making recommendations to the OTC shall document the analysis used to develop recommendations. The supporting information should include the following:
1. Project description 2. Project justification
Identify the planning history
As applicable, describe information provided from the pavements or bridge management system. If the recommendation varies from the prioritization identified by the management system, describe the process used to reach that recommendation

14
Describe how this project supports OHP policies (Table 1)
Provide an assessment of the likelihood of the project getting to construction in the timeframe contemplated
Provide supplementary project information if the project leverages additional funding or community benefit
3. Applicable additional information
E. Funding
As required by federal regulations (23 CFR Part 450) the C-STIP is financially constrained by year. The Eligibility Criteria and Prioritization Factors defined in this document apply to projects that implement current revenue sources. If more funding becomes available, it will be allocated in adherence to any additional funding or selection criteria attached to those new funds.
The STIP represents multiple funding categories and each category has limits as to how the funding can be obligated. STIP projects must meet the funding source limitations established by state or federal regulations and cannot be selected without looking at those limitations. The D-STIP will be funded with the same funding sources as the C-STIP and the total funds committed to the D-STIP may vary. Funding of the D-STIP can be impacted by several factors, including the following: OTC selection of projects of statewide importance, federally funded earmarks and discretionary projects, federal and state restrictions on the use of available funds, and the Regional equity distribution of Modernization funds (ORS 366.507).
II. Development STIP (D-STIP)
A. Introduction to the D-STIP
The Oregon Transportation Commission will make the final selections for all D-STIP projects and will apply a statewide perspective to the proposed list of projects, giving highest priority to OTC approved federal discretionary projects that have funding secured through federal legislation. It will be important to clearly articulate the rationale and need of a D-STIP project in order to help manage expectations and potential next steps. D-STIP projects will be consistent with statewide policies and may be identified in one or more planning documents, such as transportation system plans, regional transportation plans, corridor plans, comprehensive plans, refinement plans, or state management systems. Additionally, the OTC may select large projects of statewide significance for inclusion in the D-STIP. The D-STIP includes projects approved and funded for development through specific milestones for planning, environmental or project development activities and within specific timeframes.
The following should be considered when applying the Eligibility Criteria and Prioritization Factors:
A new alignment will be selected for one or several features in the refinement plan. Project specific refinement plans may be funded in the D-STIP as needed to resolve need, function, mode, and general location decisions that could not be made during system plan or corridor plan development. In circumstances where these decisions have already been made, the goal of refinement planning will be to develop a specific solution or a range of solutions to the problems(s) that support the next appropriate project development step.
Rapid development is occurring in the area, making corridor preservation critical.

15
Issues needing resolution have a high priority and solutions are likely to be funded in the near future.
The highway segment is very sensitive environmentally, and a strategy for the whole segment needs to be approved before work on individual elements can commence. For example, addressing land use to help resolve inconsistencies with planned transportation facilities; planning for compatible land uses along state highways.
Public pressure for a sustainable decision is high.
Selection of D-STIP projects requires application of the D-STIP definition approved by the OTC. D-STIP projects generally fall into the following three categories: federal discretionary projects (earmarks), large statewide significant projects, and modernization or major bridge replacement projects.
Federal discretionary projects
Federal discretionary projects are a part of federal appropriations or transportation funding legislation. The Oregon Department of Transportation, with direction from the Oregon Transportation Commission, developed guidelines to use in deciding which projects should be submitted as earmark proposals in federal legislation for the reauthorization of transportation funding. The projects are categorized as low or medium risk and can be completed over the life of the federal transportation-funding bill. Local jurisdictions that pursue earmark funding for projects not submitted by ODOT are solely responsible for the required matching funds or any shortfalls.
Large statewide significant projects
Large statewide significant projects are projects that require funding that cannot be achieved within standard STIP allocations but are viewed by the OTC as projects of statewide significance and can be selected by the OTC independent of the ACT process. Identified funds would be used to either keep existing work on very large projects current, or to support development of very large projects (for example, funding a new Environmental Impact Statement or updating an existing EIS).
Modernization or major bridge replacement projects
Modernization or major bridge replacement projects are projects that have been approved and funded for development through specific milestones but that cannot be constructed within the four-year timeframe of the STIP and/or within the normal Region STIP allocations. These may include shelf projects, which are high priority projects developed in anticipation of funding but that have no funding identified for construction in the current STIP. Milestones include planning, environmental and project development.
D-STIP Project Completion
Projects remain in the D-STIP until work required to meet the National Environmental Policy Act (NEPA) is completed. NEPA classifications:
Class 1: Requires draft and final environmental impact statement (EIS). An EIS is required for actions that significantly affect the environment.

16
Class 2: Categorical exclusion (neither an environmental assessment nor an environmental impact statement is required). These actions do not individually or cumulative have a significant environmental effect and are excluded from the requirement to prepare an environmental assessment or environmental impact statement.
Class 3: Requires environmental assessment (EA) or revised environmental assessment. The environmental impact is not clearly established. All actions that are not Class 1 or 2 fall into this classification. These actions require preparation of an EA to determine the appropriate environmental document. If it is determined that the action is likely to have a significant impact on the environment, the preparation of an EIS will be required.
All Class 1 and 3 projects should be in the D-STIP until a final Record of Decision (ROD) or Finding of No Significant Impact (FONSI) has been completed. By programming completion of D-STIP milestones that follow a ROD or FONSI, the project delivery activity can continue through right of way acquisition, advance plans, and/or plans specifications and estimates (PS&E). The project could then be ready for inclusion in the C-STIP at the regular 2-year update. Work on right of way, advance plans or PS&E may be conducted in either the D-STIP or the C-STIP.
ODOT and the Department of Land Conservation and Development (DLCD) shall work with affected cities and counties to obtain land use approvals needed to select a specific alignment. After completion of the Draft EIS or EA they will resolve any other project specific land use issues. The level of land use consistency required will depend on the environmental milestone being completed.
Although the primary purpose of the D-STIP is to develop projects for the C-STIP, inclusion in the D-STIP does not guarantee funding for future D-STIP milestones or that a project will automatically move into the C-STIP. Funding may not be available to construct the final solution or the environmental document may identify the solution as a No Build .
B. Development STIP
B.1. Development STIP Eligibility Criteria Footnotes 1 D-STIP milestones. D-STIP projects must have funding to complete the identified milestone; partial milestones or those with no funding will not be programmed. D-STIP milestones, while not necessarily sequential, include those listed below. Not all projects are required to complete all the milestones.
Project specific refinement plan completion
Project specific refinement plan adoption
Land use consistency/Statewide Goal Compliance. (Project is included in the acknowledged comprehensive plan or transportation system plan as a planned facility, which is a facility allowed by the plan and that is expected to be constructed within the next 20 years with available financial resources. This may include land use decisions that establish need, mode, function and general location.)
Location Environmental Impact Statement (EIS) Record of Decision (ROD)
Design EIS ROD
Environmental Assessment (EA) and Finding of No Significant Impact (FONSI)
17
Right of way acquisition
Advance plans (or any other applicable project development design milestone)
Plans, specifications and estimates (PS&E)
B.2. Development STIP Prioritization Factors Footnotes 2 D-STIP Projects that Best Support the Oregon Highway Plan Policies. Oregon Highway Plan policies that are applicable to D-STIP projects may include but are not necessarily limited to the following (Table 1):
1A, 1B, 1C, 1D, 1F, 1G, 1H, 2A, 2B, 2C, 2E, 2F, 2G, 3A, 3B, 3C, 4A, 4B, 4C, 4D, 4E, and 5A
3 Funding for D-STIP Projects. A funding scenario should be identified through construction, though not necessarily guaranteed. Congressional high priority projects would fall into this category.
4 Leverage and Public Benefit for D-STIP Projects. ACTs, MPOs and regional or statewide advisory groups should evaluate how proposed projects leverage additional funding or collateral community benefits and make wise and efficient use of infrastructure and natural resources. Those making project recommendations should pursue an agenda to accomplish leverage or community benefits although specific benefits might not always be known at the D-STIP stage. Examples of leverage and public benefits for D-STIP modernization projects could include where applicable, but are not limited to the following:
Other funding contributions, such as additional federal funds, local matching funds or provision of project right of way, private funding.
Bundling with other infrastructure projects (provided there is no adverse affect on project readiness).
Fish enhancement, such as culvert replacement and improved drainage.
Transfer of jurisdiction from state to local control.
Leveraging additional funds that contribute to transportation system effectiveness, revitalization of the downtown or mainstreet, etc.
Direct benefits to multiple modes of travel. This would include local efforts to accommodate non-auto modal opportunities.
Local circulation improvements that support and complement the state highway project.
Improvements in Oregon s economy by addressing transportation challenges.
Potential for collecting toll revenues.
Projects that implement other innovative finance techniques.
This determination must be considered within the capacity of the community on a case by case basis.

18
III. Construction STIP (C-STIP)
A. Introduction to the C-STIP
The C-STIP contains projects scheduled for construction and is financially constrained by year. Application of the C-STIP Eligibility Criteria and Prioritization Factors includes Modernization, Preservation, and Bridge projects. Information about other programs in the STIP may be found in the Draft 2004-2007 STIP.
B. Modernization
As stated in the 1999 Oregon Highway Plan, The primary goal of modernization projects is to add capacity to the highway system in order to facilitate existing traffic and/or accommodate projected traffic growth. Modernization means capacity-adding projects including HOV lanes and off-system improvements. Projects in this category include major widening of lanes or bridges, and the addition of lanes, rest areas or entire facilities. Where a culvert is replaced with a bridge due to environmental analysis concluding that this is necessary, the project is not considered modernization.
B.1. Construction STIP Eligibility Criteria for Modernization Footnotes 5 Consistency with Comprehensive Plans and Transportation System Plans (TSP). The proposal must show that the project is consistent with the applicable adopted comprehensive plan or transportation system plan as a planned facility, including land use decisions that establish need, mode, function and general location, including goal exceptions, where required. If consistency cannot be demonstrated the project submission will describe how the inconsistency will be addressed, including changes to the project, TSP and/or comprehensive plan and when they need to be completed. In such cases, the ACT or regional or statewide advisory group may recommend that the project be included in the D-STIP, and request that Transportation Planning Rule issues be addressed.
Proposed projects from within MPOs shall be identified in fiscally constrained Regional Transportation Plans and shall meet air quality conformity requirements.
6 Consistency with Oregon Highway Plan (OHP) Policy 1G, Action 1G.1, on Major Improvements. In order to demonstrate that a project is consistent with OHP Policy 1G, Action 1G.1, the proposal must show that the project and/or the TSP clearly addressed the prioritization criteria found in Action 1G.1 of the OHP.
Where needed to achieve consistency with the above-noted Oregon Highway Plan policy, the ACTs, MPOs, or regional or statewide advisory groups, with ODOT assistance, shall negotiate conditions for project approval with an applicant. These conditions, if not addressed as the project proceeded through the D-STIP if applicable, shall be attached to the application approved by the ACT, MPO or regional or statewide advisory group, shall be as specific as possible given the stage of development of the project, and may include the following:
Access management and interchange area management plans,
Highway segment designations,
Needed local street improvements,
Traffic management plans,

19
Land use plan designations,
Other similar conditions.
B.2. Construction STIP Prioritization Factors for Modernization Footnotes 7 Project Readiness for C-STIP Modernization Projects. Projects that can begin construction within the timeframe of the STIP and within the timeframe expected are considered to be more ready than those that have many or complicated remaining steps. The overall judgment of a project's readiness is dependent on timeliness of construction expectations not on the number of steps to be completed.
Where applicable, the hurdles to accomplish each of the following steps must be assessed for major modernization projects that have come through the D-STIP and for which a final Record of Decision (ROD) for a design level environmental impact statement or a Finding of No Significant Impact (FONSI) has been made:
Public involvement
Right of way purchased
Final construction and traffic flow management plans developed
Additional land use requirements such as completing plans for access management, supporting local transportation system improvements and land use measures to protect the function and operation of the project.
Projects that have not gone through the D-STIP or have not completed a FONSI or ROD must also assess the following:
Environmental requirements
Land use requirements
Applicability of minor improvements and alternative mode solutions
For all projects, if those aspects are not completed at the time of the assessment of project readiness, a plan to complete them must be described to assist in judging the likelihood that all of those aspects can be addressed, and construction begun within the timeframe projected. The project budget and time line must include execution of the plan.
8 Modernization Projects that Best Support the Oregon Highway Plan Policies. OHP policies that are applicable to modernization projects may include but are not necessarily limited to the following (Table 1):
1A, 1B, 1C, 1D, 1F, 1G, 1H, 2A, 2B, 2C, 2E, 2F, 2G, 3A, 3B, 3C, 4A, 4B, 4C, 4D, 4E, 38 and 5A
9 Leverage and Public Benefit for C-STIP Modernization Projects. ACTs, MPOs and regional or statewide advisory groups should evaluate how proposed projects leverage additional funding or collateral community benefits and make wise and efficient use of infrastructure and natural resources. Examples of leverage and public benefits for C-STIP modernization projects include:
20
Other funding contributions, such as additional federal funds, local matching funds or provision of project right-of-way, private funding.
Bundling with other infrastructure projects (provided there is no adverse affect on project readiness).
Fish enhancement, such as culvert replacement and improved drainage.
Transfer of jurisdiction from state to local control.
Leveraging of additional funds that contribute to transportation system effectiveness, revitalization of the downtown or mainstreet, etc.
Direct benefits to multiple modes of travel. This would include local efforts to accommodate non-auto modal opportunities.
Local circulation improvements that support and complement the state highway project.
Improvements in Oregon s economy by addressing transportation challenges.
Potential for collecting toll revenues.
Projects that implement other innovative finance techniques.
This determination must be considered within the capacity of the community on a case by case basis.
10 Environmental Classification
Class 1: Requires draft and final environmental impact statement (EIS)
Class 2: Categorical exclusion (neither an environmental assessment nor an environmental impact statement is required)
Class 3: Requires environmental assessment (EA) or revised environmental assessment
This prioritization factor is not intended to give Class 1 and 3 projects priority over or to exclude Class 2 projects, but to give Class 1 and 3 projects with a completed ROD or FONSI priority over Class 1 and 3 projects that require additional environmental documentation.
C. Preservation
The pavement preservation projects list is developed by ODOT s Pavement Management System (PMS) and applied by the pavement management selection committees. The PMS is an electronic data management tool used by the department to identify, prioritize, and develop needed pavement preservation projects. The role of ACTs, MPOs and regional or statewide advisory groups is to review the timing of the pavement preservation projects as they relate to other local projects or issues; their comments will be considered as part of the process. It is anticipated that these groups will primarily enhance selected projects by leveraging additional funding or collateral community benefit. The interstate preservation projects are selected based on the PMS and a statewide strategy and are therefore not a part of these criteria.
C.1. Construction STIP Eligibility Criteria for Pavement Preservation Footnotes 11 Pavement Strategy. The department has adopted a pavement preservation program designed to keep highways in the best condition at the lowest lifecycle cost, taking into account available funding. ODOT established a Pavement Strategy Committee in 1999 to address pavement preservation issues, including the development of a statewide pavement strategy for all state highways. The pavement strategy was developed using the department s Pavement Management

21
System. The strategy assumes maintenance of existing traffic capacity; it does not provide for capacity improvements.
Using the list generated by the Pavement Management System (PMS), each Region is responsible for recommending preservation projects for inclusion in the STIP.
C.2. Construction STIP Prioritization Factors for Pavement Preservation Footnotes
12 Project Readiness for C-STIP Preservation Projects. Projects that can begin construction within the timeframe of the STIP and within the timeframe expected are considered to be more ready than those that have many or complicated remaining steps. The overall judgment of a project's readiness is dependent on timeliness of construction expectations not on the number of steps to be completed.
13 Preservation Projects that Best Support the Oregon Highway Plan Policies. Oregon Highway Plan policies that are applicable to preservation projects may include but are not necessarily limited to the following (Table 1):
1A, 1B, 1C, 1D, 1E, 2A, 2C, 2F, 3A, 4A, and 5A
14 Leverage and Public Benefit for C-STIP Preservation Projects. ACTs, MPOs and regional or statewide advisory groups should evaluate how proposed projects leverage additional funding or collateral community benefits and make wise and efficient use of infrastructure and natural resources. Examples of leverage and public benefits for C-STIP pavement preservation projects include:
Other funding contributions, such as additional federal funds, local matching funds or provision of project right-of-way, private funding.
Bundling with other infrastructure projects (provided there is no adverse affect on project readiness).
Fish enhancement, such as culvert replacement and improved drainage.
Transfer of jurisdiction from state to local control.
Leveraging of additional funds that contribute to transportation system effectiveness, revitalization of the downtown or mainstreet, etc.
Direct benefits to multiple modes of travel. This would include local efforts to accommodate non-auto modal opportunities.
Local circulation improvements that support and complement the state highway project.
Improvements in Oregon s economy by addressing transportation challenges.
D. Bridge
The process of identifying bridge projects for the STIP is two-fold in nature (1) bridges are inspected at least every two years, in order that the most current inspection information is used to develop a list of bridges and (2) the use of a Bridge Management System (BMS). The BMS is an electronic data management tool used by the department to identify, prioritize, and develop needed bridge improvements. BMS data are linked to other technical databases to identify bridges that meet twelve separate deficiency parameters. Applying this information, the State Bridge Oversight Committee develops a prioritized list. The role of ACTs, MPOs and regional or
22
statewide advisory groups is to review the timing of the bridge replacement/rehabilitation projects as they relate to other local projects or issues; their comments will be considered as part of the process. It is anticipated that these groups will primarily enhance selected projects by leveraging additional funding or collateral community benefit.
D.1. Construction STIP Eligibility Criteria for Bridge Footnotes
15 Bridge Management System
State Bridge Project Selection.
This criterion applies to bridges on the State highway system only. Through a formula distribution, 27% (% periodically reassessed) of the federal Highway Bridge Replacement and Rehabilitation Project funds go to local bridges, which are covered through a separate selection process.
State bridge projects proposed for funding will be selected based on the desire to maintain and improve transportation s role in Oregon s economy.
Focusing on the Interstate Highway and Oregon Highway Plan Freight Routes, consider bridges as candidates based on the following:
Bridges that are presently load restricted.
Bridges that have needed temporary repair but still have some load restrictions.
Bridges that have deterioration that will cause load restrictions in the near future.
Bridges that preserve freight corridors.
D.2 Construction STIP Prioritization Factors for Bridge Footnotes 16 Bridge Options Report. Priority will be given to projects that support the Bridge Options Report adopted by the Oregon Transportation Commission. In implementing the Bridge Options Report, bridges being designed or constructed to take into account anticipated future growth are not considered modernization projects. Other bridges that increase lane capacity are included under modernization and must meet the modernization criteria and prioritization factors.
17 Leverage and Public Benefit for C-STIP Bridge Projects. ACTs, MPOs and regional or statewide advisory groups should evaluate how proposed projects leverage additional funding or collateral community benefits and make wise and efficient use of infrastructure and natural resources. Examples of leverage and public benefits for C-STIP bridge replacement/rehabilitation projects include:
Other funding contributions, such as additional federal funds, local matching funds or provision of project right-of-way, private funding.
Bundling with other infrastructure projects (provided there is no adverse affect on project readiness).
Fish enhancement, such as culvert replacement and improved drainage.
Direct benefits to multiple modes of travel. This would include local efforts to accommodate non-auto modal opportunities.

23
Improvements in Oregon s economy by addressing transportation challenges.
FFiigguurree BB--33 OOrreeggoonn HHiigghhwwaayy PPllaann PPoolliicciieess AApppplliiccaabbllee ttoo PPrriioorriittiizziinngg PPrroojjeeccttss SSttaatteewwiiddee TTrraannssppoorrttaattiioonn IImmpprroovveemmeenntt PPrrooggrraamm
Policy D-STIP Mod.
C-STIP Mod.
C-STIP Pres.
Goal 1: System Definition
Policy 1A: State Highway Classification System X X X Policy 1B: Land Use and Transportation X X X Policy 1C: State Highway Freight System X X X Policy 1D: Scenic Byways X X X Policy 1E: Lifeline Routes X Policy 1F: Highway Mobility Standards X X Policy 1G: Major Improvements X X Policy 1H: Bypasses X X
Goal 2: System Management
Policy 2A: Partnerships X X X Policy 2B: Off-system Improvements X X Policy 2C: Interjurisdictional Transfers X X X Policy 2E: Intelligent Transportation Systems X X Policy 2F: Traffic Safety X X X Policy 2G: Rail and Highway Compatibility X X
Goal 3: Access Management
Policy 3A: Classification and Spacing Standards X X X Policy 3B: Medians X X Policy 3C: Interchange Access Management Areas X X
Goal 4: Travel Alternatives
Policy 4A: Efficiency of Freight Movement X X X Policy 4B: Alternative Passenger Modes X X Policy 4D: Transportation Demand Management X X Policy 4C: High-occupancy Vehicle (HOV) Facilities X X Policy 4E: Park-and-Ride Facilities X X
Goal 5: Environmental and Scenic Resources
Policy 5A: Environmental Resources X X X
KKeeyy WWeebbssiittee AAddddrreesssseess
Draft 2004-2007 STIP: http://www.odot.state.or.us/stip/
Management Systems: http://intranet.odot.state.or.us/otms/
Policy on Formation and Operation of the ACTs: http://www.odot.state.or.us/otc/ACT.htm
Program Advisory Committees, Community Involvement: http://www.odot.state.or.us/home/

24
AAppppeennddiixx CC
AALLTTEERRNNAATTIIVVEE MMEEAASSUURREESS FFOORR TTHHEE
RROOGGUUEE VVAALLLLEEYY MMEETTRROOPPOOLLIITTAANN
PPLLAANNNNIINNGG OORRGGAANNIIZZAATTIIOONN
IInnttrroodduuccttiioonn
In April 2002 the Land Conservation and Development Commission (LCDC) approved Alternative Measures to bring the RVMPO s 2000 Regional Transportation Plan interim update into compliance with the state s Transportation Planning Rule (TPR). The RVMPO developed these measures because modeling of the 2000 RTP showed that the region could expect a 2.5% per capita VMT reduction over the 20-year planning period, falling short of the TPR s 5% per capita VMT reduction requirement. The Alternative Measures meet requirements for an alternative measure of reduced reliance on the automobile, as specified in section 660-012-0035(5).
LCDC s approval, however, was conditioned on completion of certain tasks to clarify the manner in which compliance would be measured. The RVMPO completed that work in 2004, and findings are at the end of this section.
This appendix contains: 1. Alternative Measures Development 2. Selection of Measures 3. Alternative Measures Summary (table) 4. RVMPO Findings 5. LCDC Findings Regarding Alternative Measures

25
6. RVMPO Alternative Measures Implementation 7. Technical Memorandum: Refine Tracking Criteria, Alternative Measures 8. Technical Memorandum: Determination of Development that Satisfies Tracking Criteria
11.. AAlltteerrnnaattiivvee MMeeaassuurreess DDeevveellooppmmeenntt
In April 2000, the RVMPO adopted an Interim Update of the Rogue Valley Regional Transportation Plan (RTP). The updated RTP contained a financially constrained project list, including projects identified in local TSPs from the cities of Medford (draft version), Central Point (draft version), and Phoenix (final version). Projects from Jackson County and ODOT, as well as a financially constrained transit plan from the Rogue Valley Transportation District (RVTD) were also included in the updated RTP.
Although the update of the RTP brought the region into compliance with Federal planning requirements, the RTP s compliance with the State s Transportation Planning Rule (TPR) remained an outstanding issue.
The RVMPO s development of an alternative measure began with an inventory of possible measures. Early in the development process, the RVMPO chose to a select a set of measures as an alternative to the TPR s per capita VMT measure. Figure C-1 lists the measures and the source from which six of the seven alternative measures were selected. The measure of alternative transportation funding was developed later in the process.
FFiigguurree CC--11 PPootteennttiiaall AAlltteerrnnaattiivvee MMeeaassuurreess UUsseedd iinn SSeelleeccttiioonn PPrroocceessss Type Measure Source
Mode share (alternative modes & SOV) TPR 0035 (5)(d) Percent non-SOV commuter during peak-hour Oregon Benchmark #73/ TPR 0035 (5)(d) A
lt.
Mod
es
Percent non-auto trips Lane Council of Governments Transit service hours per capita RVTD Percent of population with access to public transit RVRTP Evaluation Criteria/TPR 0035 (5)(d) Transit ridership, service hours, and frequency RVRTP Evaluation Criteria T
rans
it
Percent transit mode share on congested corridors Lane Council of Governments Percent employees participating in a trip-reduction program
Staff
TD
M
Percent employees participating in Trans. Mgmt. Assoc. (TMAs) Staff
Per capita vehicle trips TPR 0035 (5)(d) Per capita vehicle occupancy 2000-2020 Interim RVRTP, Appendix G Per capita vehicle miles of travel (VMT) RVRTP Evaluation Criteria/TPR 0035 (4)(a)
Aut
omob
ile
Per capita vehicle-hours traveled (VHT) RVRTP Evaluation Criteria/TPR 0035 (5)(d)
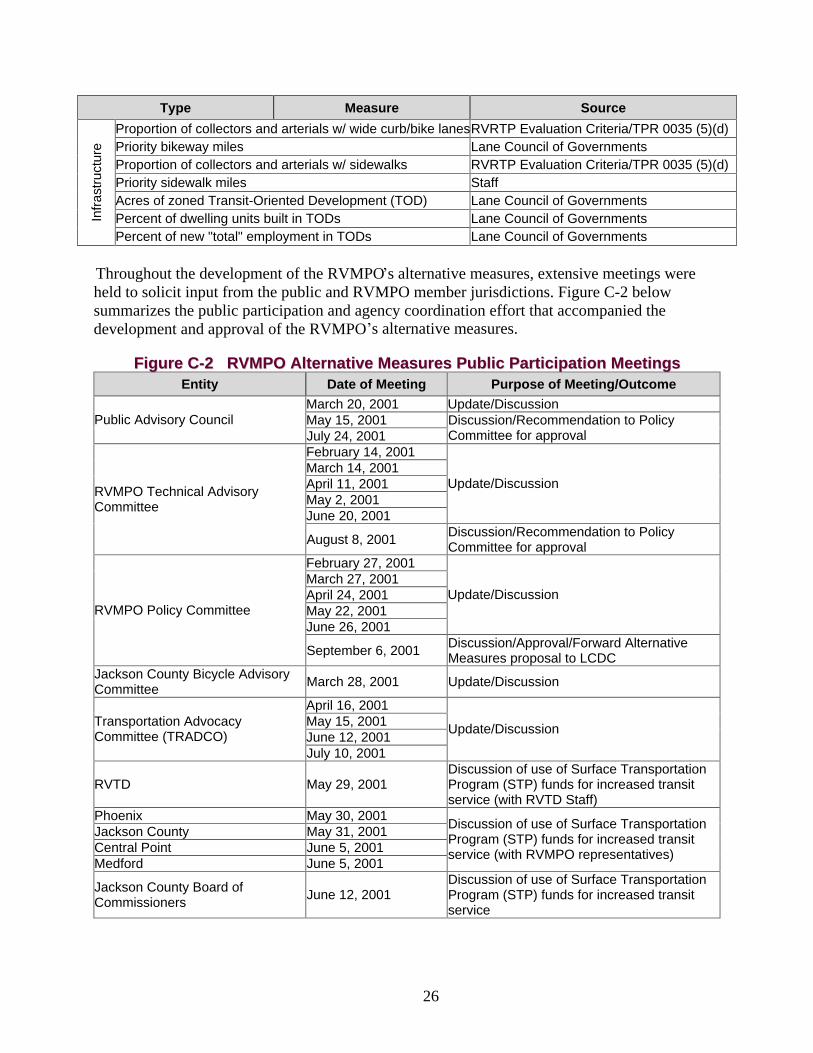
26
Type Measure Source
Proportion of collectors and arterials w/ wide curb/bike lanesRVRTP Evaluation Criteria/TPR 0035 (5)(d) Priority bikeway miles Lane Council of Governments Proportion of collectors and arterials w/ sidewalks RVRTP Evaluation Criteria/TPR 0035 (5)(d) Priority sidewalk miles Staff Acres of zoned Transit-Oriented Development (TOD) Lane Council of Governments Percent of dwelling units built in TODs Lane Council of Governments In
fras
truc
ture
Percent of new "total" employment in TODs Lane Council of Governments
Throughout the development of the RVMPO s alternative measures, extensive meetings were held to solicit input from the public and RVMPO member jurisdictions. Figure C-2 below summarizes the public participation and agency coordination effort that accompanied the development and approval of the RVMPO s alternative measures.
FFiigguurree CC--22 RRVVMMPPOO AAlltteerrnnaattiivvee MMeeaassuurreess PPuubblliicc PPaarrttiicciippaattiioonn MMeeeettiinnggss Entity Date of Meeting Purpose of Meeting/Outcome
March 20, 2001 Update/Discussion May 15, 2001 Public Advisory Council July 24, 2001
Discussion/Recommendation to Policy Committee for approval
February 14, 2001 March 14, 2001 April 11, 2001 May 2, 2001 June 20, 2001
Update/Discussion RVMPO Technical Advisory Committee
August 8, 2001 Discussion/Recommendation to Policy Committee for approval
February 27, 2001 March 27, 2001 April 24, 2001 May 22, 2001 June 26, 2001
Update/Discussion RVMPO Policy Committee
September 6, 2001 Discussion/Approval/Forward Alternative Measures proposal to LCDC
Jackson County Bicycle Advisory Committee March 28, 2001 Update/Discussion
April 16, 2001 May 15, 2001 June 12, 2001
Transportation Advocacy Committee (TRADCO)
July 10, 2001
Update/Discussion
RVTD May 29, 2001 Discussion of use of Surface Transportation Program (STP) funds for increased transit service (with RVTD Staff)
Phoenix May 30, 2001 Jackson County May 31, 2001 Central Point June 5, 2001 Medford June 5, 2001
Discussion of use of Surface Transportation Program (STP) funds for increased transit service (with RVMPO representatives)
Jackson County Board of Commissioners
June 12, 2001 Discussion of use of Surface Transportation Program (STP) funds for increased transit service

27
22.. SSeelleeccttiioonn ooff MMeeaassuurreess
Based on the input received from RVMPO member jurisdictions, the public, DLCD staff and other State and Federal agencies that participated in the development process, seven measures of reduced automobile reliance were adopted as an alternative to the TPR s per capita VMT reduction measure. Each of the seven measures is discussed below in detail. Adopted 5-year benchmarks and 20-year targets for each of the measures are summarized at the beginning of the measure descriptions and again at the end of the chapter in Figure C-13.
Measure 1: Transit, bicycle and walking mode share As with the per capita VMT reduction measure, this measure is intended to demonstrate a shift in travel behavior away from the automobile. This shift is anticipated to result from the region s planned improvements in the transit, bicycle and pedestrian infrastructure, as well as from the implementation of planned Transit-Oriented Developments (TODs). The benchmarks and target for this measure are shown in Figure C-3. A three-fold increase in transit mode share (from 1% to 3%) and a 35% increase in bicycle and walking (non-motorized) mode share (from 8.2% to 11%) have been set as 20-year targets for this measure.
Progress on this measure would be determined at 5-year intervals using the best available information at that time. Today s best information source is the RVCOG travel demand model, which can be (and has been) used to predict mode share over the 20-year planning period. Current modeling of the financially constrained RTP indicates that, in 20 years, transit mode share will remain about the same (increase to 1.2%) and bicycling and walking mode share will decrease from 8.2% to 7.7%. This modeling effort assumed that transit service levels will be reduced and that only three of the seven proposed TOD sites will be developed. Conservative assumptions concerning bicycling and walking were also implemented in the model.
Given the mode share levels predicted by the RVCOG travel demand model, the benchmarks and target identified for the mode share measure represent significant increases in alternative mode use. It is believed that changes in the urban environment to which the model currently lacks a high degree of sensitivity, such as the development of mixed-use, pedestrian friendly areas, (as described later in this proposal) will result in the higher figures shown in Figure C-3. Due to the timing of construction of the mixed-use, pedestrian friendly areas, changes in travel behavior will proceed more slowly in the first 10 years of the planning period than in the final 10 years.
FFiigguurree CC--33 AAddoopptteedd 2200--YYeeaarr TTaarrggeett ffoorr MMooddee SShhaarree
Measure How Measured 2000 2005 Benchmark 2010
Benchmark 2015
Target 2020
Measure 1: Transit and bicycle/pedestrian mode share
The percent of total daily trips taken by transit and the combination of bicycle and walking (non-motorized) modes. Determined from best available data (e.g., model output and/or transportation survey data).
% daily trips
transit: 1.0 bike/ped: 8.2
% daily trips
transit: 1.2 bike/ped: 8.4
% daily trips
transit: 1.6 bike/ped: 8.4
% daily trips
transit: .2 bike/ped: 9.8
% daily trips
transit: 3.0 bike/ped: 11
Measure 2: Percentage of Dwelling Units within ¼-Mile Walking Distance of 30-Minute Transit

28
This measure is intended to demonstrate improvements in transit accessibility. A walking distance of ¼ mile from a dwelling is assumed to provide reasonable pedestrian access to a transit line. Only those transit lines that provide at least 30-minute service will be counted towards meeting the benchmarks and target shown in Figure C-4. Progress on this measure would be tracked through GIS.
A GIS analysis of current tax lot, street, geographic and transit data was used to determine the percentage of dwelling units in the MPO that are within ¼ mile walking distance to RVTD transit lines. The result of this effort is shown on a map included as Attachment A Existing and Future Transit Service. The GIS analysis showed that 12% of dwelling units in the MPO are currently within ¼ mile walking distance to 30-minute transit service.
Today, two of RVTD s transit lines provide 30-minute service, one provides 45-minute service, three provide 60-minute service, and one provides 90-minute service. During the 20-year planning period, all of these routes are planned to go to at least 30-minute service frequency with 15-minute service during the peak hours to routes serving TOD areas (assuming increased transit revenues). In addition, a large percentage of new development in the RVMPO area is planned to occur along existing or future transit lines. These changes are expected to result in an increase in the transit accessibility measure from 12% to 50% over the 20-year planning period. Figure C-4 shows the 5-year benchmarks and 20-year target for the adopted measure.
FFiigguurree CC--44 AAddoopptteedd 2200--YYeeaarr TTaarrggeett ffoorr TTrraannssiitt AAcccceessssiibbiilliittyy
Measure How Measured 2000 2005 Benchmark 2010
Benchmark 2015
Target 2020
Measure 2: % Dwelling Units (DUs) w/in ¼ mile walk to 30-min. transit service
Determined through GIS mapping. Current estimates are that 12% of DUs are within ¼ mile walking distance of RVTD transit routes.
12% 20% 30% 40% 50%
Measure 3: Percentage of collectors and arterials with bicycle facilities The RVMPO programs projects along collector and arterial streets within the MPO boundaries. Consistent with the TPR, the RVMPO s policy is for these facilities to include bicycle lanes or, in rural areas, shoulders with a width greater than four feet. The measure is intended as a way to track the progress of including these facilities on the MPO s street network and as a way to demonstrate improved accessibility for bicyclists.
Progress on this measure would be determined through GIS analysis. 21% of collectors and arterials in the MPO have provisions for cyclists, i.e., 4 foot or greater shoulders or bike lanes. Projects included in the latest Draft RVRTP project listing show that these figures will increase to approximately 60%. Proposed 5-year benchmarks and 20-year targets are shown below in Figure C-5.

29
FFiigguurree CC--55 PPrrooppoosseedd 2200--YYeeaarr TTaarrggeett ffoorr BBiiccyyccllee FFaacciilliittiieess
Measure How Measured 2000 2005 Benchmark 2010
Benchmark 2015
Target 2020
Measure 3: % Collectors and arterials w/ bicycle facilities
Determined through GIS mapping. Current estimates are that 21% of collectors and arterials in the MPO have provisions for bicyclists.
21% 28% 37% 48% 60%
Measure 4: Percentage of collectors and arterials in TOD areas with sidewalks The RVMPO has identified seven areas that are currently planned for mixed-use, pedestrian friendly development or are in downtown areas (Figure B-1 on page B-10). This measure is intended to demonstrate improvements in pedestrian accessibility in these portions of the MPO area - where pedestrian access is most critical.
Attachment C - Existing and Future Pedestrian Facilities - shows that 47% of the collectors and arterials in the TOD/Downtown areas of Central Point, Medford, and Phoenix have sidewalks. Analysis of the projects planned in the draft RVRTP Street System (Attachment D), shows that another 29% of these facilities will have sidewalks by the year 2020. This brings the total sidewalk coverage within the TOD/Downtown areas in the MPO to approximately 75%. Proposed 5-year benchmarks and 20-year targets are shown below in Figure C-6.
FFiigguurree CC--66 AAddoopptteedd 2200--YYeeaarr TTaarrggeett ffoorr PPeeddeessttrriiaann FFaacciilliittiieess
Measure How Measured 2000 2005 Benchmark 2010
Benchmark 2015
Target 2020
Measure 4: % Collectors and arterials in TOD areas w/ sidewalks
Determined through GIS mapping. Current estimates are that 46% of collectors and arterials in TOD areas have sidewalks.
47% 50% 56% 64% 75%
Figure C-7 shows how the number of bicycle/pedestrian projects in the draft RVRTP project list compares to all the projects listed in the RTP. All projects are included on the financially constrained (Tier 1) project list.
FFiigguurree CC--77
DDrraafftt RRVVRRTTPP SSttrreeeett SSyysstteemm PPrroojjeecctt LLiisstt SSttaattiissttiiccss
Jurisdiction Total Projects Bike/Ped Projects
% Bike/Ped Projects
Bike/Ped Project Costs
Jackson County 55 27 49% $22,320,000 Medford 79 15 19% $7,375,000 Central Point 41 9 22% $3,864,000 Phoenix 33 26 79% $4,004,000
MPO Total 208 77 37% $37,563,000
Measure 5: Percent of New Dwelling Units in Mixed Use/Pedestrian-Friendly Areas and Measure 6: Percent of New Employment in Mixed Use/Pedestrian-Friendly Areas The objective of these measures is to demonstrate progress towards creating mixed use, pedestrian-friendly developments in the MPO. Progress towards meeting the benchmarks and targets for this measure would be determined by monitoring development after the appropriate land use and development regulations have been adopted. Mixed use, pedestrian-friendly

30
development occurring within downtown areas in Medford, Central Point, and Phoenix, as well as within proposed TOD sites, would count towards meeting the benchmark and target figures shown below in Figure C-8. The benchmarks and targets shown in the table represent the accumulated development occurring since year 2000.
FFiigguurree CC--88 AAddoopptteedd 2200--YYeeaarr TTaarrggeettss ffoorr MMiixxeedd--UUssee PPeeddeessttrriiaann FFrriieennddllyy DDeevveellooppmmeenntt
Measure How Measured 2000 2005 Benchmark 2010
Benchmark 2015
Target 2020
Measure 5: % Mixed-use DUs in new development
Determined by tracking building permits - the ratio between new DUs in TODs and total new DUs in the region.
0% 9% 26% 41% 49%
Measure 6: % Mixed-use employment in new development
Estimated from annual employment files from State
represents the ratio of new employment in TODs over total regional employment.
0% 9% 23% 36% 44%
Tables B-9 and B-10 show mixed-use housing (dwelling unit) and employment projections by RVMPO jurisdiction. Numbers shown in the tables represent the accumulated increase from year 2000 base year conditions. The unincorporated portion of Jackson County is not anticipated to include any mixed-use development during the planning period. Detailed population, employment, and housing information from the 2000-2020 RVMPO travel demand model was used to estimate the figures shown in these tables. Downtown and future TOD areas were analyzed for new dwelling units and employment. Agricultural and industrial employment was not included in the calculations due to the unlikelihood of these uses locating in either a downtown or a TOD.
FFiigguurree CC--99 MMiixxeedd UUssee HHoouussiinngg PPrroojjeeccttiioonnss
RRVVMMPPOO JJuurriissddiiccttiioonnss Jurisdiction Category 2005 2010 2015 2020 2020%
New DU (total) 1578 4126 5667 7581 Medford Mixed-Use DU 158 1238 2834 4604
61%
New DU (total) 555 1098 1715 2423 Central Point Mixed-Use DU 55 274 600 945
39%
New DU (total) 179 345 514 738 Phoenix Mixed-Use DU 18 103 180 302
41%
New DU (total) 386 638 930 1225 Jackson County Mixed-Use DU 0 0 0 0
0%
New DU (total) 2697 6206 8827 11967 MPO Total Mixed-Use DU 231 1616 3614 5851
49%

31
FFiigguurree CC--1100 MMiixxeedd UUssee EEmmppllooyymmeenntt PPrroojjeeccttiioonnss
RRVVMMPPOO JJuurriissddiiccttiioonnss
Jurisdiction Category 2005 2010 2015 2020 2020%
New Emp (total) 3078 6156 9234 12312 Medford Mixed-Use Emp 308 1539 3694 5956
48%
New Emp (total) 405 811 1216 1622 Central Point Mixed-Use Emp 41 243 486 778
48%
New Emp (total) 165 330 495 660 Phoenix Mixed-Use Emp 8 50 99 173
26%
New Emp (total) 273 546 820 1093 Jackson County Mixed-Use Emp 0 0 0 0
0%
New Emp (total) 3922 7843 11765 15686 MPO Total Mixed-Use Emp 357 1832 4279 6907
44%
RVMPO Transit-Oriented/Mixed-Use, Pedestrian-Friendly Development (For the purposes of this proposal, the term TOD is used interchangeably with the Mixed-Use, Pedestrian Friendly Development term used in the Transportation Planning Rule (TPR).)
Transit-oriented development (TOD) is a way to locate people near transit services while decreasing their dependency on automobiles. While sprawling development patterns necessitate use of automobiles for virtually every trip, TODs - through the creation of higher-density, mixed-use, pedestrian districts - increase the convenience of walking, bicycling, and transit and thereby reduce automobile dependency.
In 1999, the RVMPO undertook a Transit-Oriented Design and Transit Corridor Development Strategies Study (TOD Study). The TOD Study outlined recommendations for ten TOD sites in Central Point, Medford, Phoenix, and White City (in unincorporated Jackson County). The study was intended to provide an alternative land use scenario that would bring the MPO into compliance with the TPR s VMT reduction requirement. Although modeling of the TOD Study s
recommended land use patterns did not yield the TPR-mandated 5% reduction in VMT per capita, many of the Study s land use recommendations are being implemented.
Figure C-11 provides an illustration of the TOD locations currently under consideration. The boundaries for the TOD areas shown in Figure C-11 correspond to transportation analysis zones (TAZs) used by the RVCOG model to estimate future population and employment. The boundaries are close approximations of planned TOD areas for purposes of estimating 20-year population and employment figures.
Ten candidate high-growth areas, previously identified in the 1995 RTP, were analyzed in the TOD Study. Of the original ten TOD sites, three are proceeding towards development, three are undergoing analysis and four have been removed from consideration. The three TOD sites closest to development are the Central Point TOD, the Medford SE Plan, and the Phoenix City Center Plan. The following is a brief summary of the current status of TOD development in the RVMPO.
Central Point TOD - Status Central Point completed amendments to its official maps and implementing ordinances establishing a fully compliant TOD center in the northwest section of the city. Infrastructure needs, particularly transportation, have been thoroughly reviewed. Residential neighborhoods

32
have been constructed in the southern half of the development, with public and commercial phases expected to be developed when a new rail crossing is completed.
Medford TOD Development - Status The City of Medford has applied for a TGM grant to implement the four TOD sites under consideration within the City. These four sites include Downtown, Southeast, Delta Waters and West Medford. The City is committed to TOD concepts, and is already working to implement its adopted Southeast Plan, a large development employing Smart Development principles.
Phoenix City Center TOD - Status Phoenix has developed a mixed-use plan for the City Center area that incorporates TOD policies and standards consistent with the MPO s TOD Study. The TOD site includes much of the existing downtown area, and the City is committed to urban-centered, pedestrian-friendly growth. The City has conducted a marketing feasibility study for an independently prepared City Center Plan and will adopt amendments to its municipal code that foster transit-oriented development.

33
FFiigguurree CC--1111 RRVVMMPPOO TTrraannssiitt--OOrriieenntteedd//MMiixxeedd--UUssee,, PPeeddeessttrriiaann FFrriieennddllyy DDeevveellooppmmeenntt AArreeaass

34
Measure 7: Alternative Transportation Funding This measure has been developed to demonstrate the RVMPO s commitment to implementing the alternative transportation projects upon which many of the proposed measures rely. Funds made available to the RVMPO through the Surface Transportation Program (STP) are the only funds over which the RVMPO has complete discretion. RVMPO jurisdictions have agreed to direct 50% of this revenue stream, historically used for vehicular capacity expansion projects, towards alternative transportation projects. STP funds would be used to expand transit service, or, if RVTD is successful with a local funding package, to fund bicycle/pedestrian and TOD-development supportive projects. Figure C-12 shows adopted 5-year benchmarks and 20-year targets for this measure.
FFiigguurree CC--1122
AAddoopptteedd 2200--YYeeaarr TTaarrggeett ffoorr AAlltteerrnnaattiivvee TTrraannssppoorrttaattiioonn FFuunnddiinngg
Measure How Measured 2000 2005 Benchmark 2010
Benchmark 2015
Target 2020
Measure 7: Alternative Transportation Funding
Funding committed to transit or bicycle/pedestrian/TOD projects. Amounts shown represent ½ of the MPO s estimated accumulation of discretionary funding (STP).
N/A $950,000 $2.5 Million $4.3 Million $6.4
Million
*STP revenue estimates developed by Oregon Department of Transportation.
Without the additional operating revenues provided through this measure (or through some other source), current revenue projections show that RVTD will be required to cut service and eliminate routes in the MPO. The RTP identifies a financially constrained (Tier 1) transit system that provides greatly reduced service in the MPO, along with a preferred (Tier 2) transit system, providing several additional routes as well as faster headways. RVTD will be pursuing a local funding package in the near future to finance the Tier 2 transit plan. If voters approve this package, RVTD will not require STP funds in order to cover funding shortfalls. It is therefore proposed that, should RVTD s new fund source become a reality, the STP transit allocation proposed in this measure instead be directed to RTP bicycle/pedestrian projects and projects that facilitate the development of TOD sites.
The following list of priorities for STP funded transit projects has been developed in consultation with MPO jurisdictions. The list is intended as a starting point for determining how STP funds will be spent by the Rogue Valley Transportation District. Projects are not listed in any particular order.
STP Funding Priorities for Rogue Valley Transportation District (RVTD): Central Point
RVTD will increase service on Route 40 (Central Point) to 30 minute headways and provide service to the TOD site when feasible.
Medford
RVTD will serve the Southeast Plan Area (Medford TOD) when feasible.
Phoenix
RVTD will improve transit stops within Phoenix.
35
RVTD will explore ways to improve Hwy 99 (Main Street) pedestrian crossing to a northbound transit stop, and in the interim, will provide shuttle service for this purpose.
Jackson County
RVTD will increase transit service to White City (unincorporated Jackson County).
33.. AAlltteerrnnaattiivvee MMeeaassuurreess SSuummmmaarryy ((TTaabbllee))
Figure C-13 summarizes the seven adopted alternative measures along with 5-year benchmarks and 20-year targets. Five findings based on the requirements of the Transportation Planning Rule s section 660-012-0035(5) conclude the RVMPO s alternative measures proposal.
FFiigguurree CC--1133 -- RRVVMMPPOO AAddoopptteedd AAlltteerrnnaattiivvee MMeeaassuurreess ffoorr TTPPRR CCoommpplliiaannccee
Measure How Measured 2000 2005 Benchmark 2010
Benchmark 2015
Target 2020
Measure 1: Transit and bicycle/pedestrian mode share
The percent of total daily trips taken by transit and the combination of bicycle and walking (non-motorized) modes. Determined from best available data (e.g., model output and/or transportation survey data).
% daily trips
transit: 1.0 bike/ped: 8.2
% daily trips
transit: 1.2 bike/ped: 8.4
% daily trips
transit: 1.6 bike/ped: 8.4
% daily trips
transit: .2 bike/ped: 9.8
% daily trips
transit: 3.0 bike/ped: 11
Measure 2: % Dwelling Units (DUs) w/in ¼ mile walk to 30-min. transit service
Determined through GIS mapping. Current estimates are that 12% of DUs are within ¼ mile walking distance of RVTD transit routes.
12% 20% 30% 40% 50%
Measure 3: % Collectors and arterials w/ bicycle facilities
Determined through GIS mapping. Current estimates are that 21% of collectors and arterials in the MPO have provisions for bicyclists.
21% 28% 37% 48% 60%
Measure 4: % Collectors and arterials in TOD areas w/ sidewalks
Determined through GIS mapping. Current estimates are that 46% of collectors and arterials in TOD areas have sidewalks.
47% 50% 56% 64% 75%
Measure 5: % Mixed-use DUs in new development
Determined by tracking building permits - the ratio between new DUs in TODs and total new DUs in the region.
0% 9% 26% 41% 49%
Measure 6: % Mixed-use employment in new development
Estimated from annual employment files from State
represents the ratio of new employment in TODs over total regional employment.
0% 9% 23% 36% 44%
Measure 7: Alternative Transportation Funding
Funding committed to transit or bicycle/pedestrian/TOD projects. Amounts shown represent ½ of the MPO s estimated accumulation of discretionary funding (STP).
N/A $950,000 $2.5 Million $4.3 Million $6.4 Million
44.. RRVVMMPPOO FFiinnddiinnggss
1. Achieving the targets for the adopted alternative measures will result in a reduction in reliance on automobiles.

36
2. Achieving the targets for the adopted alternative measures will accomplish a significant increase in the availability and convenience of alternative modes of transportation.
3. Achieving the targets for the adopted alternative measures is likely to result in a significant increase in the share of trips made by alternative modes, including walking, bicycling, and transit.
4. VMT per capita is unlikely to increase by more than 5%.
5. The adopted alternative measures are reasonably related to achieving the goal of reduced reliance on the automobile as described in OAR 660-012-0000.
55.. LLCCDDCC FFiinnddiinnggss RReeggaarrddiinngg AAlltteerrnnaattiivvee MMeeaassuurreess
The RVMPO s proposal to achieve compliance with the TPR s 5 % per capita VMT reduction requirement through implementation of seven Alternative Measures, described in Sections 2 and 3 of this appendix, was considered and approved by LCDC on April 3, 2002. The findings and order appear on the following three pages.
As noted in the Introduction to this appendix, the LCDC order included conditions regarding Measures 3, 5 and 6. These conditions required additional work by the RVMPO. That work is described in Sections 5, 6 and 7, following the LCDC order.

38

39

40
66.. RRVVMMPPOO AAlltteerrnnaattiivvee MMeeaassuurreess IImmpplleemmeennttaattiioonn
Since LCDC s approval of the Alternative Measures, the RVMPO and member jurisdictions have undertaken a number of projects to implement the measures. Several cities are, or are planning to, update Transportation System Plans. Phoenix and Central Point, as this RTP update goes to adoption, are revising their zoning ordinances to include conditions that are expected to foster compliance with the measures.
Two projects have been undertaken by the RVMPO to directly address the commission s conditions: refinement of Alternative Measures 5 and 6; and creation and adoption of an Integrated Land Use Plan (ILUTP). Refinement of Measures 5 and 6 is contained in the following two sections. These sections include a city-by-city report on activities that support the measures. The RVMPO is working with member cities to draft an ILUPT. The ILUTP work is to be completed by June 2005.
Both of these projects address LCDC concerns about Alternative Measure 3 and the need for a safe, convenient network of bicycle facilities within the planning horizon. Bicycle system features addressed in the refinement of Measures 5 and 6 and the ILUTP include bicycle routes on roadways as well as routes off the road system, establishment of connections to key community and regional destinations, and secure bicycle parking.
77.. TTeecchhnniiccaall MMeemmoorraanndduumm:: RReeffiinnee TTrraacckkiinngg CCrriitteerriiaa,, AAlltteerrnnaattiivvee MMeeaassuurreess
The objective of this memo is to establish criteria and methodology to track development of TOD or mixed-use, pedestrian friendly areas in all cities in the RVMPO. This involves developing a system to identify which housing and employment growth contributes to meeting the benchmarks and targets of the Alternative Measures in the Regional Transportation Plan.
This evaluation is intended to: 1) Establish a method by which the RVMPO can track development for Alternative Measures 5 and 6; and 2) Provide cities with an interim report on progress toward meeting the first benchmark for both measures in 2005.
Standards for AM benchmark qualification
The LCDC order approving the Alternative Measures (Order 02 LCDC-026) requires that the RVMPO defines the kinds of dwelling units and employment that will count toward meeting the benchmarks and targets. The definition must recognize three principles:
a) Development in some locations, such as in the downtowns, should count toward meeting targets, because development in these areas contributes to mixed-use, pedestrian-friendly centers;
b) Development outside downtowns and central business districts should not count toward meeting the targets unless that development clearly is consistent with transit-oriented development and appropriate zoning and land development regulations necessary to implement the TODs have been adopted; and

41
c) Some of the TOD areas, such as the Southeast Medford TOD, are quite large and include some areas where the planned development is unlikely to contribute to mixed-use, pedestrian-friendly development. Only development that clearly contributes to achieving mixed-use, pedestrian friendly development should be counted toward this target.
To qualify as an AM 5 (residential) development, dwelling units must be built to a density of at least 10 units per acre, or the equivalent for smaller developments. This density is consistent with approved planning documents in common use within the RVMPO, including Medford s TSP (adopted in 2003 and since remanded by DLCD, but not on this issue) and the RVMPO s Transit Oriented Development Study (completed in 1999). Additionally, the RVMPO will evaluate all development in a five step process, attached as Appendix A to this memo. This process is based on a similar process described in the Medford TSP, but adapted here to suit all of the cities in the RVMPO.
The RVMPO evaluation for AM will include development around activity centers. The concept of activity centers was described in Medford s TSP, and locations of these centers were identified and mapped. Although DLCD in June, 2004, remanded portions of the TSP for additional work (including work on steps needed to meet AM requirements), the department did accept the concept of activity centers as places that, like designated TOD sites, can foster the kind of compact, pedestrian-friendly development that meets AM requirements and contributes to the RVMPO s compliance with the TPR. Development can be focused around activity centers to complement investments in the transportation system. Furthermore, as the RVMPO begins implementing Alternative Measures as a way to help reduce reliance on the automobile, this monitoring process is an opportunity to identify areas that could with some changes to current development patterns contribute to achieving the benchmarks. In the Medford TSP, these sites include parks, schools, and neighborhood commercial and employment centers, and number more than 60 (some are adjoining). By recognizing activity centers in all RVMPO cities, the evaluations of all cities can be consistent, and the region gains some flexibility in counting development outside of TODs toward meeting AM benchmarks. Activity center areas generally are an area within ¼-mile of the defined activity (school, employment center, etc.). In these areas, only development that is vertically or horizontally mixed use can qualify toward meeting benchmarks.
Specific areas are described below, by city. In some instances, this report identifies areas that could become activities centers, but currently lack a necessary feature, such as an employment center or mixed-use development.
Methodology for tracking development
The evaluation is based on a GIS-based review of all construction in member cities Ashland, Central Point, Eagle Point, Jacksonville, Medford, Phoenix and Talent. The time span covered was from the base year, January 2000, to December 2003. Maps mark in red the residential development that exceeds the density standard of 10 units per acre, and mark in yellow the residential development that meets the standards and, therefore, may qualify toward meeting the benchmarks.

42
The map review included identification of the downtown area for each city, TOD areas (if any) for each city, and activity centers in cases where the existence of a center would enable a development to qualify toward meeting the benchmarks. Potential activity centers in each city could be associated with parks, schools, and neighborhood commercial and employment centers.
Commercial development similarly was examined and described by use (commercial, office and industrial), floor space area and location. The number of jobs created was determined by formula (noted in the Medford TSP):
Commercial use divide building square footage by 600 equals number of jobs;
Office divide building square footage by 500 equals number of jobs; and
Light industrial divide building square footage by 1000 equals number of jobs.
Comprehensive land use plans and zoning ordinances for each city were reviewed and zones that could qualify for benchmarks also are listed.
Findings for each city appear below.
Ashland
The project examined high-density residential in the downtown area, and in four activity centers around the city. The activity centers have generally defined themes. Two centers included dedicated health care zones one is Ashland Community Hospital. Another activity center focuses on light industrial employment opportunities. The fourth activity center includes both the state university and local school district and includes many businesses catering to student clientele.
Zones examined were: R-1 3.5; R-2; R-3; E-1; HC; and C-1.
Area descriptions:
Downtown-Historic Railroad District area includes mixed commercial with theaters and restaurants, parks and is served by transit. The area core is roughly a 10-block stretch of North Main Street, from Helman Street to Union Street, extending north to the railroad tracks (A Street area), with a surrounding residential area, which is mostly developed. High-density residential development has occurred at the southern end of this area.
Ashland Community Hospital area, including east side of N. Main Street, contains care residences which, along with medical clinics and labs represent a sizable neighborhood employment center. Transit service available. Commercial development and high-density residential development has occurred off Scenic Drive.
North Mountain Avenue area includes Mountain Meadows Retirement Community in northeast Ashland. An area to the west is designated as the North Mountain Neighborhood area, and a health care area is designated on the east. A park is nearby. Some high-density residential development, and commercial development has occurred in and around this area.

43
Hersey Street Employment District includes low-density housing as well as high-density dwellings with commercial uses. This area includes a park and mixed commercial/light industrial uses. High-density development has occurred around the eastern edge of this area.
Southern Oregon University zone, in addition to the university, includes Ashland High School and district administrative offices and a mix of commercial uses along and around Siskiyou Boulevard. High-density residential development has occurred at the north end of this area.
Central Point
The project examined four distinct areas for their potential to help Central Point meet AM benchmarks, and recent, high-density development. The areas are: downtown; Central Point TOD site west of Highway 99 and north of Taylor Road; mixed use area around Freeman Road, south of the Pine Street interchange; and residential development along Hamrick Road in east Central Point. These areas were selected because they offer compact residential areas, nearby commercial development or the potential for commercial development that would reduce reliance on automobiles.
Zones examined were: R-2; R-3; C-N; C-2; C-3; C-4; C-5; M1; and TOD zones LMR (parcels smaller than 4,356 sq. ft.), MMR , HMR, EC, GC, C.
Area descriptions:
Downtown bordered on the east by 10th Street; on the north by Hazel Street and including Crater High School; crossing Hwy. 99 to include Haskell Street, Glenn Way and Snowy Butte Lane on the west; and a southern boundary that includes Bush Street to Freeman Road. A mixed-use commercial, retail and residential development has been built in the reporting period.
Central Point TOD a triangular area bordered on the east by Hwy. 99; Scenic Avenue on the north; Grant Road on the southwest and city limits (a line extending directly north of Grant Road to Scenic, intersecting with Scenic east of Grant Road; and Taylor Road on the south, extending directly east to Hwy. 99.
Freeman Road activity center high-density residential area associated with and south of a regional shopping center; bordered by Freeman Road, Hopkins Road, Interstate 5 and Pine Street. The area is within ¼-mile of a major commercial area and is served by transit.
Hamrick Road/East Central Point a new, residential area that includes high-density dwellings, but lacks commercial development. With the addition of commercial uses, development in this area could qualify to meet AM benchmarks.

44
Eagle Point
The city is a fast-growing residential community at the north end of the RVMPO one of the fastest growing in Oregon with a population exceeding 6,000. This is the only RVMPO city that is not served by transit. The largest employer is the Eagle Point School District, and many residents commute south on Hwy. 62 to jobs in White City and Medford. High-density development has occurred in two locations: downtown area, near Eagle Point High School, and in the northeast corner of the city, off Reese Creek Road.
Zones examined were: R-2; R-3; R-4; C-1; C-2; I-1
Area descriptions:
Downtown area includes a major commercial area along Hwy. 62. The core of the area includes Main and Loto streets, Linn Road, Royal and Shasta avenues. High-density residential development has occurred on Minerva Avenue, near the high school.
Reese Creek Road area is more than a half-mile from the downtown area as the crow flies
and considerably longer along existing roads. Additionally, this area lacks the commercial/employment or park aspects that could help it qualify it toward AM benchmarks. It is discussed here, however, because it has been the site of high-density residential development, as well as larger-lot residential development (at densities too low to qualify under AM standards).
Golf course area, located at the southern end of Eagle Point, consists of single family homes surrounding a championship, 18-hole golf course with a restaurant and other golf-related businesses. This location lacks the high-density and mixed use development necessary to count toward benchmarks.
Jacksonville
Three areas were examined, the downtown and Nunan Square and Fifth Street TOD.
Zones examined were: MF; CI; GC; HC.
Area descriptions:
The downtown area is bordered by F Street to the north; one block west of Oregon Street on the west; one block south of Pine Street (Fir Street) on the south; and one block east of Fifth Street on the east. One commercial development has been built in the reporting period.
Nunan Square is a planned unit development that includes residential (including attached homes), general commercial, and park areas. It is located in a triangular area between N. Oregon Street, F Street and N. Fifth Street. Commercial and high-density residential development has occurred in the reporting period.

45
Fifth Street TOD site covers area along Jacksonville Highway, north of the downtown area, includes G Street, Shafer Lane and Jacksonville Elementary School. A medical has been built in the reporting period.
Medford
Medford s TSP identifies more than 60 activity areas schools, parks and neighborhood commercial centers. This examination focused on areas where high-density residential and commercial development occurred in the 2000-2003 period.
Zones examined were: SFR-10; MFR-15; MFR-20; MFR-30; C-SP; CN; CC; CR; CH; IL. Area descriptions:
Northeast Medford
North Medford TOD is located on the east side of Crater Lake Hwy., and covers about 460 acres. It is bordered by city limits on the north, Springbrook Road and McLaughlin Drive on the east and, roughly, Delta Waters Road on the south. The development examined in this reporting period occurred at the northern end and the southern tip of the TOD.
North Medford High School (activity center), high-density residential development on Camellia Avenue, near transit service.
Northwest Medford
Medford Railroad Park (activity center) area, high-density residential on Berrydale Avenue.
West Medford
West Medford TOD includes about 450 acres directly west of the City Center TOD. Current land uses include auto-oriented, low-density commercial and residential, with transit service available at the perimeter. Some development near the McAndrews Road/Jackson Street intersection, and just beyond the southeast TOD boundary, at Cherry Street and Meadow Lane, meet AM density standards. A row-store development has been built in the reporting period.
Central Medford
City Center TOD has new design standards and guidelines to protect historic and pedestrian character of this core downtown area. The TOD is bordered by Jackson Street, Oakdale Avenue, Tenth Street, and Interstate 5.
Siskiyou Boulevard (activity center), high-density residential near Portland Avenue, within ¼-mile of a park, and served by transit.

46
South Medford
Asante/Rogue Valley Medical Center (activity center) area. Medical office and hospital development around Murphy Road and high-density residential near park and school around Alameda Street have been built in the reporting period.
Phoenix
Much of the City of Phoenix is designated as the City Center TOD. It is located on the west side of Interstate 5 and includes both sides of Hwy. 99. On the north, this TOD includes commercial and residential development on the northwest side of the interchange and northern city limits. The area is bordered on the west by Colver Road. The city has developed a mixed-use plan for the city center with standards that are consistent with the RVMPO TOD study. High density development in this TOD would meet AM requirements.
Zones examined were: R-2; R-3; MX; C-1; CT; CH; LI.
Area descriptions:
City Center TOD shows high-density development areas on Cheryl Lane and Colver Road.
Talent
No high-density residential construction took place in this reporting period. For most of this period a building moratorium was in effect because of water system inadequacies. A new water system was completed and the moratorium was lifted in summer, 2003. Some recently approved projects are expected to meet benchmark qualifications once built. A civic center with retail space was built in the downtown area during the reporting period.
Zones examine were: R-2; MH; C-1; C-2; C-3; C-4; LI.
Area descriptions:
Downtown area extends west of Hwy. 99, and north and south of W. Main Street to include Talent Elementary and Middle schools.

47
Appendix A Technical Memorandum Refine Tracking Criteria, Alternative Measures
The following steps set out a process for evaluating development in RVMPO cities to show progress toward meeting the benchmarks and targets for mixed-use housing and employment growth, as established in the RVMPO s Regional Transportation Plan, Alternative Measures.
Information gathered (from building permits issued) is to be recorded on the attached chart.
Step 1. Determine location of development (from maps in previous task) 1. If development is within the Downtown area, and is not auto oriented (gas station, storage
facility, or drive-through commercial), it qualifies. Check box and go to Step 2. 2. If development is within a TOD site, appropriate box and go to Step 2. 3. If development is adjacent to an existing neighborhood activity center, as noted in
previous mapping task, and is vertically or horizontally mixed use (single structure with residential and commercial uses, check box and go to Step 5.
4. If none of the above, check Not qualify and enter No in far right column. Go to Step 2.
Step 2. Determine type of development 1. Is the project residential? If yes, enter number of total units and units per acre (or the
equivalent) on chart. Go to Step 3. 2. Is the project retail commercial (generally Community Commercial or Regional
Commercial), office (Service Commercial or Professional Office), or light industrial? If yes, go to Step 4.
3. Is the project mixed use, generally combining uses in 1 and 2 above? If yes, go to Step 5. 4. If none of the above, project does not qualify. Enter No in far right column. Go to Step
4.1 to determine number of jobs associated with this project.
Step 3. Determine whether residential development counts toward meeting benchmarks 1. Determine the number of units per acre, or the equivalent, i.e. one home on a 4,356 sq. ft.
lot would be 10 homes/ac, meeting the standard for Alternative Measure 5. Enter number on chart. If number is 10 or greater, go to next question. If number is smaller than 10, enter No in far right column.
2. Is the project within ¼ mile (measured as actual walking distance from the nearest edge of projects and following the most direct pedestrian walkway, existing or proposed) of a significant retail center (20,000 sq. ft. or larger)? If yes, go to next question. If no, enter No in far right column.
3. Is there a completed pedestrian walkway connection to the retail center above and no significant (more than 120 feet) out-of-direction travel required for the pedestrian? A completed pedestrian walkway is defined as a facility that is: identified by the city as a public sidewalk along a street; an off-street multi-use path meeting city design standards; or a pathway that replicates a sidewalk in parking lots, including physical separation from vehicles, and sidewalk-like features. Where street crossing are included as part of the pedestrian route to connect with the retail center, these crossing should not be unprotected crossings of streets carrying significant traffic volumes, or where speeds

48
exceed 30 mph. If there is a completed walkway connection, the project qualifies. Enter M5 in the far right column. If not, enter no.
Step 4. Determine whether commercial and industrial development counts toward meeting benchmarks
1. Determine the number of jobs to be created, using the appropriate formulas, and enter result on chart:
Commercial divide building square footage by 600 sq. ft., equals number of jobs;
Office divide building square footage by 500 sq. ft., equals number of jobs; or
Light Industrial divide building square footage by 1000 sq. ft. equals number of jobs
2. Does the building front the street (so parking between building and street) and have a main entrance from that street? If yes, go to next question. If no, enter No at far right.
3. Does the project include a vertical mix of uses (single structure with above floors used for residential or office use, and a portion of the ground floor for retail/commercial or services)? If yes, the project qualifies. Enter M6 at far right. If no, go to next question.
4. Is the project located within ¼ mile of higher density residential development (10 or more units per acre) measured as actual walking distance from the nearest edge of the project and following the most direct pedestrian walkway (existing or proposed as part of this project)? If yes, go to next question. If no, enter No at far right.
5. Is there a complete (or proposed as part of this project) pedestrian walkway between the project and the residential development identified in this section? If yes, the project qualifies. Enter M6 in column at far right. If no, the project does not qualify.
Step 5. Determine whether mixed-use project outside of TOD areas qualifies toward meeting benchmarks
1. Enter number of residential units in chart. Calculate number of units per acre following step 3.1.
2. Enter number of jobs following step 4.1 3. Does the building front the street (no parking between building and street) and have a
main entrance from that street? If yes, go to next question. If no, enter No at far right. 4. Is the project within ¼ mile (measured as actual walking distance from the nearest edge
of the project and following the most direct pedestrian walkway, existing or proposed as part of this project) of an existing major transit stop as defined by the state Transportation Planning Rule. If yes, the project qualifies. Fill in M5 and M6 in the far right column. If no, the project does not qualify. Enter No in far right column.

49
RVMPO Alternative Measures sample tracking chart
_____________________ January, 2000 December, 2003 (City)
1. Location: address and legal description; and check area that applies (if none applies, also enter No in far right column). 2. List one of three uses: Residential, Commercial/Industrial, Mixed Use. 3. If residential, list number of units. 4. Lot-size determination: distinguish whether lot is greater or less that .10 acre (i.e. one home on a 4,356 sq. ft. lot is equivalent to 10 homes/ac., meeting the standard for Alternative Measure 5). 5. To be filled out for all commercial uses (retail, industrial, manufacturing, etc.). List potential employment by the following standard (from Medford TSP):
Commercial divide building square footage by 600 sq. ft. equals number of jobs
Office divide building square footage by 500 sq. ft. equals number of jobs
Light Industrial divide building square footage by 1000 sq. ft. equals number of jobs 6. Alternative Measures determination. For qualifying dwellings enter AM5; for qualifying commercial enter AM6; mixed use enter AM 5 & AM6; for developments that don t qualify enter No.
Downtown TOD Activity Center Not Qualify
Downtown TOD Activity Center Not Qualify
Downtown TOD Activity Center Not Qualify

50
88.. TTeecchhnniiccaall MMeemmoorraanndduumm:: DDeetteerrmmiinnaattiioonn ooff DDeevveellooppmmeenntt tthhaatt SSaattiissffiieess TTrraacckkiinngg CCrriitteerriiaa
This memo reports on the use of the RVMPO s Alternative Measures (AM) tracking criteria to separate development that promotes a mixed-use, pedestrian-friendly environment from development that does not achieve this aim. The sorting criteria described in detail in the previous section (Section 6. Technical Memorandum Refine Tracking Criteria, Alternative Measures) was used in this evaluation.
To complete this task, all commercial and residential development that has occurred in the period of January, 2000, to December, 2003, in each of the RVMPO member jurisdictions was identified using records available from GIS, Jackson County Assessor s Department, and the cities. This process relies on a multitude of sources because no singles source was adequate. Determining whether or not a particular development residential or commercial/industrial meets AM 5 or AM 6 standards is dependent on cities themselves providing detailed information.
To categorize and evaluate development for this memo, the chart illustrated in Technical Memorandum 5 was completed for each city. Information reported on the attached charts includes available housing and employment data for each city, determination of the location of the development, determination of the type of residential , commercial or industrial development, determination of the number of dwelling units or jobs, and the determination of whether the development counts toward meeting the benchmarks.
Summary of development, 2000-2003
Using the methodology described in this memo, summary results of the Alternative Measures audit are shown in the two charts below. Information was collected for the years 2000 (base year for Alternative Measures) through 2003.
Dwelling units, 2000-2003
City Total Units
# Meet AM-5
Percent Meet AM-5
Ashland 261 32 12% Central Point 600 25 4% Eagle Point 411 6 1% Jacksonville 127 27 21% Medford 1,274 109 8.5% Phoenix 169 32 19% Talent 33 4 12%
The Housing table, above, shows by city the total number of dwelling units built 2000-2003, and the total number of those units and the percentage that meet Alternative Measure 5.

51
Commercial, Industrial Job Growth, 2000-2003
City Total # Jobs
# Meet AM-6
Percent Meet AM-6
Ashland Central Point 22 9 40% Eagle Point 0 -- -- Jacksonville 10 10 100% Medford 208 0 0% Phoenix 0 -- -- Talent 8 5 62%
The Commercial/Industrial table, above, shows by city the total number of jobs created 2000-2003, and the number of those jobs and percentage that meet Alternative Measure 6.
The two tables above were based on audits of growth within the cities. Details of the audits, by city, appear on the following pages.
Notes on the charts
As discussed in Section 6, a home that meets the AM 5 benchmarks must be built on a lot no greater than 10 unites per acre (<0.1) in downtown and TOD areas. In activity centers, the development also must be mixed use.
Auxiliary dwelling units are included in all residential counts when the dwelling is a separate building (footprint).
Column on far right records whether or not the development meets the benchmark and for which measure. When only a portion of the development meets a measure, the number of units is noted.

52
ASHLAND 2000 - 2003
Ashland Community Hospital area
Downtown TOD
Not Qualify
Residential (inc. 8 aux. dwellings)
14
8
<0.1 ac
>0.1 ac
No (Step 1.3)
North Mountain Avenue area
Downtown TOD
Not Qualify
Residential
14
20
<0.1 ac
>0.1 ac
No (Step 1.3)
Hersey Street District
Downtown TOD
Not Qualify
Residential
13
29
<0.1 ac
>0.1 ac
No (Step 1.3)
AM 5 (32)
Downtown/Railroad District TOD Activity Center Not Qualify
Residential (inc. 17 aux. dwellings)
32
4
<0.1 ac
>0.1 ac No
Southern Oregon University area
Downtown TOD
Not Qualify
Residential (inc. 7 aux. dwellings)
12
5
<0.1 ac
>0.1 ac
No (Step 1.3)
Other Areas
Downtown TOD Activity Center
Residential (inc. 18 aux. dwellings)
18
92
<0.1 ac
>0.1 ac No
Mountain Meadows LLC 905 Skylark Place 391E04AD77004
Downtown TOD
Not Qualify
Office
A Street Market Place 340 Oak Street 391E04CD1300
TOD Activity Center Not Qualify
Commercial AM 6

53
Ashland Community Hospital 588 N. Main St. 391E05DA4400
Downtown TOD
Not Qualify
Parking lot 0
Ashland City 560 Catalina Drive 391E05DB2400
Downtown TOD
Not Qualify
Commercial (hospital) sq.ft.
William Robertson Applegate Way 391E13B2011
Downtown TOD Activity Center
Industrial/ manufacturing sq. ft.
No
Morris/Oak Street Tank & Steel 789 Jefferson Ave. 391E14A2403
Downtown TOD Activity Center
Industrial/ manufacturing sq. ft.
No
Thompson Investment 560 Clover Lane 391E14AA6400
Downtown TOD Activity Center
Commercial (fast food) sq.ft.
No
Summit Investment 2210 Ashland St. 391E14BA1800
Downtown TOD Activity Center
Commercial (mini-lube) sq.ft.
No
CENTRAL POINT 2000 - 2003
Hamrick Road/E. Central Point
Downtown TOD Activity
Residential
41
181
<0.1 ac
>0.1 ac
No (lacks commercial)
Freeman Road
Downtown TOD
Not Qualify
Residential
31
7
<0.1 ac
>0.1 ac
No
(Step 1.3)

54
Four Oaks Center Fourth & Oak streets
TOD Activity Center Not Qualify
Mixed use (office, commercial residential)
15 <0.1 ac 9
AM 5
AM 6
Duplexes at Maple and Seventh streets
TOD Activity Center Not Qualify
Residential 4 <0.1 ac
AM 5
Cherry Street development TOD Activity Center Not Qualify
Residential
2
6
<0.1 ac
>0.1 ac
AM 5
No
Misc. downtown residential TOD Activity Center Not
Residential 8 >0.1 ac No
Central Point TOD
Downtown
Activity Center Not Qualify
Residential (inc. 1 aux. dwelling)
4
66
<0.1 ac
>0.1 ac
AM 5
No
Other Central Point residential
Downtown TO Activity Center
Residential (inc. 9 aux, dwellings)
12
223
<0.1 ac
>0.1 ac No
MDD LLC 81 Freeman Road 372W02D1000
Downtown TOD
Not Qualify
Office 3984 sq. ft.
8 No
L & B Holding Co. Larue Drive 372W02D2905
Downtown TOD Activity Center
Commercial (fast food) 2835 sq. ft.
5 No
EAGLE POINT 2000 20003

55
Downtown area
TOD Activity Center Not Qualify
Residential (inc. 3 aux dwellings)
6
13
<0.1 ac
>0.1 ac
AM 5 (6)
No
Reese Creek Road TOD
Not Qualify
Residential
27
143
<0.1 ac
>0.1 ac
No (Step 1.3)
Golf Course area
Downtown TOD
Not Qualify
Residential 199 >0.1 ac
No
Other areas
Downtown TOD Activity Center
Residential (inc. 1 aux. dwelling)
17
6
<0.1 ac
>0.1 ac No
JACKSONVILLE 2000 - 2003
South & West Jacksonville
Downtown TOD Activity Center
Residential 40 >0.1 No
Fifth Street TOD
Downtown
Activity Center Not Qualify
Residential 1 >0.1 No
Nunan Square
Downtown
Activity Cen Not Qualify
Residential (inc. 4 aux. dwellings)
24
44
<0.1
>0.1
AM 5
No
Downtown TOD Activity Center Not Qualify
Residential (3 aux. dwellings)
3 <0.1 AM 5

56
Other areas
Downtown TOD
Residential
10
5
<0.1
>0.1 No
William Brodie 305 Shafer Lane 372W29DA400
Downtown
Activity Center Not Qualify
Office (dentist) 3,740 sq.ft.
8 AM 6
Ron Coffman/Oregon Diverse Industries 650 G Street 372W29DC4103
Downtown
Activity Center Not Qualify
Parking lot 0
AM 6
R. Collins 100 California Street 372W32BA10101
TOD Activity Center Not Qualify
Commercial 1,088 sq.ft.
2 AM 6
MEDFORD 2000 - 20003
Delta Waters
Downtown
Activity Center Not Qualify
Residential
25
28
<0.1 ac
>0.1 ac
AM 5 (25)
No
North Medford High School area
Downtown TOD
Not Qualify
Residential
31
52
<0.1 ac
>0.1 ac
No
(Step 1.3)
Other North East Medford
Downtown TOD Activity Center
Residential (inc. 45 aux. dwellings)
45
148
<0.1 ac
>0.1 ac No
Central-North Medford
Downtown TOD Activity Center
Residential
13
126
<0.1 ac
>0.1 ac No

57
Medford Railroad Park
Downtown TOD
Not Qualify
Residential
3
2
<0.1 ac
>0.1 ac
No
(Step 1.3)
West Medford TOD
Downtown
Activity Center Not Qualify
Residential
84
1
<0.1 ac
>0.1 ac
AM 5 (84 ) No
Southwest Medford
Downtown TOD Activity Center
Residential
8
372
<0.1 ac
>0.1 ac No
Southeast Medford Asante/ RVMC area
Downtown TOD
Not Qualify
Residential
2
28
<0.1 ac
>0.1 ac
No
(Step 1.3)
Other Southeast Medford
Downtown TOD
Residential
14
292
<0.1 ac
>0.1 ac No
Lock & Key LLC 1669 Coker Butte Road 371W051600
Downtown
Activity Center Not Qualify
Commercial mini-storage, 107,587sq. ft.
1 <0.1 2 No (Steps 2.2-2.4)
Charles Abar 4841 Airway Drive 371W06BB422
Downtown TOD Activity Center
Industrial/ manufacturing 6,000 sq. ft.
6 No
Blum Commercial Properties 3581 Excel Drive 371W07AC2200
Downtown TOD Activity Center
Office, 6,665 sq. ft.
14 No

58
Burrill Resources Inc. 3525 Lear Way 371W07D312
Downtown TOD Activity Center
Office, 12,688 sq. ft.
26 No
Columbine Investments 3862 Crater Lake Ave. 371W08BB3800
Downtown
Activity Center Not Qualify
Office (clinic) 9,752 sq. ft.
20 No (Step 4.2)
Donald Berryessa 1914 Sky Park Drive 371W18AA2714
Downtown TOD Activity Center
Industrial/ manufacturing 11,600sq. ft.
12 No
Summit Hotel Properties 1122 Morrow Road 371W18C4600
Downtown TOD
Not Qualify
Commercial (lodging) 42,128 sq. ft.
4 No
Edwin Bennion 725 Golf View Drive 371W33AB10000
Downtown TOD
Not Qualify
Office (medical) 3,700 sq. ft.
8 No
Michael Mahar 3180, 3190 Golf View Drive 371W33AB11400, 500, 600
Downtown TOD
Not Qualify
Office (medical) 9,112 sq. ft.
19 No
Powder River Inc. Juanipero Way 371W33AC8603
Downtown TOD
Not Qualify
Office 4082 sq. ft.
9 No
Asante 750 Murphy Road 371W33BA6000 (or BA9000?)
Downtown TOD
Not Qualify
Office (clinic) 12,632 sq. ft.
26 No
59
Barry Engle 3569 National Drive 372W12A1115
Downtown TOD Activity Center
Office 5,372 sq. ft.
11 No
Roland Buck 542 Parsons Drive 372W23DA138
Downtown TOD Activity Center
Industrial Manufacturing 8,575 sq. ft.
9 No
Jacksonville Hwy. LLC 2386 Jacksonville Hwy. 372W26AC2500
Downtown
Activity Center Not Qualify
Commercial (row store) 5,000 sq. ft.
9 No (Step 4.2)
Galpin LLC 2306 Jacksonville Hwy. 372W26AC2700
Downtown
Activity Center Not Qualify
Commercial (row store) 9,884 sq. ft.
17 No (Step 4.2)
Back 2 Back s Inc. 2380 Jacksonville Hwy. 372W26AC2701
Downtown
Activity Center Not Qualify
Commercial (row store) 4,042 sq. ft.
7 No (Step 4.2)
Jackson Creek Center LLC 2366 Jacksonville Hwy. 372W26AD4100
Downtown
Activity Ce Not Qualify
Commercial (row store) 4,800 sq. ft.
8
Hays R W Properties LLC 2809 Jacksonville Hwy. 372W26C2500
Downtown TOD
Not Qualify
Commercial (coffee kiosk) 351 sq. ft.
1 No
PHOENIX 2000 - 2003
Cheryl Street 4-plexes TOD Activity Center Not Qualify
Residential 24 <0.1 ac AM 5

60
First Street development
TOD Activity Center
Not Quali
Residential 11 >0.1 ac No
Colver & Pacific Lane TOD Activity Center Not Qualify
Residential 7 <0.1 ac AM 5
Colver & Pacific Lane TOD Activity Center Not Qualify
Residential 1 >0.1 ac No
Jared Court &Samuel Lane Loop Road, & other
Downtown TOD Activity Center
Residential 14 >0.1 ac No
Misc. downtown residential TOD Activity Center Not Qualify
Residential 4 >0.1 ac No
West Phoenix residential
Downtown TOD Activity Center
Residential 5 >0.1 ac No
East Phoenix residential
Downtown TOD Activity Center
Residential 102 >0.1 ac No
TALENT 2000 - 2003
Talent (all outside downtown core)
Downtown TOD Activity Center
Residential (3 aux. dwellings)
29 No

61
Downtown area
TOD Activity Center
Not Qualify
Residential (4 aux. dwellings)
4 <0.1 ac AM 5
Urban Renewal Agency 100 E. Main St. 381W23CD10700
TOD Activity Center Not Qualify
Office 2,367 sq.ft.
5 AM 6
Ken Scott S. Pacific Hwy./Arnos St. 381W25B2804
TOD Activity Center
Industrial 1,985 sq.ft. Office 415 sq.ft.
3 No

62
AAppppeennddiixx DD
AALLTTEERRNNAATTIIVVEE HHIIGGHHWWAAYY MMOOBBIILLIITTYY SSTTAANNDDAARRDDSS
PPrreeffaaccee
In December 2000, the Oregon Transportation Commission (OTC) approved a request by the RVMPO to reduce State mobility standards near the South Medford Interchange. OTC approval of lowering the highway mobility standards near the South Medford Interchange was granted on the condition that a set of actions assuring continued safe traffic operations was implemented in a timely manner. The action plan approved by the OTC consists of thirteen specific actions and requires that a monitoring plan be developed to track their implementation. The monitoring plan, called for in action #13 of the plan, has the specific objectives of: 1) Tracking the development that occurs as a result of changing the mobility standards in the South Medford Interchange area; and 2) Tracking the results of the 12 other action items.
Several actions have been completed and will not require future monitoring. Other actions will be monitored using a separate process. Seven actions have been identified that will require some degree of monitoring and/or follow-up. In these cases, a proposed timeline and methodology was established for how and when implementation of the actions will be monitored. This document is an update of a document completed in May 2003. Revisions reflect information provided by Medford Planning Department and Engineering Department staff.
AAlltteerrnnaattiivvee MMoobbiilliittyy SSttaannddaarrddss AAccttiioonn PPllaann
Action #1:
Work completed as part of the South Medford Interchange (SMI) Project will address deficiencies in the bicycle/pedestrian network in the vicinity of the interchange. Improvements may include extensions and/or improved access to the Bear Creek Greenway, bicycle lanes and other improvements along Barnett Avenue and improved pedestrian crossings and access to businesses.

63
Progress to Date:
The following bicycle/pedestrian projects have been planned to be implemented in coordination with the SMI project. Some projects will occur prior to the construction of the interchange and are not directly associated with the new interchange.
Highland: Add sidewalk to west side from Barnett to Siskiyou; design to include a 10' planted buffer between curb and sidewalk; re-stripe from Greenwood to Siskiyou to provide for on-street bike lanes on both sides.
Bear Creek Greenway: extend south from Barnett Road through the interchange area, under I-5, and continuing south along the west side of I-5; construct 2 connections to the Greenway at Barnett.
New SMI: include standard sidewalks and bike lanes on Garfield, Highland, Barnett, Center, and Highway 99.
Garfield: separate sidewalk from curb with 10' planter.
Highway 99: separate sidewalk with 3' planter; west side of Highway 99 to include addition of bike lane.
Barnett Rd.: Add sidewalk to the north side between Bear Creek and Highland Design to include a 10' planted buffer between curb and walk; re-stripe over I-5; modify bridge curbs/walks for standard sidewalks and bike lanes; extend bike lanes to Ellendale.
Timeline for Completion:
The SMI project is scheduled for construction in 2006. The bicycle/pedestrian projects identified are to be completed either prior to or concurrent with construction of the SMI project.
Monitoring Schedule:
This action requires that bicycle/pedestrian projects be included as part of the SMI project. As such, no continual monitoring of progress is necessary prior to construction of the SMI. An assessment of progress on the SMI and the bicycle/pedestrian projects linked with its construction will be reported to ODOT and the RVMPO by June 30, 2006, when the SMI project is scheduled to be nearing construction.
2004 Update:
The project is scheduled to let in February 2006 and should take two years to complete.
Action #2:
The City of Medford RTP projects will be implemented to provide local connectivity, facilitate the use of alternative modes, and reduce demand on state highways. Several of these projects will specifically address congestion problems in the SMI area.

64
Progress to Date:
The following projects have been completed:
Delta Waters, Haul to Lear - New roadway;
Garfield, Holly to Hwy 99 - New roadway;
Hillcrest, Valley View to Black Oak - Sidewalks/bike lanes;
Juanipero, Olympic to Golf View - New roadway;
McAndrews, Brookdale to Foothill - New roadway;
McAndrews, Foothill to Tamarack - New roadway;
Miscellaneous locations - City-wide sidewalk improvements.
The following projects are scheduled for completion by 2005:
Holly, Garfield to Holmes - New roadway;
Jackson, Berkeley to Valley View Widening;
Lozier, Cunningham to Stewart - New roadway;
Peach, Stewart to Garfield Widening;
Poplar, McAndrews to Progress Widening;
Columbus, Service Center to Sage - Realign & new roadway;
N. Phoenix, Cherry to Hillcrest - New roadway.
The following projects are scheduled for completion between 2006-2010:
South Medford Interchange - New Interchange;
Garfield, Peach to King Widening;
Black Oak, Hillcrest to Acorn Widening;
Delta Waters Rd, Provincial to Foothill Widening;
Springbrook, Cedar Links to Delta Waters Widening;
Highland, Keene to Main Widening;
Table Rock, Merriman to I-5 Widening.
65
The following projects are scheduled for completion between 2011-2023:
Spring, Crater Lake to Sunrise Widening;
Spring, Sunrise to Pierce Widening.
This project has been eliminated due to the accelerated timing of the new interchange:
S. Medford Interchange, SB off-ramp - Add left-turn lane.
Timeline for Completion:
Seven projects are scheduled for completion by 2005, seven projects are scheduled for completion by 2010, and two others are scheduled for completion before the end of the RTP planning horizon (2023).
Monitoring Schedule:
Continual monitoring of the progress on these projects is part of on-going RVMPO planning responsibilities. Therefore, no additional monitoring of these projects should be necessary. An assessment of progress on these projects will be made and reported to ODOT and the RVMPO by June 30, 2006.
2004 Update:
Several projects differ from the original progress report:
2005 projects:
Jackson, Berkeley to Valley View Widening. This project is scheduled in the MTIP to let in 2006.
Lozier, Cunningham to Stewart New roadway. The MTIP shows that this project was completed in FY 2003.
Peach, Stewart to Garfield Widening. This project is scheduled in the MTIP to let in 2006.
Poplar, McAndrews to Progress Widening. The MTIP shows this project was completed in FY 2003.
Columbus, Service Center to Sage Realign and new roadway. This project is not in the MTIP and will not be constructed in this timeframe.
N. Phoenix, Cherry to Hillcrest new roadway. The MTIP shows this project was completed in FY 2003.
With these changes, seven projects are scheduled for completion by 2005, seven projects are scheduled for completion by 2010, and two others are scheduled for completion before the end of the RTP planning horizon (2023).

66
Action #3:
If the SMI project is not included in the 2002-2005 STIP, the City of Medford will develop an access management plan that will include projects to control access in the vicinity of the current interchange. Project implementation will begin following adoption of the access management plan and be complete by 2010 or when the SMI project is funded in a subsequent STIP, whichever comes first.
Progress to Date:
The SMI project has been included in the 2002-2005 STIP (Key # 10964).
Timeline for Completion:
The SMI project is currently scheduled for completion by 2007. The requirements of this action have been fulfilled.
Monitoring Schedule:
This action requires no further monitoring.
2004 Update:
The action is complete. No further monitoring is required.
Action #4:
Funding of RVTD's TDM program shall continue at existing levels and increase as funds become available.
Progress to Date:
Funding for the TDM/Rideshare program (operated by RVTD) went from $89,000/year in 2000 to $131,000 in 2003. The Draft 2004-2007 STIP estimates this funding to increase to $146,000 in 2005 and continue at that level through 2007. There is no indication at this time that funding for this program will decrease at any time in the future.
Timeline for Completion:
Funding allocations for RVTD s TDM/Rideshare program will be tracked until the SMI project has been completed. To date, this action has been successfully implemented.
Monitoring Schedule:
As long as alternative mobility standards remain in place at the South Interchange, the RVMPO shall insure that funding for the TDM program remains at current, or increased funding levels. An assessment of progress on this action will be made and reported to ODOT and the RVMPO by June 30, 2006.

67
2004 Update:
Funding of the TDM is continuing. The most recent version of the STIP allocates $146,000 per year through the planning period.
Action #5:
A study (currently underway) will be completed to examine the feasibility and determine possible locations for Park-and-Ride facilities within the Rogue Valley Transportation Districts
service boundary. Particular emphasis will be made to reduce peak-hour demand on state highways. Funding has been allocated in the 2000-2003 STIP ($800,000) for construction of park-and-ride facilities.
Progress to Date:
The park-and-ride study for RVTD has been completed. This study examined the feasibility of park-and-ride facilities and recommended locations for their placement. Based on the findings in the study, the recommendations were as follows:
1) The construction of any park-and-ride facilities in the Rogue Valley should be part of an integrated transport package with clear objectives. The combined effect of these measures should be to reduce dependency on the single occupant vehicle.
2) Until park-and-ride facilities can offer time and/or cost savings to commuters, RVTD should pursue leased (or joint-use) as opposed to owner-operated arrangements when considering the development of park-and-ride facilities.
3) Parking fees and/or parking space reductions at the destination of transit patrons should be implemented as part of the development of park-and-ride facilities serving that destination.
4) RVTD should investigate the feasibility of direct (or shuttle ) service to employment centers or other major destinations as part of any effort to establish park-and-ride facilities
Due, in part, to the study s findings relative to the lack of demand for park-and-ride facilities in the Rogue Valley area, approximately $420,000 of the funding previously allocated in the 2000-2003 STIP was diverted at ODOT s request to other projects. This action left funding for park-and-rides facilities in both Ashland and Talent (total cost of $337,000) but eliminated funding for park-and-rides in Medford and Central Point.
Timeline for Completion:
The study has been completed. The study s findings did not support the present viability of park-and-ride facilities to reduce peak-hour travel demand near the interchange. There are no plans at this time to construct park-and-ride facilities in the vicinity of the SMI.
Monitoring Schedule:
This action requires no further monitoring.

68
2004 Update:
This action requires no further monitoring.
Action #6:
The City of Medford will work with RVTD and area employers to establish a Transportation Management Association (TMA) that will address employee-related congestion problems in the SMI area. Efforts will focus on the implementation of TDM programs.
Progress to Date:
The RVTMA has been formed with its current membership consisting of RVTD and RVCOG. Discussions are ongoing with the City of Medford, Jackson County and ODOT concerning their membership in the TMA. Monthly meetings started in June of 2002, with discussions about the intent and structure of the TMA. Staff from the City of Medford, Jackson County, RVCOG, and RVTD are regular participants at TMA meetings. Beginning with the November meeting, an effort has been made to bring additional employers into the group. Participants to date have included Providence Medford Medical Center, Rogue Community College, Bear Creek Operations, the Bureau of Land Management, and ODOT.
In the last three months, the TMA has heard a series of informational presentations. In November, ODOT presented on upcoming I-5 viaduct construction impacts. Decembers
meeting saw Rick Williams, director of what is probably Oregon s most successful TMA, talk about the challenges and successes of the Lloyd District TMA. In January, Kathy King from the Oregon Office of Energy talked about the Oregon Business Energy Tax Credit (BETC).
RVTD has applied for CMAQ funding to pay for three years of TMA staffing and activities. Recruiting additional members and encouraging public sector employer members to actually implement TDM strategies are the near term challenges for the RVTMA.
Timeline for Completion:
The alternative mobility standards action plan set a January 2003 timeline for establishment of a TMA and adoption of a TDM program. Although the TMA has been established, its membership is limited to only two government organizations and a TDM program has not been adopted. In the years 2004-2007, funding will be made available through CMAQ to boost the TMA s efforts. This funding would serve to build membership and begin to assist employers in implementing various TDM strategies with an initial focus on the South Medford Interchange area. Staff proposes that a June 30, 2004 deadline be established for adoption of TDM program.
Monitoring Schedule:
Quarterly monitoring of this task is proposed beginning in FY 2004. A memorandum will be prepared in the first through fourth quarters detailing progress made in boosting membership in the TMA and implementing TDM programs. Monitoring of this task will continue on this basis until the SMI project is complete.

69
2004 Update:
The City of Medford has now joined the TMA program and is in discussion regarding TDM measures. Reserved parking spaces for those carpooling will be parked, along with a guarantee of a ride home in the case of an emergency. The program was anticipated to begin in June 2004. Other discussion continues regarding incentives for using alternative modes to get to work, including the feasibility of RVTD providing free bus passes for City employees on a trial basis.
Action #7:
The RVMPO will comply with the Transportation Planning Rule s (TPR) requirement to demonstrate a reduced reliance on the automobile. Work is scheduled to be completed by May of 2001 on an alternative to the TPR measurement of 5% VMT reduction. The alternative measure will use benchmarks to demonstrate greater usage of alternative modes such as bicycling, walking, and transit. Benchmarks will also demonstrate a reduced reliance on the automobile.
Progress to Date:
In December of 2001, the Land Conservation and Development Commission (LCDC) approved RVMPO s proposal for adopting an alternative to the TPR s 5% VMT/capita reduction requirement. The RVMPO proposed a set of seven measures as follows:
Measure 1: Transit and bicycle/pedestrian mode share: Increase transit s mode share from 1% to 3% and bicycle/pedestrian mode share from 8.2% to 11% over a 20-year planning period.
Measure 2: Percentage Dwelling Units (DU s) w/in ¼ mile walk to 30-min. transit service: Increase from 12% to 50%.
Measure 3: Percentage Collectors and arterials w/ bicycle facilities: Increase from 21% to 60%.
Measure 4: Percentage Collectors and arterials in TOD areas w/ sidewalks: Increase from 46% to 75%.
Measure 5: Percentage Mixed-use DUs in new development: 49% of new development between 2000 and 2020.
Measure 6: Percentage Mixed-use employment in new development: 44% of new development between 2000 and 2020.
Measure 7: Alternative Transportation Funding: Provide $6.4 million for transit, bicycle and pedestrian projects (represents ½ of the MPO s estimated accumulation of discretionary funding (STP) from 2000 to 2020).
Timeline for Completion:
Implementation of this action has been completed.

70
Monitoring Schedule:
This action requires no further monitoring. Implementation of the alternative measures will be monitored through a separate process at 5-year intervals beginning in 2005 and continuing through 2020.
2004 Update:
This action requires no further monitoring.
Action #8:
The RVMPO will identify funding possibilities to increase transit service frequency within the MPO to a minimum of 30 minutes headway during peak hours and add transit service to the Southeast Medford area.
Progress to Date:
In 2001, the RVMPO approved funding priority transit routes (serving TOD areas as well as White City) using one-half of the MPO s share of STP funds through the year 2020. These funds will pay for 30-minute transit service on Route 40 (Central Point) and add transit service to the Southeast Medford area.
It remains a top priority for RVTD to insure 30-minute headways on all routes during peak hours. Although potential funding to accomplish this goal has been identified in the RTP, it will most likely be necessary for a local revenue source (such as a property tax increase or a new payroll tax) to be implemented.
Timeline for Completion:
Implementation of this action has been completed.
Monitoring Schedule:
This action requires no further monitoring.
2004 Update:
This action requires no further monitoring.
Action #9:
The City of Medford will explore signal prioritization, queue jumper lanes, bus rapid transit facilities, increased hours of service, increased service frequency, and increased transit coverage options in order to increase the attractiveness of transit in the City.
Progress to Date:
The City is working with RVTD to explore possibilities for improving transit service in Medford as specified in this action. The majority of this work is being coordinated through the Medford TSP process. Nothing has been formalized to date. A signal prioritization project is being

71
explored through the Rogue Valley Intelligent Transportation Systems (RVITS) committee, a subcommittee to the RVMPO Policy Committee.
Timeline for Completion:
The Medford TSP is scheduled to be partially adopted by the end of FY 2003. At this time, a formal evaluation of potential transit improvements as specified in this action will have been explored by Medford.
Monitoring Schedule:
This action requires no further monitoring.
2004 Update:
The Medford TSP was adopted by the City Council in November 2003. It was partially acknowledged by the Department of Land Conservation and Development on June 17, 2004. Areas needing additional work include (1) a plan to revise land uses to reduce reliance on the automobile, and (2) a parking plan to assist planned efforts to reduce reliance on the automobile. The compliance order requires submission of a work program to reduce reliance on the automobile by December 31, 2005, and development of a parking plan by June 30, 2005.
Action #10:
The RVMPO will continue to implement the recommendations made in the Transit Oriented Development or TOD Study completed in August 1999. The objectives of the study were to: 1) reduce reliance on the automobile in order to meet the Oregon Transportation Planning Rule s (TPR) mandated 5% vehicle miles traveled (VMT) reduction; and 2) identify alternative land use strategies to meet 060 analysis of the TPR. TGM grants are currently being used to implement TOD sites in Phoenix, Medford, and Central Point.
Progress to Date:
Ten candidate high-growth areas, previously identified in the 1995 RTP, were analyzed in the TOD Study. Of the original ten TOD sites, three are proceeding towards development, three are undergoing analysis, and four have been removed from consideration. The three TOD sites closest to development are the Central Point TOD, the Medford SE Plan, and the Phoenix City Center Plan. The following is a brief summary of the status of TOD development in the RVMPO.
Central Point TOD Status. Central Point has adopted changes to its comprehensive plan map and implementing ordinances to establish a fully compliant TOD center in the northwest section of the city. Transportation infrastructure needs are currently being programmed in the 2002-2005 TIP/STIP.
Medford TOD Development Status. The four sites currently being planned for TOD development include: Downtown, Southeast, Delta Waters and West Medford. The Medford Urban Renewal Agency has secured a TGM grant that will aid in the development of codes and standards for the Downtown TOD. The

72
City of Medford has secured a TGM grant to implement the Southeast TOD development. Much of the planning for this development has been completed and portions will soon be under construction. Preliminary plans have been developed through the Medford TSP for implementing the other TOD areas near Delta Waters and West Medford.
Phoenix City Center TOD Status. Phoenix has developed a mixed-use plan for the City Center area that incorporates TOD policies and standards consistent with the MPO s TOD Study. The TOD site includes much of the existing downtown area, and the City is committed to urban-centered, pedestrian-friendly growth. The City has conducted a marketing feasibility study for an independently prepared City Center Plan and will adopt amendments to its municipal code that foster transit-oriented development.
Timeline for Completion:
TOD developments will be implemented in the MPO over the course of several years. No timeline has been developed for their completion.
Monitoring Schedule:
Monitoring of TOD development in the MPO area will be accomplished through the alternative measures monitoring plan. This action requires no further monitoring.
2004 Update:
The Southeast Plan Area TOD is nearing completion of a special plan and code standards to implement its function. Adoption is anticipated in late 2004
The Downtown TOD implementation is contained in the City Center 2050 Plan now being prepared to start the formal adoption process. Adoption is anticipated in summer 2004.
Work on the West Main Street TOD and the Delta Waters TOD has not begun, other than many of the standards identified in the other two TODs will be useful for these. Medford applied for a Technical Assistance Grant for work on the West Main Street TOD, and while it was not approved, the city was informed that TGM funds not expended in FY 2004 may be available to assist in the evaluation.
Action #11:
ODOT and the City of Medford will implement portions of a Congestion Management System which will include: 1) frequent (semi-annual) optimization of signalized intersections in the South Medford Area; and 2) construction of variable message signs in the vicinity of the SMI. Other possibilities include live camera monitoring, media alerts, and other methods of informing travelers of possible delays and detours awaiting them ahead. [There is currently a message sign display installed on Southbound I-5 between Central Point and Medford. Funding has been programmed for the construction of an additional sign south of the interchange.]
73
Progress to Date:
The Congestion Management System called for in the above action has been implemented as follows:
The City currently reviews signal timing on a regular basis, as directed by the Manual for Uniform Traffic Control Devices. Although the signal timing is not optimized on a semi-annual basis, it is optimized frequently enough to account for any significant variations in travel patterns in the SMI area. The City has indicated that semi-annual signal optimization would not be practical or logical.
Variable Message Signs have been located at both ends of Medford, within close proximity to the SMI.
Medford has a traffic camera installed at the SMI and they currently do traffic news alerts. Work on the I-5 Viaduct has also provided many avenues for driver notification along with ODOT's trip check site on the internet.
Other improvements, consistent with improvements called for in this action, will be identified within the Medford TSP, scheduled for partial adoption during FY 2003.
Timeline for Completion:
Implementation of this action has been completed.
Monitoring Schedule:
This action requires no further monitoring.
2004 Update:
The Medford TSP identified congestion management projects for the South Medford interchange area.
Action #12:
The City of Medford will address possible solutions for the Highway 99 @ Stewart Avenue intersection, as well as other nearby intersections, as part of their TSP adoption process.
Progress to Date:
The transference of ownership of the Highway 99 and Stewart Avenue intersection was one of the conditions of approval of the alternative mobility standards. The following language was included in the proposal to the Oregon Transportation Commission:
Technical analysis by ODOT did not reveal a potential solution for the intersection of Highway 99 @ Stewart Avenue. The new South Medford Interchange project, which will solve v/c problems at the interchange, does not solve problems here. However, considering the urban nature of the proposed and existing development surrounding the intersection, and the proximity of the intersection to City-owned portions of Highway 99, there is a strong argument to be made

74
that ownership of the intersection should be transferred to the City of Medford and so conform to the City s mobility standards. Under this scenario, the intersection would no longer need to operate under the State s mobility standards and would instead revert to the City s standards. It s important to note that the safety issues related to lowering mobility standards on the I-5 off-ramps, i.e., high speed differentials, are not a factor for this intersection.
The proposed alternative mobility standard of v/c >1.0 for two hours per day would remain in place until ownership of the intersection could be transferred to the City. This transference of ownership would likely occur in the next five years and possibly before exceedence of the current State mobility standard (v/c .90) for this intersection.
Although the Draft Medford TSP does not address the intersection of Hwy 99 and Stewart Ave., ODOT and the City are currently working on the jurisdictional exchange for this intersection, currently scheduled to occur by the end of this summer. ODOT also is developing plans to construct dual left turn lanes onto Stewart for northbound traffic. The turn lanes will be completed as part of the SMI project and will be done concurrently with the SMI project. The turn lanes should enable the intersection to function according to ODOT highway mobility standards until 2030.
Timeline for Completion:
The jurisdictional exchange for the Highway 99 and Stewart Avenue intersection should be complete by the end of summer 2003. Dual left turn lanes, designed to allow the intersection to function according to ODOT mobility standards, are scheduled for construction concurrently with the SMI project in 2006.
Monitoring Schedule:
This action requires that congestion problems be addressed at the Highway 99 and Stewart Avenue intersection. Additionally, the OTC anticipated that the intersection would be transferred to City ownership prior to exceedence of State mobility standards. Both of these requirements are on-track to completion and therefore further monitoring should not be necessary. An assessment of progress on the SMI and the related construction of dual-left turn lanes will be reported to ODOT and the RVMPO by June 30, 2006, when the SMI project is scheduled to be nearing construction.
2004 Update:
Not action is required at this time. Work will be completed with the SMI project.
The project is scheduled to be let in February 2006 and should take two years to complete.
Action #13:
The RVMPO, in conjunction with the City of Medford and ODOT, will develop a monitoring plan with the objectives of: 1) Tracking the development that occurs as a result of changing the mobility standards in the SMI area; and 2) Tracking the results of the 12 action items proposed above. An expected outcome is that new development is consistent with policies as set forth in the Oregon Highway Plan (e.g. OHP Policy 1B).

75
Progress to Date:
This memo will serve to implement Action #13.
Timeline for Completion:
Refer to monitoring schedule below.
Monitoring Schedule:
Task one of this action - tracking development related to changing the mobility standards - has been identified as a work task in RVMPO s FY2004 Unified Planning Work Program (UPWP). The work will be done according to the following methodology and schedule:
Collect documentation (applications, etc.) associated with any developments potentially affected by a lowering in the mobility standard at the SMI.
Timeline: Complete by end of first quarter FY 2004.
Deliverable: Tech memo summarizing completed and proposed developments affected by lowering of State mobility standard in the SMI area.
Report on the development s consistency with policies in the Oregon Highway Plan.
Timeline: Complete by end of second quarter FY 2004.
Deliverable: Tech memo summarizing consistency issues relating to Oregon Highway Plan and development in the SMI area affected by lowering of State mobility standards.
These work tasks will serve to track developments completed and proposed from the time when the lowering of mobility standards occurred (December 2000) until the second quarter of FY 2004 (December 2003). Further monitoring will be required on a periodic basis until the construction of the SMI. Staff proposes to continue this monitoring on an annual basis beginning in FY 2005.
Task two of this action has been addressed with the completion of this document.
2004 Update:
According to the City, no comprehensive plan or zoning map amendments have been approved since Alternative Measures were approved.
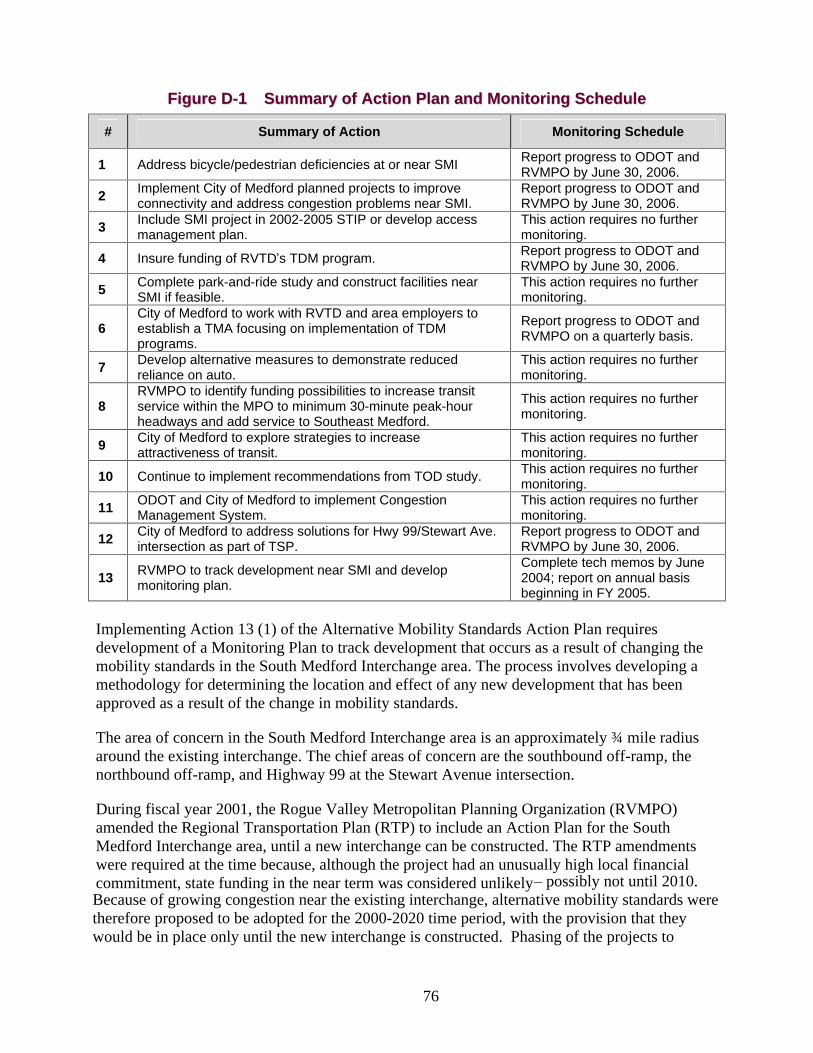
76
FFiigguurree DD--11 SSuummmmaarryy ooff AAccttiioonn PPllaann aanndd MMoonniittoorriinngg SScchheedduullee
# Summary of Action Monitoring Schedule
1 Address bicycle/pedestrian deficiencies at or near SMI Report progress to ODOT and RVMPO by June 30, 2006.
2 Implement City of Medford planned projects to improve connectivity and address congestion problems near SMI.
Report progress to ODOT and RVMPO by June 30, 2006.
3 Include SMI project in 2002-2005 STIP or develop access management plan.
This action requires no further monitoring.
4 Insure funding of RVTD s TDM program. Report progress to ODOT and RVMPO by June 30, 2006.
5 Complete park-and-ride study and construct facilities near SMI if feasible.
This action requires no further monitoring.
6 City of Medford to work with RVTD and area employers to establish a TMA focusing on implementation of TDM programs.
Report progress to ODOT and RVMPO on a quarterly basis.
7 Develop alternative measures to demonstrate reduced reliance on auto.
This action requires no further monitoring.
8 RVMPO to identify funding possibilities to increase transit service within the MPO to minimum 30-minute peak-hour headways and add service to Southeast Medford.
This action requires no further monitoring.
9 City of Medford to explore strategies to increase attractiveness of transit.
This action requires no further monitoring.
10 Continue to implement recommendations from TOD study. This action requires no further monitoring.
11 ODOT and City of Medford to implement Congestion Management System.
This action requires no further monitoring.
12 City of Medford to address solutions for Hwy 99/Stewart Ave. intersection as part of TSP.
Report progress to ODOT and RVMPO by June 30, 2006.
13 RVMPO to track development near SMI and develop monitoring plan.
Complete tech memos by June 2004; report on annual basis beginning in FY 2005.
Implementing Action 13 (1) of the Alternative Mobility Standards Action Plan requires development of a Monitoring Plan to track development that occurs as a result of changing the mobility standards in the South Medford Interchange area. The process involves developing a methodology for determining the location and effect of any new development that has been approved as a result of the change in mobility standards.
The area of concern in the South Medford Interchange area is an approximately ¾ mile radius around the existing interchange. The chief areas of concern are the southbound off-ramp, the northbound off-ramp, and Highway 99 at the Stewart Avenue intersection.
During fiscal year 2001, the Rogue Valley Metropolitan Planning Organization (RVMPO) amended the Regional Transportation Plan (RTP) to include an Action Plan for the South Medford Interchange area, until a new interchange can be constructed. The RTP amendments were required at the time because, although the project had an unusually high local financial commitment, state funding in the near term was considered unlikely possibly not until 2010. Because of growing congestion near the existing interchange, alternative mobility standards were therefore proposed to be adopted for the 2000-2020 time period, with the provision that they would be in place only until the new interchange is constructed. Phasing of the projects to

77
achieve the standards was proposed to coincide with the STIP update process so that, when the new interchange project was included in the STIP. The measures would cease.1 The interchange project was included in the 2002-2005 STIP, with construction anticipated to be completed in 2007.
The City s Transportation System Plan includes access management plan includes a discussion of the access management conditions in the vicinity of the South Medford Interchange. As a condition of receiving OTIA funding for the interchange, the City is required to develop land use and subdivision ordinances that address access control measures and signal spacing standards consistent with the functional classification of roads, and standards to protect the future operation of state highways. Progress in developing these ordinances must be made prior to contracting for interchange construction. Draft access management and signal spacing standards are currently under development by the City s Public Works Department.
Tracking development related to the revised mobility standards was identified in the RVMPO s FY2004 Unified Planning Work Program (UPWP). The work was to be done according to the following methodology:
Collect documentation (applications, etc.) associated with any developments potentially affected by a lowering in the mobility standard at the SMI, summarizing completed and proposed developments affected by lowering of State mobility standard in the SMI area.
Report on the development s consistency with policies in the Oregon Highway Plan, summarizing consistency issues relating to Oregon Highway Plan and development in the SMI area affected by lowering of State mobility standards.
The Medford City Planning staff reported that no new developments have been approved that required application of the alternative mobility standards established in December 2000. Staff indicated that the only developments affected by the standards are those that require zone changes to increase the intensity of development, such as higher density residential or increased development in commercial or industrial zones. No such zone changes have been approved.
Monitoring will continue on an annual basis until construction is completed.

78
AAppppeennddiixx EE
TTRRAANNSSPPOORRTTAATTIIOONN PPLLAANNNNIINNGG AACCRROONNYYMMSS
AANNDD TTEERRMMSS ACT: Area Commission on Transportation ADA: Americans with Disabilities Act ADT: Average Daily Traffic AQMA: Air Quality Maintenance Area CAAA: Clean Air Act Amendments CBD: Central Business District CMAQ: Congestion Mitigation & Air Quality CO: Carbon Monoxide COATS: California Oregon Advanced Transportation Systems DLCD: Department of Land Conservation and Development EMME/2: Computerized Transportation Modeling Software EPA: Environmental Protection Agency FFY: Federal Fiscal Year: from October 1 to September 31. FHWA: Federal Highway Administration FTA: Federal Transit Administration FTZ: Foreign Trade Zone FY: Fiscal Year: (Oregon state fiscal year from July 1 to June 30) GCP: General Corridor Planning GIS: Geographic Information Systems HOT: High Occupancy Toll lane with extra charge for single occupants HOV: High Occupancy Vehicle lane for vehicles with more than one occupant HPMS: Highway Performance Monitoring System I/M or I & M: Inspection and Maintenance Program for emissions control ISTEA: Intermodal Surface Transportation Efficiency Act (1991), replaced by
TEA-21, the Transportation Equity Act for the 21st century, expired in
2003 ITS: Intelligent Transportation Systems JJTC: Jackson-Josephine Transportation Committee

79
LOS: Level of Service, a measure of traffic congestion from A (free-flow) to F (grid-lock)
LRT: Light Rail Transit, self-propelled rail cars such as Portland s MAX MIS: Major Investment Study MOU: Memorandum of Understanding MPO: Metropolitan Planning Organization, a planning body in an urbanized area
over 50,000 population which has responsibility for developing transportation plans for that area
MTIP: Metropolitan Transportation Improvement Program (same as TIP) NAAQS: National Ambient Air Quality Standards NARC: National Association of Regional Councils NHS: National Highway System NPTS: Nationwide Personal Transportation Survey NTI: National Transit Institute OAR: Oregon Administrative Rules ODFW: Oregon Department of Fish and Wildlife ODOT: Oregon Department of Transportation ORS: Oregon Revised Statutes OTC: Oregon Transportation Commission, ODOT s governing body OTP: Oregon Transportation Plan PC: MPO Policy Committee PL Funds: Public Law 112, Federal Planning Funds PM 10: Particulate Matter of less than 10 Micrometers PM2.5: Particulate Matter of less than 2.5 Micrometers RTP: Regional Transportation Plan RVACT: Rogue Valley Area Commission on Transportation RVCOG: Rogue Valley Council of Governments RVIA: Rogue Valley International Airport RVTD: Rogue Valley Transportation District SIP: State Implementation Plan SMSG: Statewide Modeling Steering Group SMP: Statewide Modal Planning SOV: Single Occupancy Vehicle STA: Special Transportation Area STIP: Statewide Transportation Improvement Program STP: Surface Transportation Program TAC: Technical Advisory Committee TAZ: Transportation Analysis Zones TCM: Traffic Control Measures TDM: Transportation Demand Management TEA-21: Transportation Equity Act for the 21st Century TIP: Transportation Improvement Program TOD: Transit Oriented Development TPAU: Transportation Planning Analysis Unit TPR: Transportation Planning Rule TRADCO: Transportation Advisory Committee

80
TSM: Transportation Systems Management TSP: Transportation System Plan UGB: Urban Growth Boundary UPWP: Unified Planning Work Program US DOT: U.S. Department of Transportation VMT: Vehicle Miles of Travel
Appropriation - Legislation that allocates budgeted funds from general revenues to programs that have been previously authorized by other legislation. The amount of money appropriated may be less than the amount authorized.
Authorization - Federal legislation that creates the policy and structure of a program including formulas and guidelines for awarding funds. Authorizing legislation may set an upper limit on program spending or may be open ended. General revenue funds to be spent under an authorization must be appropriated by separate legislation.
Capital Costs - Non-recurring or infrequently recurring cost of long-term assets, such as land, buildings, vehicles, and stations.
Conformity Analysis - A determination made by the MPOs and the US DOT that transportation plans and programs in non-attainment areas meet the purpose of the SIP, which is to reduce pollutant emissions to meet air quality standards.
Emissions Budget - The part of the SIP that identifies the allowable emissions levels for certain pollutants emitted from mobile, stationary, and area sources. The emissions levels are used for meeting emission reduction milestones, attainment, or maintenance demonstration.
Emissions Inventory - A complete list of sources and amounts of pollutant emissions within a specific area and time interval (part of the SIP).
Exempt / Non-Exempt Projects - Transportation projects which will not change the operating characteristics of a roadway are exempt from the Transportation Improvement Program conformity analysis. Conformity analysis must be completed on projects that affect the distance, speed, or capacity of a roadway.
Federal-aid Highways - Those highways eligible for assistance under Title 23 of the United States Code, as amended, except those functionally classified as local or rural minor collectors.
Functional Classification - The grouping of streets and highways into classes, or systems according to the character of service that they are intended to provide, e.g., residential, collector, arterial, etc.
Key Number - Unique number assigned by ODOT to identify projects in the TIP/STIP.
Maintenance - Activities that preserve the function of the existing transportation system.

81
Maintenance Area - Any geographical region of the United States that the EPA has designated (under Section 175A of the CAA) for a transportation related pollutant(s) for which a national ambient air quality standard exists. This designation is used after non-attainment areas reach attainment.
Mobile Sources - Mobile sources of air pollutants include motor vehicles, aircraft, seagoing vessels, and other transportation modes. The mobile source related pollutants of greatest concern are carbon monoxide (CO), transportation hydrocarbons (HC), nitrogen oxides (NOx), and particulate matter (PM10). Mobile sources are subject to a different set of regulations than are stationary and area sources of air pollutants.
Non-attainment Area - Any geographic region of the United States that the EPA has designated as non-attainment for a transportation related pollutant(s) for which a national ambient air quality standard exists.
Regionally Significant From OAR 340-252-0030 (39) "Regionally significant project" means a transportation project, other than an exempt project, that is on a facility which serves regional transportation needs, such as access to and from the area outside the region, major activity centers in the region, major planned developments such as new retail malls, sports complexes, etc., or transportation terminals as well as most terminals themselves, and would normally be included in the modeling of a metropolitan area's transportation network, including at a minimum: (a) All principal arterial highways; (b) All fixed guideway transit facilities that offer an alternative to regional highway travel; and (c) Any other facilities determined to be regionally significant through interagency consultation pursuant to OAR 340-252-0060.
3C - Three C s = continuing, comprehensive, and cooperative - This term refers to the requirements set forth in the Federal Highway Act of 1962 that transportation projects in urbanized areas be based on a continuing, comprehensive transportation planning process carried out cooperatively by states and local communities. ISTEA s planning requirements broaden the framework for such a process to include consideration of important social, environmental and energy goals, and to involve the public in the process at several key decision making points.

82
AAppppeennddiixx FF SSeelleecctteedd RReeggiioonnaall PPrroojjeeccttss
wwiitthh LLoonngg--tteerrmm PPootteennttiiaall IInnttrroodduuccttiioonn
Projects are proposed as part of the regional transportation system in a variety of ways. For new project concepts to be accepted into the RTP Tier 1 list, they must (among other considerations) be featured in an adopted local jurisdiction TSP. This Appendix was added to the Draft RTP in order to address several regional concerns about how to address possible future projects that do not yet appear, or appear only partially, in an adopted TSP and yet are still important to keep on
the radar as agencies refine their plans. In developing the County TSP, a policy and terminology were developed about Long-Term Potential corridors (LTPs); this is a method of addressing conceptual projects that may also be of value to the RTP process.
LLTTPPss
The recently adopted County TSP has a new policy:
4.2.1-M Jackson County establishes Long-term Potential (LTP) Comprehensive Plan corridor areas where planning for future road connections beyond the planning horizon of the TSP are probable.
Strategies:
a) Review LTP overlay designations at least once every ten years to determine whether protection of the corridor is still warranted based on an analysis that determines if the corridor is still a probable location for a future road connection.
b) If a road is planned at a future time within a LTP corridor, then the LTP corridor designation will be removed. The presence of an LTP designation provides no special status for planning a transportation improvement, such as the need for
exceptions to the Statewide Planning Goals.
The RTP may want to adopt a similar policy.
Where a proposed transportation connection passes through both city and county jurisdictions, coordination and consensus are required for the full project to become part of the regional transportation plan. For the City portion of a proposed new route to have any viability it must be connected to a Jackson County portion. Under RVMPO procedures, such a route, even if

83
funding were available, could not be in the Tier 1 regional project list unless the County TSP includes it in its adopted Tier 1 plan.
SSppeecciiffiicc SSeelleecctteedd LLTTPPss
Three such LTPs are addressed here; this is not necessarily an exhaustive list but addresses top concerns:
White City / I-5 Freight Mobility Study/ Seven Oaks Interchange / 140 Connector;
Jacksonville Arterial Connector Refinement Plan; and
South Stage Road Long-Term Potential Corridor.
WWhhiittee CCiittyy // II--55 FFrreeiigghhtt MMoobbiilliittyy SSttuuddyy// SSeevveenn OOaakkss IInntteerrcchhaannggee // 114400 CCoonnnneeccttoorr RReeffiinneemmeenntt PPllaann
This planning project provides the long-term strategy to provide a solution to freight issues for travel from the Seven Oaks interchange to Highway 140 and freight mobility to the White City industrial area. The refinement plan would develop recommendations for improving truck circulation between I-5 and both the White City industrial area and Highway 140. RVCOG has been conducting a freight study concurrently with Jackson County s TSP development. This freight study identifies significant needs for freight mobility improvements from both the White City industrial area and from Highway 140 to I-5. The freight needs have also been identified through several County planning processes. The desire for a good route from Klamath Falls to the Coast has been popular for several decades. Delays to trucks often occur due to congestion on Highway 62, and the out-of-direction travel required on alternative routes.
The County s TSP applies a short term and long term strategy to address these needs. The short-term strategy employs some small-scale site-specific construction projects to improve freight mobility on the existing Kirtland-Blackwell route. The short-term strategy will address some of the intersection geometry problems and turning movement issues.
However, the short-term strategy does not address the out-of-direction travel issues. The out-of-direction travel issue is especially apparent for connections to Highway 140. A direct road extension from Highway 140 to the Seven Oaks interchange would have to address severe environmental constraints (vernal pools) and Statewide Planning Goal 3. The Highway 62 Corridor Project will examine the proposed direct route, along with alternative routes.
The TSP, along with the Regional Freight study conducted by RVCOG, identified the relative underutilization of the I-5/Seven Oaks Interchange (Exit 35) by White City freight traffic. This interchange is the closest interchange to the industrial area of White City, but the existing connections do not provide a direct route to the interchange. Consequently, both the Pine Street Interchange and the North Medford Interchange carry a significant portion of total White City freight traffic. ODOT currently has a study underway to address infrastructure issues associated with the bridge over I-5 at Seven Oaks interchange. In the short term, this study will enable first phase interchange improvements that will benefit existing uses in and around the interchange.
84
In the long term, the study will become part of an integrated interchange management plan that could support development of a more direct route from the White City industrial area to the Seven Oaks Interchange, which has been identified as a long term need by the County. A corollary to this need is the terminus of Highway 140. Highway 140 is the primary connection to Klamath Falls and other destinations east of the Cascade Mountains. Currently, Highway 140 terminates at Highway 62 in White City. A direct westerly extension of Highway 140 better aligns with the Seven Oaks interchange. Thus, an improved freight connection to the Seven Oaks Interchange would also improve connectivity for I-5 traffic with destinations east of the Cascades.
JJaacckkssoonnvviillllee AArrtteerriiaall CCoonnnneeccttoorr RReeffiinneemmeenntt PPllaann
The City of Jacksonville s Transportation System Plan identifies the need for an alternative connection for through traffic on Highway 238 and contemplates a northern arterial connector being extended from the current intersection of Highway 238 and west to Pair-a-dice Ranch Road to on the north of Jacksonville. This refinement plan would define an arterial extension from Pair-a-dice Ranch Road to Highway 238 at the north edge of Jacksonville. This connection has been considered for over 40 years with both a northerly and southerly route analyzed, along with multiple internal options analyzed through the City s TSP. Either alignment would require crossing resource land, although in different proportions, outside the acknowledged urban growth boundary. Jacksonville s TSP finds that the alternative connection is needed to address both livability and capacity issues.
In reviewing Jacksonville s TSP for plan coordination, Jackson County evaluated both of these needs. Traffic volumes have not increased at the rate presumed in the original Jacksonville TSP traffic analysis. This traffic analysis was performed in 1994; therefore Jackson County considers an updated analysis is warranted.
The second need identified in Jacksonville s TSP relates to livability. Downtown Jacksonville is a unique place, not just in Jackson County, but in the entire United States. It is nationally recognized as Oregon s, most extensive and complete example of late 19th century inland commercial and mining community (National Park Service). It is flourishing in the 21st century; the historic nature of downtown Jacksonville has supported the development of a specific cluster of economic activities. Downtown Jacksonville attracts many high-end retail establishments. It is a regional entertainment destination during the summer months. It also has many fine restaurants. Downtown Jacksonville is essential to the City s overall livability in an important way. Jacksonville s TSP identifies many ways in which through traffic is detrimental to the unique character of the City. The previous Jackson County Comprehensive Plan Transportation Element recognized the need for a regional transportation route around the City of Jacksonville. In 2004, the Oregon Department of Transportation formally recognized downtown Jacksonville as one of the few Special Transportation Areas (STA) in the State. The livability needs identified in Jacksonville s TSP remain unmet at this time.
While construction of any facility is not expected to be necessary within the planning horizon, preservation and recognition of this connection is important now to protect what is likely to be a critical connection some time in the future. Delays to trucks often occur due to congestion on Highway 238 in Jacksonville. The refinement plan would develop recommendations for

85
improving truck circulation between aggregate resource areas west of Jacksonville and destination growth areas east of Jacksonville.
A significant portion of this area is currently zoned EFU and therefore is well protected from residential and commercial development under current EFU land use protections. However, this protection is not entirely complete. EFU allows for substantial structural improvements to occur when in conjunction with a farm use. Prevention of development that would be incompatible with a future transportation connection within this area would be the primary benefit of this refinement plan. Also, the statutory protection of these lands from residential and commercial development could be changed at any legislative session, in which case this refinement plan would become a vital local protection.
When the time comes to plan a project to provide the anticipated connection, the Jackson County TSP and the RTP will need to be amended to remove the refinement planinclude the arterial connector designation and replace it with a project. Until such an amendment is completed and the specified project is added to both the County TSP and the RTP, an extension of Pair-a-dice Ranch Road to Highway 238 north of Jacksonville is not a planned project. Because this refinement plan affects an area outside of an acknowledged urban growth boundary including portions of land planned for exclusive farm use, an exception to Statewide Planning Goal 3 would need to be taken and the County s TSP amended to plan a road facility in this area.
SSoouutthh SSttaaggee RRooaadd LLoonngg--TTeerrmm PPootteennttiiaall CCoorrrriiddoorr
The City of Medford s TSP contemplates South Stage Road being extended from its current terminus at Highway 99 to east of I-5, with an overcrossing of the freeway. This corridor overlay protects the area where an arterial extension of South Stage Road east of I-5 to North Phoenix Road (not including the freeway overcrossing) would be located.
This corridor overlay will protect the area necessary to connect the facility contemplated in the Medford TSP. From a connectivity standpoint, an arterial in this area would provide a well-spaced connection across I-5 and Bear Creek between the South Medford Interchange and the Fern Valley Interchange. The ongoing development in southeast Medford and northeast Phoenix is going to continually increase the need for an additional connection in this area. While construction of any facility is not expected to be necessary within the planning horizon, preservation and recognition of this connection is important now to protect what is likely to be a critical connection some time in the future.
This area is currently zoned EFU and therefore is well protected from residential and commercial development under current EFU land use protections. However, this protection is not entirely complete. EFU allows for substantial structural improvements to occur when in conjunction with a farm use. Prevention of development that would be incompatible with a future transportation connection within this corridor is the primary reason for this overlay. Also, the statutory protection of these lands from residential and commercial development could be changed at any legislative session, in which case this corridor overlay would become a vital local protection.

86
When the time comes to plan a project to provide the anticipated connection, the Jackson County TSP and the RTP will need to be amended to remove the LTP corridor designation and replace it with a project. Until such an amendment is completed and the specified project is added to both the County TSP and the RTP, an extension of South Stage Road to North Phoenix Road is not a planned project. Because this overlay protects a transportation corridor outside an acknowledged urban growth boundary across land planned for exclusive farm use, an exception to Statewide Planning Goal 3 would need to be taken and the County s TSP amended to plan a road facility in this corridor.

87
AAppppeennddiixx GG
PPUUBBLLIICC CCOOMMMMEENNTTSS AANNDD RREESSPPOONNSSEESS OONN TTHHEE RREEGGIIOONNAALL
TTRRAANNSSPPOORRTTAATTIIOONN PPLLAANN
RReeggiioonnaall TTrraannssppoorrttaattiioonn PPllaann UUppddaattee OOppeenn HHoouussee 22 FFeebb.. 2244,, 22000055
MMeeddffoorrdd PPuubblliicc LLiibbrraarryy
Approximately 45 people attended the second Open House addressing updates to the Regional Transportation Plan, the Transportation Improvement Plan and the Air Quality Conformity Determination. All of the documents were available to take with them. A brochure describing the comment process was given to people as they came in and comment forms were available.
Copies of the draft Regional Transportation Plan, Transportation Improvement Program and Air Quality Conformity Determination were available for everyone to take. Also, people were informed that all draft documents and maps were posted on the RVMPO web sit.
The event was publicized in an ad in the Mail Tribune, newspaper of record for Jackson County, a press release distributed to local media, and invitations mailed to about 300 people, including members of all RVMPO committees, all elected and appointed officials

88
from RVMPO member jurisdictions and agencies, members of transportation committees (including Fern Valley Interchange, Highway 62, and Crater Lake Highway Transportation & Land Use Study citizen committees).
RVMPO/RVCOG staff was stationed at all presentation areas to talk to participants. Open House stations and activities are described in detail below. Open House stations detail:
1. Introduction: Purpose: Orient people to the RVMPO and the Regional Plan by relating the RTP to some key projects going on now. Display included RVMPO map, photos of current projects in the current RTP, and list of RVMPO members (jurisdictions)
2. Existing Conditions station, showing the status of improvements to the following systems: airport, rail, transit oriented development.
3. RTP Proposed Tier 1 and Transportation Improvement Program Projects station, includes project list, maps of all proposed project (bike, freight, ITS, pedestrian, streets, transit) and air quality conformity findings.
Public Comments
Four formal comments were received. Original copies are in RVMPO files.
# Comment Received MPO Response
1.
Regarding future improvements to Foothills Road, any improvements should include the Cedar Links Drive intersection. The angle of the existing intersection impedes visibility and can be difficult to drive.
Noted.
2. Build underground pedestrian tunnels in Jacksonville to provide access to old Chinese mining operations.
Noted. More likely to be funded through tourism project than transportation.
3. Increase RVTD hours of service to Jacksonville; add Eagle Point service; use double-decker buses for tourism.
Increased service hours to Jacksonville will require additional funding beyond the estimates of this Plan. Eagle Point opted out of the RVTD district. Tourism buses

89
# Comment Received MPO Response also require additional funding.
4. Build park-and-ride lots at all new interchanges.
This RTP contains a new policy, 6.B-6 Local governments and ODOT shall plan
park and ride facilities near transit routes and major transportation connections to encourage transit and shared rides to discourage single occupancy vehicles.
5.
CCOOMMMMEENNTTSS BBYY PPOORRTTEERR LLOOMMBBAARRDD OONN TTHHEE RRVVMMPPOO TTIIPP,, aanndd RRTTPP ssuubbmmiitttteedd aatt tthhee MMaarrcchh 1155 PPAACC mmeeeettiinngg
The following tables are summary of my assessment of the street projects submitted to the RVMPO Public Advisory Council. I have assessed each project by the MPO Goals and Policies. The projects which could not meet any Goals or Policies was listed under Non-Goal or Policy, Increase VMT or Lack of Benefits. These are based on my understanding of the project. But if each jurisdiction would indicate the goal and policy to be accomplished by each project, then assessment would be much easier and more accurate. Also, there should be a balance of goals and policies among the projects to indicate that all goals and policies are being met. The balance of the street improvement program would depend on the size and type of the jurisdiction. For example Jackson County and ODOT might be more emphasis to freight and less to safety policies than the cities. Also, some cities listed maintenance projects more than others.
Also, I have included the percent of projects by various goals and policies to evaluate the balance in each jurisdiction. The results are discussed after each table for TIP and RTP projects.
As discussed in RTP Chapter 4, the development of the RTP and TIP projects is based primarily on local TSPs and ODOTs STIP. This is because the funding for these projects is not con- trolled by the MPO but by these other agencies. In the few cases where regional funding is available (STP, CMAQ are primary examples), the MPO sets up a project specific selection process with scoring criteria.
A good deal of funding simply goes to preserving the existing system, a priority goal.
Porter Lombard s analysis, coupled with the discussion it triggered in the March 2005 PAC meeting, are at the heart of the regional transportation planning process and address its fundamental question
how does a regional transportation coordinating agency help to shape regional transportation investment

90
# Comment Received MPO Response
RVMPO RTP Street System Project List by Goals and Policies, FFY 2006-2030
Project RTP Nos. and % of total projects by jurisdiction. Goal 2, Policy 2-2. Safety (and Calming Methods).
Ashland: 101, 118, 120-123, 131-135, 138, 142-151, 153, 154=63% Jacksonville: 400, 401=100% Medford: 502-510, 515, 517-530, 535, 541, 544-546, 548, 551, 553,
556, 557, 560, 566, 572-574, 577, 595=44% Phoenix: 600-624=100% Talent: 700-703, 711-716, 718=48% Jackson County: 808, 810-813, 816, 817, 819, 821, 823-828, 831-834,
836-847, 849, 850=67% ODOT: 900, 907. 910. 911, 913-915, 917, 921-925, 927, 928, 930-
932=44% Goal 3 & Policies 6C, 7-1, & 8-2 Reduced VMT (Vehicle Miles Traveled)
Ashland: 101, 118, 131-135, 138, 142-151, 153, 154=53% Central Point: 202-206, 210-215, 217, 219-226, 228=67% Eagle Point: 309, 314, 316=12% Jacksonville: 400, 401=100% Medford: 502-507, 515, 517-530, 535, 544, 545, 547, 548, 551, 556,
557, 560, 566, 577, 595=32% Phoenix: 600-624=100% Talent: 700-703, 711-714, 716, 718=47%
Goal 3 cont. Jackson County: 808, 810-812, 815-817, 819-821, 823-826, 838=27% ODOT: 900, 907, 910, 914=10%
Goal 4, Policy 4-4, Street and Bridge Maintenance.
AAsshhllaanndd:: 110022--111177,, 11221166,, 113377,, 114400==3322%%
priorities? Under the TPR, the local TSPs must be consistent with the regional plans, although no timetable is set for accomplishing this and no apparent penalties exist for failure.
For this RTP and TIP the projects cannot be revised at this late date; for future RTPs and TIPs the RVMPO will seek to work with local jurisdictions to ensure that their TSP updates more closely reflect the RTP goals and policies and that they consider and explain how each proposed project meets those goals and policies, before adopting each.

91
# Comment Received MPO Response TTaalleenntt:: 770077--771100,, 771199,,772200,,772244==3300%%
OODDOOTT:: 990066,, 990088,, 990099==88%%
GGooaall 66,, RReedduuccttiioonn ooff SSOOVV ((SSiinnggllee OOccccuuppaannccyy VVeehhiiccllee)) RReelliiaannccee
None Goal 8, Policy 8-2 CMAQ PM10
Ashland: 100, 124, 125=11% Central Point: 200, 201=7% Medford: 500, 501, 509, 510=8% Talent: 704, 705=10% Jackson County: 800=2%
GGooaall 1100,, PPoolliiccyy 1100--22 EEccoonnoommiicc FFaacciilliittiieess aanndd FFrreeiigghhtt MMoovveemmeenntt
Ashland: 139=2% Central Point: 207, 209, 218=13% Eagle Point: 305, 309=8% Medford: 531, 534, 536, 539, 540, 542, 543, 550, 555, 558, 562-570,
572, 575-576=20% Talent: 715, 717, 722=14% Jackson County: 801-803, 805, 808, 813, 836, 837=15% ODOT: 901-905, 919, 920, 922-925, 927, 928, 930-932=44%
Non-Goal or Policy, Increase VMT or Lack of Benefits. Ashland: 119, 127-130, 136, 141, 152, 155=21% Central Point: 208, 216, 227=10% Eagle Point: 300-304, 306-308, 310-313, 315, 317-319=64% Medford: 511-514, 516, 532, 533, 537, 538, 549, 552, 554, 559, 561,
571, 578-594, 596=35%

92
# Comment Received MPO Response
Talent: 721=5% Jackson County: 804, 806, 807, 809, 814, 822, 829, 830, 835, 840=19% ODOT: 912, 916, 918, 926, 929=13%
Results and Discussion: 1. Similar results and discussion for the TIP projects were found
among the jurisdictions for RTP. 2. There were generally an increase percentage of non-goal projects
among the jurisdictions than for short-term projects. Talent had listed several projects for rebuilding or upgrade streets without mentioning sidewalks or bike lanes which were placed under non-goal projects.
3. Very few or no calming projects were listed for neighborhoods by any of the jurisdiction. Medford listed only 2 or 3 projects for calming. Therefore I recommend an increase listing of these projects for all jurisdictions. The term calming should be mentioned in Goal 2 as one of a policy.
4. Eagle Point should be required to reduce the non-goal projects in the future.
5. Eagle Point, Medford, Jackson County, and ODOT should be required to increase the percentage of VMT reduction TIP and RTP projects.
6. Maintenance projects should be listed separately or should be listed uniformly among the jurisdictions.
6.
Various discussions from the PAC: David Chapman asked about the 5 percent reduction in VMT that was part of the last RTP and would like to know how close we are, and asked that the RTP address that.
David Chapman commented that there will have to be a public transportation plan that works. Kay Harrison noted that one year RVTD voted against the
The expanded RTP Appendix C addresses this in some depth.
The RTP Transit Chapter discusses the fact that RVTD needs a long-term stable funding base in order to expand service to

93
# Comment Received MPO Response regional plan and took a lot of criticism for it.
David Chapman gave his opinion that the criteria pay lip service to the wrong things.
Glen Anderson commented that the places where traffic is moving successfully are achieving this through building big freeways rather than by TODs and pedestrian oriented development. He has researched this and hasn t found examples of success without major dependence on freeways. This approach to regional transportation problems it is never discussed here; it gobbles up huge amounts of land so it violates many of our principles.
a level that will make it competitive with driving. It appears this conclusion has already triggered appropriate discussions about transit funding strategy.
The RVMPO staff concurs that a good highway system is a primary component of the regional transportation system. More trips are made by road and freeway than by any other mode. Much of the spending on the regional transportation system if for road and freeway improvements; however,
RVMPO staff concur that the PAC is raising excellent questions and that in laying out the process and timeframe for the next RTP and TIP updates, more PAC involvement will be scheduled. There will be follow-up discussion with the PAC as to how best to organize this.

94
# Comment Received MPO Response
Mike Montero said we the PAC could play a more constructive and useful role in RTP development if they could receive draft information earlier and incrementally, in particular the Tier I list. The PAC needs enough time to closely examine all of the proposed projects. Jim Roos concurred, suggesting the PAC needs more of a foundation from which to make recommendations. There was general agreement that during plan development phases of the RVMPO s work, the PAC should meet more often. There needs to be more explanation of what the projects are and what each will achieve. RVMPO staff was asked to provide a primer on how the various regional planning documents are crafted; which ones are just compliance documents and which allow for creative vision to be developed.
Mike move Jim second a recommendation to the Policy Committee:
Well in advance of the next RTP, TIP and AQCD updates, that the schedule for PAC meetings be adjusted and the PAC be provided data well in advance so that the PAC can be actively engaged in shaping the plan.
7.
Chris Haynes of Sims Cycle commented:
Thank you for the opportunity to review and comment on the Regional Transportation Plan.
I fully support the plan goals to decrease the use of single occupancy vehicles and increase the use of alternative, more efficient transportation, like walking, biking, and use of public transit. I would like to provide additional support for several items in the plan.
The current Jackson County practice of chip-sealing road surfaces makes walking and cycling extremely difficult and dangerous for several years after chip seal application. Techniques exist to increase the lifecycle of the chip seal
Staff has met with Mr. Haynes and other members of the Jackson County Bicycle Committee and plan to continue the dialog with bike-ped groups to ensure their ideas and issues are addressed and that transportation decision-makers gain a better understanding of bike-ped. Issues.

95
# Comment Received MPO Response product and improve the road surface for cycling and walking. This includes use of significantly smaller aggregate, much more aggressive compactive effort following aggregate application, and the use of pre-coated aggregates. The Plan mentions the need for improved chip sealing practice and I strongly support these alternative techniques.
Intersections exist in Medford and Jacksonville where automobile traffic is facilitated but pedestrian and bicycles must go out of their way or are put at risk. Not all of these have been identified but this plan should encourage the responsible jurisdictions to have a process in place to identify and improve these intersections on an on-going basis with priority based on meeting the needs of pedestrians and cyclists.
The Bear Creek Greenway will connect Central Point through to Ashland by the end of this summer and is a wonderful alternative transportation route. Plans are underway to extend this Greenway all the way to Grants Pass. However, this facility cannot become part of the transportation system without effective means of accessing it from east and west. The Regional Transportation Plan addresses this concern and jurisdictions should be strongly encouraged to give priority to projects that complete bicycle and pedestrian improvements that provide east west linkages to the Bear Creek Greenway.
Thank you for your attention to these issues.
8.
Rick Berlet of Siskiyou Velo commented:
I am the current president of the Siskiyou Velo Club, a group of about 400-450 cyclists in the Rogue Valley. We are very active in sponsoring recreational rides, promoting bicycle commuting, educating new riders on good safety and cycling habits, and generally advocating what we feel are important programs, to the local authorities, which we feel will increase the bicycling population and improve its safety. I was planning to attend the meeting today, but an
See above.

96
# Comment Received MPO Response unexpected delay in getting my car out of the repair shop made it impossible to get to the meeting on time (my cycling legs were worn out as well).
In any event, I have read the 2002 RTP in considerable detail, and though there are many references to the needs of cyclists in this report, I would like to focus on three philosophical guidelines, from a cyclist s perspective, that would vastly improve the safety of cycling in the Valley, and encourage the growth of the bicycle-riding population:
1. Road Surfaces We are aware that there are many financial constraints that prohibit the use of high-density asphalt on the secondary roads of the County. However, we would strongly encourage the use, on the most heavily traveled cycling routes (we could easily identify these for you), of surfacing materials more conducive to cycling than the coarse chip seal currently used in most resurfacing projects. Alternatively, a resurfacing process which would create a smoother surface on a two-foot margin on either side of the road would be satisfactory. The rougher surfaces are very uncomfortable, can actually lead to loss of control on occasion, and, in fact, deter bicycle traffic.
2. Through Right Turns Oregon is, based on my discussions with ODOT, perhaps the only state in the US to allow the through oncoming traffic, and even more dangerously, the through right turn without stopping at selected intersections. Though signs are posted, on some, but not all, intersections using this signage, to alert motorists and cyclists that oncoming traffic does not have to stop, these signs do not alert one to the threat from the right. I, personally, have been nearly caught in this trap, and I know many others that have had near misses with cars because of it. When one approaches these intersections, and sees the fine print of the warning sign, the focus shifts to the oncoming traffic. When it is clear this traffic is not turning left, to cut off one s advance, one proceeds, only to be side-swiped by traffic from the right

97
# Comment Received MPO Response that very obviously (but not effectively) has a stop sign. This is just horrendously dangerous, and all of these intersections should be eliminated from both urban and rural settings. They are not used elsewhere in the states, the traffic engineers with whom I have conferred fully acknowledge their inherent hazards, and, with the possible exception of the most urbanized areas, no person is in such a hurry that the modest pick-up in traffic throughput is worth the hazard to other cars (particularly those from out-of-state) and cyclists.
3. Bikeways
I have attended several meetings on transportation planning, here in Oregon, and in my original home in the Chicago suburbs. It is very common and understandable that planners, not intimately familiar with the milieu of cycling, conclude that a bikeway, reserved (as they rarely are) for the exclusive use of cyclists, is a substitute for a bike lane on a parallel roadway. First of all, almost all bikeways are multi-use, and therefore not entirely satisfactory for
bicycle commuting they are slow, potential obstacles (pedestrians, skateboarders, runners, roller-bladers, etc.) lurk around every corner, and their surfaces are often unreliable. Secondly, at best these bikeways are only good for a portion of a trip or recreational ride, unless one sets out just to ride the bikeway a relatively infrequent type of usage. So, we would plead that the concept of substitution bikeway for bike lane
be stricken from the planning process as a viable strategy .
I hope these thoughts are useful to your efforts. Naturally, I would be happy to provide further input at any time. Just give me a call.
9. Mike Montero spoke at the Public Hearing in support of the plans. Noted.

98
AAppppeennddiixx HH
AAGGEENNCCYY CCOOMMMMEENNTTSS AANNDD RREESSPPOONNSSEESS OONN TTHHEE RREEGGIIOONNAALL
TTRRAANNSSPPOORRTTAATTIIOONN PPLLAANN # Comment Received MPO Response
Front Matter
1. Check spelling of "Dorell" s name; add Gary Shipley s name; check all other names are included
Done. The original list contained voting members plus just a few other names; the final list contains all TAC e-mail recipients except for consultants, with voting members shown first.
2. Add page numbers to Table of Contents. Done. Chapter 1 -- Introduction
3.
Figure 1-4, RTP Project List Summary show Jacksonville Arterial Connector project and include $6m cost in Jacksonville Tier 2
Done. Tier 2 will show 1 project at $6m and a new Appendix F Selected Regional Projects with
Long-term Potential will discuss the County portion and map the project.
Chapter 3 Guiding Principles

99
# Comment Received MPO Response
4.
Proposed New Policy 1-4: Local jurisdictions should plan projects with appropriate space reserved for current and future multi-modal transportation infrastructure connections required to create adequate access for the project.
Proposed New Policy 1-5: The RVMPO establishes Long-term Potential (LTP) corridor areas where planning for future road connections beyond the planning horizon of the TSP are probable.
Approved by Policy Committee for inclusion; added to Chapter 3
Chapter 5 Forecasts
5.
The Rogue Valley Transportation District (RVTD) requests the Regional Transportation Plan (RTP) to include information on world energy supplies to forecast the effects that a fluctuation in supplies might cause on the local transportation system.
The Energy Information Administration (EIA) housed within the Federal Department of Energy presents a forecast and analysis of US energy supply, demand, and prices through 2025. World crude oil production is expected to drop by 18% between 2000 and 2025 (Appendix A Reference Case Forecast, Table A1; Total Energy Supply and Disposition Summary). Earth's endowment of conventionally reservoired crude oil is a large but finite volume. Production from it may well peak within this century. All or very nearly all of Earth's prolific petroleum basins are believed identified and most are partially to near-fully explored. All or nearly all of the largest oil fields in them have already been discovered and are being produced. Production is indeed clearly past its peak in some of the most prolific basins (John H. Wood, Gary R. Long, David F. Morehouse; Long-Term World Oil Supply Scenarios). A multitude of analysts consisting of retired petroleum industry professionals hailing from either the geologic or business side of the house, a smattering of physicists, assorted consultants, and less than a handful of economists have predicted at various times over the past two decades, and with increasing frequency, that world crude oil production would peak at times ranging from 8 to 20+ years after their forecast even with crude oil production technological advancements.
Energy cost and supply are not part of the RVMPO model this time around although staff has given some thought to this issue. The RVMPO s model s assumptions need a review from this perspective.
For example, China is making deals with Iran to tie up its oil for their use. Sadly, as we know, the Chinese are moving away from a bike culture and into a car culture. India will outstrip China's population in the first quarter of this century and they are in pursuit of oil too. Within the 20 year timeframe of the next RTP we agree that we may have passed the date at which the world's oil output peaks and begins to decline, ANWR notwithstanding (that's just a drop in the bucket - a
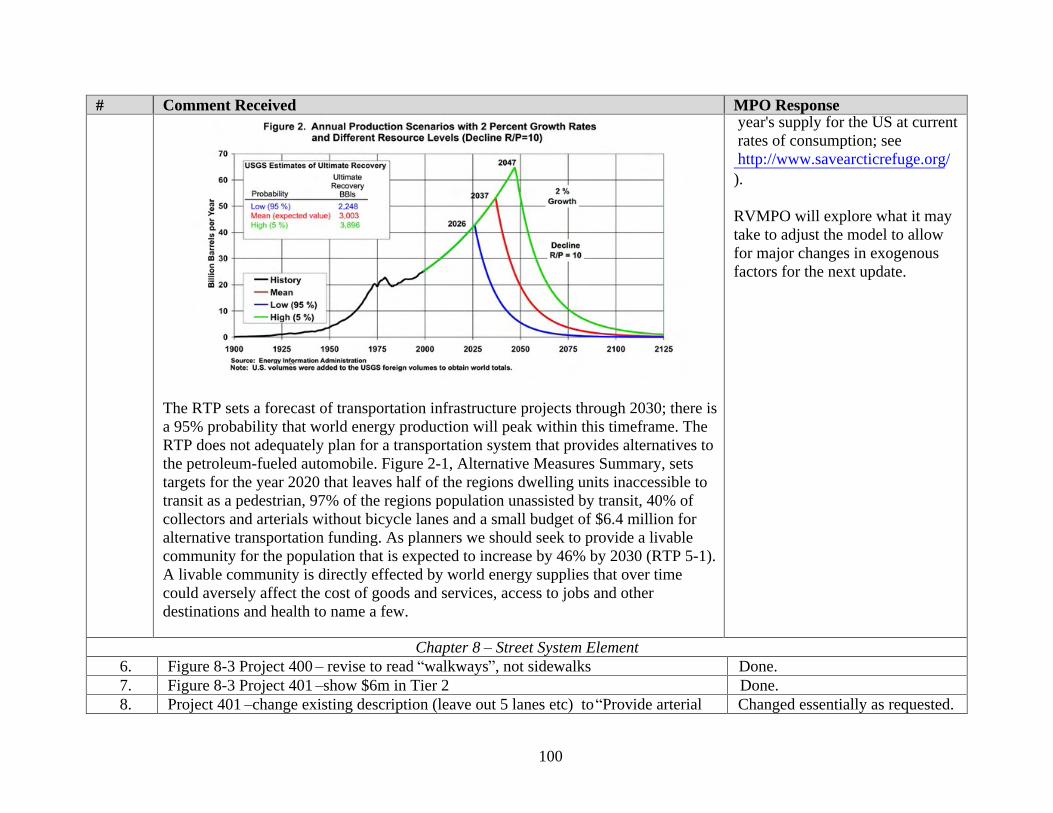
100
# Comment Received MPO Response
The RTP sets a forecast of transportation infrastructure projects through 2030; there is a 95% probability that world energy production will peak within this timeframe. The RTP does not adequately plan for a transportation system that provides alternatives to the petroleum-fueled automobile. Figure 2-1, Alternative Measures Summary, sets targets for the year 2020 that leaves half of the regions dwelling units inaccessible to transit as a pedestrian, 97% of the regions population unassisted by transit, 40% of collectors and arterials without bicycle lanes and a small budget of $6.4 million for alternative transportation funding. As planners we should seek to provide a livable community for the population that is expected to increase by 46% by 2030 (RTP 5-1). A livable community is directly effected by world energy supplies that over time could aversely affect the cost of goods and services, access to jobs and other destinations and health to name a few.
year's supply for the US at current rates of consumption; see http://www.savearcticrefuge.org/
).
RVMPO will explore what it may take to adjust the model to allow for major changes in exogenous factors for the next update.
Chapter 8 Street System Element 6. Figure 8-3 Project 400
revise to read walkways , not sidewalks Done. 7. Figure 8-3 Project 401 show $6m in Tier 2 Done. 8. Project 401 change existing description (leave out 5 lanes etc) to Provide arterial Changed essentially as requested.

101
# Comment Received MPO Response connection , change to Pair-a-Dice Ranch Rd ., OR 238 to city limits
9. It s # 400 not 401 in Jacksonville. Done. 10. Project #596
change (city share) to (city share within UGB)
Done.
11. #712 should read Highway 99 to Bear Creek Greenway (not Talent Ave). This project should be long range.
Project stays in medium range; limits have been changed.
12. Project 833 on Hanley Road should be 823. Fixed.
The City of Phoenix Transportation System Plan includes an extension of Oak Street with an overpass over the freeway, ending at Fern Valley Road. Through the RPS process, the need arose to include this project in the Regional Transportation Plan to show the transportation component of Phoenix s growth areas. Therefore, the City would like to request that the following project be included as a Tier 2 project on the City of Phoenix s RTP project list: Oak St., OR 99 to Fern Valley Rd. --Extension of Oak St, including overcrossing of I-5 at a cost of $20,000,000.
Will be included in Tier 2 as requested. $20m added to Tier 2.
16. Project #902 on ODOT list should be on County list instead (Bear Creek Bridge, Fern Valley)
The Fern Valley Bear Creek bridge project, which had for years been listed as a county project, is being folded into ODOTs Fern Valley project, so
no correction required. This was clarified at the March 9 TAC meeting.
17. Talent has a map correction Done. Chapter 12 Land Use
18. Page 12-5 Jacksonville has a TOD site. It also has a mixed use STA which serves the same function.
Included.
Chapter 18 Financial Element
19. Page 18-7 Talent, Jacksonville also have Urban Renewal funds These are included in other
local in Figure 18-5; text has been added to clarify this.
20. Page 18-10, Figure 18-3 add $6m to Tier 2 Jacksonville funds Done. 21. 18-12 add description of Jacksonville project Done.
Appendices

102
# Comment Received MPO Response
22.
23.
Comments from County Commissioner Gilmour: Show potential Route 140 Arterial Connector. Comments from Paul Wyntergreen, Jacksonville City Administrator: As with South Stage, the Jacksonville Connector has a portion of a connection clearly indicated in a City TSP, but the remainder is not in the County's. As such, the City portion is ready for Tier 2, whereas the County portions await a Goal Exception (which according to both DLCD and ODOT occurs before an EIS). How that is written into the RTP demands careful consistency.
Second, you cannot state that these two projects are "needed beyond the 20-year planning horizon". In fact, the current Jackson County Transportation Element, along the Jacksonville TSP, state that the Jacksonville connector is needed now. What is true is that the construction projects for the County portions are not ready-to-go because the planning (and accompanying goal exceptions) have not been done. As DLCD has previously stated, the goal exception for the Jacksonville Connector could be adopted now (with their support) based upon the voluminous record 1998-2-CPA, but that is up to the County if they wish to hold more hearings and generate a new record. The bottom line is that the County planning work is needed now and that fact needs to be highlighted in both plans.
Ali's agreement with the statement that the County is not comfortable with advancing the Jacksonville Connector "because of the high cost of this project relative to other County priorities" is also incorrect, due to the fact that County policy has adopted that the pursuit of "the design of, alternative locations for, and state approval of, the Highway 238 Bypass (a.k.a. the Jacksonville Connector), as one of the highest priorities for both jurisdictions."
As to the statement that the County Commissioners "weren't willing to change the project to Tier 2"; that is incorrect. I never specifically requested that action and they never specifically denied it. All the rest is supposition.
I was somewhat surprised that this is the first time the MPO had heard of the
RTP has added a new appendix Selected Regional Projects with
Long-term Potential similar to that in 2002 RTP, that describes need for and shows area of, three projects 1) Route 140 Connector to I-5; 2) Jacksonville Arterial Connector, county portion; 3) South Stage Road over I-5, County portion. Map and text will be added mirroring the County TSP.
Extensive telephone and in-person coordination and consultation among the County, City of Jacksonville and RVMPO staff took place to agree on and draft this Appendix, beyond the messages shown here for the record; however this record in RVMPO staff s opinion captures the key dialog.
Both parties sent final e-mails expressing their satisfaction with the final version of the new Appendix.

103
# Comment Received MPO Response County's LTP concept and that it will now, in the eleventh hour, be introduced to the MPO decision makers. It makes me wonder as to how much coordination between the RTP and the County TSP has actually gone on.
Lastly, I have not reviewed the attachments due to technological difficulties; I'm still waiting on a FAX. The mapping concepts sound fine; however, including a caption "pending possible future annexation" would not be appropriate since these areas are not inside UGBs and cannot be guaranteed to be so at this point in time. The handling of Hwy. 140, South Stage, and Jacksonville on an equal basis is appropriate.
Comments from Alwin Turiel, Jackson County Planning Manager: The county TSP LTP corridors are not tier 2 projects in our plan because they are not identified as absolutely needed during the 20 year planning horizon. I would expect this would also be the case with the RTP. While we've identified a probable need (from a traffic volume/capacity standpoint) at some point beyond the planning horizon, we haven't yet done the analysis to verify these projects are definitely more than a regional "nice to have." Our intention through our TSP is to actually do the planning studies that will identify whether these projects should be advanced to Tier 2 in our TSP (any maybe the RTP as well) during future updates, which we expect to come every 3-5 years. The proposed RPS transportation modeling the BOC is anxious to have done would likely give us the information we need to answer some of these questions.
Using the J'ville bypass as an example, earlier drafts of our TSP stated there was no data to support the need for the facility. J'ville objected to this language, and the county modified the discussion to indicate that "Traffic volumes have not increased at the rate presumed in the original Jacksonville TSP traffic analysis. This traffic analysis was performed in 1994; therefore an updated City analysis is warranted." The county's TSP goes on to talk about the bypass idea as being more a "livability" than a capacity issue. While quite a bit of work was apparently done on a prior attempt to add the city's preferred alignment to the county's plan, that
104
# Comment Received MPO Response work is very out of date and will need to be redone or updated. Additional alternatives analysis is essential.
In DLCD's 2003 acknowledgment order for the Jacksonville TSP they stated in numerous places that the J'ville TSP identification of the need for a bypass is only an "endorsement" of the concept for the county's consideration (see our TSP record pp. 371-381). In summary, DLCD stated that the city "lacks jurisdiction" to implement a road project outside its UGB and that the county needed to do one of two things, "either approve a goal exception for the bypass or determine that the bypass is not a needed facility over the 20-year planning horizon. A decision by the County that the bypass is not needed will create a need for the City to revise the City's TSP to be consistent with the County's TSP." The DLCD order further states; "the information contained in the (city's) TSP is not adequate for the purposes of justifying a goal exception or for identifying the proposed bypass as a planned facility... The City's TSP does not contain sufficient analysis to establish a need for a proposed bypass or to justify a goal exception."
Based on the modeling that was done for the county TSP, it was apparent a bypass is not needed to address capacity issues over the 20 year planning horizon. It may be desirable because of "livability" concerns, but it is not needed from a traffic operations standpoint. Because the County supports the City's desire to provide an alternative route for through traffic for socio-political reasons, we chose to identify the project as one of five that would likely be needed in the future beyond 20 years so as to keep it on the table. DLCD's order simply says we need to identify if the bypass is needed over the next 20 years. It doesn't stipulate that identifying it as a longer term project precludes us from addressing it (or other similar projects) in our TSP.
Finally, in response to Paul's comments regarding our concern about "advancing the Jacksonville Connector because of the high cost of this project relative to other County priorities," it should be noted that at the time the statement he quotes was added to the county's plan, the city of J'ville was not in the MPO. Now that J'ville,

105
# Comment Received MPO Response Ashland and Talent are in the MPO the county cannot unilaterally negotiate with them for transportation improvements that may require MPO money. This changes the discussion about transportation improvement prioritization and funding in a substantive way from the county's perspective.
Comments from Paul Wyntergreen: Well, this is turning into an interesting round of "he said/she said". So here's the latest "he said" rebuttal for the record.
In Ali's final comment, she stated that "it should be noted that at the time the statement he quotes was added to the county's plan, the city of J'ville was not in the MPO" (first off, it is not a statement; it is a policy). "Now that J'ville, Ashland and Talent are in the MPO the county cannot unilaterally negotiate with them for transportation improvements that may require MPO money" (secondly, the County did not negotiate this policy now; it is part of a 2001 pre-MPO Intergovernmental Agreement and doesn't obligate MPO money). "This changes the discussion about transportation improvement prioritization and funding in a substantive way from the county's perspective" (Thirdly, any changes in the county's perspective that may have occurred in staff's mind cannot abrogate a contractual agreement).
Next, as to the County "modeling" exercise referenced, it has been repeatedly noted in the record that that exercise was conducted and calculated incorrectly and therefore its results are meaningless. The data was simply not applied correctly. This "modeling" exercise was done entirely without consultation with City staff which violated Goal 2 and, had they coordinated their efforts as repeatedly requested by the City, we would have had the chance to correct those errors. Unfortunately, we still find these factual misrepresentations being disseminated as truth.
Therefore, Ali's statements that "a bypass is not needed to address capacity issues over the 20 year planning horizon" and that "it is not needed from a traffic operations standpoint" are not supported by the record, by the adopted TSP, nor by the County's current Transportation Element, Ordinance #2000-38, which states

106
# Comment Received MPO Response that "a regional transportation route around the City of Jacksonville is needed to preserve the historic structures and character of Jacksonville, and to provide safe regional transportation between Medford and the Applegate Valley." That established County finding is in the present tense, is not a "nice to have" wish as Ali characterized it, and has not been countered with a finding of "no need over the next 20 years" in the adopted TSP. Why this discussion cannot be based upon the facts, instead of spin and personal opinion is beyond me.
Thirdly, there is no State nor County separation between need as it relates to capacity and need as it relates to livability. To characterize livability needs as merely "desirable" is again an objectionable and unfortunate use of personal opinion. In fact, page 16 of the adopted County TSP states that "the livability needs identified in Jacksonville's TSP remain unmet at this time."
Whether the decision on the County TSP complies with the State's 2003 guidance is questionable. Perhaps some input from john Renz would be helpful.
Finally, my original email was submitted to two contact points in Jackson County in a timely manner and therefore should be part of the County TSP record. Written correspondence is not required to be hand delivered.
24.
DLCD has sent a letter with cautions about the LTP concept, emphasizing that while the concept is commendable; such projects have no legal standing: The Department of Land Conservation and Development notes the Regional Transportation plan for the Rogue Valley contains a new category of future project, Long-Term Potential Corridor Areas . While it is commendable for the region to plan for transportation needs beyond the planning horizon mandated for an MPO, we are concerned that the MPO and its members understand the status of such projects.
From a transportation planning standpoint these Long-Term Potential Corridor Areas have
no legal standing and may not be relied on for planning and
Noted.
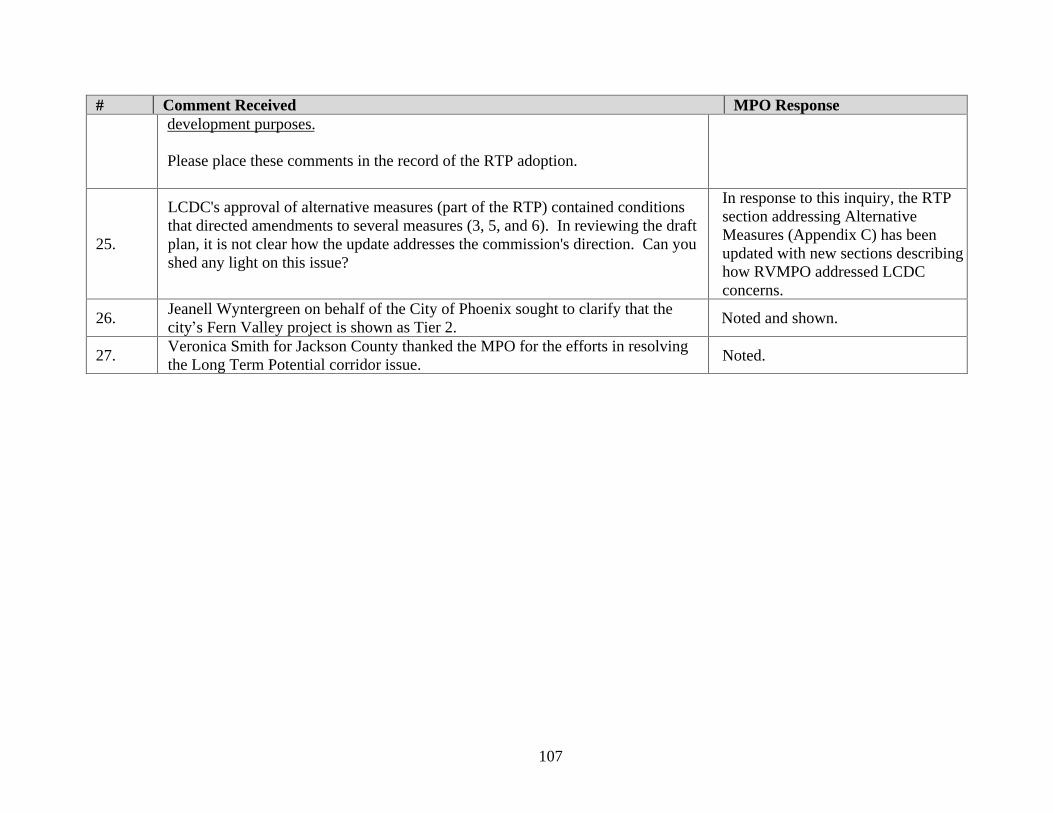
107
# Comment Received MPO Response development purposes.
Please place these comments in the record of the RTP adoption.
25.
LCDC's approval of alternative measures (part of the RTP) contained conditions that directed amendments to several measures (3, 5, and 6). In reviewing the draft plan, it is not clear how the update addresses the commission's direction. Can you shed any light on this issue?
In response to this inquiry, the RTP section addressing Alternative Measures (Appendix C) has been updated with new sections describing how RVMPO addressed LCDC concerns.
26. Jeanell Wyntergreen on behalf of the City of Phoenix sought to clarify that the city s Fern Valley project is shown as Tier 2.
Noted and shown.
27. Veronica Smith for Jackson County thanked the MPO for the efforts in resolving the Long Term Potential corridor issue.
Noted.