Field Survey of the March 28, 2005 Nias-Simeulue Earthquake and Tsunami
14
Field Survey of the March 28, 2005 Nias-Simeulue Earthquake and Tsunami JOSE C. BORRERO, 1,2 BRIAN MCADOO, 3 BRUCE JAFFE, 4 LORI DENGLER, 5 GUY GELFENBAUM, 4 BRETWOOD HIGMAN, 6 RAHMAN HIDAYAT, 7,8,14 ANDREW MOORE, 9 WIDJO KONGKO, 7 LUKIJANTO, 7 ROBERT PETERS, 4 GEGAR PRASETYA, 7,10 VASILY TITOV, 11,12 and EKO YULIANTO 13 Abstract—On the evening of March 28, 2005 at 11:09 p.m. local time (16:09 UTC), a large earthquake occurred offshore of West Sumatra, Indonesia. With a moment magnitude (M w ) of 8.6, the event caused substantial shaking damage and land level changes between Simeulue Island in the north and the Batu Islands in the south. The earthquake also generated a tsunami, which was observed throughout the source region as well as on distant tide gauges. While the tsunami was not as extreme as the tsunami of December 26th, 2004, it did cause significant flooding and damage at some locations. The spatial and temporal proximity of the two events led to a unique set of observational data from the earthquake and tsunami as well as insights relevant to tsunami hazard planning and education efforts. Key words: Tsunami, earthquake, Sumatra, subduction zone, natural hazards, hazard mitigation. 1. Introduction Just 3 months after producing the second largest instrumentally recorded earthquake in human history (STEIN and OKAL, 2005) and an associated tsunami responsible for the deaths of over 230,000 people worldwide (SYNOLAKIS and KONG, 2006,GEIST et al., 2006a), the Sumatra Subduction Zone (SSZ) pro- duced another large earthquake. On March 28, 2005 at 11:09 p.m. local time (16:09 UTC), an earthquake with moment magnitude (M w ) 8.6 occurred just a few hundred kilometers south of the most tsunami-dev- astated regions of Sumatra. The earthquake epicenter was located at approximately 2.07° N, 97.01° E (USGS) (Fig. 1). With the regional population already at a heightened sense of anxiety due to the extreme effects of the December event, this earth- quake served to send the people into outright panic. Various news stories in the popular media reported such scenes in countries affected by the December 26th, 2004 event. 1.1. Post-Event Survey When the March 28th earthquake occurred, an international team of researchers was in Jakarta preparing to begin a research cruise from Padang in Sumatra, through the islands west of Sumatra, north to Banda Aceh. The aim of the cruise was to collect tsunami field data related to the December 26th event from offshore islands and otherwise inaccessible 1 ASR Limited, Marine Consulting and Research, Raglan 3225, New Zealand. E-mail: [email protected] 2 Tsunami Research Center, University of Southern California, Los Angeles, CA 90089-2531, USA. 3 Department of Earth Science and Geography, Vassar College, Poughkeepsie, NY 12604-0735, USA. 4 US Geological Survey, Pacific Sciences Center, Santa Cruz, CA 95060, USA. 5 Department of Geology, Humboldt State University, Arcata, CA, USA. 6 Department of Earth Science, University of Washington, Seattle, WA, USA. 7 Coastal Engineering Laboratory-BPPT, Jl. Grafika 2, Yogyakarta 55281, Indonesia. 8 Present Address: Meguro Laboratory, Institute of Industrial Science, The University of Tokyo, Komaba 4-6-1, Meguro-ku, Tokyo 153-8505, Japan. 9 Department of Geology, Kent State University, Kent, OH, USA. 10 Present Address: New Zealand Institute of Geological and Nuclear Sciences, Lower Hutt, New Zealand. 11 NOAA Center for Tsunami Research, 7600 Sand Point Way, Seattle, WA 98195, USA. 12 Joint Institute for the Study of the Atmosphere and Ocean, University of Washington, Seattle, WA 98195, USA. 13 Indonesian Institute of Science, Jakarta, Indonesia. 14 Institute for Sustainability and Peace-United Nations University (UNU-ISP), Shibuya-ku, Tokyo 150-8925, Japan. Pure Appl. Geophys. 168 (2011), 1075–1088 Ó 2010 Springer Basel AG DOI 10.1007/s00024-010-0218-6 Pure and Applied Geophysics
-
Upload
independent -
Category
Documents
-
view
0 -
download
0
Transcript of Field Survey of the March 28, 2005 Nias-Simeulue Earthquake and Tsunami
Field Survey of the March 28, 2005 Nias-Simeulue Earthquake and Tsunami
JOSE C. BORRERO,1,2 BRIAN MCADOO,3 BRUCE JAFFE,4 LORI DENGLER,5 GUY GELFENBAUM,4 BRETWOOD HIGMAN,6
RAHMAN HIDAYAT,7,8,14 ANDREW MOORE,9 WIDJO KONGKO,7 LUKIJANTO,7 ROBERT PETERS,4 GEGAR PRASETYA,7,10
VASILY TITOV,11,12 and EKO YULIANTO13
Abstract—On the evening of March 28, 2005 at 11:09 p.m.
local time (16:09 UTC), a large earthquake occurred offshore of
West Sumatra, Indonesia. With a moment magnitude (Mw) of 8.6,
the event caused substantial shaking damage and land level
changes between Simeulue Island in the north and the Batu Islands
in the south. The earthquake also generated a tsunami, which was
observed throughout the source region as well as on distant tide
gauges. While the tsunami was not as extreme as the tsunami of
December 26th, 2004, it did cause significant flooding and damage
at some locations. The spatial and temporal proximity of the two
events led to a unique set of observational data from the earthquake
and tsunami as well as insights relevant to tsunami hazard planning
and education efforts.
Key words: Tsunami, earthquake, Sumatra, subduction zone,
natural hazards, hazard mitigation.
1. Introduction
Just 3 months after producing the second largest
instrumentally recorded earthquake in human history
(STEIN and OKAL, 2005) and an associated tsunami
responsible for the deaths of over 230,000 people
worldwide (SYNOLAKIS and KONG, 2006, GEIST et al.,
2006a), the Sumatra Subduction Zone (SSZ) pro-
duced another large earthquake. On March 28, 2005
at 11:09 p.m. local time (16:09 UTC), an earthquake
with moment magnitude (Mw) 8.6 occurred just a few
hundred kilometers south of the most tsunami-dev-
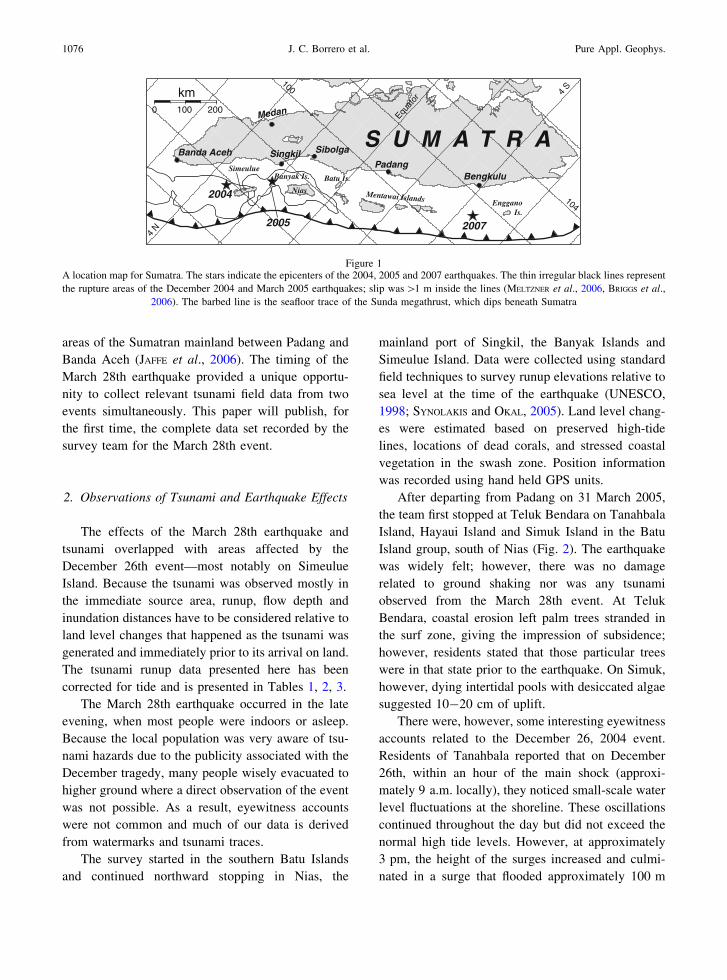
astated regions of Sumatra. The earthquake epicenter
was located at approximately 2.07� N, 97.01� E
(USGS) (Fig. 1). With the regional population
already at a heightened sense of anxiety due to the
extreme effects of the December event, this earth-
quake served to send the people into outright panic.
Various news stories in the popular media reported
such scenes in countries affected by the December
26th, 2004 event.
1.1. Post-Event Survey
When the March 28th earthquake occurred, an
international team of researchers was in Jakarta
preparing to begin a research cruise from Padang in
Sumatra, through the islands west of Sumatra, north
to Banda Aceh. The aim of the cruise was to collect
tsunami field data related to the December 26th event
from offshore islands and otherwise inaccessible
1 ASR Limited, Marine Consulting and Research,
Raglan 3225, New Zealand. E-mail: [email protected] Tsunami Research Center, University of Southern
California, Los Angeles, CA 90089-2531, USA.3 Department of Earth Science and Geography, Vassar
College, Poughkeepsie, NY 12604-0735, USA.4 US Geological Survey, Pacific Sciences Center, Santa
Cruz, CA 95060, USA.5 Department of Geology, Humboldt State University,
Arcata, CA, USA.6 Department of Earth Science, University of Washington,
Seattle, WA, USA.7 Coastal Engineering Laboratory-BPPT, Jl. Grafika 2,
Yogyakarta 55281, Indonesia.8 Present Address: Meguro Laboratory, Institute of Industrial
Science, The University of Tokyo, Komaba 4-6-1, Meguro-ku,
Tokyo 153-8505, Japan.9 Department of Geology, Kent State University, Kent, OH,
USA.10 Present Address: New Zealand Institute of Geological and
Nuclear Sciences, Lower Hutt, New Zealand.11 NOAA Center for Tsunami Research, 7600 Sand Point
Way, Seattle, WA 98195, USA.12 Joint Institute for the Study of the Atmosphere and Ocean,
University of Washington, Seattle, WA 98195, USA.13 Indonesian Institute of Science, Jakarta, Indonesia.14 Institute for Sustainability and Peace-United Nations
University (UNU-ISP), Shibuya-ku, Tokyo 150-8925, Japan.
Pure Appl. Geophys. 168 (2011), 1075–1088
� 2010 Springer Basel AG
DOI 10.1007/s00024-010-0218-6 Pure and Applied Geophysics
areas of the Sumatran mainland between Padang and
Banda Aceh (JAFFE et al., 2006). The timing of the
March 28th earthquake provided a unique opportu-
nity to collect relevant tsunami field data from two
events simultaneously. This paper will publish, for
the first time, the complete data set recorded by the
survey team for the March 28th event.
2. Observations of Tsunami and Earthquake Effects
The effects of the March 28th earthquake and
tsunami overlapped with areas affected by the
December 26th event––most notably on Simeulue
Island. Because the tsunami was observed mostly in
the immediate source area, runup, flow depth and
inundation distances have to be considered relative to
land level changes that happened as the tsunami was
generated and immediately prior to its arrival on land.
The tsunami runup data presented here has been
corrected for tide and is presented in Tables 1, 2, 3.
The March 28th earthquake occurred in the late
evening, when most people were indoors or asleep.
Because the local population was very aware of tsu-
nami hazards due to the publicity associated with the
December tragedy, many people wisely evacuated to
higher ground where a direct observation of the event
was not possible. As a result, eyewitness accounts
were not common and much of our data is derived
from watermarks and tsunami traces.
The survey started in the southern Batu Islands
and continued northward stopping in Nias, the
mainland port of Singkil, the Banyak Islands and
Simeulue Island. Data were collected using standard
field techniques to survey runup elevations relative to
sea level at the time of the earthquake (UNESCO,
1998; SYNOLAKIS and OKAL, 2005). Land level chang-
es were estimated based on preserved high-tide
lines, locations of dead corals, and stressed coastal
vegetation in the swash zone. Position information
was recorded using hand held GPS units.
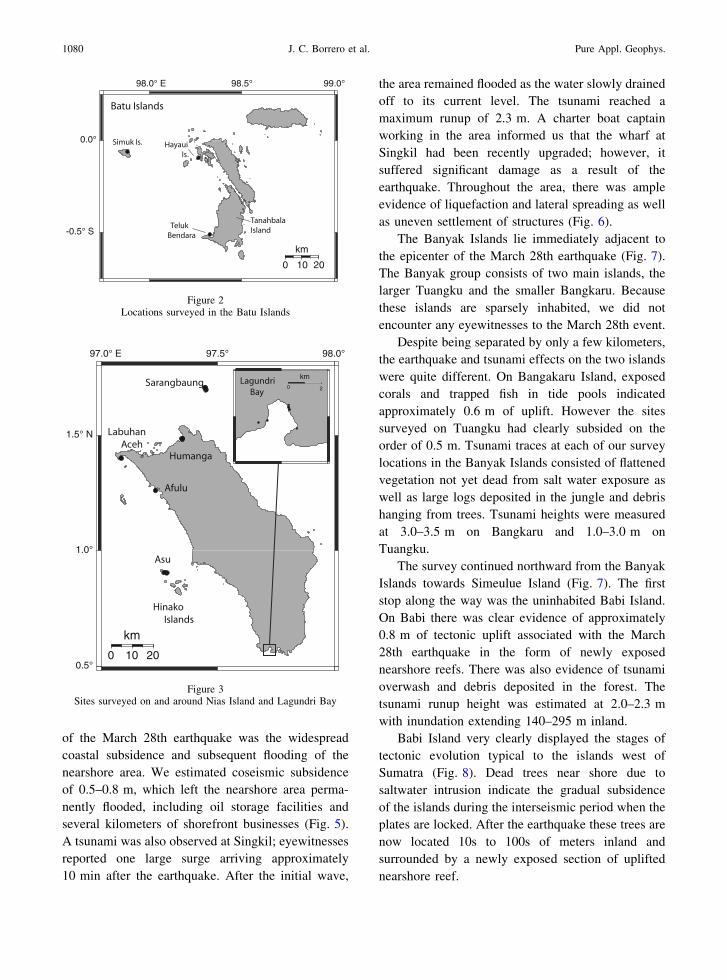
After departing from Padang on 31 March 2005,
the team first stopped at Teluk Bendara on Tanahbala
Island, Hayaui Island and Simuk Island in the Batu
Island group, south of Nias (Fig. 2). The earthquake
was widely felt; however, there was no damage
related to ground shaking nor was any tsunami
observed from the March 28th event. At Teluk
Bendara, coastal erosion left palm trees stranded in
the surf zone, giving the impression of subsidence;
however, residents stated that those particular trees
were in that state prior to the earthquake. On Simuk,
however, dying intertidal pools with desiccated algae
suggested 10-20 cm of uplift.
There were, however, some interesting eyewitness
accounts related to the December 26, 2004 event.
Residents of Tanahbala reported that on December
26th, within an hour of the main shock (approxi-
mately 9 a.m. locally), they noticed small-scale water
level fluctuations at the shoreline. These oscillations
continued throughout the day but did not exceed the
normal high tide levels. However, at approximately
3 pm, the height of the surges increased and culmi-
nated in a surge that flooded approximately 100 m
100
104
Equat
or
4 N
0 100 200
km
Banda Aceh
Medan
Singkil
Nias
Sibolga
Padang
Mentawai Islands
Bengkulu
EngganoIs.
S U M A T R A
Batu Is.Simeulue
4 S
2004
2005 2007
Banyak Is.
Figure 1A location map for Sumatra. The stars indicate the epicenters of the 2004, 2005 and 2007 earthquakes. The thin irregular black lines represent
the rupture areas of the December 2004 and March 2005 earthquakes; slip was [1 m inside the lines (MELTZNER et al., 2006, BRIGGS et al.,
2006). The barbed line is the seafloor trace of the Sunda megathrust, which dips beneath Sumatra
1076 J. C. Borrero et al. Pure Appl. Geophys.
inland with a flow depth of 0.7 m and a total runup of
1.3 m.
Residents from nearby Simuk Island also reported a
late-arriving large wave on December 26th that caused
approximately 200 m of inundation. We were not able,
however, to confirm this with additional witnesses
from the local harbor where the report originated. A
similar phenomenon was also reported at Lagundri Bay
on Nias Island (discussed in the next section). It is
interesting to note that similar observations related to
the arrival time of the December 26th tsunami were
also reported by residents of Muara Maras, located on
the Sumatra mainland south of Bengkulu (see Fig. 1).
These reports were recorded during a survey of the
September 2007 Bengkulu earthquake and tsunami
(BORRERO et al., 2009). The exact cause of the late
arrival of the largest waves has never been specifically
addressed in the open literature.
2.1. Nias and Vicinity
Continuing north, the team visited Lagundri Bay
on the southwest corner of Nias Island (Fig. 3). The
earthquake was felt very strongly at Lagundri Bay
and ground shaking was responsible for several
collapsed buildings, especially in the popular tourist
area of Sorake Beach on the west side of the bay. The
earthquake was followed by the tsunami, which
arrived just minutes after the earthquake. A maxi-
mum tsunami runup of 3.2 m and horizontal
inundation distance of up to 300 m was recorded
based on watermarks and eyewitness accounts.
According to one resident, however, there was, ‘‘No
tsunami’’– noting that after the earthquake stopped,
the sea rose up and came inland then receded, but
‘‘nothing like what happened in Aceh’’ (paraphrased
from the translation.)
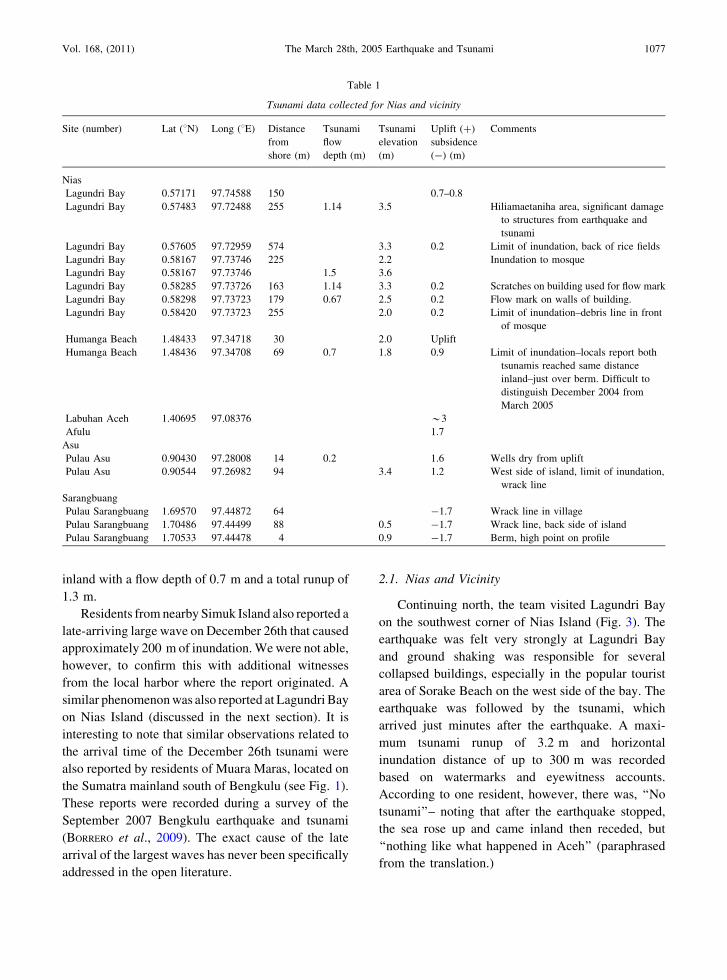
Table 1
Tsunami data collected for Nias and vicinity
Site (number) Lat (8N) Long (8E) Distance
from
shore (m)
Tsunami
flow
depth (m)
Tsunami
elevation
(m)
Uplift (?)
subsidence
(-) (m)
Comments
Nias
Lagundri Bay 0.57171 97.74588 150 0.7–0.8
Lagundri Bay 0.57483 97.72488 255 1.14 3.5 Hiliamaetaniha area, significant damage
to structures from earthquake and
tsunami
Lagundri Bay 0.57605 97.72959 574 3.3 0.2 Limit of inundation, back of rice fields
Lagundri Bay 0.58167 97.73746 225 2.2 Inundation to mosque
Lagundri Bay 0.58167 97.73746 1.5 3.6
Lagundri Bay 0.58285 97.73726 163 1.14 3.3 0.2 Scratches on building used for flow mark
Lagundri Bay 0.58298 97.73723 179 0.67 2.5 0.2 Flow mark on walls of building.
Lagundri Bay 0.58420 97.73723 255 2.0 0.2 Limit of inundation–debris line in front
of mosque
Humanga Beach 1.48433 97.34718 30 2.0 Uplift
Humanga Beach 1.48436 97.34708 69 0.7 1.8 0.9 Limit of inundation–locals report both
tsunamis reached same distance
inland–just over berm. Difficult to
distinguish December 2004 from
March 2005
Labuhan Aceh 1.40695 97.08376 *3
Afulu 1.7
Asu
Pulau Asu 0.90430 97.28008 14 0.2 1.6 Wells dry from uplift
Pulau Asu 0.90544 97.26982 94 3.4 1.2 West side of island, limit of inundation,
wrack line
Sarangbuang
Pulau Sarangbuang 1.69570 97.44872 64 -1.7 Wrack line in village
Pulau Sarangbuang 1.70486 97.44499 88 0.5 -1.7 Wrack line, back side of island
Pulau Sarangbuang 1.70533 97.44478 4 0.9 -1.7 Berm, high point on profile
Vol. 168, (2011) The March 28th, 2005 Earthquake and Tsunami 1077
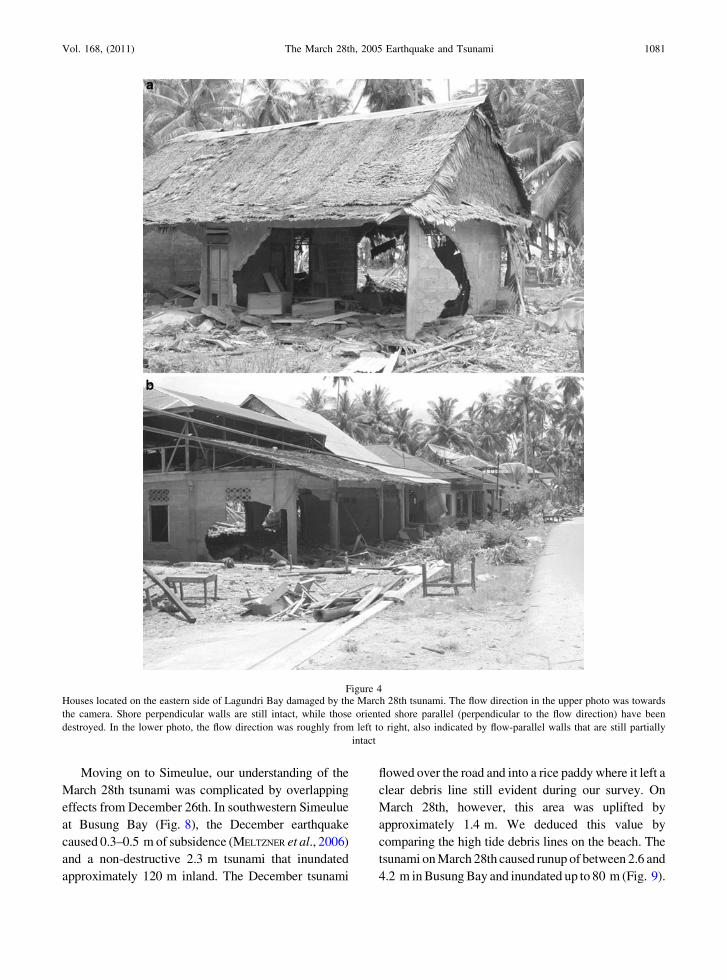
There was ample evidence of characteristic tsu-
nami damage, including destroyed walls parallel to
the shore while perpendicular walls of the same
structures remained intact (Fig. 4). Tsunami induced
scour and erosion were observed, especially in the
Sorake Beach section. Fortunately, there were no
fatalities in Lagundri; this may be because the peak
tourist season had not yet begun, so many of the
collapsed buildings used for tourist accommodation
were not occupied. We estimated coseismic uplift to
be between 0.2 and 0.8 m based on exposed reefs and
desiccated algae, which was still somewhat green,
5 days after the earthquake. Uplift at Hiliamataniha
Village, on the east side of Lagundri Bay, was
0.5–0.55 m based on the elevation difference
between high-tide marks.
From Lagundri, the survey moved to the Hinako
Island group located off the central west coast of Nias
(Fig. 3). Here, the local residents reported only
negligible tsunami effects. On Asu Island, we mea-
sured 1.2–1.6 m of coseismic uplift from the March
28th earthquake. This was based on observed changes
in the local high tide line, exposed nearshore reefs
and a stand of mangroves raised above the high-tide
line. Residents of the island were left without water
as the wells were uplifted above the water table. The
residents on the eastern side of the island did not
report any surges from the March 28th tsunami
exceeding the high tide level and there was no
evidence of a tsunami. However, there was evidence
on the western side of the island of tsunami runup of
3.4 m.
The survey continued on to the northwestern
corner of Nias. This region experienced significant
uplift as a result of the March 28th earthquake. Uplift
was estimated at 1.7 m near Afulu, 0.5–1.0 m at
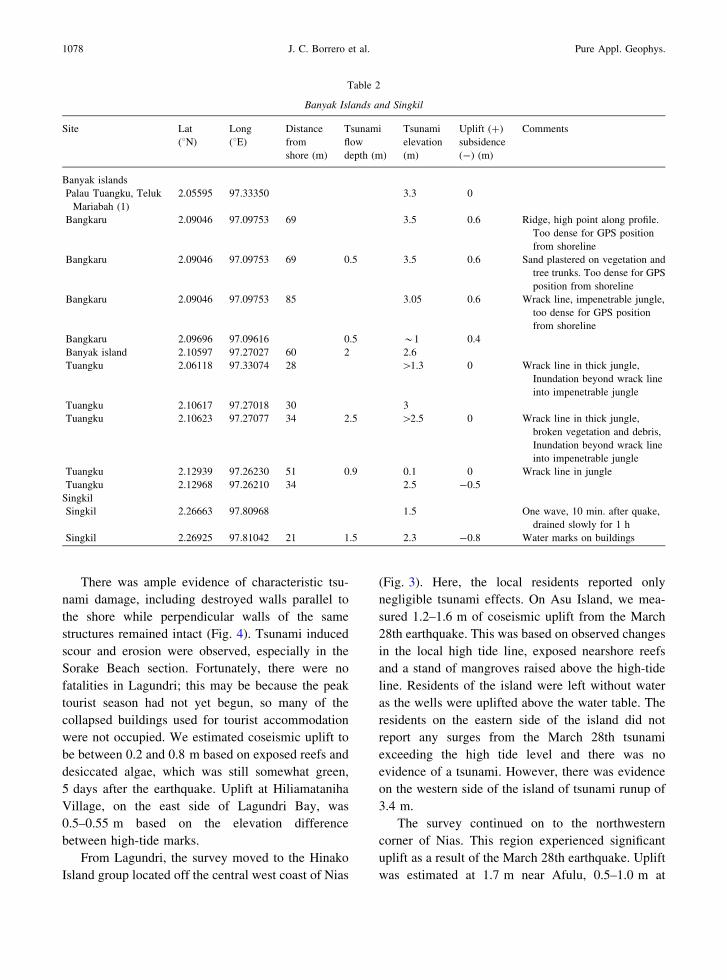
Table 2
Banyak Islands and Singkil
Site Lat
(8N)
Long
(8E)
Distance
from
shore (m)
Tsunami
flow
depth (m)
Tsunami
elevation
(m)
Uplift (?)
subsidence
(-) (m)
Comments
Banyak islands
Palau Tuangku, Teluk
Mariabah (1)
2.05595 97.33350 3.3 0
Bangkaru 2.09046 97.09753 69 3.5 0.6 Ridge, high point along profile.
Too dense for GPS position
from shoreline
Bangkaru 2.09046 97.09753 69 0.5 3.5 0.6 Sand plastered on vegetation and
tree trunks. Too dense for GPS
position from shoreline
Bangkaru 2.09046 97.09753 85 3.05 0.6 Wrack line, impenetrable jungle,
too dense for GPS position
from shoreline
Bangkaru 2.09696 97.09616 0.5 *1 0.4
Banyak island 2.10597 97.27027 60 2 2.6
Tuangku 2.06118 97.33074 28 [1.3 0 Wrack line in thick jungle,
Inundation beyond wrack line
into impenetrable jungle
Tuangku 2.10617 97.27018 30 3
Tuangku 2.10623 97.27077 34 2.5 [2.5 0 Wrack line in thick jungle,
broken vegetation and debris,
Inundation beyond wrack line
into impenetrable jungle
Tuangku 2.12939 97.26230 51 0.9 0.1 0 Wrack line in jungle
Tuangku 2.12968 97.26210 34 2.5 -0.5
Singkil
Singkil 2.26663 97.80968 1.5 One wave, 10 min. after quake,
drained slowly for 1 h
Singkil 2.26925 97.81042 21 1.5 2.3 -0.8 Water marks on buildings
1078 J. C. Borrero et al. Pure Appl. Geophys.
Humanga Bay. At Labuhan Aceh, between the two,
uplift was on the order of 3 m based on differences in
the high tide lines. Because the tsunami occurred at
night and the village at Afulu is located several
hundred meters from shore, there were no eyewit-
nesses to the tsunami. There was, however, evidence
of tsunami debris in the vegetation between the beach
and the village. We assume that this was from the
March 28th event; however, we cannot be certain that
it was not produced by a previous storm high tide or
the December 26th tsunami. At Humanga Bay there
was a clear indication of a debris line inland of any
possible high tide mark, which we interpret to have
been deposited by the March 28th tsunami. On an
uninhabited section of the northern shore of Nias,
evidence suggested a 1 m high tsunami, which we
assume was caused by the March 28th earthquake.
Northeast of Nias on Saranbaung Island, the local
residents did not observe a tsunami on either
December 26th or March 28th. However, the March
28th earthquake caused subsidence on the order of
1.7 m. This estimate was based on a small dock,
which had been previously used to offload boats and
was now completely submerged. Further evidence of
subsidence was seen in the increase in well-water
levels in the village. Water in wells was no longer
potable due to salt intrusion resulting from being
dropped below the island’s thin freshwater lens.
At Singkil, a provincial port town located on the
mainland of Sumatra (Fig. 1), the most obvious effect
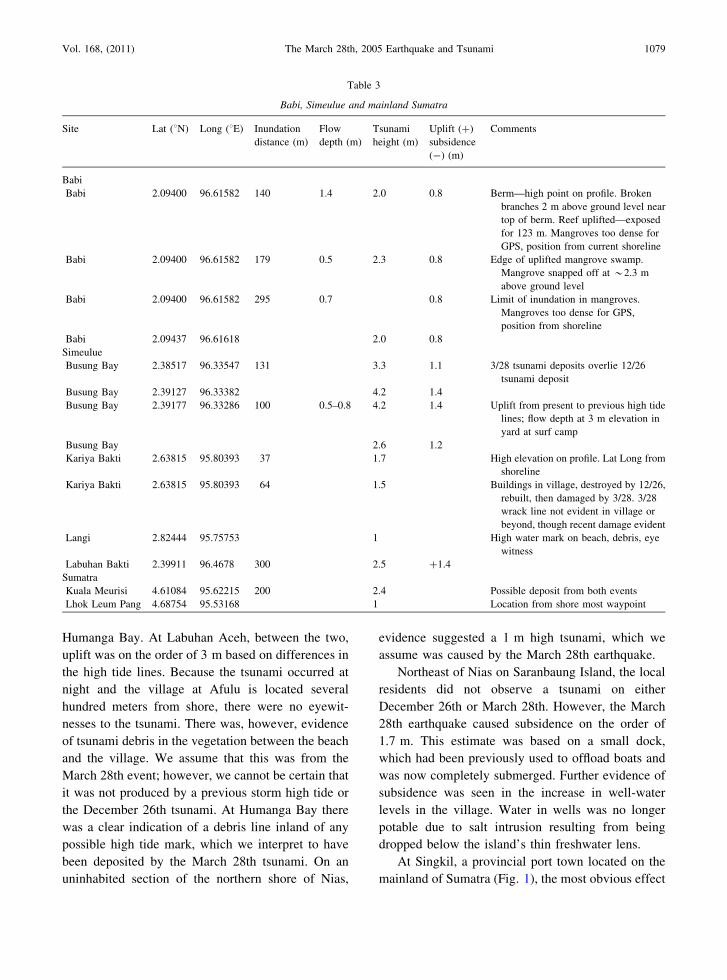
Table 3
Babi, Simeulue and mainland Sumatra
Site Lat (8N) Long (8E) Inundation
distance (m)
Flow
depth (m)
Tsunami
height (m)
Uplift (?)
subsidence
(-) (m)
Comments
Babi
Babi 2.09400 96.61582 140 1.4 2.0 0.8 Berm—high point on profile. Broken
branches 2 m above ground level near
top of berm. Reef uplifted—exposed
for 123 m. Mangroves too dense for
GPS, position from current shoreline
Babi 2.09400 96.61582 179 0.5 2.3 0.8 Edge of uplifted mangrove swamp.
Mangrove snapped off at *2.3 m
above ground level
Babi 2.09400 96.61582 295 0.7 0.8 Limit of inundation in mangroves.
Mangroves too dense for GPS,
position from shoreline
Babi 2.09437 96.61618 2.0 0.8
Simeulue
Busung Bay 2.38517 96.33547 131 3.3 1.1 3/28 tsunami deposits overlie 12/26
tsunami deposit
Busung Bay 2.39127 96.33382 4.2 1.4
Busung Bay 2.39177 96.33286 100 0.5–0.8 4.2 1.4 Uplift from present to previous high tide
lines; flow depth at 3 m elevation in
yard at surf camp
Busung Bay 2.6 1.2
Kariya Bakti 2.63815 95.80393 37 1.7 High elevation on profile. Lat Long from
shoreline
Kariya Bakti 2.63815 95.80393 64 1.5 Buildings in village, destroyed by 12/26,
rebuilt, then damaged by 3/28. 3/28
wrack line not evident in village or
beyond, though recent damage evident
Langi 2.82444 95.75753 1 High water mark on beach, debris, eye
witness
Labuhan Bakti 2.39911 96.4678 300 2.5 ?1.4
Sumatra
Kuala Meurisi 4.61084 95.62215 200 2.4 Possible deposit from both events
Lhok Leum Pang 4.68754 95.53168 1 Location from shore most waypoint
Vol. 168, (2011) The March 28th, 2005 Earthquake and Tsunami 1079
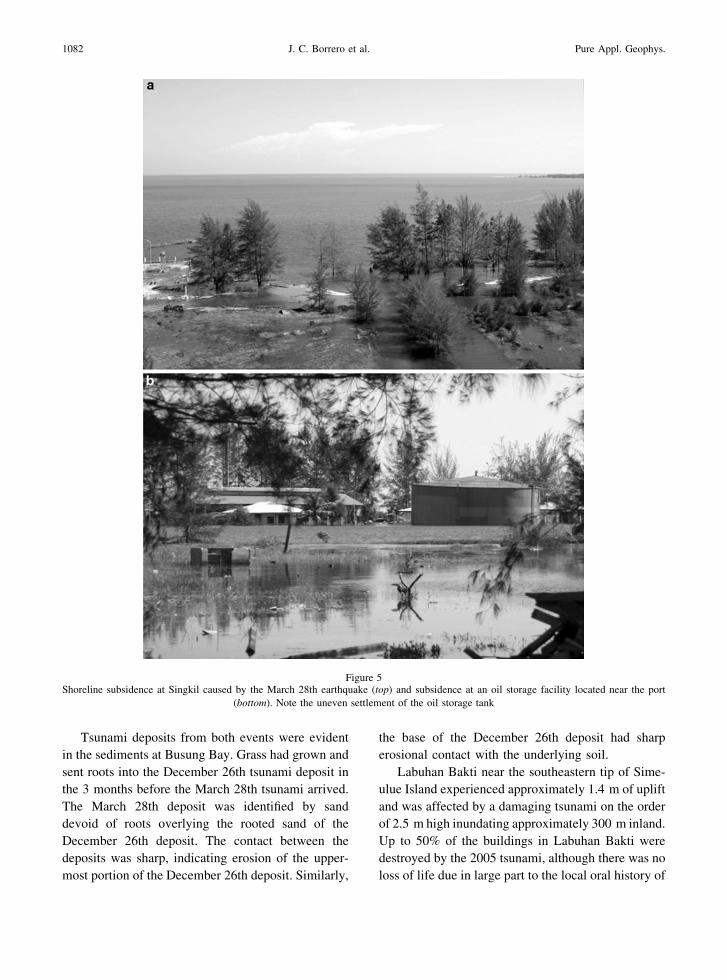
of the March 28th earthquake was the widespread
coastal subsidence and subsequent flooding of the
nearshore area. We estimated coseismic subsidence
of 0.5–0.8 m, which left the nearshore area perma-
nently flooded, including oil storage facilities and
several kilometers of shorefront businesses (Fig. 5).
A tsunami was also observed at Singkil; eyewitnesses
reported one large surge arriving approximately
10 min after the earthquake. After the initial wave,
the area remained flooded as the water slowly drained
off to its current level. The tsunami reached a
maximum runup of 2.3 m. A charter boat captain
working in the area informed us that the wharf at
Singkil had been recently upgraded; however, it
suffered significant damage as a result of the
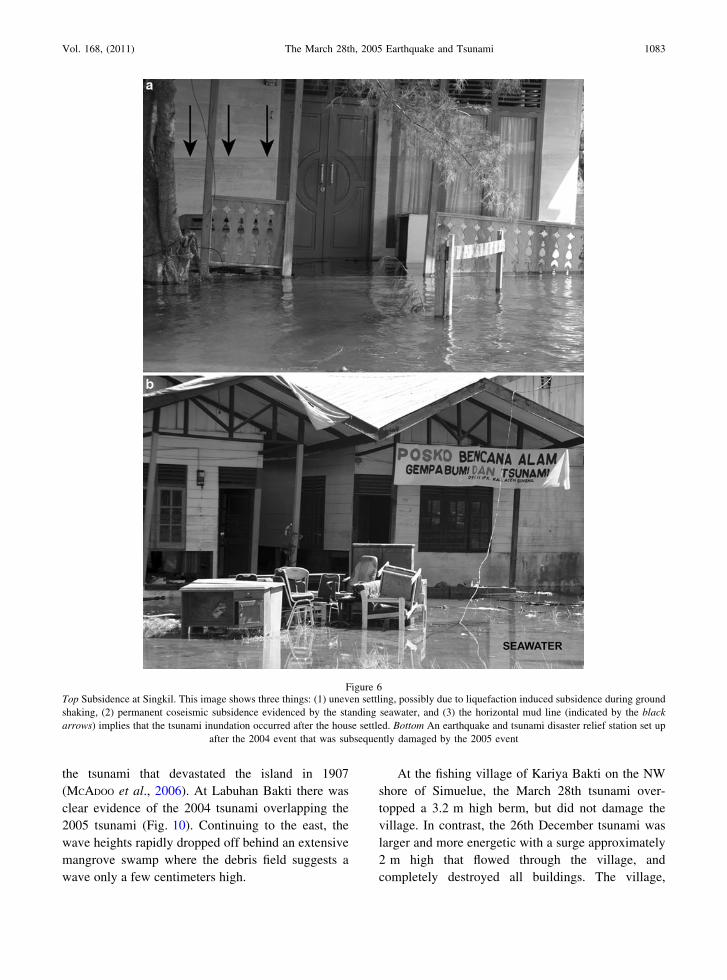
earthquake. Throughout the area, there was ample
evidence of liquefaction and lateral spreading as well
as uneven settlement of structures (Fig. 6).
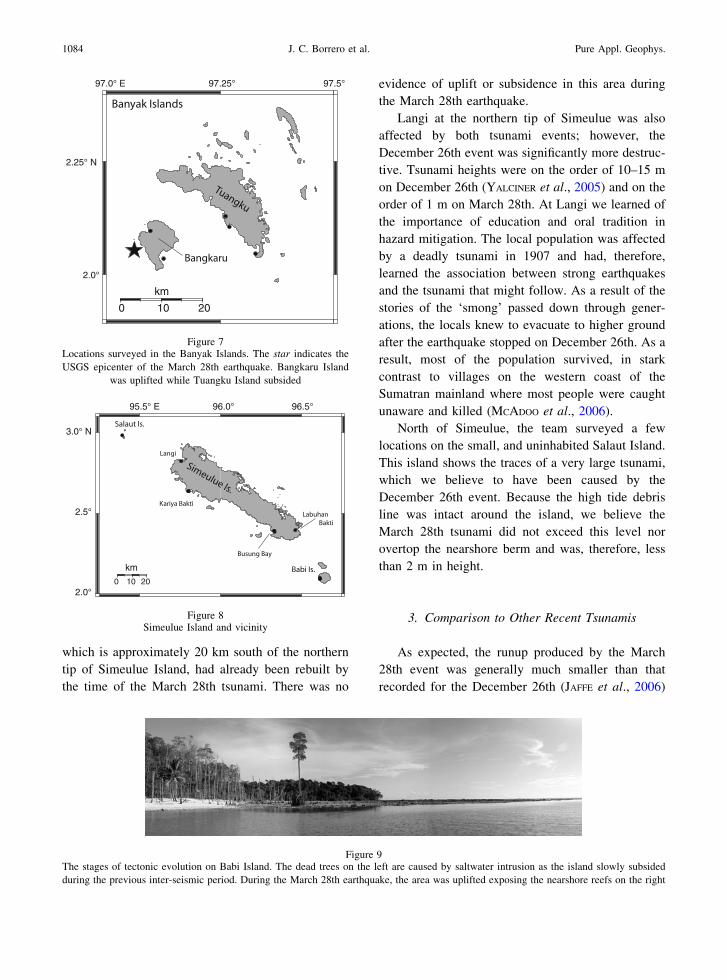
The Banyak Islands lie immediately adjacent to
the epicenter of the March 28th earthquake (Fig. 7).
The Banyak group consists of two main islands, the
larger Tuangku and the smaller Bangkaru. Because
these islands are sparsely inhabited, we did not
encounter any eyewitnesses to the March 28th event.
Despite being separated by only a few kilometers,
the earthquake and tsunami effects on the two islands
were quite different. On Bangakaru Island, exposed
corals and trapped fish in tide pools indicated
approximately 0.6 m of uplift. However the sites
surveyed on Tuangku had clearly subsided on the
order of 0.5 m. Tsunami traces at each of our survey
locations in the Banyak Islands consisted of flattened
vegetation not yet dead from salt water exposure as
well as large logs deposited in the jungle and debris
hanging from trees. Tsunami heights were measured
at 3.0–3.5 m on Bangkaru and 1.0–3.0 m on
Tuangku.
The survey continued northward from the Banyak
Islands towards Simeulue Island (Fig. 7). The first
stop along the way was the uninhabited Babi Island.
On Babi there was clear evidence of approximately
0.8 m of tectonic uplift associated with the March
28th earthquake in the form of newly exposed
nearshore reefs. There was also evidence of tsunami
overwash and debris deposited in the forest. The
tsunami runup height was estimated at 2.0–2.3 m
with inundation extending 140–295 m inland.
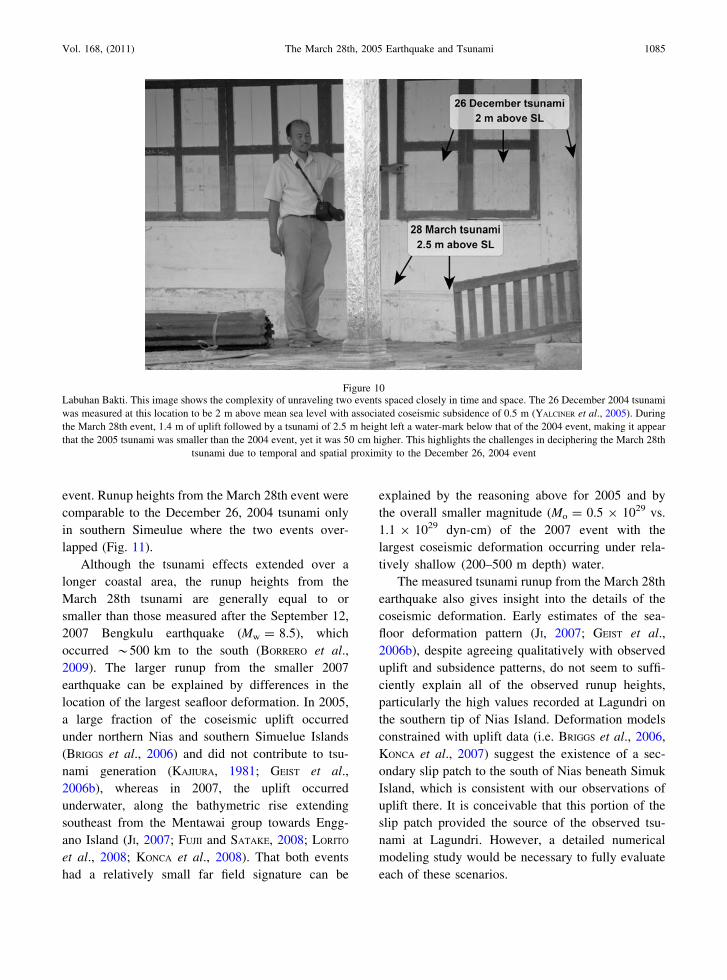
Babi Island very clearly displayed the stages of
tectonic evolution typical to the islands west of
Sumatra (Fig. 8). Dead trees near shore due to
saltwater intrusion indicate the gradual subsidence
of the islands during the interseismic period when the
plates are locked. After the earthquake these trees are
now located 10s to 100s of meters inland and
surrounded by a newly exposed section of uplifted
nearshore reef.
98.0° E 98.5° 99.0°
-0.5° S
0.0°
0 10 20
km
Figure 2Locations surveyed in the Batu Islands
97.0° E 97.5° 98.0°
0.5°
1.0°
1.5° N
0 10 20
km
0
km
2
Figure 3Sites surveyed on and around Nias Island and Lagundri Bay
1080 J. C. Borrero et al. Pure Appl. Geophys.
Moving on to Simeulue, our understanding of the
March 28th tsunami was complicated by overlapping
effects from December 26th. In southwestern Simeulue
at Busung Bay (Fig. 8), the December earthquake
caused 0.3–0.5 m of subsidence (MELTZNER et al., 2006)
and a non-destructive 2.3 m tsunami that inundated
approximately 120 m inland. The December tsunami
flowed over the road and into a rice paddy where it left a
clear debris line still evident during our survey. On
March 28th, however, this area was uplifted by
approximately 1.4 m. We deduced this value by
comparing the high tide debris lines on the beach. The
tsunami on March 28th caused runup of between 2.6 and
4.2 m in Busung Bay and inundated up to 80 m (Fig. 9).
Figure 4Houses located on the eastern side of Lagundri Bay damaged by the March 28th tsunami. The flow direction in the upper photo was towards
the camera. Shore perpendicular walls are still intact, while those oriented shore parallel (perpendicular to the flow direction) have been
destroyed. In the lower photo, the flow direction was roughly from left to right, also indicated by flow-parallel walls that are still partially
intact
Vol. 168, (2011) The March 28th, 2005 Earthquake and Tsunami 1081
Tsunami deposits from both events were evident
in the sediments at Busung Bay. Grass had grown and
sent roots into the December 26th tsunami deposit in
the 3 months before the March 28th tsunami arrived.
The March 28th deposit was identified by sand
devoid of roots overlying the rooted sand of the
December 26th deposit. The contact between the
deposits was sharp, indicating erosion of the upper-
most portion of the December 26th deposit. Similarly,
the base of the December 26th deposit had sharp
erosional contact with the underlying soil.
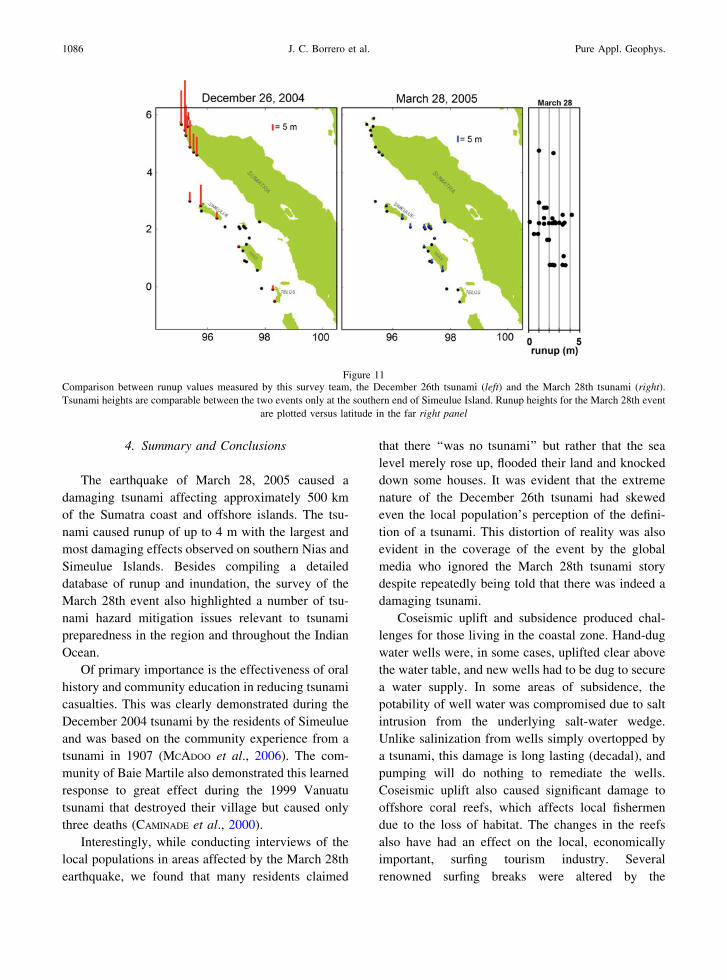
Labuhan Bakti near the southeastern tip of Sime-
ulue Island experienced approximately 1.4 m of uplift
and was affected by a damaging tsunami on the order
of 2.5 m high inundating approximately 300 m inland.
Up to 50% of the buildings in Labuhan Bakti were
destroyed by the 2005 tsunami, although there was no
loss of life due in large part to the local oral history of
Figure 5Shoreline subsidence at Singkil caused by the March 28th earthquake (top) and subsidence at an oil storage facility located near the port
(bottom). Note the uneven settlement of the oil storage tank
1082 J. C. Borrero et al. Pure Appl. Geophys.
the tsunami that devastated the island in 1907
(MCADOO et al., 2006). At Labuhan Bakti there was
clear evidence of the 2004 tsunami overlapping the
2005 tsunami (Fig. 10). Continuing to the east, the
wave heights rapidly dropped off behind an extensive
mangrove swamp where the debris field suggests a
wave only a few centimeters high.
At the fishing village of Kariya Bakti on the NW
shore of Simuelue, the March 28th tsunami over-
topped a 3.2 m high berm, but did not damage the
village. In contrast, the 26th December tsunami was
larger and more energetic with a surge approximately
2 m high that flowed through the village, and
completely destroyed all buildings. The village,
Figure 6Top Subsidence at Singkil. This image shows three things: (1) uneven settling, possibly due to liquefaction induced subsidence during ground
shaking, (2) permanent coseismic subsidence evidenced by the standing seawater, and (3) the horizontal mud line (indicated by the black
arrows) implies that the tsunami inundation occurred after the house settled. Bottom An earthquake and tsunami disaster relief station set up
after the 2004 event that was subsequently damaged by the 2005 event
Vol. 168, (2011) The March 28th, 2005 Earthquake and Tsunami 1083
which is approximately 20 km south of the northern
tip of Simeulue Island, had already been rebuilt by
the time of the March 28th tsunami. There was no
evidence of uplift or subsidence in this area during
the March 28th earthquake.
Langi at the northern tip of Simeulue was also
affected by both tsunami events; however, the
December 26th event was significantly more destruc-
tive. Tsunami heights were on the order of 10–15 m
on December 26th (YALCINER et al., 2005) and on the
order of 1 m on March 28th. At Langi we learned of
the importance of education and oral tradition in
hazard mitigation. The local population was affected
by a deadly tsunami in 1907 and had, therefore,
learned the association between strong earthquakes
and the tsunami that might follow. As a result of the
stories of the ‘smong’ passed down through gener-
ations, the locals knew to evacuate to higher ground
after the earthquake stopped on December 26th. As a
result, most of the population survived, in stark
contrast to villages on the western coast of the
Sumatran mainland where most people were caught
unaware and killed (MCADOO et al., 2006).
North of Simeulue, the team surveyed a few
locations on the small, and uninhabited Salaut Island.
This island shows the traces of a very large tsunami,
which we believe to have been caused by the
December 26th event. Because the high tide debris
line was intact around the island, we believe the
March 28th tsunami did not exceed this level nor
overtop the nearshore berm and was, therefore, less
than 2 m in height.
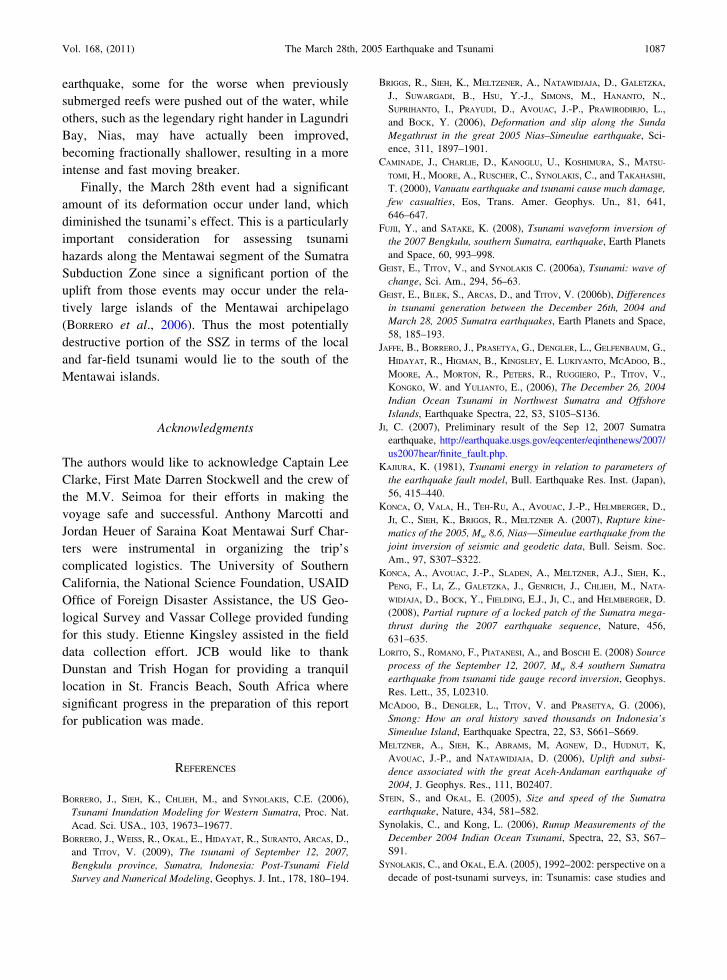
3. Comparison to Other Recent Tsunamis
As expected, the runup produced by the March
28th event was generally much smaller than that
recorded for the December 26th (JAFFE et al., 2006)
97.0° E 97.25° 97.5°
2.0°
2.25° N
0 10 20
km
Figure 7Locations surveyed in the Banyak Islands. The star indicates the
USGS epicenter of the March 28th earthquake. Bangkaru Island
was uplifted while Tuangku Island subsided
95.5° E 96.0° 96.5°
2.0°
2.5°
3.0° N
0 10 20
km
Figure 8Simeulue Island and vicinity
Figure 9The stages of tectonic evolution on Babi Island. The dead trees on the left are caused by saltwater intrusion as the island slowly subsided
during the previous inter-seismic period. During the March 28th earthquake, the area was uplifted exposing the nearshore reefs on the right
1084 J. C. Borrero et al. Pure Appl. Geophys.
event. Runup heights from the March 28th event were
comparable to the December 26, 2004 tsunami only
in southern Simeulue where the two events over-
lapped (Fig. 11).
Although the tsunami effects extended over a
longer coastal area, the runup heights from the
March 28th tsunami are generally equal to or
smaller than those measured after the September 12,
2007 Bengkulu earthquake (Mw = 8.5), which
occurred *500 km to the south (BORRERO et al.,
2009). The larger runup from the smaller 2007
earthquake can be explained by differences in the
location of the largest seafloor deformation. In 2005,
a large fraction of the coseismic uplift occurred
under northern Nias and southern Simuelue Islands
(BRIGGS et al., 2006) and did not contribute to tsu-
nami generation (KAJIURA, 1981; GEIST et al.,
2006b), whereas in 2007, the uplift occurred
underwater, along the bathymetric rise extending
southeast from the Mentawai group towards Engg-
ano Island (JI, 2007; FUJII and SATAKE, 2008; LORITO
et al., 2008; KONCA et al., 2008). That both events
had a relatively small far field signature can be
explained by the reasoning above for 2005 and by
the overall smaller magnitude (Mo = 0.5 9 1029 vs.
1.1 9 1029 dyn-cm) of the 2007 event with the
largest coseismic deformation occurring under rela-
tively shallow (200–500 m depth) water.
The measured tsunami runup from the March 28th
earthquake also gives insight into the details of the
coseismic deformation. Early estimates of the sea-
floor deformation pattern (JI, 2007; GEIST et al.,
2006b), despite agreeing qualitatively with observed
uplift and subsidence patterns, do not seem to suffi-
ciently explain all of the observed runup heights,
particularly the high values recorded at Lagundri on
the southern tip of Nias Island. Deformation models
constrained with uplift data (i.e. BRIGGS et al., 2006,
KONCA et al., 2007) suggest the existence of a sec-
ondary slip patch to the south of Nias beneath Simuk
Island, which is consistent with our observations of
uplift there. It is conceivable that this portion of the
slip patch provided the source of the observed tsu-
nami at Lagundri. However, a detailed numerical
modeling study would be necessary to fully evaluate
each of these scenarios.
Figure 10Labuhan Bakti. This image shows the complexity of unraveling two events spaced closely in time and space. The 26 December 2004 tsunami
was measured at this location to be 2 m above mean sea level with associated coseismic subsidence of 0.5 m (YALCINER et al., 2005). During
the March 28th event, 1.4 m of uplift followed by a tsunami of 2.5 m height left a water-mark below that of the 2004 event, making it appear
that the 2005 tsunami was smaller than the 2004 event, yet it was 50 cm higher. This highlights the challenges in deciphering the March 28th
tsunami due to temporal and spatial proximity to the December 26, 2004 event
Vol. 168, (2011) The March 28th, 2005 Earthquake and Tsunami 1085
4. Summary and Conclusions
The earthquake of March 28, 2005 caused a
damaging tsunami affecting approximately 500 km
of the Sumatra coast and offshore islands. The tsu-
nami caused runup of up to 4 m with the largest and
most damaging effects observed on southern Nias and
Simeulue Islands. Besides compiling a detailed
database of runup and inundation, the survey of the
March 28th event also highlighted a number of tsu-
nami hazard mitigation issues relevant to tsunami
preparedness in the region and throughout the Indian
Ocean.
Of primary importance is the effectiveness of oral
history and community education in reducing tsunami
casualties. This was clearly demonstrated during the
December 2004 tsunami by the residents of Simeulue
and was based on the community experience from a
tsunami in 1907 (MCADOO et al., 2006). The com-
munity of Baie Martile also demonstrated this learned
response to great effect during the 1999 Vanuatu
tsunami that destroyed their village but caused only
three deaths (CAMINADE et al., 2000).
Interestingly, while conducting interviews of the
local populations in areas affected by the March 28th
earthquake, we found that many residents claimed
that there ‘‘was no tsunami’’ but rather that the sea
level merely rose up, flooded their land and knocked
down some houses. It was evident that the extreme
nature of the December 26th tsunami had skewed
even the local population’s perception of the defini-
tion of a tsunami. This distortion of reality was also
evident in the coverage of the event by the global
media who ignored the March 28th tsunami story
despite repeatedly being told that there was indeed a
damaging tsunami.
Coseismic uplift and subsidence produced chal-
lenges for those living in the coastal zone. Hand-dug
water wells were, in some cases, uplifted clear above
the water table, and new wells had to be dug to secure
a water supply. In some areas of subsidence, the
potability of well water was compromised due to salt
intrusion from the underlying salt-water wedge.
Unlike salinization from wells simply overtopped by
a tsunami, this damage is long lasting (decadal), and
pumping will do nothing to remediate the wells.
Coseismic uplift also caused significant damage to
offshore coral reefs, which affects local fishermen
due to the loss of habitat. The changes in the reefs
also have had an effect on the local, economically
important, surfing tourism industry. Several
renowned surfing breaks were altered by the
Figure 11Comparison between runup values measured by this survey team, the December 26th tsunami (left) and the March 28th tsunami (right).
Tsunami heights are comparable between the two events only at the southern end of Simeulue Island. Runup heights for the March 28th event
are plotted versus latitude in the far right panel
1086 J. C. Borrero et al. Pure Appl. Geophys.
earthquake, some for the worse when previously
submerged reefs were pushed out of the water, while
others, such as the legendary right hander in Lagundri
Bay, Nias, may have actually been improved,
becoming fractionally shallower, resulting in a more
intense and fast moving breaker.
Finally, the March 28th event had a significant
amount of its deformation occur under land, which
diminished the tsunami’s effect. This is a particularly
important consideration for assessing tsunami
hazards along the Mentawai segment of the Sumatra
Subduction Zone since a significant portion of the
uplift from those events may occur under the rela-
tively large islands of the Mentawai archipelago
(BORRERO et al., 2006). Thus the most potentially
destructive portion of the SSZ in terms of the local
and far-field tsunami would lie to the south of the
Mentawai islands.
Acknowledgments
The authors would like to acknowledge Captain Lee
Clarke, First Mate Darren Stockwell and the crew of
the M.V. Seimoa for their efforts in making the
voyage safe and successful. Anthony Marcotti and
Jordan Heuer of Saraina Koat Mentawai Surf Char-
ters were instrumental in organizing the trip’s
complicated logistics. The University of Southern
California, the National Science Foundation, USAID
Office of Foreign Disaster Assistance, the US Geo-
logical Survey and Vassar College provided funding
for this study. Etienne Kingsley assisted in the field
data collection effort. JCB would like to thank
Dunstan and Trish Hogan for providing a tranquil
location in St. Francis Beach, South Africa where
significant progress in the preparation of this report
for publication was made.
REFERENCES
BORRERO, J., SIEH, K., CHLIEH, M., and SYNOLAKIS, C.E. (2006),
Tsunami Inundation Modeling for Western Sumatra, Proc. Nat.
Acad. Sci. USA., 103, 19673–19677.
BORRERO, J., WEISS, R., OKAL, E., HIDAYAT, R., SURANTO, ARCAS, D.,
and TITOV, V. (2009), The tsunami of September 12, 2007,
Bengkulu province, Sumatra, Indonesia: Post-Tsunami Field
Survey and Numerical Modeling, Geophys. J. Int., 178, 180–194.
BRIGGS, R., SIEH, K., MELTZENER, A., NATAWIDJAJA, D., GALETZKA,
J., SUWARGADI, B., HSU, Y.-J., SIMONS, M., HANANTO, N.,
SUPRIHANTO, I., PRAYUDI, D., AVOUAC, J.-P., PRAWIRODIRJO, L.,
and BOCK, Y. (2006), Deformation and slip along the Sunda
Megathrust in the great 2005 Nias–Simeulue earthquake, Sci-
ence, 311, 1897–1901.
CAMINADE, J., CHARLIE, D., KANOGLU, U., KOSHIMURA, S., MATSU-
TOMI, H., MOORE, A., RUSCHER, C., SYNOLAKIS, C., and TAKAHASHI,
T. (2000), Vanuatu earthquake and tsunami cause much damage,
few casualties, Eos, Trans. Amer. Geophys. Un., 81, 641,
646–647.
FUJII, Y., and SATAKE, K. (2008), Tsunami waveform inversion of
the 2007 Bengkulu, southern Sumatra, earthquake, Earth Planets
and Space, 60, 993–998.
GEIST, E., TITOV, V., and SYNOLAKIS C. (2006a), Tsunami: wave of
change, Sci. Am., 294, 56–63.
GEIST, E., BILEK, S., ARCAS, D., and TITOV, V. (2006b), Differences
in tsunami generation between the December 26th, 2004 and
March 28, 2005 Sumatra earthquakes, Earth Planets and Space,
58, 185–193.
JAFFE, B., BORRERO, J., PRASETYA, G., DENGLER, L., GELFENBAUM, G.,
HIDAYAT, R., HIGMAN, B., KINGSLEY, E. LUKIYANTO, MCADOO, B.,
MOORE, A., MORTON, R., PETERS, R., RUGGIERO, P., TITOV, V.,
KONGKO, W. and YULIANTO, E., (2006), The December 26, 2004
Indian Ocean Tsunami in Northwest Sumatra and Offshore
Islands, Earthquake Spectra, 22, S3, S105–S136.
JI, C. (2007), Preliminary result of the Sep 12, 2007 Sumatra
earthquake, http://earthquake.usgs.gov/eqcenter/eqinthenews/2007/
us2007hear/finite_fault.php.
KAJIURA, K. (1981), Tsunami energy in relation to parameters of
the earthquake fault model, Bull. Earthquake Res. Inst. (Japan),
56, 415–440.
KONCA, O, VALA, H., TEH-RU, A., AVOUAC, J.-P., HELMBERGER, D.,
JI, C., SIEH, K., BRIGGS, R., MELTZNER A. (2007), Rupture kine-
matics of the 2005, Mw 8.6, Nias––Simeulue earthquake from the
joint inversion of seismic and geodetic data, Bull. Seism. Soc.
Am., 97, S307–S322.
KONCA, A., AVOUAC, J.-P., SLADEN, A., MELTZNER, A.J., SIEH, K.,
PENG, F., LI, Z., GALETZKA, J., GENRICH, J., CHLIEH, M., NATA-
WIDJAJA, D., BOCK, Y., FIELDING, E.J., JI, C., and HELMBERGER, D.
(2008), Partial rupture of a locked patch of the Sumatra mega-
thrust during the 2007 earthquake sequence, Nature, 456,
631–635.
LORITO, S., ROMANO, F., PIATANESI, A., and BOSCHI E. (2008) Source
process of the September 12, 2007, Mw 8.4 southern Sumatra
earthquake from tsunami tide gauge record inversion, Geophys.
Res. Lett., 35, L02310.
MCADOO, B., DENGLER, L., TITOV, V. and PRASETYA, G. (2006),
Smong: How an oral history saved thousands on Indonesia’s
Simeulue Island, Earthquake Spectra, 22, S3, S661–S669.
MELTZNER, A., SIEH, K., ABRAMS, M, AGNEW, D., HUDNUT, K,
AVOUAC, J.-P., and NATAWIDJAJA, D. (2006), Uplift and subsi-
dence associated with the great Aceh-Andaman earthquake of
2004, J. Geophys. Res., 111, B02407.
STEIN, S., and OKAL, E. (2005), Size and speed of the Sumatra
earthquake, Nature, 434, 581–582.
Synolakis, C., and Kong, L. (2006), Runup Measurements of the
December 2004 Indian Ocean Tsunami, Spectra, 22, S3, S67–
S91.
SYNOLAKIS, C., and OKAL, E.A. (2005), 1992–2002: perspective on a
decade of post-tsunami surveys, in: Tsunamis: case studies and
Vol. 168, (2011) The March 28th, 2005 Earthquake and Tsunami 1087

recent developments, ed. by SATAKE, K., Adv. Natur. Technol.
Hazards, 23, pp 1–30.
UNESCO, Intergovernmental Oceanographic Commission, Post-
Tsunami Survey Field Guide, IOC Manuals and Guides, no. 37.
YALCINER, A., PERINCEK, D., ERSOY, S., PRASETYA, G., HIDAYAT, R.
and MCADOO, B. (2005), December 26, 2004 Indian Ocean tsu-
nami field survey (Jan. 21–31, 2005) at north of Sumatra Island,
UNESCO IOC Report.
(Received November 30, 2009, revised June 21, 2010, accepted June 21, 2010, Published online November 12, 2010)
1088 J. C. Borrero et al. Pure Appl. Geophys.