The 15 August 2007 Peru Earthquake and Tsunami: Influence of the Source Characteristics on the...
22
The 15 August 2007 Peru Earthquake and Tsunami: Influence of the Source Characteristics on the Tsunami Heights HE ´ LE ` NE HE ´ BERT, 1 DOMINIQUE REYMOND, 2 YANN KRIEN, 1 JULIEN VERGOZ, 1 FRANC ¸ OIS SCHINDELE ´ , 1 JEAN ROGER, 1 and ANNE LOEVENBRUCK 1 Abstract—The tsunami caused by the 2007 Peru earthquake (M w 8.0) provoked less damage than by the seismic shaking itself (numerous casualties due to the earthquake in the vicinity of Pisco). However, it propagated across the Pacific Ocean and small waves were observed on one tide gauge in Taiohae Bay (Nuku Hiva, Marquesas, French Polynesia). We invert seismological data to recover the rupture pattern in two steps. The first step uses surface waves to find a solution for the moment tensor, and the second step uses body waves to compute the slip distribution in the source area. We find the slip distribution to consist of two main slip patches in the source area. The inversion of surface waves yields a scalar moment of 8.9 10 20 Nm, and body- wave inversion gives 1.4 10 21 Nm. The inversion of tsunami data recorded on a single deep ocean sensor also can be used to compute a fault slip pattern (yielding a scalar moment of 1.1 10 21 Nm). We then use these different sources to model the tsunami propagation across the Pacific Ocean, especially towards Nuku Hiva. While the source model taken from the body-wave inversion yields computed tsunami waves systematically too low with respect to observations (on the central Pacific Ocean DART buoy as on the Polynesian tide gauge), the source model established from the surface-wave inversion is more efficient to fit the observations, confirming that the tsunami is sensitive to the low frequency component of the source. Finally we also discuss the modeling of the late tsunami arrivals in Taiohae Bay using several friction coefficients for the sea bottom. Key words: Seismological source, Moment tensor inversion, Body-wave inversion, DART inversion, Tsunami numerical modeling, Pacific Ocean, French Polynesia. 1. Introduction and Objectives On August 15, 2007, at 23:40 UTC, a M w 8.0 earthquake occurred off the Peruvian coast on a shallow portion of the subduction zone where the Nazca plate subducts beneath the South American plate at a rapid convergence rate of about 6.5 to 7.0 cm/yr (KENDRICK et al., 2003). In addition to numerous casualties and severe damage in the region of Pisco, the sea-floor displacement associated to the quake triggered a destructive tsunami, as normal given the earthquake magnitude and such a shallow hypocentral depth. The run- up reported along the coastline measured up to almost 10 m locally, and on average 3 to 5 m along at least 100 km of the Peruvian coast (SLADEN et al., 2007c;FRITZ et al., 2008; http://www.eeri.org/lfe/pdf/peru_coast_tsunami.pdf). 1 CEA, DAM, DIF, F-91297 Arpajon, France. 2 Laboratoire de Ge ´ophysique, CEA, BP 640, 98713 Papeete, Tahiti, French Polynesia. Pure appl. geophys. 166 (2009) 211–232 Ó Birkha ¨user Verlag, Basel, 2009 0033–4553/09/010211–22 DOI 10.1007/s00024-008-0439-0 Pure and Applied Geophysics
Transcript of The 15 August 2007 Peru Earthquake and Tsunami: Influence of the Source Characteristics on the...

The 15 August 2007 Peru Earthquake and Tsunami: Influence
of the Source Characteristics on the Tsunami Heights
HELENE HEBERT,1 DOMINIQUE REYMOND,2 YANN KRIEN,1 JULIEN VERGOZ,1
FRANCOIS SCHINDELE,1 JEAN ROGER,1 and ANNE LOEVENBRUCK1
Abstract—The tsunami caused by the 2007 Peru earthquake (Mw 8.0) provoked less damage than by the
seismic shaking itself (numerous casualties due to the earthquake in the vicinity of Pisco). However, it
propagated across the Pacific Ocean and small waves were observed on one tide gauge in Taiohae Bay (Nuku
Hiva, Marquesas, French Polynesia). We invert seismological data to recover the rupture pattern in two steps.
The first step uses surface waves to find a solution for the moment tensor, and the second step uses body waves
to compute the slip distribution in the source area. We find the slip distribution to consist of two main slip
patches in the source area. The inversion of surface waves yields a scalar moment of 8.9 1020 Nm, and body-
wave inversion gives 1.4 1021 Nm. The inversion of tsunami data recorded on a single deep ocean sensor also
can be used to compute a fault slip pattern (yielding a scalar moment of 1.1 1021 Nm). We then use these
different sources to model the tsunami propagation across the Pacific Ocean, especially towards Nuku Hiva.
While the source model taken from the body-wave inversion yields computed tsunami waves systematically too
low with respect to observations (on the central Pacific Ocean DART buoy as on the Polynesian tide gauge), the
source model established from the surface-wave inversion is more efficient to fit the observations, confirming
that the tsunami is sensitive to the low frequency component of the source. Finally we also discuss the modeling
of the late tsunami arrivals in Taiohae Bay using several friction coefficients for the sea bottom.
Key words: Seismological source, Moment tensor inversion, Body-wave inversion, DART inversion,
Tsunami numerical modeling, Pacific Ocean, French Polynesia.
1. Introduction and Objectives
On August 15, 2007, at 23:40 UTC, a Mw 8.0 earthquake occurred off the Peruvian
coast on a shallow portion of the subduction zone where the Nazca plate subducts beneath
the South American plate at a rapid convergence rate of about 6.5 to 7.0 cm/yr (KENDRICK
et al., 2003). In addition to numerous casualties and severe damage in the region of Pisco,
the sea-floor displacement associated to the quake triggered a destructive tsunami, as
normal given the earthquake magnitude and such a shallow hypocentral depth. The run-
up reported along the coastline measured up to almost 10 m locally, and on average 3 to
5 m along at least 100 km of the Peruvian coast (SLADEN et al., 2007c; FRITZ et al., 2008;
http://www.eeri.org/lfe/pdf/peru_coast_tsunami.pdf).
1 CEA, DAM, DIF, F-91297 Arpajon, France.2 Laboratoire de Geophysique, CEA, BP 640, 98713 Papeete, Tahiti, French Polynesia.
Pure appl. geophys. 166 (2009) 211–232 � Birkhauser Verlag, Basel, 2009
0033–4553/09/010211–22
DOI 10.1007/s00024-008-0439-0Pure and Applied Geophysics

This event occurred in an area frequently struck by major thrusting events,
immediately north to the 12 November, 1996 Mw 7.7 earthquake. Further southward, the
1868 historical seismic gap has been partly ruptured by the Mw 8.4 23 June 2001
earthquake, however the identified gap may correspond to a magnitude 9 event as in 1868
(DORBATH et al., 1990). This seismic gap, together with the nearby gap corresponding to
the North Chile 1877 earthquake (DELOUIS et al., 1997; CHLIEH et al., 2004), constitute
large areas expected to produce major earthquakes (COMTE and PARDO, 1991). Such being
the case, the 2001 Peru earthquake seems to have ruptured a significant part of the 1868
gap, while the 1877 remains unbroken (Fig. 1).
Figure 1
Context of the Peru-Chile border subduction zone, with recent major seismic ruptures highlighted. Background
subduction seismicity in grey is taken from USGS NEIC catalogue, with a symbol depending on the focal depth
(circle, z < 50 km, triangle, 50 < z < 150 km, and diamond, 150 < z < 500 km). For each major event
displayed, one-year aftershocks are plotted, defining the extent of the rupture (taken from USGS database).
Ellipses recall the historical seismic gaps, the 1877 still devoid of recent ruptures, except with the recent 14
November, 2007 event which may have started to fill the gap. Note the lack of shallow seismicity along the 1877
gap, contrasting with the high level of deep seismicity. DART sensors studied are also plotted with crosses. Inset
shows the mean direction from the source area to the Marquesas (French Polynesia).
212 H. Hebert et al. Pure appl. geophys.,

While it is well known which seismological parameters are relevant to issue a
warning (location, seismic moment, and focal depth), the difficulty in determining the
accurate level of impact and possible flooding for specific bays and harbors is real,
particularly because the actual azimuth and rupture direction are difficult to define in the
first minutes after the quake, and yet they define the area where the maximum impact is
expected. Recent events in 2006 have also stressed the need for cautious appraisal of
tsunami impact in remote sites, as was the case for Crescent City during the November
15, 2006 tsunami initiated in the Kuril Islands. The Marquesas Islands (French Polynesia)
are among these remote far-field sites where the impact can be strong, but highly
dependent upon the fault azimuth and rupture direction (HEBERT et al., 2001a, b; OKAL
and HEBERT, 2007).
The dependence on relation with the seismic moment is the first-order aspect to take
into account (TALANDIER and OKAL, 1989), however corrections including azimuthal
influence and propagation distance are now considered (REYMOND et al., 2007) to help
define more accurately the expected level of tsunami impact. In addition, the slip
heterogeneities during the rupture may also influence the impact in the far field, as was
already observed in the Indian Ocean (HEBERT et al., 2007).
The 15 August 2007 event presents the opportunity to discuss the influence of the
seismic rupture characteristics on the tsunami heights, especially in the far field. Seismic
inversions have been performed to rapidly compute the moment and to obtain the slip
distribution. Another insight to the earthquake source is also given by a simple inversion
of the tsunami waves recorded on a single DART signal located off Chile. Then we
compare tsunami heights computed in the far field (French Polynesia) using the various
source models considered, and we emphasize the influence of the source characteristics
on these water heights. Our results finally allow us to discuss the relevant parameters of
the source that facilitate improvement of the tsunami hazard assessment, and that could
be considered in the frame of real-time modeling.
2. Seismological Overview of the 15 August 2007 Earthquake
Given the magnitude and depth quickly determined on August 15, 2007, a tsunami
information bulletin was first issued by the Pacific Tsunami Warning Center at 23:54
UTC, while the estimated magnitude was then only Mw 7.5. Subsequently an expanding
regional warning (Mw 7.9) was issued at 00:19 UTC, based on the variable-period mantle
magnitude Mm (OKAL and TALANDIER, 1989; REYMOND et al., 1991; SCHINDELE et al., 1995)
(further information available on http://www.prh.noaa.gov/ptwc/messages/pacific/2007/).
Meanwhile in Tahiti (French Polynesia) the TREMORS system, similarly based on
Mm, provided at 00:35 UTC a rapid estimation of the seismic moment corresponding to
Mw 8.1. The Polynesian Tsunami Warning System (CPPT: Centre Polynesien de
Prevention des Tsunamis) then issued a yellow warning bulletin for the Marquesas
Islands at 00:57 UTC. While the PTWC finally cancelled the warning at 02:10 UTC, the
Vol. 166, 2009 The 15 August 2007 Peru Tsunami 213

warning in Polynesia was revised to the orange level at 03:50 UTC for the Marquesas,
since these islands are well known to amplify tsunami waves coming from Chilean and
Peruvian subduction earthquakes. Finally the alert was cancelled at 11:30 UTC, two
hours after the arrival of the waves. During the watch level, only coastal sites and light
boats have been evacuated. No damage was observed.
2.1 PDFM Inversion
A method of quick inversion of seismic moment tensor using very small data sets
(named PDFM: Preliminary Determination of Focal Mechanism) started in 1997 with the
goal of deriving early focal mechanism solutions for strong earthquakes in the context of
tsunami warning. Good knowledge of the seismic source is obviously of crucial
importance in tsunami warning because the tsunami excitation is strongly dependent on
focal depth, earthquake size (seismic moment), and fault geometry. The method is based
on the early suggestion by ROMANOWICZ and SUAREZ (1983), that focal solutions can be
obtained by inverting only spectral amplitudes of mantle waves (and discarding the phase
information). It has been verified (REYMOND and OKAL, 2000) that this approach is
particularly robust with respect to uncertainties in epicentral location and exact origin
time; these parameters being relatively imprecise under real-time operational conditions.
The cost of working with modulus of spectra is an indeterminacy of 180 degrees in strike
and slip angles that can be lifted by considering a few critical first motion polarities. The
PDFM method also had been applied to study large historical earthquakes such as the
great Banda Sea earthquake of February 1, 1938 (OKAL and REYMOND, 2003), for which
no definitive focal mechanism has been published. Precise timing corrections are not
available for these historical earthquakes; such technical limitations constitute an obstacle
for standard CMT inversions which use the phase velocity, but is not problematic for the
PDFM method which needs only spectral amplitude without the phase information.
For the 15 August, 2007 earthquake PDFM inversion, 48 stations from IRIS were
used (Fig. 2). The inversion itself was made between 114 s and 293 s, using a total of 576
spectral amplitudes, originating from 48 Rayleigh waves and 24 Love waves (the signals
were checked visually, and those showing bad signal-to-noise ratios on the horizontal
components were removed manually). Details of the inversion process are explained in
previous works (REYMOND and OKAL, 2000). The spectral amplitudes of Rayleigh and
Love waves are related through a nonlinear system to the components of the moment
tensor and of the excitation coefficients of the surface waves, computed with the PREM
model (DZIEWONSKI and ANDERSON, 1981). The signals are corrected from the propagation,
using a regionalized earth model of 10�9 10� degrees, in 7 tectonic regions (similar to
correction of distance in the computation of mantle magnitude Mm, see OKAL and
TALANDIER, 1989).
The nonlinear system is solved iteratively, using the generalized inversion method of
TARANTOLA (1987); the quality of the inversion is controlled with the condition number
defined by the ratio of the largest to the smallest eigenvalue of the model matrix of partial
214 H. Hebert et al. Pure appl. geophys.,

derivatives (relative to the moment tensor elements). Since the result of the inversion is
the moment tensor itself, the principal axes of constraint are solved as the eigenvectors of
the moment tensor, and the best double couple gives the scalar moment M0; the nodal
planes are then computed from the (T) and (P) axis.
It is also worth mentioning that the PDFM method (like other published CMTs)
calculates only the focal geometry and scalar moment, but not the slip distribution along
the fault; consequently an average uniform slip over the entire fault area is assumed.
This remark is important for the next, because the earth surface deformation computed
Figure 2
Preliminary Determination of Focal Mechanism (PDFM) inversion based on 48 stations (location on top). The
solution yields a best double couple moment of 8.9 1020 Nm, with principal axes (T) Val = -8.76 1020 Nm,
Plg = 83�, Azm = 30�, (N) Val = -0.221020 Nm, Plg = 4�, Azm = 157�, and (P) Val = 8.98 1020 Nm,
Plg = 006, Azm = 248, corresponding to nodal planes NP1 (strike = 343� dip = 39� slip = 97�) and NP2
(strike = 154� dip = 51� slip = 84�). The quality of the solution obtained is verified by comparing the radiation
patterns at the source, at several periods, to the observed spectral amplitudes calculated in the stations used.
Since the representation is made in the frequency domain, the units are in cm; the graphics are the same for both
Rayleigh and Love waves.
Vol. 166, 2009 The 15 August 2007 Peru Tsunami 215

with this homogeneous slip model (with OKADA’s formula, 1985) is injected as the static
displacement in tsunami simulation.
Results for the Peruvian earthquake of 15 August, 2007 are summarized on Figure 2.
Without surprise, the mechanism is a quasi-pure thrust faulting (rake 97�), with the
principal nodal plane that corresponds approximately to the plane defined by the
subduction zone.
The Centroid Moment Tensor determined at Harvard (http://www.globalcmt.org/)
exhibits a strike (324�) more consistent with the mean trench direction than the azimuth
found in PDFM inversion (343�). This could be explained by the fact that the inversion is
made at a very long period, and thus integrates the multiple sources that can occur: the
resulting fault plane solution would be an average of the smaller ones. The CMT dip
angle (24�) is also less steep than that of the PDFM (39�), the latter, again could be more
representative for the deeper part of the subduction.
Despite an ill-conditioned resolution (the condition number is equal to 342), it has
also been possible to determine the focal depth from the residual errors computed at
several focal depths, and retaining the depth corresponding to the smallest value of
residuals, thus 40 km.
2.2 Body-wave Inversion
Body waves recorded on teleseismic broadband stations allow recovery of the fault
characteristics (focal mechanism, depth and duration of the rupture, slip distribution and
rupture velocity). The method employed here (VALLEE and BOUCHON, 2004) considers the
rupture as a succession of slip patches breaking at different velocities. As it is very simple
to implement, this method is routinely used after large events, and provides interesting
characteristics especially for tsunami warning.
We use 16 IRIS stations with epicentral distances from 35� to 90� and well sampled
various azimuths for this body-wave inversion. Signals are bandpass-filtered between
120 s and 40 s, and the misfits are calculated on 170 s windows for P waves, 210 s
windows for SH waves. The rise time is assumed to be the same for each subfault, and
fixed to 12 s.
In this 2-patch inversion, 12 parameters are inverted: the small and large axes of the 2
elliptic patches (2 9 2 parameters), the slip and rupture velocity for each patch (2 9 2
parameters) and the position of the center of each patch relative to the hypocenter (2 9 2
parameters).
The fault geometry used here is fixed using the mean parameters of the CMT solution,
thus with a 27� dip angle, and a 324� azimuth of the fault. The hypocentral depth was
fixed to 37 km. Then each patch axes and slip value is retrieved on 5 9 5 km2 sub-fault
planes. In addition a mean rupture velocity is also determined using the rise times found
for each patch. For early warning purposes, the method can also be implemented without
waiting for the CMT solution. In that case it relies on a preliminary low frequency
estimation that is subsequently refined with a higher frequency approach, on two patches
216 H. Hebert et al. Pure appl. geophys.,

if necessary; the entire process can be achieved within less than 30 minutes after the main
shock.
We find here two main slip patches (Fig. 3) with values locally reaching more than
9 m, and yielding a seismic moment of 1.4 1021 Nm, consistent with Mw 8.0 (a 35 Nm2
rigidity is used). The southernmost patch is actually close to the city of Pisco where the
strongest damage occurred. We also note that both patches are defined in areas where the
rate of aftershocks is rather low. The relationship between aftershock activity and
coseismic slip on asperities has been debated recently in the Indian Ocean (HSU et al.,
2006; KONCA et al., 2007). Although the seismological inversion here is only carried out
to the first order, the highest slip areas similarly seem to be consistent with lower
aftershock occurrence. Results of other body-wave inversions available (e.g., http://
www.tectonics.caltech.edu/slip_history/2007_peru/pisco.html; Chen Ji (UCSB) and
Yueha Zeng (NEIC): http://earthquake.usgs.gov/eqcenter/eqinthenews/2007/
us2007gbcv/finite_fault.php) also highlight these two areas of high slip, although with
a smoother pattern giving smaller slip values on larger patches.
Figure 3
Slip distribution on the fault plane obtained by inversion of teleseismic body waves. The fault geometry is
derived from the CMT solution (http://www.globalcmt.org/) and the inversion yields the slip values and the
rupture velocity. Open circles are the aftershocks determined by USGS during the first three months following
the main shock. The southernmost patch, located south of Pisco, is consistent with the highest damage observed
in the area.
Vol. 166, 2009 The 15 August 2007 Peru Tsunami 217

Finally, we also observe that the mean direction defined by both patches is close to
the azimuth defined in the PDFM inversion, thus oblique with respect to the trench axis,
confirming the integration made by the latter approach that probably yields an integrated
view of the main rupture patches.
3. Propagation of the 15 August 2007 Tsunami in Pacific Ocean
The seismological inversion of the earthquake retrieves the seismic moment and
defines the main slip pattern on the fault. In this section, we show that the tsunami signal
observed in the deep ocean can also be used to examine the fault pattern. Then we use the
different earthquake sources presented to study the far-field impact of the tsunami in the
Marquesas (French Polynesia).
3.1 Method of Tsunami Modeling
We assume here that the tsunami is triggered by the coseismic deformation of the
seabottom, considered as instantaneous (1 to 2 minutes for this kind of magnitude) with
respect to tsunami periods (from 15 to 30 minutes). This coseismic deformation is
computed from a model of elastic dislocation (OKADA, 1985), as a function of the fault
geometry and ground elastic parameters. The fault parameters and the seismic moment
M0 are provided by the moment tensor analysis of seismic waves, and are related by
M0 = lULW, where l is the rigidity, U is the average slip amount and L (W) the length
(width) of the fault plane.
Since tsunami wavelengths (hundreds of kilometers) are much larger than the ocean
depth (a few kilometers), tsunamis are considered ‘‘long’’ or shallow water gravity waves.
Under this assumption, the hydrodynamic equations describing the conservation of mass
(1) and momentum (2) can be depth-averaged:
o gþ hð Þot
þr: v gþ hð Þ½ � ¼ 0; ð1Þ
o vð Þotþ v:rð Þv ¼ �grgþ
Xf; ð2Þ
where h is the sea depth and g the water elevation above the mean sea level, v is the
depth-averaged horizontal velocity vector, g is the gravity acceleration and f additional
forces such as bottom friction and Coriolis forces. Coriolis forces are usually negligible
and bottom friction will be further discussed in the results.
In the shallow water theory, for small amplitudes and nondispersive propagation,
the wave velocity c is simply given by c = (gh)1/2, the long-wave celerity. When
approaching the coasts, the water depth h decreases and the wave velocity slows. As
periods remain approximately constant, wavelengths decrease and the conservation of
energy in a smaller volume of water produces nonlinear waves with amplitudes of the
218 H. Hebert et al. Pure appl. geophys.,

order of the water depth. This amplification effect (shoaling effect) is responsible for the
large waves observed onshore, which can flood and devastate significant areas close to
the shores.
Equations (1) and (2) are solved in spherical coordinates by means of a finite-
difference method, centered in time, and using an upwind scheme in space (HEINRICH
et al., 1998; HEBERT et al., 2001a). To deal with shoaling and resonance effects close to
the shores, tsunamis are simulated over a set of nested bathymetric grids characterized by
an increased resolution close to the shores. The numerical stability is ensured under the
Courant-Friedrich-Lewy condition defining the time step Dt such as Dt < < Dx/c, where c
is the wave velocity and Dx the grid cell dimension.
In this study we use five levels of imbricated grids to compute proper amplification in
the Marquesas bays. The grids used have been briefly described in previous works, and
have been validated for various scenarios allowing definition of hazard maps for the
Marquesas (SLADEN et al., 2007a and 2007b). In addition to the 4’ grid describing the
ocean, derived from ETOPO2 dataset (SMITH and SANDWELL, 1997), they consist of a 1’
grid describing the archipelago, a 300-m grid describing the surroundings of Nuku Hiva
Island, a 60-m grid describing the approach to the Taiohae Bay and finally a 15-m grid
describing the Taiohae bay. This latter high resolution grid includes topographic data
allowing to compute runup, through a method extrapolating values on wet cells towards
dry cells (KOWALIK and MURTY, 1993). Even though these grids are available for several
bays in the Marquesas, we present here results for the Taiohae Bay, where the tide gauge
recorded well the 2007 tsunami waves.
3.2 Constraints Given by the DART Sensors
The tsunami triggered by the 15 August 2007 Peruvian earthquake was well recorded
by the Chilean DART 32401 (Deep-ocean Assessment and Reporting of Tsunamis)
deployed off Chile (see location on Fig. 1), and operated within the frame of the Pacific
Tsunami Warning System by the Chilean Hydrographic and Oceanographic Service of
the Chilean Navy (SHOA). On the 15 August 2007, this DART sensor was the only one
to record the tsunami in the ocean in this area close to the epicenter. The signal exhibits a
6-cm positive first wave confirming the propagation of significant tsunami waves in the
ocean (Fig. 4a), and observed about 50 minutes after the quake. These data, compared to
modeling results based on precomputed scenarios, enable the identification of the regions
of highest tsunami exposure, a few hours after the main shock. For instance, 4 to 5 hours
after the quake, the Short-term Inundation Forecasting for Tsunami (SIFT) delivered a
map of maximum expected wave heights showing that French Polynesia was within one
of the maximum lobes (now revised on http://nctr.pmel.noaa.gov/peru20070815.html;
WEI et al., 2008).
A second DART system (DART 51406), located in the central Pacific Ocean (see
location on Fig. 1) also recorded the tsunami waves, with peak-to-trough amplitudes not
exceeding 4 cm (Fig. 4b). This record was however originally substantially noisier than
Vol. 166, 2009 The 15 August 2007 Peru Tsunami 219

that recorded at DART 32401, and the recently revised signal available on the NOAA
NDBC (National Data Buoy Center) surprisingly exhibited a negative leading wave while
the original signal only contained a high-frequency signal probably related to the
triggering of high-frequency acquisition when the tsunami waves arrive. Modeling results
described later will also indicate that this negative leading wave may not be the actual
Figure 4
Tsunami records on two DART systems (Deep ocean Assessment and Reporting of Tsunamis) in the Pacific
Ocean (see their location on Fig. 1). For each DART, the raw signal is displayed in the lower panel. The signal is
filtered using a Gaussian filter removing periods larger than 120 min, and the residual is shown in each upper
panel. The grey area in the bottom indicates the focus displayed on the upper panel. The time of the earthquake
is recalled with the grey line. For DART 51406, some erroneous points occurring on the first trough were
removed. High-frequency signals originally present in the dataset at the time of tsunami arrival were located at
the present negative leading wave (around 7 h) (see text).
220 H. Hebert et al. Pure appl. geophys.,

tsunami signal; all the more as the coseismic deformation due to a subduction earthquake
is not expected to produce a negative leading wave oceanwards.
Our objective here was not originally to invert tsunami data to recover the fault pattern,
since the records available do not favor a good azimuthal distribution, and detailed
modelings in Peruvian bays where tide gauges could be available, and improve the coverage,
require considerable effort beyond our purpose. However, preliminary tests on the single
DART 32401 record showed that the inversion yielded an interesting fault pattern, not
completely consistent with seismological inversions, however worthy of examination.
We defined 12 subfaults in the epicentral area, covering the aftershock area,
characterized by 50 9 50 km2 dimensions, and with a mean geometry close to those used
in seismological inversions (using the focal geometry published by the Harvard CMT:
strike 324�, dip 27� and rake 64�) (Fig. 5a). The Green’s functions corresponding to each
subfault were computed using the linear version of the equations, using here the 2’
bathymetric grid taken from ETOPO2. Then the inversion to recover the slip distribution
was simply performed using the Non-Negative Least-Square method which we already
used in the Indian Ocean (SLADEN and HEBERT, 2008).
Figure 5
Slip values obtained when inverting the DART 32401 data on 50 9 50 km2 subfaults. The slip pattern is
significantly different from the one obtained in Figure 3, and concentrates considerable slip in shallower parts of
the fault, although also in the area south of Pisco
Vol. 166, 2009 The 15 August 2007 Peru Tsunami 221

Synthetical tests performed with the checkerboard approach underlined the need to
use only the first waveforms of the DART signal (about 120 min). However, regardless of
the approach and the time window used, the inversion was not robust for the deeper part
of the fault involved, whereas the inversion led to a shallow pattern close to the one input
for the shallowest sub-faults.
Using only the DART 32401 on a time window of 120 minutes, the obtained slip
distribution (Fig. 5) does not appear to be extremely consistent with the body-wave
seismological inversion. The common point is a high slip southwards of Pisco and the
Paracas Peninsula, retrieved in most of the published seismological inversions. However,
the average correlation between the low-slip area and the aftershock sequence almost
disappears, and significant slip appears in the shallowest part of the source area. This may
result from the poor robustness evidenced in synthetical tests as regards the deepest part
of the fault. Thus contrary to the seismological inversion, one of the highest slip areas is
in the shallowest portion of the fault, and, more generally, the sub-faults characterized by
the highest slip values are complementary to those found using seismological data. The
obtained model yields a seismic moment of 1.1 1021 Nm.
The tsunami waves due to the different earthquake and tsunami sources have been
modeled and compared to the available data. The model derived from the DART inversion
obviously does match very well the DART 32401 signal, for the 120 minutes considered
in the inversion, and also for the subsequent long wavelength trends (Fig. 6) (the RMS
obtained from the inversion process was smaller than 1 cm). By comparison, neither the
PDFM nor the body-wave inversion is able to fit the first recorded peak of the tsunami,
which exhibits a shorter period and a higher amplitude compared to the modeling results.
Both seismological inversions indeed provide a zero-to-peak amplitude never exceeding
2 cm, compared to the 5 cm observed amplitude. These sources are thus unable to produce
the high and narrow observed peak that probably arises from a shallow source.
3.3 Comparison with DART 51406
The data recorded by the DART 51406, of poorer quality, are not very satisfactorily
fit by any of the models tested (Fig. 7). Whereas all models yielded arrival times rather
correct for DART 32401, only the time arrival due to the body-wave inversion is close to
the signal inception. However, as mentioned before, the signal of the DART 51406 is
rather suspect in the minutes preceding the apparent arrival, and a 15-min shift in tsunami
modeling, in deep water, is rather surprising. Thus we cast doubts on the quality of this
record.
However, it is worth noting that for this DART record, the tsunami model using the
body-wave inversion model (Fig. 7, middle) has already lost more energy than the
tsunami model using the PDFM inversion as a source (Fig. 7, top): the amplitudes rather
similar for both models on DART 32401 are now lower by at least 50% for the DART
51406. This confirms that this model may be characterized by shorter tsunami periods
(shorter slip patches) that are less efficiently propagated across the ocean in a non-
222 H. Hebert et al. Pure appl. geophys.,

dispersive model. On the other hand, an average uniform slip along the entire fault (as
assumed with PDFM) generates longer tsunami periods losing less energy in the far field.
The model taken from the inversion of a single DART produces an amplitude apparently
close to the one observed (Fig. 7, bottom).
3.4 Tsunami Pattern in the Pacific Ocean
The maximum water heights computed after 13 hours of propagation have been
plotted (Fig. 8). They underline the less energetic tsunami when the model uses the
Figure 6
Comparison of tsunami modeling results with the tsunami observation on DART 32401, for various source
models.
Vol. 166, 2009 The 15 August 2007 Peru Tsunami 223

results of the body-wave inversion as a source (Fig. 8, middle) which is associated with
the smallest seismic moment retrieved. The most energetic model is derived from the
PDFM inversion and also from the DART inversion, with both patterns being rather
close. The PDFM model is weaker towards the region south to the source, probably due
to the azimuth’s inconsistency with tectonics, whereas the body wave and the DART
models use an azimuth derived from CMT, more consistent with the subduction direction.
As usual, the bathymetric features characterizing the oceanic seafloor strongly guide
the distribution of tsunami maximum values (HEBERT et al., 2001a, b and 2007), from the
Nazca Ridge close to the source, to the alignments of the southeast Pacific. The fracture
Figure 7
Same as Figure 6, for the central Pacific DART 51406. Note that all tsunami models exhibit a positive first
arrival not consistent with the negative arrival obtained when the raw data are filtered and de-tided, casting
doubt on this part of the observed signal.
224 H. Hebert et al. Pure appl. geophys.,

Figure 8
Maximum water heights in the Pacific Ocean, computed after thirteen hours of propagation, and for the
three principal source models. The poorly constrained DART inversion is only slightly different from the
pattern obtained using the PDFM inversion, except for the area south of the source area. The tsunami model
based on the body-wave inversion is significantly lower.
Vol. 166, 2009 The 15 August 2007 Peru Tsunami 225

zones also probably trap part of the tsunami energy, such as the Marquesas Fracture Zone
that may catch one of the principal lobes just before its arrival in the archipelago (Fig. 8).
The central lobe, present for all the sources, is probably influenced by a series of shallow,
localized seamounts forming the Sala y Gomez alignment, that relay and favor the
propagation of highest amplitudes.
Finally, the source taken from body-wave inversion (Fig. 8, middle) only radiates,
moderately across the ocean, consistent with the results presented. As for all the models,
the Nazca Ridge and Sala y Gomez alignment trap part of the energy at the beginning of
the propagation and subsequentially towards the central Pacific Ocean.
4. Observations and Modeling Results in the Marquesas
4.1 Context
In French Polynesia, one of the most important natural hazards is the tsunami hazard,
mainly arising from the central location of the Polynesian Islands in the Pacific Ocean,
where transoceanic tsunamis occur several times a century (SCHINDELE et al., 2006).
Among the archipelagos, the Marquesas are the most sensitive to these long waves
originating around the Pacific, because these high volcanic islands, contrary to the low
atolls, are not protected by any coral reef and offer wide bays directly open towards the
ocean. In addition, submarine slopes are very mild in the 0–200-m bathymetric range and
favor the tsunami amplification when the wave celerity decreases close to the coast. In the
1990’s several tsunamis originating from Japan, Peru, Chile and Mexico, caused varied
damage in the Marquesas, from almost unnoticed (in 1994, from Kurile, and 1995, from
Mexico), to a significant flooding (in 1995, from Chile and 1996, from Peru), especially
in the Tahauku Bay (Hiva Oa) (GUIBOURG et al., 1997; HEINRICH et al., 1998; HEBERT
et al., 2001a). As mentioned before, the key source parameter controlling the impact in
the far field is the fault azimuth, posing a significant hazard level for tsunamis triggered in
the Tonga, the Aleutian and the Peru-Chile events (HEBERT et al., 2001b; SLADEN et al.,
2007a, b). More generally, most of the major historical tsunamis triggered in these
regions have been observed in the Marquesas (OKAL et al., 2004; OKAL and HEBERT, 2007;
SCHINDELE et al., 2006).
4.2 Observations
Within the Polynesian tsunami warning system operated in the frame of the basin-
wide Pacific Tsunami Warning System, four tide gauges are deployed in harbors and
designed for real-time transmission: one in Tahiti (Papeete harbor), one in Mangareva
(Rikitea), and two in the Marquesas (Taiohae Bay in Nuku Hiva and Tahauku Bay in
Hiva Oa). In August 2007, unfortunately only one gauge was recording, in Taiohae, with
a sampling rate of 2 minutes.
226 H. Hebert et al. Pure appl. geophys.,

The tsunami arrival is observed at low tide, at about midnight local time (10 h UTC
on 16 August) (Fig. 9). When de-tided, the signal exhibits a series of waves with rather
constant periods (about 15 min). This noteworthy monochromatic behavior has already
been observed for this wide bay where the period of resonance always seems to be close
to 15 minutes (HEBERT et al., 2001a). On the 15 August 2007, the peak-to-trough
amplitudes reach 50 cm during the first 2 hours, and even 60 cm about 2 hours after the
arrival. The tsunami arrivals last at least 4 hours, and clearly decrease after 5 hours. A
relative increase of the amplitudes also occurs at about 12 h UTC, 2 hours after the first
arrivals. This may reflect a delayed arrival due to scattered tsunami waves, and a detailed
study of the animated, computed oceanic free surfaces indeed indicates that the Tuamotu
Plateau located about 500 km southwest the Marquesas may be a good candidate for this
secondary source.
4.3 Modeling Results in Taiohae (Nuku Hiva)
The model using the seismological PDFM inversion provides amplitudes rather close
to the observed amplitudes, but for the 4 to 6 first waves (Fig. 10, top). Thereafter the
amplitudes computed increase and exceed the observed signal by at least 40 to 50%. The
tsunami waves computed using the source derived from body-wave inversion (Fig. 10,
middle) are constantly too low for the first waves, and are close to the observation about
Figure 9
Tide gauge signal observed in Taiohae Bay (Nuku Hiva Island, Marquesas Archipelago) on 16 August. The raw
signal (bottom) is de-tided using a Gaussian filter removing periods larger than 120 min (same as data in Fig. 4),
yielding the residual (top). Note the duration of the signal amounting to about five hours.
Vol. 166, 2009 The 15 August 2007 Peru Tsunami 227
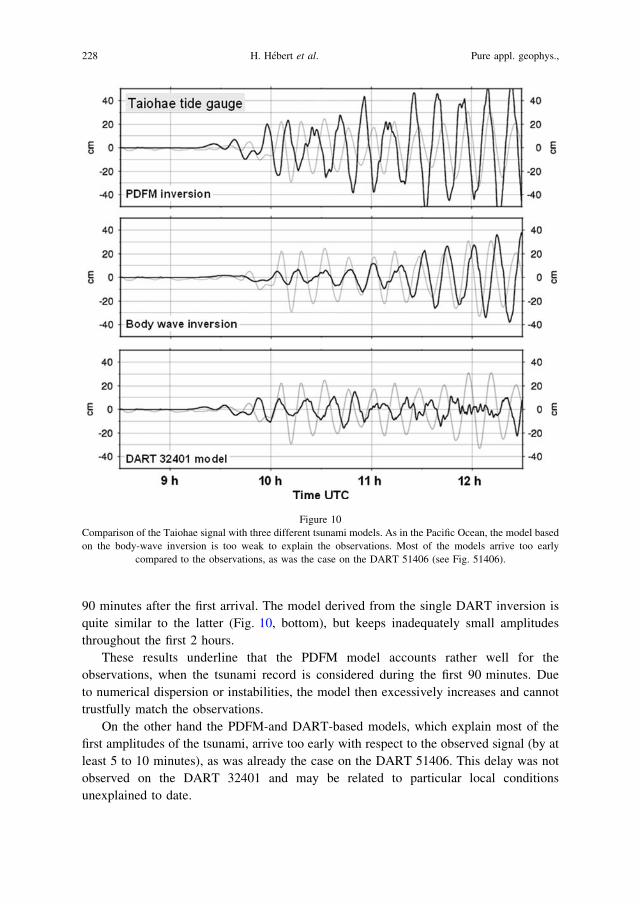
90 minutes after the first arrival. The model derived from the single DART inversion is
quite similar to the latter (Fig. 10, bottom), but keeps inadequately small amplitudes
throughout the first 2 hours.
These results underline that the PDFM model accounts rather well for the
observations, when the tsunami record is considered during the first 90 minutes. Due
to numerical dispersion or instabilities, the model then excessively increases and cannot
trustfully match the observations.
On the other hand the PDFM-and DART-based models, which explain most of the
first amplitudes of the tsunami, arrive too early with respect to the observed signal (by at
least 5 to 10 minutes), as was already the case on the DART 51406. This delay was not
observed on the DART 32401 and may be related to particular local conditions
unexplained to date.
Figure 10
Comparison of the Taiohae signal with three different tsunami models. As in the Pacific Ocean, the model based
on the body-wave inversion is too weak to explain the observations. Most of the models arrive too early
compared to the observations, as was the case on the DART 51406 (see Fig. 51406).
228 H. Hebert et al. Pure appl. geophys.,

Finally we also took the opportunity to study the effect of bottom friction in the Taiohae
harbor on the modeling results. Several formulations of the bottom friction exist in the
literature; one of the most frequent involves the Chezy friction coefficient that depends on
the Reynolds number and the seabottom roughness (LIU et al., 1994). We tested here
several values of the Chezy coefficient that are uniformly ascribed to the Taiohae Bay. For
a Chezy coefficient of 30, the waveforms computed are not very different from the
waveform computed without any friction, nonetheless the differences become significant
as soon as the Chezy coefficient decreases to 20 (differences of 5 to 10%) and even to 10
(differences reaching 40%) (Fig. 11). The friction is more perceptible after the first tsunami
waves (from 11 h UTC), when precisely the previous modeling results tend to overestimate
the observations. Thus allowing for the seabottom friction may sound reasonable to
improve the fit of late observations. Unfortunately, the Chezy coefficient required to
improve this match is very low (10), and is usually considered only for areas covered with
buildings or dense forests (MADER and CURTIS, 1991). Thus it is rather unlikely that such a
coefficient is physically realistic in the Taiohae Bay, however it highlights the need for
dissipation terms in our modeling of the late tsunami arrivals.
5. Discussion and Conclusion
This study allows us to discuss the main features of the 15 August 2007 earthquake
that triggered a significant tsunami. The inversion of the seismic moment tensor provides
a moment magnitude of 8.0 consistent with other results, and evidences a mean azimuth
not strictly consistent with the regional trench direction. However, this azimuth is in
proximity to the mean direction defined by the two main slip patches identified in the
body-wave teleseismic inversion. This inversion yields an important patch just in the
region south of Pisco, in good agreement with the major damage observed here, and a
second patch confined to the deepest part of the trench, to the northwest of the first patch.
Figure 11
Effect of the friction term on the tsunami modeling in Taiohae Bay. The observation is displayed with the
dashed line. The modeling results (solid lines) are plotted for a model without friction (light grey), with a Chezy
coefficient of 20 (dark grey) and of 10 (black).
Vol. 166, 2009 The 15 August 2007 Peru Tsunami 229

Although it should not be considered as too robust, the inversion of the single DART
data having recorded the tsunami close to the source area has been carried out. The slip
pattern obtained is disparate from the one obtained by the body-wave inversion,
confirming the fact that the tsunami waves are obviously more influenced by the lower
frequency component of the earthquake source, and not that sensitive to details less than
50 km in extent.
It may also be illusory to recover the slip pattern on the actual fault thanks to tsunami
data only, especially with a single DART record. Indeed inversion of tsunami data should
more likely be used to recover the initial seafloor deformation, since imaging the rupture
on the fault plane implies additional uncertainties depending on the subduction zone
characteristics, including many uncertainties on the sediment cover. The direct inversion
of the seafloor deformation would avoid the construction of sub-fault fixed geometries
that can be unsuitable for some earthquakes (either the geometry or the mechanical
properties input in the elastic model). Regardless the tsunami modeling of the DART-
derived source, though underestimating the observation, provides a valuable complement
to the inversion of seismic moment tensor to improve the tsunami warning in the far field.
To date the distribution of DART buoys is not homogeneous off the major subduction
zones, although in the future, inversions including seismological, GPS and tsunami data,
should greatly contribute to advancing the accuracy of tsunami warnings.
This study also allowed us to discuss the coastal impact of the tsunami in French
Polynesia, where unfortunately only one tide gauge was able to record the waves. The
observed wave train persists about five hours, with a relative maximum occurring two
hours after the first arrival. These data are best fit using the model derived from the
PDFM inversion, while the source model derived from the body-wave inversion and the
DART inversion are rather excessively low. After the two first hours of signal, the best
models overestimate the observations. Adding seafloor friction allows to improve the fit,
however the coefficient that must be input is poorly realistic in terms of the nature of
seafloor. These results remind us that tsunami modeling is usually correct for the first
wave trains, and that our method requires additional dissipation for the subsequent wave
trains.
In conclusion this study is also promising regarding the tools that can be developed
for real-time tsunami warning. An efficient inversion of surface waves together with
tsunami data should facilitate definition of a realistic source for the tsunami waves
underway. The current computing capacity allows for the estimation of the sea-level
heights in remote places in the first hours following the event, readily in advance with
respect to the actual arrival, and the improvement of parallel computing should
significantly decrease this computing duration to consider real-time computing as feasible
in the shortterm. This, of course, should be complementary to the precomputed database,
an element necessary for the inversion of tsunami data. Despite its complex rupture
pattern, partially beneath the coast, the 2007 Peru earthquake gives some reliable
indications towards this purpose, showing that the amplitudes of the remote first wave
trains are well forecasted.
230 H. Hebert et al. Pure appl. geophys.,

Acknowledgements
The original manuscript benefited from constructive reviews by S. Weinstein and
S. Barrientos. This work was partly supported by French Agence Nationale de la Recherche
under contract ANR-05-CATT-016-01. We thank Anthony Sladen for fruitful discussions
regarding his early models and tsunami observations in Peru. Support from CEA is also
acknowledged. Figures were drawn using the GMT software (WESSEL and SMITH, 1998).
REFERENCES
CHLIEH, M., DE CHABALIER, J.-B., RUEGG, J.-C., ARMIJO, R., DMOWSKA, R., CAMPOS, J., and FEIGL, K.L. (2004),
Crustal deformation and fault slip during the seismic cycle in the North Chile subduction zone, from GPS and
InSAR observations, Geophys. J. Int. 158, 695–711.
COMTE, D. and PARDO, M. (1991), Reappraisal of great historical earthquakes in the Northern Chile and
Southern Peru seismic gaps, Nat. Hazards 4, 23–44.
DELOUIS, B., MONFRET, T., DORBATH, L., PARDO, M., RIVERA, L., COMTE, D., HAESSLER, H., CAMINADE, J.P., PONCE,
L., KAUSEL, E., and CISTERNAS, A. (1997), The Mw = 8.0 Antofagasta (Northern Chile) earthquake of 30 July
1995: A precursor to the end of the large 1877 gap, Bull. Seismol. Soc. Am. 87 (2), 427–445.
DORBATH, L., CISTERNAS, A., and DORBATH, C. (1990), Assessment of the size of large and great historical
earthquakes in Peru, Bull. Seismol. Soc. Am. 80, 551–576.
DZIEWONSKI, A.M. and ANDERSON, D.L. (1981), Preliminary reference Earth model, Phys. Earth Planet. Inter. 25,
197 – 256.
FRITZ, H. M., KALLIGERIS, N., BORRERO, J.C., BRONCANO, P., and ORTEGA, E. (2008), The 15 August 2007 Peru
tsunami runup observations and modeling, Geophys. Res. Lett. 35, L10604, doi:10.1029/2008GL033494.
GUIBOURG, S., HEINRICH P., and ROCHE, R. (1997), Numerical modeling of the 1995 Chilean tsunami. Impact on
French Polynesia, Geophys. Res. Lett. 24, 775–778.
HEBERT, H., HEINRICH, P., SCHINDELE, F., and PIATANESI, A. (2001a), Far-field simulation of tsunami propagation in
the Pacific Ocean: Impact on the Marquesas Islands (French Polynesia), J. Geophys. Res. 106, C5, 9161–9177.
HEBERT, H., SCHINDELE, F., and HEINRICH, P. (2001b), Tsunami risk assessment in the Marquesas Islands (French
Polynesia) through numerical modeling of generic far-field event, Nat. Hazards Earth Syst. Sci. 1, 233–242.
HEBERT, H., SLADEN, A., and SCHINDELE, F. (2007), Numerical modeling of the Great 2004 Indian Ocean Tsunami
focus on the Mascarene Islands, Bull. Seismol. Soc. Am. 97, 1A, S208–S222.
HEINRICH, P., SCHINDELE, F., GUIBOURG, S., and IHMLE, P. (1998), Modeling of the February 1996 Peruvian
tsunami, Geophys. Res. Lett. 25, 2687–2690.
HSU, Y., SIMONS, M., AVOUAC, J., GALETZKA, J., SIEH, K., CHLIEH, M., NATAWIDJAJA, D., PRAWIRODIRDJO, L., and
BOCK, Y. (2006), Frictional afterslip following the 2005 Nias-Simeulue earthquake, Science 312, 1921–1926.
KENDRICK, E., BEVIS, M., SMALLEY, R.J., BROOKS, B., VARGAS, R.B., LAURIA, E., and FORTES, L.P.S. (2003), The
Nazca-South America Euler vector and its rate of change, J. South Amer. Earth Sci. 16, 125–131.
KONCA, A., HJORLEIFSDOTTIR, V., SONG, T. R.-A., AVOUAC, J.-P., HELMBERGER, D., Ji, C., SIEH, K., BRIGGS, R., and
MELTZNER, A. (2007), Rupture kinematics of the 2005, Mw 8.6, Nias-Simeulue earthquake from the joint
inversion of seismic and geodetic data, Bull. Seismol. Soc. Am. 97, S307–322.
KOWALIK, Z. and MURTY, T.S. (1993), Numerical simulation of two-dimensional tsunami runup, Marine Geodesy
16, 87–100.
LIU, P.L.-F., CHO, Y.-S., YOON, S.B., and SEO, S.N. (1994), Numerical simulations of the 1960 Chilean tsunami
propagation and inundation at Hilo, Hawaii. In, Y. Tsuchiya, N. Shuto, (eds.), Tsunami: Progress in
Prediction, Disaster Prevention and Warning. Advances in Natural and Technological Hazards Research, vol.
4. (Kluwer Academic Press, 1994), pp. 99–115.
MADER, C.L. and CURTIS, G. (1991), Modeling Hilo, Hawaii tsunami inundation, Sci. Tsunami Hazards 9, 85–94.
OKADA, Y. (1985), Surface deformation due to shear and tensile faults in a half-space, Bull. Seismol. Soc. Am.
75, 1135–1154.
OKAL, E.A., and TALANDIER, J. (1989) Mm: A variable-period mantle magnitude, J. Geophys. Res. 94, 4169–4193.
Vol. 166, 2009 The 15 August 2007 Peru Tsunami 231

OKAL, E.A. and REYMOND, D. (2003), The mechanism of the great Banda Sea earthquake of 01 February 1938:
Applying the method of Preliminary Determination of Focal Mechanism to a historical event, Earth Planet.
Sci. Lett. 216, 1–15.
OKAL, E.A. BORRERO, J.C., and SYNOLAKIS, C.E. (2004), The earthquake and tsunami of 17 November 1865:
Evidence for far-field tsunami hazard from Tonga, Geophys. J. Int. 157, 164–174.
OKAL, E.A. and HEBERT, H. (2007), Far-field modeling of the 1946 Aleutian tsunami, Geophys. J. Int. 169, 1229–1238.
REYMOND, D., HYVERNAUD, O., and TALANDIER, J. (1991), Automatic detection, location and quantification of
earthquakes: Application to Tsunami Warning, Pure Appl. Geophys. 135, 361–382.
REYMOND, D. and OKAL, E.A. (2000), Preliminary determination of focal mechanisms from the inversion of
spectral amplitudes of mantle waves, Phys. Earth Planet. Inter. 121, 249–271.
REYMOND., D., OKAL, E.A., HEBERT, H., and LOEVENBRUCK, A. (2007), Far-field tsunami amplitude estimations from
numerical simulations and empirical laws, Eos Trans. AGU 88 (52), Fall Meet. Suppl., Abstract S53A–1037.
ROMANOVICZ, B.A. and SUAREZ, G. (1983), On an improved method to obtain the moment tensor and depth of
earthquakes from the amplitudes spectrum of Rayleigh waves, Bull. Seismd. Soc. Am. 73, 1513–1526.
SCHINDELE, F., HEBERT, H., SLADEN, A., and REYMOND, D. (2006), L’alea tsunami en Polynesie francaise: synthese
des observations et des mesures, C. R. Geoscience 338, 1133–1140.
SCHINDELE, F., REYMOND, D., GAUCHER, E., and OKAL, E.A. (1995), Analysis and automatic processing in near-
field of the eight 1992–1994 tsunamigenic earthquakes: Improvements in real-time tsunami warning, Pure
Appl. Geophys. 144, 381–408.
SLADEN, A. and HEBERT, H. (2008), On the use of satellite altimetry to infer the earthquake rupture
characteristics: application to the 2004 Sumatra event, Geophys. J. Int. 172, 707–714.
SLADEN, A., HEBERT, H., SCHINDELE, F., and REYMOND, D. (2007a), Evaluation of far-field tsunami hazard in French
Polynesia based on historical data and numerical simulations, Nat. Hazards Earth Syst. Sci. 7, 195–206.
SLADEN, A., HEBERT, H., SCHINDELE, F., and REYMOND, D. (2007b), L’alea tsunami en Polynesie francaise:
Apports de la simulation numerique, C. R. Geoscience 339, 303–316.
SLADEN, A., KONCA, O., FIELDING, E., PERFETTINI, H., AUDIN, L., TAVERA, H., AVOUAC, J.-P., SIMONS, M., and
HELMBERGER, D. (2007c), Source characteristics of the 2007 Pisco earthquake (Mw = 8.0), Central Peru, EOS
Trans. AGU 88 (52), Fall Meet. Suppl., Abstract S13A–1055.
SMITH, W.H.F. and SANDWELL, D.T. (1997), Global seafloor topography from satellite altimetry and ship depth
soundings, Science 277, 1956–1962.
TALANDIER, J. and OKAL E.A. (1989), An algorithm for automated tsunami warning in French Polynesia, based
on mantle magnitudes, Bull. Seismol. Soc. Am. 79, 1177–1193.
TARANTOLA, A. (1987), Inverse Problem Theory: Methods for Data Fitting and Model Parameter Estimation
(Elsevier 1987), 613 pp.
VALLEE, M., and BOUCHON, M. (2004), Imaging coseismic rupture in far field by slip patches, Geophys. J. Int.
156, 615–630.
WEI, Y., BERNARD, E.N., TANG, L., WEISS, R., TITOV, V.V., MOORE, C., SPILLANE, M., HOPKINS, M., and KANOGLU,
U. (2008), Real-time experimental forecast of the Peruvian tsunami of August 2007 for U.S. coastlines,
Geophys. Res. Lett. 35, L04609, doi:10.1029/2007GL032250.
WESSEL, P., and SMITH W.H.F. (1998), New, improved version of Generic Mapping Tools released, EOS Trans.
AGU, 79 (47), 579. pp
(Received January 12, 2008, revised September 30, 2008, accepted October 14, 2008)
Published Online First: February 14, 2009
To access this journal online:
www.birkhauser.ch/pageoph
232 H. Hebert et al. Pure appl. geophys.,