Field Survey of the 27 February 2010 Chile Tsunami
24
1 23 Pure and Applied Geophysics pageoph ISSN 0033-4553 Volume 168 Number 11 Pure Appl. Geophys. (2011) 168:1989-2010 DOI 10.1007/s00024-011-0283-5 Field Survey of the 27 February 2010 Chile Tsunami Hermann M. Fritz, Catherine M. Petroff, Patricio A. Catalán, Rodrigo Cienfuegos, Patricio Winckler, Nikos Kalligeris, Robert Weiss, et al.
-
Upload
senavirtual -
Category
Documents
-
view
2 -
download
0
Transcript of Field Survey of the 27 February 2010 Chile Tsunami

1 23
Pure and Applied Geophysicspageoph ISSN 0033-4553Volume 168Number 11 Pure Appl. Geophys. (2011)168:1989-2010DOI 10.1007/s00024-011-0283-5
Field Survey of the 27 February 2010 ChileTsunami
Hermann M. Fritz, Catherine M. Petroff,Patricio A. Catalán, Rodrigo Cienfuegos,Patricio Winckler, Nikos Kalligeris,Robert Weiss, et al.

1 23
Your article is protected by copyright and all
rights are held exclusively by Springer Basel
AG. This e-offprint is for personal use only
and shall not be self-archived in electronic
repositories. If you wish to self-archive your
work, please use the accepted author’s
version for posting to your own website or
your institution’s repository. You may further
deposit the accepted author’s version on
a funder’s repository at a funder’s request,
provided it is not made publicly available until
12 months after publication.
Field Survey of the 27 February 2010 Chile Tsunami
HERMANN M. FRITZ,1 CATHERINE M. PETROFF,2 PATRICIO A. CATALAN,3 RODRIGO CIENFUEGOS,4 PATRICIO WINCKLER,5
NIKOS KALLIGERIS,6 ROBERT WEISS,7 SERGIO E. BARRIENTOS,8 GIANINA MENESES,8 CAROLINA VALDERAS-BERMEJO,8
CARL EBELING,9 ATHANASSIOS PAPADOPOULOS,6 MANUEL CONTRERAS,10 RAFAEL ALMAR,4 JUAN CARLOS DOMINGUEZ,4
and COSTAS E. SYNOLAKIS11,12
Abstract—On 27 February 2010, a magnitude Mw = 8.8
earthquake occurred off the coast of Chile’s Maule region causing
substantial damage and loss of life. Ancestral tsunami knowledge
from the 1960 event combined with education and evacuation
exercises prompted most coastal residents to spontaneously evac-
uate after the earthquake. Many of the tsunami victims were
tourists in coastal campgrounds. The international tsunami survey
team (ITST) was deployed within days of the event and surveyed
800 km of coastline from Quintero to Mehuın and the Pacific
Islands of Santa Marıa, Mocha, Juan Fernandez Archipelago, and
Rapa Nui (Easter). The collected survey data include more than
400 tsunami flow depth, runup and coastal uplift measurements.
The tsunami peaked with a localized runup of 29 m on a coastal
bluff at Constitucion. The observed runup distributions exhibit
significant variations on local and regional scales. Observations
from the 2010 and 1960 Chile tsunamis are compared.
Key words: Tsunami, wave runup, coastal uplift, Chile, South
Pacific Ocean.
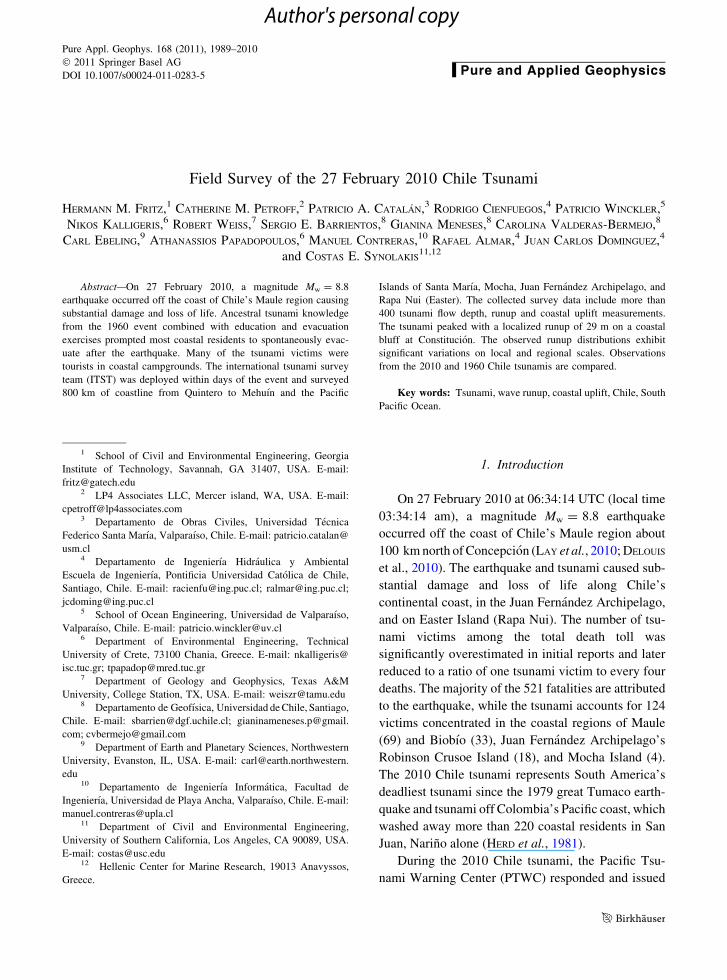
1. Introduction
On 27 February 2010 at 06:34:14 UTC (local time
03:34:14 am), a magnitude Mw = 8.8 earthquake
occurred off the coast of Chile’s Maule region about
100 km north of Concepcion (LAY et al., 2010; DELOUIS
et al., 2010). The earthquake and tsunami caused sub-
stantial damage and loss of life along Chile’s
continental coast, in the Juan Fernandez Archipelago,
and on Easter Island (Rapa Nui). The number of tsu-
nami victims among the total death toll was
significantly overestimated in initial reports and later
reduced to a ratio of one tsunami victim to every four
deaths. The majority of the 521 fatalities are attributed
to the earthquake, while the tsunami accounts for 124
victims concentrated in the coastal regions of Maule
(69) and Biobıo (33), Juan Fernandez Archipelago’s
Robinson Crusoe Island (18), and Mocha Island (4).
The 2010 Chile tsunami represents South America’s
deadliest tsunami since the 1979 great Tumaco earth-
quake and tsunami off Colombia’s Pacific coast, which
washed away more than 220 coastal residents in San
Juan, Narino alone (HERD et al., 1981).
During the 2010 Chile tsunami, the Pacific Tsu-
nami Warning Center (PTWC) responded and issued
1 School of Civil and Environmental Engineering, Georgia
Institute of Technology, Savannah, GA 31407, USA. E-mail:
[email protected] LP4 Associates LLC, Mercer island, WA, USA. E-mail:
[email protected] Departamento de Obras Civiles, Universidad Tecnica
Federico Santa Marıa, Valparaıso, Chile. E-mail: patricio.catalan@
usm.cl4 Departamento de Ingenierıa Hidraulica y Ambiental
Escuela de Ingenierıa, Pontificia Universidad Catolica de Chile,
Santiago, Chile. E-mail: [email protected]; [email protected];
[email protected] School of Ocean Engineering, Universidad de Valparaıso,
Valparaıso, Chile. E-mail: [email protected] Department of Environmental Engineering, Technical
University of Crete, 73100 Chania, Greece. E-mail: nkalligeris@
isc.tuc.gr; [email protected] Department of Geology and Geophysics, Texas A&M
University, College Station, TX, USA. E-mail: [email protected] Departamento de Geofısica, Universidad de Chile, Santiago,
Chile. E-mail: [email protected]; gianinameneses.p@gmail.
com; [email protected] Department of Earth and Planetary Sciences, Northwestern
University, Evanston, IL, USA. E-mail: [email protected].
edu10 Departamento de Ingenierıa Informatica, Facultad de
Ingenierıa, Universidad de Playa Ancha, Valparaıso, Chile. E-mail:
[email protected] Department of Civil and Environmental Engineering,
University of Southern California, Los Angeles, CA 90089, USA.
E-mail: [email protected] Hellenic Center for Marine Research, 19013 Anavyssos,
Greece.
Pure Appl. Geophys. 168 (2011), 1989–2010
� 2011 Springer Basel AG
DOI 10.1007/s00024-011-0283-5 Pure and Applied Geophysics
Author's personal copy

warnings 5 min after the earthquake, but because the
tsunami arrived within 30 min at many locations,
official evacuations and warnings by local authorities
were often not in place prior to the arrival of the
tsunami. Fortunately, most coastal residents in Chile
were aware of the tsunami risk and evacuated to high
ground as a result of ancestral tsunami knowledge,
regular evacuation drills and education programs
(MARIN et al., 2010). Most of the tsunami victims
were Chilean tourists enjoying a late summer week-
end and staying overnight in low-lying coastal
campgrounds.
The 27 February 2010 Maule earthquake was at
the time the fifth largest event instrumentally recorded
and filled the longest standing seismic gap in Chile.
The epicenter was located in the center of the Con-
cepcion–Constitucion area [35–37�S] in south-central
Chile, identified as a mature seismic gap by RUEGG
et al. (2009). Pre-event estimates of a potential
earthquake of 8.0 \ Mw \ 8.5 based on the accumu-
lated slip deficit over the past 175 years were
conservative. The last large subduction zone earth-
quake in this south-central Chile region occurred on
20 February 1835 (DARWIN, 1851) and was of a similar
estimated magnitude, close to Mw & 8.5 (LOMNITZ,
1970; BECK et al., 1998). The rupture zone of the 2010
event was situated immediately to the north of the
rupture zone associated with the great 1960 earth-
quake with Mw = 9.5 (PLAFKER and SAVAGE, 1970;
KANAMORI, 1977; CIFUENTES, 1989) and south of the
rupture zones corresponding to the 1928 Talca
earthquake (BECK et al., 1998) and the 1906 and 1985
Valparaiso earthquakes (BARRIENTOS, 1995). Part of
the region was affected by the 1939 Chillan earth-
quake Mw = 7.9, which was a slab-pull event with
release of tensional stresses within the down-going
slab (CAMPOS and KAUSEL, 1990; BECK et al., 1998).
Further north, the Talca earthquake of 1 December
1928, was interpreted as a shallow dipping thrust
event (LOMNITZ, 1970; BECK et al., 1998).
2. Post-Tsunami Reconnaissance
The surveys took place using three integrated
survey groups from 7 to 24 March 2010 covering an
800 km stretch of south-central Chilean coastline
from Quintero to Mehuın, including Santa Marıa
Island in the Gulf of Arauco, Easter Island and
Robinson Crusoe Island in the Juan Fernandez
Archipelago. A follow-up survey from 21 to 23 May
2010 focused on Mocha Island. Aerial reconnaissance
flights were conducted between Pelluhue and the
Arauco peninsula as well as over Robinson Crusoe
and Mocha Islands. The survey teams documented
tsunami runup, flow depth and inundation; wave
induced deposition or erosion, structural damage and
interviewed eyewitnesses using established protocols
(SYNOLAKIS and OKAL, 2005). The Chile survey data
recorded 419 tsunami runup and flow depth mea-
surements shown in Fig. 1 and Appendix Table 1. At
most locations, the tsunami arrived as sea levels
passed through low tide (Fig. 2). Measured data were
corrected for tide level at the time of tsunami arrival
on the basis of tide predictions provided by the
United Kingdom Hydrographic Office (pers. comm.:
Christopher Jones, Head of Tides, UKHO). A sig-
nificant variation in tsunami impact was observed
along Chile’s mainland at both local and regional
scales (Fig. 3).
The tsunami impact peaked with a localized
maximum runup of 29 m at Constitucion along a
steep coastal bluff (Fig. 3a). To the north of Con-
stitucion the runup distribution exhibited a decaying
trend with runup heights typically between 5 and
10 m exceeded only by a high point of 14 m runup on
a coastal bluff within 70 m of the shoreline at Caleta
de Mostazal (Fig. 3c), 35 km south of San Antonio.
Further to the north, runup remained uniformly below
5 m with typical heights of 3 m in the greater Val-
paraıso area. Nevertheless, at Llolleo, a campground
on low-lying ground along a lagoon adjacent to the
south of Chile’s main container terminal at San
Antonio was washed away during the tsunami. Low-
lying coastal dunes stabilized by vegetation offered
partial protection to some coastal communities such
as Punta de Lobos. Variable runup heights within a
5–15 m range were observed between Constitucion
and Punta Morguilla some 300 km to the south. In a
few significant cases, however, runup heights
decreased below 5 m along this stretch of coastline.
These included the epicentral area at Cobquecura as
well as the east coasts inside the Bay of Concepcion
and the Gulf of Arauco. Further to the south between
1990 H. M. Fritz et al. Pure Appl. Geophys.
Author's personal copy

Punta Morguilla and Mehuın the runup remained
mostly below 5 m with exception of the greater Tirua
area. A 20 m runup spike was measured along a
coastal bluff within 70 m of the exposed shoreline to
the south of the Tirua river mouth (Fig. 3f), while
13 m runup on nearby sand dunes along wide beaches
to the north of the river are more representative.
Throughout the affected area, eyewitnesses
reported one to four main waves usually with an
initial recession, which would correspond to the
leading depression N-wave predicted by the model of
TADEPALLI and SYNOLAKIS (1994). At most locations,
the first wave arrived within 30 min of the earth-
quake. Subsequent late arriving waves during the
morning daylight hours after the earthquake were
observed and recorded on cell phone videos by eye-
witnesses on the south shores of the U-shaped and
northward facing Bay of Dichato, the Bay of Con-
cepcion and the Gulf of Arauco, as well as on the
north shores of bays located north of the rupture zone,
such as the Bay of Quintero. These reports remain to
be explained.
The variability of tsunami impact at a local scale is
highlighted at Constitucion and along the Maule River
(Fig. 4). Here, the tsunami peaked with a localized
maximum runup of 29 m on a coastal bluff within
120 m of the shoreline along transect A situated less
than 2 km south of the Maule River mouth (Fig. 3a,
Fig. 4b). At Playa Calabocillos only 1.2 km further
south, however, the tsunami runup remained below
40
39
38
37
36
35
34
33
Latit
ude
(o S)
71727374757677787980 70 69
051015202530Tsunami Height [m]
2010 EQ1960 EQ
Flow DepthRunup
RobinsonCrusoeIsland
Valparaíso
San Antonio
Navidad
Pichilemu
Iloca
Constitución
Pelluhue
Cobquecura
Dichato
Concepción/Talcahuano
SantaMaria
AraucoLebu
Punta Morguilla
Tirúa
Puerto Saavedra
Mehuín
Santiago
Curanipe
Juan Fernández Archipelago
CH
I LE
Mocha
Sou
thP
acifi
cO
cea
n
0510 50
0
Kilometers
Miles
100
25 50 75
Figure 1Tsunami flow depths and runup heights measured along 800 km of Chilean coastline from Quintero to Mehuın including the Islands of Santa
Marıa, Mocha, and Robinson Crusoe (Juan Fernandez Archipelago)
Vol. 168, (2011) Field Survey of the 27 February 2010 Chile Tsunami 1991
Author's personal copy

6 m along an open stretch of coastline facing due west,
while another 2.3 km farther south along the same
stretch of coastline the runup heights went back up to
18 m. The wooden huts of the low-lying campground
along the wide beach at Playa Calabocillos remained
miraculously untouched by the tsunami. Most other
campgrounds fared far worse. In Fig. 4, inside the
Maule River estuary a river-crossing transect (B1–B2)
was measured. The measurements along this transect
highlighted a north–south gradient in the water surface
across the Maule River (Fig. 4b). Fortunately the city
of Constitucion, situated on the southern bank, expe-
rienced relatively lower runup, but inundation still
reached 500 m. Orrego Island in the middle of the river
was completely submerged by the tsunami with a 10 m
flow depth. Dozens of campers enjoying the late
summer weekend and anticipating scheduled fire-
works over the island were washed away by the
tsunami. Eyewitnesses described the Maule River
branch between the island and the city falling dry prior
to the onslaught of the tsunami. It is likely that the
earthquake-generated panic and the darkness of the
night prevented any of the campers from attempting a
last minute dash across the dry riverbed. Some docu-
mentaries filmed at Constitucion are available online
(DISCOVERY, 2010 and CCTV, 2010).
Figure 2Tide gauge recordings of the tsunami in Chile with failures at Juan Fernandez and Talcahuano tide gauges
1992 H. M. Fritz et al. Pure Appl. Geophys.
Author's personal copy

Figure 3Mainland tsunami impact: (a) maximum runup of 29 m on a coastal bluff at Constitucion along transect A shown in Figure 4b; (b) trees bent
upriver 10 km from the Maule River mouth; (c) runup of 14 m marked by wrackline with octopus at Caleta Mostazal; (d) breached sand spit
at Pelluhue; (e) erosion along the river at Dichato; (f) runup of 20 m marked by brown vegetation at Tirua
Vol. 168, (2011) Field Survey of the 27 February 2010 Chile Tsunami 1993
Author's personal copy

Similarly, other campgrounds located in low-
lying coastal areas, such as at Pelluhue and Curanipe,
were also flooded by deadly tsunami waves.
Offshore-capable fishing boats were washed more
than 10 km up the Maule River, where trees bent
upriver (Fig. 3b), and eyewitness cell phone videos
documented tsunami propagation at least 15 km from
the river mouth. Inundation and damage occurred
more than a kilometer inland along several other
rivers such as at Coliumo and Tubul. In sharp contrast
to the variability in runup distribution, runup heights
on Sumatra from the 2004 Indian Ocean tsunami
35.37
35.35
35.33
35.31
72.47 72.45 72.43 72.41 72.39 72.37 72.35 72.330
5
10
15
20
25
30
Longitude (oW)
Tsu
nam
i Hei
ght [
m]
RunupFlow Depth
AB2
B1
Latit
ude
(o S)
C
o ns t i t u c ió n
43210km
Río M
a u l e
a
b
Isla Orrego
Pacic
Oce
anN
W
S
E
00
10
20
30
-5000 50 100 0 500 1000
5
10
Tsu
nam
i Hei
ght [
m]
Tsu
nam
i Hei
ght [
m]
15Flow DepthRunup
Distance [m]Distance [m]
Transect A Transect B1-B2
Road
Tree Constitución
Río Maule
Río Maule
IslaOrrego
Tree
Figure 4Variability of tsunami impact at Constitucion and along the Maule River: (a) survey point locations on post-tsunami satellite image (acquired:
7 March 2010 by NSPO Formosat 2) combined with measured flow depths and runup heights; (b) transect A with maximum runup of 29 m
along the coastal bluff and transect B1–B2 through Constitucion and across the Maule River channels and separated by Orrego Island, which
was completely overwashed by the tsunami
1994 H. M. Fritz et al. Pure Appl. Geophys.
Author's personal copy

were sustained at levels and inundation distances
exceeding runup spikes at Constitucion or Tirua
(BORRERO, 2005; BORRERO et al., 2006).
3. Observed Coastal Uplift
The coastline located south of the city of Con-
cepcion between 37 and 38�S is particularly
interesting regarding land-level changes. The Arauco
peninsula is an elevated terrace with respect to the
mean Chilean mainland shoreline. It shows evidences
of both quaternary and modern uplift (CAMPOS et al.,
2002). DARWIN (1851) reported 3 m of uplift at Santa
Marıa Island due to the 1835 earthquake. Further-
more, this area constitutes the limit between the
rupture zones of the 1835 and 1960 earthquakes. As
such, it might play an important role in the segmen-
tation of the subducting slab.
The 2010 Chile earthquake represents a unique
opportunity to characterize the co-seismic seafloor
displacements because the Arauco peninsula and both
Santa Marıa and Mocha Islands are in proximity of
the rupture (FARIAS et al., 2010). Coastal uplift was
measured on uplifted intertidal rocks, as well as on
navigation and port infrastructure using high tide
water lines and eyewitness accounts along a 100 km
stretch of coastline between Tumbes and Punta
37.5
36.5
Latit
ude
(°S
)
37.0
Longitude (°W)73.073.574.074.5 72.5
Tsunami Height [m]010 520 15
Flow DepthRunupUplift
Flow Depth
2010 Tsunami
1960 Tsunami
Dichato
Talcahuano
SantaMaria
Arauco
Lebu
PuntaMorguilla
Coronel
0
0
Kilometers
Miles
Concepción
TubulLlic
o
10 20 30
15105
N
W E
S
Figure 5Arauco peninsula, Bays of Concepcion and Dichato with measured tsunami runup and flow depths, as well as coastal uplift. Note: direct
comparison between flow depths of the 2010 and 1960 tsunami at an individual residence at Talcahuano
Vol. 168, (2011) Field Survey of the 27 February 2010 Chile Tsunami 1995
Author's personal copy

Morguilla (Fig. 5, Appendix Table 2). Uplift excee-
ded 3 m at Playa Quiapo and Caleta Piure located
between Lebu and Punta Lavapie of the Arauco
Peninsula. Santa Marıa Island was uplifted more than
2 m (Fig. 7e, f). The coastal uplift during the earth-
quake prior to tsunami arrival reduced the tsunami
impact. In the course of a few minutes, the Arauco
Peninsula and Santa Marıa Island acquired significant
new land, mostly uplifted rocks and wide beaches.
The uplift severely affects navigation at several
fishing ports including: Punta Morguilla, Lebu, Punta
Lavapie, Llico, Tubul and Santa Marıa Island’s
Puerto Norte and Puerto Sur. By comparison, co-
seismic land level changes during the 1960 Chile
earthquake ranged from 5.7 m uplift on Guamblin
Island to 2.7 m subsidence in Valdivia (PLAFKER and
SAVAGE, 1970). Similarly part of Ranongga Island
was uplifted by more than 3 m while adjacent Simbo
Island subsided by 2 m during the 1 April 2007
Solomon Islands earthquake of Mw = 8.1 (FRITZ and
KALLIGERIS, 2008).
4. Tsunami Observations on Chile’s Pacific Islands
Mocha Island is a 12 km long island located
30 km off the coast of south-central Chile’s mainland
near Tirua and southwest of the Arauco Peninsula.
During the past 6,000 years Mocha experienced a
38 m fall in relative sea level primarily due to
extremely rapid tectonic uplift recorded by 18 raised
marine terraces (NELSON and MANLEY, 1992). His-
torical accounts also document uplift during the 1835
and 1960 great earthquakes. Coastal uplift was
observed at Caleta La Hacienda fishing port after the
2010 event. The terraces resulting in gradual mild
0 1 2
km
4
N
W
S
E
La Hacienda
I sl a
Mo
ch
aTsunami Height [m]Tsunami Height [m]
5 10 15 20 25510152025 0 0
38.32
38.34
38.36
Latitude (°S)La
titud
e (°
S)
Flow DepthRunup
Runup
2010 Tsunami
1960 Tsunami
Inundation
38.38
38.40
38.33
38.35
38.37
38.39
38.41
Longitude (°W)73.9173.9373.95 73.89 73.87
0 100 200 300 400 500 600 700Distance (m)
Ele
vatio
n (m
)
Runup
0
5
10
15
20
25boulder
campers †
Tirúa
overtoppedMocha A Mocha BMocha C
Mocha D
A
CB D
b
a
Figure 6Mocha Island: (a) measured tsunami heights with survey point locations on post-tsunami satellite image (acquired: 12 March 2010 by
Worldview 01) and 1960 tsunami inundation line (Shoa, 2000); (b) characteristic tsunami runup transects at the northern headland with
gradual slopes compared to the steep coastal bluff at Tirua. Note the locations of the boulder deposited and campers killed, shown in Figure
7b, c
1996 H. M. Fritz et al. Pure Appl. Geophys.
Author's personal copy

topographic slopes on the order of a few percent and
the almost total absence of trees and large vegetation
within the tsunami inundation zones made Mocha a
unique location to compare tsunami runup from the
1960 and 2010 events. The Mocha Island tsunami
survey circled the entire island from 21 to 23 May
2010. The tsunami runup peaked on the west side of
the northern tip at more than 23 m and a maximum
inundation of more than 600 m (Fig. 6). Mocha
Island is the only location where the 2010 tsunami
reached a 20 m runup elevation at a 500 m inundation
distance over marine terraces shown in Fig. 7a–d.
Figure 7Observed tsunami impact on Chile’s coastal Pacific Islands: a–d Isla Mocha: a Aerial view of barren marine terraces after tsunami overwash
on north tip; b sandstone boulder deposited more than 250 m from the shoreline at 15 m elevation; c monument in memory of campers killed
at 400 m inundation and 17 m elevation; d typical wrackline at 560 m inundation and 19 m runup; e and f more than 2 m coastal uplift at both
Puerto Norte and Puerto Sur, Santa Marıa Island
Vol. 168, (2011) Field Survey of the 27 February 2010 Chile Tsunami 1997
Author's personal copy

All other locations with more than 20 m runup on
Chile’s mainland are at steep coastal bluffs within
close proximity of the shoreline such as at Tirua
(Fig. 3f, Fig. 6b). The forces involved during the
tsunami’s overland flooding are demonstrated by the
deposition of a sandstone boulder, measuring 3 m in
diameter, more than 250 m from the shoreline at an
elevation of 15 m (Fig. 7b). The tsunami victims
were camping at a 400-m distance from the shoreline
and 17-m elevation, which marks the highest victim
location for this event (Fig. 7c). Unfortunately, the
campers failed to evacuate after the earthquake and
were washed away by the tsunami waves while inside
their tents. Along Mocha’s east side, the runup
gradually decreased and remained below 10 m on the
southern half of the island. The inundation of the
1960 tsunami mostly exceeded that of the 2010 tsu-
nami with the exception of Mocha’s north tip,
penetrating more than twice as far (1.5 km) inland on
Mocha’s west side (SHOA, 2000).
The archipelago of Juan Fernandez is located
670 km off the coast of Chile due west of Valparaıso.
These volcanic islands are sparsely populated with
600 inhabitants concentrated in the coastal town of
San Juan Bautista in Cumberland Bay. The first
tsunami wave impacted San Juan Bautista 49 min
after the earthquake as a relatively slow moving flood
comparable to a rapid high tide, followed by a violent
wave which destroyed approximately 160 houses and
the majority of the public facilities. The 12 year old
daughter of one of the local carabineros triggered a
last minute evacuation by ringing the church bells,
which constrained the death toll to 18 people in the
devastated lowlands of this coastal town. Robinson
Crusoe Island was surveyed on 24 March 2010. The
field-survey results highlighted a maximum runup of
18 m at an inundation distance of 300 m (Fig. 8a,b,
Fig. 9a,b). Some filmed details are available online
(UK Channel 4, 2010). Juan Fernandez had been
impacted by the 1946 Aleutian tsunami, and the
investigation of OKAL et al. (2002) inferred runup of
2.7 m, based on descriptions of surviving eyewit-
nesses at the time of their survey in 2000.
Rapa Nui (Easter Island) is located 3,700 km off
the coast of continental Chile, almost due west of
Juan Fernandez. Rapa Nui was surveyed from 20 to
22 March 2010. The field survey results exhibited a
maximum runup of 4 m (Fig. 7b, 8c, d). At Ton-
gariki, the tsunami reached up to the ahu (stone
platform) and flooded a nearby house, while the 1960
27.05
27.10
27.15
27.20
Latit
ude
(°S
)
N
W
S
E
Tongariki
OvaheAnakena
HangaRoa
Rapa Nui
Hanga Tee
Easter Island
RunupFlow Depth
Longitude (°W)
Tsu
nam
i Hei
ght [
m] 5
4
3
2
1
0109.45 109.40 109.30 109.25109.350 100 200 300
0
5
10
15
20
Distance (m)
Ele
vatio
n (m
)
Flow DepthRunup San Juan Bautista
Tsu
nam
i Hei
ght [
m]
a
b
c
20151050
N
78.78
78.86
78.94
Longitude (°W)
33.62
Latitude (°S)
RunupFlow Depth
32.70
Robinson Crusoe Island
San JuanBautista
Figure 8Robison Crusoe Island, Juan Fernandez Archipelago: (a) Measured tsunamiheights and (b) survey transect through the center of San Juan
Bautista; (c) Easter Island(Rapa Nui) with measured tsunami heights and survey locations on pre-tsunami satelliteimage (acquired: 3 January
2001 by Landsat 7).
1998 H. M. Fritz et al. Pure Appl. Geophys.
Author's personal copy

tsunami moved some of the moais (stone statues)
scattered on the ground prior to the event and reached
a runup of 6 m (SHOA, 2000). The runup during the
2010 event was smaller than the 8.6 m runup by the
1946 Aleutian tsunami at Hanga Roa (OKAL et al.,
2002). The 2010 tsunami runup at Easter Island was
twice as large as the far field runup of 2 m at Lagu-
nilla on Peru’s Paracas peninsula 2,400 km northwest
of the epicenter shown in Fig. 8e (pers. comm.: Pablo
Broncano and Erik Ortega, Direccion de Hidrografıa
y Navegacion, Peru). The fishing village at Lagunilla
was completely destroyed by a 6 m runup during the
Figure 9Observed mid and far field tsunami impact: a, b total destruction at San Juan Bautista, Robinson Crusoe Island, Juan Fernandez Archipelago;
c, d flooding at Tongariki on Rapa Nui (Easter Island); e, f Fishing port Lagunilla and tsunami magnet on Peru’s Paracas peninsula: e flooding
by the 27 February 2010 Chile tsunami (photo credit: Pablo Broncano and Erik Ortega, Direccion de Hidrografıa y Navegacion, Peru);
f tsunami damage after the 2007 Pisco tsunami (FRITZ et al., 2008)
Vol. 168, (2011) Field Survey of the 27 February 2010 Chile Tsunami 1999
Author's personal copy

2007 Pisco tsunami shown in Fig. 8f and had been
rebuilt (FRITZ et al., 2008). OKAL et al. (2006) discuss
the seismic gaps in Peru.
5. Tsunami Modeling
Tsunami propagation in the Pacific Ocean is
simulated using the benchmarked tsunami model
MOST, which solves the 2?1 non-linear shallow
water equations in spherical coordinates (TITOV and
GONZALEZ, 1997; TITOV and SYNOLAKIS, 1998). Model
inputs consist of bathymetry and initial conditions for
tsunami propagation. Bathymetry is an extrapolated
4-arcmin’s cell size grid extracted from the ETOPO
2-min global relief dataset. Computations stop at 5-m
depth and therefore runup on the coast is not simu-
lated. For initial conditions, the inversion model of
LORITO et al. (2011) is utilized. The source area is
discretized into 25 9 25 km sub-faults of variable
slip. Static surface deformation field is computed by
applying OKADA’s (1985) formulas for each sub-fault
using the fault parameters for the ‘‘Best Model’’
given in supplementary table S1 in LORITO et al.
(2011). The resulting deformation field is directly
translated to the free water surface assuming an
incompressible liquid layer overlying an elastic half-
space. The final deformation field and maximum
tsunami wave heights of the numerical simulation are
shown in Fig. 10. The model results highlight the
directivity of the highest tsunami waves towards Juan
Fernandez and Easter Island during the transoceanic
propagation.
6. Conclusions
The rapid deployment of the international tsunami
survey team (ITST) to Chile after the 27 February
2010 event resulted in the recovery of important data
on the characteristics of tsunami impact in both the
near and far fields, as well as information on coastal
uplift. As with most near-field tsunamis, the waves
struck prior to official warnings reaching coastal
residents. Self-evacuations minimized the fatalities
and demonstrated the pivotal importance of
74° 72°
38°
36°
34°
Mw 8.8
Santiago
Valparaíso
Constitución
Concepción
Isla Santa Maria
Isla Mocha
–1 0 1 2 3 4 5
Surface Deformation
(m)
120° 100° 80°
40°
20°
0°
Easter Isl.
Rob. Crusoe Isl.
LimaLagunilla
Isla Mocha
Valparaiso
Talcahuano
0 0.01 0.05 0.1 0.2 0.5 1 1.5 2 3 5 10Wave Height
(m)
a b
Figure 10(a) Maximum estimated tsunami wave heights in the South Pacific Ocean computed using the MOST-model with key survey locations and
arrival time contour lines; (b) source deformation field by LORITO et al. (2011).
2000 H. M. Fritz et al. Pure Appl. Geophys.
Author's personal copy

community-based education and awareness programs
(SYNOLAKIS and BERNARD 2006; SIEH 2006). This
partial success was overshadowed by the vast
majority of tsunami victims being campers and
tourists, a population that is not easily reached by
community-based education. Despite small areas of
locally high runup, the 2010 Chile tsunami had sig-
nificantly lower sustained runup heights and a
substantially smaller overall impact than either the
1960 Chile or the 2004 Indian Ocean tsunami.
Acknowledgments
The survey team was supported by the National
Science Foundation through the NSF RAPID award
CMMI-1034886.
Appendix Tables
See Tables 1 and 2.
Table 1
Tsunami dataset recorded in Chile by the International Tsunami Survey Team (ITST) from 7 March to 23 May 2010
Pt. Site Latitude (N) Longitude (E) z ? h
(m)
R (m) I (m) Date and Time
surveyed (UTC)
Watermark
1 Cartagena -33.54231 -71.60268 4.00 103.0 7-Mar-2010 14:52 WL, EW
2 Llolleo -33.60716 -71.62590 4.00 77.9 7-Mar-2010 17:46 RD
3 Llolleo -33.60749 -71.62637 4.60 122.2 7-Mar-2010 18:15 RD, DT
4 Llolleo -33.60738 -71.62571 3.00 179.9 7-Mar-2010 18:42 MI, MO
5 Llolleo -33.60772 -71.62277 3.30 455.2 7-Mar-2010 19:15 WL, RD
6 Constitucion -35.32440 -72.40864 7.40 66.9 9-Mar-2010 22:30 DT
7 Constitucion -35.32254 -72.40998 6.60 62.9 9-Mar-2010 23:12 DT
8 Constitucion -35.32252 -72.41034 8.00 90.7 9-Mar-2010 22:59 TB, RD
9 Caleta Pellines -35.49278 -72.51907 9.70 123.4 10-Mar-2010 12:13 WL, RD
10 Constitucion -35.32717 -72.41950 8.30 633.9 10-Mar-2010 13:04 MI
11 Constitucion -35.32726 -72.41943 8.20 643.0 10-Mar-2010 13:08 MO
12 Constitucion -35.33085 -72.40629 8.30 19.9 10-Mar-2010 13:34 DT
13 Constitucıon -35.33090 -72.40649 8.40 33.8 10-Mar-2010 13:34 RD, SD
14 Constitucion -35.33095 -72.40678 6.40 57.9 10-Mar-2010 13:34 MI
15 Constitucion -35.33052 -72.40675 7.80 51.9 10-Mar-2010 13:26 DT, RD
16 Constitucion -35.33054 -72.40712 9.10 80.1 10-Mar-2010 14:42 MO, DT
17 Constitucion -35.33078 -72.40777 8.50 144.7 10-Mar-2010 14:40 MO, DT
18 Constitucion -35.33108 -72.40857 8.40 224.6 10-Mar-2010 14:34 MO, SD
19 Constitucion -35.33146 -72.40935 7.60 307.0 10-Mar-2010 14:24 MO, DT
20 Constitucion -35.33184 -72.41004 7.70 382.0 10-Mar-2010 14:24 MO
21 Constitucion -35.33191 -72.41053 7.50 425.2 10-Mar-2010 14:16 RD, WL, MO
22 Constitucion -35.32424 -72.40887 8.20 82.8 10-Mar-2010 15:45 DT
23 Constitucion -35.32482 -72.40885 7.60 126.0 10-Mar-2010 15:40 TB
24 Constitucion -35.32544 -72.40977 5.70 231.8 10-Mar-2010 15:29 MO
25 Constitucion -35.32592 -72.41165 5.60 396.4 10-Mar-2010 15:23 MO
26 Constitucion -35.32632 -72.41250 5.70 485.2 10-Mar-2010 15:20 RD, WL, MO
27 Constitucion -35.32011 -72.39968 9.50 121.6 10-Mar-2010 17:38 TB
28 Constitucion -35.32015 -72.39918 9.90 167.3 10-Mar-2010 17:34 TB
29 Constitucion -35.32005 -72.39875 13.50 205.3 10-Mar-2010 17:30 WL, BV
30 Isla Orrego -35.32282 -72.40511 10.60 32.8 10-Mar-2010 18:25 TB
31 Isla Orrego -35.32330 -72.40461 9.10 101.6 10-Mar-2010 18:35 TB
32 Constitucion -35.32623 -72.42591 17.20 89.5 10-Mar-2010 21:24 TB, RD
33 Constitucion -35.32626 -72.42543 23.20 111.4 10-Mar-2010 21:05 WL, RD, BV
34 Constitucion -35.32630 -72.42544 26.20 114.9 10-Mar-2010 21:05 WL, RD, BV
35 Constitucion -35.32633 -72.42544 29.00 117.7 10-Mar-2010 21:05 WL, RD, BV
36 Constitucion -35.32639 -72.42639 28.00 89.8 10-Mar-2010 21:32 WL, RD, BV
37 Constitucion -35.32843 -72.42967 13.20 95.4 10-Mar-2010 21:47 WL, RD, BV
38 Constitucion -35.33457 -72.43446 5.80 87.4 10-Mar-2010 22:06 WL, RD, BV
39 Constitucion -35.35271 -72.44595 17.10 54.2 10-Mar-2010 22:23 WL, RD, BV
Vol. 168, (2011) Field Survey of the 27 February 2010 Chile Tsunami 2001
Author's personal copy

Table 1
continued
Pt. Site Latitude (N) Longitude (E) z ? h
(m)
R (m) I (m) Date and Time
surveyed (UTC)
Watermark
40 Constitucion -35.35299 -72.44656 18.80 65.3 10-Mar-2010 22:28 WL, RD, BV
41 Constitucion -35.35891 -72.45615 12.30 106.8 10-Mar-2010 22:51 DT, RD
42 Constitucıon -35.35948 -72.45605 11.30 168.2 10-Mar-2010 22:55 DT, RD
43 Constitucion -35.35964 -72.45587 11.10 191.1 10-Mar-2010 22:56 DT, RD
44 Constitucıon -35.35989 -72.45557 11.30 227.2 10-Mar-2010 22:56 WL, RD, BV
45 Constitucion -35.33518 -72.40386 7.70 10.9 11-Mar-2010 15:52 DT, RD
46 Constitucıon -35.33593 -72.40442 7.90 107.3 11-Mar-2010 15:41 RD
47 Constitucion -35.33581 -72.40535 7.20 158.4 11-Mar-2010 15:36 MO
48 Constitucion -35.33620 -72.40599 6.80 230.9 11-Mar-2010 15:32 MO
49 Constitucion -35.33676 -72.40695 6.70 337.5 11-Mar-2010 15:06 MO
50 Constitucion -35.33705 -72.40776 6.30 417.1 11-Mar-2010 14:55 RD
51 Constitucion -35.35173 -72.38709 4.50 0.0 11-Mar-2010 18:51 RD
52 Constitucion -35.35181 -72.38733 8.50 23.6 11-Mar-2010 18:51 WL, RD, BV
53 Constitucion -35.36966 -72.34809 2.50 37.2 11-Mar-2010 19:40 MO
54 Constitucion -35.37056 -72.34801 5.10 134.5 11-Mar-2010 19:40 WL, RD, BV
55 Pelluhue -35.80637 -72.57040 7.70 186.3 12-Mar-2010 13:49 TB, BB
56 Pelluhue -35.80669 -72.57059 7.30 201.0 12-Mar-2010 13:49 RD
57 Pelluhue -35.80624 -72.56920 8.10 271.3 12-Mar-2010 15:54 TB, BB, RD
58 Pelluhue -35.80621 -72.56893 9.40 292.3 12-Mar-2010 15:54 DT
59 Pelluhue -35.80654 -72.56721 12.40 450.8 12-Mar-2010 16:05 WL, RD, BV
60 Pelluhue -35.80766 -72.56977 7.90 331.8 12-Mar-2010 14:27 TB, BB, RD
61 Pelluhue -35.80872 -72.56979 8.00 431.8 12-Mar-2010 14:37 RD, DT
62 Pelluhue -35.80873 -72.56904 8.20 467.1 12-Mar-2010 14:46 TB, RD
63 Pelluhue -35.80906 -72.56703 8.80 613.4 12-Mar-2010 14:54 WL, RD, BV
64 Pelluhue -35.81110 -72.56742 6.60 768.0 12-Mar-2010 15:38 WL, RD, BV
65 Pelluhue -35.81014 -72.56542 5.90 802.2 12-Mar-2010 14:55 WL, RD, BV
66 Pelluhue -35.81138 -72.56631 6.40 851.0 12-Mar-2010 15:38 WL, RD, BV
67 Pelluhue -35.80831 -72.56317 6.90 862.5 12-Mar-2010 15:24 WL, RD
68 Pelluhue -35.80007 -72.56699 10.50 204.3 12-Mar-2010 16:42 DT
69 Pelluhue -35.79982 -72.56662 11.60 232.6 12-Mar-2010 16:42 WL
70 Pelluhue -35.81530 -72.57917 11.20 119.4 12-Mar-2010 17:23 WL, BV
71 Pelluhue -35.81461 -72.57808 14.00 101.4 12-Mar-2010 17:31 WL, RD
72 Trespenas -35.82125 -72.59823 13.90 178.5 12-Mar-2010 18:02 WL, RD
73 Curanipe -35.83739 -72.62478 10.50 129.1 12-Mar-2010 18:21 WL, RD
74 Curanipe -35.83741 -72.62428 11.20 167.5 12-Mar-2010 18:21 WL, RD
75 Curanipe -35.84135 -72.63006 7.50 124.6 12-Mar-2010 19:06 MO, RD
76 Curanipe -35.84157 -72.62916 8.90 207.7 12-Mar-2010 19:06 WL, RD
77 Curanipe -35.84542 -72.64218 9.10 191.0 12-Mar-2010 20:09 TB
78 Curanipe -35.84642 -72.64160 9.50 297.5 12-Mar-2010 20:00 WL, RD
79 Curanipe -35.84610 -72.64118 9.00 306.5 12-Mar-2010 20:05 MI
80 Curanipe -35.84652 -72.64106 8.50 342.2 12-Mar-2010 20:05 WL, RD
81 Curanipe -35.84560 -72.64187 8.50 224.6 12-Mar-2010 20:29 TB
82 Curanipe -35.84560 -72.64021 7.50 362.9 12-Mar-2010 20:34 WL, RD
83 Curanipe -35.84504 -72.64020 8.80 259.5 12-Mar-2010 20:44 WL, RD
84 Curanipe -35.84366 -72.63837 6.90 162.7 12-Mar-2010 21:22 MI
85 Playa Peuno -35.87400 -72.66840 7.60 109.8 12-Mar-2010 22:09 MO
86 Playa Peuno -35.87417 -72.66862 7.50 112.5 12-Mar-2010 22:09 WL, RD
87 Tregualemu -35.95389 -72.74855 7.80 133.6 12-Mar-2010 22:45 WL, RD, BV
88 Perales -36.42526 -72.87051 6.80 328.8 13-Mar-2010 14:46 WL, RD, BV
89 Perales -36.42970 -72.87250 14.50 184.5 13-Mar-2010 15:11 WL, RD, BV
90 Perales -36.42917 -72.87187 14.30 198.4 13-Mar-2010 15:11 WL, RD, BV
91 Perales -36.42967 -72.87453 16.40 101.5 13-Mar-2010 15:21 WL, RD, BV
92 Perales -36.42971 -72.87392 15.10 114.8 13-Mar-2010 15:21 WL, RD, BV
2002 H. M. Fritz et al. Pure Appl. Geophys.
Author's personal copy

Table 1
continued
Pt. Site Latitude (N) Longitude (E) z ? h
(m)
R (m) I (m) Date and Time
surveyed (UTC)
Watermark
93 Playa Purema -36.44674 -72.88442 7.50 236.4 13-Mar-2010 15:59 AL, TB
94 Playa Purema -36.44697 -72.88403 9.00 274.8 13-Mar-2010 15:59 WL, RD, BV
95 Playa Purema -36.44666 -72.88030 7.80 505.3 13-Mar-2010 16:13 RD
96 Playa Purema -36.44522 -72.87957 8.30 527.6 13-Mar-2010 16:13 WL, RD, BV
97 Playa Purema -36.44678 -72.87671 7.00 812.4 13-Mar-2010 16:13 WL, RD, BV
98 Playa Purema -36.44783 -72.87678 6.90 846.4 13-Mar-2010 16:13 WL, RD, BV
99 Playa Purema -36.44545 -72.87676 7.00 780.4 13-Mar-2010 16:13 WL, RD, BV
100 Playa Purema -36.44477 -72.87760 7.40 701.9 13-Mar-2010 16:13 WL, RD, BV
101 Playa Purema -36.44836 -72.88049 8.20 595.6 13-Mar-2010 16:13 WL, RD, BV
102 Playa Purema -36.45124 -72.87717 7.30 1032.3 13-Mar-2010 16:13 WL, RD, BV
103 Playa -36.47808 -72.91084 6.30 58.1 13-Mar-2010 16:49 TB, BB, RD
104 Playa -36.47812 -72.91073 6.60 68.2 13-Mar-2010 16:49 WL, RD, BV
105 Playa -36.49884 -72.90659 6.60 126.8 13-Mar-2010 17:31 TB, BB, RD
106 Playa -36.49873 -72.90647 6.90 132.7 13-Mar-2010 17:31 WL, RD, BV
107 Playa -36.49782 -72.90505 5.60 261.1 13-Mar-2010 17:43 TB, BB, RD
108 Playa -36.49806 -72.90370 6.30 376.1 13-Mar-2010 17:47 AL, BB
109 Playa -36.49820 -72.90294 5.80 443.1 13-Mar-2010 17:47 OT
110 Playa -36.49827 -72.90218 5.70 510.7 13-Mar-2010 17:47 WL, RD, BV
111 Dichato -36.54240 -72.93172 8.60 69.9 13-Mar-2010 18:21 TB, BB, RD
112 Dichato -36.54227 -72.93142 9.30 99.4 13-Mar-2010 18:21 WL, RD, BV
113 Dichato -36.54511 -72.93179 8.30 293.7 13-Mar-2010 18:50 TB, BB, RD
114 Dichato -36.54576 -72.93059 8.70 397.3 13-Mar-2010 18:55 TB, BB, RD
115 Dichato -36.54576 -72.93059 8.80 397.3 13-Mar-2010 18:55 WL, RD, BV
116 Dichato -36.54737 -72.93793 7.70 726.1 13-Mar-2010 19:26 DT
117 Dichato -36.54775 -72.93810 8.20 767.8 13-Mar-2010 19:33 RD, FI
118 Dichato -36.54842 -72.93837 9.50 840.8 13-Mar-2010 19:33 MO, RD
119 Dichato -36.54856 -72.93845 10.50 856.9 13-Mar-2010 19:33 WL, RD, BV
120 Dichato -36.54760 -72.94256 9.00 53.6 13-Mar-2010 20:04 TB, BB, RD
121 Dichato -36.54820 -72.94199 8.80 116.4 13-Mar-2010 20:16 TB, BB, RD
122 Dichato -36.54837 -72.94193 9.60 136.7 13-Mar-2010 20:16 MO
123 Dichato -36.54899 -72.94194 10.20 203.9 13-Mar-2010 20:20 WL, RD, BV
124 Dichato -36.54922 -72.95041 7.60 38.4 13-Mar-2010 22:50 WL, RD, BV
125 Tome -36.61809 -72.96312 3.70 30.4 14-Mar-2010 13:46 WL, RD
126 Penco -36.73178 -72.99144 4.20 13.4 14-Mar-2010 14:34 EW (wave 1)
127 Penco -36.73178 -72.99144 5.50 13.4 14-Mar-2010 14:34 EW (wave 2)
128 Penco -36.73178 -72.99133 6.50 23.5 14-Mar-2010 14:40 AL
129 Penco -36.73195 -72.99114 6.20 45.5 14-Mar-2010 14:44 MO
130 Penco -36.73157 -72.99085 5.70 68.8 14-Mar-2010 14:46 OT, EW (wave 3)
131 Penco -36.73142 -72.99078 5.20 81.0 14-Mar-2010 14:50 RD, EW
132 Talcahuano -36.72420 -73.10423 8.00 159.0 14-Mar-2010 15:49 WL, RD, BV
133 Talcahuano -36.72474 -73.10445 5.90 222.4 14-Mar-2010 16:00 MO
134 Talcahuano -36.72507 -73.10506 5.00 279.4 14-Mar-2010 16:44 MO, MI
135 Talcahuano -36.72478 -73.10563 4.70 284.9 14-Mar-2010 16:49 MO, MI
136 Talcahuano -36.72460 -73.10549 5.20 261.3 14-Mar-2010 16:49 WL, RD, BV
137 Talcahuano -36.71174 -73.11326 6.60 0.0 14-Mar-2010 17:36 AL
138 Talcahuano -36.71265 -73.11391 6.70 117.0 14-Mar-2010 17:36 MI, MO (Oil)
139 Talcahuano -36.71319 -73.11358 6.50 163.8 14-Mar-2010 17:50 MO
140 Talcahuano -36.71388 -73.11406 6.60 248.3 14-Mar-2010 17:54 MO
141 Talcahuano -36.71456 -73.11472 6.60 340.3 14-Mar-2010 17:57 WL, RD
142 Caleta Tumbes -36.63815 -73.09246 13.30 54.4 14-Mar-2010 19:37 WL, RD, BV
143 Caleta Tumbes -36.63977 -73.09406 6.60 86.8 14-Mar-2010 20:21 DT, RD, MO
144 Caleta Tumbes -36.63983 -73.09443 5.00 120.4 14-Mar-2010 20:21 MO
145 Caleta Tumbes -36.63979 -73.09462 4.60 136.8 14-Mar-2010 20:21 WL, EW
Vol. 168, (2011) Field Survey of the 27 February 2010 Chile Tsunami 2003
Author's personal copy

Table 1
continued
Pt. Site Latitude (N) Longitude (E) z ? h
(m)
R (m) I (m) Date and Time
surveyed (UTC)
Watermark
146 Caleta El Manzano -36.69736 -73.10770 6.10 44.9 14-Mar-2010 21:57 MI
147 Caleta El Manzano -36.69719 -73.10847 7.20 116.0 14-Mar-2010 22:06 MO
148 Caleta El Manzano -36.69760 -73.10871 7.20 133.8 14-Mar-2010 22:11 MO
149 Caleta El Manzano -36.69751 -73.10909 7.40 166.6 14-Mar-2010 22:11 WL, RD
150 San Vincente -36.72736 -73.12795 3.40 44.1 15-Mar-2010 14:32 MO (Oil)
151 San Vincente -36.72736 -73.12782 3.50 54.2 15-Mar-2010 14:27 WL (Oil)
152 Caleta Lenga -36.76712 -73.17013 6.10 50.9 15-Mar-2010 14:57 EW
153 Caleta Chome -36.77253 -73.21137 3.00 45.7 15-Mar-2010 15:47 EW
154 Punta El Bosque -36.80906 -73.17330 7.40 67.6 15-Mar-2010 17:33 WL, RD, BV
155 Punta El Bosque -36.80871 -73.17289 2.90 73.0 15-Mar-2010 17:43 WL, RD, BV
156 Laraquete -37.16832 -73.19107 3.10 116.3 15-Mar-2010 19:46 WL, RD, MO
157 Laraquete -37.16874 -73.19015 3.50 210.0 15-Mar-2010 19:46 WL, RD, MO
158 Laraquete -37.16841 -73.18971 3.20 227.0 15-Mar-2010 20:04 MO
159 Laraquete -37.16868 -73.18915 3.10 284.0 15-Mar-2010 20:04 WL, RD, EW
160 Arauco -37.23673 -73.31647 3.90 123.2 15-Mar-2010 20:43 WL, RD, BV
161 Arauco -37.23803 -73.32371 4.20 96.1 15-Mar-2010 21:02 WL, RD, BV
162 Tubul -37.24016 -73.42801 7.20 117.7 15-Mar-2010 22:34 WL, RD, BV
163 Tubul -37.24009 -73.42923 8.40 124.7 15-Mar-2010 22:34 WL, RD, BV
164 Punta Morguilla -37.71533 -73.64735 7.80 410.0 16-Mar-2010 14:13 TB, BB, RD
165 Punta Morguilla -37.71482 -73.64555 8.60 573.3 16-Mar-2010 14:04 WL, RD, BV
166 Punta Morguilla -37.72351 -73.66186 7.20 83.6 16-Mar-2010 14:36 WL, RD, EW
167 Chome -37.68148 -73.65048 6.40 279.9 16-Mar-2010 15:19 WL, RD, BV
168 Costa Mina -37.64082 -73.66506 12.70 143.6 16-Mar-2010 15:49 WL, RD, BV
169 Lebu -37.58641 -73.64313 7.90 236.6 16-Mar-2010 17:26 WL, RD, BV
170 Lebu -37.60773 -73.64599 3.60 21.8 16-Mar-2010 17:49 WL, RD, BV
171 Ranquil Bajo -37.52633 -73.59617 5.70 104.8 16-Mar-2010 18:28 WL, RD, BV
172 Playa Quiapo -37.45870 -73.59111 10.80 152.0 16-Mar-2010 19:54 WL, RD, BV
173 Quidicolile -37.37359 -73.63469 7.90 131.5 16-Mar-2010 20:43 SQ, WL, RD
174 Yani -37.36425 -73.66146 10.10 163.0 16-Mar-2010 21:21 SQ, WL, RD
175 Caleta Piure -37.23513 -73.65380 7.20 101.8 16-Mar-2010 22:26 SQ, WL, RD
176 Caleta Rumena -37.17574 -73.61442 7.30 101.8 16-Mar-2010 23:02 SQ, WL, RD
177 Caleta Lavapie -37.15023 -73.57769 3.70 80.5 16-Mar-2010 23:23 SQ, WL, RD
178 Tubul -37.22586 -73.43676 6.20 145.1 17-Mar-2010 15:06 WL, RD, BV
179 Tubul -37.22565 -73.43697 5.90 171.2 17-Mar-2010 15:06 WL, RD, BV
180 Tubul -37.22536 -73.43744 5.30 213.4 17-Mar-2010 15:06 WL, RD, BV
181 Tubul -37.22588 -73.43798 5.10 208.1 17-Mar-2010 15:14 TB, BB, RD
182 Tubul -37.22441 -73.43876 5.40 384.3 17-Mar-2010 15:14 WL, RD, BV
183 Tubul -37.22678 -73.43808 6.20 122.5 17-Mar-2010 15:50 AL, WL, RD
184 Tubul -37.22634 -73.43881 5.70 203.4 17-Mar-2010 15:57 MI, DT
185 Tubul -37.22556 -73.44132 5.40 439.2 17-Mar-2010 15:57 WL, RD, BV, BO
186 Tubul -37.23109 -73.44513 4.40 39.6 17-Mar-2010 16:18 WL, RD, BV
187 Tubul -37.23165 -73.43953 5.90 263.6 17-Mar-2010 16:44 TB, BB, RD
188 Tubul -37.23184 -73.44007 4.30 315.5 17-Mar-2010 16:51 MI, DT
189 Tubul -37.23145 -73.44039 4.40 333.1 17-Mar-2010 16:54 MO, DT
190 Tubul -37.23018 -73.45706 4.10 9.7 17-Mar-2010 17:05 TB, BB, RD
191 Tubul -37.22904 -73.45708 3.20 127.7 17-Mar-2010 17:05 MI, DT
192 Caleta Llico -37.19437 -73.56280 7.60 35.4 17-Mar-2010 17:39 AL, RD, DT
193 Caleta Llico -37.19454 -73.56306 7.50 62.5 17-Mar-2010 17:45 DT, RD, WL
194 Caleta Llico -37.19483 -73.56319 8.00 96.2 17-Mar-2010 17:47 TB, BB, RD
195 Caleta Llico -37.19500 -73.56269 8.50 103.5 17-Mar-2010 17:47 TB, BB, RD
196 Caleta Llico -37.19549 -73.56338 8.70 170.4 17-Mar-2010 17:56 TB, BB, RD
197 Caleta Llico -37.19677 -73.56436 7.60 335.7 17-Mar-2010 18:01 MI, MO
198 Caleta Llico -37.19658 -73.56410 7.00 306.8 17-Mar-2010 18:01 MO
2004 H. M. Fritz et al. Pure Appl. Geophys.
Author's personal copy

Table 1
continued
Pt. Site Latitude (N) Longitude (E) z ? h
(m)
R (m) I (m) Date and Time
surveyed (UTC)
Watermark
199 Caleta Llico -37.19694 -73.56431 6.80 350.7 17-Mar-2010 18:01 WL, RD, BV
200 Caleta Llico -37.19674 -73.55780 9.10 77.7 17-Mar-2010 19:08 WL, RD, BV
201 Caleta Llico -37.19128 -73.56817 9.80 186.3 17-Mar-2010 19:42 AL, TB, BB, RD
202 Caleta Llico -37.19135 -73.56863 10.10 227.3 17-Mar-2010 19:49 AL, TB, BB, RD
203 Caleta Llico -37.19110 -73.56916 13.30 269.3 17-Mar-2010 19:49 WL, RD, BV
204 Caleta Llico -37.19049 -73.56785 13.40 136.6 17-Mar-2010 19:55 WL, RD, BV
205 Santa Maria -37.04511 -73.51122 4.90 73.6 18-Mar-2010 17:46 WL, RD, EW
206 Santa Maria -37.04552 -73.51066 2.90 35.6 18-Mar-2010 17:52 AL
207 Santa Maria -36.97285 -73.52438 4.20 34.1 18-Mar-2010 18:51 SQ, WL, RD
208 Santa Maria -36.97433 -73.53255 11.30 139.8 18-Mar-2010 19:39 SQ, WL, RD
209 Rapa Nui, Hanga Tee -27.16536 -109.36446 4.30 36.2 20-Mar-2010 20:27 WL, RD
210 Rapa Nui, Tongariki -27.12710 -109.27641 4.10 27.7 20-Mar-2010 22:29 MO, RD
211 Rapa Nui, Tongariki -27.12708 -109.27658 3.80 43.2 20-Mar-2010 22:29 WL, RD
212 Rapa Nui, Tongariki -27.12675 -109.27655 3.90 50.3 20-Mar-2010 22:29 WL, RD
213 Rapa Nui, Tongariki -27.12311 -109.27255 2.20 47.1 20-Mar-2010 23:07 WL, RD
214 Rapa Nui, Tongariki -27.12312 -109.27301 3.20 84.0 20-Mar-2010 23:11 WL, RD
215 Rapa Nui, Tongariki -27.12573 -109.27676 4.50 76.1 21-Mar-2010 0:42 WL, RD, BV, EW
216 Rapa Nui, Tongariki -27.12559 -109.27669 4.30 79.2 21-Mar-2010 0:42 WL, RD, BV, EW
217 Rapa Nui, Tongariki -27.12488 -109.27642 4.40 144.3 21-Mar-2010 1:02 WL, RD, BV, EW
218 Rapa Nui, Hanga Roa -27.14712 -109.43042 2.70 15.9 21-Mar-2010 18:04 WL, RD, EW
219 Rapa Nui, Anakena -27.07365 -109.32389 3.30 31.9 21-Mar-2010 18:44 WL, RD, EW
220 Rapa Nui, Anakena -27.07391 -109.32270 3.50 85.8 21-Mar-2010 18:50 WL, RD, BV, EW
221 Rapa Nui, Anakena -27.07278 -109.32229 3.20 111.0 21-Mar-2010 19:08 WL, RD, BV, EW
222 Rapa Nui, Ovahe -27.07682 -109.31269 1.40 70.2 21-Mar-2010 21:37 WL, RD, BV, EW
223 Rapa Nui, Ovahe -27.07666 -109.31333 3.70 50.7 21-Mar-2010 21:43 WL, RD, BV, EW
224 Juan Fernandez -33.66972 -78.93581 6.80 53.7 24-Mar-2010 15:37 WL, RD, BV, EW
225 Juan Fernandez -33.63506 -78.82989 10.60 35.7 24-Mar-2010 17:27 TB, BB, RD
226 Juan Fernandez -33.63509 -78.82995 10.00 41.0 24-Mar-2010 17:23 TB, BB, RD
227 Juan Fernandez -33.63475 -78.83057 10.20 105.3 24-Mar-2010 17:23 TB, BB, RD
228 Juan Fernandez -33.63483 -78.83219 15.30 250.6 24-Mar-2010 17:53 MO, DT
229 Juan Fernandez -33.63483 -78.83219 16.20 250.6 24-Mar-2010 17:53 RD, DT
230 Juan Fernandez -33.63450 -78.83223 15.30 261.0 24-Mar-2010 17:53 WL, RD, EW
231 Juan Fernandez -33.63527 -78.83269 18.30 295.3 24-Mar-2010 17:23 WL, RD, EW
232 Juan Fernandez -33.63285 -78.82954 10.50 53.7 24-Mar-2010 18:05 TB, BB, RD
233 Juan Fernandez -33.63242 -78.82978 12.70 84.1 24-Mar-2010 18:14 TB, BB, RD
234 Juan Fernandez -33.63233 -78.82997 15.70 104.6 24-Mar-2010 18:14 WL, RD, EW
235 Juan Fernandez -33.63796 -78.83123 10.20 44.6 24-Mar-2010 18:28 TB, BB, RD
236 Juan Fernandez -33.63795 -78.83182 15.90 95.1 24-Mar-2010 18:28 WL, RD, EW
237 Juan Fernandez -33.63912 -78.83040 8.50 46.3 24-Mar-2010 18:38 RD
238 Juan Fernandez -33.63926 -78.83048 9.50 63.3 24-Mar-2010 18:38 WL, RD, EW
239 Juan Fernandez -33.64183 -78.82650 10.70 41.2 24-Mar-2010 18:38 WL, RD, EW
240 Constitucion -35.32620 -72.42580 24.09 80.0 11-Mar-2010 19:58 WL, RD, BV
241 Constitucion -35.32730 -72.42080 7.91 520.0 11-Mar-2010 20:41 MO
242 Los Pellines -35.47560 -72.50470 9.82 92.0 12-Mar-2010 14:00 RD, EW
243 Los Pellines -35.47650 -72.50510 7.93 6.63 174.0 12-Mar-2010 14:58 MO
244 Los Pellines -35.47600 -72.50520 6.85 122.0 12-Mar-2010 15:01 DT
245 Llanco -35.58440 -72.62290 13.21 158.0 12-Mar-2010 19:42 RD
246 Llanco -35.58440 -72.62290 11.94 11.37 153.0 12-Mar-2010 19:50 MO
247 Llanco -35.58360 -72.62100 15.88 130.0 12-Mar-2010 20:25 WL, RD, BV
248 Llanco -35.58350 -72.62080 15.41 140.0 12-Mar-2010 20:32 WL, RD, BV
249 Chanco Beach -35.73910 -72.57040 11.79 11.29 97.0 12-Mar-2010 22:10 WL
250 Buchupureo -36.07930 -72.79540 3.08 168.0 13-Mar-2010 15:35 WL
251 Cobquecura -36.13140 -72.80580 1.95 13-Mar-2010 17:09 FI
Vol. 168, (2011) Field Survey of the 27 February 2010 Chile Tsunami 2005
Author's personal copy

Table 1
continued
Pt. Site Latitude (N) Longitude (E) z ? h
(m)
R (m) I (m) Date and Time
surveyed (UTC)
Watermark
252 Mela -36.36030 -72.85160 3.06 225.0 13-Mar-2010 20:19 WL
253 Mela -36.36020 -72.85240 2.62 215.0 13-Mar-2010 20:24 WL
254 Playa Solanera -36.52660 -72.95910 6.14 54.0 14-Mar-2010 19:42 SD
255 Coliumo -36.52980 -72.95880 8.49 53.0 14-Mar-2010 18:15 WL, RD
256 Coliumo -36.53250 -72.95790 8.03 14-Mar-2010 18:58 MO
257 Coliumo -36.53840 -72.95990 8.13 8.13 130.0 14-Mar-2010 20:28 SD
258 Coliumo -36.53820 -72.95950 7.98 14-Mar-2010 20:30 RD
259 Maule -37.00790 -73.18590 2.72 1.92 20.0 15-Mar-2010 19:06 EW
260 Playa Conchilla -37.07550 -73.16250 2.36 25.0 15-Mar-2010 20:48 RD
261 Colcura -37.10860 -73.15350 3.39 31.0 15-Mar-2010 22:21 EW
262 Colcura -37.11400 -73.15200 3.04 60.0 15-Mar-2010 21:48 RD
263 Playa Chivilingo -37.14940 -73.17630 3.79 73.0 15-Mar-2010 22:49 RD
264 Mouth of Lieu Lieu -38.09650 -73.44920 3.58 300.0 17-Mar-2010 13:57 RD
265 Mouth of Lieu Lieu -38.09690 -73.44860 2.33 350.0 17-Mar-2010 14:00 WR, RD
266 Quidico -38.24410 -73.47760 6.47 233.0 17-Mar-2010 16:37 WR, RD
267 Quidico -38.24710 -73.49090 4.10 56.0 17-Mar-2010 16:38 OT
268 Quidico -38.24820 -73.49110 4.42 175.0 17-Mar-2010 17:04 RD
269 Tirua -38.34060 -73.49860 10.40 150.0 16-Mar-2010 20:41 BB
270 Tirua -38.34100 -73.49820 9.14 179.0 16-Mar-2010 20:49 BV
271 Tirua -38.34080 -73.49750 7.91 239.0 16-Mar-2010 20:55 RD, WL
272 Tirua -38.34120 -73.49690 5.58 300.0 16-Mar-2010 21:05 RD, WL
273 Tirua -38.34190 -73.49630 8.17 354.0 16-Mar-2010 21:15 BB, RD
274 Tirua -38.34280 -73.49600 9.85 418.0 16-Mar-2010 21:28 RD
275 Tirua -38.34370 -73.49510 10.68 539.0 16-Mar-2010 21:44 DT
276 Tirua -38.34440 -73.49460 9.45 623.0 16-Mar-2010 21:48 DT
277 Tirua -38.34400 -73.49380 7.50 652.0 16-Mar-2010 21:52 MO
278 Tirua -38.34370 -73.49280 8.01 702.0 16-Mar-2010 21:56 MO
279 Tirua -38.34350 -73.49240 7.88 729.0 16-Mar-2010 22:04 MO
280 Tirua -38.34270 -73.50140 15.91 56.0 16-Mar-2010 22:30 WL, RD, BV, ER
281 Puento Saavedra -38.78370 -73.40140 2.51 39.0 16-Mar-2010 18:24 WL, RD
282 Boca del Budi -38.82710 -73.39600 3.57 17-Mar-2010 19:55 OT
283 Boca del Budi -38.82560 -73.39340 2.77 321.0 17-Mar-2010 20:12 WL, RD, BV
284 Mehuin -39.44400 -73.21740 2.30 60.0 18-Mar-2010 13:58 WL, RD
285 La Trinchera -34.99680 -72.17820 6.30 11-Mar-2010 19:40 RD
286 La Trinchera -34.99630 -72.17720 7.60 227.0 11-Mar-2010 19:40 WL, RD
287 La Pesca -34.97730 -72.18170 10.20 20.0 11-Mar-2010 20:28 WL, RD
288 Rancura -34.96740 -72.18460 7.75 11-Mar-2010 21:44 DT
289 Rancura -34.96710 -72.18410 4.65 11-Mar-2010 21:44 MO
290 Rancura -34.96700 -72.18380 7.00 251.2 11-Mar-2010 21:44 RD
291 Rancura -34.96320 -72.18450 6.58 11-Mar-2010 22:15 RD
292 Rancura -34.96320 -72.18400 7.50 265.6 11-Mar-2010 22:15 WL, RD
293 Iloca -34.95320 -72.18620 3.86 12-Mar-2010 13:30 SD
294 Iloca -34.95330 -72.18570 3.62 12-Mar-2010 13:30 RD
295 Iloca -34.95340 -72.18540 3.64 12-Mar-2010 13:30 RD
296 Iloca -34.95340 -72.18500 3.93 12-Mar-2010 13:30 MO
297 Iloca -34.95340 -72.18480 4.10 228.0 12-Mar-2010 13:30 WL, RD
298 Iloca -34.95060 -72.18550 5.75 12-Mar-2010 14:49 MO
299 Iloca -34.95050 -72.18510 6.71 12-Mar-2010 14:49 TB, BB
300 Iloca -34.95050 -72.18420 6.10 5.80 383.2 12-Mar-2010 14:49 RD, DT
301 Duao -34.88590 -72.16790 2.74 12-Mar-2010 18:50 MI
302 Duao -34.88620 -72.16750 7.00 67.2 12-Mar-2010 18:50 MO, RD
303 Iloca -34.92550 -72.17960 4.61 12-Mar-2010 19:30 MO
304 Iloca -34.92540 -72.17910 4.20 314.4 12-Mar-2010 19:30 MO, RD
2006 H. M. Fritz et al. Pure Appl. Geophys.
Author's personal copy

Table 1
continued
Pt. Site Latitude (N) Longitude (E) z ? h
(m)
R (m) I (m) Date and Time
surveyed (UTC)
Watermark
305 Lipimavida -34.83710 -72.14280 4.70 12-Mar-2010 20:40 DT
306 Lipimavida -34.83730 -72.14220 4.10 255.2 12-Mar-2010 20:40 WL, RD
307 Llico -34.75390 -72.08560 4.90 42.4 12-Mar-2010 21:43 WL, RD
308 Boyeruca -34.68880 -72.05320 3.77 12-Mar-2010 22:30 RD
309 Boyeruca -34.68890 -72.05300 3.62 3.10 229.6 12-Mar-2010 22:30 MO
310 Boyeruca -34.68790 -72.05640 6.70 47.0 12-Mar-2010 23:20 WL, RD, BV
311 Boyeruca -34.68620 -72.05480 4.10 32.0 13-Mar-2010 15:44 WL, RD
312 Las Brisas -33.70570 -71.65910 5.53 14-Mar-2010 21:53 RD
313 Las Brisas -33.70570 -71.65910 3.40 72.2 14-Mar-2010 21:53 WL, RD
314 Santo Domingo -33.63900 -71.63490 4.80 93.0 14-Mar-2010 20:24 WL, RD
315 San Antonio -33.61440 -71.62690 2.60 27.9 14-Mar-2010 14:57 WL, RD, BV
316 San Antonio -33.60740 -71.62190 2.00 455.0 14-Mar-2010 17:16 EW
317 San Antonio -33.60470 -71.62530 3.90 57.2 14-Mar-2010 17:45 WL, RD
318 Ritoque -32.82710 -71.52860 3.20 17-Mar-2010 19:40 WL, RD
319 Ritoque -32.82630 -71.52850 3.50 17-Mar-2010 19:40 DT
320 Ritoque -32.82620 -71.52840 3.51 17-Mar-2010 19:40 DT
321 Ritoque -32.82580 -71.52820 3.40 192.8 17-Mar-2010 19:40 WL, RD
322 Quintero -32.78190 -71.52700 3.40 97.6 17-Mar-2010 20:12 EW
323 Vina del Mar -32.93030 -71.53870 3.40 30.4 17-Mar-2010 22:10 MO
324 Mataquito -34.99310 -72.18010 6.60 11-Mar-2010 21:30 RD
325 Mataquito -34.99360 -72.17810 7.70 160.0 11-Mar-2010 21:30
326 Mataquito -34.98840 -72.17840 9.70 190.0 11-Mar-2010 20:05
327 Iloca -34.93880 -72.18340 5.30 12-Mar-2010 14:40 MO
328 Iloca -34.94310 -72.18620 7.60 70.0 12-Mar-2010 13:45
329 Iloca -34.93900 -72.18300 6.70 120.0 12-Mar-2010 14:40
330 Iloca -34.93900 -72.18290 4.30 335.0 12-Mar-2010 15:35
331 Iloca -34.93410 -72.17910 5.80 90.0 12-Mar-2010 16:35
332 Duao -34.88600 -72.16430 7.50 115.0 12-Mar-2010 19:20
333 Duao -34.88350 -72.16040 5.90 12-Mar-2010 20:35 MO
334 Duao -34.88280 -72.16140 5.90 155.0 12-Mar-2010 20:35
335 Duao -34.88040 -72.15540 6.40 12-Mar-2010 21:15 RD
336 Duao -34.88090 -72.15500 4.70 12-Mar-2010 21:15 RD
337 Duao -34.88210 -72.15430 4.70 12-Mar-2010 21:15 TB, BB, RD
338 Duao -34.88180 -72.15400 4.40 12-Mar-2010 21:15
339 Duao -34.88320 -72.15380 3.80 12-Mar-2010 21:15
340 Duao -34.88350 -72.15320 3.60 12-Mar-2010 21:15
341 Duao -34.88270 -72.15380 3.70 12-Mar-2010 21:15
342 Duao -34.88280 -72.11510 4.30 12-Mar-2010 23:00 MO
343 Duao -34.86620 -72.14810 8.00 130.0 13-Mar-2010 13:30
344 Bucalemu -34.64018 -72.04393 5.60 13-Mar-2010 16:30 MO
345 Bucalemu -34.64156 -72.04358 5.30 13-Mar-2010 16:30 MO
346 Bucalemu -34.64187 -72.04337 5.00 13-Mar-2010 16:30 MO
347 Bucalemu -34.64195 -72.04307 5.20 13-Mar-2010 16:30 MO
348 Bucalemu -34.64211 -72.04238 5.20 13-Mar-2010 16:30 BB
349 Bucalemu -34.64241 -72.04220 4.50 13-Mar-2010 16:30 MO
350 Cahuil -34.47520 -72.02450 2.30 260.0 13-Mar-2010 19:25
351 Punta de Lobos -34.42790 -72.03970 10.50 200.0 13-Mar-2010 21:20
352 Punta de Lobos -34.42710 -72.03780 5.80 145.0 13-Mar-2010 22:00
353 Cahuil -34.49620 -72.02670 7.20 43.0 19-Mar-2010 19:25
354 Cahuil -34.49700 -72.02600 7.00 19-Mar-2010 19:50 TB, BB, RD
355 Cahuil -34.49690 -72.02600 7.30 94.0 19-Mar-2010 19:50
356 Pichilemu -34.40810 -72.02810 5.90 176.0 19-Mar-2010 20:40
357 Pichilemu -34.38430 -72.01320 6.20 157.0 19-Mar-2010 21:25
Vol. 168, (2011) Field Survey of the 27 February 2010 Chile Tsunami 2007
Author's personal copy

Table 1
continued
Pt. Site Latitude (N) Longitude (E) z ? h
(m)
R (m) I (m) Date and Time
surveyed (UTC)
Watermark
358 Pichilemu -34.38480 -72.00480 5.00 270.0 19-Mar-2010 22:10
359 Pichilemu -34.38480 -72.00480 5.00 19-Mar-2010 22:10 TB, BB, RD
360 Topocalma -34.13280 -71.98560 9.90 20-Mar-2010 16:00 TB, BB, RD
361 Topocalma -34.13270 -71.98440 11.30 20-Mar-2010 16:00 TB, BB, RD
362 Topocalma -34.13250 -71.98610 11.20 284.0 20-Mar-2010 16:00
363 Matanzas -33.96200 -71.87550 5.10 20-Mar-2010 20:10
364 Matanzas -33.96260 -71.87540 6.30 128.0 20-Mar-2010 20:10
365 Navidad -33.93690 -71.84910 5.20 20-Mar-2010 22:40 MO
366 Navidad -33.93670 -71.84860 5.20 234.0 20-Mar-2010 22:40
367 Puertecillo -34.08790 -71.95590 8.40 1-Apr-2010 19:10 TB, BB, RD
368 Puertecillo -34.06210 -71.94030 10.20 4-Apr-2010 18:30
369 Puertecillo -34.08830 -71.95590 11.90 4-Apr-2010 19:10
370 Caleta Mostazal -33.83670 -71.81430 5.58 12-Apr-2010 19:20 EW
371 Caleta Mostazal -33.83720 -71.81220 5.35 12-Apr-2010 20:10 TB, BB, RD
372 Caleta Mostazal -33.83720 -71.81610 14.70 69.0 12-Apr-2010 17:20 WL, RD, BV
373 Caleta Mostazal -33.83410 -71.81380 10.40 114.0 12-Apr-2010 18:20 WL, RD, BV
374 Caleta Mostazal -33.83800 -71.81150 6.10 434.0 4-Apr-2010 18:55 WL, RD, BV
375 El Yali -33.74770 -71.70840 5.20 3.20 320.0 14-Mar-2010 19:23
376 El Yali -33.75150 -71.71760 3.13 2.10 180.0 14-Mar-2010 19:54
377 El Yali -33.76880 -71.74200 0.70 624.0 14-Mar-2010 21:55
378 Isla Mocha -38.32493 -73.95412 22.00 183.5 21-May-2010 18:18 WL, RD
379 Isla Mocha -38.32366 -73.95388 23.50 262.7 21-May-2010 18:32 WL, RD
380 Isla Mocha -38.32248 -73.95447 19.50 269.0 21-May-2010 18:43 WL, RD
381 Isla Mocha -38.31997 -73.95640 22.20 353.8 21-May-2010 19:00 OT
382 Isla Mocha -38.31988 -73.95544 19.90 436.3 21-May-2010 19:29 WL, RD
383 Isla Mocha -38.32037 -73.95513 21.20 469.8 21-May-2010 19:29 WL, RD
384 Isla Mocha -38.31953 -73.95400 19.00 557.9 21-May-2010 19:47 WL, RD
385 Isla Mocha -38.32057 -73.95048 16.00 556.1 21-May-2010 20:04 WL, RD
386 Isla Mocha -38.32308 -73.94488 18.20 632.0 21-May-2010 20:27 WL, RD
387 Isla Mocha -38.32418 -73.93710 14.50 499.1 21-May-2010 21:05 WL, RD
388 Isla Mocha -38.33064 -73.92703 9.30 446.1 21-May-2010 21:47 WL, RD
389 Isla Mocha -38.33267 -73.91775 7.30 38.1 21-May-2010 22:06 AL, RD
390 Isla Mocha -38.33470 -73.91955 10.20 313.0 21-May-2010 22:16 WL, RD
391 Isla Mocha -38.33515 -73.91909 10.00 337.9 22-May-2010 14:56 WL, RD
392 Isla Mocha -38.34013 -73.91145 9.40 131.4 22-May-2010 15:31 AL, RD
393 Isla Mocha -38.34066 -73.91203 10.10 194.2 22-May-2010 15:17 MO, DT, EW
394 Isla Mocha -38.34089 -73.91211 9.80 220.5 22-May-2010 15:16 WL, RD, BV
395 Isla Mocha -38.34641 -73.90449 7.30 223.8 22-May-2010 15:41 WL, RD
396 Isla Mocha -38.34657 -73.90481 6.70 255.7 22-May-2010 15:40 WL, RD
397 Isla Mocha -38.35339 -73.89646 7.60 57.4 22-May-2010 16:14 RD, DT
398 Isla Mocha -38.35459 -73.89790 7.40 222.2 22-May-2010 16:04 WL, RD
399 Isla Mocha -38.36827 -73.88394 9.90 582.8 22-May-2010 16:34 WL, RD
400 Isla Mocha -38.38245 -73.86760 4.60 103.9 22-May-2010 19:01 WL, RD
401 Isla Mocha -38.37466 -73.87020 6.50 164.9 22-May-2010 19:23 WL, RD
402 Isla Mocha -38.39449 -73.87175 7.10 81.2 22-May-2010 19:58 WL, RD
403 Isla Mocha -38.40606 -73.88091 4.80 34.0 22-May-2010 20:09 WL, RD
404 Isla Mocha -38.41558 -73.89224 4.80 26.9 22-May-2010 20:22 OT
405 Isla Mocha -38.41530 -73.89200 3.60 64.1 22-May-2010 20:21 WL, RD
406 Isla Mocha -38.40579 -73.92656 3.60 146.0 22-May-2010 20:52 WL, RD
407 Isla Mocha -38.36498 -73.94586 8.00 142.3 22-May-2010 21:25 OT
408 Isla Mocha -38.36494 -73.94568 7.20 158.0 22-May-2010 21:25 WL, RD
409 Isla Mocha -38.35627 -73.94554 5.60 70.9 22-May-2010 21:42 WL, RD
410 Isla Mocha -38.37933 -73.94117 5.60 126.5 22-May-2010 22:06 WL, RD
411 Isla Mocha -38.41133 -73.90631 4.50 58.0 23-May-2010 13:10 WL, RD
2008 H. M. Fritz et al. Pure Appl. Geophys.
Author's personal copy

REFERENCES
BARRIENTOS, S.E. (1995). Dual seismogenic behavior: the 1985
Central Chile earthquake. Geophys. Res. Lett. 22, 3541–3544.
BECK, S., BARRIENTOS, S., KAUSEL, E., and REYES, M. (1998). Source
characteristics of historic earthquakes along the central Chile
subduction zone. J. S. Am. Earth Sci. 11, 115–129.
BORRERO, J.C. (2005). Field data and satellite imagery of tsunami
effects in Banda Aceh, Science, 308 (5728):1596.
BORRERO, J.C., SYNOLAKIS, C.E., and FRITZ, H. (2006). Field surveys
northern Sumatra after the tsunami and earthquake of 26
December 2004. Earthq Spectra, 22(S3):S93–S104.
CAMPOS, J., and KAUSEL, E. (1990). The large 1939 intraplate
earthquake of Southern Chile. Seis. Res. Lett., 61.
CAMPOS, J., HATZFELD, D., MADARIAGA, R., LOPEZ, G., KAUSEL, E.,
ZOLLO, A., IANNACONE, G., FROMM, R., BARRIENTOS, S., and LYON-
CAEN, H. (2002). A seismological study of the 1835 seismic gap
in South Central Chile. Phys. Earth Planet. Int., 132:177–195.
CCTV (2010). China Central Television News 16/03/2010. http://
english.cctv.com/program/newshour/20100316/102393.shtml
CIFUENTES, I.L. (1989). The 1960 Chilean earthquake. J. Geophys.
Res. 94, 665–680.
DARWIN, C. (1851). Geological Observations on Coral Reefs,
Volcanic Islands and on South America. Smith, Elder and Co.,
London, p. 768.
Table 1
continued
Pt. Site Latitude (N) Longitude (E) z ? h
(m)
R (m) I (m) Date and Time
surveyed (UTC)
Watermark
412 Tirua -38.34251 -73.50384 18.00 207.4 23-May-2010 14:33 WL, RD, BV
413 Tirua -38.34149 -73.50420 17.20 72.5 23-May-2010 14:46 WL, RD, BV
414 Tirua -38.34172 -73.50507 20.10 71.7 23-May-2010 14:51 WL, RD, BV
415 Tirua -38.33806 -73.49810 11.00 121.1 23-May-2010 15:44 WL, RD, BV
416 Tirua -38.33466 -73.49636 13.70 178.4 23-May-2010 15:53 WL, RD, BV
417 Tirua -38.33490 -73.49630 13.10 184.2 23-May-2010 15:53 WL, RD, BV
418 Talcahuano (1960) -36.72474 -73.10445 5.10 222.4 14-Mar-2010 16:00 1960 tsunami EW
419 Isla Mocha (1960) -38.41018 -73.90506 10.80 224.0 23-May-2010 13:06 1960 tsunami EW
Codes to nature of measurements: h flow depth above terrain; z terrain elevation; z?h flow depth above sea level at tsunami arrival time;
R runup; I inundation
Codes to nature of watermarks: WL wrack line; AL algae; BB broken branch; BO boat; BV brown vegetation; DT damage trimline; ER erosion;
EW eyewitness; FI fish; MI mudline inside; MO mudline outside; OT overtopped; RD rafted debris; SD sediment deposit; SQ squid; TB tree
bark
Table 2
Coastal uplift dataset recorded in Chile by the International Tsunami Survey Team (ITST)
Pt. Site Latitude (N) Longitude (E) Uplift (m) Date and time surveyed (UTC) Landlevel markers
1 Talcahuano (El Morro) -36.72353 -73.10365 0.75 14-Mar-2010 16:21 HT, EW
2 Talcahuano (Puerto Pescadores) -36.71095 -73.11380 0.70 14-Mar-2010 17:31 HT, EW
3 Caleta Tumbes -36.63927 -73.09298 0.60 14-Mar-2010 20:14 HT, EW
4 Caleta Chome -36.77253 -73.21137 1.50 15-Mar-2010 15:47 HT, EW
5 Arauco -37.23732 -73.32389 0.80 15-Mar-2010 21:14 HT, EW
6 Punta Morguilla -37.72305 -73.66141 1.80 16-Mar-2010 14:36 HT, EW
7 Lebu -37.59479 -73.66561 0.80 16-Mar-2010 16:19 HT, EW
8 Lebu -37.60763 -73.64619 1.65 16-Mar-2010 17:49 HT, EW
9 Playa Quiapo -37.45888 -73.59127 3.44 16-Mar-2010 19:54 HT, EW
10 Caleta Piure -37.23506 -73.65404 3.01 16-Mar-2010 22:26 HT, EW
11 Caleta Lavapie -37.14991 -73.57761 1.60 16-Mar-2010 23:23 HT, EW
12 Tubul -37.23109 -73.44513 1.80 17-Mar-2010 16:18 HT, EW
13 Tubul -37.23122 -73.44492 1.50 17-Mar-2010 16:25 HT, EW
14 Caleta Llico -37.19398 -73.56266 1.90 17-Mar-2010 18:51 HT, EW
15 Santa Maria, Puerto Sur -37.04537 -73.51031 2.00 18-Mar-2010 17:53 HT, EW
16 Santa Maria, Puerto Norte -36.97321 -73.52490 2.20 18-Mar-2010 18:55 HT, EW
17 Santa Maria, Rincon de la Bulga -36.97465 -73.53347 2.10 18-Mar-2010 19:22 HT, EW
Codes to nature of landlevel markers: HT pre- and post-earthquake high tide lines; EW eyewitness
Vol. 168, (2011) Field Survey of the 27 February 2010 Chile Tsunami 2009
Author's personal copy

DELOUIS, B., NOCQUET, J.-M., and VALLEE, N. (2010). Slip distri-
bution of the February 27, 2010 Mw = 8.8 Maule Earthquake,
central Chile, from static and high-rate GPS, InSAR, and
broadband teleseismic data. Geophys. Res. Lett., 37, L17305,
doi:10.1029/2010GL043899.
DISCOVERY (2010). Chile 8.8, premier 26/05/2010, Discovery
Channel TV en Espanol (USA). http://www.youtube.com/watch?
v=ZQfPpg1gqnE&feature=related
FARIAS, M., VARGAS, G., TASSARA, A., CARRETIER, S., BAIZE, S.,
MELNICK, D., and BATAILLE, K. (2010). Land-level changes pro-
duced by the Mw 8.8 2010 chilean earthquake. Science,
329(5994):916, doi:10.1126/science.1192094.
FRITZ, H.M., and KALLIGERIS, N. (2008). Ancestral heritage saves
tribes during 1 April 2007 Solomon Islands tsunami. Geophys.
Res. Lett., 35, L01607, doi:10.1029/2007GL031654.
FRITZ, H.M., KALLIGERIS, N., BORRERO, J.C., BRONCANO, P., and
ORTEGA, E. (2008). The 15 August 2007 Peru tsunami runup
observations and modeling. Geophys. Res. Lett., 35, L10604,
doi:10.1029/2008GL033494.
HERD, D.G., YOUD, T.Y., MEYER, H., ARANGO C., J.L., PERSON, W.J.,
and MENDOZA, C. (1981). The Great Tumaco, Colombia, Earth-
quake of 12 December 1979. Science, 211(4481):441–445.
KANAMORI, H. (1977). The energy release in great earthquakes.
J. Geophys. Res. 82, 2981–2987.
LAY, L., AMMON, C.J., KANAMORI, H., KOPER, K.D., SUFRI, O., and
HUTKO, A.R. (2010). Teleseismic inversion for rupture process of
the 27 February 2010 Chile (Mw 8.8) earthquake. Geophys. Res.
Lett., 37, L13301, doi:10.1029/2010GL043379.
LOMNITZ, C. (1970). Major earthquakes and tsunamis in Chile
during the period 1535 to 1955. Geol. Rundschau 59, 938–960.
LORITO, S., ROMANO, F., ATZORI, S., TONG, X., AVALLONE, A.,
MCCLOSKEY, J., COCCO, M.,BOSCHI, E., and PIATANESI, A. (2011).
Limited overlap between the seismic gap andcoseismic slip
of the great 2010 Chile earthquake. Nature Geoscience 4(3):
173–177, doi:10.1038/ngeo1073.
MARIN, A., GELCICH, S., ARAYA, G., OLEA, G., ESPINDOLA, M., and
CASTILLA, J.C. (2010). The 2010 tsunami in Chile: Devastation
and survival of coastal small-scale fishing communities. Marine
Policy 34(6):1381–1384, doi:10.1016/j.marpol.2010.06.010.
NELSON, A.R., and MANLEY, W.F. (1992). Holocene coseismic and
aseismic uplift of Mocha Island, South-Central Chile. Quarter-
nary International, 15/16:61–76.
OKADA, Y. (1985). Surface deformation due to shear and tensile
faults in a halfspace. Bull. Seismol. Soc. Am., 75(4):1135–1154.
OKAL, E.A., BORRERO, J.C. and SYNOLAKIS, C.E. (2006). Evaluation
of tsunami risk from regional earthquakes at Pisco, Peru, Bull.
Seismol. Soc. Am., 96, 1634–1648, doi:10.1785/0120050158.
OKAL, E.A., SYNOLAKIS, C.E., FRYER, G.J., HEINRICH, P., BORRERO,
J.C., RUSCHER, C., ARCAS, D., GUILLE, G. and ROUSSEAU, D.
(2002). A field survey of the 1946 Aleutian tsunami in the far
field, Seismol. Res. Letts., 73, 490–503.
PLAFKER, G., and SAVAGE, J.C. (1970). Mechanism of the Chilean
earthquake of May 21 and 22 1960. Geol. Soc. Am. Bull. 81,
1001–1030.
RUEGG, J.C., RUDLOFF, A., VIGNY, C., MADARIAGA, R., DE CHABALIER,
J.B., CAMPOS, J., KAUSEL, E., BARRIENTOS, S., and DIMITROV, D.
(2009). Interseismic strain accumulation measured by GPS in the
seismic gap between Constitucion and Concepcion in Chile.
Phys. Earth Planet. Int., 175:78–85.
SHOA (2000). El maremoto del 22 de Mayo de 1960 en las costas de
Chile, 2nd edition, Pub 3012, Servicio Hidrografico y Ocean-
ografico de la Armada de Chile.
SIEH, K. (2006). Sumatran Megathrust Earthquakes—From Science
to Saving Lives. Phil. Trans. R. Soc. A 364(1845):1947–1963.
SYNOLAKIS, C.E., and BERNARD, E.N. (2006) Tsunami science before
and beyond Boxing Day 2004. Phil. Trans. R. Soc. A 364:2231–
2265.
SYNOLAKIS, C.E., and OKAL, E.A. (2005). 1992-2002: Perspective
on a decade of post-tsunami surveys; in: Tsunamis: Case studies
and recent developments, ed. by K. Satake, Adv. Natur. Technol.
Hazards, 23:1–30, Springer.
TADEPALLI, S., and SYNOLAKIS, C.E. (1994). The Run-Up of N-Waves
on sloping beaches. Proc. Roy. Soc. Lond. A 445(1923):99–112.
TITOV, V.V., and GONZALEZ, F. (1997). Implementation and Testing
of the Method of Splitting Tsunami (MOST) Model. NOAA
Tech. Memo. ERL PMEL-112.
TITOV, V.V., and SYNOLAKIS, C.E. (1998), Numerical modeling of
tidal wave runup, J. Waterw. Port Coastal Ocean Eng., 124,
157–171.
UK Channel 4 (2010). News 02/04/2010. http://link.brightcove.
com/services/player/bcpid62744310001?bclid=75139459001&
bctid=75745819001.
(Received September 20, 2010, accepted September 27, 2010, Published online March 30, 2011)
2010 H. M. Fritz et al. Pure Appl. Geophys.
Author's personal copy