FibroMeters: a family of blood tests for liver fibrosis
12
FibroMeters: a family of blood tests for liver fibrosis FibroMètres : une famille de tests sanguins de fibrose hépatique Corresponding author: Service d’Hépato-Gastroentérologie, CHU, 49933 Angers Cedex 09, France E-mail address : [email protected] © 2008 Elsevier Masson SAS. Tous droits réservés. Gastrœntérol Clin Bio (2008) 32, 40-51 KEYWORDS Liver fibrosis; FibroMeterss; Area of fibrosis; Blood tests; Non invasive diagnosis; Chronic viral hepatitis; Alcoholic liver disease; NAFLD; HIV co-infection; Cirrhosis P. Calès a, b,* , J. Boursier a, b , F. Oberti a, b , I. Hubert a, b , Y. Gallois a, c , M.-C. Rousselet a, d , N. Dib a, b , V. Moal c , L. Macchi e , A. Chevailler f , S. Michalak a, d , G. Hunault a , J. Chaigneau a , A. Sawadogo a, b , F. Lunel a, f a Laboratoire HIFIH, IFR 132, Université, Angers b Service d’Hépato-gastroentérologie, CHU, Angers c Laboratoire de Biochimie et Biologie Moléculaire, CHU, Angers d Département de Pathologie Cellulaire et Tissulaire, CHU, Angers e Laboratoire d’Hématologie, CHU, Angers f Laboratoire d’Immunologie, CHU, Angers g Laboratoire de Virologie, CHU, Angers Summary FibroMeters are blood tests for liver fibrosis with several specificities: two main diagnostic targets (fibrosis stage and area of fibrosis); adaptation to specific causes; and results confirmed by an expert system. Thus, FibroMeters comprise six different tests: one for staging and one for quantitation of liver fibrosis in each of the three main causes of chronic liver disease—chronic viral hepatitis, alcoholic liver disease (ALD) and non-alcoholic fatty liver disease (NAFLD). FibroMeters display a high overall diagnostic accuracy and are the only tests to correctly classify 100% of HCV patients without fibrosis or with cirrhosis. They have 90% predictive values in a higher proportion of patients than with other usual blood tests. A 90% correct classification is available in 100% of HCV patients with the following reliable diagnostic intervals: F0/1, F1/2, F2±1, F3±1. In real-life conditions, the reproducibility of FibroMeters is higher than that of liver biopsy or ultrasonographic elastometry. FibroMeters are robust tests with the most stable diagnostic performance across different centers. Optional tests are also available, such as a specific one for cirrhosis, which has a diagnostic accuracy of 93.0% (AUROC: 0.92) and a 100% positive predictive value for diagnosis of HCV cirrhosis. Determination by FibroMeters of the area of fibrosis — the only direct, non-invasive, quantitative measurement of liver fibrosis — are especially useful for following-up cirrhosis as it correlates well with clinical events. FibroMeters are also very accurate in HVB or HIV-HCV co-infected patients. The tests specific for ALD and NAFLD also have a high diagnostic accuracy (AUROCs: 0.96 and 0.94, respectively, for significant fibrosis). © 2008 Elsevier Masson SAS. All rights reserved. 05_cales.indd 40 12/09/2008 14:58:33
Transcript of FibroMeters: a family of blood tests for liver fibrosis
FibroMeters: a family of blood tests for liver fibrosis
FibroMètres : une famille de tests sanguins de fibrose hépatique
Corresponding author: Service d’Hépato-Gastroentérologie, CHU, 49933 Angers Cedex 09, France E-mail address : [email protected]
© 2008 Elsevier Masson SAS. Tous droits réservés.
Gastrœntérol Clin Bio (2008) 32, 40-51
KEYWORDSLiver fibrosis; FibroMeterss; Area of fibrosis; Blood tests; Non invasive diagnosis; Chronic viral hepatitis; Alcoholic liver disease; NAFLD; HIV co-infection; Cirrhosis
P. Calès a, b,*, J. Boursier a, b, F. Oberti a, b, I. Hubert a, b, Y. Gallois a, c, M.-C. Rousselet a, d, N. Dib a, b, V. Moal c, L. Macchi e, A. Chevailler f, S. Michalak a, d, G. Hunault a, J. Chaigneau a, A. Sawadogo a, b, F. Lunel a, f
a Laboratoire HIFIH, IFR 132, Université, Angers b Service d’Hépato-gastroentérologie, CHU, Angers c Laboratoire de Biochimie et Biologie Moléculaire, CHU, Angers d Département de Pathologie Cellulaire et Tissulaire, CHU, Angers e Laboratoire d’Hématologie, CHU, Angers f Laboratoire d’Immunologie, CHU, Angers g Laboratoire de Virologie, CHU, Angers
Summary
FibroMeters are blood tests for liver fibrosis with several specificities: two main diagnostic targets (fibrosis stage and area of fibrosis); adaptation to specific causes; and results confirmed by an expert system. Thus, FibroMeters comprise six different tests: one for staging and one for quantitation of liver fibrosis in each of the three main causes of chronic liver disease—chronic viral hepatitis, alcoholic liver disease (ALD) and non-alcoholic fatty liver disease (NAFLD). FibroMeters display a high overall diagnostic accuracy and are the only tests to correctly classify 100% of HCV patients without fibrosis or with cirrhosis. They have 90% predictive values in a higher proportion of patients than with other usual blood tests. A 90% correct classification is available in 100% of HCV patients with the following reliable diagnostic intervals: F0/1, F1/2, F2±1, F3±1. In real-life conditions, the reproducibility of FibroMeters is higher than that of liver biopsy or ultrasonographic elastometry. FibroMeters are robust tests with the most stable diagnostic performance across different centers. Optional tests are also available, such as a specific one for cirrhosis, which has a diagnostic accuracy of 93.0% (AUROC: 0.92) and a 100% positive predictive value for diagnosis of HCV cirrhosis. Determination by FibroMeters of the area of fibrosis — the only direct, non-invasive, quantitative measurement of liver fibrosis — are especially useful for following-up cirrhosis as it correlates well with clinical events. FibroMeters are also very accurate in HVB or HIV-HCV co-infected patients. The tests specific for ALD and NAFLD also have a high diagnostic accuracy (AUROCs: 0.96 and 0.94, respectively, for significant fibrosis). © 2008 Elsevier Masson SAS. All rights reserved.
05_cales.indd 40 12/09/2008 14:58:33
FibroMeters 41
Résumé
Les FibroMètres sont des tests sanguins de fibrose hépatique avec plusieurs spécificités : deux cibles diagnostiques -stade et aire de fibrose-, adaptation à la cause, et résultats sécurisés par un système expert. Ainsi, il y a six principaux FibroMètres : un pour les stades et un pour la quantification de la fibrose dans chacune des trois principales causes d’hépatopathies : virus, alcool et stéatose. Le FibroMètre a une performance diagnostique globale très élevée et est le seul test à classer correctement 100% des patients infectés par le virus de l’hépatite C (VHC) sans fibrose ou avec cirrhose. Le FibroMètre a des valeurs prédictives à 90% chez une proportion élevée de patients. Une classification correcte à 90% est observée chez 100% des patients dans les intervalles diagnostiques suivants : F0/1, F1/2, F2±1, F3±1. Dans les conditions réelles, la reproductibilité du FibroMètre est plus élevée que celle de la biopsie hépatique ou de l’élastométrie impulsionnelle. Le FibroMètre est un test robuste avec la performance diagnostique la plus stable entre différents centres. Il y a plusieurs tests optionnels. Le FibroMètre spécifique de cirrhose a une performance diagnostique de 93% (AUROC: 0,92) et une valeur prédictive positive de 100% pour la cirrhose VHC. Le FibroMètre aire de fibrose, le seul test non invasif quantitatif de fibrose, est particulièrement utile au suivi des cirrhoses en raison de sa corrélation avec les événements cliniques. Le FibroMètre virus a une performance diagnostique élevée chez les patients co-infectés VHC-VIH ou atteints d’hépatite B. Le FibroMètre spécifique alcool ou stéatopathie métabolique a également une performance diagnostique élevée (AUROC: 0,96 et 0,94, respectivement, pour le diagnostic de fibrose significative). © 2008 Elsevier Masson SAS. Tous droits réservés.
Abbreviations
ALD: alcoholic liver disease
AUROC: area under the receiver operating characteristic
HCV: Hepatitis C Virus
MRI: magnetic resonance imaging
NAFLD: non-alcoholic fatty liver disease
NPV: negative predictive value
PPV: positive predictive value
Introduction
In 1997, our laboratory described a diagnostic test for liver fibrosis based on a mathematical algorithm that included several biomarkers [1]. In 2005, we constructed a series of second-generation tests called FibroMeters [2]. The good performance and applicability of these blood tests make them clinically relevant for everyday clinical practice.
FibroMeters have several specificities. First, they are constructed for specific causes of liver fibrosis—namely, chronic viral hepatitis B or C, alcoholic liver disease (ALD) and non-alcoholic fatty liver disease (NAFLD)—which con-tributes to their high level of performance. Indeed, our first blood test was not cause-specific [1] but, as the cause was an independent predictor of liver fibrosis, we subsequently developed cause-specific tests [2]. Also, these tests have two main diagnostic targets: fibrosis stage, based on histologi-cal staging systems such as METAVIR [3]; and the amount of fibrosis, based on morphometric determinations of the area
of fibrosis [4]. Thus, they are the only direct, non-invasive, quantitative tests to measure liver fibrosis. This option of FibroMeters presents the amount of liver fibrosis as a percentage of fibrous tissue. Another specificity is that it validates the results through an expert system that detects and corrects erroneous results (false positives and false negatives).
In this overview, we describe the different character-istics that make FibroMeters a unique series of blood tests with high-quality performance and relevant results for the non-invasive diagnosis of liver fibrosis. FibroMeters offer sig-nificant adaptability and flexibility in the clinical setting.
Overall presentation
There are six different tests within FibroMeters (Table 1): one for staging and one for quantification in each of the three main causes of chronic liver diseases—chronic viral hepatitis, ALD and NAFLD. In addition, optional specific tests can be
MOTS CLÉSFibrose hépatique ; FibroMètres ; Metavir ; Aire de fibrose ; Tests sanguins ; Dia-gnostic non invasif ; Hépatite chronique virale ; Maladie alcoolique du foie ; Stéatose métabolique ; Co-infection VIH ; Cirrhose
05_cales.indd 41 12/09/2008 14:58:33
42 P. Calés et al.
used for certain circumstances, especially viral hepatitis. Thus, the diagnosis of cirrhosis is optimized because of its own specific FibroMeter test (see details below). Likewise, determining the fibrosis stage in co-infections with HIV is also optimized with a specific test. The expert system uses other algorithms (scores), and these complementary diagnostic steps are all found on a professional website and are easy to use for users. In addition, an ancillary test—the InflaMeter—is intended to grade necroinflammatory activity and is also available. The clinical characteristics and blood biomarkers included in the six main FibroMeters tests and in the InflaMeter are given in Table 1.
FibroMeters in HCV patients
Performance
Overall performance
Pivotal study
In the pivotal study, the FibroMeters tests were mainly evaluated in patients with chronic hepatitis due to
hepatitis C virus (HCV) [2]. The overall diagnostic performance for significant fibrosis (METAVIR F2– F4), as reflected by the area under the receiver operating characteristic curve (AUROC, an index summarizing sensitivity and specificity), was significantly superior to the Fibrotest [5], Forns test [6] and APRI [7] in the test population. FibroMeters AUROC was also superior to those of Fibrospect [8] and the European liver fibrosis test [9].
Validation studies
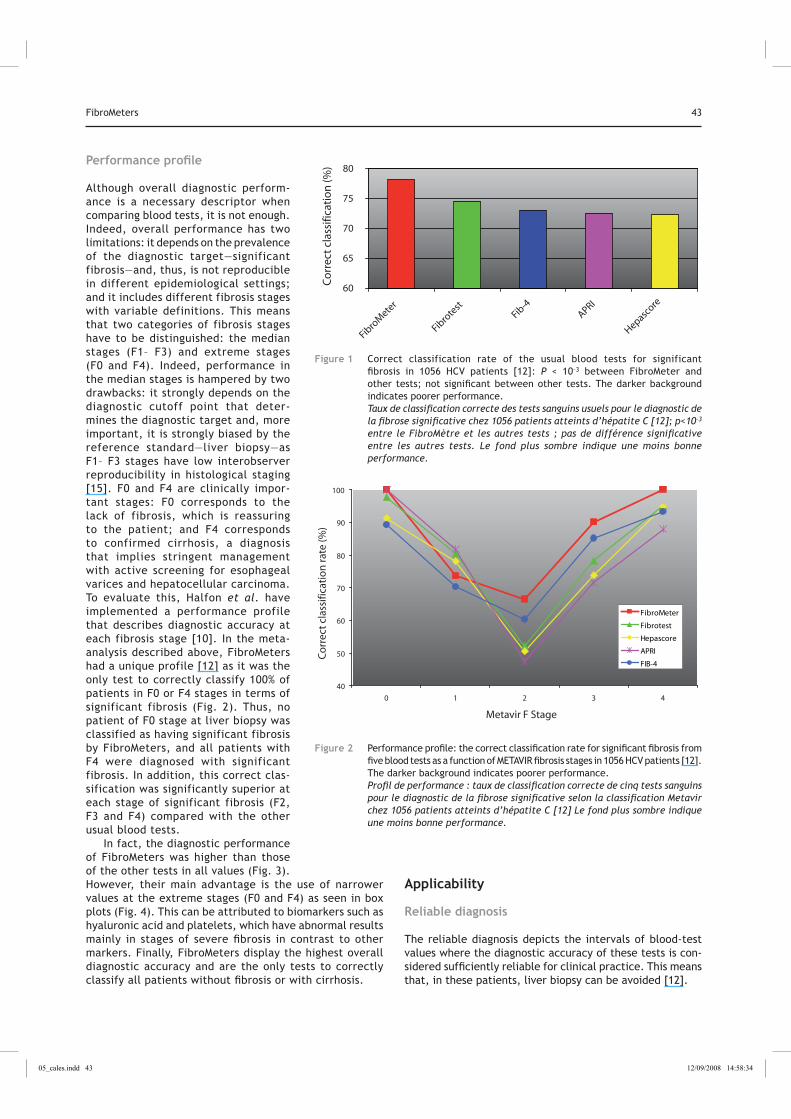
The FibroMeter test for fibrosis staging in HCV hepatitis has been evaluated in two independent studies [10, 11] and one meta-analysis, with individual data including the two previous studies, the pivotal study and other available cohorts [12]. We present here the results of the meta-analysis of 1056 patients [12]. In brief, FibroMeters AUROC, or correct classification rate (Fig. 1), for sig-nificant fibrosis was significantly higher than those of the other tests evaluated: Fibrotest, Hepascore [13], APRI and Fib-4 [14]. The AUROCs of these other tests did not signifi-cantly differ among themselves. In a sensitivity analysis excluding the pivotal study population, these significant differences were maintained.
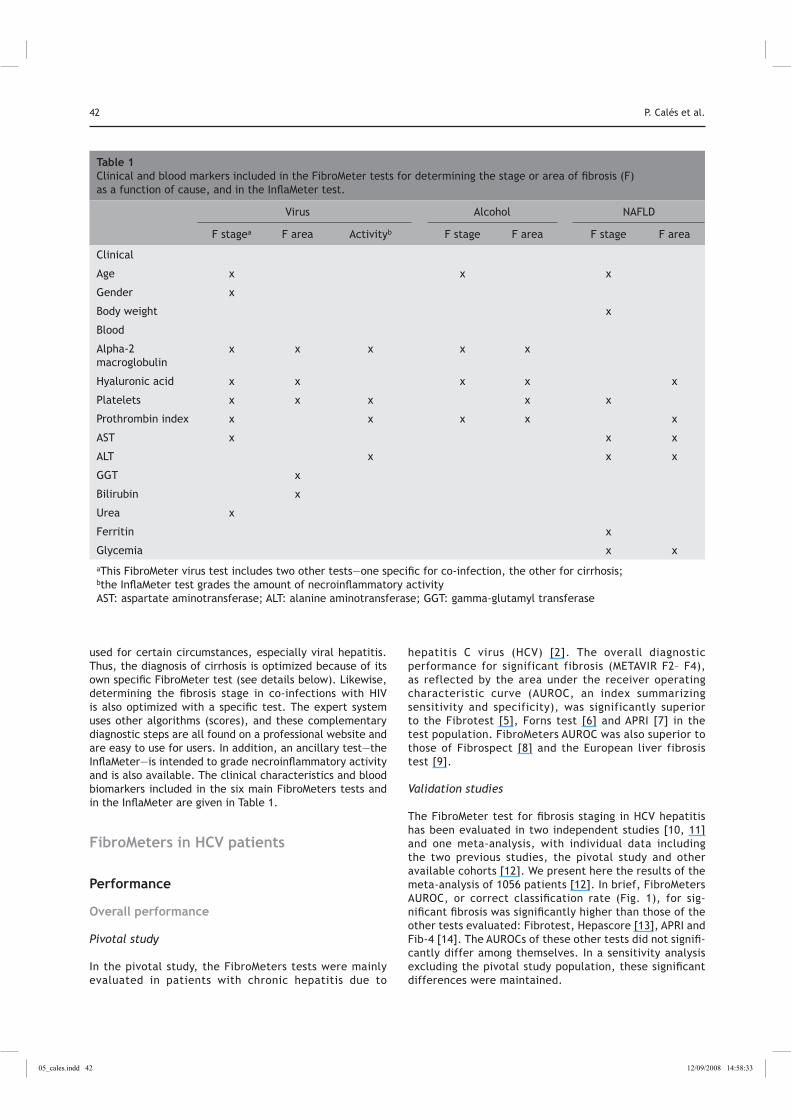
Table 1 Clinical and blood markers included in the FibroMeter tests for determining the stage or area of fibrosis (F) as a function of cause, and in the InflaMeter test.
Virus Alcohol NAFLD
F stagea F area Activityb F stage F area F stage F area
Clinical
Age x x x
Gender x
Body weight x
Blood
Alpha-2 macroglobulin
x x x x x
Hyaluronic acid x x x x x
Platelets x x x x x
Prothrombin index x x x x x
AST x x x
ALT x x x
GGT x
Bilirubin x
Urea x
Ferritin x
Glycemia x x
aThis FibroMeter virus test includes two other tests—one specific for co-infection, the other for cirrhosis;
bthe InflaMeter test grades the amount of necroinflammatory activity
AST: aspartate aminotransferase; ALT: alanine aminotransferase; GGT: gamma-glutamyl transferase
05_cales.indd 42 12/09/2008 14:58:33
FibroMeters 43
Performance profile
Although overall diagnostic perform-ance is a necessary descriptor when comparing blood tests, it is not enough. Indeed, overall performance has two limitations: it depends on the prevalence of the diagnostic target—significant fibrosis—and, thus, is not reproducible in different epidemiological settings; and it includes different fibrosis stages with variable definitions. This means that two categories of fibrosis stages have to be distinguished: the median stages (F1– F3) and extreme stages (F0 and F4). Indeed, performance in the median stages is hampered by two drawbacks: it strongly depends on the diagnostic cutoff point that deter-mines the diagnostic target and, more important, it is strongly biased by the reference standard—liver biopsy—as F1– F3 stages have low interobserver reproducibility in histological staging [15]. F0 and F4 are clinically impor-tant stages: F0 corresponds to the lack of fibrosis, which is reassuring to the patient; and F4 corresponds to confirmed cirrhosis, a diagnosis that implies stringent management with active screening for esophageal varices and hepatocellular carcinoma. To evaluate this, Halfon et al. have implemented a performance profile that describes diagnostic accuracy at each fibrosis stage [10]. In the meta-analysis described above, FibroMeters had a unique profile [12] as it was the only test to correctly classify 100% of patients in F0 or F4 stages in terms of significant fibrosis (Fig. 2). Thus, no patient of F0 stage at liver biopsy was classified as having significant fibrosis by FibroMeters, and all patients with F4 were diagnosed with significant fibrosis. In addition, this correct clas-sification was significantly superior at each stage of significant fibrosis (F2, F3 and F4) compared with the other usual blood tests.
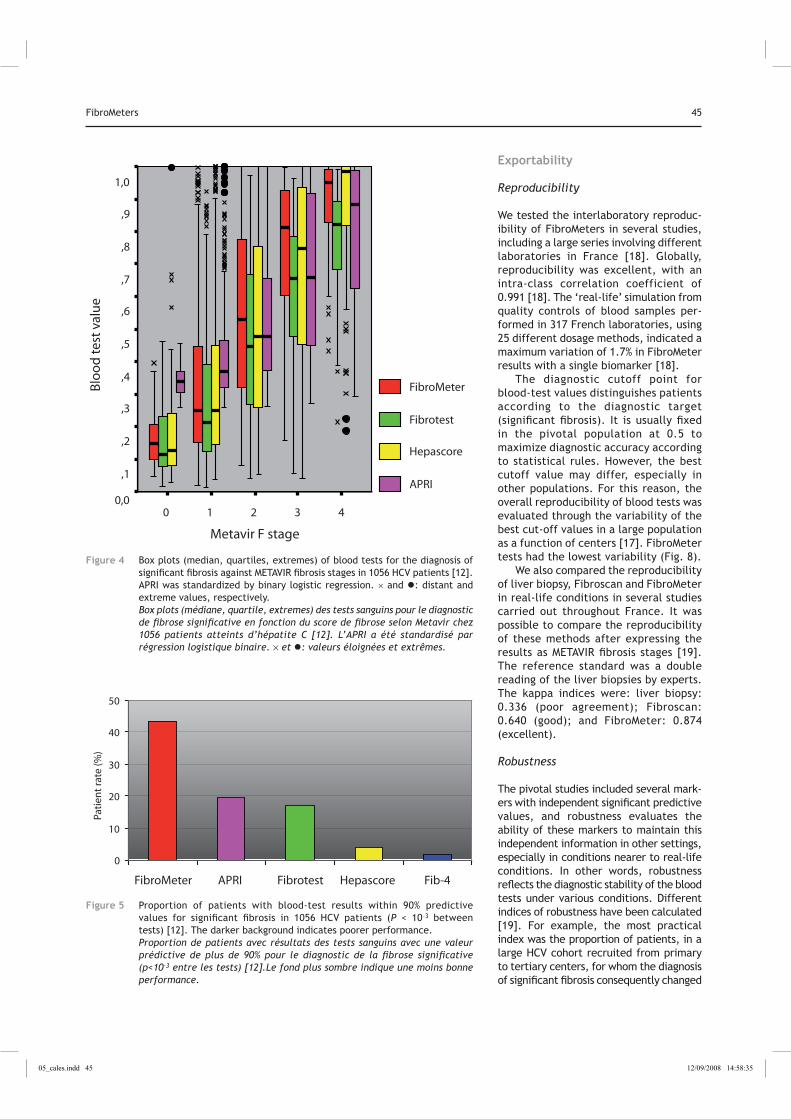
In fact, the diagnostic performance of FibroMeters was higher than those of the other tests in all values (Fig. 3). However, their main advantage is the use of narrower values at the extreme stages (F0 and F4) as seen in box plots (Fig. 4). This can be attributed to biomarkers such as hyaluronic acid and platelets, which have abnormal results mainly in stages of severe fibrosis in contrast to other markers. Finally, FibroMeters display the highest overall diagnostic accuracy and are the only tests to correctly classify all patients without fibrosis or with cirrhosis.
Applicability
Reliable diagnosis
The reliable diagnosis depicts the intervals of blood-test values where the diagnostic accuracy of these tests is con-sidered sufficiently reliable for clinical practice. This means that, in these patients, liver biopsy can be avoided [12].
60
65
70
75
80
Fibro
Mete
r
Fibro
test
Fib-4
APRI
Hepascore
Co
rrec
t cla
ssifi
cati
on
(%)
Figure 1 Correct classification rate of the usual blood tests for significant fibrosis in 1056 HCV patients [12]: P < 10–3 between FibroMeter and other tests; not significant between other tests. The darker background indicates poorer performance. Taux de classification correcte des tests sanguins usuels pour le diagnostic de la fibrose significative chez 1056 patients atteints d’hépatite C [12]; p<10–3 entre le FibroMètre et les autres tests ; pas de différence significative entre les autres tests. Le fond plus sombre indique une moins bonne performance.
40
50
60
70
80
90
100
0 1 2 3 4
Metavir F Stage
Co
rrec
t cl
assi
ficat
ion
rate
(%)
FibroMeter
Fibrotest
Hepascore
APRI
FIB-4
FibroMeter
Fibrotest
Hepascore
APRI
FIB-4
Figure 2 Performance profile: the correct classification rate for significant fibrosis from five blood tests as a function of METAVIR fibrosis stages in 1056 HCV patients [12]. The darker background indicates poorer performance. Profil de performance : taux de classification correcte de cinq tests sanguins pour le diagnostic de la fibrose significative selon la classification Metavir chez 1056 patients atteints d’hépatite C [12] Le fond plus sombre indique une moins bonne performance.
05_cales.indd 43 12/09/2008 14:58:34
44 P. Calés et al.
Traditional intervals
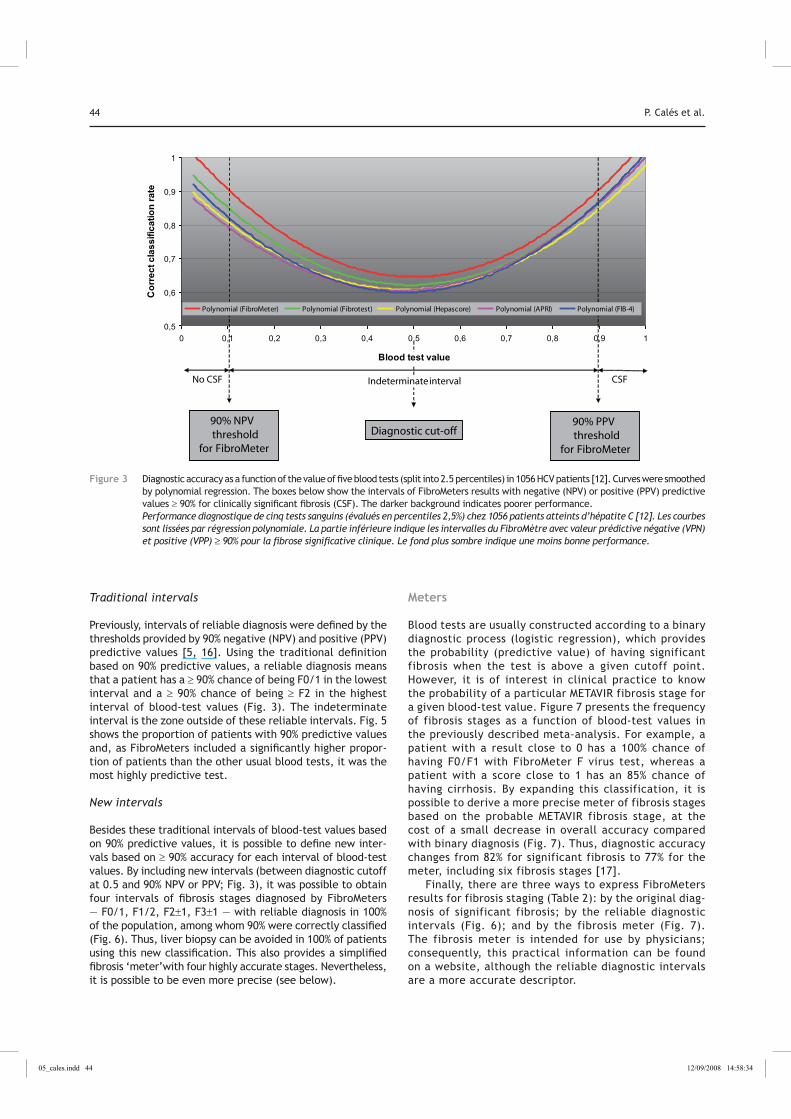
Previously, intervals of reliable diagnosis were defined by the thresholds provided by 90% negative (NPV) and positive (PPV) predictive values [5, 16]. Using the traditional definition based on 90% predictive values, a reliable diagnosis means that a patient has a ≥ 90% chance of being F0/1 in the lowest interval and a ≥ 90% chance of being ≥ F2 in the highest interval of blood-test values (Fig. 3). The indeterminate interval is the zone outside of these reliable intervals. Fig. 5 shows the proportion of patients with 90% predictive values and, as FibroMeters included a significantly higher propor-tion of patients than the other usual blood tests, it was the most highly predictive test.
New intervals
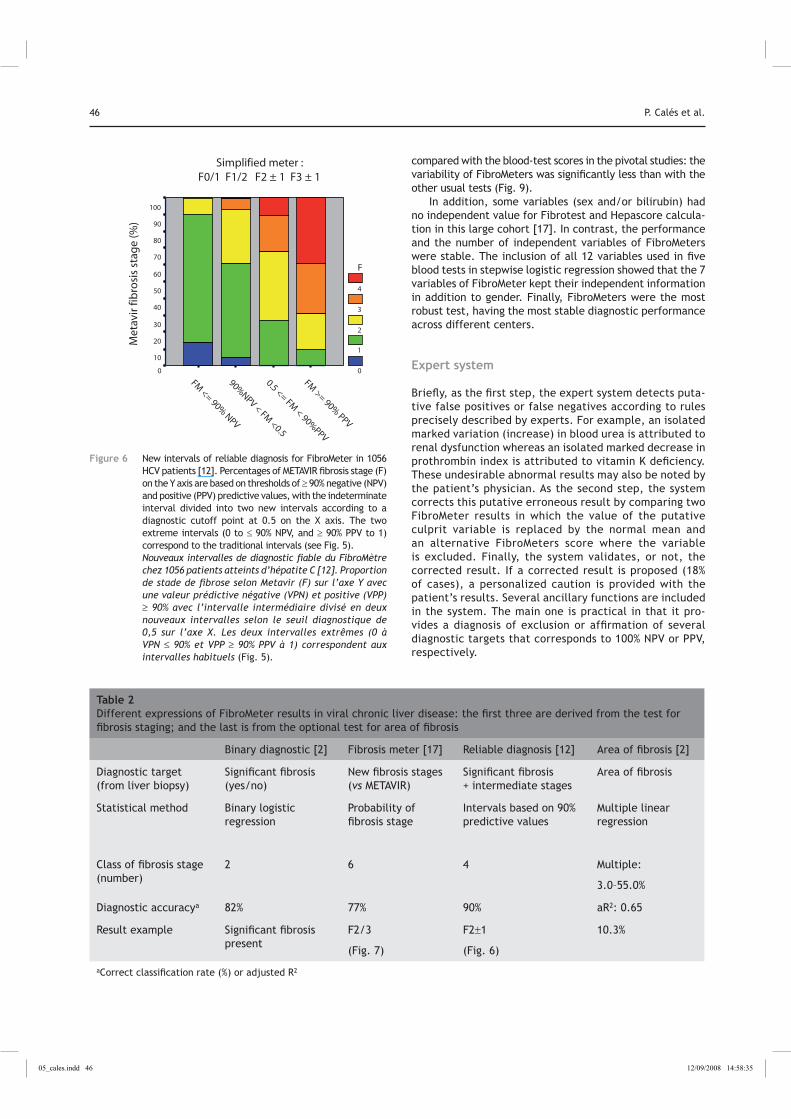
Besides these traditional intervals of blood-test values based on 90% predictive values, it is possible to define new inter-vals based on ≥ 90% accuracy for each interval of blood-test values. By including new intervals (between diagnostic cutoff at 0.5 and 90% NPV or PPV; Fig. 3), it was possible to obtain four intervals of fibrosis stages diagnosed by FibroMeters — F0/1, F1/2, F2±1, F3±1 — with reliable diagnosis in 100% of the population, among whom 90% were correctly classified (Fig. 6). Thus, liver biopsy can be avoided in 100% of patients using this new classification. This also provides a simplified fibrosis ‘meter’with four highly accurate stages. Nevertheless, it is possible to be even more precise (see below).
Meters
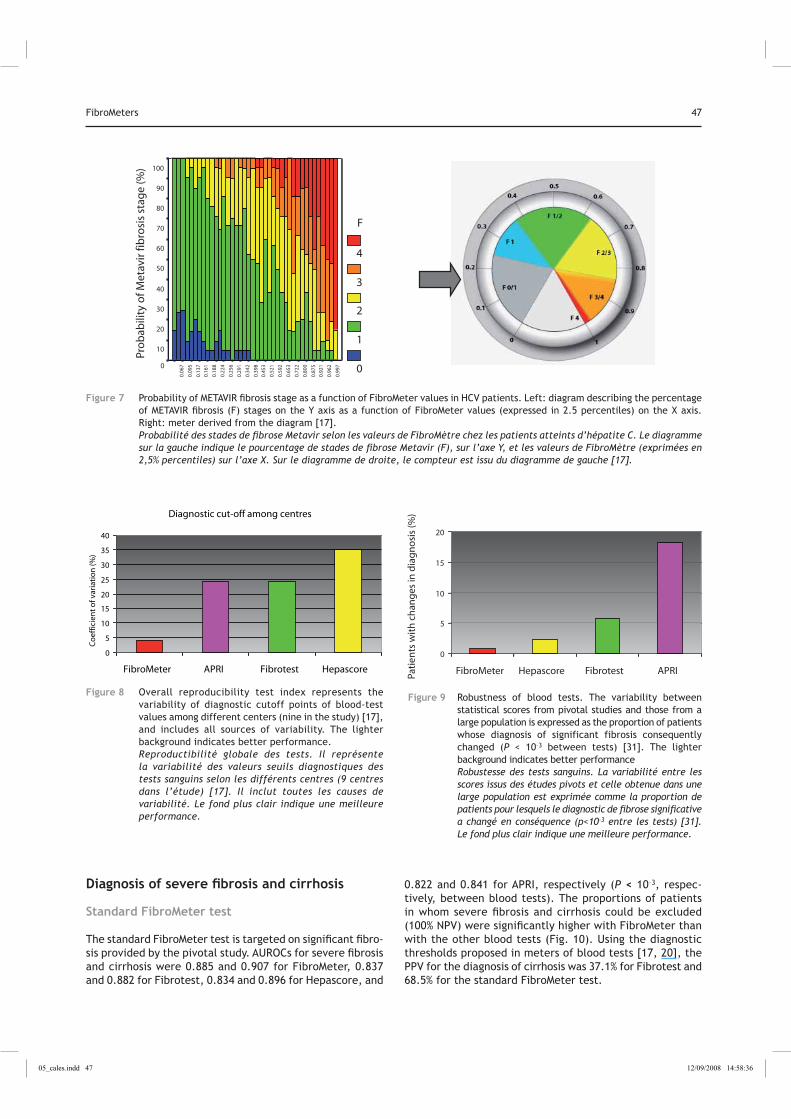
Blood tests are usually constructed according to a binary diagnostic process (logistic regression), which provides the probability (predictive value) of having significant fibrosis when the test is above a given cutoff point. However, it is of interest in clinical practice to know the probability of a particular METAVIR fibrosis stage for a given blood-test value. Figure 7 presents the frequency of fibrosis stages as a function of blood-test values in the previously described meta-analysis. For example, a patient with a result close to 0 has a 100% chance of having F0/F1 with FibroMeter F virus test, whereas a patient with a score close to 1 has an 85% chance of having cirrhosis. By expanding this classification, it is possible to derive a more precise meter of fibrosis stages based on the probable METAVIR fibrosis stage, at the cost of a small decrease in overall accuracy compared with binary diagnosis (Fig. 7). Thus, diagnostic accuracy changes from 82% for significant fibrosis to 77% for the meter, including six fibrosis stages [17].
Finally, there are three ways to express FibroMeters results for fibrosis staging (Table 2): by the original diag-nosis of significant fibrosis; by the reliable diagnostic intervals (Fig. 6); and by the fibrosis meter (Fig. 7). The fibrosis meter is intended for use by physicians; consequently, this practical information can be found on a website, although the reliable diagnostic intervals are a more accurate descriptor.
0,5
0,6
0,7
0,8
0,9
1
0 0,1 0,2 0,3 0,4 0,5 0,6 0,7 0,8 0,9 1
Cor
rect
cla
ssifi
catio
n ra
te
Polynomial (FibroMeter) Polynomial (Fibrotest) Polynomial (Hepascore) Polynomial (APRI) Polynomial (FIB-4)
90% NPV threshold
for FibroMeter
Diagnostic cut-off90% PPV threshold
for FibroMeter
No CSF CSF
Blood test value
Polynomial (FibroMeter) Polynomial (Fibrotest) Polynomial (Hepascore) Polynomial (APRI) Polynomial (FIB-4)
Indeterminateinterval
Figure 3 Diagnostic accuracy as a function of the value of five blood tests (split into 2.5 percentiles) in 1056 HCV patients [12]. Curves were smoothed by polynomial regression. The boxes below show the intervals of FibroMeters results with negative (NPV) or positive (PPV) predictive values ≥ 90% for clinically significant fibrosis (CSF). The darker background indicates poorer performance. Performance diagnostique de cinq tests sanguins (évalués en percentiles 2,5%) chez 1056 patients atteints d’hépatite C [12]. Les courbes sont lissées par régression polynomiale. La partie inférieure indique les intervalles du FibroMètre avec valeur prédictive négative (VPN) et positive (VPP) 90% pour la fibrose significative clinique. Le fond plus sombre indique une moins bonne performance.
05_cales.indd 44 12/09/2008 14:58:34
FibroMeters 45
Metavir F stage
43210
Blo
od
test
val
ue
1,0
,9
,8
,7
,6
,5
,4
,3
,2
,1
0,0
FibroMeter
Fibrotest
Hepascore
APRI
Figure 4 Box plots (median, quartiles, extremes) of blood tests for the diagnosis of significant fibrosis against METAVIR fibrosis stages in 1056 HCV patients [12]. APRI was standardized by binary logistic regression. × and �: distant and extreme values, respectively. Box plots (médiane, quartile, extremes) des tests sanguins pour le diagnostic de fibrose significative en fonction du score de fibrose selon Metavir chez 1056 patients atteints d’hépatite C [12]. L’APRI a été standardisé par régression logistique binaire. et �: valeurs éloignées et extrêmes.
Exportability
Reproducibility
We tested the interlaboratory reproduc-ibility of FibroMeters in several studies, including a large series involving different laboratories in France [18]. Globally, reproducibility was excellent, with an intra-class correlation coefficient of 0.991 [18]. The ‘real-life’ simulation from quality controls of blood samples per-formed in 317 French laboratories, using 25 different dosage methods, indicated a maximum variation of 1.7% in FibroMeter results with a single biomarker [18].
The diagnostic cutoff point for blood-test values distinguishes patients according to the diagnostic target (significant fibrosis). It is usually fixed in the pivotal population at 0.5 to maximize diagnostic accuracy according to statistical rules. However, the best cutoff value may differ, especially in other populations. For this reason, the overall reproducibility of blood tests was evaluated through the variability of the best cut-off values in a large population as a function of centers [17]. FibroMeter tests had the lowest variability (Fig. 8).
We also compared the reproducibility of liver biopsy, Fibroscan and FibroMeter in real-life conditions in several studies carried out throughout France. It was possible to compare the reproducibility of these methods after expressing the results as METAVIR fibrosis stages [19]. The reference standard was a double reading of the liver biopsies by experts. The kappa indices were: liver biopsy: 0.336 (poor agreement); Fibroscan: 0.640 (good); and FibroMeter: 0.874 (excellent).
Robustness
The pivotal studies included several mark-ers with independent significant predictive values, and robustness evaluates the ability of these markers to maintain this independent information in other settings, especially in conditions nearer to real-life conditions. In other words, robustness reflects the diagnostic stability of the blood tests under various conditions. Different indices of robustness have been calculated [19]. For example, the most practical index was the proportion of patients, in a large HCV cohort recruited from primary to tertiary centers, for whom the diagnosis of significant fibrosis consequently changed
0
10
20
30
40
50
FibroMeter APRI Fibrotest Hepascore Fib-4
Pati
ent r
ate
(%)
Figure 5 Proportion of patients with blood-test results within 90% predictive values for significant fibrosis in 1056 HCV patients (P < 10–3 between tests) [12]. The darker background indicates poorer performance. Proportion de patients avec résultats des tests sanguins avec une valeur prédictive de plus de 90% pour le diagnostic de la fibrose significative (p<10–3 entre les tests) [12].Le fond plus sombre indique une moins bonne performance.
05_cales.indd 45 12/09/2008 14:58:35
46 P. Calés et al.
compared with the blood-test scores in the pivotal studies: the variability of FibroMeters was significantly less than with the other usual tests (Fig. 9).
In addition, some variables (sex and/or bilirubin) had no independent value for Fibrotest and Hepascore calcula-tion in this large cohort [17]. In contrast, the performance and the number of independent variables of FibroMeters were stable. The inclusion of all 12 variables used in five blood tests in stepwise logistic regression showed that the 7 variables of FibroMeter kept their independent information in addition to gender. Finally, FibroMeters were the most robust test, having the most stable diagnostic performance across different centers.
Expert system
Briefly, as the first step, the expert system detects puta-tive false positives or false negatives according to rules precisely described by experts. For example, an isolated marked variation (increase) in blood urea is attributed to renal dysfunction whereas an isolated marked decrease in prothrombin index is attributed to vitamin K deficiency. These undesirable abnormal results may also be noted by the patient’s physician. As the second step, the system corrects this putative erroneous result by comparing two FibroMeter results in which the value of the putative culprit variable is replaced by the normal mean and an alternative FibroMeters score where the variable is excluded. Finally, the system validates, or not, the corrected result. If a corrected result is proposed (18% of cases), a personalized caution is provided with the patient’s results. Several ancillary functions are included in the system. The main one is practical in that it pro-vides a diagnosis of exclusion or affirmation of several diagnostic targets that corresponds to 100% NPV or PPV, respectively.
Table 2 Different expressions of FibroMeter results in viral chronic liver disease: the first three are derived from the test for fibrosis staging; and the last is from the optional test for area of fibrosis
Binary diagnostic [2] Fibrosis meter [17] Reliable diagnosis [12] Area of fibrosis [2]
Diagnostic target (from liver biopsy)
Significant fibrosis (yes/no)
New fibrosis stages (vs METAVIR)
Significant fibrosis + intermediate stages
Area of fibrosis
Statistical method Binary logistic regression
Probability of fibrosis stage
Intervals based on 90% predictive values
Multiple linear regression
Class of fibrosis stage (number)
2 6 4 Multiple:
3.0–55.0%
Diagnostic accuracya 82% 77% 90% aR2: 0.65
Result example Significant fibrosis present
F2/3
(Fig. 7)
F2±1
(Fig. 6)
10.3%
aCorrect classification rate (%) or adjusted R2
FM >= 90%
PPV
0.5 <= FM < 90%
PPV
90%NPV < FM
<0.5
FM <= 90%
NPV
Met
avir
fib
rosi
s st
age
(%)
100
90
80
70
60
50
40
30
20
10
0
F
4
3
2
1
0
Simplified meter :F0/1 F1/2 F2 ± 1 F3 ± 1
Figure 6 New intervals of reliable diagnosis for FibroMeter in 1056 HCV patients [12]. Percentages of METAVIR fibrosis stage (F) on the Y axis are based on thresholds of ≥ 90% negative (NPV) and positive (PPV) predictive values, with the indeterminate interval divided into two new intervals according to a diagnostic cutoff point at 0.5 on the X axis. The two extreme intervals (0 to ≤ 90% NPV, and ≥ 90% PPV to 1) correspond to the traditional intervals (see Fig. 5). Nouveaux intervalles de diagnostic fiable du FibroMètre chez 1056 patients atteints d’hépatite C [12]. Proportion de stade de fibrose selon Metavir (F) sur l’axe Y avec une valeur prédictive négative (VPN) et positive (VPP) 90% avec l’intervalle intermédiaire divisé en deux
nouveaux intervalles selon le seuil diagnostique de 0,5 sur l’axe X. Les deux intervalles extrêmes (0 à VPN 90% et VPP 90% PPV à 1) correspondent aux intervalles habituels (Fig. 5).
05_cales.indd 46 12/09/2008 14:58:35
FibroMeters 47
0.99
7
0.96
2
0.92
1
0.87
5
0.80
0
0.72
2
0.65
3
0.59
2
0.52
1
0.45
3
0.39
8
0.34
2
0.29
1
0.25
6
0.22
4
0.18
8
0.16
1
0.13
7
0.09
5
0.06
7
Pro
bab
ility
of M
etav
ir fi
bro
sis
stag
e (%
) 100
90
80
70
60
50
40
30
20
10
0
F
4
3
2
1
0
Figure 7 Probability of METAVIR fibrosis stage as a function of FibroMeter values in HCV patients. Left: diagram describing the percentage of METAVIR fibrosis (F) stages on the Y axis as a function of FibroMeter values (expressed in 2.5 percentiles) on the X axis. Right: meter derived from the diagram [17]. Probabilité des stades de fibrose Metavir selon les valeurs de FibroMètre chez les patients atteints d’hépatite C. Le diagramme sur la gauche indique le pourcentage de stades de fibrose Metavir (F), sur l’axe Y, et les valeurs de FibroMètre (exprimées en 2,5% percentiles) sur l’axe X. Sur le diagramme de droite, le compteur est issu du diagramme de gauche [17].
Diagnosis of severe fibrosis and cirrhosis
Standard FibroMeter test
The standard FibroMeter test is targeted on significant fibro-sis provided by the pivotal study. AUROCs for severe fibrosis and cirrhosis were 0.885 and 0.907 for FibroMeter, 0.837 and 0.882 for Fibrotest, 0.834 and 0.896 for Hepascore, and
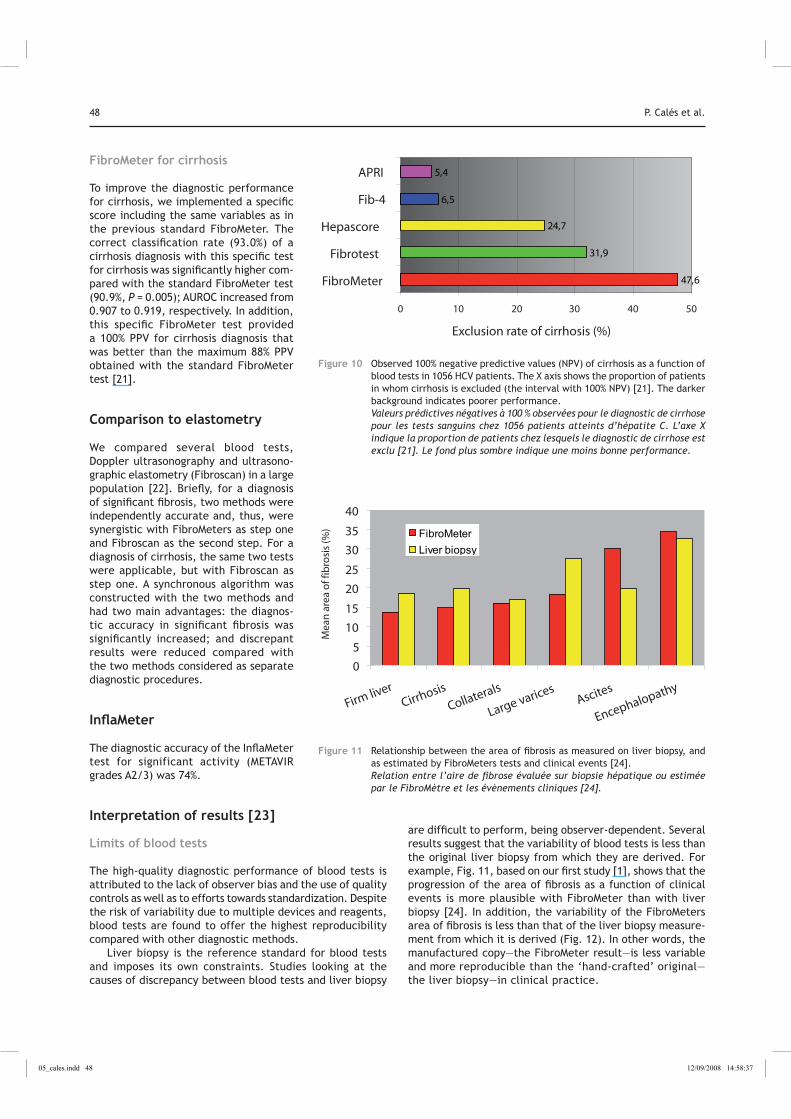
0.822 and 0.841 for APRI, respectively (P < 10–3, respec-tively, between blood tests). The proportions of patients in whom severe fibrosis and cirrhosis could be excluded (100% NPV) were significantly higher with FibroMeter than with the other blood tests (Fig. 10). Using the diagnostic thresholds proposed in meters of blood tests [17, 20], the PPV for the diagnosis of cirrhosis was 37.1% for Fibrotest and 68.5% for the standard FibroMeter test.
Diagnostic cut-off among centres
0
5
10
15
20
25
30
35
40
FibroMeter APRI Fibrotest Hepascore
Co
effic
ien
t o
f var
iati
on
(%)
Figure 8 Overall reproducibility test index represents the variability of diagnostic cutoff points of blood-test values among different centers (nine in the study) [17], and includes all sources of variability. The lighter background indicates better performance. Reproductibilité globale des tests. Il représente la variabilité des valeurs seuils diagnostiques des tests sanguins selon les différents centres (9 centres dans l’étude) [17]. Il inclut toutes les causes de variabilité. Le fond plus clair indique une meilleure performance.
0
5
10
15
20
FibroMeter Hepascore Fibrotest APRIPati
ents
wit
h c
han
ges
in d
iag
no
sis
(%)
Figure 9 Robustness of blood tests. The variability between statistical scores from pivotal studies and those from a large population is expressed as the proportion of patients whose diagnosis of significant fibrosis consequently changed (P < 10–3 between tests) [31]. The lighter background indicates better performance Robustesse des tests sanguins. La variabilité entre les scores issus des études pivots et celle obtenue dans une large population est exprimée comme la proportion de patients pour lesquels le diagnostic de fibrose significative a changé en conséquence (p<10–3 entre les tests) [31]. Le fond plus clair indique une meilleure performance.
05_cales.indd 47 12/09/2008 14:58:36
48 P. Calés et al.
FibroMeter for cirrhosis
To improve the diagnostic performance for cirrhosis, we implemented a specific score including the same variables as in the previous standard FibroMeter. The correct classification rate (93.0%) of a cirrhosis diagnosis with this specific test for cirrhosis was significantly higher com-pared with the standard FibroMeter test (90.9%, P = 0.005); AUROC increased from 0.907 to 0.919, respectively. In addition, this specific FibroMeter test provided a 100% PPV for cirrhosis diagnosis that was better than the maximum 88% PPV obtained with the standard FibroMeter test [21].
Comparison to elastometry
We compared several blood tests, Doppler ultrasonography and ultrasono-graphic elastometry (Fibroscan) in a large population [22]. Briefly, for a diagnosis of significant fibrosis, two methods were independently accurate and, thus, were synergistic with FibroMeters as step one and Fibroscan as the second step. For a diagnosis of cirrhosis, the same two tests were applicable, but with Fibroscan as step one. A synchronous algorithm was constructed with the two methods and had two main advantages: the diagnos-tic accuracy in significant fibrosis was significantly increased; and discrepant results were reduced compared with the two methods considered as separate diagnostic procedures.
InflaMeter
The diagnostic accuracy of the InflaMeter test for significant activity (METAVIR grades A2/3) was 74%.
Interpretation of results [23]
Limits of blood tests
The high-quality diagnostic performance of blood tests is attributed to the lack of observer bias and the use of quality controls as well as to efforts towards standardization. Despite the risk of variability due to multiple devices and reagents, blood tests are found to offer the highest reproducibility compared with other diagnostic methods.
Liver biopsy is the reference standard for blood tests and imposes its own constraints. Studies looking at the causes of discrepancy between blood tests and liver biopsy
are difficult to perform, being observer-dependent. Several results suggest that the variability of blood tests is less than the original liver biopsy from which they are derived. For example, Fig. 11, based on our first study [1], shows that the progression of the area of fibrosis as a function of clinical events is more plausible with FibroMeter than with liver biopsy [24]. In addition, the variability of the FibroMeters area of fibrosis is less than that of the liver biopsy measure-ment from which it is derived (Fig. 12). In other words, the manufactured copy—the FibroMeter result—is less variable and more reproducible than the ‘hand-crafted’ original—the liver biopsy—in clinical practice.
0 10 20 30 40 50
FibroMeter
Fibrotest
Hepascore
Fib-4
APRI
Exclusion rate of cirrhosis (%)
47,6
31,9
24,7
6,5
5,4
Figure 10 Observed 100% negative predictive values (NPV) of cirrhosis as a function of blood tests in 1056 HCV patients. The X axis shows the proportion of patients in whom cirrhosis is excluded (the interval with 100% NPV) [21]. The darker background indicates poorer performance. Valeurs prédictives négatives à 100 % observées pour le diagnostic de cirrhose pour les tests sanguins chez 1056 patients atteints d’hépatite C. L’axe X indique la proportion de patients chez lesquels le diagnostic de cirrhose est exclu [21]. Le fond plus sombre indique une moins bonne performance.
0
5
10
15
20
25
30
35
40
Firm liverCirrhosis
Collaterals
Large varicesAscites
Encephalopathy
Mea
n a
rea
of f
ibro
sis
(%) FibroMeter
Liver biopsy
Figure 11 Relationship between the area of fibrosis as measured on liver biopsy, and as estimated by FibroMeters tests and clinical events [24]. Relation entre l’aire de fibrose évaluée sur biopsie hépatique ou estimée par le FibroMètre et les évènements cliniques [24].
05_cales.indd 48 12/09/2008 14:58:37

FibroMeters 49
Limits and advantages of FibroMeters
We have seen that FibroMeters have several advantages in terms of diagnostic performance, reproducibility and robustness. This can be attributed to the design of the tests and to the multistep diagnostic process. Thus, the FibroMeters F virus test uses the widest spectrum of biomarkers for fibrogenesis and fibrolysis [25]. However, this inconveniently requires several laboratory automates (three as a rule), which increases the cost.
Interpretation of FibroMeters requires validation by a physi-cian, as with any other diagnostic tool. Although the test result is analyzed by an expert system on a professional website, the true expert remains a qualified physician, and the interpretation of non-invasive tests requires expertise in this particular field.
FibroMeters have not been validated for miscellaneous causes of liver diseases, in children and in co-morbidities. However, in our hands, the FibroMeter virus test is the most useful option.
All of the diagnostic improvements provided by FibroMeter optional tests require the use of sophisticated software that is available on a website.
Other conditions
Other viruses
HBV
In the pivotal study, the FibroMeter AUROC was 0.868 in HBV patients vs 0.883 in HCV patients [2]. In an independent study of 255 HBV patients and 255 HCV patients, the FibroMeter
AUROC was the highest of four blood tests and not signifi-cantly different from that observed in HCV patients [26].
Co-infections
FibroMeter test has been compared with other blood tests in a large series of 272 HCV-HIV co-infected patients [27], and its AUROC was the highest of 7 blood tests. We have also tested several blood tests in a large cohort of 452 HCV-HIV co-infected patients that included the previous cohort, and implemented a specific FibroMeter test for co-infection with an AUROC of 0.85 for significant fibrosis [28].
Other causes
Alcohol
The FibroMeter test for ALD had a good diagnostic perform-ance in the pivotal study with an AUROC of 0.962 for sig-nificant fibrosis [2], which was confirmed in a meta-analysis [29]. However, this excellent performance is partially due to the high prevalence of severe fibrosis in ALD with liver biopsy.
NAFLD
The FibroMeter test specific for NAFLD includes glucose, AST, ferritin, platelets, ALT, body weight and age and, thus, includes three markers specific to the metabolic syndrome. It has been evaluated in 235 NAFLD patients [30]. The highest accuracy—91%—for significant fibrosis was obtained with the FibroMeter NAFLD, with an AUROC (0.943) that was significantly higher than those of the NAFLD fibrosis score (NFSA) [31] (0.884, P = 0.008 vs FibroMeter) and APRI (0.866, P < 10–3 vs FibroMeter; P = 0.309 vs NFSA). Using thresholds of 90% predictive values (accepted error: 10%), liver biopsy could have been avoided in most patients: FibroMeter, 97.4%, compared with NFSA, 86.8% (P < 10–3) and APRI, 80.0% (P < 10–3). The classification of patients, based on the new intervals of reliable diagnosis, provided three reliable diag-nostic intervals—F0/1, F2±1 and F3±1—with 91.4% accuracy for FibroMeter NAFLD, avoiding biopsy in all patients.
Particular settings
The FibroMeters virus test has also been validated in hemo-philiacs [32].
Quantitation of liver fibrosis
The relationship between the degree of liver fibrosis and the clinical course of chronic liver disease is not established. However, recent studies suggest a close link between the degree of fibrosis and clinical events such as portal hyperten-sion [33]. In addition, as the amount of fibrosis may have
272248776 272248776N =
Metavir F
43210
30
20
10
0
FibroMeter
Liver Biopsy
Are
a o
f fib
rosi
s (%
)
Figure 12 Box plots (median, quartiles, extremes) of the area of fibrosis determined by FibroMeter and liver biopsy [2]. Box plots (médiane, quartiles, extrêmes) de l’aire de fibrose déterminée par le FibroMètre ou la biopsie hépatique [2].
05_cales.indd 49 12/09/2008 14:58:37
50 P. Calés et al.
prognostic value, it is likely that quantitative fibrosis tests are clinically useful. In addition, non-invasive tests may substantially contribute to our knowledge of the natural course of chronic liver disease. Previous studies have shown that the amount of fibrosis is mainly developed during cir-rhosis [33]. This means that quantification of liver fibrosis is of growing interest.
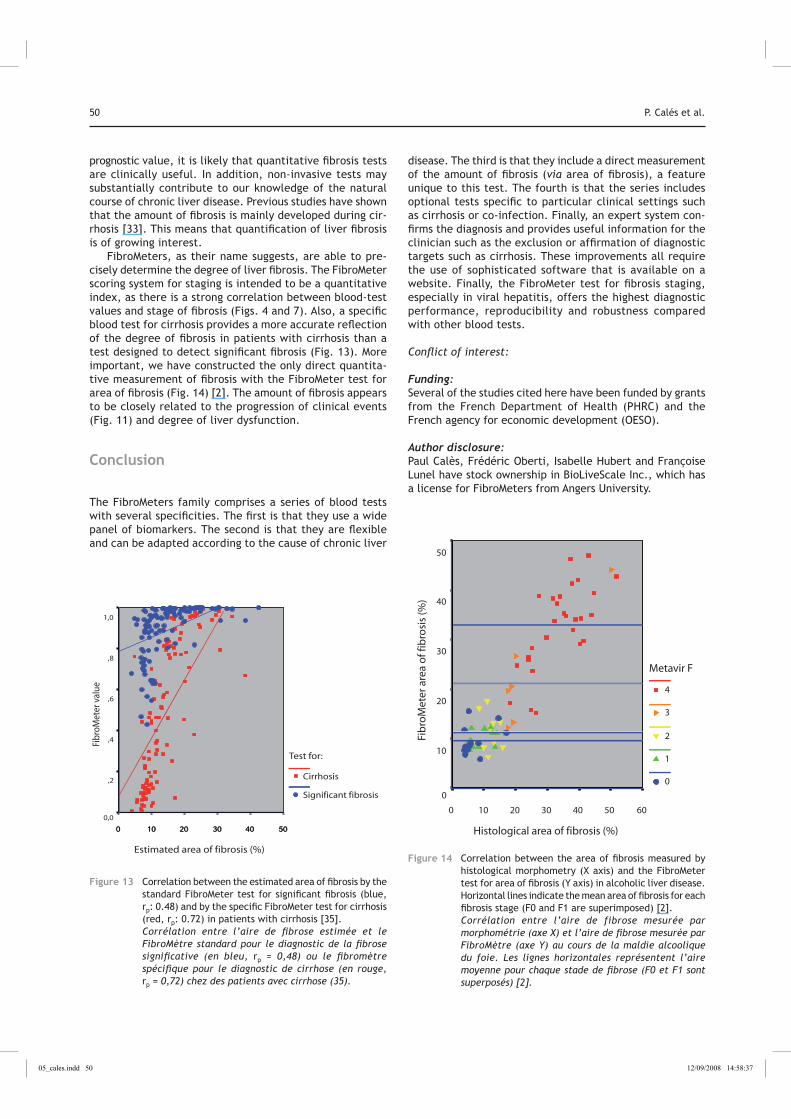
FibroMeters, as their name suggests, are able to pre-cisely determine the degree of liver fibrosis. The FibroMeter scoring system for staging is intended to be a quantitative index, as there is a strong correlation between blood-test values and stage of fibrosis (Figs. 4 and 7). Also, a specific blood test for cirrhosis provides a more accurate reflection of the degree of fibrosis in patients with cirrhosis than a test designed to detect significant fibrosis (Fig. 13). More important, we have constructed the only direct quantita-tive measurement of fibrosis with the FibroMeter test for area of fibrosis (Fig. 14) [2]. The amount of fibrosis appears to be closely related to the progression of clinical events (Fig. 11) and degree of liver dysfunction.
Conclusion
The FibroMeters family comprises a series of blood tests with several specificities. The first is that they use a wide panel of biomarkers. The second is that they are flexible and can be adapted according to the cause of chronic liver
disease. The third is that they include a direct measurement of the amount of fibrosis (via area of fibrosis), a feature unique to this test. The fourth is that the series includes optional tests specific to particular clinical settings such as cirrhosis or co-infection. Finally, an expert system con-firms the diagnosis and provides useful information for the clinician such as the exclusion or affirmation of diagnostic targets such as cirrhosis. These improvements all require the use of sophisticated software that is available on a website. Finally, the FibroMeter test for fibrosis staging, especially in viral hepatitis, offers the highest diagnostic performance, reproducibility and robustness compared with other blood tests.
Conflict of interest:
Funding: Several of the studies cited here have been funded by grants from the French Department of Health (PHRC) and the French agency for economic development (OESO).
Author disclosure: Paul Calès, Frédéric Oberti, Isabelle Hubert and Françoise Lunel have stock ownership in BioLiveScale Inc., which has a license for FibroMeters from Angers University.
Estimated area of fibrosis (%)
50403020100
Fibr
oMet
er v
alue
1,0
,8
,6
,4
,2
0,0
Test for:
Cirrhosis
Significant fibrosis
50403020100
Figure 13 Correlation between the estimated area of fibrosis by the standard FibroMeter test for significant fibrosis (blue, rp: 0.48) and by the specific FibroMeter test for cirrhosis (red, rp: 0.72) in patients with cirrhosis [35]. Corrélation entre l’aire de fibrose estimée et le FibroMètre standard pour le diagnostic de la fibrose significative (en bleu, rp = 0,48) ou le fibromètre spécifique pour le diagnostic de cirrhose (en rouge, rp = 0,72) chez des patients avec cirrhose (35).
Histological area of fibrosis (%)
6050403020100
Fib
roM
eter
are
a o
f fib
rosi
s (%
)
50
40
30
20
10
0
Metavir F
4
3
2
1
0
Figure 14 Correlation between the area of fibrosis measured by histological morphometry (X axis) and the FibroMeter test for area of fibrosis (Y axis) in alcoholic liver disease. Horizontal lines indicate the mean area of fibrosis for each fibrosis stage (F0 and F1 are superimposed) [2]. Corrélation entre l’aire de fibrose mesurée par morphométrie (axe X) et l’aire de fibrose mesurée par FibroMètre (axe Y) au cours de la maldie alcoolique du foie. Les lignes horizontales représentent l’aire moyenne pour chaque stade de fibrose (F0 et F1 sont superposés) [2].
05_cales.indd 50 12/09/2008 14:58:37
FibroMeters 51
References
[1] Oberti F, Valsesia E, Pilette C, Rousselet MC, Bedossa P, Aube C, et al. Noninvasive diagnosis of hepatic fibrosis or cirrhosis. Gastroenterology 1997;113:1609-16.
[2] Cales P, Oberti F, Michalak S, Hubert-Fouchard I, Rousselet MC, Konate A, et al. A novel panel of blood markers to assess the degree of liver fibrosis. Hepatology 2005;42:1373-81.
[3] Intraobserver and interobserver variations in liver biopsy interpretation in patients with chronic hepatitis C. The French METAVIR Cooperative Study Group. Hepatology 1994;20:15-20.
[4] Pilette C, Rousselet MC, Bedossa P, Chappard D, Oberti F, Rifflet H, et al. Histopathological evaluation of liver fibrosis: quantitative image analysis vs semi-quantitative scores. Comparison with serum markers. J Hepatol 1998;28:439-46.
[5] Imbert-Bismut F, Ratziu V, Pieroni L, Charlotte F, Benhamou Y, Poynard T. Biochemical markers of liver fibrosis in patients with hepatitis C virus infection: a prospective study. Lancet 2001;357:1069-75.
[6] Forns X, Ampurdanes S, Llovet JM, Aponte J, Quinto L, Martinez-Bauer E, et al. Identification of chronic hepatitis C patients without hepatic fibrosis by a simple predictive model. Hepatology 2002;36:986-92.
[7] Wai CT, Greenson JK, Fontana RJ, Kalbfleisch JD, Marrero JA, Conjeevaram HS, et al. A simple noninvasive index can predict both significant fibrosis and cirrhosis in patients with chronic hepatitis C. Hepatology 2003;38:518-26.
[8] Patel K, Gordon SC, Jacobson I, Hezode C, Oh E, Smith KM, et al. Evaluation of a panel of non-invasive serum markers to differentiate mild from moderate-to-advanced liver fibrosis in chronic hepatitis C patients. J Hepatol 2004;41:935-42.
[9] Rosenberg WM, Voelker M, Thiel R, Becka M, Burt A, Schuppan D, et al. Serum markers detect the presence of liver fibrosis: a cohort study. Gastroenterology 2004;127:1704-13.
[10] Halfon P, Bacq Y, De Muret A, Penaranda G, Bourliere M, Ouzan D, et al. Comparison of test performance profile for blood tests of liver fibrosis in chronic hepatitis C. J Hepatol 2007;46:395-402.
[11] Leroy V, Hilleret MN, Sturm N, Trocme C, Renversez JC, Faure P, et al. Prospective comparison of six non-invasive scores for the diagnosis of liver fibrosis in chronic hepatitis C. J Hepatol 2007;46:775-82.
[12] Calès P, de Ledinghen V, Halfon P, Bacq Y, Leroy V, Boursier J, et al. Evaluating accuracy and increasing the reliable diagnosis rate of blood tests for liver fibrosis in chronic hepatitis C. Liver Intern 2008; (in press).
[13] Adams LA, Bulsara M, Rossi E, DeBoer B, Speers D, George J, et al. Hepascore: an accurate validated predictor of liver fibrosis in chronic hepatitis C infection. Clin Chem 2005;51:1867-73.
[14] Vallet-Pichard A, Mallet V, Nalpas B, Verkarre V, Nalpas A, Dhalluin-Venier V, et al. FIB-4: an inexpensive and accurate marker of fibrosis in HCV infection. comparison with liver biopsy and Fibrotest. Hepatology 2007;46:32-6.
[15] Rousselet MC, Michalak S, Dupre F, Croue A, Bedossa P, Saint-Andre JP, et al. Sources of variability in histological scoring of chronic viral hepatitis. Hepatology 2005;41:257-64.
[16] Colletta C, Smirne C, Fabris C, Toniutto P, Rapetti R, Minisini R, et al. Value of two noninvasive methods to detect progression of fibrosis among HCV carriers with normal aminotransferases. Hepatology 2005;42:838-45.
[17] Leroy V, Halfon P, Bacq Y, Boursier J, Rousselet M, Bourlière M, et al. Diagnostic accuracy, reproducibility and robustness of fibrosis blood tests in chronic hepatitis C: a meta-analysis with individual data. Clin Biochem 2008; (in press).
[18] Cales P, Veillon P, Konate A, Mathieu E, Ternisien C, Chevailler A, et al. Reproducibility of blood tests of liver fibrosis in clini-cal practice. Clin Biochem 2008;41:10-8.
[19] Calès P, Boursier J, Rousselet M, Michalak S, Oberti F, Gallois Y, et al. Comparison of reproducibility of histology, blood tests and Fibroscan for liver fibrosis (abstract). Hepatology 2007;46:834A.
[20] Poynard T, Imbert-Bismut F, Munteanu M, Messous D, Myers RP, Thabut D, et al. Overview of the diagnostic value of biochemi-cal markers of liver fibrosis (Fibrotest, HCV FibroSure) and necrosis (ActiTest) in patients with chronic hepatitis C. Comp Hepatol 2004;3:8.
[21] Boursier J, Bacq Y, Halfon P, Leroy V, de Ledinghen V, de Muret A, et al. Improved diagnostic accuracy of blood tests for severe fibrosis and cirrhosis in chronic hepatitis C. Eur J Gastroenterol Hepatol 2008; (in press).
[22] Boursier J, de Ledinghen V, Sawadogo A, Lebigot J, Michalak S, Gallois Y, et al. Amélioration du diagnostic de la fibrose hépatique par la combinaison synchrone de tests non invasifs (résumé). Gastroenterol Clin Biol 2007;31:31.
[23] Boursier J, Dib N, Oberti F, Calès P. Caractéristiques et interpré-tation des tests sanguins de fibrose hépatique. Gastroenterol Clin Biol 2007;31:511-23.
[24] Boursier J, Dib N, Oberti F, Hubert I, Rousselet M, Gallois Y, et al. Role of fibrosis degree in the clinical course of chronic liver diseases (abstract). Gastroenterology 2007;132:A804.
[25] Pinzani M, Vizzutti F, Arena U, Marra F. Technology Insight: noninvasive assessment of liver fibrosis by biochemical scores and elastography. Nat Clin Pract Gastroenterol Hepatol 2008;5:95-106.
[26] Leroy V, Sturm N, Hilleret M, Renversez P, Trocmé C, Faure P, et al. Diagnostic accuracy of blood tests of liver fibrosis in chronic hepatitis B: comparison with hepatitis C (abstract). Hepatology 2007;46:900-1A.
[27] Cacoub P, Carrat F, Bedossa P, Lambert J, Penaranda G, Perronne C, et al. Comparison of non-invasive liver fibrosis biomarkers in HIV/HCV co-infected patients: The fibrovic study - ANRS HC02. J Hepatol 2008;48:765-73.
[28] Calès P, Halfon P, Batisse D, Carrat F, Perré P, Penaranda G, et al. Tests sanguins de fibrose hépatique chez les patients co-infectés VIH et VHC (résumé). Gastroenterol Clin Biol 2008; (in press).
[29] Oberti F, Anty R, Vanbiervliet G, Lacave-Oberti N, Gelsi E, Rosenthal A, et al. Meta-analysis of blood scores of liver fibrosis (FibroMeters, Hepascore, APRI) in alcoholic chronic liver diseases (abstract). Hepatology 2006;44:467A.
[30] Calès P, Lainé F, Boursier J, Deugnier Y, Moal V, Oberti F, et al. Comparison of blood tests for liver fibrosis specific or not to NAFLD. J Hepatol 2008; (in press).
[31] Angulo P, Hui JM, Marchesini G, Bugianesi E, George J, Farrell GC, et al. The NAFLD fibrosis score: a noninvasive system that identifies liver fibrosis in patients with NAFLD. Hepatology 2007;45:846-54.
[32] Maor Y, Cales P, Bashari D, Kenet G, Lubetsky A, Luboshitz J, et al. Improving estimation of liver fibrosis using combi-nation and newer noninvasive biomarker scoring systems in hepatitis C-infected haemophilia patients. Haemophilia 2007;13:722-9.
[33] Foucher J, Chanteloup E, Vergniol J, Castera L, Le Bail B, Adhoute X, et al. Diagnosis of cirrhosis by transient elastogra-phy (Fibroscan): a prospective study. Gut 2006;55:403-8.
05_cales.indd 51 12/09/2008 14:58:38