Antibiotic Prophylaxis in Gastric, Biliary and Colonic Surgery
Upload
independentCategory
view
0download
0
Prediction of Clinical Outcomes in Primary Biliary Cirrhosis bySerum Enhanced Liver Fibrosis (ELF) Assay
MJ Mayo, J Parkes, B Adams-Huet, B Combes, AS Mills, RS Markin, R Rubin, D Wheeler, MContos, AB West, S Saldana, Y Getachew, R Butsch, V Luketic, MG Peters, A Di Biscelglie,N Bass, J Lake, T Boyer, E Martinez, J Boyer, G Garcia-Tsao, D Barnes, and WMRosenberg
AbstractBackground—Primary biliary cirrhosis (PBC) is sometimes diagnosed based upon a positiveantimitochondrial antibody in the appropriate clinical setting without a liver biopsy. While a liverbiopsy can assess the extent of liver fibrosis and provide prognostic information, serum fibrosismarkers avoid biopsy complications, sampling error, and provide results as a continuous variable,which may be more precise than categorical histological stages. The current study was undertakento evaluate serum fibrosis markers as predictors of clinical progression in a large cohort of PBCpatients.
Methods—Serial liver biopsies and serum samples were collected every 2 years in 161 PBCsubjects for a median of 7.3 years. Clinical progression was defined as development of one ormore of the following events: varices, variceal bleed, ascites, encephalopathy, liver transplant, orliver-related death. Serum HA, TIMP-1, and PIIINP were measured and entered into thepreviously validated Enhanced Liver Fibrosis (ELF) algorithm. The ability of ELF, histologicalfibrosis, bilirubin, MELD, and Mayo Risk Score to differentiate between individuals who wouldexperience a clinical event from those who would not was evaluated at different time points.
Results—Event-free survival was significantly lower in those with high baseline ELF. Each 1point increase in ELF was associated with a 3 fold increase in future complications. Theprognostic performance of all tests was similar when performed close to the time of the first event.However, at earlier times in the disease process (4 and 6 years prior to the first event), theprognostic performance of ELF was significantly better than MELD or Mayo R score.
Conclusion—The ELF algorithm is a highly accurate non-invasive measure of PBC diseaseseverity which provides useful long-term prognostic information.
KeywordsMayo Risk Score; MELD; Biopsy; Metalloproteinase; Hyaluronic acid
IntroductionSome patients with primary biliary cirrhosis (PBC) will have a normal life span withoutcomplications, whereas others will progress to complications of cirrhosis, liver failure, anddeath [1]. Accurately predicting clinical outcomes in patients with primary biliary cirrhosispresents a challenge. Surrogate markers of disease progression are needed for multiplereasons, including providing prognostic information to patients, optimizing referral time for
Contact Information: Marlyn J Mayo, MD, UT Southwestern Medical Center, 5323 Harry Hines Boulevard, Room J.5.130A, Dallas,Texas 75390-9151, Fax: 214-648-0274, Ph: 214-648-9117, [email protected].
NIH Public AccessAuthor ManuscriptHepatology. Author manuscript; available in PMC 2009 November 1.
Published in final edited form as:Hepatology. 2008 November ; 48(5): 1549–1557. doi:10.1002/hep.22517.
NIH
-PA Author Manuscript
NIH
-PA Author Manuscript
NIH
-PA Author Manuscript
liver transplant, and serving as endpoints in clinical trials [2]. The Model for End stage LiverDisease (MELD) and Mayo Prognostic Model for PBC (Mayo R score) are prognosticmodels that have been validated in PBC patients as predictors of death. They are widelyused to determine appropriate timing of liver transplantation, but these models were notoriginally developed to detect disease progression at earlier stages of PBC. Liver biopsy hasbeen the only reliable means to assess prognosis in all stages of disease. However, theaccuracy of liver biopsy is limited by sampling error, subjective interpretations, limitedfrequency of biopsies, and categorical staging systems. Non-invasive surrogate markers areappealing because they do not pose the same risks of pain and bleeding as liver biopsy; theycan be performed frequently and provide a score that is a continuous variable, potentiallycapable of tracking progression from mild fibrosis through to end-stage cirrhosis. Serumfibrosis markers could potentially replace liver biopsy as the test of choice for determiningthe position of a patient along the spectrum of disease severity. However, their prognosticaccuracy compared to liver biopsy has not been assessed in PBC.
The correlation between serum fibrosis markers and histology in other chronic liver diseaseis good, but not perfect. Thus, clinicians have been reluctant to substitute serum fibrosismarkers for histological staging. Most marker panels show similar ability to distinguishsignificant from insignificant fibrosis in cross-sectional studies, with area under the receiveroperating characteristic curve (AUROC) of about 0.8. [3-5] However, imperfect correlationdue to biopsy sampling error is to be expected, and only longitudinal studies with clinicalendpoints can determine the prognostic accuracy of biochemical markers of disease severity.Very few studies have acquired sufficient follow-up data to evaluate clinical outcomes.Amongst 357 patients with alcoholic liver disease, those with elevated serum YKL-40(growth factor) or PIIINP (N-terminal propeptide of type III procollagen) had shortersurvival than patients with normal serum levels of YKL-40 or PIIINP.[6] In a group of 537treated and untreated patients with hepatitis C, fibrosis biomarkers had a similar, butstatistically better ability than biopsy to predict hepatitis-related complications over a 5-yearperiod. [7] This study investigated the hypothesis that serum fibrosis markers would predictclinical progression as well or better than current methods of disease staging in primarybiliary cirrhosis. This is the first study to evaluate serum fibrosis markers in a large cohort ofpatients with primary biliary cirrhosis patients and in particular to examine the ability ofserum fibrosis markers to predict clinical outcomes.
MethodsSubjects
One hundred sixty one patients with PBC were prospectively followed between 1993 and2003 as part of a multi-center US clinical trial (PUMPS) that was designed to investigatewhether low dose weekly methotrexate, when added to ursodiol, improved survival ordelayed progression of PBC. Methotrexate was not found to affect the course of PBC [8], sopatients from both treatment arms were combined for the purpose of the present analysis.Combining treatment arms was also later justified by a subanalysis demonstrating no effectof the treatment arm on the outcomes of this analysis. Only patients with established, but notdecompensated PBC were enrolled into the parent trial. Participants were required to haveboth a positive anti-mitochondrial antibody and either an abnormal alkaline phosphatase orat least stage 1 disease on liver biopsy. Exclusion criteria included a history of varicealbleeding, ascites, or encephalopathy.
InvestigationsSubjects received a history, physical, and serum blood tests at entry and every 3 months. Atentry and at 2 year intervals, they also underwent percutaneous liver needle core biopsy to
Mayo et al. Page 2
Hepatology. Author manuscript; available in PMC 2009 November 1.
NIH
-PA Author Manuscript
NIH
-PA Author Manuscript
NIH
-PA Author Manuscript
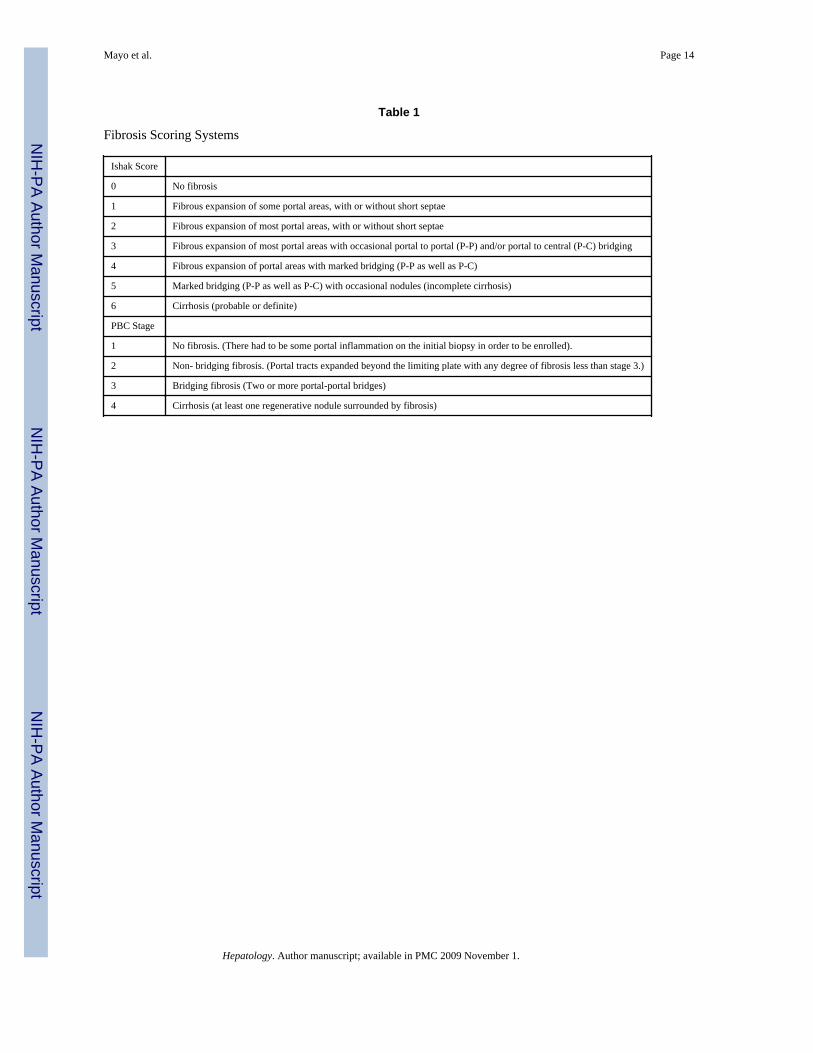
assess histological changes, endoscopy to look for new varices, and abdominal ultrasound tolook for new ascites. On the same day as these procedures, serum for long term storage wasobtained, frozen, and later used for the serum fibrosis marker assay. Thus, all biochemical,serological, and histological data were precisely synchronized. Biopsies were coded with aunique subject identifier and date. They were fixed and stained with hemotoxylin and eosinfor assessment of cell morphology and trichrome stain for assessment of fibrosis. Eachbiannual biopsy was read by 4 independent pathologists and a mean PBC stage of 1-4(explained in Table 1) was calculated. Pathologists convened on an annual basis toindependently read those biopsies that had been collected over the preceding 12 months.Biopsies were read in isolation, i.e. pathologists did not confer and previous biopsies fromthe same subject were not compared to newly acquired biopsies. Each pathologist read eachbiopsy only once, except for a single pathologist (S. Mills), who, at the request of the NIH,also read each biopsy using the Ishak scoring system to quantify fibrosis. [9] (Table 1).Routine laboratories (bilirubin, albumin, INR, creatinine) were performed at each centerthroughout the trial. MELD and Mayo R scores were calculated as described previously.Enhanced Liver Fibrosis (ELF) Test scores, were determined on frozen sera after the closeof the study. The ELF assay, which includes serum hyaluronic acid (HA), tissue inhibitor ofmetalloproteinase 1 (TIMP-1), and procollagen type III N-terminal propeptide (PIIINP), waspreviously developed and validated as a predictor of histological fibrosis in a cohort of 1921patients with chronic liver disease, including 53 patients with either PBC or primarysclerosing cholangitis [3]. All assays are heterogeneous immunoassays employing amagnetic particle separation technique developed by Bayer Diagnostics and now property ofSiemens Molecular Solutions [3].
AnalysisEach of the potential prognostic tests (ELF, histology, serum bilirubin, Mayo R score, andMELD) was then examined for its ability to separate patients who developed clinicalprogression from those who did not. Clinical progression was defined as the development ofone of the following events: new varices, variceal bleed, ascites, encephalopathy, liver-related death, or liver transplantation.
Two types of analyses were performed to examine the predictive ability of the prognostictests. In the forward-looking analysis, the ability of each baseline test result (ELF, Ishakscore, PBC stage, Bilirubin, MELD, Mayo R score) to predict development of a clinicalevent during follow-up was analyzed. Each of the baseline test scores were divided intothree subgroups (low, intermediate, and high score) and the frequency of progression in eachsubgroup was determined. A Kaplan-Meier time to event curve was generated for eachsubgroup. A Cox Proportional Hazard ratio was modeled, using ELF and the meanhistological PBC stage of the 4 pathologists as continuous variables.
A rear-looking analysis was also performed to address the possibility that some tests mightbe better long-range predictors in patients with earlier disease. The rear-looking analysis wasdesigned to account for heterogeneity of disease severity in the study population at the timeof entry into the parent trial. This analysis looked retrospectively at tests performed at 0, 2,4, 6, or 8 years prior to the development of the first clinical event. For example, in subjectswho developed new varices, the data measured at the time of the endoscopy is designated ‘0years prior’ to the event. In subjects who never developed a clinical event, data were usedfrom the last date the individual was known to be completely free of complications. At eachof these time points, the ability of each test to predict whether or not the subject would laterdevelop a clinical event was determined. ROC curves were generated to compare thediagnostic performance of each of the tests at each time point in the disease process. Theareas under the receiver operating characteristic curves (AUROC)s for each test werecompared using a non-parametric approach [10], including both omnibus and pairwise
Mayo et al. Page 3
Hepatology. Author manuscript; available in PMC 2009 November 1.
NIH
-PA Author Manuscript
NIH
-PA Author Manuscript
NIH
-PA Author Manuscript
comparisons. To adjust for multiple comparisons, a p-value of <0.01 was consideredsignificant for the pairwise testing.
ELF scores were correlated with biopsy findings using the Spearman Rank OrderCorrelation test. An ROC curve was generated to examine the ability of ELF score to predicthistological fibrosis. Serial assessments of ELF that were made over the eight year follow-up duration were evaluated for change over time by estimating the slopes of the regressionline from initial to final ELF determination with random coefficient models. Comparisons ofthe slopes between the event and no event groups were made with linear contrasts from therandom coefficient model. The modeling and fitting was performed in SAS 9.1. (SASInstitute, Cary, NC) using the PROC MIXED procedure.
ResultsThe median follow-up of the 161 subjects was 7.3 years (range 5 months-10 years). The vastmajority of subjects were Caucasian (93%) and female (93%). During follow-up, forty two(26%) of the subjects developed one of the events defined as clinical progression: onset ofvarices (33), variceal bleed (0), ascites (6), encephalopathy (1), liver-related death (1), orliver transplantation (1). Although most of these subjects had the onset of varices as theirfirst event, this was often followed by one or more of the other events.
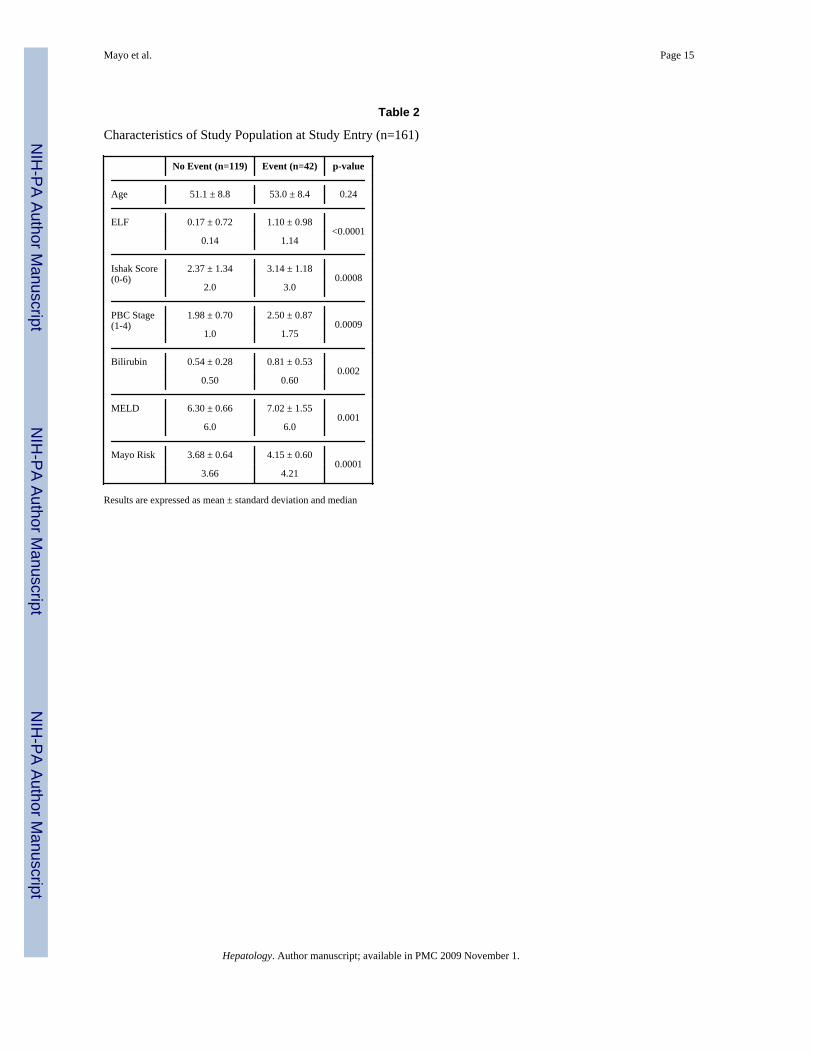
The characteristics of the study population are shown in Table 2. The mean scores of allprognostic tests were significantly higher at study entry in the group that progressed todevelop clinical events during follow-up.
Adequacy of Liver BiopsiesOf the 578 liver biopsies used in this study, the median biopsy length was 1.7 cm (minimum1 cm, maximum 5 cm). The majority of biopsies (80%) had 6 portal tracts per tissue core.Less than 1% had more than 6 portal tracts per biopsy. Very few (7%) had less than 4 portaltracts, and the remainder (13%) had 4 or 5 portal tracts per biopsy. The biopsies werefragmented in 47% of cases. Pathologists were given the option to interpret a biopsy as“inadequate for staging,” which occurred in one instance. The weighted kappa score forinter-pathologist variability in assessing PBC stage was 0.62.
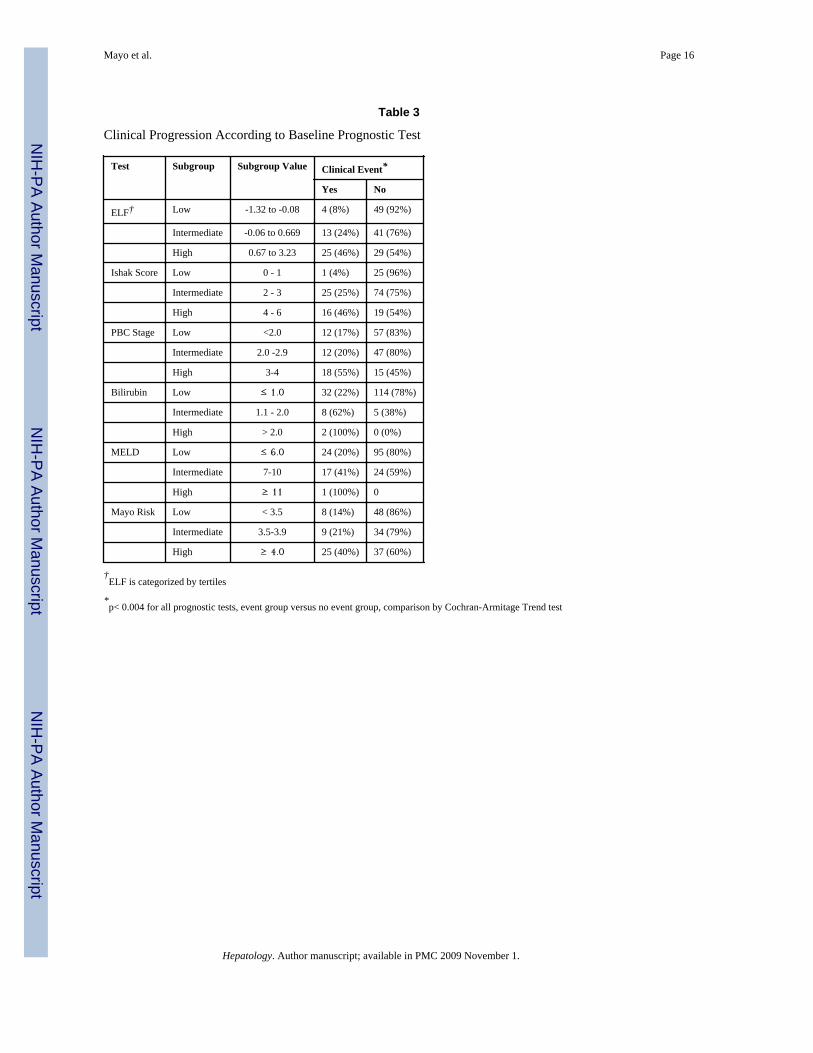
Forward-looking event-free survivalThe chance of developing a clinical event was examined in persons with either low,intermediate, or high scores on each of the prognostic tests obtained at baseline. There was asignificant correlation between the baseline score of all prognostic tests and the likelihood ofdeveloping a clinical complication over the next 6 years (Table 3). Only 8% of subjects witha low baseline ELF score developed a complication during follow-up, whereas 24% ofsubjects with an intermediate score and 46% of subjects with high a score developed aclinical complication. In a Cox's Proportional Hazard model adjusting for age and treatmentarm (the latter had no effect), each increase in ELF score by 1 point was associated with a 3-fold increase in future complications (Relative risk 2.9, 95% CI 2.0 -4.3). Every stageincrease of PBC stage (1-4 point scale) led to a 2-fold increase in future complication rate(RR 2.4, 95% CI 1.6 -3.6). ELF performed as well as either Ishak score or PBC stage.
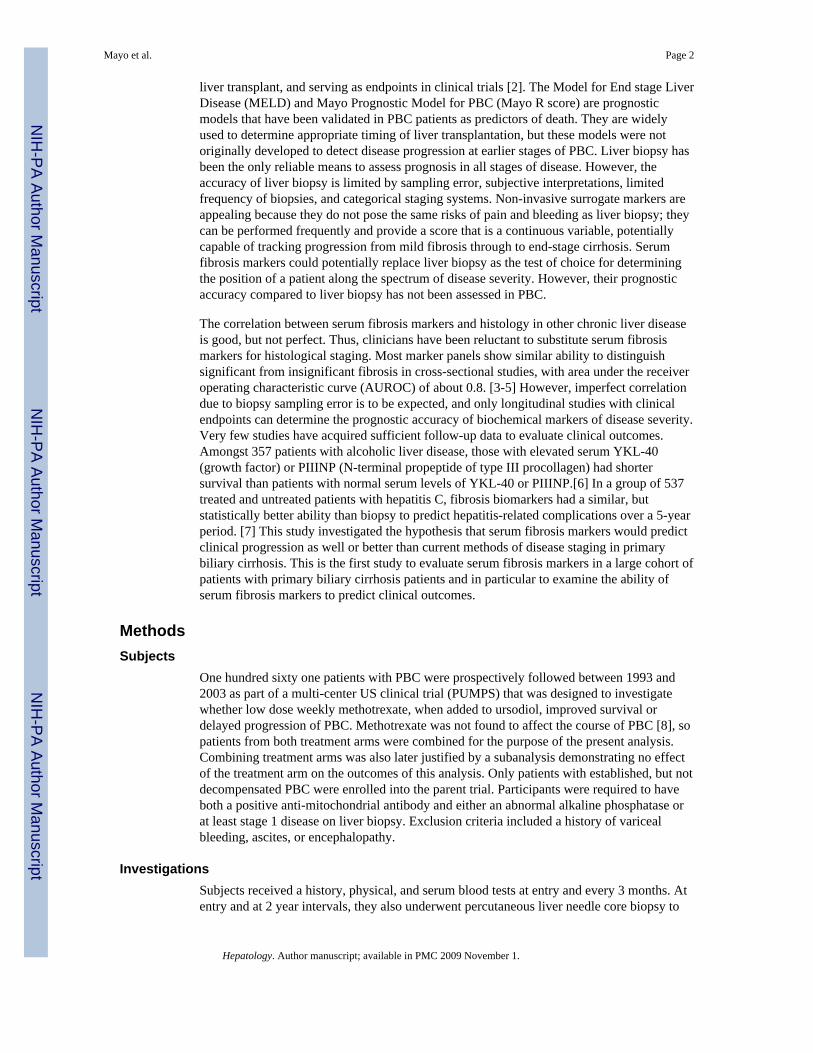
The event-free survival according to baseline ELF score is depicted in Figure 1. The logrank test comparing the three subgroups showed a highly significant difference (p<0.0001)in event-free survival depending on the baseline ELF score.
Mayo et al. Page 4
Hepatology. Author manuscript; available in PMC 2009 November 1.
NIH
-PA Author Manuscript
NIH
-PA Author Manuscript
NIH
-PA Author Manuscript
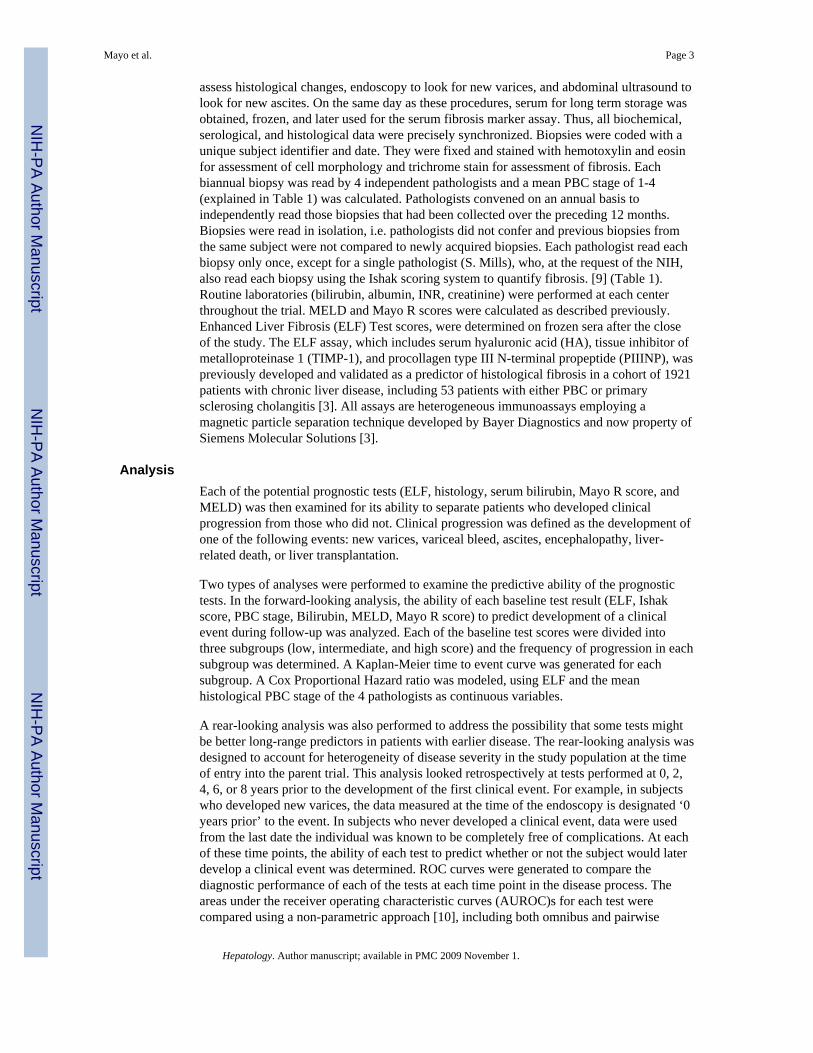
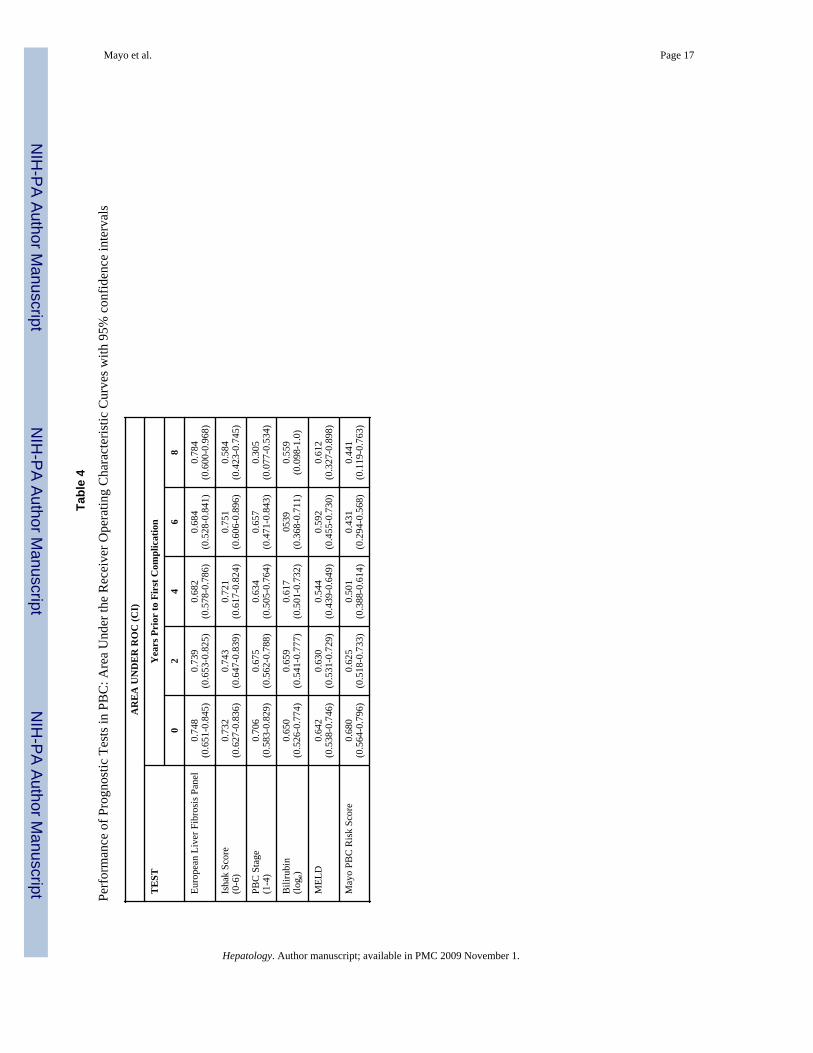
Rear-looking prediction of clinical progressionThe ability of each test to predict whether or not a subject would later develop a clinicalevent was also retrospectively determined at increasing time intervals (0, 2, 4, 6, and 8years) prior to the first event. For each time point, ROC curves were generated for eachdiagnostic test (Figure 2), and the AUROC was calculated (Table 4) as a measure of theprognostic value of each test. The AUROCs of the various tests were not significantlydifferent from each other at years 0 and 2 (ANOVA, p=0.24 at 0 years and p=0.25 at 2years). However, at earlier time points in the disease process (4 and 6 years prior to the firstcomplication), there were significant differences (ANOVA p=0.003 at 4 years and p=0.007at 6 years). The differences in the prognostic tests performed 8 years before the first clinicalevent were also significant (p<0.001), but the confidence interval of the AUROCs werequite wide at this time point due to the small number of patients in the event group at thattime, which made comparisons between tests difficult to interpret.
At each time point in the disease process, Ishak staging system and ELF score had highestpredictive values (AUROC). In fact, there was no statistically significant difference in theAUROC of ELF and histological staging at any time point. The AUROC of histologicalstaging by the 7-point Ishak system was consistently slightly greater than the AUROC of the4-point PBC stage. The prognostic performance of ELF (AUROC) was also higher than theother non-invasive tests (bilirubin, MELD, Mayo Risk Score) at each time point, althoughthis difference was not statistically significant at later time points in the disease process (0and 2 years before the first event). The most strongly significant differences were betweenELF and Mayo R score AUROCs at earlier time points in the disease process (4 and 6 yearsprior to the first event, p=0.004 and 0.009 respectively).
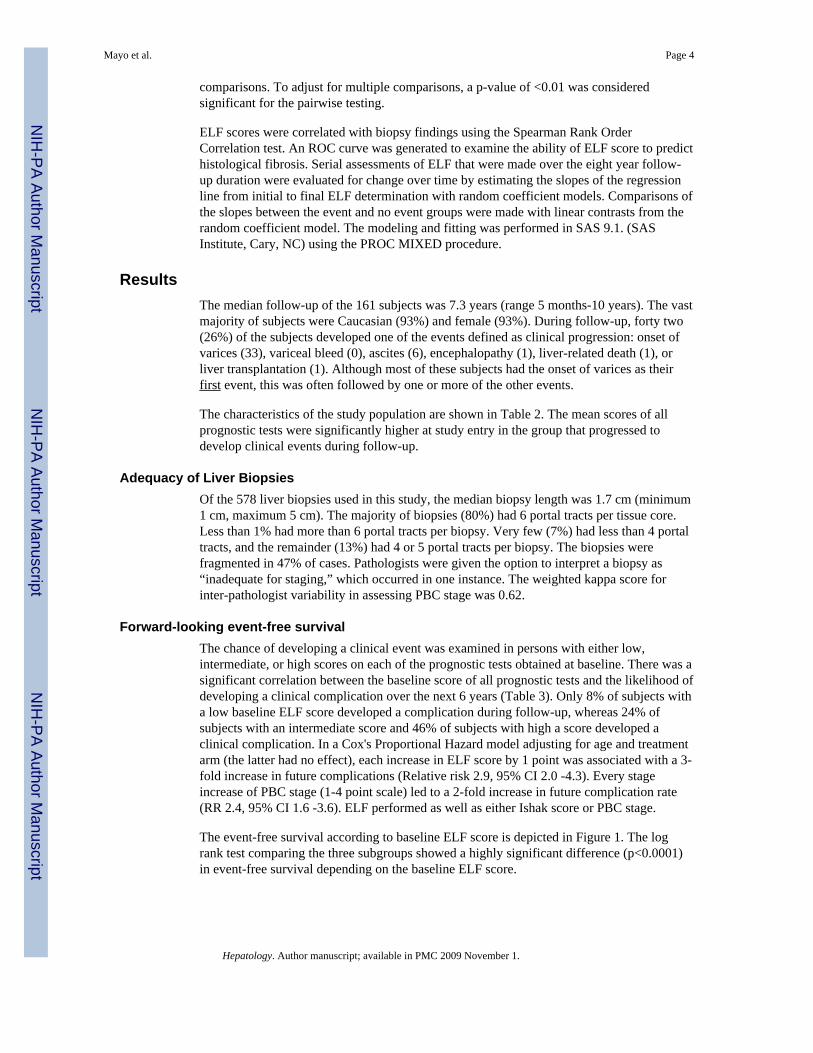
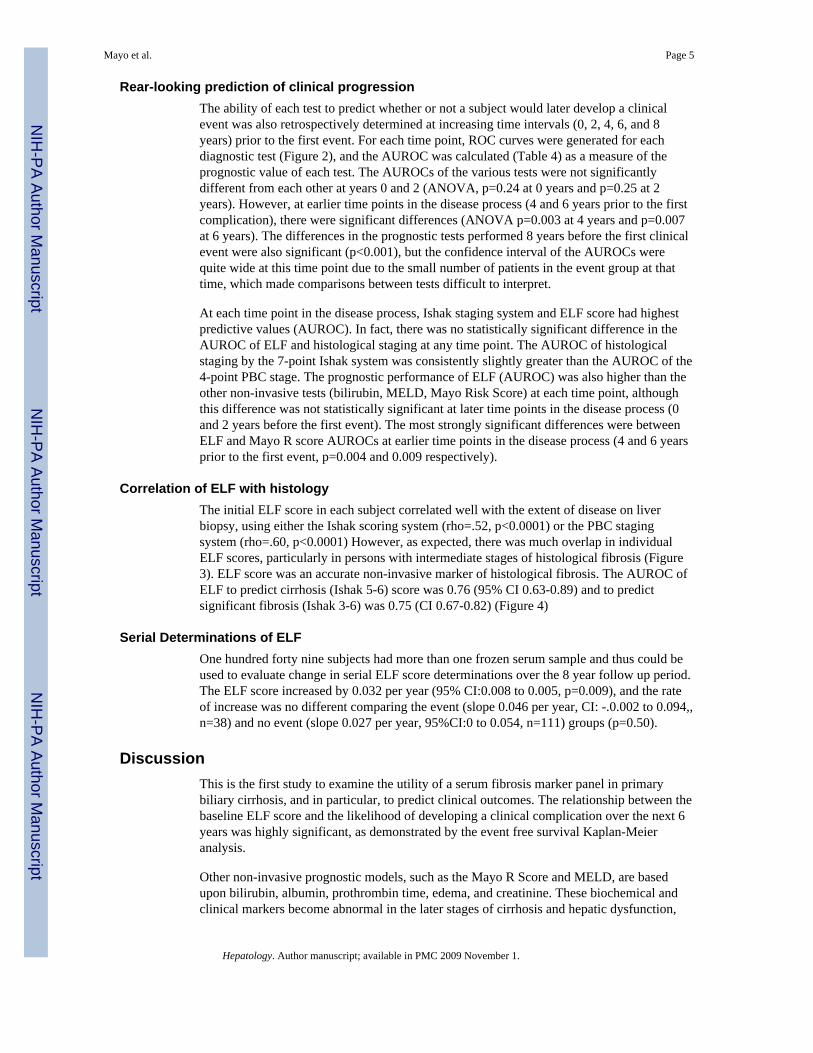
Correlation of ELF with histologyThe initial ELF score in each subject correlated well with the extent of disease on liverbiopsy, using either the Ishak scoring system (rho=.52, p<0.0001) or the PBC stagingsystem (rho=.60, p<0.0001) However, as expected, there was much overlap in individualELF scores, particularly in persons with intermediate stages of histological fibrosis (Figure3). ELF score was an accurate non-invasive marker of histological fibrosis. The AUROC ofELF to predict cirrhosis (Ishak 5-6) score was 0.76 (95% CI 0.63-0.89) and to predictsignificant fibrosis (Ishak 3-6) was 0.75 (CI 0.67-0.82) (Figure 4)
Serial Determinations of ELFOne hundred forty nine subjects had more than one frozen serum sample and thus could beused to evaluate change in serial ELF score determinations over the 8 year follow up period.The ELF score increased by 0.032 per year (95% CI:0.008 to 0.005, p=0.009), and the rateof increase was no different comparing the event (slope 0.046 per year, CI: -.0.002 to 0.094,,n=38) and no event (slope 0.027 per year, 95%CI:0 to 0.054, n=111) groups (p=0.50).
DiscussionThis is the first study to examine the utility of a serum fibrosis marker panel in primarybiliary cirrhosis, and in particular, to predict clinical outcomes. The relationship between thebaseline ELF score and the likelihood of developing a clinical complication over the next 6years was highly significant, as demonstrated by the event free survival Kaplan-Meieranalysis.
Other non-invasive prognostic models, such as the Mayo R Score and MELD, are basedupon bilirubin, albumin, prothrombin time, edema, and creatinine. These biochemical andclinical markers become abnormal in the later stages of cirrhosis and hepatic dysfunction,
Mayo et al. Page 5
Hepatology. Author manuscript; available in PMC 2009 November 1.
NIH
-PA Author Manuscript
NIH
-PA Author Manuscript
NIH
-PA Author Manuscript
which is why they are excellent predictors of death. However, these markers are notsensitive to disease progression earlier in the course of PBC. This is most likely theexplanation for the poor prognostic performance of Mayo R Score, MELD, and bilirubin 6years prior to the first clinical event, similar to the chance of flipping a coin.(AUROC=0.420-0.564). Even though the parent trial was not originally designed tocompare prognostic tests, the availability of concurrent data and long-term follow-upenabled us to make comparisons and determine retrospectively the most accurate prognostictests.
Clinical jaundice is known to be a late but poor prognostic sign in PBC. The PUMPS trialexcluded patients with a history of bilirubin >2.0, so only 2 patients in this cohort hadjaundice at study entry. Although both of these patients did develop a clinical event, a largepercentage of patients with normal baseline bilirubin also progressed to have a clinicalevent. In the retrospective analysis, taking the loge of bilirubin improved its prognosticability, although the AUROC of loge bilirubin (reported in this paper) was still lower thanthat of ELF or histology.
The key components of the ELF algorithm are hyaluronic acid, tissue inhibitor ofmetalloproteinase 1, and procollagen type III N-terminal propeptide, which are expressedduring early stages of collagen deposition in the liver, and this is most likely the reason thatELF retains its prognostic ability even in early stages of the disease process (AUROC0.737-0.863 at all time points). It should be noted, however, that none of the prognostictests, including biopsy and ELF, had AUROCs of over 0.9. Thus, no test is error-free whentrying to predict clinical progression and this must be considered when counselingindividual patients in the clinical setting.
Liver biopsy has been the reference standard for staging PBC and other chronic liverdiseases for over 50 years, and the prognostic information gained from liver biopsy is useful.The three most popular staging systems for PBC are the Ludwig, Popper, and Scheuersystems [11,12,13]. This study used the the Ludwig system, which has become favored overthe others as it is increasingly recognized that florid duct lesions or ductular proliferationneed not be present to define early stages. ELF algorithm was found to be superior to PBCstage at all time points for predicting clinical progression. Of course, a liver biopsy providesadditional diagnostic information, but this is not always necessary. A typical middle-agedfemale with cholestatic liver tests, positive AMA and no other liver disease risk factors doesnot require a confirmatory liver biopsy [14]. Although not originally developed for PBC, theIshak system was also used to score each of the biopsies in this study. The performance ofthe Ishak score was not statistically different from the performance of the ELF score. Thus,we propose that if a liver biopsy is not needed for diagnostic purposes, the ELF score can beutilized for prognostic staging and monitoring during follow-up. In the situation where aliver biopsy is appropriate for diagnostic purposes, the Ishak system should be used for moreaccurate staging. The Ishak system is based entirely on the extent of fibrosis and providesbetter prognostic information, but cannot establish the diagnosis of PBC. The diagnosis muststill be made by the presence of typical histological features such as non-suppurativedestructive cholangitis.
The possibility of replacing staging liver biopsies with simple noninvasive markeralgorithms is gaining momentum as evidence is accumulating in other chronic liver diseasesthat these panels are reasonable surrogate markers of histological liver fibrosis. Severalcross-sectional studies have evaluated the ability of marker panels to quantify fibrosis inhepatitis C and non-alcoholic fatty liver disease. [15-19] Consistently, these marker panelsare reasonably accurate at distinguishing the absence of fibrosis from advanced cirrhosis, butthe accuracy of the test in a single individual, particularly an individual with an intermediate
Mayo et al. Page 6
Hepatology. Author manuscript; available in PMC 2009 November 1.
NIH
-PA Author Manuscript
NIH
-PA Author Manuscript
NIH
-PA Author Manuscript
degree of fibrosis, is lower 15,20-23] These studies have been criticized because the “goldstandard” of histology is inaccurate due to the high rate of sampling error known to occur inpatients with diffuse parenchymal liver diseases.[24] One study of patients with cirrhosisfrom different causes demonstrated that three samples taken by the same route in the samepatients were concordant for the degree of fibrosis in only 50% of cases. [25] Althoughincreasing the length of the biopsy improves diagnostic accuracy, the rate of discordance inbiopsies >25mm is still 25% in hepatitis C [26]. Thus, although “bigger is better,” needlebiopsies are by their nature somewhat inaccurate. PBC, in particular, is characterized bypatchy involvement of portal areas. Whole section scanning of 50 PBC liver explantsdemonstrated that only 20% of PBC livers have a consistent histological stage of fibrosisthroughout the liver, even when the tissue was obtained at clinically-defined end-stagedisease. [27] The correlation between ELF score and histological fibrosis in these patientswas strong. However, as expected, there was also significant overlap of individual ELFscores, particularly in persons with intermediate stages of histological fibrosis. The ELFscore, therefore, was not a perfect reflection of the histological fibrosis score; yet itsexcellent performance as a prognostic marker implies that biopsy error may actually accountfor part of the discord between ELF and histological fibrosis score.
One advantage of the current study was that serial serum samples were available in a verywell defined cohort with meticulously determined clinical outcomes over a long time period.Thus, prognostic tests could be evaluated at different time points and also evaluated forchange over time. The average ELF score increased over time (by 0.032 per year). Thisaverage rate of increase was not different between subjects who experienced an event andthose who didn't, which indicates that the rate of PBC fibrosis progression may be relativelysteady, regardless of whether the starting point is early or advanced disease. It also suggeststhat the patients who developed the clinical events started the study at a later time point intheir disease process. This data argues against the theory that there may be a rapidly fibroticand slowly fibrotic form of PBC, at least in the cohort studied here.
In conclusion, the ELF algorithm is a highly accurate non-invasive measure of PBC diseaseseverity which provides accurate prognostic information. The ability of this algorithm topredict clinical outcomes is as good or better than traditional prognostic tests for PBC,particularly in early stages of the disease. It is a simple, non-invasive technique with long-range predictive ability that should be very useful in the clinical assessment of PBC.
AcknowledgmentsSupport: This work was supported by the following grants: NIH R21 DK70995, NIH DK46602, NIH M01-RR00633, DTI UK-Texas Initiative. Reagents were provided by Bayer Diagnostics/Siemens Molecular Solutionsand i-Qur Limited.
References1. Corpechot C, Carrat F, Bahr A, Chretien Y, Poupon RE, Poupon R. The effect of ursodeoxycholic
acid therapy on the natural course of primary biliary cirrhosis. Gastroenterology. 2005; 128:297–303. [PubMed: 15685541]
2. McHutchison J, Poynard T, Afdhal N. International Fibrosis Group Meeting Participants. Fibrosis asan end point for clinical trials in liver disease: a report of the international fibrosis group. ClinGastroenterol Hepatol. 2006; 4:1214–1220. [PubMed: 16979947]
3. Rosenberg WM, Voelker M, Thiel R, Becka M, Burt A, Schuppan D, Hubscher S, Roskams T,Pinzani M, Arthur MJ. European Liver Fibrosis Group. Serum markers detect the presence of liverfibrosis: a cohort study. Gastroenterology. 2004; 127(6):1704–13. [PubMed: 15578508]
4. Ratziu V, Massard J, Charlotte F, Messous D, Imbert-Bismut F, Bonyhay L, Tahiri M, Munteanu M,Thabut D, Cadranel JF, Le Bail B, de Ledinghen V, Poynard T. LIDO Study Group. CYTOL study
Mayo et al. Page 7
Hepatology. Author manuscript; available in PMC 2009 November 1.
NIH
-PA Author Manuscript
NIH
-PA Author Manuscript
NIH
-PA Author Manuscript
group. Diagnostic value of biochemical markers (FibroTest-FibroSURE) for the prediction of liverfibrosis in patients with non-alcoholic fatty liver disease. BMC Gastroenterol. 2006; 6:6. [PubMed:16503961]
5. Naveau S, Raynard B, Ratziu V, Abella A, Imbert-Bismut F, Messous D, Beuzen F, Capron F,Thabut D, Munteanu M, Chaput JC, Poynard T. Biomarkers for the prediction of liver fibrosis inpatients with chronic alcoholic liver disease. Clin Gastroenterol Hepatol. 2005; 3:167–74. [PubMed:15704051]
6. Nojgaard C, Johansen JS, Christensen E, Skovgaard LT, Price PA, Becker U. EMALD Group.Serum levels of YKL-40 and PIIINP as prognostic markers in patients with alcoholic liver disease. JHepatol. 2003; 39:179–86. [PubMed: 12873813]
7. Ngo Y, Munteanu M, Messous D, Charlotte F, Imbert-Bismut F, Thabut D, Lebray P, Thibault V,Benhamou Y, Moussalli J, Ratziu V, Poynard T. A prospective analysis of the prognostic value ofbiomarkers (FibroTest) in patients with chronic hepatitis C. Clin Chem. 2006; 52:1887–96.[PubMed: 16931569]
8. Combes B, Emerson SS, Flye NL, Munoz SJ, Luketic VA, Mayo MJ, McCashland TM, ZettermanRK, Peters MG, Di Bisceglie AM, Benner KG, Kowdley KV, Carithers RL, Rosoff L, Garcia-TsaoG, Boyer JL, Boyer TD, Martinez EJ, Bass NM, Lake JR, Barnes DS, Bonacini M, Lindsay KL,Milss AS, Markin RS, Rubin R, West AB, Wheeler DE, Contos MJ, Hoffman AF. Methotrexate(MTZ) plus ursodeoxycholic acid (UDCA) in the treatment of primary biliary cirrhosis. Hepatology.2005; 42:1184–1193. [PubMed: 16250039]
9. Ishak K, Baptista A, Bianchi L, Callea F, De Groote J, Gudat F, Denk H, Desmet V, Korb G,MacSween RN, et al. Histological grading and staging of chronic hepatitis. J Hepatol. 1995;22:696–699. [PubMed: 7560864]
10. DeLong ER, DeLong DM, Clarke-Pearson DL. Comparing the areas under two or more correlatedreceiver operating characteristic curves: A nonparametric approach. Biometrics. 1988; 44:837–45.[PubMed: 3203132]
11. Ludwig J, Dickson ER, McDonald GS. Staging of chronic nonsuppurative destructive cholangitis(syndrome of primary biliary cirrhosis). Virchow Archiv A Pathol Anat Histol. 1978; 379:103.
12. Popper, H.; Schaffner, F. Nonsuppurative destructive chronic cholangitis and chronic hepatitis. In:Popper, H.; Schaffner, F., editors. Progress in liver diseases. Vol. 3. New York: Grune &StrattonInc; 1970. p. 336-354.
13. Scheuer PJ. Primary biliary cirrhosis. Proceedings of the Royal Society of Medicine. 1967;60:1257. [PubMed: 6066569]
14. Zein, Co; Angulo, P.; Lindor, KD. When is liver biopsy needed in the diagnosis of primary biliarycirrhosis? Clin Gastro & Hep. 2003; 1(2):89–9.
15. Imbert-Bismut F, Ratzui V, Pieroni L, Charlotte F, Benhamou Y, Poynard T. MULTIVIRC group.Biochemical markers of liver fibrosis in patients with hepatitis C virus infection: a prospectivestudy. Lancet. 2001; 357:1069–75. [PubMed: 11297957]
16. Guha IN, Parkes J, Roderick PR, Harris S, Rosenberg WM. Non-invasive markers associated withliver fibrosis in non-alcoholic fatty liver disease. Gut. 200; 55(11):1650–60. [PubMed: 17047111]
17. Zaman A, Rosen HR, Ingram K, Corless CL, Oh E, Smith K. Assessment of FIBROSpectII todetect hepatic fibrosis in chronic hepatitis C patients. Am J Med. 2007; 120(3):280e9–14.[PubMed: 17349453]
18. Guha IN, Parkes J, Roderick P, Chattopadhyay D, Cross R, Harris S, Kaye P, Burt AD, Ryder SD,Aithal GP, Day CP, Rosenberg WM. Noninvasive markers of fibrosis in nonalcoholic fatty liverdisease: Validating the European Liver Fibrosis Panel and exploring simple markers Hepatology.in press.
19. Angulo P, Hui JM, Marchesini G, Bugianesi E, George J, Farrell GC, Enders F, Saksena S, BurtAD, Bida JP, Lindor K, Sanderson SO, Lenzi M, Adams LA, Kench J, Therneau TM, Day CP.The NAFLD fibrosis score: a noninvasive system that identifies liver fibrosis in patients withNAFLD. Hepatology. 2007; 45:846–54. [PubMed: 17393509]
20. Poynard R, Imbert-Bismut I, Ratzui V, Chevret S, Jardel C, Moussalli J, Messous D, Degos F.GERMED cyt04 groups. Biochemical markers of liver fibrosis inpatients infected by hepatitis Cvirius: longitudinal validation in a randomized trial. J Virol Hepatitis. 2002; 9:128–133.
Mayo et al. Page 8
Hepatology. Author manuscript; available in PMC 2009 November 1.
NIH
-PA Author Manuscript
NIH
-PA Author Manuscript
NIH
-PA Author Manuscript
21. Poynard T, McHutchison J, Manns M, Myers RP, Albreacht J. Biochemcial surrogate markers ofliver fibrosis and activity in a randomized trial of peginterferon alfa-2b and ribavirin. Hepatology.2003; 38:481–492. [PubMed: 12883493]
22. Myers RP, Ratzui V, Imbert-Bismut F, Charlotte F, Poynard T. MULTIVIRC group. Biochemicalmarkers of liver fibrosis :a comparison with historical features in patients with chronic hepatitis c.Am J Gastro. 2002; 97:2419–25.
23. Myers RP, de Torres M, Imbert-Bismut F, Ratzui V, Charlotte f, Poynard T. MULTIVIRC group.Biochemical markers of fibrosis in patient with chronic hepatitis C: a comparison withprothrombin time, platelet count, and age-platelet index. Dig Dis Sci. 2003; 48:146–153.[PubMed: 12645802]
24. Scheuer PJ. Liver Biopsy Size matters in chronic hepatitis: bigger is better. Hepatology. 2003;38:1356–7. [PubMed: 14647044]
25. Maharaj B, Maharaj RJ, Leary WP, Coppan RM, Naran AD, Pirie D, Pudfin DJ. Samplingvariability and its influence on the diagnostic yield of percutaneous needle biopsy of the liver.Lancet. 1986; 8480:523–5. [PubMed: 2869260]
26. Bedossa P, Dargere D, Paradis V. Sampling variability of liver fibrosis in chronic hepatitis C.Hepatology. 2003; 38:1449–57. [PubMed: 14647056]
27. Garrido MC, Hubscher SG. Accuracy of staging in primary biliary cirrhosis. Journal of ClinicalPathology. 1996; 49:556–9. [PubMed: 8813953]
Mayo et al. Page 9
Hepatology. Author manuscript; available in PMC 2009 November 1.
NIH
-PA Author Manuscript
NIH
-PA Author Manuscript
NIH
-PA Author Manuscript
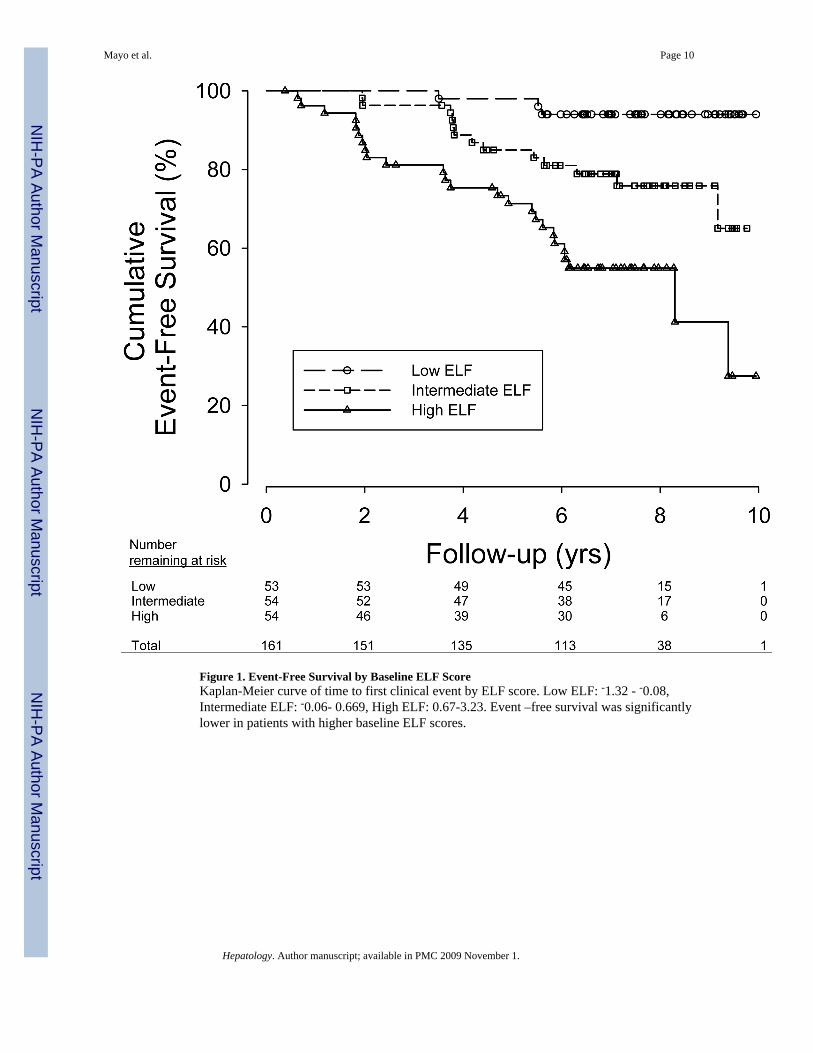
Figure 1. Event-Free Survival by Baseline ELF ScoreKaplan-Meier curve of time to first clinical event by ELF score. Low ELF: -1.32 - -0.08,Intermediate ELF: -0.06- 0.669, High ELF: 0.67-3.23. Event –free survival was significantlylower in patients with higher baseline ELF scores.
Mayo et al. Page 10
Hepatology. Author manuscript; available in PMC 2009 November 1.
NIH
-PA Author Manuscript
NIH
-PA Author Manuscript
NIH
-PA Author Manuscript
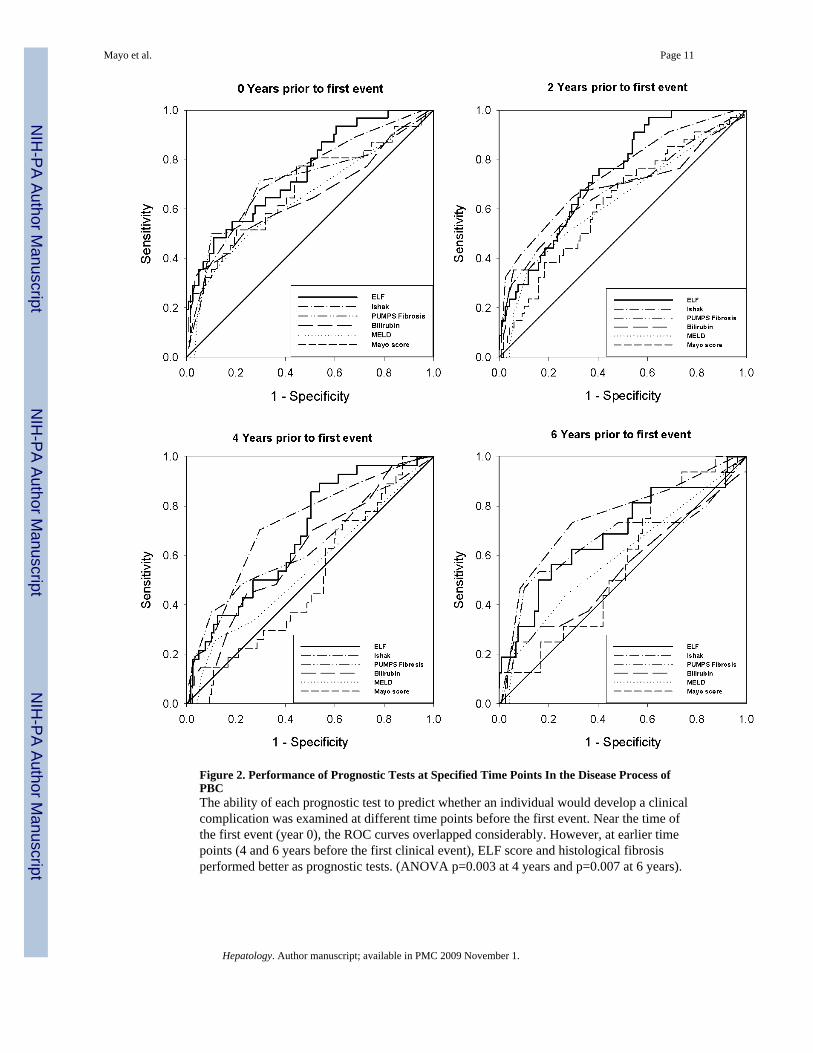
Figure 2. Performance of Prognostic Tests at Specified Time Points In the Disease Process ofPBCThe ability of each prognostic test to predict whether an individual would develop a clinicalcomplication was examined at different time points before the first event. Near the time ofthe first event (year 0), the ROC curves overlapped considerably. However, at earlier timepoints (4 and 6 years before the first clinical event), ELF score and histological fibrosisperformed better as prognostic tests. (ANOVA p=0.003 at 4 years and p=0.007 at 6 years).
Mayo et al. Page 11
Hepatology. Author manuscript; available in PMC 2009 November 1.
NIH
-PA Author Manuscript
NIH
-PA Author Manuscript
NIH
-PA Author Manuscript
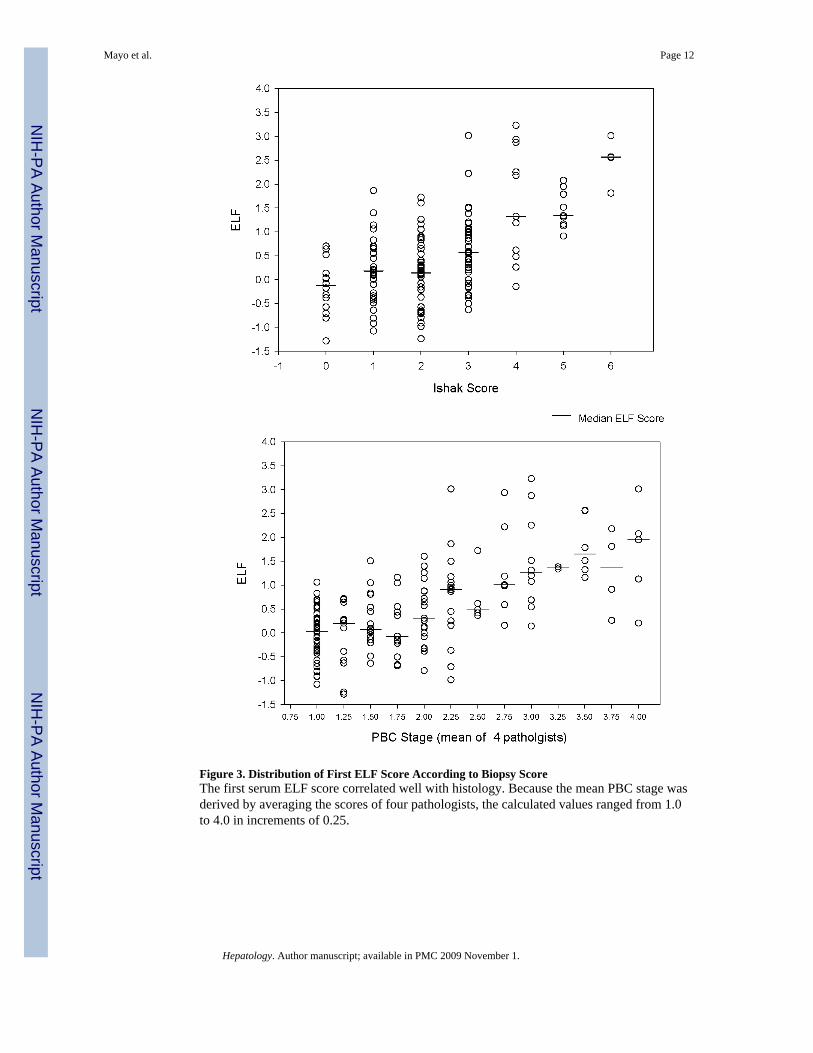
Figure 3. Distribution of First ELF Score According to Biopsy ScoreThe first serum ELF score correlated well with histology. Because the mean PBC stage wasderived by averaging the scores of four pathologists, the calculated values ranged from 1.0to 4.0 in increments of 0.25.
Mayo et al. Page 12
Hepatology. Author manuscript; available in PMC 2009 November 1.
NIH
-PA Author Manuscript
NIH
-PA Author Manuscript
NIH
-PA Author Manuscript
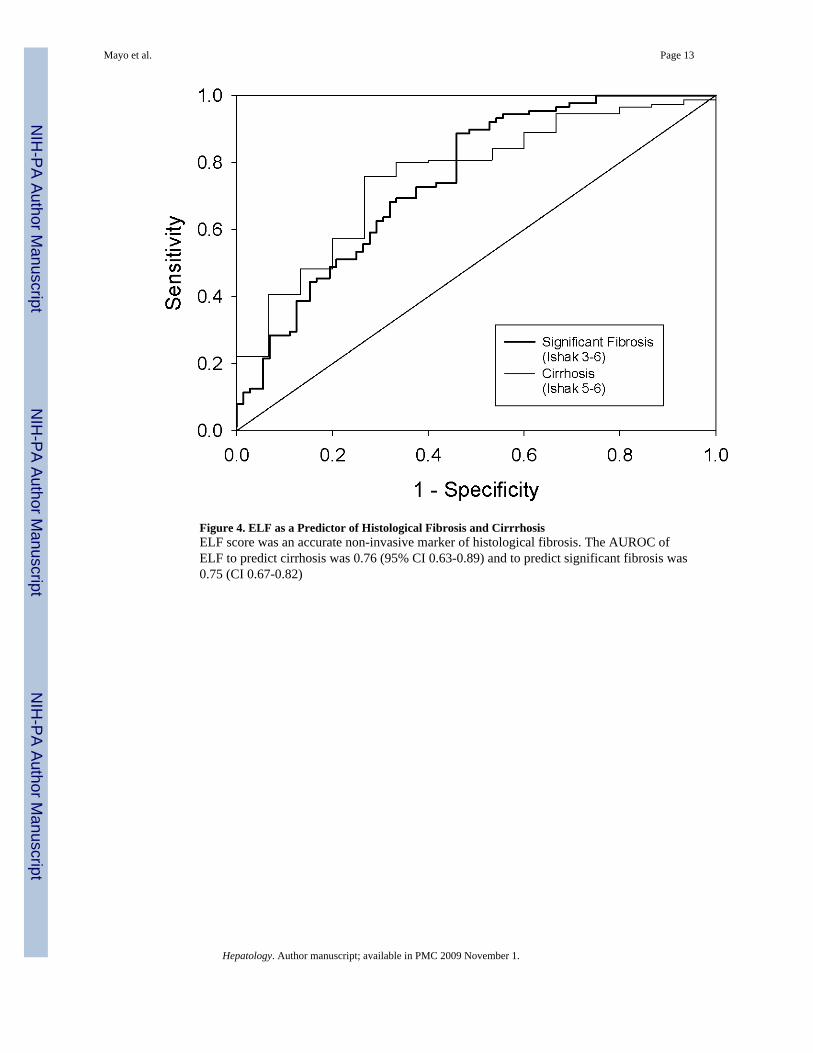
Figure 4. ELF as a Predictor of Histological Fibrosis and CirrrhosisELF score was an accurate non-invasive marker of histological fibrosis. The AUROC ofELF to predict cirrhosis was 0.76 (95% CI 0.63-0.89) and to predict significant fibrosis was0.75 (CI 0.67-0.82)
Mayo et al. Page 13
Hepatology. Author manuscript; available in PMC 2009 November 1.
NIH
-PA Author Manuscript
NIH
-PA Author Manuscript
NIH
-PA Author Manuscript
NIH
-PA Author Manuscript
NIH
-PA Author Manuscript
NIH
-PA Author Manuscript
Mayo et al. Page 14
Table 1
Fibrosis Scoring Systems
Ishak Score
0 No fibrosis
1 Fibrous expansion of some portal areas, with or without short septae
2 Fibrous expansion of most portal areas, with or without short septae
3 Fibrous expansion of most portal areas with occasional portal to portal (P-P) and/or portal to central (P-C) bridging
4 Fibrous expansion of portal areas with marked bridging (P-P as well as P-C)
5 Marked bridging (P-P as well as P-C) with occasional nodules (incomplete cirrhosis)
6 Cirrhosis (probable or definite)
PBC Stage
1 No fibrosis. (There had to be some portal inflammation on the initial biopsy in order to be enrolled).
2 Non- bridging fibrosis. (Portal tracts expanded beyond the limiting plate with any degree of fibrosis less than stage 3.)
3 Bridging fibrosis (Two or more portal-portal bridges)
4 Cirrhosis (at least one regenerative nodule surrounded by fibrosis)
Hepatology. Author manuscript; available in PMC 2009 November 1.
NIH
-PA Author Manuscript
NIH
-PA Author Manuscript
NIH
-PA Author Manuscript
Mayo et al. Page 15
Table 2
Characteristics of Study Population at Study Entry (n=161)
No Event (n=119) Event (n=42) p-value
Age 51.1 ± 8.8 53.0 ± 8.4 0.24
ELF 0.17 ± 0.72 1.10 ± 0.98<0.0001
0.14 1.14
Ishak Score(0-6)
2.37 ± 1.34 3.14 ± 1.180.0008
2.0 3.0
PBC Stage(1-4)
1.98 ± 0.70 2.50 ± 0.870.0009
1.0 1.75
Bilirubin 0.54 ± 0.28 0.81 ± 0.530.002
0.50 0.60
MELD 6.30 ± 0.66 7.02 ± 1.550.001
6.0 6.0
Mayo Risk 3.68 ± 0.64 4.15 ± 0.600.0001
3.66 4.21
Results are expressed as mean ± standard deviation and median
Hepatology. Author manuscript; available in PMC 2009 November 1.
NIH
-PA Author Manuscript
NIH
-PA Author Manuscript
NIH
-PA Author Manuscript
Mayo et al. Page 16
Table 3
Clinical Progression According to Baseline Prognostic Test
Test Subgroup Subgroup Value Clinical Event*
Yes No
ELF† Low -1.32 to -0.08 4 (8%) 49 (92%)
Intermediate -0.06 to 0.669 13 (24%) 41 (76%)
High 0.67 to 3.23 25 (46%) 29 (54%)
Ishak Score Low 0 - 1 1 (4%) 25 (96%)
Intermediate 2 - 3 25 (25%) 74 (75%)
High 4 - 6 16 (46%) 19 (54%)
PBC Stage Low <2.0 12 (17%) 57 (83%)
Intermediate 2.0 -2.9 12 (20%) 47 (80%)
High 3-4 18 (55%) 15 (45%)
Bilirubin Low ≤ 1.0 32 (22%) 114 (78%)
Intermediate 1.1 - 2.0 8 (62%) 5 (38%)
High > 2.0 2 (100%) 0 (0%)
MELD Low ≤ 6.0 24 (20%) 95 (80%)
Intermediate 7-10 17 (41%) 24 (59%)
High ≥ 11 1 (100%) 0
Mayo Risk Low < 3.5 8 (14%) 48 (86%)
Intermediate 3.5-3.9 9 (21%) 34 (79%)
High ≥ 4.0 25 (40%) 37 (60%)
†ELF is categorized by tertiles
*p< 0.004 for all prognostic tests, event group versus no event group, comparison by Cochran-Armitage Trend test
Hepatology. Author manuscript; available in PMC 2009 November 1.
NIH
-PA Author Manuscript
NIH
-PA Author Manuscript
NIH
-PA Author Manuscript
Mayo et al. Page 17
Tabl
e 4
Perf
orm
ance
of P
rogn
ostic
Tes
ts in
PB
C: A
rea
Und
er th
e R
ecei
ver O
pera
ting
Cha
ract
eris
tic C
urve
s with
95%
con
fiden
ce in
terv
als
AR
EA
UN
DE
R R
OC
(CI)
TE
STY
ears
Pri
or to
Fir
st C
ompl
icat
ion
02
46
8
Euro
pean
Liv
er F
ibro
sis P
anel
0.74
8(0
.651
-0.8
45)
0.73
9(0
.653
-0.8
25)
0.68
2(0
.578
-0.7
86)
0.68
4(0
.528
-0.8
41)
0.78
4(0
.600
-0.9
68)
Isha
k Sc
ore
(0-6
)0.
732
(0.6
27-0
.836
)0.
743
(0.6
47-0
.839
)0.
721
(0.6
17-0
.824
)0.
751
(0.6
06-0
.896
)0.
584
(0.4
23-0
.745
)
PBC
Sta
ge(1
-4)
0.70
6(0
.583
-0.8
29)
0.67
5(0
.562
-0.7
88)
0.63
4(0
.505
-0.7
64)
0.65
7(0
.471
-0.8
43)
0.30
5(0
.077
-0.5
34)
Bili
rubi
n(lo
g e)
0.65
0(0
.526
-0.7
74)
0.65
9(0
.541
-0.7
77)
0.61
7(0
.501
-0.7
32)
0539
(0.3
68-0
.711
)0.
559
(0.0
98-1
.0)
MEL
D0.
642
(0.5
38-0
.746
)0.
630
(0.5
31-0
.729
)0.
544
(0.4
39-0
.649
)0.
592
(0.4
55-0
.730
)0.
612
(0.3
27-0
.898
)
May
o PB
C R
isk
Scor
e0.
680
(0.5
64-0
.796
)0.
625
(0.5
18-0
.733
)0.
501
(0.3
88-0
.614
)0.
431
(0.2
94-0
.568
)0.
441
(0.1
19-0
.763
)
Hepatology. Author manuscript; available in PMC 2009 November 1.
Copyright © 2022 FDOKUMEN