
Feasibility study of porous copper fiber sintered felt
17
Feasibility study of porous copper fiber sintered felt: A novel porous flow field in proton exchange membrane fuel cells Yong Tang a , Wei Yuan a,b, *, Minqiang Pan a , Zhenping Wan a a Key Laboratory of Surface Functional Structure Manufacturing of Guangdong Higher Education Institutes, South China University of Technology, Guangzhou 510640, People’s Republic of China b School of Mechanical and Manufacturing Engineering, The University of New South Wales, Sydney, NSW 2052, Australia article info Article history: Received 29 January 2010 Received in revised form 27 June 2010 Accepted 28 June 2010 Available online 31 July 2010 Keywords: Proton exchange membrane fuel cell Porous copper fiber sintered felt Porous flow field Contact angle Corrosion resistance abstract A novel porous flow field made of the porous copper fiber sintered felt (PCFSF) is developed for proton exchange membrane (PEM) fuel cells. The feasibility of this material is systematically investigated involving fabrication, characterization and application. The experimental results reveal that a lower cutting speed helps prevent the fibers from formation failure and morphological defects. A lower feed rate and a smaller back-cutting depth both reduce the equivalent diameter of the copper fibers. The sintering temperature, time and pressure combine to affect the formation quality of the PCFSF which has three- dimensional network structure with open pores distributed stochastically. The wettability tests show that the PCFSF is hydrophobic and the contact angle increases with the increase of porosity. The corrosion behaviors of the PCFSF in simulated PEM fuel cell environment prove that the PCFSF without any coating and alloying treatment is not quite competent, although the Cu corrosion does not critically happen in the tested fuel cell. The resistance tests demonstrate that the combined total electrical resistance of the composite bipolar plate is smaller than the graphite plate. The single-cell tests show that the performance of the fuel cell with the PCFSF flow field is acceptable. The effects of the operating parameters such as the anode operating pressure and cathode air flow rate are also explored. ª 2010 Professor T. Nejat Veziroglu. Published by Elsevier Ltd. All rights reserved. 1. Introduction The proton exchange membrane (PEM) fuel cell technology has drawn considerable attention during past two decades in the field of hydrogen energy. It has the ability to generate high power densities under low-temperature conditions. This makes it potentially attractive for automotive, portable and distributed power generation [1e3]. A typical PEM fuel cell consists of the bipolar/end plate and the membrane electrode assembly (MEA). The bipolar plate (BP) is a key component in the PEM fuel cell architecture, which accounts for 80% of total weight and 45% of total cost [4]. It serves for current conduc- tion, heat dissipation, gas flow distribution and residual water removal, thereby directly influencing the fuel cell perfor- mance. A large number of R&D activities have concentrated on the flow field design and fabrication in PEM fuel cells. A common method is to make grooved channels on the surface of the bipolar plates through mechanical or electrochemical methods so as to transport reactant gases uniformly to the whole electrodes. Fig. 1 illustrates some traditional flow field patterns usually employed in PEM fuel cells. However, there is no certain conclusion concerning which type is the best. * Corresponding author. Key Laboratory of Surface Functional Structure Manufacturing of Guangdong Higher Education Institutes, South China University of Technology, Guangzhou 510640, People’s Republic of China. Tel./fax: þ86 2085516947. E-mail address: [email protected] (W. Yuan). Available at www.sciencedirect.com journal homepage: www.elsevier.com/locate/he international journal of hydrogen energy 35 (2010) 9661 e9677 0360-3199/$ e see front matter ª 2010 Professor T. Nejat Veziroglu. Published by Elsevier Ltd. All rights reserved. doi:10.1016/j.ijhydene.2010.06.101
-
Upload
khangminh22 -
Category
Documents
-
view
4 -
download
0
Transcript of Feasibility study of porous copper fiber sintered felt
i n t e r n a t i o n a l j o u r n a l o f h y d r o g e n en e r g y 3 5 ( 2 0 1 0 ) 9 6 6 1e9 6 7 7
Avai lab le a t www.sc iencedi rec t .com
journa l homepage : www.e lsev ier . com/ loca te /he
Feasibility study of porous copper fiber sintered felt: A novelporous flow field in proton exchange membrane fuel cells
Yong Tang a, Wei Yuan a,b,*, Minqiang Pan a, Zhenping Wan a
aKey Laboratory of Surface Functional Structure Manufacturing of Guangdong Higher Education Institutes,
South China University of Technology, Guangzhou 510640, People’s Republic of Chinab School of Mechanical and Manufacturing Engineering, The University of New South Wales, Sydney, NSW 2052, Australia
a r t i c l e i n f o
Article history:
Received 29 January 2010
Received in revised form
27 June 2010
Accepted 28 June 2010
Available online 31 July 2010
Keywords:
Proton exchange membrane fuel cell
Porous copper fiber sintered felt
Porous flow field
Contact angle
Corrosion resistance
* Corresponding author. Key Laboratory ofSouth China University of Technology, Guan
E-mail address: [email protected]/$ e see front matter ª 2010 Profedoi:10.1016/j.ijhydene.2010.06.101
a b s t r a c t
A novel porous flow field made of the porous copper fiber sintered felt (PCFSF) is developed
for proton exchange membrane (PEM) fuel cells. The feasibility of this material is
systematically investigated involving fabrication, characterization and application. The
experimental results reveal that a lower cutting speed helps prevent the fibers from
formation failure and morphological defects. A lower feed rate and a smaller back-cutting
depth both reduce the equivalent diameter of the copper fibers. The sintering temperature,
time and pressure combine to affect the formation quality of the PCFSF which has three-
dimensional network structure with open pores distributed stochastically. The wettability
tests show that the PCFSF is hydrophobic and the contact angle increases with the increase
of porosity. The corrosion behaviors of the PCFSF in simulated PEM fuel cell environment
prove that the PCFSF without any coating and alloying treatment is not quite competent,
although the Cu corrosion does not critically happen in the tested fuel cell. The resistance
tests demonstrate that the combined total electrical resistance of the composite bipolar
plate is smaller than the graphite plate. The single-cell tests show that the performance of
the fuel cell with the PCFSF flow field is acceptable. The effects of the operating parameters
such as the anode operating pressure and cathode air flow rate are also explored.
ª 2010 Professor T. Nejat Veziroglu. Published by Elsevier Ltd. All rights reserved.
1. Introduction weight and 45% of total cost [4]. It serves for current conduc-
The proton exchange membrane (PEM) fuel cell technology
has drawn considerable attention during past two decades in
the field of hydrogen energy. It has the ability to generate high
power densities under low-temperature conditions. This
makes it potentially attractive for automotive, portable and
distributed power generation [1e3]. A typical PEM fuel cell
consists of the bipolar/end plate and the membrane electrode
assembly (MEA). The bipolar plate (BP) is a key component in
the PEM fuel cell architecture, which accounts for 80% of total
Surface Functional Strucgzhou 510640, People’s Rcn (W. Yuan).ssor T. Nejat Veziroglu. P
tion, heat dissipation, gas flow distribution and residual water
removal, thereby directly influencing the fuel cell perfor-
mance. A large number of R&D activities have concentrated
on the flow field design and fabrication in PEM fuel cells. A
common method is to make grooved channels on the surface
of the bipolar plates through mechanical or electrochemical
methods so as to transport reactant gases uniformly to the
whole electrodes. Fig. 1 illustrates some traditional flow field
patterns usually employed in PEM fuel cells. However, there is
no certain conclusion concerning which type is the best.
ture Manufacturing of Guangdong Higher Education Institutes,epublic of China. Tel./fax: þ86 2085516947.
ublished by Elsevier Ltd. All rights reserved.

Fig. 1 e Schematic of various flow field patterns for PEM fuel cells: (a) serpentine; (b) parallel; (c) parallel serpentine; (d)
interdigitated; (e) spiral; (f) porous mesh.
i n t e rn a t i o n a l j o u r n a l o f h y d r o g e n en e r g y 3 5 ( 2 0 1 0 ) 9 6 6 1e9 6 7 79662
Additionally, the fabrication of these complex flow fields on
graphite and metal plates costs too much. This severely
hinders quantity manufacturing and inevitably delays the
market commercialization of PEM fuel cells. Therefore, it is
necessary to develop newmaterials, structures and processes
for bipolar plates and flow fields so as to satisfy various
application requirements of PEM fuel cells.
Compared with graphite, the metallic materials seem to be
more promising candidates when used for BPs due to higher
heat conductivity andmechanical strength, better durability to
shocks and vibration, and superior machinability and cost
effectiveness [5]. For example, aluminum [6,7], titanium [8,9],
copper [10e14] and stainless steel [9,15,16] are all popular
materials used tomakemetallic bipolar plates. In spite of their
advantages mentioned above, most of them have to face
a crucial issuewith regard to thematerial corrosion in the acid
and humid environment of PEM fuel cells. They are likely to
suffer dissolution when operating at a temperature of around
80 �C and a pH of 2e4 [17]. When they are corroded, the
producedmetal ions tend to poison the catalysts and even the
polymer membrane. Besides, the metal-oxide layer may grow
on the material surface, which increases the interfacial elec-
trical resistancebetween the current collector andneighboring
components. These two factors both possibly deteriorate the
performance of PEM fuel cells. Therefore, protective pretreat-
ments suchas surfacecoatingandalloyingareusually adopted
to avoid or at least alleviate the material corrosion.
In recent years, a new trend is worth noting that the porous
metals (e.g. stainless steel foam and nickel foam) have
exhibited great feasibility to make current collectors and gas
diffusion layers in PEM fuel cells. According to different fabri-
cation methods, the porous metals can be mainly classified
into following types: the powder/fiber sintered, mold casted
and electro/vapor deposited (i.e. metal foams), which are
widely used for filtration and separation, heat exchange,
catalyst support, fluid flow control and so on [18]. Nowadays,
they are regarded as potential alternative materials for
construction of PEM fuel cells because of their excellent
advantages in weight, current conductivity, self-support
ability and specific surface area, thereby attracting increasing
attentions of the fuel cell community [19e28]. There have been
published reports studying on the porous flow field models in
PEM fuel cells, although the related knowledge is still limited.
Hontanon et al. [19] focused on optimization of the gas flow
distribution in PEM fuel cells by using the FLUENT software
package. They compared the porous medium with traditional
groovedflowfield, proving that thepermeability of the gasflow
distributor is a key parameter affecting consumption of the
reactant gases in the electrodes. The simulation results
demonstrated that the porous medium produces better
performance than the grooved flow channels because the
permeability reduction benefits utilization of the reactant
gases, especially on the porous anode side. Kumar and Reddy
[20] developed a three-dimensional steady-state model to
investigate the PEM fuel cell, which provided an efficient
solution forporousmaterialswithdifferentpermeability. They
usedmetal foamas the gas distributionmedium instead of the
widely used rectangular channels and meanwhile prepared

i n t e r n a t i o n a l j o u r n a l o f h y d r o g e n en e r g y 3 5 ( 2 0 1 0 ) 9 6 6 1e9 6 7 7 9663
amulti-parallel flowfield for comparison. They also confirmed
that the permeability has prominent effect on the cell perfor-
mance. This result is consistent with Ref. [19]. Based on above
review, a general conclusion can be drawn that the fuel cell
performance increases with a decrease in the permeability of
the flow field. This phenomenon may be explained by the
increase of the pressure drop which will enhance the mass
transfer from the flow field to the electrode-membrane reac-
tion interface through forced convection. In this regard, the
traditional machined flow field seems less competent because
it cannot reduce the permeability value below 10�8 m2 due to
machining limitation of the micro channels [20].
Murphyetal. [21]proposeda low-costapproach toassemble
light-weigh PEM fuel cell stacks. Their core idea was to use
expanded metals or metal foams to make the flow field,
forming a combined bipolar platewith the polymer cell frames
integrated. They claimed that this new solution was able to
remarkably reduce both cost and weight as a result of the
simple fabrication process. They experimentally demon-
strated that the flow field made of porous metal could yield
even flow, and that the three-dimensional feature of the
porous materials could prevent formation of a laminar flow
regime, where the gas flow itself would develop a concentra-
tion gradient and deprive the electrodes of sufficient reactive
gas. Kumar and Reddy [22] also performed single-cell experi-
ments to validate their rationale developed in Ref. [20]. The
results showed that the best fuel cell performance was
obtainedwhenNieCrmetal foamwas used, followed by SS316
metal foam, multi-parallel flow field and carbon cloth. This
trend effectively strengthened the modeling result they
previously published [20]. Hottinen et al. [23] evaluated the
performance of a PEM fuel cell which used the titanium sinter
material as the gas diffusion backing (GDB). Their study aimed
at reducing the high contact resistance between the MEA and
the titanium sinter with platinum and carbon coatings on its
surface.Zhanget al. [24] reportedanovel gasdiffusionmedium
with controllable porosity. They prepared a 12.5 mmcopper foil
as theGDLbymeansofMEMStechnologyandcompared itwith
the conventional carbon GDL. The results showed that the cell
performance was improved due to increased in-plane mass
transport. Liu et al. [25] adopted a stainless steel sintered fiber
felt as the GDB in an air-breathing direct methanol fuel cell
(DMFC). Compared with the conventional carbon paper, this
GDB pattern helps increase the power density of the fuel cell
because of its higher electronical conductivity and hydrophi-
licity. Chen and Zhao [26] tried to fabricate and test current
collectors utilizing the porous metal foam made from NieCr
alloy for a passive DMFC. The results suggested that the fuel
cell with porous current collectors yielded higher performance
in a stable manner than with perforated-plate current collec-
tors. This interesting behavior could be attributed to a larger
specific transport area, a lower effective thermal conductivity
and faster water removal as a result of the capillary action.
Arisetty et al. [27] conducted experimental studies on DMFCs
incorporating a metal foam flow field. The authors chiefly
focused on the effects of the physical parameters (i.e. pore size
and density) of aluminum metal foam and the operating
parameters (i.e. concentration and flow rate) of methanol
feeding on the polarization behavior and power output. Shudo
and Suzuki [28] employed a corrosion-resisting porous
stainless steel as the flow field used for a DMFC. They ascribed
the improved cell performance to its high porosity around 90%
that benefits both the reactant supply and product removal. As
enumerated above, these literatures greatly illuminate the
feasibility of using porous metals as the flow field in PEM fuel
cells, and fully affirm their advantages in cell performance
optimization.
As aforementioned, the metallic bipolar plate must effec-
tively handle the two important issues such as corrosion
resistance and electrical conductivity. It is known that the
copper has poor corrosion resistance but good electrical and
thermal conductivity. This fact seems to be an intractable
conflict when the copper is used as BPs in PEM fuel cells. This
may explain why the copper is seldom considered as a BP
material. In general, surface coating or alloying treatment is
necessary for copper and other corrodible metals to meet the
functional demands of BPmaterials. Nikam and Reddy [10e12]
solved this issue by using a coppereberyllium alloy (C-17200)
and successfully fabricated channeled and corrugated BPs for
PEM fuel cell application. They reported that this alloy was
a competent candidate material for BPs, which was proved to
have good corrosion resistance in simulated PEM fuel cell
environment. Lee et al. [13] tested the chemical behavior and
electrical conductivity of the Cue5.3 (wt.%) Cr alloy for
possible application in PEM fuel cells. They found that the
formation of Crenitride improved the corrosion resistance
especially in an anode environment and the electrical
conductivity was acceptable without any recession after
polarization. Hsieh et al. [14] made the micro-fabricated
copper BPs through the electroforming method and per-
formed the polarization tests. They did not give out more
details about the corrosion property of the copper material,
although they claimed that it was suitable to produce BPs in
PEM fuel cells.
As summarized above, the previous work has made
constructive contribution to the potential application of
porous metals in PEM fuel cells and facilitated further studies
on this promising solution for flow field design. However, few
efforts were made with respect to the porous copper used in
PEM fuel cells, although it hasmuch favorable properties such
as higher electrical and thermal conductivity, better ductility
andmanufacturability, andmassive production. In this study,
a novel porous flow field of the PEM fuel cell is presented,
which is made of the porous copper fiber sintered felt (PCFSF).
It can be regarded as a multi-functional material with opti-
mized structures serving for flow distribution and mass
transfer enhancement. A systematical investigation is carried
out to explore a series of concerned issues including fabrica-
tion process, morphological description, functional charac-
terization and application in PEM fuel cells. Several important
physical indexes such as wettability, electrical conductivity
and corrosion resistance, are emphatically analyzed.
2. Experimental
2.1. Fabrication of the PCFSF
The metal fibers can be used to produce porous metal mate-
rials partially or entirely instead of metal powders, which is

Fig. 2 e Copper fiber fabrication usingmulti-tooth cutter: (a) photograph of the copper fiber cutting on the lathe; (b) schematic
of the multi-tooth cutter.
i n t e rn a t i o n a l j o u r n a l o f h y d r o g e n en e r g y 3 5 ( 2 0 1 0 ) 9 6 6 1e9 6 7 79664
generally called metal fiber metallurgy. A common process of
this technique includes fiber drawing, felting and sintering. In
this study, the copper fibers are made by the cutting method
developed in our laboratory [29,30], which is considered to be
simple, cost effective and controllable. A special multi-tooth
cutter was prepared through wire-cutting and employed for
fiber fabrication, as shown in Fig. 2.
A copper rod was firstly cleaned and then fitted on the
C6132A lathe. After enough fibers were manufactured, they
were categorized and mixed uniformly according to certain
length, diameter and aspect ratio. Then the fibers were spread
in the groove of a stainless steel mold plate with Al2O3
powders filled simultaneously. Later, the cover plate was
installed and fastened using M8 screw bolts. The detailed
setup configuration is shown in Fig. 3. Subsequently, the
whole assemblywas sealed and sintered in a sintering furnace
with a programmable temperature controller for 30e60 min at
850e950 �C. The sintering process depended on the tempera-
ture level by stages. When the temperature was below 800 �C,the heating rate was kept at 300 �C/h; and when the temper-
ature was above 800 �C, the heating rate was reduced to
200 �C/h. The furnace chamber was purged by nitrogen to get
rid of the air and then filled with hydrogen to maintain
a reductive atmosphere. The pressure of the hydrogen in the
furnace chamber was kept at 0.3 MPa.When the sintering was
finished, the sample was taken out and cooled to room
temperature. Then the Al2O3 powderswerewashed away, and
the PCFSF with a similar size to the groove was finally
obtained.
Fig. 3 e Schematic of the assembly for PCFSF sintering.
2.2. Characterization of the PCFSF
2.2.1. Morphological analysisThemorphological features of the PCFSFwere inspected using
the scanning electron microscope (SEM) technique. The
complex intertexture of the solid phase and holes were
magnified to characterize the detailed microstructures that
closely influence the physical characteristics of the PCFSF.
The relationship between the processing parameters and
surface formation of the PCFSF was also investigated.
2.2.2. Porosity, pore diameter and permeabilityThe porous metal materials are treated as a kind of complex
consisting of solid phases and holes. Its porosity is defined as
a key parameter related to various physical quantities such as
electrical/thermal conductivity, optical/acoustical perfor-
mance, tensile intensity and compressibility. Here, it can be
expressed by the percentage of the interspace volume in the
whole volume:
3 ¼ Vk
V(1)
where Vk and V are the volumes of the holes and the whole
PCFSF, respectively.
In the present study, the weight-volume method was used
to determine the porosity of the PCFSF. Three samples were
cautiously prepared without deforming the original porous
structure. Then they were weighted using an analytical
balance. The volume value could be acquired averagely from

Fig. 4 e The relationship between wettability and contact
angle (q).
i n t e r n a t i o n a l j o u r n a l o f h y d r o g e n en e r g y 3 5 ( 2 0 1 0 ) 9 6 6 1e9 6 7 7 9665
the results of repeated measurements. Thus, the porosity of
the PCFSF can be deducted as:
3 ¼�1� M
Vars
�� 100% (2)
where M is the mass of the PCFSF; rs is the density of the
substrate material of solid copper; Va is the average value of
the measured volume.
Besides the porosity, the average pore diameter is also an
important structural parameter for the PCFSF. The relation-
ship between these two physical quantities can be calculated
by the bundle-of-capillary model. It is assumed that the pores
in the PCFSF are all parallel cylindrical capillary tubes. Thus,
the average pore diameter of the PCFSF can be computed by
the following equation:
da ¼ 3df=ð1� 3Þ (3)
where df is the fiber diameter. In this study, it is approximately
100 mm.
However, the above method only yields a theoretical value
which is far from the real condition. Thus, the average pore
diameter is usually obtained using the statistical method. In
this study, the average pore diameter was calculated using Eq.
(4) presented by Wang et al. [31]:
da ¼ 6:15df33:35 (4)
Since the PCFSF was applied as the flow field in PEM fuel
cells, its permeability has to be evaluated and optimized for
fluid distribution and penetration. Here, the Darcy’s law can
be used to describe the fluidic flow through the PCFSF:
DPh
¼ m
Ku (5)
where DP is the hydrostatic pressure difference across the
PCFSF; h is the thickness of the PCFSF; m is the fluid dynamic
viscosity; u is the average flow rate in unit cross-sectional
area; and K is the permeability coefficient which is closely
related with the porosity and average pore size. The value of K
is a very important indicator to distinguish the permeability
difference between the PCFSF and grooved gas flow field.
According to the KozenyeCarman equation, in the porous
material, K can be defined as following form:
K ¼ C33=S2v (6)
where C¼ 0.2 for the irregular metal fiber sintered felt. And Svis the specific surface area of the pore, which can be expressed
as:
Sv ¼ 43=da (7)
2.3. Wettability test
Since the PCFSF serves as the flow field and GDL in PEM fuel
cells, its wettability becomes an important index that is
closely related to the water management mechanisms
[32e34]. In this research, the wettability tests were carried out
to verify the characteristics of hydrophobicity or hydrophi-
licity. A group of samples obtained from the PCFSFs with
different porosities were used to explore the influence of the
porosity on wettability degree. For the purpose of microscopic
insight, the quantitative measurement of the surface contact
angle (i.e. wetting angle, q) was performed on the video optical
platform, OCA20 (Dataphysics, Inc.) by using the sessile
dropletmethod [35,36]. The contact angle is the angle at which
a liquid/vapor interface meets the solid surface. It is a specific
parameter for any given system and is determined by the
interactions across the three interfaces. The relationship
betweenwettability and the value of q is shown in Fig. 4.When
q< 90�, the material is hydrophilic; contrarily when q> 90�,the material is hydrophobic.
2.4. Corrosion resistance test
The porous metal materials used under harsh operating
conditions have to be corrosion-resistant especially in acid
environment. They are usually damaged internally by corro-
sion behavior due to existence of a lot of pores. In this study,
corrosion experiment for the PCFSF was conducted in simu-
lated PEM fuel cell environment. The polarization tests were
carried out in a self-designed electrochemical cell, which was
filled with 200 ml acid solution of 0.05 M SO42� and 2 ppm F� in
deionized water. The three-electrode system was set up with
a platinum foil acting as the counter electrode (CE) and
a saturated calomel electrode (SCE) acting as the reference
electrode (RE). A cleaned sample of a copper foil
(10 mm� 10 mm� 1 mm) was prepared as the working elec-
trode (WE), which had experienced the same high-tempera-
ture process in the furnace as the PCFSF. It was connected
with a standard copper wire through the welding method. A

Fig. 5 e Comparison between the PCFSF porous flow field
and the single-channel serpentine flow field.
Table 1 e The detailed dimensional parameters of theporous flow field plate and serpentine flow field plate.
Dimensionalparameters
Porous flowfield plate
Serpentine flowfield plate
Materials PCFSF & 316 L SS Graphite
Size (mm) 70� 27� 4 70� 27� 4
Channel
depth (mm)
1 1
Channel
width (mm)
1.7
Rib width (mm) 0.5
i n t e rn a t i o n a l j o u r n a l o f h y d r o g e n en e r g y 3 5 ( 2 0 1 0 ) 9 6 6 1e9 6 7 79666
Luggin capillary was filled with saturated KCl solution and
encapsulated with agar, working as a salt bridge to maintain
a constant distance of 2 mm between the RE and WE. In order
to simulate the anodic and cathodic environments in PEM fuel
cells, the solution was bubbled with pure hydrogen and air,
respectively. The gas flowwas regulated by a flowmeter before
entering the gas feeding inlet of the electrochemical cell. The
operating temperature was automatically controlled using
water bath. Before starting each test, pre-bubbling was per-
formed for about 30 min. The AUTOLAB (PGSTAT302) elec-
trochemical workstation was utilized to conduct the
potentiodynamic tests. All the samples were stabilized in the
simulated solution at the open circuit potential (OCP) for
about 5 min every time before measurement. In the poten-
tiodynamic tests, the potential increases with a scan rate of
1 mV/s from �1 V to þ1.5 V.
2.5. Preparation of single PEM fuel cell
2.5.1. MEA fabricationThe MEA was fabricated with an active area of 11 cm2
(5.5 cm� 2 cm) and catalyst loadings of 0.8 mgPt/cm2 on both
the anode and the cathode sides. Nafion� membranes of NRE-
212 (Dupont, Inc.) and Toray� Carbon papers were used as the
proton exchange membrane and the backing layer (BL), respec-
tively. Firstly, the membrane was boiled in 3% H2O2 for 1 h and
then boiled in 0.5 M H2SO4 solution to activate the membrane.
Afterward, themembranewaspurifiedinboileddeionizedwater
for 1 h to get rid of the residual sulfuric acid. A mixed PTFE/C
(Vulcan XC72, E-Tec, Inc.) layer was bonded upon the wet-
proofed BL surface to form a complete GDL. The catalyst ink for
the electrodes was prepared by mixing the catalyst powders
(40 wt.% Pt/C, E-Tec, Inc.), Nafion� solution, and isopropyl
alcohol together. Then the prepared catalyst inkwas sprayedon
the PTFE/C layer surface by using a sprayingmachine and dried
in a vacuum oven, forming a so-called gas diffusion electrode
(GDE). Subsequently, the Nafion� solution was again used to
brush the CL in order to realize effective contact between the
catalyst and the polymer electrolyte. Finally, a complete MEA
can be obtained by hot-pressing the pretreated membrane and
the electrodes together for 3 min at 120 �C.
2.5.2. Bipolar plate and flow field designThe PCFSF was used as the porous flow field in a PEM fuel cell
(FC1). To validate the feasibility and effectivity of such
a special structure, a traditional graphite fuel cell (FC2) with
a single-channel serpentine flow field was prepared for
comparison analysis, as illustrated in Fig. 5. The detailed
geometric parameters of these two flow field plates are listed
in Table 1. In this study, the flow field was machined on one
side of the bipolar plate for single-cell tests.
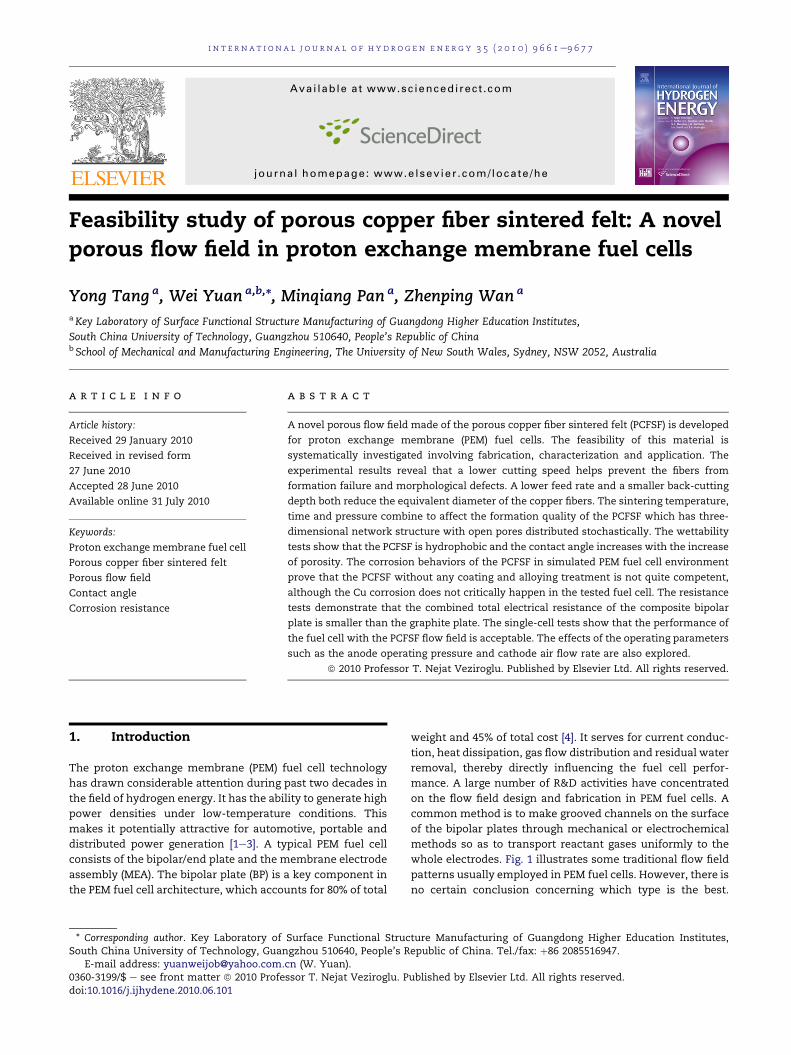
2.5.3. Single-cell configuration and experimentsFig. 6 describes the detailed configuration of the tested PEM
fuel cell. The PCFSF was embedded in the groove of the SS316
support plate (see Fig. 6(b)). A copper plate with an exerted
wiring terminal served as the current collector and an insu-
lated nylon plate served as the end plate. The connections
between relevant parts were sealed with Teflon gaskets.
During the whole testing, the fuel cell worked in a counter-
flowmode with the gas inlet and outlet both on the same side.
It was operated at the normal temperature without any
external humidification. A schematic diagram of the experi-
mental system for fuel cell test is shown in Fig. 7.
2.6. Electrical resistance measurement
Except for corrosion resistance, the electrical conductivity of
the metallic components included in PEM fuel cells also
deserves much attention. Generally speaking, the level of
electrical resistance (ER) has great effect on the operating
performance and power output of PEM fuel cells. In particular,
the interfacial contact resistance (ICR) between two materials
in PEM fuel cells is regarded as an important criterion for
feasibility evaluation. Wang et al. once presented a useful
method to measure the ICR which was commonly used later
by other groups [16]. However, the ICR only reflects the

Fig. 6 e Schematic of the configuration of a PEM fuel cell with the PCFSF flow field.
i n t e r n a t i o n a l j o u r n a l o f h y d r o g e n en e r g y 3 5 ( 2 0 1 0 ) 9 6 6 1e9 6 7 7 9667
contacting quality of two components. A combined value of
both the body resistance (BR) and ICR is more significant in
real application because the BR is always inevitable. Moreover,
a variety of PEM fuel cell components with different materials
and configurations are involved in this study, namely the
PCFSF, SS316 support plate, copper plate, graphite plate, and
carbon paper. Therefore, different from Ref. [16], a new
concept of a combined resistance Rt0 (see Fig. 8) containing one
BR and two ICRs, is proposed to express the related variables
when a new material is chosen to make the bipolar plate and
flow field. This symbolic resistance was used as an objective
function to evaluate the componential electrical property. In
the real testing process, Rt0 can be replaced by a total ER (Rt)
through deductive calculation. The overall experiment was
divided into five groups according to the assembly patterns, as
illustrated in Fig. 9. A series of tests were carried out to directly
measure the value of Rt under a forced compaction and the
results were characterized as functions of the applied pres-
sure. A pressure transducer connected to a digital screen was
used to capture the compaction values. And two polished
copper sheets with four standard wires embedded were used
as clamping plates on both the upper and lower sides. The
expressions of the total resistance (Rt) in each case are
respectively described as follows:
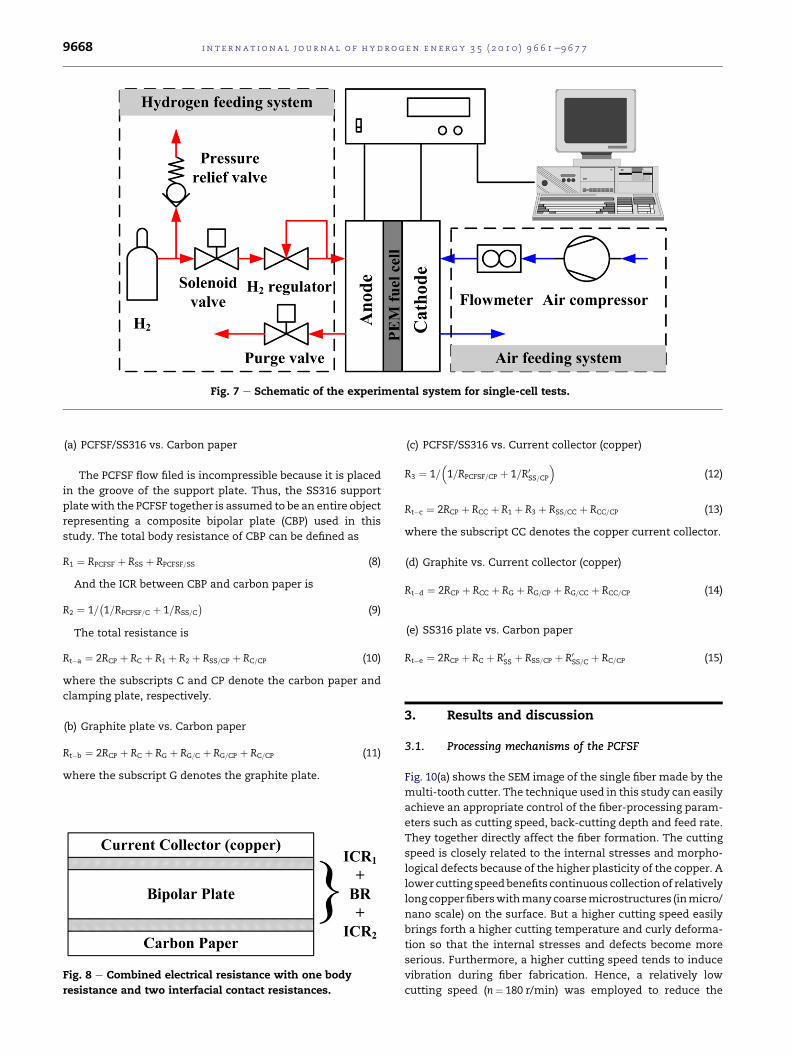
Fig. 7 e Schematic of the experimental system for single-cell tests.
i n t e rn a t i o n a l j o u r n a l o f h y d r o g e n en e r g y 3 5 ( 2 0 1 0 ) 9 6 6 1e9 6 7 79668
(a) PCFSF/SS316 vs. Carbon paper
The PCFSF flow filed is incompressible because it is placed
in the groove of the support plate. Thus, the SS316 support
platewith the PCFSF together is assumed to be an entire object
representing a composite bipolar plate (CBP) used in this
study. The total body resistance of CBP can be defined as
R1 ¼ RPCFSF þ RSS þ RPCFSF=SS (8)
And the ICR between CBP and carbon paper is
R2 ¼ 1=�1=RPCFSF=C þ 1=RSS=C
�(9)
The total resistance is
Rt�a ¼ 2RCP þ RC þ R1 þ R2 þ RSS=CP þ RC=CP (10)
where the subscripts C and CP denote the carbon paper and
clamping plate, respectively.
(b) Graphite plate vs. Carbon paper
Rt�b ¼ 2RCP þ RC þ RG þ RG=C þ RG=CP þ RC=CP (11)
where the subscript G denotes the graphite plate.
Fig. 8 e Combined electrical resistance with one body
resistance and two interfacial contact resistances.
(c) PCFSF/SS316 vs. Current collector (copper)
R3 ¼ 1=�1=RPCFSF=CP þ 1=R0
SS=CP
�(12)
Rt�c ¼ 2RCP þ RCC þ R1 þ R3 þ RSS=CC þ RCC=CP (13)
where the subscript CC denotes the copper current collector.
(d) Graphite vs. Current collector (copper)
Rt�d ¼ 2RCP þ RCC þ RG þ RG=CP þ RG=CC þ RCC=CP (14)
(e) SS316 plate vs. Carbon paper
Rt�e ¼ 2RCP þ RC þ R0SS þ RSS=CP þ R0
SS=C þ RC=CP (15)
3. Results and discussion
3.1. Processing mechanisms of the PCFSF
Fig. 10(a) shows the SEM image of the single fiber made by the
multi-tooth cutter. The technique used in this study can easily
achieve an appropriate control of the fiber-processing param-
eters such as cutting speed, back-cutting depth and feed rate.
They together directly affect the fiber formation. The cutting
speed is closely related to the internal stresses and morpho-
logical defects because of the higher plasticity of the copper. A
lower cutting speedbenefits continuous collectionof relatively
long copperfiberswithmanycoarsemicrostructures (inmicro/
nano scale) on the surface. But a higher cutting speed easily
brings forth a higher cutting temperature and curly deforma-
tion so that the internal stresses and defects become more
serious. Furthermore, a higher cutting speed tends to induce
vibration during fiber fabrication. Hence, a relatively low
cutting speed (n¼ 180 r/min) was employed to reduce the

Fig. 9 e Experiments of electrical resistance between the involved components in PEM fuel cells.
i n t e r n a t i o n a l j o u r n a l o f h y d r o g e n en e r g y 3 5 ( 2 0 1 0 ) 9 6 6 1e9 6 7 7 9669
deformation coefficient andmaintain a relatively steady state.
It is also discovered that the increase of the feed rate ( f ) and
back-cutting depth (ap) results in an increase of the equivalent
fiber diameter. According to the basic principle of cutting
process, the teethdepth (h)must be bigger than the real cutting
depth to promote efficient chip bifurcation.When the feed rate
increases, the cutting depth gets bigger so that the tool teeth
have to be made deeper accordingly. This tends to cause cut
edge crack. Meanwhile, an increase of the feed rate helps
achieve a larger fiber diameter. Therefore, an optimum feed
rate is necessary to create fibers with a required equivalent
diameter and improve the production efficiency. In addition,
the back-cutting depth also affects the fiber diameter because
it is related to the contact length between the multi-tooth
cutter and work piece. For this reason, the feed rate and back-
cutting depth were kept at appropriate values ( f¼ 0.10 mm/r,
ap¼ 1.25 mm)during thewholemachiningprocess.With these
parameters prescribed, the produced fibers have an average
diameter of less than 100 mm. According to Eqs. (5) and (6), the
fiber diameter interacts on theporosity andpermeability of the
PCFSF.When the porosity is certain, the average pore diameter
increases with a growth of the fiber diameter so that the
permeability also increases. However, the fibers with an
excessively big diameter are not suitable for fiber arrangement
andsintering. Conversely,when thefiberdiameter is too small,
the permeability of the PCFSF is quite limited so that it cannot
beused as theflowfield in PEM fuel cells. Therefore, an average
fiber diameter of 100 mm obtained in this study is found to be
suitable for PCFSF fabrication.
As for the sintering process, there are also a series of tech-
nical factors,namely thesintering temperature, sintering time,
sintering pressure and so forth. Fig. 10 compares the shape of
the single fiber before and after sintering. It is obvious that the
fiberedgebecomesa little smootherafter the sinteringprocess.
This trend can be explained by the material migration
behavior. Before sintering, the fibers have plenty of salient
burrs enlarging the surface area of the fiber bundles. So, the
fibers have higher surface free energy under this unsteady
condition. The sintering process forces the surfacematerial of
the fibers tomigrate so as to reduce the surface area. The fibers
finally reach a relatively steady state with lower surface
energy. Generally, a higher sintering temperature benefits
formationof the sintering joints (see Fig. 11) betweenfibersdue
to thematerialmigrationmechanisms. On the other hand, the
copper fiber felts cannot be sintered at a lower temperature
because the fibers contact each other loosely without proper
melting condition. The sintering time is determined by the
sintering temperature.When the sintering temperature is kept
at a relatively high level, the sintering time should not be long.
But when the sintering temperature is lower, the processing
time should be prolonged to satisfy the sintering requirement.
Additionally, the sintering pressure helps to accelerate the
forming velocity of the PCFSF. Therefore, the sintering
parameters used in this study are optimized to facilitate better
formation of the fiber-to-fibermetallurgy junction. To sumup,
the processing parameters have great influence on the micro-
structures of the PCFSF, thereby affecting the functional
characteristics (e.g. flow distribution, fluidic permeation,
electrical conduction) in practical applications.
3.2. Morphological description of the PCFSF
Fig. 11 shows the SEM images of the PCFSF (90% porosity)
sintered for 1 h at 900 �C. It is shown that the copper fibers

Fig. 10 e SEM photos of the single fiber: (a) before sintering;
(b) after sintering.
i n t e rn a t i o n a l j o u r n a l o f h y d r o g e n en e r g y 3 5 ( 2 0 1 0 ) 9 6 6 1e9 6 7 79670
intervene stochastically and bond with each other, forming
many contact points among the fiber clusters. This layout can
be regarded as a type of three-dimensional network micro-
structure with countless open pores, which is quite different
from the metal foams. All of the pores are connected so that
the fluidic phase can pass through. Thus, there are only
Fig. 11 e SEM photo and structu
through holes inside the PCFSF, without blind holes formed.
The solid phase constitutes a skeleton of the network struc-
ture and the non-solid phase makes up the porous space.
However, the formed holes are not regularly and uniformly
distributed because the copper fibers cross and overlap each
other in a chaotic mode. It is usually acknowledged that the
structural uniformity depends on the regulation of fiber
layers. More fiber layers help achieve more uniform porous
structures. As shown in Fig. 11, there exist three kinds of
“path” in the PCFSF architecture, which can be defined as
a connected string of fiber segments [37]:
(a) “branchebranch” (BeB) path that connects to joints at
each end;
(b) “brancheleaf” (BeL) path that connects to a joint at only
one end leaving the other end free;
(c) “leafeleaf” (LeL) path that stands for an isolated fiber.
These paths combine to strengthen the mechanical and
physical properties of the PCFSF with different fiber length
and orientation. Compared with the sintered powders, the
sintered fiber felts are able to produce a large range of pore
diameters and porosities. Such an irregular fiber layout can be
treated as a fractal profile which benefits a deep under-
standing of the internal heat and mass transfer mechanisms
in porous medium [38e41]. It is also noticed that the edges of
copper fibers havemany coarse antler-like burrs revealing the
cutting trace during themulti-toothmachining process. These
microstructures increase both the specific surface area of the
internal pores and the surface roughness, which have great
influence on the surface free energy, capillary intrusion,
wetting behavior and so on. In addition, the number of joints
determines the effective contact between copper fibers. It is
also an important parameter that improves the electrical
conductivity by constructing a conductive skeleton. In a word,
the morphology of the PCFSF is closely related to the func-
tional characteristics and practical applications.
3.3. Wettability characterization of the PCFSF
Thewettabilityof thePCFSF is considered tobeakeyparameter
when it isusedas theflowfieldandGDLmaterial,whichgreatly
ral schematic of the PCFSF.
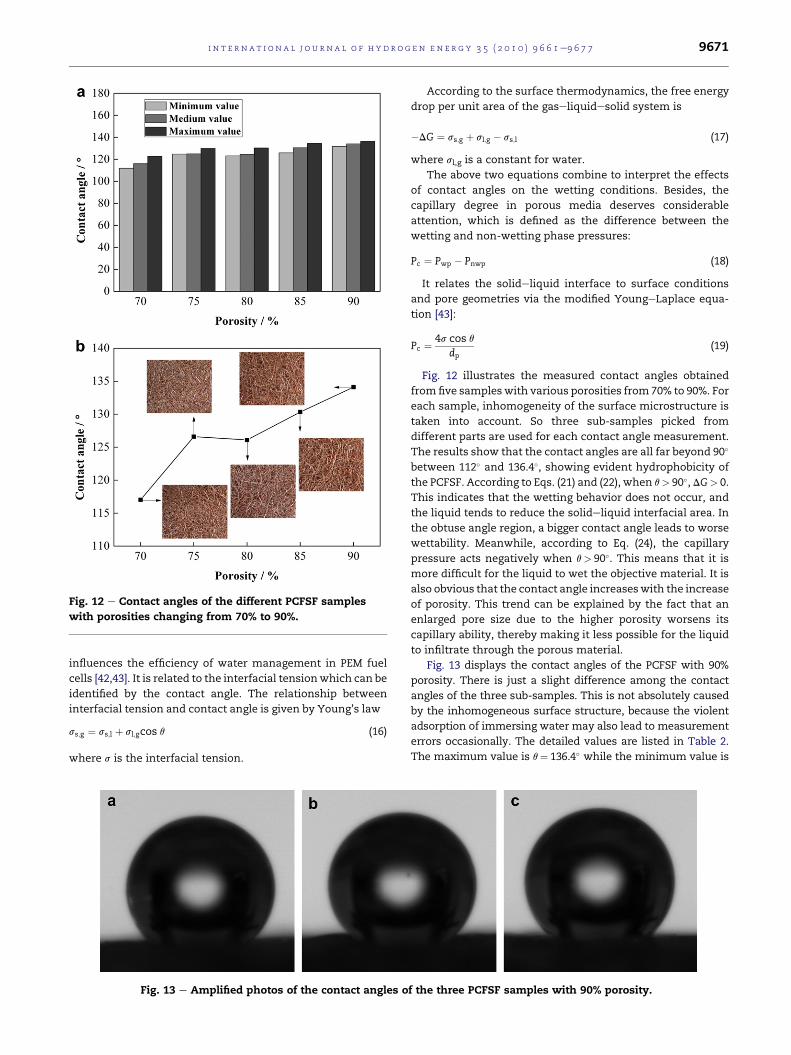
Fig. 12 e Contact angles of the different PCFSF samples
with porosities changing from 70% to 90%.
i n t e r n a t i o n a l j o u r n a l o f h y d r o g e n en e r g y 3 5 ( 2 0 1 0 ) 9 6 6 1e9 6 7 7 9671
influences the efficiency of water management in PEM fuel
cells [42,43]. It is related to the interfacial tensionwhich can be
identified by the contact angle. The relationship between
interfacial tension and contact angle is given by Young’s law
ss;g ¼ ss;l þ sl;gcos q (16)
where s is the interfacial tension.
Fig. 13 e Amplified photos of the contact angles o
According to the surface thermodynamics, the free energy
drop per unit area of the gaseliquidesolid system is
�DG ¼ ss;g þ sl;g � ss;l (17)
where sl,g is a constant for water.
The above two equations combine to interpret the effects
of contact angles on the wetting conditions. Besides, the
capillary degree in porous media deserves considerable
attention, which is defined as the difference between the
wetting and non-wetting phase pressures:
Pc ¼ Pwp � Pnwp (18)
It relates the solideliquid interface to surface conditions
and pore geometries via the modified YoungeLaplace equa-
tion [43]:
Pc ¼ 4s cos qdp
(19)
Fig. 12 illustrates the measured contact angles obtained
fromfive sampleswith various porosities from 70% to 90%. For
each sample, inhomogeneity of the surface microstructure is
taken into account. So three sub-samples picked from
different parts are used for each contact angle measurement.
The results show that the contact angles are all far beyond 90�
between 112� and 136.4�, showing evident hydrophobicity of
the PCFSF. According to Eqs. (21) and (22), when q> 90�, DG> 0.
This indicates that the wetting behavior does not occur, and
the liquid tends to reduce the solideliquid interfacial area. In
the obtuse angle region, a bigger contact angle leads to worse
wettability. Meanwhile, according to Eq. (24), the capillary
pressure acts negatively when q> 90�. This means that it is
more difficult for the liquid to wet the objective material. It is
also obvious that the contact angle increaseswith the increase
of porosity. This trend can be explained by the fact that an
enlarged pore size due to the higher porosity worsens its
capillary ability, thereby making it less possible for the liquid
to infiltrate through the porous material.
Fig. 13 displays the contact angles of the PCFSF with 90%
porosity. There is just a slight difference among the contact
angles of the three sub-samples. This is not absolutely caused
by the inhomogeneous surface structure, because the violent
adsorption of immersing water may also lead to measurement
errors occasionally. The detailed values are listed in Table 2.
The maximum value is q¼ 136.4� while the minimum value is
f the three PCFSF samples with 90% porosity.

Table 2 e The measurement results of the contact anglesof the three PCFSF samples with 90% porosity.
Code Contact angle (�)
Sample a 131.8
Sample b 136.4
Sample c 134.1
i n t e rn a t i o n a l j o u r n a l o f h y d r o g e n en e r g y 3 5 ( 2 0 1 0 ) 9 6 6 1e9 6 7 79672
q¼ 131.8�. The water droplet shows a spherical profile indi-
cating that the PCFSF is hydrophobicwith lower surface energy.
The merits of this special property lie in following two points.
On the one hand, lower surface energy of the PCFSF helps to
prevent the electrodes from dehydration through effective
control of the water transfer and removal rates, especially
when such a small-scale PEM fuel cell operates without
external humidification. For most of the time, the fuel cell runs
at a medium current density so that it does not produce too
much byproduct water. Thus, the hydrophobic PCFSF contrib-
utes to water conservation in the electrodes and membranes.
On the other hand, even if the fuel cell operates under a high
current load, the PCFSF with hydrophobic characteristics is
helpful to remove accumulated water [44,45]. Thus, it helps
protect the porous flow field from being blocked by residual
water so that the gas flow is able to successfully reach the
catalyst layer. These two advantages together improve the
water and gas management in PEM fuel cells. Additionally, in
view of the practical design and cost control, the auxiliary
system could be simplified without the complex humidifying
equipments. Most importantly, the fabrication method used in
this study can easily realize an effective control of the material
wettability by regulating the porosity instead of the traditional
process of water-proof treatment. For example, the GDLs are
conventionally made hydrophobic using PTFE that increases
the weight by 5e30% and also reduces the electronic and
thermal conductivities. Therefore, the PCFSF shows potential
feasibility to be used in PEM fuel cells due to its advantages in
both functional performance and control flexibility.
3.4. Application of the PCFSF as porous flow field in PEMfuel cells
3.4.1. Corrosion resistance of the PCFSF in simulated PEMfuel cell environmentSince the present work focuses on the feasibility of the PCFSF
to be used as the flow field in PEM fuel cells, the corrosion
problemsmust be investigated in order to explore an effective
way to protect the material being corroded. During the
corrosion test, the dissolution of the copper sample is
observed. The overall reaction can be formulated by following
equations:
CuþO2þ 2Hþ¼Cu2þþH2O (20)
Since Cu is nobler than Hþ in the electromotive series,
a cathodic reaction other than displacement of Hþ accounts
for metal dissolution in terms of O2 reduction [46]:
O2þ 4Hþþ 4e�¼ 2H2O (21)
In fact, the detailed reaction process can be divided into
following three steps (Eqs. (27)e(29)). They together affect the
current variation by changing the concentrations of Hþ and
O2. At the beginning of the dissolution on the anode side, the
reaction is mainly controlled by:
Cu¼Cu2þþ 2e� (22)
Subsequently, the dissolution is controlled by the following
equation [46]:
4CuþþO2þ 4Hþ¼ 4Cu2þþ 2H2O (23)
Thus, the concentration of Cu2þ increases and the current
density climbs up due to the auto-catalytic reaction given
below [46]:
CuþCu2þ¼ 2Cuþ (24)
Fig. 14 shows the polarization curves of the copper samples
in simulated anodic environment of PEM fuel cells. It is
observed that there is no activationepassivation turning
point, which means the material gets corroded continuously
without any passive film formed on the sample surface.
Compared with the coppereberyllium alloy C-17200 reported
in Ref. [12], the polarization curves of the PCFSF have the
similar shape to C-17200. However, the current density of the
PCFSF in simulated PEM fuel cell solution with 0.05 M H2SO4 is
much higher than the copper alloy, because the PCFSF is
mainly made of pure copper without any coating or alloying
treatment. The copper is directly exposed to the sulfuric acid
and easily dissolved during the anodic reaction. Fig. 15 shows
the cathodic behaviors of the copper samples in simulated
oxidizing environment of PEM fuel cells. It is also noticed that
the material does not experience an obvious activeepassive
transition. However, compared with the anodic behavior, the
cathodic polarization curves have two distinct features. On
the one hand, there exists serious vibration of the current
density in the negative low-potential regions. This can be
explained by the violent reaction on the surface of pure copper
especially when the solution is bubbled with air/oxygen. The
oxide film forms and dissolves repeatedly, showing an
unstable feature of the current density. Another possible
reason may be the presence of porosity in the corrosion
products as claimed in Ref. [12]. On the other hand, the current
density experiences a sudden jump in the positive high-
potential regions. Different from the anodic manner, the
current density here takes two steps to reach the level of
around 10�1 A cm�2. This pronounced phenomenon is due to
the release of slow passivation after a gradual linear rise of
current density. During the reaction process in an oxidizing
environment, more and more oxygen-rich regions near the
electrode emerge so that the kinetic behaviors are quite
different from the non-oxidizing activity. In single-cell tests
(see Section 3.4.3), the cell performance is not inhibited seri-
ously by the corrosion effects because the PCFSF does not
directly touch the membrane and catalyst layer, and the
testing period does not last very long. Another possible reason
may be the room-temperature operation that keeps the
corrosion rate at a lower level, alleviating the influence of

Fig. 16 e Curves of total electrical resistances vs.
compaction force for the situations (a), (b) and (e)
mentioned in Section 2.6. The inset shows the detailed
resistance when the compaction force is between 1.2 and
1.8 MPa.
Fig. 14 e Anodic behavior of the PCFSF in simulated PEM
fuel cell environment at 65 �C purged with hydrogen. The
anode operating potential is marked.
i n t e r n a t i o n a l j o u r n a l o f h y d r o g e n en e r g y 3 5 ( 2 0 1 0 ) 9 6 6 1e9 6 7 7 9673
corrosion behavior. However, in view of long-term operation,
the copper corrosion is inevitable without stable passivation
regions formed in whatever the anodic and cathodic envi-
ronments. Therefore, it is necessary to take measures to
develop corrosion-resistant methods when the PCFSF is used
in real environment of PEM fuel cells.
3.4.2. Electrical resistance of bipolar plate materials in PEMfuel cellsThe curves of the total electrical resistance (Rt) vs. compaction
force (Fc) under different assembly conditions are illustrated in
Figs. 16 and 17. It is evident that during the initial stage, the
total resistance drops sharply with a slow increase of
compaction force. When Fc is around 0.5 MPa, Rt decreases
more slowly than before. When Fc rises to 1.5 MPa, Rt gradually
approaches a horizontal line at a relatively steady value. This
dynamic trend can be explained by the variation of interfacial
contact area among the tested components. The change of
Fig. 15 e Cathodic behavior of the PCFSF in simulated PEM
fuel cell environment at 65 �C purged with air. The cathode
operating potential is marked.
body resistance due to slight deformation is not considered. At
the beginning, the compaction force is unavailable so that the
components touch each other naturally with very small
contact area. Subsequently, the compaction force continuously
increases, the contact area gets enhanced, forming more and
more conductive paths. When the force is big enough to make
the components contact each other completely, the contact
area arrives at a maximum value so that the total resistance
will not increase further. Thus, the value of Rt actually reveals
the involved contact resistances in the experiments.
As mentioned above, the values of Rt-a and Rt-b can
approximately represent the values of Rt-a0 and Rt-b
0, which are
more significant in this study. It can be judged fromFig. 16 that
the order of the three quantities is Rt-a< Rt-e< Rt-b. Meanwhile,
the inset plot in Fig. 16 magnifies the details of total electrical
Fig. 17 e Curves of total electrical resistance vs. compaction
force for the situations (c) and (d) mentioned in Section 2.6.
The inset shows the detailed resistance when the
compaction force is between 1.2 and 1.8 MPa.

i n t e rn a t i o n a l j o u r n a l o f h y d r o g e n en e r g y 3 5 ( 2 0 1 0 ) 9 6 6 1e9 6 7 79674
resistances when the compaction force is around 1.5 MPa. It is
obvious that even during the steady stage, Rt-a keeps about
10 mU lower than Rt-b. This result illuminates the fact that the
CBP with the PCFSF does not bring forth more resistance than
traditional graphite bipolar plate. On the contrary, it is able to
reduce both the body resistance and interfacial contact resis-
tance efficiently so as to improve the performance of PEM fuel
cells. Furthermore, by comparison between Rt-a and Rt-e, it can
be seen that the PCFSF flow field is not a barrier for current
collection because the effective contacts among fibers can
Fig. 18 e Comparison of the polarization curves between
the PCFSF fuel cell and the traditional graphite fuel cell.
Fig. 19 e Effects of the anode operating pressure and
cathode flow rate on the performance of PEM fuel cell with
the PCFSF flow field.
guarantee a higher electrical conductivity. In addition, Fig. 17
suggests that the CBP also exhibits better electrical perfor-
mance than graphite when it is connected with the current
collector. Furthermore, it can be inferred that the electrical
resistance is supposed to decrease to amuch lower level when
we use the SS316L support plate itself for current collection
instead of the copper current collector.
3.4.3. Polarization behavior of the PEM fuel cell with thePCFSF flow fieldThe performance of PEM fuel cells can be evaluated by using
polarization curves including the current vs. voltage (IeV) and
current vs. power (IeP) curves. Fig. 18 illustrates the polariza-
tion curves of the laboratory-scale single cell under both inac-
tivated and activated conditions, respectively. The range of
current density is typically chosen from 100 to 700 mAcm�2.
This region accounts for the ohmic losses, showing a linear
drop of potentials. The effects of the bipolar plate with the
PCFSF flow filed on cell performance are compared with
a traditional graphite fuel cell. It is evident that the cell
performance after activation is much higher than the inacti-
vated one. Before activation (see Fig. 18(a)), the maximum
power densities of FC1 and FC2 are 102.2 mWcm�2 and
208.6 mWcm�2, respectively. After activation, the maximum

i n t e r n a t i o n a l j o u r n a l o f h y d r o g e n en e r g y 3 5 ( 2 0 1 0 ) 9 6 6 1e9 6 7 7 9675
power densities of FC1 and FC2 increase to 434 mWcm�2 and
429.8 mWcm�2, respectively (see Fig. 18(c)). This prominent
rejuvenation of the cell performance can be explained by the
complex evolving process of water and gas transfer as well as
the electron and proton transport. At the beginning of the
electrochemical reaction, the polymer electrolyte membrane is
not well hydrated for lack of enough water, especially at lower
current densities. It is known that in a PEM fuel cell, the water
molecules are driven in following three ways: the electro-
osmotic drag from the anode to the cathode due to potential
difference, the back diffusion from the anode to the cathode
due to concentration gradient and the pressure differences
between the cathode and anode. The activation process
accelerates these activities and finally reaches a water balance
in the PEM fuel cell. Meanwhile, at the three-phase interface of
the electrodes, the activation process improves mass transfer
by generating more channels for gas diffusion. In addition, the
activation process particularly benefits formation of the
transport networks for electrons and protons in the MEA so
that the ohmic losses can be reduced. The cell voltages in Fig. 18
(b) and (c) decrease more slowly than Fig. 18(a) with the
increase of the current density. This indicates that the activa-
tion process indeed promotes reduction of the ohmic losses.
Fig. 18 also compares the cell performance between FC1 and
FC2. Before activation, the traditional FC2 shows a higher
performance than FC1 with a porous flow field made of the
PCFSF. Comparedwith themachined serpentine channels, the
PCFSF seems less able to deliver the reactants to GDLs and CLs
at the beginning of the testing operation, because it takesmore
time to feed enough gases to the three-phase reaction area due
to a lower diffusion rate. However, this is only a temporary
phenomenon. With the reaction going on, the diffusion
networks in GDLs and CLs gradually build up so that the fuel
cell output can keeps at a relatively higher level. Thus, the
polarization curve of FC1 draws close to FC2, as shown in Fig. 18
(b). Subsequently, the power output of FC1 continues to
improve and eventually reaches a maximum value of
434 mWcm�2 while FC2 still keeps at a relatively stable level as
before (see Fig. 18(c)). This can be interpreted by the enhanced
mass transfer in the porous flow field. The PCFSF with a lower
permeability tends to cause forced convection by which the
reactant gas can easily arrive at the electrode-membrane
reaction interface. This mechanism facilitates efficient utili-
zation of the reactants and improves the performance of PEM
fuel cells. This result agrees well with that presented by other
research groups [19,20,22]. From Eqs. (6) and (7), it can be seen
that the permeability of the porous material is determined by
porosity and pore geometry (i.e. average pore diameter). In this
study, the permeability of 90% PCFSF is calculated to be
2.1� 10�9 m2 which is quite smaller than themagnitude order
of 10�8. Therefore, it canbepredicted that FC1 is able toproduce
anevenhigherperformanceby furtheroptimizationof theflow
fieldpermeability, although thefinal output of FC1 is just a little
higher than FC2. However, as for the traditionalmachined flow
field, a decrease of permeability cannot be easily achieved by
minimizing the feature size on account of processing limita-
tion. This test proves that the PCFSF flow field yields better
performances in mass transfer than the traditional grooved
channels. This is consistent with the conclusion made by
Kumar and Reddy [20].
Fig. 19 shows the effects of anode operating pressure and
cathode flow rate on the performance of PEM fuel cells with
the PCFSF flow field. It is shown in Fig. 19(a) that the PCFSF fuel
cell is insensitive to the change of anode operating pressure,
because there is almost no difference between the two cases
when P1¼ 0.04 MPa and P2¼ 0.12 MPa. Theoretically speaking,
an increase of operating pressure results in the improvement
of cell performance because themass transport resistance can
be reduced. However, the PCFSF flow field with a lower
permeability here contributes to an increase of pressure drop
that forces the gas to diffuse from the flow field to the reaction
area. Thus, it can be inferred that the porous structure itself
may play a more important role in gas distribution and
diffusion than the high-pressure operation. Moreover, the
tested fuel cell is not fed with humidified gas. Under this
condition, the high-pressure operation at the anode may dry
out the membrane due to a pressure gradient. This may
depress the cell performance to a great extent. Therefore, the
negative water transfer from the anode to the cathode side
may offset the contribution of high-pressure operation to the
electrode kinetics. The result shows that it is possible to
operate the fuel cell at a lower pressure when the PCFSF is
used. Therefore, the PCFSF has great advantages in system
efficiency and running cost for the engineering practice.
Fig. 19(b) reveals the effects of air flow rate on the perfor-
mance of PEM fuel cells with the PCFSF flow field. On the one
hand, a higher air flow rate leads to a higher oxygen concen-
tration so as to elevate the reaction rate. On the other hand,
a higher air flow rate helps to remove excessive water which
may cause flooding at the cathode. These two factors combine
to improve the cell performance efficiently. However, in this
study, it isworthemphasizing that theair humidification isnot
applied so that the latter mechanism may result in a higher
water removal rate and gradually dry out the membrane. As
shown in Fig. 19(b), a lower air flowrate (V1¼ 0.3 L/min) ismore
beneficial to the PEM fuel cell performance especially at high
current densities. This result may be attributed to the hydro-
phobicity of the PCFSF. Asmentioned in Section 3.3, the PCFSF
is hydrophobic so that the water cannot freely accumulate at
the cathode. Therefore a lower air flow rate facilitates not only
the utilization of oxygen but also themaintenance of adequate
water. Based on this test, it can be concluded that the PCFSF is
competent to be used as a porous flow field in PEM fuel cells
with the air fed at a lower flow rate.
4. Conclusions
A comprehensive study on a novel porous flow field made of
the PCFSF is conducted in order to investigate the feasibility
for this material to be used in the special environment in PEM
fuel cells. A series of experiments were systematically carried
out, which covered the PCFSF fabrication, the structural and
functional characterization, and the application in PEM fuel
cells. The copper fibers can be obtained directly by using
a self-designedmulti-tooth cutter. A lower cutting speed helps
prevent the fibers from formation failure and morphological
defects. A lower feed rate and a smaller back-cutting depth
both reduce the equivalent diameter of the fibers. The

i n t e rn a t i o n a l j o u r n a l o f h y d r o g e n en e r g y 3 5 ( 2 0 1 0 ) 9 6 6 1e9 6 7 79676
sintering temperature, time and pressure have great effects
on the formation of fiber-to-fiber joints in the PCFSF.
It is found that the PCFSF is hydrophobic and the contact
angle increases with the increase of porosity. This property
benefitswaterandgasmanagement inPEMfuel cells especially
when the reactant gases are not humidified. Meanwhile, it is
proved that the PCFSF without any coating or alloying treat-
ment is not quite competent in corrosion resistance. In view of
long-term operation, the work regarding this critical issue is
now under progress and will be reported deeply in future
papers. It is also demonstrated that the electrical resistance of
the CBP decreases, when compared with the graphite plate.
The polarization tests demonstrate that the performance of
the fuel cellwith thePCFSFflowfiled is comparablewith that of
the graphite-plate fuel cell. The output of the PCFSF fuel cell is
expected to get further improved if the permeability of the
material is better optimized and the corrosion problem is
successfully resolved. In addition, the PCFSF flow field can be
used at lower anodic pressures and cathodic flow rates. This
facilitates both efficiency enhancement and cost reduction of
the fuel cell system. To sum up, the PCFSF is proved to be
a promising material used as the flow field in PEM fuel cells,
which further ignites the feasibility of using the porous flow
field instead of the traditional machined channels.
Acknowledgment
The research was supported by the National Natural Science
Foundation of China (NSFC), projects No. 50930005 and
50805052, the Natural Science Foundation of Guangdong
Province, project No. 07118064. The authors also would like to
acknowledge the Joint-training Program (No. 2009615064)
sponsored by China Scholarship Council and the Doctorate
Dissertation Innovation Funds supported by South China
University of Technology. In addition, the constructive
suggestions by professor Jun Wang in The University of New
South Wales are also gratefully appreciated.
r e f e r e n c e s
[1] Corbo P, Migliardini F, Veneri O. Performance investigation of2.4 kW PEM fuel cell stack in vehicles. Int J Hydrogen Energy2007;32(17):4340e9.
[2] Tuber K, Zobel M, Schmidt H, Hebling C. A polymerelectrolyte membrane fuel cell system for powering portablecomputers. J Power Sources 2003;122(1):1e8.
[3] Uzunoglu M, Onar O, El-Sharkh MY, Sisworahardjo NS,Rahman A, Alam MS. Parallel operation characteristics ofPEM fuel cell and microturbine power plants. J Power Sources2007;168(2):469e76.
[4] TsuchiyaH, Kobayashi O.Mass production cost of PEM fuel cellby learning curve. Int J Hydrogen Energy 2004;29(10):985e90.
[5] Tawfik H, Hung Y, Mahajan D. Metal bipolar plates for PEMfuel cell e a review. J Power Sources 2007;163(2):755e67.
[6] Joseph S, McClure JC, Sebastian PJ, Moreira J, Valenzuela E.Polyaniline and polypyrrole coatings on aluminum for PEMfuel cell bipolar plates. J Power Sources 2008;177(1):161e6.
[7] Barranco J, Barreras F, Lozano A, Lopez AM, Roda V, Martin J,et al. Cr and Zr/Cr nitride CAE-PVD coated aluminum bipolar
plates for polymer electrolyte membrane fuel cells. Int JHydrogen Energy; in press, doi:10.1016/j.ijhydene.2010.05.050.
[8] Wang SH, Peng J, Lui WB. Surface modification anddevelopment of titanium bipolar plates for PEM fuel cells.J Power Sources 2006;160(1):485e9.
[9] Park YC, Lee SH, Kim SK, Lim S, Jung DH, Lee DY, et al.Performance and long-term stability of Ti metal andstainless steels as a metal bipolar plate for a direct methanolfuel cell. Int J Hydrogen Energy 2010;35(9):4320e8.
[10] Nikam VV, Reddy RG. Corrugated bipolar sheets as fueldistributors in PEMFC. Int J Hydrogen Energy 2006;31(13):1863e73.
[11] Nikam VV, Reddy RG. Copper alloy bipolar plates for polymerelectrolyte membrane fuel cell. Electrochim Acta 2006;51(28):6338e45.
[12] Nikam VV, Reddy RG. Corrosion studies ofa coppereberyllium alloy in a simulated polymer electrolytemembrane fuel cell environment. J Power Sources 2005;152:146e55.
[13] Lee HY, Lee SH, Kim JH, Kim MC, Wee DM. Thermallynitrided Cue5.3Cr alloy for application as metallic separatorsin PEMFCs. Int J Hydrogen Energy 2008;33(15):4171e7.
[14] Hsieh SS, Huang CF, Feng CL. A novel design and micro-fabrication for copper (Cu) electroforming bipolar plates.Micron 2008;39(3):263e8.
[15] Makkus RC, Janssen AHH, de Bruijn FA, Mallant RKAM. Useof stainless steel for cost competitive bipolar plates in theSPFC. J Power Sources 2000;86(1e2):274e82.
[16] Wang HL, Sweikart MA, Turner JA. Stainless steel as bipolarplate material for polymer electrolyte membrane fuel cells.J Power Sources 2003;115(1e2):243e51.
[17] Antunes RA, Oliveira MCL, Ett G, Ett V. Corrosion of metalbipolar plates for PEM fuel cells: a review. Int J HydrogenEnergy 2010;35(8):3632e47.
[18] Banhart J. Manufacture, characterisation and application ofcellular metals and metal foams. Prog Mater Sci 2001;46(6):559e632.
[19] Hontanon E, Escudero MJ, Bautista C, Garcıa-Ybarra PL,Daza L. Optimisation of flow-field in polymer electrolytemembrane fuel cells using computational fluid dynamicstechniques. J Power Sources 2000;86(1e2):363e8.
[20] Kumar A, Reddy RG. Modeling of polymer electrolytemembrane fuel cell with metal foam in the flow-field of thebipolar/end plates. J Power Sources 2003;114(1):54e62.
[21] Murphy OJ, Cisar A, Clarke E. Low-cost light weight highpower density PEM fuel cell stack. Electrochim Acta 1998;43(24):3829e40.
[22] Kumar A, Reddy RG. Materials and design development forbipolar/end plates in fuel cells. J Power Sources 2004;129(1):62e7.
[23] Hottinen T, Mikkola M, Mennola T, Lund P. Titanium sinteras gas diffusion backing in PEMFC. J Power Sources 2003;118(1e2):183e8.
[24] Zhang FY, Advani SG, Prasad AK. Performance of a metallicgas diffusion layer for PEM fuel cells. J Power Sources 2008;176(1):293e8.
[25] Liu JG, Sun GQ, Zhao FL,Wang GX, Zhao G, Chen LK, et al. Studyofsinteredstainlesssteelfiber feltasgasdiffusionbackinginair-breathing DMFC. J Power Sources 2004;133(2):175e80.
[26] Chen R, Zhao TS. Porous current collectors for passive directmethanol fuel cells. Electrochim Acta 2007;52(13):4317e24.
[27] Arisetty S, Prasad AK, Advani SG. Metal foams as flow fieldand gas diffusion layer in direct methanol fuel cells. J PowerSources 2007;165(1):49e57.
[28] Shudo T, Suzuki K. Performance improvement in directmethanol fuel cells using a highly porous corrosion-resistingstainless steel flow field. Int J Hydrogen Energy 2008;33(11):2850e6.

i n t e r n a t i o n a l j o u r n a l o f h y d r o g e n en e r g y 3 5 ( 2 0 1 0 ) 9 6 6 1e9 6 7 7 9677
[29] Tang Y, Zhou W, Pan MQ, Chen HQ, Liu WY, Yu H. Porouscopper fiber sintered felts: an innovative catalyst support ofmethanol steam reformer for hydrogen production. Int JHydrogen Energy 2008;33(12):2950e6.
[30] ZhouW, Tang Y, Pan MQ,Wei XL, Xiang JH. Experimentalinvestigation on uniaxial tensile properties of high-porositymetal fiber sinteredsheet.MaterSci EngA2009;525(1e2):133e7.
[31] WangZ, Liao JC,HanXY. Study of thepore sizeof stainless steelfiber felt. Rare Metal Mater Eng 1997;26(4):49e52 [in Chinese].
[32] Owejana JP, Trabold TA, Jacobson DL, Arif M, Kandlikar SG.Effects of flow field and diffusion layer properties on wateraccumulation in a PEM fuel cell. Int J Hydrogen Energy 2007;32(17):4489e502.
[33] Park S, Popov BN. Effect of hydrophobicity and poregeometry in cathode GDL on PEM fuel cell performance.Electrochim Acta 2009;54(12):3473e9.
[34] Gostick JT, Fowler MW, Ioannidis MA, Pritzker MD,Volfkovich YM, Sakars A. Capillary pressure and hydrophilicporosity in gas diffusion layers for polymer electrolyte fuelcells. J Power Sources 2006;156(2):375e87.
[35] Gajewski A. Contact angle and sessile drop diameterhysteresis on metal surfaces. Int J Heat Mass Transfer 2008;51(19e20):4628e36.
[36] Kannan AM, Cindrella L, Munukutla L. Functionally gradednano-porous gas diffusion layer for proton exchangemembrane fuel cells under low relative humidity conditions.Electrochim Acta 2008;53(5):2416e22.
[37] Tan JC, Elliott JA, Clyne TW. Analysis of tomography images ofbondedfibrenetworkstomeasuredistributionsoffibresegmentlength and fibre orientation. Adv Eng Mater 2006;8(6):495e500.
[38] Shi Y, Xiao JS, Pan M, Yuan RZ. A fractal permeability modelfor the gas diffusion layer of PEM fuel cells. J Power Sources2006;160(1):277e83.
[39] Shi Y, Xiao JS, Quan SH, Pan M, Yuan RZ. Fractal model forprediction of effective thermal conductivity of gas diffusionlayer in proton exchange membrane fuel cell. J PowerSources 2008;185(1):241e7.
[40] He GL, Zhao ZC, Ming PW, Abuliti A, Yin CY. A fractal modelfor predicting permeability and liquid water relativepermeability in the gas diffusion layer (GDL) of PEMFCs.J Power Sources 2007;163(2):846e52.
[41] Cheng X, Sastry AM, Layton BE. Transport in stochasticfibrous networks. J Eng Mater Technol 2001;123(1):12e9.
[42] Jiao K, Zhou B. Effects of electrode wettabilities on liquidwater behaviours in PEM fuel cell cathode. J Power Sources2008;175(1):106e19.
[43] Cheung P, Fairweather JD, Schwartz DT. Characterization ofinternal wetting in polymer electrolyte membrane gasdiffusion layers. J Power Sources 2009;187(2):487e92.
[44] Fu Y, Hou M, Lin GQ, Hou JB, Shao ZG, Yi BL. Coated 316Lstainless steel with CrxN film as bipolar plate for PEMFCprepared by pulsed bias arc ion plating. J Power Sources 2008;176(1):282e6.
[45] Fu Y, Lin GQ, Hou M, Wu B, Li HK, Hao LX, et al. OptimizedCrenitride film on 316L stainless steel as proton exchangemembrane fuel cell bipolar plate. Int J Hydrogen Energy 2008;34(1):453e8.
[46] El Din AMS, El Dahshan ME, El Din AMT. Dissolution ofcopper and copperenickel alloys in aerated dilute HClsolutions. Desalination 2000;130(1):89e97.