Pre-Feasibility Report For Onshore Oil and Gas Exploration ...
Upload
khangminh22Category
view
5download
0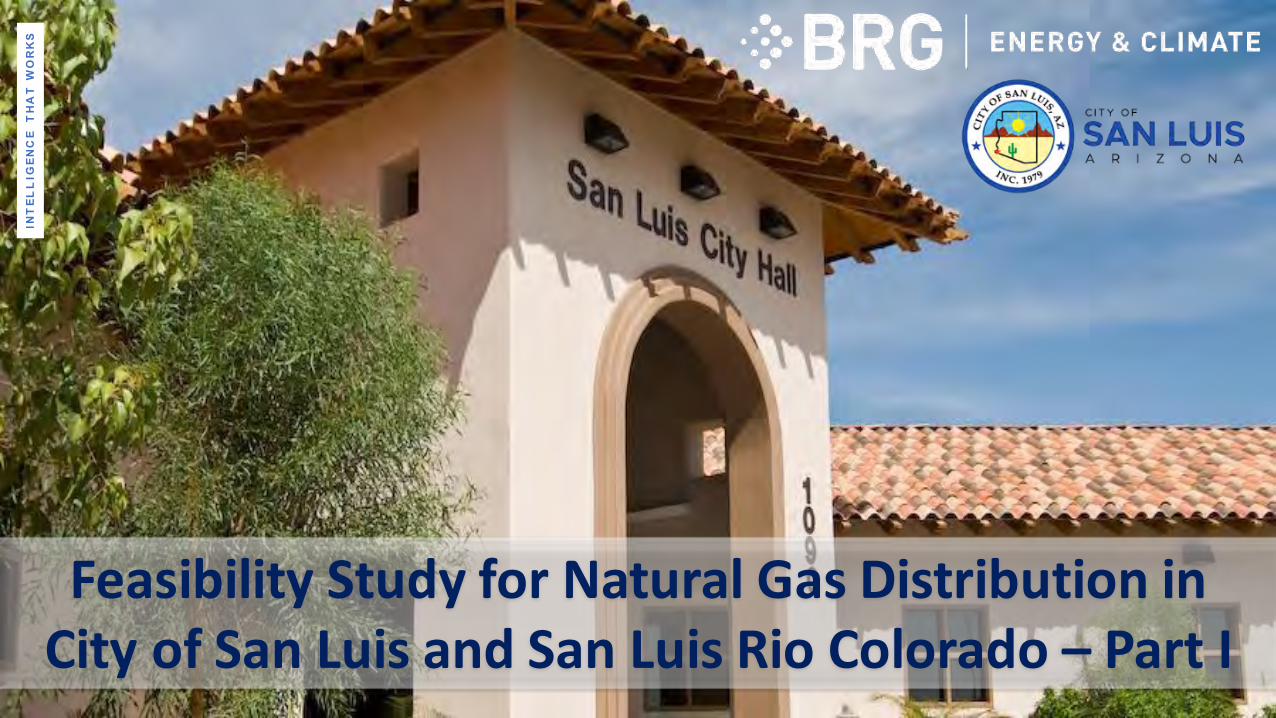
INT
EL
LIG
EN
CE
T
HA
T W
OR
KS
Feasibility Study for Natural Gas Distribution in City of San Luis and San Luis Rio Colorado – Part I
I NT EL L I GENC E T HA T W ORKS
Table of Contents
2
Executive Summary
Project Overview
Current Situation
Demand Estimation
Supply Analysis
Routing & Conceptual
Design
Supply Alternatives
Economic Feasibility
Regulatory Requirement Conclusion and Recommendation

I NT EL L I GENC E T HA T W ORKS
1 Executive Summary

I NT EL L I GENC E T HA T W ORKS
Executive Summary (1 of 3)
City and Economic Overview
4
City of San Luis has latent demand for natural gas that been untapped and this demand is expected to grow in future
The City of San Luis is located on the southwestern corner of Arizona, adjacent to the Colorado River and immediatelyadjacent to the international border between Mexico and the United States. It is one of the fastest growingcommunities in Yuma County.
Its proximity to Mexico and the maquiladora industry has been influential in this growth, which is expected to continue.
San Luis population is expected to grow to a population of 39,390 (according to the Arizona Office of EconomicOpportunity) by the year 2020. As economic conditions improve, additional residential, commercial and industrialdevelopment is expected.
Demand in San Luis is concentrated in two areas – San Luis City (mostly commercial, residentialand other demand) and Magrino Industrial Park (mostly industrial and some residential).
Total gas demand in San Luis is expected to reach 5,653,519 therms1 by 2038. Of this demand,Industrial sector is expected to have the largest share of nearly 70% and additional demand isexpected to come from growing industries. It is unlikely to achieve 100 percent market penetrationin the first year that natural gas is made available.
Gas Demand in San Luis, Arizona
1 1 Therm = 100,000 British Thermal Units (Btu)
I NT EL L I GENC E T HA T W ORKS
Executive Summary (2 of 3)
Gas supply in San Luis, Arizona
Gas Distribution Infrastructure Design
Based on the projected demand profile, city of San Luis would conservatively require nearly 2 miles of 6” pipeline, 5.5 miles of 3” pipelinesand nearly 23 miles of 1” residential service lines.
Total infrastructure cost for this investment is estimated at nearly $3.1 million (this excludes cost of building a CNG station necessary tosupply natural gas to transportation sector).
5
There is sufficient transmission pipeline capacity in the region, but gas distribution infrastructure yet to be developed
There are two transmission pipelines in the region – El Paso Natural Gas Pipeline and North Baja pipeline, whichcould be tapped for natural gas supply.
San Luis gas distribution comes under jurisdiction of Southwest Gas, a local distribution utility active in Arizona,Nevada and California. The utility has contracted supplies from the transmission pipeline with a design capacity ofover 1 million therms/day (which appears sufficient but additional discussions with SW gas is necessary).
City of San Luis lacks gas distribution infrastructure and expansion of existing grid would be required.
I NT EL L I GENC E T HA T W ORKS
Conclusion
Thus, based on expectation of the demand estimates and favorable economics, developmentof natural gas infrastructure is feasible.
Next steps
In order to pursue the developmentof infrastructure two steps must be followed in parallel.
1. Gathering commitment from the customers for use of natural gas for mid-to-long term, which will provide Southwest gas necessary incentiveto pursue the infrastructure development.
2. Start discussionwith Southwest gas on gas availability and developmentof system hydraulics, cost validation and development timeline.
Executive Summary (3 of 3)
6
Based on conservative demand estimates and infrastructure plan, gas distribution system development seems feasible
Based on estimated demand, estimated pipeline infrastructure costs, and existing tariffs on gas supply in Arizona published by Southwest gas,the expansion of existing gas distribution network appears to meet the target return requirement for the LDC.
Investment in a CNG station is proposed for the city to reduce the cost of running school busses, while reducing the carbon footprint.Incremental investment in buses are expected to be recouped within 5-6 years, whereas overall investment (along with CNG station) could berecouped within 10-12 years.
Comparing the commodity cost of alternative fuels, natural gas appears to be cheapest optionand is expected to be adopted widely if available.

I NT EL L I GENC E T HA T W ORKS
2 Project Overview
I NT EL L I GENC E T HA T W ORKS
Project Overview
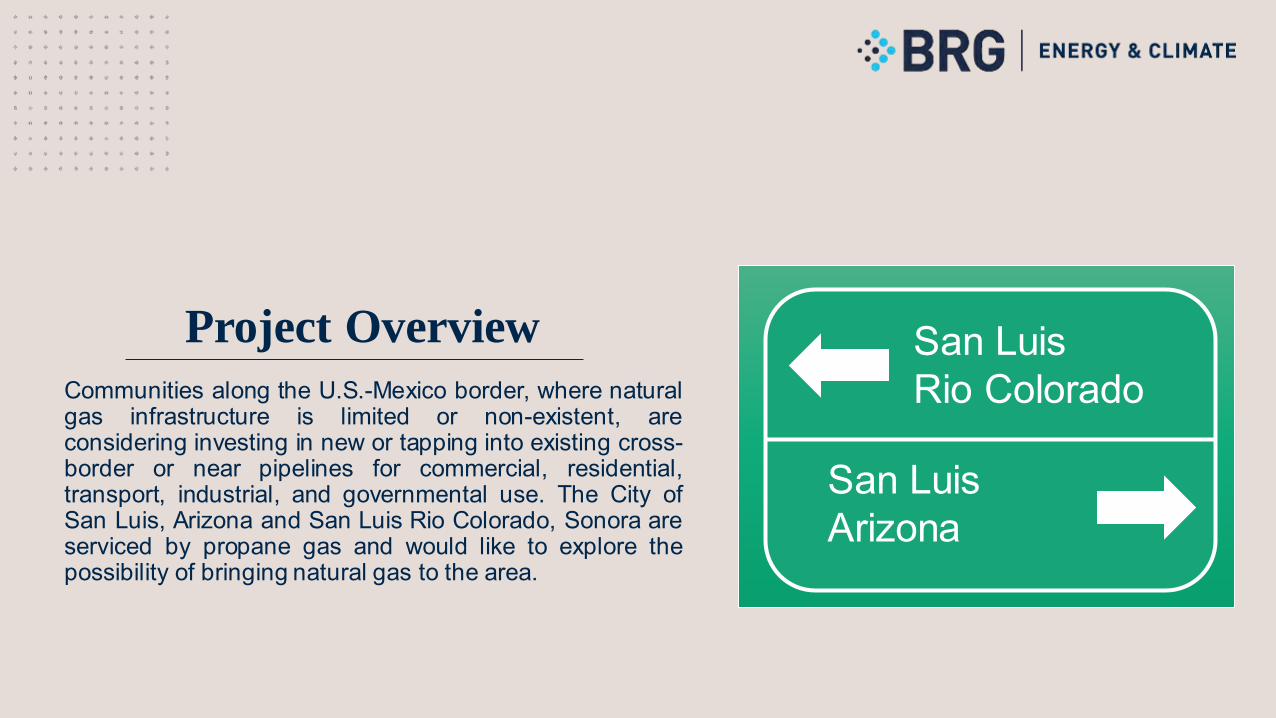
Communities along the U.S.-Mexico border, where naturalgas infrastructure is limited or non-existent, areconsidering investing in new or tapping into existing cross-border or near pipelines for commercial, residential,transport, industrial, and governmental use. The City ofSan Luis, Arizona and San Luis Rio Colorado, Sonora areserviced by propane gas and would like to explore thepossibility of bringing natural gas to the area.
San Luis Arizona
San Luis Rio Colorado
I NT EL L I GENC E T HA T W ORKS
Project Background
9
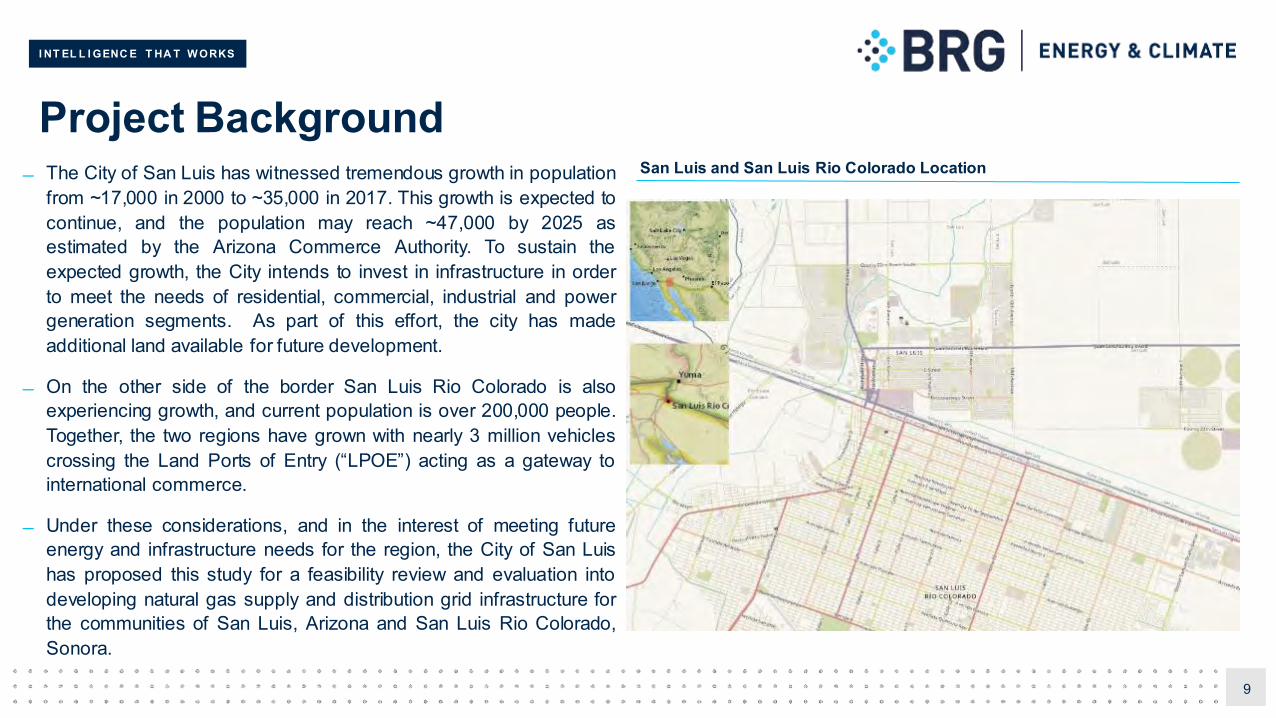
The City of San Luis has witnessed tremendous growth in populationfrom ~17,000 in 2000 to ~35,000 in 2017. This growth is expected tocontinue, and the population may reach ~47,000 by 2025 asestimated by the Arizona Commerce Authority. To sustain theexpected growth, the City intends to invest in infrastructure in orderto meet the needs of residential, commercial, industrial and powergeneration segments. As part of this effort, the city has madeadditional land available for future development.
On the other side of the border San Luis Rio Colorado is alsoexperiencing growth, and current population is over 200,000 people.Together, the two regions have grown with nearly 3 million vehiclescrossing the Land Ports of Entry (“LPOE”) acting as a gateway tointernational commerce.
Under these considerations, and in the interest of meeting futureenergy and infrastructure needs for the region, the City of San Luishas proposed this study for a feasibility review and evaluation intodeveloping natural gas supply and distribution grid infrastructure forthe communities of San Luis, Arizona and San Luis Rio Colorado,Sonora.
San Luis and San Luis Rio Colorado Location
I NT EL L I GENC E T HA T W ORKS
Project Objectives
10
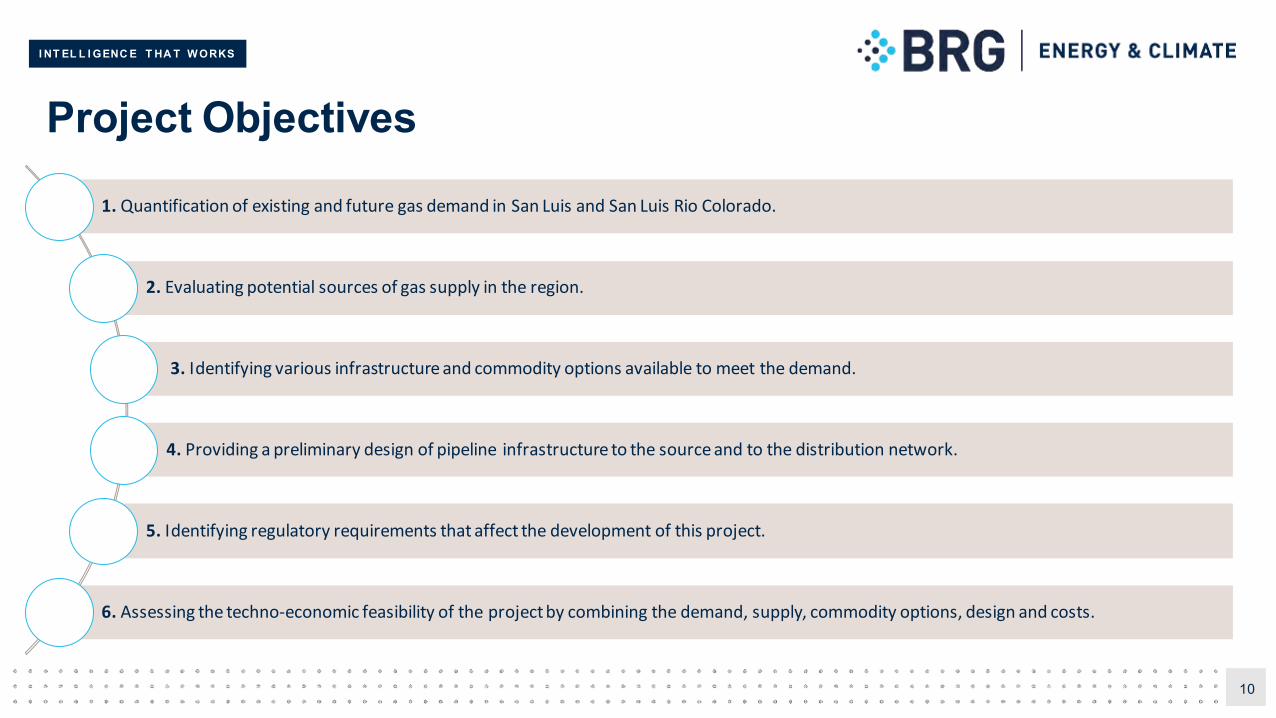
1. Quantification of existing and future gas demand in San Luis and San Luis Rio Colorado.
2. Evaluating potential sources of gas supply in the region.
3. Identifying various infrastructure and commodity options available to meet the demand.
4. Providing a preliminary design of pipeline infrastructure to the source and to the distribution network.
5. Identifying regulatory requirements that affect the development of this project.
6. Assessing the techno-economic feasibility of the project by combining the demand, supply, commodity options, design and costs.
I NT EL L I GENC E T HA T W ORKS
Report Organization
– Section 3
– Section 4
– Section 5
– Section 6
– Section 7
– Section 8
– Section 9
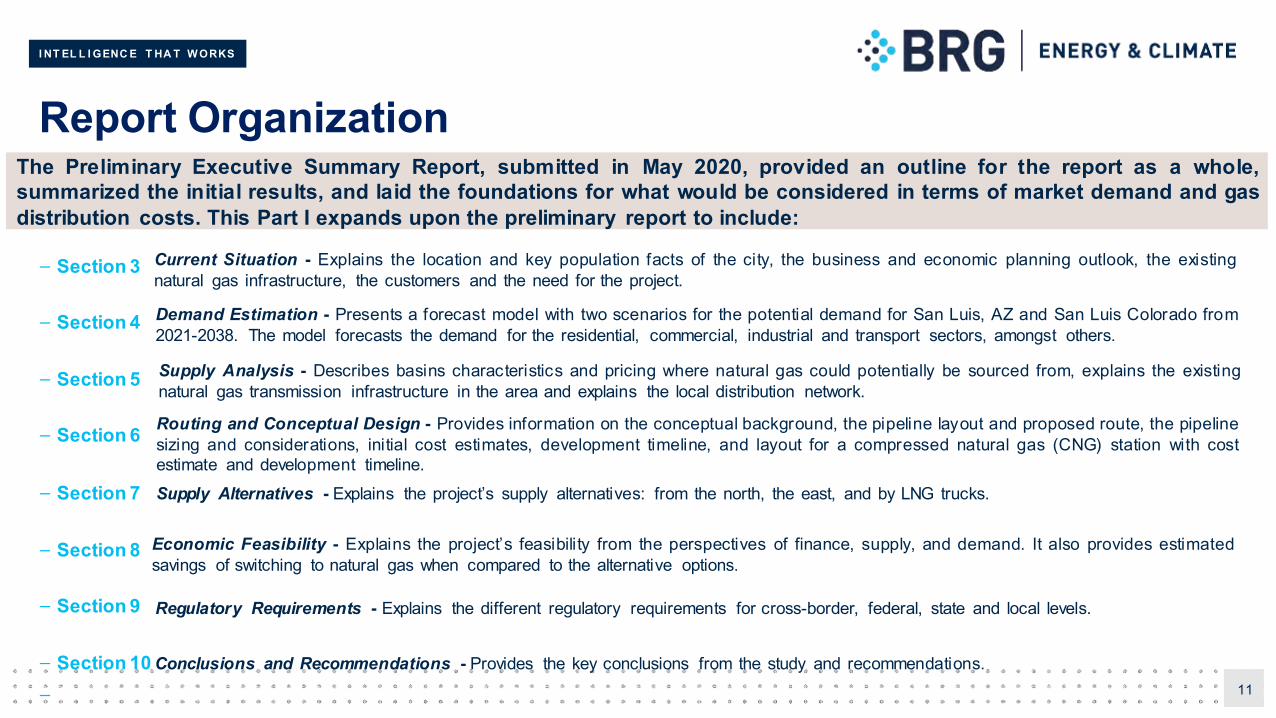
– Section 10 Conclusions and Recommendations - Provides the key conclusions from the study and recommendations.
– 11
Current Situation - Explains the location and key population facts of the city, the business and economic planning outlook, the existingnatural gas infrastructure, the customers and the need for the project.
Demand Estimation - Presents a forecast model with two scenarios for the potential demand for San Luis, AZ and San Luis Colorado from2021-2038. The model forecasts the demand for the residential, commercial, industrial and transport sectors, amongst others.
Supply Analysis - Describes basins characteristics and pricing where natural gas could potentially be sourced from, explains the existingnatural gas transmission infrastructure in the area and explains the local distribution network.
Routing and Conceptual Design - Provides information on the conceptual background, the pipeline layout and proposed route, the pipelinesizing and considerations, initial cost estimates, development timeline, and layout for a compressed natural gas (CNG) station with costestimate and development timeline.Supply Alternatives - Explains the project’s supply alternatives: from the north, the east, and by LNG trucks.
Economic Feasibility - Explains the project’s feasibility from the perspectives of finance, supply, and demand. It also provides estimatedsavings of switching to natural gas when compared to the alternative options.
Regulatory Requirements - Explains the different regulatory requirements for cross-border, federal, state and local levels.
The Preliminary Executive Summary Report, submitted in May 2020, provided an outline for the report as a whole,summarized the initial results, and laid the foundations for what would be considered in terms of market demand and gasdistribution costs. This Part I expands upon the preliminary report to include:

I NT EL L I GENC E T HA T W ORKS
3 Current Situation
I NT EL L I GENC E T HA T W ORKS
Overview (1 of 2)
13
Location and Key Facts
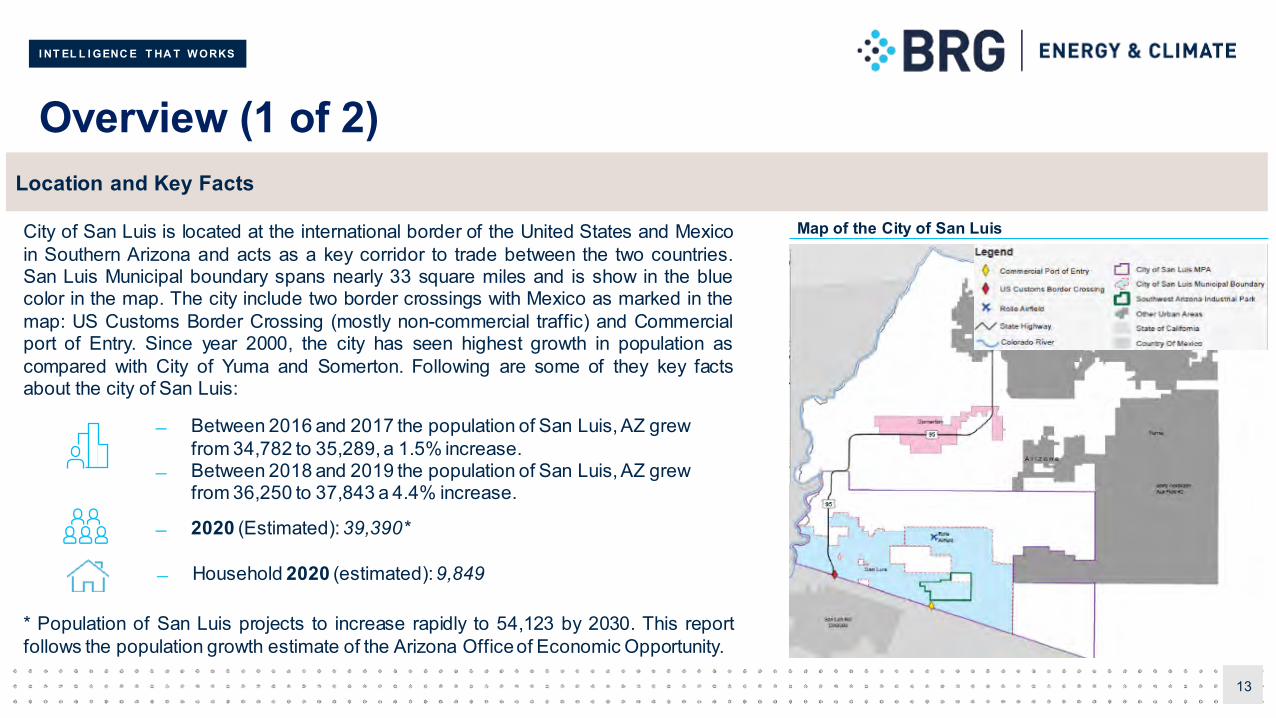
2020 (Estimated): 39,390*
Between 2016 and 2017 the population of San Luis, AZ grew from 34,782 to 35,289, a 1.5% increase.
Between 2018 and 2019 the population of San Luis, AZ grew from 36,250 to 37,843 a 4.4% increase.
Household 2020 (estimated): 9,849
City of San Luis is located at the international border of the United States and Mexicoin Southern Arizona and acts as a key corridor to trade between the two countries.San Luis Municipal boundary spans nearly 33 square miles and is show in the bluecolor in the map. The city include two border crossings with Mexico as marked in themap: US Customs Border Crossing (mostly non-commercial traffic) and Commercialport of Entry. Since year 2000, the city has seen highest growth in population ascompared with City of Yuma and Somerton. Following are some of they key factsabout the city of San Luis:
* Population of San Luis projects to increase rapidly to 54,123 by 2030. This reportfollows the population growth estimate of the Arizona Officeof Economic Opportunity.
Map of the City of San Luis
I NT EL L I GENC E T HA T W ORKS
Overview (2 of 2)
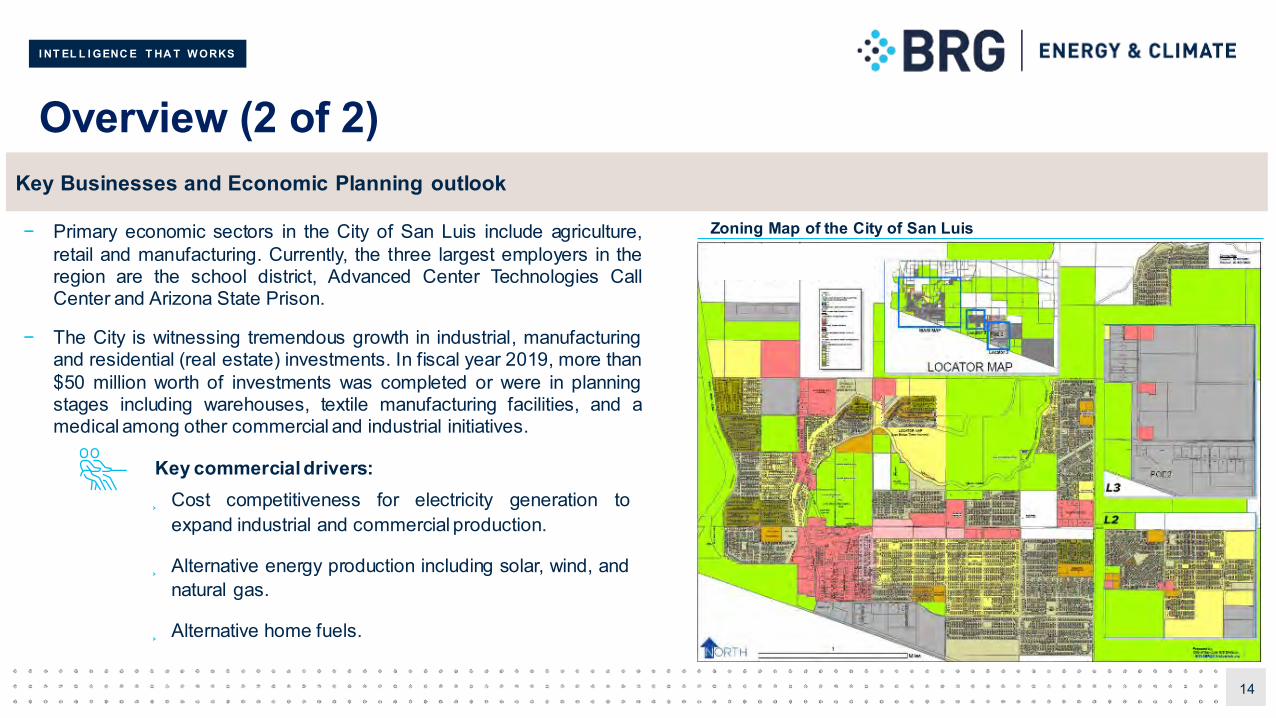
Cost competitiveness for electricity generation toexpand industrial and commercial production.
Alternative energy production including solar, wind, andnatural gas.
Alternative home fuels.
14
Key Businesses and Economic Planning outlook
Key commercial drivers:
− Primary economic sectors in the City of San Luis include agriculture,retail and manufacturing. Currently, the three largest employers in theregion are the school district, Advanced Center Technologies CallCenter and Arizona State Prison.
− The City is witnessing tremendous growth in industrial, manufacturingand residential (real estate) investments. In fiscal year 2019, more than$50 million worth of investments was completed or were in planningstages including warehouses, textile manufacturing facilities, and amedical among other commercial and industrial initiatives.
Zoning Map of the City of San Luis
I NT EL L I GENC E T HA T W ORKS
Existing Natural Gas Infrastructure
15
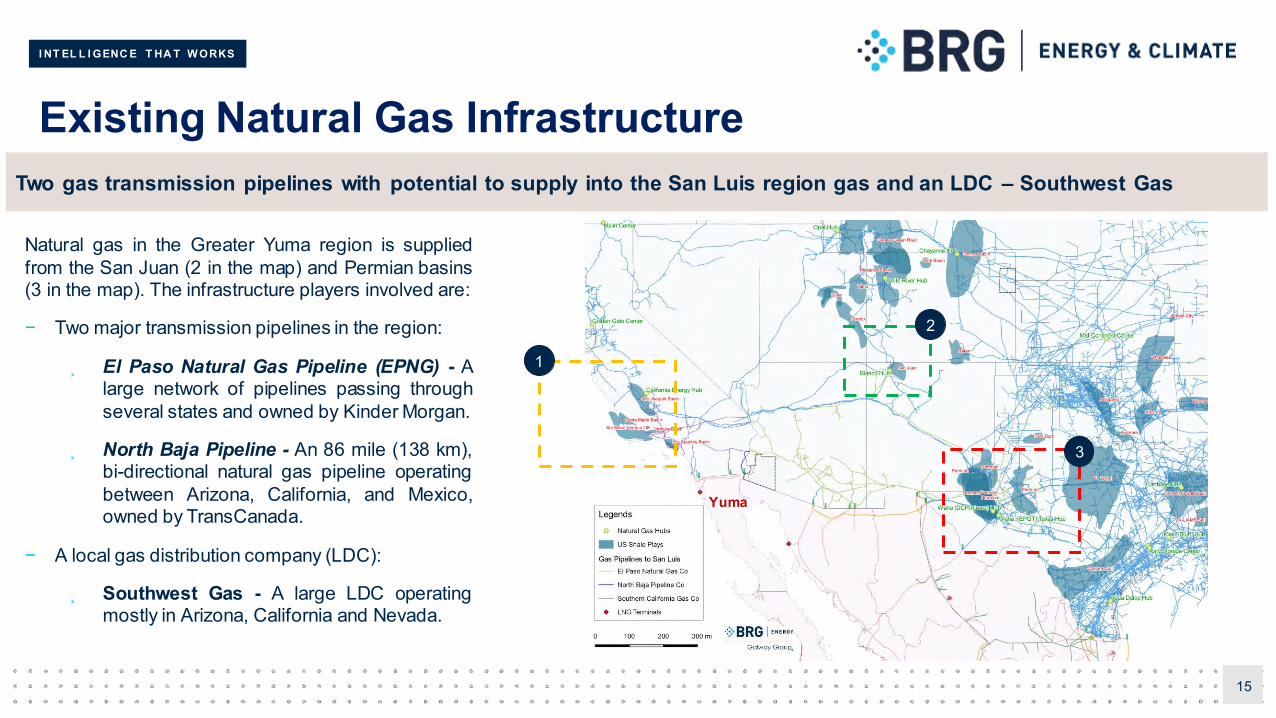
Natural gas in the Greater Yuma region is suppliedfrom the San Juan (2 in the map) and Permian basins(3 in the map). The infrastructure players involved are:
− Two major transmission pipelines in the region:
El Paso Natural Gas Pipeline (EPNG) - Alarge network of pipelines passing throughseveral states and owned by Kinder Morgan.
North Baja Pipeline - An 86 mile (138 km),bi-directional natural gas pipeline operatingbetween Arizona, California, and Mexico,owned by TransCanada.
− A local gas distribution company (LDC):
Southwest Gas - A large LDC operatingmostly in Arizona, California and Nevada.
Two gas transmission pipelines with potential to supply into the San Luis region gas and an LDC – Southwest Gas
Yuma
1
2
3
I NT EL L I GENC E T HA T W ORKS
Existing Customers Location
16
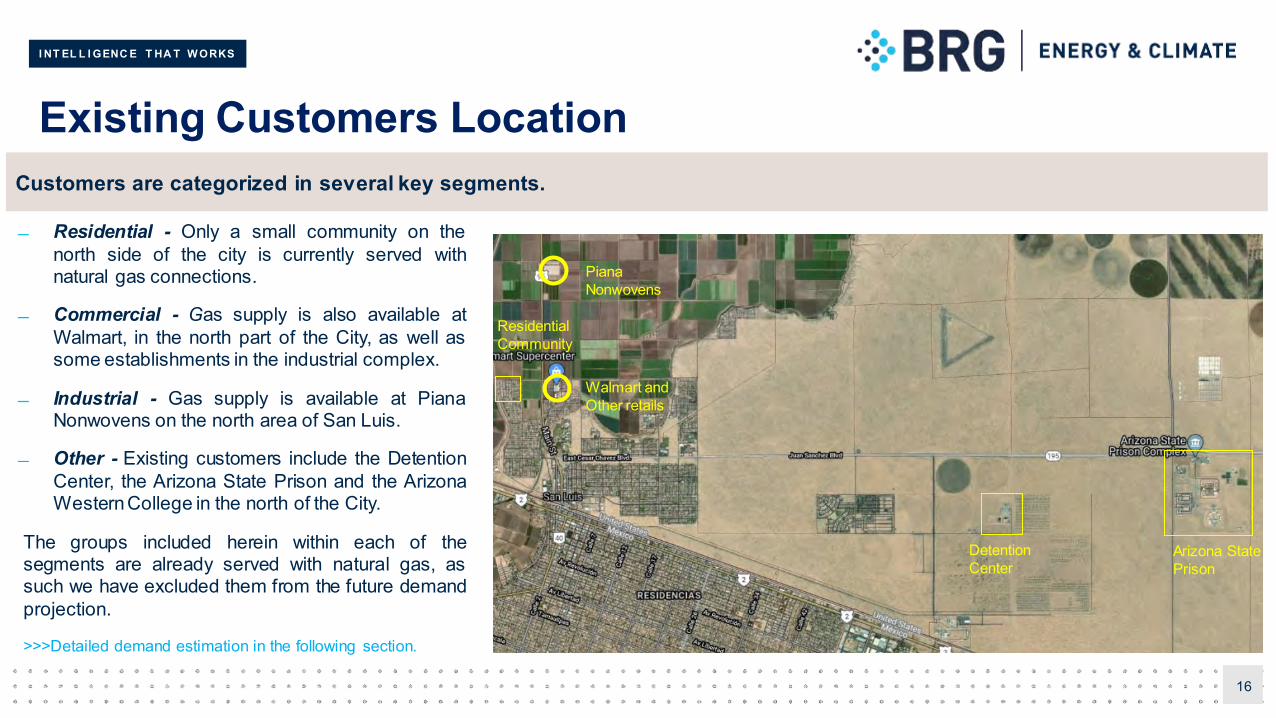
Customers are categorized in several key segments.
Residential - Only a small community on thenorth side of the city is currently served withnatural gas connections.
Commercial - Gas supply is also available atWalmart, in the north part of the City, as well assome establishments in the industrial complex.
Industrial - Gas supply is available at PianaNonwovens on the north area of San Luis.
Other - Existing customers include the DetentionCenter, the Arizona State Prison and the ArizonaWesternCollege in the north of the City.
The groups included herein within each of thesegments are already served with natural gas, assuch we have excluded them from the future demandprojection.
>>>Detailed demand estimation in the following section.
PianaNonwovens
Walmart and Other retails
Residential Community
Detention Center
Arizona State Prison

I NT EL L I GENC E T HA T W ORKS
4 Demand Estimation
I NT EL L I GENC E T HA T W ORKS
Demand Overview
18
− Demand is the key driver for development of last mile natural gas infrastructure. It is imperative to understand the nature of demand as itdirectly impacts the considerations that must be taken into account for development of infrastructure.
− From a planning perspective, it is also necessary to understand how the demand is expected to evolve over the years to determine necessaryflexibility that must be incorporated.
− In this report demand was estimated in two regions (the City of San Luis and the Southwest Arizona Industrial Park) and segmented asfollows:
Residential - Demand in this segment is primarily for heating requirements and household appliances. Typical uses include cooking,space and water heating (e.g. fireplace), and usage in other appliances such as a dryer.
Commercial - Demand in this segment is mostly required for heating purposes in heavy duty gas burners and commercial kitchens.
Industrial - This segment mostly uses natural gas for boilers, compressors, generators, space heating and for the processing ofindustrial goods.
Transport - This segment uses natural gas as an alternative to gasoline or diesel fuel. Vehicles could either be retrofitted or purchasednew.
Other - Includes government buildings, schools, and other facilities.
Natural gas is a preferred low-cost fuel that can serve various customer segments
I NT EL L I GENC E T HA T W ORKS
Demand Estimation Methodology (1 of 4)
19
Demand estimation was carried out in two geographic regionof San Luis:
− City of San Luis - covering 33 sq. miles and includes the incorporated city limits and land in unincorporated areas of Yuma County.
− Southwest Arizona Industrial + Magrino Industrial Park - covering over 250 acres.
Residential - Natural gas could be used for space heating, cooking and water heating.
Commercial - Covers grocery stores, Walmart, restaurants, retail stores and a brewery. Natural gas could be used for cooking andrefrigeration,space heating and other processing needs.
Industrial - Covers the medical waste incinerator, medical mall, food processing facilities, refrigerated and nonrefrigerated warehousesand residential projects (Belleza del Desierto Phase I and II, Santa Cecilia and a high-density residential area of 4 acres). Natural gaswould be used for electricity generation and other manufacturing needs.
Transportation - Covers school buses and refuse trucks. Natural gas would be used as an alternative fuel to gasoline or diesel fuel.
Other - Covers schools and Government buildings (except for the Prison Complex and the Detention Center). Natural gas could beused for space heating, electricity generation, cooking and refrigeration, as applicable.
>>> The report estimates the demand for each segment in a bottom-up approach. The estimation methodology is explained in the next slides.
Step 1: Classificationof demandsegments: Within these regions, the demand was further classified by segments as following:
I NT EL L I GENC E T HA T W ORKS
Demand Estimation Methodology (2 of 4)
20
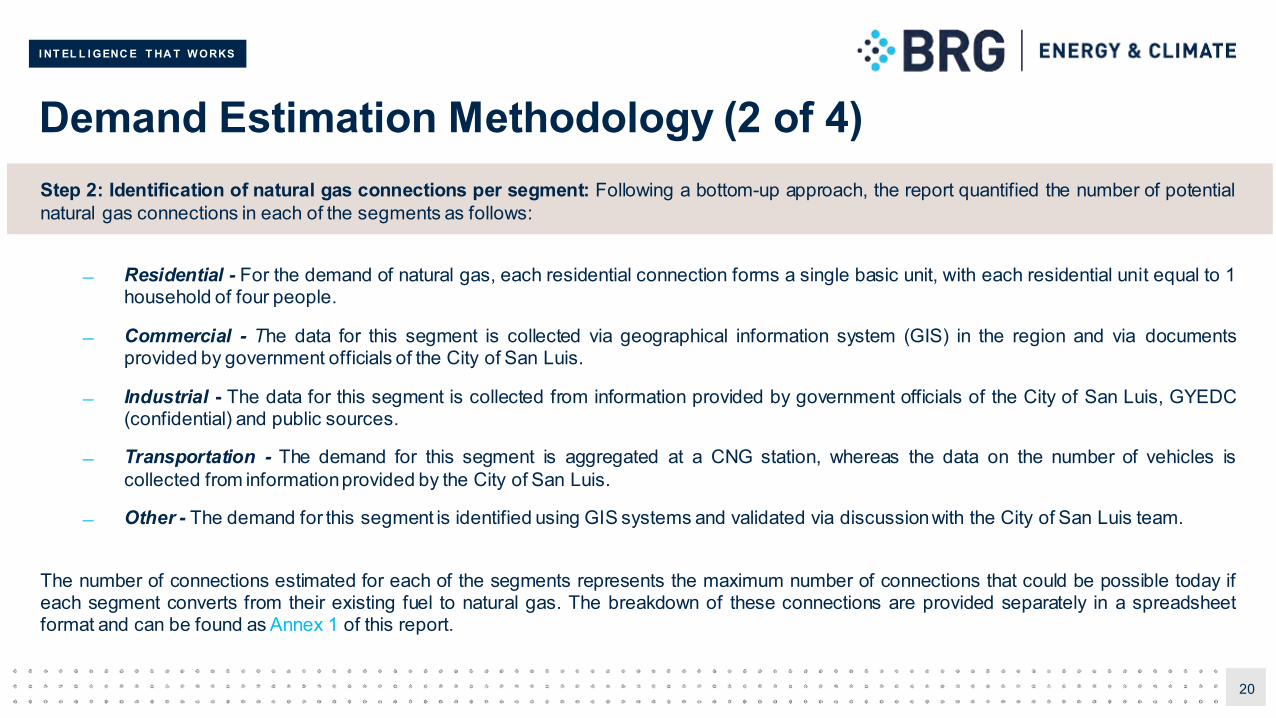
Step 2: Identification of natural gas connections per segment: Following a bottom-up approach, the report quantified the number of potentialnatural gas connections in each of the segments as follows:
Residential - For the demand of natural gas, each residential connection forms a single basic unit, with each residential unit equal to 1household of four people.
Commercial - The data for this segment is collected via geographical information system (GIS) in the region and via documentsprovided by government officials of the City of San Luis.
Industrial - The data for this segment is collected from information provided by government officials of the City of San Luis, GYEDC(confidential) and public sources.
Transportation - The demand for this segment is aggregated at a CNG station, whereas the data on the number of vehicles iscollected from informationprovided by the City of San Luis.
Other - The demand for this segment is identified using GIS systems and validated via discussionwith the City of San Luis team.
The number of connections estimated for each of the segments represents the maximum number of connections that could be possible today ifeach segment converts from their existing fuel to natural gas. The breakdown of these connections are provided separately in a spreadsheetformat and can be found as Annex 1 of this report.
I NT EL L I GENC E T HA T W ORKS
Demand Estimation Methodology (3 of 4)
21
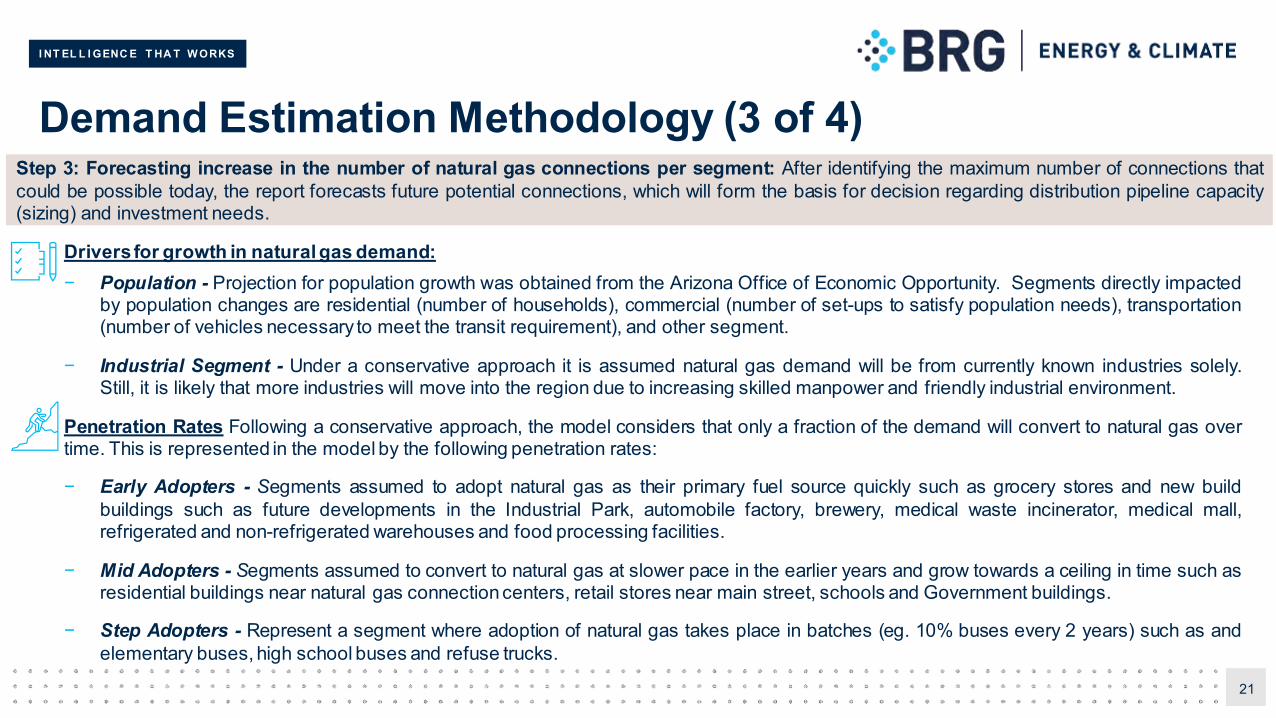
Drivers for growth in natural gas demand:− Population - Projection for population growth was obtained from the Arizona Office of Economic Opportunity. Segments directly impacted
by population changes are residential (number of households), commercial (number of set-ups to satisfy population needs), transportation(number of vehicles necessary to meet the transit requirement), and other segment.
− Industrial Segment - Under a conservative approach it is assumed natural gas demand will be from currently known industries solely.Still, it is likely that more industries will move into the region due to increasing skilled manpower and friendly industrial environment.
Penetration Rates Following a conservative approach, the model considers that only a fraction of the demand will convert to natural gas overtime. This is represented in the model by the following penetration rates:
− Early Adopters - Segments assumed to adopt natural gas as their primary fuel source quickly such as grocery stores and new buildbuildings such as future developments in the Industrial Park, automobile factory, brewery, medical waste incinerator, medical mall,refrigerated and non-refrigerated warehouses and food processing facilities.
− Mid Adopters - Segments assumed to convert to natural gas at slower pace in the earlier years and grow towards a ceiling in time such asresidential buildings near natural gas connectioncenters, retail stores near main street, schools and Government buildings.
− Step Adopters - Represent a segment where adoption of natural gas takes place in batches (eg. 10% buses every 2 years) such as andelementary buses, high school buses and refuse trucks.
Step 3: Forecasting increase in the number of natural gas connections per segment: After identifying the maximum number of connections thatcould be possible today, the report forecasts future potential connections, which will form the basis for decision regarding distribution pipeline capacity(sizing) and investment needs.
I NT EL L I GENC E T HA T W ORKS
Demand Estimation Methodology (4 of 4)
22
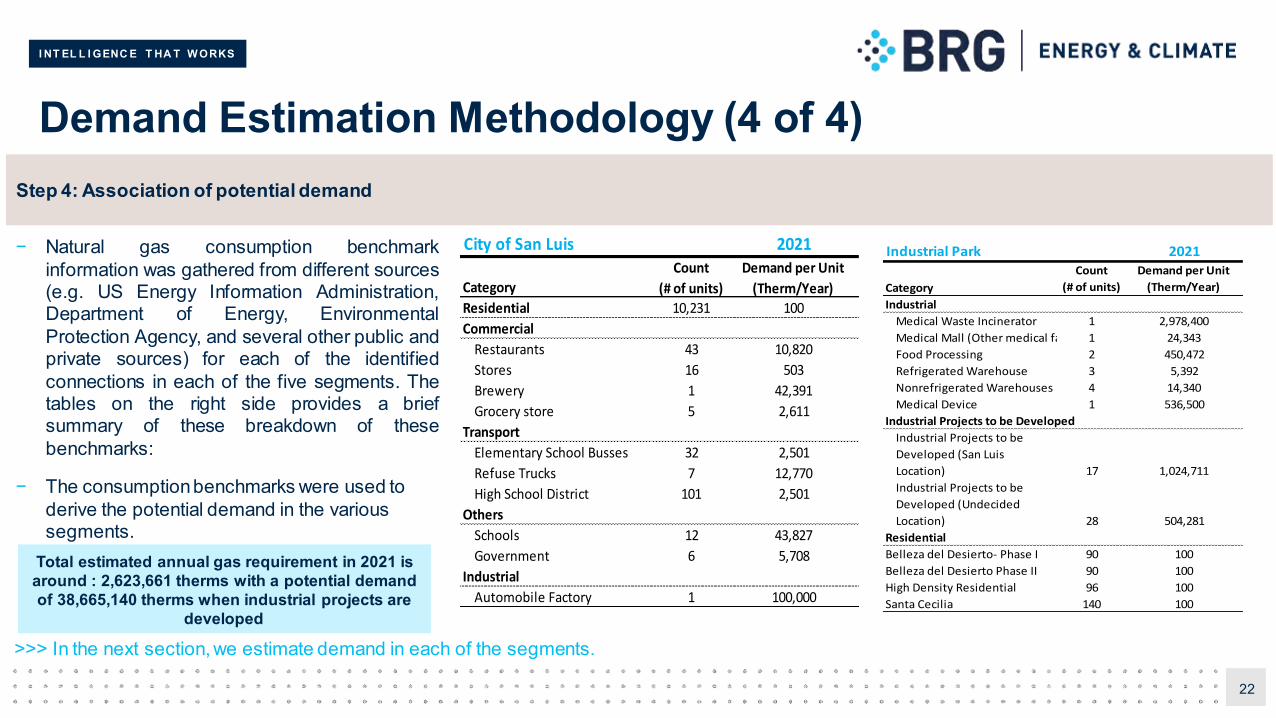
− Natural gas consumption benchmarkinformation was gathered from different sources(e.g. US Energy Information Administration,Department of Energy, EnvironmentalProtection Agency, and several other public andprivate sources) for each of the identifiedconnections in each of the five segments. Thetables on the right side provides a briefsummary of these breakdown of thesebenchmarks:
− The consumption benchmarks were used to derive the potential demand in the various segments.
Step 4: Association of potential demand
Total estimated annual gas requirement in 2021 is around : 2,623,661 therms with a potential demand of 38,665,140 therms when industrial projects are
developed
City of San Luis 2021
Category
Count
(# of units)
Demand per Unit
(Therm/Year)
Residential 10,231 100
Commercial
Restaurants 43 10,820
Stores 16 503
Brewery 1 42,391
Grocery store 5 2,611
Transport
Elementary School Busses 32 2,501
Refuse Trucks 7 12,770
High School District 101 2,501
Others
Schools 12 43,827
Government 6 5,708
Industrial
Automobile Factory 1 100,000
>>> In the next section, we estimate demand in each of the segments.
Industrial Park 2021
Category
Count
(# of units)
Demand per Unit
(Therm/Year)
Industrial
Medical Waste Incinerator 1 2,978,400
Medical Mall (Other medical facilities)1 24,343
Food Processing 2 450,472
Refrigerated Warehouse 3 5,392
Nonrefrigerated Warehouses 4 14,340
Medical Device 1 536,500
Industrial Projects to be Developed
Industrial Projects to be
Developed (San Luis
Location) 17 1,024,711
Industrial Projects to be
Developed (Undecided
Location) 28 504,281
Residential
Belleza del Desierto- Phase I 90 100
Belleza del Desierto Phase II 90 100
High Density Residential 96 100
Santa Cecilia 140 100
I NT EL L I GENC E T HA T W ORKS
San Luis Demand Summary
I NT EL L I GENC E T HA T W ORKS
Overview
24
Demand Case Definition
For ease of understanding an expected penetration in the market, we have categorized our demand analysis covering two cases:
(a) 100% Adoption Scenario: This scenario will define the demand ceiling for the region. Demand ceiling refers to an event when each of theidentified participants/stakeholder decides to adopt natural gas its primary fuel for the mentioned purposes, displacing alternate fuel such aselectricity, propane, gasoline or other.
(b) Potential Adoption Trend Scenario: This scenario will demonstrate a relatively more realistic case where adoption in various segments willfollow a trend for adoption. These trends are further categorized into:
(a) Early Adopters;
(b) Mid Adopters; and,
(c) Step Adopters;
Within each segment (as defined earlier) total penetration is defined to a maximum level. For example, maximum penetration in residentialsegment is assumed to 10%. Such conservative approach is reflective of choice that residential customer may make depending on ease andhassle of conversion.
Following slides provides the resulting demand from each of these scenarios
I NT EL L I GENC E T HA T W ORKS
Summary of Results (1 of 6)
* Other encumbers schools, Government buildings, the medical device and the call center
25
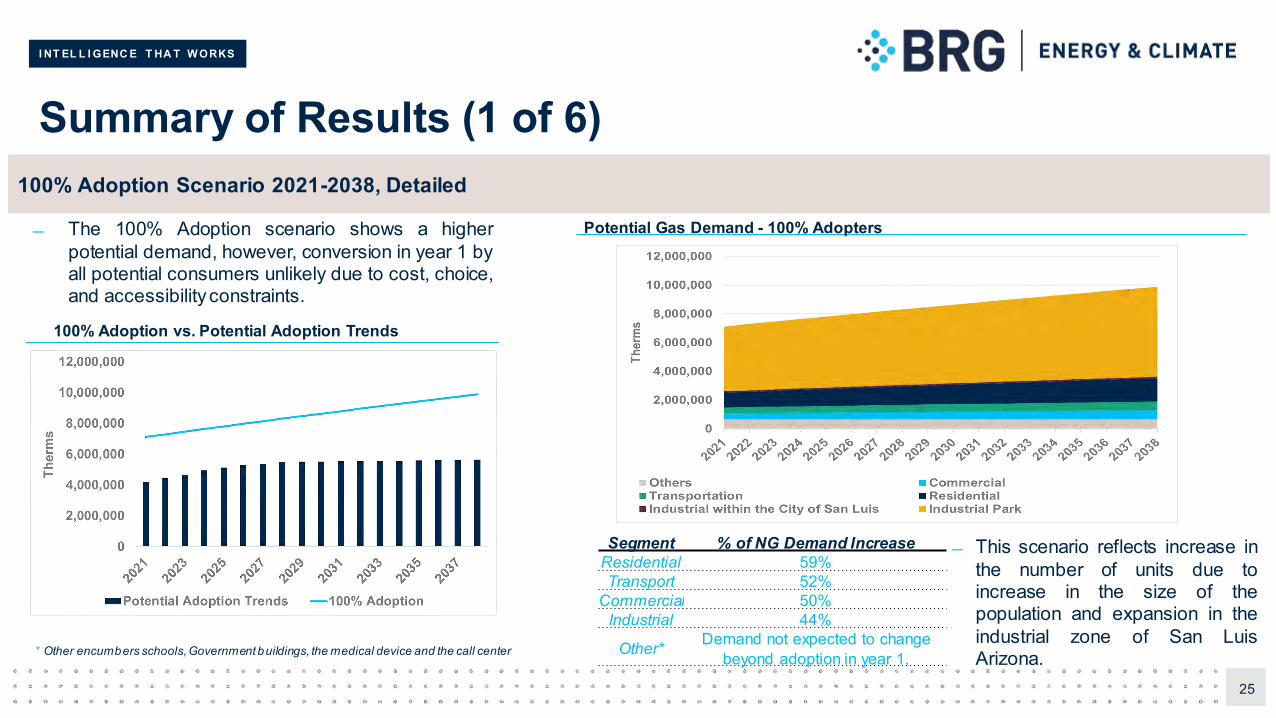
100% Adoption Scenario 2021-2038, Detailed
Segment % of NG Demand IncreaseResidential 59%Transport 52%
Commercial 50%Industrial 44%
Other* Demand not expected to change beyond adoption in year 1.
This scenario reflects increase inthe number of units due toincrease in the size of thepopulation and expansion in theindustrial zone of San LuisArizona.
The 100% Adoption scenario shows a higherpotential demand, however, conversion in year 1 byall potential consumers unlikely due to cost, choice,and accessibilityconstraints.
100% Adoption vs. Potential Adoption Trends
Potential Gas Demand - 100% Adopters
I NT EL L I GENC E T HA T W ORKS
Summary of Results (2 of 6)
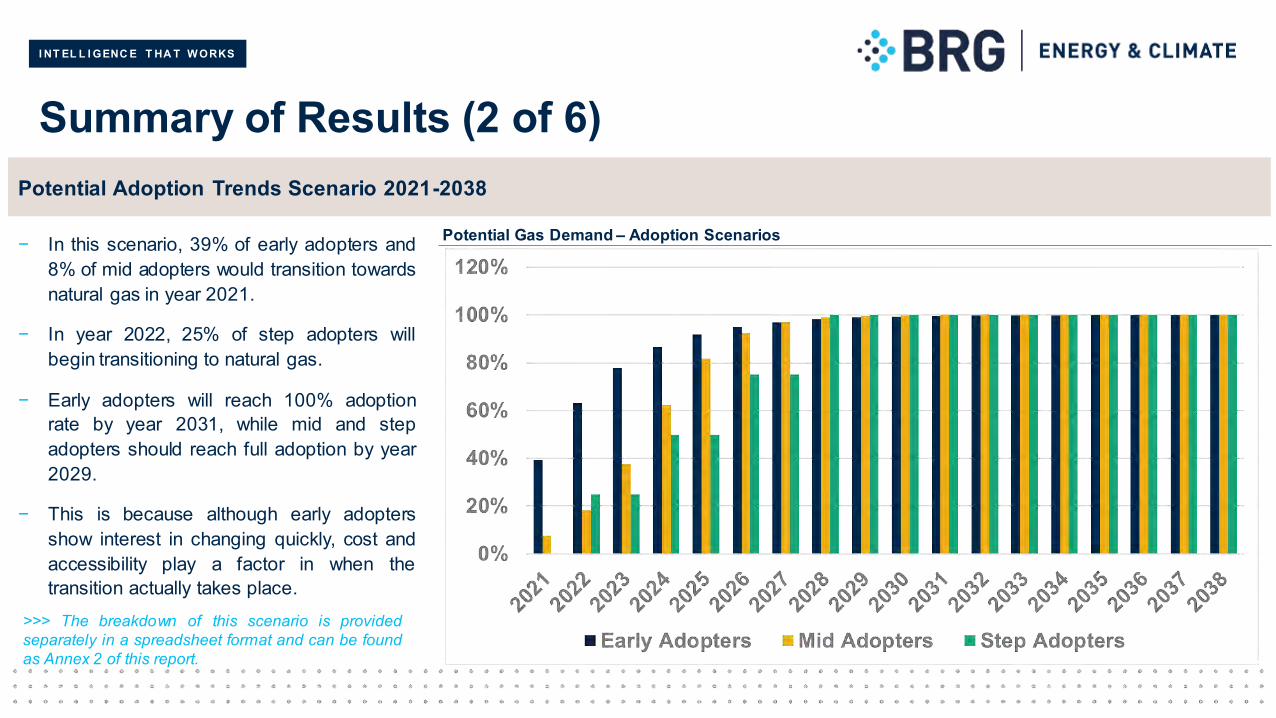
− In this scenario, 39% of early adopters and8% of mid adopters would transition towardsnatural gas in year 2021.
− In year 2022, 25% of step adopters willbegin transitioning to natural gas.
− Early adopters will reach 100% adoptionrate by year 2031, while mid and stepadopters should reach full adoption by year2029.
− This is because although early adoptersshow interest in changing quickly, cost andaccessibility play a factor in when thetransition actually takes place.
Potential Adoption Trends Scenario 2021-2038
Potential Gas Demand – Adoption Scenarios
>>> The breakdown of this scenario is providedseparately in a spreadsheet format and can be foundas Annex 2 of this report.
I NT EL L I GENC E T HA T W ORKS
Summary of Results (3 of 6)
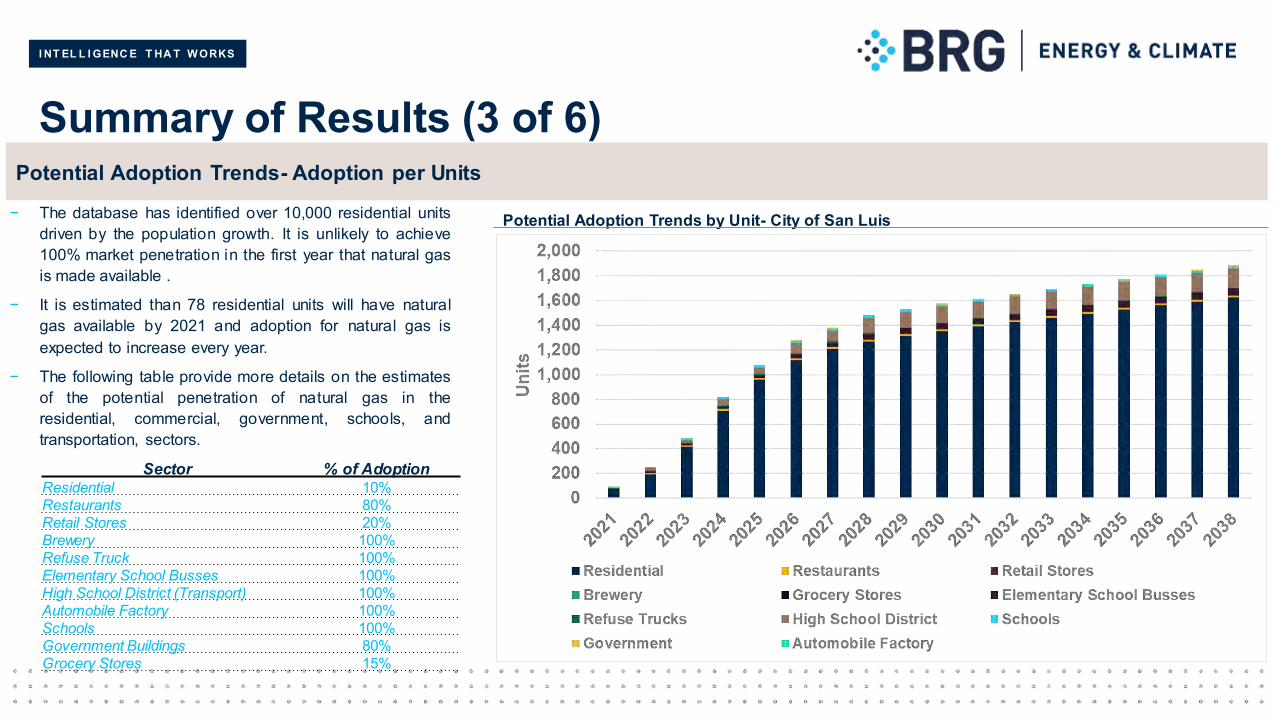
− The database has identified over 10,000 residential unitsdriven by the population growth. It is unlikely to achieve100% market penetration in the first year that natural gasis made available .
− It is estimated than 78 residential units will have naturalgas available by 2021 and adoption for natural gas isexpected to increase every year.
− The following table provide more details on the estimatesof the potential penetration of natural gas in theresidential, commercial, government, schools, andtransportation, sectors.
Sector % of AdoptionResidential 10%Restaurants 80%Retail Stores 20%Brewery 100%Refuse Truck 100%Elementary School Busses 100%High School District (Transport) 100%Automobile Factory 100%Schools 100%Government Buildings 80%Grocery Stores 15%
Potential Adoption Trends- Adoption per Units
Potential Adoption Trends by Unit- City of San Luis
I NT EL L I GENC E T HA T W ORKS
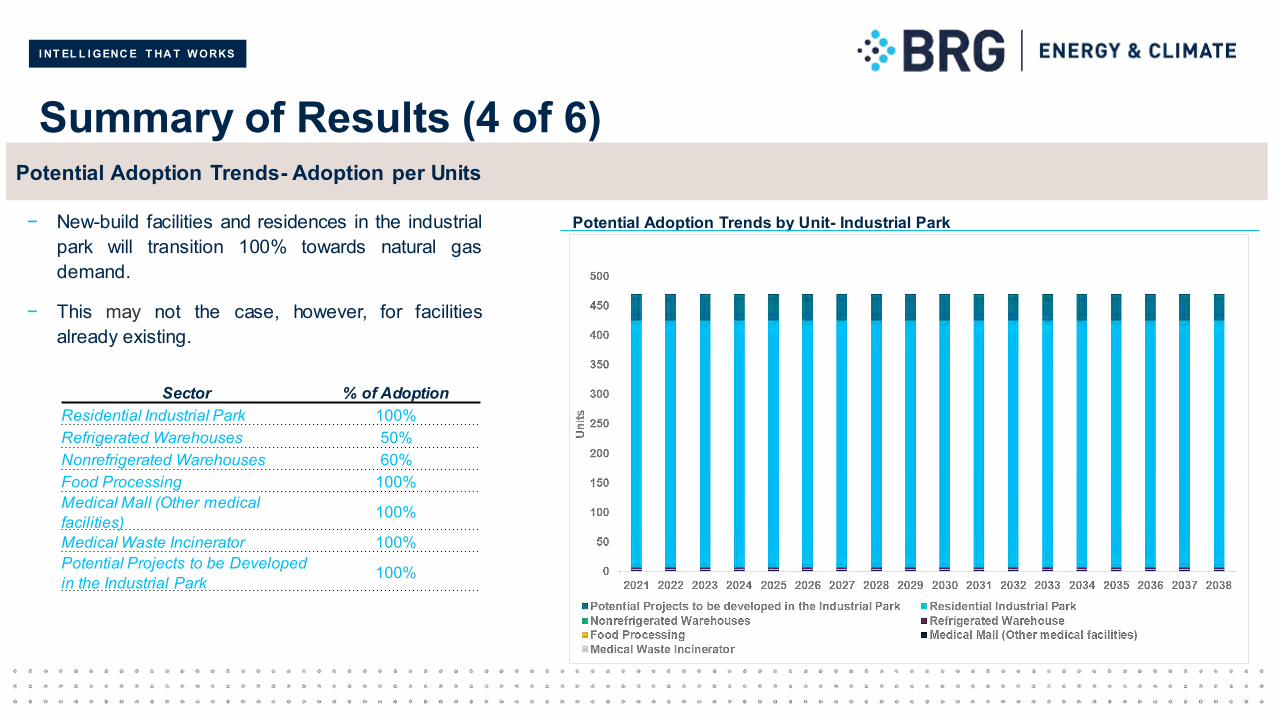
Sector % of AdoptionResidential Industrial Park 100%Refrigerated Warehouses 50%Nonrefrigerated Warehouses 60%Food Processing 100%Medical Mall (Other medical facilities) 100%
Medical Waste Incinerator 100%Potential Projects to be Developed in the Industrial Park 100%
Summary of Results (4 of 6)
− New-build facilities and residences in the industrialpark will transition 100% towards natural gasdemand.
− This may not the case, however, for facilitiesalready existing.
Potential Adoption Trends- Adoption per Units
Potential Adoption Trends by Unit- Industrial Park
I NT EL L I GENC E T HA T W ORKS
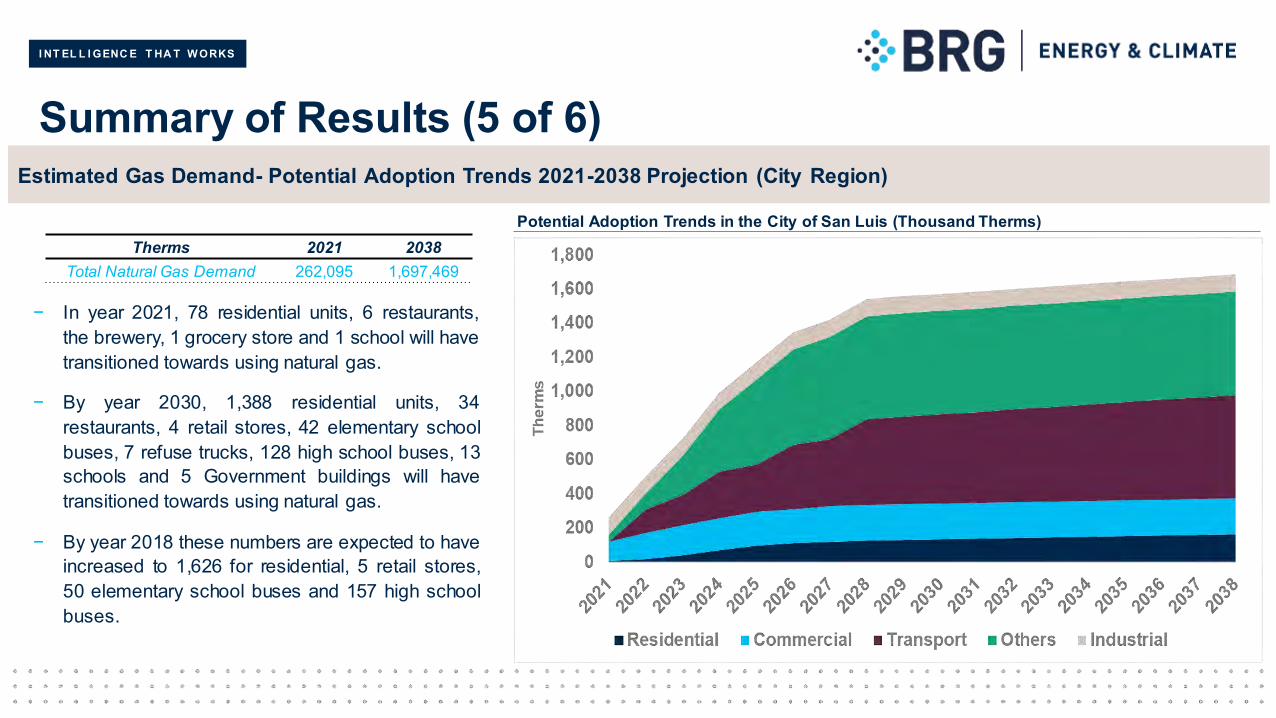
Summary of Results (5 of 6)
− In year 2021, 78 residential units, 6 restaurants,the brewery, 1 grocery store and 1 school will havetransitioned towards using natural gas.
− By year 2030, 1,388 residential units, 34restaurants, 4 retail stores, 42 elementary schoolbuses, 7 refuse trucks, 128 high school buses, 13schools and 5 Government buildings will havetransitioned towards using natural gas.
− By year 2018 these numbers are expected to haveincreased to 1,626 for residential, 5 retail stores,50 elementary school buses and 157 high schoolbuses.
Therms 2021 2038Total Natural Gas Demand 262,095 1,697,469
Estimated Gas Demand- Potential Adoption Trends 2021-2038 Projection (City Region)
Potential Adoption Trends in the City of San Luis (Thousand Therms)
I NT EL L I GENC E T HA T W ORKS
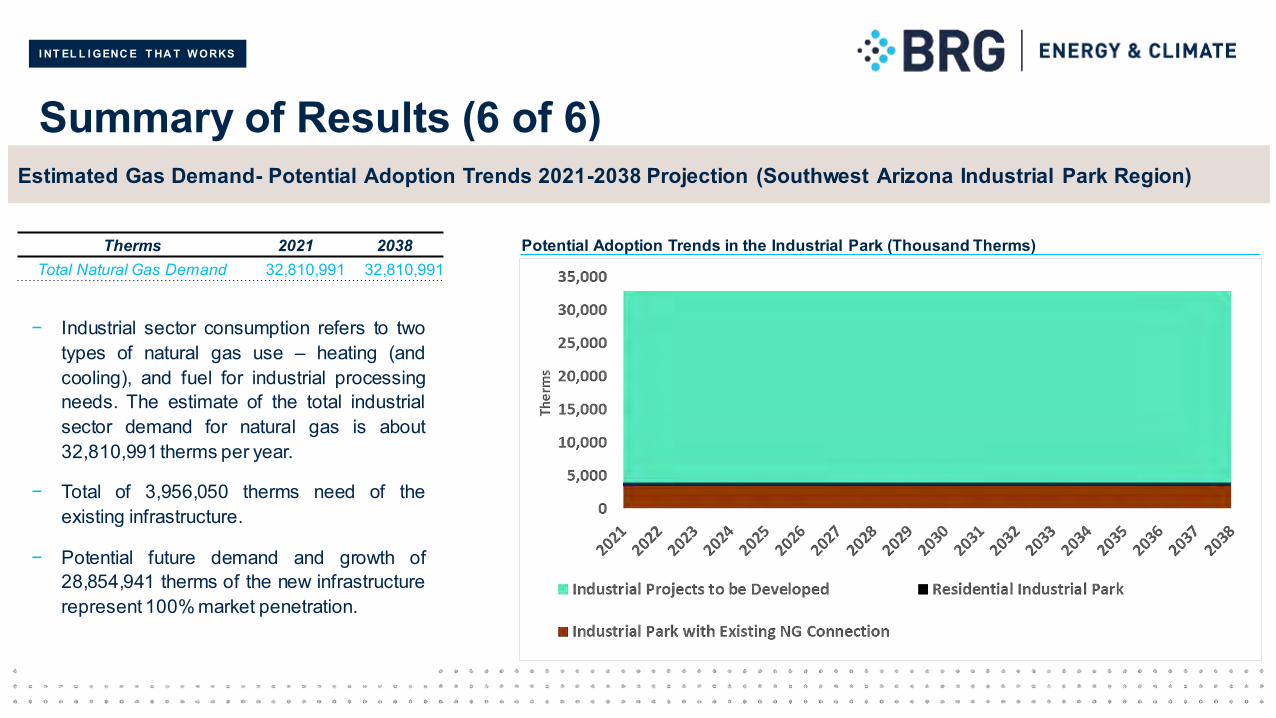
Summary of Results (6 of 6)
− Industrial sector consumption refers to twotypes of natural gas use – heating (andcooling), and fuel for industrial processingneeds. The estimate of the total industrialsector demand for natural gas is about32,810,991 therms per year.
− Total of 3,956,050 therms need of theexisting infrastructure.
− Potential future demand and growth of28,854,941 therms of the new infrastructurerepresent 100% market penetration.
Therms 2021 2038Total Natural Gas Demand 32,810,991 32,810,991
Estimated Gas Demand- Potential Adoption Trends 2021-2038 Projection (Southwest Arizona Industrial Park Region)
Potential Adoption Trends in the Industrial Park (Thousand Therms)

I NT EL L I GENC E T HA T W ORKS
San Luis by SectorThis section provides a revised estimate of the market potentialfor natural gas in the City of San Luis and Industrial Park. Thismarket size is defined in terms of annual natural gasconsumption for space and water heating, power generation, andindustrial processing for structures and entities located in the city.The market demand estimates are used to size the gastransmission line and other facilities, and they are also key inputsto the financial, benefit-cost, and air quality analyses.

I NT EL L I GENC E T HA T W ORKS
Residential
I NT EL L I GENC E T HA T W ORKS
Residential Segment
33
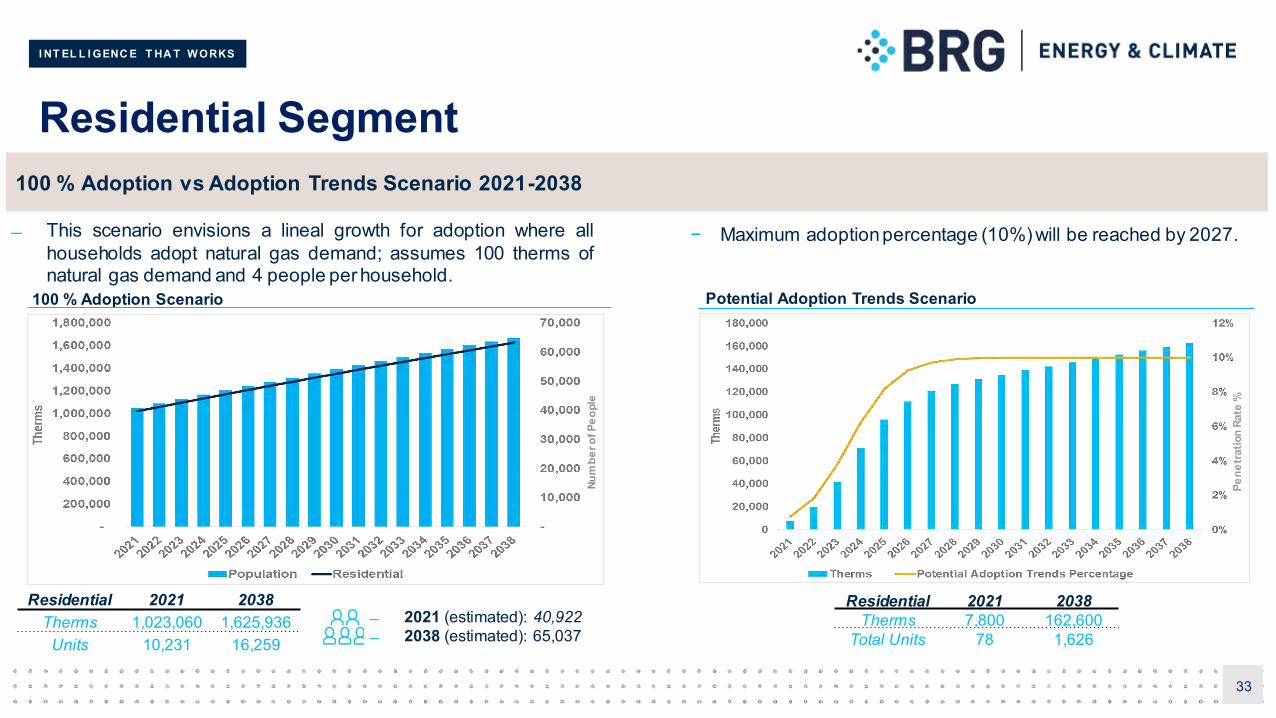
100 % Adoption vs Adoption Trends Scenario 2021-2038
Residential 2021 2038Therms 1,023,060 1,625,936
Units 10,231 16,259
Residential 2021 2038Therms 7,800 162,600
Total Units 78 1,626
This scenario envisions a lineal growth for adoption where allhouseholds adopt natural gas demand; assumes 100 therms ofnatural gas demand and 4 people per household.
− Maximum adoption percentage (10%) will be reached by 2027.
100 % Adoption Scenario Potential Adoption Trends Scenario
2021 (estimated): 40,922 2038 (estimated): 65,037
Num
ber o
f Peo
ple
Pene
trat
ion
Rate
%

I NT EL L I GENC E T HA T W ORKS
Commercial
I NT EL L I GENC E T HA T W ORKS
Commercial Segment (1 of 2)
35
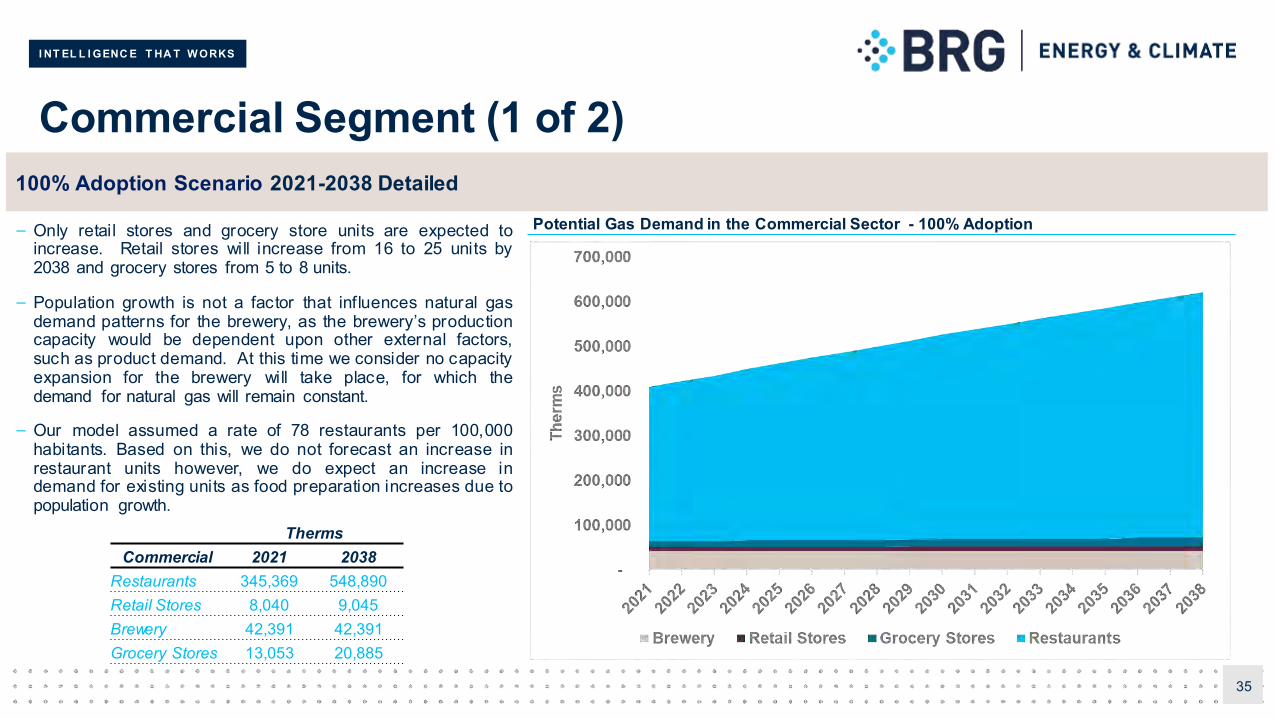
100% Adoption Scenario 2021-2038 Detailed
ThermsCommercial 2021 2038
Restaurants 345,369 548,890Retail Stores 8,040 9,045Brewery 42,391 42,391Grocery Stores 13,053 20,885
– Only retail stores and grocery store units are expected toincrease. Retail stores will increase from 16 to 25 units by2038 and grocery stores from 5 to 8 units.
– Population growth is not a factor that influences natural gasdemand patterns for the brewery, as the brewery’s productioncapacity would be dependent upon other external factors,such as product demand. At this time we consider no capacityexpansion for the brewery will take place, for which thedemand for natural gas will remain constant.
– Our model assumed a rate of 78 restaurants per 100,000habitants. Based on this, we do not forecast an increase inrestaurant units however, we do expect an increase indemand for existing units as food preparation increases due topopulation growth.
Potential Gas Demand in the Commercial Sector - 100% Adoption
I NT EL L I GENC E T HA T W ORKS
Commercial Segment (2 of 2)
36
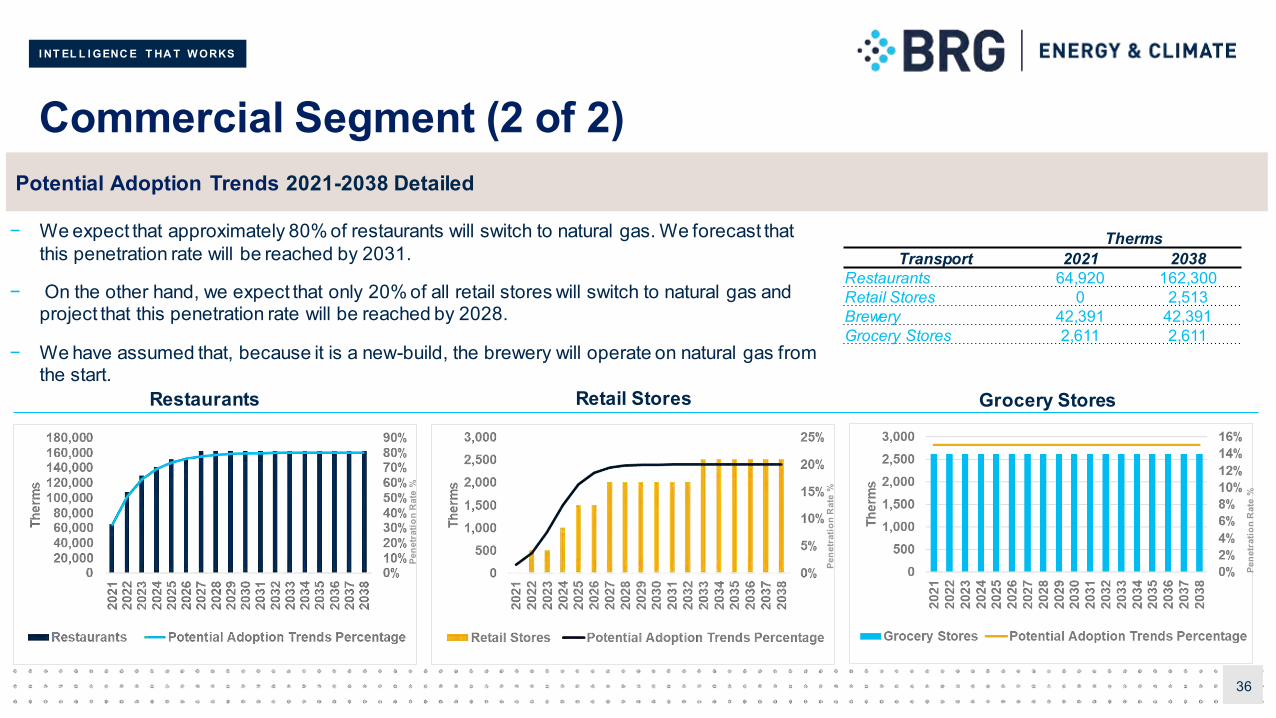
− We expect that approximately 80% of restaurants will switch to natural gas. We forecast that this penetration rate will be reached by 2031.
− On the other hand, we expect that only 20% of all retail stores will switch to natural gas and project that this penetration rate will be reached by 2028.
− We have assumed that, because it is a new-build, the brewery will operate on natural gas from the start.
ThermsTransport 2021 2038
Restaurants 64,920 162,300Retail Stores 0 2,513Brewery 42,391 42,391Grocery Stores 2,611 2,611
Potential Adoption Trends 2021-2038 Detailed
Restaurants Retail Stores Grocery Stores
Pene
trat
ion
Rat
e %
Pene
trat
ion
Rat
e %
Pene
trat
ion
Rat
e %
I NT EL L I GENC E T HA T W ORKS
Industrial
I NT EL L I GENC E T HA T W ORKS
Industrial Segment (1 of 4)
38
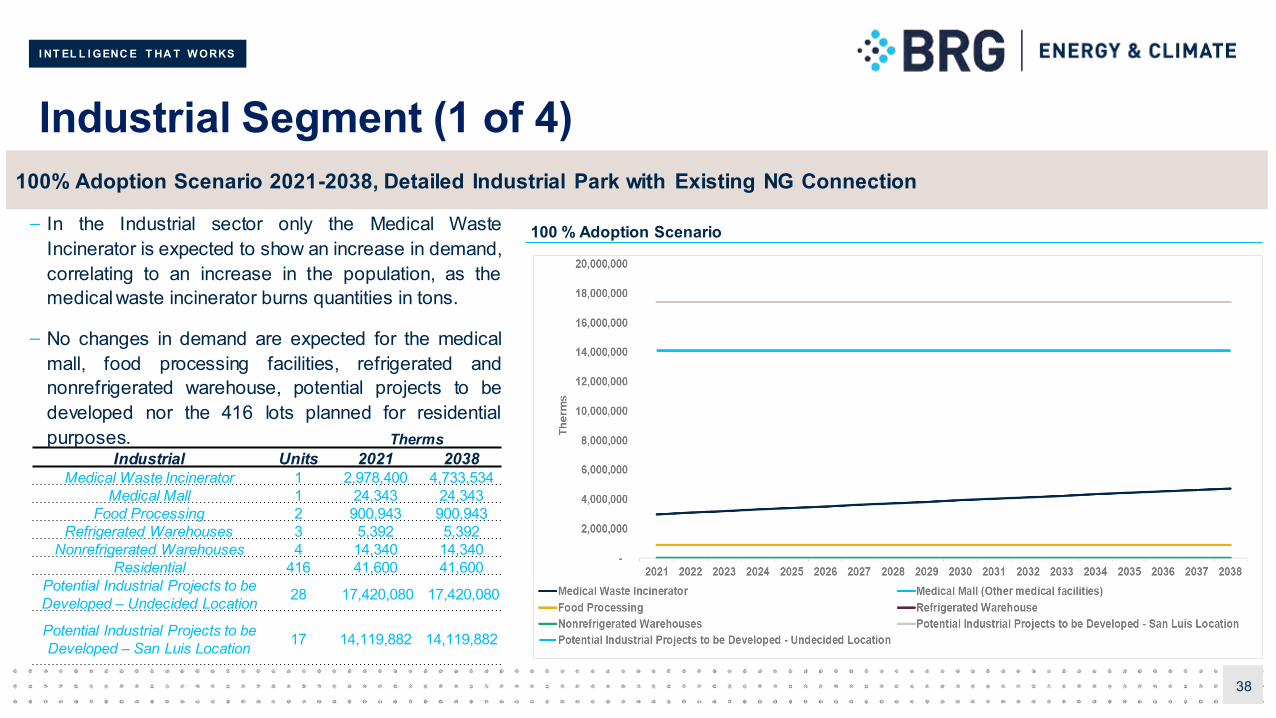
100% Adoption Scenario 2021-2038, Detailed Industrial Park with Existing NG Connection
ThermsIndustrial Units 2021 2038
Medical Waste Incinerator 1 2,978,400 4,733,534Medical Mall 1 24,343 24,343
Food Processing 2 900,943 900,943 Refrigerated Warehouses 3 5,392 5,392
Nonrefrigerated Warehouses 4 14,340 14,340 Residential 416 41,600 41,600
Potential Industrial Projects to be Developed – Undecided Location 28 17,420,080 17,420,080
Potential Industrial Projects to be Developed – San Luis Location 17 14,119,882 14,119,882
– In the Industrial sector only the Medical WasteIncinerator is expected to show an increase in demand,correlating to an increase in the population, as themedical waste incinerator burns quantities in tons.
– No changes in demand are expected for the medicalmall, food processing facilities, refrigerated andnonrefrigerated warehouse, potential projects to bedeveloped nor the 416 lots planned for residentialpurposes.
100 % Adoption Scenario
I NT EL L I GENC E T HA T W ORKS
Industrial Segment-Potential Demand (2 of 4)
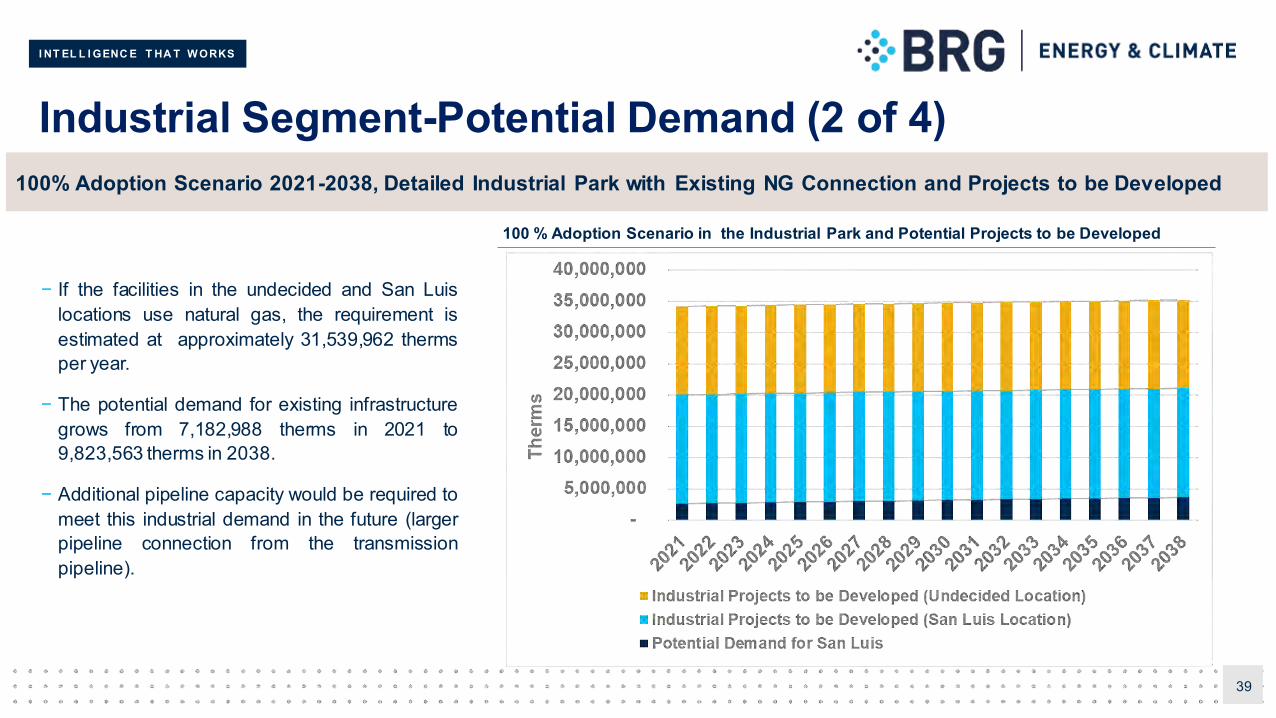
− If the facilities in the undecided and San Luislocations use natural gas, the requirement isestimated at approximately 31,539,962 thermsper year.
− The potential demand for existing infrastructuregrows from 7,182,988 therms in 2021 to9,823,563 therms in 2038.
− Additional pipeline capacity would be required tomeet this industrial demand in the future (largerpipeline connection from the transmissionpipeline).
39
100% Adoption Scenario 2021-2038, Detailed Industrial Park with Existing NG Connection and Projects to be Developed
100 % Adoption Scenario in the Industrial Park and Potential Projects to be Developed
I NT EL L I GENC E T HA T W ORKS
Industrial Segment (3 of 4)
40
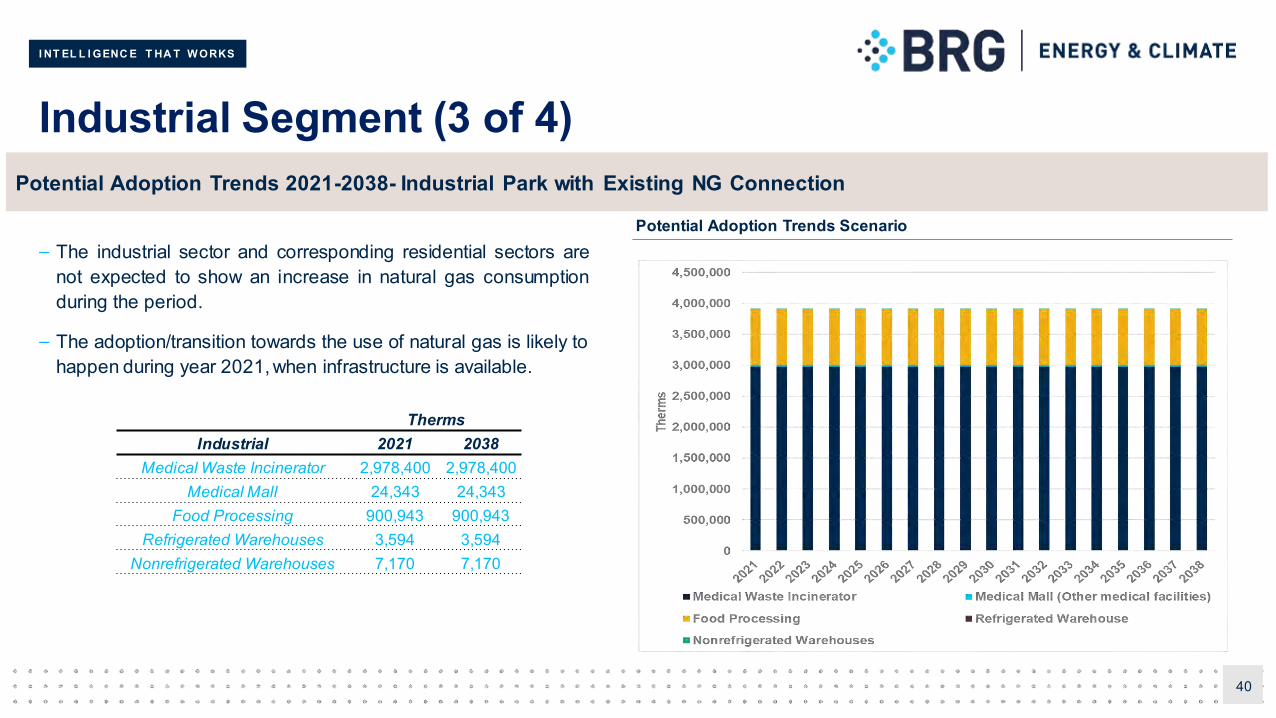
– The industrial sector and corresponding residential sectors arenot expected to show an increase in natural gas consumptionduring the period.
– The adoption/transition towards the use of natural gas is likely tohappen during year 2021, when infrastructure is available.
Potential Adoption Trends 2021-2038- Industrial Park with Existing NG Connection
ThermsIndustrial 2021 2038
Medical Waste Incinerator 2,978,400 2,978,400Medical Mall 24,343 24,343
Food Processing 900,943 900,943 Refrigerated Warehouses 3,594 3,594
Nonrefrigerated Warehouses 7,170 7,170
Potential Adoption Trends Scenario
I NT EL L I GENC E T HA T W ORKS
Industrial Segment- Potential Demand (4 of 4)
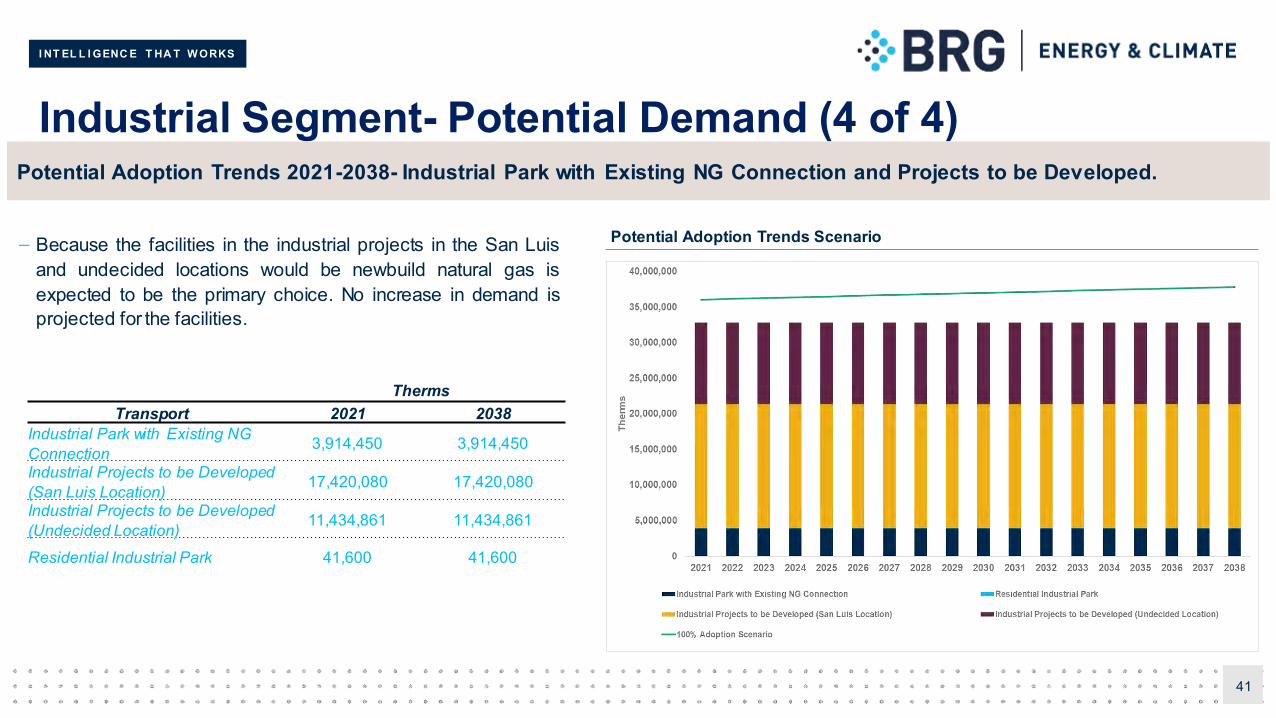
– Because the facilities in the industrial projects in the San Luisand undecided locations would be newbuild natural gas isexpected to be the primary choice. No increase in demand isprojected for the facilities.
41
ThermsTransport 2021 2038
Industrial Park with Existing NG Connection 3,914,450 3,914,450
Industrial Projects to be Developed (San Luis Location) 17,420,080 17,420,080
Industrial Projects to be Developed (Undecided Location) 11,434,861 11,434,861
Residential Industrial Park 41,600 41,600
Potential Adoption Trends 2021-2038- Industrial Park with Existing NG Connection and Projects to be Developed.
Potential Adoption Trends Scenario
I NT EL L I GENC E T HA T W ORKS
Transport
I NT EL L I GENC E T HA T W ORKS
Transport Segment (1 of 2)
43
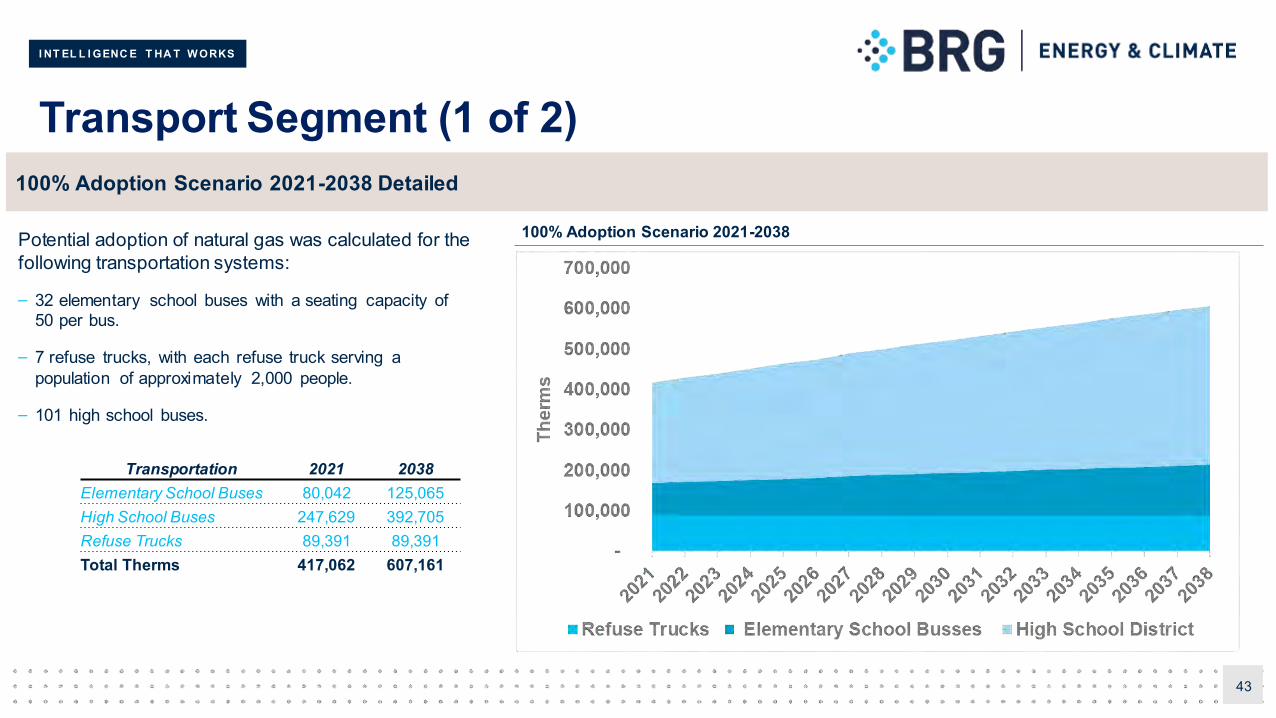
100% Adoption Scenario 2021-2038 Detailed
Transportation 2021 2038Elementary School Buses 80,042 125,065High School Buses 247,629 392,705Refuse Trucks 89,391 89,391Total Therms 417,062 607,161
Potential adoption of natural gas was calculated for thefollowing transportation systems:
– 32 elementary school buses with a seating capacity of 50 per bus.
– 7 refuse trucks, with each refuse truck serving a population of approximately 2,000 people.
– 101 high school buses.
100% Adoption Scenario 2021-2038
I NT EL L I GENC E T HA T W ORKS
Transport Segment (2 of 2)
44
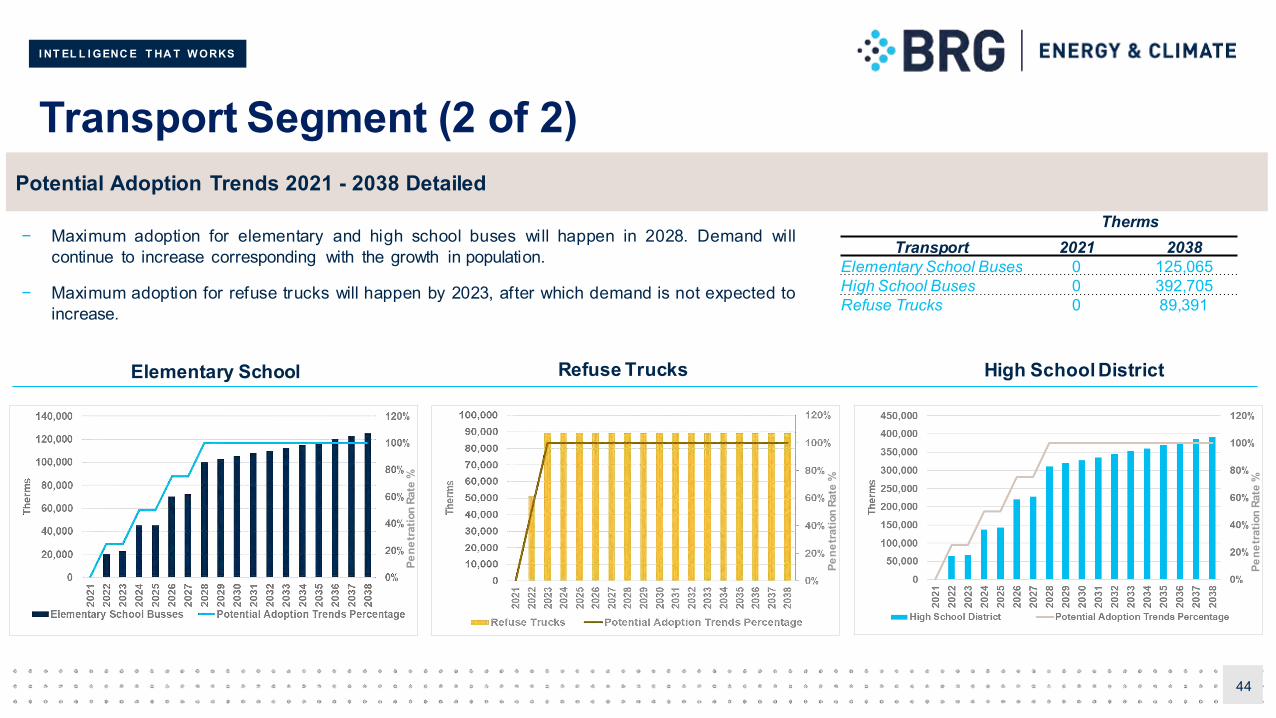
Potential Adoption Trends 2021 - 2038 Detailed
Elementary School Refuse Trucks High School District
ThermsTransport 2021 2038
Elementary School Buses 0 125,065High School Buses 0 392,705Refuse Trucks 0 89,391
− Maximum adoption for elementary and high school buses will happen in 2028. Demand willcontinue to increase corresponding with the growth in population.
− Maximum adoption for refuse trucks will happen by 2023, after which demand is not expected toincrease.
Pene
trat
ion
Rate
%
Pene
trat
ion
Rate
%
Pene
trat
ion
Rate
%

I NT EL L I GENC E T HA T W ORKS
Other
I NT EL L I GENC E T HA T W ORKS
Other Segment
46
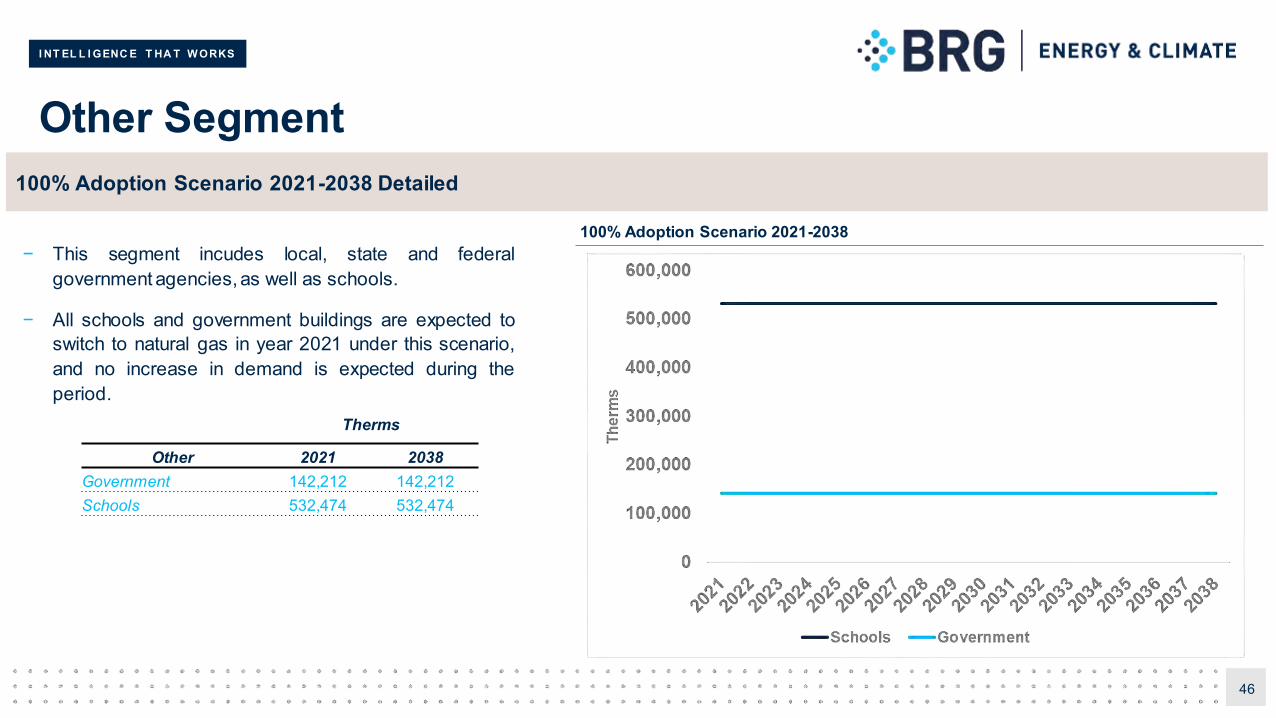
100% Adoption Scenario 2021-2038 Detailed
− This segment incudes local, state and federalgovernment agencies,as well as schools.
− All schools and government buildings are expected toswitch to natural gas in year 2021 under this scenario,and no increase in demand is expected during theperiod.
Therms
Other 2021 2038Government 142,212 142,212Schools 532,474 532,474
100% Adoption Scenario 2021-2038
I NT EL L I GENC E T HA T W ORKS
Other Segment
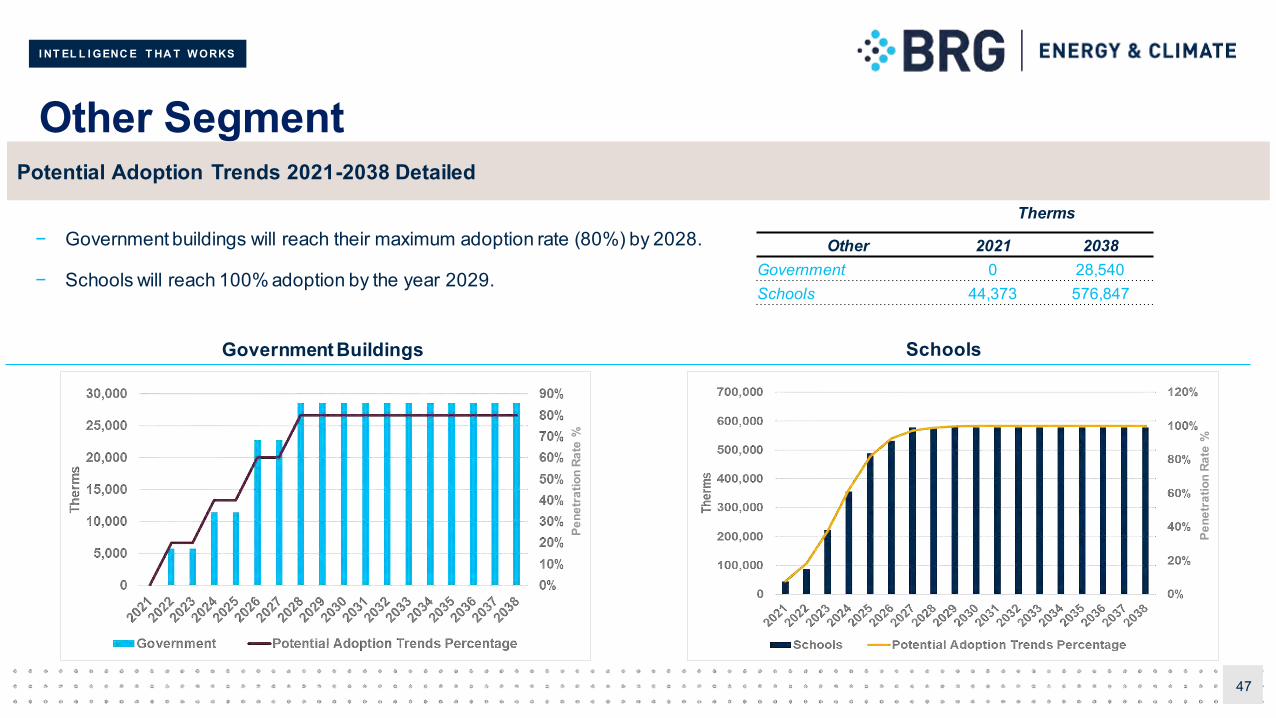
47
− Government buildings will reach their maximum adoption rate (80%) by 2028.
− Schools will reach 100% adoption by the year 2029.
Therms
Other 2021 2038Government 0 28,540Schools 44,373 576,847
Potential Adoption Trends 2021-2038 Detailed
Government Buildings Schools
Pene
trat
ion
Rate
%
Pene
trat
ion
Rate
%

I NT EL L I GENC E T HA T W ORKS
5 Supply Analysis
I NT EL L I GENC E T HA T W ORKS
Supply Overview
49
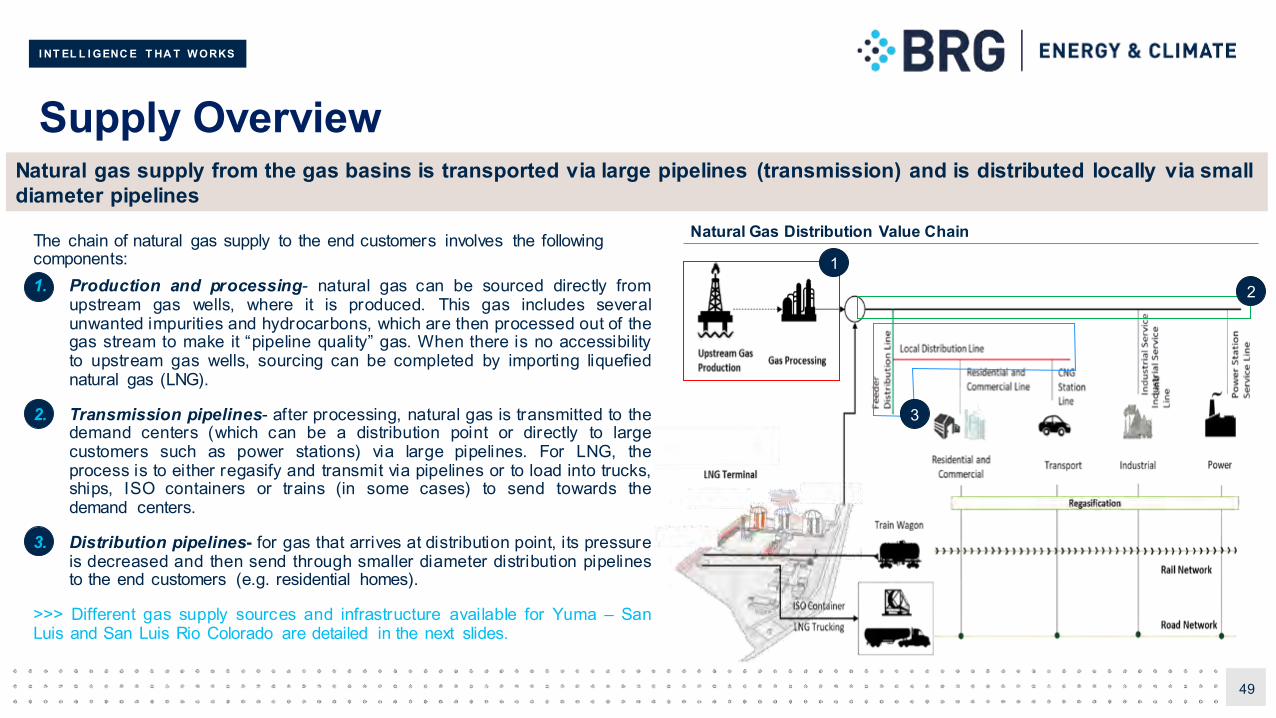
Natural gas supply from the gas basins is transported via large pipelines (transmission) and is distributed locally via smalldiameter pipelines
Natural Gas Distribution Value Chain
1
2
3
The chain of natural gas supply to the end customers involves the following components:1. Production and processing- natural gas can be sourced directly from
upstream gas wells, where it is produced. This gas includes severalunwanted impurities and hydrocarbons, which are then processed out of thegas stream to make it “pipeline quality” gas. When there is no accessibilityto upstream gas wells, sourcing can be completed by importing liquefiednatural gas (LNG).
2. Transmission pipelines- after processing, natural gas is transmitted to thedemand centers (which can be a distribution point or directly to largecustomers such as power stations) via large pipelines. For LNG, theprocess is to either regasify and transmit via pipelines or to load into trucks,ships, ISO containers or trains (in some cases) to send towards thedemand centers.
3. Distribution pipelines- for gas that arrives at distribution point, its pressureis decreased and then send through smaller diameter distribution pipelinesto the end customers (e.g. residential homes).
>>> Different gas supply sources and infrastructure available for Yuma – SanLuis and San Luis Rio Colorado are detailed in the next slides.
I NT EL L I GENC E T HA T W ORKS
Natural Gas Sources
50
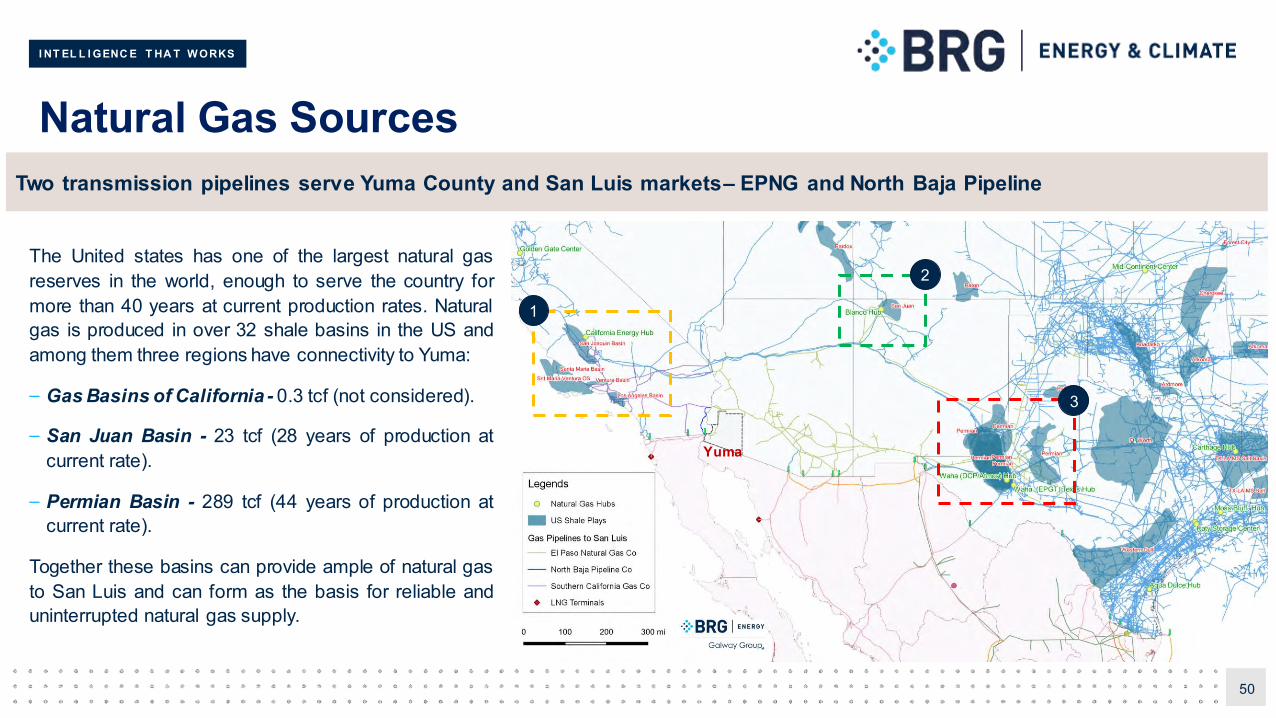
Two transmission pipelines serve Yuma County and San Luis markets– EPNG and North Baja Pipeline
The United states has one of the largest natural gasreserves in the world, enough to serve the country formore than 40 years at current production rates. Naturalgas is produced in over 32 shale basins in the US andamong them three regions have connectivity to Yuma:
– Gas Basins of California - 0.3 tcf (not considered).
– San Juan Basin - 23 tcf (28 years of production atcurrent rate).
– Permian Basin - 289 tcf (44 years of production atcurrent rate).
Together these basins can provide ample of natural gasto San Luis and can form as the basis for reliable anduninterrupted natural gas supply.
Yuma
1
2
3
I NT EL L I GENC E T HA T W ORKS
Natural Gas Pricing
51
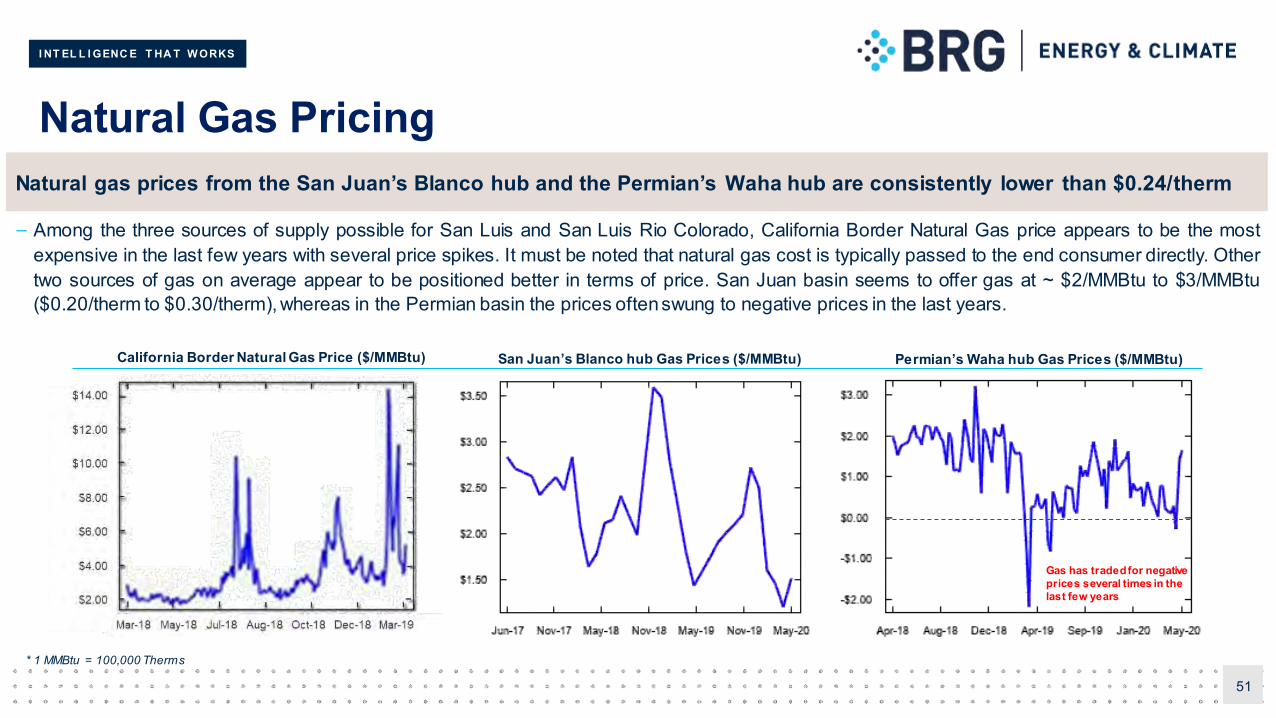
Natural gas prices from the San Juan’s Blanco hub and the Permian’s Waha hub are consistently lower than $0.24/therm
San Juan’s Blanco hub Gas Prices ($/MMBtu) Permian’s Waha hub Gas Prices ($/MMBtu)
* 1 MMBtu = 100,000 Therms
Gas has traded for negative prices several times in the last few years
California Border Natural Gas Price ($/MMBtu)
– Among the three sources of supply possible for San Luis and San Luis Rio Colorado, California Border Natural Gas price appears to be the mostexpensive in the last few years with several price spikes. It must be noted that natural gas cost is typically passed to the end consumer directly. Othertwo sources of gas on average appear to be positioned better in terms of price. San Juan basin seems to offer gas at ~ $2/MMBtu to $3/MMBtu($0.20/therm to $0.30/therm), whereas in the Permian basin the prices oftenswung to negative prices in the last years.
I NT EL L I GENC E T HA T W ORKS
Natural Gas Transmission (1 of 3)
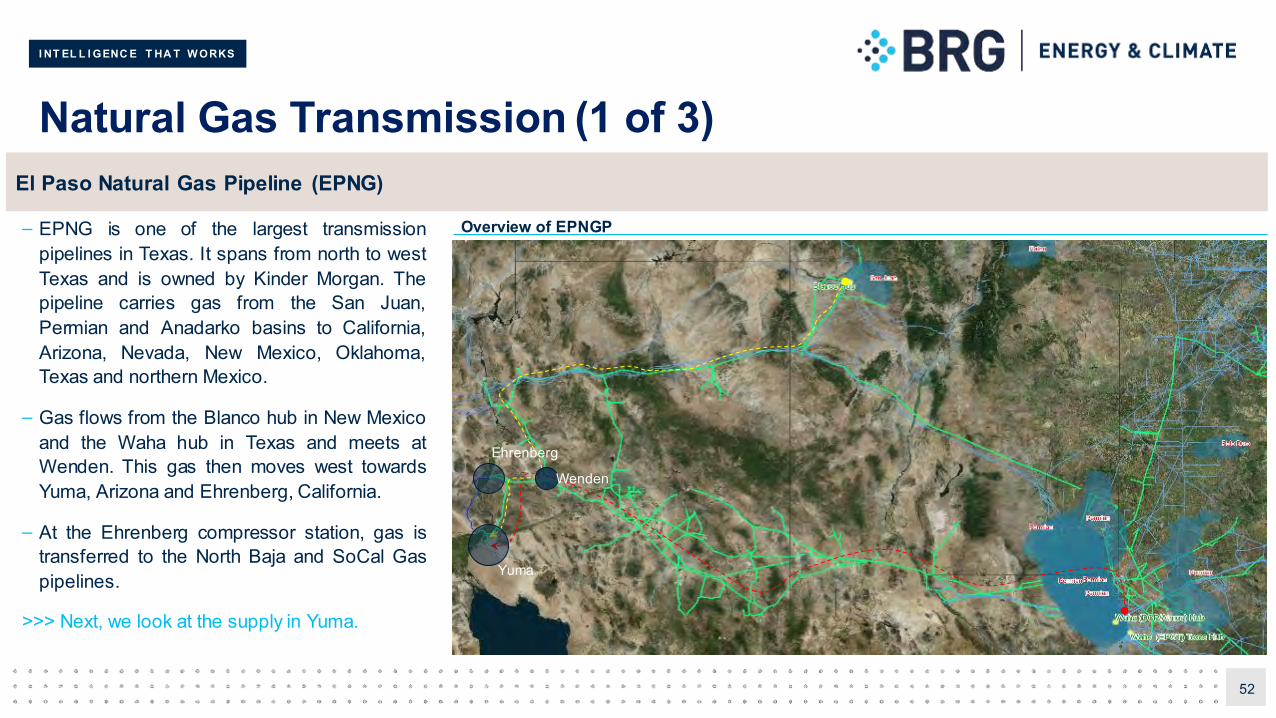
– EPNG is one of the largest transmissionpipelines in Texas. It spans from north to westTexas and is owned by Kinder Morgan. Thepipeline carries gas from the San Juan,Permian and Anadarko basins to California,Arizona, Nevada, New Mexico, Oklahoma,Texas and northern Mexico.
– Gas flows from the Blanco hub in New Mexicoand the Waha hub in Texas and meets atWenden. This gas then moves west towardsYuma, Arizona and Ehrenberg, California.
– At the Ehrenberg compressor station, gas istransferred to the North Baja and SoCal Gaspipelines.
>>> Next, we look at the supply in Yuma.
52
El Paso Natural Gas Pipeline (EPNG)
Wenden
Overview of EPNGP
Yuma
Ehrenberg
I NT EL L I GENC E T HA T W ORKS
Natural Gas Transmission (2 of 3)
53
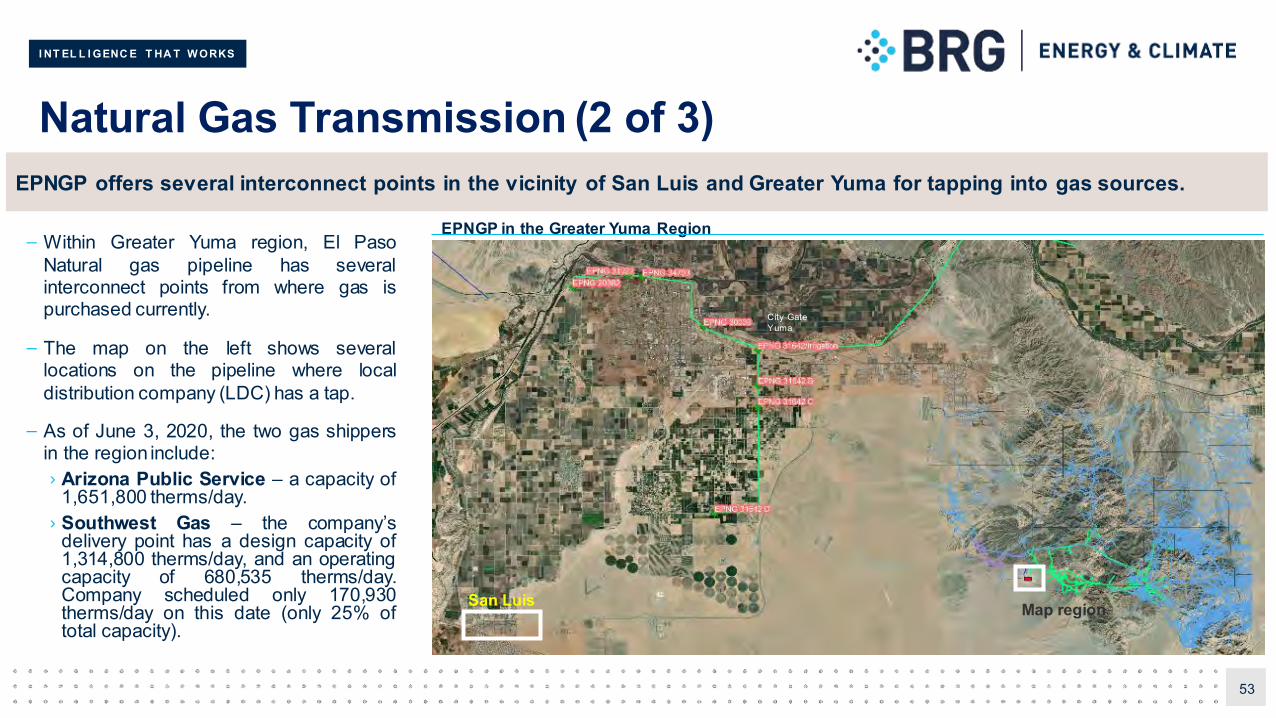
EPNGP offers several interconnect points in the vicinity of San Luis and Greater Yuma for tapping into gas sources.
Map regionSan Luis
City Gate Yuma
EPNGP in the Greater Yuma Region– Within Greater Yuma region, El Paso
Natural gas pipeline has severalinterconnect points from where gas ispurchased currently.
– The map on the left shows severallocations on the pipeline where localdistribution company (LDC) has a tap.
– As of June 3, 2020, the two gas shippersin the region include:› Arizona Public Service – a capacity of
1,651,800 therms/day.› Southwest Gas – the company’s
delivery point has a design capacity of1,314,800 therms/day, and an operatingcapacity of 680,535 therms/day.Company scheduled only 170,930therms/day on this date (only 25% oftotal capacity).
I NT EL L I GENC E T HA T W ORKS
Natural Gas Transmission (3 of 3)
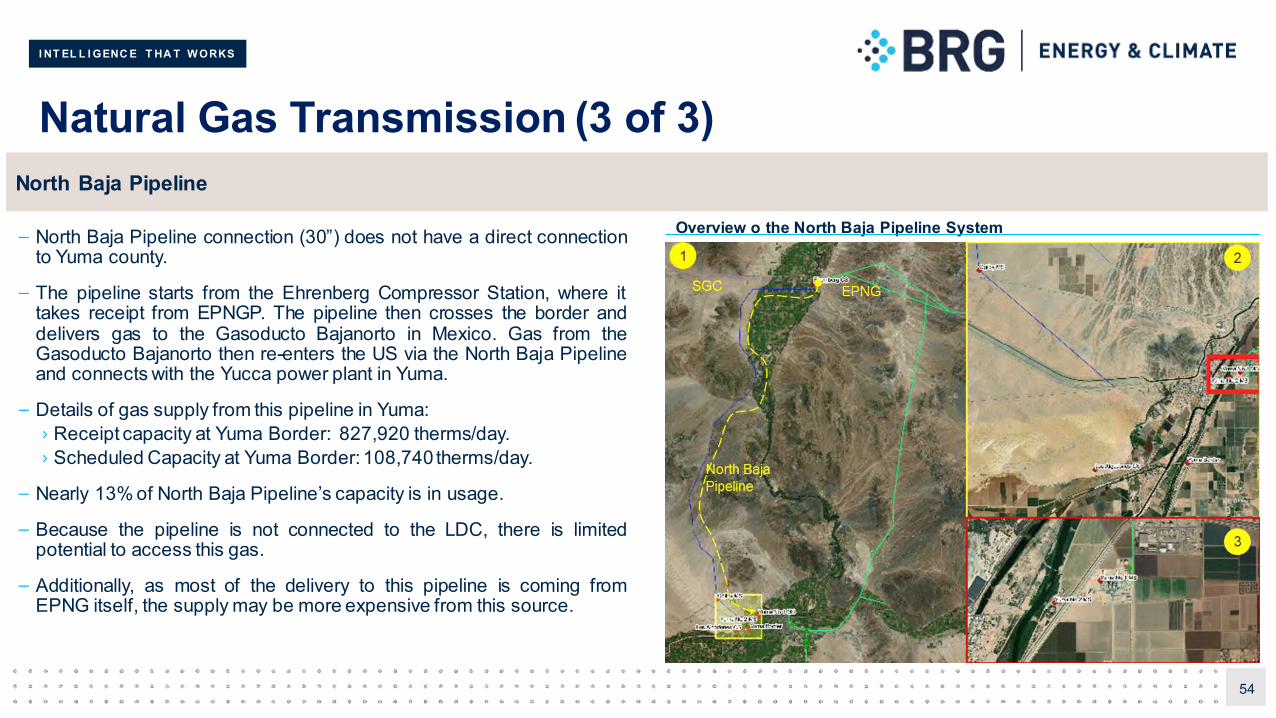
– North Baja Pipeline connection (30”) does not have a direct connectionto Yuma county.
– The pipeline starts from the Ehrenberg Compressor Station, where ittakes receipt from EPNGP. The pipeline then crosses the border anddelivers gas to the Gasoducto Bajanorto in Mexico. Gas from theGasoducto Bajanorto then re-enters the US via the North Baja Pipelineand connects with the Yucca power plant in Yuma.
– Details of gas supply from this pipeline in Yuma:› Receipt capacity at Yuma Border: 827,920 therms/day.› Scheduled Capacity at Yuma Border: 108,740 therms/day.
– Nearly 13% of North Baja Pipeline’s capacity is in usage.
– Because the pipeline is not connected to the LDC, there is limitedpotential to access this gas.
– Additionally, as most of the delivery to this pipeline is coming fromEPNG itself, the supply may be more expensive from this source.
54
North Baja Pipeline
Overview o the North Baja Pipeline System
I NT EL L I GENC E T HA T W ORKS
Local Distribution Network (1 of 2)
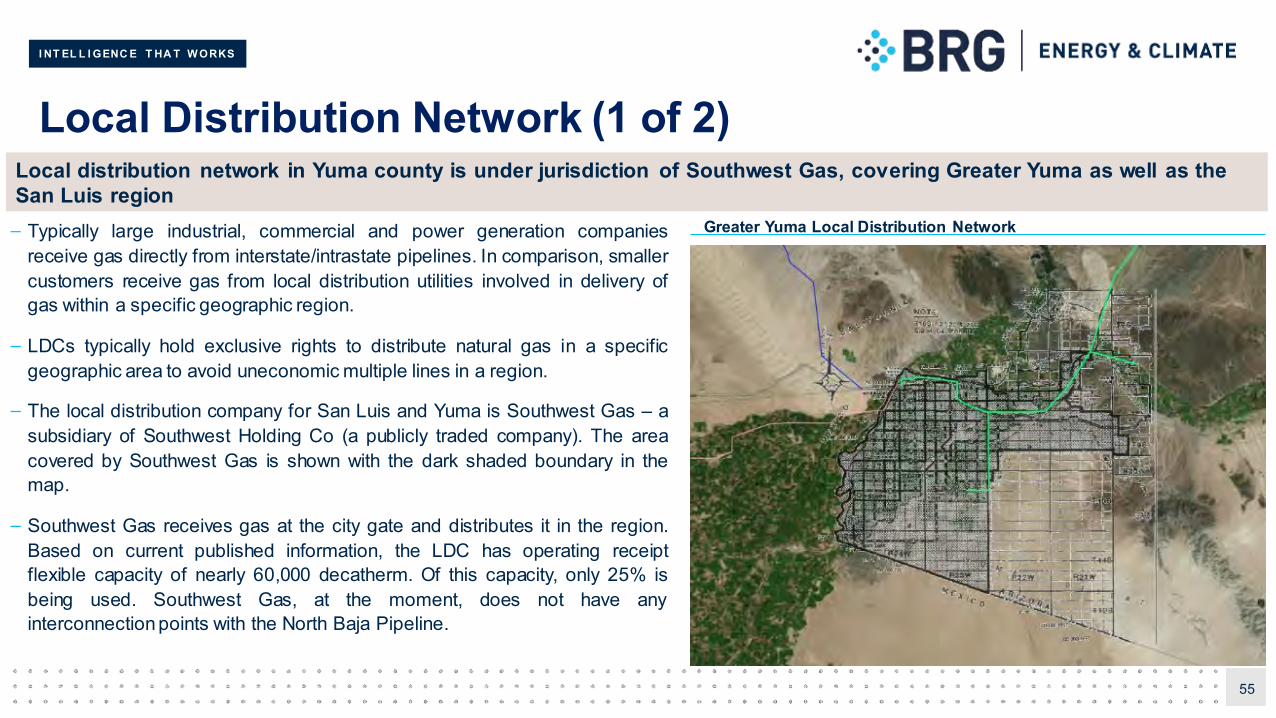
– Typically large industrial, commercial and power generation companiesreceive gas directly from interstate/intrastate pipelines. In comparison, smallercustomers receive gas from local distribution utilities involved in delivery ofgas within a specific geographic region.
– LDCs typically hold exclusive rights to distribute natural gas in a specificgeographic area to avoid uneconomic multiple lines in a region.
– The local distribution company for San Luis and Yuma is Southwest Gas – asubsidiary of Southwest Holding Co (a publicly traded company). The areacovered by Southwest Gas is shown with the dark shaded boundary in themap.
– Southwest Gas receives gas at the city gate and distributes it in the region.Based on current published information, the LDC has operating receiptflexible capacity of nearly 60,000 decatherm. Of this capacity, only 25% isbeing used. Southwest Gas, at the moment, does not have anyinterconnection points with the North Baja Pipeline.
55
Local distribution network in Yuma county is under jurisdiction of Southwest Gas, covering Greater Yuma as well as the San Luis region
Greater Yuma Local Distribution Network
I NT EL L I GENC E T HA T W ORKS
Local Distribution Network (2 of 2)
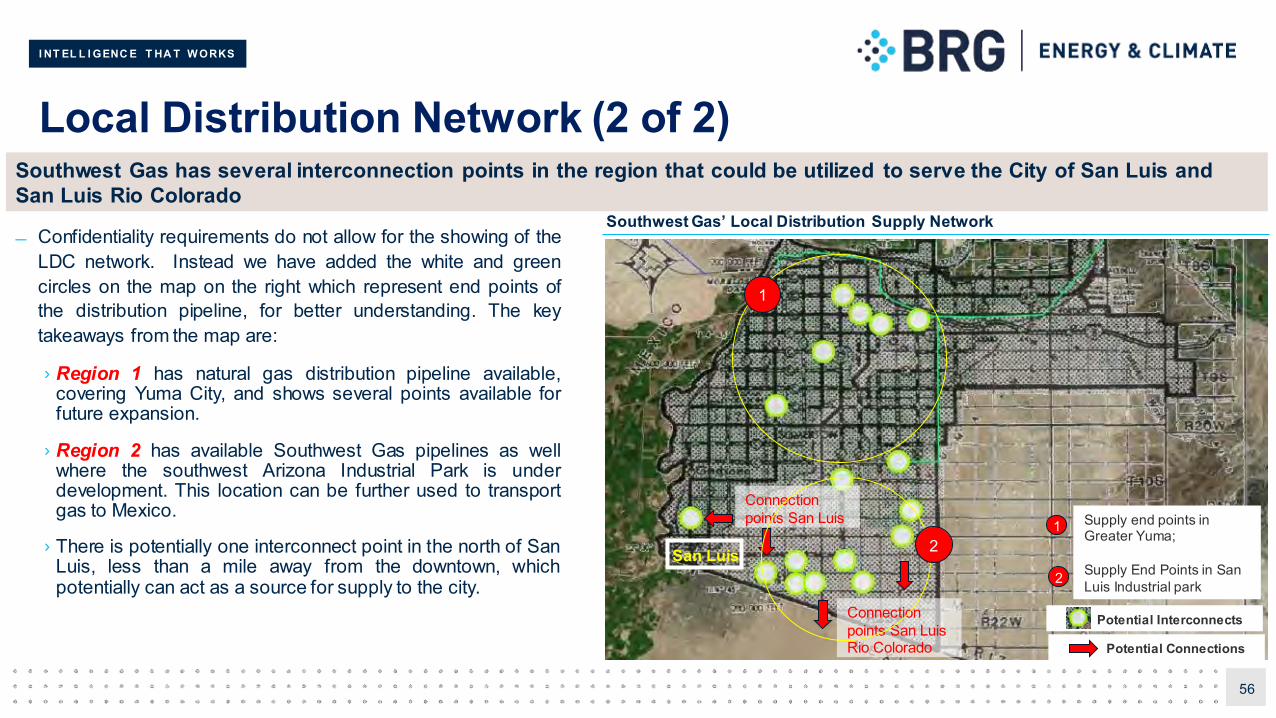
Confidentiality requirements do not allow for the showing of theLDC network. Instead we have added the white and greencircles on the map on the right which represent end points ofthe distribution pipeline, for better understanding. The keytakeaways from the map are:
› Region 1 has natural gas distribution pipeline available,covering Yuma City, and shows several points available forfuture expansion.
› Region 2 has available Southwest Gas pipelines as wellwhere the southwest Arizona Industrial Park is underdevelopment. This location can be further used to transportgas to Mexico.
› There is potentially one interconnect point in the north of SanLuis, less than a mile away from the downtown, whichpotentially can act as a source for supply to the city.
56
Southwest Gas has several interconnection points in the region that could be utilized to serve the City of San Luis and San Luis Rio Colorado
San Luis
Connection points San Luis
Potential Connections
Connection points San Luis Rio Colorado
1
2
Southwest Gas’ Local Distribution Supply Network
Potential Interconnects
1 Supply end points in Greater Yuma;
Supply End Points in San Luis Industrial park2
I NT EL L I GENC E T HA T W ORKS
Supply Conclusion
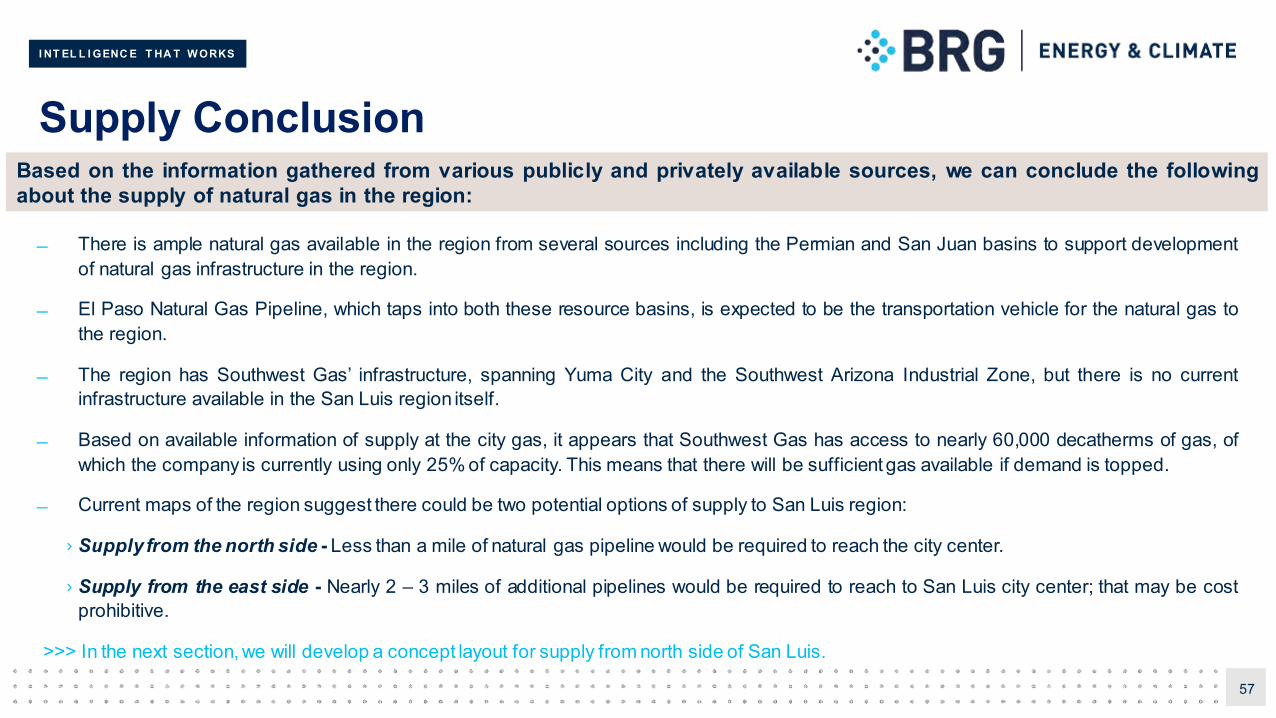
There is ample natural gas available in the region from several sources including the Permian and San Juan basins to support developmentof natural gas infrastructure in the region.
El Paso Natural Gas Pipeline, which taps into both these resource basins, is expected to be the transportation vehicle for the natural gas tothe region.
The region has Southwest Gas’ infrastructure, spanning Yuma City and the Southwest Arizona Industrial Zone, but there is no currentinfrastructure available in the San Luis region itself.
Based on available information of supply at the city gas, it appears that Southwest Gas has access to nearly 60,000 decatherms of gas, ofwhich the company is currently using only 25% of capacity. This means that there will be sufficient gas available if demand is topped.
Current maps of the region suggest there could be two potential options of supply to San Luis region:
› Supply from the north side - Less than a mile of natural gas pipeline would be required to reach the city center.
› Supply from the east side - Nearly 2 – 3 miles of additional pipelines would be required to reach to San Luis city center; that may be costprohibitive.
>>> In the next section, we will develop a concept layout for supply from north side of San Luis.
57
Based on the information gathered from various publicly and privately available sources, we can conclude the followingabout the supply of natural gas in the region:
I NT EL L I GENC E T HA T W ORKS
Next steps
58
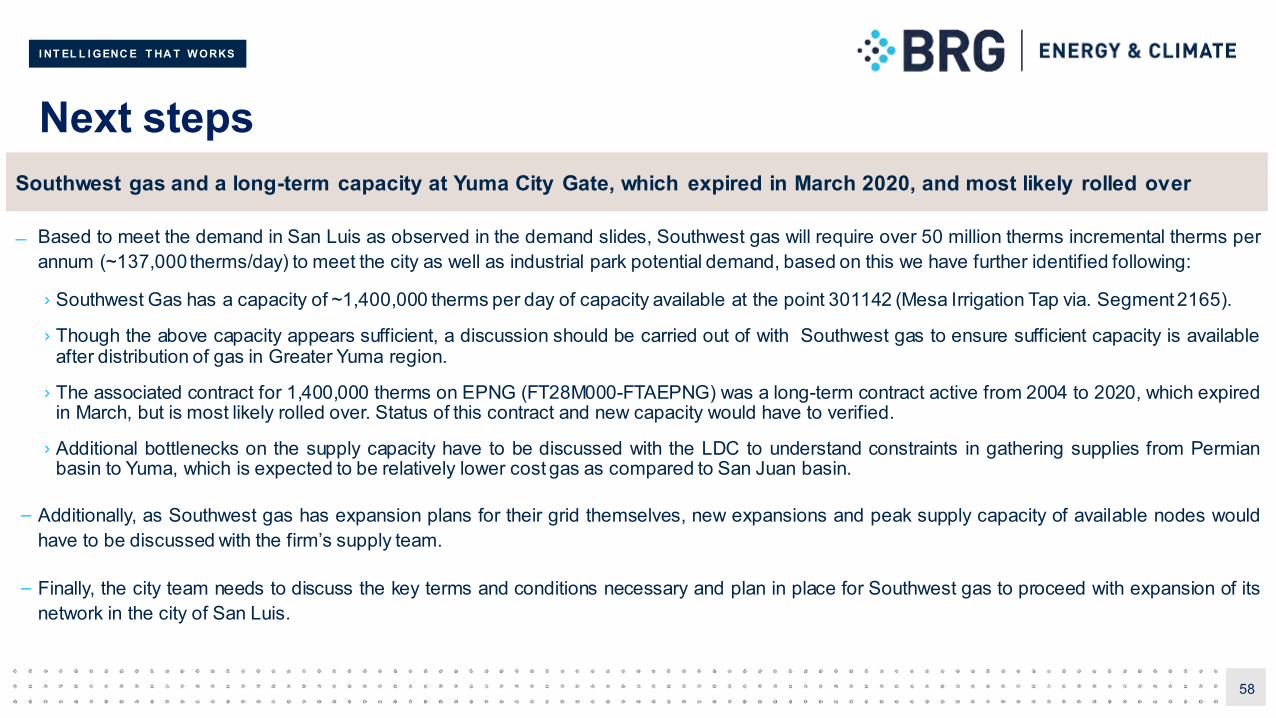
Southwest gas and a long-term capacity at Yuma City Gate, which expired in March 2020, and most likely rolled over
Based to meet the demand in San Luis as observed in the demand slides, Southwest gas will require over 50 million therms incremental therms perannum (~137,000 therms/day) to meet the city as well as industrial park potential demand, based on this we have further identified following:
› Southwest Gas has a capacity of ~1,400,000 therms per day of capacity available at the point 301142 (Mesa Irrigation Tap via. Segment 2165).
› Though the above capacity appears sufficient, a discussion should be carried out of with Southwest gas to ensure sufficient capacity is availableafter distribution of gas in Greater Yuma region.
› The associated contract for 1,400,000 therms on EPNG (FT28M000-FTAEPNG) was a long-term contract active from 2004 to 2020, which expiredin March, but is most likely rolled over. Status of this contract and new capacity would have to verified.
› Additional bottlenecks on the supply capacity have to be discussed with the LDC to understand constraints in gathering supplies from Permianbasin to Yuma, which is expected to be relatively lower cost gas as compared to San Juan basin.
– Additionally, as Southwest gas has expansion plans for their grid themselves, new expansions and peak supply capacity of available nodes wouldhave to be discussed with the firm’s supply team.
– Finally, the city team needs to discuss the key terms and conditions necessary and plan in place for Southwest gas to proceed with expansion of itsnetwork in the city of San Luis.

I NT EL L I GENC E T HA T W ORKS
6 Routing and Conceptual Design
I NT EL L I GENC E T HA T W ORKS
Conceptual Design Background
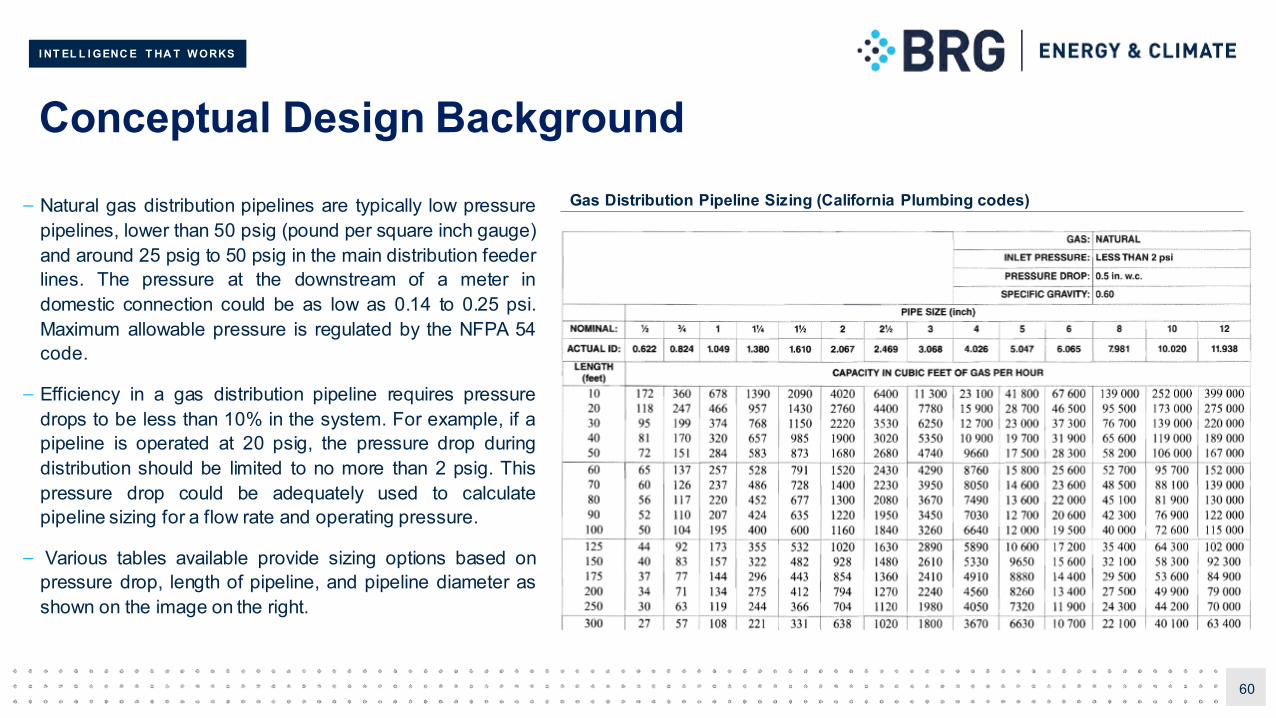
– Natural gas distribution pipelines are typically low pressurepipelines, lower than 50 psig (pound per square inch gauge)and around 25 psig to 50 psig in the main distribution feederlines. The pressure at the downstream of a meter indomestic connection could be as low as 0.14 to 0.25 psi.Maximum allowable pressure is regulated by the NFPA 54code.
– Efficiency in a gas distribution pipeline requires pressuredrops to be less than 10% in the system. For example, if apipeline is operated at 20 psig, the pressure drop duringdistribution should be limited to no more than 2 psig. Thispressure drop could be adequately used to calculatepipeline sizing for a flow rate and operating pressure.
– Various tables available provide sizing options based onpressure drop, length of pipeline, and pipeline diameter asshown on the image on the right.
60
Gas Distribution Pipeline Sizing (California Plumbing codes)
I NT EL L I GENC E T HA T W ORKS
Conceptual Design Background
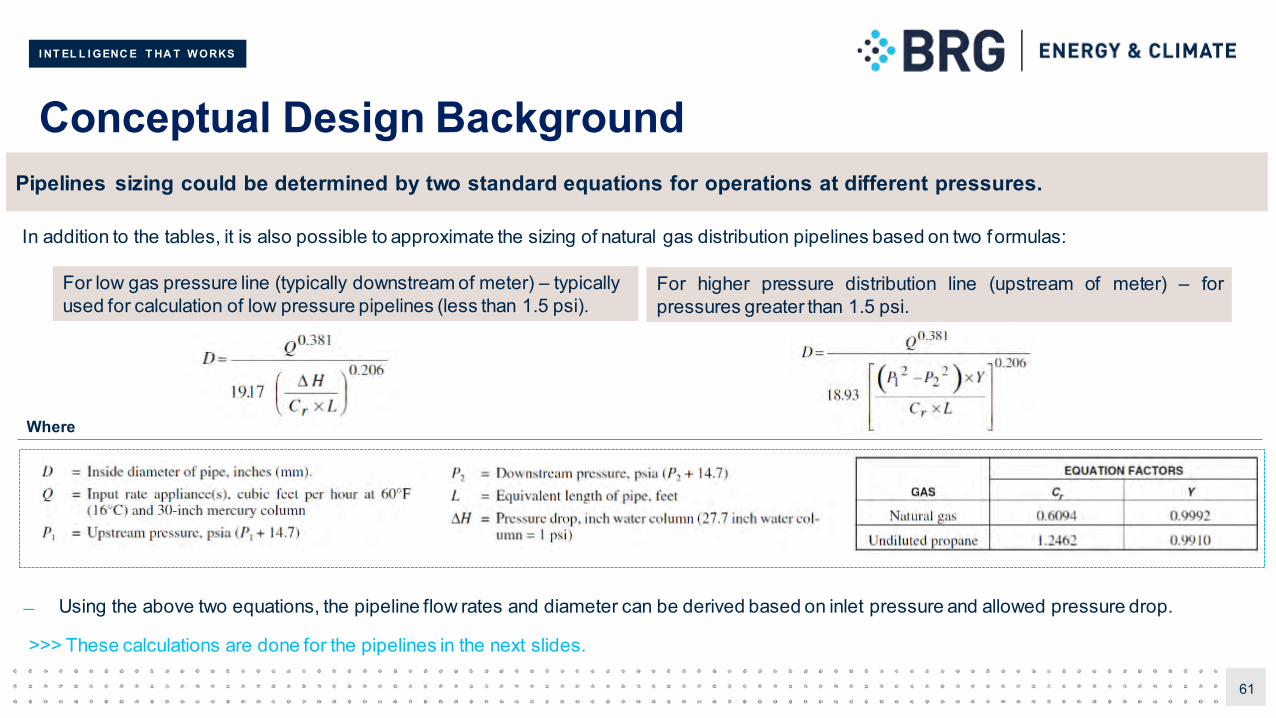
In addition to the tables, it is also possible to approximate the sizing of natural gas distribution pipelines based on two formulas:
61
Using the above two equations, the pipeline flow rates and diameter can be derived based on inlet pressure and allowed pressure drop.
>>> These calculations are done for the pipelines in the next slides.
Pipelines sizing could be determined by two standard equations for operations at different pressures.
For low gas pressure line (typically downstream of meter) – typically used for calculation of low pressure pipelines (less than 1.5 psi).
For higher pressure distribution line (upstream of meter) – forpressures greater than 1.5 psi.
Where
I NT EL L I GENC E T HA T W ORKS
Pipeline Layout and Proposed Route
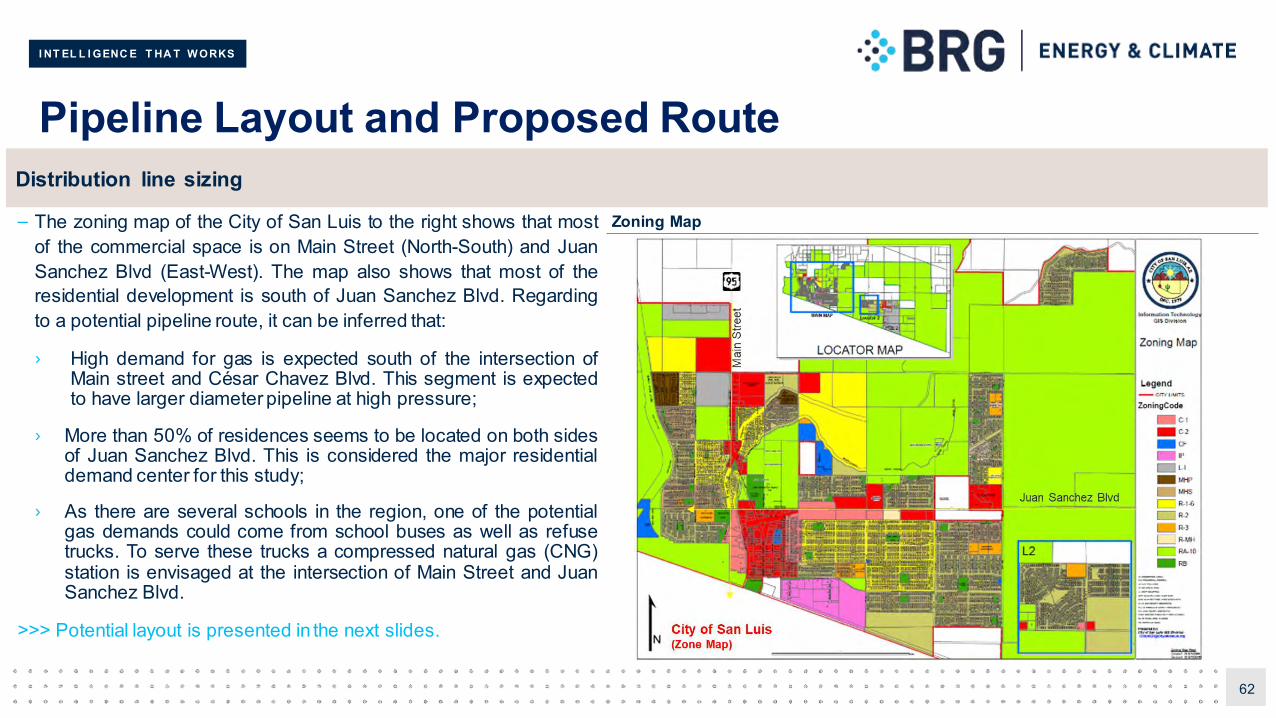
– The zoning map of the City of San Luis to the right shows that mostof the commercial space is on Main Street (North-South) and JuanSanchez Blvd (East-West). The map also shows that most of theresidential development is south of Juan Sanchez Blvd. Regardingto a potential pipeline route, it can be inferred that:
› High demand for gas is expected south of the intersection ofMain street and César Chavez Blvd. This segment is expectedto have larger diameter pipeline at high pressure;
› More than 50% of residences seems to be located on both sidesof Juan Sanchez Blvd. This is considered the major residentialdemand center for this study;
› As there are several schools in the region, one of the potentialgas demands could come from school buses as well as refusetrucks. To serve these trucks a compressed natural gas (CNG)station is envisaged at the intersection of Main Street and JuanSanchez Blvd.
>>> Potential layout is presented in the next slides.
62
Distribution line sizing
Zoning Map
I NT EL L I GENC E T HA T W ORKS
Concept Layout and Pipeline Sizing (1 of 3)
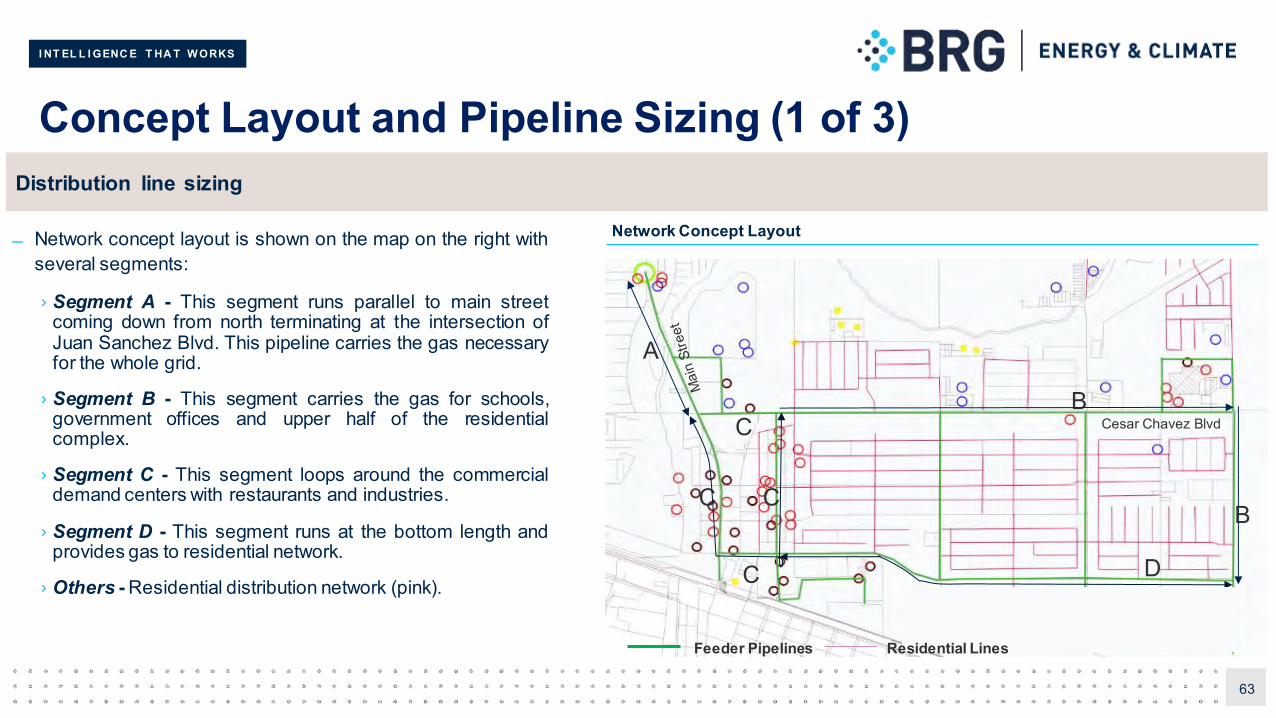
Network concept layout is shown on the map on the right withseveral segments:
› Segment A - This segment runs parallel to main streetcoming down from north terminating at the intersection ofJuan Sanchez Blvd. This pipeline carries the gas necessaryfor the whole grid.
› Segment B - This segment carries the gas for schools,government offices and upper half of the residentialcomplex.
› Segment C - This segment loops around the commercialdemand centers with restaurants and industries.
› Segment D - This segment runs at the bottom length andprovides gas to residential network.
› Others - Residential distribution network (pink).
63
Distribution line sizing
Network Concept Layout
A
B
B
D
C C
Feeder Pipelines
Cesar Chavez Blvd
C
C
Residential Lines
I NT EL L I GENC E T HA T W ORKS
Concept Layout and Pipeline Sizing (2 of 3)
64
12,175 SCFH
5,433 SCFH
1,81
1 SC
FH
7,667 SCFH
1,81
1 SC
FH
1,81
1 SC
FH
5,856 SCFH
37,8
34 S
CFH
9,35
0 SC
FH
CNG Station + 50% others Demand
20% others Demand
30% others Demand
1,811 SCFH
1,811 SCFH
1,811 SCFH
Commercial Sector
30 psi
27 psi
6”, 0.5 miles
6”, 0.5 miles
0.2 miles 3”, 0.5 miles
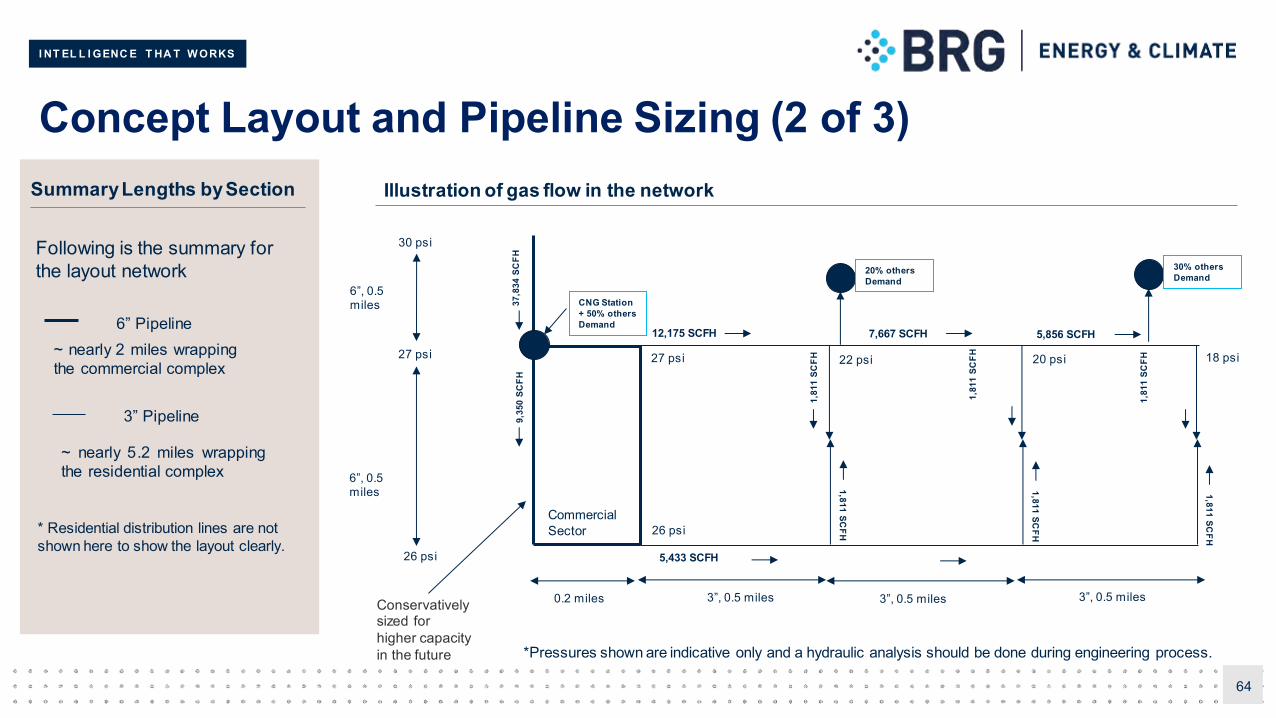
Summary Lengths by Section
26 psi
27 psi
26 psi
22 psi 20 psi 18 psi
3”, 0.5 miles 3”, 0.5 miles
6” Pipeline
3” Pipeline
~ nearly 5.2 miles wrappingthe residential complex
~ nearly 2 miles wrappingthe commercial complex
Following is the summary for the layout network
* Residential distribution lines are not shown here to show the layout clearly.
Illustration of gas flow in the network
*Pressures shown are indicative only and a hydraulic analysis should be done during engineering process.
Conservatively sized for higher capacity in the future
I NT EL L I GENC E T HA T W ORKS
Considerations for the Pipeline
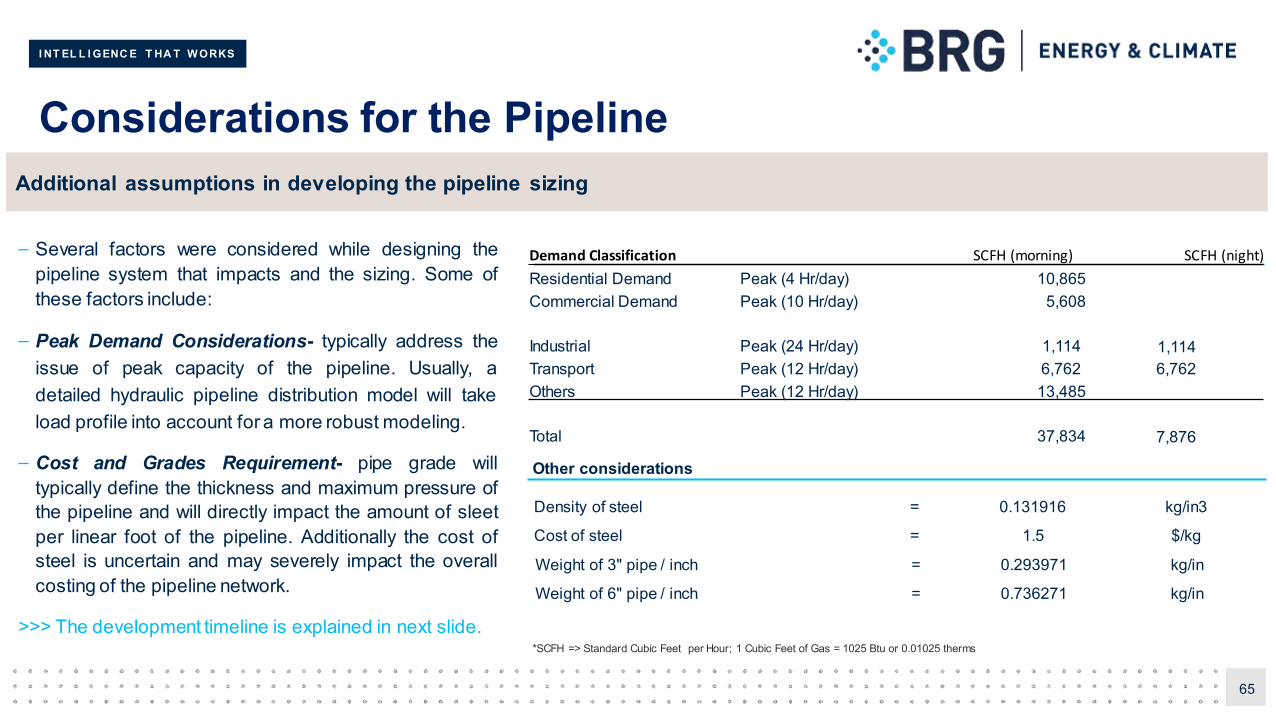
– Several factors were considered while designing thepipeline system that impacts and the sizing. Some ofthese factors include:
– Peak Demand Considerations- typically address theissue of peak capacity of the pipeline. Usually, adetailed hydraulic pipeline distribution model will takeload profile into account for a more robust modeling.
– Cost and Grades Requirement- pipe grade willtypically define the thickness and maximum pressure ofthe pipeline and will directly impact the amount of sleetper linear foot of the pipeline. Additionally the cost ofsteel is uncertain and may severely impact the overallcosting of the pipeline network.
>>> The development timeline is explained in next slide.
65
Additional assumptions in developing the pipeline sizing
Density of steel = 0.131916 kg/in3
Cost of steel = 1.5 $/kg
Weight of 3" pipe / inch = 0.293971 kg/in
Weight of 6" pipe / inch = 0.736271 kg/in
Other considerations
*SCFH => Standard Cubic Feet per Hour; 1 Cubic Feet of Gas = 1025 Btu or 0.01025 therms
Demand Classification SCFH (morning) SCFH (night)
Residential Demand Peak (4 Hr/day) 10,865 Commercial Demand Peak (10 Hr/day) 5,608
Industrial Peak (24 Hr/day) 1,114 1,114 Transport Peak (12 Hr/day) 6,762 6,762 Others Peak (12 Hr/day) 13,485
Total 37,834 7,876
I NT EL L I GENC E T HA T W ORKS
Concept Layout and Pipeline Sizing (3 of 3)
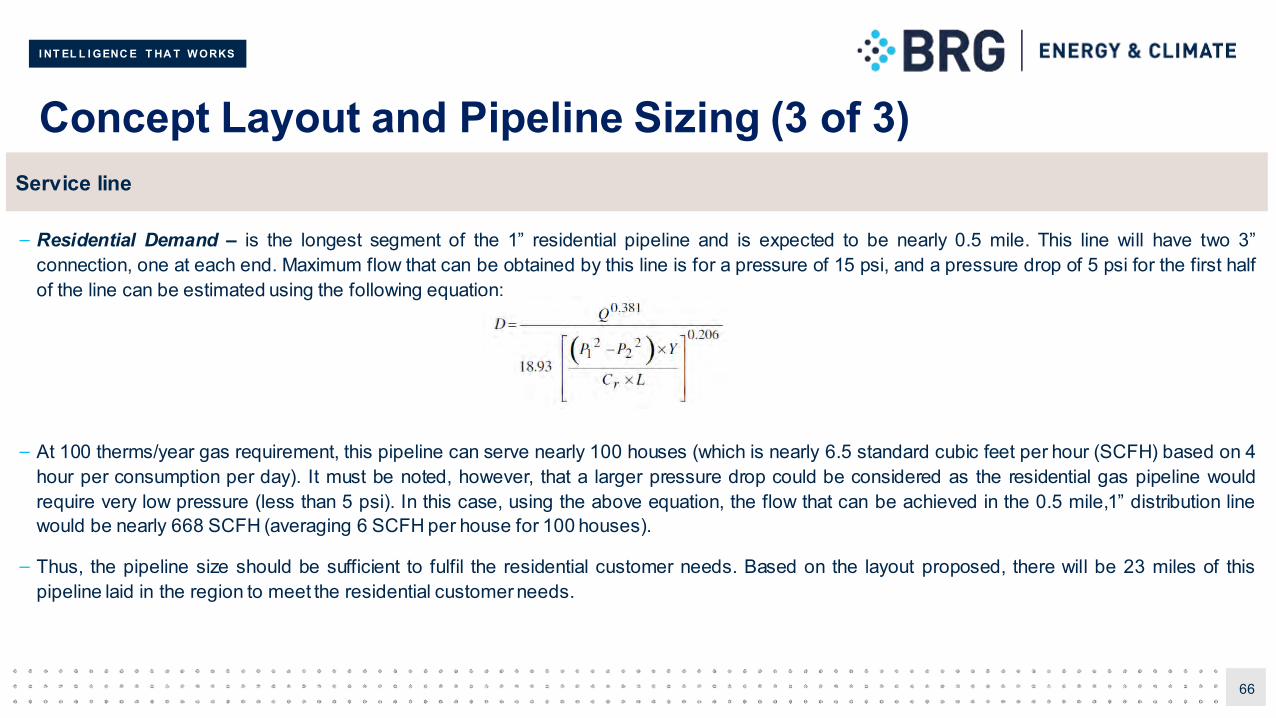
– Residential Demand – is the longest segment of the 1” residential pipeline and is expected to be nearly 0.5 mile. This line will have two 3”connection, one at each end. Maximum flow that can be obtained by this line is for a pressure of 15 psi, and a pressure drop of 5 psi for the first halfof the line can be estimated using the following equation:
– At 100 therms/year gas requirement, this pipeline can serve nearly 100 houses (which is nearly 6.5 standard cubic feet per hour (SCFH) based on 4hour per consumption per day). It must be noted, however, that a larger pressure drop could be considered as the residential gas pipeline wouldrequire very low pressure (less than 5 psi). In this case, using the above equation, the flow that can be achieved in the 0.5 mile,1” distribution linewould be nearly 668 SCFH (averaging 6 SCFH per house for 100 houses).
– Thus, the pipeline size should be sufficient to fulfil the residential customer needs. Based on the layout proposed, there will be 23 miles of thispipeline laid in the region to meet the residential customer needs.
66
Service line
I NT EL L I GENC E T HA T W ORKS
Initial Cost Estimates (1 of 3)
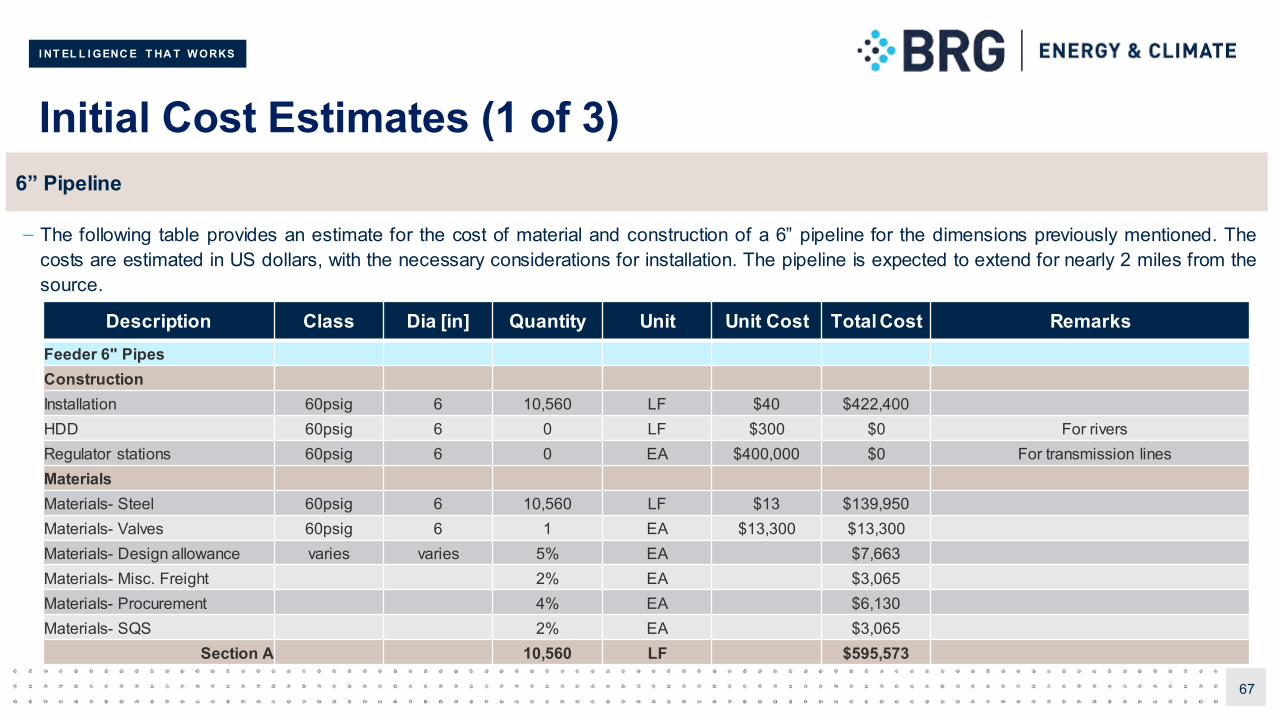
– The following table provides an estimate for the cost of material and construction of a 6” pipeline for the dimensions previously mentioned. Thecosts are estimated in US dollars, with the necessary considerations for installation. The pipeline is expected to extend for nearly 2 miles from thesource.
67
6” Pipeline
Description Class Dia [in] Quantity Unit Unit Cost Total Cost RemarksFeeder 6" PipesConstructionInstallation 60psig 6 10,560 LF $40 $422,400HDD 60psig 6 0 LF $300 $0 For riversRegulator stations 60psig 6 0 EA $400,000 $0 For transmission linesMaterialsMaterials- Steel 60psig 6 10,560 LF $13 $139,950Materials- Valves 60psig 6 1 EA $13,300 $13,300Materials- Design allowance varies varies 5% EA $7,663Materials- Misc. Freight 2% EA $3,065Materials- Procurement 4% EA $6,130Materials- SQS 2% EA $3,065
Section A 10,560 LF $595,573
I NT EL L I GENC E T HA T W ORKS
Initial Cost Estimates (2 of 3)
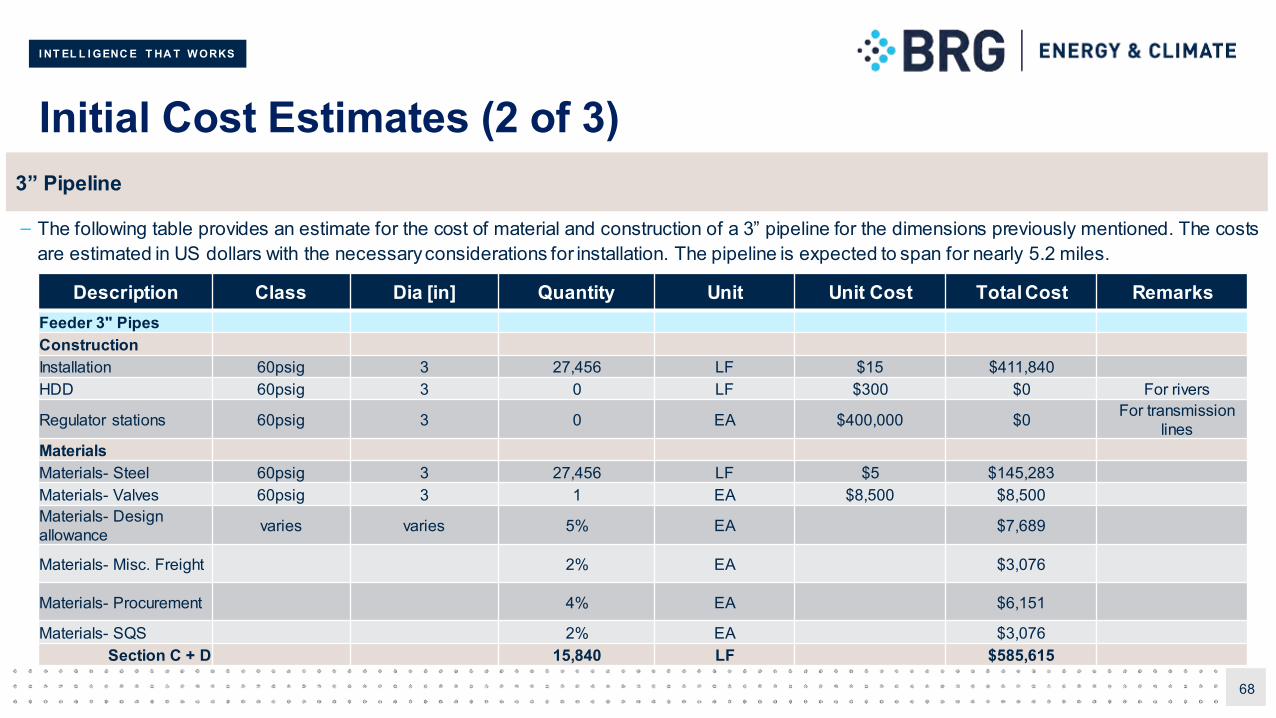
– The following table provides an estimate for the cost of material and construction of a 3” pipeline for the dimensions previously mentioned. The costsare estimated in US dollars with the necessaryconsiderations for installation. The pipeline is expected to span for nearly 5.2 miles.
68
3” Pipeline
Description Class Dia [in] Quantity Unit Unit Cost Total Cost RemarksFeeder 3" PipesConstructionInstallation 60psig 3 27,456 LF $15 $411,840HDD 60psig 3 0 LF $300 $0 For rivers
Regulator stations 60psig 3 0 EA $400,000 $0 For transmission lines
MaterialsMaterials- Steel 60psig 3 27,456 LF $5 $145,283Materials- Valves 60psig 3 1 EA $8,500 $8,500Materials- Design allowance varies varies 5% EA $7,689
Materials- Misc. Freight 2% EA $3,076
Materials- Procurement 4% EA $6,151
Materials- SQS 2% EA $3,076Section C + D 15,840 LF $585,615
I NT EL L I GENC E T HA T W ORKS
Initial Cost Estimates (3 of 3)
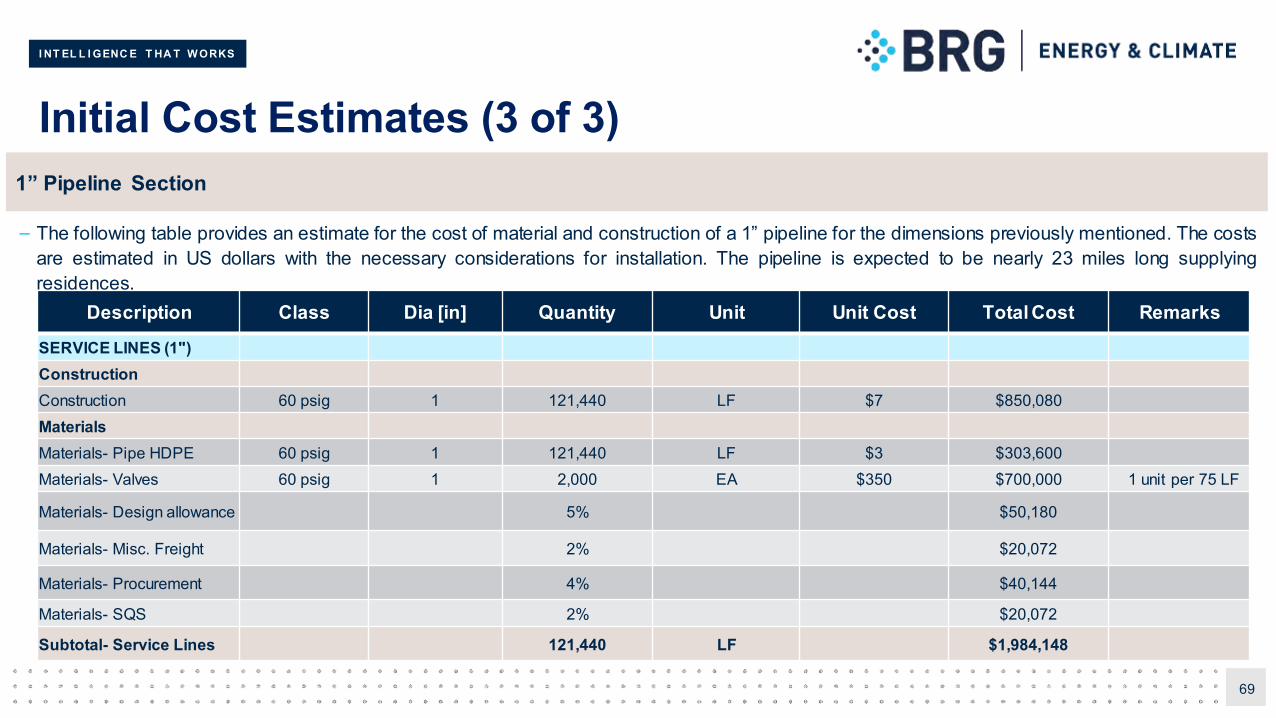
– The following table provides an estimate for the cost of material and construction of a 1” pipeline for the dimensions previously mentioned. The costsare estimated in US dollars with the necessary considerations for installation. The pipeline is expected to be nearly 23 miles long supplyingresidences.
69
1” Pipeline Section
Description Class Dia [in] Quantity Unit Unit Cost Total Cost Remarks
SERVICE LINES (1")ConstructionConstruction 60 psig 1 121,440 LF $7 $850,080MaterialsMaterials- Pipe HDPE 60 psig 1 121,440 LF $3 $303,600Materials- Valves 60 psig 1 2,000 EA $350 $700,000 1 unit per 75 LF
Materials- Design allowance 5% $50,180
Materials- Misc. Freight 2% $20,072
Materials- Procurement 4% $40,144
Materials- SQS 2% $20,072
Subtotal- Service Lines 121,440 LF $1,984,148
I NT EL L I GENC E T HA T W ORKS
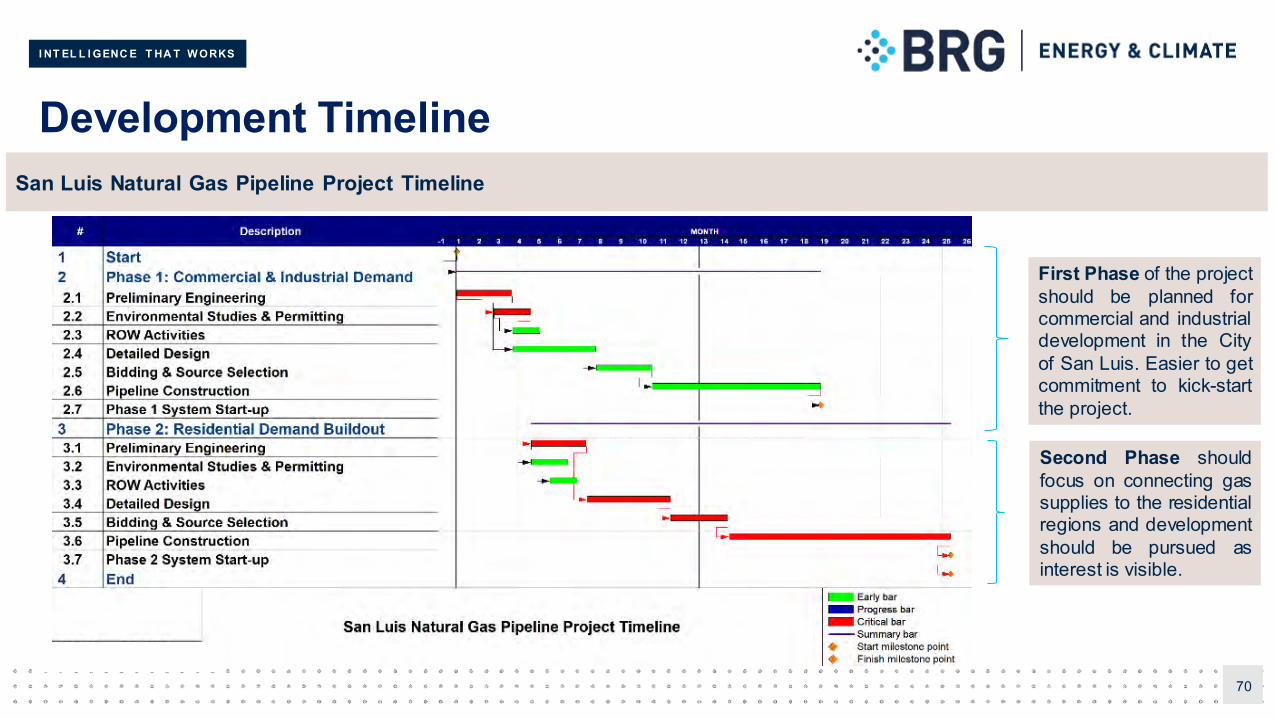
Development Timeline
70
First Phase of the projectshould be planned forcommercial and industrialdevelopment in the Cityof San Luis. Easier to getcommitment to kick-startthe project.
Second Phase shouldfocus on connecting gassupplies to the residentialregions and developmentshould be pursued asinterest is visible.
San Luis Natural Gas Pipeline Project Timeline
I NT EL L I GENC E T HA T W ORKS
CNG Station Layout
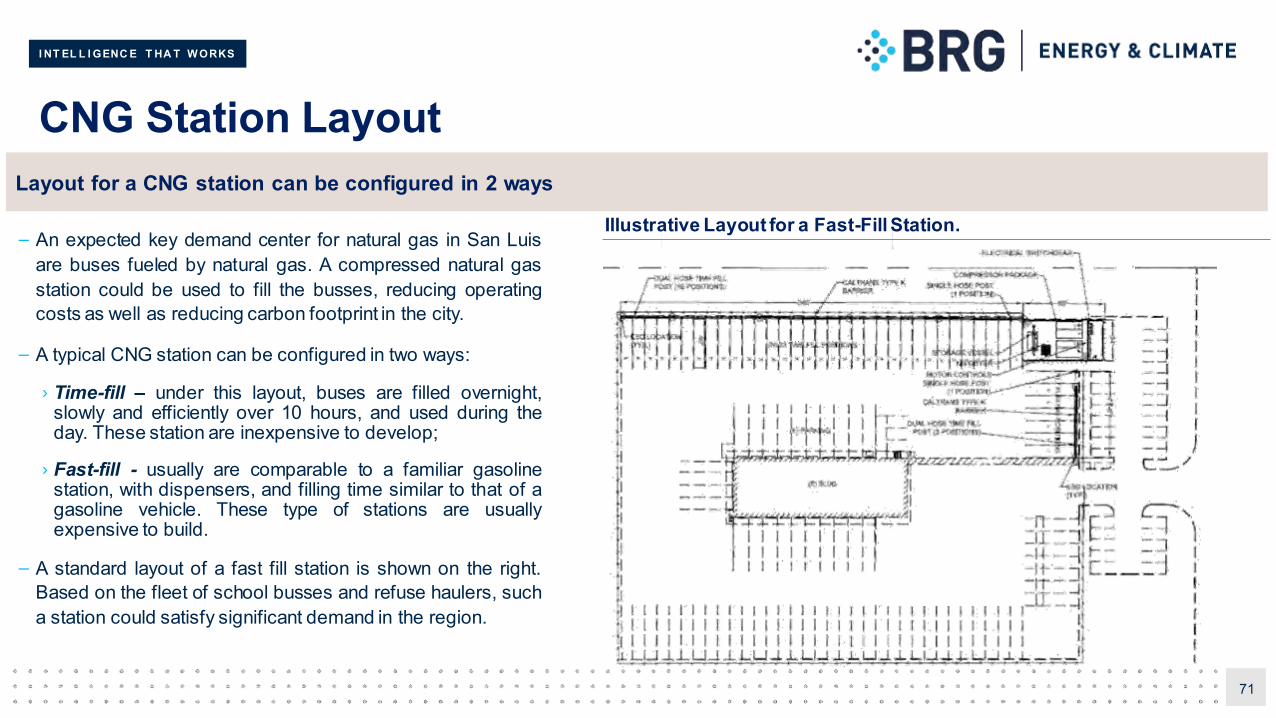
– An expected key demand center for natural gas in San Luisare buses fueled by natural gas. A compressed natural gasstation could be used to fill the busses, reducing operatingcosts as well as reducing carbon footprint in the city.
– A typical CNG station can be configured in two ways:
› Time-fill – under this layout, buses are filled overnight,slowly and efficiently over 10 hours, and used during theday. These station are inexpensive to develop;
› Fast-fill - usually are comparable to a familiar gasolinestation, with dispensers, and filling time similar to that of agasoline vehicle. These type of stations are usuallyexpensive to build.
– A standard layout of a fast fill station is shown on the right.Based on the fleet of school busses and refuse haulers, sucha station could satisfy significant demand in the region.
71
Illustrative Layout for a Fast-Fill Station.
Layout for a CNG station can be configured in 2 ways
I NT EL L I GENC E T HA T W ORKS
CNG Station Cost Estimate
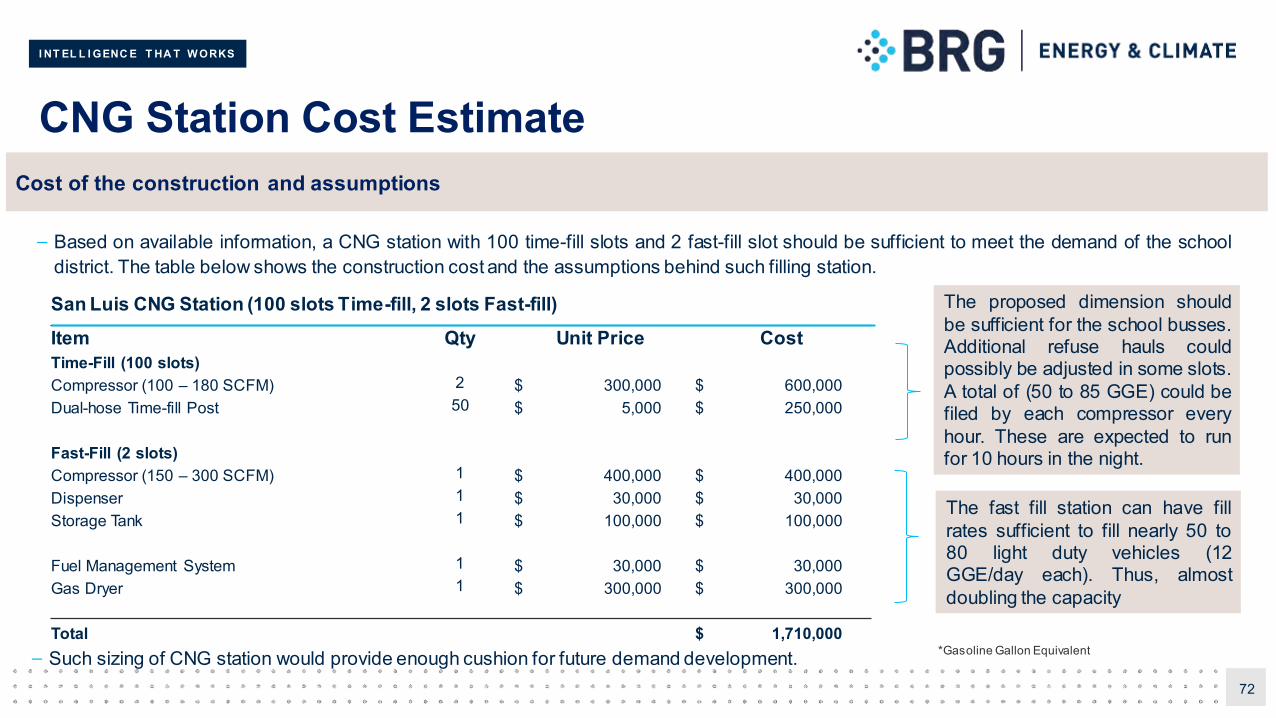
– Based on available information, a CNG station with 100 time-fill slots and 2 fast-fill slot should be sufficient to meet the demand of the schooldistrict. The table below shows the construction cost and the assumptions behind such filling station.
72
San Luis CNG Station (100 slots Time-fill, 2 slots Fast-fill)Item Qty Unit Price CostTime-Fill (100 slots)Compressor (100 – 180 SCFM) 2 $ 300,000 $ 600,000 Dual-hose Time-fill Post 50 $ 5,000 $ 250,000
Fast-Fill (2 slots)Compressor (150 – 300 SCFM) 1 $ 400,000 $ 400,000 Dispenser 1 $ 30,000 $ 30,000 Storage Tank 1 $ 100,000 $ 100,000
Fuel Management System 1 $ 30,000 $ 30,000 Gas Dryer 1 $ 300,000 $ 300,000
Total $ 1,710,000
The proposed dimension shouldbe sufficient for the school busses.Additional refuse hauls couldpossibly be adjusted in some slots.A total of (50 to 85 GGE) could befiled by each compressor everyhour. These are expected to runfor 10 hours in the night.
The fast fill station can have fillrates sufficient to fill nearly 50 to80 light duty vehicles (12GGE/day each). Thus, almostdoubling the capacity
– Such sizing of CNG station would provide enough cushion for future demand development.
Cost of the construction and assumptions
*Gasoline Gallon Equivalent
I NT EL L I GENC E T HA T W ORKS
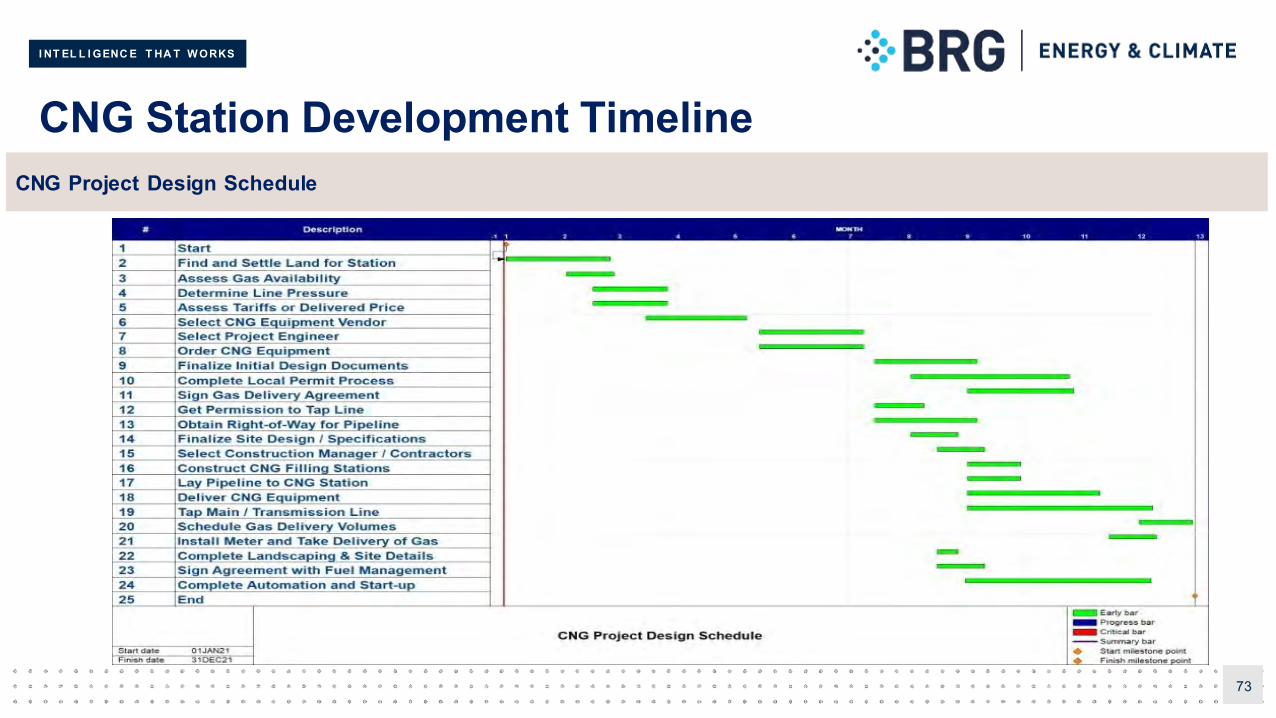
CNG Station Development Timeline
73
CNG Project Design Schedule

I NT EL L I GENC E T HA T W ORKS
7 Supply Alternatives
I NT EL L I GENC E T HA T W ORKS
Overview of Supply Alternatives
– In previous sections we analyzed the possibility of natural gas supply from the north side of the City of San Luis. In this section, we discuss othersupply options of supply as well as an alternate energy option. These includes:
› Revisiting gas supply from the north side.
› Gas supply from the east side of San Luis.
› LNG supply from a liquefaction plant with a regasificationstation at the city.
– Each of the options were then analyzed by the report team to understand their advantages and disadvantages.
– A preliminary cost impact was assessed for each of the options.
– This analysis addresses the basics of available options and weighs these options against the status quo.
>>> This analysis is presented indetail in the next few slides.
75
In this section, we will analyze other supply options available to the City of San Luis
I NT EL L I GENC E T HA T W ORKS
Alternative I – North Supply
San Luis
Connection points San Luis
Potential Connections
Connection points San Luis Rio Colorado
1
2
Potential Interconnects
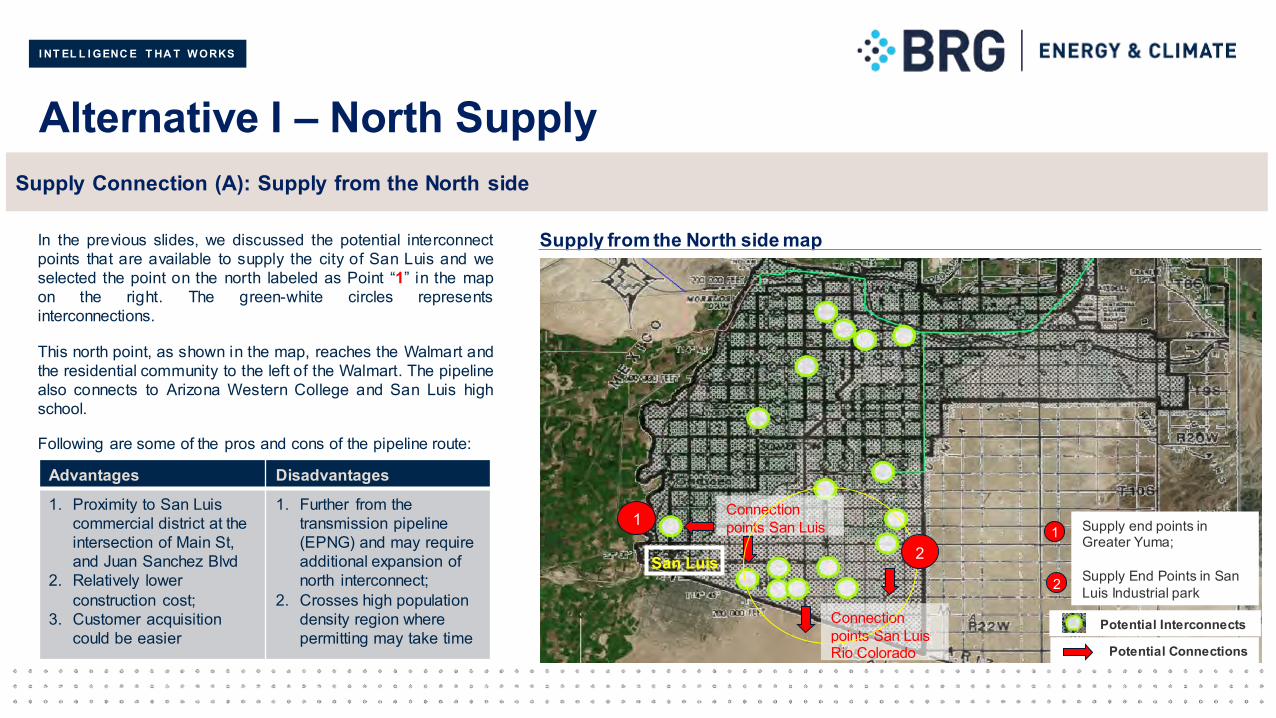
Supply from the North side mapIn the previous slides, we discussed the potential interconnectpoints that are available to supply the city of San Luis and weselected the point on the north labeled as Point “1” in the mapon the right. The green-white circles representsinterconnections.
This north point, as shown in the map, reaches the Walmart andthe residential community to the left of the Walmart. The pipelinealso connects to Arizona Western College and San Luis highschool.
Following are some of the pros and cons of the pipeline route:
Advantages Disadvantages
1. Proximity to San Luis commercial district at the intersection of Main St, and Juan Sanchez Blvd
2. Relatively lower construction cost;
3. Customer acquisition could be easier
1. Further from the transmission pipeline (EPNG) and may require additional expansion of north interconnect;
2. Crosses high population density region where permitting may take time
Supply Connection (A): Supply from the North side
1 Supply end points in Greater Yuma;
Supply End Points in San Luis Industrial park2
I NT EL L I GENC E T HA T W ORKS
Alternative II – East Supply
77
Supply from the East side map
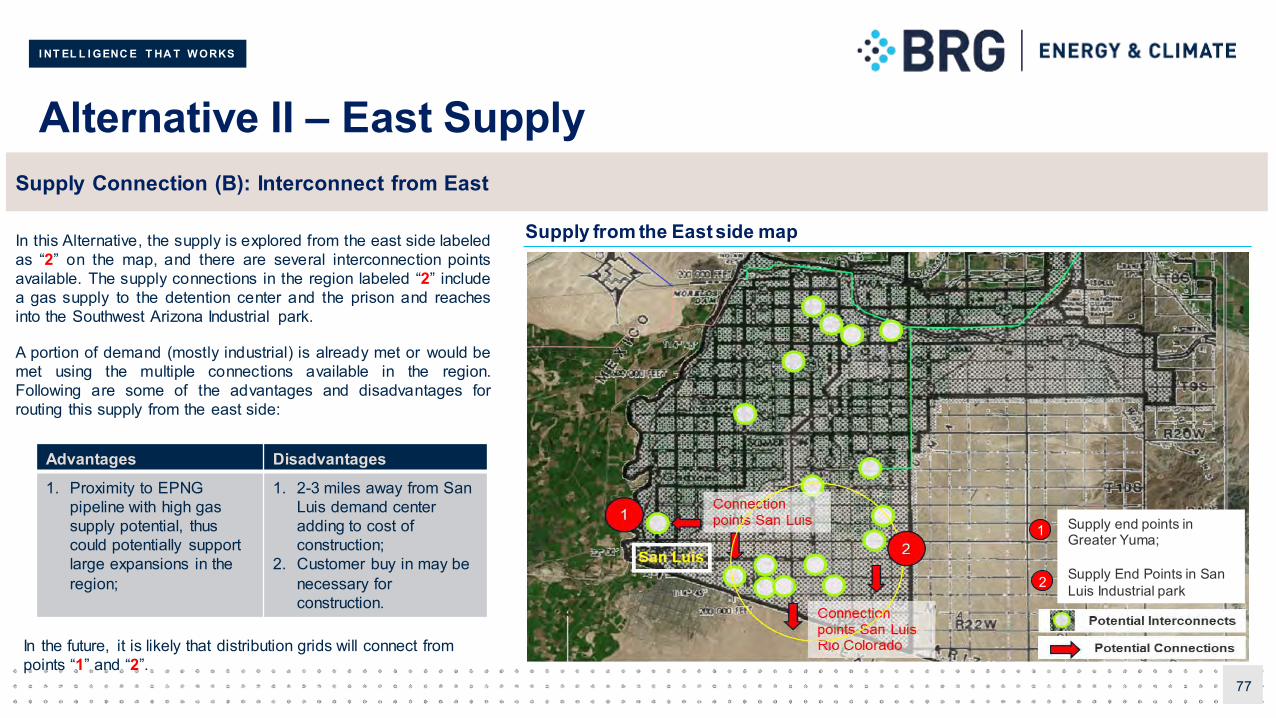
Supply Connection (B): Interconnect from East
In this Alternative, the supply is explored from the east side labeledas “2” on the map, and there are several interconnection pointsavailable. The supply connections in the region labeled “2” includea gas supply to the detention center and the prison and reachesinto the Southwest Arizona Industrial park.
A portion of demand (mostly industrial) is already met or would bemet using the multiple connections available in the region.Following are some of the advantages and disadvantages forrouting this supply from the east side:
Advantages Disadvantages
1. Proximity to EPNG pipeline with high gas supply potential, thus could potentially support large expansions in the region;
1. 2-3 miles away from San Luis demand center adding to cost of construction;
2. Customer buy in may be necessary for construction.
In the future, it is likely that distribution grids will connect from points “1” and “2”.
1 Supply end points in Greater Yuma;
Supply End Points in San Luis Industrial park2
I NT EL L I GENC E T HA T W ORKS
Alternative III – LNG Trucking (1 of 2)
78
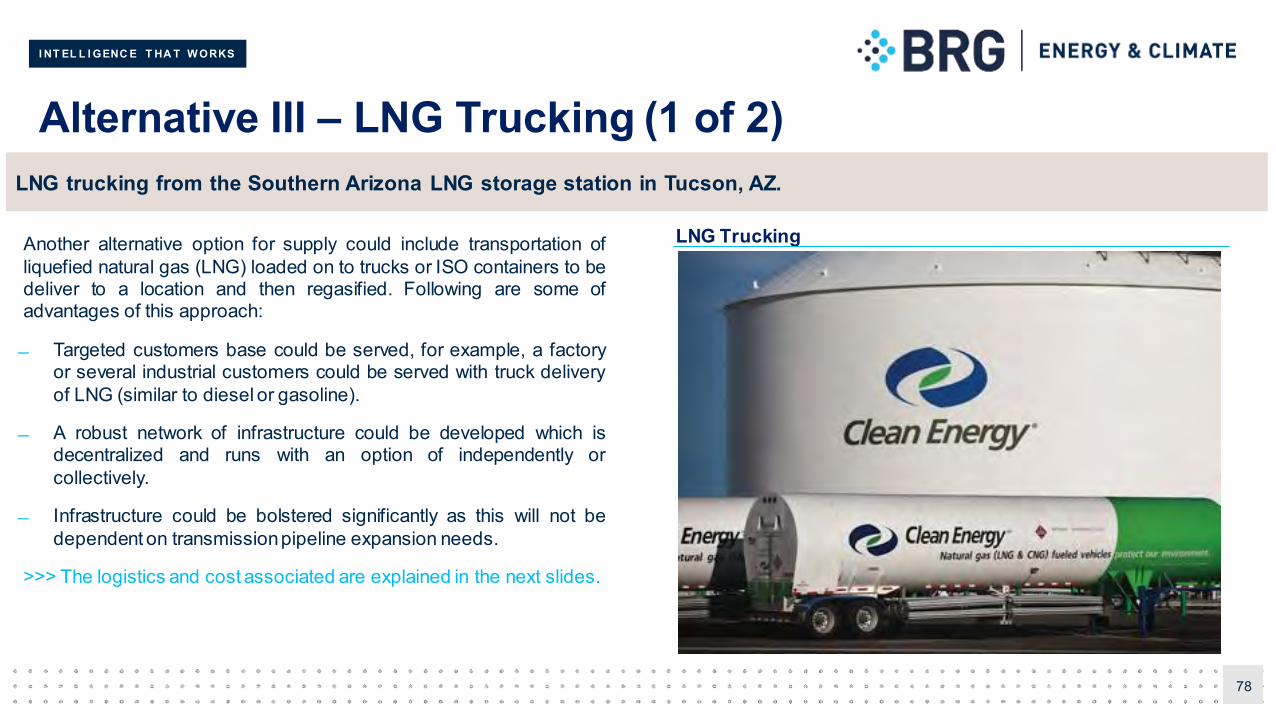
LNG TruckingAnother alternative option for supply could include transportation ofliquefied natural gas (LNG) loaded on to trucks or ISO containers to bedeliver to a location and then regasified. Following are some ofadvantages of this approach:
Targeted customers base could be served, for example, a factoryor several industrial customers could be served with truck deliveryof LNG (similar to diesel or gasoline).
A robust network of infrastructure could be developed which isdecentralized and runs with an option of independently orcollectively.
Infrastructure could be bolstered significantly as this will not bedependent on transmissionpipeline expansion needs.
>>> The logistics and cost associated are explained in the next slides.
LNG trucking from the Southern Arizona LNG storage station in Tucson, AZ.
I NT EL L I GENC E T HA T W ORKS
Alternative III – LNG Trucking (2 of 2)
79
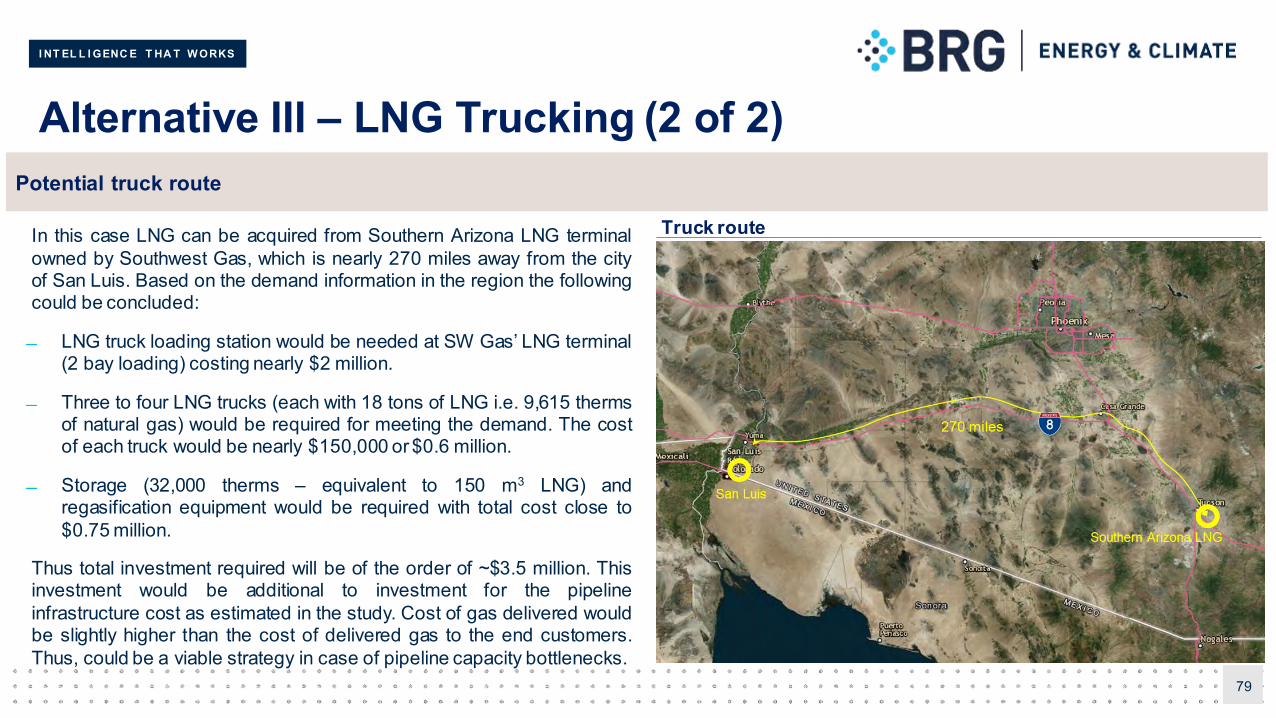
Truck routeIn this case LNG can be acquired from Southern Arizona LNG terminalowned by Southwest Gas, which is nearly 270 miles away from the cityof San Luis. Based on the demand information in the region the followingcould be concluded:
LNG truck loading station would be needed at SW Gas’ LNG terminal(2 bay loading) costing nearly $2 million.
Three to four LNG trucks (each with 18 tons of LNG i.e. 9,615 thermsof natural gas) would be required for meeting the demand. The costof each truck would be nearly $150,000 or $0.6 million.
Storage (32,000 therms – equivalent to 150 m3 LNG) andregasification equipment would be required with total cost close to$0.75 million.
Thus total investment required will be of the order of ~$3.5 million. Thisinvestment would be additional to investment for the pipelineinfrastructure cost as estimated in the study. Cost of gas delivered wouldbe slightly higher than the cost of delivered gas to the end customers.Thus, could be a viable strategy in case of pipeline capacity bottlenecks.
Potential truck route
I NT EL L I GENC E T HA T W ORKS
Conclusion Alternatives
80
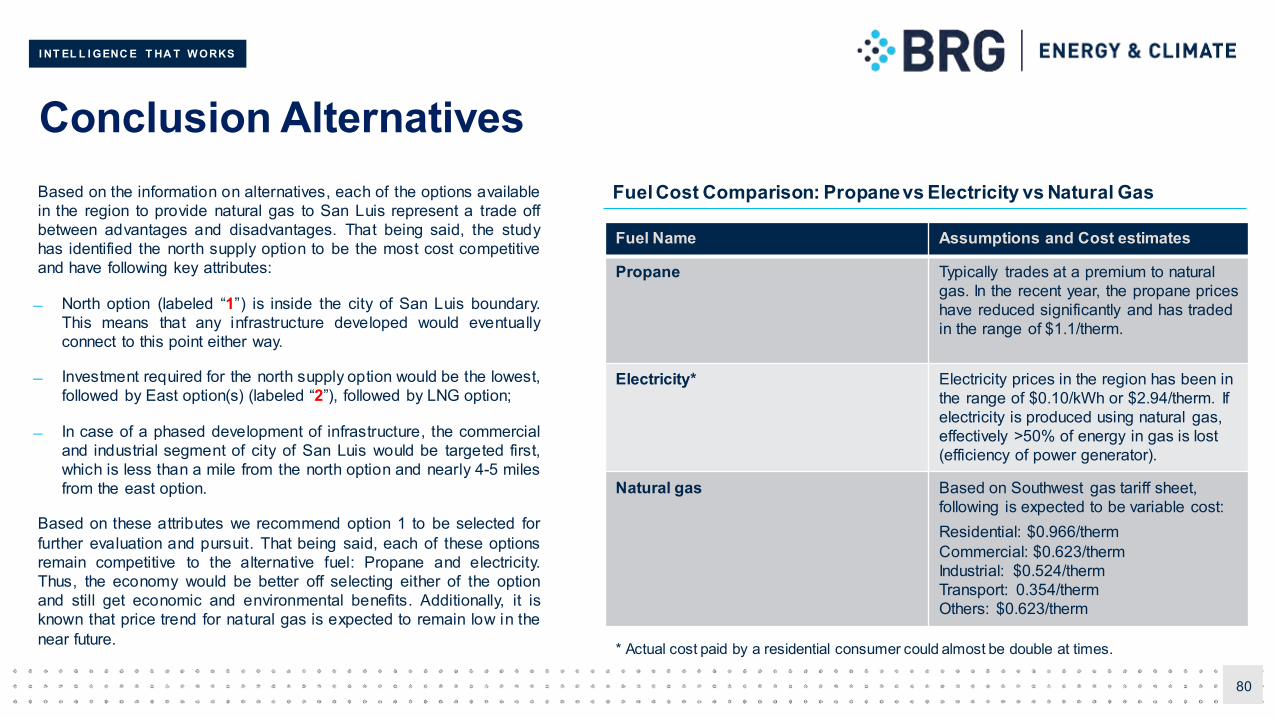
Based on the information on alternatives, each of the options availablein the region to provide natural gas to San Luis represent a trade offbetween advantages and disadvantages. That being said, the studyhas identified the north supply option to be the most cost competitiveand have following key attributes:
North option (labeled “1”) is inside the city of San Luis boundary.This means that any infrastructure developed would eventuallyconnect to this point either way.
Investment required for the north supply option would be the lowest,followed by East option(s) (labeled “2”), followed by LNG option;
In case of a phased development of infrastructure, the commercialand industrial segment of city of San Luis would be targeted first,which is less than a mile from the north option and nearly 4-5 milesfrom the east option.
Based on these attributes we recommend option 1 to be selected forfurther evaluation and pursuit. That being said, each of these optionsremain competitive to the alternative fuel: Propane and electricity.Thus, the economy would be better off selecting either of the optionand still get economic and environmental benefits. Additionally, it isknown that price trend for natural gas is expected to remain low in thenear future.
Fuel Name Assumptions and Cost estimates
Propane Typically trades at a premium to natural gas. In the recent year, the propane prices have reduced significantly and has traded in the range of $1.1/therm.
Electricity* Electricity prices in the region has been in the range of $0.10/kWh or $2.94/therm. If electricity is produced using natural gas, effectively >50% of energy in gas is lost (efficiency of power generator).
Natural gas Based on Southwest gas tariff sheet, following is expected to be variable cost:Residential: $0.966/thermCommercial: $0.623/thermIndustrial: $0.524/thermTransport: 0.354/thermOthers: $0.623/therm
Fuel Cost Comparison: Propane vs Electricity vs Natural Gas
* Actual cost paid by a residential consumer could almost be double at times.

I NT EL L I GENC E T HA T W ORKS
8 Economic Feasibility
I NT EL L I GENC E T HA T W ORKS
Financial Feasibility Analysis Overview
– Gas infrastructure provider facing enough demand to justify making an investment; and,
– Gas buyer has sufficient incentive to switch to natural gas as it is made available.
– Consequently, this analysis develops:
› For Infrastructure provider:
An economic model based on existing tariff for different customers to evaluate if rate of return objective is met. In case of a regulated utility, thegas infrastructure allowed return of investment is assumed to be 10% (equivalent to cost of capital). In reality, this number would be slightlylower. Assumptionare detailed in the later slides.
› For Gas buyer:
Transport User - Delivered/filled CNG price is compared against the Diesel price. CNG bus and station payback period is demonstrated.
Commercial User - Delivered gas price is compared against propane price.
Residential User - Fuel cost is comparedagainst electricity cost in heating/cooking.
>>> These sections are detailed in the next slides.
82
Feasibility of adoption of an alternative fuel requires careful analysis of value to each of the stakeholders. In verysimplistic terms, we will evaluate:
I NT EL L I GENC E T HA T W ORKS
Gas Supply Infrastructure Feasibility (1 of 3)
83
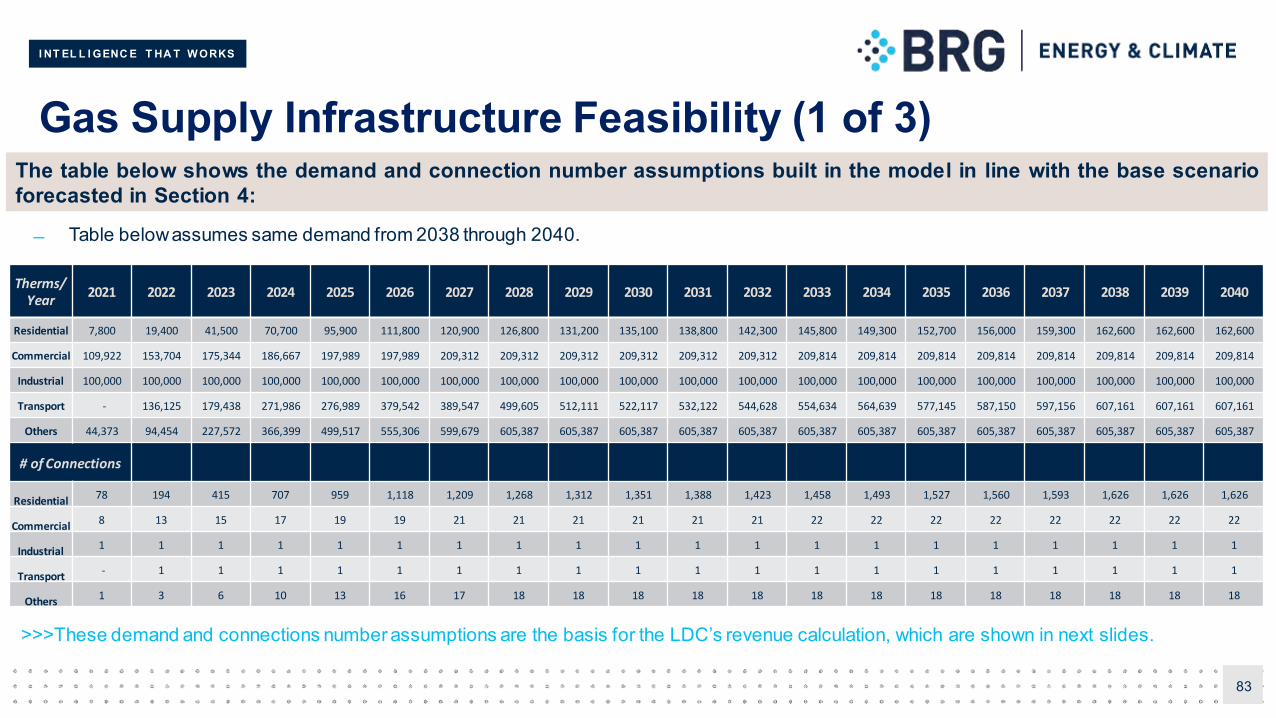
The table below shows the demand and connection number assumptions built in the model in line with the base scenarioforecasted in Section 4:
Table belowassumes same demand from 2038 through 2040.
>>>These demand and connections number assumptions are the basis for the LDC’s revenue calculation, which are shown in next slides.
Therms/ Year
2021 2022 2023 2024 2025 2026 2027 2028 2029 2030 2031 2032 2033 2034 2035 2036 2037 2038 2039 2040
Residential 7,800 19,400 41,500 70,700 95,900 111,800 120,900 126,800 131,200 135,100 138,800 142,300 145,800 149,300 152,700 156,000 159,300 162,600 162,600 162,600
Commercial 109,922 153,704 175,344 186,667 197,989 197,989 209,312 209,312 209,312 209,312 209,312 209,312 209,814 209,814 209,814 209,814 209,814 209,814 209,814 209,814
Industrial 100,000 100,000 100,000 100,000 100,000 100,000 100,000 100,000 100,000 100,000 100,000 100,000 100,000 100,000 100,000 100,000 100,000 100,000 100,000 100,000
Transport - 136,125 179,438 271,986 276,989 379,542 389,547 499,605 512,111 522,117 532,122 544,628 554,634 564,639 577,145 587,150 597,156 607,161 607,161 607,161
Others 44,373 94,454 227,572 366,399 499,517 555,306 599,679 605,387 605,387 605,387 605,387 605,387 605,387 605,387 605,387 605,387 605,387 605,387 605,387 605,387
# of Connections
Residential78 194 415 707 959 1,118 1,209 1,268 1,312 1,351 1,388 1,423 1,458 1,493 1,527 1,560 1,593 1,626 1,626 1,626
Commercial8 13 15 17 19 19 21 21 21 21 21 21 22 22 22 22 22 22 22 22
Industrial1 1 1 1 1 1 1 1 1 1 1 1 1 1 1 1 1 1 1 1
Transport- 1 1 1 1 1 1 1 1 1 1 1 1 1 1 1 1 1 1 1
Others1 3 6 10 13 16 17 18 18 18 18 18 18 18 18 18 18 18 18 18
I NT EL L I GENC E T HA T W ORKS
Gas Supply Infrastructure Feasibility (2 of 3)
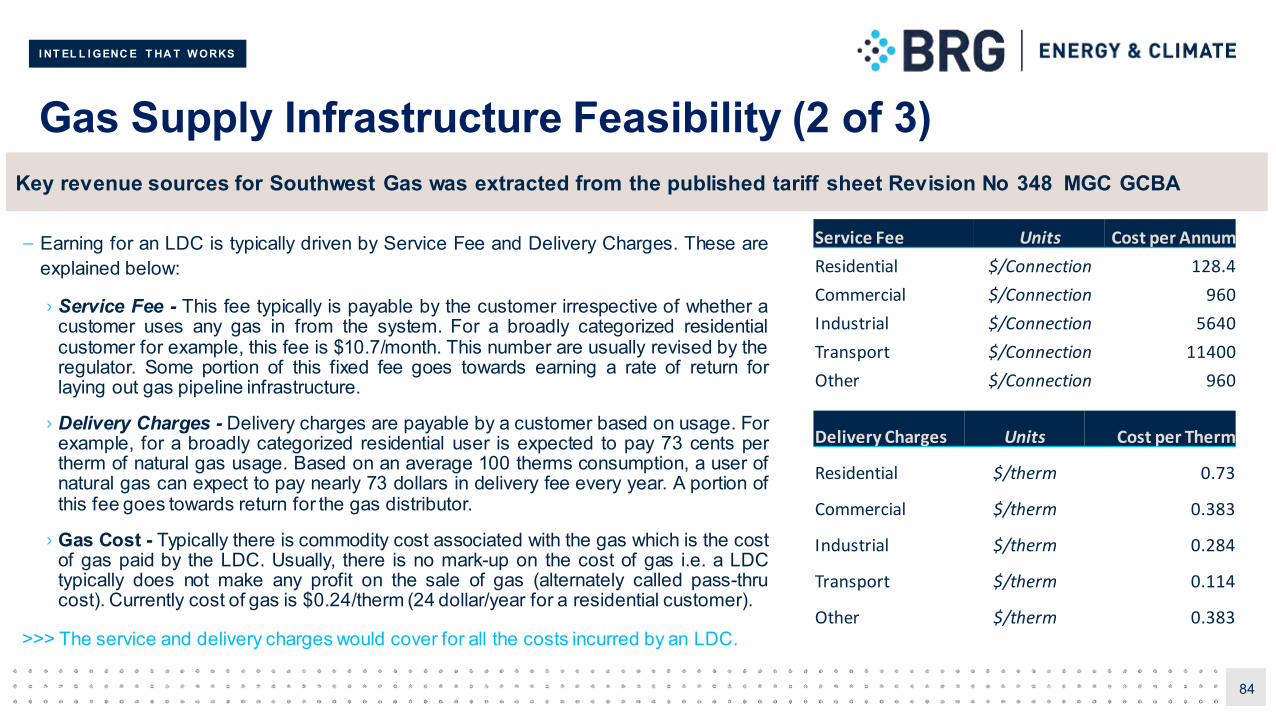
– Earning for an LDC is typically driven by Service Fee and Delivery Charges. These areexplained below:
› Service Fee - This fee typically is payable by the customer irrespective of whether acustomer uses any gas in from the system. For a broadly categorized residentialcustomer for example, this fee is $10.7/month. This number are usually revised by theregulator. Some portion of this fixed fee goes towards earning a rate of return forlaying out gas pipeline infrastructure.
› Delivery Charges - Delivery charges are payable by a customer based on usage. Forexample, for a broadly categorized residential user is expected to pay 73 cents pertherm of natural gas usage. Based on an average 100 therms consumption, a user ofnatural gas can expect to pay nearly 73 dollars in delivery fee every year. A portion ofthis fee goes towards return for the gas distributor.
› Gas Cost - Typically there is commodity cost associated with the gas which is the costof gas paid by the LDC. Usually, there is no mark-up on the cost of gas i.e. a LDCtypically does not make any profit on the sale of gas (alternately called pass-thrucost). Currently cost of gas is $0.24/therm (24 dollar/year for a residential customer).
>>> The service and delivery charges would cover for all the costs incurred by an LDC.
84
Key revenue sources for Southwest Gas was extracted from the published tariff sheet Revision No 348 MGC GCBA
Service Fee Units Cost per Annum
Residential $/Connection 128.4
Commercial $/Connection 960
Industrial $/Connection 5640
Transport $/Connection 11400
Other $/Connection 960
Delivery Charges Units Cost per Therm
Residential $/therm 0.73
Commercial $/therm 0.383
Industrial $/therm 0.284
Transport $/therm 0.114
Other $/therm 0.383
I NT EL L I GENC E T HA T W ORKS
Gas Supply Infrastructure Feasibility (3 of 3)
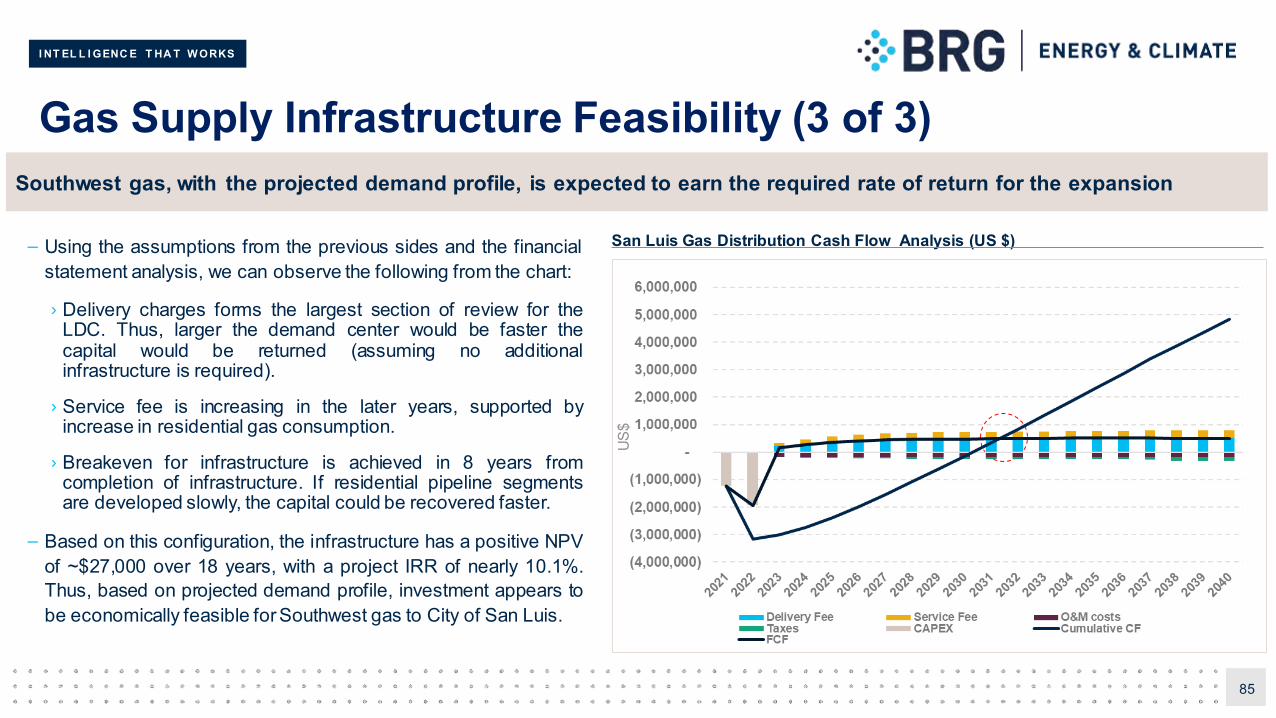
– Using the assumptions from the previous sides and the financialstatement analysis, we can observe the following from the chart:
› Delivery charges forms the largest section of review for theLDC. Thus, larger the demand center would be faster thecapital would be returned (assuming no additionalinfrastructure is required).
› Service fee is increasing in the later years, supported byincrease in residential gas consumption.
› Breakeven for infrastructure is achieved in 8 years fromcompletion of infrastructure. If residential pipeline segmentsare developed slowly, the capital could be recovered faster.
– Based on this configuration, the infrastructure has a positive NPVof ~$27,000 over 18 years, with a project IRR of nearly 10.1%.Thus, based on projected demand profile, investment appears tobe economically feasible for Southwest gas to City of San Luis.
85
Southwest gas, with the projected demand profile, is expected to earn the required rate of return for the expansion
San Luis Gas Distribution Cash Flow Analysis (US $)
US$
I NT EL L I GENC E T HA T W ORKS
Demand side feasibility – Transportation (1 of 2)
86
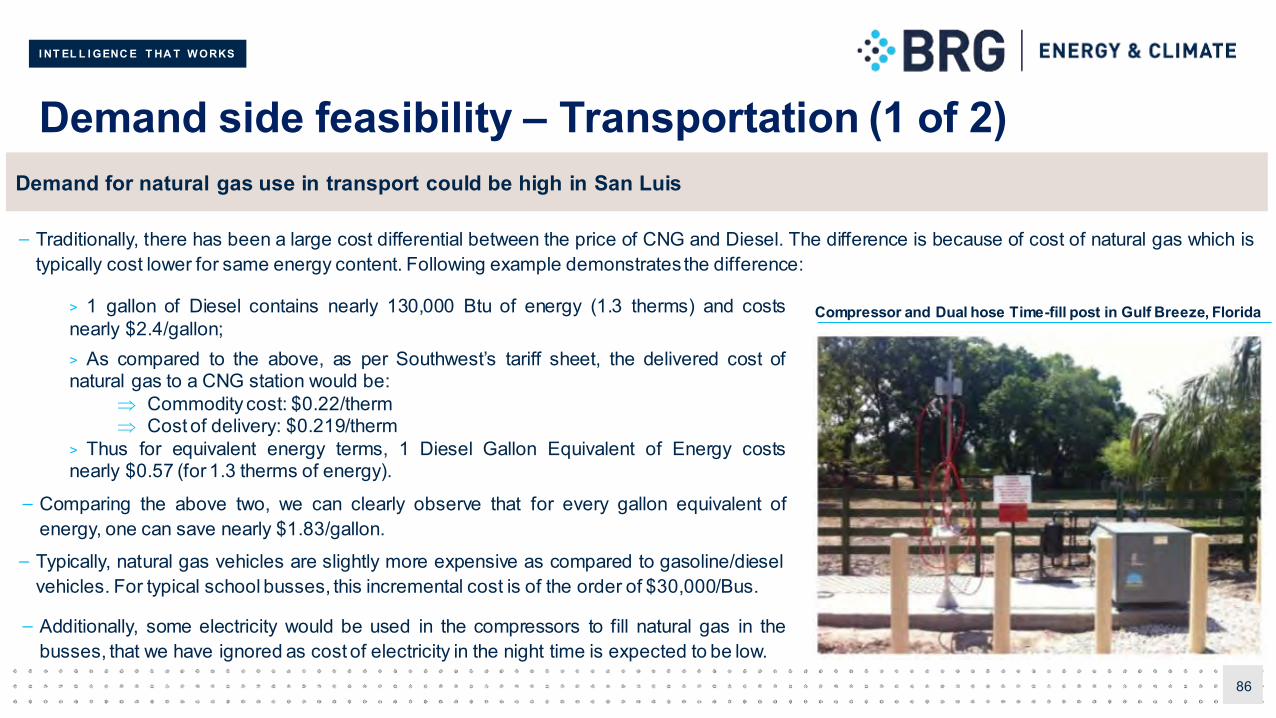
Demand for natural gas use in transport could be high in San Luis
– Traditionally, there has been a large cost differential between the price of CNG and Diesel. The difference is because of cost of natural gas which istypically cost lower for same energy content. Following example demonstrates the difference:
> 1 gallon of Diesel contains nearly 130,000 Btu of energy (1.3 therms) and costsnearly $2.4/gallon;> As compared to the above, as per Southwest’s tariff sheet, the delivered cost ofnatural gas to a CNG station would be:
Commoditycost: $0.22/therm Cost of delivery: $0.219/therm
> Thus for equivalent energy terms, 1 Diesel Gallon Equivalent of Energy costsnearly $0.57 (for 1.3 therms of energy).
– Comparing the above two, we can clearly observe that for every gallon equivalent ofenergy, one can save nearly $1.83/gallon.
– Typically, natural gas vehicles are slightly more expensive as compared to gasoline/dieselvehicles. For typical school busses, this incremental cost is of the order of $30,000/Bus.
– Additionally, some electricity would be used in the compressors to fill natural gas in thebusses, that we have ignored as cost of electricity in the night time is expected to be low.
Compressor and Dual hose Time-fill post in Gulf Breeze, Florida
I NT EL L I GENC E T HA T W ORKS
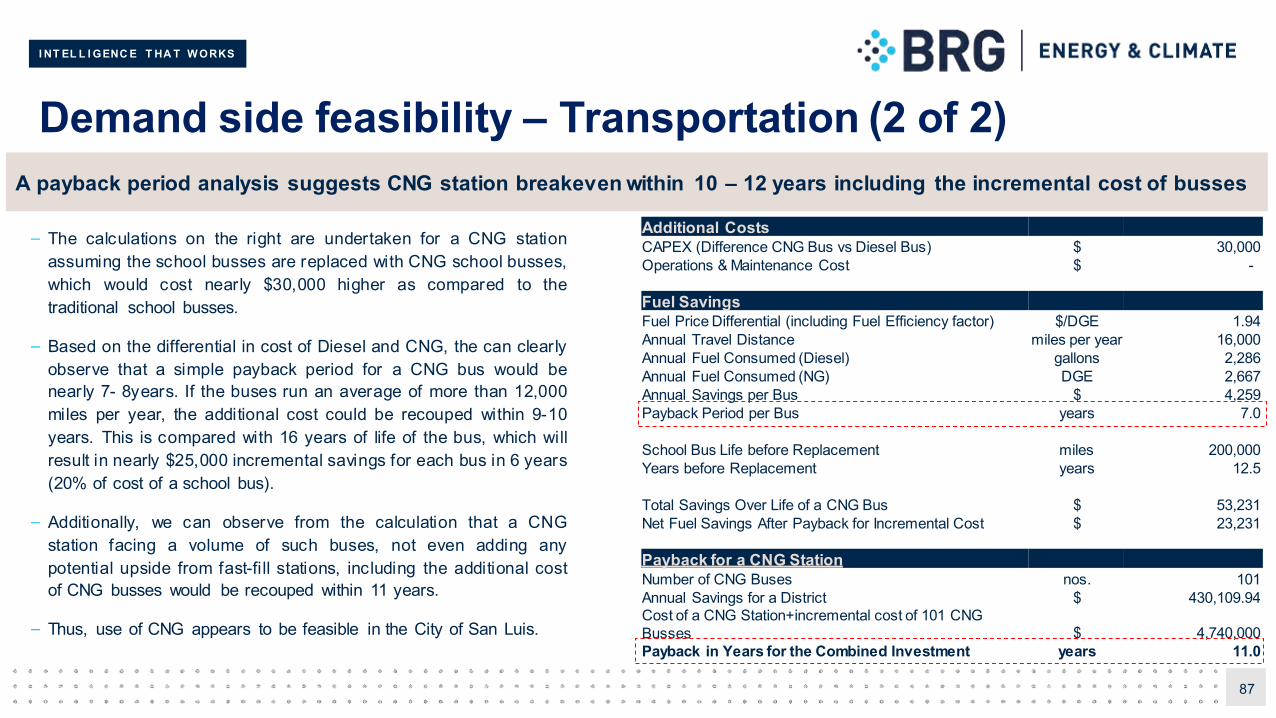
Demand side feasibility – Transportation (2 of 2)
– The calculations on the right are undertaken for a CNG stationassuming the school busses are replaced with CNG school busses,which would cost nearly $30,000 higher as compared to thetraditional school busses.
– Based on the differential in cost of Diesel and CNG, the can clearlyobserve that a simple payback period for a CNG bus would benearly 7- 8years. If the buses run an average of more than 12,000miles per year, the additional cost could be recouped within 9-10years. This is compared with 16 years of life of the bus, which willresult in nearly $25,000 incremental savings for each bus in 6 years(20% of cost of a school bus).
– Additionally, we can observe from the calculation that a CNGstation facing a volume of such buses, not even adding anypotential upside from fast-fill stations, including the additional costof CNG busses would be recouped within 11 years.
– Thus, use of CNG appears to be feasible in the City of San Luis.
87
A payback period analysis suggests CNG station breakeven within 10 – 12 years including the incremental cost of busses
Additional CostsCAPEX (Difference CNG Bus vs Diesel Bus) $ 30,000 Operations & Maintenance Cost $ -
Fuel SavingsFuel Price Differential (including Fuel Efficiency factor) $/DGE 1.94 Annual Travel Distance miles per year 16,000 Annual Fuel Consumed (Diesel) gallons 2,286 Annual Fuel Consumed (NG) DGE 2,667 Annual Savings per Bus $ 4,259 Payback Period per Bus years 7.0
School Bus Life before Replacement miles 200,000 Years before Replacement years 12.5
Total Savings Over Life of a CNG Bus $ 53,231 Net Fuel Savings After Payback for Incremental Cost $ 23,231
Payback for a CNG StationNumber of CNG Buses nos. 101 Annual Savings for a District $ 430,109.94 Cost of a CNG Station+incremental cost of 101 CNG Busses $ 4,740,000 Payback in Years for the Combined Investment years 11.0
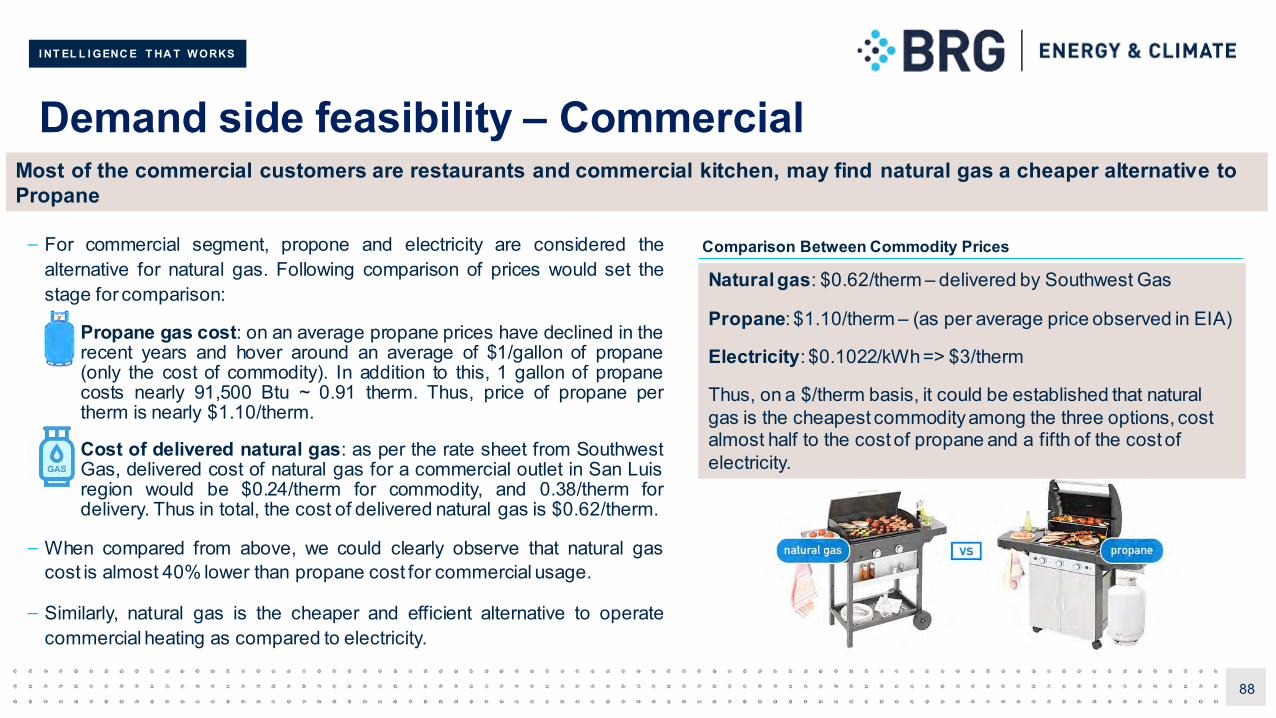
I NT EL L I GENC E T HA T W ORKS
Demand side feasibility – Commercial
– For commercial segment, propone and electricity are considered thealternative for natural gas. Following comparison of prices would set thestage for comparison:
• Propane gas cost: on an average propane prices have declined in therecent years and hover around an average of $1/gallon of propane(only the cost of commodity). In addition to this, 1 gallon of propanecosts nearly 91,500 Btu ~ 0.91 therm. Thus, price of propane pertherm is nearly $1.10/therm.
• Cost of delivered natural gas: as per the rate sheet from SouthwestGas, delivered cost of natural gas for a commercial outlet in San Luisregion would be $0.24/therm for commodity, and 0.38/therm fordelivery. Thus in total, the cost of delivered natural gas is $0.62/therm.
– When compared from above, we could clearly observe that natural gascost is almost 40% lower than propane cost for commercial usage.
– Similarly, natural gas is the cheaper and efficient alternative to operatecommercial heating as compared to electricity.
88
Most of the commercial customers are restaurants and commercial kitchen, may find natural gas a cheaper alternative to Propane
Comparison Between Commodity Prices
Natural gas: $0.62/therm – delivered by Southwest Gas
Propane: $1.10/therm – (as per average price observed in EIA)
Electricity: $0.1022/kWh => $3/therm
Thus, on a $/therm basis, it could be established that natural gas is the cheapest commodity among the three options, cost almost half to the cost of propane and a fifth of the cost of electricity.
I NT EL L I GENC E T HA T W ORKS
Other sectors
– Within each of the other segments estimation of saving could be largely be viewed as necessary cost and switching cost differential that mayresult in consumers selecting to use natural gas as their primary source of heating/fuel. Following calculation can be done based on needs ofsegments:
› Residential Segment - As it is estimated that nearly each household is expected to use ~100 therms/year, if natural gas is used as analternate fuel, the cost saving every year for 100 thems would be in range of 0 – 46 dollars per year as compared to propane. Propane pipinginstallation cost could be higher. Thus, natural gas would be overall a betteralternate.
› Industrial Segment - For industrial segment, use of natural gas would typically be cheaper and efficient for heating, drying, processing andother purposes. It must be noted, however, that depending on the type of equipment involved, the specific calculations have to be done toestablish superiority of one fuel against the other.
› Other Segments - In this report, we have categorized schools, government facilities, and other facilities in other segments. The main naturalgas fuel alternative in these segment includes propane and electricity. Typically on the basis of economics, natural gas would result in loweroperating costs as compared to the alternative fuels.
>>> In order to understand the magnitude of saving, in the next section, we have presented a table of potential saving from the use of natural gas on a commodity basis. The commodities compared against natural gas are propane, diesel and electricity.
89
Residential Savings could be estimate
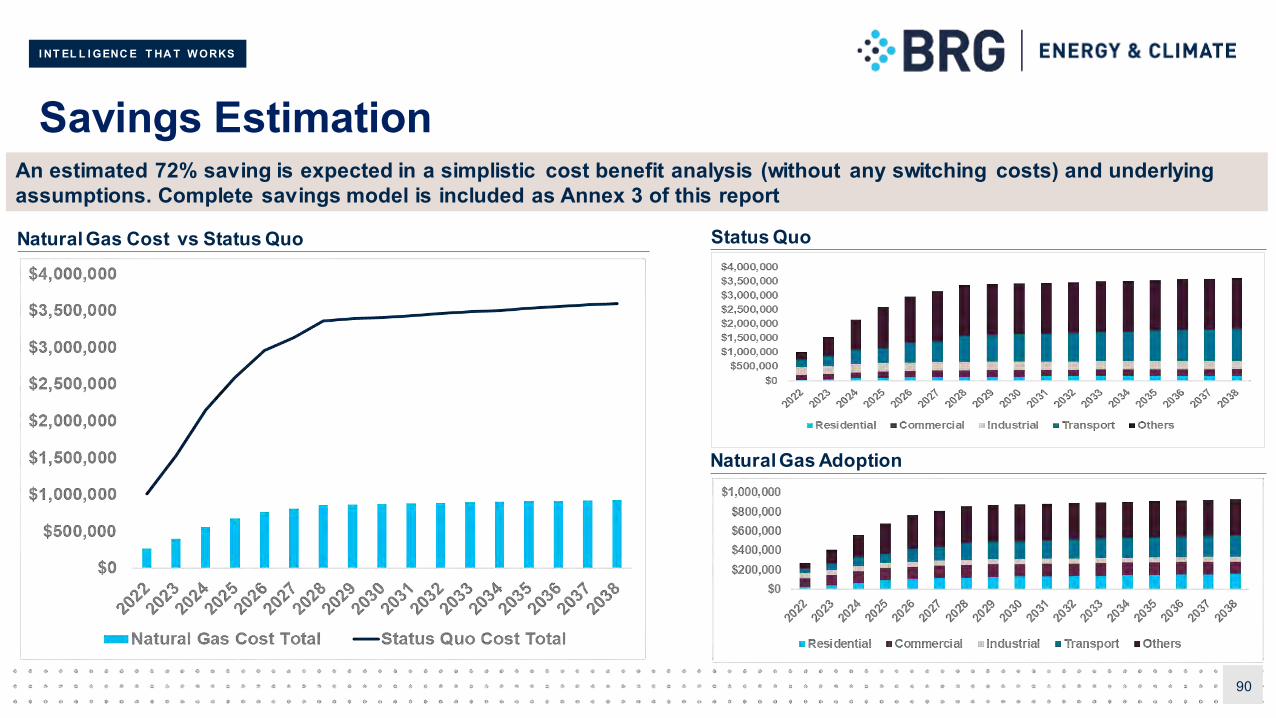
I NT EL L I GENC E T HA T W ORKS
Savings Estimation
90
An estimated 72% saving is expected in a simplistic cost benefit analysis (without any switching costs) and underlying assumptions. Complete savings model is included as Annex 3 of this report
Natural Gas Cost vs Status Quo Status Quo
Natural Gas Adoption
I NT EL L I GENC E T HA T W ORKS
Conclusion
91
Natural gas offers tremendous potential for saving in San Luis and will encourage further movement of commerce in the region
Based on the economic feasibilityanalysis presented here, the following could be concluded:
If the project demand profile materializes, infrastructure investments made by Southwest Gas would be sufficient to provide the required rate ofreturn for the LDC. Thus, natural gas infrastructure development is feasible.
On the demand side switching economics, it can be established that a CNG station in San Luis would serve as a stable anchor demand center fornatural gas, with large savings if busses switch to natural gas. This will serve two purposes:
Cost saving in running the school districts.
Usage of environmentally cleaner fuel.
Comparison of cost between natural gas and propane yields favorable economics for use of natural gas in commercial sector as well as residentialsector.
Finally, the industrial sector may require switching economics validated on case by case bases for existing machinery, but future industries couldcertainly benefit from natural gas availability.
>>> Thus, a nutshell, natural gas appears to be economically feasibility and a superior fuel that can serve the community reliably.

I NT EL L I GENC E T HA T W ORKS
9 Regulation, Rates and Permitting
I NT EL L I GENC E T HA T W ORKS
Regulatory Requirements
− Under the current US regulatory regime gas suppliers (also referred to as marketers or shippers) are not regulated. This means that gasproducers and shippers’business are not subject to a regulators’ oversight for day to day business; prices are determined by market forces.
− In contrast, pipeline companies and local distribution companies (LDCs) are regulated; service price is determined or approved by a regulator.The key objective for regulating the distribution infrastructure is to ensure non-discriminatory access to the gas source for all the gas buyers andto ensure fair pricing is established; returns are set by the regulator. The Yuma County’s LDC, Southwest Gas, has seen return on its distributioninfrastructure capped between9% to 10% of cost of capital.
− Natural gas pipeline permitting requirements can fall within federal and/or state and local level jurisdictions. The jurisdiction is determined basedon whether the pipeline is interstate or intrastate.
Interstate Pipelines - Are those which cross multiple states (eg. El Paso Pipeline) and are regulated by two federal agencies: the FederalEnergy Regulatory Commission (FERC) and the Pipeline Safety and Hazardous Materials Administration (PHMSA) within the Department ofTransportation (DOT). FERC reviews applications for construction and operations of interstate pipelines while PHMSA promulgates minimumfederal safety standards for pipeline facilities and transportation.
Intrastate Pipelines - Those that operate within state borders. PHMSA delegates in appointed state regulators the responsibility for the sitting,constructionand expansion of pipelines within state boundaries.
Distribution pipelines fall in the intrastate category; as such are under state jurisdiction. For the City of San Luis, the Arizona Utility Commissionis the entity that administers safety and consumerprotectionplans as well as regulates distribution pipeline operations and maintenance.
93
Natural gas access to the end customers requires two key participants: the gas supplier (or gas producer or shipper) andthe gas distributor (or gas infrastructure owner/operator)
I NT EL L I GENC E T HA T W ORKS
Permitting Requirements
− Submission of plans and stakeholder details to state regulators.
− Environmental agencies: Specific permission for river or stream crossings. Environmental assessments to outline endangered species and wetland impacts from large projects in the vicinity of environmental
sensitive areas. Air and other environmental pollution studies.
− Right of way (ROW) permissions are sought from the various landowners on the route.
− Depending on complexity of project and elements involved, the permitting timeline could be 6 to 12 months or longer.
94
State level permitting is a little more complex than local government permitting. Permitting may require, as needed:
− Construction permit from town/municipal entities with necessary conditioned fulfilled. The representative for the construction company should meet with government representatives to discuss the scope and specifications of the permit. Submission of plans outlining the project. Municipality verifies that the plans do not conflict with roads, canals, sewers and other existing or planned infrastructure. In case of any conflict special arrangements may be needed to agree on a solution.
− Municipal codes and specific requirements.− Local government may or may not require inspection of the pipelines.− The permitting timeline could take between 2-3 months for approval.
Stat
e Le
vel
Loca
l G
over
nmen
t
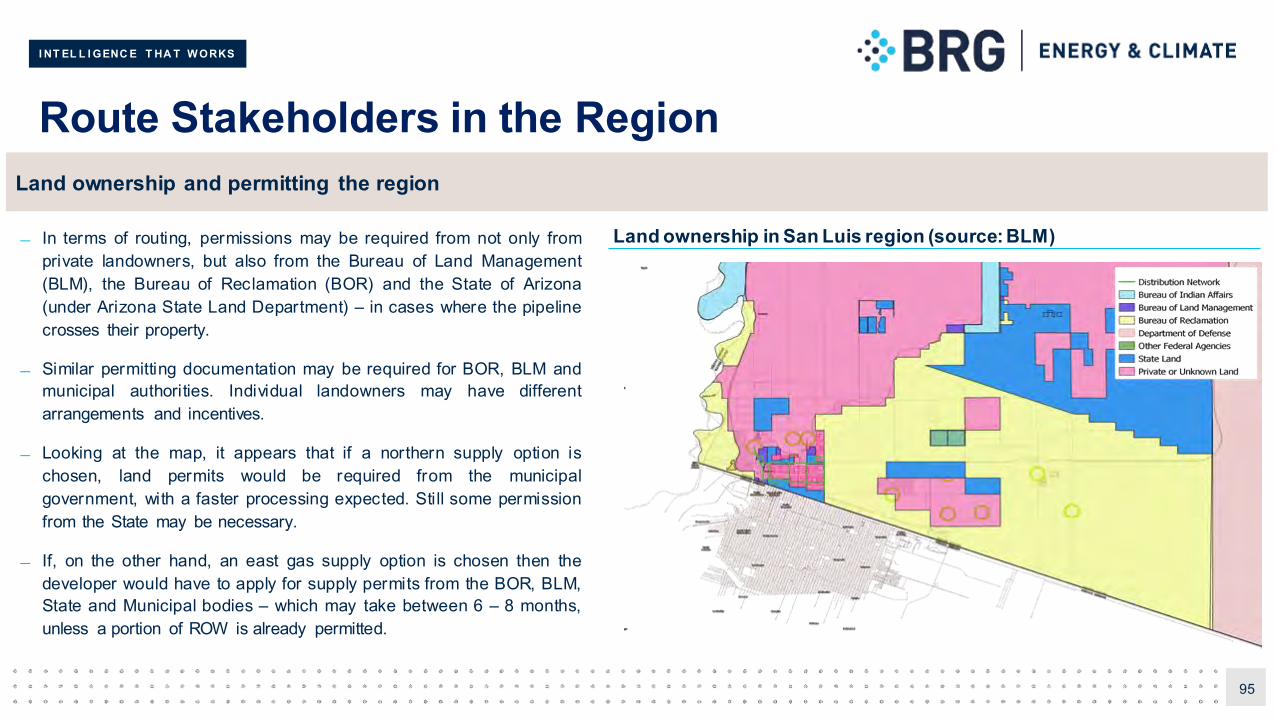
I NT EL L I GENC E T HA T W ORKS
Route Stakeholders in the Region
In terms of routing, permissions may be required from not only fromprivate landowners, but also from the Bureau of Land Management(BLM), the Bureau of Reclamation (BOR) and the State of Arizona(under Arizona State Land Department) – in cases where the pipelinecrosses their property.
Similar permitting documentation may be required for BOR, BLM andmunicipal authorities. Individual landowners may have differentarrangements and incentives.
Looking at the map, it appears that if a northern supply option ischosen, land permits would be required from the municipalgovernment, with a faster processing expected. Still some permissionfrom the State may be necessary.
If, on the other hand, an east gas supply option is chosen then thedeveloper would have to apply for supply permits from the BOR, BLM,State and Municipal bodies – which may take between 6 – 8 months,unless a portion of ROW is already permitted.
95
Land ownership in San Luis region (source: BLM)
Land ownership and permitting the region
I NT EL L I GENC E T HA T W ORKS
Regulatory Requirements for Cross-Border Pipelines
– A company must obtain a Presidential permit before constructing and operating a cross-border pipeline between the United States and a foreign country.
– Presidential permits for natural gas pipelines are requested through the Federal Energy Regulatory Commission (FERC) as per Executive Order 10485. FERC approves the requests if it determines that the pipeline is ‘consistent with the public interest’ and if the Secretary of Defense and the Secretary of State make favorable recommendations.
– FERC is also the agency in charge of authorizing the siting, construction and operation of the pipeline.
– Executive Order 13867 of April 10, 2019 designated the Secretary of State to receive all applications for the issuance or amendment of Presidential permits, however natural gas pipelines was exempted, and its designation falls to FERC.
>>> The process would be revisited with permits necessary for supply of natural gas across the border and permits would be discussed with the corresponding counterparties from San Luis Rio Colorado.
96
The following regulations would be applicable for a cross-border pipelines:

I NT EL L I GENC E T HA T W ORKS
10 Conclusions and Recommendation
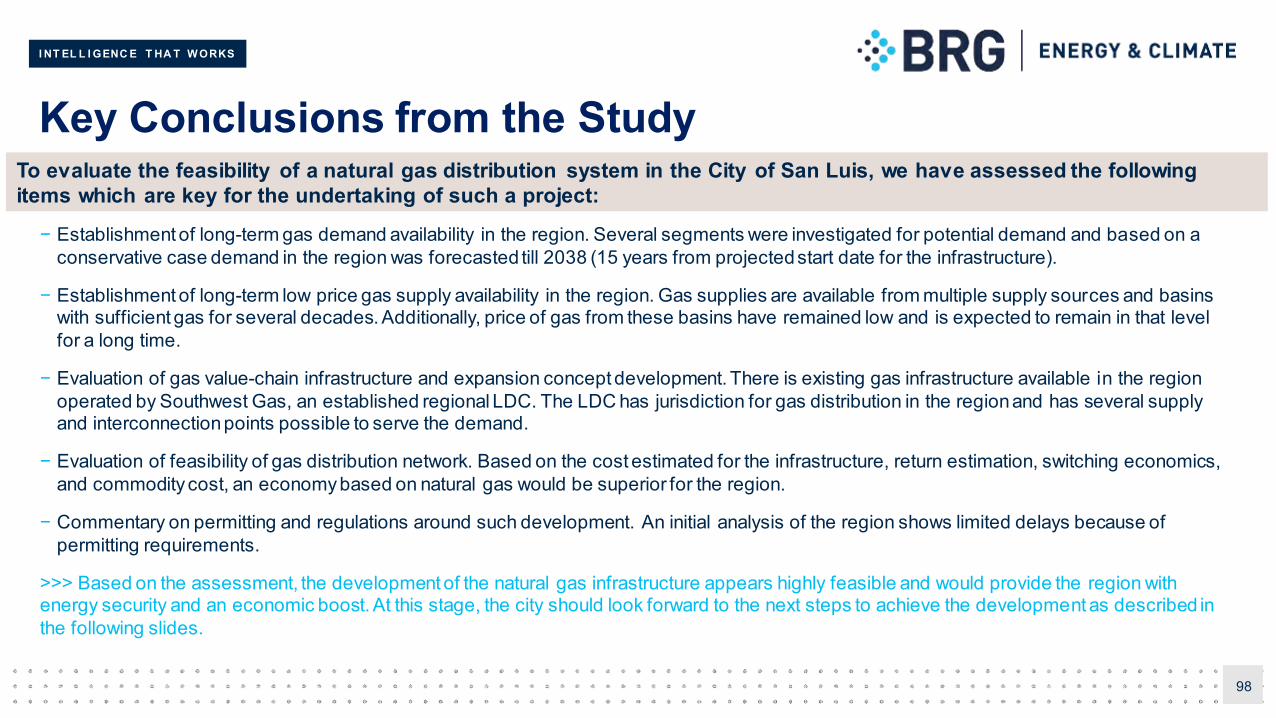
I NT EL L I GENC E T HA T W ORKS
Key Conclusions from the Study
98
− Establishment of long-term gas demand availability in the region. Several segments were investigated for potential demand and based on a conservative case demand in the region was forecasted till 2038 (15 years from projected start date for the infrastructure).
− Establishment of long-term low price gas supply availability in the region. Gas supplies are available from multiple supply sources and basins with sufficient gas for several decades. Additionally, price of gas from these basins have remained low and is expected to remain in that level for a long time.
− Evaluation of gas value-chain infrastructure and expansion concept development. There is existing gas infrastructure available in the region operated by Southwest Gas, an established regional LDC. The LDC has jurisdiction for gas distribution in the region and has several supply and interconnection points possible to serve the demand.
− Evaluation of feasibility of gas distribution network. Based on the cost estimated for the infrastructure, return estimation, switching economics, and commodity cost, an economy based on natural gas would be superior for the region.
− Commentary on permitting and regulations around such development. An initial analysis of the region shows limited delays because of permitting requirements.
>>> Based on the assessment, the development of the natural gas infrastructure appears highly feasible and would provide the region with energy security and an economic boost. At this stage, the city should look forward to the next steps to achieve the development as described in the following slides.
To evaluate the feasibility of a natural gas distribution system in the City of San Luis, we have assessed the following items which are key for the undertaking of such a project:
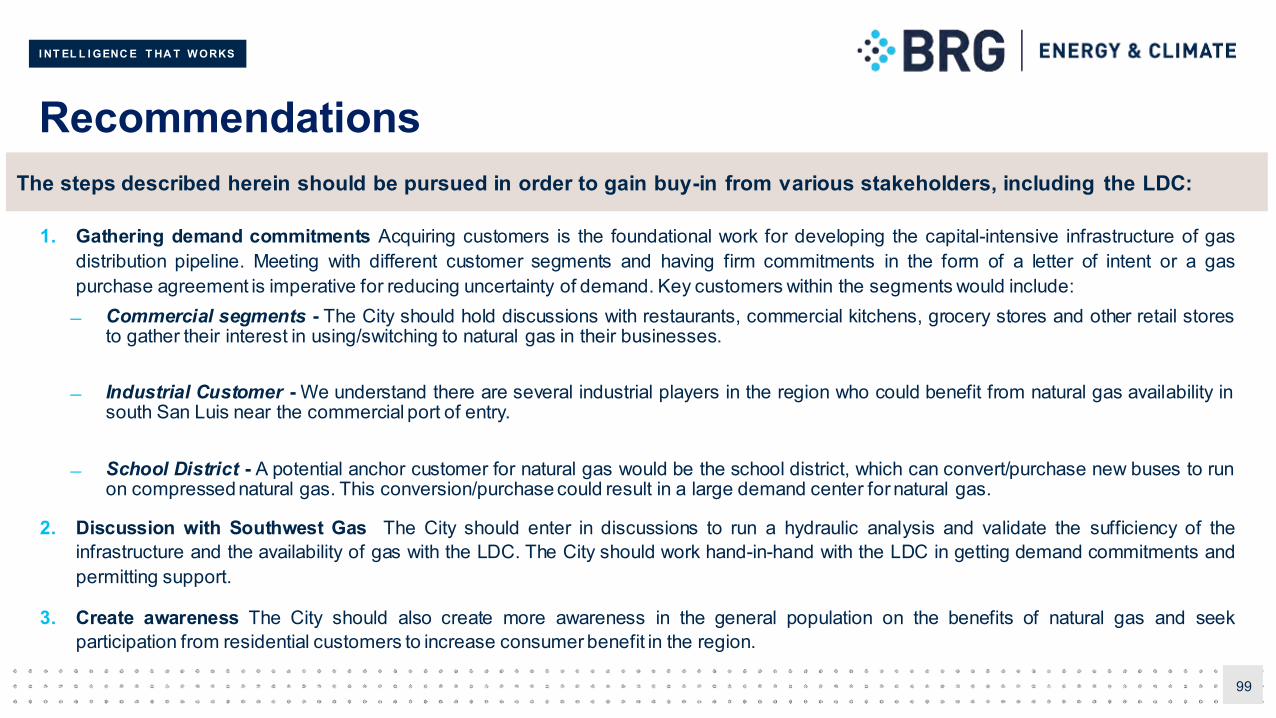
I NT EL L I GENC E T HA T W ORKS
Recommendations
99
1. Gathering demand commitments Acquiring customers is the foundational work for developing the capital-intensive infrastructure of gasdistribution pipeline. Meeting with different customer segments and having firm commitments in the form of a letter of intent or a gaspurchase agreement is imperative for reducing uncertainty of demand. Key customers within the segments would include: Commercial segments - The City should hold discussions with restaurants, commercial kitchens, grocery stores and other retail stores
to gather their interest in using/switching to natural gas in their businesses.
Industrial Customer - We understand there are several industrial players in the region who could benefit from natural gas availability insouth San Luis near the commercial port of entry.
School District - A potential anchor customer for natural gas would be the school district, which can convert/purchase new buses to runon compressednatural gas. This conversion/purchase could result in a large demand center for natural gas.
2. Discussion with Southwest Gas The City should enter in discussions to run a hydraulic analysis and validate the sufficiency of theinfrastructure and the availability of gas with the LDC. The City should work hand-in-hand with the LDC in getting demand commitments andpermitting support.
3. Create awareness The City should also create more awareness in the general population on the benefits of natural gas and seekparticipation from residential customers to increase consumer benefit in the region.
The steps described herein should be pursued in order to gain buy-in from various stakeholders, including the LDC:

I NT EL L I GENC E T HA T W ORKS
100
Thank you!

I NT EL L I GENC E T HA T W ORKS
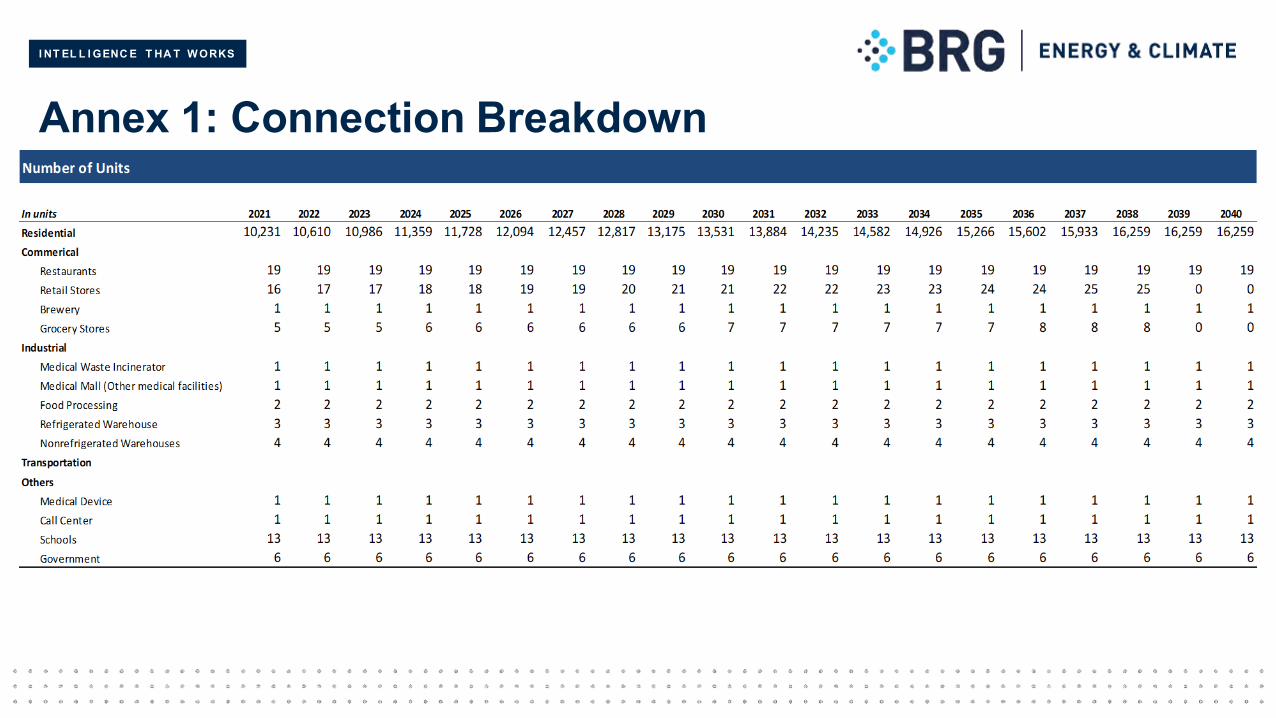
I NT EL L I GENC E T HA T W ORKS
Annex 1: Connection Breakdown
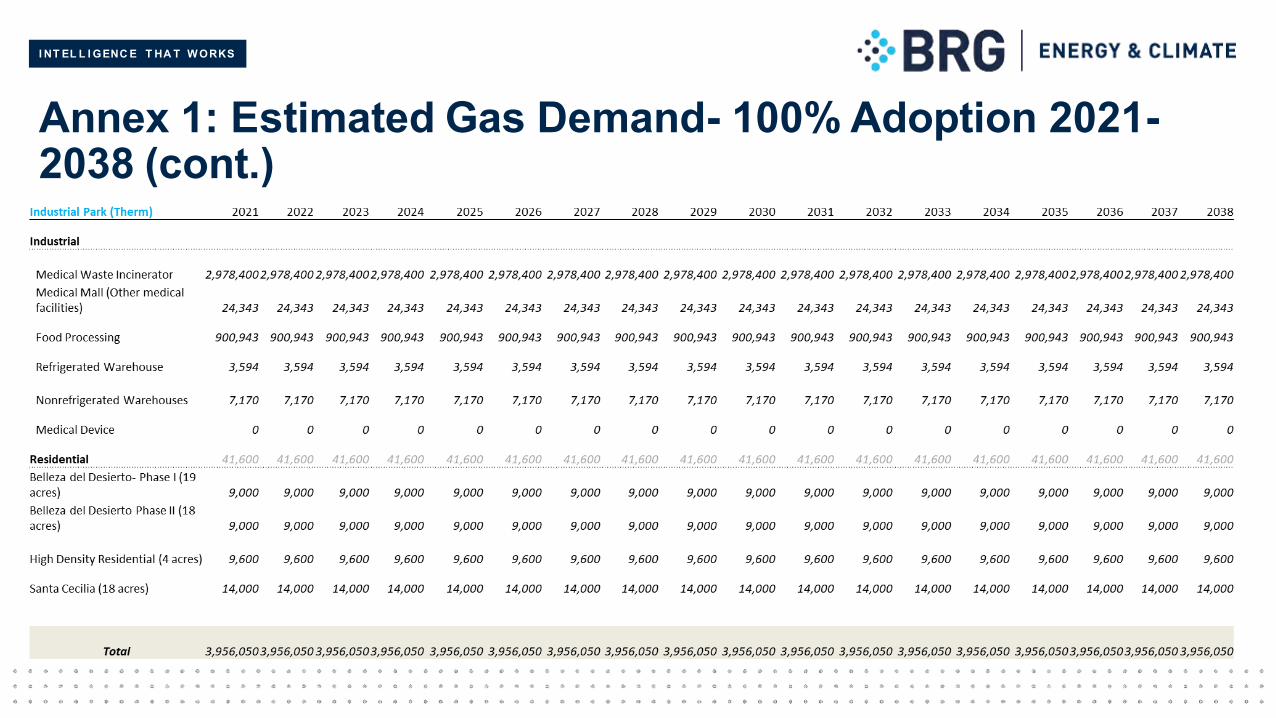
I NT EL L I GENC E T HA T W ORKS
Annex 1: Estimated Gas Demand- 100% Adoption 2021-2038 (cont.)
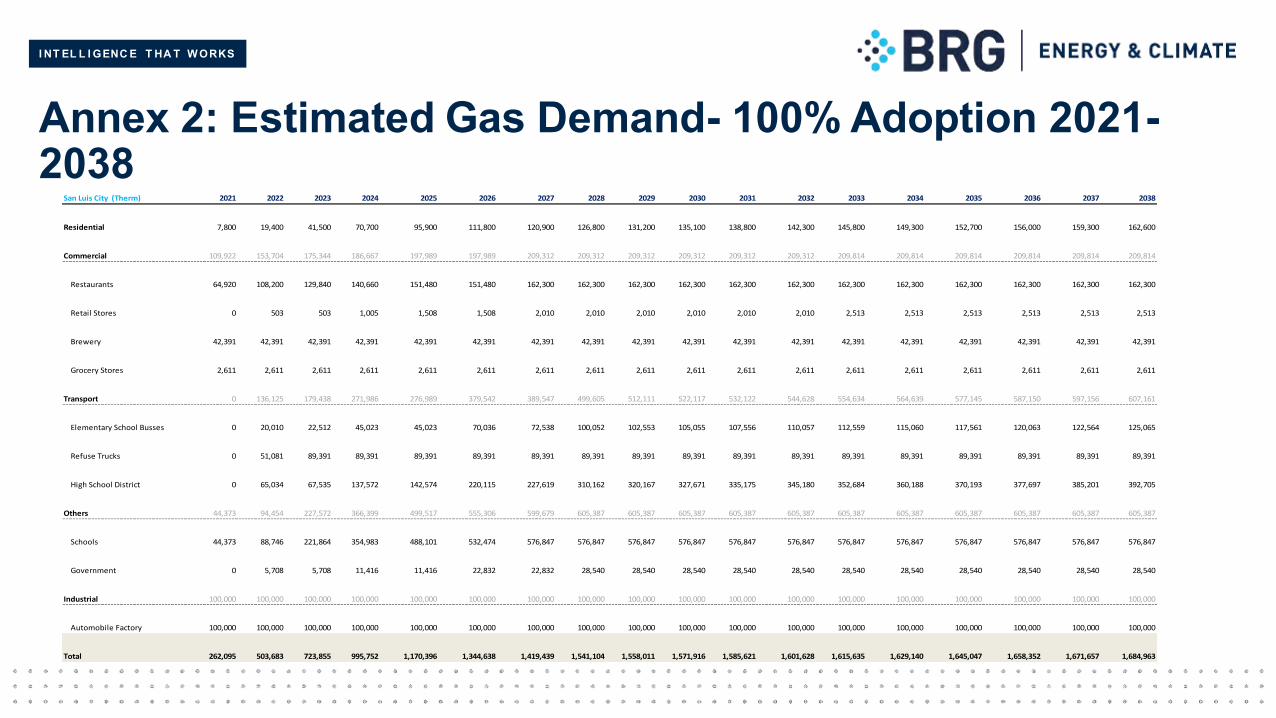
I NT EL L I GENC E T HA T W ORKS
Annex 2: Estimated Gas Demand- 100% Adoption 2021-2038
San Luis City (Therm) 2021 2022 2023 2024 2025 2026 2027 2028 2029 2030 2031 2032 2033 2034 2035 2036 2037 2038
Residential 7,800 19,400 41,500 70,700 95,900 111,800 120,900 126,800 131,200 135,100 138,800 142,300 145,800 149,300 152,700 156,000 159,300 162,600
Commercial 109,922 153,704 175,344 186,667 197,989 197,989 209,312 209,312 209,312 209,312 209,312 209,312 209,814 209,814 209,814 209,814 209,814 209,814
Restaurants 64,920 108,200 129,840 140,660 151,480 151,480 162,300 162,300 162,300 162,300 162,300 162,300 162,300 162,300 162,300 162,300 162,300 162,300
Retail Stores 0 503 503 1,005 1,508 1,508 2,010 2,010 2,010 2,010 2,010 2,010 2,513 2,513 2,513 2,513 2,513 2,513
Brewery 42,391 42,391 42,391 42,391 42,391 42,391 42,391 42,391 42,391 42,391 42,391 42,391 42,391 42,391 42,391 42,391 42,391 42,391
Grocery Stores 2,611 2,611 2,611 2,611 2,611 2,611 2,611 2,611 2,611 2,611 2,611 2,611 2,611 2,611 2,611 2,611 2,611 2,611
Transport 0 136,125 179,438 271,986 276,989 379,542 389,547 499,605 512,111 522,117 532,122 544,628 554,634 564,639 577,145 587,150 597,156 607,161
Elementary School Busses 0 20,010 22,512 45,023 45,023 70,036 72,538 100,052 102,553 105,055 107,556 110,057 112,559 115,060 117,561 120,063 122,564 125,065
Refuse Trucks 0 51,081 89,391 89,391 89,391 89,391 89,391 89,391 89,391 89,391 89,391 89,391 89,391 89,391 89,391 89,391 89,391 89,391
High School District 0 65,034 67,535 137,572 142,574 220,115 227,619 310,162 320,167 327,671 335,175 345,180 352,684 360,188 370,193 377,697 385,201 392,705
Others 44,373 94,454 227,572 366,399 499,517 555,306 599,679 605,387 605,387 605,387 605,387 605,387 605,387 605,387 605,387 605,387 605,387 605,387
Schools 44,373 88,746 221,864 354,983 488,101 532,474 576,847 576,847 576,847 576,847 576,847 576,847 576,847 576,847 576,847 576,847 576,847 576,847
Government 0 5,708 5,708 11,416 11,416 22,832 22,832 28,540 28,540 28,540 28,540 28,540 28,540 28,540 28,540 28,540 28,540 28,540
Industrial 100,000 100,000 100,000 100,000 100,000 100,000 100,000 100,000 100,000 100,000 100,000 100,000 100,000 100,000 100,000 100,000 100,000 100,000
Automobile Factory 100,000 100,000 100,000 100,000 100,000 100,000 100,000 100,000 100,000 100,000 100,000 100,000 100,000 100,000 100,000 100,000 100,000 100,000
Total 262,095 503,683 723,855 995,752 1,170,396 1,344,638 1,419,439 1,541,104 1,558,011 1,571,916 1,585,621 1,601,628 1,615,635 1,629,140 1,645,047 1,658,352 1,671,657 1,684,963
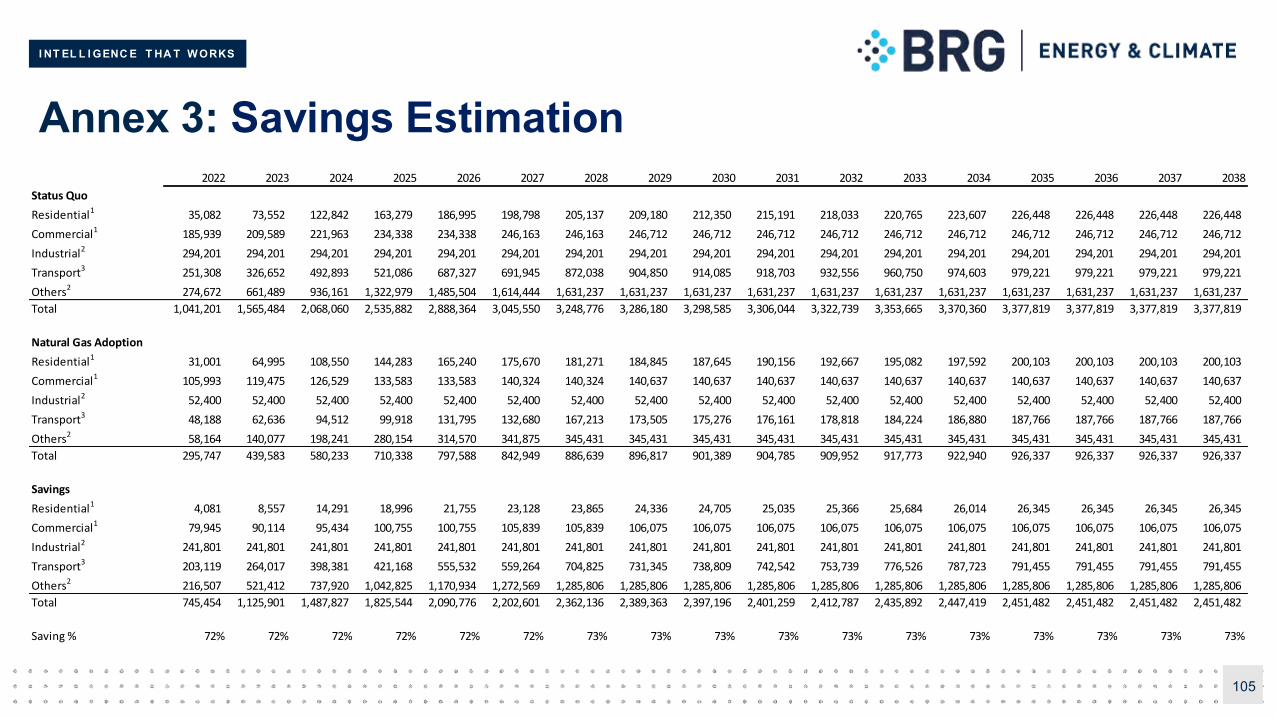
I NT EL L I GENC E T HA T W ORKS
Annex 3: Savings Estimation
105
2022 2023 2024 2025 2026 2027 2028 2029 2030 2031 2032 2033 2034 2035 2036 2037 2038
Status Quo
Residential1 35,082 73,552 122,842 163,279 186,995 198,798 205,137 209,180 212,350 215,191 218,033 220,765 223,607 226,448 226,448 226,448 226,448
Commercial1 185,939 209,589 221,963 234,338 234,338 246,163 246,163 246,712 246,712 246,712 246,712 246,712 246,712 246,712 246,712 246,712 246,712
Industrial2 294,201 294,201 294,201 294,201 294,201 294,201 294,201 294,201 294,201 294,201 294,201 294,201 294,201 294,201 294,201 294,201 294,201
Transport3 251,308 326,652 492,893 521,086 687,327 691,945 872,038 904,850 914,085 918,703 932,556 960,750 974,603 979,221 979,221 979,221 979,221
Others2 274,672 661,489 936,161 1,322,979 1,485,504 1,614,444 1,631,237 1,631,237 1,631,237 1,631,237 1,631,237 1,631,237 1,631,237 1,631,237 1,631,237 1,631,237 1,631,237
Total 1,041,201 1,565,484 2,068,060 2,535,882 2,888,364 3,045,550 3,248,776 3,286,180 3,298,585 3,306,044 3,322,739 3,353,665 3,370,360 3,377,819 3,377,819 3,377,819 3,377,819
Natural Gas Adoption
Residential1 31,001 64,995 108,550 144,283 165,240 175,670 181,271 184,845 187,645 190,156 192,667 195,082 197,592 200,103 200,103 200,103 200,103
Commercial1 105,993 119,475 126,529 133,583 133,583 140,324 140,324 140,637 140,637 140,637 140,637 140,637 140,637 140,637 140,637 140,637 140,637
Industrial2 52,400 52,400 52,400 52,400 52,400 52,400 52,400 52,400 52,400 52,400 52,400 52,400 52,400 52,400 52,400 52,400 52,400
Transport3 48,188 62,636 94,512 99,918 131,795 132,680 167,213 173,505 175,276 176,161 178,818 184,224 186,880 187,766 187,766 187,766 187,766
Others2 58,164 140,077 198,241 280,154 314,570 341,875 345,431 345,431 345,431 345,431 345,431 345,431 345,431 345,431 345,431 345,431 345,431
Total 295,747 439,583 580,233 710,338 797,588 842,949 886,639 896,817 901,389 904,785 909,952 917,773 922,940 926,337 926,337 926,337 926,337
Savings
Residential1 4,081 8,557 14,291 18,996 21,755 23,128 23,865 24,336 24,705 25,035 25,366 25,684 26,014 26,345 26,345 26,345 26,345
Commercial1 79,945 90,114 95,434 100,755 100,755 105,839 105,839 106,075 106,075 106,075 106,075 106,075 106,075 106,075 106,075 106,075 106,075
Industrial2 241,801 241,801 241,801 241,801 241,801 241,801 241,801 241,801 241,801 241,801 241,801 241,801 241,801 241,801 241,801 241,801 241,801
Transport3 203,119 264,017 398,381 421,168 555,532 559,264 704,825 731,345 738,809 742,542 753,739 776,526 787,723 791,455 791,455 791,455 791,455
Others2 216,507 521,412 737,920 1,042,825 1,170,934 1,272,569 1,285,806 1,285,806 1,285,806 1,285,806 1,285,806 1,285,806 1,285,806 1,285,806 1,285,806 1,285,806 1,285,806
Total 745,454 1,125,901 1,487,827 1,825,544 2,090,776 2,202,601 2,362,136 2,389,363 2,397,196 2,401,259 2,412,787 2,435,892 2,447,419 2,451,482 2,451,482 2,451,482 2,451,482
Saving % 72% 72% 72% 72% 72% 72% 73% 73% 73% 73% 73% 73% 73% 73% 73% 73% 73%
INT
EL
LIG
EN
CE
T
HA
T W
OR
KS
Feasibility Study for Natural Gas Distribution in City of San Luis and San Luis Rio Colorado – Part II
I NT EL L I GENC E T HA T W ORKS
Table of Contents
2
Executive Summary
Project Overview
Current Situation
Demand Estimation
Supply Analysis
Routing & Conceptual
Design
Supply Alternatives
Economic Feasibility
Regulatory Requirement
Environmental Assessment
Conclusion and Recommendation

I NT EL L I GENC E T HA T W ORKS
1 Executive Summary
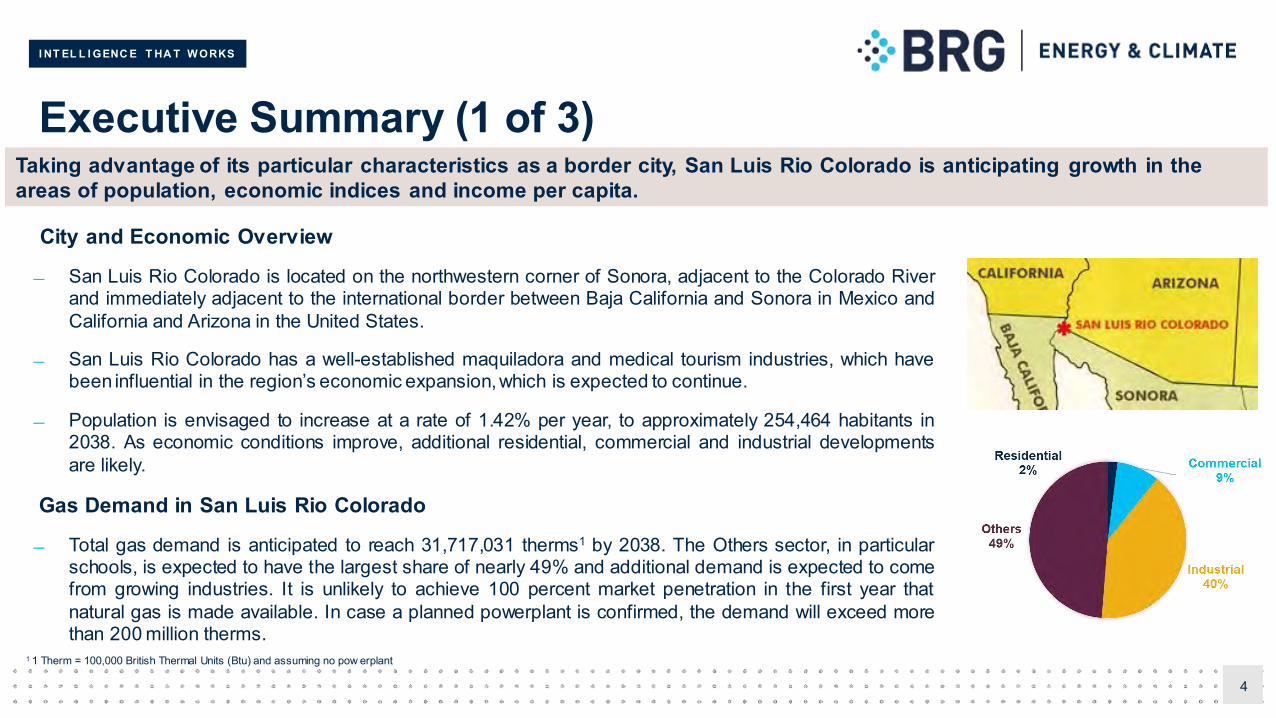
I NT EL L I GENC E T HA T W ORKS
Executive Summary (1 of 3)
City and Economic Overview
San Luis Rio Colorado is located on the northwestern corner of Sonora, adjacent to the Colorado Riverand immediately adjacent to the international border between Baja California and Sonora in Mexico andCalifornia and Arizona in the United States.
San Luis Rio Colorado has a well-established maquiladora and medical tourism industries, which havebeen influential in the region’s economic expansion,which is expected to continue.
Population is envisaged to increase at a rate of 1.42% per year, to approximately 254,464 habitants in2038. As economic conditions improve, additional residential, commercial and industrial developmentsare likely.
Gas Demand in San Luis Rio Colorado
Total gas demand is anticipated to reach 31,717,031 therms1 by 2038. The Others sector, in particularschools, is expected to have the largest share of nearly 49% and additional demand is expected to comefrom growing industries. It is unlikely to achieve 100 percent market penetration in the first year thatnatural gas is made available. In case a planned powerplant is confirmed, the demand will exceed morethan 200 million therms.
4
Taking advantage of its particular characteristics as a border city, San Luis Rio Colorado is anticipating growth in the areas of population, economic indices and income per capita.
1 1 Therm = 100,000 British Thermal Units (Btu) and assuming no pow erplant
I NT EL L I GENC E T HA T W ORKS
Executive Summary (2 of 3)
Gas supply in San Luis Rio Colorado The region itself does not have any transmission pipelines and gas is expected to be supplied from the United States. There are some
existing distribution pipelines laid in the area, but was not accessible for the study.
Gas Distribution Infrastructure Design Based on the projected demand profile, without a powerplant demand, San Luis Rio Colorado would conservatively require one main feeder
line and five regional feeder lines. The location would be:
nearly 18 miles of 10.5” main feeder line, connecting at Somertonsupply
nearly 6 miles of 6.5” feeder line 1 – running along the border of US and Mexico;
nearly 4 miles of 6.0” feeder line 2, 3, and 4, each with length of 6 miles, 4 miles, and 9 miles respectively – running through the denselypopulated region of city, parallel to feeder line 1
nearly 11 miles of 7” feeder line 5 – which will diverge south to meet additional relatively less dense population.
Total infrastructure cost for this investment is estimated at nearly $34.1 million (this includes main and subsidiary feeder lines).
In case a powerplant demand is available, the 10.5” main feeder line can be replaced with a 25 miles 12” transmission pipeline [from Yuma]
5
There is sufficient pipeline design capacity in the region, but gas distribution infrastructure is yet to be developed.
I NT EL L I GENC E T HA T W ORKS
Conclusion Based on estimated demand, estimated pipeline infrastructure costs, and existing tariffs (as derived from Southwest Gas’ existing
tariffs), the development of the gas distribution network appears to meet the regulated target unlevered rate of return of nearly 10%.
The project’s target return remains in the viable range for investment, with or without the construction of the power plant.
Comparing the commodity cost of alternative fuels, natural gas appears to be cheapest option on an energy equivalent basis and isexpected to be adopted widely if available.
Thus, based on expectation of the demand estimates and favorable economics, development of natural gas infrastructure isfeasible.
Next stepsIn order to pursue the development of infrastructure two steps must be followed in parallel.
1. Gathering commitment from the customers for use of natural gas for mid-to-long term, which will provide the project developerswith the necessary incentive to pursue the infrastructure development.
2. Start discussion with Southwest Gas and EPNG on gas and pipeline capacity constraints and availability and development ofsystem hydraulics, cost validation and development timeline.
Executive Summary (3 of 3)
6
Based on conservative demand estimates and infrastructure plan, gas distribution system development seems feasible.
I NT EL L I GENC E T HA T W ORKS
2 Project Overview
I NT EL L I GENC E T HA T W ORKS
Part II Overview
Part II (SLRC) will address the following objectives: quantifyexisting and future gas demand; evaluate the potential sourcesof gas supply in the region; identify various infrastructure andcommodity options available to meet demand; provide apreliminary design of pipeline infrastructure to the source and tothe distribution network; identify regulatory requirements thataffect the development of this project; assess the techno-feasibility of the project by combining demand, supply,commodity options, design and costs.This section begins with a brief summary of the results of Part I.
San Luis Arizona
San Luis Rio Colorado
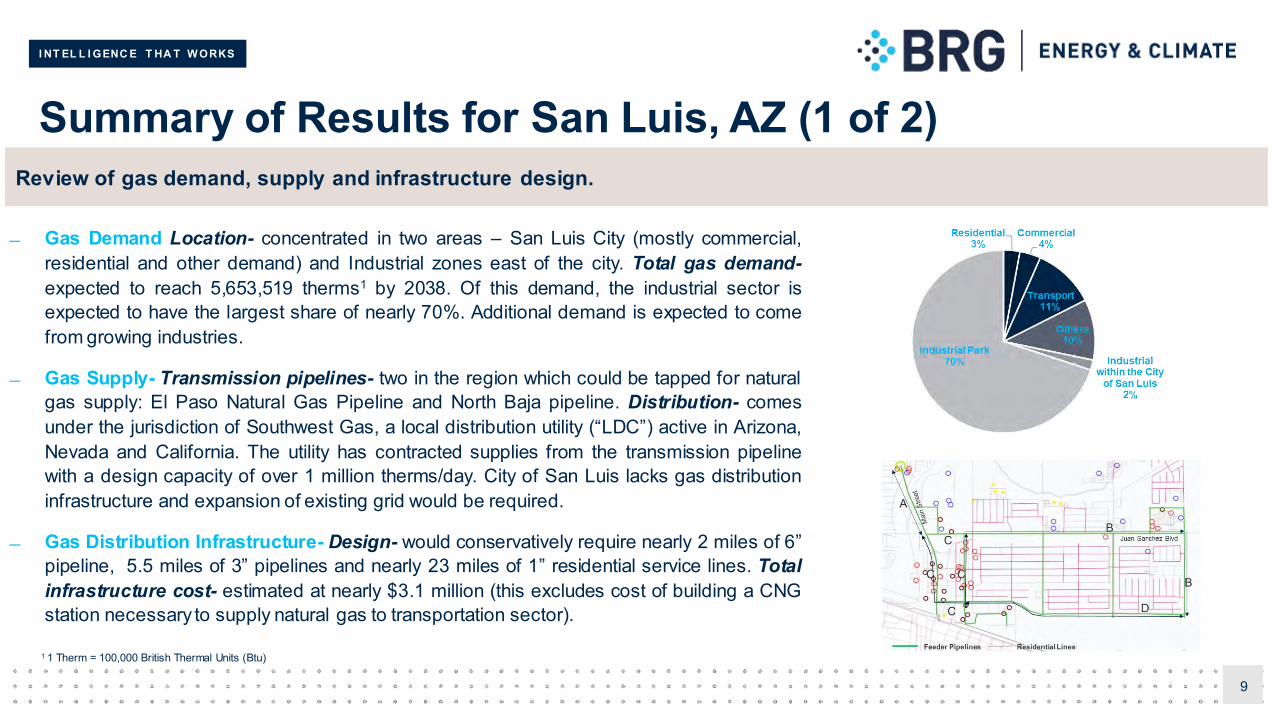
I NT EL L I GENC E T HA T W ORKS
Summary of Results for San Luis, AZ (1 of 2)
9
Review of gas demand, supply and infrastructure design.
Gas Demand Location- concentrated in two areas – San Luis City (mostly commercial,residential and other demand) and Industrial zones east of the city. Total gas demand-expected to reach 5,653,519 therms1 by 2038. Of this demand, the industrial sector isexpected to have the largest share of nearly 70%. Additional demand is expected to comefrom growing industries.
Gas Supply- Transmission pipelines- two in the region which could be tapped for naturalgas supply: El Paso Natural Gas Pipeline and North Baja pipeline. Distribution- comesunder the jurisdiction of Southwest Gas, a local distribution utility (“LDC”) active in Arizona,Nevada and California. The utility has contracted supplies from the transmission pipelinewith a design capacity of over 1 million therms/day. City of San Luis lacks gas distributioninfrastructure and expansion of existing grid would be required.
Gas Distribution Infrastructure- Design- would conservatively require nearly 2 miles of 6”pipeline, 5.5 miles of 3” pipelines and nearly 23 miles of 1” residential service lines. Totalinfrastructure cost- estimated at nearly $3.1 million (this excludes cost of building a CNGstation necessary to supply natural gas to transportation sector).
1 1 Therm = 100,000 British Thermal Units (Btu)
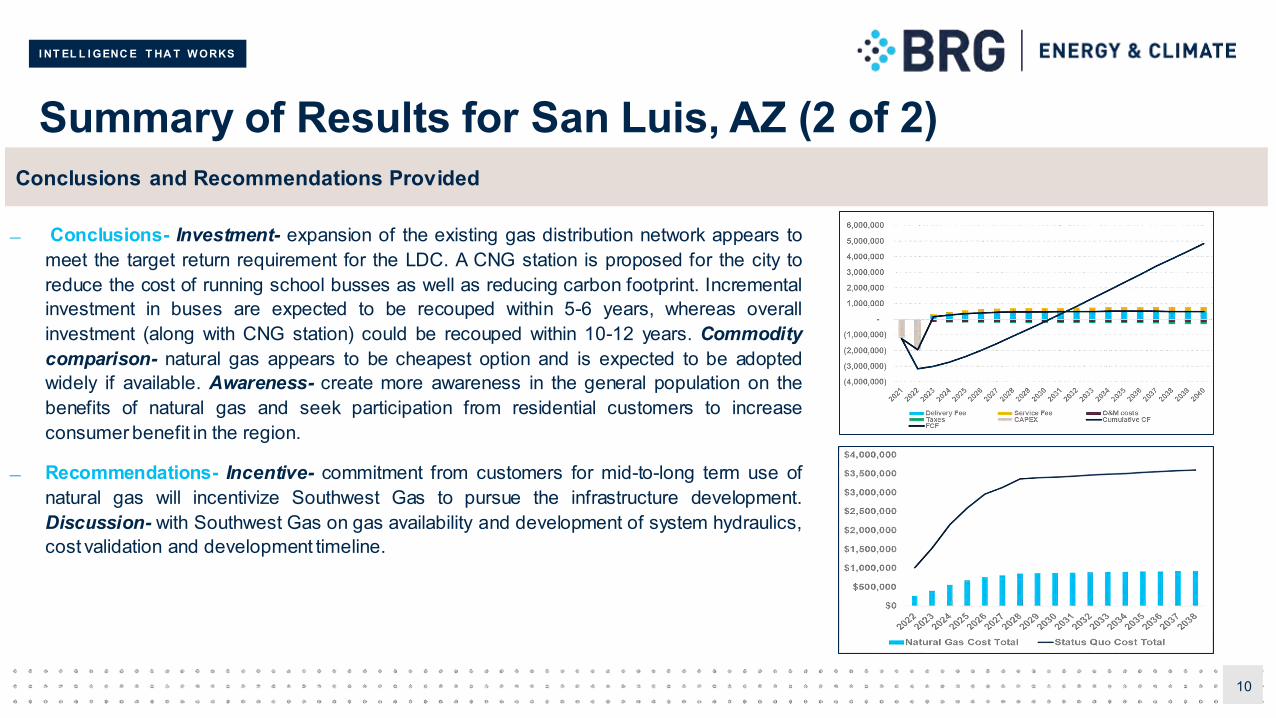
I NT EL L I GENC E T HA T W ORKS
Conclusions- Investment- expansion of the existing gas distribution network appears tomeet the target return requirement for the LDC. A CNG station is proposed for the city toreduce the cost of running school busses as well as reducing carbon footprint. Incrementalinvestment in buses are expected to be recouped within 5-6 years, whereas overallinvestment (along with CNG station) could be recouped within 10-12 years. Commoditycomparison- natural gas appears to be cheapest option and is expected to be adoptedwidely if available. Awareness- create more awareness in the general population on thebenefits of natural gas and seek participation from residential customers to increaseconsumer benefit in the region.
Recommendations- Incentive- commitment from customers for mid-to-long term use ofnatural gas will incentivize Southwest Gas to pursue the infrastructure development.Discussion- with Southwest Gas on gas availability and development of system hydraulics,cost validation and development timeline.
Summary of Results for San Luis, AZ (2 of 2)
10
Conclusions and Recommendations Provided
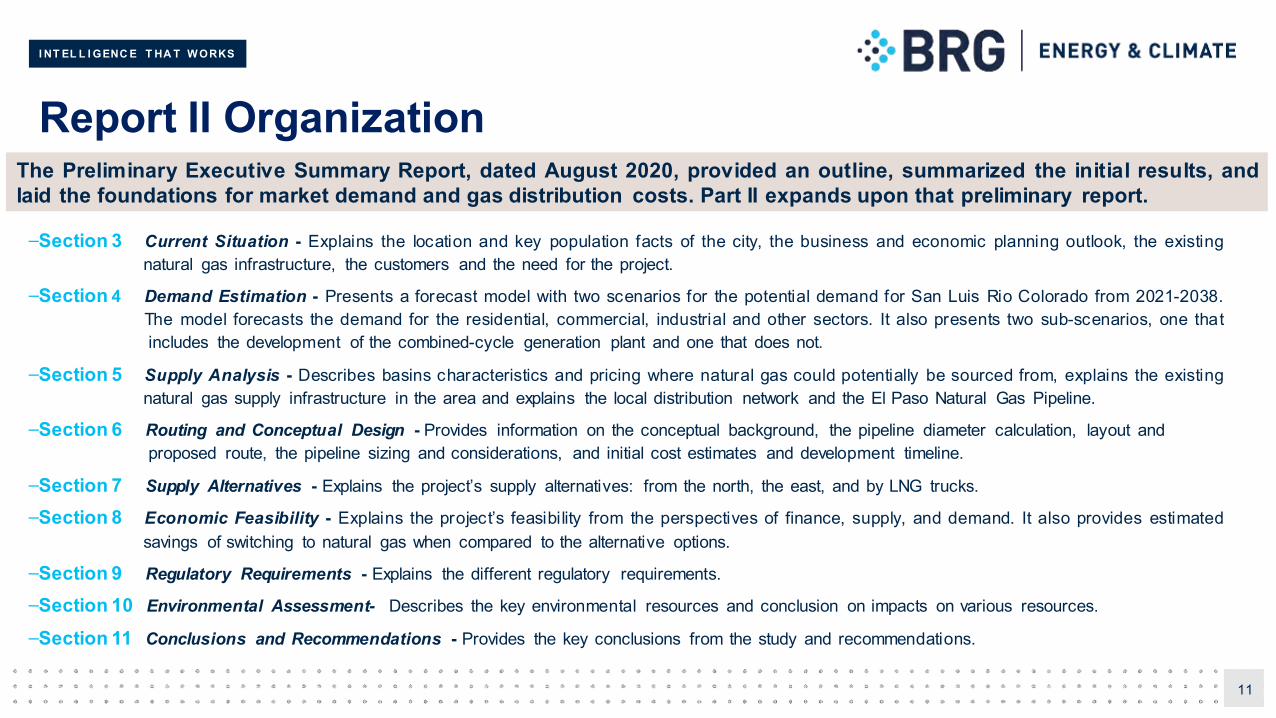
I NT EL L I GENC E T HA T W ORKS
Report II Organization
–Section 3 Current Situation - Explains the location and key population facts of the city, the business and economic planning outlook, the existingnatural gas infrastructure, the customers and the need for the project.
–Section 4 Demand Estimation - Presents a forecast model with two scenarios for the potential demand for San Luis Rio Colorado from 2021-2038.The model forecasts the demand for the residential, commercial, industrial and other sectors. It also presents two sub-scenarios, one thatincludes the development of the combined-cycle generation plant and one that does not.
–Section 5 Supply Analysis - Describes basins characteristics and pricing where natural gas could potentially be sourced from, explains the existingnatural gas supply infrastructure in the area and explains the local distribution network and the El Paso Natural Gas Pipeline.
–Section 6 Routing and Conceptual Design - Provides information on the conceptual background, the pipeline diameter calculation, layout andproposed route, the pipeline sizing and considerations, and initial cost estimates and development timeline.
–Section 7 Supply Alternatives - Explains the project’s supply alternatives: from the north, the east, and by LNG trucks.
–Section 8 Economic Feasibility - Explains the project’s feasibility from the perspectives of finance, supply, and demand. It also provides estimatedsavings of switching to natural gas when compared to the alternative options.
–Section 9 Regulatory Requirements - Explains the different regulatory requirements.
–Section 10 Environmental Assessment- Describes the key environmental resources and conclusion on impacts on various resources.
–Section 11 Conclusions and Recommendations - Provides the key conclusions from the study and recommendations.
11
The Preliminary Executive Summary Report, dated August 2020, provided an outline, summarized the initial results, andlaid the foundations for market demand and gas distribution costs. Part II expands upon that preliminary report.

I NT EL L I GENC E T HA T W ORKS
3 Current Situation
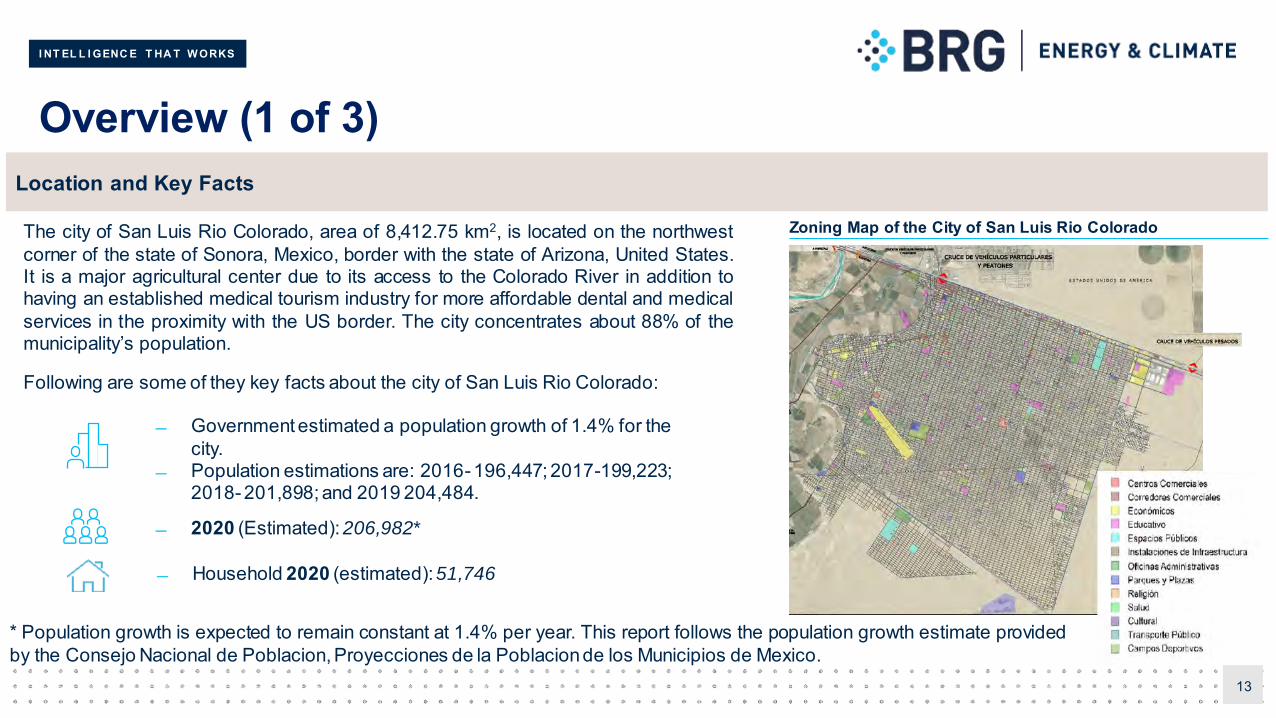
I NT EL L I GENC E T HA T W ORKS
Overview (1 of 3)
13
Location and Key Facts
2020 (Estimated): 206,982*
Government estimated a population growth of 1.4% for the city.
Population estimations are: 2016- 196,447; 2017-199,223; 2018- 201,898; and 2019 204,484.
Household 2020 (estimated): 51,746
The city of San Luis Rio Colorado, area of 8,412.75 km2, is located on the northwestcorner of the state of Sonora, Mexico, border with the state of Arizona, United States.It is a major agricultural center due to its access to the Colorado River in addition tohaving an established medical tourism industry for more affordable dental and medicalservices in the proximity with the US border. The city concentrates about 88% of themunicipality’s population.
Following are some of they key facts about the city of San Luis Rio Colorado:
* Population growth is expected to remain constant at 1.4% per year. This report follows the population growth estimate providedby the Consejo Nacional de Poblacion, Proyecciones de la Poblacionde los Municipios de Mexico.
Zoning Map of the City of San Luis Rio Colorado
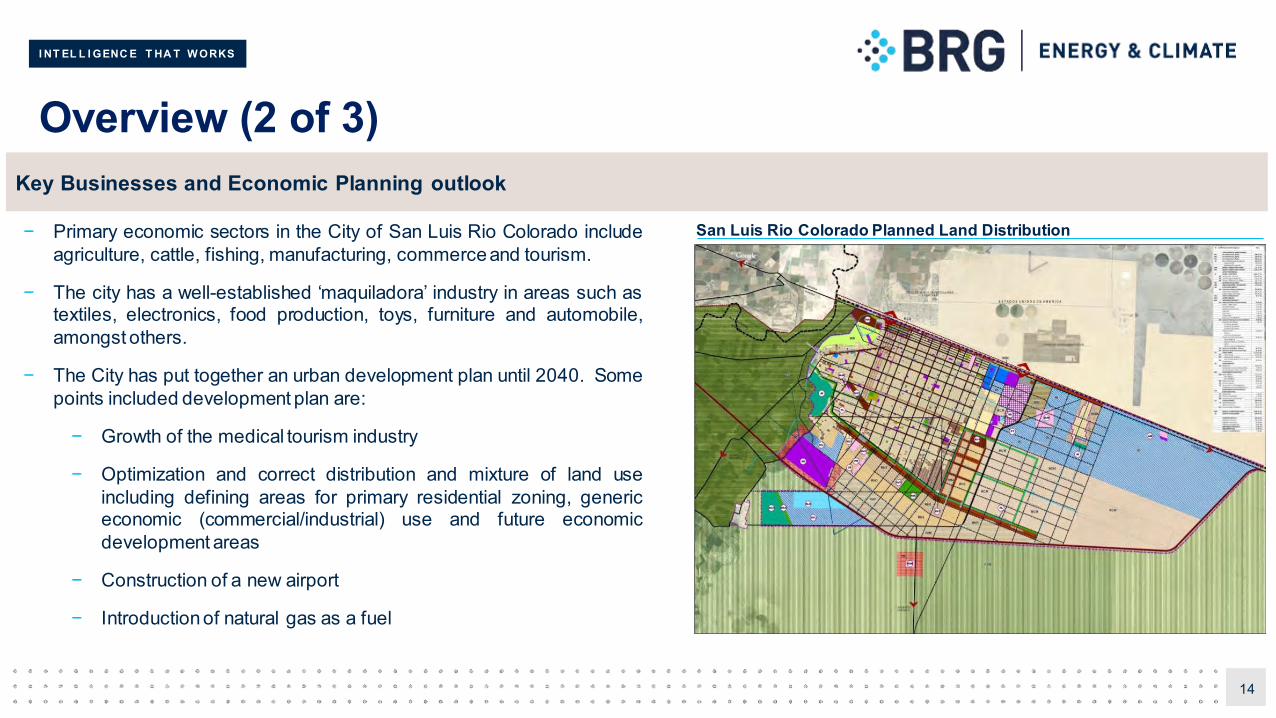
I NT EL L I GENC E T HA T W ORKS
Overview (2 of 3)
14
Key Businesses and Economic Planning outlook
− Primary economic sectors in the City of San Luis Rio Colorado includeagriculture, cattle, fishing, manufacturing, commerceand tourism.
− The city has a well-established ‘maquiladora’ industry in areas such astextiles, electronics, food production, toys, furniture and automobile,amongst others.
− The City has put together an urban development plan until 2040. Somepoints included development plan are:
− Growth of the medical tourism industry
− Optimization and correct distribution and mixture of land useincluding defining areas for primary residential zoning, genericeconomic (commercial/industrial) use and future economicdevelopment areas
− Construction of a new airport
− Introductionof natural gas as a fuel
San Luis Rio Colorado Planned Land Distribution
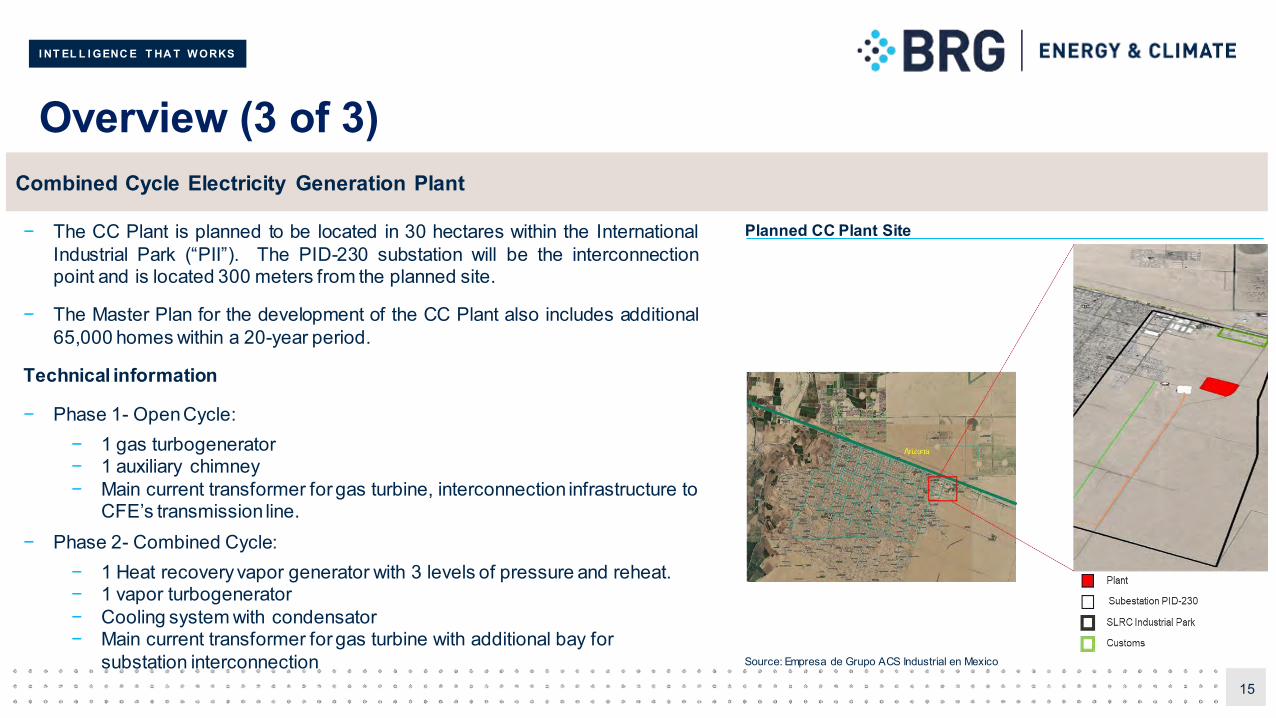
I NT EL L I GENC E T HA T W ORKS
Overview (3 of 3)
15
Combined Cycle Electricity Generation Plant
Planned CC Plant Site− The CC Plant is planned to be located in 30 hectares within the InternationalIndustrial Park (“PII”). The PID-230 substation will be the interconnectionpoint and is located 300 meters from the planned site.
− The Master Plan for the development of the CC Plant also includes additional65,000 homes within a 20-year period.
Technical information
− Phase 1- OpenCycle:− 1 gas turbogenerator− 1 auxiliary chimney− Main current transformer for gas turbine, interconnection infrastructure to
CFE’s transmission line. − Phase 2- Combined Cycle:
− 1 Heat recovery vapor generator with 3 levels of pressure and reheat.− 1 vapor turbogenerator− Cooling system with condensator− Main current transformer for gas turbine with additional bay for
substation interconnection Source: Empresa de Grupo ACS Industrial en Mexico
I NT EL L I GENC E T HA T W ORKS
Existing Natural Gas Infrastructure
16
Two companies have shown interest in developing natural gas pipeline infrastructureand it is likely that some speculatively built infrastructure already exists in the region.The companies are:
− Isagamex
− Gas Natural del Noroeste S.A.
No information was available as it was deemed confidential.
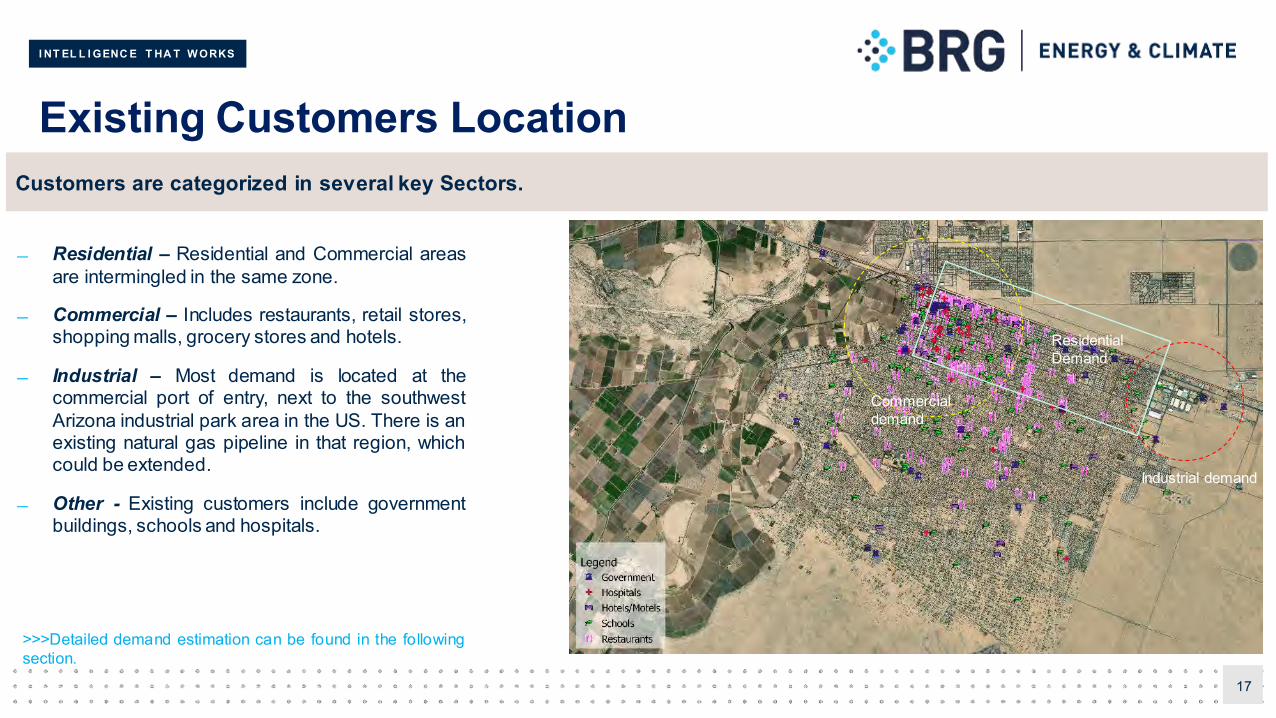
I NT EL L I GENC E T HA T W ORKS
Existing Customers Location
17
Customers are categorized in several key Sectors.
Residential – Residential and Commercial areasare intermingled in the same zone.
Commercial – Includes restaurants, retail stores,shopping malls, grocery stores and hotels.
Industrial – Most demand is located at thecommercial port of entry, next to the southwestArizona industrial park area in the US. There is anexisting natural gas pipeline in that region, whichcould be extended.
Other - Existing customers include governmentbuildings, schools and hospitals.
>>>Detailed demand estimation can be found in the followingsection.
Industrial demand
Commercial demand
Residential Demand
I NT EL L I GENC E T HA T W ORKS
4 Demand Estimation
I NT EL L I GENC E T HA T W ORKS
Demand Estimation Methodology Overview (1 of 4)
19
Step 1: Classificationof demandsegments
− Residential - This Sector consists solely on households. Demand in this Sector is primarily for heating requirements (e.g. fireplace)and household appliances (e.g. cooking, water heating, dryer, etc.)
− Commercial - This Sector includes restaurants, retail stores, grocery stores, hotels and shopping malls. Demand in this Sector ismostly required for heating purposes in heavy duty gas burners and commercial kitchens.
− Industrial - This Sector includes a series of different industries including food preparation, textiles and machinery, amongst others.Demand in this Sector is mostly used for boilers, compressors, generators, space heating and for the processing of industrial goods.
− Transport - This Sector is not included in the present report due to lack of information.
− Other - This Sector includes government buildings, schools and hospitals. Demand in this Sector is mostly required for cooking,heating and appliances.
− For Part I, gas demand was estimated in two regions, the City of San Luis and the Industrial Park. San Luis Rio Colorado, however, has amore intermingled customer based, which is not clearly defined. The City’s urban development plans are not currently defined, nor do theyhave specific timeframe, reason for which they have not been considered in this report.
For consistency purposes, methodology and sectors used in this report follows those used in Part I.
I NT EL L I GENC E T HA T W ORKS
Demand Estimation Methodology Overview (2 of 4)
20
Step 2: Identification of natural gas connectionsper Sector:
Residential - For the demand of natural gas, each residential connection forms a single basic unit, with each residential unit equal to 1household of 4 people. Increase in number of household is corelated to expected populationgrowth.
Commercial - The data for this Sector is collected via geographical information system (GIS) in the region.
Industrial - The data for this Sector is collected from information provided by government officials of the City of San Luis Rio Colorado,and public sources.
Other - The demand for this Sector is identified using GIS systems and validated via discussion with the City of San Luis Rio Coloradoteam.
The number of connections estimated for each of the Sectors represents the maximum number of connections that could be possible today ifeach Sector converts from their existing fuel to natural gas. The breakdown of these connections are provided separately in a spreadsheet formatand can be found as Annex 1 of this report.
Following a bottom-up approach, the report quantified the number of potential natural gas connections in each of the Sectors as follows:
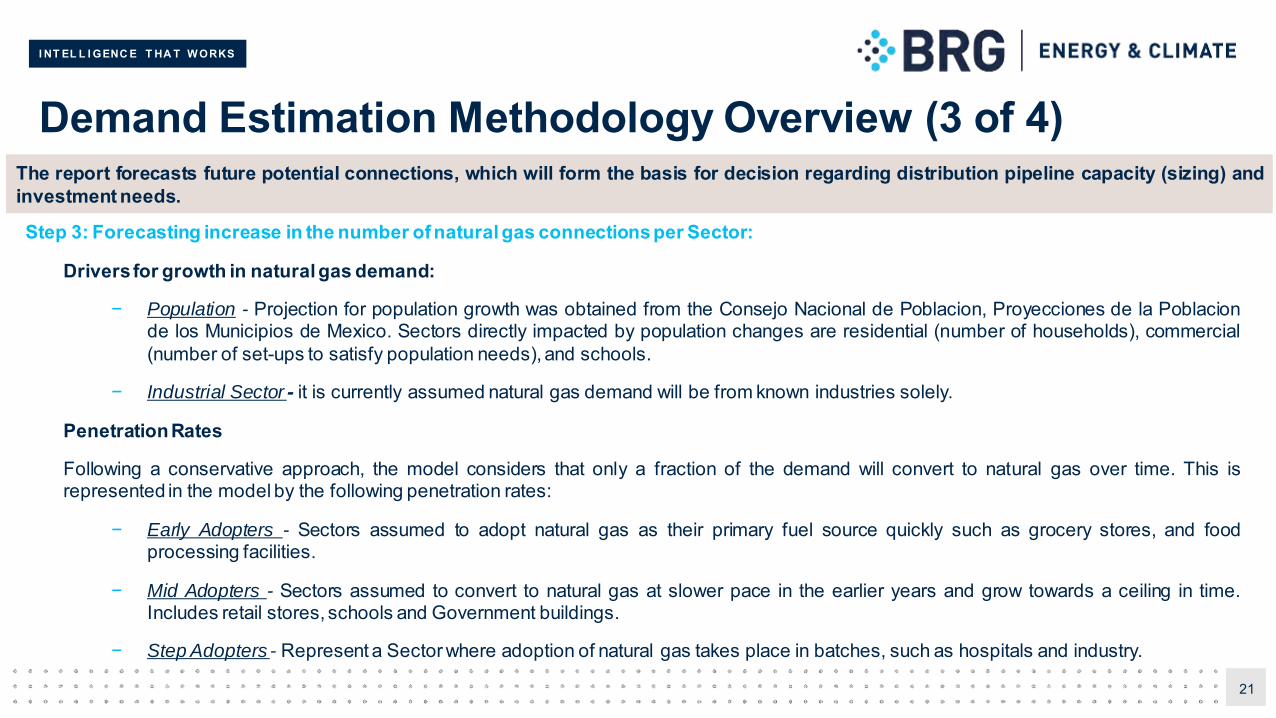
I NT EL L I GENC E T HA T W ORKS
Demand Estimation Methodology Overview (3 of 4)
21
Step 3: Forecasting increase in the number of natural gas connectionsper Sector:
Drivers for growth in natural gas demand:
− Population - Projection for population growth was obtained from the Consejo Nacional de Poblacion, Proyecciones de la Poblacionde los Municipios de Mexico. Sectors directly impacted by population changes are residential (number of households), commercial(number of set-ups to satisfy population needs), and schools.
− Industrial Sector - it is currently assumed natural gas demand will be from known industries solely.
PenetrationRates
Following a conservative approach, the model considers that only a fraction of the demand will convert to natural gas over time. This isrepresented in the model by the following penetration rates:
− Early Adopters - Sectors assumed to adopt natural gas as their primary fuel source quickly such as grocery stores, and foodprocessing facilities.
− Mid Adopters - Sectors assumed to convert to natural gas at slower pace in the earlier years and grow towards a ceiling in time.Includes retail stores, schools and Government buildings.
− Step Adopters - Represent a Sector where adoption of natural gas takes place in batches, such as hospitals and industry.
The report forecasts future potential connections, which will form the basis for decision regarding distribution pipeline capacity (sizing) andinvestment needs.
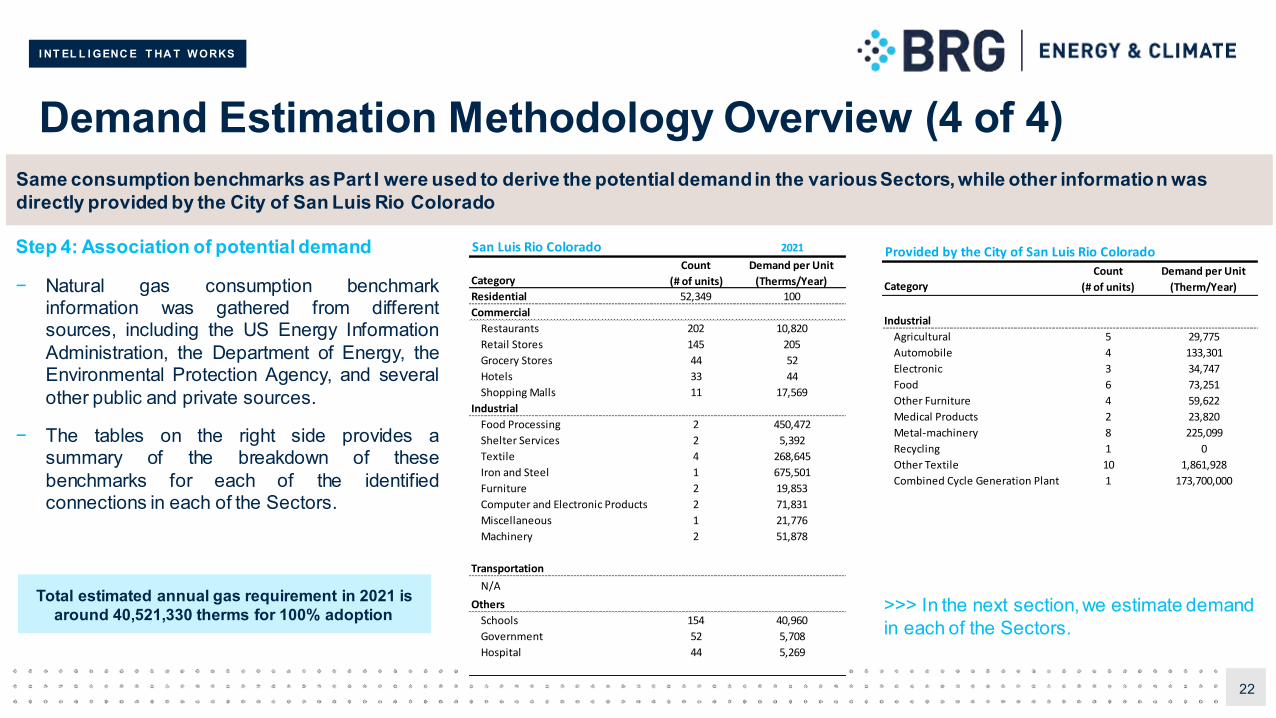
I NT EL L I GENC E T HA T W ORKS
Demand Estimation Methodology Overview (4 of 4)
22
Step 4: Association of potential demand
− Natural gas consumption benchmarkinformation was gathered from differentsources, including the US Energy InformationAdministration, the Department of Energy, theEnvironmental Protection Agency, and severalother public and private sources.
− The tables on the right side provides asummary of the breakdown of thesebenchmarks for each of the identifiedconnections in each of the Sectors.
Same consumption benchmarks as Part I were used to derive the potential demand in the various Sectors, while other information was directly provided by the City of San Luis Rio Colorado
Total estimated annual gas requirement in 2021 is around 40,521,330 therms for 100% adoption >>> In the next section, we estimate demand
in each of the Sectors.
Provided by the City of San Luis Rio Colorado
Category
Count
(# of units)
Demand per Unit
(Therm/Year)
Industrial
Agricultural 5 29,775
Automobile 4 133,301
Electronic 3 34,747
Food 6 73,251
Other Furniture 4 59,622
Medical Products 2 23,820
Metal-machinery 8 225,099
Recycling 1 0
Other Textile 10 1,861,928
Combined Cycle Generation Plant 1 173,700,000
San Luis Rio Colorado 2021
Category
Count
(# of units)
Demand per Unit
(Therms/Year)
Residential 52,349 100
Commercial
Restaurants 202 10,820
Retail Stores 145 205
Grocery Stores 44 52
Hotels 33 44
Shopping Malls 11 17,569
Industrial
Food Processing 2 450,472
Shelter Services 2 5,392
Textile 4 268,645
Iron and Steel 1 675,501
Furniture 2 19,853
Computer and Electronic Products 2 71,831
Miscellaneous 1 21,776
Machinery 2 51,878
Transportation
N/A
Others
Schools 154 40,960
Government 52 5,708
Hospital 44 5,269
I NT EL L I GENC E T HA T W ORKS
San Luis Rio Colorado Demand Summary
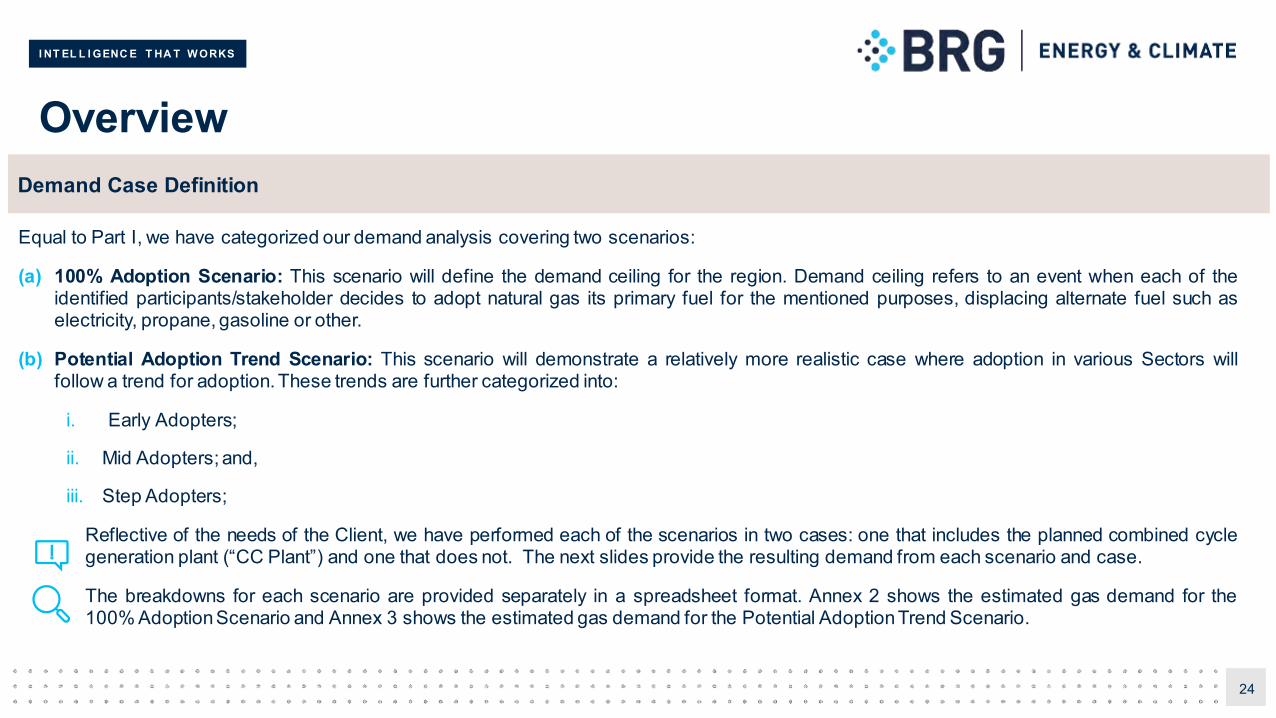
I NT EL L I GENC E T HA T W ORKS
Overview
24
Demand Case Definition
Equal to Part I, we have categorized our demand analysis covering two scenarios:
(a) 100% Adoption Scenario: This scenario will define the demand ceiling for the region. Demand ceiling refers to an event when each of theidentified participants/stakeholder decides to adopt natural gas its primary fuel for the mentioned purposes, displacing alternate fuel such aselectricity, propane, gasoline or other.
(b) Potential Adoption Trend Scenario: This scenario will demonstrate a relatively more realistic case where adoption in various Sectors willfollow a trend for adoption. These trends are further categorized into:
i. Early Adopters;
ii. Mid Adopters; and,
iii. Step Adopters;
Reflective of the needs of the Client, we have performed each of the scenarios in two cases: one that includes the planned combined cyclegeneration plant (“CC Plant”) and one that does not. The next slides provide the resulting demand from each scenario and case.
The breakdowns for each scenario are provided separately in a spreadsheet format. Annex 2 shows the estimated gas demand for the100% AdoptionScenario and Annex 3 shows the estimated gas demand for the Potential AdoptionTrend Scenario.
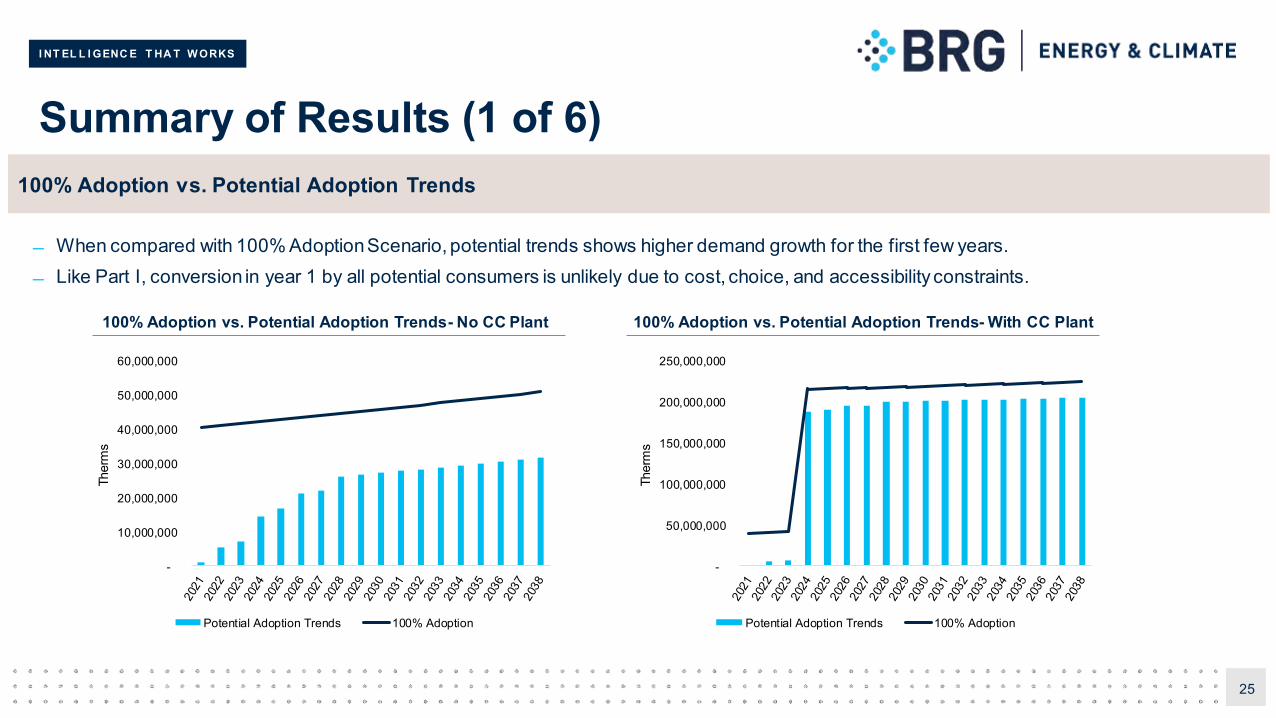
I NT EL L I GENC E T HA T W ORKS
Summary of Results (1 of 6)
25
100% Adoption vs. Potential Adoption Trends
When compared with 100% Adoption Scenario, potential trends shows higher demand growth for the first few years. Like Part I, conversion in year 1 by all potential consumers is unlikely due to cost, choice, and accessibility constraints.
100% Adoption vs. Potential Adoption Trends- No CC Plant 100% Adoption vs. Potential Adoption Trends- With CC Plant
-
50,000,000
100,000,000
150,000,000
200,000,000
250,000,000
Ther
ms
Potential Adoption Trends 100% Adoption
-
10,000,000
20,000,000
30,000,000
40,000,000
50,000,000
60,000,000
Ther
ms
Potential Adoption Trends 100% Adoption
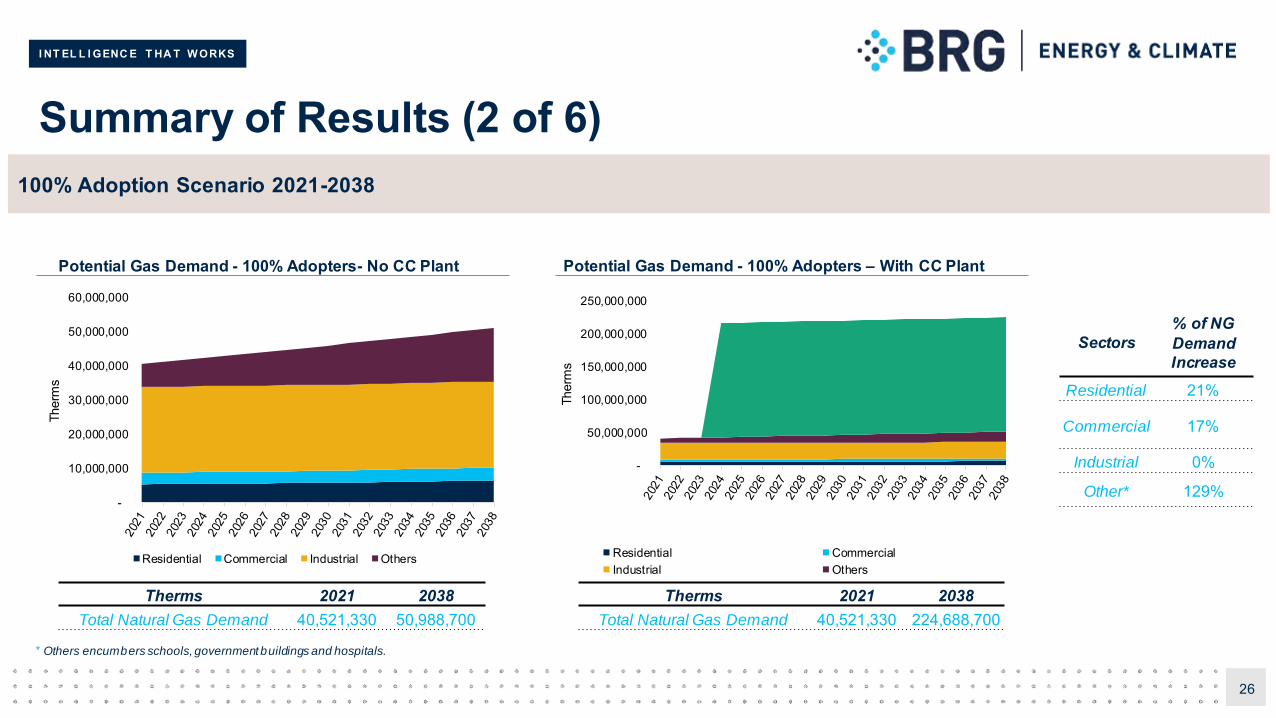
I NT EL L I GENC E T HA T W ORKS
Summary of Results (2 of 6)
* Others encumbers schools, government buildings and hospitals.
26
100% Adoption Scenario 2021-2038
Sectors% of NG Demand Increase
Residential 21%
Commercial 17%
Industrial 0%
Other* 129%
Potential Gas Demand - 100% Adopters – With CC PlantPotential Gas Demand - 100% Adopters- No CC Plant
Therms 2021 2038Total Natural Gas Demand 40,521,330 224,688,700
Therms 2021 2038Total Natural Gas Demand 40,521,330 50,988,700
-
10,000,000
20,000,000
30,000,000
40,000,000
50,000,000
60,000,000
Ther
ms
Residential Commercial Industrial Others
-
50,000,000
100,000,000
150,000,000
200,000,000
250,000,000
Ther
ms
Residential CommercialIndustrial Others
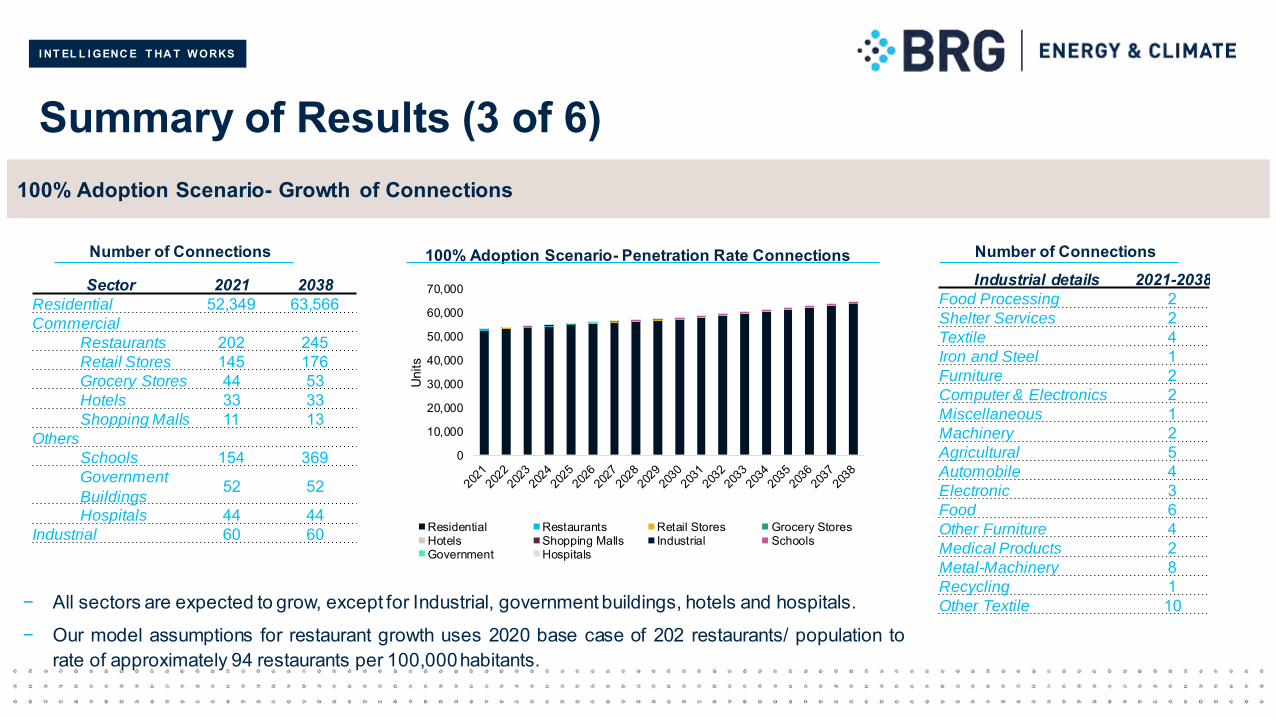
I NT EL L I GENC E T HA T W ORKS
Summary of Results (3 of 6)100% Adoption Scenario- Growth of Connections
100% Adoption Scenario- Penetration Rate Connections
Sector 2021 2038Residential 52,349 63,566Commercial
Restaurants 202 245Retail Stores 145 176Grocery Stores 44 53Hotels 33 33Shopping Malls 11 13
Others
Schools 154 369Government
Buildings52 52
Hospitals 44 44Industrial 60 60
Industrial details 2021-2038Food Processing 2Shelter Services 2Textile 4Iron and Steel 1Furniture 2Computer & Electronics 2Miscellaneous 1Machinery 2Agricultural 5Automobile 4Electronic 3Food 6Other Furniture 4Medical Products 2Metal-Machinery 8Recycling 1Other Textile 10
Number of Connections Number of Connections
− All sectors are expected to grow, except for Industrial, government buildings, hotels and hospitals.
− Our model assumptions for restaurant growth uses 2020 base case of 202 restaurants/ population torate of approximately 94 restaurants per 100,000habitants.
0
10,000
20,000
30,000
40,000
50,000
60,000
70,000
Uni
ts
Residential Restaurants Retail Stores Grocery StoresHotels Shopping Malls Industrial SchoolsGovernment Hospitals
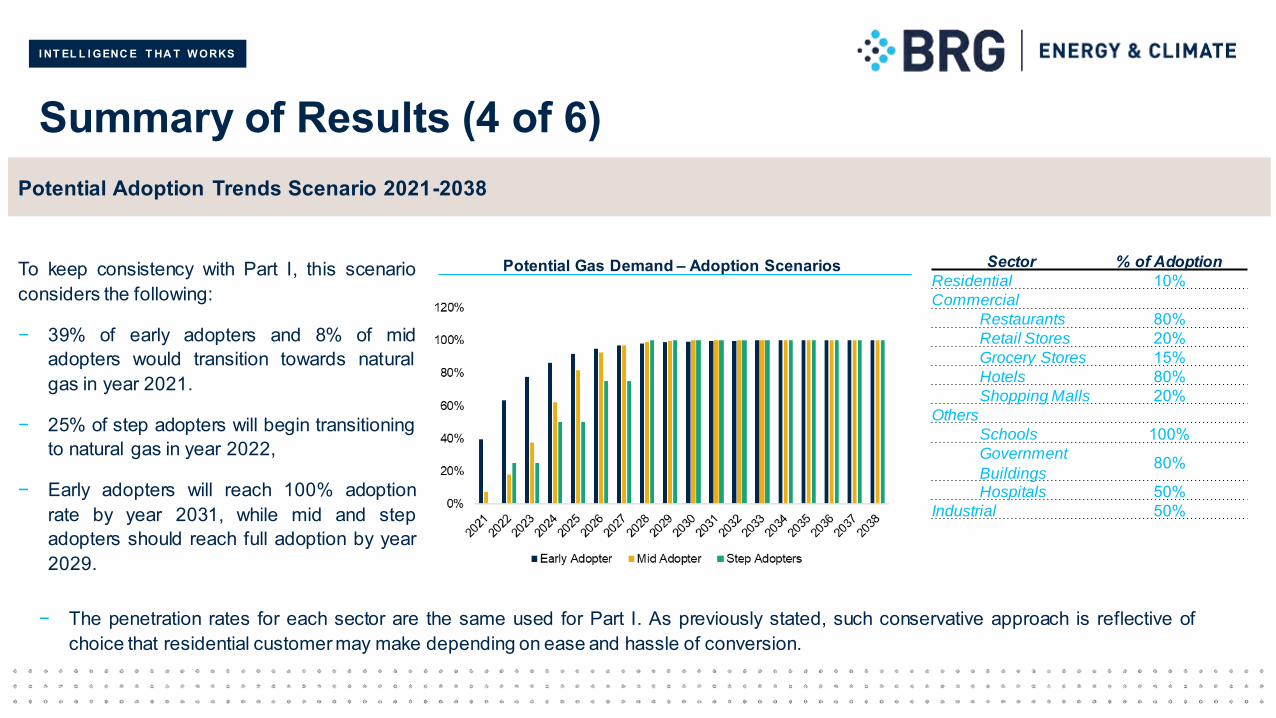
I NT EL L I GENC E T HA T W ORKS
Summary of Results (4 of 6)
To keep consistency with Part I, this scenarioconsiders the following:
− 39% of early adopters and 8% of midadopters would transition towards naturalgas in year 2021.
− 25% of step adopters will begin transitioningto natural gas in year 2022,
− Early adopters will reach 100% adoptionrate by year 2031, while mid and stepadopters should reach full adoption by year2029.
Potential Adoption Trends Scenario 2021-2038
Potential Gas Demand – Adoption Scenarios Sector % of AdoptionResidential 10%Commercial
Restaurants 80%Retail Stores 20%Grocery Stores 15%Hotels 80%Shopping Malls 20%
Others
Schools 100%Government
Buildings80%
Hospitals 50%Industrial 50%
− The penetration rates for each sector are the same used for Part I. As previously stated, such conservative approach is reflective ofchoice that residential customer may make depending on ease and hassle of conversion.
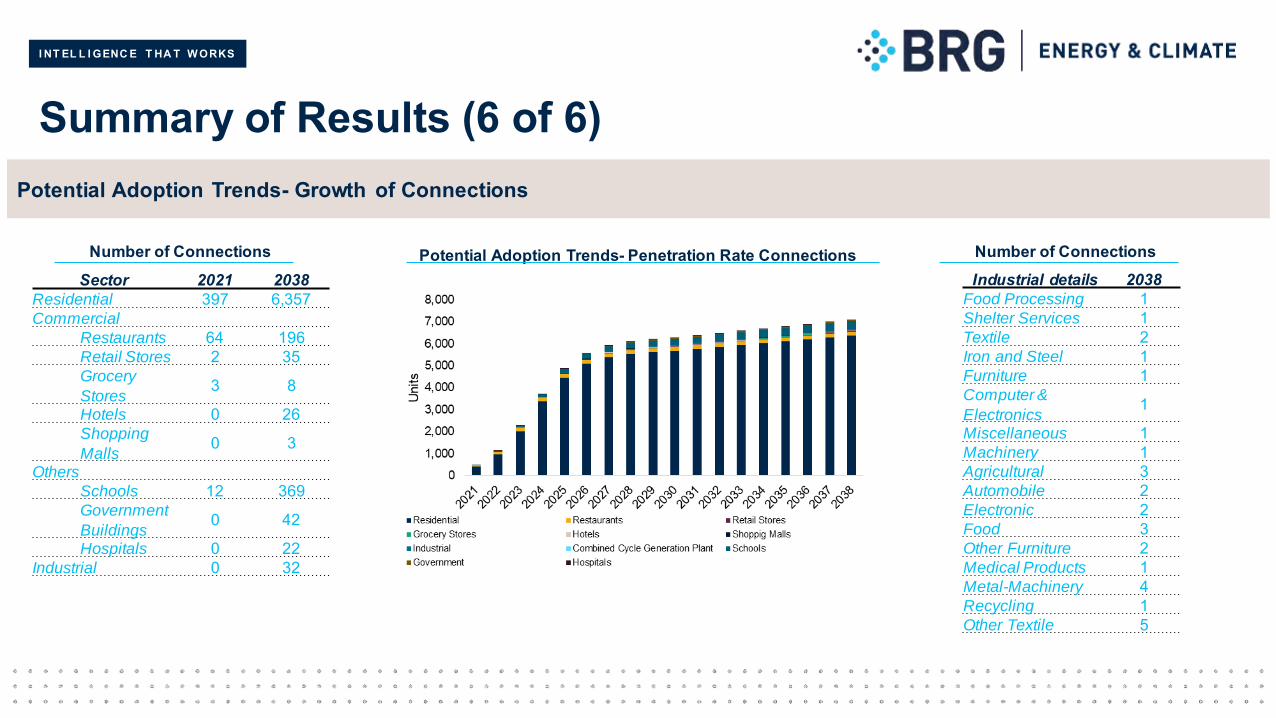
I NT EL L I GENC E T HA T W ORKS
Summary of Results (6 of 6)Potential Adoption Trends- Growth of Connections
Potential Adoption Trends- Penetration Rate ConnectionsSector 2021 2038
Residential 397 6,357Commercial
Restaurants 64 196Retail Stores 2 35Grocery
Stores3 8
Hotels 0 26Shopping
Malls0 3
Others
Schools 12 369Government
Buildings0 42
Hospitals 0 22Industrial 0 32
Industrial details 2038Food Processing 1Shelter Services 1Textile 2Iron and Steel 1Furniture 1Computer &
Electronics1
Miscellaneous 1Machinery 1Agricultural 3Automobile 2Electronic 2Food 3Other Furniture 2Medical Products 1Metal-Machinery 4Recycling 1Other Textile 5
Number of Connections Number of Connections
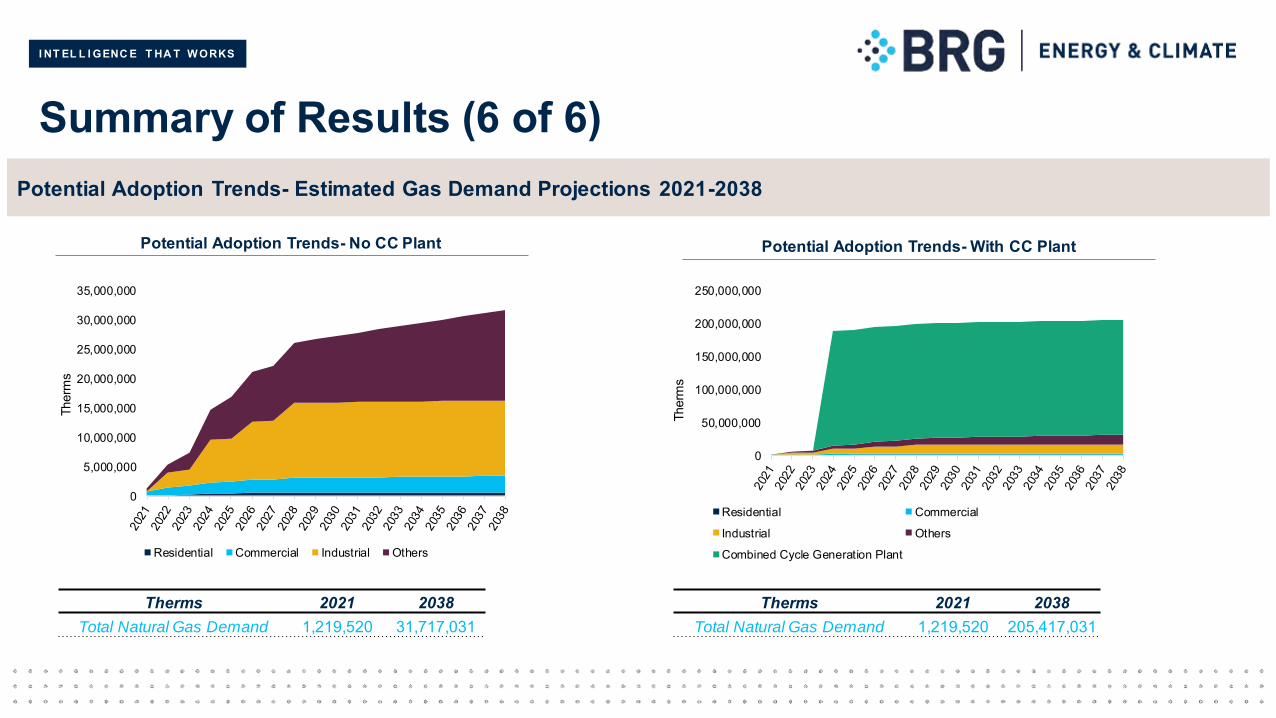
I NT EL L I GENC E T HA T W ORKS
Summary of Results (6 of 6)Potential Adoption Trends- Estimated Gas Demand Projections 2021-2038
Potential Adoption Trends- No CC Plant Potential Adoption Trends- With CC Plant
Therms 2021 2038Total Natural Gas Demand 1,219,520 31,717,031
Therms 2021 2038Total Natural Gas Demand 1,219,520 205,417,031
0
5,000,000
10,000,000
15,000,000
20,000,000
25,000,000
30,000,000
35,000,000
Ther
ms
Residential Commercial Industrial Others
0
50,000,000
100,000,000
150,000,000
200,000,000
250,000,000
Ther
ms
Residential Commercial
Industrial Others
Combined Cycle Generation Plant
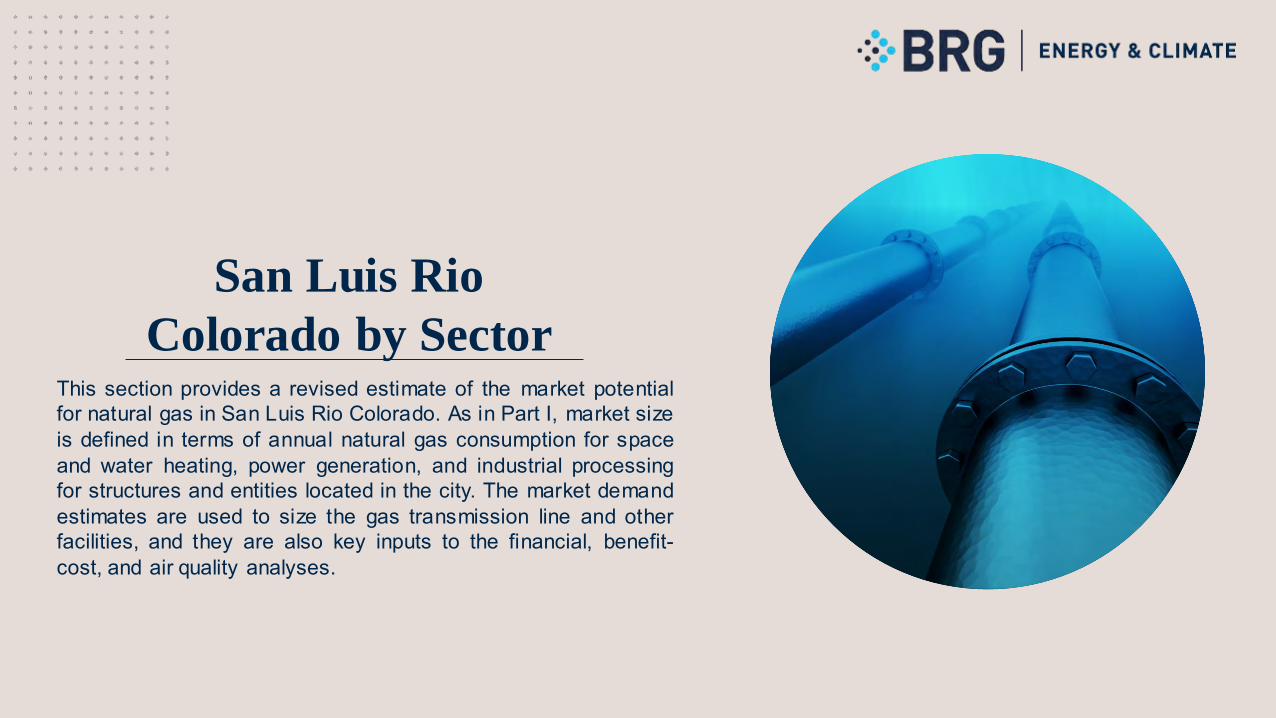
I NT EL L I GENC E T HA T W ORKS
San Luis Rio
Colorado by SectorThis section provides a revised estimate of the market potentialfor natural gas in San Luis Rio Colorado. As in Part I, market sizeis defined in terms of annual natural gas consumption for spaceand water heating, power generation, and industrial processingfor structures and entities located in the city. The market demandestimates are used to size the gas transmission line and otherfacilities, and they are also key inputs to the financial, benefit-cost, and air quality analyses.
I NT EL L I GENC E T HA T W ORKS
Residential
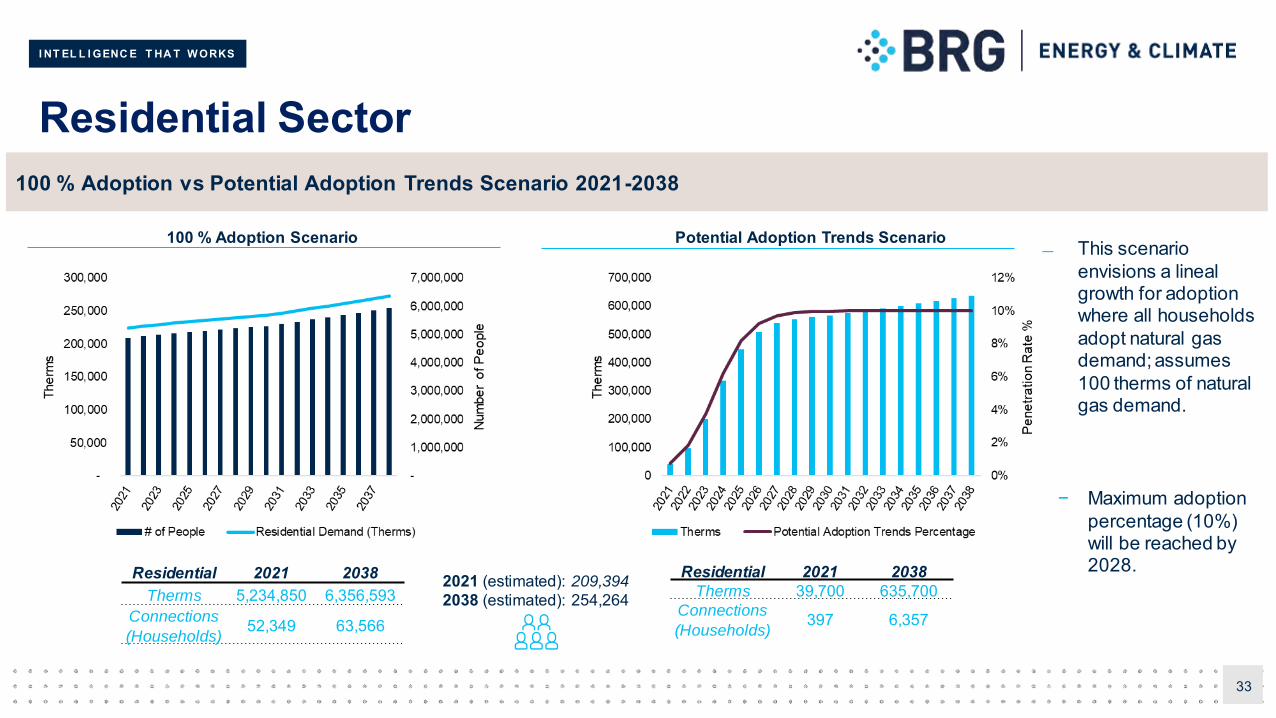
I NT EL L I GENC E T HA T W ORKS
Residential Sector
33
100 % Adoption vs Potential Adoption Trends Scenario 2021-2038
Residential 2021 2038Therms 5,234,850 6,356,593
Connections
(Households)52,349 63,566
Residential 2021 2038Therms 39,700 635,700
Connections
(Households)397 6,357
This scenario envisions a lineal growth for adoption where all households adopt natural gas demand; assumes 100 therms of natural gas demand.
− Maximum adoption percentage (10%) will be reached by 2028.
100 % Adoption Scenario Potential Adoption Trends Scenario
2021 (estimated): 209,394
2038 (estimated): 254,264
I NT EL L I GENC E T HA T W ORKS
Commercial
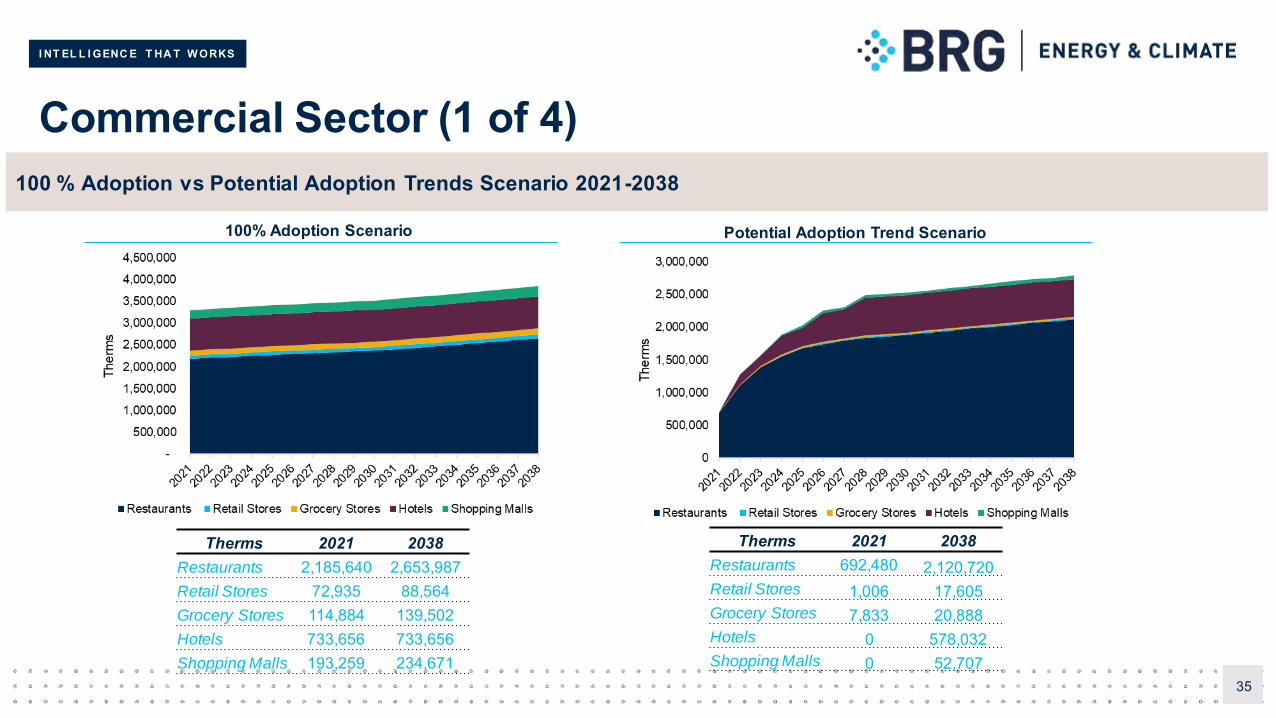
I NT EL L I GENC E T HA T W ORKS
Commercial Sector (1 of 4)
35
100 % Adoption vs Potential Adoption Trends Scenario 2021-2038
Therms 2021 2038Restaurants 2,185,640 2,653,987Retail Stores 72,935 88,564Grocery Stores 114,884 139,502Hotels 733,656 733,656Shopping Malls 193,259 234,671
100% Adoption Scenario Potential Adoption Trend Scenario
Therms 2021 2038Restaurants 692,480 2,120,720Retail Stores 1,006 17,605Grocery Stores 7,833 20,888Hotels 0 578,032Shopping Malls 0 52,707
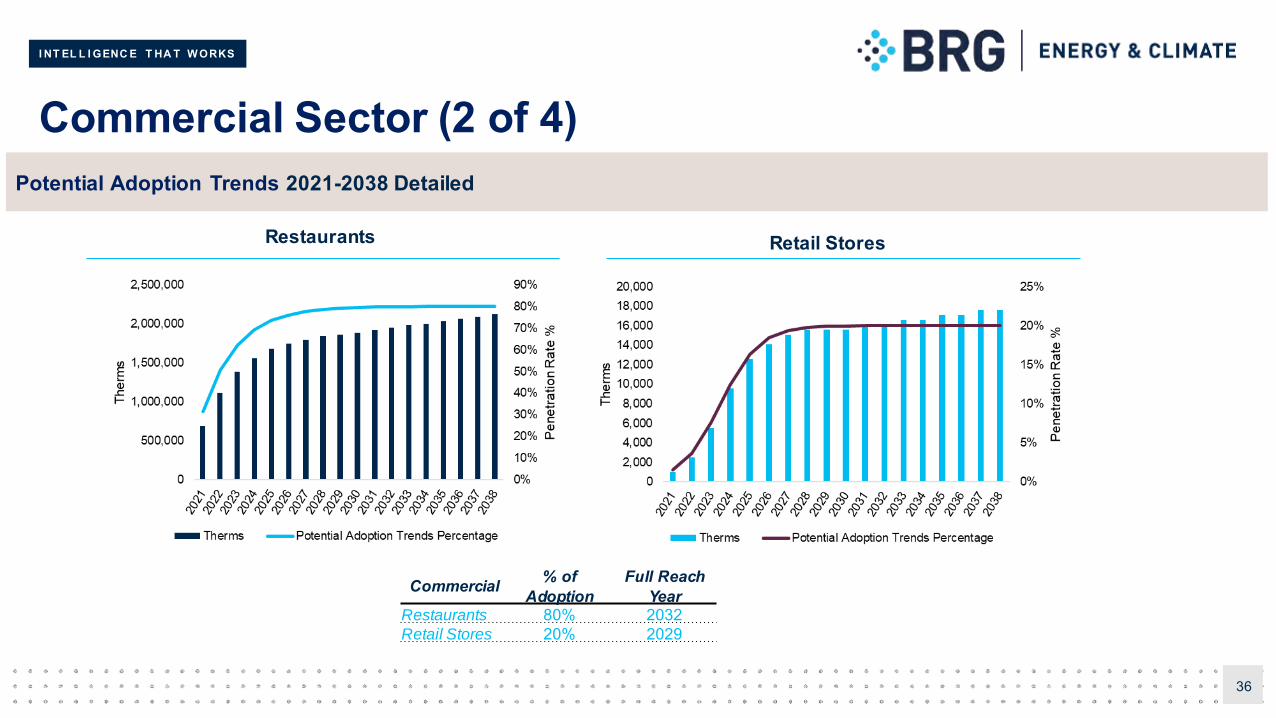
I NT EL L I GENC E T HA T W ORKS
Commercial Sector (2 of 4)
36
Potential Adoption Trends 2021-2038 Detailed
Restaurants Retail Stores
Commercial % of Adoption
Full Reach Year
Restaurants 80% 2032Retail Stores 20% 2029
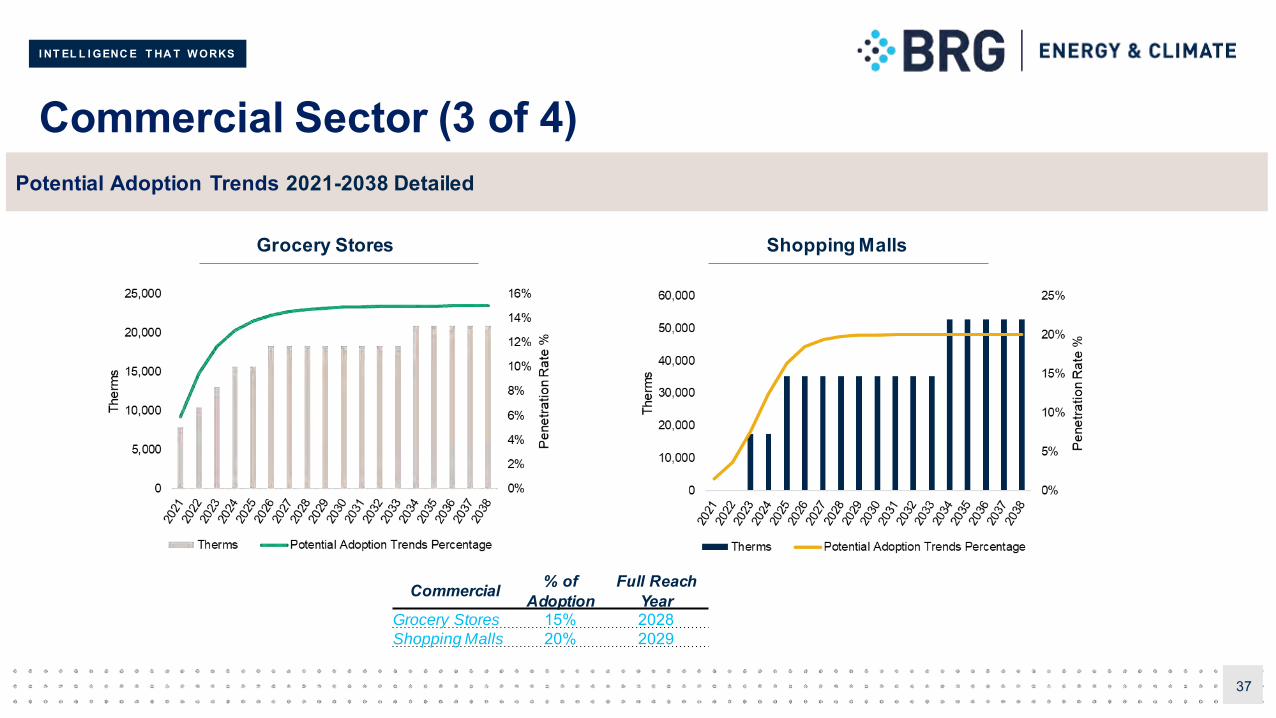
I NT EL L I GENC E T HA T W ORKS
Commercial Sector (3 of 4)
37
Potential Adoption Trends 2021-2038 Detailed
Grocery Stores Shopping Malls
Commercial % of Adoption
Full Reach Year
Grocery Stores 15% 2028Shopping Malls 20% 2029
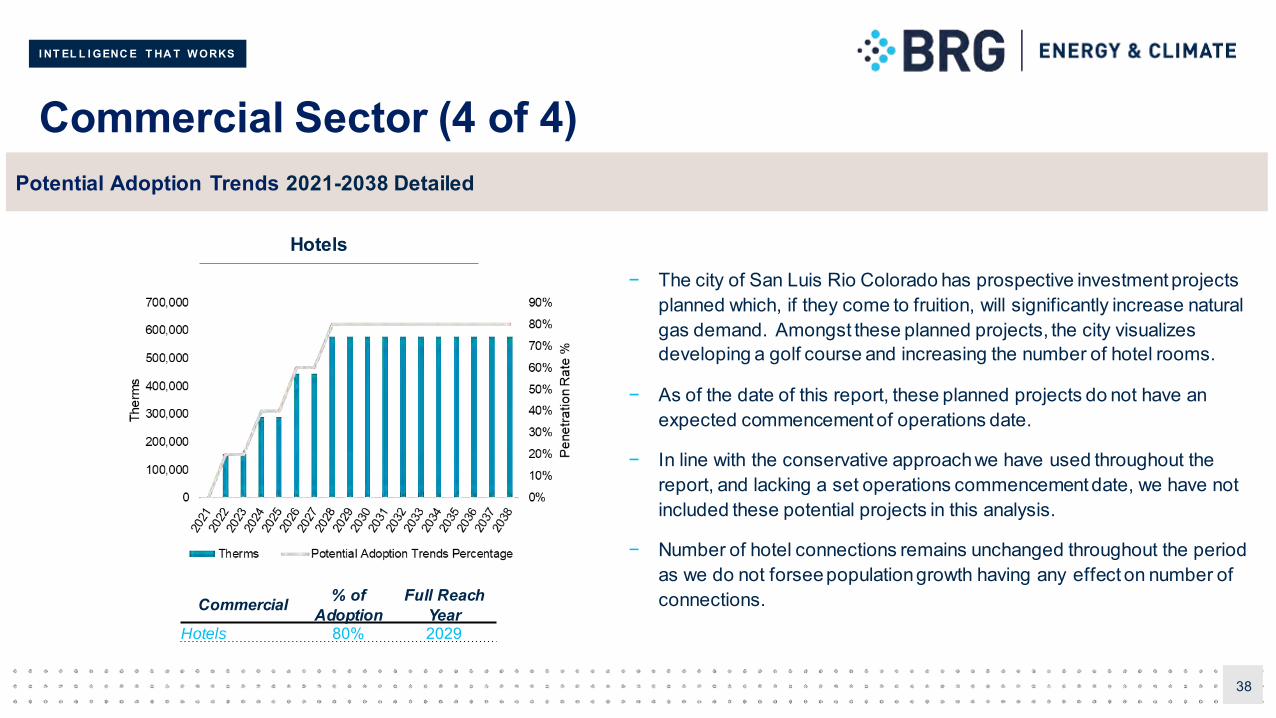
I NT EL L I GENC E T HA T W ORKS
Commercial Sector (4 of 4)
38
Potential Adoption Trends 2021-2038 Detailed
Hotels
Commercial % of Adoption
Full Reach Year
Hotels 80% 2029
− The city of San Luis Rio Colorado has prospective investment projects planned which, if they come to fruition, will significantly increase natural gas demand. Amongst these planned projects, the city visualizes developing a golf course and increasing the number of hotel rooms.
− As of the date of this report, these planned projects do not have an expected commencement of operations date.
− In line with the conservative approach we have used throughout the report, and lacking a set operations commencement date, we have not included these potential projects in this analysis.
− Number of hotel connections remains unchanged throughout the period as we do not forseepopulation growth having any effect on number of connections.

I NT EL L I GENC E T HA T W ORKS
Industrial
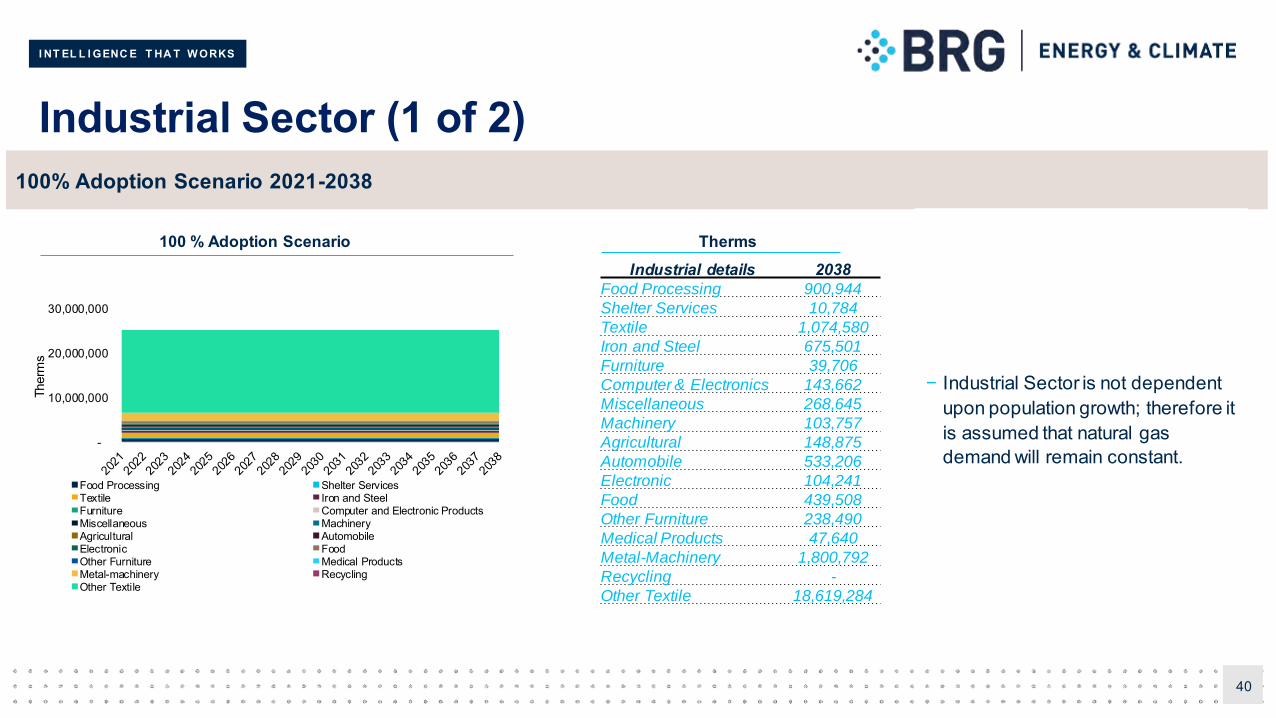
I NT EL L I GENC E T HA T W ORKS
Industrial Sector (1 of 2)
40
100% Adoption Scenario 2021-2038
100 % Adoption ScenarioIndustrial details 2038
Food Processing 900,944
Shelter Services 10,784
Textile 1,074,580
Iron and Steel 675,501
Furniture 39,706
Computer & Electronics 143,662
Miscellaneous 268,645
Machinery 103,757
Agricultural 148,875
Automobile 533,206
Electronic 104,241
Food 439,508
Other Furniture 238,490
Medical Products 47,640
Metal-Machinery 1,800,792
Recycling -
Other Textile 18,619,284
Therms
− Industrial Sector is not dependent upon population growth; therefore it is assumed that natural gas demand will remain constant.
-
10,000,000
20,000,000
30,000,000
Ther
ms
Food Processing Shelter ServicesTextile Iron and SteelFurniture Computer and Electronic ProductsMiscellaneous MachineryAgricultural AutomobileElectronic FoodOther Furniture Medical ProductsMetal-machinery RecyclingOther Textile
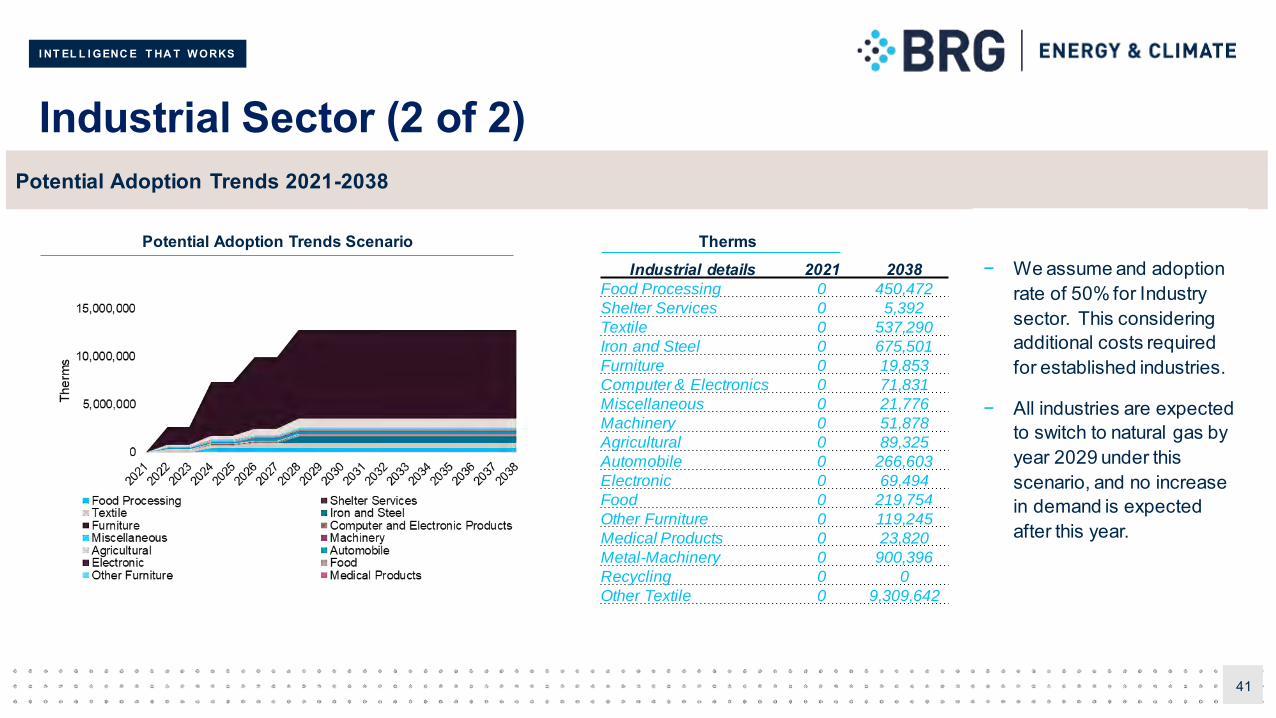
I NT EL L I GENC E T HA T W ORKS
Industrial Sector (2 of 2)
41
Potential Adoption Trends 2021-2038
Potential Adoption Trends ScenarioIndustrial details 2021 2038
Food Processing 0 450,472
Shelter Services 0 5,392
Textile 0 537,290
Iron and Steel 0 675,501
Furniture 0 19,853
Computer & Electronics 0 71,831
Miscellaneous 0 21,776
Machinery 0 51,878
Agricultural 0 89,325
Automobile 0 266,603
Electronic 0 69,494
Food 0 219,754
Other Furniture 0 119,245
Medical Products 0 23,820
Metal-Machinery 0 900,396
Recycling 0 0
Other Textile 0 9,309,642
Therms− We assume and adoption
rate of 50% for Industry sector. This considering additional costs required for established industries.
− All industries are expected to switch to natural gas by year 2029 under this scenario, and no increase in demand is expected after this year.

I NT EL L I GENC E T HA T W ORKS
Other
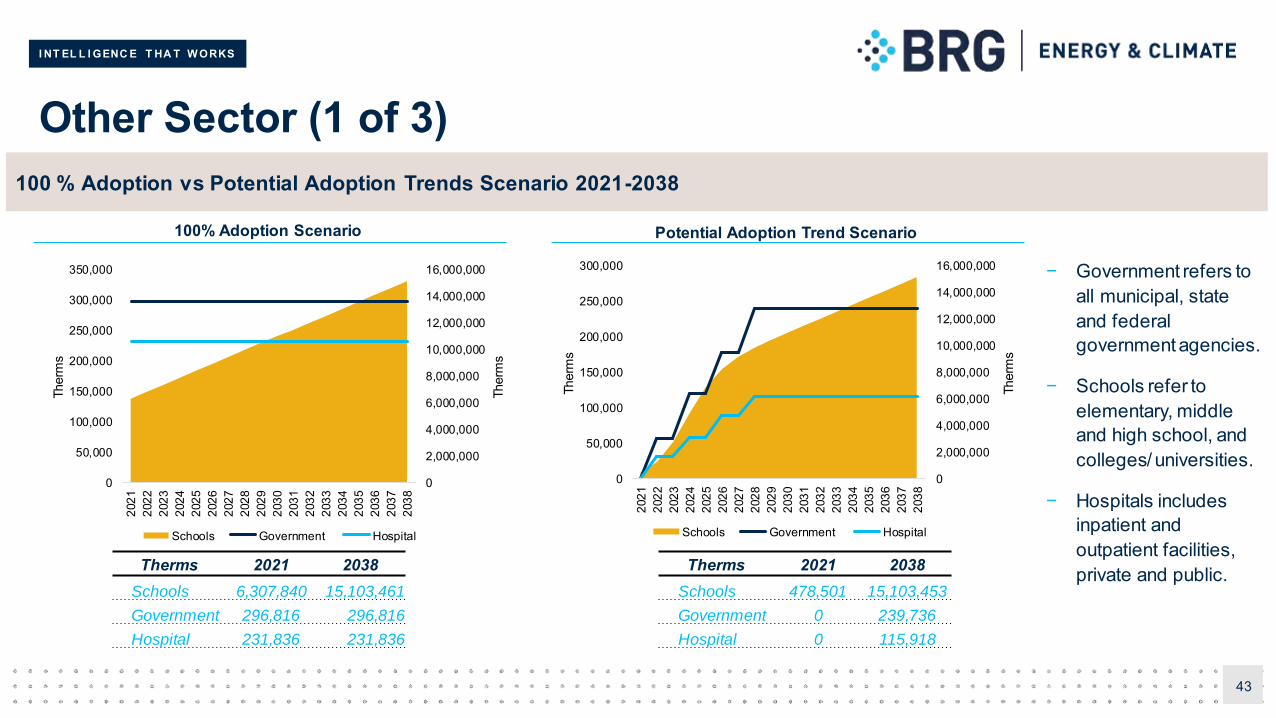
I NT EL L I GENC E T HA T W ORKS
Other Sector (1 of 3)
43
100 % Adoption vs Potential Adoption Trends Scenario 2021-2038
Therms 2021 2038Schools 6,307,840 15,103,461
Government 296,816 296,816
Hospital 231,836 231,836
100% Adoption Scenario Potential Adoption Trend Scenario
Therms 2021 2038Schools 478,501 15,103,453
Government 0 239,736
Hospital 0 115,918
− Government refers to all municipal, state and federal government agencies.
− Schools refer to elementary, middle and high school, and colleges/ universities.
− Hospitals includes inpatient and outpatient facilities, private and public.
0
2,000,000
4,000,000
6,000,000
8,000,000
10,000,000
12,000,000
14,000,000
16,000,000
0
50,000
100,000
150,000
200,000
250,000
300,000
350,000
2021
2022
2023
2024
2025
2026
2027
2028
2029
2030
2031
2032
2033
2034
2035
2036
2037
2038
Ther
ms
Ther
ms
Schools Government Hospital
0
2,000,000
4,000,000
6,000,000
8,000,000
10,000,000
12,000,000
14,000,000
16,000,000
0
50,000
100,000
150,000
200,000
250,000
300,000
2021
2022
2023
2024
2025
2026
2027
2028
2029
2030
2031
2032
2033
2034
2035
2036
2037
2038
Ther
ms
Ther
ms
Schools Government Hospital
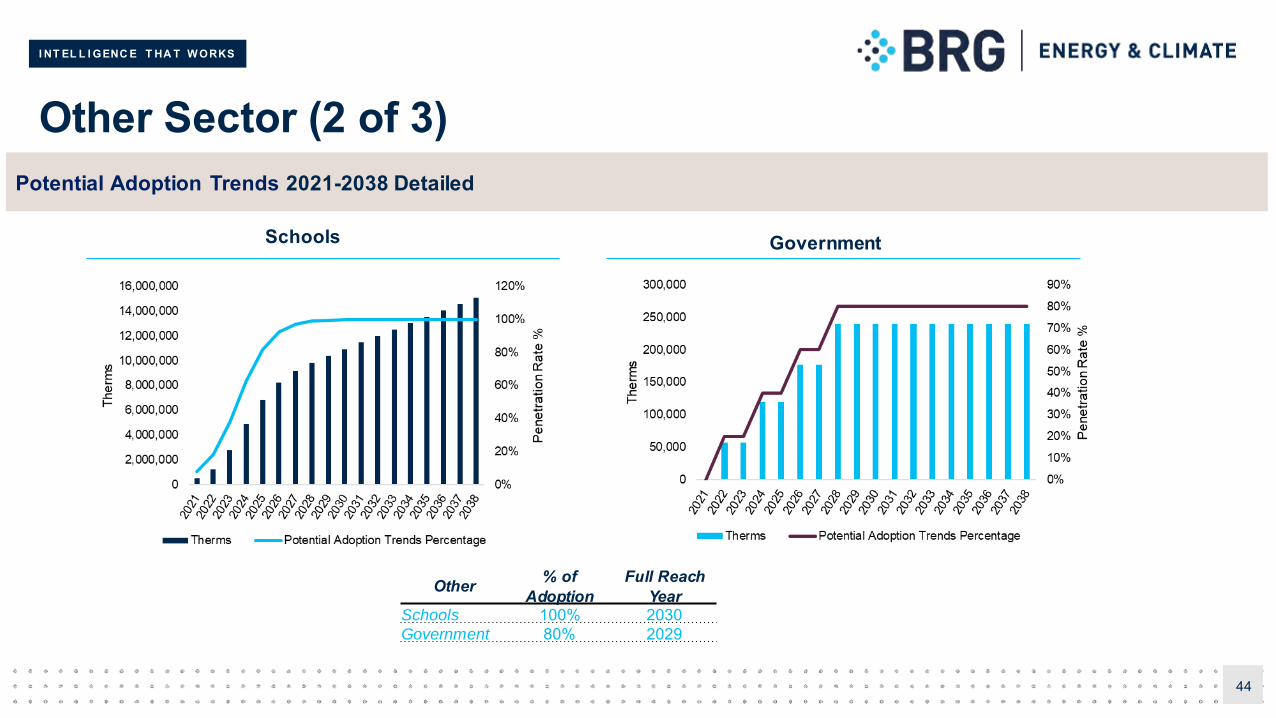
I NT EL L I GENC E T HA T W ORKS
Other Sector (2 of 3)
44
Potential Adoption Trends 2021-2038 Detailed
Schools Government
Other % of Adoption
Full Reach Year
Schools 100% 2030Government 80% 2029
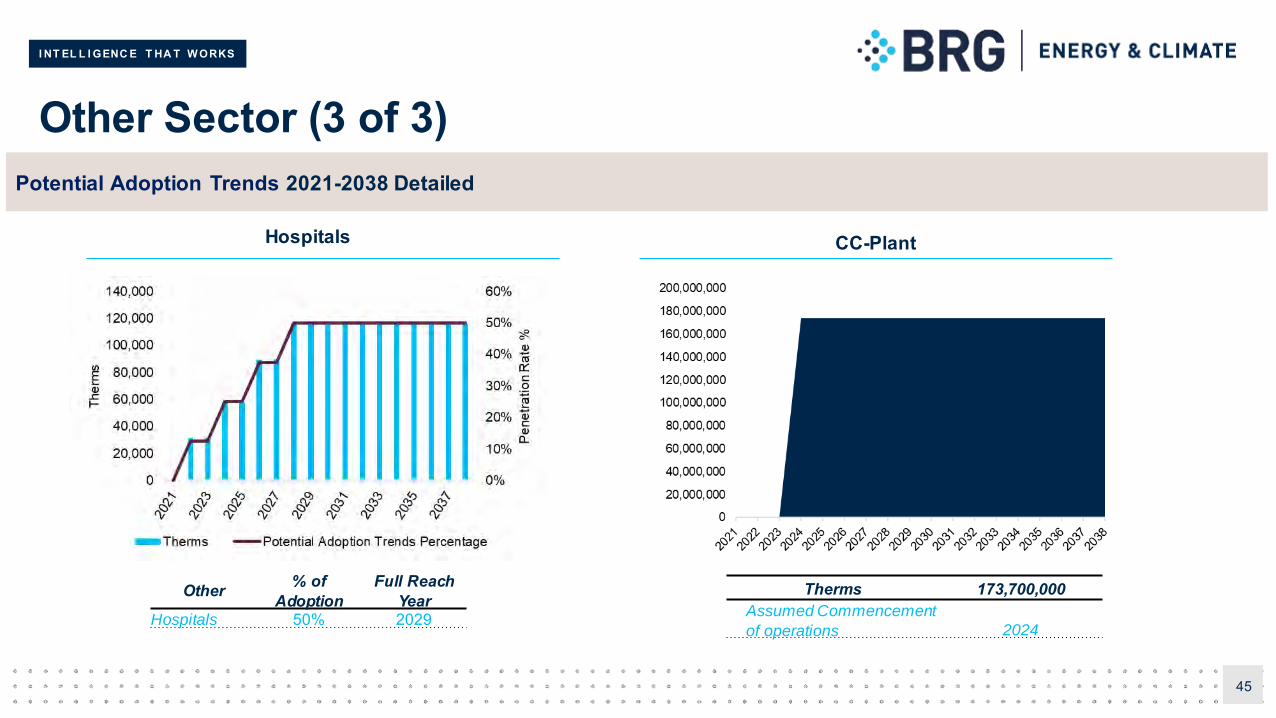
I NT EL L I GENC E T HA T W ORKS
Other Sector (3 of 3)
45
Potential Adoption Trends 2021-2038 Detailed
Hospitals CC-Plant
Other % of Adoption
Full Reach Year
Hospitals 50% 2029
Therms 173,700,000Assumed Commencement
of operations 2024
I NT EL L I GENC E T HA T W ORKS
5 Supply Analysis
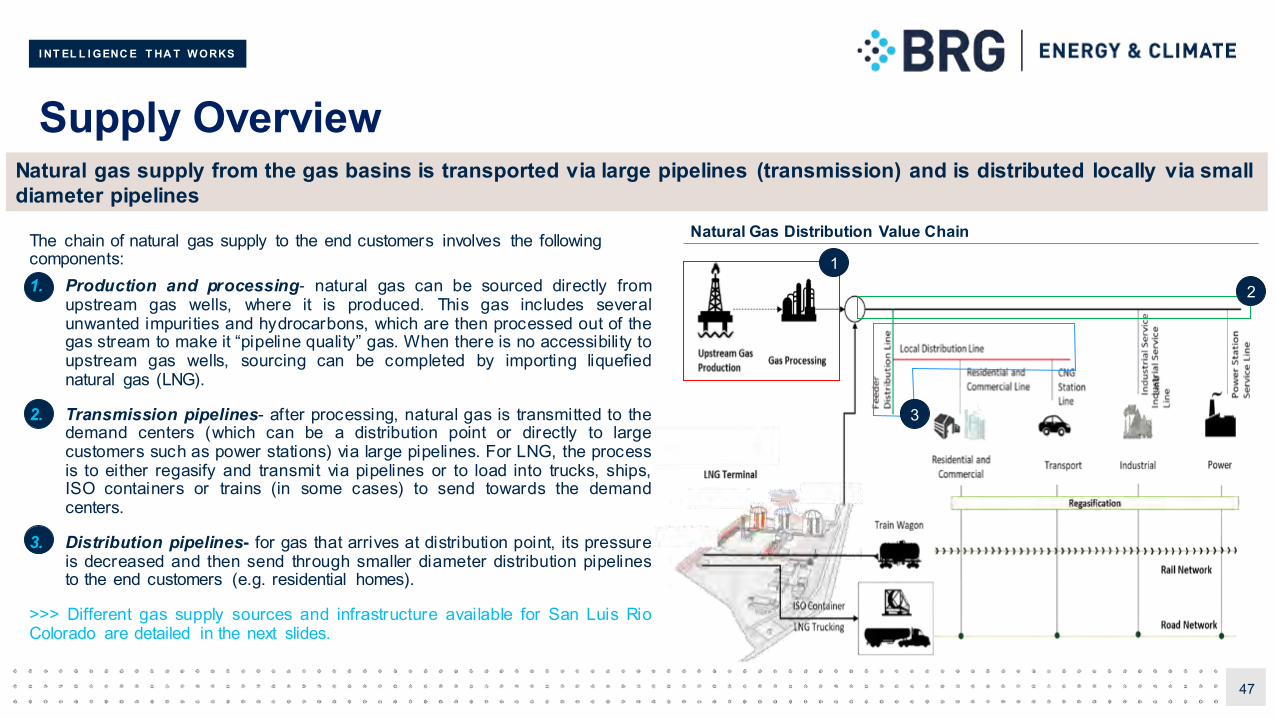
I NT EL L I GENC E T HA T W ORKS
Supply Overview
47
Natural gas supply from the gas basins is transported via large pipelines (transmission) and is distributed locally via smalldiameter pipelines
Natural Gas Distribution Value Chain
1
2
3
The chain of natural gas supply to the end customers involves the following components:1. Production and processing- natural gas can be sourced directly from
upstream gas wells, where it is produced. This gas includes severalunwanted impurities and hydrocarbons, which are then processed out of thegas stream to make it “pipeline quality” gas. When there is no accessibility toupstream gas wells, sourcing can be completed by importing liquefiednatural gas (LNG).
2. Transmission pipelines- after processing, natural gas is transmitted to thedemand centers (which can be a distribution point or directly to largecustomers such as power stations) via large pipelines. For LNG, the processis to either regasify and transmit via pipelines or to load into trucks, ships,ISO containers or trains (in some cases) to send towards the demandcenters.
3. Distribution pipelines- for gas that arrives at distribution point, its pressureis decreased and then send through smaller diameter distribution pipelinesto the end customers (e.g. residential homes).
>>> Different gas supply sources and infrastructure available for San Luis RioColorado are detailed in the next slides.
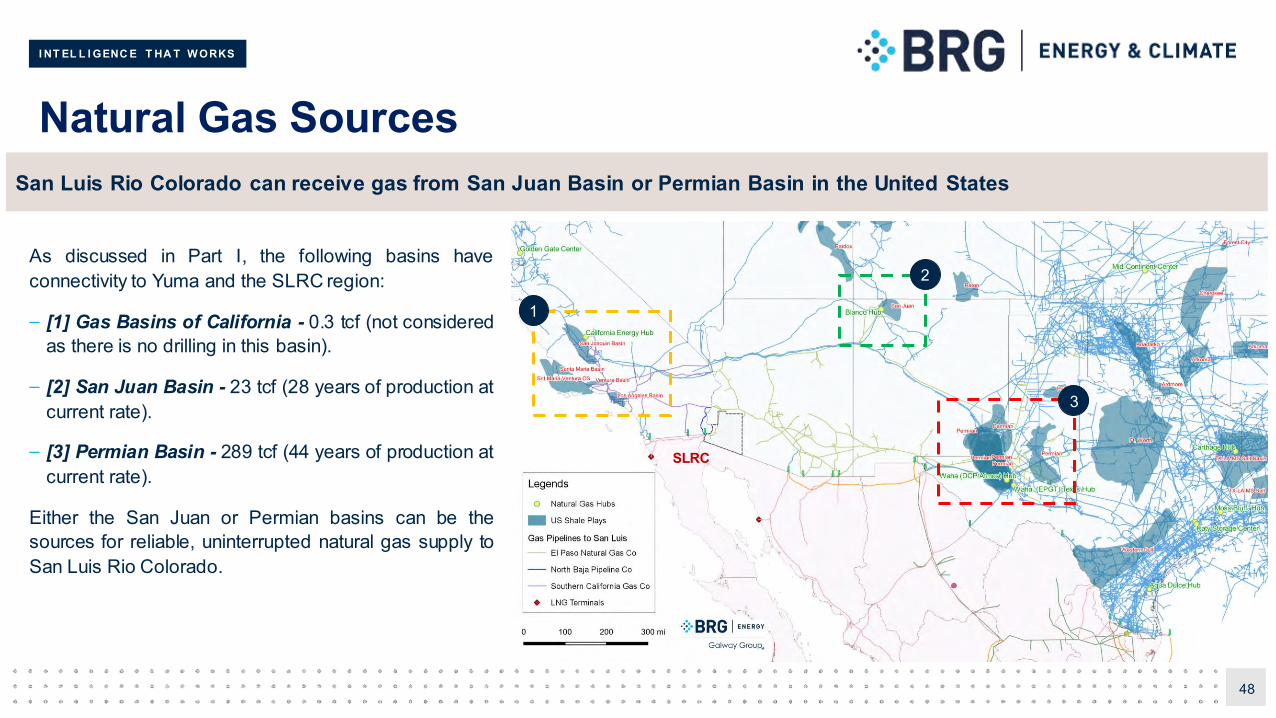
I NT EL L I GENC E T HA T W ORKS
Natural Gas Sources
48
San Luis Rio Colorado can receive gas from San Juan Basin or Permian Basin in the United States
As discussed in Part I, the following basins haveconnectivity to Yuma and the SLRC region:
– [1] Gas Basins of California - 0.3 tcf (not consideredas there is no drilling in this basin).
– [2] San Juan Basin - 23 tcf (28 years of production atcurrent rate).
– [3] Permian Basin - 289 tcf (44 years of production atcurrent rate).
Either the San Juan or Permian basins can be thesources for reliable, uninterrupted natural gas supply toSan Luis Rio Colorado.
SLRC
1
2
3
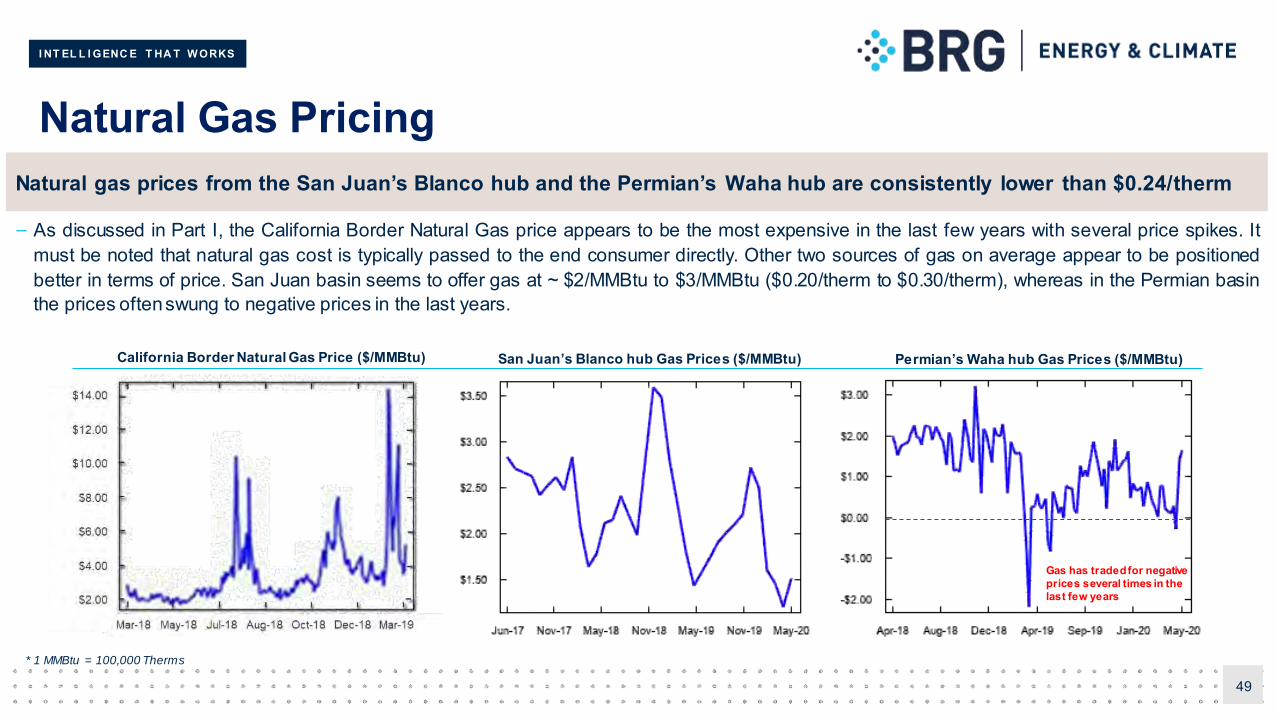
I NT EL L I GENC E T HA T W ORKS
Natural Gas Pricing
49
Natural gas prices from the San Juan’s Blanco hub and the Permian’s Waha hub are consistently lower than $0.24/therm
San Juan’s Blanco hub Gas Prices ($/MMBtu) Permian’s Waha hub Gas Prices ($/MMBtu)
* 1 MMBtu = 100,000 Therms
Gas has traded for negative prices several times in the last few years
California Border Natural Gas Price ($/MMBtu)
– As discussed in Part I, the California Border Natural Gas price appears to be the most expensive in the last few years with several price spikes. Itmust be noted that natural gas cost is typically passed to the end consumer directly. Other two sources of gas on average appear to be positionedbetter in terms of price. San Juan basin seems to offer gas at ~ $2/MMBtu to $3/MMBtu ($0.20/therm to $0.30/therm), whereas in the Permian basinthe prices oftenswung to negative prices in the last years.
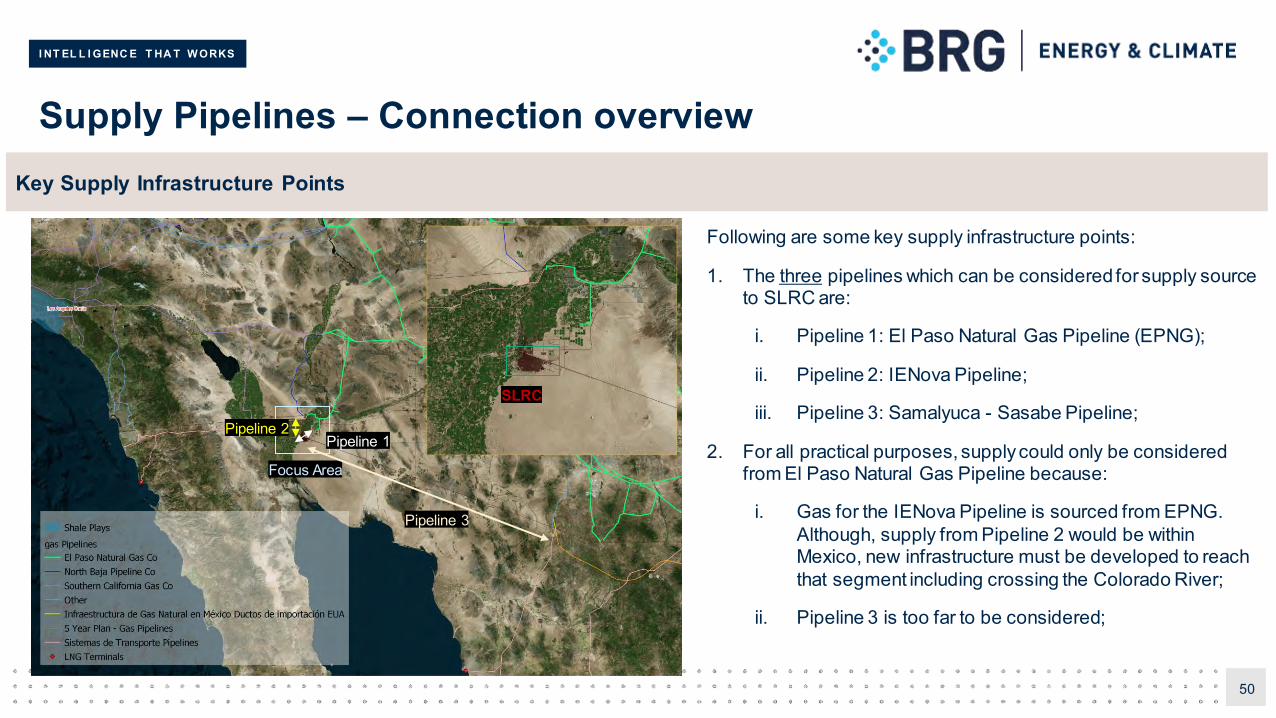
I NT EL L I GENC E T HA T W ORKS
50
Supply Pipelines – Connection overview
Following are some key supply infrastructure points:
1. The three pipelines which can be considered for supply source to SLRC are:
i. Pipeline 1: El Paso Natural Gas Pipeline (EPNG);
ii. Pipeline 2: IENova Pipeline;
iii. Pipeline 3: Samalyuca - Sasabe Pipeline;
2. For all practical purposes, supply could only be considered from El Paso Natural Gas Pipeline because:
i. Gas for the IENova Pipeline is sourced from EPNG. Although, supply from Pipeline 2 would be within Mexico, new infrastructure must be developed to reach that segment including crossing the Colorado River;
ii. Pipeline 3 is too far to be considered;
Focus Area
SLRC
Pipeline 3
Pipeline 2Pipeline 1
Key Supply Infrastructure Points
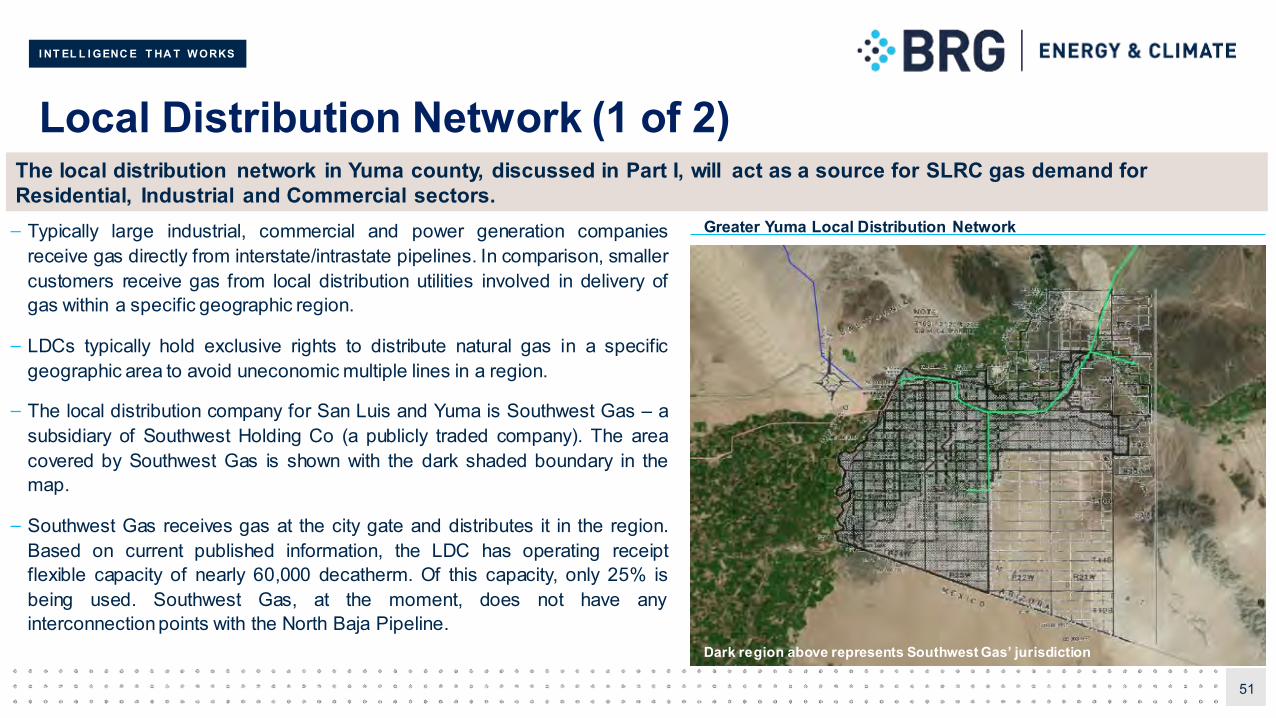
I NT EL L I GENC E T HA T W ORKS
Local Distribution Network (1 of 2)
– Typically large industrial, commercial and power generation companiesreceive gas directly from interstate/intrastate pipelines. In comparison, smallercustomers receive gas from local distribution utilities involved in delivery ofgas within a specific geographic region.
– LDCs typically hold exclusive rights to distribute natural gas in a specificgeographic area to avoid uneconomic multiple lines in a region.
– The local distribution company for San Luis and Yuma is Southwest Gas – asubsidiary of Southwest Holding Co (a publicly traded company). The areacovered by Southwest Gas is shown with the dark shaded boundary in themap.
– Southwest Gas receives gas at the city gate and distributes it in the region.Based on current published information, the LDC has operating receiptflexible capacity of nearly 60,000 decatherm. Of this capacity, only 25% isbeing used. Southwest Gas, at the moment, does not have anyinterconnection points with the North Baja Pipeline.
51
The local distribution network in Yuma county, discussed in Part I, will act as a source for SLRC gas demand for Residential, Industrial and Commercial sectors.
Greater Yuma Local Distribution Network
Dark region above represents Southwest Gas’ jurisdiction
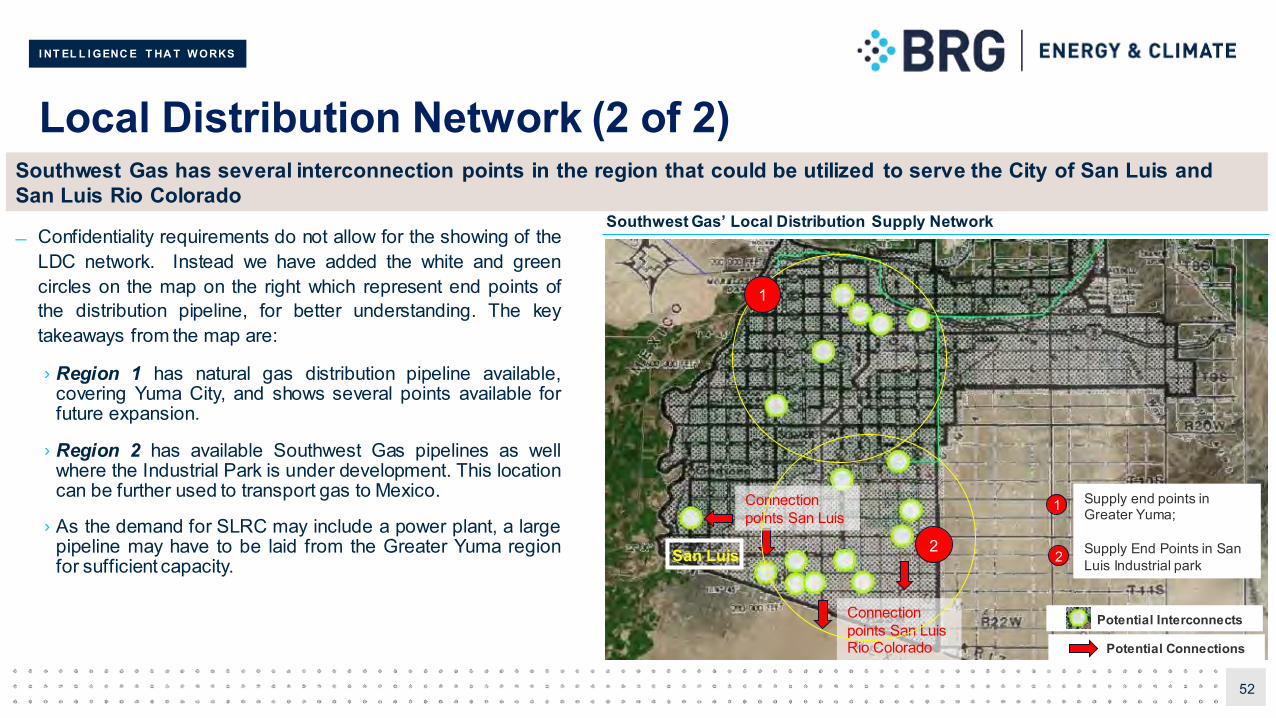
I NT EL L I GENC E T HA T W ORKS
Local Distribution Network (2 of 2)
Confidentiality requirements do not allow for the showing of theLDC network. Instead we have added the white and greencircles on the map on the right which represent end points ofthe distribution pipeline, for better understanding. The keytakeaways from the map are:
› Region 1 has natural gas distribution pipeline available,covering Yuma City, and shows several points available forfuture expansion.
› Region 2 has available Southwest Gas pipelines as wellwhere the Industrial Park is under development. This locationcan be further used to transport gas to Mexico.
› As the demand for SLRC may include a power plant, a largepipeline may have to be laid from the Greater Yuma regionfor sufficient capacity.
52
Southwest Gas has several interconnection points in the region that could be utilized to serve the City of San Luis and San Luis Rio Colorado
San Luis
Connection points San Luis
Potential Connections
Connection points San Luis Rio Colorado
1
2
Southwest Gas’ Local Distribution Supply Network
Potential Interconnects
1 Supply end points in Greater Yuma;
Supply End Points in San Luis Industrial park2
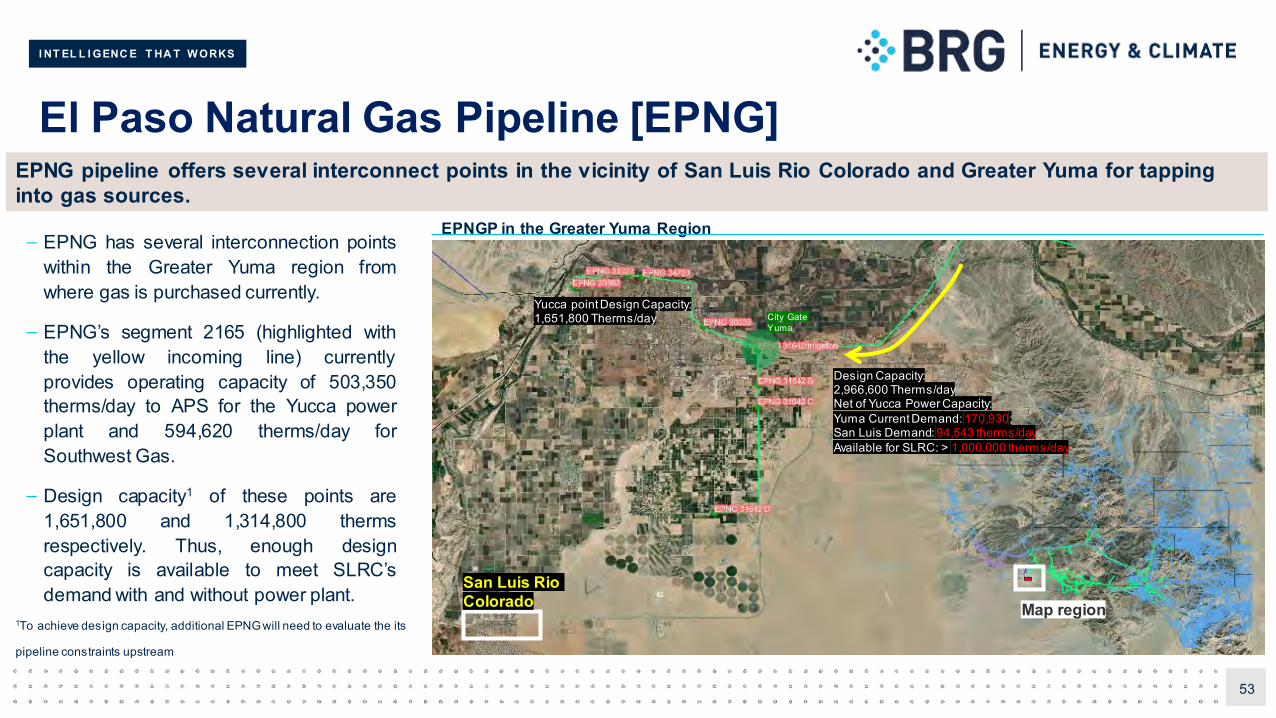
I NT EL L I GENC E T HA T W ORKS
El Paso Natural Gas Pipeline [EPNG]
53
EPNG pipeline offers several interconnect points in the vicinity of San Luis Rio Colorado and Greater Yuma for tapping into gas sources.
Map regionSan Luis Rio Colorado
City Gate Yuma
EPNGP in the Greater Yuma Region– EPNG has several interconnection points
within the Greater Yuma region fromwhere gas is purchased currently.
– EPNG’s segment 2165 (highlighted withthe yellow incoming line) currentlyprovides operating capacity of 503,350therms/day to APS for the Yucca powerplant and 594,620 therms/day forSouthwest Gas.
– Design capacity1 of these points are1,651,800 and 1,314,800 thermsrespectively. Thus, enough designcapacity is available to meet SLRC’sdemand with and without power plant.
Design Capacity:2,966,600 Therms/dayNet of Yucca Power Capacity:Yuma Current Demand: 170,930;San Luis Demand: 94,543 therms/dayAvailable for SLRC: > 1,000,000 therms/day
Yucca point Design Capacity:1,651,800 Therms/day
1To achieve design capacity, additional EPNG will need to evaluate the its
pipeline constraints upstream
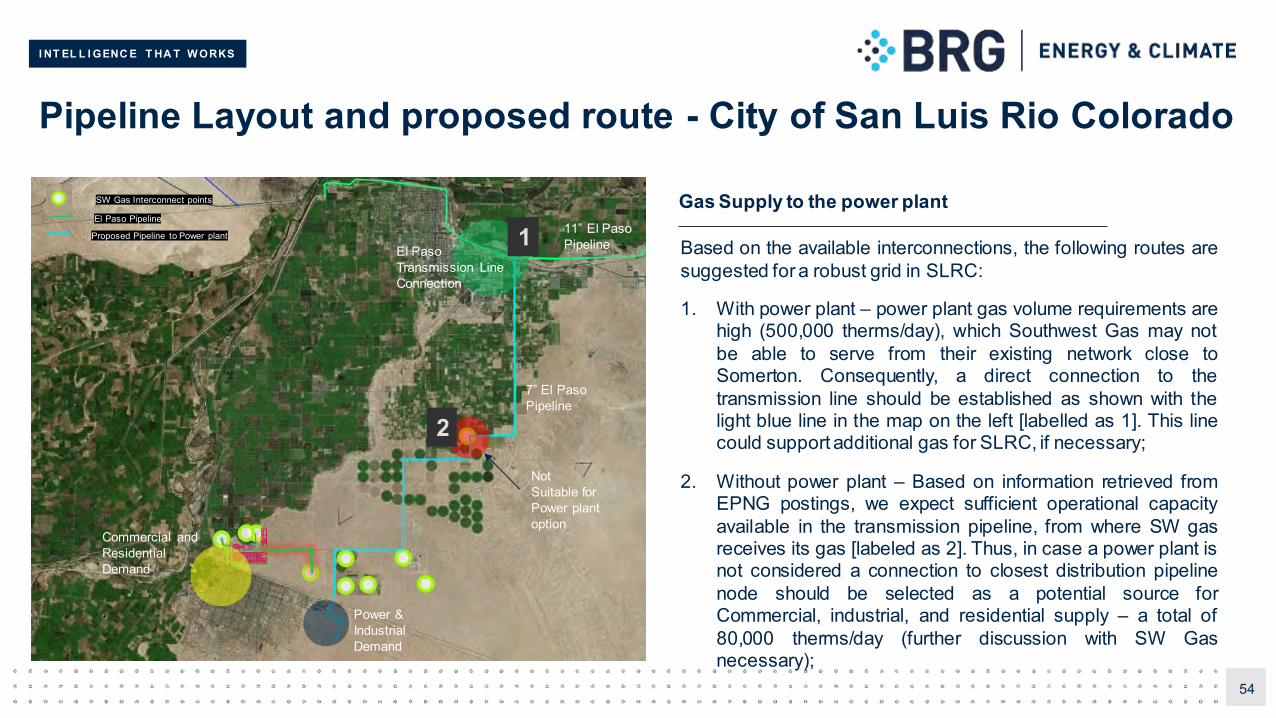
I NT EL L I GENC E T HA T W ORKS
54
Pipeline Layout and proposed route - City of San Luis Rio Colorado
Gas Supply to the power plant
Based on the available interconnections, the following routes aresuggested for a robust grid in SLRC:
1. With power plant – power plant gas volume requirements arehigh (500,000 therms/day), which Southwest Gas may notbe able to serve from their existing network close toSomerton. Consequently, a direct connection to thetransmission line should be established as shown with thelight blue line in the map on the left [labelled as 1]. This linecould support additional gas for SLRC, if necessary;
2. Without power plant – Based on information retrieved fromEPNG postings, we expect sufficient operational capacityavailable in the transmission pipeline, from where SW gasreceives its gas [labeled as 2]. Thus, in case a power plant isnot considered a connection to closest distribution pipelinenode should be selected as a potential source forCommercial, industrial, and residential supply – a total of80,000 therms/day (further discussion with SW Gasnecessary);
Commercial and Residential Demand
Power & Industrial Demand
El Paso Transmission Line Connection
7” El Paso Pipeline
11” El Paso Pipeline
Not Suitable for Power plant option
Proposed Pipeline to Power plant
El Paso Pipeline
SW Gas Interconnect points
1
2
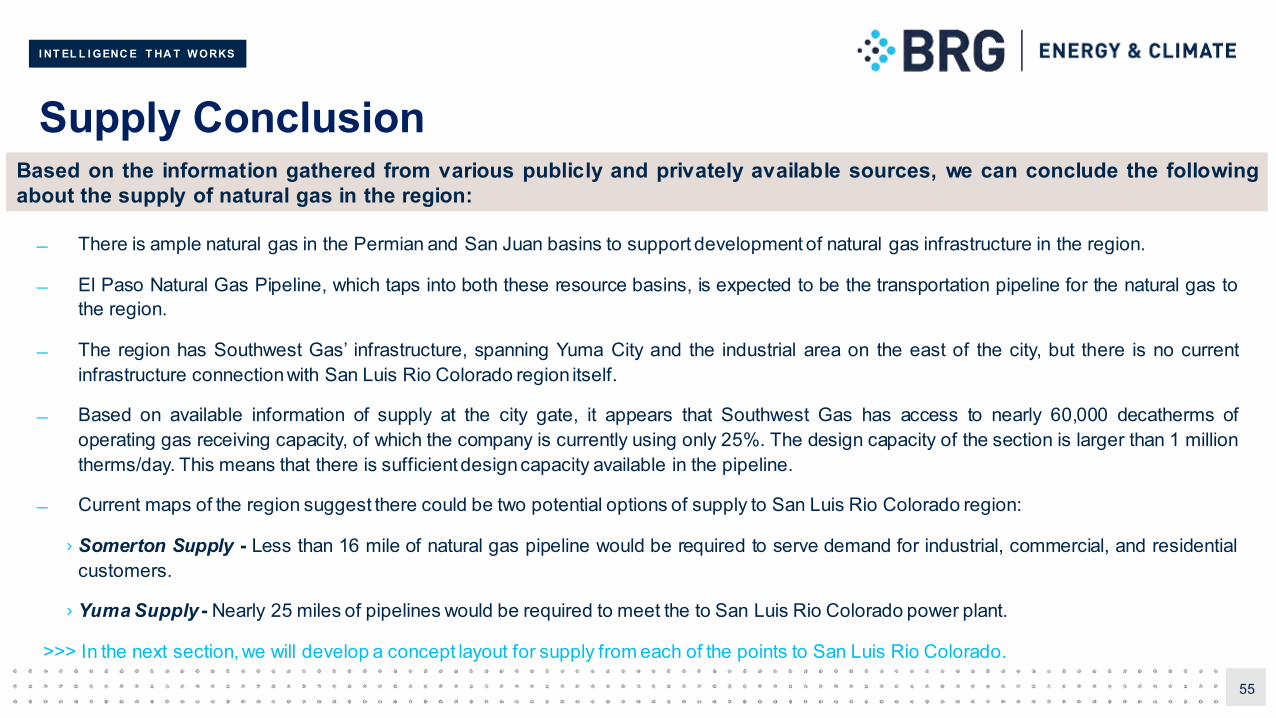
I NT EL L I GENC E T HA T W ORKS
Supply Conclusion
There is ample natural gas in the Permian and San Juan basins to support development of natural gas infrastructure in the region.
El Paso Natural Gas Pipeline, which taps into both these resource basins, is expected to be the transportation pipeline for the natural gas tothe region.
The region has Southwest Gas’ infrastructure, spanning Yuma City and the industrial area on the east of the city, but there is no currentinfrastructure connectionwith San Luis Rio Colorado region itself.
Based on available information of supply at the city gate, it appears that Southwest Gas has access to nearly 60,000 decatherms ofoperating gas receiving capacity, of which the company is currently using only 25%. The design capacity of the section is larger than 1 milliontherms/day. This means that there is sufficient designcapacity available in the pipeline.
Current maps of the region suggest there could be two potential options of supply to San Luis Rio Colorado region:
› Somerton Supply - Less than 16 mile of natural gas pipeline would be required to serve demand for industrial, commercial, and residentialcustomers.
› Yuma Supply - Nearly 25 miles of pipelines would be required to meet the to San Luis Rio Colorado power plant.
>>> In the next section, we will develop a concept layout for supply from each of the points to San Luis Rio Colorado.
55
Based on the information gathered from various publicly and privately available sources, we can conclude the followingabout the supply of natural gas in the region:
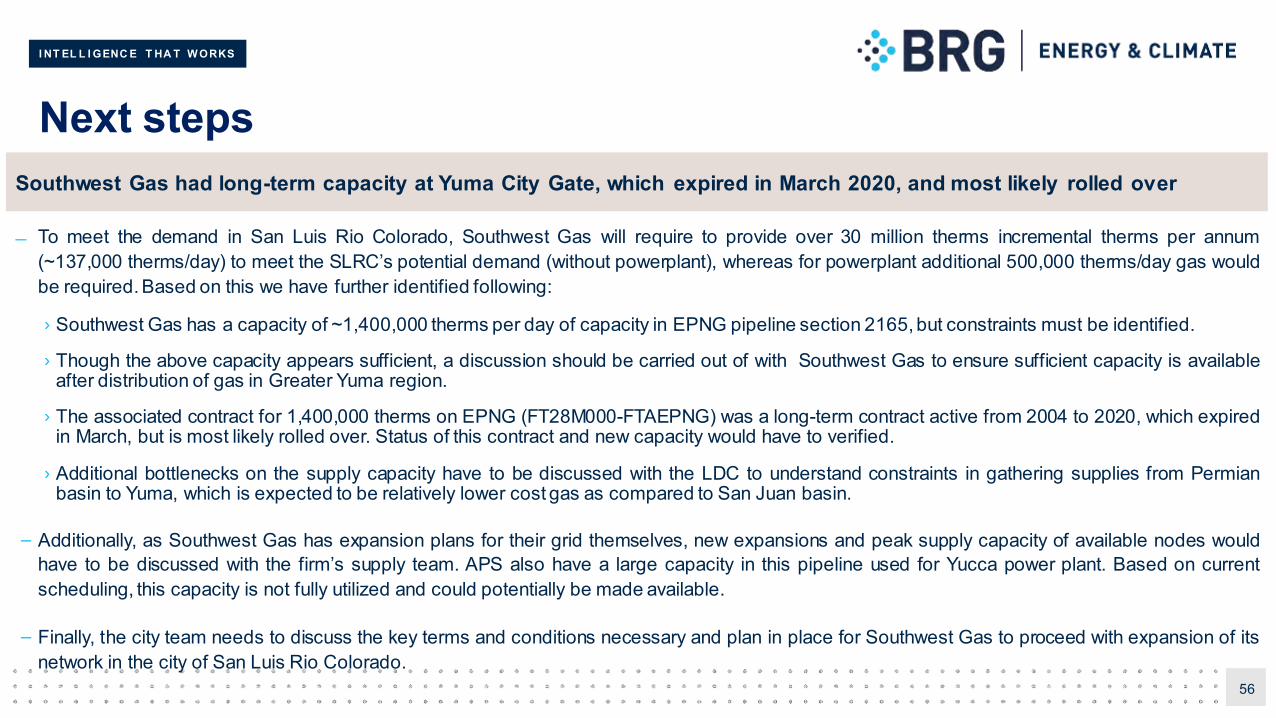
I NT EL L I GENC E T HA T W ORKS
Next steps
56
Southwest Gas had long-term capacity at Yuma City Gate, which expired in March 2020, and most likely rolled over
To meet the demand in San Luis Rio Colorado, Southwest Gas will require to provide over 30 million therms incremental therms per annum(~137,000 therms/day) to meet the SLRC’s potential demand (without powerplant), whereas for powerplant additional 500,000 therms/day gas wouldbe required. Based on this we have further identified following:
› Southwest Gas has a capacity of ~1,400,000 therms per day of capacity in EPNG pipeline section 2165, but constraints must be identified.
› Though the above capacity appears sufficient, a discussion should be carried out of with Southwest Gas to ensure sufficient capacity is availableafter distribution of gas in Greater Yuma region.
› The associated contract for 1,400,000 therms on EPNG (FT28M000-FTAEPNG) was a long-term contract active from 2004 to 2020, which expiredin March, but is most likely rolled over. Status of this contract and new capacity would have to verified.
› Additional bottlenecks on the supply capacity have to be discussed with the LDC to understand constraints in gathering supplies from Permianbasin to Yuma, which is expected to be relatively lower cost gas as compared to San Juan basin.
– Additionally, as Southwest Gas has expansion plans for their grid themselves, new expansions and peak supply capacity of available nodes wouldhave to be discussed with the firm’s supply team. APS also have a large capacity in this pipeline used for Yucca power plant. Based on currentscheduling, this capacity is not fully utilized and could potentially be made available.
– Finally, the city team needs to discuss the key terms and conditions necessary and plan in place for Southwest Gas to proceed with expansion of itsnetwork in the city of San Luis Rio Colorado.
I NT EL L I GENC E T HA T W ORKS
6 Routing and Conceptual Design
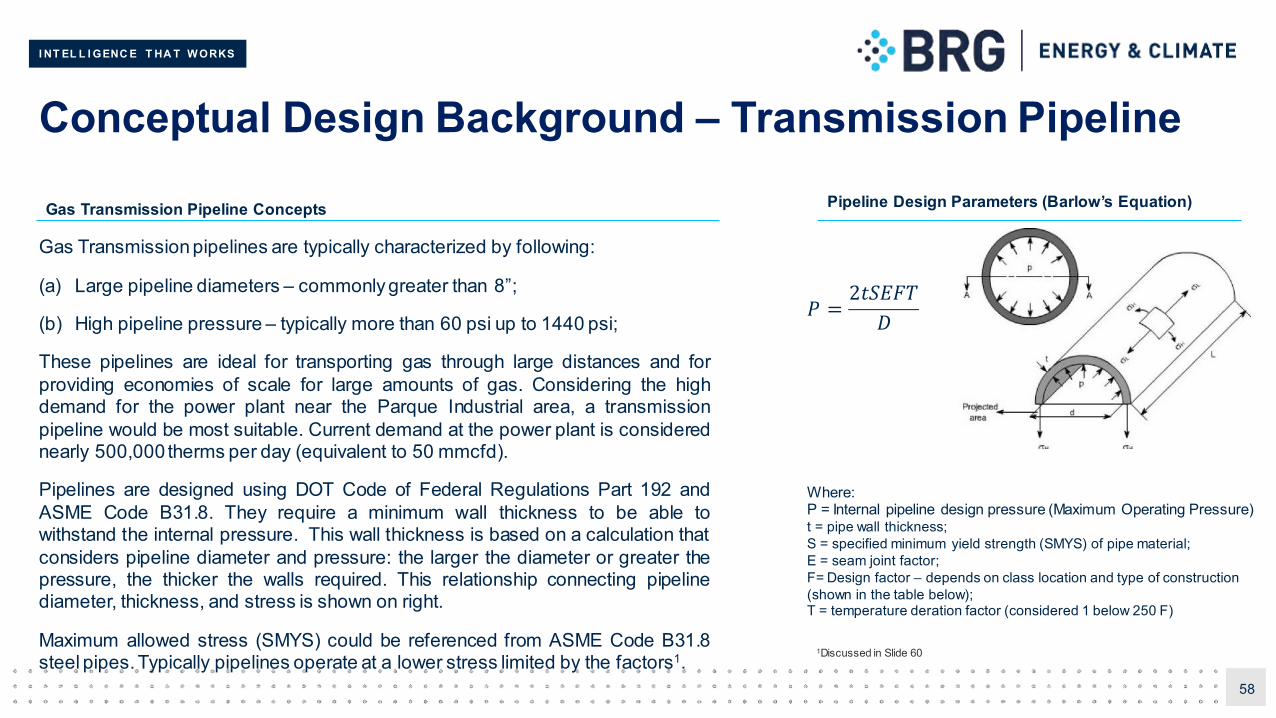
I NT EL L I GENC E T HA T W ORKS
Conceptual Design Background – Transmission Pipeline
58
Gas Transmission Pipeline Concepts
Gas Transmission pipelines are typically characterized by following:
(a) Large pipeline diameters – commonly greater than 8”;
(b) High pipeline pressure – typically more than 60 psi up to 1440 psi;
These pipelines are ideal for transporting gas through large distances and forproviding economies of scale for large amounts of gas. Considering the highdemand for the power plant near the Parque Industrial area, a transmissionpipeline would be most suitable. Current demand at the power plant is considerednearly 500,000 therms per day (equivalent to 50 mmcfd).
Pipelines are designed using DOT Code of Federal Regulations Part 192 andASME Code B31.8. They require a minimum wall thickness to be able towithstand the internal pressure. This wall thickness is based on a calculation thatconsiders pipeline diameter and pressure: the larger the diameter or greater thepressure, the thicker the walls required. This relationship connecting pipelinediameter, thickness, and stress is shown on right.
Maximum allowed stress (SMYS) could be referenced from ASME Code B31.8steel pipes. Typically pipelines operate at a lower stress limited by the factors1.
𝑃 =2𝑡𝑆𝐸𝐹𝑇
𝐷
Where:P = Internal pipeline design pressure (Maximum Operating Pressure)t = pipe wall thickness;S = specified minimum yield strength (SMYS) of pipe material;E = seam joint factor;F= Design factor – depends on class location and type of construction (shown in the table below);T = temperature deration factor (considered 1 below 250 F)
Pipeline Design Parameters (Barlow’s Equation)
1Discussed in Slide 60
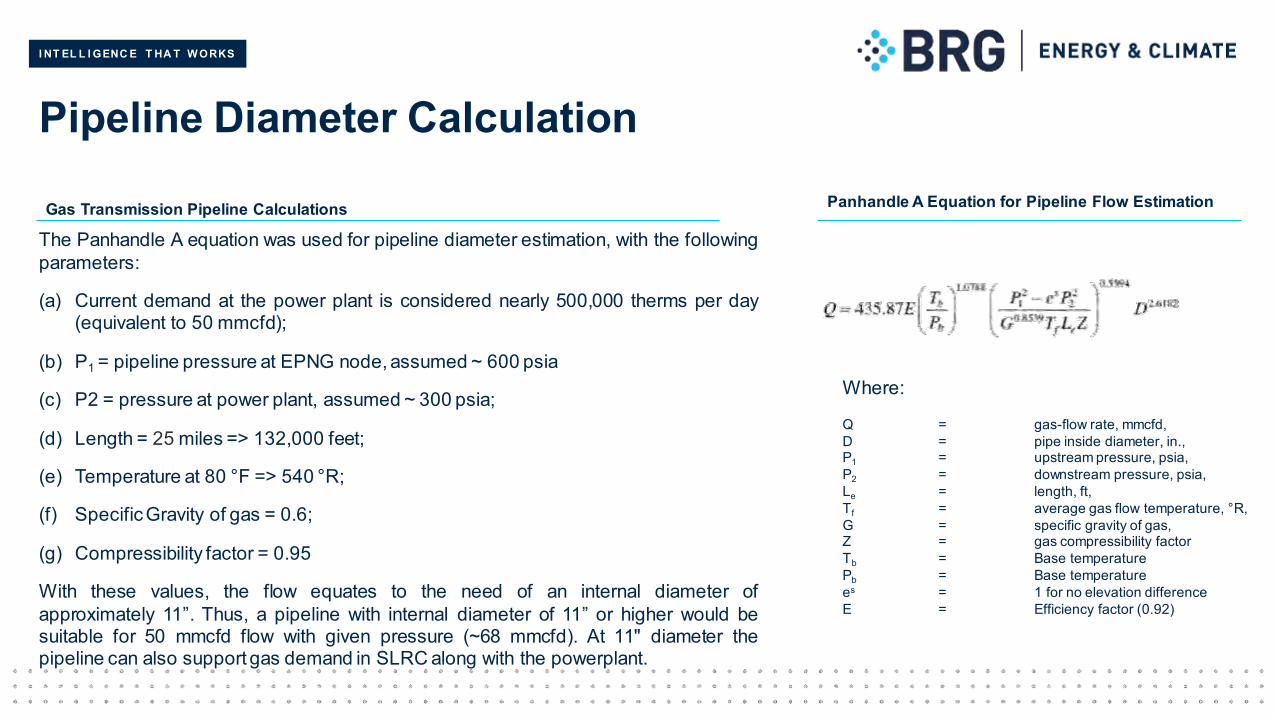
I NT EL L I GENC E T HA T W ORKS
Pipeline Diameter Calculation
Where:
Q = gas-flow rate, mmcfd,D = pipe inside diameter, in.,P1 = upstream pressure, psia,P2 = downstream pressure, psia,Le = length, ft,Tf = average gas flow temperature, °R,G = specific gravity of gas,Z = gas compressibility factorTb = Base temperaturePb = Base temperaturees = 1 for no elevation differenceE = Efficiency factor (0.92)
Gas Transmission Pipeline Calculations
The Panhandle A equation was used for pipeline diameter estimation, with the followingparameters:
(a) Current demand at the power plant is considered nearly 500,000 therms per day(equivalent to 50 mmcfd);
(b) P1 = pipeline pressure at EPNG node, assumed ~ 600 psia
(c) P2 = pressure at power plant, assumed ~ 300 psia;
(d) Length = 25 miles => 132,000 feet;
(e) Temperature at 80 °F => 540 °R;
(f) SpecificGravity of gas = 0.6;
(g) Compressibility factor = 0.95
With these values, the flow equates to the need of an internal diameter ofapproximately 11”. Thus, a pipeline with internal diameter of 11” or higher would besuitable for 50 mmcfd flow with given pressure (~68 mmcfd). At 11" diameter thepipeline can also support gas demand in SLRC along with the powerplant.
Panhandle A Equation for Pipeline Flow Estimation
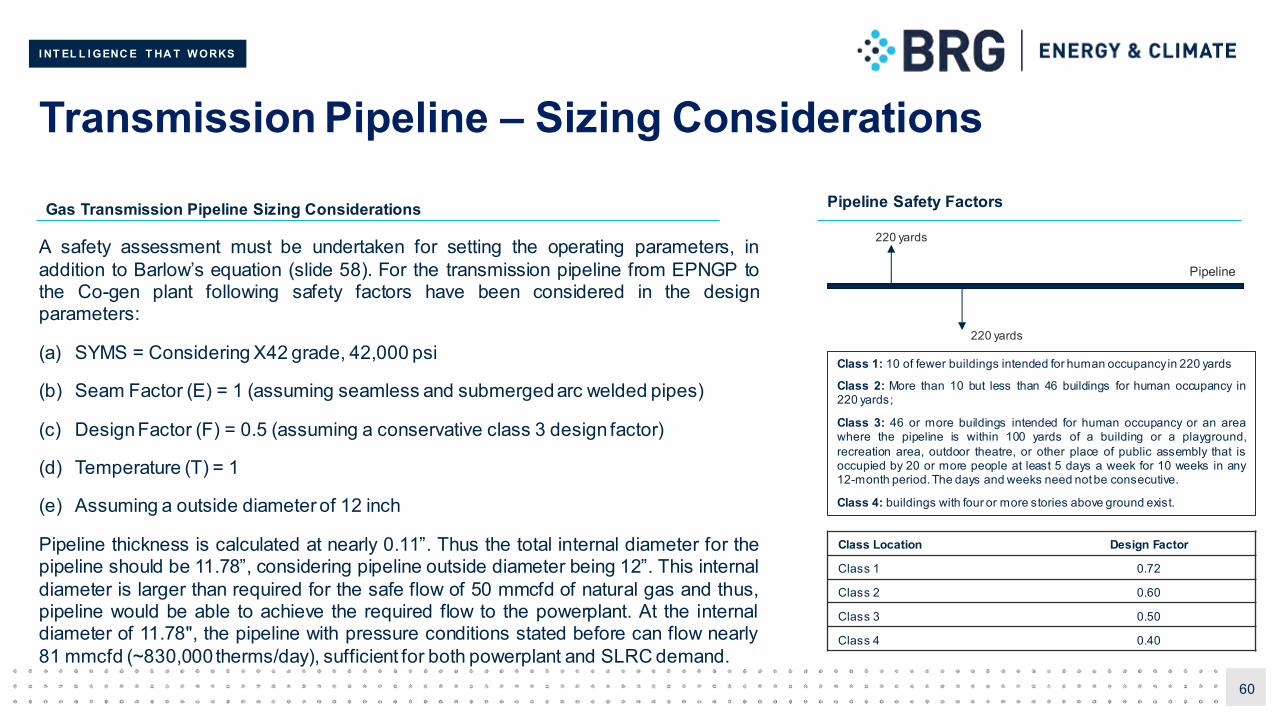
I NT EL L I GENC E T HA T W ORKS
Transmission Pipeline – Sizing Considerations
60
Gas Transmission Pipeline Sizing Considerations
A safety assessment must be undertaken for setting the operating parameters, inaddition to Barlow’s equation (slide 58). For the transmission pipeline from EPNGP tothe Co-gen plant following safety factors have been considered in the designparameters:
(a) SYMS = Considering X42 grade, 42,000 psi
(b) Seam Factor (E) = 1 (assuming seamless and submergedarc welded pipes)
(c) DesignFactor (F) = 0.5 (assuming a conservative class 3 design factor)
(d) Temperature (T) = 1
(e) Assuming a outside diameter of 12 inch
Pipeline thickness is calculated at nearly 0.11”. Thus the total internal diameter for thepipeline should be 11.78”, considering pipeline outside diameter being 12”. This internaldiameter is larger than required for the safe flow of 50 mmcfd of natural gas and thus,pipeline would be able to achieve the required flow to the powerplant. At the internaldiameter of 11.78", the pipeline with pressure conditions stated before can flow nearly81 mmcfd (~830,000 therms/day), sufficient for both powerplant and SLRC demand.
Class Location Design Factor
Class 1 0.72
Class 2 0.60
Class 3 0.50
Class 4 0.40
Pipeline Safety Factors
Class 1: 10 of fewer buildings intended for human occupancyin 220 yards
Class 2: More than 10 but less than 46 buildings for human occupancy in220 yards;
Class 3: 46 or more buildings intended for human occupancy or an areawhere the pipeline is within 100 yards of a building or a playground,recreation area, outdoor theatre, or other place of public assembly that isoccupied by 20 or more people at least 5 days a week for 10 weeks in any12-month period.The days and weeks need notbe consecutive.
Class 4: buildings with four or more stories above ground exist.
220 yards
220 yards
Pipeline
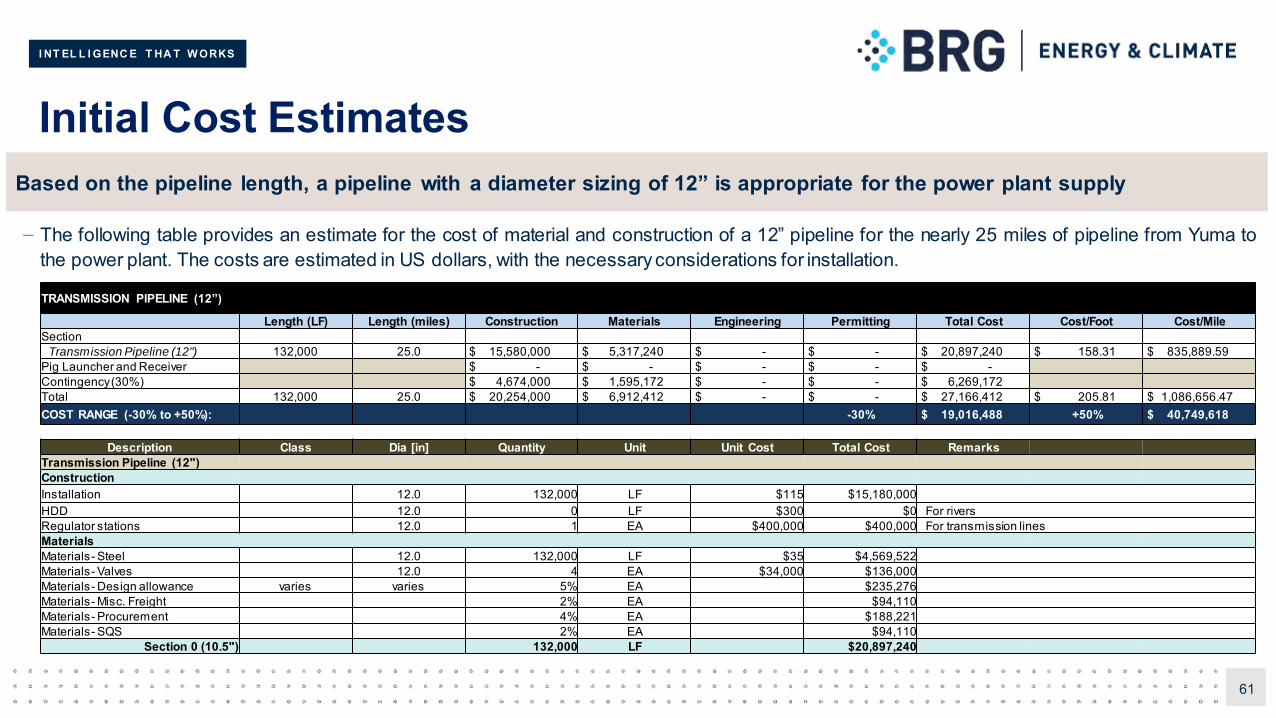
I NT EL L I GENC E T HA T W ORKS
Initial Cost Estimates
– The following table provides an estimate for the cost of material and construction of a 12” pipeline for the nearly 25 miles of pipeline from Yuma tothe power plant. The costs are estimated in US dollars, with the necessary considerations for installation.
61
Based on the pipeline length, a pipeline with a diameter sizing of 12” is appropriate for the power plant supply
TRANSMISSION PIPELINE (12”)
Length (LF) Length (miles) Construction Materials Engineering Permitting Total Cost Cost/Foot Cost/MileSection
Transmission Pipeline (12") 132,000 25.0 $ 15,580,000 $ 5,317,240 $ - $ - $ 20,897,240 $ 158.31 $ 835,889.59Pig Launcher and Receiver $ - $ - $ - $ - $ -Contingency (30%) $ 4,674,000 $ 1,595,172 $ - $ - $ 6,269,172Total 132,000 25.0 $ 20,254,000 $ 6,912,412 $ - $ - $ 27,166,412 $ 205.81 $ 1,086,656.47COST RANGE (-30% to +50%): -30% $ 19,016,488 +50% $ 40,749,618
Description Class Dia [in] Quantity Unit Unit Cost Total Cost RemarksTransmission Pipeline (12")ConstructionInstallation 12.0 132,000 LF $115 $15,180,000HDD 12.0 0 LF $300 $0 For riversRegulator stations 12.0 1 EA $400,000 $400,000 For transmission linesMaterialsMaterials- Steel 12.0 132,000 LF $35 $4,569,522Materials- Valves 12.0 4 EA $34,000 $136,000Materials- Design allowance varies varies 5% EA $235,276Materials- Misc. Freight 2% EA $94,110Materials- Procurement 4% EA $188,221Materials- SQS 2% EA $94,110
Section 0 (10.5") 132,000 LF $20,897,240
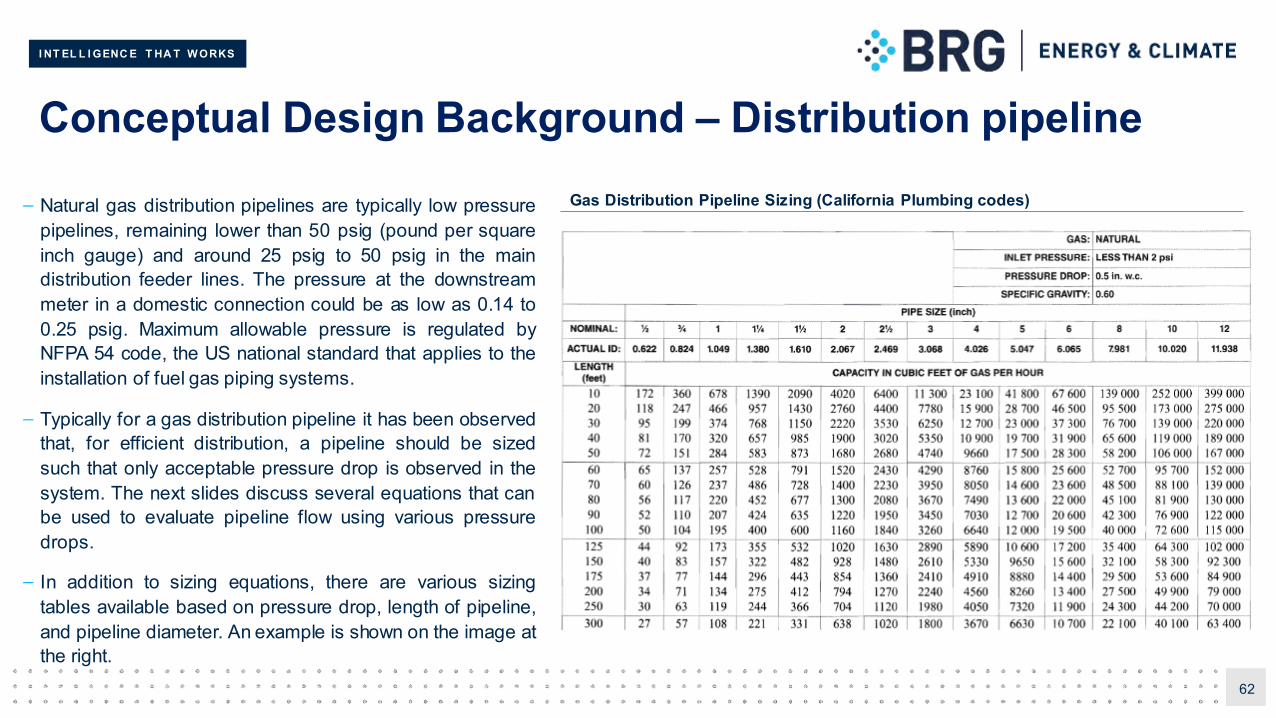
I NT EL L I GENC E T HA T W ORKS
Conceptual Design Background – Distribution pipeline
62
– Natural gas distribution pipelines are typically low pressurepipelines, remaining lower than 50 psig (pound per squareinch gauge) and around 25 psig to 50 psig in the maindistribution feeder lines. The pressure at the downstreammeter in a domestic connection could be as low as 0.14 to0.25 psig. Maximum allowable pressure is regulated byNFPA 54 code, the US national standard that applies to theinstallation of fuel gas piping systems.
– Typically for a gas distribution pipeline it has been observedthat, for efficient distribution, a pipeline should be sizedsuch that only acceptable pressure drop is observed in thesystem. The next slides discuss several equations that canbe used to evaluate pipeline flow using various pressuredrops.
– In addition to sizing equations, there are various sizingtables available based on pressure drop, length of pipeline,and pipeline diameter. An example is shown on the image atthe right.
Gas Distribution Pipeline Sizing (California Plumbing codes)
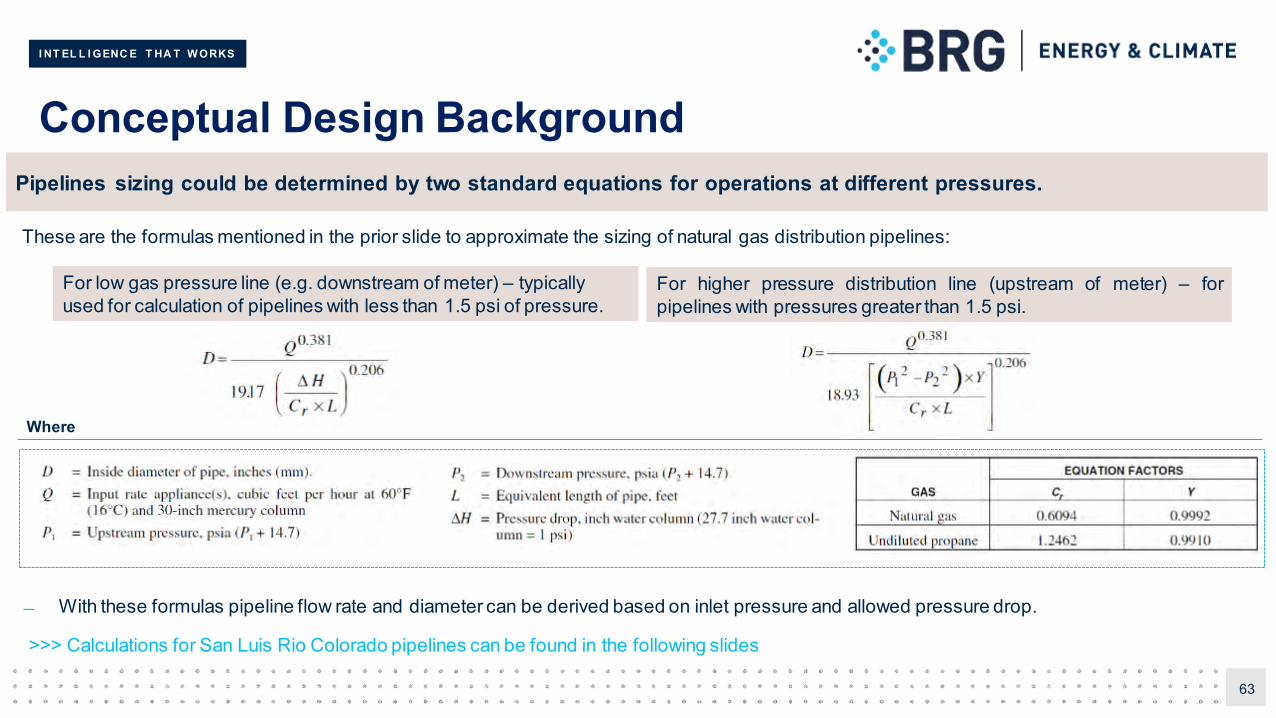
I NT EL L I GENC E T HA T W ORKS
Conceptual Design Background
These are the formulas mentioned in the prior slide to approximate the sizing of natural gas distribution pipelines:
63
With these formulas pipeline flow rate and diameter can be derived based on inlet pressure and allowed pressure drop.
>>> Calculations for San Luis Rio Colorado pipelines can be found in the following slides
Pipelines sizing could be determined by two standard equations for operations at different pressures.
For low gas pressure line (e.g. downstream of meter) – typically used for calculation of pipelines with less than 1.5 psi of pressure.
For higher pressure distribution line (upstream of meter) – forpipelines with pressures greater than 1.5 psi.
Where
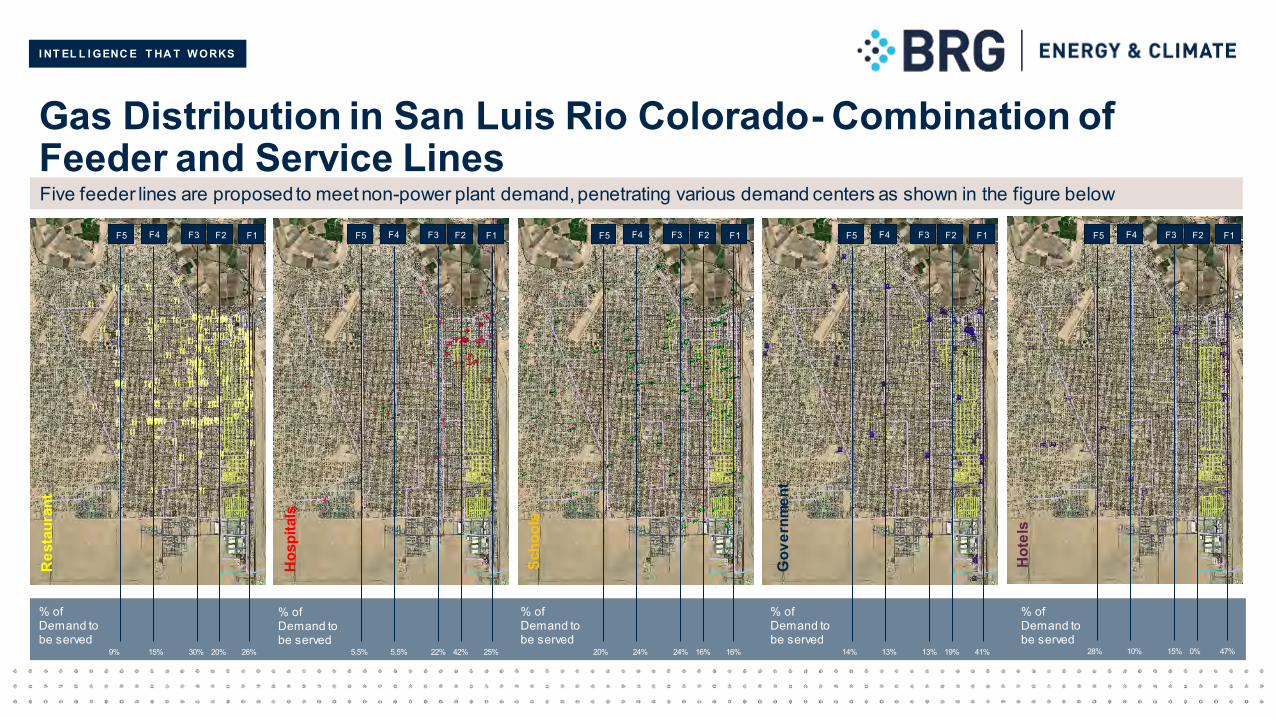
I NT EL L I GENC E T HA T W ORKS
Gas Distribution in San Luis Rio Colorado- Combination of Feeder and Service Lines
26%20%30%15%9% 25%42%22%5.5%5.5% 16%16%24%24%20% 41%19%13%13%14% 47%0%15%10%28%
F1F2F3F4F5 F1F2F3F4F5 F1F2F3F4F5 F1F2F3F4F5 F1F2F3F4F5
Res
taur
ant
Hos
pita
ls
Scho
ols
Gov
ernm
ent
Hot
els
% of Demand to be served
% of Demand to be served
% of Demand to be served
% of Demand to be served
% of Demand to be served
Five feeder lines are proposed to meet non-power plant demand, penetrating various demand centers as shown in the figure below
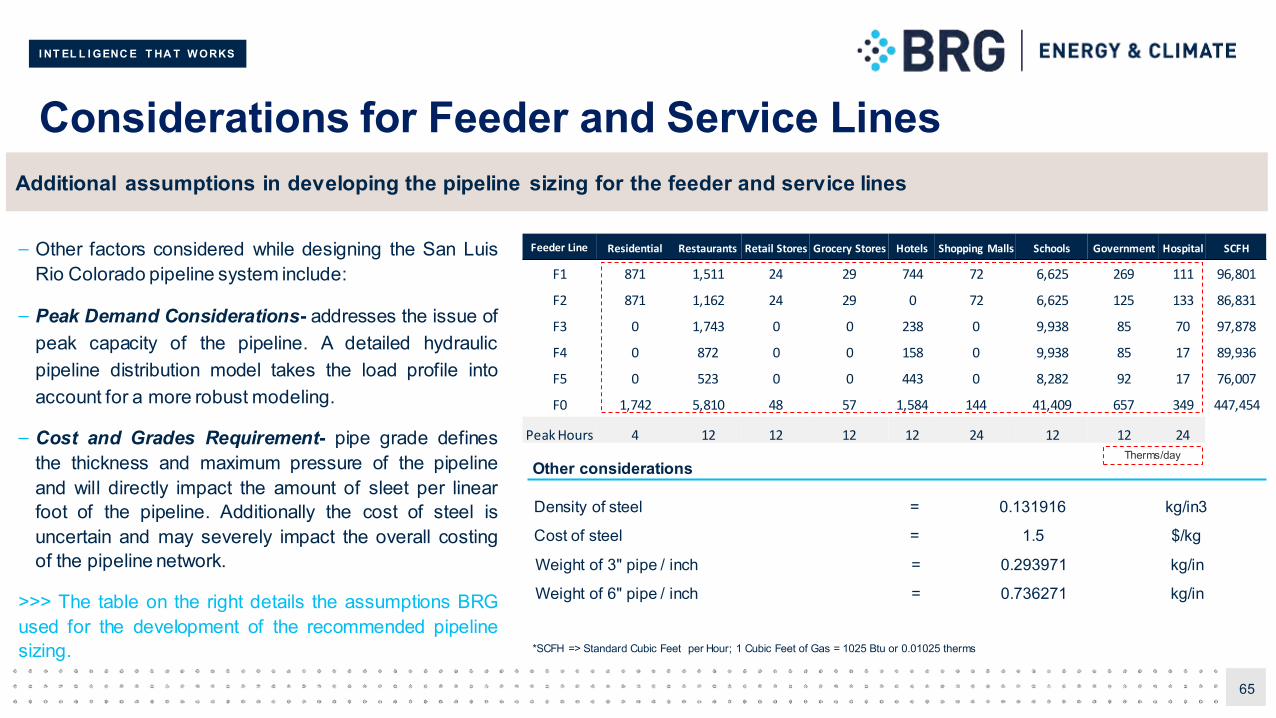
I NT EL L I GENC E T HA T W ORKS
Considerations for Feeder and Service Lines
– Other factors considered while designing the San LuisRio Colorado pipeline system include:
– Peak Demand Considerations- addresses the issue ofpeak capacity of the pipeline. A detailed hydraulicpipeline distribution model takes the load profile intoaccount for a more robust modeling.
– Cost and Grades Requirement- pipe grade definesthe thickness and maximum pressure of the pipelineand will directly impact the amount of sleet per linearfoot of the pipeline. Additionally the cost of steel isuncertain and may severely impact the overall costingof the pipeline network.
>>> The table on the right details the assumptions BRGused for the development of the recommended pipelinesizing.
65
Additional assumptions in developing the pipeline sizing for the feeder and service lines
Density of steel = 0.131916 kg/in3
Cost of steel = 1.5 $/kg
Weight of 3" pipe / inch = 0.293971 kg/in
Weight of 6" pipe / inch = 0.736271 kg/in
Other considerations
*SCFH => Standard Cubic Feet per Hour; 1 Cubic Feet of Gas = 1025 Btu or 0.01025 therms
Feeder Line Residential Restaurants Retail Stores Grocery Stores Hotels Shopping Malls Schools Government Hospital SCFH
F1 871 1,511 24 29 744 72 6,625 269 111 96,801
F2 871 1,162 24 29 0 72 6,625 125 133 86,831
F3 0 1,743 0 0 238 0 9,938 85 70 97,878
F4 0 872 0 0 158 0 9,938 85 17 89,936
F5 0 523 0 0 443 0 8,282 92 17 76,007
F0 1,742 5,810 48 57 1,584 144 41,409 657 349 447,454
Peak Hours 4 12 12 12 12 24 12 12 24
Therms/day
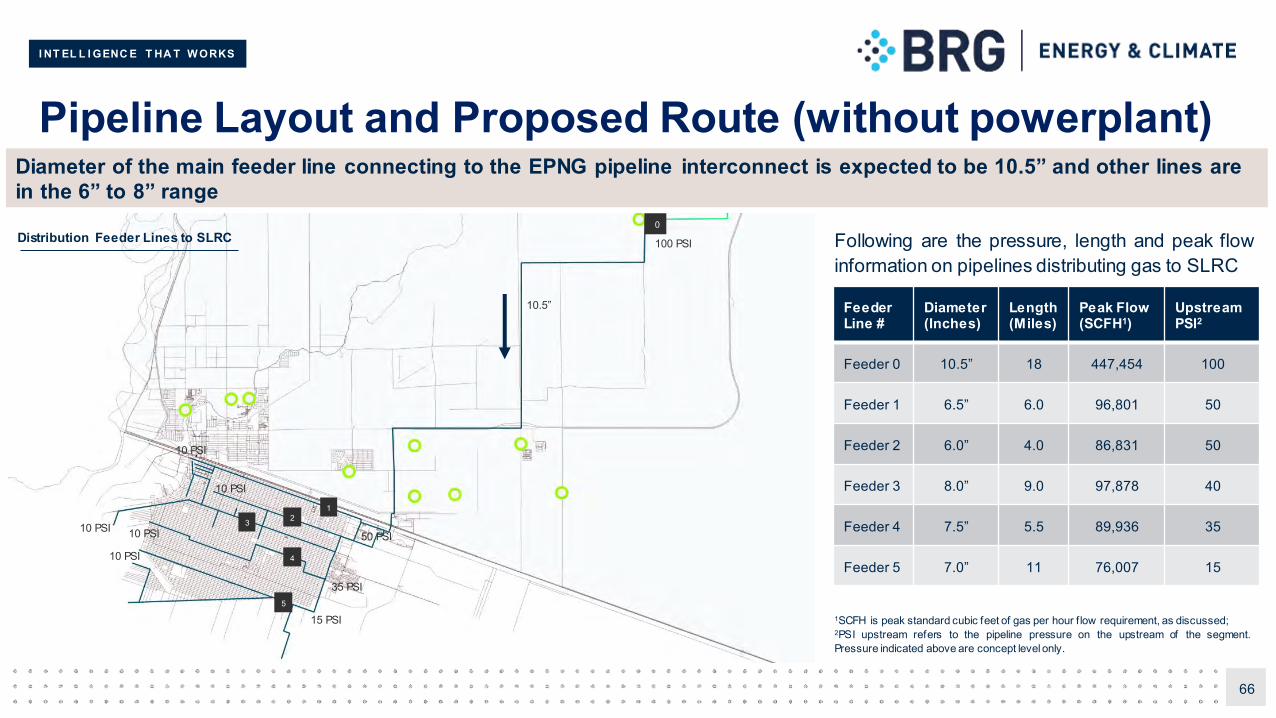
I NT EL L I GENC E T HA T W ORKS
Pipeline Layout and Proposed Route (without powerplant)
66
Diameter of the main feeder line connecting to the EPNG pipeline interconnect is expected to be 10.5” and other lines are in the 6” to 8” range
0
123
5
10 PSI
10 PSI
10 PSI 10 PSI
10 PSI 4
100 PSI
50 PSI
15 PSI
35 PSI
Following are the pressure, length and peak flowinformation on pipelines distributing gas to SLRC
10.5” Feeder Line #
Diameter(Inches)
Length(Miles)
Peak Flow (SCFH1)
Upstream PSI2
Feeder 0 10.5” 18 447,454 100
Feeder 1 6.5” 6.0 96,801 50
Feeder 2 6.0” 4.0 86,831 50
Feeder 3 8.0” 9.0 97,878 40
Feeder 4 7.5” 5.5 89,936 35
Feeder 5 7.0” 11 76,007 15
1SCFH is peak standard cubic feet of gas per hour f low requirement, as discussed;2PSI upstream refers to the pipeline pressure on the upstream of the segment.Pressure indicated above are concept level only.
Distribution Feeder Lines to SLRC
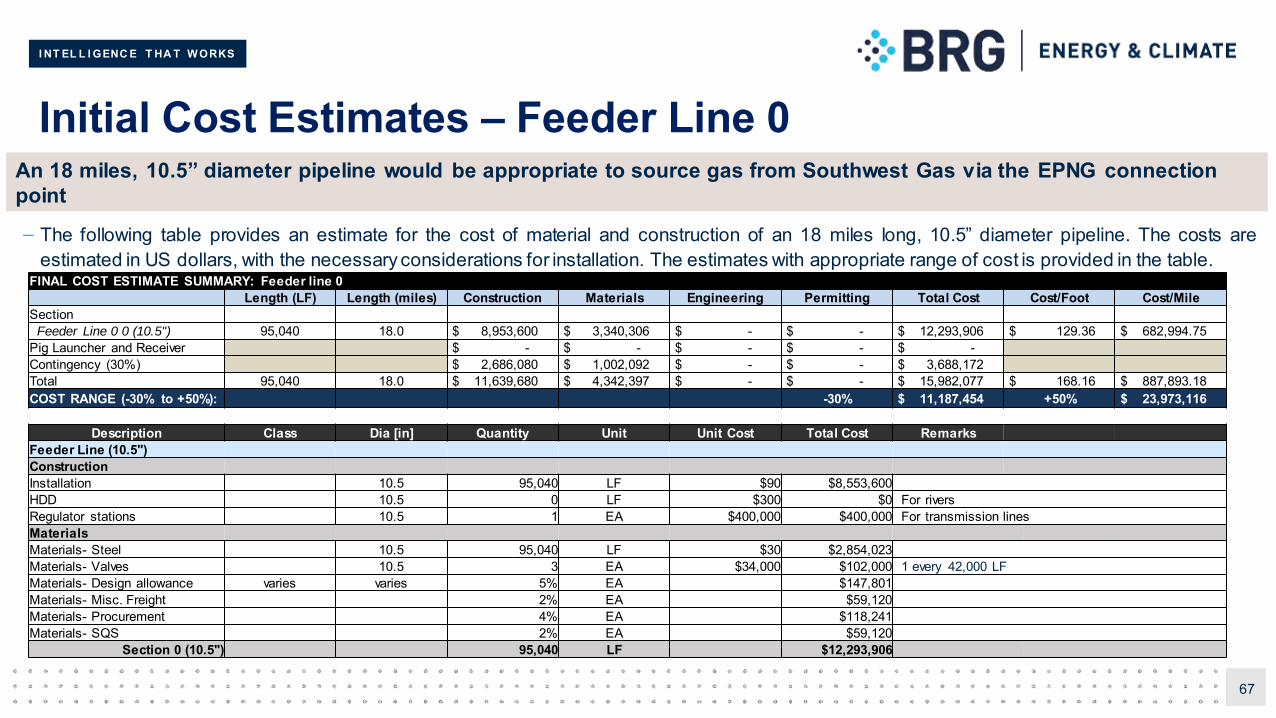
I NT EL L I GENC E T HA T W ORKS
Initial Cost Estimates – Feeder Line 0
– The following table provides an estimate for the cost of material and construction of an 18 miles long, 10.5” diameter pipeline. The costs areestimated in US dollars, with the necessary considerations for installation. The estimates with appropriate range of cost is provided in the table.
67
An 18 miles, 10.5” diameter pipeline would be appropriate to source gas from Southwest Gas via the EPNG connection point
FINAL COST ESTIMATE SUMMARY: Feeder line 0Length (LF) Length (miles) Construction Materials Engineering Permitting Total Cost Cost/Foot Cost/Mile
SectionFeeder Line 0 0 (10.5") 95,040 18.0 $ 8,953,600 $ 3,340,306 $ - $ - $ 12,293,906 $ 129.36 $ 682,994.75
Pig Launcher and Receiver $ - $ - $ - $ - $ -Contingency (30%) $ 2,686,080 $ 1,002,092 $ - $ - $ 3,688,172 Total 95,040 18.0 $ 11,639,680 $ 4,342,397 $ - $ - $ 15,982,077 $ 168.16 $ 887,893.18 COST RANGE (-30% to +50%): -30% $ 11,187,454 +50% $ 23,973,116
Description Class Dia [in] Quantity Unit Unit Cost Total Cost RemarksFeeder Line (10.5")ConstructionInstallation 10.5 95,040 LF $90 $8,553,600HDD 10.5 0 LF $300 $0 For riversRegulator stations 10.5 1 EA $400,000 $400,000 For transmission linesMaterialsMaterials- Steel 10.5 95,040 LF $30 $2,854,023Materials- Valves 10.5 3 EA $34,000 $102,000 1 every 42,000 LFMaterials- Design allowance varies varies 5% EA $147,801Materials- Misc. Freight 2% EA $59,120Materials- Procurement 4% EA $118,241Materials- SQS 2% EA $59,120
Section 0 (10.5") 95,040 LF $12,293,906
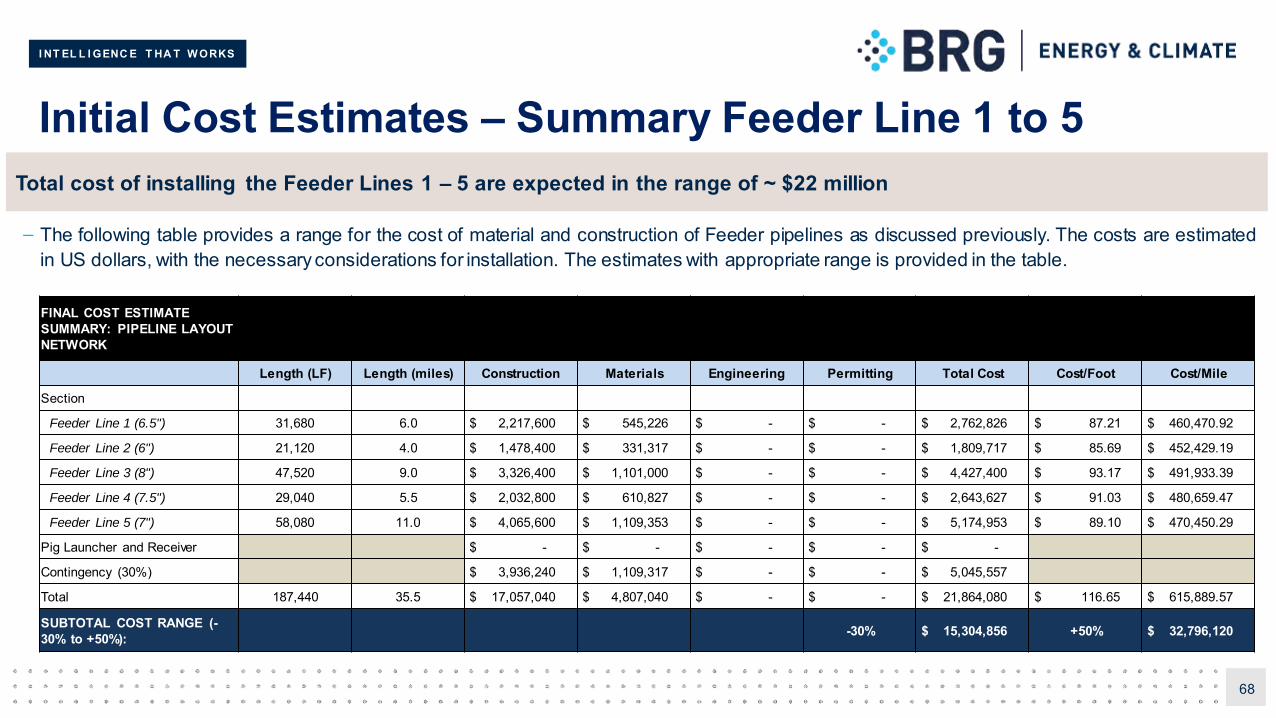
I NT EL L I GENC E T HA T W ORKS
Initial Cost Estimates – Summary Feeder Line 1 to 5
– The following table provides a range for the cost of material and construction of Feeder pipelines as discussed previously. The costs are estimatedin US dollars, with the necessary considerations for installation. The estimates with appropriate range is provided in the table.
68
Total cost of installing the Feeder Lines 1 – 5 are expected in the range of ~ $22 million
FINAL COST ESTIMATE SUMMARY: PIPELINE LAYOUT NETWORK
Length (LF) Length (miles) Construction Materials Engineering Permitting Total Cost Cost/Foot Cost/Mile
Section
Feeder Line 1 (6.5") 31,680 6.0 $ 2,217,600 $ 545,226 $ - $ - $ 2,762,826 $ 87.21 $ 460,470.92
Feeder Line 2 (6") 21,120 4.0 $ 1,478,400 $ 331,317 $ - $ - $ 1,809,717 $ 85.69 $ 452,429.19
Feeder Line 3 (8") 47,520 9.0 $ 3,326,400 $ 1,101,000 $ - $ - $ 4,427,400 $ 93.17 $ 491,933.39
Feeder Line 4 (7.5") 29,040 5.5 $ 2,032,800 $ 610,827 $ - $ - $ 2,643,627 $ 91.03 $ 480,659.47
Feeder Line 5 (7") 58,080 11.0 $ 4,065,600 $ 1,109,353 $ - $ - $ 5,174,953 $ 89.10 $ 470,450.29
Pig Launcher and Receiver $ - $ - $ - $ - $ -
Contingency (30%) $ 3,936,240 $ 1,109,317 $ - $ - $ 5,045,557
Total 187,440 35.5 $ 17,057,040 $ 4,807,040 $ - $ - $ 21,864,080 $ 116.65 $ 615,889.57
SUBTOTAL COST RANGE (-30% to +50%): -30% $ 15,304,856 +50% $ 32,796,120
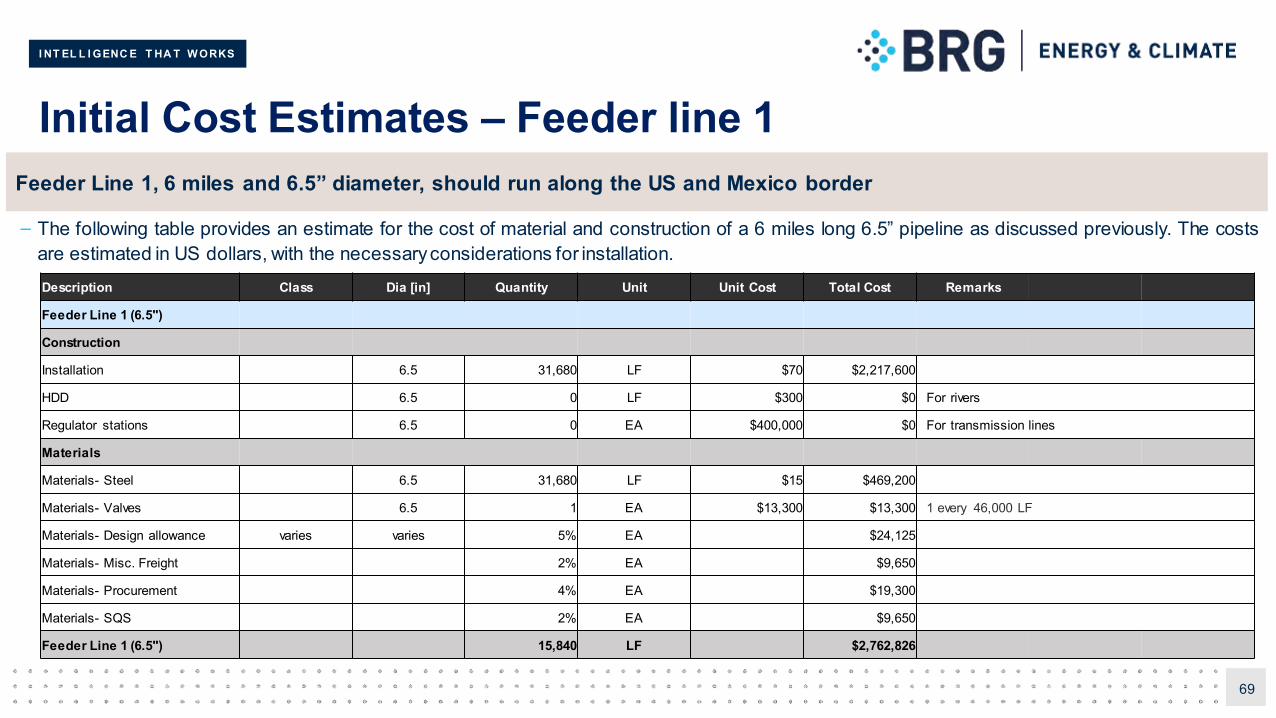
I NT EL L I GENC E T HA T W ORKS
Initial Cost Estimates – Feeder line 1
– The following table provides an estimate for the cost of material and construction of a 6 miles long 6.5” pipeline as discussed previously. The costsare estimated in US dollars, with the necessaryconsiderations for installation.
69
Feeder Line 1, 6 miles and 6.5” diameter, should run along the US and Mexico border
Description Class Dia [in] Quantity Unit Unit Cost Total Cost Remarks
Feeder Line 1 (6.5")
Construction
Installation 6.5 31,680 LF $70 $2,217,600
HDD 6.5 0 LF $300 $0 For rivers
Regulator stations 6.5 0 EA $400,000 $0 For transmission lines
Materials
Materials- Steel 6.5 31,680 LF $15 $469,200
Materials- Valves 6.5 1 EA $13,300 $13,300 1 every 46,000 LF
Materials- Design allowance varies varies 5% EA $24,125
Materials- Misc. Freight 2% EA $9,650
Materials- Procurement 4% EA $19,300
Materials- SQS 2% EA $9,650
Feeder Line 1 (6.5") 15,840 LF $2,762,826
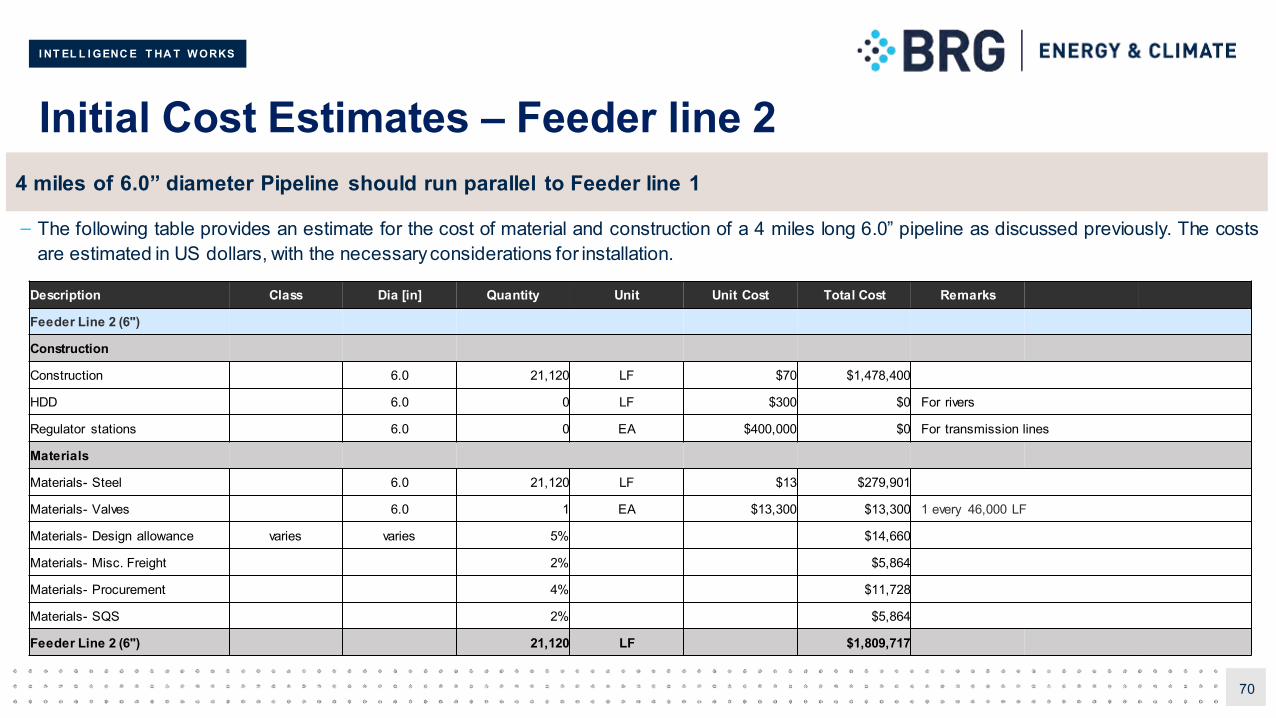
I NT EL L I GENC E T HA T W ORKS
Initial Cost Estimates – Feeder line 2
– The following table provides an estimate for the cost of material and construction of a 4 miles long 6.0” pipeline as discussed previously. The costsare estimated in US dollars, with the necessaryconsiderations for installation.
70
4 miles of 6.0” diameter Pipeline should run parallel to Feeder line 1
Description Class Dia [in] Quantity Unit Unit Cost Total Cost Remarks
Feeder Line 2 (6")
Construction
Construction 6.0 21,120 LF $70 $1,478,400
HDD 6.0 0 LF $300 $0 For rivers
Regulator stations 6.0 0 EA $400,000 $0 For transmission lines
Materials
Materials- Steel 6.0 21,120 LF $13 $279,901
Materials- Valves 6.0 1 EA $13,300 $13,300 1 every 46,000 LF
Materials- Design allowance varies varies 5% $14,660
Materials- Misc. Freight 2% $5,864
Materials- Procurement 4% $11,728
Materials- SQS 2% $5,864
Feeder Line 2 (6") 21,120 LF $1,809,717
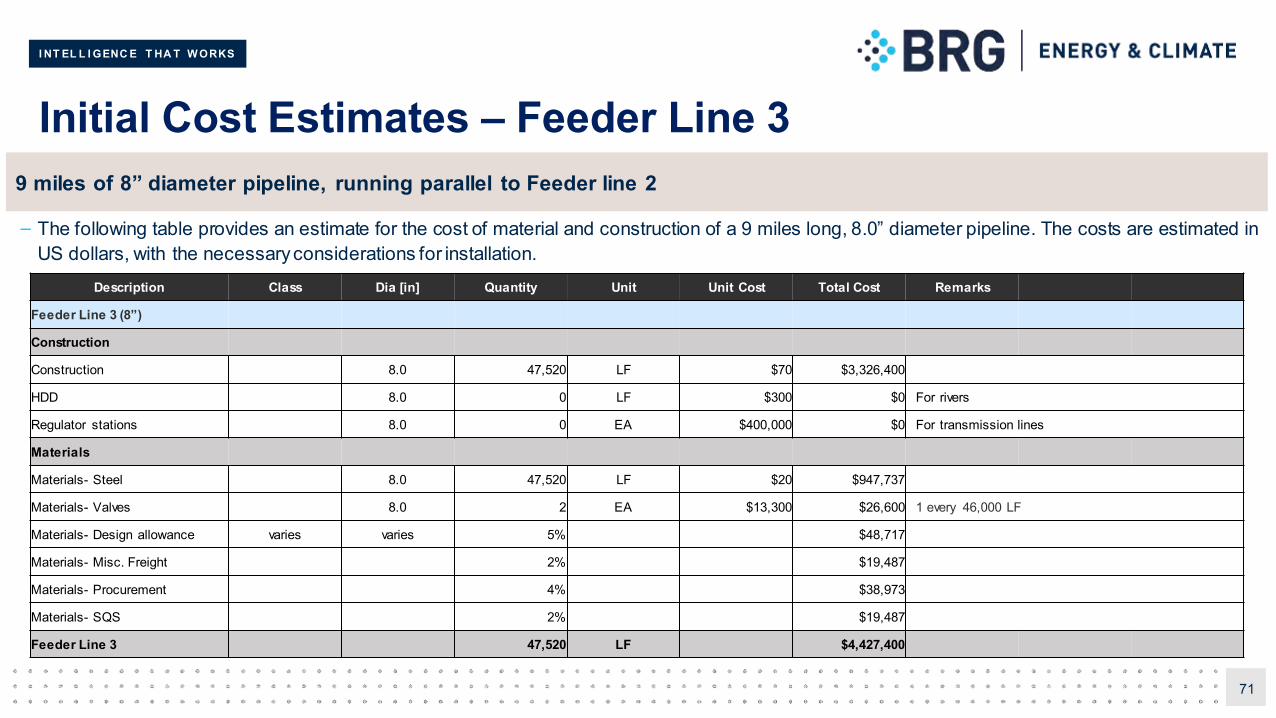
I NT EL L I GENC E T HA T W ORKS
Initial Cost Estimates – Feeder Line 3
– The following table provides an estimate for the cost of material and construction of a 9 miles long, 8.0” diameter pipeline. The costs are estimated inUS dollars, with the necessaryconsiderations for installation.
71
9 miles of 8” diameter pipeline, running parallel to Feeder line 2
Description Class Dia [in] Quantity Unit Unit Cost Total Cost Remarks
Feeder Line 3 (8”)
Construction
Construction 8.0 47,520 LF $70 $3,326,400
HDD 8.0 0 LF $300 $0 For rivers
Regulator stations 8.0 0 EA $400,000 $0 For transmission lines
Materials
Materials- Steel 8.0 47,520 LF $20 $947,737
Materials- Valves 8.0 2 EA $13,300 $26,600 1 every 46,000 LF
Materials- Design allowance varies varies 5% $48,717
Materials- Misc. Freight 2% $19,487
Materials- Procurement 4% $38,973
Materials- SQS 2% $19,487
Feeder Line 3 47,520 LF $4,427,400
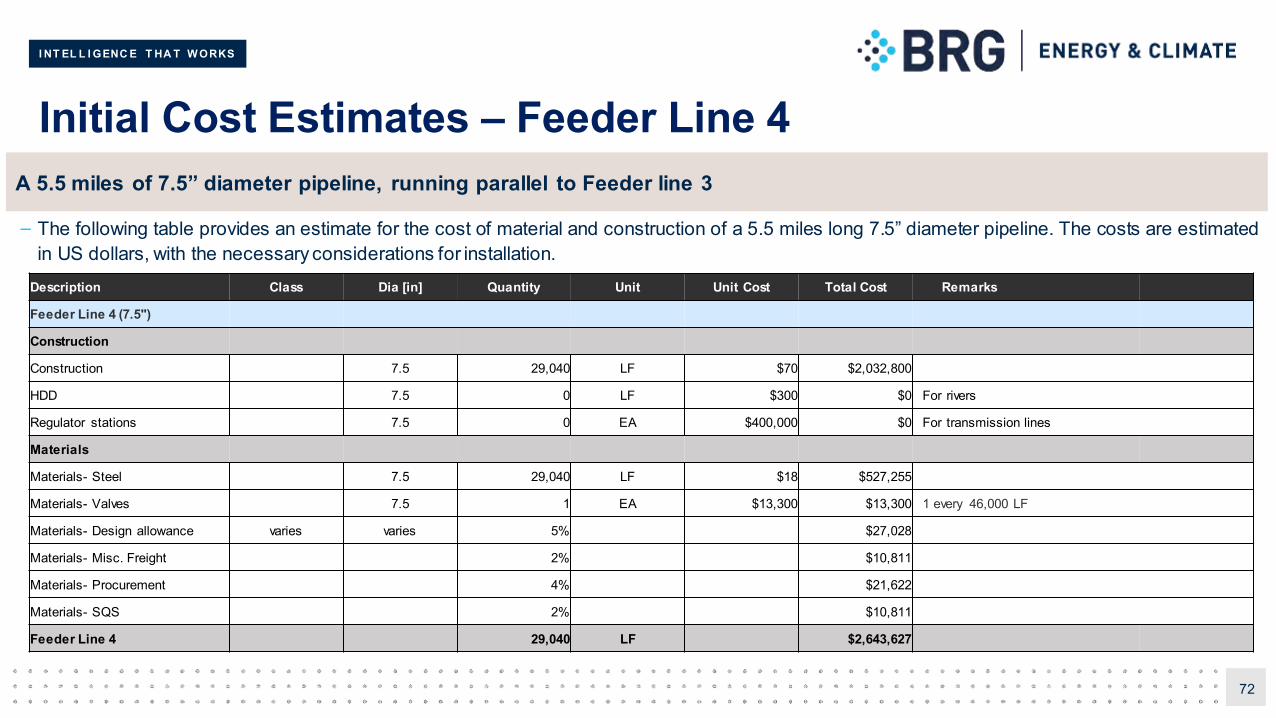
I NT EL L I GENC E T HA T W ORKS
Initial Cost Estimates – Feeder Line 4
– The following table provides an estimate for the cost of material and construction of a 5.5 miles long 7.5” diameter pipeline. The costs are estimatedin US dollars, with the necessary considerations for installation.
72
A 5.5 miles of 7.5” diameter pipeline, running parallel to Feeder line 3
Description Class Dia [in] Quantity Unit Unit Cost Total Cost Remarks
Feeder Line 4 (7.5")
Construction
Construction 7.5 29,040 LF $70 $2,032,800
HDD 7.5 0 LF $300 $0 For rivers
Regulator stations 7.5 0 EA $400,000 $0 For transmission lines
Materials
Materials- Steel 7.5 29,040 LF $18 $527,255
Materials- Valves 7.5 1 EA $13,300 $13,300 1 every 46,000 LF
Materials- Design allowance varies varies 5% $27,028
Materials- Misc. Freight 2% $10,811
Materials- Procurement 4% $21,622
Materials- SQS 2% $10,811
Feeder Line 4 29,040 LF $2,643,627
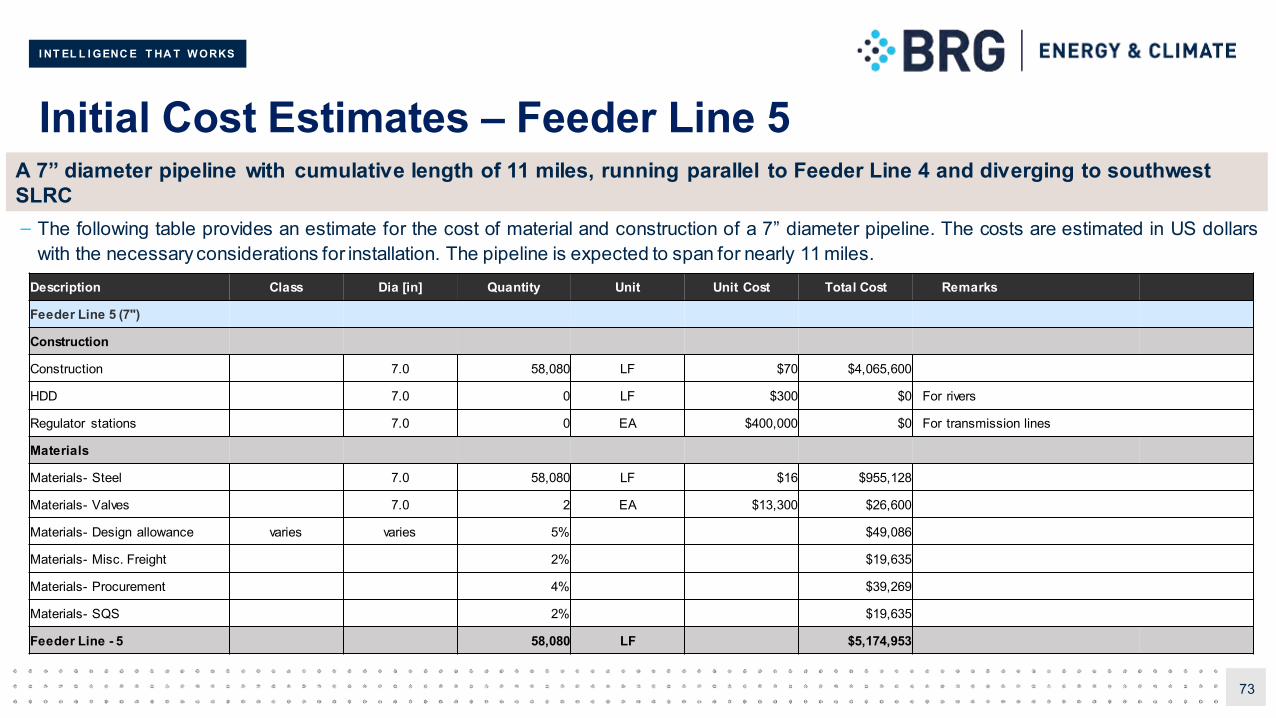
I NT EL L I GENC E T HA T W ORKS
Initial Cost Estimates – Feeder Line 5
– The following table provides an estimate for the cost of material and construction of a 7” diameter pipeline. The costs are estimated in US dollarswith the necessary considerations for installation. The pipeline is expected to span for nearly 11 miles.
73
A 7” diameter pipeline with cumulative length of 11 miles, running parallel to Feeder Line 4 and diverging to southwest SLRC
Description Class Dia [in] Quantity Unit Unit Cost Total Cost Remarks
Feeder Line 5 (7")
Construction
Construction 7.0 58,080 LF $70 $4,065,600
HDD 7.0 0 LF $300 $0 For rivers
Regulator stations 7.0 0 EA $400,000 $0 For transmission lines
Materials
Materials- Steel 7.0 58,080 LF $16 $955,128
Materials- Valves 7.0 2 EA $13,300 $26,600
Materials- Design allowance varies varies 5% $49,086
Materials- Misc. Freight 2% $19,635
Materials- Procurement 4% $39,269
Materials- SQS 2% $19,635
Feeder Line - 5 58,080 LF $5,174,953
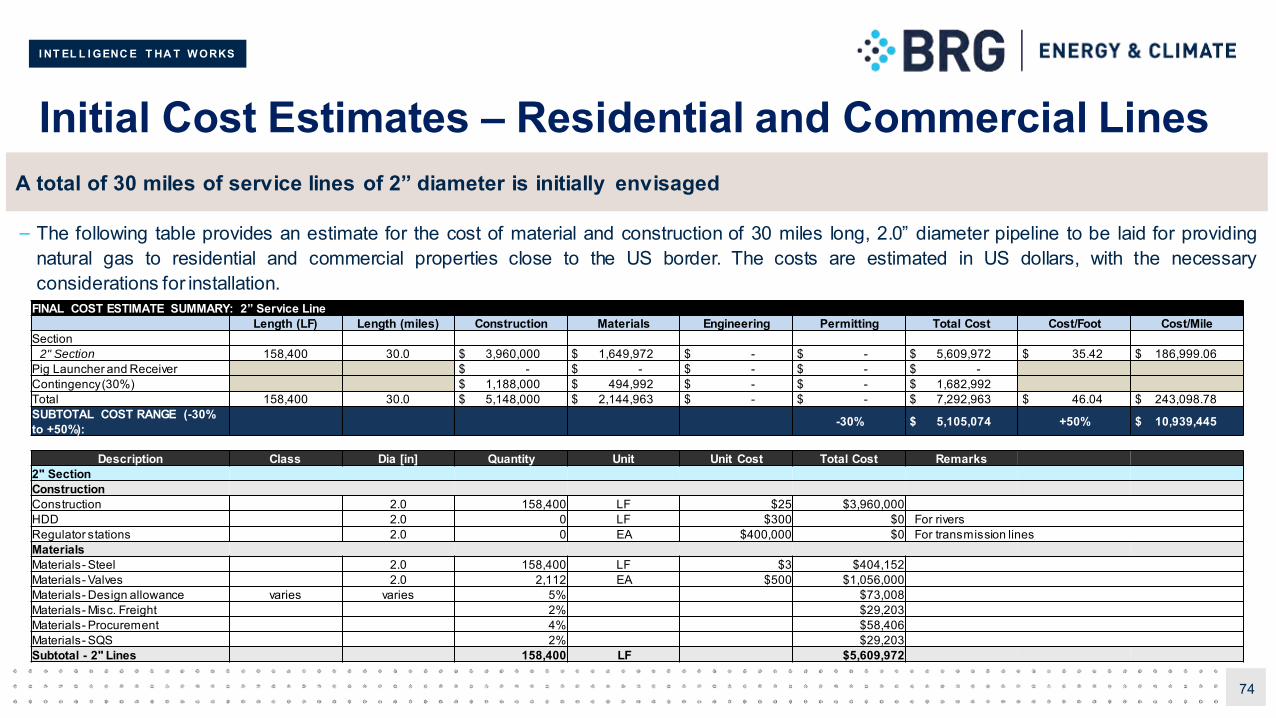
I NT EL L I GENC E T HA T W ORKS
Initial Cost Estimates – Residential and Commercial Lines
– The following table provides an estimate for the cost of material and construction of 30 miles long, 2.0” diameter pipeline to be laid for providingnatural gas to residential and commercial properties close to the US border. The costs are estimated in US dollars, with the necessaryconsiderations for installation.
74
A total of 30 miles of service lines of 2” diameter is initially envisaged
FINAL COST ESTIMATE SUMMARY: 2” Service LineLength (LF) Length (miles) Construction Materials Engineering Permitting Total Cost Cost/Foot Cost/Mile
Section2" Section 158,400 30.0 $ 3,960,000 $ 1,649,972 $ - $ - $ 5,609,972 $ 35.42 $ 186,999.06
Pig Launcher and Receiver $ - $ - $ - $ - $ -Contingency (30%) $ 1,188,000 $ 494,992 $ - $ - $ 1,682,992 Total 158,400 30.0 $ 5,148,000 $ 2,144,963 $ - $ - $ 7,292,963 $ 46.04 $ 243,098.78 SUBTOTAL COST RANGE (-30% to +50%): -30% $ 5,105,074 +50% $ 10,939,445
Description Class Dia [in] Quantity Unit Unit Cost Total Cost Remarks2" SectionConstructionConstruction 2.0 158,400 LF $25 $3,960,000HDD 2.0 0 LF $300 $0 For riversRegulator stations 2.0 0 EA $400,000 $0 For transmission linesMaterialsMaterials- Steel 2.0 158,400 LF $3 $404,152Materials- Valves 2.0 2,112 EA $500 $1,056,000Materials- Design allowance varies varies 5% $73,008Materials- Misc. Freight 2% $29,203Materials- Procurement 4% $58,406Materials- SQS 2% $29,203Subtotal - 2" Lines 158,400 LF $5,609,972
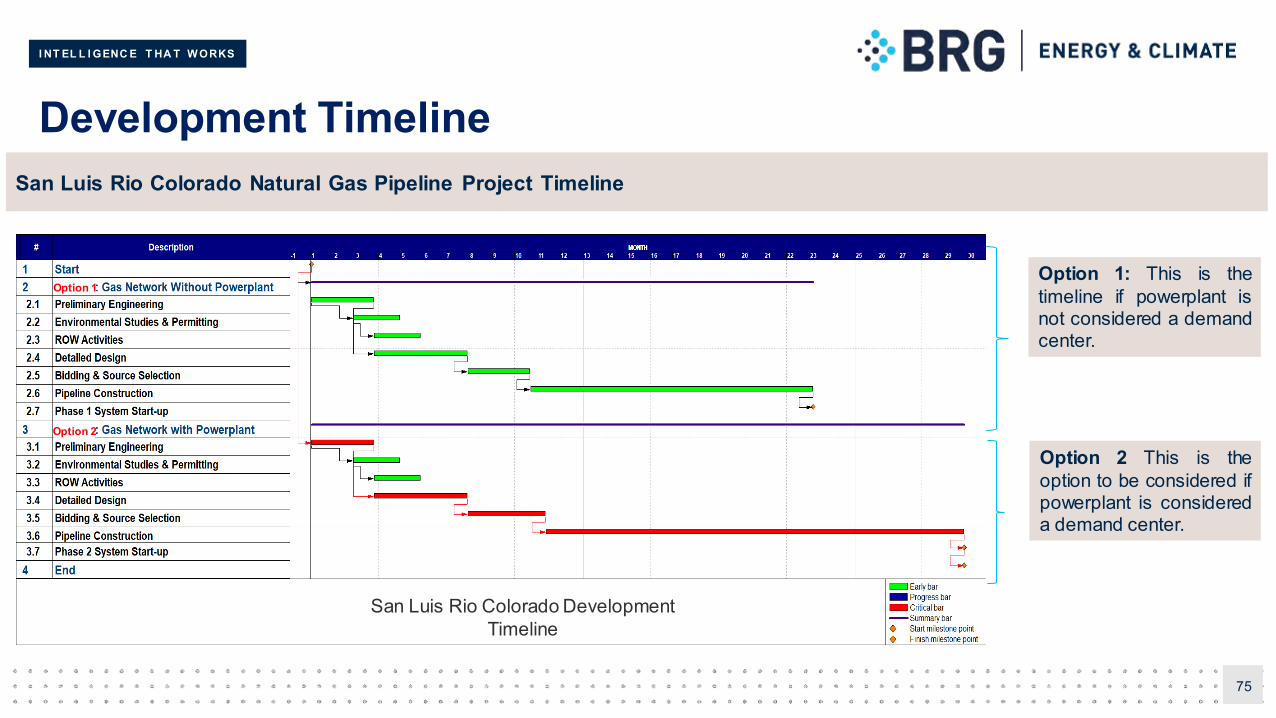
I NT EL L I GENC E T HA T W ORKS
Development Timeline
75
Option 1: This is thetimeline if powerplant isnot considered a demandcenter.
Option 2 This is theoption to be considered ifpowerplant is considereda demand center.
San Luis Rio Colorado Natural Gas Pipeline Project Timeline
San Luis Rio Colorado Development Timeline
Option 1
Option 2
I NT EL L I GENC E T HA T W ORKS
7 Supply Alternatives
I NT EL L I GENC E T HA T W ORKS
Overview of Supply Alternatives
– In previous sections we analyzed the possibility of natural gas supply from the Somerton EPNG connection point. In this section, we discussother supply options of supply as well as an alternate energy options. These includes:
› Revisiting gas supply from the SomertonEPNG connection point.
› Gas supply from EPNG Mesa Irrigation Tap in the north.
› LNG supply from a liquefaction plant with a regasificationstation at the city.
– Each of the options were then analyzed by the report team to understand their advantages and disadvantages.
– A preliminary cost impact was assessed for each of the options is provided.
– This analysis addresses the basics of available options and weighs these options against the status quo.
>>> This analysis is presented indetail in the next few slides.
77
In this section, we will analyze other supply options available to the City of San Luis Rio Colorado
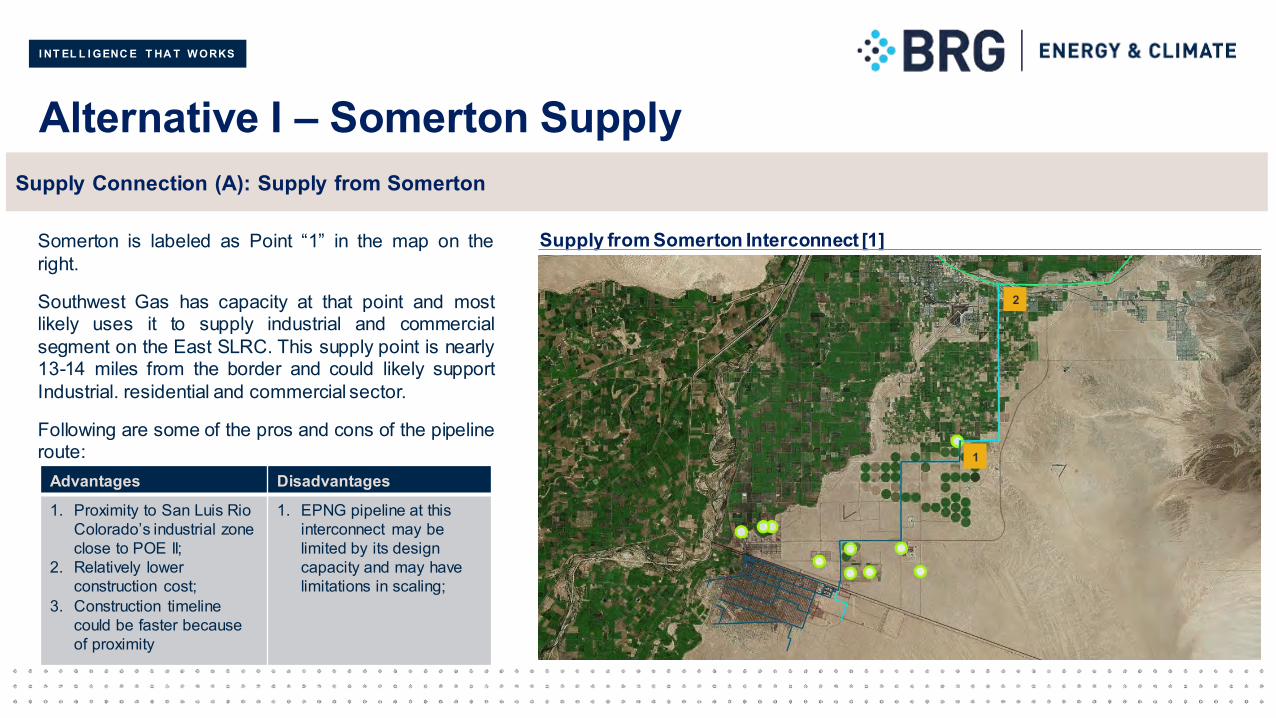
I NT EL L I GENC E T HA T W ORKS
Alternative I – Somerton Supply
Supply from Somerton Interconnect [1]Somerton is labeled as Point “1” in the map on theright.
Southwest Gas has capacity at that point and mostlikely uses it to supply industrial and commercialsegment on the East SLRC. This supply point is nearly13-14 miles from the border and could likely supportIndustrial. residential and commercial sector.
Following are some of the pros and cons of the pipelineroute:
Advantages Disadvantages
1. Proximity to San Luis Rio Colorado’s industrial zone close to POE II;
2. Relatively lower construction cost;
3. Construction timeline could be faster because of proximity
1. EPNG pipeline at this interconnect may be limited by its design capacity and may have limitations in scaling;
Supply Connection (A): Supply from Somerton
1
2
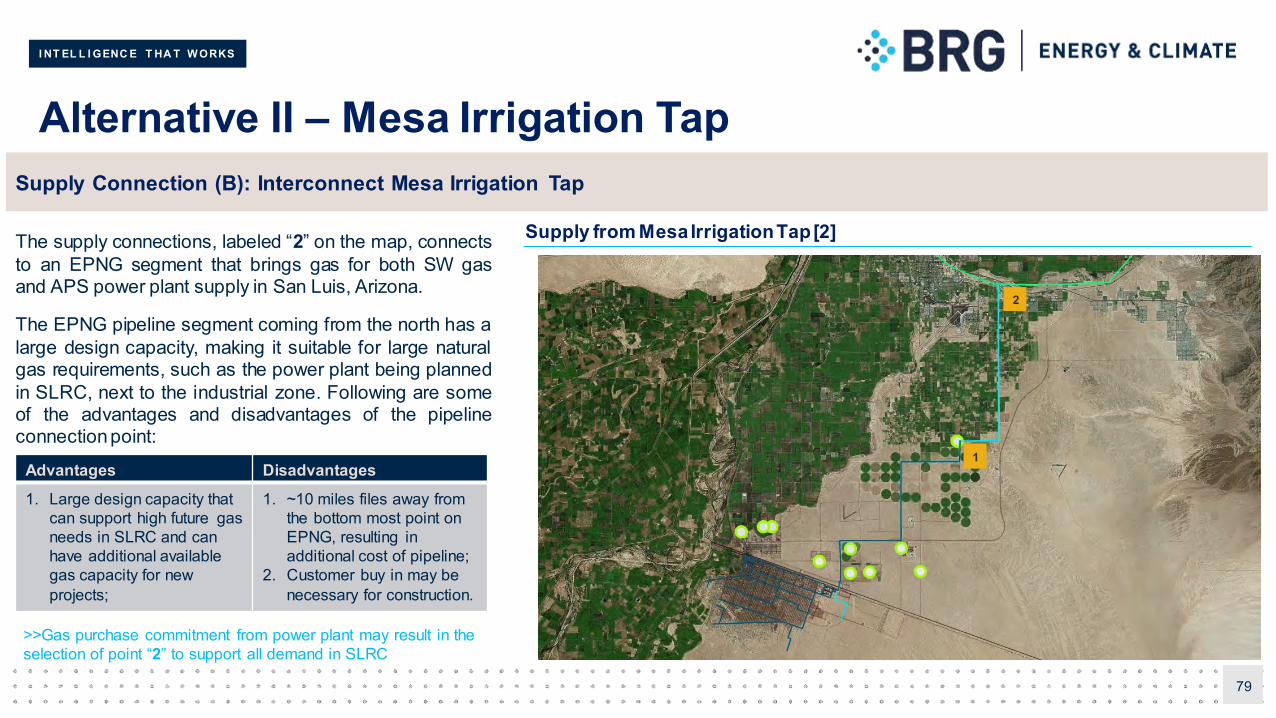
I NT EL L I GENC E T HA T W ORKS
Alternative II – Mesa Irrigation Tap
79
Supply from Mesa Irrigation Tap [2]
Supply Connection (B): Interconnect Mesa Irrigation Tap
The supply connections, labeled “2” on the map, connectsto an EPNG segment that brings gas for both SW gasand APS power plant supply in San Luis, Arizona.
The EPNG pipeline segment coming from the north has alarge design capacity, making it suitable for large naturalgas requirements, such as the power plant being plannedin SLRC, next to the industrial zone. Following are someof the advantages and disadvantages of the pipelineconnectionpoint:
Advantages Disadvantages
1. Large design capacity that can support high future gas needs in SLRC and can have additional available gas capacity for new projects;
1. ~10 miles files away from the bottom most point on EPNG, resulting in additional cost of pipeline;
2. Customer buy in may be necessary for construction.
>>Gas purchase commitment from power plant may result in the selection of point “2” to support all demand in SLRC
1
2

I NT EL L I GENC E T HA T W ORKS
Alternative III – LNG Trucking (1 of 2)
80
LNG TruckingAnother alternative option for supply could include transportation ofliquefied natural gas (LNG) loaded on to trucks or ISO containers to bedeliver to a location and then regasified. Following are some ofadvantages of this approach:
Targeted customers base could be served, for example, a factoryor several industrial customers could be served with truck deliveryof LNG (similar to diesel or gasoline).
A robust network of infrastructure could be developed which isdecentralized and runs with an option of independently orcollectively.
Infrastructure could be bolstered significantly as this will not bedependent on transmissionpipeline expansion needs.
>>> The logistics and cost associated are explained in the next slides.
LNG trucking from the Southern Arizona LNG storage station in Tucson, AZ.

I NT EL L I GENC E T HA T W ORKS
Alternative III – LNG Trucking (2 of 2)
81
Truck routeIn this case LNG can be acquired from Southern Arizona LNG terminalowned by Southwest Gas, which is nearly 270 miles away from San LuisRio Colorado. Based on the demand information in the region thefollowing could be concluded:
LNG truck loading station would be needed at SW Gas’ LNG terminal(2 bay loading) costing nearly $2 million.
Five to six LNG trucks (each with 18 tons of LNG i.e. 9,615 therms ofnatural gas) would be required for meeting the demand. The cost ofeach truck is approximately $200,000or $1.2 million.
Storage (32,000 therms – equivalent to 150 m3 LNG) andregasification equipment would be required with total cost close to$1.0 million.
Thus total investment required will be in the order of ~ $4 - $5 million.This investment would be additional to investment for the pipelineinfrastructure cost as estimated in the study. Cost of gas delivered wouldbe higher1 than the cost of delivered gas to the end customers. Thus,could be a viable strategy in case of pipeline capacity bottlenecks.
Potential truck route
1Additional cost for converting gas to LNG + Transport
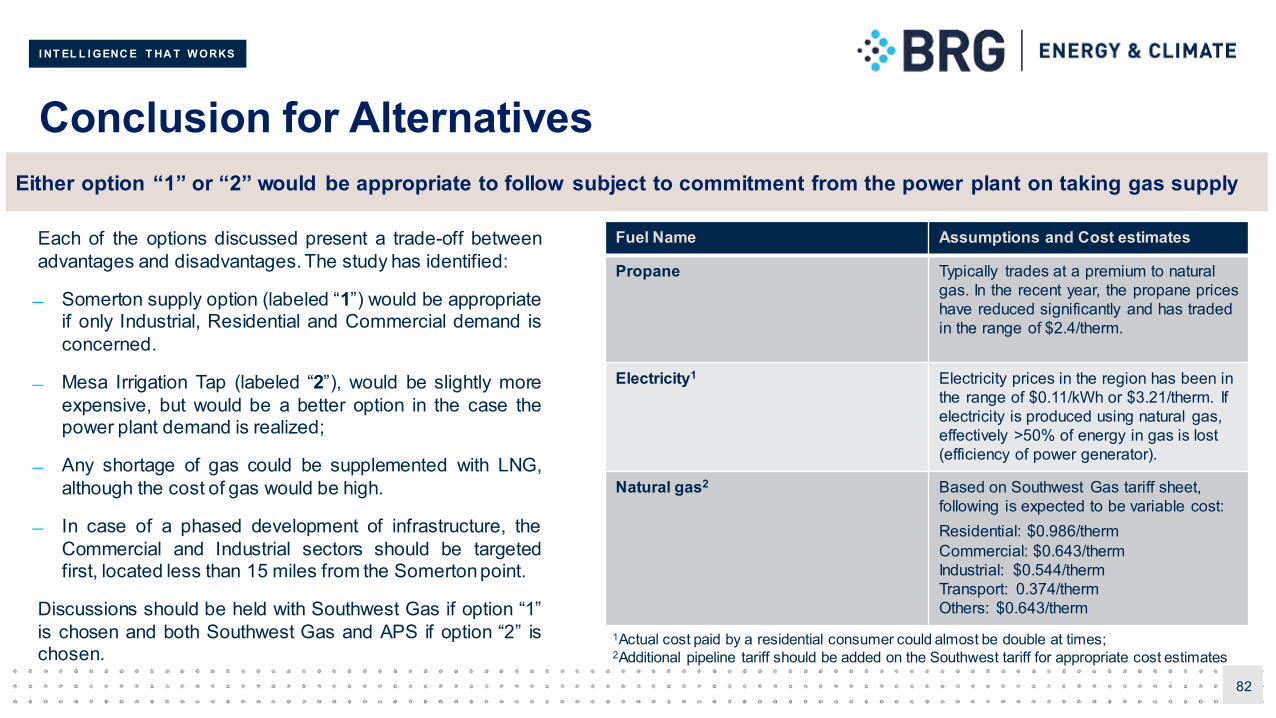
I NT EL L I GENC E T HA T W ORKS
Conclusion for Alternatives
82
Each of the options discussed present a trade-off betweenadvantages and disadvantages. The study has identified:
Somerton supply option (labeled “1”) would be appropriateif only Industrial, Residential and Commercial demand isconcerned.
Mesa Irrigation Tap (labeled “2”), would be slightly moreexpensive, but would be a better option in the case thepower plant demand is realized;
Any shortage of gas could be supplemented with LNG,although the cost of gas would be high.
In case of a phased development of infrastructure, theCommercial and Industrial sectors should be targetedfirst, located less than 15 miles from the Somertonpoint.
Discussions should be held with Southwest Gas if option “1”is chosen and both Southwest Gas and APS if option “2” ischosen.
Fuel Name Assumptions and Cost estimates
Propane Typically trades at a premium to natural gas. In the recent year, the propane prices have reduced significantly and has traded in the range of $2.4/therm.
Electricity1 Electricity prices in the region has been in the range of $0.11/kWh or $3.21/therm. If electricity is produced using natural gas, effectively >50% of energy in gas is lost (efficiency of power generator).
Natural gas2 Based on Southwest Gas tariff sheet, following is expected to be variable cost:Residential: $0.986/thermCommercial: $0.643/thermIndustrial: $0.544/thermTransport: 0.374/thermOthers: $0.643/therm
Fuel Cost Comparison: Propane vs Electricity vs Natural Gas
1Actual cost paid by a residential consumer could almost be double at times;2Additional pipeline tariff should be added on the Southwest tariff for appropriate cost estimates
Either option “1” or “2” would be appropriate to follow subject to commitment from the power plant on taking gas supply

I NT EL L I GENC E T HA T W ORKS
8 Economic Feasibility
I NT EL L I GENC E T HA T W ORKS
Financial Feasibility Analysis Overview
In very simplistic terms, we will evaluate:
– Gas infrastructure provider facing enough demand to justify making an investment; and,
– Gas buyer has sufficient incentive to switch to natural gas as it is made available.
Consequently, this analysis develops:
– For infrastructure provider- An economic model based on existing tariff for different customers to evaluate if rate of return objective is met. Incase of a regulated utility, the gas infrastructure allowed return of investment is assumed to be 10% (equivalent to cost of capital). In reality, thisnumber would be slightly lower. Assumptionare detailed in the later slides.
• The economic model has two CAPEX/OPEX scenarios, one with Power Plant and one without the Power Plant.
– For Gas buyer-
Commercial User - Delivered gas price is compared against propane price.
Residential User - Fuel cost is compared against electricity cost in heating/cooking.
>>> The results are detailed in the next slides.
84
Feasibility of adoption of an alternative fuel requires careful analysis of value to each of the stakeholders.
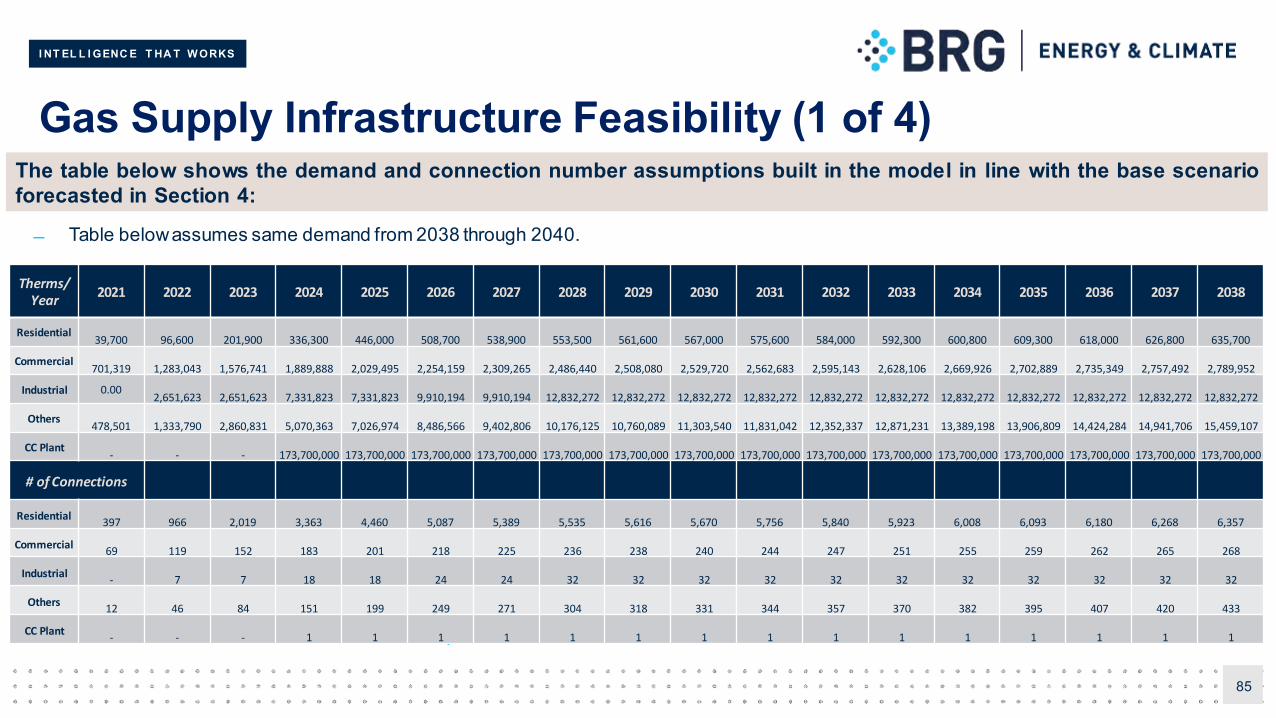
I NT EL L I GENC E T HA T W ORKS
Gas Supply Infrastructure Feasibility (1 of 4)
85
The table below shows the demand and connection number assumptions built in the model in line with the base scenarioforecasted in Section 4:
Table belowassumes same demand from 2038 through 2040.
>>>These demand and connections number assumptions are the basis for the LDC’s revenue calculation, which are shown in next slides.
Therms/ Year
2021 2022 2023 2024 2025 2026 2027 2028 2029 2030 2031 2032 2033 2034 2035 2036 2037 2038
Residential39,700 96,600 201,900 336,300 446,000 508,700 538,900 553,500 561,600 567,000 575,600 584,000 592,300 600,800 609,300 618,000 626,800 635,700
Commercial701,319 1,283,043 1,576,741 1,889,888 2,029,495 2,254,159 2,309,265 2,486,440 2,508,080 2,529,720 2,562,683 2,595,143 2,628,106 2,669,926 2,702,889 2,735,349 2,757,492 2,789,952
Industrial 0.002,651,623 2,651,623 7,331,823 7,331,823 9,910,194 9,910,194 12,832,272 12,832,272 12,832,272 12,832,272 12,832,272 12,832,272 12,832,272 12,832,272 12,832,272 12,832,272 12,832,272
Others478,501 1,333,790 2,860,831 5,070,363 7,026,974 8,486,566 9,402,806 10,176,125 10,760,089 11,303,540 11,831,042 12,352,337 12,871,231 13,389,198 13,906,809 14,424,284 14,941,706 15,459,107
CC Plant- - - 173,700,000 173,700,000 173,700,000 173,700,000 173,700,000 173,700,000 173,700,000 173,700,000 173,700,000 173,700,000 173,700,000 173,700,000 173,700,000 173,700,000 173,700,000
# of Connections
Residential397 966 2,019 3,363 4,460 5,087 5,389 5,535 5,616 5,670 5,756 5,840 5,923 6,008 6,093 6,180 6,268 6,357
Commercial69 119 152 183 201 218 225 236 238 240 244 247 251 255 259 262 265 268
Industrial- 7 7 18 18 24 24 32 32 32 32 32 32 32 32 32 32 32
Others12 46 84 151 199 249 271 304 318 331 344 357 370 382 395 407 420 433
CC Plant- - - 1 1 1 1 1 1 1 1 1 1 1 1 1 1 1
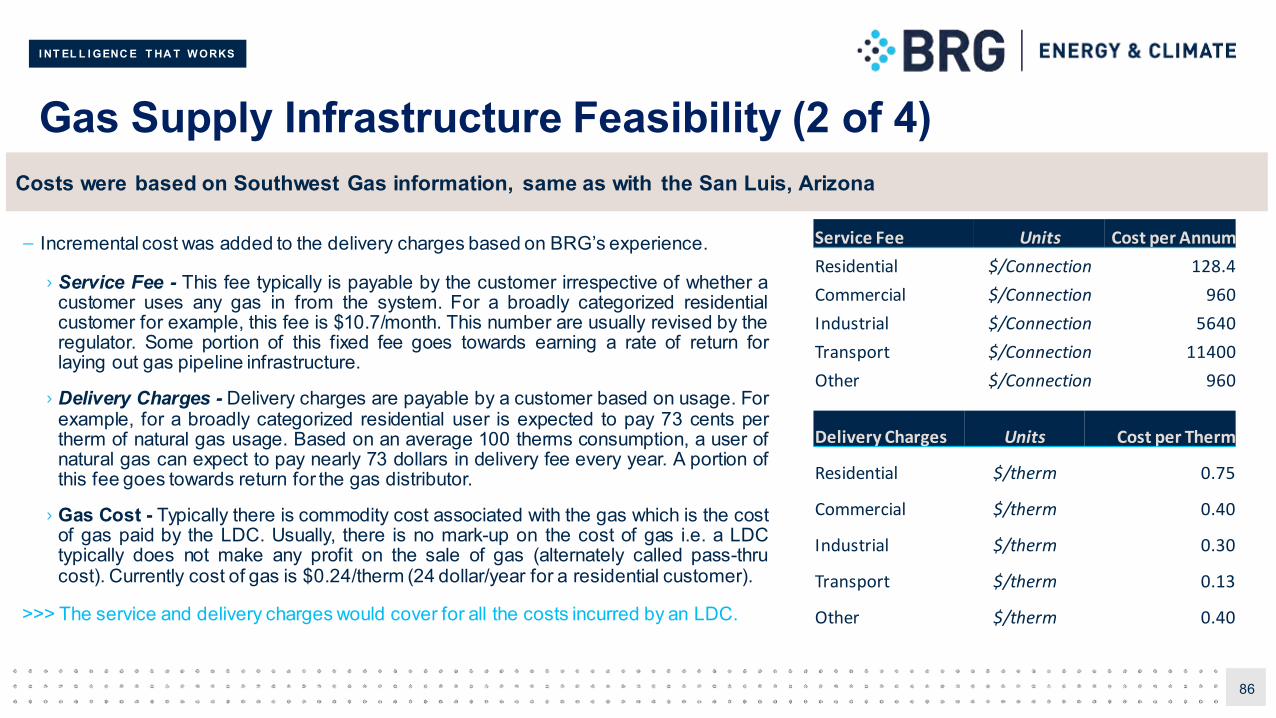
I NT EL L I GENC E T HA T W ORKS
Gas Supply Infrastructure Feasibility (2 of 4)
– Incremental cost was added to the delivery charges based on BRG’s experience.
› Service Fee - This fee typically is payable by the customer irrespective of whether acustomer uses any gas in from the system. For a broadly categorized residentialcustomer for example, this fee is $10.7/month. This number are usually revised by theregulator. Some portion of this fixed fee goes towards earning a rate of return forlaying out gas pipeline infrastructure.
› Delivery Charges - Delivery charges are payable by a customer based on usage. Forexample, for a broadly categorized residential user is expected to pay 73 cents pertherm of natural gas usage. Based on an average 100 therms consumption, a user ofnatural gas can expect to pay nearly 73 dollars in delivery fee every year. A portion ofthis fee goes towards return for the gas distributor.
› Gas Cost - Typically there is commodity cost associated with the gas which is the costof gas paid by the LDC. Usually, there is no mark-up on the cost of gas i.e. a LDCtypically does not make any profit on the sale of gas (alternately called pass-thrucost). Currently cost of gas is $0.24/therm (24 dollar/year for a residential customer).
>>> The service and delivery charges would cover for all the costs incurred by an LDC.
86
Costs were based on Southwest Gas information, same as with the San Luis, Arizona
Service Fee Units Cost per Annum
Residential $/Connection 128.4
Commercial $/Connection 960
Industrial $/Connection 5640
Transport $/Connection 11400
Other $/Connection 960
Delivery Charges Units Cost per Therm
Residential $/therm 0.75
Commercial $/therm 0.40
Industrial $/therm 0.30
Transport $/therm 0.13
Other $/therm 0.40
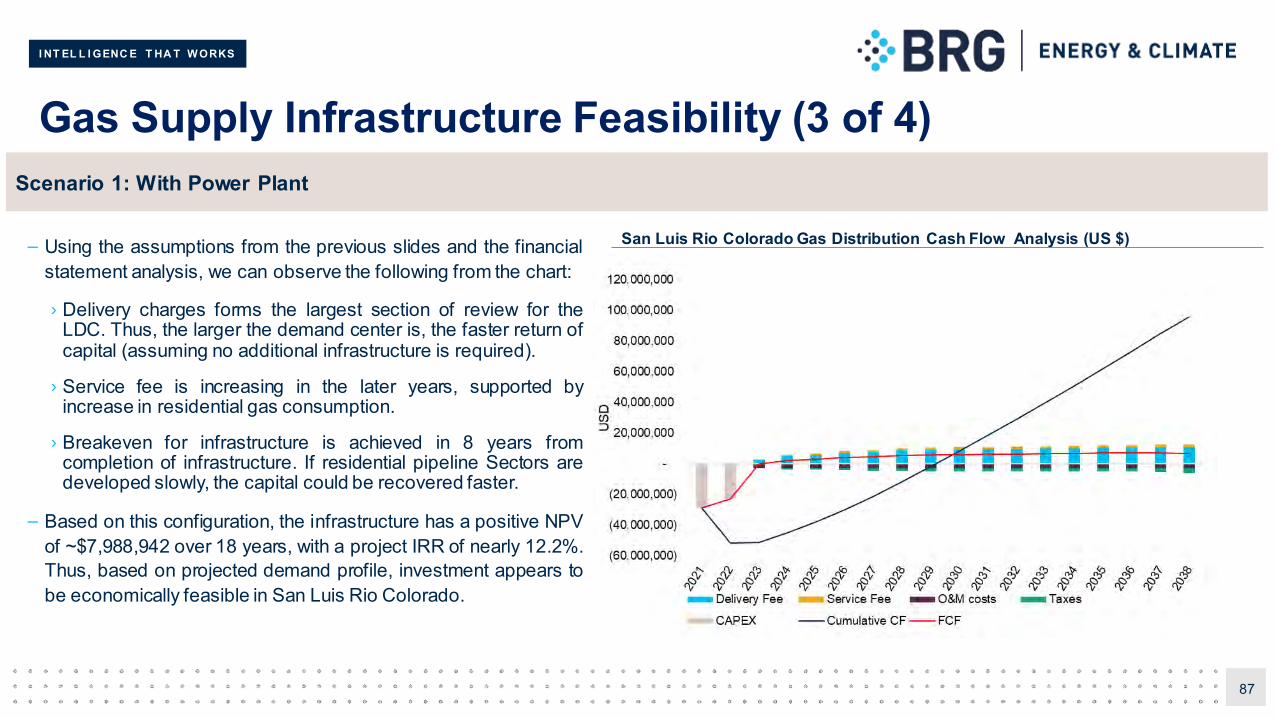
I NT EL L I GENC E T HA T W ORKS
Gas Supply Infrastructure Feasibility (3 of 4)
– Using the assumptions from the previous slides and the financialstatement analysis, we can observe the following from the chart:
› Delivery charges forms the largest section of review for theLDC. Thus, the larger the demand center is, the faster return ofcapital (assuming no additional infrastructure is required).
› Service fee is increasing in the later years, supported byincrease in residential gas consumption.
› Breakeven for infrastructure is achieved in 8 years fromcompletion of infrastructure. If residential pipeline Sectors aredeveloped slowly, the capital could be recovered faster.
– Based on this configuration, the infrastructure has a positive NPVof ~$7,988,942 over 18 years, with a project IRR of nearly 12.2%.Thus, based on projected demand profile, investment appears tobe economically feasible in San Luis Rio Colorado.
87
Scenario 1: With Power Plant
San Luis Rio Colorado Gas Distribution Cash Flow Analysis (US $)
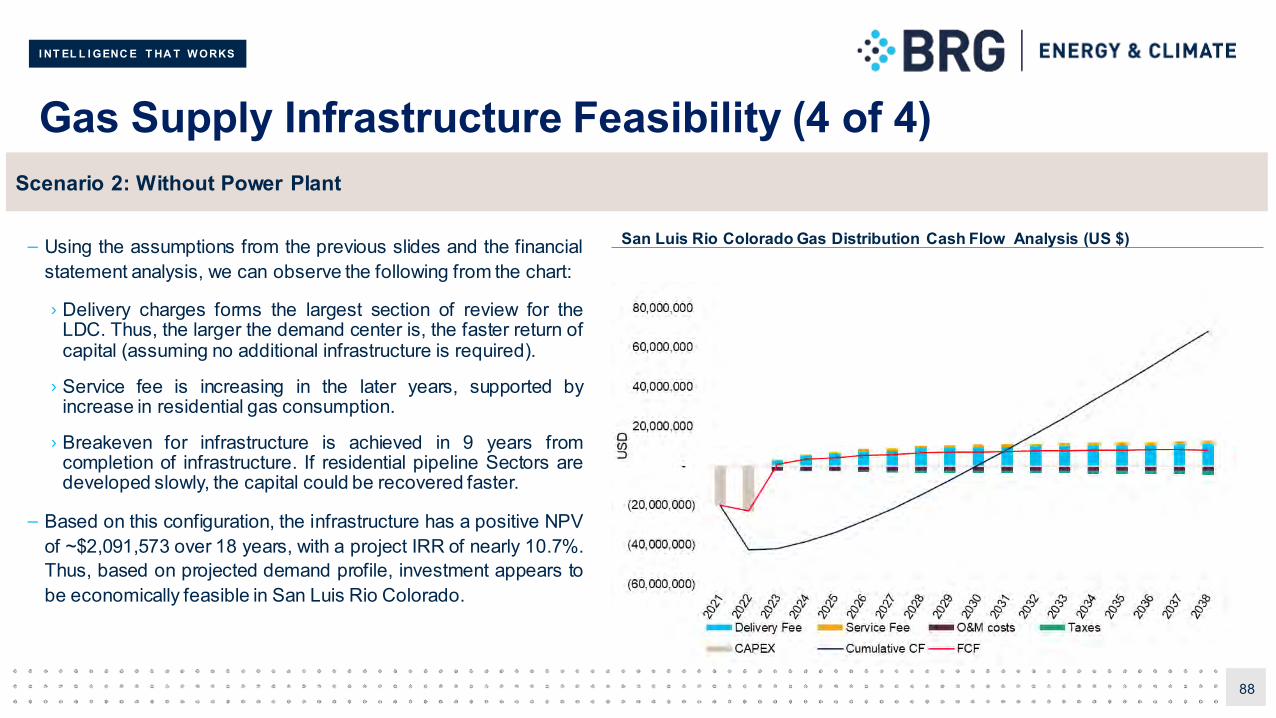
I NT EL L I GENC E T HA T W ORKS
Gas Supply Infrastructure Feasibility (4 of 4)
– Using the assumptions from the previous slides and the financialstatement analysis, we can observe the following from the chart:
› Delivery charges forms the largest section of review for theLDC. Thus, the larger the demand center is, the faster return ofcapital (assuming no additional infrastructure is required).
› Service fee is increasing in the later years, supported byincrease in residential gas consumption.
› Breakeven for infrastructure is achieved in 9 years fromcompletion of infrastructure. If residential pipeline Sectors aredeveloped slowly, the capital could be recovered faster.
– Based on this configuration, the infrastructure has a positive NPVof ~$2,091,573 over 18 years, with a project IRR of nearly 10.7%.Thus, based on projected demand profile, investment appears tobe economically feasible in San Luis Rio Colorado.
88
Scenario 2: Without Power Plant
San Luis Rio Colorado Gas Distribution Cash Flow Analysis (US $)
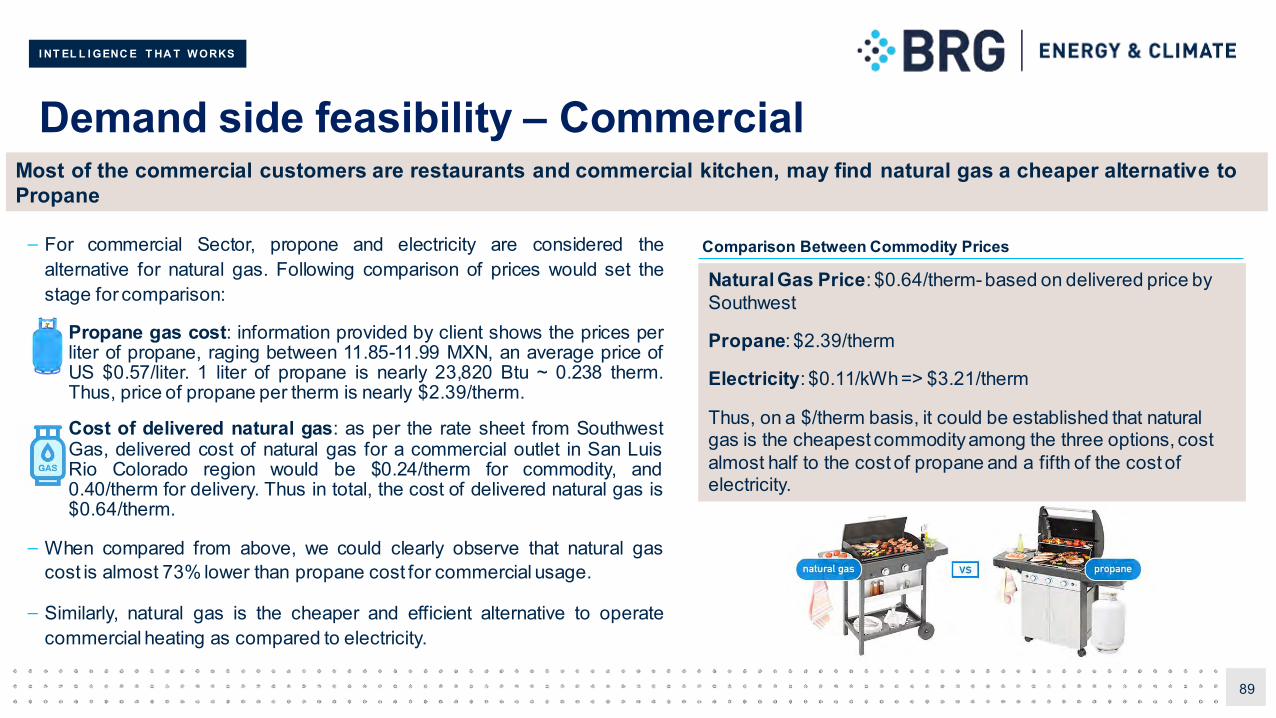
I NT EL L I GENC E T HA T W ORKS
Demand side feasibility – Commercial
– For commercial Sector, propone and electricity are considered thealternative for natural gas. Following comparison of prices would set thestage for comparison:
Propane gas cost: information provided by client shows the prices perliter of propane, raging between 11.85-11.99 MXN, an average price ofUS $0.57/liter. 1 liter of propane is nearly 23,820 Btu ~ 0.238 therm.Thus, price of propane per therm is nearly $2.39/therm.
Cost of delivered natural gas: as per the rate sheet from SouthwestGas, delivered cost of natural gas for a commercial outlet in San LuisRio Colorado region would be $0.24/therm for commodity, and0.40/therm for delivery. Thus in total, the cost of delivered natural gas is$0.64/therm.
– When compared from above, we could clearly observe that natural gascost is almost 73% lower than propane cost for commercial usage.
– Similarly, natural gas is the cheaper and efficient alternative to operatecommercial heating as compared to electricity.
89
Most of the commercial customers are restaurants and commercial kitchen, may find natural gas a cheaper alternative to Propane
Comparison Between Commodity Prices
Natural Gas Price: $0.64/therm- based on delivered price by Southwest
Propane: $2.39/therm
Electricity: $0.11/kWh => $3.21/therm
Thus, on a $/therm basis, it could be established that natural gas is the cheapest commodity among the three options, cost almost half to the cost of propane and a fifth of the cost of electricity.
I NT EL L I GENC E T HA T W ORKS
Savings Estimation (1 of 2)
– Savings estimation for each Sector could be largely be viewed as necessary cost and switching cost differential that may result in consumersselecting to use natural gas as their primary source of heating/fuel. Following calculations can be done based on needs of Sectors:
› Residential Sector - As it is estimated that nearly each household is expected to use ~100 therms/year, if natural gas is used as an alternatefuel, the cost saving every year for 100 therms would be in range of 0 – 46 dollars per year as compared to propane. Propane pipinginstallation cost could be higher. Thus, natural gas would be overall a betteralternate.
› Industrial Sector - For industrial Sector, use of natural gas would typically be cheaper and efficient for heating, drying, processing and otherpurposes. It must be noted, however, that depending on the type of equipment involved, the specific calculations have to be done to establishsuperiority of one fuel against the other.
› Other Sectors - In this report, we have categorized schools, government facilities, and hospitals in other Sectors. The main natural gas fuelalternative in these Sector includes propane and electricity. Typically on the basis of economics, natural gas would result in lower operatingcosts as compared to the alternative fuels.
>>> In order to understand the magnitude of saving, in the next section, we have presented a table of potential saving from the use of natural gas on a commodity basis. The commodities compared against natural gas are propane, diesel and electricity.
90
Commercial sector could benefit from the biggest savings.
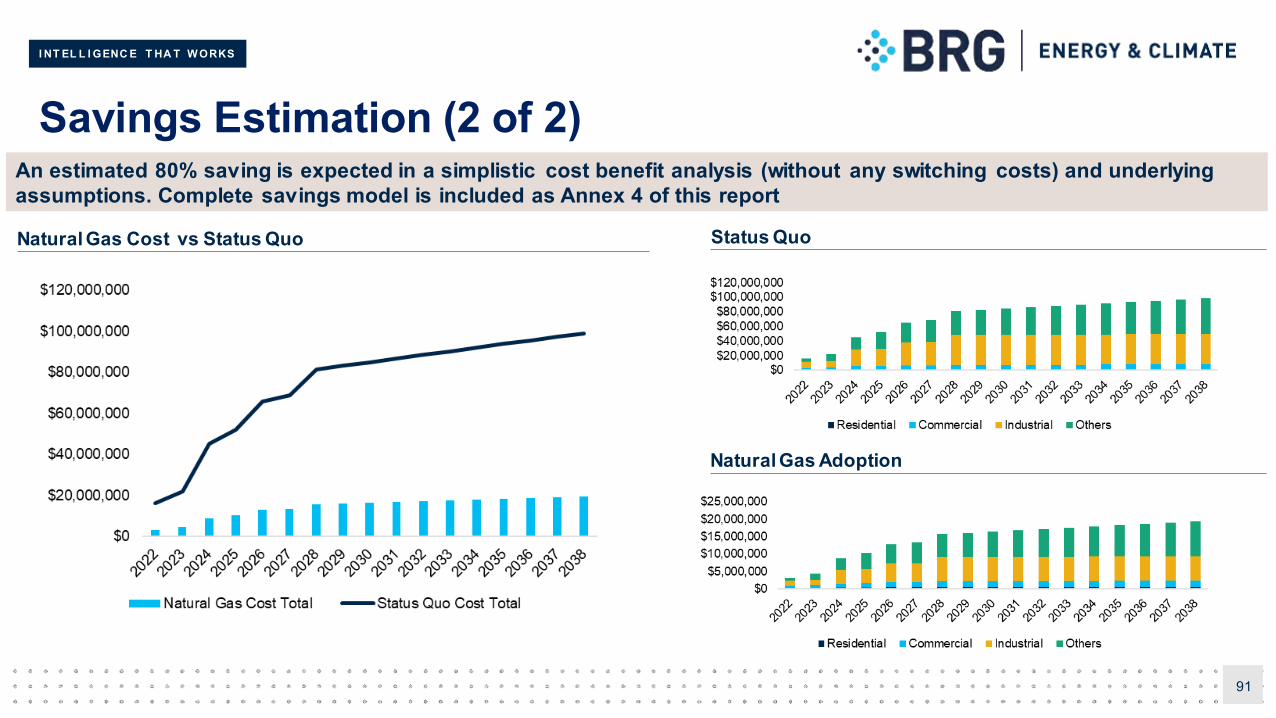
I NT EL L I GENC E T HA T W ORKS
Savings Estimation (2 of 2)
91
An estimated 80% saving is expected in a simplistic cost benefit analysis (without any switching costs) and underlying assumptions. Complete savings model is included as Annex 4 of this report
Natural Gas Cost vs Status Quo Status Quo
Natural Gas Adoption
I NT EL L I GENC E T HA T W ORKS
Conclusion
92
Natural gas offers tremendous potential for saving in San Luis Rio Colorado
Based on the economic feasibilityanalysis shown here, the following can be concluded:
If the project demand profile materializes, infrastructure investments made would be sufficient to provide the required rate of return for the LDC.Thus, natural gas infrastructure development is feasible.
The project is feasible with or without the construction of the power plant.
Comparison of cost between natural gas and propane yields favorable economics for use of natural gas in commercial sector as well as residentialsector.
Finally, the industrial sector may require switching economics validated on case by case bases for existing machinery, but future industries couldcertainly benefit from natural gas availability.
>>> Thus, a nutshell, natural gas appears to be economically feasibility and a superior fuel that can serve the community reliably.
I NT EL L I GENC E T HA T W ORKS
9 Regulation, Rates and Permitting
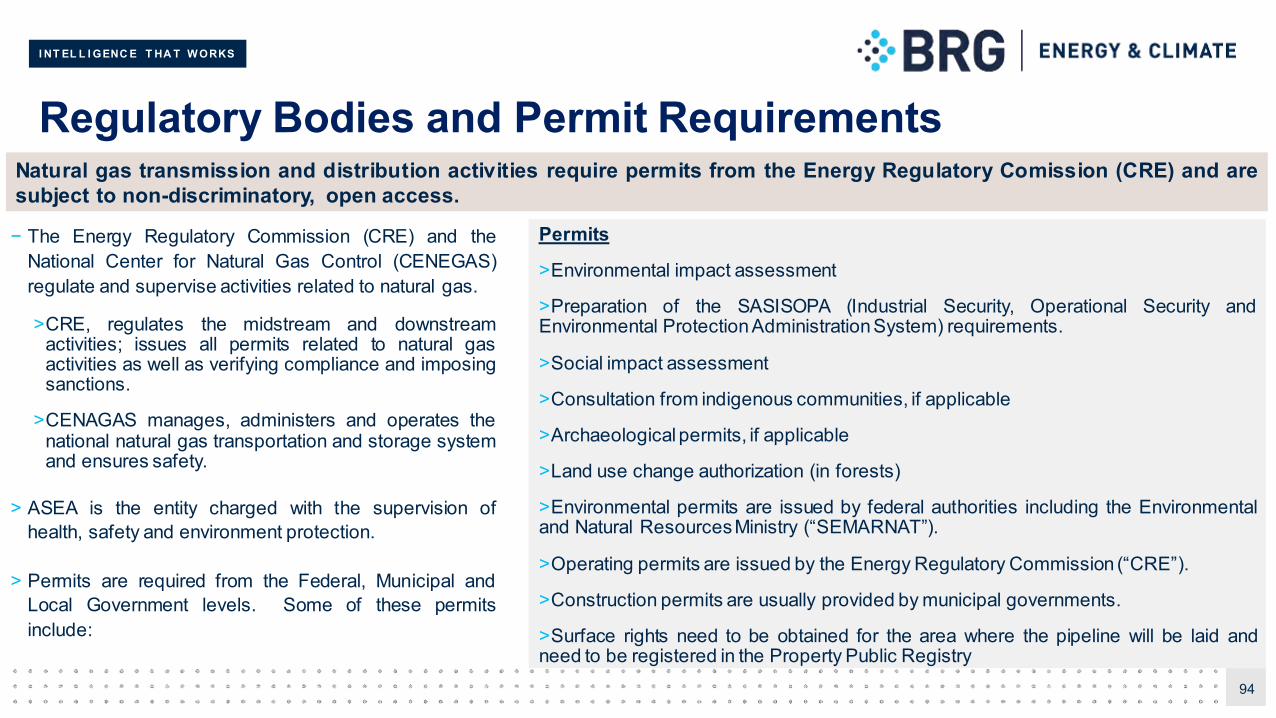
I NT EL L I GENC E T HA T W ORKS
Regulatory Bodies and Permit Requirements
− The Energy Regulatory Commission (CRE) and theNational Center for Natural Gas Control (CENEGAS)regulate and supervise activities related to natural gas.
>CRE, regulates the midstream and downstreamactivities; issues all permits related to natural gasactivities as well as verifying compliance and imposingsanctions.
>CENAGAS manages, administers and operates thenational natural gas transportation and storage systemand ensures safety.
> ASEA is the entity charged with the supervision ofhealth, safety and environment protection.
> Permits are required from the Federal, Municipal andLocal Government levels. Some of these permitsinclude:
94
Natural gas transmission and distribution activities require permits from the Energy Regulatory Comission (CRE) and aresubject to non-discriminatory, open access.
Permits
>Environmental impact assessment
>Preparation of the SASISOPA (Industrial Security, Operational Security andEnvironmental ProtectionAdministrationSystem) requirements.
>Social impact assessment
>Consultation from indigenous communities, if applicable
>Archaeological permits, if applicable
>Land use change authorization (in forests)
>Environmental permits are issued by federal authorities including the Environmentaland Natural ResourcesMinistry (“SEMARNAT”).
>Operating permits are issued by the Energy Regulatory Commission (“CRE”).
>Construction permits are usually provided by municipal governments.
>Surface rights need to be obtained for the area where the pipeline will be laid andneed to be registered in the Property Public Registry

I NT EL L I GENC E T HA T W ORKS
10 Environmental Assessment
I NT EL L I GENC E T HA T W ORKS
Environmental and social impacts for San Luis Rio Colorado
Overview
> This section explores the environmental and social impact that could be expected from the construction of this pipeline.
> As the gas source starts on the Arizona side where the pipeline is exposed to greater environmental disturbance, the report focuses on several aspects that are unique to San Luis rather than SLRC
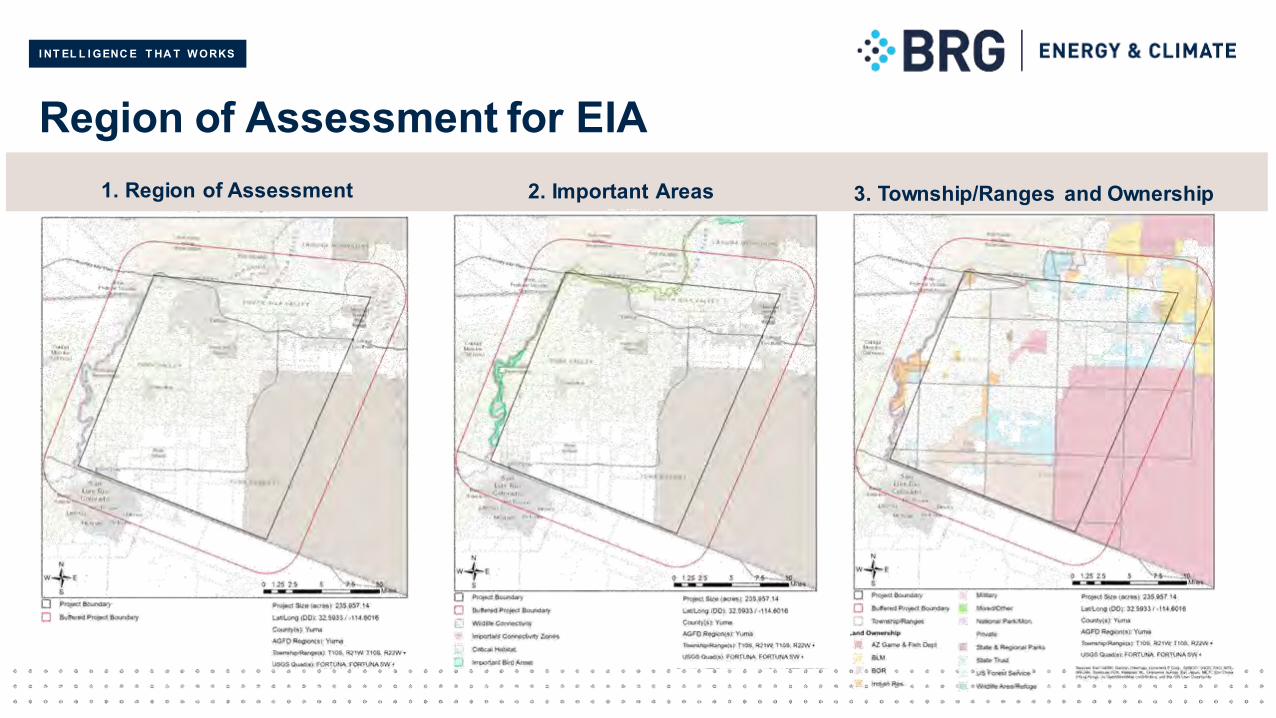
I NT EL L I GENC E T HA T W ORKS
Region of Assessment for EIA1. Region of Assessment 2. Important Areas 3. Township/Ranges and Ownership
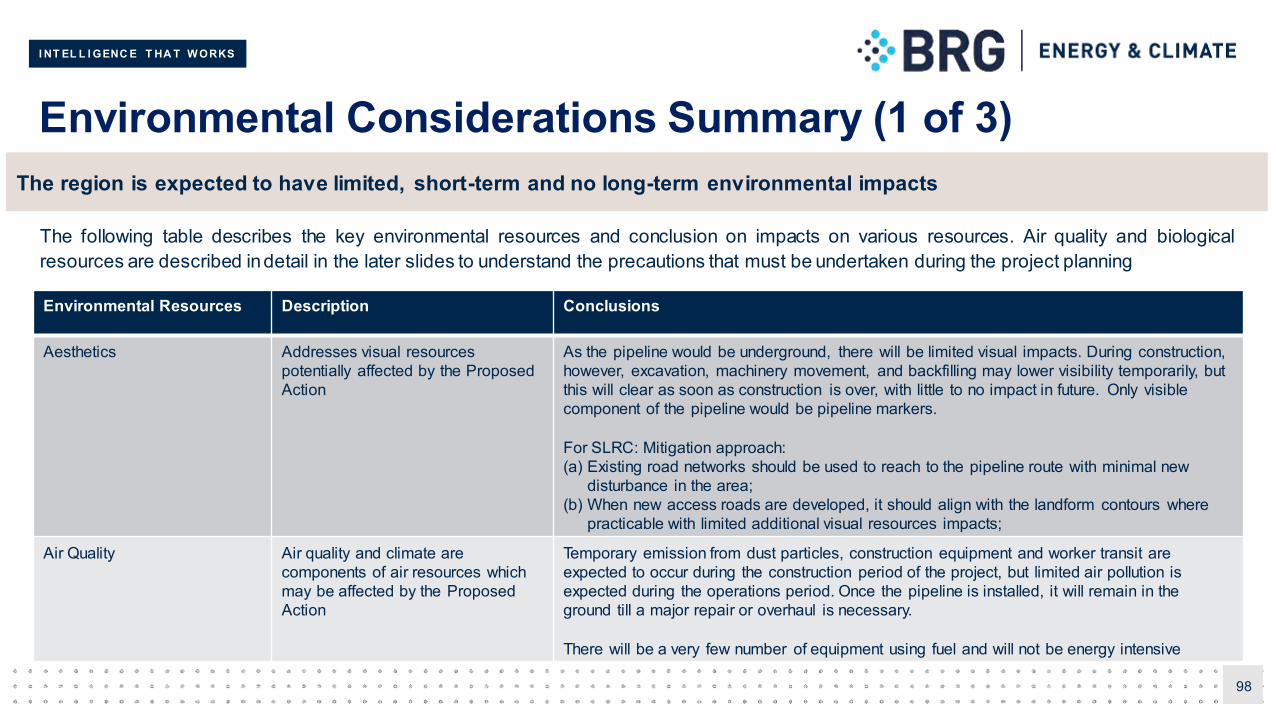
I NT EL L I GENC E T HA T W ORKS
Environmental Considerations Summary (1 of 3)
98
The following table describes the key environmental resources and conclusion on impacts on various resources. Air quality and biologicalresources are described indetail in the later slides to understand the precautions that must be undertaken during the project planning
The region is expected to have limited, short-term and no long-term environmental impacts
Environmental Resources Description Conclusions
Aesthetics Addresses visual resources potentially affected by the Proposed Action
As the pipeline would be underground, there will be limited visual impacts. During construction, however, excavation, machinery movement, and backfilling may lower visibility temporarily, but this will clear as soon as construction is over, with little to no impact in future. Only visible component of the pipeline would be pipeline markers.
For SLRC: Mitigation approach:(a) Existing road networks should be used to reach to the pipeline route with minimal new
disturbance in the area;(b) When new access roads are developed, it should align with the landform contours where
practicable with limited additional visual resources impacts;
Air Quality Air quality and climate are components of air resources which may be affected by the Proposed Action
Temporary emission from dust particles, construction equipment and worker transit are expected to occur during the construction period of the project, but limited air pollution is expected during the operations period. Once the pipeline is installed, it will remain in the ground till a major repair or overhaul is necessary.
There will be a very few number of equipment using fuel and will not be energy intensive
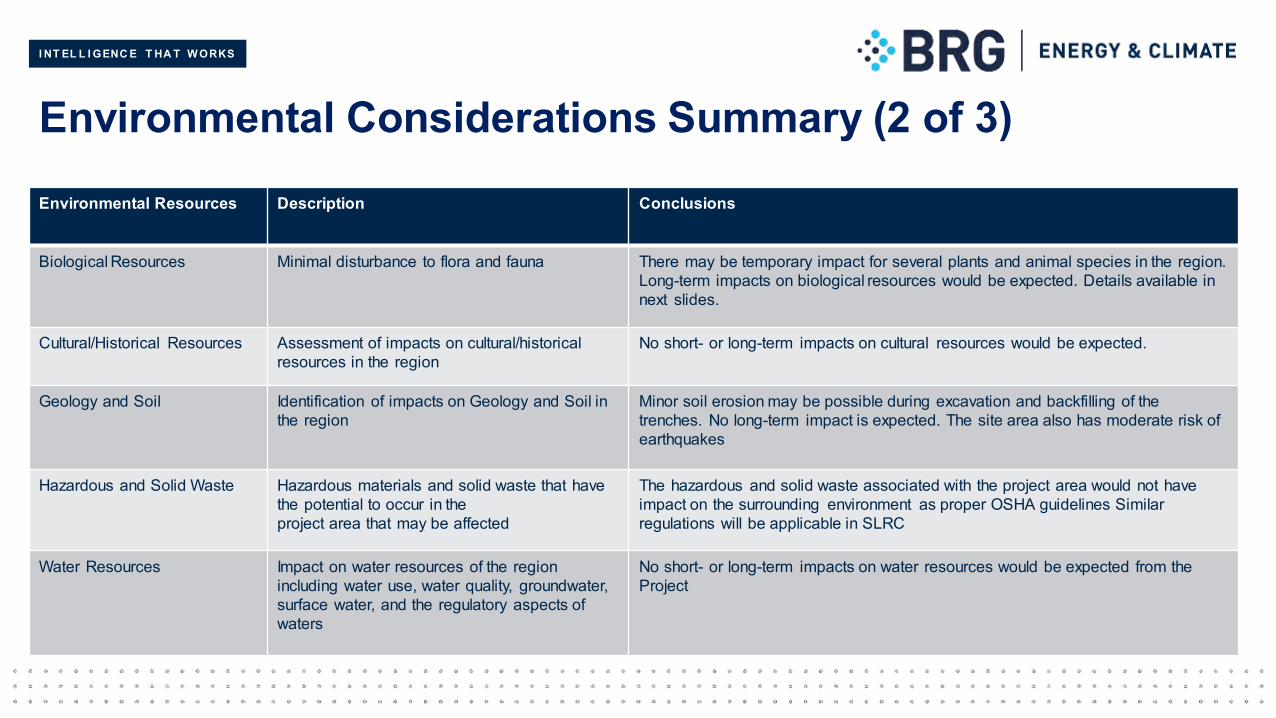
I NT EL L I GENC E T HA T W ORKS
Environmental Considerations Summary (2 of 3)Environmental Resources Description Conclusions
Biological Resources Minimal disturbance to flora and fauna There may be temporary impact for several plants and animal species in the region. Long-term impacts on biological resources would be expected. Details available in next slides.
Cultural/Historical Resources Assessment of impacts on cultural/historical resources in the region
No short- or long-term impacts on cultural resources would be expected.
Geology and Soil Identification of impacts on Geology and Soil in the region
Minor soil erosion may be possible during excavation and backfilling of the trenches. No long-term impact is expected. The site area also has moderate risk of earthquakes
Hazardous and Solid Waste Hazardous materials and solid waste that have the potential to occur in theproject area that may be affected
The hazardous and solid waste associated with the project area would not have impact on the surrounding environment as proper OSHA guidelines Similar regulations will be applicable in SLRC
Water Resources Impact on water resources of the region including water use, water quality, groundwater, surface water, and the regulatory aspects of waters
No short- or long-term impacts on water resources would be expected from the Project
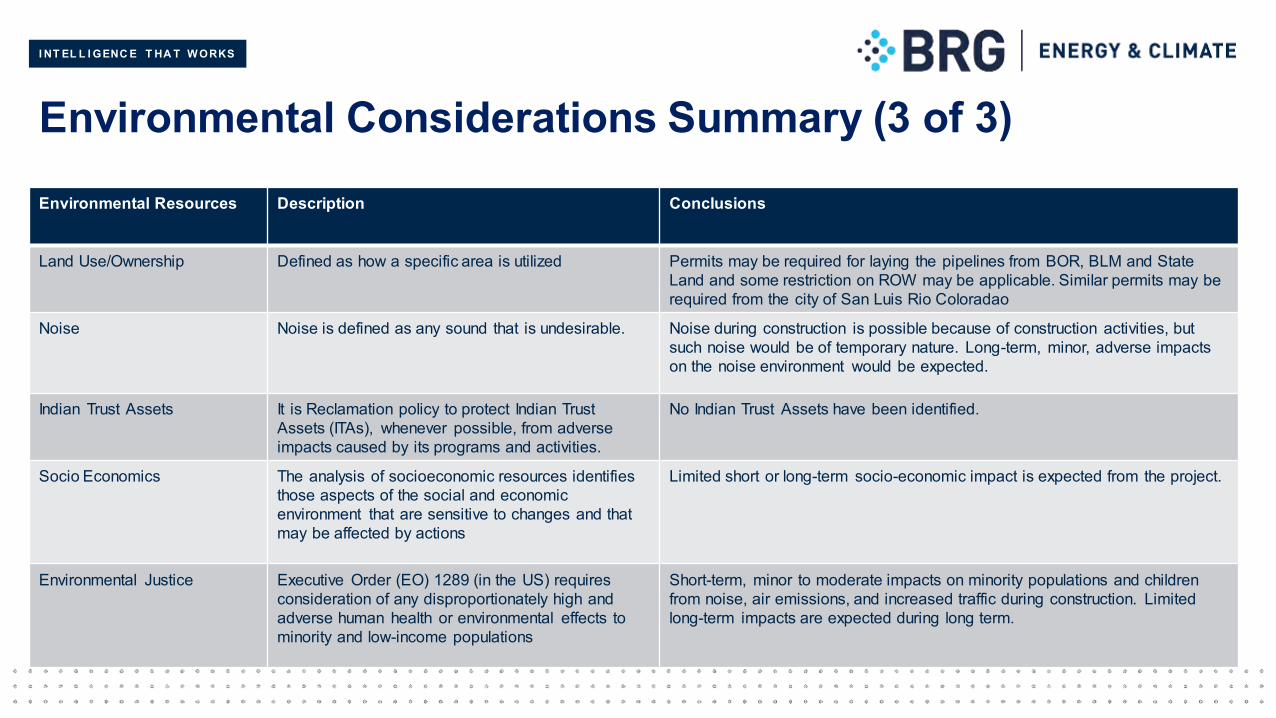
I NT EL L I GENC E T HA T W ORKS
Environmental Considerations Summary (3 of 3)Environmental Resources Description Conclusions
Land Use/Ownership Defined as how a specific area is utilized Permits may be required for laying the pipelines from BOR, BLM and State Land and some restriction on ROW may be applicable. Similar permits may be required from the city of San Luis Rio Coloradao
Noise Noise is defined as any sound that is undesirable. Noise during construction is possible because of construction activities, but such noise would be of temporary nature. Long-term, minor, adverse impacts on the noise environment would be expected.
Indian Trust Assets It is Reclamation policy to protect Indian Trust Assets (ITAs), whenever possible, from adverse impacts caused by its programs and activities.
No Indian Trust Assets have been identified.
Socio Economics The analysis of socioeconomic resources identifies those aspects of the social and economic environment that are sensitive to changes and that may be affected by actions
Limited short or long-term socio-economic impact is expected from the project.
Environmental Justice Executive Order (EO) 1289 (in the US) requires consideration of any disproportionately high and adverse human health or environmental effects to minority and low-income populations
Short-term, minor to moderate impacts on minority populations and children from noise, air emissions, and increased traffic during construction. Limited long-term impacts are expected during long term.
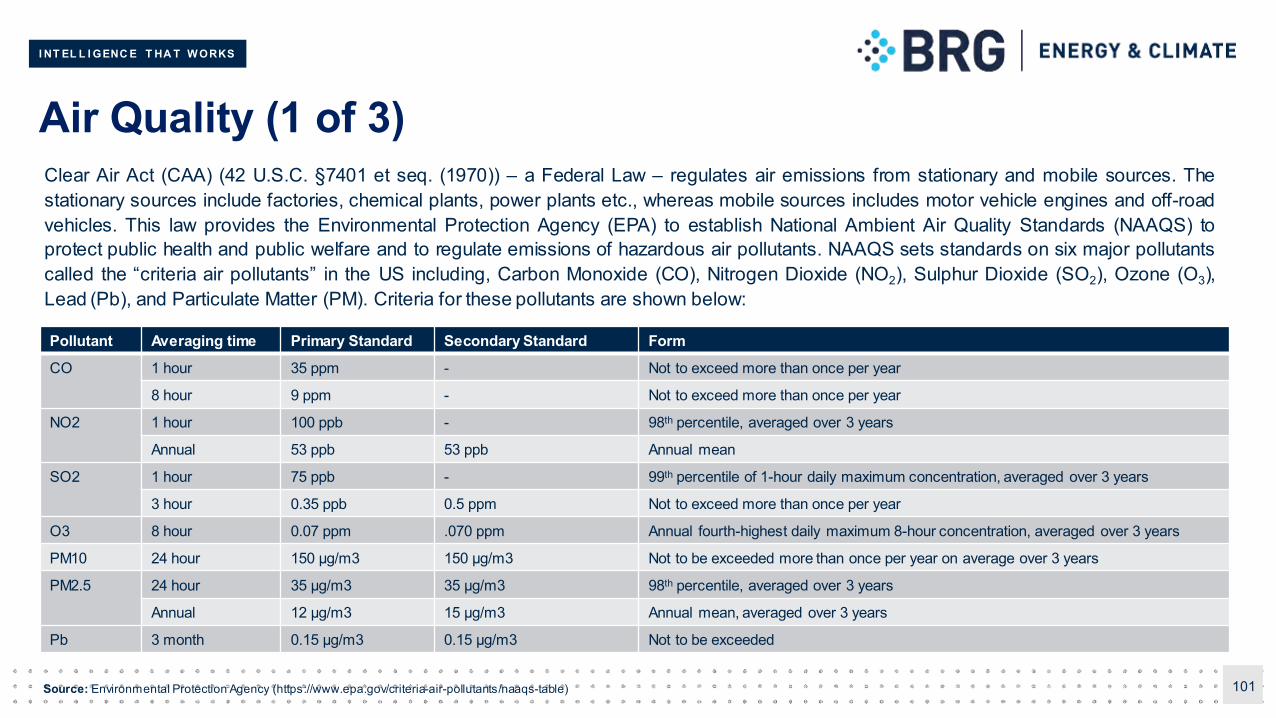
I NT EL L I GENC E T HA T W ORKS
Air Quality (1 of 3)
101
Clear Air Act (CAA) (42 U.S.C. §7401 et seq. (1970)) – a Federal Law – regulates air emissions from stationary and mobile sources. Thestationary sources include factories, chemical plants, power plants etc., whereas mobile sources includes motor vehicle engines and off-roadvehicles. This law provides the Environmental Protection Agency (EPA) to establish National Ambient Air Quality Standards (NAAQS) toprotect public health and public welfare and to regulate emissions of hazardous air pollutants. NAAQS sets standards on six major pollutantscalled the “criteria air pollutants” in the US including, Carbon Monoxide (CO), Nitrogen Dioxide (NO2), Sulphur Dioxide (SO2), Ozone (O3),Lead (Pb), and Particulate Matter (PM). Criteria for these pollutants are shown below:
Pollutant Averaging time Primary Standard Secondary Standard Form
CO 1 hour 35 ppm - Not to exceed more than once per year
8 hour 9 ppm - Not to exceed more than once per year
NO2 1 hour 100 ppb - 98th percentile, averaged over 3 years
Annual 53 ppb 53 ppb Annual mean
SO2 1 hour 75 ppb - 99th percentile of 1-hour daily maximum concentration, averaged over 3 years
3 hour 0.35 ppb 0.5 ppm Not to exceed more than once per year
O3 8 hour 0.07 ppm .070 ppm Annual fourth-highest daily maximum 8-hour concentration, averaged over 3 years
PM10 24 hour 150 µg/m3 150 µg/m3 Not to be exceeded more than once per year on average over 3 years
PM2.5 24 hour 35 µg/m3 35 µg/m3 98th percentile, averaged over 3 years
Annual 12 µg/m3 15 µg/m3 Annual mean, averaged over 3 years
Pb 3 month 0.15 µg/m3 0.15 µg/m3 Not to be exceeded
Source: Environmental Protection Agency (https://www.epa.gov/criteria-air-pollutants/naaqs-table)
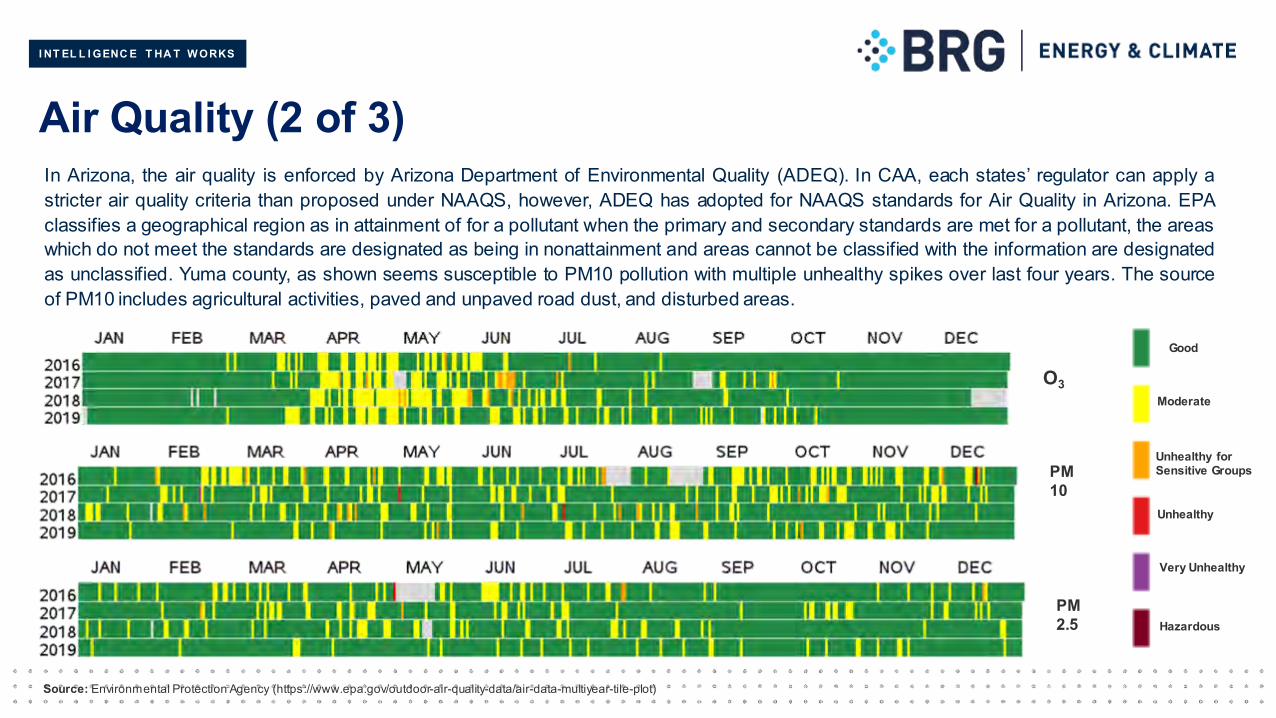
I NT EL L I GENC E T HA T W ORKS
Air Quality (2 of 3)In Arizona, the air quality is enforced by Arizona Department of Environmental Quality (ADEQ). In CAA, each states’ regulator can apply astricter air quality criteria than proposed under NAAQS, however, ADEQ has adopted for NAAQS standards for Air Quality in Arizona. EPAclassifies a geographical region as in attainment of for a pollutant when the primary and secondary standards are met for a pollutant, the areaswhich do not meet the standards are designated as being in nonattainment and areas cannot be classified with the information are designatedas unclassified. Yuma county, as shown seems susceptible to PM10 pollution with multiple unhealthy spikes over last four years. The sourceof PM10 includes agricultural activities, paved and unpaved road dust, and disturbed areas.
PM 2.5
PM 10
O3
Good
Moderate
Unhealthy for Sensitive Groups
Unhealthy
Very Unhealthy
Hazardous
Source: Environmental Protection Agency (https://www.epa.gov/outdoor-air-quality-data/air-data-multiyear-tile-plot)
I NT EL L I GENC E T HA T W ORKS
Air Quality (3 of 3)As clear from the previous charts, the pipelines have to laid in nonattainment area for PM10 and therefore project should be subject to GeneralConformity and emission thresholds for PM10 should be 100 tons/year. A summary of the applicable ADEQ, and Yuma County, fugitive dustrules, regulations, and ordinances with which the construction of pipeline must comply includes fugitive dust rules by ADEQ and Yuma countyOrdnance 05-01 (Requires project information signage for construction activities within the Yuma PM10 nonattainment area). We preliminarilyanticipate that:
(a) Most of the construction would be of short term in nature and should ensure the emission thresholds of PM10;
(b) There are no permanent sources of emissionand air permitting may not apply;
(c) Limited air quality impacts are anticipated; however, periodic review of EPA attainment status should be conducted for alignment with theenvironmental and air quality guidelines.
(d) Operations of underground pipelines is expected to have limited impacts on air quality;
The developers and contractors for the infrastructure development should develop an elaborate plan for negligible impact to air quality. Someof the mitigation measures may include limited speed of construction vehicles on dirt roads, proper maintenance of the equipment, coveringthe excavated earth and covered haul trucks.
I NT EL L I GENC E T HA T W ORKS
Biological Resources (1 of 3)The gas distribution pipelines pass along the roadways in the residential and commercial region and on the vicinity of large agricultural regionsand open desert in outer city region. In conducting the environmental review, we used Heritage Data Management System (HDMS) data fromArizona Game and Fish Department (AGFD)and gathered supporting information from several environmental reports conducted in the region.
The project area contains a low diversity and density of plants. Rolle Airfiled conducted an environmental review in 2016 and General ServicesAdministration conducted an environmental review in the region and confirms that creosote bush (Larrea tridentata) is widespread in theregion. Various desert trees such as white bursage (Ambrosia dumosa), Arizona honeysweet (Tidestromia oblongifolia), cryptantha(Cryptantha sp.), Schott’s wire lettuce (Stephanomeria schottii), whitestem milkweed (Asclepias albicans), Mediterranean grass (Schismussp.), etc. are mentioned in the Rolle Airfield report (closer to the pipeline route), which are not covered under Arizona Native Plant Law(ANPL). This is verified in the data gather from Heritage Data management System.
US Fish and Wildlife Service (USFWS) maintains a database of protected species that may occur in Yuma county. The species are currentlylisted or are proposed for listing as endangered or threatened under the Endangered Species Act (ESA). ESA prohibits harming any of theselisted species, but only provides protection for species listed1.
AGFD monitors the species of greatest conservation (SGCN) and are the vertebrates, crustaceans, and mollusks that rank high in thevulnerability category for immediate action. Each species was assessed in terms of vulnerability and assigned as either a Tier 1a, 1b, or 1cranking, with Tier 1a being the highest threat level.
Some bird species receive legal protection under the federal Migratory Bird Treaty Act. Some of the nesting habitat observed on AGFD’sHDMS was along the Colorado river further away from the project location. If an active Bird nest is observed during construction, measuresshould be taken to protect the nest to avoid violation of federal Migratory Bird Treaty Act (MBTA).
1USFWS list for Endangered Plants and Wildlife is provided in the Appendix
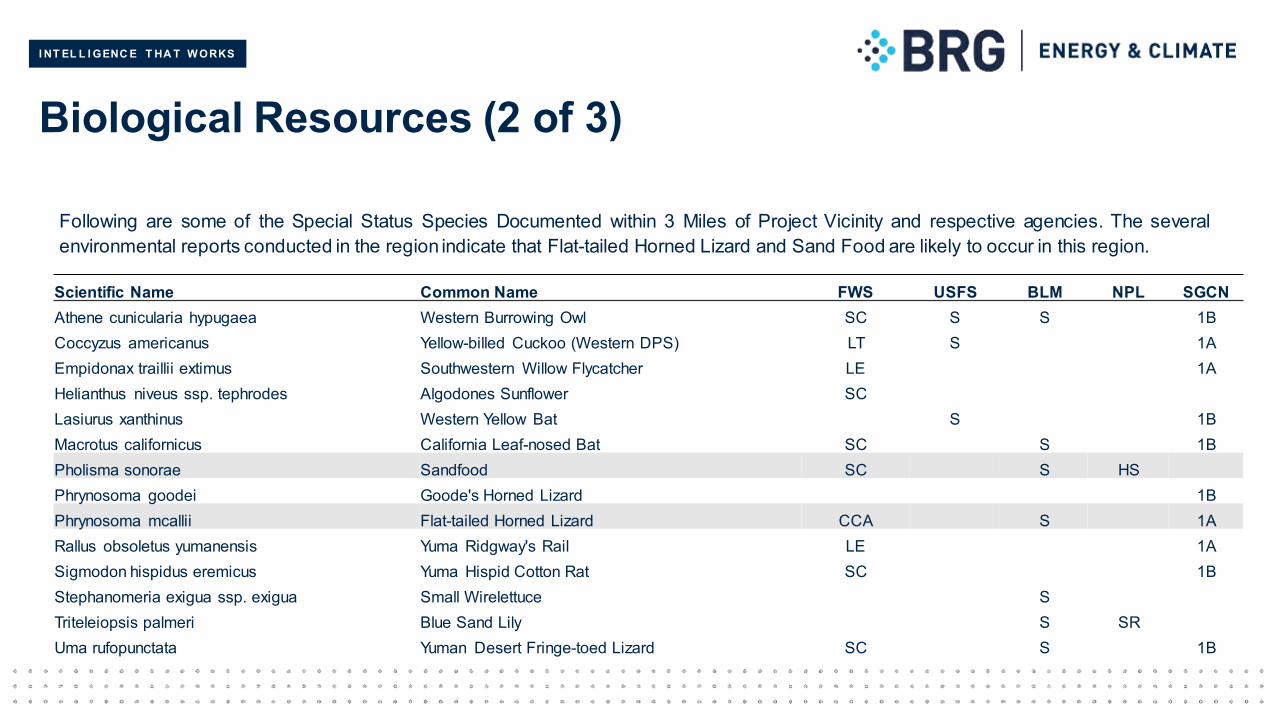
I NT EL L I GENC E T HA T W ORKS
Biological Resources (2 of 3)
Following are some of the Special Status Species Documented within 3 Miles of Project Vicinity and respective agencies. The severalenvironmental reports conducted in the region indicate that Flat-tailed Horned Lizard and Sand Food are likely to occur in this region.
Scientific Name Common Name FWS USFS BLM NPL SGCNAthene cunicularia hypugaea Western Burrowing Owl SC S S 1BCoccyzus americanus Yellow-billed Cuckoo (Western DPS) LT S 1AEmpidonax traillii extimus Southwestern Willow Flycatcher LE 1AHelianthus niveus ssp. tephrodes Algodones Sunflower SCLasiurus xanthinus Western Yellow Bat S 1BMacrotus californicus California Leaf-nosed Bat SC S 1BPholisma sonorae Sandfood SC S HSPhrynosoma goodei Goode's Horned Lizard 1BPhrynosoma mcallii Flat-tailed Horned Lizard CCA S 1ARallus obsoletus yumanensis Yuma Ridgway's Rail LE 1ASigmodon hispidus eremicus Yuma Hispid Cotton Rat SC 1BStephanomeria exigua ssp. exigua Small Wirelettuce STriteleiopsis palmeri Blue Sand Lily S SRUma rufopunctata Yuman Desert Fringe-toed Lizard SC S 1B
I NT EL L I GENC E T HA T W ORKS
Biological resources (3 of 3)
During the construction of the pipeline, the vegetation that are on the route of pipeline would be removed from the site, although the portionof this removal is expected to be low. However, no additional impact to the vegetation is expected during operations of the pipeline project.Project pipeline is expected to follow already disturbed land and should result in minimal incremental disturbance.
Due to construction related activities, there could be loss of habitat. However, as in the project region there already have been development(transmission pipelines, distribution pipelines, industrial zones, residential and commercial properties, etc.) the incremental loss is expectedto be low. As some of these wild species may come under the construction vehicles, it is recommended that construction vehicle speedshould be limited in the region to minimize such impacts.
Additionally, excavation of land could result in trapped wildlife in the trenches during construction. Consequently, appropriate precautionshould be taken including covered trench or escape ramps and trenches should be checked prior to work every day. Noise and vibrationmay also temporarily change the habitat pattern in the region.
With temporary nature of construction and limited disturbance during operations, it appears unlikely that there would be any long-term orpopulation level dangers for the species in the region.
The construction in the region should be prepared to mitigate any disturbance to Flat-tailed horned lizard in region and appropriate measureshould be planned from project initiation to completion.
I NT EL L I GENC E T HA T W ORKS
11 Conclusions and Recommendation
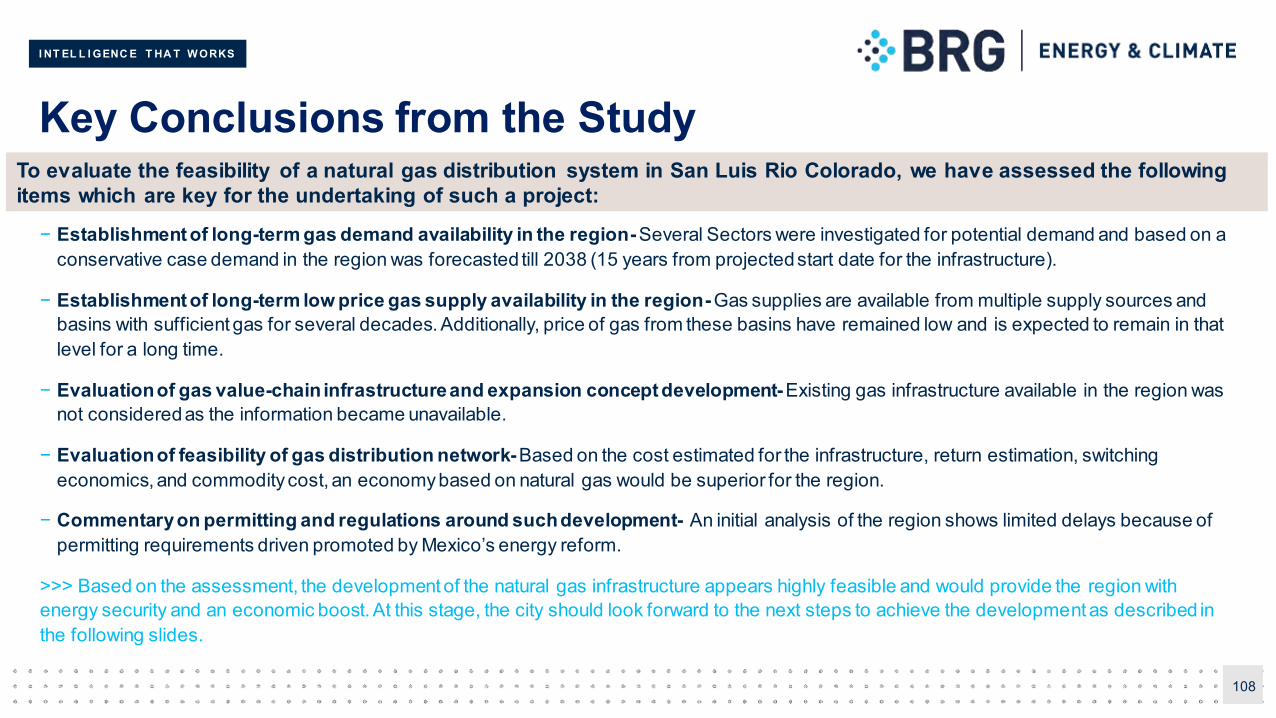
I NT EL L I GENC E T HA T W ORKS
Key Conclusions from the Study
108
− Establishment of long-term gas demand availability in the region- Several Sectors were investigated for potential demand and based on a conservative case demand in the region was forecasted till 2038 (15 years from projected start date for the infrastructure).
− Establishment of long-term low price gas supply availability in the region- Gas supplies are available from multiple supply sources and basins with sufficient gas for several decades. Additionally, price of gas from these basins have remained low and is expected to remain in that level for a long time.
− Evaluation of gas value-chain infrastructure and expansion concept development- Existing gas infrastructure available in the region was not considered as the information became unavailable.
− Evaluation of feasibility of gas distribution network- Based on the cost estimated for the infrastructure, return estimation, switching economics, and commodity cost, an economy based on natural gas would be superior for the region.
− Commentary on permitting and regulations around such development- An initial analysis of the region shows limited delays because of permitting requirements driven promoted by Mexico’s energy reform.
>>> Based on the assessment, the development of the natural gas infrastructure appears highly feasible and would provide the region with energy security and an economic boost. At this stage, the city should look forward to the next steps to achieve the development as described in the following slides.
To evaluate the feasibility of a natural gas distribution system in San Luis Rio Colorado, we have assessed the following items which are key for the undertaking of such a project:
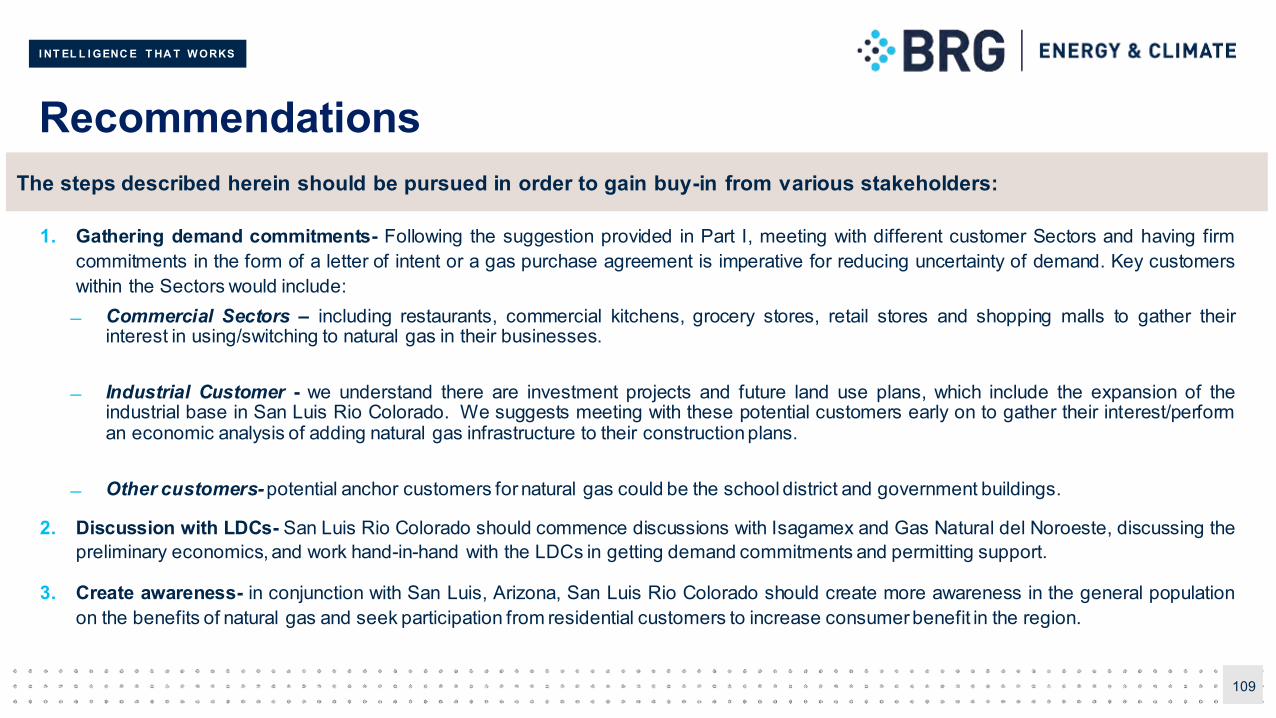
I NT EL L I GENC E T HA T W ORKS
Recommendations
109
1. Gathering demand commitments- Following the suggestion provided in Part I, meeting with different customer Sectors and having firmcommitments in the form of a letter of intent or a gas purchase agreement is imperative for reducing uncertainty of demand. Key customerswithin the Sectors would include: Commercial Sectors – including restaurants, commercial kitchens, grocery stores, retail stores and shopping malls to gather their
interest in using/switching to natural gas in their businesses.
Industrial Customer - we understand there are investment projects and future land use plans, which include the expansion of theindustrial base in San Luis Rio Colorado. We suggests meeting with these potential customers early on to gather their interest/performan economic analysis of adding natural gas infrastructure to their constructionplans.
Other customers- potential anchor customers for natural gas could be the school district and government buildings.
2. Discussion with LDCs- San Luis Rio Colorado should commence discussions with Isagamex and Gas Natural del Noroeste, discussing thepreliminary economics, and work hand-in-hand with the LDCs in getting demand commitments and permitting support.
3. Create awareness- in conjunction with San Luis, Arizona, San Luis Rio Colorado should create more awareness in the general populationon the benefits of natural gas and seek participation from residential customers to increase consumerbenefit in the region.
The steps described herein should be pursued in order to gain buy-in from various stakeholders:

I NT EL L I GENC E T HA T W ORKS
110
Thank you!
I NT EL L I GENC E T HA T W ORKS
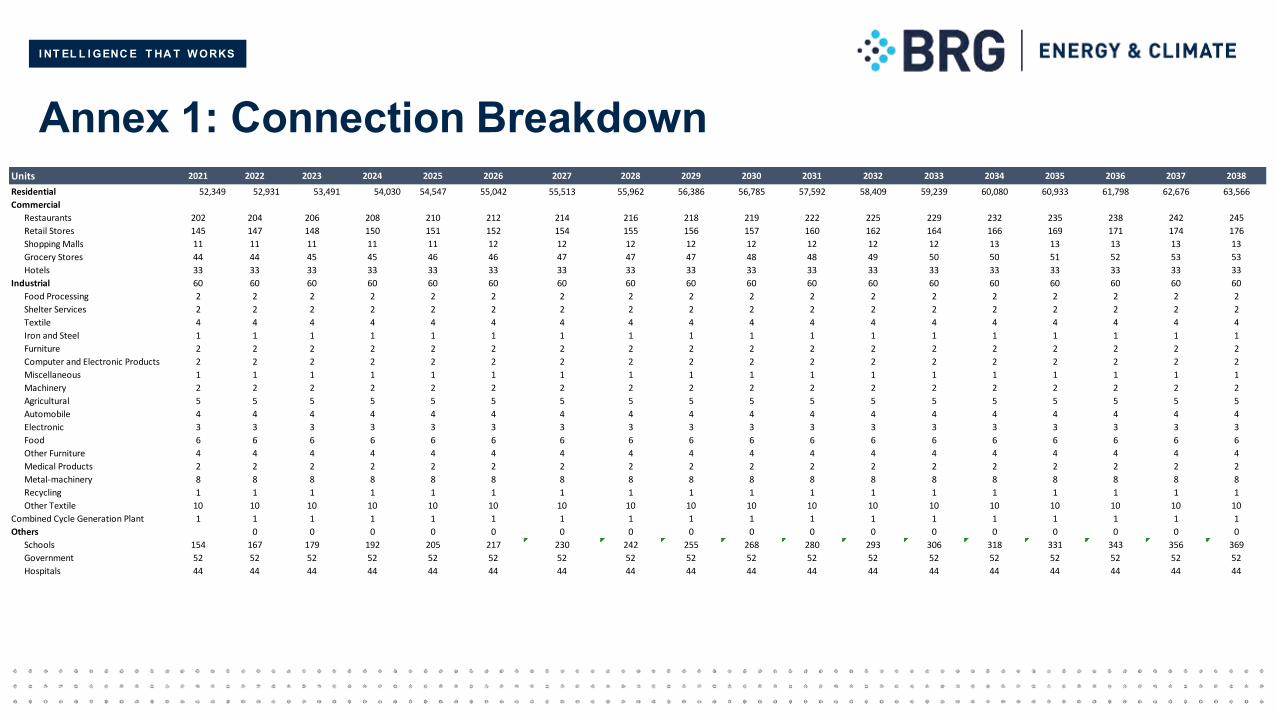
I NT EL L I GENC E T HA T W ORKS
Annex 1: Connection BreakdownUnits 2021 2022 2023 2024 2025 2026 2027 2028 2029 2030 2031 2032 2033 2034 2035 2036 2037 2038
Residential 52,349 52,931 53,491 54,030 54,547 55,042 55,513 55,962 56,386 56,785 57,592 58,409 59,239 60,080 60,933 61,798 62,676 63,566
Commercial
Restaurants 202 204 206 208 210 212 214 216 218 219 222 225 229 232 235 238 242 245
Retail Stores 145 147 148 150 151 152 154 155 156 157 160 162 164 166 169 171 174 176
Shopping Malls 11 11 11 11 11 12 12 12 12 12 12 12 12 13 13 13 13 13
Grocery Stores 44 44 45 45 46 46 47 47 47 48 48 49 50 50 51 52 53 53
Hotels 33 33 33 33 33 33 33 33 33 33 33 33 33 33 33 33 33 33
Industrial 60 60 60 60 60 60 60 60 60 60 60 60 60 60 60 60 60 60
Food Processing 2 2 2 2 2 2 2 2 2 2 2 2 2 2 2 2 2 2
Shelter Services 2 2 2 2 2 2 2 2 2 2 2 2 2 2 2 2 2 2
Textile 4 4 4 4 4 4 4 4 4 4 4 4 4 4 4 4 4 4
Iron and Steel 1 1 1 1 1 1 1 1 1 1 1 1 1 1 1 1 1 1
Furniture 2 2 2 2 2 2 2 2 2 2 2 2 2 2 2 2 2 2
Computer and Electronic Products 2 2 2 2 2 2 2 2 2 2 2 2 2 2 2 2 2 2
Miscellaneous 1 1 1 1 1 1 1 1 1 1 1 1 1 1 1 1 1 1
Machinery 2 2 2 2 2 2 2 2 2 2 2 2 2 2 2 2 2 2
Agricultural 5 5 5 5 5 5 5 5 5 5 5 5 5 5 5 5 5 5
Automobile 4 4 4 4 4 4 4 4 4 4 4 4 4 4 4 4 4 4
Electronic 3 3 3 3 3 3 3 3 3 3 3 3 3 3 3 3 3 3
Food 6 6 6 6 6 6 6 6 6 6 6 6 6 6 6 6 6 6
Other Furniture 4 4 4 4 4 4 4 4 4 4 4 4 4 4 4 4 4 4
Medical Products 2 2 2 2 2 2 2 2 2 2 2 2 2 2 2 2 2 2
Metal-machinery 8 8 8 8 8 8 8 8 8 8 8 8 8 8 8 8 8 8
Recycling 1 1 1 1 1 1 1 1 1 1 1 1 1 1 1 1 1 1
Other Textile 10 10 10 10 10 10 10 10 10 10 10 10 10 10 10 10 10 10
Combined Cycle Generation Plant 1 1 1 1 1 1 1 1 1 1 1 1 1 1 1 1 1 1
Others 0 0 0 0 0 0 0 0 0 0 0 0 0 0 0 0 0
Schools 154 167 179 192 205 217 230 242 255 268 280 293 306 318 331 343 356 369
Government 52 52 52 52 52 52 52 52 52 52 52 52 52 52 52 52 52 52
Hospitals 44 44 44 44 44 44 44 44 44 44 44 44 44 44 44 44 44 44
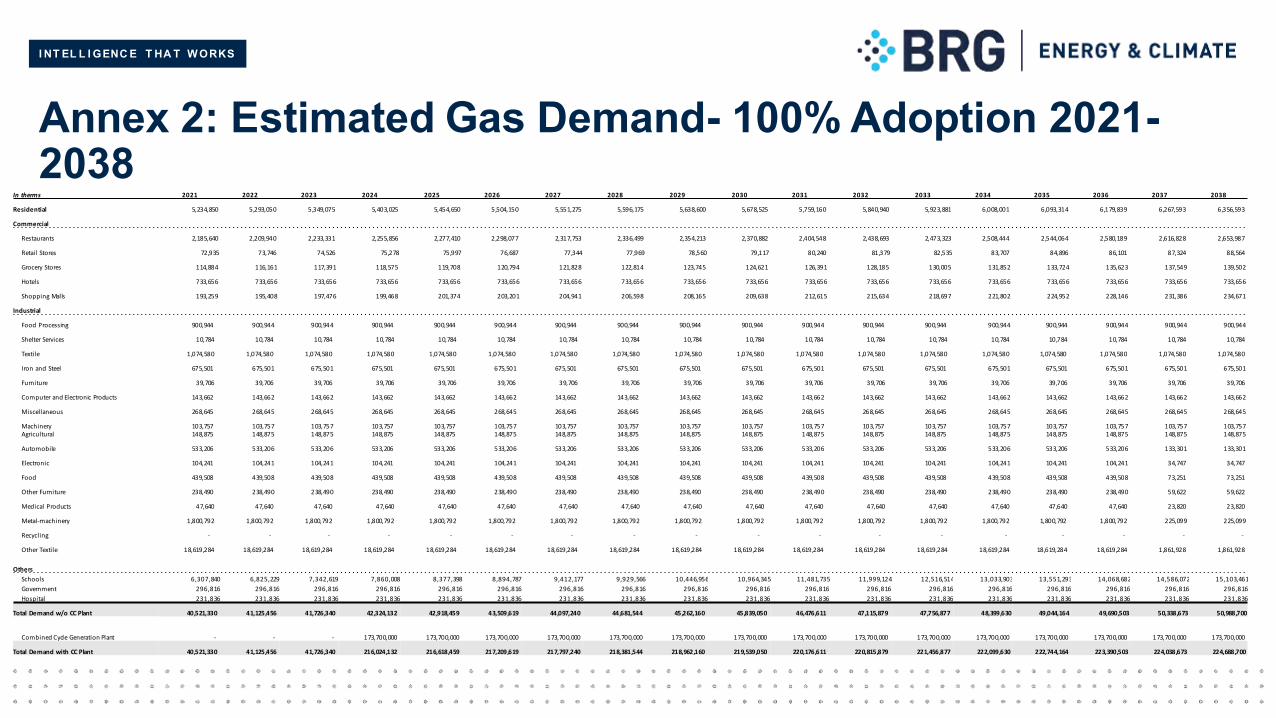
I NT EL L I GENC E T HA T W ORKS
Annex 2: Estimated Gas Demand- 100% Adoption 2021-2038
In therms 2021 2022 2023 2024 2025 2026 2027 2028 2029 2030 2031 2032 2033 2034 2035 2036 2037 2038
Residential 5,234,850 5,293,050 5,349,075 5,403,025 5,454,650 5,504,150 5,551,275 5,596,175 5,638,600 5,678,525 5,759,160 5,840,940 5,923,881 6,008,001 6,093,314 6,179,839 6,267,593 6,356,593
Commercial 3,300,374 3,328,910 3,356,380 3,382,832 3,408,145 3,432,415 3,455,521 3,477,537 3,498,338 3,517,914 3,557,450 3,597,548 3,638,215 3,679,460 3,721,291 3,763,715 3,806,742 3,850,380
Restaurants 2,185,640 2,209,940 2,233,331 2,255,856 2,277,410 2,298,077 2,317,753 2,336,499 2,354,213 2,370,882 2,404,548 2,438,693 2,473,323 2,508,444 2,544,064 2,580,189 2,616,828 2,653,987
Retail Stores 72,935 73,746 74,526 75,278 75,997 76,687 77,344 77,969 78,560 79,117 80,240 81,379 82,535 83,707 84,896 86,101 87,324 88,564
Grocery Stores 114,884 116,161 117,391 118,575 119,708 120,794 121,828 122,814 123,745 124,621 126,391 128,185 130,005 131,852 133,724 135,623 137,549 139,502
Hotels 733,656 733,656 733,656 733,656 733,656 733,656 733,656 733,656 733,656 733,656 733,656 733,656 733,656 733,656 733,656 733,656 733,656 733,656
Shopping Malls 193,259 195,408 197,476 199,468 201,374 203,201 204,941 206,598 208,165 209,638 212,615 215,634 218,697 221,802 224,952 228,146 231,386 234,671
Industrial 5,659,124 5,778,224 5,778,224 5,778,224 5,778,224 5,778,224 5,778,224 5,778,224 5,778,224 5,778,224 5,778,224 5,778,224 5,778,224 5,778,224 5,778,224 5,778,224 5,778,224 5,778,224
Food Processing 900,944 900,944 900,944 900,944 900,944 900,944 900,944 900,944 900,944 900,944 900,944 900,944 900,944 900,944 900,944 900,944 900,944 900,944
Shelter Services 10,784 10,784 10,784 10,784 10,784 10,784 10,784 10,784 10,784 10,784 10,784 10,784 10,784 10,784 10,784 10,784 10,784 10,784
Textile 1,074,580 1,074,580 1,074,580 1,074,580 1,074,580 1,074,580 1,074,580 1,074,580 1,074,580 1,074,580 1,074,580 1,074,580 1,074,580 1,074,580 1,074,580 1,074,580 1,074,580 1,074,580
Iron and Steel 675,501 675,501 675,501 675,501 675,501 675,501 675,501 675,501 675,501 675,501 675,501 675,501 675,501 675,501 675,501 675,501 675,501 675,501
Furniture 39,706 39,706 39,706 39,706 39,706 39,706 39,706 39,706 39,706 39,706 39,706 39,706 39,706 39,706 39,706 39,706 39,706 39,706
Computer and Electronic Products 143,662 143,662 143,662 143,662 143,662 143,662 143,662 143,662 143,662 143,662 143,662 143,662 143,662 143,662 143,662 143,662 143,662 143,662
Miscellaneous 268,645 268,645 268,645 268,645 268,645 268,645 268,645 268,645 268,645 268,645 268,645 268,645 268,645 268,645 268,645 268,645 268,645 268,645
Machinery 103,757 103,757 103,757 103,757 103,757 103,757 103,757 103,757 103,757 103,757 103,757 103,757 103,757 103,757 103,757 103,757 103,757 103,757 Agricultural 148,875 148,875 148,875 148,875 148,875 148,875 148,875 148,875 148,875 148,875 148,875 148,875 148,875 148,875 148,875 148,875 148,875 148,875
Automobile 533,206 533,206 533,206 533,206 533,206 533,206 533,206 533,206 533,206 533,206 533,206 533,206 533,206 533,206 533,206 533,206 133,301 133,301
Electronic 104,241 104,241 104,241 104,241 104,241 104,241 104,241 104,241 104,241 104,241 104,241 104,241 104,241 104,241 104,241 104,241 34,747 34,747
Food 439,508 439,508 439,508 439,508 439,508 439,508 439,508 439,508 439,508 439,508 439,508 439,508 439,508 439,508 439,508 439,508 73,251 73,251
Other Furniture 238,490 238,490 238,490 238,490 238,490 238,490 238,490 238,490 238,490 238,490 238,490 238,490 238,490 238,490 238,490 238,490 59,622 59,622
Medical Products 47,640 47,640 47,640 47,640 47,640 47,640 47,640 47,640 47,640 47,640 47,640 47,640 47,640 47,640 47,640 47,640 23,820 23,820
Metal-machinery 1,800,792 1,800,792 1,800,792 1,800,792 1,800,792 1,800,792 1,800,792 1,800,792 1,800,792 1,800,792 1,800,792 1,800,792 1,800,792 1,800,792 1,800,792 1,800,792 225,099 225,099
Recycling - - - - - - - - - - - - - - - - - -
Other Textile 18,619,284 18,619,284 18,619,284 18,619,284 18,619,284 18,619,284 18,619,284 18,619,284 18,619,284 18,619,284 18,619,284 18,619,284 18,619,284 18,619,284 18,619,284 18,619,284 1,861,928 1,861,928
Others 6,836,492 7,353,881 7,871,271 8,388,660 8,906,050 9,423,439 9,940,829 10,458,218 10,975,608 11,492,997 12,010,387 12,527,776 13,045,166 13,562,555 14,079,945 14,597,334 15,114,724 15,632,113
Schools 6,307,840 6,825,229 7,342,619 7,860,008 8,377,398 8,894,787 9,412,177 9,929,566 10,446,956 10,964,345 11,481,735 11,999,124 12,516,514 13,033,903 13,551,293 14,068,682 14,586,072 15,103,461
Government 296,816 296,816 296,816 296,816 296,816 296,816 296,816 296,816 296,816 296,816 296,816 296,816 296,816 296,816 296,816 296,816 296,816 296,816
Hospital 231,836 231,836 231,836 231,836 231,836 231,836 231,836 231,836 231,836 231,836 231,836 231,836 231,836 231,836 231,836 231,836 231,836 231,836
Total Demand w/o CC Plant 40,521,330 41,125,456 41,726,340 42,324,132 42,918,459 43,509,619 44,097,240 44,681,544 45,262,160 45,839,050 46,476,611 47,115,879 47,756,877 48,399,630 49,044,164 49,690,503 50,338,673 50,988,700
Combined Cycle Generation Plant - - - 173,700,000 173,700,000 173,700,000 173,700,000 173,700,000 173,700,000 173,700,000 173,700,000 173,700,000 173,700,000 173,700,000 173,700,000 173,700,000 173,700,000 173,700,000
Total Demand with CC Plant 40,521,330 41,125,456 41,726,340 216,024,132 216,618,459 217,209,619 217,797,240 218,381,544 218,962,160 219,539,050 220,176,611 220,815,879 221,456,877 222,099,630 222,744,164 223,390,503 224,038,673 224,688,700
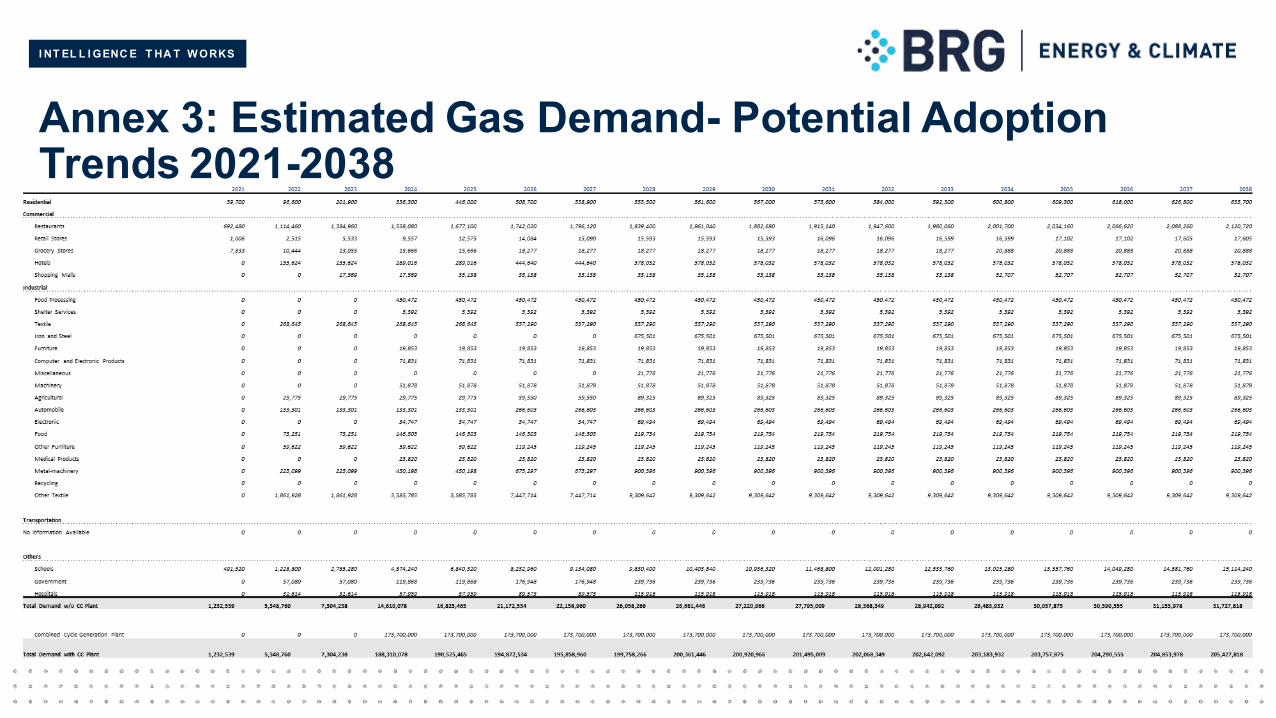
I NT EL L I GENC E T HA T W ORKS
Annex 3: Estimated Gas Demand- Potential Adoption Trends 2021-2038
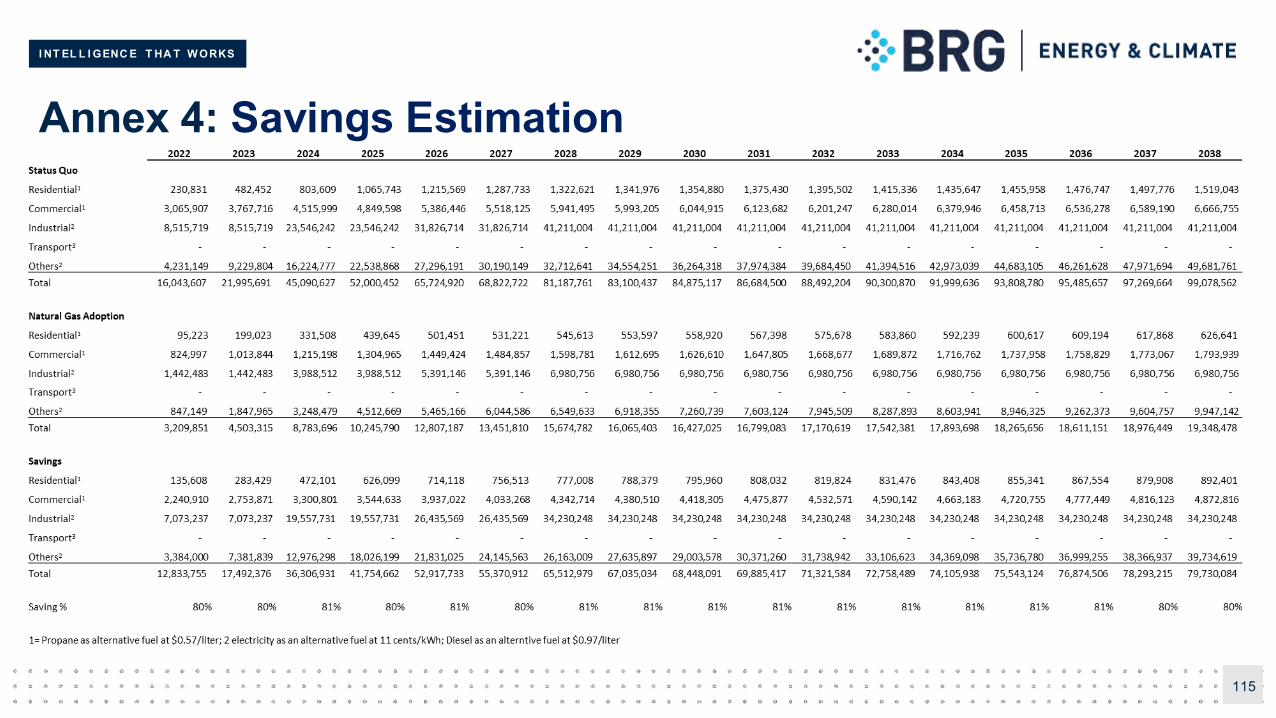
I NT EL L I GENC E T HA T W ORKS
Annex 4: Savings Estimation
115
Copyright © 2022 FDOKUMEN