Feasibility of equilibrium-controlled reactive distillation process: application of residue curve...
9
Feasibility of equilibrium-controlled reactive distillation process: application of residue curve mapping Cristhian Almeida-Rivera *, Johan Grievink Process Systems Engineering Group, DelftChemTech, Delft University of Technology, Julianalaan 136, 2628 BL Delft, Netherlands Abstract The residue curve mapping technique (RCM) has been considered a powerful tool for the flow-sheet development and preliminary design of conventional multi-component separation processes. It does not only represent a good approximation to actual equilibrium behavior, but also it allows performing feasibility analysis of separation processes where non-ideal and azeotropic mixtures are involved. Applications of RCM to reactive distillation processes have recently been reported, but a generalized and systematic approach is still missing for the case of reactive feeds outside the conventional composition ranges and represents the aim of this contribution. An RCM-based feasibility analysis has been applied to the homogeneous reactive distillation synthesis of methyl tert -butyl ether (MTBE) at 11 atm from isobutene (IB) and methanol (MeOH) and in the presence of n -Butane (n C 4 ). The reaction space, defined in terms of transformed composition variables, has been divided into sub-regions characterized by separation boundaries. A feasibility analysis of the reactive distillation process has been performed based upon the location of the reacting mixture, defined by [x MeOH F , x IB F , x n C 4 ] /[0, 1], and initial separation sequences have been generated according to the feed transformed-composition. In all the cases, high purity MTBE has been obtained. # 2003 Elsevier Ltd. All rights reserved. Keywords: Reactive distillation; Residue curve mapping (RCM); Feasibility analysis; Graphical methods; Methyl tert -butyl ether; Non-conventional feed compositions 1. Introduction The art of process design involves finding equipment sizes, configurations and operating conditions that will allow an economical operation, only by specifying the state of the feeds and the targets on the output streams of a system. As reported by Fien and Liu (1994), residue curve mapping (RCM) techniques may assist the design task of */particularly */non-ideal systems. Traditionally, non-reactive residue curves have been used to predict the liquid-composition trajectories in continuous distillation units in the / case (i.e. infinite number of stages and infinite reflux). Although for finite columns those profiles differ slightly compared with the residue curves under same isobaric conditions (Fien & Liu, 1994), this difference might be considered negligible at the first stages of design. Analytically, RCM’s are constructed based upon physical properties of the system (i.e. VL equilibrium, LL equilibrium and solubility data), wherein the composition of a non- reacting liquid remaining in the system may be deter- mined by performing an overall and component mate- rial balances in the system (Westerberg, Lee & Hauan, 2000)(Fig. 1), dL dt V ; (1) d (x i L) dt L x i dt x i dL dt y i V i [1; n]: (2) where: L is the mass of liquid in the system, V is the vapor flow, x i is the molar composition of component i in the liquid phase, y i is the molar composition of component i in the vapor phase and n is the number of components present in the system. Replacing expression (1) in expression (2) and intro- ducing a warped time (dt /dt × / V /L ) allow to rewrite the RCM expression as, * Corresponding author. Tel.: /31-15-278-4466; fax: /31-15-278- 4370; http://www.dct.tudelft.nl/pse. E-mail addresses: [email protected] (C. Almeida-Rivera), j.griev[email protected] (J. Grievink). Computers and Chemical Engineering 28 (2004) 17 /25 www.elsevier.com/locate/compchemeng 0098-1354/03/$ - see front matter # 2003 Elsevier Ltd. All rights reserved. doi:10.1016/S0098-1354(03)00168-6
-
Upload
independent -
Category
Documents
-
view
2 -
download
0
Transcript of Feasibility of equilibrium-controlled reactive distillation process: application of residue curve...
Computers and Chemical Engineering 28 (2004) 17�/25
www.elsevier.com/locate/compchemeng
Feasibility of equilibrium-controlled reactive distillation process:application of residue curve mapping
Cristhian Almeida-Rivera *, Johan Grievink
Process Systems Engineering Group, DelftChemTech, Delft University of Technology, Julianalaan 136, 2628 BL Delft, Netherlands
Abstract
The residue curve mapping technique (RCM) has been considered a powerful tool for the flow-sheet development and preliminary
design of conventional multi-component separation processes. It does not only represent a good approximation to actual
equilibrium behavior, but also it allows performing feasibility analysis of separation processes where non-ideal and azeotropic
mixtures are involved. Applications of RCM to reactive distillation processes have recently been reported, but a generalized and
systematic approach is still missing for the case of reactive feeds outside the conventional composition ranges and represents the aim
of this contribution. An RCM-based feasibility analysis has been applied to the homogeneous reactive distillation synthesis of
methyl tert -butyl ether (MTBE) at 11 atm from isobutene (IB) and methanol (MeOH) and in the presence of n -Butane (nC4). The
reaction space, defined in terms of transformed composition variables, has been divided into sub-regions characterized by separation
boundaries. A feasibility analysis of the reactive distillation process has been performed based upon the location of the reacting
mixture, defined by [xMeOHF , xIB
F , xn C4] � /[0, 1], and initial separation sequences have been generated according to the feed
transformed-composition. In all the cases, high purity MTBE has been obtained.
# 2003 Elsevier Ltd. All rights reserved.
Keywords: Reactive distillation; Residue curve mapping (RCM); Feasibility analysis; Graphical methods; Methyl tert -butyl ether; Non-conventional
feed compositions
1. Introduction
The art of process design involves finding equipment
sizes, configurations and operating conditions that will
allow an economical operation, only by specifying the
state of the feeds and the targets on the output streams
of a system. As reported by Fien and Liu (1994), residue
curve mapping (RCM) techniques may assist the design
task of*/particularly*/non-ideal systems.Traditionally, non-reactive residue curves have been
used to predict the liquid-composition trajectories in
continuous distillation units in the �/� case (i.e.
infinite number of stages and infinite reflux). Although
for finite columns those profiles differ slightly compared
with the residue curves under same isobaric conditions
(Fien & Liu, 1994), this difference might be considered
* Corresponding author. Tel.: �/31-15-278-4466; fax: �/31-15-278-
4370; http://www.dct.tudelft.nl/pse.
E-mail addresses: [email protected] (C. Almeida-Rivera),
[email protected] (J. Grievink).
0098-1354/03/$ - see front matter # 2003 Elsevier Ltd. All rights reserved.
doi:10.1016/S0098-1354(03)00168-6
negligible at the first stages of design. Analytically,
RCM’s are constructed based upon physical properties
of the system (i.e. VL equilibrium, LL equilibrium andsolubility data), wherein the composition of a non-
reacting liquid remaining in the system may be deter-
mined by performing an overall and component mate-
rial balances in the system (Westerberg, Lee & Hauan,
2000) (Fig. 1),
dL
dt��V ; (1)
d(xiL)
dt�L
xi
dt�xi
dL
dt��yiV i � [1; n]: (2)
where: L is the mass of liquid in the system, V is the
vapor flow, xi is the molar composition of component i
in the liquid phase, yi is the molar composition of
component i in the vapor phase and n is the number of
components present in the system.Replacing expression (1) in expression (2) and intro-
ducing a warped time (dt�/dt �/ V /L ) allow to rewrite
the RCM expression as,
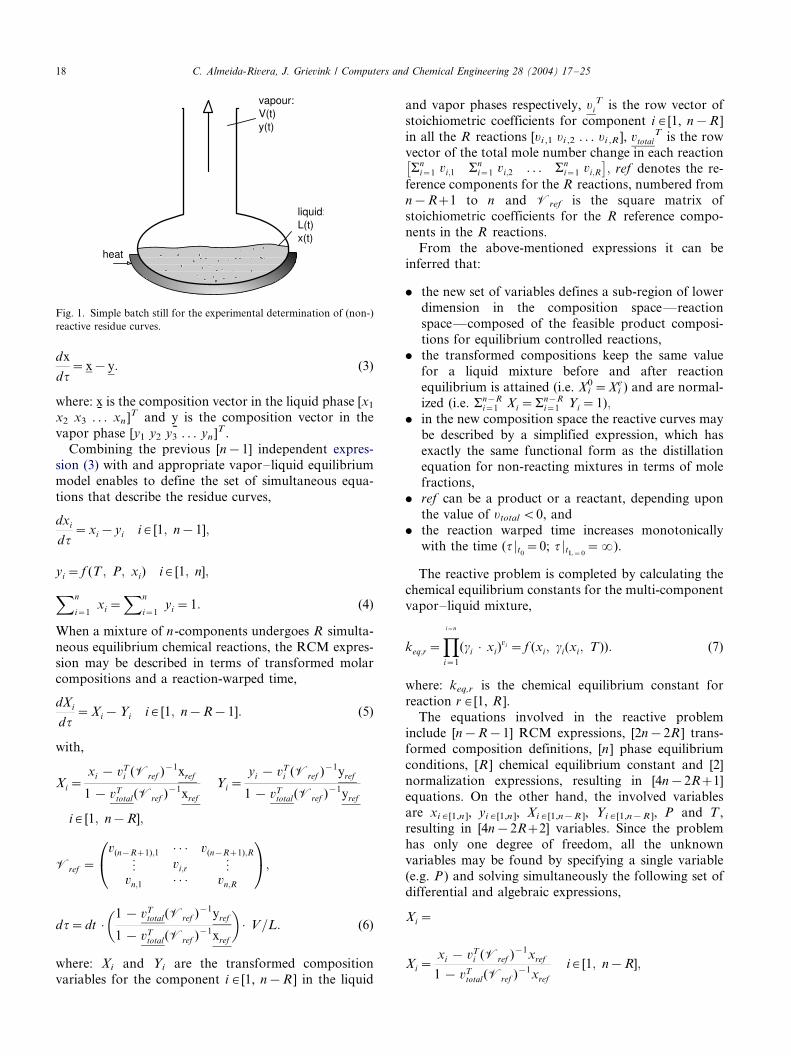
Fig. 1. Simple batch still for the experimental determination of (non-)
reactive residue curves.
C. Almeida-Rivera, J. Grievink / Computers and Chemical Engineering 28 (2004) 17�/2518
dx
dt�x�y: (3)
where: x¯
is the composition vector in the liquid phase [x1
x2 x3 . . . xn ]T and y¯
is the composition vector in the
vapor phase [y1 y2 y3 . . . yn ]T .
Combining the previous [n�/1] independent expres-
sion (3) with and appropriate vapor�/liquid equilibrium
model enables to define the set of simultaneous equa-
tions that describe the residue curves,
dxi
dt�xi�yi i � [1; n�1];
yi� f (T ; P; xi) i � [1; n];
Xn
i�1xi�
Xn
i�1yi �1: (4)
When a mixture of n-components undergoes R simulta-
neous equilibrium chemical reactions, the RCM expres-
sion may be described in terms of transformed molarcompositions and a reaction-warped time,
dXi
dt�Xi�Yi i � [1; n�R�1]: (5)
with,
Xi�xi � vT
i (Vref )�1xref
1 � vTtotal(Vref )�1xref
Yi�yi � vT
i (Vref )�1yref
1 � vTtotal(Vref )�1yref
i � [1; n�R];
Vref �v(n�R�1);1 � � � v(n�R�1);R
n vi;r nvn;1 � � � vn;R
0@
1A;
dt�dt ��1 � vT
total(Vref )�1yref
1 � vTtotal(Vref )�1xref
�� V=L: (6)
where: Xi and Yi are the transformed composition
variables for the component i � /[1, n�/R ] in the liquid
and vapor phases respectively, yi/T is the row vector of
stoichiometric coefficients for component i � /[1, n�/R ]
in all the R reactions [yi ,1 yi ,2 . . . yi ,R ], vtotal/T is the row
vector of the total mole number change in each reactionan
i�1 vi;1 ani�1 vi;2 . . . an
i�1 vi;R
� ; ref denotes the re-
ference components for the R reactions, numbered from
n�/R�/1 to n and Vref is the square matrix ofstoichiometric coefficients for the R reference compo-
nents in the R reactions.
From the above-mentioned expressions it can be
inferred that:
. the new set of variables defines a sub-region of lower
dimension in the composition space*/reaction
space*/composed of the feasible product composi-tions for equilibrium controlled reactions,
. the transformed compositions keep the same value
for a liquid mixture before and after reaction
equilibrium is attained (i.e. Xi0�/Xi
e) and are normal-
ized (i.e. an�Ri�1 Xi �an�R
i�1 Yi �1);/. in the new composition space the reactive curves may
be described by a simplified expression, which has
exactly the same functional form as the distillationequation for non-reacting mixtures in terms of mole
fractions,
. ref can be a product or a reactant, depending upon
the value of ytotal B/0, and
. the reaction warped time increases monotonically
with the time (t jt0�/0; t jtL�0
�/�).
The reactive problem is completed by calculating the
chemical equilibrium constants for the multi-component
vapor�/liquid mixture,
keq;r�Yi�n
i�1
(gi � xi)vi �f (xi; gi(xi; T)): (7)
where: keq,r is the chemical equilibrium constant for
reaction r � /[1, R ].
The equations involved in the reactive problem
include [n�/R�/1] RCM expressions, [2n�/2R ] trans-
formed composition definitions, [n ] phase equilibrium
conditions, [R ] chemical equilibrium constant and [2]
normalization expressions, resulting in [4n�/2R�/1]
equations. On the other hand, the involved variablesare xi � [1,n ], yi � [1,n ], Xi � [1,n�R ], Yi � [1,n�R ], P and T ,
resulting in [4n�/2R�/2] variables. Since the problem
has only one degree of freedom, all the unknown
variables may be found by specifying a single variable
(e.g. P ) and solving simultaneously the following set of
differential and algebraic expressions,
Xi�
Xi�xi � vT
i (Vref )�1xref
1 � vTtotal(Vref )�1xref
i � [1; n�R];
C. Almeida-Rivera, J. Grievink / Computers and Chemical Engineering 28 (2004) 17�/25 19
Yi�yi � vT
i (Vref )�1yref
1 � vTtotal(Vref )�1yref
i � [1; n�R];
yi� f (T ; P; xi) i � [1; n];
keq;r�Yi�n
i�1(gi � xi)
vi r � [1; R]: (8)
2. Feasibility analysis: distillation-based approach
Residue curve maps provide a powerful tool to
represent relevant properties of the system, particularly
those aiming to predict feasible design sequences. In
addition, analytical material balances may be repre-
sented in a RCM, resulting in constraints to feasible
product compositions and convenient operating strate-
gies (e.g. direct or indirect distillation).
The presence of (reactive) singular points (i.e. purecomponents and azeotropes) in RCM’s allows to divide
the (transformed) composition diagram into separate
(reactive) distillation regions by introducing (reactive)
distillation separatrices, which connect two singular
points in the composition space. If a separatrice ends
at a saddle point, it is commonly referred to as boundary
curve. Crossing distillation boundaries has been exten-
sively reported for industrial cases and especially forthose with curved distillation boundaries. For those
systems, the boundaries can be crossed by simple recycle
methods provided an appropriate entrainer. However,
conventional design strategies require that the feed and
products remain in the same distillation region (Fien &
Liu, 1994).
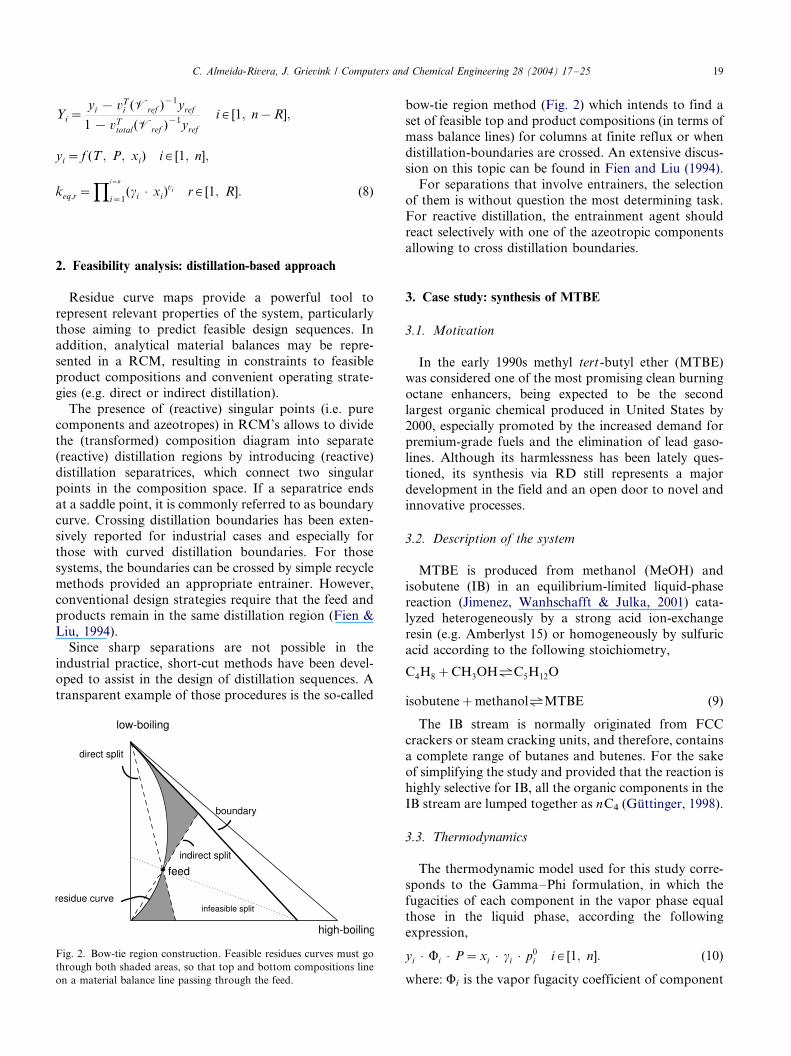
Since sharp separations are not possible in the
industrial practice, short-cut methods have been devel-oped to assist in the design of distillation sequences. A
transparent example of those procedures is the so-called
Fig. 2. Bow-tie region construction. Feasible residues curves must go
through both shaded areas, so that top and bottom compositions line
on a material balance line passing through the feed.
bow-tie region method (Fig. 2) which intends to find a
set of feasible top and product compositions (in terms of
mass balance lines) for columns at finite reflux or when
distillation-boundaries are crossed. An extensive discus-sion on this topic can be found in Fien and Liu (1994).
For separations that involve entrainers, the selection
of them is without question the most determining task.
For reactive distillation, the entrainment agent should
react selectively with one of the azeotropic components
allowing to cross distillation boundaries.
3. Case study: synthesis of MTBE
3.1. Motivation
In the early 1990s methyl tert-butyl ether (MTBE)was considered one of the most promising clean burning
octane enhancers, being expected to be the second
largest organic chemical produced in United States by
2000, especially promoted by the increased demand for
premium-grade fuels and the elimination of lead gaso-
lines. Although its harmlessness has been lately ques-
tioned, its synthesis via RD still represents a major
development in the field and an open door to novel andinnovative processes.
3.2. Description of the system
MTBE is produced from methanol (MeOH) and
isobutene (IB) in an equilibrium-limited liquid-phasereaction (Jimenez, Wanhschafft & Julka, 2001) cata-
lyzed heterogeneously by a strong acid ion-exchange
resin (e.g. Amberlyst 15) or homogeneously by sulfuric
acid according to the following stoichiometry,
C4H8�CH3OHXC5H12O
isobutene�methanolXMTBE (9)
The IB stream is normally originated from FCC
crackers or steam cracking units, and therefore, contains
a complete range of butanes and butenes. For the sake
of simplifying the study and provided that the reaction is
highly selective for IB, all the organic components in the
IB stream are lumped together as nC4 (Guttinger, 1998).
3.3. Thermodynamics
The thermodynamic model used for this study corre-
sponds to the Gamma�/Phi formulation, in which the
fugacities of each component in the vapor phase equal
those in the liquid phase, according the following
expression,
yi � Fi � P�xi � gi � p0i i � [1; n]: (10)
where: Fi is the vapor fugacity coefficient of component

Table 1
Wilson interaction parameters for the system IB�/MeOH�/nC4 at 11
atm (Ung & Doherty, 1995; Guttinger, 1998
Component IB Methanol MTBE n C4
aij (�/)
IB 0.00000 �/0.74200 0.24130 0.00000
Methanol 0.74200 0.00000 0.98330 0.81492
MTBE �/0.2413 �/0.98330 0.0000 0.00000
n C4 0.00000 �/0.81492 0.00000 0.00000
bij (K )
IB 0.0000 �/85.5447 30.2477 0.0000
Methanol �/1296.719 0.0000 �/746.3971 �/1149.280
MTBE �/136.6574 204.5029 0.0000 0.0000
n C4 0.0000 �/192.4019 0.0000 0.0000
Table 2
Antoine’s coefficients for the pure components IB, methanol, MTBE
and n C4 (Guttinger, 1998)
Component Ai (�/) Bi (K) Ci (K)
IB 20.65556 �/2125.74886 �/33.16000
Methanol 23.49989 �/3643.31362 �/33.43400
MTBE 20.71616 �/2571.58460 �/48.40600
n C4 20.57070 �/2154.89730 �/34.42000
Table 3
Parameters for the chemical equilibrium constant for the MTBE
synthesis (Guttinger, 1998)
Parameter
a (�/) �/10.0982
b (K) 4254.0500
d (�/) 0.2667
C. Almeida-Rivera, J. Grievink / Computers and Chemical Engineering 28 (2004) 17�/2520
i , gi is the liquid activity coefficient of component i and
pi0 is the vapor pressure of component i .
In this study, the vapor phase has been assumed to
behave ideally (Fi �/1), whereas for the liquid phaseWilson activity coefficient equation has been used due to
its accuracy for modeling multicomponent mixtures that
do not form two liquids (Kooijman & Taylor, 2000).
The model adopts the following form,
ln(Lij)�aij�bij=T i; j � [1; n];
Si �Xj�n
j�1xj � Lij i; j � [1; n];
ln(gi)�1� ln(Si)�Xk�n
k�1
xk � Lki
Sk
i � [1; n]: (11)
where: Lij is the binary interaction parameter for the
pair i�/j and aij and bij are model parameters.
Pure component vapor pressures are expressed as a
function of absolute temperature by means of Antoine’s
equation,
ln(p0i )�Ai�Bi=(T�Ci) i � [1; n]: (12)
where: Ai , Bi and Ci are model parameters of compo-
nent i .
3.4. Reaction equilibrium
The reaction equilibrium and kinetics of MTBE
synthesis have been subject of intensive research during
the last decade (Colombo, Cori, Dalioro & Delogu,
1983; Rehfinger & Hoffmann, 1990; Zhang & Datta,1995; Izquierdo, Cunill, Vila, Tejero & Iborra, 1992).
Without loosing generality, the chemical equilibrium
constant may be expressed as an algebraic function of
temperature,
ln(keq)�a�b=T�d � ln(T)�o � T�h � T2: (13)
where: a , b , d , o and h are experimental constants for
the particular synthesis reaction.
3.5. Simulation data
The thermodynamic and kinetic parameters listed in
Ung and Doherty (1995) and Guttinger (1998) have
been used in this study, after being corrected to the
system pressure of 11 atm (Tables 1�/3).
3.6. Simulation problem
The simulation problem encompasses the solution of
the RCM expressions for two cases: non-reactive and
reactive mixture of IB�/MeOH�/MTBE�/nC4 system.According to the degree of freedom analysis of the
previous sections, only the total pressure has been
specified (P�/11 atm). The criterion for choosing this
value is determined by the solubility of IB in the liquid
phase and enables to carry out the reaction to a
desirable extent (Zhang & Datta, 1995).
In this study GPROMS programming software (Process
Systems Enterprise Ltd.) has been used to solve the set
of simultaneous differential and non-linear expressions.
The solving algorithm is composed of an DAE inte-
grator based on variable step-size/variable order back-
ward differentiation formulae. Initial molar
compositions in the non-reactive case and transformed
variables in the reactive case have been specified to
generate the residue lines, aiming*/by visual in-
spection*/to cover completely the composition space.
The simulations have been performed until singular
solutions have been found, which correspond to pure
component or (non-) reactive azeotropes (i.e. x¯�/y
¯and
X�/Y).
¯ ¯
C. Almeida-Rivera, J. Grievink / Computers and Chemical Engineering 28 (2004) 17�/25 21
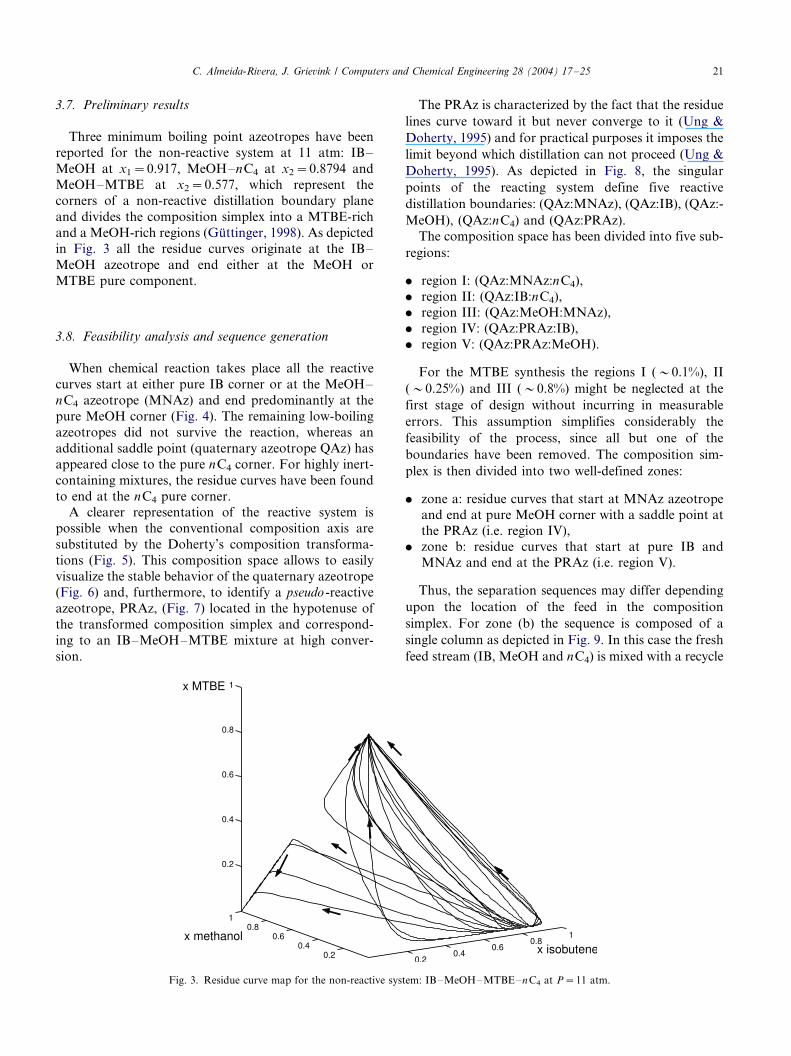
3.7. Preliminary results
Three minimum boiling point azeotropes have been
reported for the non-reactive system at 11 atm: IB�/
MeOH at x1�/0.917, MeOH�/nC4 at x2�/0.8794 and
MeOH�/MTBE at x2�/0.577, which represent the
corners of a non-reactive distillation boundary plane
and divides the composition simplex into a MTBE-rich
and a MeOH-rich regions (Guttinger, 1998). As depicted
in Fig. 3 all the residue curves originate at the IB�/
MeOH azeotrope and end either at the MeOH or
MTBE pure component.
3.8. Feasibility analysis and sequence generation
When chemical reaction takes place all the reactive
curves start at either pure IB corner or at the MeOH�/
nC4 azeotrope (MNAz) and end predominantly at the
pure MeOH corner (Fig. 4). The remaining low-boiling
azeotropes did not survive the reaction, whereas an
additional saddle point (quaternary azeotrope QAz) has
appeared close to the pure nC4 corner. For highly inert-
containing mixtures, the residue curves have been found
to end at the nC4 pure corner.
A clearer representation of the reactive system is
possible when the conventional composition axis are
substituted by the Doherty’s composition transforma-
tions (Fig. 5). This composition space allows to easily
visualize the stable behavior of the quaternary azeotrope
(Fig. 6) and, furthermore, to identify a pseudo -reactive
azeotrope, PRAz, (Fig. 7) located in the hypotenuse of
the transformed composition simplex and correspond-
ing to an IB�/MeOH�/MTBE mixture at high conver-
sion.
Fig. 3. Residue curve map for the non-reactive sys
The PRAz is characterized by the fact that the residue
lines curve toward it but never converge to it (Ung &
Doherty, 1995) and for practical purposes it imposes the
limit beyond which distillation can not proceed (Ung &
Doherty, 1995). As depicted in Fig. 8, the singular
points of the reacting system define five reactive
distillation boundaries: (QAz:MNAz), (QAz:IB), (QAz:-
MeOH), (QAz:nC4) and (QAz:PRAz).
The composition space has been divided into five sub-
regions:
. region I: (QAz:MNAz:nC4),
. region II: (QAz:IB:nC4),
. region III: (QAz:MeOH:MNAz),
. region IV: (QAz:PRAz:IB),
. region V: (QAz:PRAz:MeOH).
For the MTBE synthesis the regions I (�/0.1%), II
(�/0.25%) and III (�/0.8%) might be neglected at the
first stage of design without incurring in measurable
errors. This assumption simplifies considerably the
feasibility of the process, since all but one of the
boundaries have been removed. The composition sim-
plex is then divided into two well-defined zones:
. zone a: residue curves that start at MNAz azeotrope
and end at pure MeOH corner with a saddle point at
the PRAz (i.e. region IV),
. zone b: residue curves that start at pure IB and
MNAz and end at the PRAz (i.e. region V).
Thus, the separation sequences may differ depending
upon the location of the feed in the composition
simplex. For zone (b) the sequence is composed of a
single column as depicted in Fig. 9. In this case the fresh
feed stream (IB, MeOH and nC4) is mixed with a recycle
tem: IB�/MeOH�/MTBE�/n C4 at P�/11 atm.
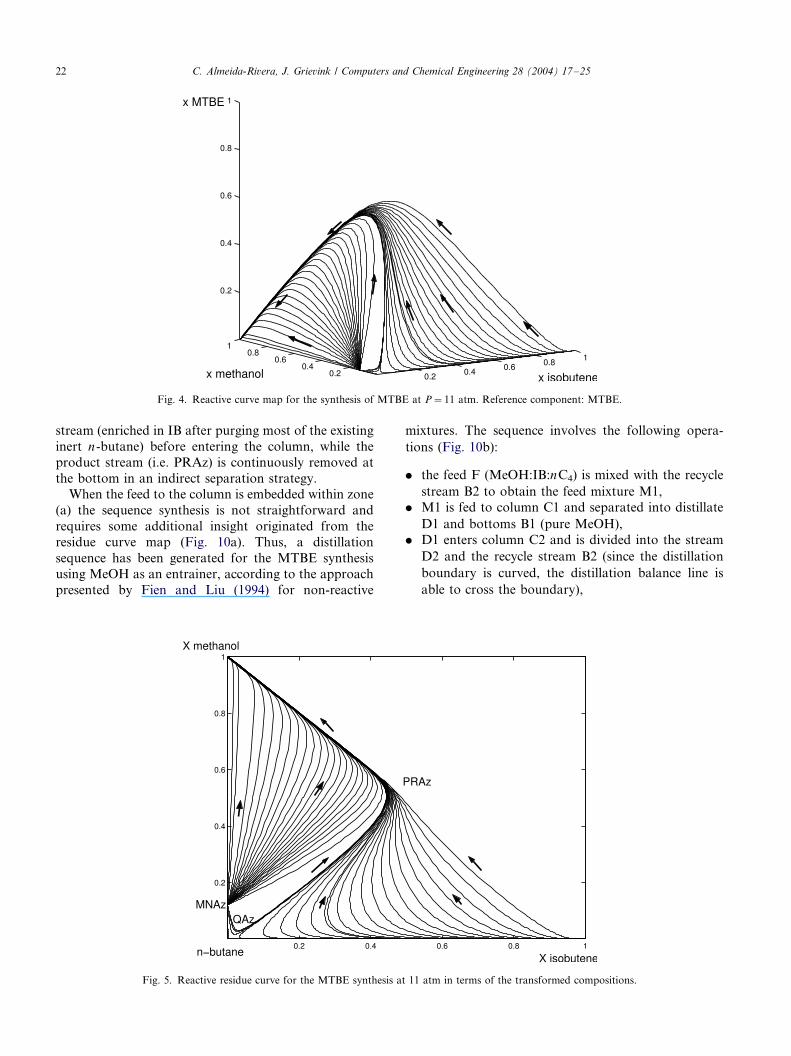
Fig. 4. Reactive curve map for the synthesis of MTBE at P�/11 atm. Reference component: MTBE.
C. Almeida-Rivera, J. Grievink / Computers and Chemical Engineering 28 (2004) 17�/2522
stream (enriched in IB after purging most of the existing
inert n-butane) before entering the column, while the
product stream (i.e. PRAz) is continuously removed at
the bottom in an indirect separation strategy.When the feed to the column is embedded within zone
(a) the sequence synthesis is not straightforward and
requires some additional insight originated from the
residue curve map (Fig. 10a). Thus, a distillation
sequence has been generated for the MTBE synthesis
using MeOH as an entrainer, according to the approach
presented by Fien and Liu (1994) for non-reactive
Fig. 5. Reactive residue curve for the MTBE synthesis a
mixtures. The sequence involves the following opera-
tions (Fig. 10b):
. the feed F (MeOH:IB:nC4) is mixed with the recycle
stream B2 to obtain the feed mixture M1,
. M1 is fed to column C1 and separated into distillate
D1 and bottoms B1 (pure MeOH),
. D1 enters column C2 and is divided into the stream
D2 and the recycle stream B2 (since the distillation
boundary is curved, the distillation balance line is
able to cross the boundary),
t 11 atm in terms of the transformed compositions.

Fig. 6. Quaternary azeotrope in the MTBE synthesis at 11 atm.
C. Almeida-Rivera, J. Grievink / Computers and Chemical Engineering 28 (2004) 17�/25 23
. the stream D2 is then separated following the
sequence designed for zone (b) and stream B1 may
be eventually recycled back to the first column.
It can be noticed that the PRAz is an intermediate
boiling reacting mixture and behaves like a tangent
pinch that prohibits designing the separation sequence
towards pure MTBE.
Fig. 7. Pseudo azeotrope in the M
4. Conclusions
Residue curve maps have shown to provide valuable
insights and design assistance for non-ideal systems,
particularly for reactive distillation.
Transforming the composition variables according to
Doherty’s approach allows to define a reaction space of
lower dimension, formed by attainable product compo-
TBE synthesis at 11 atm.
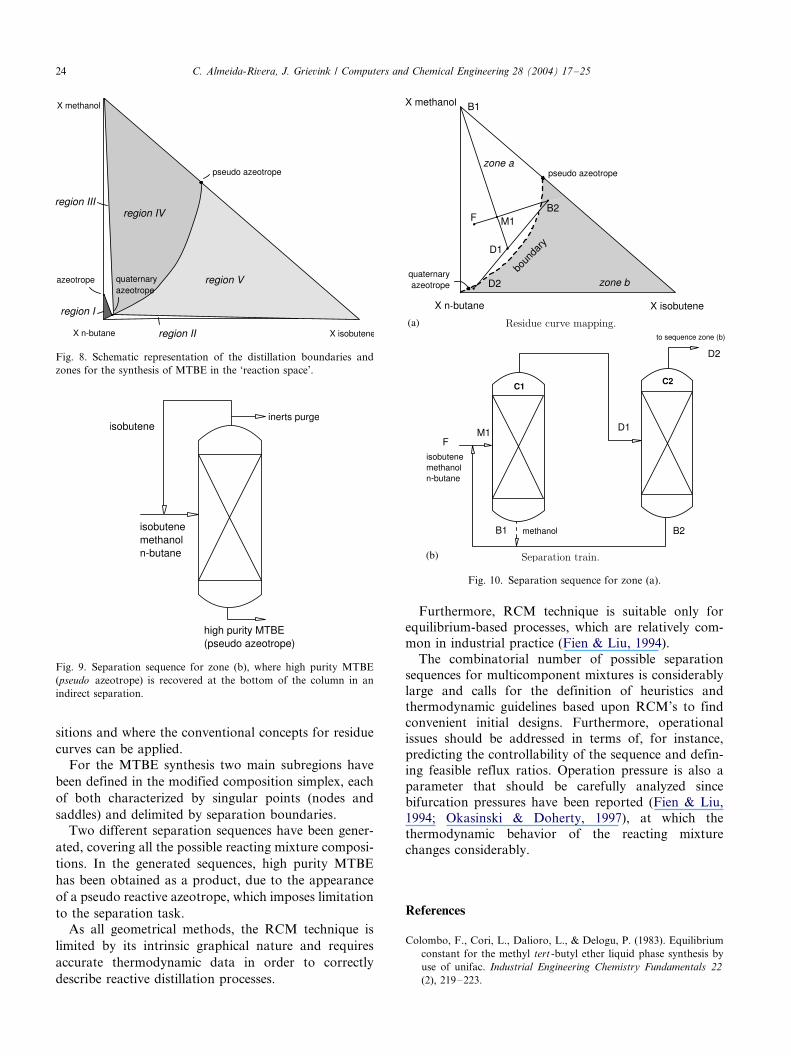
Fig. 8. Schematic representation of the distillation boundaries and
zones for the synthesis of MTBE in the ‘reaction space’.
Fig. 9. Separation sequence for zone (b), where high purity MTBE
(pseudo azeotrope) is recovered at the bottom of the column in an
indirect separation.
Fig. 10. Separation sequence for zone (a).
C. Almeida-Rivera, J. Grievink / Computers and Chemical Engineering 28 (2004) 17�/2524
sitions and where the conventional concepts for residue
curves can be applied.
For the MTBE synthesis two main subregions have
been defined in the modified composition simplex, each
of both characterized by singular points (nodes and
saddles) and delimited by separation boundaries.
Two different separation sequences have been gener-
ated, covering all the possible reacting mixture composi-
tions. In the generated sequences, high purity MTBE
has been obtained as a product, due to the appearance
of a pseudo reactive azeotrope, which imposes limitation
to the separation task.
As all geometrical methods, the RCM technique is
limited by its intrinsic graphical nature and requires
accurate thermodynamic data in order to correctly
describe reactive distillation processes.
Furthermore, RCM technique is suitable only for
equilibrium-based processes, which are relatively com-
mon in industrial practice (Fien & Liu, 1994).
The combinatorial number of possible separation
sequences for multicomponent mixtures is considerably
large and calls for the definition of heuristics andthermodynamic guidelines based upon RCM’s to find
convenient initial designs. Furthermore, operational
issues should be addressed in terms of, for instance,
predicting the controllability of the sequence and defin-
ing feasible reflux ratios. Operation pressure is also a
parameter that should be carefully analyzed since
bifurcation pressures have been reported (Fien & Liu,
1994; Okasinski & Doherty, 1997), at which thethermodynamic behavior of the reacting mixture
changes considerably.
References
Colombo, F., Cori, L., Dalioro, L., & Delogu, P. (1983). Equilibrium
constant for the methyl tert -butyl ether liquid phase synthesis by
use of unifac. Industrial Engineering Chemistry Fundamentals 22
(2), 219�/223.
C. Almeida-Rivera, J. Grievink / Computers and Chemical Engineering 28 (2004) 17�/25 25
Fien, G., & Liu, Y. (1994). Heuristic synthesis and shortcut design of
separation processes using residue curve maps: a review. Industrial
and Engineering Chemistry Research 33 , 2505�/2522.
Guttinger, T. E. (1998). Multiple steady states in azeotropic and reactive
distillation . Thesis/dissertation, Swiss Federal Institute of Technol-
ogy.
Izquierdo, J., Cunill, F., Vila, M., Tejero, J., & Iborra, M. (1992).
Equilibrium constants for methyl tert -butyl ether liquid-
phase synthesis. Journal of Chemical and Engineering Data 37 ,
339�/343.
Jimenez, L., Wanhschafft, O., & Julka, V. (2001). Analysis
of residue curve maps of reactive and extractive distillation
units. Computers and Chemical Engineering 25 , 635�/
642.
Kooijman, H., & Taylor, R. (2000). The ChemSep book . Libri books
on demand, USA.
Okasinski, M, & Doherty, M. F. (1997). Thermodynamic behavior of
reactive azeotropes. American Institute of Chemical Engineering
Journal 43 (9), 2227�/2238.
Rehfinger, A., & Hoffmann, U. (1990). Kinetics of methyl tertiary
butyl ether liquid phase synthesis catalyzed by ion exchange
resin*/i. intrinsic rate expression in liquid phase activities.
Chemical Engineering Science 45 (6), 1605�/1617.
Ung, S., & Doherty, M. (1995). Vapor�/liquid phase equilibrium in
systems with multiple chemical reactors. Chemical Engineering
Science 50 (1), 23�/48.
Westerberg, A., Lee, J. W., & Hauan, S. (2000). Synthesis of
distillation-based processes for non-ideal mixtures. Computers and
Chemical Engineering 24 , 2043�/2054.
Zhang, T., & Datta, R. (1995). Integral analysis of methyl tert -butyl
ether synthesis kinetics. Industrial and Engineering Chemistry
Research 34 (3), 730�/740.