Fatigue evaluation in maintenance and assembly operations by digital human simulation in virtual...
13
arXiv:1006.5787v1 [cs.RO] 30 Jun 2010 Noname manuscript No. (will be inserted by the editor) Fatigue evaluation in maintenance and assembly operations by digital human simulation Liang MA · Damien CHABLAT · Fouad BENNIS · Wei ZHANG · Bo HU · Franc ¸ois GUILLAUME Abstract Virtual human techniques have been used a lot in industrial design in order to consider human factors and er- gonomics as early as possible. The physical status (the phys- ical capacity of virtual human) has been mostly treated as invariable in the current available human simulation tools, while indeed the physical capacity varies along time in an operation and the change of the physical capacity depends on the history of the work as well. Virtual Human Status is proposed in this paper in order to assess the difficulty of manual handling operations, especially from the physi- cal perspective. The decrease of the physical capacity be- fore and after an operation is used as an index to indicate the work difficulty. The reduction of physical strength is simulated in a theoretical approach on the basis of a fa- tigue model in which fatigue resistances of different mus- cle groups were regressed from 24 existing maximum en- durance time (MET) models. A framework based on digi- tal human modeling technique is established to realize the comparison of physical status. An assembly case in airplane assembly is simulated and analyzed under the framework. The endurance time and the decrease of the joint moment strengths are simulated. The experimental result in simu- Liang MA · Damien CHABLAT · Fouad BENNIS Institut de Recherche en Communications et Cybern´ etique de Nantes, UMR 6597 du CNRS, ´ Ecole Centrale de Nantes, IRCCyN - 1, rue de la No¨ e - BP 92 101 - 44321 Nantes CEDEX 03, FRANCE Tel.:+33-02 40 37 69 58 Fax: +33-02 40 37 69 30 E-mail: {liang.ma, damien.chablat, fouad.bennis}@irccyn.ec-nantes.fr Wei ZHANG · Bo HU Department of Industrial Engineering, Tsinghua University, 100084, Beijing, P.R.CHINA E-mail: [email protected], [email protected] Franc ¸ois GUILLAUME EADS Innovation Works, 12, rue Pasteur - BP 76, 92152 Suresnes Cedex - FRANCE E-mail: [email protected] lated operations under laboratory conditions confirms the feasibility of the theoretical approach. Keywords Virtual human simulation · muscle fatigue model · fatigue resistance · physical fatigue evaluation · human status 1 Introduction Although automation techniques have played a very impor- tant role in industry, there are still lots of operations re- quiring manual handling operations thanks to the flexibility and the dexterity of human. Some of these manual handling operations deal with relative heavy physical loads, which might result in physical fatigue in the muscles and joints, and further generate potential risks for Musculoskeletal Dis- orders (MSDs) (Li and Buckle, 1999). In order to improve the work design, digital human mod- eling (DHM) technique has been used more and more in in- dustry taking human as the center of the work design system (Chaffin, 2002, 2007), since it benefits the validation of the workspace design, the assessment of the accessibility of an assembly design, the reduction of the production cost, and the reduction of the physical risks as well. Several commercial available DHM tools have already been developed and integrated into computer aided design (CAD) tools, such as Jack (Badler et al, 1993), 3DSSPP (Chaffin et al, 1999), RAMSIS (Bubb et al, 2006), AnyBody (Damsgaard et al, 2006), Santos TM (VSR Research Group, 2004), etc. In gen- eral, the virtual human in those tools is modeled with a large number of degrees of freedom (DOF) to represent the joint mobility, create the cinematic chain of human, and complete the skeleton structure of human. Meanwhile, the graphical appearance of virtual human is realized by bone, muscle, skin, and cloth models from the interior to the exterior, from simple stick models to complicated 3D mesh models. Nor- mally, biomechanical database and anthropometry database
Transcript of Fatigue evaluation in maintenance and assembly operations by digital human simulation in virtual...

arX
iv:1
006.
5787
v1 [
cs.R
O]
30 J
un 2
010
Noname manuscript No.(will be inserted by the editor)
Fatigue evaluation in maintenance and assembly operationsby digitalhuman simulation
Liang MA · Damien CHABLAT · Fouad BENNIS · Wei ZHANG · Bo HU ·
Francois GUILLAUME
Abstract Virtual human techniques have been used a lot inindustrial design in order to consider human factors and er-gonomics as early as possible. The physical status (the phys-ical capacity of virtual human) has been mostly treated asinvariable in the current available human simulation tools,while indeed the physical capacity varies along time in anoperation and the change of the physical capacity dependson the history of the work as well. Virtual Human Statusis proposed in this paper in order to assess the difficultyof manual handling operations, especially from the physi-cal perspective. The decrease of the physical capacity be-fore and after an operation is used as an index to indicatethe work difficulty. The reduction of physical strength issimulated in a theoretical approach on the basis of a fa-tigue model in which fatigue resistances of different mus-cle groups were regressed from 24 existing maximum en-durance time (MET) models. A framework based on digi-tal human modeling technique is established to realize thecomparison of physical status. An assembly case in airplaneassembly is simulated and analyzed under the framework.The endurance time and the decrease of the joint momentstrengths are simulated. The experimental result in simu-
Liang MA · Damien CHABLAT · Fouad BENNISInstitut de Recherche en Communications et Cybernetique de Nantes,UMR 6597 du CNRS,Ecole Centrale de Nantes, IRCCyN - 1, rue dela Noe - BP 92 101 - 44321 Nantes CEDEX 03, FRANCETel.:+33-02 40 37 69 58Fax: +33-02 40 37 69 30E-mail:{liang.ma, damien.chablat, fouad.bennis}@irccyn.ec-nantes.fr
Wei ZHANG · Bo HUDepartment of Industrial Engineering, Tsinghua University, 100084,Beijing, P.R.CHINAE-mail: [email protected], [email protected]
Francois GUILLAUMEEADS Innovation Works, 12, rue Pasteur - BP 76, 92152 SuresnesCedex - FRANCEE-mail: [email protected]
lated operations under laboratory conditions confirms thefeasibility of the theoretical approach.
Keywords Virtual human simulation· muscle fatiguemodel· fatigue resistance· physical fatigue evaluation·human status
1 Introduction
Although automation techniques have played a very impor-tant role in industry, there are still lots of operations re-quiring manual handling operations thanks to the flexibilityand the dexterity of human. Some of these manual handlingoperations deal with relative heavy physical loads, whichmight result in physical fatigue in the muscles and joints,and further generate potential risks for Musculoskeletal Dis-orders (MSDs) (Li and Buckle, 1999).
In order to improve the work design, digital human mod-eling (DHM) technique has been used more and more in in-dustry taking human as the center of the work design system(Chaffin, 2002, 2007), since it benefits the validation of theworkspace design, the assessment of the accessibility of anassembly design, the reduction of the production cost, andthe reduction of the physical risks as well.
Several commercial available DHM tools have alreadybeen developed and integrated into computer aided design(CAD) tools, such as Jack (Badler et al, 1993), 3DSSPP (Chaffin et al,1999), RAMSIS (Bubb et al, 2006), AnyBody (Damsgaard et al,2006), SantosTM (VSR Research Group, 2004), etc. In gen-eral, the virtual human in those tools is modeled with a largenumber of degrees of freedom (DOF) to represent the jointmobility, create the cinematic chain of human, and completethe skeleton structure of human. Meanwhile, the graphicalappearance of virtual human is realized by bone, muscle,skin, and cloth models from the interior to the exterior, fromsimple stick models to complicated 3D mesh models. Nor-mally, biomechanical database and anthropometry database

2
are often set up to determine virtual human’s dimensionaland physical properties.
The main functions of the virtual human simulation toolsare posture analysis and posture prediction. These tools arecapable of determining the workspace of virtual human (Yanget al,2008), assessing the visibility and accessibility of an opera-tion (Chedmail et al, 2003), evaluating postures (Bubb et al,2006), etc. Conventional motion time methods (MTM) andposture analysis techniques can be integrated into virtualhu-man simulation systems to assess the work efficiency (Hou et al,2007). From the physical aspect, the moment load of eachjoint (e.g., 3DSSPP) and even the force of each individualmuscle (e.g., AnyBody) can be determined, and the postureis predictable for reach operations (Yang et al, 2006) basedon inverse kinematics and optimization methods. Overall,the human motion can be simulated and analyzed based onthe workspace information, virtual human strength informa-tion, and other aspects. However, there are still several limi-tations in the existing virtual human simulation tools.
There is no integration of physical fatigue model in mostof the human simulation tools. The physical capacity is of-ten initialized as constant. For example, the joint strengthis assigned as joint maximum moment strength in 3DSSPP,and the strength of each muscle is set proportional to itsphysiological cross section area (PSCA) in AnyBody. Thephysical capacity keeps constant in the simulation, and thefatigue effect along time is not considered enough. However,the change of the physical status can be experienced every-day by everyone, and different working procedures generatedifferent fatigue effects. Furthermore, it has been reportedthat the motion strategy depends on the physical status, anddifferent strategies were taken under fatigue and non-fatigueconditions (Chen, 2000; Fuller et al, 2008). Therefore, it isnecessary to create a virtual human model with a variablephysical status for the simulation.
Some fatigue models have been incorporated into somevirtual human tools to predict the variable physical strength.For example, Wexler’s fatigue model (Ding et al, 2000) hasbeen integrated into SantosT M (Vignes, 2004), and Giat’s fa-tigue model (Giat et al, 1993) has been integrated based onHill’s muscle model (Hill, 1938) in the computer simulationby Komura et al (2000). However, either the muscle fatiguemodel has too many variables for ergonomic applications(e.g. Wexler’s model), or there is no confidential physiolog-ical principle for the fatigue decay term (Xia and Frey Law,2008) in the previous studies. It is necessary to find a simplefatigue model interpretable in muscle physiological mecha-nism for ergonomics applications.
In addition, some assessments in those tools provide in-dexes generated by traditional evaluation methods (e.g., Rapidupper limb assessment (RULA)). Due to the intermittent record-ing procedures of the conventional posture analysis meth-ods, the evaluation result cannot analyze the fatigue effect
in details. In this case, a new fatigue evaluation tool shouldbe developed and integrated into virtual human simulation.
In order to assess the variable human status, a prototypeof a digital human modeling and simulation tool developedin OpenGL is presented in this paper. This human model-ing tool is under a virtual environment framework involvingvariable physical status on the basis of a fatigue model.
The structure of the paper is as follows. First, a vir-tual human model is introduced into the framework for pos-ture analysis based on kinematic, dynamic, biomechanical,and graphical modeling. Second, the framework is presentedwith a new definition called Human Status. Third, the fatiguemodel and fatigue resistance for different muscle groups areintroduced. At last, an application case European Aeronau-tic Defence & Space (EADS) Company is assessed usingthis prototype tool under the framework with experimentalvalidation.
2 Digital human modeling
2.1 Kinematic modeling of virtual human
In this study, the human body is modeled kinematically as aseries of revolute joints. The Modified Denavit-Hartenberg(modified DH) notation system (Khalil and Dombre, 2002)is used to describe the movement flexibility of each joint.According to the joint function, one natural joint can be de-composed into 1 to 3 revolute joints. Each revolute joint hasits rotational joint coordinate, labeled asqi, with joint limits:the upper limitqU
i and the lower limitqLi . A general coordi-
nateq = [q1,q2, . . . ,qn] is defined to represent the kinematicchain of the skeleton.
The human body is geometrically modeled by 28 rev-olute joints to represent the main movement of the humanbody in Fig. 1. The posture, velocity, and acceleration areexpressed by the general coordinatesq, q, andq. It is fea-sible to carry out the kinematic analysis of the virtual hu-man based on this kinematic model. By implementing in-verse kinematic algorithms, it is able to predict the postureand trajectory of the human, particularly for the end effec-tors (e.g., the hands). All the parameters for modeling thevirtual human are listed in Table 1.[Xr,Yr,Zr] is the Carte-sian coordinates of the root point (the geometrical center ofthe pelvis) in the coordinates defined byX0Y0Z0.
The geometrical parameters of the limb are required inorder to accomplish the kinematic modeling. Such informa-tion can be obtained from anthropometry database in the lit-erature. The dimensional information can also be used forthe dynamic model of the virtual human. The lengths of dif-ferent segments can be calculated as a proportion of bodystatureH in Table 2.
3
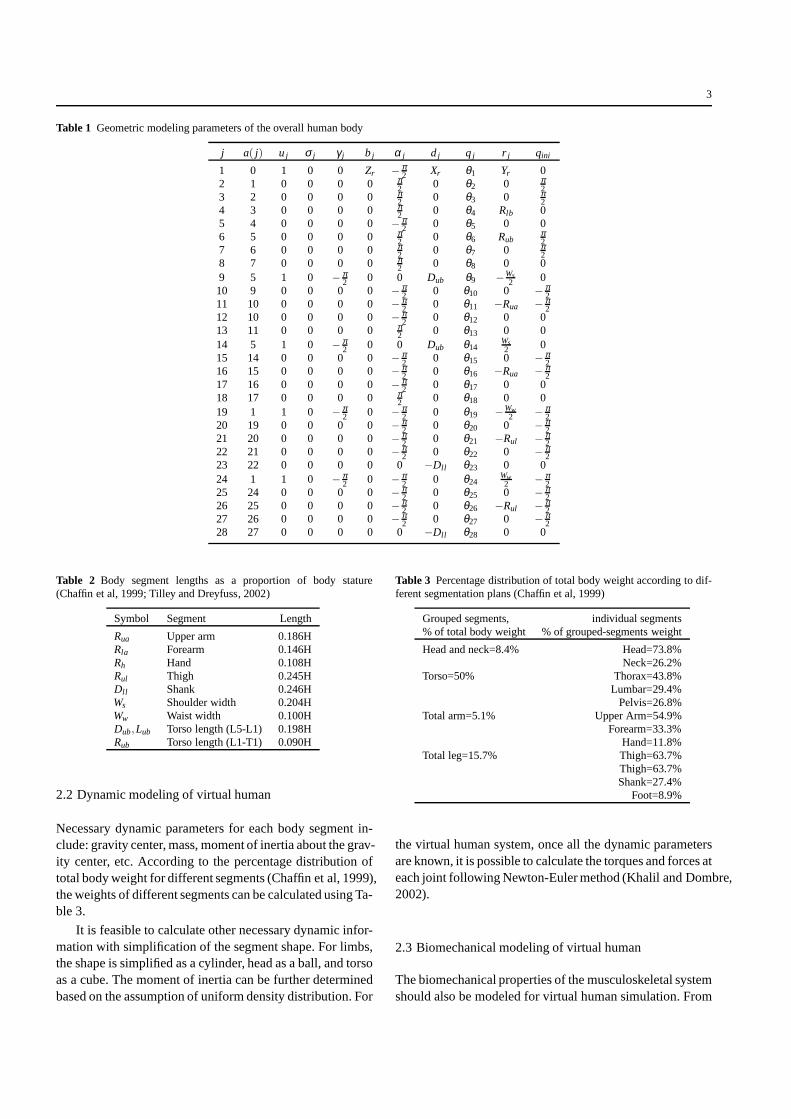
Table 1 Geometric modeling parameters of the overall human body
j a( j) u j σ j γ j b j α j d j q j r j qini
1 0 1 0 0 Zr − π2 Xr θ1 Yr 0
2 1 0 0 0 0 π2 0 θ2 0 π
23 2 0 0 0 0 π
2 0 θ3 0 π2
4 3 0 0 0 0 π2 0 θ4 Rlb 0
5 4 0 0 0 0 − π2 0 θ5 0 0
6 5 0 0 0 0 π2 0 θ6 Rub
π2
7 6 0 0 0 0 π2 0 θ7 0 π
28 7 0 0 0 0 π
2 0 θ8 0 09 5 1 0 − π
2 0 0 Dub θ9 −Ws2 0
10 9 0 0 0 0 − π2 0 θ10 0 − π
211 10 0 0 0 0 − π
2 0 θ11 −Rua − π2
12 10 0 0 0 0 − π2 0 θ12 0 0
13 11 0 0 0 0 π2 0 θ13 0 0
14 5 1 0 − π2 0 0 Dub θ14
Ws2 0
15 14 0 0 0 0 − π2 0 θ15 0 − π
216 15 0 0 0 0 − π
2 0 θ16 −Rua − π2
17 16 0 0 0 0 − π2 0 θ17 0 0
18 17 0 0 0 0 π2 0 θ18 0 0
19 1 1 0 − π2 0 − π
2 0 θ19 −Ww2 − π
220 19 0 0 0 0 − π
2 0 θ20 0 − π2
21 20 0 0 0 0 − π2 0 θ21 −Rul − π
222 21 0 0 0 0 − π
2 0 θ22 0 − π2
23 22 0 0 0 0 0 −Dll θ23 0 024 1 1 0 − π
2 0 − π2 0 θ24
Ww2 − π
225 24 0 0 0 0 − π
2 0 θ25 0 − π2
26 25 0 0 0 0 − π2 0 θ26 −Rul − π
227 26 0 0 0 0 − π
2 0 θ27 0 − π2
28 27 0 0 0 0 0 −Dll θ28 0 0
Table 2 Body segment lengths as a proportion of body stature(Chaffin et al, 1999; Tilley and Dreyfuss, 2002)
Symbol Segment Length
Rua Upper arm 0.186HRla Forearm 0.146HRh Hand 0.108HRul Thigh 0.245HDll Shank 0.246HWs Shoulder width 0.204HWw Waist width 0.100HDub,Lub Torso length (L5-L1) 0.198HRub Torso length (L1-T1) 0.090H
2.2 Dynamic modeling of virtual human
Necessary dynamic parameters for each body segment in-clude: gravity center, mass, moment of inertia about the grav-ity center, etc. According to the percentage distribution oftotal body weight for different segments (Chaffin et al, 1999),the weights of different segments can be calculated using Ta-ble 3.
It is feasible to calculate other necessary dynamic infor-mation with simplification of the segment shape. For limbs,the shape is simplified as a cylinder, head as a ball, and torsoas a cube. The moment of inertia can be further determinedbased on the assumption of uniform density distribution. For
Table 3 Percentage distribution of total body weight according to dif-ferent segmentation plans (Chaffin et al, 1999)
Grouped segments, individual segments% of total body weight % of grouped-segments weight
Head and neck=8.4% Head=73.8%Neck=26.2%
Torso=50% Thorax=43.8%Lumbar=29.4%
Pelvis=26.8%Total arm=5.1% Upper Arm=54.9%
Forearm=33.3%Hand=11.8%
Total leg=15.7% Thigh=63.7%Thigh=63.7%Shank=27.4%
Foot=8.9%
the virtual human system, once all the dynamic parametersare known, it is possible to calculate the torques and forcesateach joint following Newton-Euler method (Khalil and Dombre,2002).
2.3 Biomechanical modeling of virtual human
The biomechanical properties of the musculoskeletal systemshould also be modeled for virtual human simulation. From

4
Fig. 1 Geometrical modeling of virtual human
the physical aspect, the skeleton structure, muscle, and jointare the main biomechanical components in a human. In ourstudy, only the joint moment strengths and joint movementranges are used for the fatigue evaluation.
As mentioned before, with correct kinematic and dy-namic models, it is possible to calculate torques and forcesin joints with an acceptable precision. Although biomechan-ical properties of muscles are reachable and different op-timization methods have been developed in the literature,the determination of the individual muscle force is still verycomplex and not as precise as that of joint torque (Xia and Frey Law,2008). Since there are several muscles attached around ajoint, it creates an mathematical underdetermined problemfor force calculation in muscle level. In addition, each indi-vidual muscle has different muscle fiber compositions, dif-ferent levers of force, and furthermore different muscle co-ordination mechanisms, and the complexity of the problemwill be increased dramatically in muscle level. Therefore,in our system, only the joint moment strength is taken todemonstrate the fatigue model.
The joint torque capacity is the overall performance ofmuscles attached around the joint, and it depends on the pos-ture and the rotation speed of joint (Anderson et al, 2007).When a heavy load is handled in a manual operation, the ac-tion speed is relatively small, and it is almost equivalent tostatic cases. The influence from speed can be neglected, soonly posture is considered. In this situation, the joint strengthcan be determined according to strength models in Chaffin et al(1999). The joint strength is measured in torque and mod-eled as a function of joint flexion angles. An example ofjoint strength is given in Fig. 2. The shoulder flexion angleand the elbow flexion angle are used to determine the profileof the male adult elbow joint strength. The 3D mesh surfacesrepresent the elbow joint strengths for 95% population. Forthe 50th percentile, the elbow joint strength varies from 45to 75 N according to the joint positions.
0
100
200
0
50
100
15020
25
30
35
40
x
2.5 percentile
y
z
0
100
200
0
50
100
15035
40
45
50
55
60
x
16 percentile
y
z
0
100
200
0
50
100
15040
50
60
70
80
x
50 percentile
y
z
0
100
200
0
50
100
15060
70
80
90
100
x
84 percentile
y
z
0
100
200
0
50
100
15070
80
90
100
110
120
x
97.5 percentile
y
z
x axis - flexion angle [deg] of shoulder αs
y axis - flexion angle of elbow[deg] αe
z axis - elbow joint strength [Nm]
Fig. 2 Elbow static strength depending on the human elbow and shoul-der joint position,αs, αe [deg]

5
2.4 Graphical modeling of virtual human
The final step for modeling the virtual human is its graphi-cal representation. The skeleton is divided into 11 segments:body (1), head and neck (1), upper arms (2), lower arms (2),upper legs (2), lower legs (2), and feet (2). Each segment ismodeled in 3ds file (3D Max, Autodesk Inc.) (Fig. 3(a)) andis connected via one or more revolute joints with anotherone to assemble the virtual skeleton (Fig. 3(b)). For eachsegment, an original point and two vectors perpendicular toeach other are attached to it to represent the position and theorientation in the simulation, respectively. The positionandorientation can be calculated by the kinematic model of thevirtual human.
(a) 3DS model (b) virtual skeleton
Fig. 3 Virtual skeleton composed of 3DS models
3 Framework for evaluating manual handlingoperations
The center of the framework is the objective work evalua-tion system (OWES) in Fig. 4. The input module includes:human motion, interaction information, and virtual environ-ment. Human motion is either captured by motion capturesystem or simulated by virtual human simulation. The inter-action information is either obtained via haptic interfaces ormodeled in simulation. Virtual environment is constructedto provide visual feedback to participants or workspace in-formation in simulation. Input information is processed inOWES. With different evaluation criteria, different aspectsof human work can be assessed as in the previous humansimulation tools.
A new conceptionhuman status is proposed for thisframework to generalize the discussion.Human Status: itis a state, or a situation in which the human possesses dif-ferent capacities for an industrial operation. It can be furtherclassified into mental status and physical status. Human sta-tus can be described as an aggregation of a set of humanabilities, such as visibility, physical capacity (joint strength,muscle strength), and mental capacity. Virtual human sta-tus can be mathematically noted asHS= {V1,V2, . . . ,Vn}.EachVi represents one specific aspect of human abilities,
OWESObjective
Work Evaluation
SystemVirtual Environment
Virtual Human
Virtual Interaction
Fatigue Criteria
Posture Criteria
Efficiency Criteria
Comfort Criteria
Environment
Human Motion
Interaction
Motion Capture
Haptic Interfaces
Virtual Reality
Simulated Human Motion
Human Simulation
Fatigue A
nalysis
Com
fort Analysis
Posutre A
nalysis
Posture Prediction Algorithm
Virutal Human Status
Update
Fig. 4 Framework for the work evaluation
and this state vector can be further detailed by a vectorVi =
{vi1,vi2, . . . ,vimi}. The change of the human status is definedas∆HS=HS(t+δ t)−HS(t) = {∆V1,∆V2, . . . ,∆Vn}. Forexample, one aspect of the physical status can be noted asHS= [S1,S2, . . . ,Sn], whereSi represents the physical jointstrength of theith joint of the virtual human.
In order to make the simulation as realistic as in realworld, it is necessary to know how the human generates amovement. The bidirectional communication between hu-man and the real world in an operation decides the actionto accomplish a physical task: worker’s mental and physicalstatus can be influenced by the history of operation, whilethe worker chooses his or her suitable movement accordingto his or her current mental and physical statuses. Hence theframework is designed to evaluate the change of human sta-tus before and after an operation, and furthermore to predictthe human motion according to the changed human status.
The human is often simplified for posture control as asensory-motor system in which there are enormous externalsensors covering the human body and internal sensors in thehuman body capturing different signals, and the central ner-vous system (CNS) transfer the signals into decision makingsystem (Cerebrum and Vertebral disc); the decision mak-ing system generates output commands to generate forces inmuscles and then drives the motion and posture respondingto the external stimulus. Normally, most of the external in-put information is directly measurable, such as temperature,external load, moisture, etc. However, how to achieve all theinformation for such a great number of sensors all over thehuman body is a challenging task. In addition, the internalperception of human body, which plays also an importantrole in motor sensor coordination, is much more difficult tobe quantified. The most difficult issue is to know how thebrain handles all the input and output signals while perform-ing a manual operation. In previous simulation tools, the ex-ternal input information has been already provided and han-dled. Visual feedback, audio feedback, and haptic feedbackare often employed as input channel for a virtual human sim-ulation. One limitation of the existing methods is that the in-

6
ternal sensation is not considered enough. Physical fatigueis going to be modeled and integrated into the framework topredict the perceived strength reduction and the reactionsofthe human body to the fatigue, which provides a close-loopfor the human simulation (Fig. 5).
Fig. 5 Human status in human simulation tools
The special contribution in this framework is that thereduction of the physical strength can be evaluated in theframework based on a muscle fatigue model. And then thechanged physical strength is taken as a feedback to the vir-tual human simulation to update the simulation result.
The framework performs mainly two functions: postureanalysis and posture prediction (human simulation). The func-tion of posture prediction is to simulate the human motionbased on the current virtual human status. Posture analysisfocuses on assessing the difficulty of the manual operation.The difficulty of the work is assessed by the change of hu-man status before and after the operation∆HS=∆HSphysical.Physical fatigue is one of the physical aspects, and this as-pect is evaluated by the decrease of the strength in joints.The posture analysis function of the framework is our focusin this paper.
More precisely in this paper, the joint strengths modelsare used to determine the initial joint moment capacity, andthen the fatigue in the joints can be further determined by theexternal load in the static operation and the fatigue model inSection 4, and then the change of the physical status can beassessed.
4 Fatigue modeling and Fatigue analysis
4.1 Fatigue modeling
A new dynamic fatigue model based on muscle motor unitrecruitment principle was proposed in (Ma et al, 2009). Thismodel was able to integrate task parameters (external load)and temporal parameters for predicting the fatigue of staticmanual handling operations in industry. Equation 1 is theoriginal form of the fatigue model to describe the reduction
of the capacity. The descriptions of the parameters for Eq.1 are listed in Table 4. The detailed explanation about thismodel can be found in Ma et al (2009).
dFcem(t)dt
=−kFcem(t)MVC
Fload(t) (1)
Table 4 Parameters in dynamic fatigue model
Item Unit Description
MVC N Maximum voluntary contraction, maximumcapacity of muscle
Fcem(t) N Current exertable maximum force, currentcapacity of muscle
Fload(t) N External load of muscle, the force which themuscle needs to generate
k min−1 Constant value, fatigue ratio%MVC Percentage of the voluntary maximum con-
traction
fMVC %MVC/100,Fload(t)MVC
Maximum endurance time (MET) models can be usedto predict the endurance time of a static operation. In staticcases,Fload(t) is constant in the fatigue model, and thenMET is the duration in whichFcem falls down toFload. Thus,MET can be determined in Eq. (2) and (3).
Fcem(t) = MVC e∫ t0−k
Fload(u)MVC
du= Fload(t) (2)
t = MET =−ln
Fload(t)MVC
kFload(t)MVC
=−ln( fMVC)
k fMVC(3)
This model was validated in comparison with 24 METmodels summarized in El ahrache et al (2006). The previousMET models were used to predict the maximum endurancetime for static exertions and they were all described in func-tions with fMVC as the only variable. High Pearson’s corre-lations and interclass correlations (ICC) between the METmodel in Eq. 3 and the other previous MET models vali-dated the availability of our model for static cases. Mean-while, the comparison between our model and a dynamicmotor unit recruitment based model (Liu et al, 2002) sug-gested that our model was also suitable for modeling musclefatigue in dynamic cases.
In (Ma et al, 2009), the fatigue ratiok was assigned 1min−1. However, from the literature, substantial variabilityin fatigue resistance in the population, and the variability re-sults from several factors, such as age, career, gender, mus-cle groups, etc. The parameterk can handle the effects on

7
the fatigue resistance globally. Therefore, it is necessary todetermine the fatigue resistances for different muscle groupsto complete the muscle fatigue model.
4.2 Fatigue resistance based on MET models
Thanks to the high linear relationship between our METmodel and the previous MET models, it is proposed thateach static MET modelf (x) can be described mathemati-cally by a linear equation (Eq. 4). In Eq. 4,x is used to re-placefMVC andp(x) represents Eq. 3.m andn are constantsdescribing the linear relationship between static model andour model, and they need be determined in regression. Here,m = 1/k indicates the fatigue resistance of the static model,andk is fatigue ratio or fatigability of different static model.
f (x) = m p(x)+ n (4)
Due to the asymptotic tendencies of MET models, whenx→ 1 (%MVC → 100), f (x)→ 0 andp(x)→ 0 (MET → 0),we assumen = 0. Since some MET models are not suit-able for %MVC ≤ 15%, the regression is carried out fromx = 0.16 tox = 0.99. With a step length 0.01,N = 84 METvalues are calculated to determine the parameterm of eachMET model by minimizing the function in Eq. 5.
M(x) =N
∑i=1
( f (xi)−m p(xi))2 = am2+ bm+ c (5)
From Eq. 5,m can be calculated by Eq. 6.
m =−b2a
=
N∑
i=1p(xi) f (xi)
N∑
i=1p(xi)2
> 0 (6)
The regression result represents the fatigue resistanceof the muscle group. In comparison with 6 general METmodels, 6 elbow models, 5 shoulder models, and 6 hip/backmodels, different muscle fatigue resistances for correspond-ing muscle groups were calculated and listed below in Table5. The mean value ¯m andσm can be used to adjust our METmodel to cover different MET models, and they can be fur-ther used to predict the fatigue resistance of a muscle groupfor a given population. The prediction with mean value andits deviation in general MET models is shown in Fig.6. Itis observable that the bold solid curve and two slim solidcurves cover most of the area formed by the previous empir-ical MET models.
It should be noted that the fatigue resistance for differ-ent muscle groups are only regressed based on the empiricaldata grouped in the literature, and the results (Table 6) for
shoulder and hip/back muscle groups did not conform to thenormal distribution. For the shoulder joint, the subjects inthese models were not only from different careers but alsofrom different gender mixture. Therefore, the fatigue resis-tance result can only provide a reference in this study.
Table 5 Fatigue resistance ¯m for different muscle groups
Segment ¯m σm
General 0.8135 0.2320Shoulder 0.7562 0.4347Elbow 0.8609 0.4079Hip 1.9701 1.1476
0.2 0.3 0.4 0.5 0.6 0.7 0.8 0.9 1
1
2
3
4
5
6
7
8
9
10Prediction of MET using Dynamic model in comparison with General static models
fMVC
End
uran
ce T
ime
in G
ener
al m
odel
s [m
in]
RohmertHuijgensSatoManenicaSjogaardRoseDynamic (mean)Dynamic (−σ)Dynamic (+σ)
Fig. 6 Prediction of MET in the dynamic MET model in comparisonwith that in the general models
Table 6 Fatigue resistances of shoulder MET models
Model Subjects mSato et al (1984) 5 male 0.427Rohmert et al (1986) 6 male and 1 female students 0.545Mathiassen and Ahsberg(1999)
20 male and 20 female mu-nicipal employees
0.698
Garg et al (2002) 12 female college subjects 1.393
4.3 Workflow for fatigue analysis
The general process of the posture analysis has been dis-cussed in Section 3, and here is the flowchart in Fig. 7 todepict all the details in processing all the input information.
First, human motion obtained either from human simu-lation or from motion capture system is further processed todisplacementq, speedq, and accelerationq in general coor-dinates.

8
Fig. 7 Workflow for the fatigue evaluation
The external forces and torques on the human body areeither measured directly by force measurement instrumentsor estimated in the simulation. The external loads are trans-formed toΓi andFi in the coordinates attached toqi in themodified DH method.
Human motion and interaction (forces, torques) are mappedinto the digital human model which is geometrically anddynamically modeled from anthropometry database and thebiomechanical database. Inverse dynamics is used to calcu-late the torque and force at each general joint. If it goes fur-ther, the effort of each individual muscle can be determinedusing optimization method as well.
Once the loads of the joints are determined, the fatigueof each joint can be analyzed using the fatigue model. Thereduction of the physical strength can be evaluated, and fi-nally the difficulty of the operation can be estimated by thechange of physical strengths.
5 Analysis Results for EADS Application Cases -Drilling
5.1 Operation description
The application case is the assembly of two fuselage sec-tions with rivets from the assembly line of an airplane inEuropean Aeronautic Defence & Space (EADS) Company.One part of the job consists of drilling holes all around thecross section. The tasks is to drill holes around the fuselagecircumference. The number of the holes could be up to 2,000on an orbital fuselage junction of an airplane. The drillingmachine has a weight around 5 kg, and even up to 7 kg inthe worst condition with consideration of the pipe weight.The drilling force applied to the drilling machine is around49N. In general, it takes 30 seconds to finish a hole. Thedrilling operation is illustrated in Fig. 8. The fatigue hap-pens often in shoulder, elbow, and lower back because ofthe heavy load. Only the upper limb is taken into consider-
ation in this demonstration case to decrease the complexityof the analysis.
Fig. 8 Drilling case in CATIA
5.2 Endurance time prediction
The drilling machine with a weight 5 kg is taken to calcu-late the maximum endurance time under a static posture withshoulder flexion as 30◦ and elbow flexion 90◦ for maintain-ing the operation in a continuous way. The weight of thedrilling machine is divided by two in order to simplify theload sharing problem. The endurance result is shown in Ta-ble 7 for the population falling in the 95% strength distribu-tion. It is found that the limitation of the work is determinedby the shoulder, since the endurance time for the shoulderjoint is much shorter than that of the elbow joint.
Table 7 Maximum endurance time of shoulder and elbow joints fordrilling work
MET [sec] S−2σ S−σ S S+σ S+2σShoulder
m−σm 19.34 45.05 75.226 108.81 145.16m 45.489 105.96 176.94 255.94 341.44
m+σm 71.639 166.87 278.65 403.07 537.71
Elbow
m−σm 230.61 424.27 640.47 873.52 1120.1m 438.27 806.3 1217.2 1660.1 2128.6
m+σm 645.92 1188.3 1793.9 2446.6 3137.2
The difference in endurance results has two origins. Oneis the external load relative to the joint strength. The secondcomes from the fatigue resistance difference among the pop-ulation. These differences are graphically presented from

9
Fig. 9 to Fig. 12. Figure 9 and Figure 10 show the vari-able endurance caused by the joint strength distribution inthe adult male population with the mean fatigue resistance.Larger strength results in longer endurance time for the sameexternal load. Figure 11 and Figure 12 present the endurancetime for the population with the average joint strength butdifferent fatigue resistances, and it shows that larger fatigueresistance leads to longer endurance time. Combining withthe strength distribution and the fatigue resistance variance,the MET can be estimated for all the population.
50 100 150 200 250 3000
20
40
60
80
100
120
Red
uctio
n of
Sho
ulde
r F
lexi
on s
tren
gth
[Nm
]
Sj−2σ
jS
j−σ
jS
jS
j+σ
jS
j+2σ
jΓ
jLoad
50 100 150 200 250 3000
0.1
0.2
0.3
0.4
0.5
0.6
0.7
0.8
0.9
1
Holding time of Shoulder Flexion for drilling hole tasks [s]
Nor
mal
ized
Red
uctio
n of
Sho
ulde
r F
lexi
on s
tren
gth
Geometric configuration in αs = 30o, α
e = 90o, mass of drilling machine 2.5 kg
Sj−2σ
jS
j−σ
jS
jS
j+σ
jS
j+2σ
j
Fig. 9 Endurance time prediction for shoulder with average fatigueresistance
500 1000 1500 20000
20
40
60
80
100
120
Red
uctio
n of
Elb
ow F
lexi
on s
tren
gth
[Nm
]
500 1000 1500 20000
0.1
0.2
0.3
0.4
0.5
0.6
0.7
0.8
0.9
1
Holding time of Elbow Flexion for drilling hole tasks [s]
Nor
mal
ized
Red
uctio
n of
Elb
ow F
lexi
on s
tren
gth
Geometric configuration in αs = 30o, α
e = 90o, mass of drilling machine 2.5 kg
Sj−2σ
jS
j−σ
jS
jS
j+σ
jS
j+2σ
j
Sj−2σ
jS
j−σ
jS
jS
j+σ
jS
j+2σ
jΓ
jLoad
Fig. 10 Endurance time prediction for the elbow with average fatigueresistance
50 100 150 200 2500
10
20
30
40
50
60
70
80
Holding time of Shoulder Flexion for drilling hole tasks [s]
Red
uctio
n of
Sho
ulde
r F
lexi
on s
tren
gth
[Nm
]
Geometric configuration in αs = 30o, α
e = 90o, mass of drilling machine 2.5 kg
mm+σ
mm−σ
mΓ
jLoad
Fig. 11 Endurance time for the population with average strength forshoulder joint
200 400 600 800 1000 1200 1400 16000
10
20
30
40
50
60
70
80
Holding time of Elbow Flexion for drilling hole tasks [s]
Red
uctio
n of
Elb
ow F
lexi
on s
tren
gth
[Nm
]
Geometric configuration in αs = 30o, α
e = 90o, mass of drilling machine 2.5 kg
mm+σ
mm−σ
mΓ
jLoad
Fig. 12 Endurance time for the population with average strength forelbow joint
5.3 Fatigue evaluation
The fatigue is evaluated by the change of the joint strengthin a fatigue operation. The working history can generate in-fluence on the fatigue. Therefore, the fatigue for drilling ahole is evaluated in a continuous working process up to 6holes. Only the population with the average strength andthe average fatigue resistance is analyzed in fatigue evalu-ation in order to present the effect of the work history. Thereduced strength is normalized by dividing the maximumjoint strength, and it is shown in Fig. 13. It takes 30 secondsto drill a hole, and the joint strength is calculated and nor-malized every 30 seconds until exhaustion for the shoulderjoint.
In our current research,HS includes only the joint strengthvector. The evaluation of the fatigue is measured by the change

10
30 60 90 120 150 180 210 2400
0.1
0.2
0.3
0.4
0.5
0.6
0.7
0.8
0.9
1
Holding time of Shoulder Flexion for drilling hole tasks [s]
Per
cent
age
of th
e R
educ
tion
of S
houl
der
Fle
xion
str
engt
h
Geometric configuration in αs = 30o, α
e = 90o, mass of drilling machine 2.5 kg
Normalized reduction of joint strength
Normalized external load
Fig. 13 Fatigue evaluation after drilling a hole in a continuous drillingprocess
of the joint strength for drilling a hole. The result is shownin Table 8. Three measurements are given in this table: oneis the normalized physical strength every 30 seconds, noted
asHSi
HSmax; one is the difference between the joint strength
before and after finishing a hole, noted asHSi −HSi+1
HSmax; the
last one if the difference between the joint strength and the
maximum joint strength, noted asHSmax −HSi
HSmax. In Table 8,
only the reduction of the shoulder joint strength is presented,since the relative load in elbow joint is much smaller.
From Fig. 13 and Table 8, the joint strength keeps thetrend of descending in the continuous work. The ratio ofthe reduction gets smaller in the work progress due to thephysiological change in the muscle fiber composition. Moretime consumed to work leads more reduction in physicalstrengths. The reduction relative to the maximum strengthis able to assess the difficulty of the operations.
5.4 Experiment validation
Simulated drilling operations were tested under laboratoryconditions in Tsinghua University. A total of 40 male in-dustrial workers were asked to simulate the drilling work ina continuous operation for 180 seconds. Maximum outputstrengths were measured in the simulated operations at dif-ferent periods of the operation. Fatigue was indexed by thereduction of the joint strength along time relative to the ini-tial maximum joint strength. Three out of the 40 subjectscould not sustain the external load for a duration of 180seconds, and 34 subjects had a shoulder joint fatigue resis-tance (Mean=1.32, SD=0.62) greater than the average shoul-der joint fatigue resistance in Table 5, which means that the
sample population has a higher fatigue resistance than thepopulation grouped in the regression.
The physical strength has been measured in simulatedjob static strengths, and the reduction in the operation variesfrom 32.0% to 71.1% (Mean=53.7% and SD=9.1%). The re-duction falls in the fatigue prediction of the theoretical meth-ods in Table 9 (Mean=51.7%, SD=12.1%).
Table 9 Normalized torque strength reduction for the population withhigher fatigue resistance
HSmax −HS180
HSmaxS−2σ S−σ S S+σ S+2σ
m - - 69.9% 62.5% 56.3%m+σm - 63.2% 53.2% 46.4% 40.8%m+2σm 64.9% 51.9% 43.0% 36.7% 31.9%
5.5 Discussion
Under the proposed framework, the conception of the virtualhuman status is introduced and realized by a virtual humanmodeling and simulation tool. The virtual human is kine-matic modeled based on the modeling method in robotics.Inverse dynamics is used to determine the joint loads. Withthe integration of a general fatigue model, the physical fa-tigue in a manual handling operation in EADS is simulatedand analyzed. The decrease in human joint strengths can bepredicted in the theoretical approach, and it has been vali-dated with experimental data.
Human status is introduced in this framework in order togeneralize all the discussion for the human simulation. Weconcentrate only on the physical aspect of the virtual human,in particular on joint strengths. Physical status can be ex-tended to other aspects, either measurable using instruments(e.g., heart rate, oxygen consumption, electromyograph ofmuscle, etc.) or predicable using mathematical models (e.g.,vision, strength, etc.). Similarly, the mental status of humancan also be established by similar terms (e.g., mental capac-ity, mental workload, mental fatigue, etc.). Under the con-ception of human status, different aspects of the human canbe aggregated together to present the virtual human com-pletely. The changed human status caused by a physical jobor a mental job can be measured or predicted to assess differ-ent aspects of the job. It should be noted that the definitionof human status is still immature and it requires great effortto form, extend, and validate this conception.
The main difference between the fatigue analysis in ourstudy and the previous methods for posture analysis is: inprevious methods (Wood et al, 1997; Iridiastadi and Nussbaum,2006; Roman-Liu et al, 2005), intermittent procedures wereused to develop the fatigue model with job specific param-eters; in contrast, all the related physical exposure factors

11
Table 8 Normalized shoulder joint strength in the drilling operation
Time [s] 0 30 60 90 120 150 180
m
HSi
HSmax100% 82.2% 67.2% 54.9% 44.8% 36.6% 30.1%
HSi −HSi+1
HSmax0% 17.8% 15.0% 12.3% 10.1% 8.2% 6.5%
HSmax −HSi
HSmax0% 17.8% 32.8% 45.1% 55.2% 63.4% 69.9%
are taken into consideration in a continuous approach in ourmodel. In this way, the analysis of the manual handling op-eration can be generalized without limitations of job spe-cific parameters. Furthermore, the fatigue and recovery pro-cedures can be decoupled to simplify the analysis in a con-tinuous way. Although only a specific application case ispresented in this paper, the feasibility of the general con-cept has been verified by the introduction of human statusand the validation of the fatigue model.
It should be noted that the recovery of the physical strengthhas not been considered yet. Although there are several work-rest allowance models in the literature, substantial variabil-ity was found among the prediction results for industrial op-erations (El ahrache and Imbeau, 2009) and it is still ongo-ing to develop a general recovery model.
6 Conclusions
In this study, human status is introduced into the work eval-uation system, especially for the physical status. It providesa global definition under which different aspects of humanabilities can be integrated and assessed simultaneously. Theeffect of the work on the human status, either positive ornegative, can be measured by the change of the human sta-tus before and after the operation. We concentrate our studyon physical aspects, especially on joint moment strengths.The physical fatigue analysis in a drilling case under thework evaluation framework demonstrates the work flow andthe functions of the virtual human simulation. The changeof joint moment strength, a specific aspect of human phys-ical status, has been simulated based on a general fatiguemodel with fatigue resistances. The similar results betweenthe analysis and the experimental data suggests that the frame-work may be useful for assessing the physical status in con-tinuous static operations.
The new conception human status and the theoreticalmethod for assessing the physical status may provide a newapproach to generalize the virtual human simulation and eval-uate the physical aspect in continuous static manual han-dling operations. This approach is useful to assess the phys-ical load to prevent industrial workers from MSD risks, and
it can also be used to assess mental load with extension ofmental status.
However, it should be noted that great effort has to bedone to extend different aspects in human status to make itmore precise. Even only for physical fatigue, it is still nec-essary to develop a recovery model to complete the fatigueprediction.
Acknowledgments
This research was supported by the EADS and the Regiondes Pays de la Loire (France) in the context of collaborationbetween theEcole Centrale de Nantes (Nantes, France) andTsinghua University (Beijing, PR China).
References
Anderson D, Madigan M, Nussbaum M (2007) Maximumvoluntary joint torque as a function of joint angle and an-gular velocity: Model development and application to thelower limb. Journal of Biomechanics 40(14):3105–3113
Badler NI, Phillips GB, Webber BL (1993) Simulating hu-mans: computer graphics animation and control. OxfordUniversity Press, USA
Bubb H, Engstler F, Fritzsche F, Mergl C, Sabbah O, Schae-fer P, Zacher I (2006) The development of RAMSIS inpast and future as an example for the cooperation betweenindustry and university. International Journal of HumanFactors Modelling and Simulation 1(1):140–157
Chaffin D (2002) On simulating human reach motions forergonomics analyses. Human Factors and Ergonomics inManufacturing 12(3):235–247
Chaffin D (2007) Human motion simulation for vehicle andworkplace design. Human Factors and Ergonomics inManufacturing 17(5):475
Chaffin DB, Andersson GBJ, Martin BJ (1999) Occupa-tional biomechanics, 3rd edn. Wiley-Interscience
Chedmail P, Chablat D, Roy CL (2003) A distributed ap-proach for access and visibility task with a manikin and arobot in a virtual reality environment. IEEE Transactionson Industrial Electronics 50(4):692–698

12
Chen Y (2000) Changes in lifting dynamics after local-ized arm fatigue. International Journal of Industrial Er-gonomics 25(6):611–619
Damsgaard M, Rasmussen J, Christensen S, Surma E,de Zee M (2006) Analysis of musculoskeletal systemsin the AnyBody Modeling System. Simulation ModellingPractice and Theory 14(8):1100–1111
Ding J, Wexler AS, Binder-Macleod SA (2000) A predictivemodel of fatigue in human skeletal muscles. Journal ofApplied Physiology 89:1322–1332
El ahrache K, Imbeau D (2009) Comparison of rest al-lowance models for static muscular work. InternationalJournal of Industrial Ergonomics 39(1):73–80
El ahrache K, Imbeau D, Farbos B (2006) Percentile val-ues for determining maximum endurance times for staticmuscular work. International Journal of Industrial Er-gonomics 36(2):99–108
Fuller J, Lomond K, Fung J, Cote J (2008) Posture-movement changes following repetitive motion-inducedshoulder muscle fatigue. Journal of electromyographyand kinesiology: official journal of the International So-ciety of Electrophysiological Kinesiology
Garg A, Hegmann K, Schwoerer B, Kapellusch J (2002) Theeffect of maximum voluntary contraction on endurancetimes for the shoulder girdle. International Journal of In-dustrial Ergonomics 30(2):103–113
Giat Y, Mizrahi J, Levy M (1993) A musculotendon modelof the fatigue profiles of paralyzed quadriceps muscle un-der FES. IEEE Transactions on Biomechanical Engineer-ing 40(7):664–674
Hill A (1938) The heat of shortening and the dynamic con-stants of muscle. Proceedings of the Royal Society ofLondon Series B, Biological Sciences 126(843):136–195
Hou H, Sun S, Pan Y (2007) Research on virtual human inergonomic simulation. Computers & Industrial Engineer-ing 53(2):350–356
Iridiastadi H, Nussbaum M (2006) Muscle fatigue and en-durance during repetitive intermittent static efforts: devel-opment of prediction models. Ergonomics 49(4):344–360
Khalil W, Dombre E (2002) Modelling, identification andcontrol of robots. Hermes Science Publications
Komura T, Shinagawa Y, Kunii TL (2000) Creating and re-targetting motion by the musculoskeletal human. The Vi-sual Computer 16(5):254–270
Li G, Buckle P (1999) Current techniques for assessingphysical exposure to work-related musculoskeletal risks,with emphasis on posture-based methods. Ergonomics42(5):674–695
Liu J, Brown R, Yue G (2002) A dynamical model of mus-cle activation, fatigue, and recovery. Biophysical Journal82(5):2344–2359
Ma L, Chablat D, Bennis F, Zhang W (2009) A new simpledynamic muscle fatigue model and its validation. Interna-
tional Journal of Industrial Ergonomics 39(1):211–220Mathiassen S, Ahsberg E (1999) Prediction of shoulder flex-
ion endurance from personal factor. International Journalof Industrial Ergonomics 24(3):315–329
Rohmert W, Wangenheim M, Mainzer J, Zipp P, Lesser W(1986) A study stressing the need for a static posturalforce model for work analysis. Ergonomics 29(10):1235–1249
Roman-Liu D, Tokarski T, Kowalewski R (2005) Decreaseof force capabilities as an index of upper limb fatigue.Ergonomics 48(8):930–948
Sato H, Ohashi J, Iwanaga K, Yoshitake R, Shimada K(1984) Endurance time and fatigue in static contractions.Journal of human ergology 13(2):147–154
Tilley AR, Dreyfuss H (2002) The measure of man &woman. Human factors in design. Revised Edition. NewYork: John Wiley & Sons, Inc.
Vignes RM (2004) Modeling muscle fatigue in digital hu-mans. Master’s thesis, Graduate College of The Univer-sity of Iowa
VSR Research Group (2004) Technical report for projectvirtual soldier research. Tech. rep., Center for Computer-Aided Design, The University of IOWA
Wood D, Fisher D, Andres R (1997) Minimizing fatigueduring repetitive jobs: optimal work-rest schedules. Hu-man Factors: The Journal of the Human Factors and Er-gonomics Society 39(1):83–101
Xia T, Frey Law L (2008) A theoretical approach for mod-eling peripheral muscle fatigue and recovery. Journal ofBiomechanics 41(14):3046–3052
Yang J, Pitarch E, Kim J, Abdel-Malek K (2006) Postureprediction and force/torque analysis for human hands. In:Proc. of SAE Digital human modelling for design and en-gineering conference, p 2326
Yang J, Sinokrot T, Abdel-Malek K (2008) A general an-alytic approach for Santos upper extremity workspace.Computers & Industrial Engineering 54(2):242–258

0.1 0.15 0.2 0.25Task performances in virtual environment
r = 0.7254y = 0.6264x+0.0360