
FATIGUE AND HUMAN FACTOR IN AVIATION - Webthesis
177
POLITECNICO DI TORINO Master of Science Degree in Aerospace Engineering Master Thesis FATIGUE AND HUMAN FACTOR IN AVIATION Academic Supervisor Prof. Paolo Maggiore Company Supervisor Cpt. Alessandro Floriani (SIRIO Airlines SPA) Eng. Marco Gajetti S.B. (SIRIO Airlines SPA) Candidate Cristiano Forcella Graduation year 2020\2021
-
Upload
khangminh22 -
Category
Documents
-
view
1 -
download
0
Transcript of FATIGUE AND HUMAN FACTOR IN AVIATION - Webthesis
POLITECNICO DI TORINO
Master of Science Degree in Aerospace Engineering
Master Thesis
FATIGUE AND HUMAN FACTOR IN AVIATION
Academic Supervisor Prof. Paolo Maggiore
Company Supervisor Cpt. Alessandro Floriani (SIRIO Airlines SPA) Eng. Marco Gajetti S.B. (SIRIO Airlines SPA)
Candidate Cristiano Forcella
Graduation year 2020\2021

2

3
To my Father

4
5
Index
Index ................................................................................................................................................................... 5
List of Figures and Tables ............................................................................................................................... 8
List of Acronyms ........................................................................................................................................... 11
Abstract ............................................................................................................................................................ 15
Chapter 1 OGHFA ............................................................................................................................................. 17
Introduction .................................................................................................................................................. 17
Influences ..................................................................................................................................................... 18
Situational Awareness .................................................................................................................................. 19
SA Analysis ................................................................................................................................................ 20
OGHFA Errors ........................................................................................................................................... 23
Chapter 2 Fatigue ............................................................................................................................................. 25
Introduction .................................................................................................................................................. 25
The Problem ................................................................................................................................................. 26
The causes ................................................................................................................................................ 27
Task Demand ................................................................................................................................................ 27
Six levels ................................................................................................................................................... 29
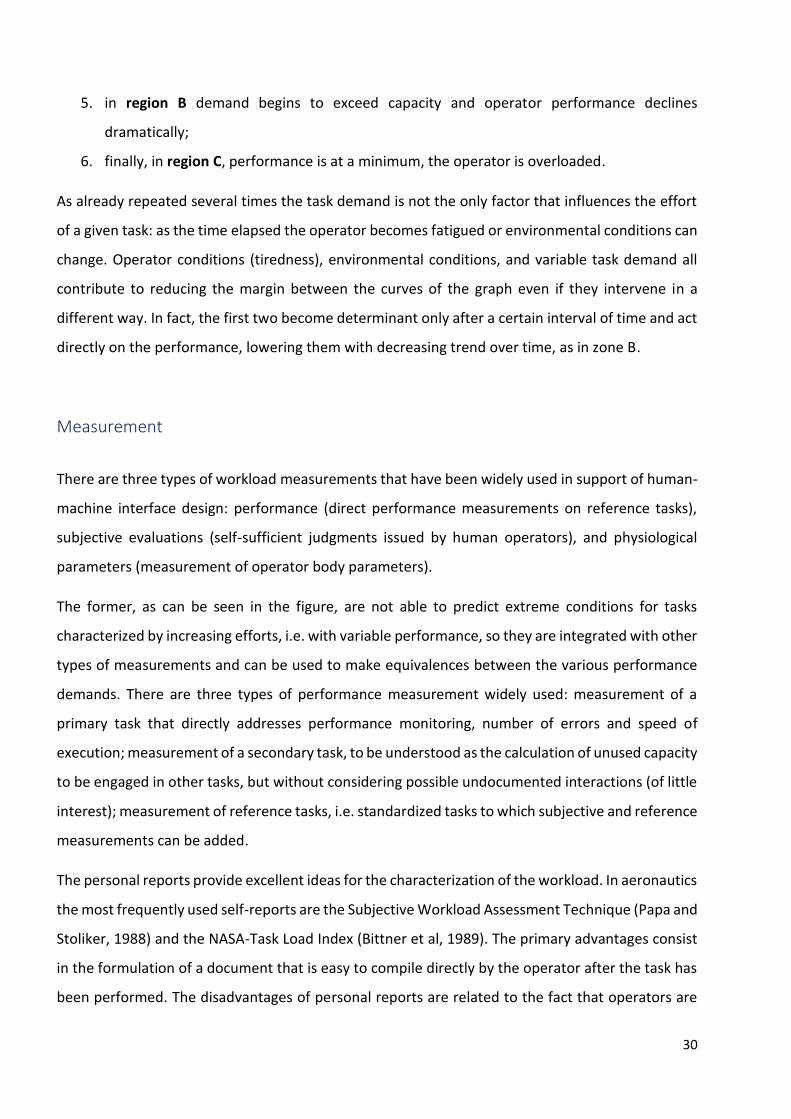
Measurement ........................................................................................................................................... 30
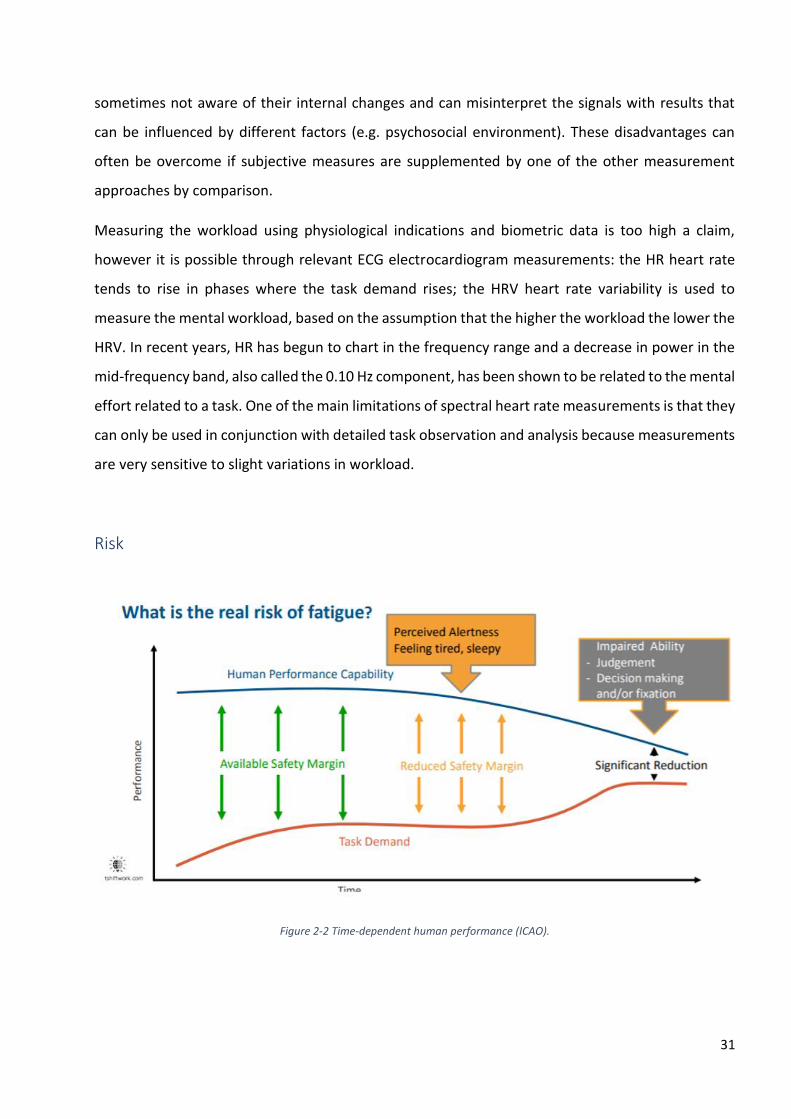
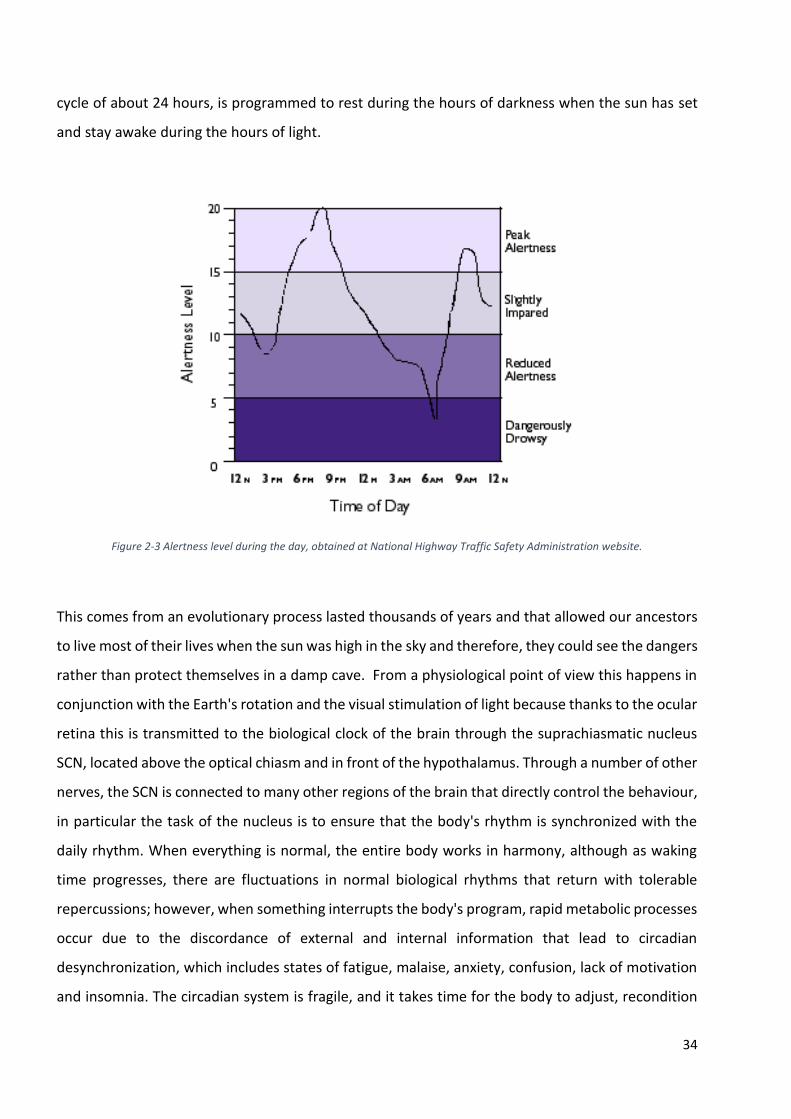
Risk ........................................................................................................................................................... 31
Sleep ............................................................................................................................................................. 32
Jet Leg and Shift Leg ................................................................................................................................. 32
Circadian Level .......................................................................................................................................... 33
Sleep Phases ............................................................................................................................................. 35
Sleep Losses .............................................................................................................................................. 36
Environment ................................................................................................................................................. 39
Noise and light .......................................................................................................................................... 39
Heat .......................................................................................................................................................... 40
Chapter 3 Workload ......................................................................................................................................... 43
Introduction .................................................................................................................................................. 43
Flight Phases ................................................................................................................................................. 43
WOMBAT ...................................................................................................................................................... 46
MRT .............................................................................................................................................................. 49
Task Complications ....................................................................................................................................... 53
Birdstrike .................................................................................................................................................. 53
Fog, Ice, Wind ........................................................................................................................................... 59
6
Warm ....................................................................................................................................................... 67
Chapter 4 Human Error ................................................................................................................................... 75
Introduction ................................................................................................................................................. 75
Constant and Variable Error ........................................................................................................................ 76
Slips, Lapses, Mistakes ................................................................................................................................. 77
SRK ............................................................................................................................................................... 78
Errors and MRT ........................................................................................................................................ 81
GEMS ........................................................................................................................................................... 82
Skill-Based ................................................................................................................................................ 83
Rule-Based ............................................................................................................................................... 84
Knowledge-Based .................................................................................................................................... 86
Error Detection ............................................................................................................................................ 87
Self-monitoring ........................................................................................................................................ 87
Environment Error Cueing ....................................................................................................................... 88
By Others ................................................................................................................................................. 89
Risk Management ........................................................................................................................................ 90
Matrix Risk ............................................................................................................................................... 92
Risk Tolerability............................................................................................................................................ 94
Fatigue Assessment and Mitigation Table ................................................................................................... 96
HEART ........................................................................................................................................................ 105
FRAT ........................................................................................................................................................... 109
Chapter 5 Decision Making ............................................................................................................................ 111
Introduction – Swiss Cheese model........................................................................................................... 111
ADM ........................................................................................................................................................... 112
SAS and CoA ........................................................................................................................................... 115
DA Teamwork ............................................................................................................................................ 116
Chapter 6 Sleep Problems ............................................................................................................................. 121
Sleep Inertia ............................................................................................................................................... 121
Cumulative Fatigue .................................................................................................................................... 124
Sleep Deprivation ...................................................................................................................................... 126
Chapter 7 Fatigue countermeasures ............................................................................................................. 129
Introduction ............................................................................................................................................... 129
Flight Limitation ......................................................................................................................................... 129
Controlled Rest .......................................................................................................................................... 135
Naps ........................................................................................................................................................... 136
Rest Break .................................................................................................................................................. 139
7
Caffeine ...................................................................................................................................................... 140
Chapter 8 CRM ............................................................................................................................................... 145
Introduction ................................................................................................................................................ 145
TEM............................................................................................................................................................. 146
The bad five ................................................................................................................................................ 149
CRM Teamwork .......................................................................................................................................... 150
Complacency .......................................................................................................................................... 154
CRM Examples ............................................................................................................................................ 154
Chapter 9 The Model ...................................................................................................................................... 157
The Optimization ........................................................................................................................................ 159
Conclusion ...................................................................................................................................................... 171
References ...................................................................................................................................................... 175
Acknowledgments .......................................................................................................................................... 177
8
List of Figures and Tables
FIGURE 1-1 SA INFLUENCES. ................................................................................................................................................... 19
FIGURE 1-2 SA LOOP. ............................................................................................................................................................ 19
FIGURE 1-3 FAULT TREE MODEL OF HF OF FCSA. ....................................................................................................................... 22
FIGURE 2-1 RELATIONSHIP BETWEEN WORKLOAD AND PERFORMANCE: SIX THEORETICAL LEVELS (DE WAARD,1996). ............................... 29
FIGURE 2-2 TIME-DEPENDENT HUMAN PERFORMANCE (ICAO). ..................................................................................................... 31
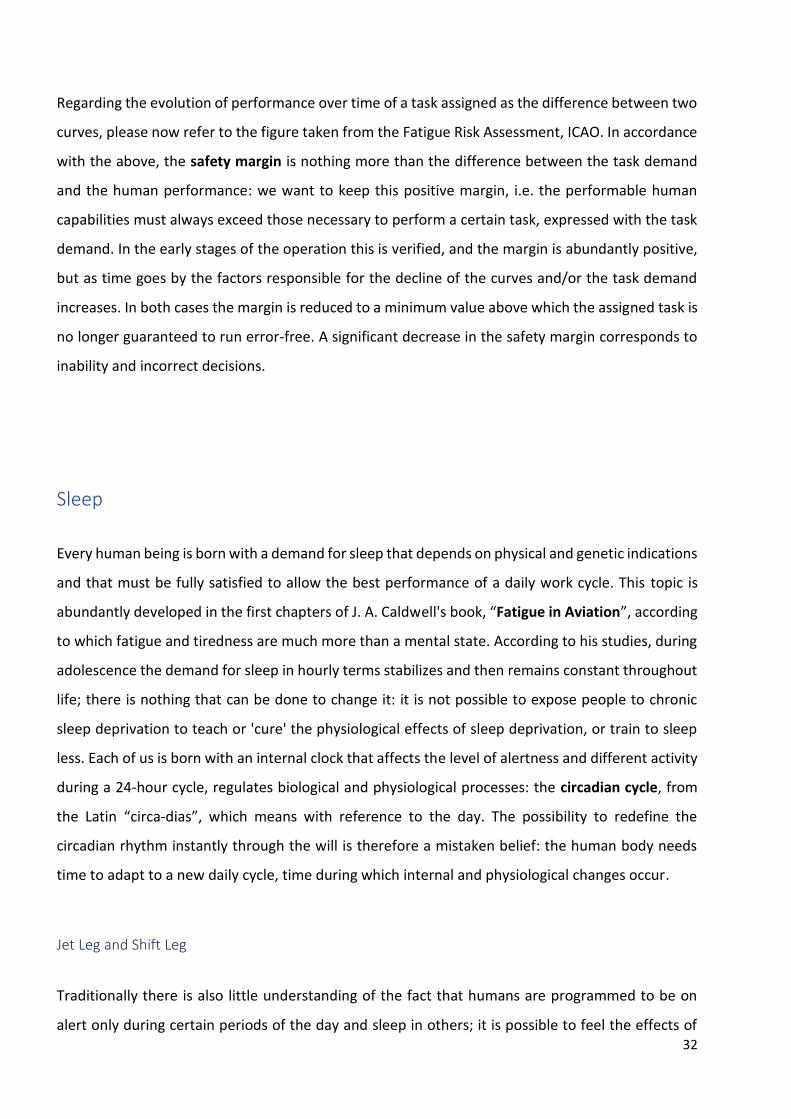
FIGURE 2-3 ALERTNESS LEVEL DURING THE DAY, OBTAINED AT NATIONAL HIGHWAY TRAFFIC SAFETY ADMINISTRATION WEBSITE. ............... 34
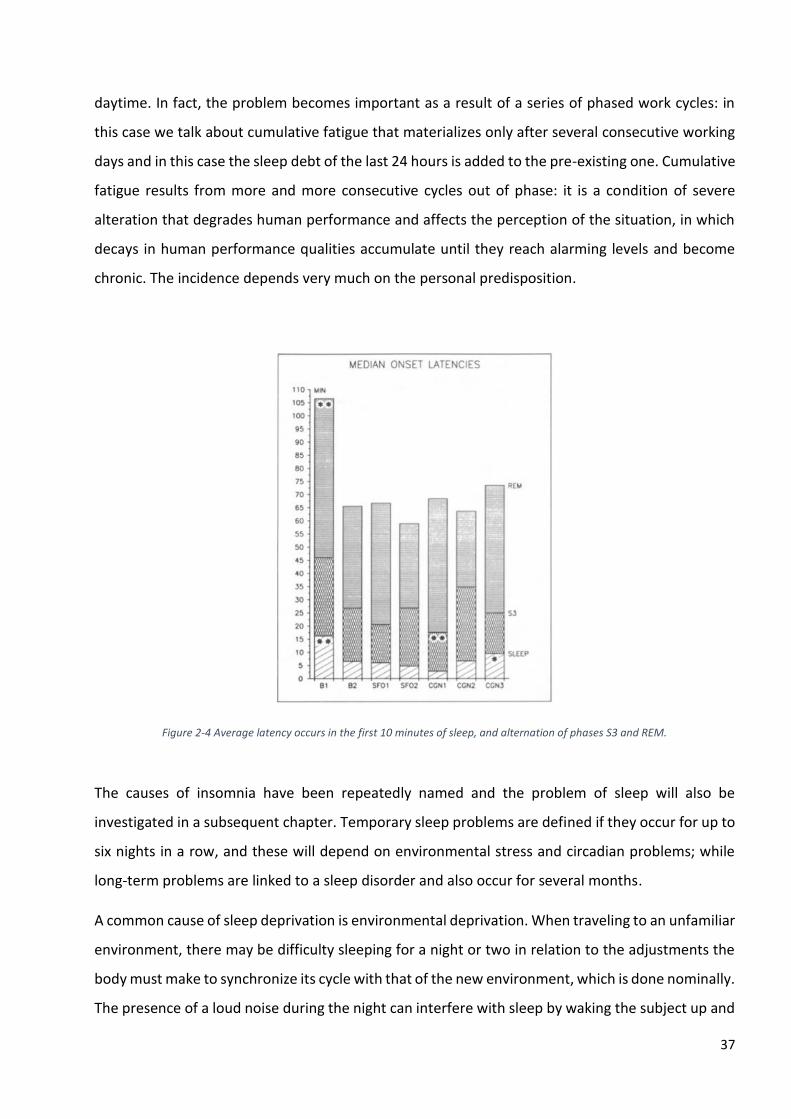
FIGURE 2-4 AVERAGE LATENCY OCCURS IN THE FIRST 10 MINUTES OF SLEEP, AND ALTERNATION OF PHASES S3 AND REM. ....................... 37
FIGURE 2-5 “WHY WE SLEEP” BY MATTHEW WALKER, THE DIRECTOR OF UC BERKELEY’S SLEEP AND NEUROIMAGING LAB. ..................... 38
FIGURE 2-6 THERMAL PHOTO OF THE LANDING GEAR COMPARTMENT. ............................................................................................ 42
FIGURE 2-7 AIR COOLING SYSTEM SCHEMA. ............................................................................................................................... 42
FIGURE 3-1 THE PERCENTAGE OF AVIATION ACCIDENTS AS THEY RELATE TO THE DIFFERENT PHASES OF FLIGHT. NOTE THAT THE GREATEST
PERCENTAGE OF THE TOTAL FLIGHT, ACCORDING TO FAA. ..................................................................................................... 44
FIGURE 3-2 MARGIN OF SAFETY IN ALL FLIGHT PHASES.................................................................................................................. 46
FIGURE 3-3 WOMBAT CONSOLE WITH DUAL JOYSTICKS, KEYPAD AND TRACKING TASK ON SCREEN. ...................................................... 47
FIGURE 3-4 THE 4-D MULTIPLE RESOURCE MODEL. ...................................................................................................................... 49
FIGURE 3-5 AN INSTANCE OF A MRT CONFLICT MATRIX................................................................................................................ 52
FIGURE 3-6 RATIO BETWEEN DAMAGING STRIKES AND ALL STRIKES IN THE USA BETWEEN 1990 AND 2018. .......................................... 54
FIGURE 3-7 ATMOSPHERE LAYER. ............................................................................................................................................. 60
FIGURE 3-8 AIR TURBULENCE GENERATION. ............................................................................................................................... 62
FIGURE 3-9 DIFFERENT TYPES OF ICE. ........................................................................................................................................ 64
FIGURE 3-10 AVERAGE INCREASE IN ESTIMATED TEMPERATURES ACCORDING TO THE VARIOUS SRES SCENARIOS. .................................... 67
TABLE 3-1 SUMMARY TABLE ON HEAT. ...................................................................................................................................... 68
TABLE 3-2 HSI. .................................................................................................................................................................... 72
FIGURE 4-1 HUMANS IMPACT ON THEIR ACTIVITIES: 80% OF TODAY'S ACCIDENTS ARE ATTRIBUTED TO HUMAN BEINGS (NTSB). ................ 75
FIGURE 4-2 TARGET PATTERNS OF TEN SHOOTS. .......................................................................................................................... 76
FIGURE 4-3 SUMMARISING THE DISTINCTIONS BETWEEN THE THREE ERRORS TYPES (REASON, 1990). ................................................... 80
FIGURE 4-4 DYNAMICS OF GENERIC ERROR MODELLING SYSTEM (GEMS) ...................................................................................... 82
FIGURE 4-5 FAMILIARITY X ATTENTION GRAPH. ........................................................................................................................... 83
FIGURE 4-6 BASIC FEED-BACK LOOP: THE DIFFERENCE BETWEEN THE OUTPUT AND INPUT SIGNALS......................................................... 88
TABLE 4-1 ICAO SMM RISK MATRIX SEVERITY X PROBABILITY. .................................................................................................... 92
TABLE 4-2 SEVERITY CLASSIFICATION BASED ON THE LEVEL OF FATIGUE PERCEPTION (SAMN-PERELLI CREW STATUS CHECK). .................... 93
TABLE 4-3 PROBABILITY OF OCCURRENCE DEFINITION. .................................................................................................................. 94
FIGURE 4-7 RISK MANAGEMENT (ICAO SMS COURSE). ............................................................................................................... 95
TABLE 4-4 SLEEP DEBT. .......................................................................................................................................................... 97
TABLE 4-5 CIRCADIAN FACTORS. .............................................................................................................................................. 97
TABLE 4-6 WAKEFULNESS. ...................................................................................................................................................... 97
9
TABLE 4-7 WORKLOAD FACTORS. .............................................................................................................................................. 98
TABLE 4-8 FATIGUE FACTOR ASSESSMENT AND MITIGATION TABLE: CGN -TSF -CGN. ...................................................................... 99
TABLE 4-9 COMPARISON OF DIFFERENT SHIFT TYPES. .................................................................................................................. 100
TABLE 4-10 THE FIRST TABLE IS THE OUTLINED VERSION OF THE BOX AT THE BOTTOM OF THE FORM IN TABLE ABOVE, THE SECOND ONE IS
APPLICABLE AFTER THE MITIGATION COLUMN HAS BEEN COMPLETED TO ASSESS THE ACCEPTABILITY OF THE REMAINING FATIGUE SCORE OF
THIS DUTY. ................................................................................................................................................................. 101
TABLE 4-11 FATIGUE FACTOR ASSESSMENT AND MITIGATION TABLE: MXP-FIR-DXB. .................................................................... 103
TABLE 4-12 FATIGUE FACTOR ASSESSMENT AND MITIGATION TABLE: DXB-PMF-MXP. .................................................................. 104
FIGURE 4-8 HUMAN ERROR PREDICTION PROCESS. ..................................................................................................................... 105
FIGURE 4-9 HTA OF AIRCREW TASK UNDER ICING CONDITION. ...................................................................................................... 107
TABLE 4-13 NOMINAL HUMAN UNRELIABILITY. .......................................................................................................................... 107
TABLE 4-14 EPC INTERPRETATION. ......................................................................................................................................... 108
FIGURE 5-1 REPRESENTATION OF THE HAZARD-BARRIER-ERROR BOND (SWISS CHEESE). ..................................................................... 111
FIGURE 5-2 RPD MODEL. ...................................................................................................................................................... 113
FIGURE 5-3 ADM AND SA. ................................................................................................................................................... 114
FIGURE 5-4 TEAMWORK IS THE KEY OF SUCCESS (EMIRATES). ....................................................................................................... 120
FIGURE 6-1 A SCHEMATIC OF THE THREE-PROCESS MODEL OF SLEEP REGULATION. ............................................................................ 123
FIGURE 6-2 WOCL DURING THE DAY CYCLE. ............................................................................................................................. 125
FIGURE 6-3 EFFECTS OF SLEEP DEPRIVATION ON BODY. ................................................................................................................ 127
FIGURE 6-4 SLEEP HOURS REQUIRED (NATIONAL SLEEP FOUNDATION). .......................................................................................... 128
TABLE 7-1 FLIGHT LIMITATION. ............................................................................................................................................... 130
FIGURE 7-1 CREW OPERATION SCHEDULE. ................................................................................................................................ 134
FIGURE 7-2 RELATIVE CHANGES IN DETRIMENTAL AND BENEFICIAL EFFECTS OF BRIEF, SHORT AND LONG NAPS FOLLOWING AWAKENING FROM
THE NAP. ................................................................................................................................................................... 136
FIGURE 7-3 BODY POSTURE AFFECTS EEG ACTIVITY (CALDWELL, 2016). ........................................................................................ 140
FIGURE 7-4 BLOOD PLASMA CONCENTRATIONS OF CAFFEINE. MEANS (IN MG/L) AND STANDARD ERRORS OF THE MEAN (VERTICAL BARS) ARE
SHOWN FOR 13 SUBJECTS. ............................................................................................................................................ 142
FIGURE 7-5 EFFECTS OF DIFFERENT MEDICATION ON SPIDERS. ....................................................................................................... 144
FIGURE 8-1 ALTERNATIVE ILLUSTRATION OF TEM MODEL. .......................................................................................................... 147
FIGURE 8-2 THE AERONAUTICAL WORLD IS A GREAT EXAMPLE OF COMPLEX SYSTEM: SO MANY COMPANIES WORKING TOGETHER SO AS SO
ACHIEVE A ONE ONLY MISSION, BRINGING THE 787. ........................................................................................................... 151
TABLE 8-1 CRM SKILLS LIST. ................................................................................................................................................. 153
FIGURE 9-1 COMPLETE REFERENCE GRAPHIC. ............................................................................................................................ 158
FIGURE 9-2 SIMPLIFIED GRAPH. .............................................................................................................................................. 160
FIGURE 9-3 VARIATION OF A TERM WITH TASK DEMAND. ............................................................................................................ 161
FIGURE 9-4 EQUIVALENT GRAPH. ............................................................................................................................................ 162
FIGURE 9-5 B TERM'S INFLUENCE ON PERFORMANCE. ................................................................................................................. 163
FIGURE 9-6 CHRONIC SLEEP RESTRICTION DEGRADES PERFORMANCE. ............................................................................................. 167
FIGURE 9-7 EFFECT OF TEMPERATURE AND PERCENTUAL HUMIDITY ON THE COMFORT ZONE, ACCORDING TO ASHRAE 55-1992.. ........... 168

10
FIGURE 9-8 NASA TASK LOAD INDEX. .................................................................................................................................... 169
11
List of Acronyms
AFM = Aircraft Flight Manual
ADI = Attitude Director Indicator
ADM = Aeronautical Decision Making
ADP = Adenosine Diphosphate
ADS-B = Automatic dependent surveillance – broadcast
AOM = Aerodrome Operating Minima
ARROW = Airworthiness certificate, Registration, Radio station license, Operating limitation
documents, Weight and balance information
ATIS = Automatic terminal information service
ATP = Adenosine Triphosphate
ATC = Air Traffic Control
CAA = Civil Aviation Authority
CFIT = Controlled Flight Into Terrain
CFS = Chronic Fatigue Syndrome
CGN = Cologne
C\I = Check-in
C\O = Check-out
CoA = Course of Action
CM = Crew Member
CR = Controlled Rest
CRM = Crew Resource Management
CVR = Cockpit Voice Recorder
DMT = Daily Mean Temperature
DXB = Dubai
EASA = European Union Aviation Safety Agency
ECAM = Electronic Centralized Aircraft Monitor
EEG = Electroencephalography
EHF = Excess Heat Factor
12
EMG = Electromyography
EOG = Electrooculography
EPR = Engine Pressure Ratio
ETOPS = Extended-range Twin-engine Operational Performance Standards
FAA = Federal Aviation Administration
FCSA = Flight Crew Situation Assessment
FDR = Flight Data Recorder
FDT = Flight Data Time
FIR = Florence
FL = Flight Level
FMS = Flight Management System
FOSA = Flight Operational Safety Assessment
FRAT = Flight Risk Assessment Tool
FRM = Fatigue Risk Management
FRMS = Fatigue Related Management System
FTA = Fault Tree Analysis
FTL = Flight Time Limitation
GEMS = Generic Error Modeling System
HEP = Human Error Probabilities
HEART = Human Error Assessment and Reduction Technique
HF = Human Factor
HFE = Human Failure Events
HR = Heart Rate
HRA = Human Reliability Analysis
HRV = Heart Rate Variability
HSI = Thermal Stress Index
HTA = Hierarchical Task Analysis
ICAO = International Civil Aviation Organization
ILS = Instrument Landing System
IPCC = Intergovernmental Panel on Climate Change
13
ISS = International Space Station
KSS = Karolinska Sleepiness Scale
LLWAS = Low Level Wind Shear Alert System
LVP = Low Visibility Procedure
OGHFA = Operators Guide to Human Factors in Aviation
MRT = Multiple Resource Theory
MXP = Milan
NASA = National Aeronautics and Space Administration
NASA-TLX = NASA Task Load Index
NCAR = National Centre for Atmospheric Research
NDM = Naturalistic Decision Making
NREM = No REM (slow wave)
NTSB = National Transportation Safety Board
PBN = Based Navigation
PIC = Pilot in Command
PF = Pilot Flying
PMF = Parma
PNF = Pilot Not Flying
PVT = Psychomotor Vigilance Test
REM = Rapid Eye Movement
RPD = Recognition-Primed Decision
RPN = Required Navigation Performance
RNP AR APCH = Required Navigation Performance Authorisation Required Approach
RVR = Runway Visual Range
SAS = Situation Assessment
SA = Situation Awareness
SCM = Suprachiasmatic Nucleus
SE = Situational Example
SKR = Skill-Rule-Knowledge
SMS = Safety Management System
14
SRES = Special Report on Emissions Scenarios
SRM = Safety Risk Management
SOPs = Standard Operating Procedures
SRS = Safety Risk Severity
SWS = Slow Wave Sleep
TAWS = Terrain Avoidance and Warning System
TCAS = Traffic Alert and Collision Avoidance System
TD = Task Demand
TEM = Threat and Error Management
TFS = Tenerife
TOC = Top Of Climb
TOD = Top Of Descend
UERF = Uncontained Engine Rotor Failure
UTC = Coordinated Universal Time
VSI = Vertical Speed Indicator
WHO = World Health Organization
WOCL = window of circadian low
15
Abstract
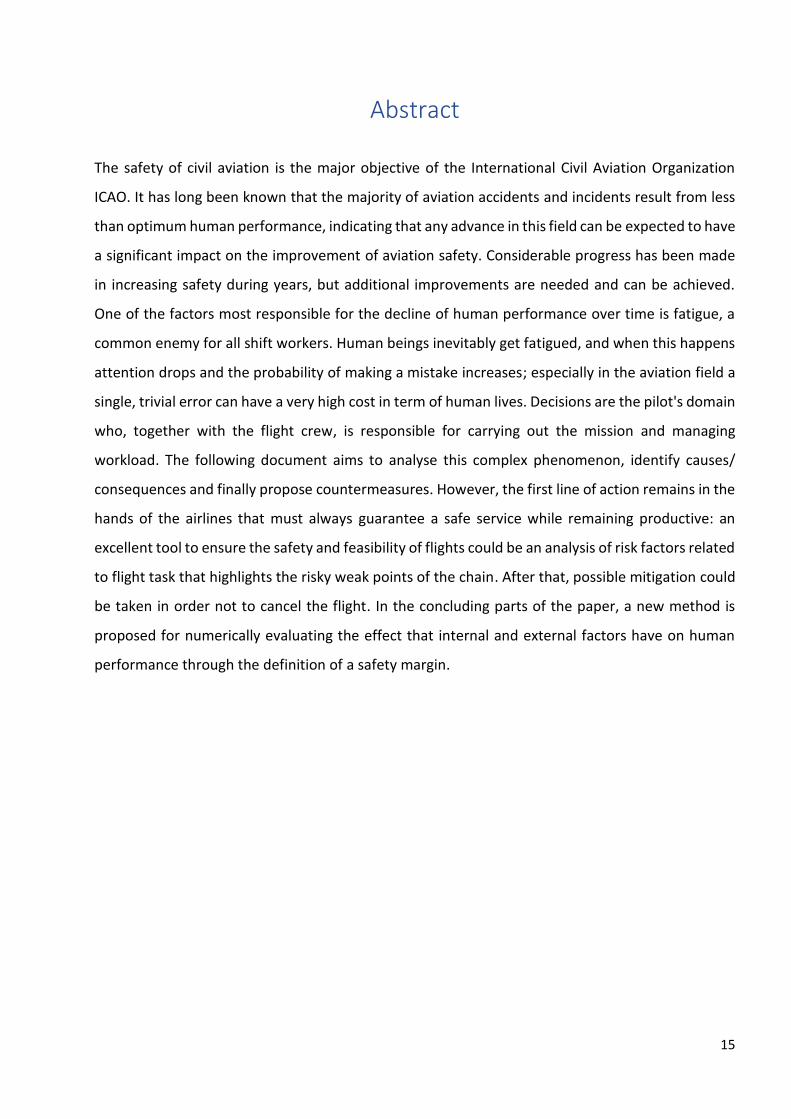
The safety of civil aviation is the major objective of the International Civil Aviation Organization
ICAO. It has long been known that the majority of aviation accidents and incidents result from less
than optimum human performance, indicating that any advance in this field can be expected to have
a significant impact on the improvement of aviation safety. Considerable progress has been made
in increasing safety during years, but additional improvements are needed and can be achieved.
One of the factors most responsible for the decline of human performance over time is fatigue, a
common enemy for all shift workers. Human beings inevitably get fatigued, and when this happens
attention drops and the probability of making a mistake increases; especially in the aviation field a
single, trivial error can have a very high cost in term of human lives. Decisions are the pilot's domain
who, together with the flight crew, is responsible for carrying out the mission and managing
workload. The following document aims to analyse this complex phenomenon, identify causes/
consequences and finally propose countermeasures. However, the first line of action remains in the
hands of the airlines that must always guarantee a safe service while remaining productive: an
excellent tool to ensure the safety and feasibility of flights could be an analysis of risk factors related
to flight task that highlights the risky weak points of the chain. After that, possible mitigation could
be taken in order not to cancel the flight. In the concluding parts of the paper, a new method is
proposed for numerically evaluating the effect that internal and external factors have on human
performance through the definition of a safety margin.

16
17
Chapter 1 OGHFA
Introduction
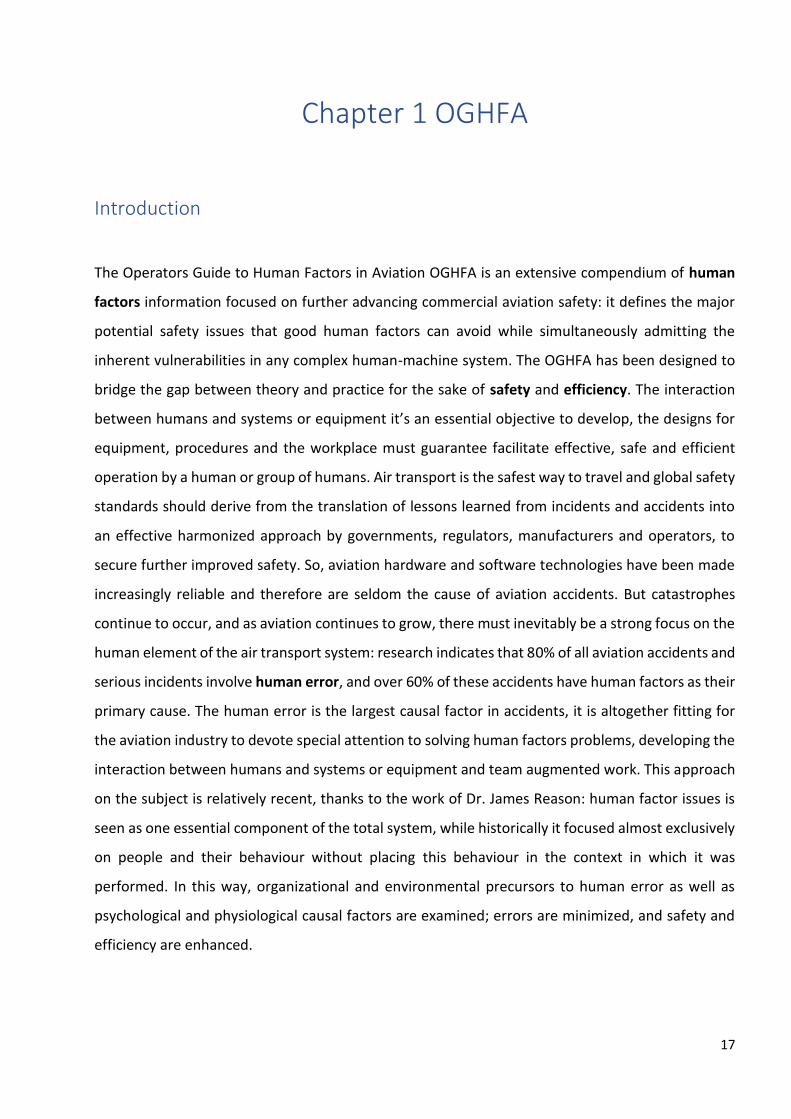
The Operators Guide to Human Factors in Aviation OGHFA is an extensive compendium of human
factors information focused on further advancing commercial aviation safety: it defines the major
potential safety issues that good human factors can avoid while simultaneously admitting the
inherent vulnerabilities in any complex human-machine system. The OGHFA has been designed to
bridge the gap between theory and practice for the sake of safety and efficiency. The interaction
between humans and systems or equipment it’s an essential objective to develop, the designs for
equipment, procedures and the workplace must guarantee facilitate effective, safe and efficient
operation by a human or group of humans. Air transport is the safest way to travel and global safety
standards should derive from the translation of lessons learned from incidents and accidents into
an effective harmonized approach by governments, regulators, manufacturers and operators, to
secure further improved safety. So, aviation hardware and software technologies have been made
increasingly reliable and therefore are seldom the cause of aviation accidents. But catastrophes
continue to occur, and as aviation continues to grow, there must inevitably be a strong focus on the
human element of the air transport system: research indicates that 80% of all aviation accidents and
serious incidents involve human error, and over 60% of these accidents have human factors as their
primary cause. The human error is the largest causal factor in accidents, it is altogether fitting for
the aviation industry to devote special attention to solving human factors problems, developing the
interaction between humans and systems or equipment and team augmented work. This approach
on the subject is relatively recent, thanks to the work of Dr. James Reason: human factor issues is
seen as one essential component of the total system, while historically it focused almost exclusively
on people and their behaviour without placing this behaviour in the context in which it was
performed. In this way, organizational and environmental precursors to human error as well as
psychological and physiological causal factors are examined; errors are minimized, and safety and
efficiency are enhanced.
18
Influences
One importing aspect of human factors is a person’s relationship and interaction with other people,
and aviation needs better interaction: communication is a crucial component pertaining to the
successful functionality of aircraft movement both on the ground and in the air. Another and
perhaps even more important human factors focus are on giving individuals important cues to the
existence of problem situations and conditions and suggesting proven methods to avoid or deal with
them. Anticipation of problems is one key to designing and operating systems that successfully avoid
accidents. All the difficulties derive from the variability of human behaviour and performance, and
often a human operator who has displayed exemplary performance for most of his career falls prey
to a human factors problem and contributes to an accident sequence. The behaviour of a flight crew
is influenced by a variety of factors that are both self-generated and external. These influences can
profoundly affect the crew’s actions and, in particular, their propensity to make errors, that are
unpredictable because the probabilistic nature of interaction factors. The human factors
information contained in the OGHFA is structured to assist in understanding and coping with:
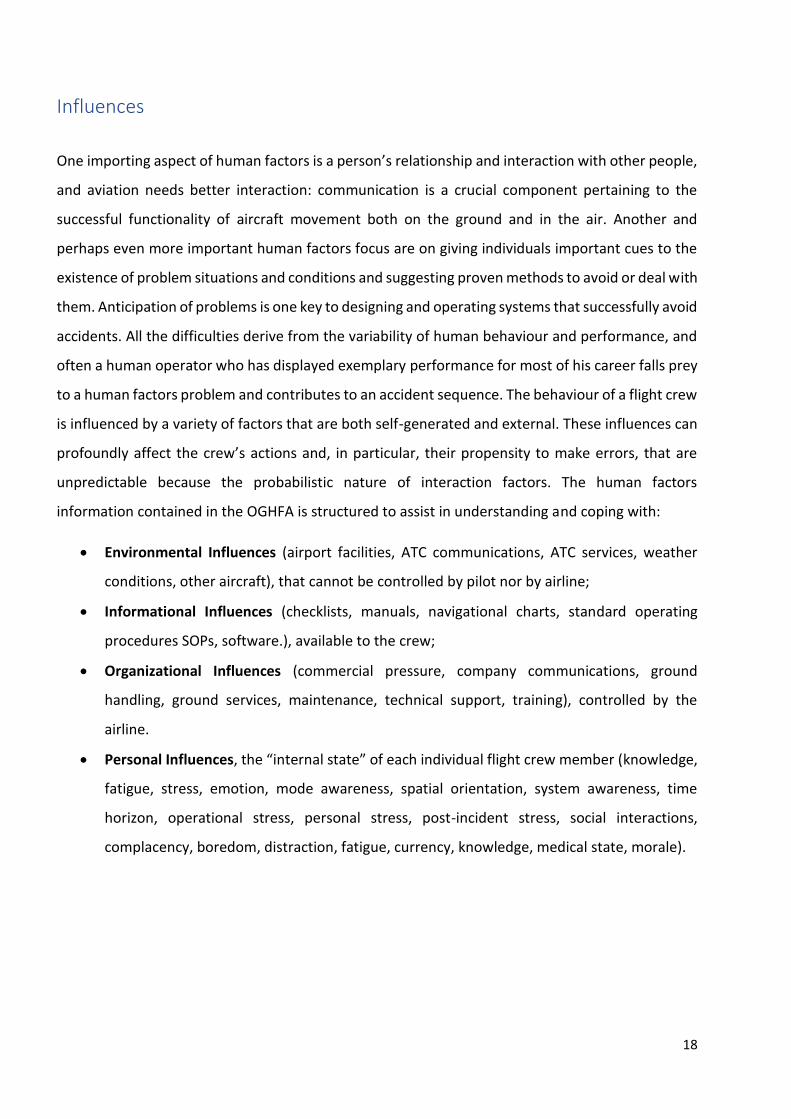
• Environmental Influences (airport facilities, ATC communications, ATC services, weather
conditions, other aircraft), that cannot be controlled by pilot nor by airline;
• Informational Influences (checklists, manuals, navigational charts, standard operating
procedures SOPs, software.), available to the crew;
• Organizational Influences (commercial pressure, company communications, ground
handling, ground services, maintenance, technical support, training), controlled by the
airline.
• Personal Influences, the “internal state” of each individual flight crew member (knowledge,
fatigue, stress, emotion, mode awareness, spatial orientation, system awareness, time
horizon, operational stress, personal stress, post-incident stress, social interactions,
complacency, boredom, distraction, fatigue, currency, knowledge, medical state, morale).
19
Situational Awareness
Figure 1-1 SA influences.
These influences are obvious, but a larger number are more difficult to discern: all affect the
situational awareness, decision making and therefore the probability of making an error. The right
human operator has to understand all influences and to channel them towards error reduction
rather than error generation. The situational awareness SA is the perception of elements in the
environment, within a volume of time and space and the project of that status in the near future, it
describes the pilot’s knowledge of what is going on around him, including flight conditions,
configuration and energy state of the aircraft as well as any other factors that could be about to
affect its safety. There are three levels: situation perceived, comprehended and projected.
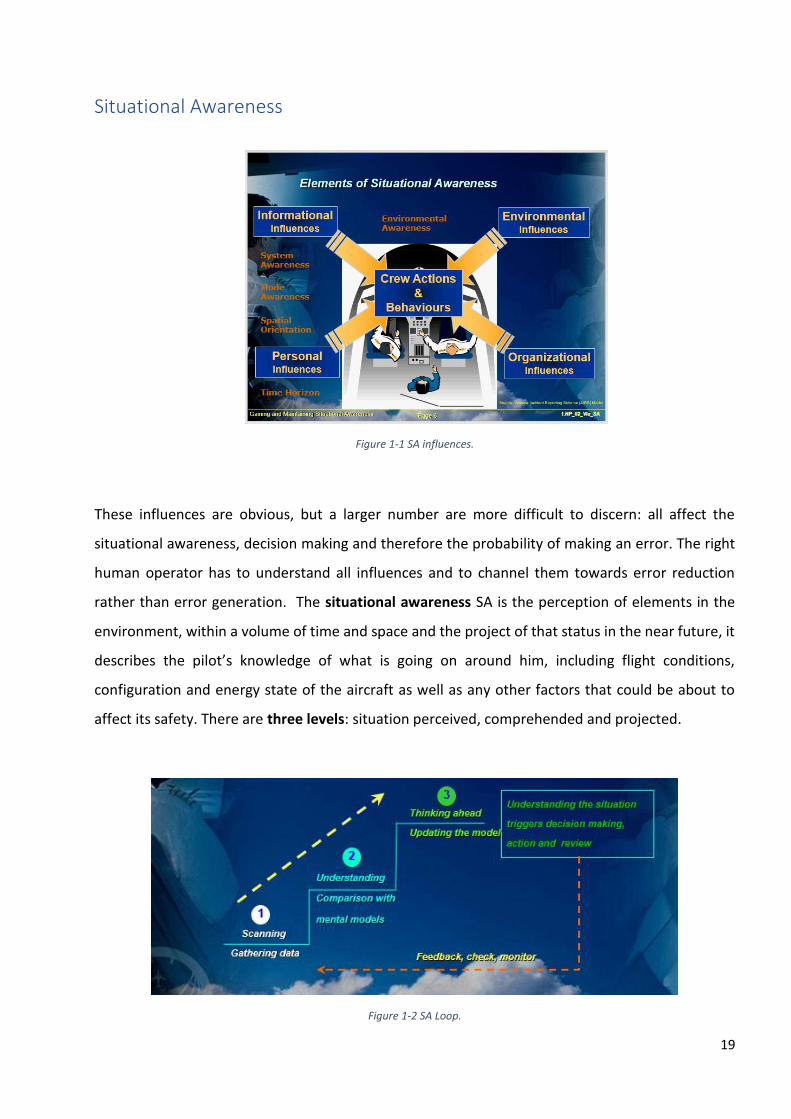
Figure 1-2 SA Loop.
20
First level is situation perception, and data accumulation: to build a solid and valid mental model of
the actual situation it is necessary to gather sufficient data using senses and information; the
attention must be direct to the most important aspects of the problem, in order to actively compare
actual situation with knowledge and experience. This mental model has to be kept updated with
inputs from the real world by paying attention to a wide range of information, so mental model is
not a static one: it’s a mixture created combining observations from the real world with knowledge
and experience recalled from memory. Understanding the situation is an active process and requires
significant discipline, as well as knowing what to look for, when to look for it and why. Next level is
about prediction: it is not enough to know the situation fully, but to make correct choices it is also
necessary to be able to anticipate unpleasant situations, predicting the consequences of one's own
actions; this step is crucial in the pilot’s decision-making process and requires that the
understanding, based on careful data gathering, be as accurate as possible. A major loss of
situational awareness occurs when inappropriate mental representations are activated in spite of
real world evidence. People then act “in the wrong scene,” and seek cues confirming their
expectations, a behaviour known as confirmation bias.
In order to gain and maintain SA it is important to stay ahead on the stick, alert and prepared to
anticipate the future situation and for decision making. Losses in SA may occur during periods of
high multitasking workload, inadequate feedback from other crewmembers, periods of stress and
interactions with automated systems. The potential consequences of inadequate situational
awareness include CFIT and loss of control or an encounter with severe air turbulence, heavy icing
or unexpectedly strong winds.
SA Analysis
The purpose of the next section is to model the situation awareness of flight crew as specific human
factors of a Required Navigation Performance Authorisation Required Approach RNP AR APCH
procedure implementation; a Situation Awareness analysis SA is required to manage influences of
shaping factor on human performance. RNP AR APCH is a family of navigation specifications under
Performance Based Navigation PBN which permit the operation of aircraft along a precise flight path
with a high level of accuracy, it can be used to reduced lateral and vertical obstacle clearance, follow
curved paths, improve safety, increase access in mountainous terrain and in congested airspace.
Human can be divided into two group: flight crew (operators) who interfere with the system directly
21
and managers who interfere with the system indirectly through the applications of Safety
Management System SMS. In accordance with ICAO, SMS is a systematic approach to managing
safety, including the necessary organisational structures, accountabilities, policies and procedures,
with the purpose of building and keeping safety barriers: the implementation of an SMS gives the
organisation’s management a structured set of tools to meet their responsibilities for safety defined
by the regulator and fosters the development of a positive corporate safety culture. All the
resources and criteria deployed by the organization to keep the RNP AR system operating safely are
categorized into six items called “Best practices of working safely”, the safety functions:
• Procedure and rules are formalized “normative” behaviour or method for rightly carrying
out an activity;
• Fatigue, workload and availability manpower: this factor emphasizes time-criticality, the
manpower planning aspects including the planning of work and the availability of critical
personnel at all times for emergency situations;
• Training, acquired skills and abilities deliver suitable and competent crew for overall
manpower planning, which can be improved with experience and practice;
• Communications refers to exchange of information and instructions between people via
verbal, written while coordination covers those mechanisms designed to ensure the smooth
interaction of actions between individuals and groups working on a joint task;
• Crew cooperation: personnel have to carry out their tasks according to the appropriate
safety criteria and procedures specified for the activities, also deviation from the procedures
can be necessary in some situations to which standard procedures do not apply;
• Equipment and human-machine interface, and the ergonomics of all the aspects of design,
selection of technology, purchase, installation, adjustment, maintenance and repair.
This last practice covers both appropriateness/friendliness of the interface for the specific activity,
and the maintenance-friendliness of equipment. A certain distinction is kept all along SA analysis
between hardware/software implementation of a function and a human/crew implementation: for
the avionics the items modelled are the main technical functions and the main interfaces, while for
flight crew, they are the fatigue, the procedures adherence, the training, the availability,
communication and commitment, probabilities described by means of the HEART method. The
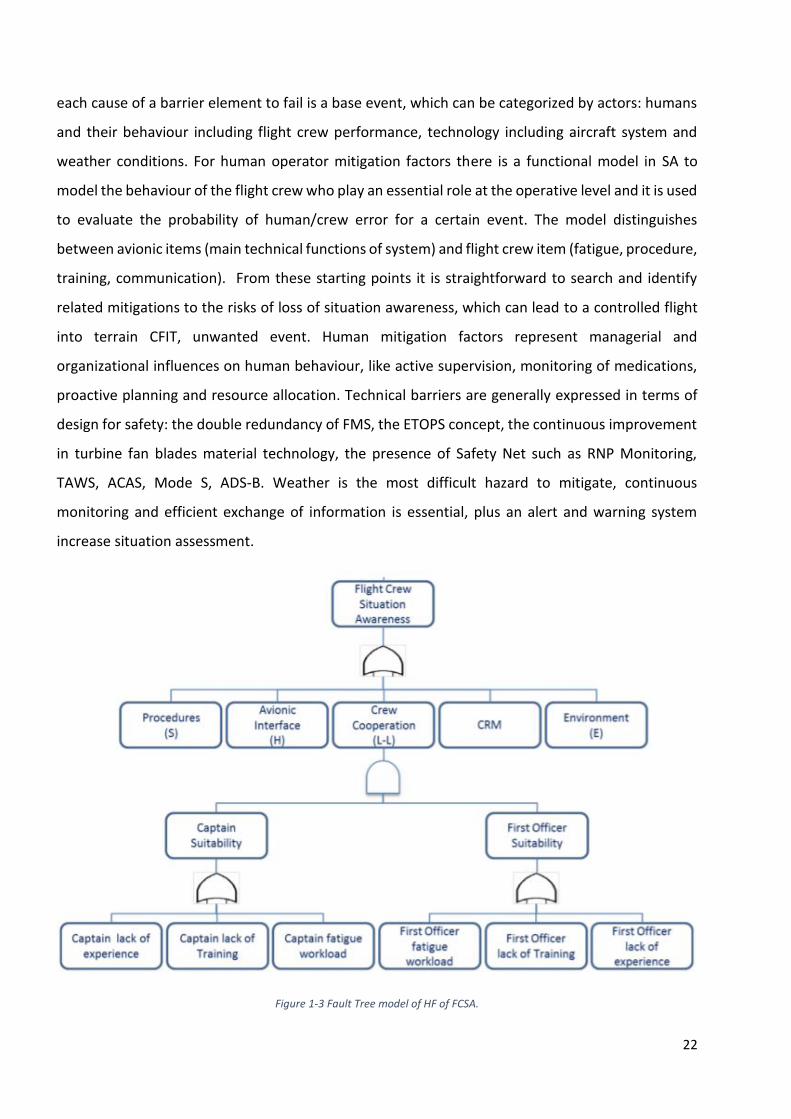
unwanted events are modelled in SA by the Fault Tree and subsequently with statistical models;
22
each cause of a barrier element to fail is a base event, which can be categorized by actors: humans
and their behaviour including flight crew performance, technology including aircraft system and
weather conditions. For human operator mitigation factors there is a functional model in SA to
model the behaviour of the flight crew who play an essential role at the operative level and it is used
to evaluate the probability of human/crew error for a certain event. The model distinguishes
between avionic items (main technical functions of system) and flight crew item (fatigue, procedure,
training, communication). From these starting points it is straightforward to search and identify
related mitigations to the risks of loss of situation awareness, which can lead to a controlled flight
into terrain CFIT, unwanted event. Human mitigation factors represent managerial and
organizational influences on human behaviour, like active supervision, monitoring of medications,
proactive planning and resource allocation. Technical barriers are generally expressed in terms of
design for safety: the double redundancy of FMS, the ETOPS concept, the continuous improvement
in turbine fan blades material technology, the presence of Safety Net such as RNP Monitoring,
TAWS, ACAS, Mode S, ADS-B. Weather is the most difficult hazard to mitigate, continuous
monitoring and efficient exchange of information is essential, plus an alert and warning system
increase situation assessment.
Figure 1-3 Fault Tree model of HF of FCSA.
23
Fault tree analysis is an optimal graphical tool to explore the causes of system level failures. All kind
of analysis starts defining the primary failure and the undesirable top event; then proceed to steps
by identifying first level contributors which are just below the top level using the available technical
information and link these contributors to top level event by using logical gates and relationship.
This must be done for every level, till calculate probability of lowest level elements occurrence and
measure the probabilities from bottom up. The Fault Trees present best estimates of the average
probabilities of events among commercial aircraft operations; there are two types of uncertainly:
variability due to natural randomness and the many influences, systemic uncertainty due to lack of
knowledge (it impossible to exactly know the probability of an event). The chosen systemic
uncertainty distribution is then combined with the variability distribution, because the functional
link of dependent events. In addition, when using a model to represent the reality a series of
structural uncertainties must be taken into account including data representativeness and
interpretation: there is presence of some degree of approximation, that could lead to some
evaluation errors in the predicted effects of model. Fault Tree Models attempt to represent
functional dependencies, to the maximum practical extent, in order to obtain base events that are
as independent as possible. Usually, the model is draft by mean of drawing tool implemented in a
spreadsheet like Excel; the key requirement is to verify that the Fault Tree has been constructed
correctly, through some independent and parallel review or numerical verification.
OGHFA Errors
It is impossible to complete eliminated the error, and there are different types:
• Slips, errors made when the operator doesn’t pay attention, or the plan is incorrectly carried
out;
• Lapses, they occur as a result of failing to carry out an intended action, usually due to a
memory failure;
• Mistakes, when people plan to do something, and carry out the plan accordingly, but it does
not produce the outcome wanted (inadequate execution of highly practiced normal
procedures);
• Violations involve deliberately (and consciously) departing from known and established rules
or procedures, a deviation from explicit guidance or SOPs;
24
• Routine violations, it results when a violation becomes what is normally done (the norm)
within the workplace, or for the operator as an individual.
• Situational violations, when there is a gap between what the rules or procedures require and
what the operator think is available or possible;
All pilots make small mistakes and, occasionally, more serious errors. Sometimes these errors are
prompted by circumstances that are known to predispose errors, so when there is a lack of local
resources, or a failure to understand real working conditions, this may increase the pressure to
ignore procedures. If error types and the factors that predispose errors are known, it may be
possible to improve procedures, training and design to eliminate error causes. However, since errors
will still occur even with the best prevention steps, it is important to include some mitigation in
dealing with human error: with the information in the OGHFA, based in the current state of art,
people can identify human factors “traps” and those situations that make it more likely to fail to
perform at the best or contribute to somebody else “having a bad day.” Learning and using human
factors knowledge is a work in progress as new material become available to supplement the
existing; but learning it’s not all and the ability to transfer theory into good practice in the proper
context is a skill that needs be developed.
The ultimate goal of the OGHFA is to create a strong bridge between theory and practice, to trigger
dynamic interactions between knowledge and experience that will improve problem solving and
judgment sense. In particular, the main objectives are:
• Improve the understanding of the consequences of the wrong behaviour and condition;
• Appreciate the safety and efficiency benefits of effective interactions among the humans in
the aviation system;
• Better understand the importance to safety and efficiency of effective interactions with your
tools, work rules and work environment;
• Learn techniques to optimize your performance and help maximize performances
maintaining safety;
Most of the resources in the OGHFA are intended for use by those engaged in flight operations,
flight training and ATC. In the end, thanks to the association of human factor principles with
situational examples the human operator will ultimately be able to systematically and easily relate
to any operations.
25
Chapter 2 Fatigue
Introduction
“FATIGUE” is a term used to cover all those changes that can be determined in the execution of an
activity, which can be traced back to the continuous exercise of that same activity under its normal
operating conditions; although no abnormal event occurs and the task performed may seem simple
and repetitive, it can be shown that during a certain period of time there is a deterioration in the
expression of that operation or, more simply, internal results to the task that are unexpected and
unwanted. Fatigue is a significant problem in modern society largely due to increasing work
demands, long periods of service, interruptions in the circadian rhythm, social needs and inadequate
sleep levels. It is a rather complex phenomenon that occurs depending on the time a person is
awake, the time of day, workloads, health status, responsibilities and lifestyle at work and outside.
Fatigue is also an inevitable consequence of modern industrial society for reasons such as the need
for 24/7 operations, rapid time zone transitions, inconsistent work schedules. From this point of
view the problem arises as a direct consequence of the overwork to which workers are subjected
by companies. In the aeronautical field, a classic work cycle implies the constant challenge to carry
out a well-defined routine, but characterized by uncontrollable factors, while ensuring that the
company remains profitable, passengers arrive safely where and when they want to arrive. Working
needs negatively affect internal circadian biological rhythms, moreover short and alternating
periods of inactivity, long movements and sub-optimal sleeping environments strongly degrade the
quality of sleep. There will therefore be individual differences in both sleep requirements and
fatigue tolerance, so some individuals are inherently more at risk than others. Excessive fatigue and
daytime sleepiness may also be chronic central nerve or peripheral system disorders and indicate
other common pathological states and diseases such as infections, asthma, metabolic disorders and
abnormalities.
26
The Problem
Fatigue has always been a concern for aviation. The International Civil Aviation Organization ICAO
defines fatigue as a psychological state of reduced mental and physical performance as a direct
result of lost sleep, prolonged wakefulness, circadian phases, workload (physical and/or mental
activity) that can endanger the ability and alert status of a crew member to operate an aircraft or
perform assigned tasks in relative safety. Fatigue therefore represents a human factor hazard as it
affects most aspects of a crew member's ability to work safely. It should be noted that the ICAO
definition includes both mental and physical fatigue under a single reference. Nevertheless, there is
a deep distinction between the two because mental fatigue is a direct result of loss of sleep and
circadian factors while physical fatigue is a high intensity effort. Despite the lack of concrete
scientific evidence about the impact of intense physical activity on the cognitive state, several
authors have concluded that exercise has a minimal impact on mental performance, while when
someone becomes mentally exhausted due to sleep deprivation or circadian desynchronization the
level of alert will certainly be negatively affected (while most critical aspects of physical performance
remain unchanged). At the same time in reference to the aeronautical case, physical actions and
intense muscular efforts are practically absent in a typical take-off-cruiser-landing mission of
medium/long duration performed by a pilot on a civil aircraft; for missions of extreme duration,
from 30 to 72 hours of continuous wakefulness, another problem, especially in the intermediate
phases, is the boredom that can induce drowsiness and distract the pilot but, since it is assumed
that the subject has not been deprived of sleep, and that in a typical aircraft cabin there are two
pilots this problem is certainly negligible. The fatigue that affects the vigilance and performance of
the pilot is the result of internal physiological changes that have not yet been fully understood.
However, it has been established that the manifestation of these changes goes far beyond the
control of individual will, motivation and professionalism, affecting sooner or later anyone. For
example, some studies have shown that fatigue is associated with slower brain activity, changes in
eye response, and other physiological changes that persist despite the presence of incentives or
consistent individual efforts. Fatigue is much more than a state of mind, however it is difficult to
quantify it due to the lack of specific biochemical markers and therefore a possible “fatigue test”
able to define precisely whether a worker is tired or not through perhaps a blood test, or the blood
27
rate. Despite the lack of indicators, we can certainly attribute fatigue to the name of a determining
factor in an accident, especially in conjunction with human error.
The causes
The U.S. company CIRCADIAN, a world leader in the search for solutions to optimize performance in
the world of work, suggests that one must consider the effect of fatigue on a human error in the
presence of:
• A substantial number of consecutive hours of service;
• An irregular work/sleep cycle;
• A consistent number of uninterrupted waking hours;
• The presence in the subject of sleep deprivation or an associated disorder;
• The level of physical and mental stress prior to the accident;
• Asphyxiating environmental factors, such as noise and light;
• Medications or drugs taken;
Since these factors, it seems that some of them are directly associated with sleep deprivation, and
others are related to the working environment and the type of work done and the effects of the
activity on the operator.
Task Demand
Aircraft pilots have many tasks to perform; these are normally shared between pilot flying PF and
pilot not flying PNF. The workload of the crew varies, even during routine flights, from low to high
and will increase in case of abnormal weather conditions or aircraft malfunctions. In case of high
workload, the flight crew is particularly vulnerable to errors if strategies for effective multitasking
prove inadequate. However, during periods of low workload (during cruising), a different type of
vulnerability to error may arise due to the low level of attention that characterizes this phase of
flight and sometimes even boredom. The aspect of the workload that will be considered in this
28
chapter is related to the task that is being performed regardless of the operating conditions. The
cockpit design has evolved considerably in the last 30 years: increasing the automation on the deck
flight, has allowed to add an important system management function to the stick-and-rubber flight,
such as the one to counteract the vibrational modes related to stability like the Dutch roll that makes
the flight uncomfortable. As a result, the mental workload of crews and air traffic controllers has
received more attention and has been reduced with the development of technologies. Workload is
an important focus because human beings can be misled if the demands of mental tasks exceed the
ability of human operators. In turn, the consequences of these mistakes could be critical and
harmful to safety and result in disastrous accidents. To respond to the increased automation, the
requirements imposed by the man-machine interface must be considered on a par with those of the
workload in order to avoid building machines that are incredibly useful, impossible to manage and
question. Therefore, a psychophysiological approach, called "psychophysiological engineering", is
necessary to the evaluation of human-machine interaction with regard to pilots. Workload can be
defined as the request, placed in terms of mental resources of a particular operator, used for the
purposes of attention, perception, in relation to decision-making processes and reasonable actions.
Since the human resources are limited, the required level may exceed the available one and under
these circumstances it is no longer possible to perform the assigned task in total safety, with the
reasonable certainty of not making mistakes: the workload, so defined, is the difference between
the available performance curve and those necessary to perform the task. In contrast to this, each
person will have a different nature and approach: because of these interpersonal differences, a
given task will not produce the same level of workload for all operators, rather the workload will
depend on: the operator's experience, task, training and skill levels pertinently developed in relation
to the task. A task may even produce a different workload for the same operator at a different time
depending on the state in which the task is to be performed. However, the workload is an individual
experience, and methods for measuring workload should be considered, taking into account human
variability.
The problem is presented in this section with special references to fatigue and developed in more
detail in a following chapter with a dedicated section on Dr. Wickens' researches (1984).
29
Six levels
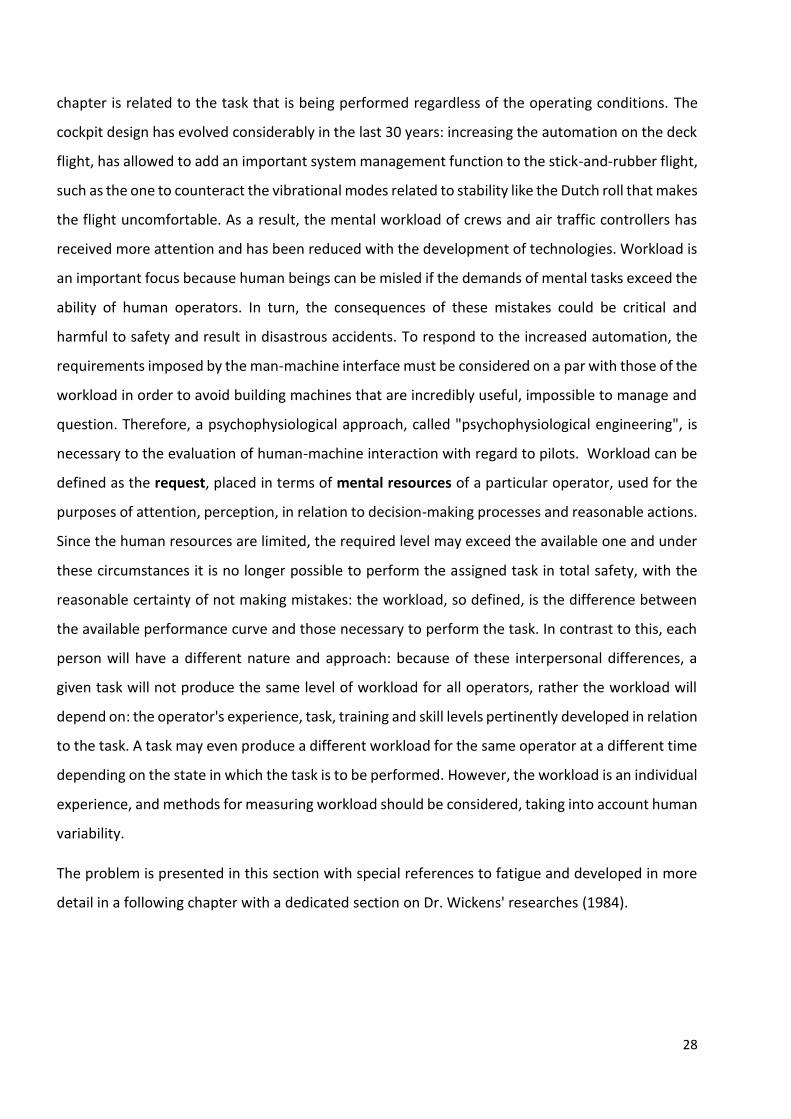
Figure 2-1 Relationship between workload and performance: six theoretical levels (de Waard,1996).
In the image is presented the depiction of the workload as a difference of the two curves, intended
as a margin that is reduced during a periodic cycle in which the performance task demand varies
from zero to a maximum value (intended as required performance) and then return to zero; the
performance of the operator instead is modified according to the free will of the same and the
demand of the task. In this model we refer to a specific task and see the presence of six different
regions in relation to the increasing demand:
1. in region D (deactivation) demand is low and performance is also low depending on the
condition of the operator who will be distracted to do so much more that he cannot meet
even the slightest demand;
2. in region A1 the operator's effort is now becoming important, so much so as to satisfy the
necessary condition to overcome the demand of the task that in the meantime settles at its
maximum value, the operator must guarantee from now on stability in performance;
3. in region A2 the performance is optimal, and the operator works at full load achieving an
adequate level of reliability;
4. the region A3 is characterized by performances that remain high, but the task demand rises
due to the type of operation carried out;
30
5. in region B demand begins to exceed capacity and operator performance declines
dramatically;
6. finally, in region C, performance is at a minimum, the operator is overloaded.
As already repeated several times the task demand is not the only factor that influences the effort
of a given task: as the time elapsed the operator becomes fatigued or environmental conditions can
change. Operator conditions (tiredness), environmental conditions, and variable task demand all
contribute to reducing the margin between the curves of the graph even if they intervene in a
different way. In fact, the first two become determinant only after a certain interval of time and act
directly on the performance, lowering them with decreasing trend over time, as in zone B.
Measurement
There are three types of workload measurements that have been widely used in support of human-
machine interface design: performance (direct performance measurements on reference tasks),
subjective evaluations (self-sufficient judgments issued by human operators), and physiological
parameters (measurement of operator body parameters).
The former, as can be seen in the figure, are not able to predict extreme conditions for tasks
characterized by increasing efforts, i.e. with variable performance, so they are integrated with other
types of measurements and can be used to make equivalences between the various performance
demands. There are three types of performance measurement widely used: measurement of a
primary task that directly addresses performance monitoring, number of errors and speed of
execution; measurement of a secondary task, to be understood as the calculation of unused capacity
to be engaged in other tasks, but without considering possible undocumented interactions (of little
interest); measurement of reference tasks, i.e. standardized tasks to which subjective and reference
measurements can be added.
The personal reports provide excellent ideas for the characterization of the workload. In aeronautics
the most frequently used self-reports are the Subjective Workload Assessment Technique (Papa and
Stoliker, 1988) and the NASA-Task Load Index (Bittner et al, 1989). The primary advantages consist
in the formulation of a document that is easy to compile directly by the operator after the task has
been performed. The disadvantages of personal reports are related to the fact that operators are
31
sometimes not aware of their internal changes and can misinterpret the signals with results that
can be influenced by different factors (e.g. psychosocial environment). These disadvantages can
often be overcome if subjective measures are supplemented by one of the other measurement
approaches by comparison.
Measuring the workload using physiological indications and biometric data is too high a claim,
however it is possible through relevant ECG electrocardiogram measurements: the HR heart rate
tends to rise in phases where the task demand rises; the HRV heart rate variability is used to
measure the mental workload, based on the assumption that the higher the workload the lower the
HRV. In recent years, HR has begun to chart in the frequency range and a decrease in power in the
mid-frequency band, also called the 0.10 Hz component, has been shown to be related to the mental
effort related to a task. One of the main limitations of spectral heart rate measurements is that they
can only be used in conjunction with detailed task observation and analysis because measurements
are very sensitive to slight variations in workload.
Risk
Figure 2-2 Time-dependent human performance (ICAO).
32
Regarding the evolution of performance over time of a task assigned as the difference between two
curves, please now refer to the figure taken from the Fatigue Risk Assessment, ICAO. In accordance
with the above, the safety margin is nothing more than the difference between the task demand
and the human performance: we want to keep this positive margin, i.e. the performable human
capabilities must always exceed those necessary to perform a certain task, expressed with the task
demand. In the early stages of the operation this is verified, and the margin is abundantly positive,
but as time goes by the factors responsible for the decline of the curves and/or the task demand
increases. In both cases the margin is reduced to a minimum value above which the assigned task is
no longer guaranteed to run error-free. A significant decrease in the safety margin corresponds to
inability and incorrect decisions.
Sleep
Every human being is born with a demand for sleep that depends on physical and genetic indications
and that must be fully satisfied to allow the best performance of a daily work cycle. This topic is
abundantly developed in the first chapters of J. A. Caldwell's book, “Fatigue in Aviation”, according
to which fatigue and tiredness are much more than a mental state. According to his studies, during
adolescence the demand for sleep in hourly terms stabilizes and then remains constant throughout
life; there is nothing that can be done to change it: it is not possible to expose people to chronic
sleep deprivation to teach or 'cure' the physiological effects of sleep deprivation, or train to sleep
less. Each of us is born with an internal clock that affects the level of alertness and different activity
during a 24-hour cycle, regulates biological and physiological processes: the circadian cycle, from
the Latin “circa-dias”, which means with reference to the day. The possibility to redefine the
circadian rhythm instantly through the will is therefore a mistaken belief: the human body needs
time to adapt to a new daily cycle, time during which internal and physiological changes occur.
Jet Leg and Shift Leg
Traditionally there is also little understanding of the fact that humans are programmed to be on
alert only during certain periods of the day and sleep in others; it is possible to feel the effects of

33
lack of sleep when this biological clock is out of phase with the external environment, as happens
with the well-known phenomenon of the jet leg. Think about travellers who are on vacation or at
work in a different continent for a week or more, the phenomenon is always problematic for the
first few days after arrival; they will soon be able to rewire the new sleep/work cycle although they
may now be exposed to consistently different environmental sets. Whenever a person travel from
one time zone to another and the difference is at least three hours, the body's rhythm goes out of
phase and the phenomenon arises. Another problem related to the circadian rhythm, occurs when
it is necessary to perform a work task at an unconventional time: think of a shift that starts at
midnight and ends at eight o'clock in the morning the next day. This uncomfortable but common
circumstance is known as shift leg and produces the same effect as the jet leg on fatigue, but the
disturbance is more difficult to return because of the phase opposition between daytime and
biological rhythm. In fact, when the sun rises and the light penetrates the window, the brain
perceives this stimulus as the beginning of a new day so it will tend to wake up, while after sunset
and the advent of darkness, there will be a tendency to rest. The means of transport have the task
of moving a group of passengers and must work even at non-standard times: from an economic and
social point of view the light and the evolution of the environment during the day, work against the
shift worker. During the day rest can be a problem, as during the night is staying awake; sleep
deprivation due to lack of sleepiness at night and insufficient hours of sleep, combined with
circadian factors, produces significant problems for the aircrew, so that the probability of making a
mistake rises, the mood is subdued and so an accident occurs. Night work poses serious safety risks.
Circadian Level
Historically, the most significant medical-scientific investigations to understand the circadian
rhythm can be attributed to the work of Dr. Nathaniel Kleitman. In 1938, helped by some colleagues,
he spends about a month in an isolated house with a single source of artificial light with the aim of
creating a new cycle consisting of 19 hours of activity and 9 hours of rest and to study the circadian
rhythm related; the result was that only one of the two subjects of the experiment came close to
the creation of the new body cycle while for the other a series of anomalies expressed through
irregular body temperatures, the main meter of the internal clock, arose. Subsequent experiments
demonstrated how any attempt to create a body cycle too different from that of 24 hours
determined poor results. The main reason comes from the fact that the human brain is wired for a
34
cycle of about 24 hours, is programmed to rest during the hours of darkness when the sun has set
and stay awake during the hours of light.
Figure 2-3 Alertness level during the day, obtained at National Highway Traffic Safety Administration website.
This comes from an evolutionary process lasted thousands of years and that allowed our ancestors
to live most of their lives when the sun was high in the sky and therefore, they could see the dangers
rather than protect themselves in a damp cave. From a physiological point of view this happens in
conjunction with the Earth's rotation and the visual stimulation of light because thanks to the ocular
retina this is transmitted to the biological clock of the brain through the suprachiasmatic nucleus
SCN, located above the optical chiasm and in front of the hypothalamus. Through a number of other
nerves, the SCN is connected to many other regions of the brain that directly control the behaviour,
in particular the task of the nucleus is to ensure that the body's rhythm is synchronized with the
daily rhythm. When everything is normal, the entire body works in harmony, although as waking
time progresses, there are fluctuations in normal biological rhythms that return with tolerable
repercussions; however, when something interrupts the body's program, rapid metabolic processes
occur due to the discordance of external and internal information that lead to circadian
desynchronization, which includes states of fatigue, malaise, anxiety, confusion, lack of motivation
and insomnia. The circadian system is fragile, and it takes time for the body to adjust, recondition
35
and in the best circumstances a new program in relation to the external environment: during this
interval the performance of a given operation will be compromised.
Sleep Phases
To understand the effect of sleep on the human body, it is necessary to study the whole complex
phenomenon first. For the study, historically, several experiments have been carried out and the
data have been collected and processed thanks to sensors placed on the head. These had the task
of measuring brain activity (electroencephalography, EEG), eye activity (electrooculography, EOG)
and muscle activity (electromyography, EMG). The output graphs from the different systems
appeared chaotic, until Dr. Kleitman's studies revealed a precise physiological order. In 1968, Dr.
Allan Rechtschaffen and Dr. Anthony Kales published a guide according to which it was possible to
standardize and classify sleep, dividing a classic night sleep into several phases. Comparing data
from all over the world, it soon became clear that the only way to maximize the alert state was to
guarantee seven to eight hours of sleep per night. When one is awake and alert, brain activity occurs
through fast and disorderly EEG with fluctuations of 12 cycles per second (beta activity); as soon as
eyes are closed and one relaxes, this intense complex activity gradually turn to a pattern consisting
of 8 cycles per second (alpha activity), while muscle tension is reduced and eye activity is virtually
absent.
Phase one of sleep is represented by the transition from wakefulness: during this phase there will
still be interaction with the external environment, in fact the ears continue to send information as
the brain prepares for rest. This is the state you usually find yourself in when sleep deprivation
fatigue takes over, typically you feel sleepy and can happen for example during a lesson, watching
TV or while behind the wheel. Characteristic of this phase are microlapses, that is, very short
intervals of time lasting a few seconds during which the brain falls asleep. Of course, this is allowed
while at home relaxing but during work these microsomnias can be extremely dangerous since they
happen unintentionally, people do not realize in the first place that they have occurred and do not
allow operators to properly manage tasks on a mission.
Phase one during a normal sleep period lasts a maximum of 10 minutes, while it presents itself as a
prolonged and continuous state when the body tries to stay awake. Next comes phase two, which
the researchers see as the true onset of sleep: the difference with phase one is seen in the EEG
36
where you notice the presence of unique waveforms (k-complexes and sleep spindles). This phase
has a maximum duration of 20 minutes.
At the end of phase two sleep arrives in its deepest stages and brain activity slows down even more.
New phases are indicated in the various diagrams by waves with a frequency of 1 cycle per second
(delta activity); these waveforms thus allow to classify phase three and phase four during which
slow wave sleep occurs, responsible for physical recovery: in these phases it is necessary a strong
external stimulation to wake the subject, much stronger than that required in the previous phases,
and also such a wake-up person will feel numb and unable to think lucidly for several minutes. The
presence of this state of drowsiness that remains even once awake takes the name of sleep inertia
and is present in different senses at each stage.
When about 30 minutes of slow-wave sleep have passed, brain activity has a surge that brings EEG
back to the typical phase two for a few minutes after which there is progression in the REM state
that stands for rapid eye movement, characteristic of mental rest. As a result of rapid eye
movements, the EEG activity of the brain becomes very fast and desynchronized; an inattentive look
at these diagrams might suggest a complete waking state but the person is clearly asleep. Another
factor that classifies this phase is the total absence of muscle tension: this is a mechanism of
adaptation of the brain that allows the restful subject not to make sudden movements since people
may be able to move in relation to the dreams they are making, which occur mainly at these stages.
In fact, it is possible to have multiple REM phases lasting up to 5 minutes interspersed with a return
to sleep in phase two. The progression of sleep through the stages allows to identify what happens
at night: sleep begins in phase one progresses quickly to phase two then three and four, and finally
phase two and REM phase intersperse in a cycle that lasts about 90 minutes. During the first half of
the night mostly shortwave sleep occurs, while in the second half REM sleep; the progression of the
various stages is modified by age, continuous waking time, the external environment and sleep
disturbances.
Sleep Losses
In aeronautics, virtually every operator has experienced the effects of fatigue. An insufficient
number of hours of sleep produces increasing tiredness and the need to rest to recharge the
batteries; working out of one's circadian rhythm poses an added difficulty than working during the
37
daytime. In fact, the problem becomes important as a result of a series of phased work cycles: in
this case we talk about cumulative fatigue that materializes only after several consecutive working
days and in this case the sleep debt of the last 24 hours is added to the pre-existing one. Cumulative
fatigue results from more and more consecutive cycles out of phase: it is a condition of severe
alteration that degrades human performance and affects the perception of the situation, in which
decays in human performance qualities accumulate until they reach alarming levels and become
chronic. The incidence depends very much on the personal predisposition.
Figure 2-4 Average latency occurs in the first 10 minutes of sleep, and alternation of phases S3 and REM.
The causes of insomnia have been repeatedly named and the problem of sleep will also be
investigated in a subsequent chapter. Temporary sleep problems are defined if they occur for up to
six nights in a row, and these will depend on environmental stress and circadian problems; while
long-term problems are linked to a sleep disorder and also occur for several months.
A common cause of sleep deprivation is environmental deprivation. When traveling to an unfamiliar
environment, there may be difficulty sleeping for a night or two in relation to the adjustments the
body must make to synchronize its cycle with that of the new environment, which is done nominally.
The presence of a loud noise during the night can interfere with sleep by waking the subject up and
38
making it impossible to go back to sleep, e.g. the presence of a strong source of light inside the room
can make the sleep intermittent; an environment too hot or cold can interfere with sleep in the
same way as a bed too hard or soft pillow can lead to uncomfortable positions taken during the
night. Obviously any other element negatively affects the quality of sleep think for example to the
hypothetical and unfortunate case of some passengers survived after a plane crash in a hostile
environment: to the above we should add the concern about ferocious animals and the consequent
stress in becoming a prey or the presence of annoying insects. Especially in the military field, pilots
may be negatively affected by logistical choices such as the creation of common tents with a large
number of individuals inside, or even the need during the war to be always ready to reach the
battlefield. The human being is a creature linked to the habitat in which he lives and when the
routine is interrupted it takes time to reconfigure: the speed of this adaptation can be greatly
increased by the use of simple measures such as bringing something familiar from home, using a
comfortable pillow, earphones and a light mask.
Another cause of short-term insomnia is related to the sleep program. Rest-work cycles are
frequently associated with sleep disorders since the body is unable to create a consistent and
regular routine. Long-range civilian pilots are continually confronted with misalignments between
the internal and environmental clocks due to their destinations. Military pilots are confronted with
these problems when crossing multiple time zones, particularly when traveling eastbound: on a trip
from Atlanta to Frankfurt they cross six time zones in less than a day and after that it will be very
difficult to fall as the body will still have the internal clock set six hours earlier. Circadian disorder
insomnia is difficult to manage, especially in the aviation field: the application of countermeasures
depends partly on the length of time during which the individual intends to remain awake and partly
on the type of activity to be performed.
Figure 2-5 “Why We Sleep” by Matthew Walker, the director of UC Berkeley’s Sleep and Neuroimaging Lab.
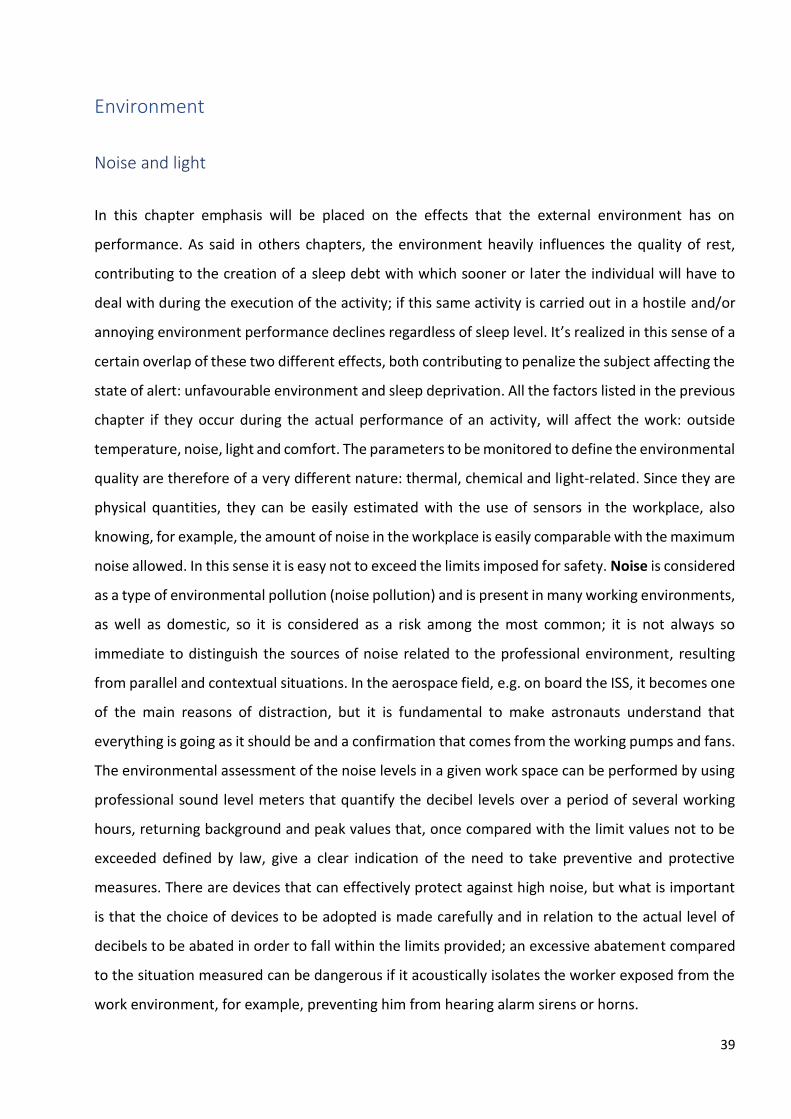
39
Environment
Noise and light
In this chapter emphasis will be placed on the effects that the external environment has on
performance. As said in others chapters, the environment heavily influences the quality of rest,
contributing to the creation of a sleep debt with which sooner or later the individual will have to
deal with during the execution of the activity; if this same activity is carried out in a hostile and/or
annoying environment performance declines regardless of sleep level. It’s realized in this sense of a
certain overlap of these two different effects, both contributing to penalize the subject affecting the
state of alert: unfavourable environment and sleep deprivation. All the factors listed in the previous
chapter if they occur during the actual performance of an activity, will affect the work: outside
temperature, noise, light and comfort. The parameters to be monitored to define the environmental
quality are therefore of a very different nature: thermal, chemical and light-related. Since they are
physical quantities, they can be easily estimated with the use of sensors in the workplace, also
knowing, for example, the amount of noise in the workplace is easily comparable with the maximum
noise allowed. In this sense it is easy not to exceed the limits imposed for safety. Noise is considered
as a type of environmental pollution (noise pollution) and is present in many working environments,
as well as domestic, so it is considered as a risk among the most common; it is not always so
immediate to distinguish the sources of noise related to the professional environment, resulting
from parallel and contextual situations. In the aerospace field, e.g. on board the ISS, it becomes one
of the main reasons of distraction, but it is fundamental to make astronauts understand that
everything is going as it should be and a confirmation that comes from the working pumps and fans.
The environmental assessment of the noise levels in a given work space can be performed by using
professional sound level meters that quantify the decibel levels over a period of several working
hours, returning background and peak values that, once compared with the limit values not to be
exceeded defined by law, give a clear indication of the need to take preventive and protective
measures. There are devices that can effectively protect against high noise, but what is important
is that the choice of devices to be adopted is made carefully and in relation to the actual level of
decibels to be abated in order to fall within the limits provided; an excessive abatement compared
to the situation measured can be dangerous if it acoustically isolates the worker exposed from the
work environment, for example, preventing him from hearing alarm sirens or horns.
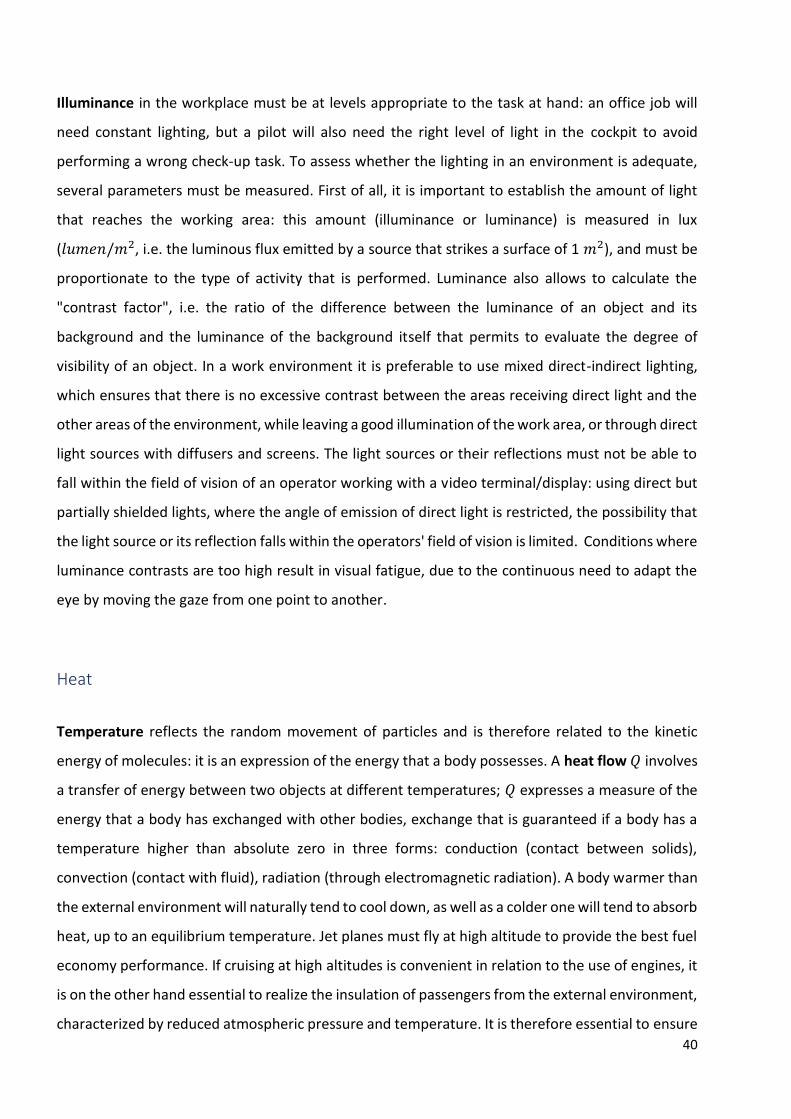
40
Illuminance in the workplace must be at levels appropriate to the task at hand: an office job will
need constant lighting, but a pilot will also need the right level of light in the cockpit to avoid
performing a wrong check-up task. To assess whether the lighting in an environment is adequate,
several parameters must be measured. First of all, it is important to establish the amount of light
that reaches the working area: this amount (illuminance or luminance) is measured in lux
(𝑙𝑢𝑚𝑒𝑛/𝑚2, i.e. the luminous flux emitted by a source that strikes a surface of 1 𝑚2), and must be
proportionate to the type of activity that is performed. Luminance also allows to calculate the
"contrast factor", i.e. the ratio of the difference between the luminance of an object and its
background and the luminance of the background itself that permits to evaluate the degree of
visibility of an object. In a work environment it is preferable to use mixed direct-indirect lighting,
which ensures that there is no excessive contrast between the areas receiving direct light and the
other areas of the environment, while leaving a good illumination of the work area, or through direct
light sources with diffusers and screens. The light sources or their reflections must not be able to
fall within the field of vision of an operator working with a video terminal/display: using direct but
partially shielded lights, where the angle of emission of direct light is restricted, the possibility that
the light source or its reflection falls within the operators' field of vision is limited. Conditions where
luminance contrasts are too high result in visual fatigue, due to the continuous need to adapt the
eye by moving the gaze from one point to another.
Heat
Temperature reflects the random movement of particles and is therefore related to the kinetic
energy of molecules: it is an expression of the energy that a body possesses. A heat flow 𝑄 involves
a transfer of energy between two objects at different temperatures; 𝑄 expresses a measure of the
energy that a body has exchanged with other bodies, exchange that is guaranteed if a body has a
temperature higher than absolute zero in three forms: conduction (contact between solids),
convection (contact with fluid), radiation (through electromagnetic radiation). A body warmer than
the external environment will naturally tend to cool down, as well as a colder one will tend to absorb
heat, up to an equilibrium temperature. Jet planes must fly at high altitude to provide the best fuel
economy performance. If cruising at high altitudes is convenient in relation to the use of engines, it
is on the other hand essential to realize the insulation of passengers from the external environment,
characterized by reduced atmospheric pressure and temperature. It is therefore essential to ensure
41
adequate environmental control in the cabin in terms of pressure, air composition and temperature
to passengers and crew. On all aircraft, pilots have the possibility to adjust the air temperature in
the cabin automatically or manually, keeping it between 18 °C and 32 °C. Air cooling is achieved by
means of air/air type heat exchangers, or refrigeration complexes, which cool the air drawn from
the propulsion system. The possibility of regulation is therefore managed by the air conditioning
system that takes a certain time to balance the temperature to the desired one: the effects of high
temperature can degrade the performance of the operator, in relation to the perceived
temperature which is influenced by many factors such as humidity and ventilation. To understand
how much the temperature affects an operation in flight, two different examples are considered.
The first of these is related to the Concorde, a supersonic airliner that at the flight altitude of 16000
m reached Mach 2; the temperature outside the reference altitude is about 216 K, so the current or
total shutdown temperature is around 130°C: obviously not all the fuselage is at the same
temperature, the temperature profile depends on the material and geometry of the aircraft, as well
as how much it dissipates in the coldest areas. The design choices of the engineers to reduce costs
and simplify the manufacturing led to the choice of duralumin as the dominant construction
material, with a maximum tolerable temperature of 127°C. Despite this, it was soon realized that in
other parts of the aircraft, such as on the leading edge and on the edges of the engines, the
temperature tended to exceed the maximum acceptable temperature. A cooling system similar to
the one successfully adopted years earlier on the US SR-71 was implemented: a network of tubes
enveloped the parts most exposed to overheating, circulating part of the fuel on board the aircraft,
which acted as coolant so that this heat could not reach the cabin. This operation is designed and
dimensioned to ensure the life of the aircraft. The second example concerns unforeseen flight
conditions: on March 13, 1961 a B-52 took off from a base in California with two Mark 39 hydrogen
bombs on board; after about 20 minutes of flight the commander noticed and communicated to the
ground station that an uncontrolled flow of hot air was entering the cabin from one of the vents.
No one on board was able to fix the fault so that after more than 10 hours of flight the temperature
in the cabin had reached 71°C, so high as to crumble one of the window seals and force the crew to
alternate in the cabin and take refuge in the hold. The situation fell when the breakdowns spread:
the plane crashed to the ground along with the precious cargo, while the entire crew evacuated and
ejected. The temperature fluctuations in an aircraft module, not to mention a space module, can
also make the working environment totally unliveable.
42
Figure 2-6 Thermal photo of the landing gear compartment.
Figure 2-7 Air cooling system schema.
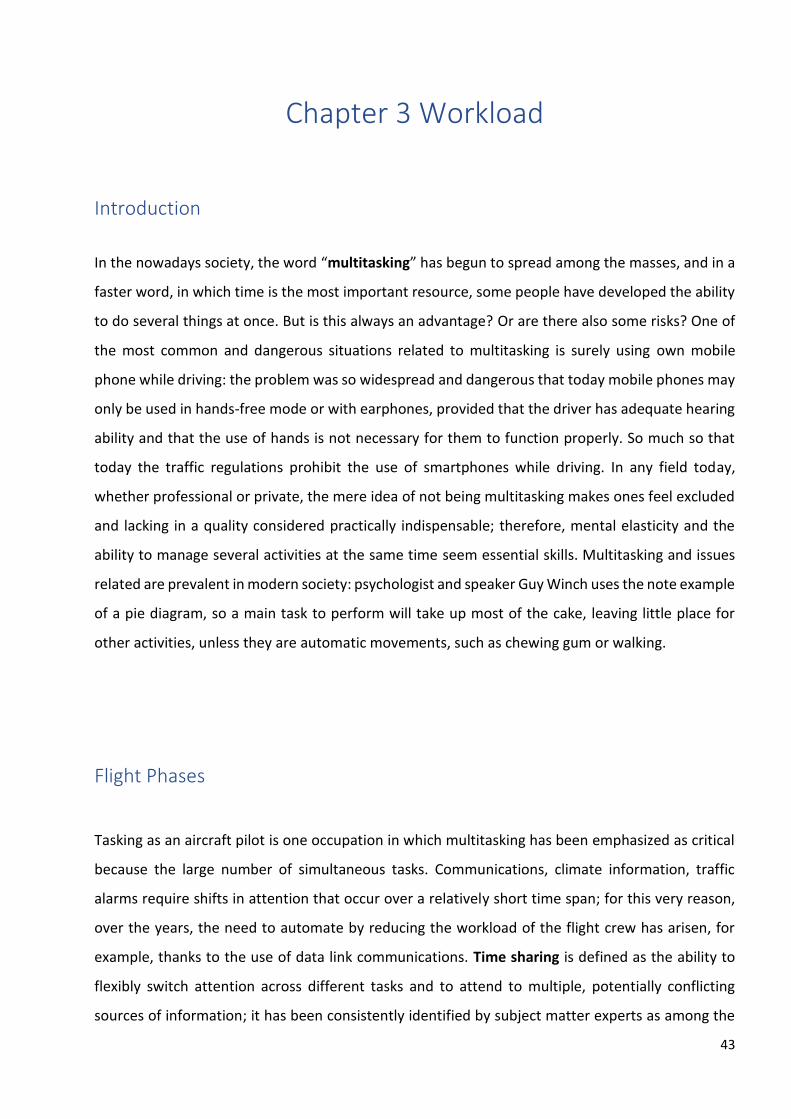
43
Chapter 3 Workload
Introduction
In the nowadays society, the word “multitasking” has begun to spread among the masses, and in a
faster word, in which time is the most important resource, some people have developed the ability
to do several things at once. But is this always an advantage? Or are there also some risks? One of
the most common and dangerous situations related to multitasking is surely using own mobile
phone while driving: the problem was so widespread and dangerous that today mobile phones may
only be used in hands-free mode or with earphones, provided that the driver has adequate hearing
ability and that the use of hands is not necessary for them to function properly. So much so that
today the traffic regulations prohibit the use of smartphones while driving. In any field today,
whether professional or private, the mere idea of not being multitasking makes ones feel excluded
and lacking in a quality considered practically indispensable; therefore, mental elasticity and the
ability to manage several activities at the same time seem essential skills. Multitasking and issues
related are prevalent in modern society: psychologist and speaker Guy Winch uses the note example
of a pie diagram, so a main task to perform will take up most of the cake, leaving little place for
other activities, unless they are automatic movements, such as chewing gum or walking.
Flight Phases
Tasking as an aircraft pilot is one occupation in which multitasking has been emphasized as critical
because the large number of simultaneous tasks. Communications, climate information, traffic
alarms require shifts in attention that occur over a relatively short time span; for this very reason,
over the years, the need to automate by reducing the workload of the flight crew has arisen, for
example, thanks to the use of data link communications. Time sharing is defined as the ability to
flexibly switch attention across different tasks and to attend to multiple, potentially conflicting
sources of information; it has been consistently identified by subject matter experts as among the
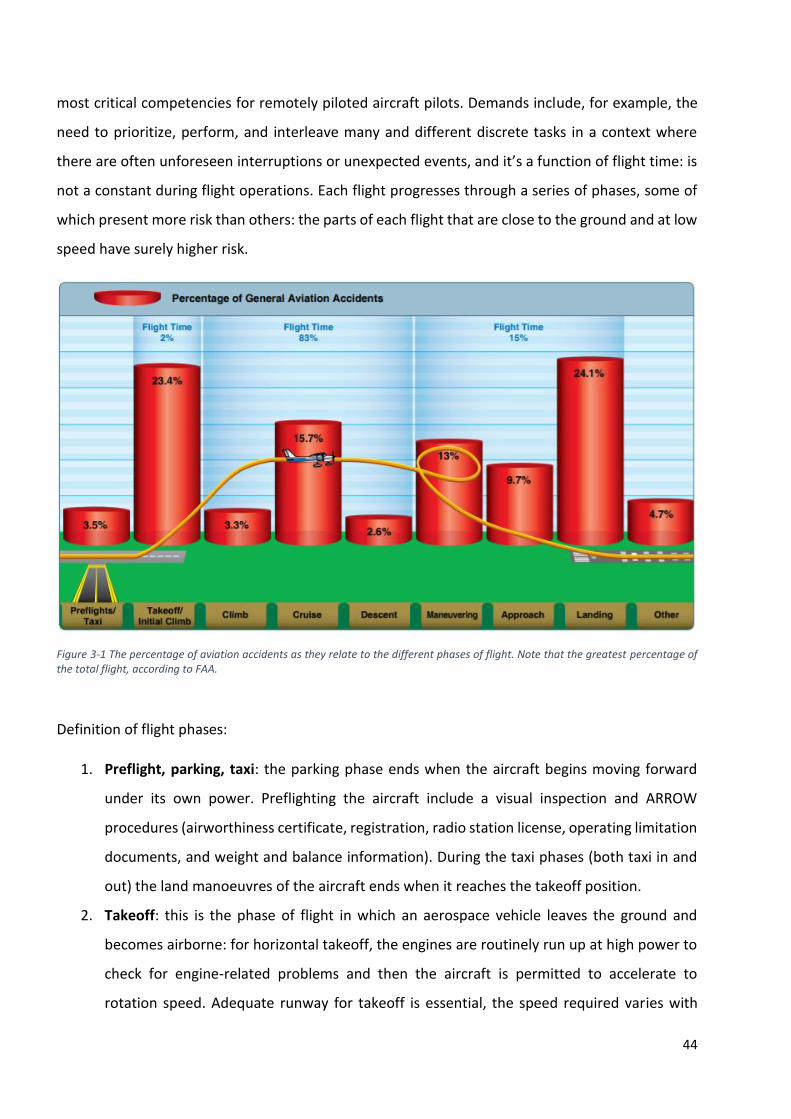
44
most critical competencies for remotely piloted aircraft pilots. Demands include, for example, the
need to prioritize, perform, and interleave many and different discrete tasks in a context where
there are often unforeseen interruptions or unexpected events, and it’s a function of flight time: is
not a constant during flight operations. Each flight progresses through a series of phases, some of
which present more risk than others: the parts of each flight that are close to the ground and at low
speed have surely higher risk.
Figure 3-1 The percentage of aviation accidents as they relate to the different phases of flight. Note that the greatest percentage of the total flight, according to FAA.
Definition of flight phases:
1. Preflight, parking, taxi: the parking phase ends when the aircraft begins moving forward
under its own power. Preflighting the aircraft include a visual inspection and ARROW
procedures (airworthiness certificate, registration, radio station license, operating limitation
documents, and weight and balance information). During the taxi phases (both taxi in and
out) the land manoeuvres of the aircraft ends when it reaches the takeoff position.
2. Takeoff: this is the phase of flight in which an aerospace vehicle leaves the ground and
becomes airborne: for horizontal takeoff, the engines are routinely run up at high power to
check for engine-related problems and then the aircraft is permitted to accelerate to
rotation speed. Adequate runway for takeoff is essential, the speed required varies with
45
aircraft weight and aircraft configuration. An engine stoppage because of fuel starvation or
exhaustion or birdstrike during the takeoff phase of flight is a real deal, often with fatal
consequences. When aborted, the crew reduces thrust during the run to stop the aircraft.
Typical takeoff accidents occur for: runway conditions, loss of control, takeoff stall,
crosswind and collisions with objects.
3. Climb: when at the defined speed, climb is the operation of increasing the altitude of an
aircraft. It is also the logical phase of a typical flight, used to develop 3D airways system and
because aeroplanes consume less fuel at high altitudes. Usually, multiple climb phases may
alternate with cruise phases and to reach the flight altitude a gradual climb is achieved to
improves forward visibility over the nose of the aircraft. The aircraft will climb steadily until
the excess thrust falls to zero, while climb phase ends when the aircraft reaches cruise
altitude.
4. Cruise: this phase begins when the aircraft reaches the initial cruise altitude. It ends when
the crew initiates a descent for the purpose of landing. Aircraft are designed to for optimum
performance at their cruise speed and jet engines have also an optimum efficiency level for
fuel consumption and power output. Mid-air collisions are quite rare.
5. Descend: this phase starts when the crew leaves the cruise altitude in order to land. It
normally ends when the crew initiates change in the aircraft’s configuration and speed in
view of the landing. It may, in some cases end with a cruise or climb to cruise phase. It’s not
a particularly critical phase, except for the possible explosive decompressions, an unplanned
and violent drop in the pressure of a sealed system, that require an emergency descent to
below 3000 m.
6. Go-around, manoeuvring, loiter: the phase of flight consisting of flying over some small
region, after an abort approach to the planned landing runway. It occurs at the end of the
flight, when the plane is waiting for clearance to land. Going around carries risks which
include failure to maintain control, impact with structure and can lead to a CFIT.
7. Approach: the descent and approach phase of flight extends from the beginning of the
descent from cruise altitude when the crew initiates changes in the aircraft’s configuration
and/or speed in view of the landing, until the aircraft reaches the runway threshold and is in
landing configuration. The category of approach depends on weather, visibility and the
airport instrumentation. This phase is critical because of the destabilising action of the
turbulence that can cause a stall.
46
8. Landing: the most critical phases, the last flight segment, that begins when the aircraft is in
the landing configuration and the crew is dedicated to land on a particular runway. It ends
when the touchdown occurs, and the aircraft’s speed is decreased to taxi speed. The landing
aircraft performance are affected by weight (that determines the landing distance required
by an aircraft), runway surface and slope, flap setting, effectiveness of aircraft brakes and
winds severity (crosswinds and tailwinds are more difficult, and therefore aircraft have
maximum limits for both; altimeters measure air pressure and altitude, Attitude and Heading
Indicators are used to show the aircraft’s orientation and direction, and the Vertical Speed
Indicator shows the rate of climb or descent). Typical landing accident are linked to loss of
directional control, retractable gear operation, engine failure (dead-stick landing) and
inadequate airspeed/attitude control. A hard landing occurs when an aircraft or spacecraft
hits the ground with a greater vertical speed and force than in a normal landing, and it can
cause extended damage and structure failure.
Figure 3-2 Margin of safety in all flight phases.
WOMBAT
To allow for an appropriate and personal prediction of a typical civil task involving multiple
concurrent inputs and response alternatives, a commercially available instrument is WOMBAT: an
unique aptitude and pilot selection test computerised widely used, measuring Situational
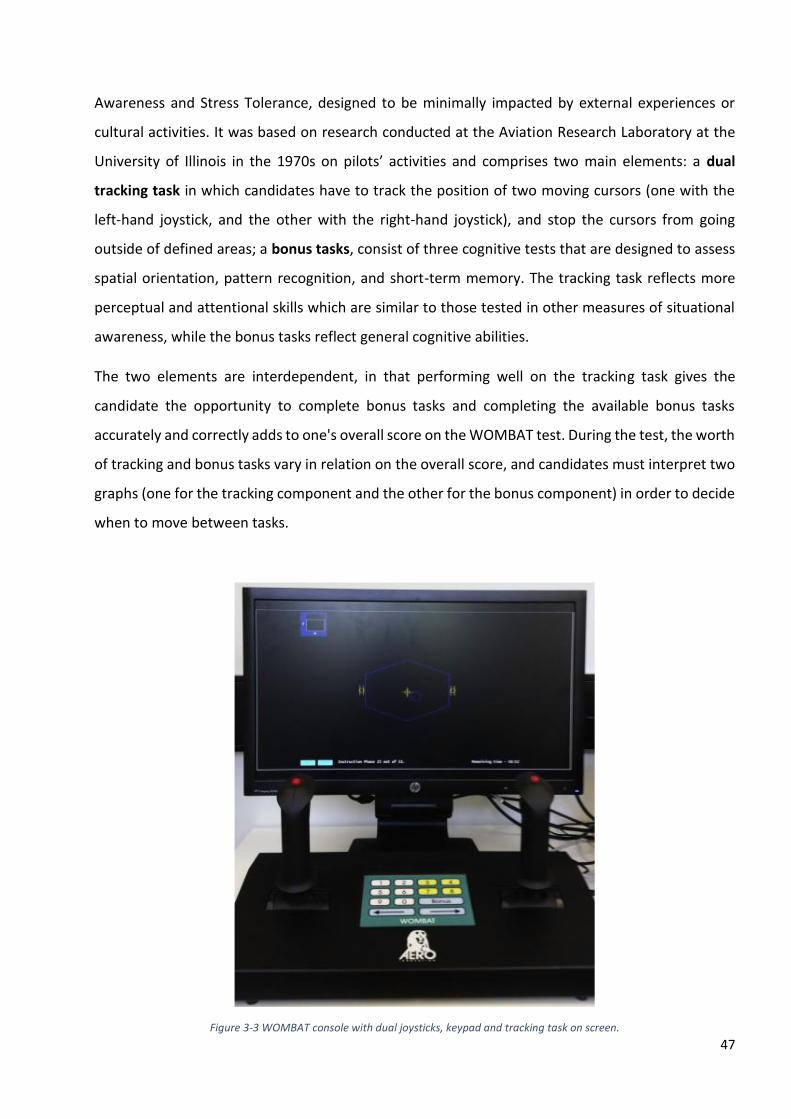
47
Awareness and Stress Tolerance, designed to be minimally impacted by external experiences or
cultural activities. It was based on research conducted at the Aviation Research Laboratory at the
University of Illinois in the 1970s on pilots’ activities and comprises two main elements: a dual
tracking task in which candidates have to track the position of two moving cursors (one with the
left-hand joystick, and the other with the right-hand joystick), and stop the cursors from going
outside of defined areas; a bonus tasks, consist of three cognitive tests that are designed to assess
spatial orientation, pattern recognition, and short-term memory. The tracking task reflects more
perceptual and attentional skills which are similar to those tested in other measures of situational
awareness, while the bonus tasks reflect general cognitive abilities.
The two elements are interdependent, in that performing well on the tracking task gives the
candidate the opportunity to complete bonus tasks and completing the available bonus tasks
accurately and correctly adds to one's overall score on the WOMBAT test. During the test, the worth
of tracking and bonus tasks vary in relation on the overall score, and candidates must interpret two
graphs (one for the tracking component and the other for the bonus component) in order to decide
when to move between tasks.
Figure 3-3 WOMBAT console with dual joysticks, keypad and tracking task on screen.
48
Some WOMBAT tests were conduct by C. Caponecchia and published in 2008 in “Applied
Ergonomics” magazine, with the aim to examine whether the WOMBAT situational awareness pilot
selection test is predictive of trainee pilot performance comparing flight time taken to achieve flying
training milestones. Sixty students enrolled in a Bachelor of Aviation (Flying) degree across three
training cohorts were recruited for the study; results exanimated refers to the flight time taken to
achieve flying training milestones, as well as instructor ratings of performance. The test procedure
is very simple: the candidate sits in front of a desktop computer and interacts with it using a special
WOMBAT console, joysticks and keypad; after a practise period to understand rules and after the
test phase begins and normally lasts for max 90 minutes, although it can be shortened as
determined by the needs of the organization; only one important number, the final score, is
normally used to compare tests: high WOMBAT scores were associated with better flight
performance.
Understanding what the WOMBAT measures and how this relates to ab-initio pilot performance is
not just an academic exercise. It is of practical concern, because understanding how the test works
may help to identify key skills or attributes that could either be screened in a simpler or faster
manner or identify ways to help foster these skills in trainees. Understanding the mechanisms of
the test can help refine training protocols and strategies to support student learning, which goes
well beyond merely selecting appropriate candidates. This may be a particularly necessary
development given the increasing demand for pilots into the future. Students scoring higher on
WOMBAT achieved key milestones earlier than those with lower scores, according to Caponecchia.
This has implications for the selection of student pilot candidates as the demand for trained pilots
increases around the globe. Several avenues of future research should be pursued, including
examining the predictive value of WOMBAT of later operational performance of pilots; the use of
additional objective measures of performance to compare with WOMBAT assessments and
corroborate it; and the performance of WOMBAT in predicting out-comes in other transport and
industrial domains.
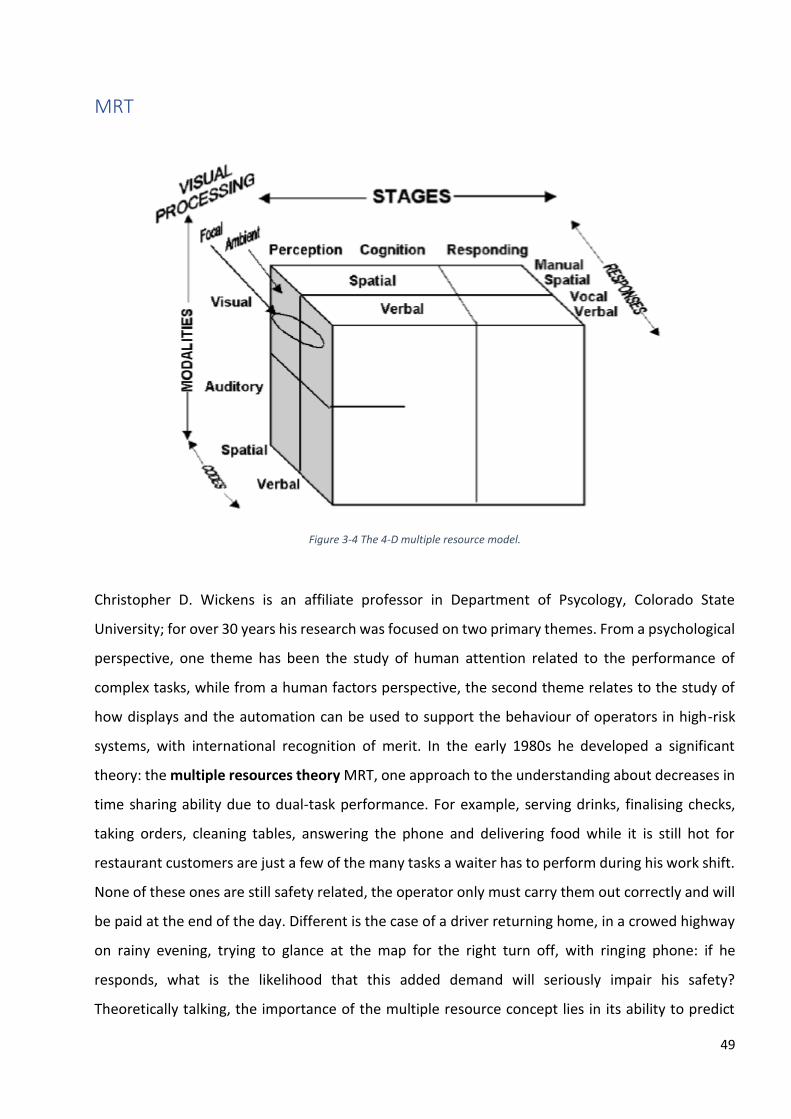
49
MRT
Figure 3-4 The 4-D multiple resource model.
Christopher D. Wickens is an affiliate professor in Department of Psycology, Colorado State
University; for over 30 years his research was focused on two primary themes. From a psychological
perspective, one theme has been the study of human attention related to the performance of
complex tasks, while from a human factors perspective, the second theme relates to the study of
how displays and the automation can be used to support the behaviour of operators in high-risk
systems, with international recognition of merit. In the early 1980s he developed a significant
theory: the multiple resources theory MRT, one approach to the understanding about decreases in
time sharing ability due to dual-task performance. For example, serving drinks, finalising checks,
taking orders, cleaning tables, answering the phone and delivering food while it is still hot for
restaurant customers are just a few of the many tasks a waiter has to perform during his work shift.
None of these ones are still safety related, the operator only must carry them out correctly and will
be paid at the end of the day. Different is the case of a driver returning home, in a crowed highway
on rainy evening, trying to glance at the map for the right turn off, with ringing phone: if he
responds, what is the likelihood that this added demand will seriously impair his safety?
Theoretically talking, the importance of the multiple resource concept lies in its ability to predict
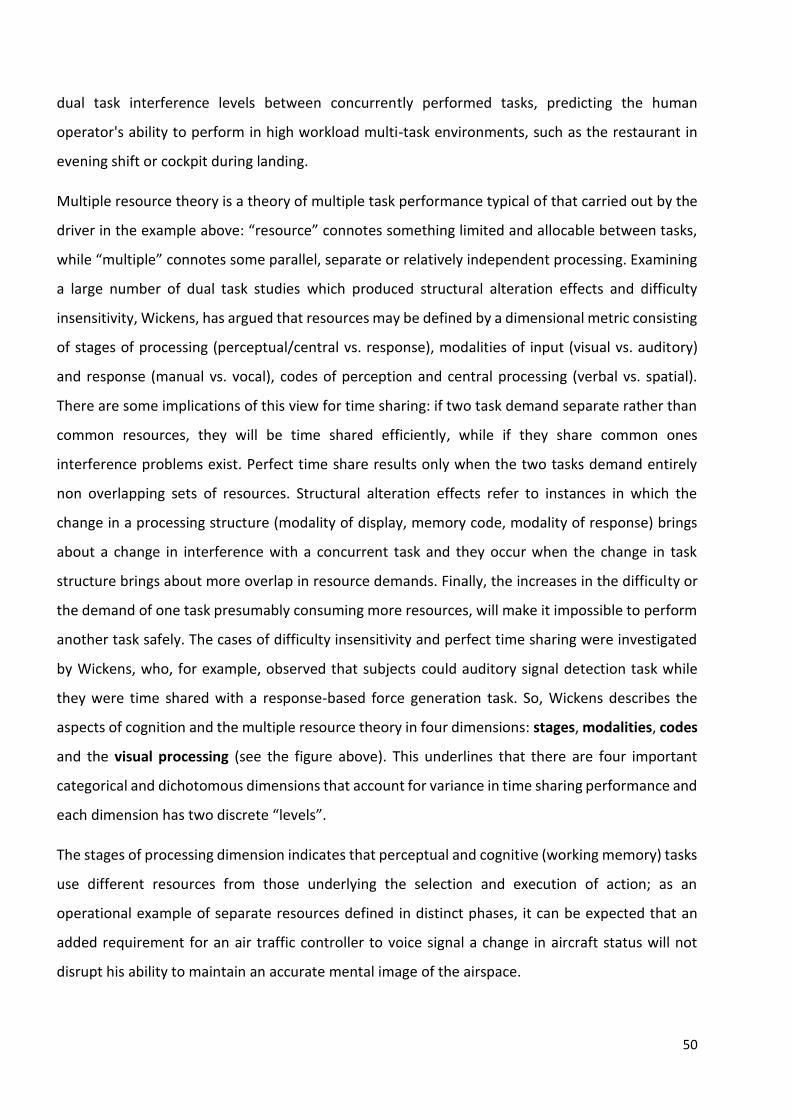
50
dual task interference levels between concurrently performed tasks, predicting the human
operator's ability to perform in high workload multi-task environments, such as the restaurant in
evening shift or cockpit during landing.
Multiple resource theory is a theory of multiple task performance typical of that carried out by the
driver in the example above: “resource” connotes something limited and allocable between tasks,
while “multiple” connotes some parallel, separate or relatively independent processing. Examining
a large number of dual task studies which produced structural alteration effects and difficulty
insensitivity, Wickens, has argued that resources may be defined by a dimensional metric consisting
of stages of processing (perceptual/central vs. response), modalities of input (visual vs. auditory)
and response (manual vs. vocal), codes of perception and central processing (verbal vs. spatial).
There are some implications of this view for time sharing: if two task demand separate rather than
common resources, they will be time shared efficiently, while if they share common ones
interference problems exist. Perfect time share results only when the two tasks demand entirely
non overlapping sets of resources. Structural alteration effects refer to instances in which the
change in a processing structure (modality of display, memory code, modality of response) brings
about a change in interference with a concurrent task and they occur when the change in task
structure brings about more overlap in resource demands. Finally, the increases in the difficulty or
the demand of one task presumably consuming more resources, will make it impossible to perform
another task safely. The cases of difficulty insensitivity and perfect time sharing were investigated
by Wickens, who, for example, observed that subjects could auditory signal detection task while
they were time shared with a response-based force generation task. So, Wickens describes the
aspects of cognition and the multiple resource theory in four dimensions: stages, modalities, codes
and the visual processing (see the figure above). This underlines that there are four important
categorical and dichotomous dimensions that account for variance in time sharing performance and
each dimension has two discrete “levels”.
The stages of processing dimension indicates that perceptual and cognitive (working memory) tasks
use different resources from those underlying the selection and execution of action; as an
operational example of separate resources defined in distinct phases, it can be expected that an
added requirement for an air traffic controller to voice signal a change in aircraft status will not
disrupt his ability to maintain an accurate mental image of the airspace.
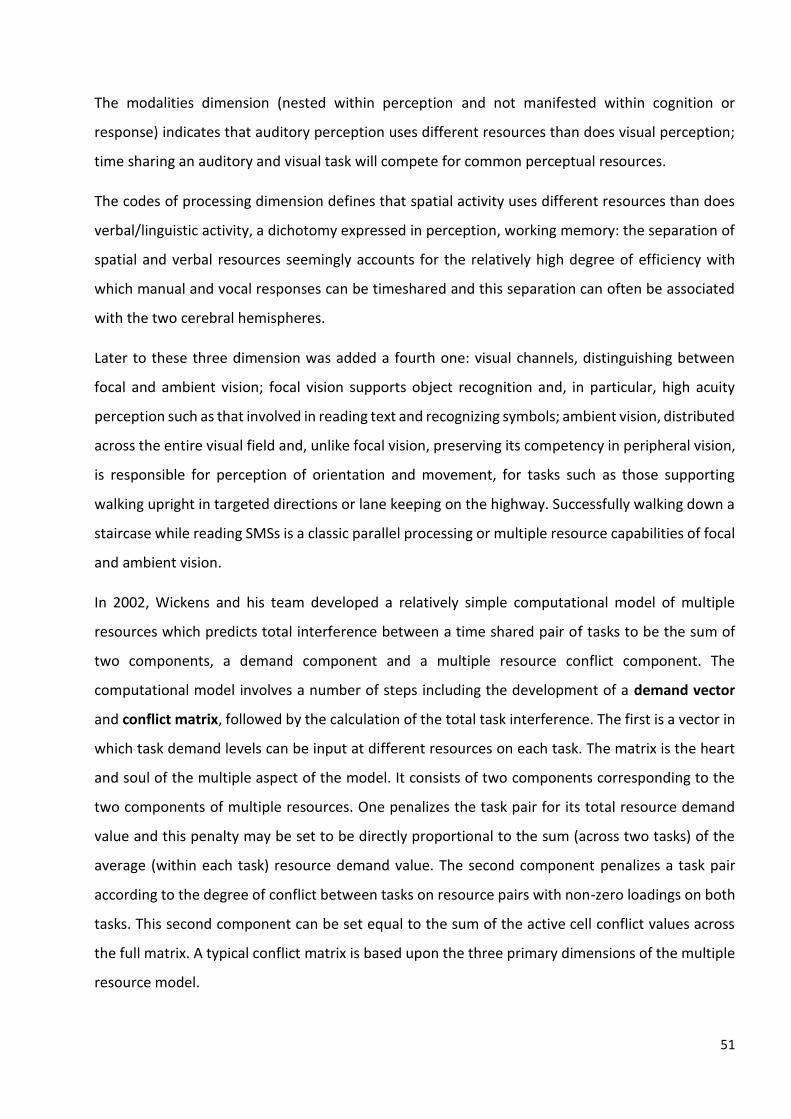
51
The modalities dimension (nested within perception and not manifested within cognition or
response) indicates that auditory perception uses different resources than does visual perception;
time sharing an auditory and visual task will compete for common perceptual resources.
The codes of processing dimension defines that spatial activity uses different resources than does
verbal/linguistic activity, a dichotomy expressed in perception, working memory: the separation of
spatial and verbal resources seemingly accounts for the relatively high degree of efficiency with
which manual and vocal responses can be timeshared and this separation can often be associated
with the two cerebral hemispheres.
Later to these three dimension was added a fourth one: visual channels, distinguishing between
focal and ambient vision; focal vision supports object recognition and, in particular, high acuity
perception such as that involved in reading text and recognizing symbols; ambient vision, distributed
across the entire visual field and, unlike focal vision, preserving its competency in peripheral vision,
is responsible for perception of orientation and movement, for tasks such as those supporting
walking upright in targeted directions or lane keeping on the highway. Successfully walking down a
staircase while reading SMSs is a classic parallel processing or multiple resource capabilities of focal
and ambient vision.
In 2002, Wickens and his team developed a relatively simple computational model of multiple
resources which predicts total interference between a time shared pair of tasks to be the sum of
two components, a demand component and a multiple resource conflict component. The
computational model involves a number of steps including the development of a demand vector
and conflict matrix, followed by the calculation of the total task interference. The first is a vector in
which task demand levels can be input at different resources on each task. The matrix is the heart
and soul of the multiple aspect of the model. It consists of two components corresponding to the
two components of multiple resources. One penalizes the task pair for its total resource demand
value and this penalty may be set to be directly proportional to the sum (across two tasks) of the
average (within each task) resource demand value. The second component penalizes a task pair
according to the degree of conflict between tasks on resource pairs with non-zero loadings on both
tasks. This second component can be set equal to the sum of the active cell conflict values across
the full matrix. A typical conflict matrix is based upon the three primary dimensions of the multiple
resource model.
52
Figure 3-5 An instance of a MRT conflict matrix.
A challenge to the model is the need to better accommodate the concept of resource allocation, or
the distribution of resources between two time shared tasks, whatever their conflict level may be.
Of particular concern, are the phenomena that may characterized under the general labels of
“engagement”. These are circumstances in which one task demands or attracts so much attention
to itself that full attention is given to that task and consequently, multiple resources and
performance prediction the concurrent task is essentially dropped altogether. In aviation simulation
studies, Helleberg and Wickens (2000) found that auditory as contrasted with visual delivery of a
side task, performed concurrently with a visual flight task, would indeed compete for fewer
resources, but could also interrupt the visual flight task entirely. This interruption resulted as the
pilot turns momentarily to deal with the incoming auditory message, a finding consistent with the
review of basic research in auditory-visual time sharing. Such discrete interruption of the ongoing
flight task is much less likely to take place when the message is delivered visually. Thus, it will be
important to understand the conditions in which engagement, or other intrinsic characteristics that
lead to pronounced allocation effects, override, or at least offset, many of the benefits offered by
resource separation. In conclusion, despite the absence of much empirical validation of the
computational multiple resource model, there are many instances in which the human operator is
53
carrying out performance (including non-observable cognitive activity) of two or more tasks at once.
Basic psychology and neurophysiology must identify the characteristics of human information
processing that make such endeavours more, or less, successful. The analysis and prediction of
human productivity and safety in high workload environments requires models to predict such
differences.
Task Complications
In the next chapter three potential dangers typical of flight operations are presented and described:
although each pilot is trained to safely perform an assigned and planned task, the hazards and errors
related cannot be completely predicted and therefore eliminated altogether. In this way a task
becomes more complicated and the safety margin can be reduced to such an extent that a
catastrophe can occur. The birdstrike phenomenon is widespread in airports all over the world, but
mainly on runways located in areas with a high concentration of fauna and flora: when it occurs in
a critical phase of the flight it poses a serious safety risk, especially if the aircraft involved is of
modest dimensions; weather, on the other hand, is the factor that most escapes human control and
if the weather conditions are heavily adverse then it is even necessary to change the flight plan.
Birdstrike
For bird strike is meant an involuntary collision between a flying bird/bat and an aircraft, a common
and significant threat to aircraft safety. It’s a risk for both parts involved: for birds, the collision with
an aircraft is a lethal danger, the consequences for the involved aircraft are usually not as severe.
Bird strikes may occur during any phase of flight but are most likely during daytime, the take-off,
initial climb, approach and landing phases due to the greater numbers of birds in flight at lower
altitudes; the impact between the two objects occurs at high speed, so despite the small mass of
the bird the damage to the aircraft can be considerable and significant enough to create a high risk
to continue safe flight. For an equivalence, just consider that the impact with a 6 kg bird at 130 kt
(the speed of a landing 737 aircraft) is equivalent to a weight of half a ton dropped from a height of

54
3 meters. The nature of aircraft damage, from a medium sized bird, depends on the aircraft: small,
propeller-driven aircraft are most likely to experience the hazardous effects of strikes as structural
damage, such as the penetration of flight deck windscreens or damage to control surfaces or the
empennage; larger jet-engined aircraft are most likely to experience the hazardous effects of strikes
as the consequences of engine ingestion and then a mid-air critical power loss. In some case,
windscreen penetrations may result in serious injury to pilots, damage to electrical equipment and
sensors or at higher altitude bird strike to a pressurised aircraft can cause structural damage to the
aircraft fuselage which can lead to rapid depressurisation. The loss of control at high speed and
flying altitude is always a critical situation during which the pilot must make decisions quickly and
promptly, like a rejected take off or an aborted landing. The aviation community strongly invests in
measures to minimize the risk of bird strikes.
Figure 3-6 Ratio between damaging strikes and all strikes in the USA between 1990 and 2018.
Bird strikes are regular events. Depending on the country, average bird strike rates between 2.83
and 8.19 per 10,000 aircraft movements were reported in civil aviation for the past years, but only
two to eight percent of all recorded strikes results in actual damage, second CAA. Some typical
scenarios:
55
• A flock of medium-sized birds is struck by a jet transport on three out of four engines at 200
feet; the results are one engine disabled completely and two others sufficiently damaged to
the extent of only producing reduced thrust, so an emergency landing is necessary;
• Wing seriously structural damaged by a single strike with a big bald eagle during climb, which
results in a control loss and CFIT;
• A light aircraft, ready to land, hits by a bird who breaks through the windscreen up to pilot
who temporarily loses control so that upon recovery finally lands with the cabin in panic.
The probability of bird strikes is determined by many parameters such as altitude, time of day,
environmental conditions, geographical location, season and the aircraft itself. Habitat features,
including open areas of grass and transient water as well as shrubs and trees, provide food and
roosting sites and can be a significant bird attractant. According with R. Dolbeer, an American
biologist, 88% of the bird strikes in the USA over the past 27 years have occurred below 2500 ft so
the probably of an unwanted event decreases with increasing altitude but a higher kinetic energy
due to increasing size and aircraft speed is related with high altitude birds. The likelihood of bird
strikes depends on seasons: despite differences between the two hemispheres, during spring and
autumn, an increased bird activity due to migration between summer and winter residences leads
to more strikes, while during the respective winters, the risk of collisions between birds and aircraft
is lowest. In the end the probability of bird strikes depends on the geographical location, it is related
to the abundance of different bird species with variable behaviour, size or tendency for flocking. In
the direct airport environment, the landscape characteristics are a determining factor; in regions
situated along a migratory flyway, the danger of collision remarkably increases during flight for all
migration seasons.
To reduce the risk of bird strikes, many measures have been implemented. They can either be
ground- or aircraft-related. On the ground, the focus of bird strike hazard reduction in civil aviation
explicitly lies on the airports and their direct surroundings, thanks to a habitat modification to make
airport unattractive: exclusion can be partly achieved by wires and net and completed with chemical
repellents; for the bird which are already in the airport area there are techniques which aim at
chasing away birds, like gas exploder, alarm and laser; the lethal suppression methods are restricted
in many country, but it is possible anyway thanks to trained dogs, falconry and shooting. Airport-
bound wildlife management is limited in its efficacy, because often birds can grow accustomed to

56
harassing methods, which reduces their effectiveness over time and also the covered area is not
enough. About aircraft-related mitigation, the majority of research in this area has focused on
increasing aircraft visibility (tint and pulsed light) to improve the bird’s ability to detect and avoid
the aircraft. Aircraft have to meet certification requirements to prove their airworthiness, and one
of them concerns the resistive capacity against bird strike: the windshield have to withstand without
penetration an impact of a 2 lb bird at cruise speed, the structure must be solid enough to
successfully completing a flight after an impact with a 4 lb bird and the pitot tubes sufficient
separated to prevent damage to all of them. Regarding the impact-resistance of engines, which have
to be certified independently of the aircraft, it must undergo an engine ingestion test to prove that
an engine responds in a safe manner to bird ingestion. Over the past few years, the awareness has
risen that the increasingly including the parties actually handling air traffic is vital to further reduce
the risk of bird strikes in civil aviation, alerting flight pilots about the presence of raid birds near the
runway; an increasing number of airports have installed radars dedicated to tracking birds, so-called
avian radars, able to predict bird activity to minimize the bird strike risk while at the same time
having an overview of the airport area with real-time guidance for bird control staff; but, not all
birds are observed by the radar and no warning for potentially critical strikes can be presented due
to the missing information. Moreover, tracks of individual birds are more difficult to predict than
those of flocks, the sensitivity of the instrument influences the detection. This reduces the potential
positive effect on safety and to superfluous warnings in case of falsely predicted bird movement.
Furthermore, bird strike risk is distributed throughout the day. This could lead to increased workload
for the controllers and to unjustifiable reduction in runway capacity at high-density airports.
The next example, marked OGHFA SE, refer to an example found on SKYBRARY related to the best-
known risk factors.
Loss of Control and In-Flight Upset After Loss of Engine Power (OGHFA SE)
The following story is about a routine flight, but turbulence complicate things compromising an
engine.
‘’ You are the captain of a large four-engine jet on a trans-pacific flight at Flight Level FL 410 with
the autopilot on when engine no. 4 loses power. You switch on the "Fasten Seatbelt" sign when the
flight encounters clear air turbulence. In accordance with company procedures, the flight engineer
57
has placed the ignition switches in the "Flight Start" position, thereby providing continuous ignition
to all four engines. In response to your order, the flight engineer takes out his checklist to review
the applicable engine-out procedures as well as the performance charts to ascertain the three-
engine en route cruise altitude. You tell the first officer to request a lower altitude from ATC in order
to descend and restart the engine. The relief flight engineer and the relief captain are resting in
bunks at the rear of the flight deck. You instruct the relief flight engineer to come forward and help
the on-duty flight engineer. The relief flight engineer moves forward to help restart the no. 4 engine.
When the relief captain climbs out of his bunk after the relief flight engineer has moved forward, he
can see neither the flight instruments nor any outside visual references. The first officer tells you
that airspeed is decreasing. The first officer requests a lower altitude from ATC. He does not tell
them about the engine failure, nor does he declare an emergency. ATC tells him to "stand by," and
the first officer does not recall hearing anything further in response to his request. You see the
indicated airspeed drop through 240 kt. As the airplane continues to decelerate, you turn the
autopilot speed mode to "Off" to release it from the altitude hold mode. This switches the autopilot
to the pitch attitude hold mode while maintaining aircraft track in the autopilot roll mode without
any pilot input. You then rotate the pitch control wheel on the autopilot manual control in the nose-
down direction to begin a descent to counter the airspeed loss. As airspeed continues to decrease,
you disconnect the autopilot and manually lower the nose at a faster rate in a further attempt to
stop the airspeed loss. After his radio call, the first officer notices that the airplane is continuing to
bank slightly to the right, and he tells you. You are concentrating on your attitude director indicator
ADI to make a left-wing-down turn, but you notice the horizon reference line rotating rapidly to the
left and all the way to the vertical position. You do not see any ADI failure flags or lights. You look at
the first officer’s ADI and at the standby ADI and do not see any inconsistency between them. The
airplane enters a cloud layer, and you cannot confirm the attitude. At that moment, the flight
engineer tells you that the other three engines have also lost power and that the airplane “dropped
all of a sudden”. You pull back on the control column, but the airspeed continues to increase rapidly
until it exceeds the maximum operating speed Vmo. Meanwhile, the first officer notices his ADI has
rotated to the left in the same manner as yours, and he does not see any ADI failure flags or lights
either. At this point, he thinks that both his ADI and yours "have malfunctioned," the airplane is out
of control, banking steeply left and right. The flight engineer attempts without success to restart the
engines because g forces in this abnormal attitude are so great that he cannot move his arm and his
head is forced down onto the pedestal. The relief flight engineer is thrown back into the rear jump
58
seat by the strong g forces, and the relief captain is thrown to the floor while trying to move forward
to help. Throughout the descent, g forces are so strong that he cannot get up. You are unable to
recover the airplane. In the clouds, you are not sure what the attitude is and are moving the control
wheel left and right. As the airplane accelerates, you continue to pull the control column back.
Airspeed slows rapidly to between 80 and 100 kts. To avoid stalling, you lower the nose. The airplane
accelerates again, and the airspeed again exceeds Vmo. The first officer asks for help, and you both
pull the control column back. The airplane decelerates. You lower the nose smoothly. The airplane
begins to decelerate slowly and emerges from the clouds at about 11,000 ft at around 180 kt. You
tell the other crewmembers you can see the horizon. Using outside visual references, you regain
stabilized control at about 9,500 ft. The first officer confirms his ADI is "coming back." The flight
engineer confirms that the no. 1, no. 2 and no. 3 engines "came in," but says the no. 4 engine would
not restart. He is able to restart no. 4 later, following the airline’s procedures. After checking the
electrical control panel, he says that “everything is back to normal.” ATC is contacted when the
airplane is stabilized, and you report having experienced a "flameout, ah, an emergency … we are
at nine thousand feet.” The crew is then cleared to climb to and maintain FL 350. While the airplane
is climbing, the flight engineer checks his instrument panel. Annunciator lights indicate that the
centre landing gear door is open and the centre gear is extended and locked. In addition, the no. 1
hydraulic system fluid-level gauge indicates empty. Because of the landing gear indications, you
choose to level off at FL 270 with the gear extended. The maximum operating altitude for flight with
the gear extended is FL 290. After checking the airplane's fuel status and fuel consumption, you
decide to divert and instruct the first officer to inform ATC, which gives you the requested clearance.
Three minutes later, you declare an emergency again and state that there are injured people aboard.
ATC clears you direct to the diversion airport and to descend at "pilot's discretion." The remaining
part of the flight is uneventful. After landing, due to the inoperative no. 1 hydraulic system which
decreases the ability to steer while taxiing, you stop the airplane after it is clear of the runway and
shut down the engines. The airplane is towed to the gate. During the upset, a passenger and a cabin
crewmember were seriously injured. The airplane was substantially damaged by aerodynamic
overload. A landing gear assembly was forced open, the auxiliary power unit separated from its
structure, and a large part of the horizontal stabilizer is missing.’’
Factor involved:
59
• Stalling: stall is a reduction in the lift coefficient generated by a airfoil as angle of attack
increases; upsets are usually defined as an airplane in flight unintentionally exceeding the
parameters normally experienced in line operations and the majority of upsets are caused
by environmental factors such as turbulence, mountain waves, wind shear, thunderstorms,
microbursts, wake turbulence and icing, but also system anomalies. In this case the
distraction about the fourth engine off and the decreasing airspeed, contributed to
deteriorate the situation awareness.
• Captain’s reliance on automation: leaving the autopilot on, he allowed himself to get out of
the control loop, so he was not aware of the increasing control inputs required to maintain
constant flight level which lead to stall. The increasing asymmetrical forces caused an
attitude divergence when the autopilot was disabled; however, the captain was unable to
assess it properly, and his actions most probably aggravated the situation.
• Recognizing the situation: work as a team for accurate risk assessments and tactical decision
making is the key for explicitly define task sharing so it is clear who is to monitor all critical
flight parameters. Since human senses are quite useless on a big plane, monitor and on-
board instruments should be seen as a personal extension: in presence of reduced visibility
due to clouds, it is necessary to rely on working instruments to understand the aircraft's
attitude, the workload rises and is easier to make a mistake. If the situation has not been
perceived and understood in its entirety, then it becomes difficult to apply correct mitigation
procedures.
Fog, Ice, Wind
Earth’s atmosphere is a chaotic mixture of gasses held against the globe by gravity force, and
commonly called air. The gas necessary for most life being in oxygen and air is composed about 78
percent nitrogen, 21 percent oxygen, and trace amounts of other gases. The atmosphere is divided
vertically into four regions: the troposphere, the stratosphere, the mesosphere, and the
thermosphere; it’s important to appreciate that the atmosphere moves along with the Earth.
Atmospheric pressure at a particular location is the force per unit area perpendicular to a surface
determined by the weight of the vertical column of atmosphere above that location; it decreases
with increasing altitude due to the diminishing mass of gas above.
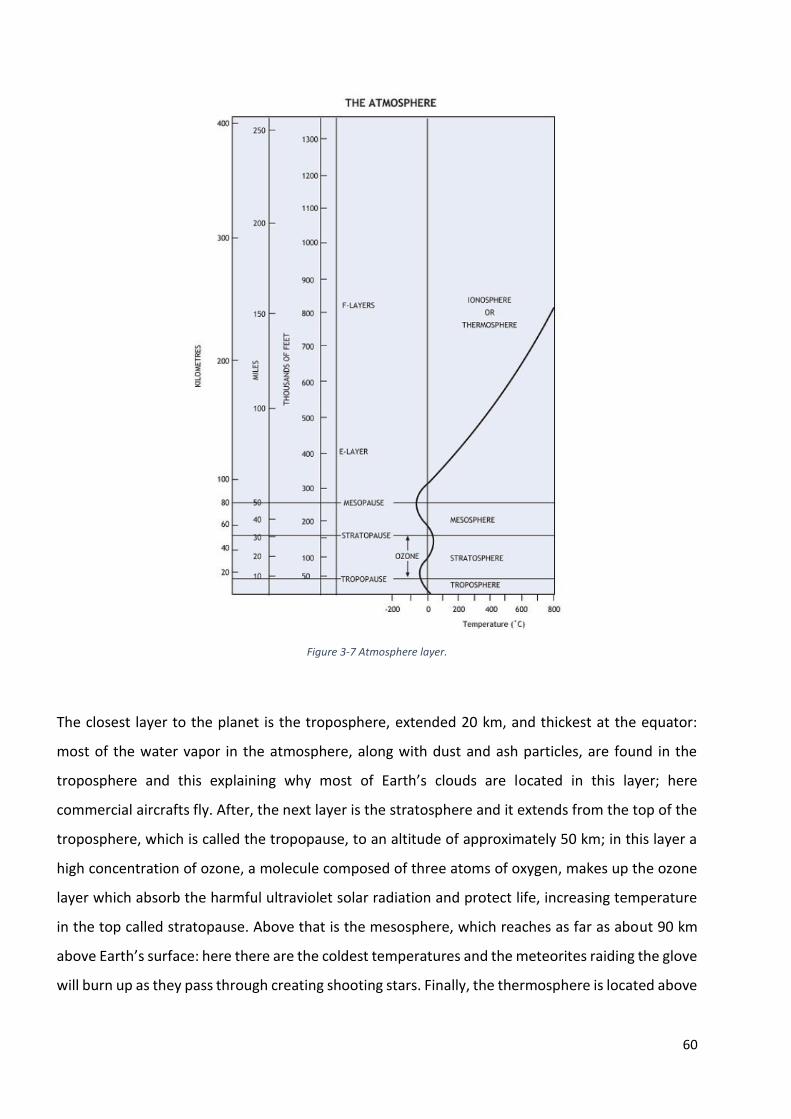
60
Figure 3-7 Atmosphere layer.
The closest layer to the planet is the troposphere, extended 20 km, and thickest at the equator:
most of the water vapor in the atmosphere, along with dust and ash particles, are found in the
troposphere and this explaining why most of Earth’s clouds are located in this layer; here
commercial aircrafts fly. After, the next layer is the stratosphere and it extends from the top of the
troposphere, which is called the tropopause, to an altitude of approximately 50 km; in this layer a
high concentration of ozone, a molecule composed of three atoms of oxygen, makes up the ozone
layer which absorb the harmful ultraviolet solar radiation and protect life, increasing temperature
in the top called stratopause. Above that is the mesosphere, which reaches as far as about 90 km
above Earth’s surface: here there are the coldest temperatures and the meteorites raiding the glove
will burn up as they pass through creating shooting stars. Finally, the thermosphere is located above
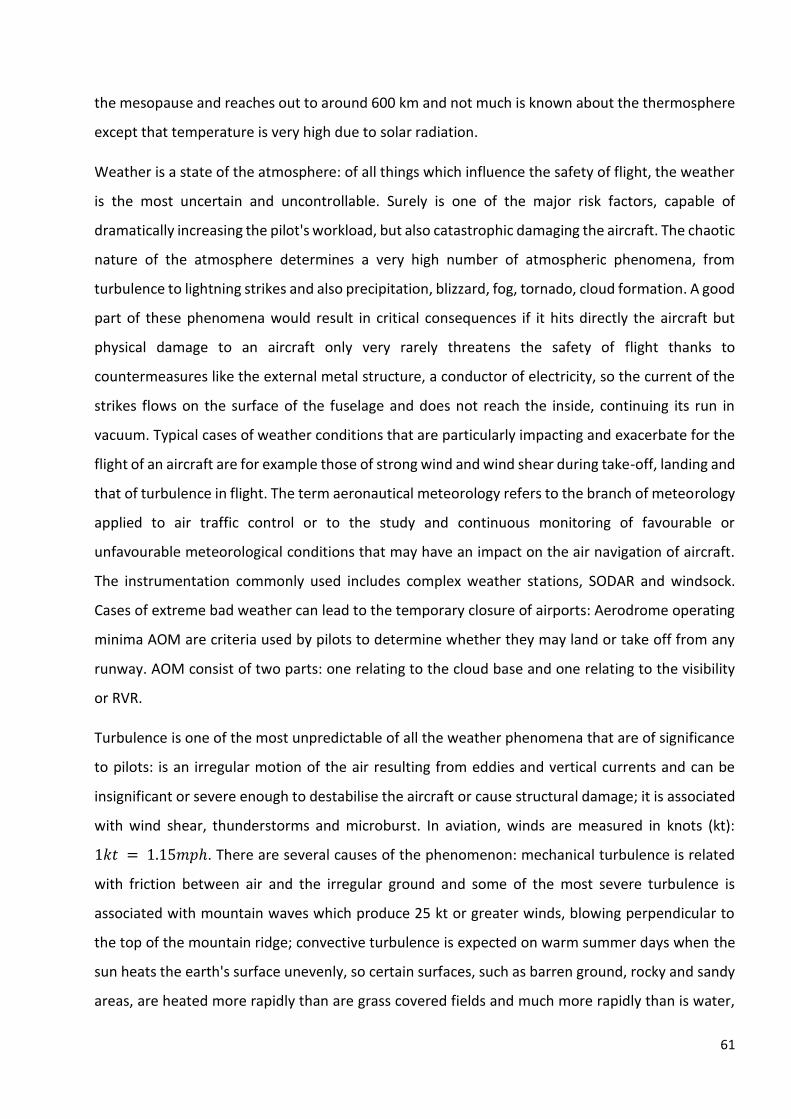
61
the mesopause and reaches out to around 600 km and not much is known about the thermosphere
except that temperature is very high due to solar radiation.
Weather is a state of the atmosphere: of all things which influence the safety of flight, the weather
is the most uncertain and uncontrollable. Surely is one of the major risk factors, capable of
dramatically increasing the pilot's workload, but also catastrophic damaging the aircraft. The chaotic
nature of the atmosphere determines a very high number of atmospheric phenomena, from
turbulence to lightning strikes and also precipitation, blizzard, fog, tornado, cloud formation. A good
part of these phenomena would result in critical consequences if it hits directly the aircraft but
physical damage to an aircraft only very rarely threatens the safety of flight thanks to
countermeasures like the external metal structure, a conductor of electricity, so the current of the
strikes flows on the surface of the fuselage and does not reach the inside, continuing its run in
vacuum. Typical cases of weather conditions that are particularly impacting and exacerbate for the
flight of an aircraft are for example those of strong wind and wind shear during take-off, landing and
that of turbulence in flight. The term aeronautical meteorology refers to the branch of meteorology
applied to air traffic control or to the study and continuous monitoring of favourable or
unfavourable meteorological conditions that may have an impact on the air navigation of aircraft.
The instrumentation commonly used includes complex weather stations, SODAR and windsock.
Cases of extreme bad weather can lead to the temporary closure of airports: Aerodrome operating
minima AOM are criteria used by pilots to determine whether they may land or take off from any
runway. AOM consist of two parts: one relating to the cloud base and one relating to the visibility
or RVR.
Turbulence is one of the most unpredictable of all the weather phenomena that are of significance
to pilots: is an irregular motion of the air resulting from eddies and vertical currents and can be
insignificant or severe enough to destabilise the aircraft or cause structural damage; it is associated
with wind shear, thunderstorms and microburst. In aviation, winds are measured in knots (kt):
1𝑘𝑡 = 1.15𝑚𝑝ℎ. There are several causes of the phenomenon: mechanical turbulence is related
with friction between air and the irregular ground and some of the most severe turbulence is
associated with mountain waves which produce 25 kt or greater winds, blowing perpendicular to
the top of the mountain ridge; convective turbulence is expected on warm summer days when the
sun heats the earth's surface unevenly, so certain surfaces, such as barren ground, rocky and sandy
areas, are heated more rapidly than are grass covered fields and much more rapidly than is water,
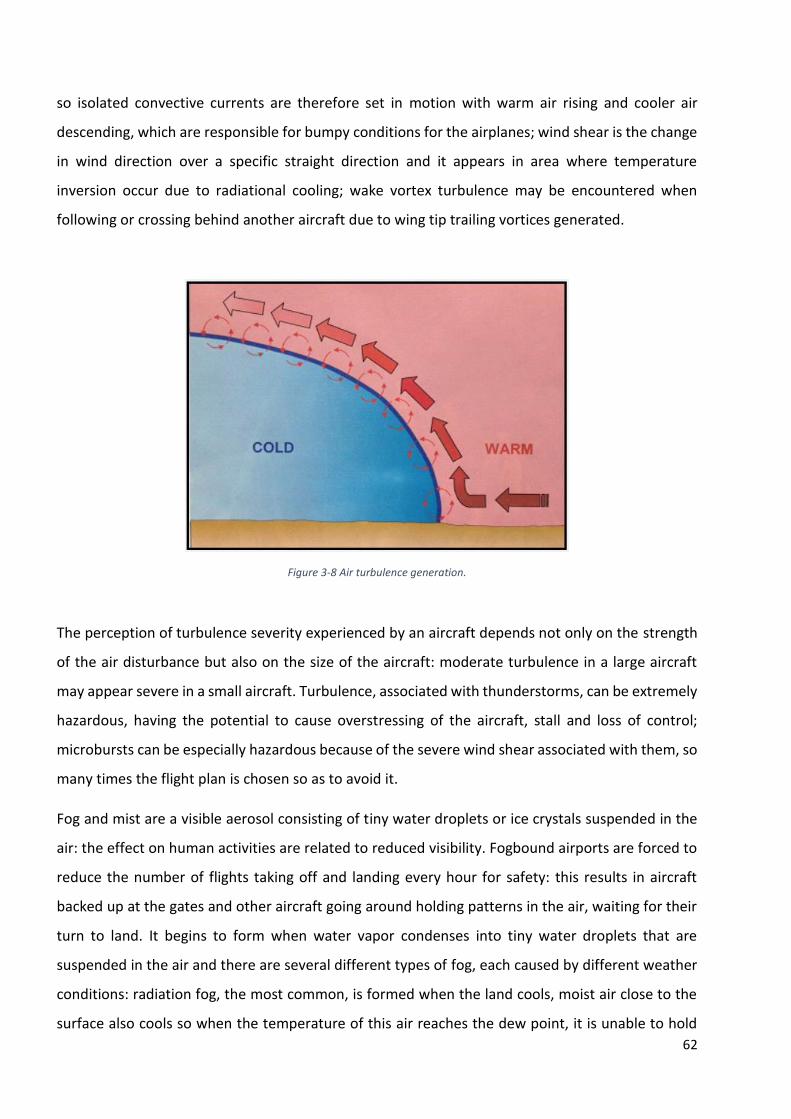
62
so isolated convective currents are therefore set in motion with warm air rising and cooler air
descending, which are responsible for bumpy conditions for the airplanes; wind shear is the change
in wind direction over a specific straight direction and it appears in area where temperature
inversion occur due to radiational cooling; wake vortex turbulence may be encountered when
following or crossing behind another aircraft due to wing tip trailing vortices generated.
Figure 3-8 Air turbulence generation.
The perception of turbulence severity experienced by an aircraft depends not only on the strength
of the air disturbance but also on the size of the aircraft: moderate turbulence in a large aircraft
may appear severe in a small aircraft. Turbulence, associated with thunderstorms, can be extremely
hazardous, having the potential to cause overstressing of the aircraft, stall and loss of control;
microbursts can be especially hazardous because of the severe wind shear associated with them, so
many times the flight plan is chosen so as to avoid it.
Fog and mist are a visible aerosol consisting of tiny water droplets or ice crystals suspended in the
air: the effect on human activities are related to reduced visibility. Fogbound airports are forced to
reduce the number of flights taking off and landing every hour for safety: this results in aircraft
backed up at the gates and other aircraft going around holding patterns in the air, waiting for their
turn to land. It begins to form when water vapor condenses into tiny water droplets that are
suspended in the air and there are several different types of fog, each caused by different weather
conditions: radiation fog, the most common, is formed when the land cools, moist air close to the
surface also cools so when the temperature of this air reaches the dew point, it is unable to hold
63
water as a gas and this water vapor condenses around particles in the air and forms fog; ice fog
forms in very low temperatures and can be the result of the exhalation of moist warm air by herds
of animals; steam fog forms over bodies of water overlain by much colder air; artificial fog is man-
made fog that is usually created by pollution. Visibility is a measure of the distance at which an
object or light can be clearly discerned, is heavily affected by the presence of fog and is measured
in metres. Runway Visual Range RVR is the range over which the pilot of an aircraft on the centre
line of a runway can see the runway surface markings or the lights delineating the runway or
identifying its centre line (ICAO definition). Visibility and RVR are reported in routine reports and
are important in all phases of flight, but especially near the terrain. Fog cause delay and potential
collisions and it is necessary to activate the so-called "low visibility procedures" LVP, while only
those planes equipped with special instrumentation, and only those pilots who have had specific
training for low visibility landing and take-off can fly. All pilots go through the low visibility
procedures, with all failures connected, at least twice a year at the simulator.
The presence of water, in vapour form, in the atmosphere associated with the low temperatures
typical of the high troposphere leads to phenomena linked to condensation (any cloud containing
liquid water). Although the nominal freezing point of water is 0°C, water in the atmosphere does
not always freeze at that temperature and often exists as a "supercooled" liquid, in liquid state even
below freezing point. If the surface temperature of an aircraft structure is below zero, then moisture
within the atmosphere may turn to ice as an immediate consequence of impact. Freshly formed ice
accumulates on aerodynamic surfaces and can lead to reduced performance and subsequent loss
of control. Ice-related hazard include: ice accretion on critical parts of an unprotected airframe like
propeller blades and wings with consequent modifications of the aerodynamic profiles leading to
loss of lift, increased drag and a shift in the airfoil centre of pressure (very little surface modifications
is required to generate significant aerodynamic effects); blockage of the air inlet to any part of a
pitot static system can produce errors in the readings of pressure instruments such VSI; degrade of
radio communication and complete or partial blockage of aerial. Ice accretion on an aircraft
structure can be distinguished as rime icing (supercooled water droplets freeze rapidly on contact
with a sub-zero surface, it forms on leading edges), clear icing (progressive freezing of the water
droplets, it’s transparent and difficult to detect) or a blend of the two referred to as cloudy icing,
and finally semi-crystalline frost can form in clear air through a deposition after a long exposition,
obscuring pilot vision. Heavy icing conditions should be avoided; therefore, the weather information
must be implemented in the definition of the flight plan. General aviation aircraft that are not
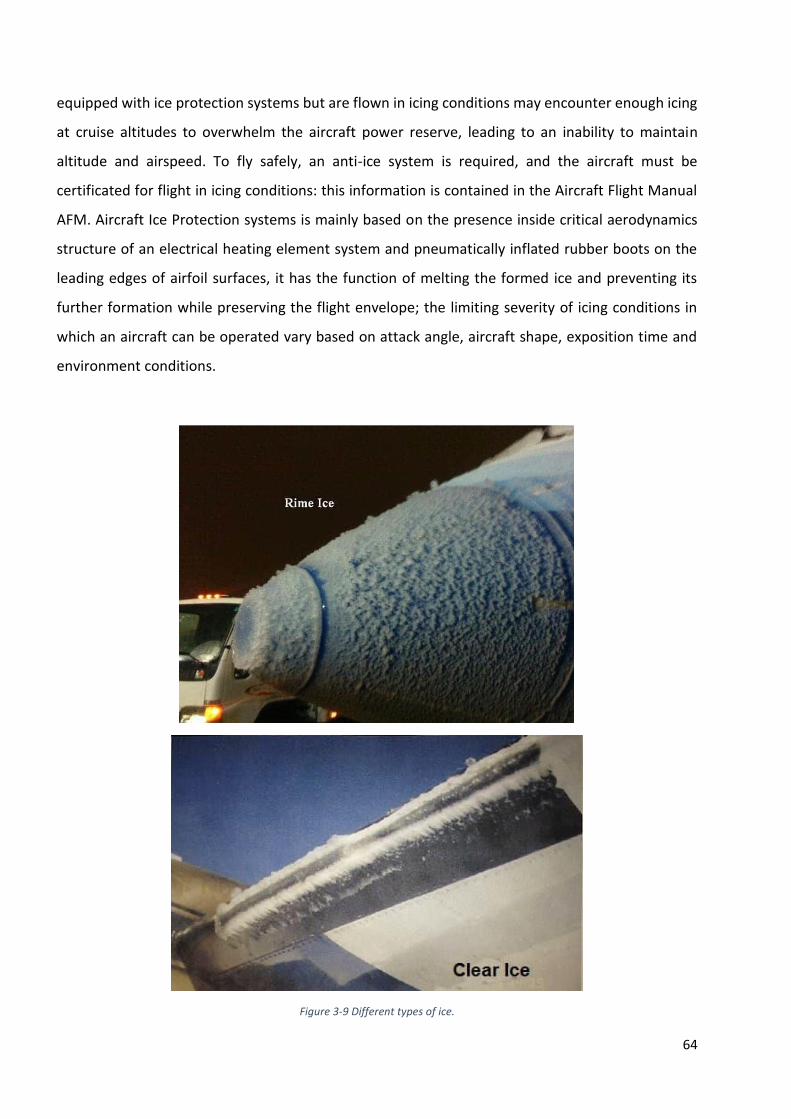
64
equipped with ice protection systems but are flown in icing conditions may encounter enough icing
at cruise altitudes to overwhelm the aircraft power reserve, leading to an inability to maintain
altitude and airspeed. To fly safely, an anti-ice system is required, and the aircraft must be
certificated for flight in icing conditions: this information is contained in the Aircraft Flight Manual
AFM. Aircraft Ice Protection systems is mainly based on the presence inside critical aerodynamics
structure of an electrical heating element system and pneumatically inflated rubber boots on the
leading edges of airfoil surfaces, it has the function of melting the formed ice and preventing its
further formation while preserving the flight envelope; the limiting severity of icing conditions in
which an aircraft can be operated vary based on attack angle, aircraft shape, exposition time and
environment conditions.
Figure 3-9 Different types of ice.
65
Again, the next paragraph, marked OGHFA SE, refer to one example found on SKYBRARY related to
the best known risk factors.
Wind Shear Encounter During Go-Around (OGHFA SE)
Turbulence and heavy rainfall, mixed with lack of awareness, lead to bad decisions.
‘’You are the captain of a twin-jet on a 35-minute flight leaving in the late afternoon. It is the crew’s
fourth and last leg of a journey that started in mid-morning. The automatic terminal information
service ATIS at the destination indicates scattered clouds at 5,000 ft, fair visibility in haze, wind 150
at 8 kt. Air traffic control ATC has cleared you to cruise altitude and to expect Runway 18R at the
destination. You observe two scattered thunderstorm cells on your weather radar, one south and
the second east of the airport. After coordinating with ATC, the controller clears you for descent
with a northerly heading to turn around a cell. Soon afterward, you are cleared to 6,000 ft and
thereafter to contact approach control, which requests you to maintain 4,000 ft for Runway 18R.
You acknowledge, then brief the approach with your first officer, the pilot flying, who has visual
contact with the airport but is flying the ILS (instrument landing system) approach as a backup. ATC
then issues a clearance to turn right 10 degrees, descend and maintain 2,300 ft for a visual approach
to Runway 18R. At just that time, the supervisor in the tower says it is “raining like hell” at the south
end of the airport. ATC amends your clearance to maintain 3,000 ft and mentions “some rain” just
south of the field that might move north. Minutes later, the controller vectors you to turn right to
170 degrees, 4 nm (7 km) from the outer marker for the Runway 18R ILS, to cross it at or above
3,000 ft. As you are manoeuvring the airplane from base leg of the visual approach to final, you and
the first officer have visual contact with the airport. The tower clears you to land on Runway 18R
and to follow a similar-size airplane on short final, who reports a smooth ride just as the previous
one had. At just about that time, a special weather observation is recorded: ceiling 4,500 ft broken,
6 mi visibility, thunderstorm, light rain, haze, wind 110 at 16 kt. This new ATIS information is not
broadcast until 15 minutes later, so you never receive it. Three minutes later, the tower says that
the wind is 100 at 19, then a short time later at 21. The tower then issues a wind shear warning alert
northeast, with wind 190 at 14. On final, the airplane enters the area of rainfall, and the first officer
comments that he is adding 10 kt. You command him to go around and turn right. The go-around
begins. The tower instructs you to fly runway heading, climb and maintain 3,000 ft. The first officer
initially rotates the airplane to the proper 15-degree nose-up attitude during the go-around.
66
However, thrust is set below the standard go-around engine pressure ratio EPR limit, and pitch
attitude is reduced to 5 degrees nose-down before both of you recognize the situation. While the
flaps are moving from 40 to 15 degrees, the airplane encounters wind shear. Although you are
equipped with an on-board wind shear warning system, it does not activate. The airplane stalls and
hits the ground.’’
Factor involved:
• Lacking complete weather information: even though the approach controller noticed heavy
precipitation cells popping up on his radar display he did not tell the crew, so the captain at
some point referred to a right turn planned to avoid cumulus. Again, at about 8 km from
runway, the controlled failed to warn the crew about a LLWAS alert on wind shear becoming
severe so the crew continued the approach despite the uncertainty of weather data. Also,
continuous landings and take-offs throughout the approach may have contributed to some
form of continuation bias with no timely decision making to go around. ATC controllers must
constantly inform pilots of weather changes.
• Overwork: after the go-around, the captain retracted the flaps but not the landing gear and
left the throttle dangerously close to the maximum; when the airplane’s performance began
to deteriorate the crew should had to change from a normal go-around procedure, which
emphasized speed, to the wind shear recovery procedure, which aimed to maintain pitch
attitude. Typical errors related to high workload phases: the microburst situation has
negatively penalized the situation awareness, whenever there is a weather factor during
approach, crews must focus more on being prepared for a go-around.
• Wrong decision: the captain gave a pitch-down command during the wind shear encounter,
and after reaching a 15-degree nose-up go-around attitude, the captain ordered a reduction
in pitch attitude in order to avoiding the microburst; this put the airplane into a steep
descent; also the crew continued the ILS. When time is an enemy, the pressure is high and
all the crew is under stress is difficult to take the right decision at the right time.
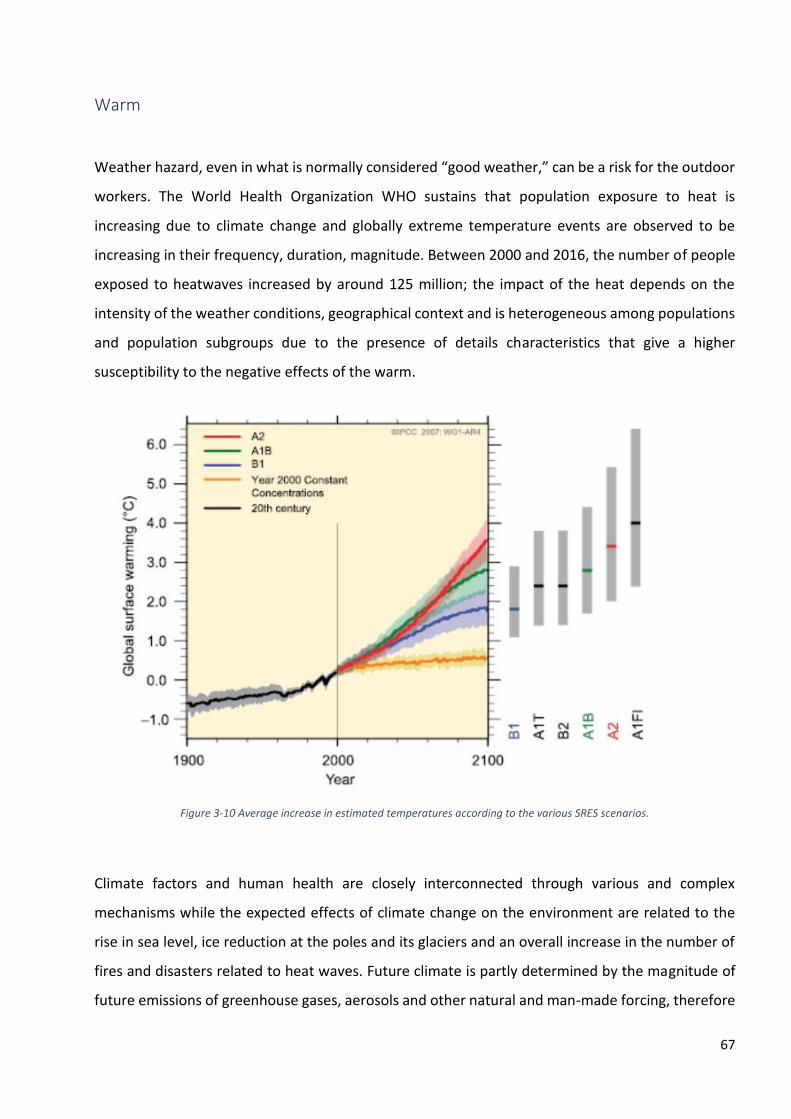
67
Warm
Weather hazard, even in what is normally considered “good weather,” can be a risk for the outdoor
workers. The World Health Organization WHO sustains that population exposure to heat is
increasing due to climate change and globally extreme temperature events are observed to be
increasing in their frequency, duration, magnitude. Between 2000 and 2016, the number of people
exposed to heatwaves increased by around 125 million; the impact of the heat depends on the
intensity of the weather conditions, geographical context and is heterogeneous among populations
and population subgroups due to the presence of details characteristics that give a higher
susceptibility to the negative effects of the warm.
Figure 3-10 Average increase in estimated temperatures according to the various SRES scenarios.
Climate factors and human health are closely interconnected through various and complex
mechanisms while the expected effects of climate change on the environment are related to the
rise in sea level, ice reduction at the poles and its glaciers and an overall increase in the number of
fires and disasters related to heat waves. Future climate is partly determined by the magnitude of
future emissions of greenhouse gases, aerosols and other natural and man-made forcing, therefore
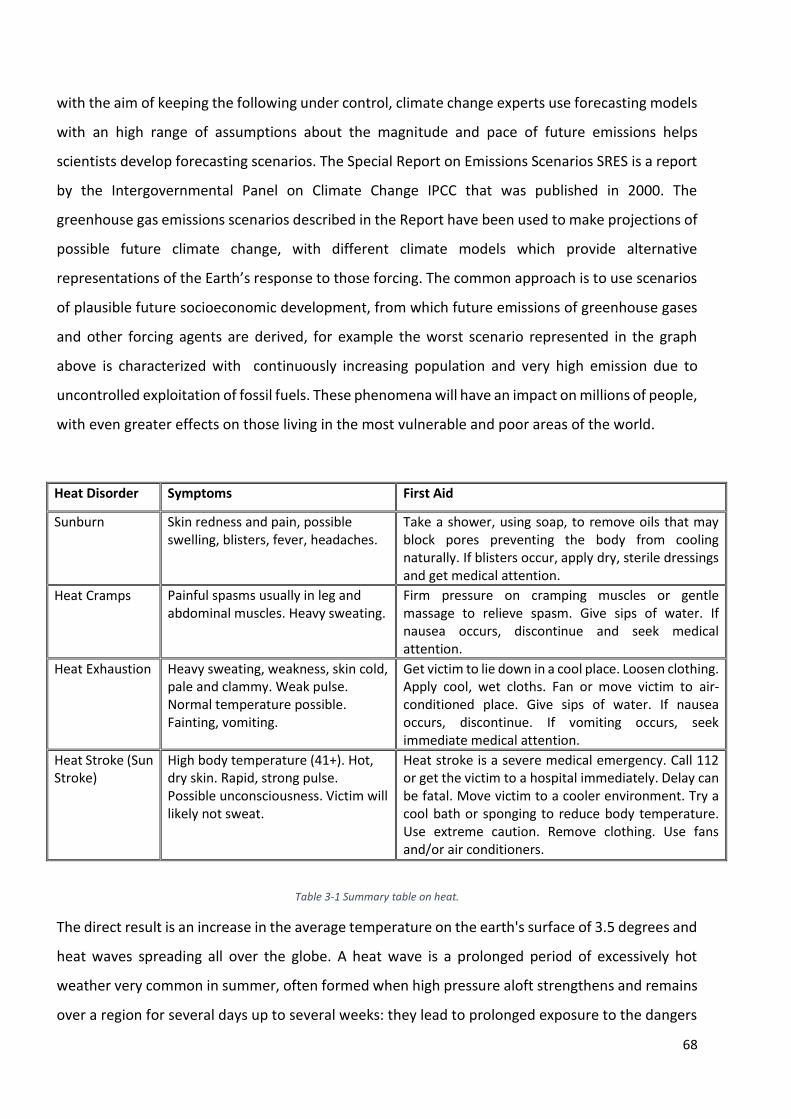
68
with the aim of keeping the following under control, climate change experts use forecasting models
with an high range of assumptions about the magnitude and pace of future emissions helps
scientists develop forecasting scenarios. The Special Report on Emissions Scenarios SRES is a report
by the Intergovernmental Panel on Climate Change IPCC that was published in 2000. The
greenhouse gas emissions scenarios described in the Report have been used to make projections of
possible future climate change, with different climate models which provide alternative
representations of the Earth’s response to those forcing. The common approach is to use scenarios
of plausible future socioeconomic development, from which future emissions of greenhouse gases
and other forcing agents are derived, for example the worst scenario represented in the graph
above is characterized with continuously increasing population and very high emission due to
uncontrolled exploitation of fossil fuels. These phenomena will have an impact on millions of people,
with even greater effects on those living in the most vulnerable and poor areas of the world.
Heat Disorder Symptoms First Aid
Sunburn Skin redness and pain, possible swelling, blisters, fever, headaches.
Take a shower, using soap, to remove oils that may block pores preventing the body from cooling naturally. If blisters occur, apply dry, sterile dressings and get medical attention.
Heat Cramps Painful spasms usually in leg and abdominal muscles. Heavy sweating.
Firm pressure on cramping muscles or gentle massage to relieve spasm. Give sips of water. If nausea occurs, discontinue and seek medical attention.
Heat Exhaustion Heavy sweating, weakness, skin cold, pale and clammy. Weak pulse. Normal temperature possible. Fainting, vomiting.
Get victim to lie down in a cool place. Loosen clothing. Apply cool, wet cloths. Fan or move victim to air-conditioned place. Give sips of water. If nausea occurs, discontinue. If vomiting occurs, seek immediate medical attention.
Heat Stroke (Sun Stroke)
High body temperature (41+). Hot, dry skin. Rapid, strong pulse. Possible unconsciousness. Victim will likely not sweat.
Heat stroke is a severe medical emergency. Call 112 or get the victim to a hospital immediately. Delay can be fatal. Move victim to a cooler environment. Try a cool bath or sponging to reduce body temperature. Use extreme caution. Remove clothing. Use fans and/or air conditioners.
Table 3-1 Summary table on heat.
The direct result is an increase in the average temperature on the earth's surface of 3.5 degrees and
heat waves spreading all over the globe. A heat wave is a prolonged period of excessively hot
weather very common in summer, often formed when high pressure aloft strengthens and remains
over a region for several days up to several weeks: they lead to prolonged exposure to the dangers
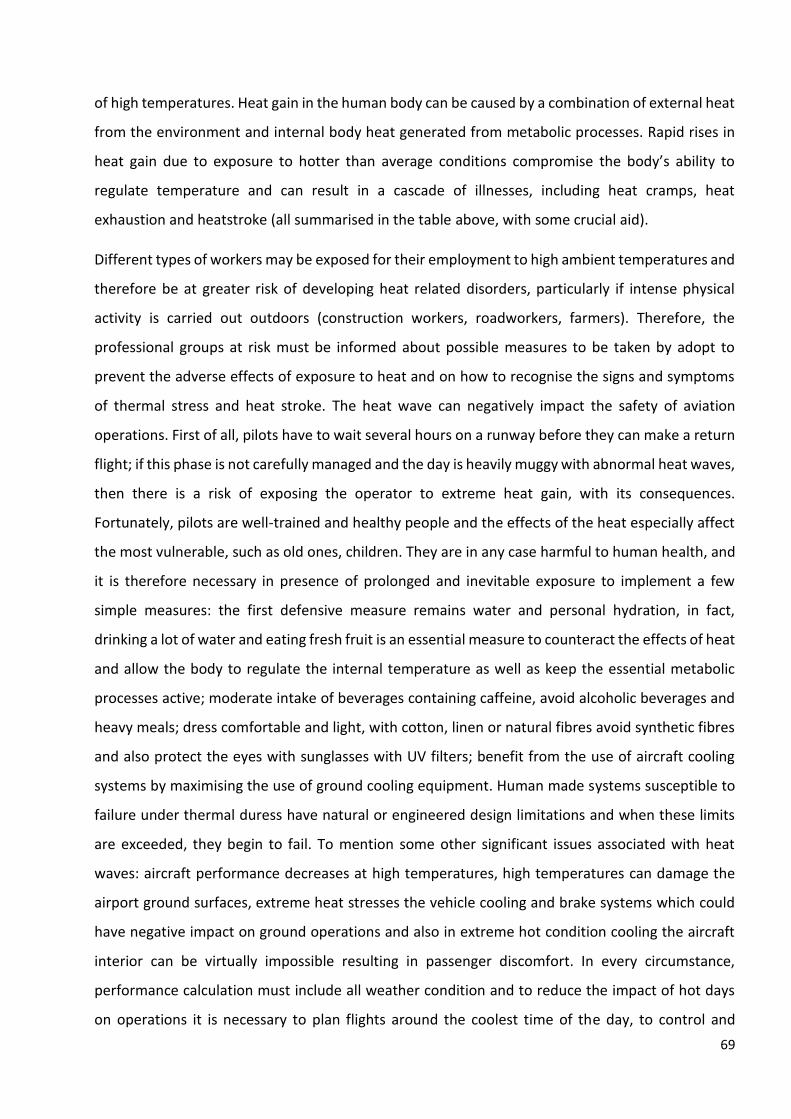
69
of high temperatures. Heat gain in the human body can be caused by a combination of external heat
from the environment and internal body heat generated from metabolic processes. Rapid rises in
heat gain due to exposure to hotter than average conditions compromise the body’s ability to
regulate temperature and can result in a cascade of illnesses, including heat cramps, heat
exhaustion and heatstroke (all summarised in the table above, with some crucial aid).
Different types of workers may be exposed for their employment to high ambient temperatures and
therefore be at greater risk of developing heat related disorders, particularly if intense physical
activity is carried out outdoors (construction workers, roadworkers, farmers). Therefore, the
professional groups at risk must be informed about possible measures to be taken by adopt to
prevent the adverse effects of exposure to heat and on how to recognise the signs and symptoms
of thermal stress and heat stroke. The heat wave can negatively impact the safety of aviation
operations. First of all, pilots have to wait several hours on a runway before they can make a return
flight; if this phase is not carefully managed and the day is heavily muggy with abnormal heat waves,
then there is a risk of exposing the operator to extreme heat gain, with its consequences.
Fortunately, pilots are well-trained and healthy people and the effects of the heat especially affect
the most vulnerable, such as old ones, children. They are in any case harmful to human health, and
it is therefore necessary in presence of prolonged and inevitable exposure to implement a few
simple measures: the first defensive measure remains water and personal hydration, in fact,
drinking a lot of water and eating fresh fruit is an essential measure to counteract the effects of heat
and allow the body to regulate the internal temperature as well as keep the essential metabolic
processes active; moderate intake of beverages containing caffeine, avoid alcoholic beverages and
heavy meals; dress comfortable and light, with cotton, linen or natural fibres avoid synthetic fibres
and also protect the eyes with sunglasses with UV filters; benefit from the use of aircraft cooling
systems by maximising the use of ground cooling equipment. Human made systems susceptible to
failure under thermal duress have natural or engineered design limitations and when these limits
are exceeded, they begin to fail. To mention some other significant issues associated with heat
waves: aircraft performance decreases at high temperatures, high temperatures can damage the
airport ground surfaces, extreme heat stresses the vehicle cooling and brake systems which could
have negative impact on ground operations and also in extreme hot condition cooling the aircraft
interior can be virtually impossible resulting in passenger discomfort. In every circumstance,
performance calculation must include all weather condition and to reduce the impact of hot days
on operations it is necessary to plan flights around the coolest time of the day, to control and
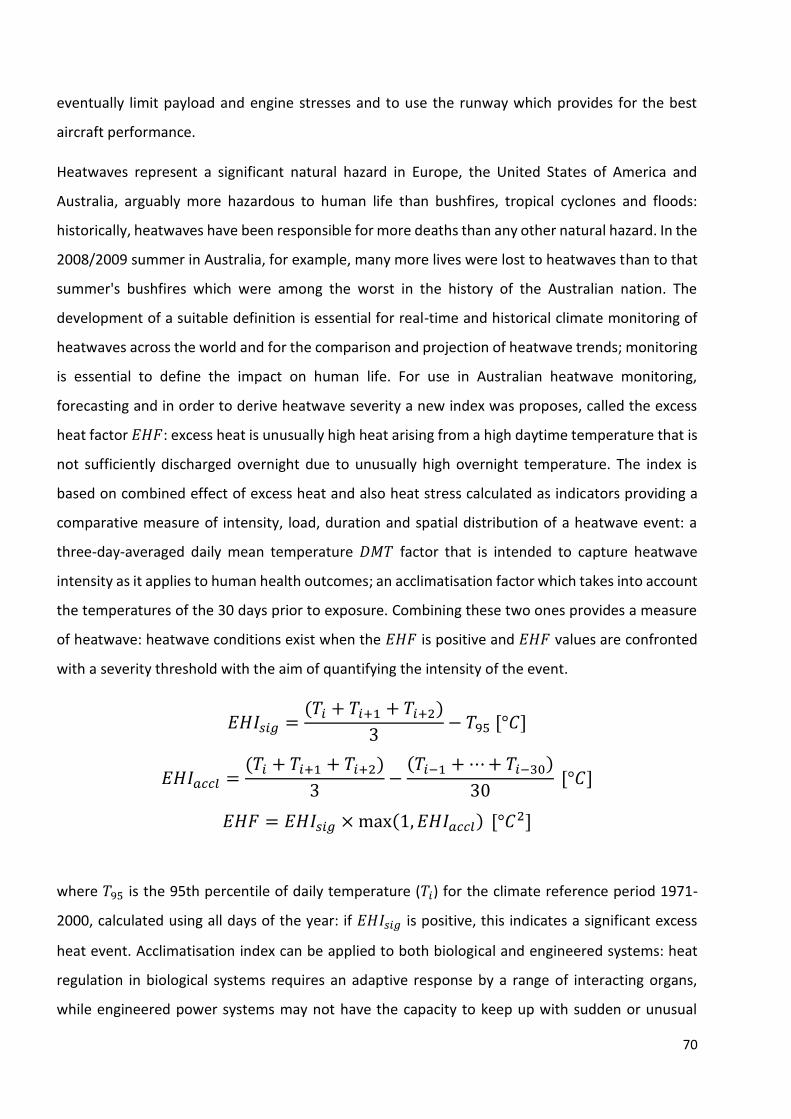
70
eventually limit payload and engine stresses and to use the runway which provides for the best
aircraft performance.
Heatwaves represent a significant natural hazard in Europe, the United States of America and
Australia, arguably more hazardous to human life than bushfires, tropical cyclones and floods:
historically, heatwaves have been responsible for more deaths than any other natural hazard. In the
2008/2009 summer in Australia, for example, many more lives were lost to heatwaves than to that
summer's bushfires which were among the worst in the history of the Australian nation. The
development of a suitable definition is essential for real-time and historical climate monitoring of
heatwaves across the world and for the comparison and projection of heatwave trends; monitoring
is essential to define the impact on human life. For use in Australian heatwave monitoring,
forecasting and in order to derive heatwave severity a new index was proposes, called the excess
heat factor 𝐸𝐻𝐹: excess heat is unusually high heat arising from a high daytime temperature that is
not sufficiently discharged overnight due to unusually high overnight temperature. The index is
based on combined effect of excess heat and also heat stress calculated as indicators providing a
comparative measure of intensity, load, duration and spatial distribution of a heatwave event: a
three-day-averaged daily mean temperature 𝐷𝑀𝑇 factor that is intended to capture heatwave
intensity as it applies to human health outcomes; an acclimatisation factor which takes into account
the temperatures of the 30 days prior to exposure. Combining these two ones provides a measure
of heatwave: heatwave conditions exist when the 𝐸𝐻𝐹 is positive and 𝐸𝐻𝐹 values are confronted
with a severity threshold with the aim of quantifying the intensity of the event.
𝐸𝐻𝐼𝑠𝑖𝑔 =(𝑇𝑖 + 𝑇𝑖+1 + 𝑇𝑖+2)
3− 𝑇95 [°𝐶]
𝐸𝐻𝐼𝑎𝑐𝑐𝑙 =(𝑇𝑖 + 𝑇𝑖+1 + 𝑇𝑖+2)
3−
(𝑇𝑖−1 + ⋯ + 𝑇𝑖−30)
30 [°𝐶]
𝐸𝐻𝐹 = 𝐸𝐻𝐼𝑠𝑖𝑔 × max(1, 𝐸𝐻𝐼𝑎𝑐𝑐𝑙) [°𝐶2]
where 𝑇95 is the 95th percentile of daily temperature (𝑇𝑖) for the climate reference period 1971-
2000, calculated using all days of the year: if 𝐸𝐻𝐼𝑠𝑖𝑔 is positive, this indicates a significant excess
heat event. Acclimatisation index can be applied to both biological and engineered systems: heat
regulation in biological systems requires an adaptive response by a range of interacting organs,
while engineered power systems may not have the capacity to keep up with sudden or unusual
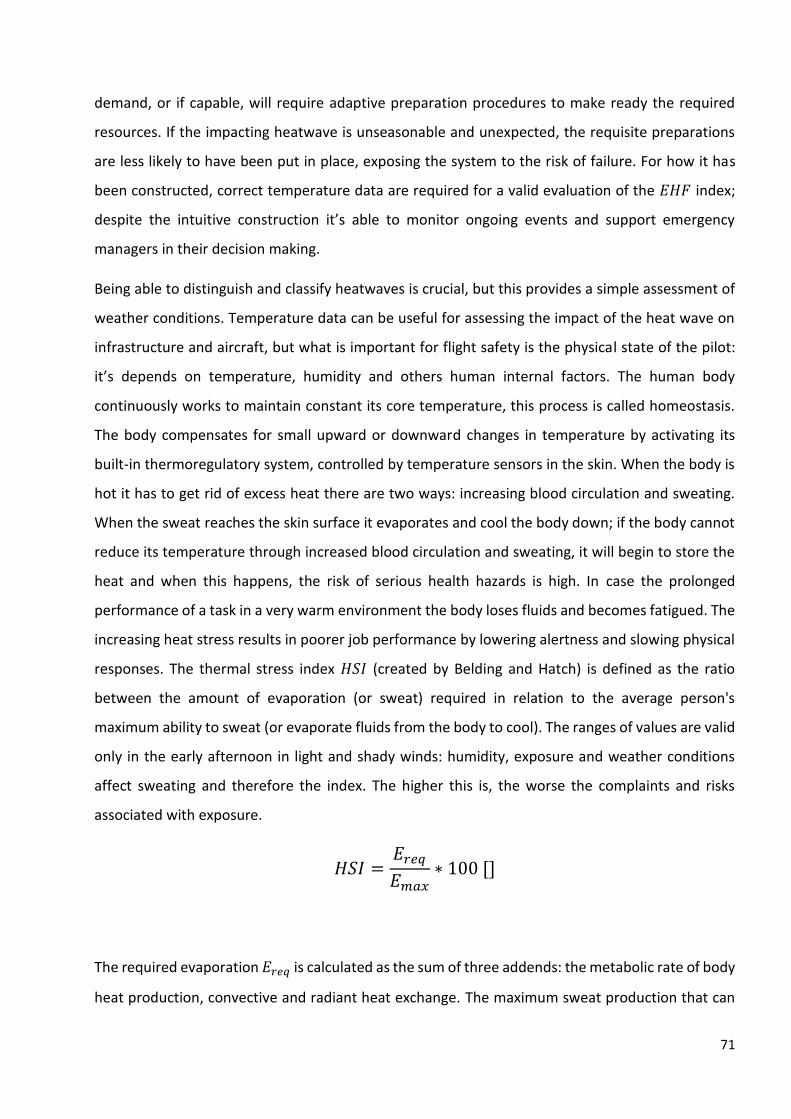
71
demand, or if capable, will require adaptive preparation procedures to make ready the required
resources. If the impacting heatwave is unseasonable and unexpected, the requisite preparations
are less likely to have been put in place, exposing the system to the risk of failure. For how it has
been constructed, correct temperature data are required for a valid evaluation of the 𝐸𝐻𝐹 index;
despite the intuitive construction it’s able to monitor ongoing events and support emergency
managers in their decision making.
Being able to distinguish and classify heatwaves is crucial, but this provides a simple assessment of
weather conditions. Temperature data can be useful for assessing the impact of the heat wave on
infrastructure and aircraft, but what is important for flight safety is the physical state of the pilot:
it’s depends on temperature, humidity and others human internal factors. The human body
continuously works to maintain constant its core temperature, this process is called homeostasis.
The body compensates for small upward or downward changes in temperature by activating its
built-in thermoregulatory system, controlled by temperature sensors in the skin. When the body is
hot it has to get rid of excess heat there are two ways: increasing blood circulation and sweating.
When the sweat reaches the skin surface it evaporates and cool the body down; if the body cannot
reduce its temperature through increased blood circulation and sweating, it will begin to store the
heat and when this happens, the risk of serious health hazards is high. In case the prolonged
performance of a task in a very warm environment the body loses fluids and becomes fatigued. The
increasing heat stress results in poorer job performance by lowering alertness and slowing physical
responses. The thermal stress index 𝐻𝑆𝐼 (created by Belding and Hatch) is defined as the ratio
between the amount of evaporation (or sweat) required in relation to the average person's
maximum ability to sweat (or evaporate fluids from the body to cool). The ranges of values are valid
only in the early afternoon in light and shady winds: humidity, exposure and weather conditions
affect sweating and therefore the index. The higher this is, the worse the complaints and risks
associated with exposure.
𝐻𝑆𝐼 =𝐸𝑟𝑒𝑞
𝐸𝑚𝑎𝑥∗ 100 []
The required evaporation 𝐸𝑟𝑒𝑞 is calculated as the sum of three addends: the metabolic rate of body
heat production, convective and radiant heat exchange. The maximum sweat production that can
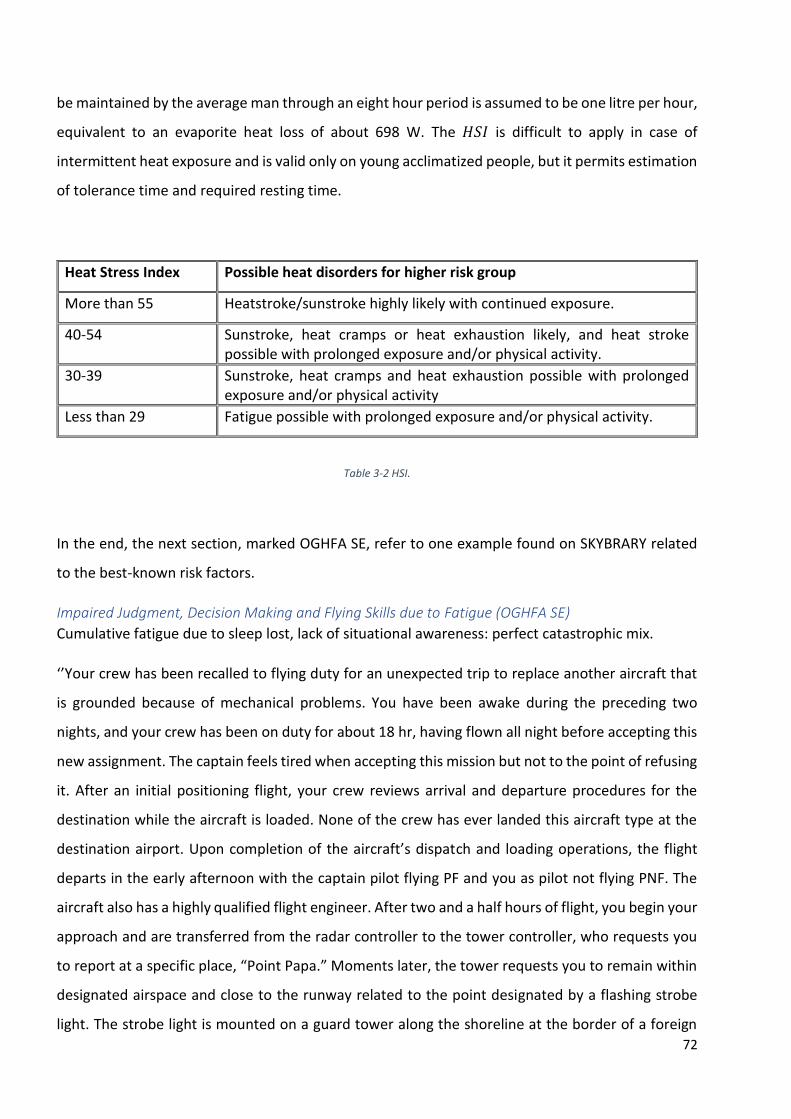
72
be maintained by the average man through an eight hour period is assumed to be one litre per hour,
equivalent to an evaporite heat loss of about 698 W. The 𝐻𝑆𝐼 is difficult to apply in case of
intermittent heat exposure and is valid only on young acclimatized people, but it permits estimation
of tolerance time and required resting time.
Heat Stress Index Possible heat disorders for higher risk group
More than 55 Heatstroke/sunstroke highly likely with continued exposure.
40-54 Sunstroke, heat cramps or heat exhaustion likely, and heat stroke possible with prolonged exposure and/or physical activity.
30-39 Sunstroke, heat cramps and heat exhaustion possible with prolonged exposure and/or physical activity
Less than 29 Fatigue possible with prolonged exposure and/or physical activity.
Table 3-2 HSI.
In the end, the next section, marked OGHFA SE, refer to one example found on SKYBRARY related
to the best-known risk factors.
Impaired Judgment, Decision Making and Flying Skills due to Fatigue (OGHFA SE)
Cumulative fatigue due to sleep lost, lack of situational awareness: perfect catastrophic mix.
‘’Your crew has been recalled to flying duty for an unexpected trip to replace another aircraft that
is grounded because of mechanical problems. You have been awake during the preceding two
nights, and your crew has been on duty for about 18 hr, having flown all night before accepting this
new assignment. The captain feels tired when accepting this mission but not to the point of refusing
it. After an initial positioning flight, your crew reviews arrival and departure procedures for the
destination while the aircraft is loaded. None of the crew has ever landed this aircraft type at the
destination airport. Upon completion of the aircraft’s dispatch and loading operations, the flight
departs in the early afternoon with the captain pilot flying PF and you as pilot not flying PNF. The
aircraft also has a highly qualified flight engineer. After two and a half hours of flight, you begin your
approach and are transferred from the radar controller to the tower controller, who requests you
to report at a specific place, “Point Papa.” Moments later, the tower requests you to remain within
designated airspace and close to the runway related to the point designated by a flashing strobe
light. The strobe light is mounted on a guard tower along the shoreline at the border of a foreign
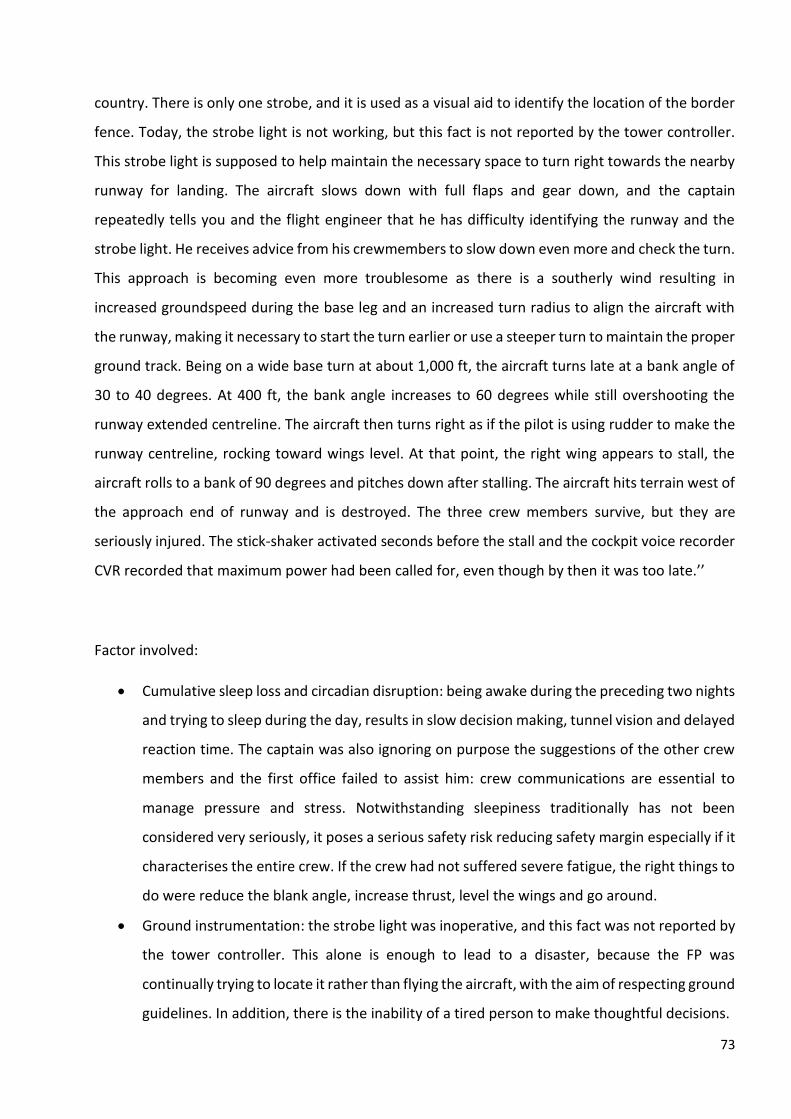
73
country. There is only one strobe, and it is used as a visual aid to identify the location of the border
fence. Today, the strobe light is not working, but this fact is not reported by the tower controller.
This strobe light is supposed to help maintain the necessary space to turn right towards the nearby
runway for landing. The aircraft slows down with full flaps and gear down, and the captain
repeatedly tells you and the flight engineer that he has difficulty identifying the runway and the
strobe light. He receives advice from his crewmembers to slow down even more and check the turn.
This approach is becoming even more troublesome as there is a southerly wind resulting in
increased groundspeed during the base leg and an increased turn radius to align the aircraft with
the runway, making it necessary to start the turn earlier or use a steeper turn to maintain the proper
ground track. Being on a wide base turn at about 1,000 ft, the aircraft turns late at a bank angle of
30 to 40 degrees. At 400 ft, the bank angle increases to 60 degrees while still overshooting the
runway extended centreline. The aircraft then turns right as if the pilot is using rudder to make the
runway centreline, rocking toward wings level. At that point, the right wing appears to stall, the
aircraft rolls to a bank of 90 degrees and pitches down after stalling. The aircraft hits terrain west of
the approach end of runway and is destroyed. The three crew members survive, but they are
seriously injured. The stick-shaker activated seconds before the stall and the cockpit voice recorder
CVR recorded that maximum power had been called for, even though by then it was too late.’’
Factor involved:
• Cumulative sleep loss and circadian disruption: being awake during the preceding two nights
and trying to sleep during the day, results in slow decision making, tunnel vision and delayed
reaction time. The captain was also ignoring on purpose the suggestions of the other crew
members and the first office failed to assist him: crew communications are essential to
manage pressure and stress. Notwithstanding sleepiness traditionally has not been
considered very seriously, it poses a serious safety risk reducing safety margin especially if it
characterises the entire crew. If the crew had not suffered severe fatigue, the right things to
do were reduce the blank angle, increase thrust, level the wings and go around.
• Ground instrumentation: the strobe light was inoperative, and this fact was not reported by
the tower controller. This alone is enough to lead to a disaster, because the FP was
continually trying to locate it rather than flying the aircraft, with the aim of respecting ground
guidelines. In addition, there is the inability of a tired person to make thoughtful decisions.
74
• Unfamiliarity: from the moment the pilot puts himself at the stick, his purpose is to carry out
the mission and land safely. Training is required to learn, and time is needed to the crew to
become familiar with all the equipment available: if aeroplane and airport had been usual
for the flight crew, the mission would have ended differently? Probably not due the
precedent risk factor, but not being comfortable with the instrumentation has definitely had
a negative impact.
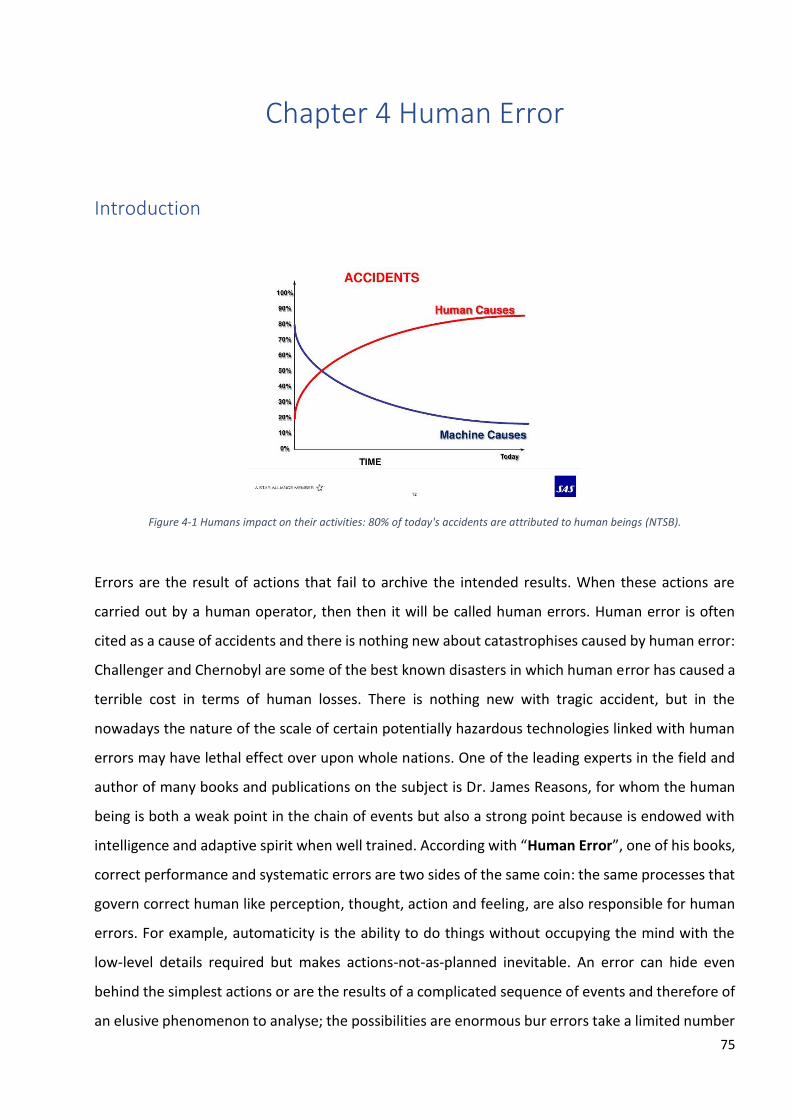
75
Chapter 4 Human Error
Introduction
Figure 4-1 Humans impact on their activities: 80% of today's accidents are attributed to human beings (NTSB).
Errors are the result of actions that fail to archive the intended results. When these actions are
carried out by a human operator, then then it will be called human errors. Human error is often
cited as a cause of accidents and there is nothing new about catastrophises caused by human error:
Challenger and Chernobyl are some of the best known disasters in which human error has caused a
terrible cost in terms of human losses. There is nothing new with tragic accident, but in the
nowadays the nature of the scale of certain potentially hazardous technologies linked with human
errors may have lethal effect over upon whole nations. One of the leading experts in the field and
author of many books and publications on the subject is Dr. James Reasons, for whom the human
being is both a weak point in the chain of events but also a strong point because is endowed with
intelligence and adaptive spirit when well trained. According with “Human Error”, one of his books,
correct performance and systematic errors are two sides of the same coin: the same processes that
govern correct human like perception, thought, action and feeling, are also responsible for human
errors. For example, automaticity is the ability to do things without occupying the mind with the
low-level details required but makes actions-not-as-planned inevitable. An error can hide even
behind the simplest actions or are the results of a complicated sequence of events and therefore of
an elusive phenomenon to analyse; the possibilities are enormous bur errors take a limited number
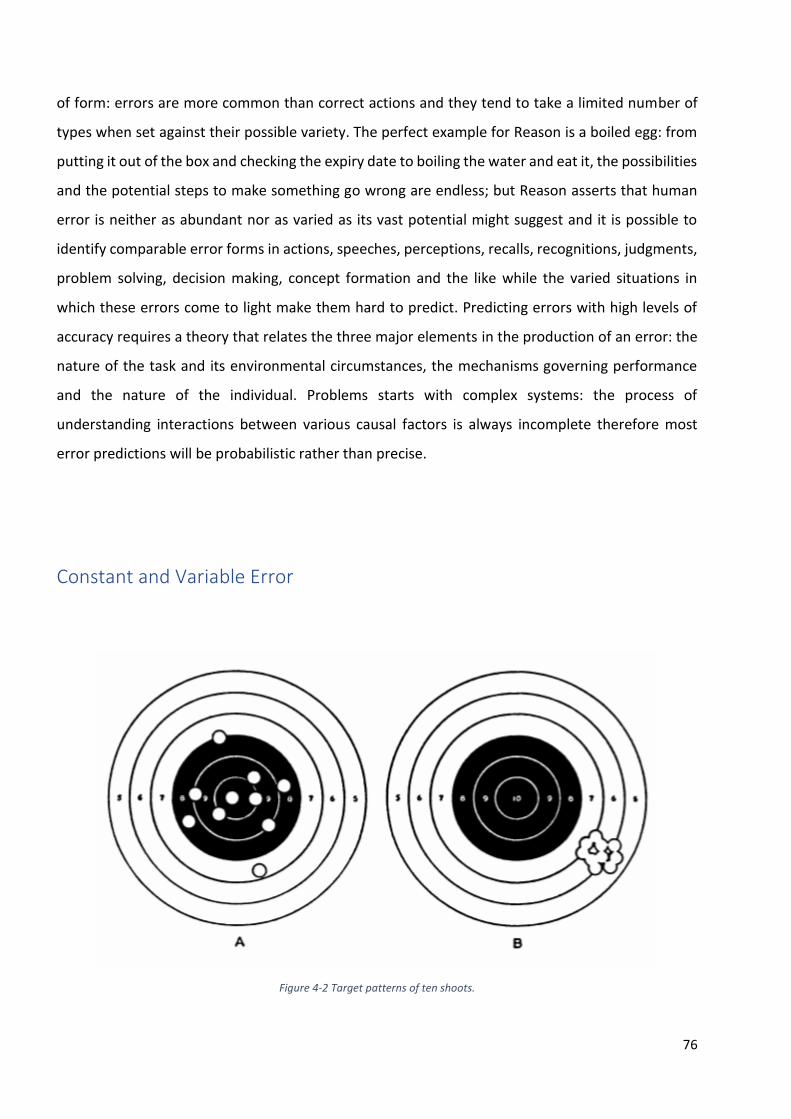
76
of form: errors are more common than correct actions and they tend to take a limited number of
types when set against their possible variety. The perfect example for Reason is a boiled egg: from
putting it out of the box and checking the expiry date to boiling the water and eat it, the possibilities
and the potential steps to make something go wrong are endless; but Reason asserts that human
error is neither as abundant nor as varied as its vast potential might suggest and it is possible to
identify comparable error forms in actions, speeches, perceptions, recalls, recognitions, judgments,
problem solving, decision making, concept formation and the like while the varied situations in
which these errors come to light make them hard to predict. Predicting errors with high levels of
accuracy requires a theory that relates the three major elements in the production of an error: the
nature of the task and its environmental circumstances, the mechanisms governing performance
and the nature of the individual. Problems starts with complex systems: the process of
understanding interactions between various causal factors is always incomplete therefore most
error predictions will be probabilistic rather than precise.
Constant and Variable Error
Figure 4-2 Target patterns of ten shoots.
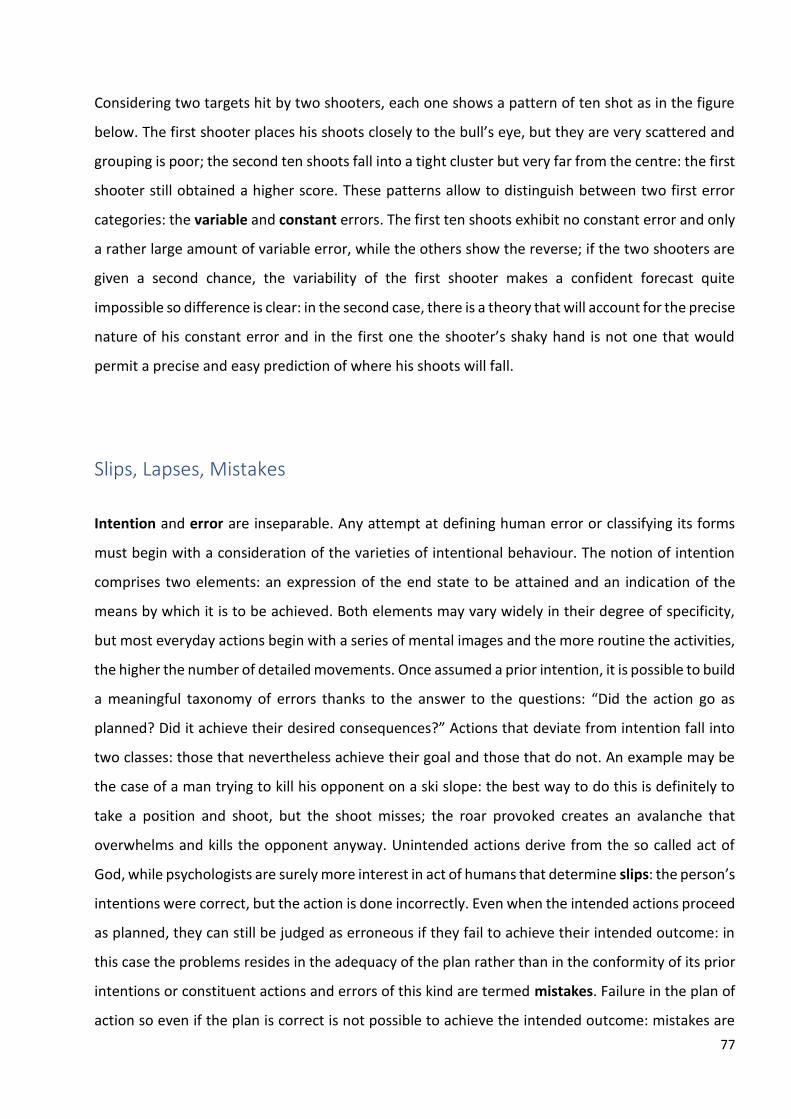
77
Considering two targets hit by two shooters, each one shows a pattern of ten shot as in the figure
below. The first shooter places his shoots closely to the bull’s eye, but they are very scattered and
grouping is poor; the second ten shoots fall into a tight cluster but very far from the centre: the first
shooter still obtained a higher score. These patterns allow to distinguish between two first error
categories: the variable and constant errors. The first ten shoots exhibit no constant error and only
a rather large amount of variable error, while the others show the reverse; if the two shooters are
given a second chance, the variability of the first shooter makes a confident forecast quite
impossible so difference is clear: in the second case, there is a theory that will account for the precise
nature of his constant error and in the first one the shooter’s shaky hand is not one that would
permit a precise and easy prediction of where his shoots will fall.
Slips, Lapses, Mistakes
Intention and error are inseparable. Any attempt at defining human error or classifying its forms
must begin with a consideration of the varieties of intentional behaviour. The notion of intention
comprises two elements: an expression of the end state to be attained and an indication of the
means by which it is to be achieved. Both elements may vary widely in their degree of specificity,
but most everyday actions begin with a series of mental images and the more routine the activities,
the higher the number of detailed movements. Once assumed a prior intention, it is possible to build
a meaningful taxonomy of errors thanks to the answer to the questions: “Did the action go as
planned? Did it achieve their desired consequences?” Actions that deviate from intention fall into
two classes: those that nevertheless achieve their goal and those that do not. An example may be
the case of a man trying to kill his opponent on a ski slope: the best way to do this is definitely to
take a position and shoot, but the shoot misses; the roar provoked creates an avalanche that
overwhelms and kills the opponent anyway. Unintended actions derive from the so called act of
God, while psychologists are surely more interest in act of humans that determine slips: the person’s
intentions were correct, but the action is done incorrectly. Even when the intended actions proceed
as planned, they can still be judged as erroneous if they fail to achieve their intended outcome: in
this case the problems resides in the adequacy of the plan rather than in the conformity of its prior
intentions or constituent actions and errors of this kind are termed mistakes. Failure in the plan of
action so even if the plan is correct is not possible to achieve the intended outcome: mistakes are
78
evidently more insidious and complex than slips, they constitute a far greater danger and are harder
to detect. Execution errors are also called lapses, especially when they involve failure of memory.
Reason refers to these errors as failures in the modality of action control: at this level, errors happen
because we do not perform the appropriate attentional control over the action and therefore a
wrong routine is activated; it is not difficult to imagine that when under stress during in-flight
emergencies, critical steps in emergency procedures can be missed. Observations taken from a wide
range of samples, in which people were exposed to different stresses, support the stress
vulnerability hypothesis. A person under high stress has a higher tendency for lapses and cognitive
failure in normal everyday life are associated with increased vulnerability to externally imposed
stresses.
SRK
The previous dichotomy between execution and planning failure is a useful first approximation but
falls naturally out of the working definition of error: planned actions may fail to achieve their desired
outcome either because the actions did not go as planned or because the plan itself was deficient.
Mistakes occur at the level of intention formation whereas slips and lapses are associated with more
subordinate levels of action selection and intention storage. During the Chernobyl disaster, after
the reduction of energy to 10% of the maximum and the violation of security procedures, the
operators continued with some scheduled tests; these violations produced a security breach and a
consequent explosion that poured the radioactive material into the atmosphere. Where is the
error? The operators adhered to the plan, but it was inadequate to achieve safe plant conditions:
this can be categorized fairly unambiguously as mistake. The Three Mile Island accident was a partial
meltdown of reactor number 2 of Three Mile Island Nuclear Generating Station in Pennsylvania;
during some hectic moments the operators did not recognise that the relief valve on the pressurized
was stuck open because a failed panel display indicate that it was shut instead. This kind of error do
not readily fit into the precedent dichotomy: it contains some of the elements of mistakes in that
they involved improper appraisals of the system state bat also shows sliplike features in the wrong
interpretation of valve state, typical strong but wrong interpretation.
79
An influential classification of the different types of information processing involved in industrial
tasks was developed by J. Rasmussen of the Risø Laboratory in Denmark: the goal was to provide a
useful framework for identifying the types of error likely to occur in different operational situations,
or within different aspects of the same task where different types of information processing
demands on the individual may occur. This classification system is known as the Skill, Rule,
Knowledge based SRK approach; it yields three basic error types:
• Skill based error SB are related to the intrinsic variability of force, space and time. Human
performance is governed by stored patterns of preprogramed instructions represented as
analogue structures in a time space domain; the skill based mode refers to the smooth
execution of highly practiced, largely physical actions in which there is virtually no conscious
monitoring. The error-triggering generally involve a necessary departure from some well-
established routine, this is the most recoverable one because usually the feedback is
obtained from the action that didn’t work.
• Rule based error RB is typically associated with the misclassification of situations leading to
the application of the wrong rule and this level is applicable to tacking familiar problems in
which solutions are governed by stoned rules of the type if-then. These rules may have been
learned as a result of interacting with the plant, through formal training, or by working with
experienced process workers. The level of conscious control is intermediate between that of
the knowledge and skill based modes, while feedbacks are more problematic because the
immediate response is the one someone asked for.
• Knowledge based error KB comes into play in novel situations for which actions must be
planned on-line using conscious analytical processes and stored knowledge. Errors rise from
resource limitations and incomplete knowledge, while increasing experience allows to
reduce mental effort to better assess the situation. Mistakes result from changes in the
world that have neither been prepared for not anticipated, or from the lack of some of the
relevant information available at the planning stage (attention bottleneck).
In raw error frequencies, SB >> RB > KB: 61% of errors are at SB level, 27% of errors are at RB level
and 11% of errors are at KB level (SKYBRARY); but about opportunities for errors the order reverses:
humans perform vastly more SB tasks than RB, and vastly more RB than KB so a given KB task is
more likely to result in error than a given RB or SB task. Both RB and KB performance are only called
into play after the individual has become conscious of the problem and someone attempts to find a

80
solution, while SB errors precede the detection of a problem; also SB and RB errors share a
predominant mode of control and performance is characterised by feedforward control emanating
from stored knowledge structures that is absent from KB because the problem solver has exhausted
his stock of stored problem solving routine.
Figure 4-3 Summarising the distinctions between the three errors types (Reason, 1990).
81
Errors and MRT
Workload is the amount of work an individual has to carry out: is a complicated topic discussed in
more depth in the previous chapters through resource theory by Wickens. In this theory, selection
is implicit in the restricted nature of the attentional commodity, the resources are limited and not
overlapping thus only those events, task elements or ideas that receive some critical allocation of
resources will achieve deeper levels of processing. People’s ability to divide attention between two
concurrent tasks depends on the similarity: the greater the similarity the two tasks are the more
likely they are to call upon the same processing resources at the same time and thus produce mutual
interference. The results of several studies by Wickens indicate that interference can occur at
several different stages of the task sequence rather that a single critical points, but the more
practised people are at handling the two activities at the same time the more proficient they
become at responding to just those features that differentiate the two tasks, thus reducing their
initial similarity and the likelihood of interference.
Despite the accuracy with which Wickens describes his model, the limitations of MRT include
variability in measuring efficiency of tasks, as well as the challenge of estimating a baseline level of
demand for tasks, since the level of demand for a given task may be very reliant on some factor,
very difficult to include in the account: the experience level of the individual in question with the
task, or all the experimental finding for example the rhythmicity of the two shared task. The model
assumes that resources will be deployed logically and optimally towards each task being completed,
while more recent studies suggest that there are tasks which are more engaging than others, such
that they pre-empt other tasks. This complicate the overlap process. Studies for example, have
found that drivers became so engrossed by cell phone conversations that they failed to continue to
pay attention to their surroundings, despite the fact that there is little overlap in resource allocation
between the two tasks. Further research is needed to elucidate how to identify and minimize all
those limitations.
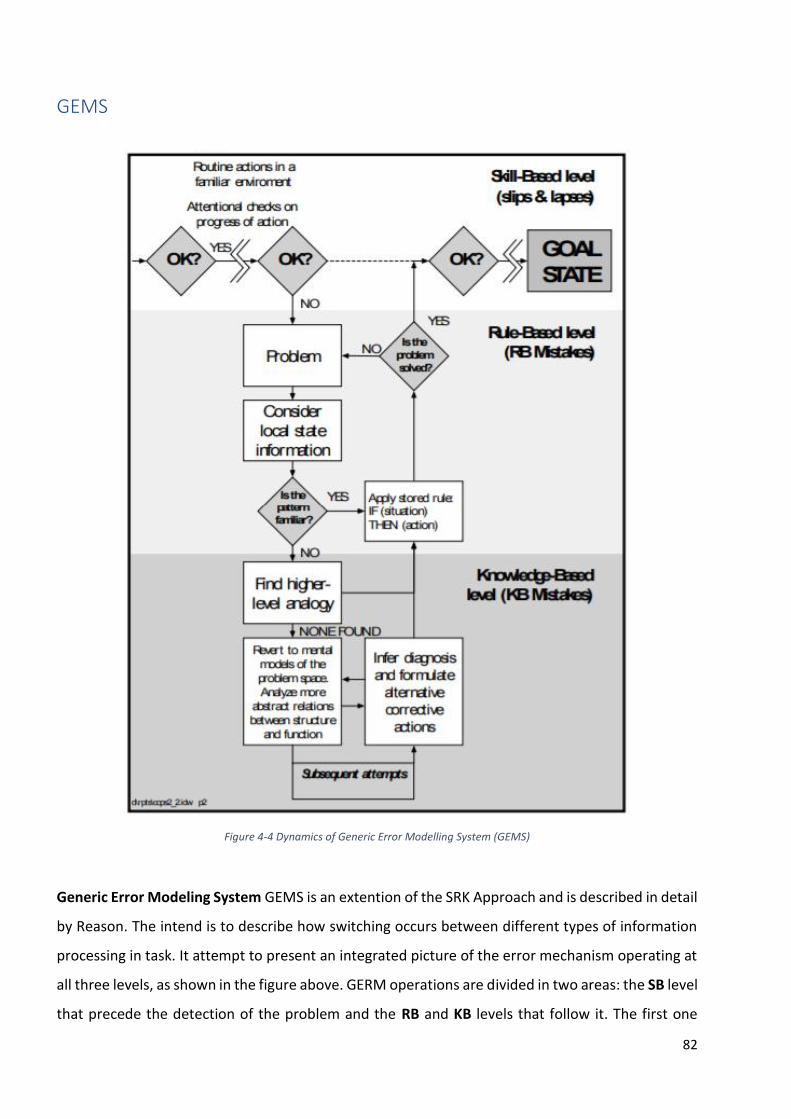
82
GEMS
Figure 4-4 Dynamics of Generic Error Modelling System (GEMS)
Generic Error Modeling System GEMS is an extention of the SRK Approach and is described in detail
by Reason. The intend is to describe how switching occurs between different types of information
processing in task. It attempt to present an integrated picture of the error mechanism operating at
all three levels, as shown in the figure above. GERM operations are divided in two areas: the SB level
that precede the detection of the problem and the RB and KB levels that follow it. The first one
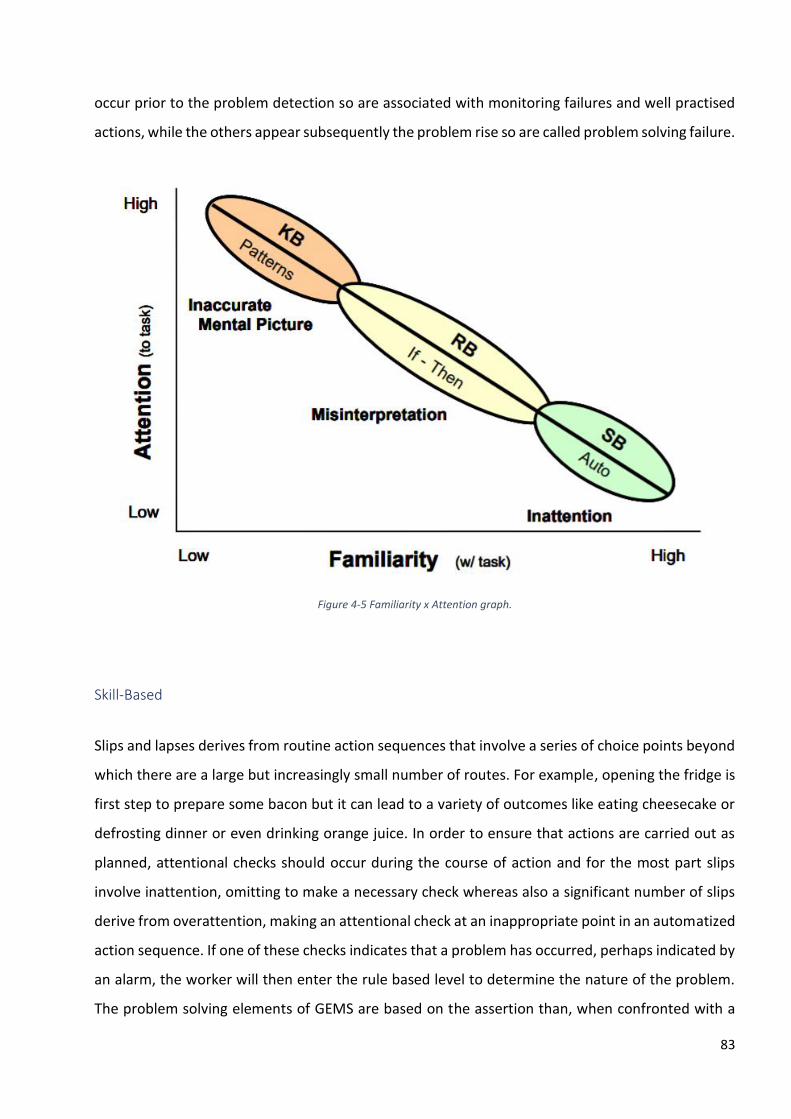
83
occur prior to the problem detection so are associated with monitoring failures and well practised
actions, while the others appear subsequently the problem rise so are called problem solving failure.
Figure 4-5 Familiarity x Attention graph.
Skill-Based
Slips and lapses derives from routine action sequences that involve a series of choice points beyond
which there are a large but increasingly small number of routes. For example, opening the fridge is
first step to prepare some bacon but it can lead to a variety of outcomes like eating cheesecake or
defrosting dinner or even drinking orange juice. In order to ensure that actions are carried out as
planned, attentional checks should occur during the course of action and for the most part slips
involve inattention, omitting to make a necessary check whereas also a significant number of slips
derive from overattention, making an attentional check at an inappropriate point in an automatized
action sequence. If one of these checks indicates that a problem has occurred, perhaps indicated by
an alarm, the worker will then enter the rule based level to determine the nature of the problem.
The problem solving elements of GEMS are based on the assertion than, when confronted with a
84
problem, human being are strongly biased to search for find a pre-packaged solutions at the RB level
before resorting to the far more effortful KB level: the drop is made by matching aspects of the local
state information to the situational elements of stored problem handling. If RB solutions are failed
to offer satisfactory options, then the move down to KB level takes place. In the SB level, recovery
is usually rapid and efficient, because the individual will be aware of the expected outcome of his
or her actions and will therefore get early feedback with regard to any slips that have occurred which
may have prevented this outcome being achieved.
Rule-Based
RB level is based on matching: the more specifically a rule describes the current situation, the more
likely it is to win. Because the rules are organised into default hierarchies, success also depends
upon the degree of support a competing rule receives from other rules, the degree of compatibility.
RB mistakes arise from the misapplication of good or bad rule: a good rule is one with proven utility
in a particular situation but which can be misapplied due to similar conditions where different
actions are needed; bad rules can be divided in two main categories: encoding deficiencies, in which
features of a particular situation are ignored or either not encoded at all and action deficiencies, in
which the action yields unsuitable or inadvisable responses.
A good rule is also called strong but wrong rule, a routine than in the past has repeatedly shown
itself to be reliable. A good example, was the error made by the Oyster Creek operators: the Oyster
Creek Nuclear Power Station was a boiling water reactor located in New jersey and on 2 May 1979
the operators mistook the annulus level for the water level within the shroud because the two level
are usually the same, but although the low water level alarm sounded three minutes the error was
not discovered until 30 minutes later. This demonstrates that the misapplication of a good rules, is
preceded by signs or inputs that satisfy some of the conditional aspects of an appropriate rules (the
same water level), and by countersigns or input that indicate that the more general rule in
inapplicable (the alarm). The difficulty of detecting or interpreting the countersigns, often traded
for nonsigns or inputs which do not relate to any existing rule, leads to a wrong action; such a
difficulty, even when the alarm has been on for several minutes, is linked to the strength of the rule
because the more victories it has to its credit, the stronger and more likely to win the rule will be,
but also the less attention will be paid to the other rules. In other word, the cognitive system is
biased to favour strong rather than weak rules whenever the matching conditions are less than
85
perfect. Cognitive bias is a systematic pattern of deviation from rationality in judgment, related with
individual experience and cultural contest. It indicates the tendency to create one’s own subjected
reality regulated by own rules and not necessarily corresponding to the evidence, but developed on
the interpretation of the information possessed, even if not logically or semantically connected. In
an autonomous reality, the decision making process will be badly influenced, and even a good rule
can bring unwanted results. Failure to apply a good rule is also known as a violation.
Sometimes rules are inappropriate or incorrect, and adherence leads to negative outcomes. In these
cases, application of a bad rule does not deliver the desired outcome. Bad rules may be created
based on incorrect knowledge or a good rule may become bad following changes that are not
managed appropriately. The bad rules case is surely more complicated to analyse; for example: the
Piper Alpha was an oil platform located in the North Sea, approximately near the Scotland, and on
6 July 1988 explosions, resulting oil losses and gas fires occur; during the tragedy the personnel
following the muster procedures found that they could not access the lifeboats from the
accommodation block while the ones who survived the disaster were those who chose to violate
the muster rule and jump off the platform into the ocean. In this case the bad rule was violated, and
the desired outcome was achieved. Reason starts with encoding deficiencies in rules, usually related
to with missing or fragmented rule structures; sometimes the feedback necessary to disconfirm bad
rules may be misconstrued or absent altogether, or even deliberately ignored because they
contradict an erroneous general rule. About the action component of a problem solving rule, it can
be bad in varying degrees. At one extreme, a rule based solution may be perfectly adequate to
achieve its immediate goal but it could be inadvisable because it may expose its user to avoidable
risk: for example, a conscientious driver who is tremendously late for work knows that he couldn’t
exceed the speed limit to get there earlier, but the dangers of driving too fast are much less
compelling that the consequences of a missed appointment. At intermediate level, a rule could be
clumsy or inefficient, but still achieve its aims; one problem has several solutions, and some are
efficient and direct, while others are circuitous satisfying certain goals yet bringing even more acute
problem in their wake. For example, leaving the computer permanently on, is the right choice to
use it at every required moment, but in the long run it will burn the battery out. In the end, a rule
could simply be wrong: for example, the application of a wrong rule is one of the causes of the
Chernobyl disaster on 26 April 1986. The accident started during a safety test on nuclear reactor
because in order to carry out their assigned task, the operators switched off the emergency core
cooling system’s pump and increased the water flow through the core threefold. They appeared to
86
be working in accordance with a good rule trying to increase water flow to have a greater safety
margin, but in the dangerously low power regime in which they were then operating more water
equalled less safety, triggering the accident.
Knowledge-Based
The last level of GEMS is the knowledge based level. Knowledge based behaviour is the one to use
when in the presence of new or unforeseen situations, that is not known, for which the rules or
procedures of reference are unidentified. No skill, rule or pattern recognizable to the individual is
present, like first day in a new workplace or first time driving a car. In the case of knowledge based
mistakes, other factors are important. Most of these factors arise from the considerable demands
on the information processing capabilities of the individual that are necessary when a situation must
be evaluated from first principles. A useful image to conjure up when considering a problem of
knowledge based processing is that of a beam of light directed onto a large screen: the imagine on
the screen is the mental representation of the problem, that may be incomplete or inaccurate so
the information may be insufficient or irrelevant. Furthermore, the beam could highlight only a few
areas and leave many others in the darkness, thereby causing a person to make a wrong decision.
According with the GEMS model, once out the RB level, if the problem hasn't been solved yet, higher
level analogies must be found; during the application some corrective actions or the formulation of
alternatives may be required. Reason describes a wide range of failure modes under this condition.
One of them is “confirmation bias”, the tendency to search for, interpret, favor, and recall
information in a way that confirms or supports one's prior beliefs or values: an internal yes man
echoing back and the tendency to selectively process information; for example, a police detective
may identify a suspect early in an investigation, but then may only seek confirming rather than
disconfirming evidence. Confirmation biases contribute to overconfidence in personal beliefs and
can maintain or strengthen beliefs in the face of contrary evidence. Problem solver are likely to be
overconfident in evaluating the correctness of their knowledge, and the tendency to never abandon
a devised plan is greater when the plan is very elaborate or product of considerable labour. So,
another common behaviour that occurs during knowledge-based problem solving is “encystment”
where the individual or the operating team become enmeshed in one aspect of the problem to the
exclusion of all other considerations; the opposite form of behaviour is “vagabonding” observed
where the overloaded worker gives his attention superficially to one problem after another, without
87
solving any of them. Selectivity also play a fundamental role because mistake will occur if attention
is given to the wrong features or not given to the right one. The last danger behaviour can be
summarized with the saying “out of sight out of mind”, which refers to another common attitude
about forgetting fact that are not immediately present.
Error Detection
In this chapter the emphasis will shift toward the detection and recovery of errors. From the last
paragraph, one thing is certainly clear: to err is human and errors still occur no matter how well
people are trained. It is impossible to guarantee the total errors elimination, but ways of mitigating
their consequences needs to be discovered. The first step along this path is to consider what is
known about the means by which slips, lapses and mistakes can be detected and recovered.
Common sensed and every day observation have shown that there are probably only three ways in
which people’s error are brought to their attention: various kind of self-monitoring, environment
error cueing and error detection thanks to other people.
Self-monitoring
Self-monitoring is when the action is monitored and compared with expectations, if the action was
not as planned, then the error would be detected, or through deleterious outcome, if the error
causes some deleterious results, then it may be detected. Both modes rely upon a feedback
mechanism with some monitoring function that compares what is expected with what has occurred,
and the ability of the cognitive system to catch a discrepancy between expectations and
occurrences. This process is driven by a control feedback: deviations of output from some ideal or
desired stare are the new input to the controlling agency, which acts to minimize these
discrepancies. This, in turn, carries implications for the various ways in which the ideal and desired
state can be represented.
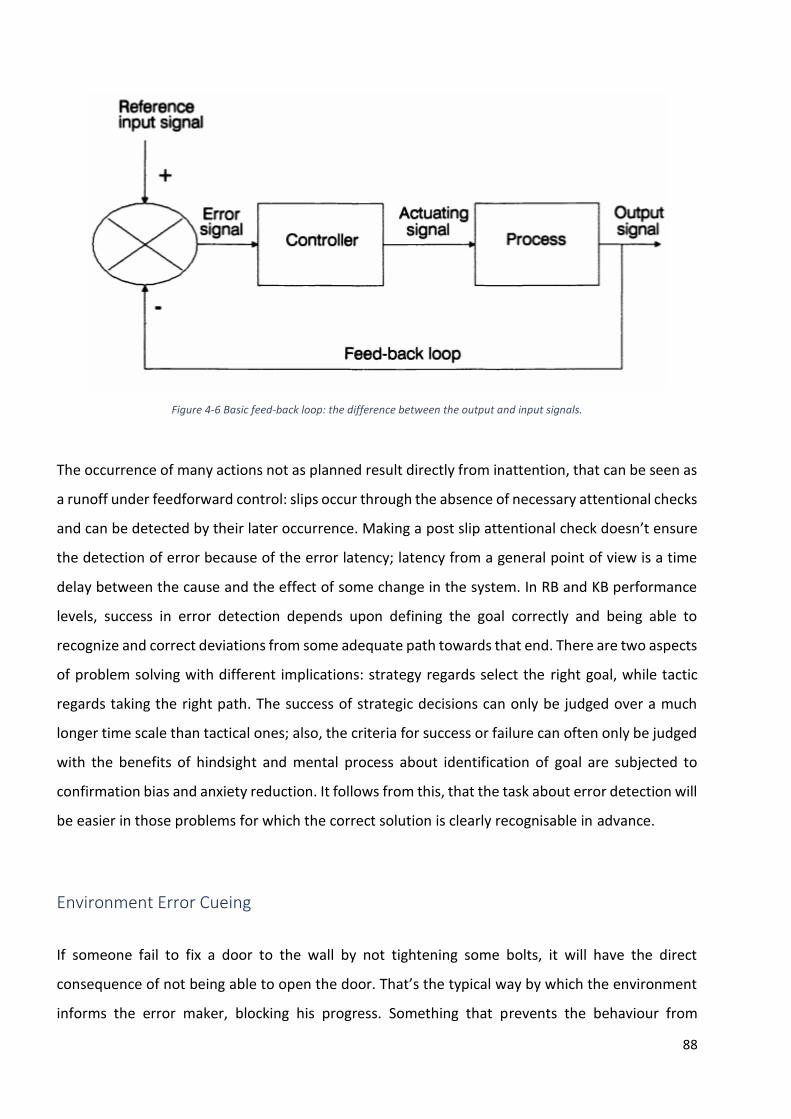
88
Figure 4-6 Basic feed-back loop: the difference between the output and input signals.
The occurrence of many actions not as planned result directly from inattention, that can be seen as
a runoff under feedforward control: slips occur through the absence of necessary attentional checks
and can be detected by their later occurrence. Making a post slip attentional check doesn’t ensure
the detection of error because of the error latency; latency from a general point of view is a time
delay between the cause and the effect of some change in the system. In RB and KB performance
levels, success in error detection depends upon defining the goal correctly and being able to
recognize and correct deviations from some adequate path towards that end. There are two aspects
of problem solving with different implications: strategy regards select the right goal, while tactic
regards taking the right path. The success of strategic decisions can only be judged over a much
longer time scale than tactical ones; also, the criteria for success or failure can often only be judged
with the benefits of hindsight and mental process about identification of goal are subjected to
confirmation bias and anxiety reduction. It follows from this, that the task about error detection will
be easier in those problems for which the correct solution is clearly recognisable in advance.
Environment Error Cueing
If someone fail to fix a door to the wall by not tightening some bolts, it will have the direct
consequence of not being able to open the door. That’s the typical way by which the environment
informs the error maker, blocking his progress. Something that prevents the behaviour from
89
continuing until the problem has been corrected is called forcing functions by the American author
Donald Norman. It forces conscious attention upon something. The existence of appropriate
functions naturally in the task, guarantee error detection only if it does not come too late. People’s
reactions to forcing functions are not always entirely rational: execution of well-known tasks is often
partly or wholly automatized, requiring few or no attentional resources, the function can thus be
necessary to wake the user up. Norman identified six possible ways in which a system can respond
to its operators’ errors in human-computer interactions:
• Gagging: a gag is a forcing function that prevent users from expressing unrealisable
intentions.
• Warning: messages to inform the user about potentially dangerous situations.
• “Do nothing”: the system literally do nothing responding to an illegal input.
• Self-correct: the evolution of the previous, because the system tries to guess some legal
action thar corresponds to the user’s intention.
• “Teach me”: the system quizzes the user about what is in his mind, storing new command.
• “Let’s talk about it”: the user interacts directly with system to allocate the error.
By Others
At Oyster Creek on the accident day, on operator erroneously closed four pump discharge valves
instead of two. This effectively shut off all the natural circulation in the core area damaging the
reactor. The error was only discovered 30 minutes later, when the engineering supervisor entered
the control room and noticed a precipitous decline in the water level after a discharge valve had
been opened: he noted the closure while walking to check the pump seal display. David Woods is
an integrated systems engineering who has worked to improve systems safety in high risk complex
settings for 40 years. These include studies of human coordination with automated and intelligent
systems and accident investigations in aviation, nuclear power and crisis response. During one of
his studies he analysed 99 simulated emergency scenario and categorised operator errors into two
groups: state identification problems and execution failures, or slips. None of the diagnostic errors
were noticed by the operators who made them: some of they were discovered by fresh eyes
operators, but the major part of all the errors remained undetected. Woods conclude the study,
90
saying that fixation was the most common cause of the failure and misdiagnoses tended to persist
regardless of an accumulation of contradictory evidence. These observations are very much in
keeping about the KB processing: when the formulated hypothesis is incorrect, feedback that is
useful for detecting slips is unavailable. There is no discrepancy between action and intention, only
between the plan and the true state of things.
Risk Management
Safety, also fatigue related, is the condition that affected elements are protected from hazards and
risks arising in the operating environment. The affected elements and responsible of aviation safety
include everyone in the aviation environment from governmental civil aviation authorities and
traffic controller to aircraft, pilots, employers and customers. In such a vast universe, human fatigue
plays a fundamental role as identified human factor hazard particularly with any kind of shift work.
The elimination of aviation accidents and/or serious incidents starts from the identification and
remains the ultimate goal achievable, but obviously the aviation system can never be totally free
from hazards and associated risks because safety is a dynamic feature. The risk management process
determines whether or not a fatigue hazard requires mitigation and is a key component of the safety
management process of any Safety Management System SMS or Fatigue Related Management
System FRMS. It requires a coherent and consistent process of objective analysis, in particular for
evaluating the operational risks. As surely not all risks can be removed and not all possible risk
mitigation measures are economically practical, it is necessary to accept and tolerate the residual
risk. Risk management consist of three essential elements:
• Hazard identification: Identification of undesired or adverse events that can lead to the
occurrence of a hazard and the analysis of mechanisms by which these events may occur
and cause harm. Both reactive (to identify the causes of fatigue after an event) and proactive
(to identify the causes of fatigue and mitigation in current operations) methods and
techniques should be used for hazard identification while predictive methods refer to future
risk identification.
91
• Risk assessment: Identified hazards are assessed in terms of criticality of their harmful effect
and ranked in order of their risk-bearing potential. They are assessed often by experienced
personnel, or by utilising more formal techniques and through analytical expertise. The
severity of consequences and the likelihood (frequency) of occurrence of hazards are
determined. If the risk is considered acceptable, operation continues without any
intervention. If it is not acceptable, the risk mitigation process is engaged.
• Risk mitigation: If the residual risk is considered to be unacceptable, then control measures
are taken to fortify and increase the level of defences against that risk or to avoid or remove
the risk, if this is economically feasible.
Mitigations are action undertaken to limit the identified risk: each control measure needs to be
evaluated, to reveal possible latent hazards and dormant risks that may arise from activating that
measure. Once all these control measures are implemented, the organisation needs to ensure they
are engaged in a correct way, and this is achieved through a set of arrangements, processes and
systematic actions, which build the Safety Assurance domain of the SMS. Fatigue is an accepted
human factors hazard because it affects most aspects of a crewmember’s ability to do their job: a
selection of mitigations should be based on fatigue risk assessment results and the effectiveness of
controls. The general difficulty with fatigue is that it primarily results out of individual sleep obtained
and time spent awake, two variables virtually unknown to the people doing the fatigue risk
assessment. In Europe, for example, Flight Time Limitation Regulations were considered the only
solution to control flight crew fatigue, but this approach largely ignored individual responsibilities
so is considered to be inefficient since fatigue is not solely the result of flight or duty time duration.
It depends on personal factors as circadian phase, personal inclination and workload over
consecutive days; focusing on this fatigue cause it’s possible to develop more effective control
measures. Effective controls and mitigation strategies go beyond rest and duty cycles, not on
isolated duty. For duties that are either very long, start very early in morning, finish late at night or
go through the night, controls and mitigations need to be considered in the context of successive
days and duties. That’s because the only concrete remedy for fatigue is sleep which cannot be
substituted by any methodology. Fatigue leads to a reduced performance capability by definition,
but a general difficulty to assess fatigue risk is that it is underreported, hard to detect, difficult to
measure or not identified at all.
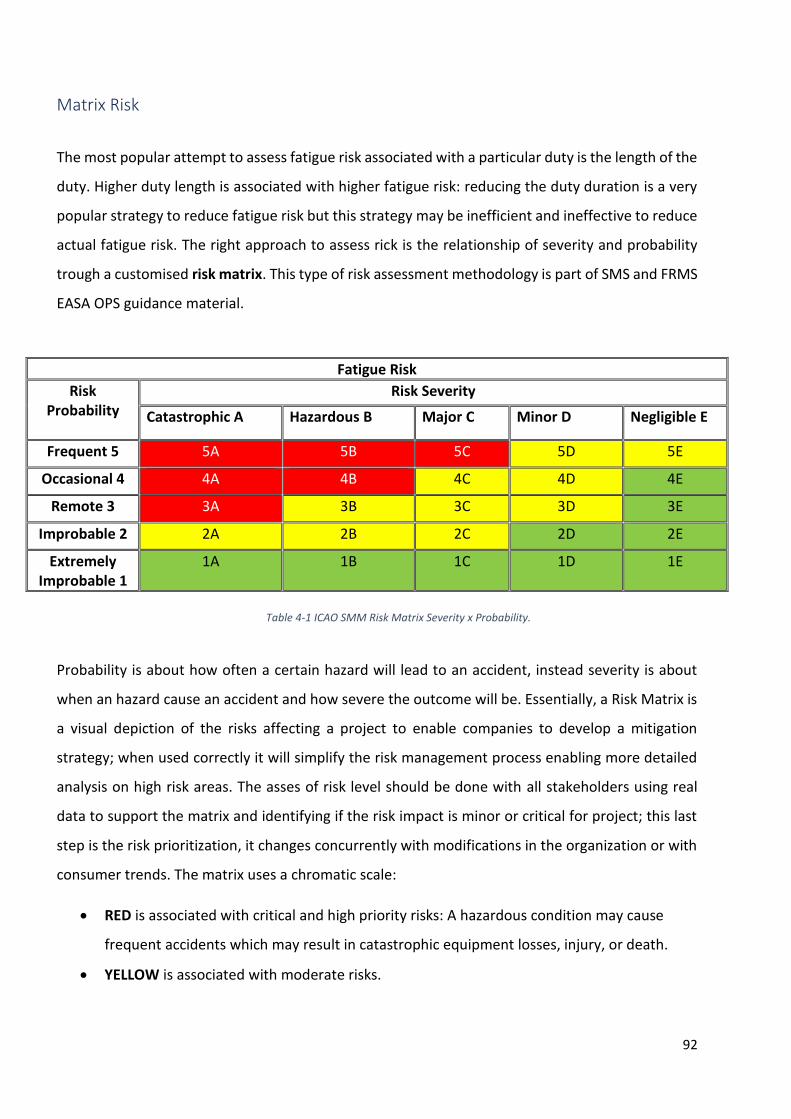
92
Matrix Risk
The most popular attempt to assess fatigue risk associated with a particular duty is the length of the
duty. Higher duty length is associated with higher fatigue risk: reducing the duty duration is a very
popular strategy to reduce fatigue risk but this strategy may be inefficient and ineffective to reduce
actual fatigue risk. The right approach to assess rick is the relationship of severity and probability
trough a customised risk matrix. This type of risk assessment methodology is part of SMS and FRMS
EASA OPS guidance material.
Probability is about how often a certain hazard will lead to an accident, instead severity is about
when an hazard cause an accident and how severe the outcome will be. Essentially, a Risk Matrix is
a visual depiction of the risks affecting a project to enable companies to develop a mitigation
strategy; when used correctly it will simplify the risk management process enabling more detailed
analysis on high risk areas. The asses of risk level should be done with all stakeholders using real
data to support the matrix and identifying if the risk impact is minor or critical for project; this last
step is the risk prioritization, it changes concurrently with modifications in the organization or with
consumer trends. The matrix uses a chromatic scale:
• RED is associated with critical and high priority risks: A hazardous condition may cause
frequent accidents which may result in catastrophic equipment losses, injury, or death.
• YELLOW is associated with moderate risks.
Fatigue Risk
Risk Probability
Risk Severity
Catastrophic A Hazardous B Major C Minor D Negligible E
Frequent 5 5A 5B 5C 5D 5E
Occasional 4 4A 4B 4C 4D 4E
Remote 3 3A 3B 3C 3D 3E
Improbable 2 2A 2B 2C 2D 2E
Extremely Improbable 1
1A 1B 1C 1D 1E
Table 4-1 ICAO SMM Risk Matrix Severity x Probability.
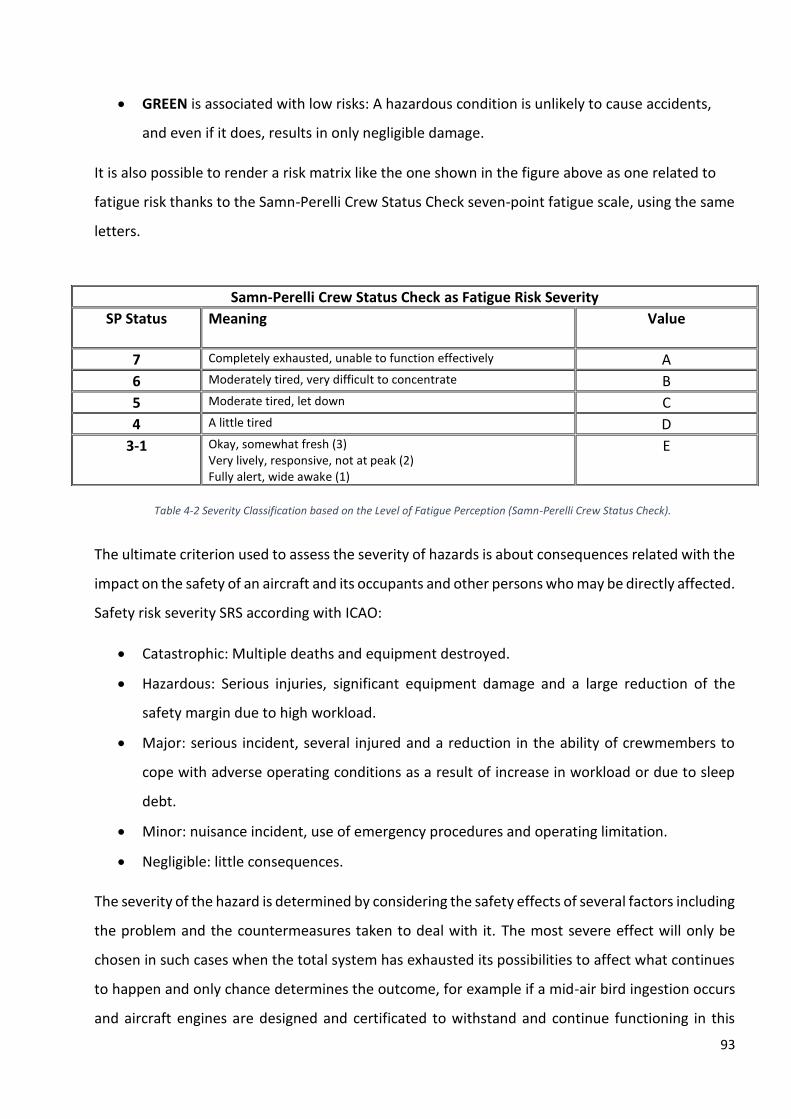
93
• GREEN is associated with low risks: A hazardous condition is unlikely to cause accidents,
and even if it does, results in only negligible damage.
It is also possible to render a risk matrix like the one shown in the figure above as one related to
fatigue risk thanks to the Samn-Perelli Crew Status Check seven-point fatigue scale, using the same
letters.
The ultimate criterion used to assess the severity of hazards is about consequences related with the
impact on the safety of an aircraft and its occupants and other persons who may be directly affected.
Safety risk severity SRS according with ICAO:
• Catastrophic: Multiple deaths and equipment destroyed.
• Hazardous: Serious injuries, significant equipment damage and a large reduction of the
safety margin due to high workload.
• Major: serious incident, several injured and a reduction in the ability of crewmembers to
cope with adverse operating conditions as a result of increase in workload or due to sleep
debt.
• Minor: nuisance incident, use of emergency procedures and operating limitation.
• Negligible: little consequences.
The severity of the hazard is determined by considering the safety effects of several factors including
the problem and the countermeasures taken to deal with it. The most severe effect will only be
chosen in such cases when the total system has exhausted its possibilities to affect what continues
to happen and only chance determines the outcome, for example if a mid-air bird ingestion occurs
and aircraft engines are designed and certificated to withstand and continue functioning in this
Samn-Perelli Crew Status Check as Fatigue Risk Severity
SP Status
Meaning Value
7 Completely exhausted, unable to function effectively A
6 Moderately tired, very difficult to concentrate B
5 Moderate tired, let down C
4 A little tired D
3-1 Okay, somewhat fresh (3) Very lively, responsive, not at peak (2) Fully alert, wide awake (1)
E
Table 4-2 Severity Classification based on the Level of Fatigue Perception (Samn-Perelli Crew Status Check).
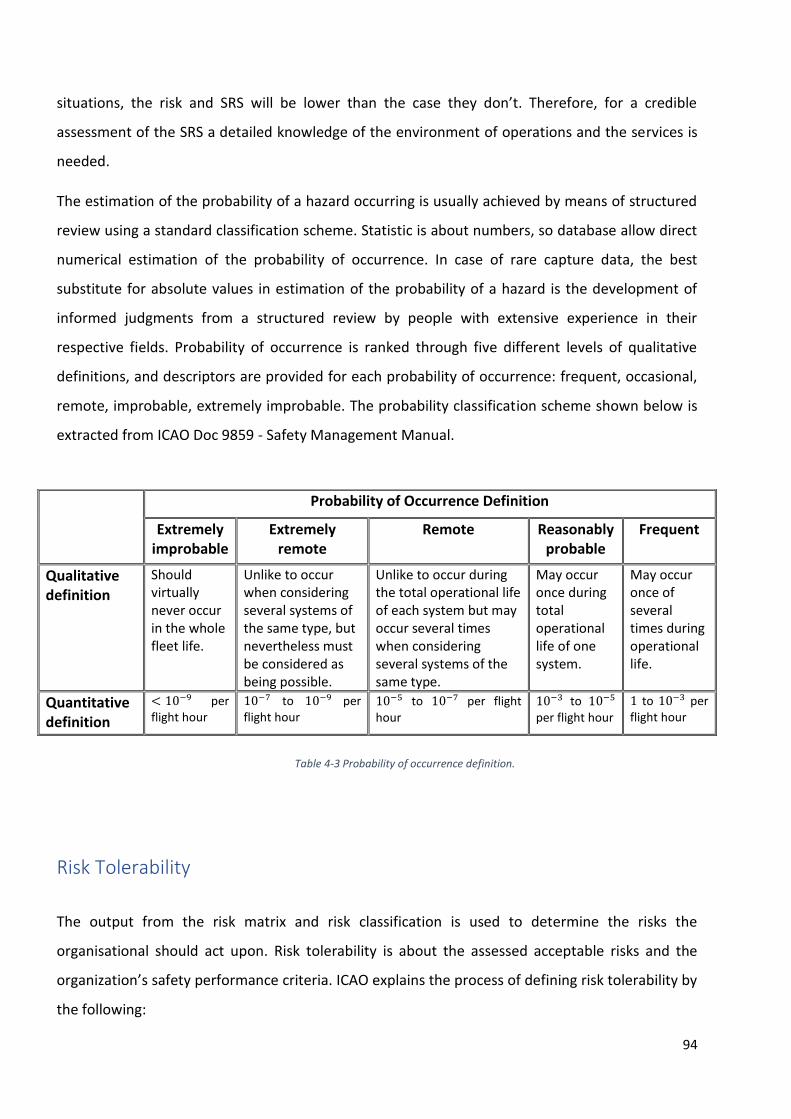
94
situations, the risk and SRS will be lower than the case they don’t. Therefore, for a credible
assessment of the SRS a detailed knowledge of the environment of operations and the services is
needed.
The estimation of the probability of a hazard occurring is usually achieved by means of structured
review using a standard classification scheme. Statistic is about numbers, so database allow direct
numerical estimation of the probability of occurrence. In case of rare capture data, the best
substitute for absolute values in estimation of the probability of a hazard is the development of
informed judgments from a structured review by people with extensive experience in their
respective fields. Probability of occurrence is ranked through five different levels of qualitative
definitions, and descriptors are provided for each probability of occurrence: frequent, occasional,
remote, improbable, extremely improbable. The probability classification scheme shown below is
extracted from ICAO Doc 9859 - Safety Management Manual.
Risk Tolerability
The output from the risk matrix and risk classification is used to determine the risks the
organisational should act upon. Risk tolerability is about the assessed acceptable risks and the
organization’s safety performance criteria. ICAO explains the process of defining risk tolerability by
the following:
Probability of Occurrence Definition
Extremely improbable
Extremely remote
Remote Reasonably probable
Frequent
Qualitative definition
Should virtually never occur in the whole fleet life.
Unlike to occur when considering several systems of the same type, but nevertheless must be considered as being possible.
Unlike to occur during the total operational life of each system but may occur several times when considering several systems of the same type.
May occur once during total operational life of one system.
May occur once of several times during operational life.
Quantitative definition
< 10−9 per flight hour
10−7 to 10−9 per flight hour
10−5 to 10−7 per flight hour
10−3 to 10−5 per flight hour
1 to 10−3 per flight hour
Table 4-3 Probability of occurrence definition.
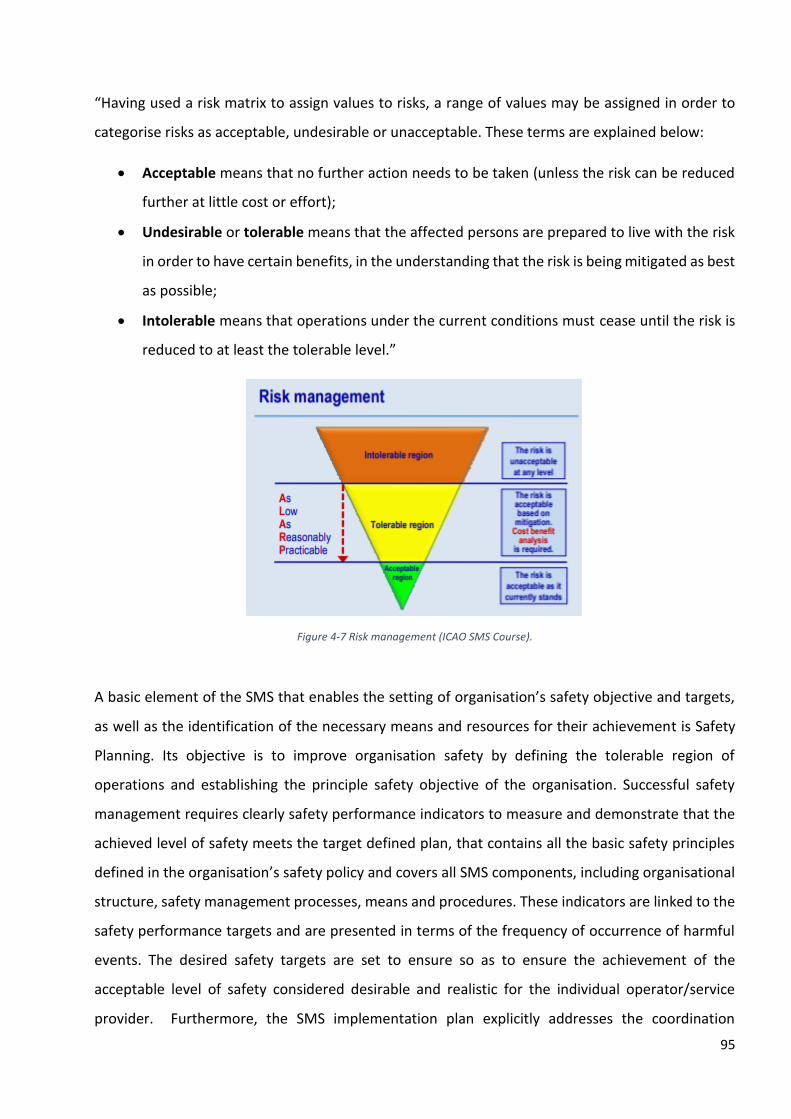
95
“Having used a risk matrix to assign values to risks, a range of values may be assigned in order to
categorise risks as acceptable, undesirable or unacceptable. These terms are explained below:
• Acceptable means that no further action needs to be taken (unless the risk can be reduced
further at little cost or effort);
• Undesirable or tolerable means that the affected persons are prepared to live with the risk
in order to have certain benefits, in the understanding that the risk is being mitigated as best
as possible;
• Intolerable means that operations under the current conditions must cease until the risk is
reduced to at least the tolerable level.”
Figure 4-7 Risk management (ICAO SMS Course).
A basic element of the SMS that enables the setting of organisation’s safety objective and targets,
as well as the identification of the necessary means and resources for their achievement is Safety
Planning. Its objective is to improve organisation safety by defining the tolerable region of
operations and establishing the principle safety objective of the organisation. Successful safety
management requires clearly safety performance indicators to measure and demonstrate that the
achieved level of safety meets the target defined plan, that contains all the basic safety principles
defined in the organisation’s safety policy and covers all SMS components, including organisational
structure, safety management processes, means and procedures. These indicators are linked to the
safety performance targets and are presented in terms of the frequency of occurrence of harmful
events. The desired safety targets are set to ensure so as to ensure the achievement of the
acceptable level of safety considered desirable and realistic for the individual operator/service
provider. Furthermore, the SMS implementation plan explicitly addresses the coordination
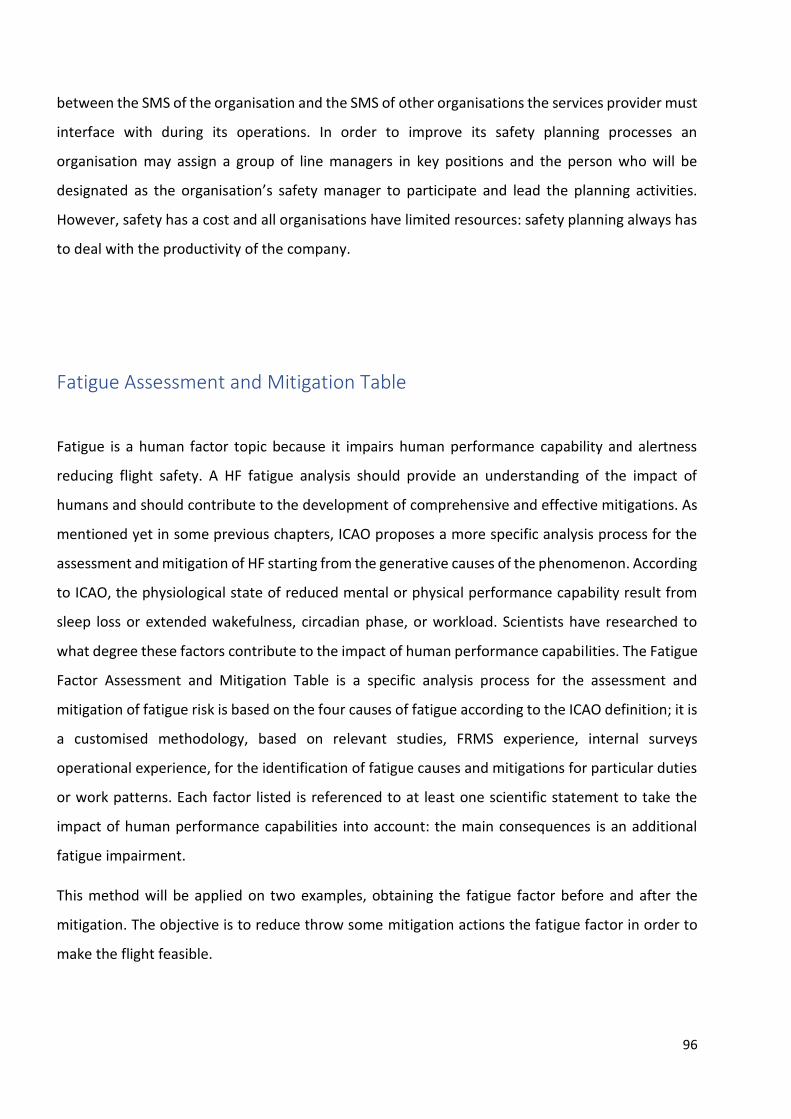
96
between the SMS of the organisation and the SMS of other organisations the services provider must
interface with during its operations. In order to improve its safety planning processes an
organisation may assign a group of line managers in key positions and the person who will be
designated as the organisation’s safety manager to participate and lead the planning activities.
However, safety has a cost and all organisations have limited resources: safety planning always has
to deal with the productivity of the company.
Fatigue Assessment and Mitigation Table
Fatigue is a human factor topic because it impairs human performance capability and alertness
reducing flight safety. A HF fatigue analysis should provide an understanding of the impact of
humans and should contribute to the development of comprehensive and effective mitigations. As
mentioned yet in some previous chapters, ICAO proposes a more specific analysis process for the
assessment and mitigation of HF starting from the generative causes of the phenomenon. According
to ICAO, the physiological state of reduced mental or physical performance capability result from
sleep loss or extended wakefulness, circadian phase, or workload. Scientists have researched to
what degree these factors contribute to the impact of human performance capabilities. The Fatigue
Factor Assessment and Mitigation Table is a specific analysis process for the assessment and
mitigation of fatigue risk is based on the four causes of fatigue according to the ICAO definition; it is
a customised methodology, based on relevant studies, FRMS experience, internal surveys
operational experience, for the identification of fatigue causes and mitigations for particular duties
or work patterns. Each factor listed is referenced to at least one scientific statement to take the
impact of human performance capabilities into account: the main consequences is an additional
fatigue impairment.
This method will be applied on two examples, obtaining the fatigue factor before and after the
mitigation. The objective is to reduce throw some mitigation actions the fatigue factor in order to
make the flight feasible.
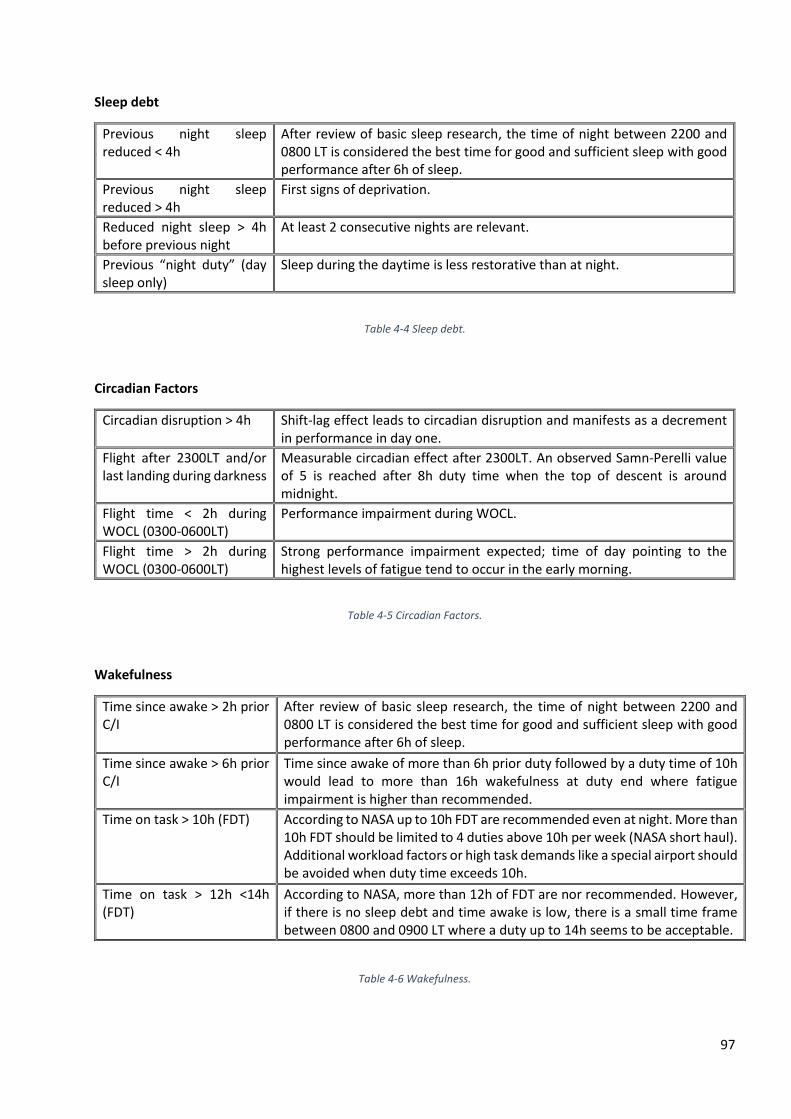
97
Sleep debt
Previous night sleep reduced < 4h
After review of basic sleep research, the time of night between 2200 and 0800 LT is considered the best time for good and sufficient sleep with good performance after 6h of sleep.
Previous night sleep reduced > 4h
First signs of deprivation.
Reduced night sleep > 4h before previous night
At least 2 consecutive nights are relevant.
Previous “night duty” (day sleep only)
Sleep during the daytime is less restorative than at night.
Table 4-4 Sleep debt.
Circadian Factors
Circadian disruption > 4h Shift-lag effect leads to circadian disruption and manifests as a decrement in performance in day one.
Flight after 2300LT and/or last landing during darkness
Measurable circadian effect after 2300LT. An observed Samn-Perelli value of 5 is reached after 8h duty time when the top of descent is around midnight.
Flight time < 2h during WOCL (0300-0600LT)
Performance impairment during WOCL.
Flight time > 2h during WOCL (0300-0600LT)
Strong performance impairment expected; time of day pointing to the highest levels of fatigue tend to occur in the early morning.
Table 4-5 Circadian Factors.
Wakefulness
Time since awake > 2h prior C/I
After review of basic sleep research, the time of night between 2200 and 0800 LT is considered the best time for good and sufficient sleep with good performance after 6h of sleep.
Time since awake > 6h prior C/I
Time since awake of more than 6h prior duty followed by a duty time of 10h would lead to more than 16h wakefulness at duty end where fatigue impairment is higher than recommended.
Time on task > 10h (FDT) According to NASA up to 10h FDT are recommended even at night. More than 10h FDT should be limited to 4 duties above 10h per week (NASA short haul). Additional workload factors or high task demands like a special airport should be avoided when duty time exceeds 10h.
Time on task > 12h <14h (FDT)
According to NASA, more than 12h of FDT are nor recommended. However, if there is no sleep debt and time awake is low, there is a small time frame between 0800 and 0900 LT where a duty up to 14h seems to be acceptable.
Table 4-6 Wakefulness.
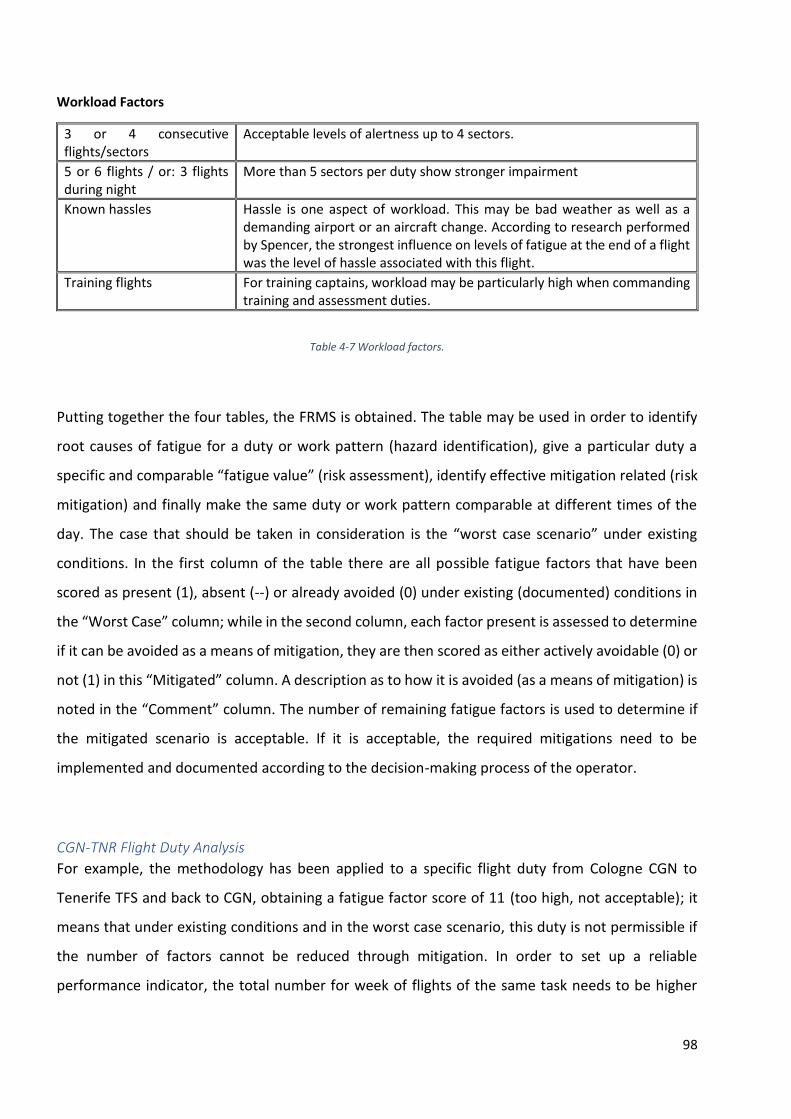
98
Workload Factors
3 or 4 consecutive flights/sectors
Acceptable levels of alertness up to 4 sectors.
5 or 6 flights / or: 3 flights during night
More than 5 sectors per duty show stronger impairment
Known hassles Hassle is one aspect of workload. This may be bad weather as well as a demanding airport or an aircraft change. According to research performed by Spencer, the strongest influence on levels of fatigue at the end of a flight was the level of hassle associated with this flight.
Training flights For training captains, workload may be particularly high when commanding training and assessment duties.
Table 4-7 Workload factors.
Putting together the four tables, the FRMS is obtained. The table may be used in order to identify
root causes of fatigue for a duty or work pattern (hazard identification), give a particular duty a
specific and comparable “fatigue value” (risk assessment), identify effective mitigation related (risk
mitigation) and finally make the same duty or work pattern comparable at different times of the
day. The case that should be taken in consideration is the “worst case scenario” under existing
conditions. In the first column of the table there are all possible fatigue factors that have been
scored as present (1), absent (--) or already avoided (0) under existing (documented) conditions in
the “Worst Case” column; while in the second column, each factor present is assessed to determine
if it can be avoided as a means of mitigation, they are then scored as either actively avoidable (0) or
not (1) in this “Mitigated” column. A description as to how it is avoided (as a means of mitigation) is
noted in the “Comment” column. The number of remaining fatigue factors is used to determine if
the mitigated scenario is acceptable. If it is acceptable, the required mitigations need to be
implemented and documented according to the decision-making process of the operator.
CGN-TNR Flight Duty Analysis
For example, the methodology has been applied to a specific flight duty from Cologne CGN to
Tenerife TFS and back to CGN, obtaining a fatigue factor score of 11 (too high, not acceptable); it
means that under existing conditions and in the worst case scenario, this duty is not permissible if
the number of factors cannot be reduced through mitigation. In order to set up a reliable
performance indicator, the total number for week of flights of the same task needs to be higher
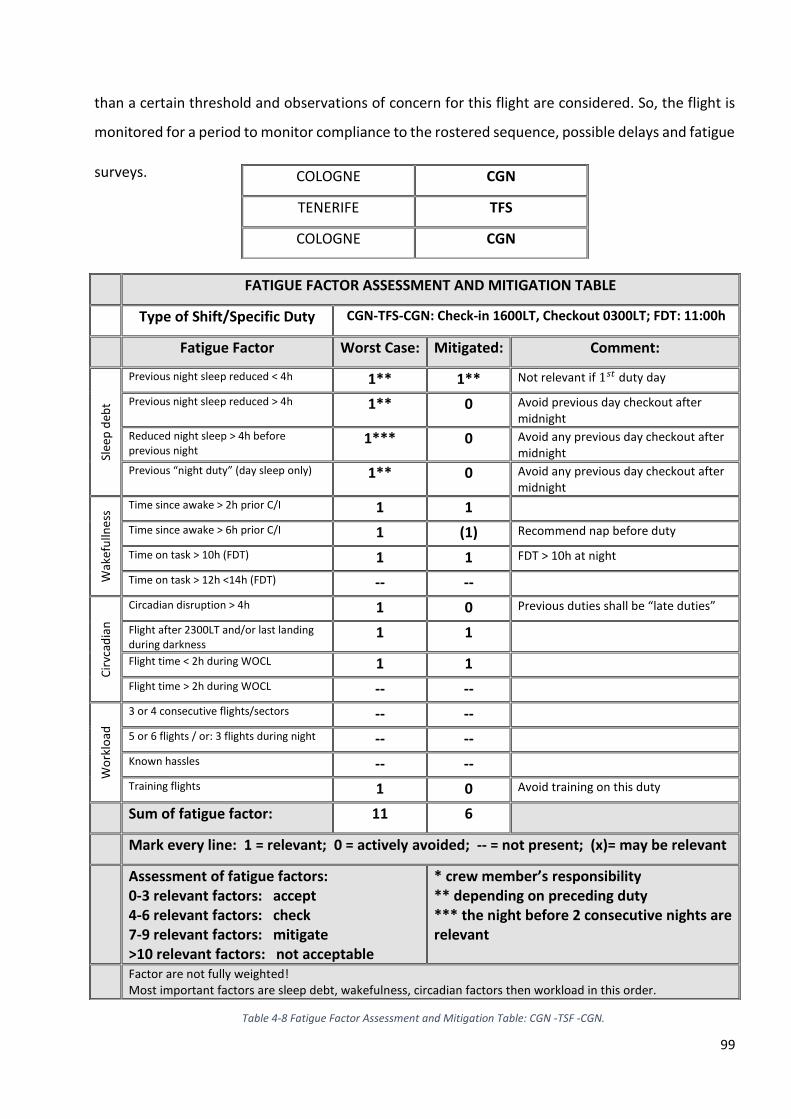
99
than a certain threshold and observations of concern for this flight are considered. So, the flight is
monitored for a period to monitor compliance to the rostered sequence, possible delays and fatigue
surveys.
COLOGNE CGN
TENERIFE TFS
COLOGNE CGN
FATIGUE FACTOR ASSESSMENT AND MITIGATION TABLE
Type of Shift/Specific Duty CGN-TFS-CGN: Check-in 1600LT, Checkout 0300LT; FDT: 11:00h
Fatigue Factor Worst Case: Mitigated: Comment:
Slee
p d
ebt
Previous night sleep reduced < 4h 1** 1** Not relevant if 1𝑠𝑡 duty day
Previous night sleep reduced > 4h 1** 0 Avoid previous day checkout after midnight
Reduced night sleep > 4h before previous night
1*** 0 Avoid any previous day checkout after midnight
Previous “night duty” (day sleep only) 1** 0 Avoid any previous day checkout after midnight
Wak
efu
llne
ss Time since awake > 2h prior C/I 1 1
Time since awake > 6h prior C/I 1 (1) Recommend nap before duty
Time on task > 10h (FDT) 1 1 FDT > 10h at night
Time on task > 12h <14h (FDT) -- --
Cir
vcad
ian
Circadian disruption > 4h 1 0 Previous duties shall be “late duties”
Flight after 2300LT and/or last landing during darkness
1 1
Flight time < 2h during WOCL 1 1
Flight time > 2h during WOCL -- --
Wo
rklo
ad
3 or 4 consecutive flights/sectors -- --
5 or 6 flights / or: 3 flights during night -- --
Known hassles -- --
Training flights 1 0 Avoid training on this duty
Sum of fatigue factor: 11 6
Mark every line: 1 = relevant; 0 = actively avoided; -- = not present; (x)= may be relevant
Assessment of fatigue factors: 0-3 relevant factors: accept 4-6 relevant factors: check 7-9 relevant factors: mitigate >10 relevant factors: not acceptable
* crew member’s responsibility ** depending on preceding duty *** the night before 2 consecutive nights are relevant
Factor are not fully weighted! Most important factors are sleep debt, wakefulness, circadian factors then workload in this order.
Table 4-8 Fatigue Factor Assessment and Mitigation Table: CGN -TSF -CGN.
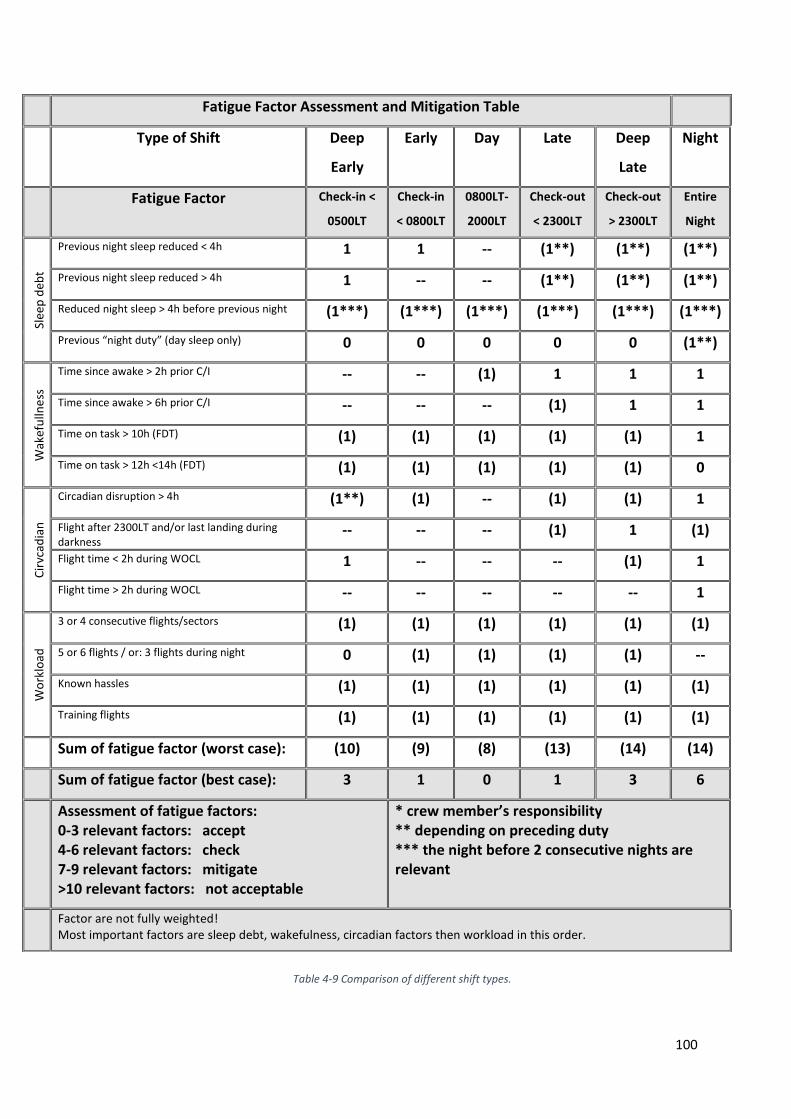
100
Fatigue Factor Assessment and Mitigation Table
Type of Shift Deep
Early
Early Day Late Deep
Late
Night
Fatigue Factor Check-in <
0500LT
Check-in
< 0800LT
0800LT-
2000LT
Check-out
< 2300LT
Check-out
> 2300LT
Entire
Night
Slee
p d
ebt
Previous night sleep reduced < 4h 1 1 -- (1**) (1**) (1**)
Previous night sleep reduced > 4h 1 -- -- (1**) (1**) (1**)
Reduced night sleep > 4h before previous night (1***) (1***) (1***) (1***) (1***) (1***)
Previous “night duty” (day sleep only) 0 0 0 0 0 (1**)
Wak
efu
llne
ss
Time since awake > 2h prior C/I -- -- (1) 1 1 1
Time since awake > 6h prior C/I -- -- -- (1) 1 1
Time on task > 10h (FDT) (1) (1) (1) (1) (1) 1
Time on task > 12h <14h (FDT) (1) (1) (1) (1) (1) 0
Cir
vcad
ian
Circadian disruption > 4h (1**) (1) -- (1) (1) 1
Flight after 2300LT and/or last landing during darkness
-- -- -- (1) 1 (1)
Flight time < 2h during WOCL 1 -- -- -- (1) 1
Flight time > 2h during WOCL -- -- -- -- -- 1
Wo
rklo
ad
3 or 4 consecutive flights/sectors (1) (1) (1) (1) (1) (1)
5 or 6 flights / or: 3 flights during night 0 (1) (1) (1) (1) --
Known hassles (1) (1) (1) (1) (1) (1)
Training flights (1) (1) (1) (1) (1) (1)
Sum of fatigue factor (worst case): (10) (9) (8) (13) (14) (14)
Sum of fatigue factor (best case): 3 1 0 1 3 6
Assessment of fatigue factors: 0-3 relevant factors: accept 4-6 relevant factors: check 7-9 relevant factors: mitigate >10 relevant factors: not acceptable
* crew member’s responsibility ** depending on preceding duty *** the night before 2 consecutive nights are relevant
Factor are not fully weighted! Most important factors are sleep debt, wakefulness, circadian factors then workload in this order.
Table 4-9 Comparison of different shift types.
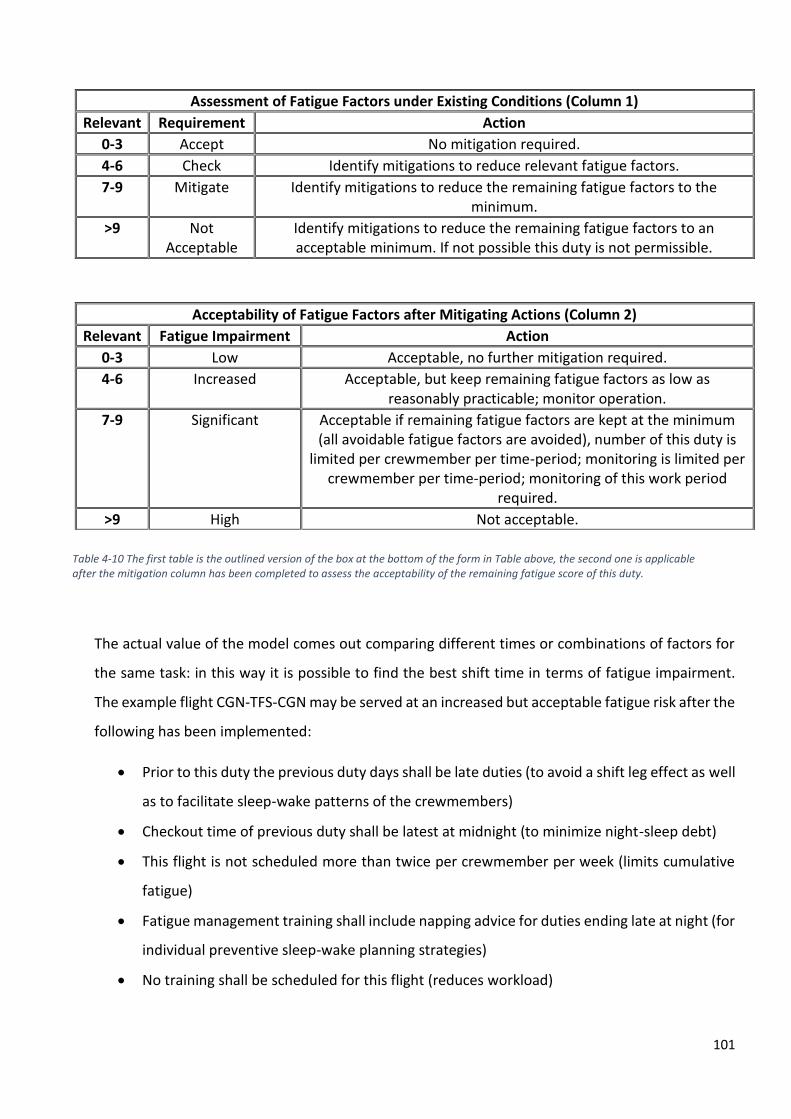
101
The actual value of the model comes out comparing different times or combinations of factors for
the same task: in this way it is possible to find the best shift time in terms of fatigue impairment.
The example flight CGN-TFS-CGN may be served at an increased but acceptable fatigue risk after the
following has been implemented:
• Prior to this duty the previous duty days shall be late duties (to avoid a shift leg effect as well
as to facilitate sleep-wake patterns of the crewmembers)
• Checkout time of previous duty shall be latest at midnight (to minimize night-sleep debt)
• This flight is not scheduled more than twice per crewmember per week (limits cumulative
fatigue)
• Fatigue management training shall include napping advice for duties ending late at night (for
individual preventive sleep-wake planning strategies)
• No training shall be scheduled for this flight (reduces workload)
Assessment of Fatigue Factors under Existing Conditions (Column 1)
Relevant Requirement Action
0-3 Accept No mitigation required.
4-6 Check Identify mitigations to reduce relevant fatigue factors.
7-9 Mitigate Identify mitigations to reduce the remaining fatigue factors to the minimum.
>9 Not Acceptable
Identify mitigations to reduce the remaining fatigue factors to an acceptable minimum. If not possible this duty is not permissible.
Acceptability of Fatigue Factors after Mitigating Actions (Column 2)
Relevant Fatigue Impairment Action
0-3 Low Acceptable, no further mitigation required.
4-6 Increased Acceptable, but keep remaining fatigue factors as low as reasonably practicable; monitor operation.
7-9 Significant Acceptable if remaining fatigue factors are kept at the minimum (all avoidable fatigue factors are avoided), number of this duty is
limited per crewmember per time-period; monitoring is limited per crewmember per time-period; monitoring of this work period
required.
>9 High Not acceptable.
Table 4-10 The first table is the outlined version of the box at the bottom of the form in Table above, the second one is applicable after the mitigation column has been completed to assess the acceptability of the remaining fatigue score of this duty.
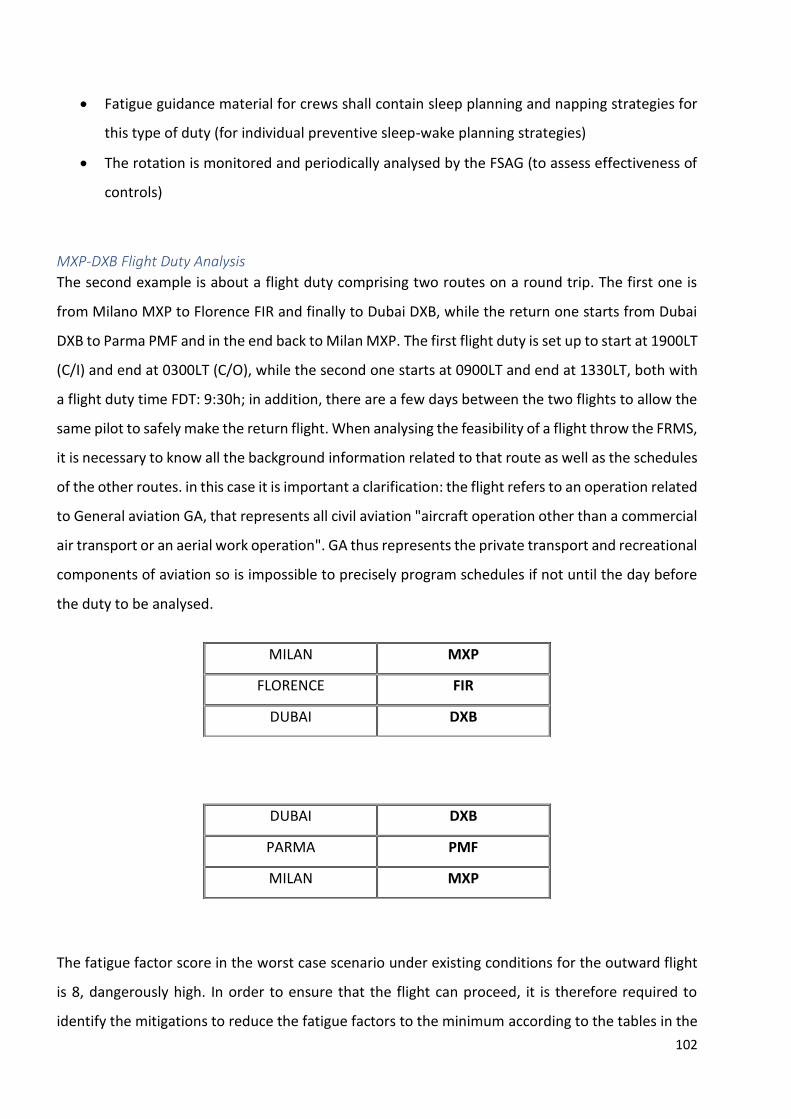
102
• Fatigue guidance material for crews shall contain sleep planning and napping strategies for
this type of duty (for individual preventive sleep-wake planning strategies)
• The rotation is monitored and periodically analysed by the FSAG (to assess effectiveness of
controls)
MXP-DXB Flight Duty Analysis
The second example is about a flight duty comprising two routes on a round trip. The first one is
from Milano MXP to Florence FIR and finally to Dubai DXB, while the return one starts from Dubai
DXB to Parma PMF and in the end back to Milan MXP. The first flight duty is set up to start at 1900LT
(C/I) and end at 0300LT (C/O), while the second one starts at 0900LT and end at 1330LT, both with
a flight duty time FDT: 9:30h; in addition, there are a few days between the two flights to allow the
same pilot to safely make the return flight. When analysing the feasibility of a flight throw the FRMS,
it is necessary to know all the background information related to that route as well as the schedules
of the other routes. in this case it is important a clarification: the flight refers to an operation related
to General aviation GA, that represents all civil aviation "aircraft operation other than a commercial
air transport or an aerial work operation". GA thus represents the private transport and recreational
components of aviation so is impossible to precisely program schedules if not until the day before
the duty to be analysed.
The fatigue factor score in the worst case scenario under existing conditions for the outward flight
is 8, dangerously high. In order to ensure that the flight can proceed, it is therefore required to
identify the mitigations to reduce the fatigue factors to the minimum according to the tables in the
MILAN MXP
FLORENCE FIR
DUBAI DXB
DUBAI DXB
PARMA PMF
MILAN MXP
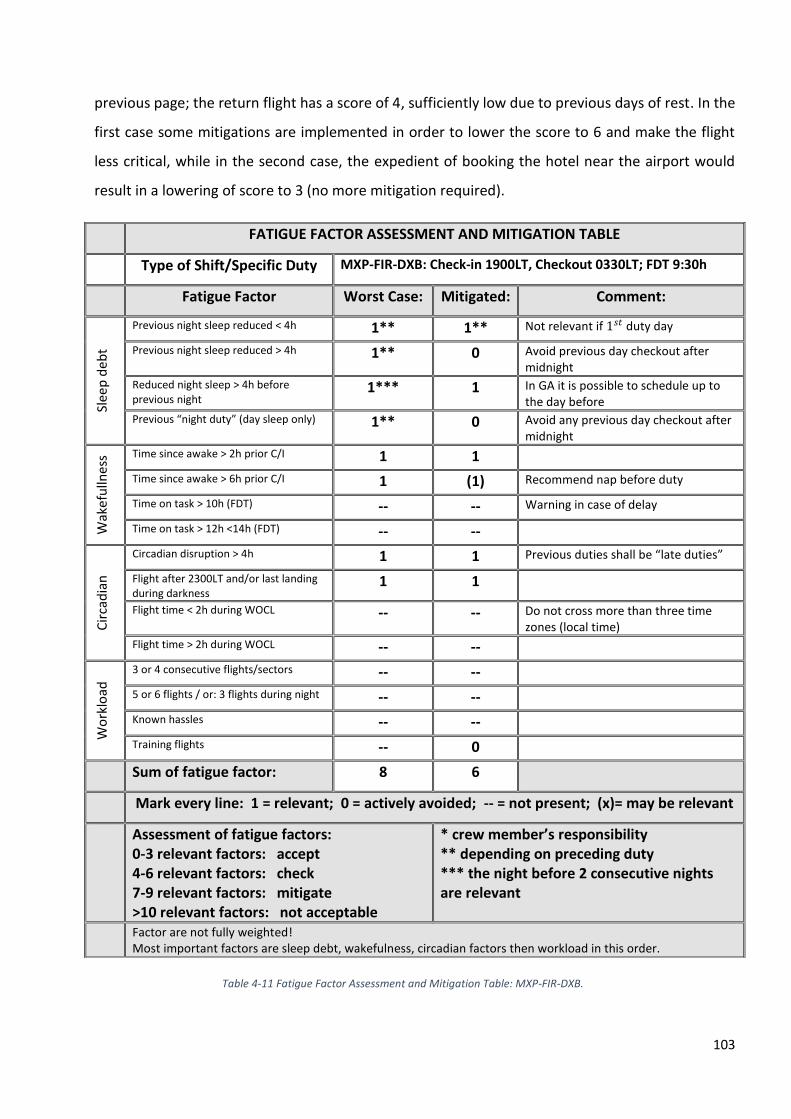
103
previous page; the return flight has a score of 4, sufficiently low due to previous days of rest. In the
first case some mitigations are implemented in order to lower the score to 6 and make the flight
less critical, while in the second case, the expedient of booking the hotel near the airport would
result in a lowering of score to 3 (no more mitigation required).
FATIGUE FACTOR ASSESSMENT AND MITIGATION TABLE
Type of Shift/Specific Duty MXP-FIR-DXB: Check-in 1900LT, Checkout 0330LT; FDT 9:30h
Fatigue Factor Worst Case: Mitigated: Comment:
Slee
p d
ebt
Previous night sleep reduced < 4h 1** 1** Not relevant if 1𝑠𝑡 duty day
Previous night sleep reduced > 4h 1** 0 Avoid previous day checkout after midnight
Reduced night sleep > 4h before previous night
1*** 1 In GA it is possible to schedule up to the day before
Previous “night duty” (day sleep only) 1** 0 Avoid any previous day checkout after midnight
Wak
efu
llnes
s Time since awake > 2h prior C/I 1 1
Time since awake > 6h prior C/I 1 (1) Recommend nap before duty
Time on task > 10h (FDT) -- -- Warning in case of delay
Time on task > 12h <14h (FDT) -- --
Cir
cad
ian
Circadian disruption > 4h 1 1 Previous duties shall be “late duties”
Flight after 2300LT and/or last landing during darkness
1 1
Flight time < 2h during WOCL -- -- Do not cross more than three time zones (local time)
Flight time > 2h during WOCL -- --
Wo
rklo
ad
3 or 4 consecutive flights/sectors -- --
5 or 6 flights / or: 3 flights during night -- --
Known hassles -- --
Training flights -- 0
Sum of fatigue factor: 8 6
Mark every line: 1 = relevant; 0 = actively avoided; -- = not present; (x)= may be relevant
Assessment of fatigue factors: 0-3 relevant factors: accept 4-6 relevant factors: check 7-9 relevant factors: mitigate >10 relevant factors: not acceptable
* crew member’s responsibility ** depending on preceding duty *** the night before 2 consecutive nights are relevant
Factor are not fully weighted! Most important factors are sleep debt, wakefulness, circadian factors then workload in this order.
Table 4-11 Fatigue Factor Assessment and Mitigation Table: MXP-FIR-DXB.
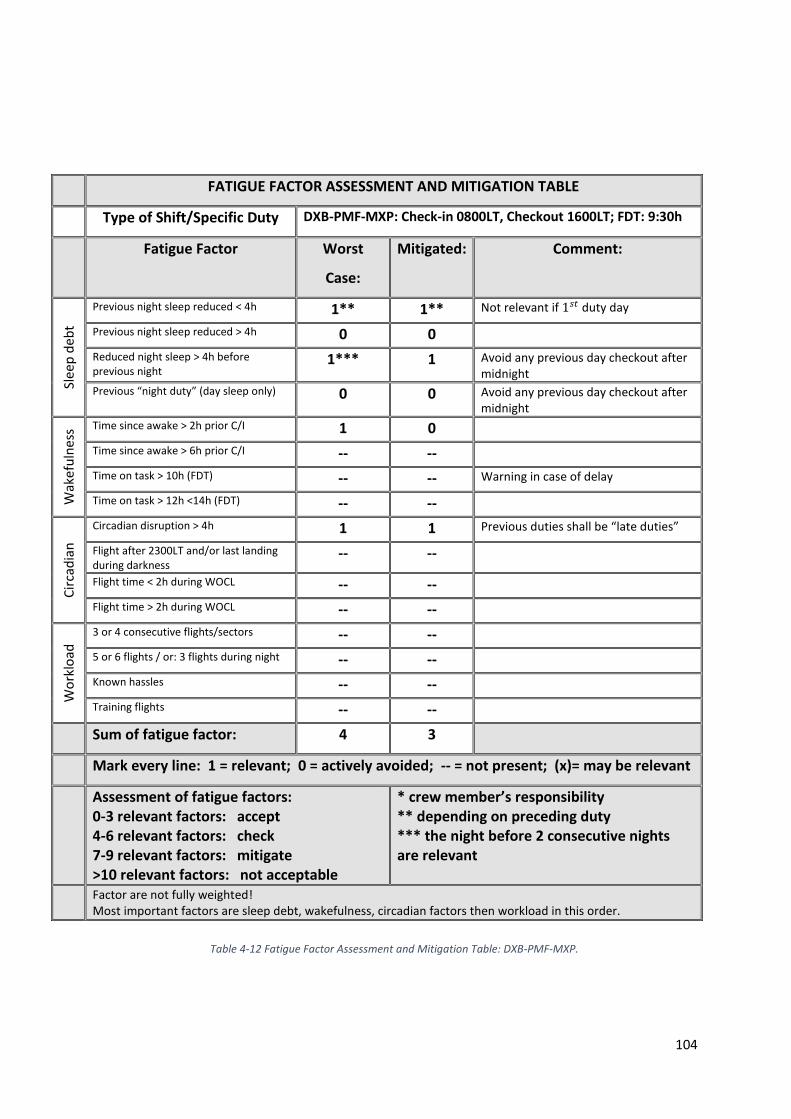
104
FATIGUE FACTOR ASSESSMENT AND MITIGATION TABLE
Type of Shift/Specific Duty DXB-PMF-MXP: Check-in 0800LT, Checkout 1600LT; FDT: 9:30h
Fatigue Factor Worst
Case:
Mitigated: Comment:
Slee
p d
ebt
Previous night sleep reduced < 4h 1** 1** Not relevant if 1𝑠𝑡 duty day
Previous night sleep reduced > 4h 0 0
Reduced night sleep > 4h before previous night
1*** 1 Avoid any previous day checkout after midnight
Previous “night duty” (day sleep only) 0 0 Avoid any previous day checkout after midnight
Wak
efu
lnes
s Time since awake > 2h prior C/I 1 0
Time since awake > 6h prior C/I -- --
Time on task > 10h (FDT) -- -- Warning in case of delay
Time on task > 12h <14h (FDT) -- --
Cir
cad
ian
Circadian disruption > 4h 1 1 Previous duties shall be “late duties”
Flight after 2300LT and/or last landing during darkness
-- --
Flight time < 2h during WOCL -- --
Flight time > 2h during WOCL -- --
Wo
rklo
ad
3 or 4 consecutive flights/sectors -- --
5 or 6 flights / or: 3 flights during night -- --
Known hassles -- --
Training flights -- --
Sum of fatigue factor: 4 3
Mark every line: 1 = relevant; 0 = actively avoided; -- = not present; (x)= may be relevant
Assessment of fatigue factors: 0-3 relevant factors: accept 4-6 relevant factors: check 7-9 relevant factors: mitigate >10 relevant factors: not acceptable
* crew member’s responsibility ** depending on preceding duty *** the night before 2 consecutive nights are relevant
Factor are not fully weighted! Most important factors are sleep debt, wakefulness, circadian factors then workload in this order.
Table 4-12 Fatigue Factor Assessment and Mitigation Table: DXB-PMF-MXP.
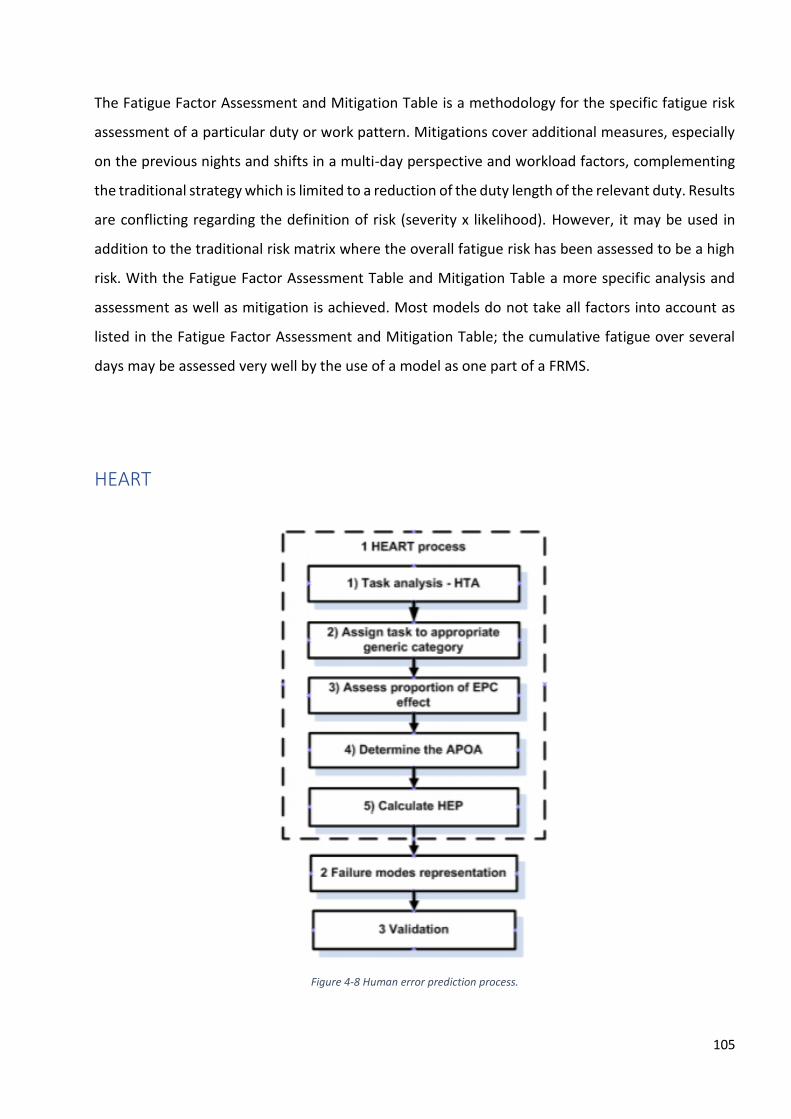
105
The Fatigue Factor Assessment and Mitigation Table is a methodology for the specific fatigue risk
assessment of a particular duty or work pattern. Mitigations cover additional measures, especially
on the previous nights and shifts in a multi-day perspective and workload factors, complementing
the traditional strategy which is limited to a reduction of the duty length of the relevant duty. Results
are conflicting regarding the definition of risk (severity x likelihood). However, it may be used in
addition to the traditional risk matrix where the overall fatigue risk has been assessed to be a high
risk. With the Fatigue Factor Assessment Table and Mitigation Table a more specific analysis and
assessment as well as mitigation is achieved. Most models do not take all factors into account as
listed in the Fatigue Factor Assessment and Mitigation Table; the cumulative fatigue over several
days may be assessed very well by the use of a model as one part of a FRMS.
HEART
Figure 4-8 Human error prediction process.
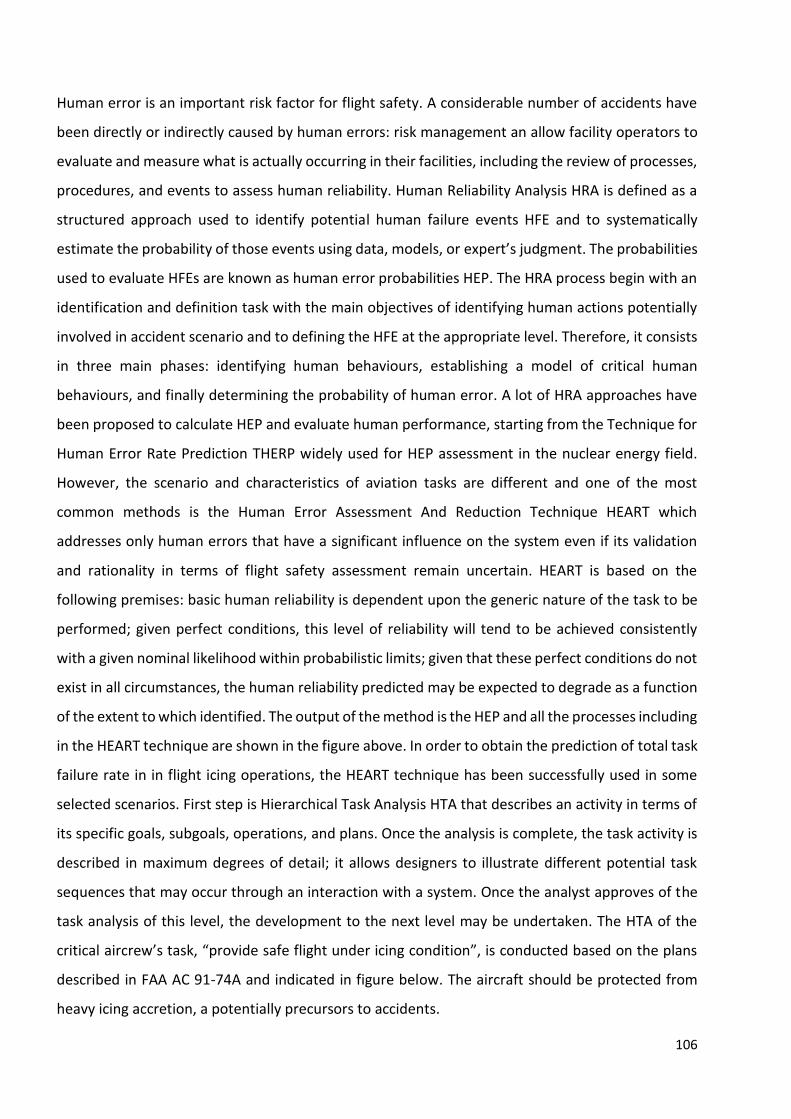
106
Human error is an important risk factor for flight safety. A considerable number of accidents have
been directly or indirectly caused by human errors: risk management an allow facility operators to
evaluate and measure what is actually occurring in their facilities, including the review of processes,
procedures, and events to assess human reliability. Human Reliability Analysis HRA is defined as a
structured approach used to identify potential human failure events HFE and to systematically
estimate the probability of those events using data, models, or expert’s judgment. The probabilities
used to evaluate HFEs are known as human error probabilities HEP. The HRA process begin with an
identification and definition task with the main objectives of identifying human actions potentially
involved in accident scenario and to defining the HFE at the appropriate level. Therefore, it consists
in three main phases: identifying human behaviours, establishing a model of critical human
behaviours, and finally determining the probability of human error. A lot of HRA approaches have
been proposed to calculate HEP and evaluate human performance, starting from the Technique for
Human Error Rate Prediction THERP widely used for HEP assessment in the nuclear energy field.
However, the scenario and characteristics of aviation tasks are different and one of the most
common methods is the Human Error Assessment And Reduction Technique HEART which
addresses only human errors that have a significant influence on the system even if its validation
and rationality in terms of flight safety assessment remain uncertain. HEART is based on the
following premises: basic human reliability is dependent upon the generic nature of the task to be
performed; given perfect conditions, this level of reliability will tend to be achieved consistently
with a given nominal likelihood within probabilistic limits; given that these perfect conditions do not
exist in all circumstances, the human reliability predicted may be expected to degrade as a function
of the extent to which identified. The output of the method is the HEP and all the processes including
in the HEART technique are shown in the figure above. In order to obtain the prediction of total task
failure rate in in flight icing operations, the HEART technique has been successfully used in some
selected scenarios. First step is Hierarchical Task Analysis HTA that describes an activity in terms of
its specific goals, subgoals, operations, and plans. Once the analysis is complete, the task activity is
described in maximum degrees of detail; it allows designers to illustrate different potential task
sequences that may occur through an interaction with a system. Once the analyst approves of the
task analysis of this level, the development to the next level may be undertaken. The HTA of the
critical aircrew’s task, “provide safe flight under icing condition”, is conducted based on the plans
described in FAA AC 91-74A and indicated in figure below. The aircraft should be protected from
heavy icing accretion, a potentially precursors to accidents.
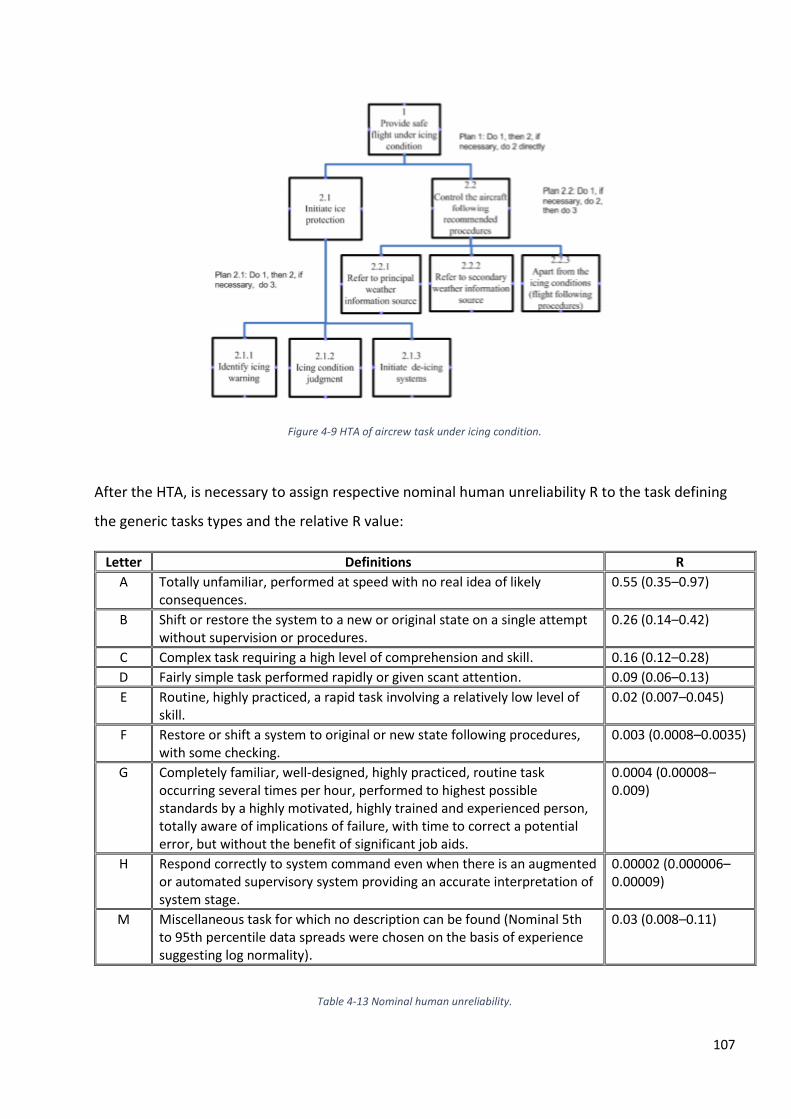
107
Figure 4-9 HTA of aircrew task under icing condition.
After the HTA, is necessary to assign respective nominal human unreliability R to the task defining
the generic tasks types and the relative R value:
Letter Definitions R
A Totally unfamiliar, performed at speed with no real idea of likely consequences.
0.55 (0.35–0.97)
B Shift or restore the system to a new or original state on a single attempt without supervision or procedures.
0.26 (0.14–0.42)
C Complex task requiring a high level of comprehension and skill. 0.16 (0.12–0.28)
D Fairly simple task performed rapidly or given scant attention. 0.09 (0.06–0.13)
E Routine, highly practiced, a rapid task involving a relatively low level of skill.
0.02 (0.007–0.045)
F Restore or shift a system to original or new state following procedures, with some checking.
0.003 (0.0008–0.0035)
G Completely familiar, well‐designed, highly practiced, routine task occurring several times per hour, performed to highest possible standards by a highly motivated, highly trained and experienced person, totally aware of implications of failure, with time to correct a potential error, but without the benefit of significant job aids.
0.0004 (0.00008–0.009)
H Respond correctly to system command even when there is an augmented or automated supervisory system providing an accurate interpretation of system stage.
0.00002 (0.000006–0.00009)
M Miscellaneous task for which no description can be found (Nominal 5th to 95th percentile data spreads were chosen on the basis of experience suggesting log normality).
0.03 (0.008–0.11)
Table 4-13 Nominal human unreliability.
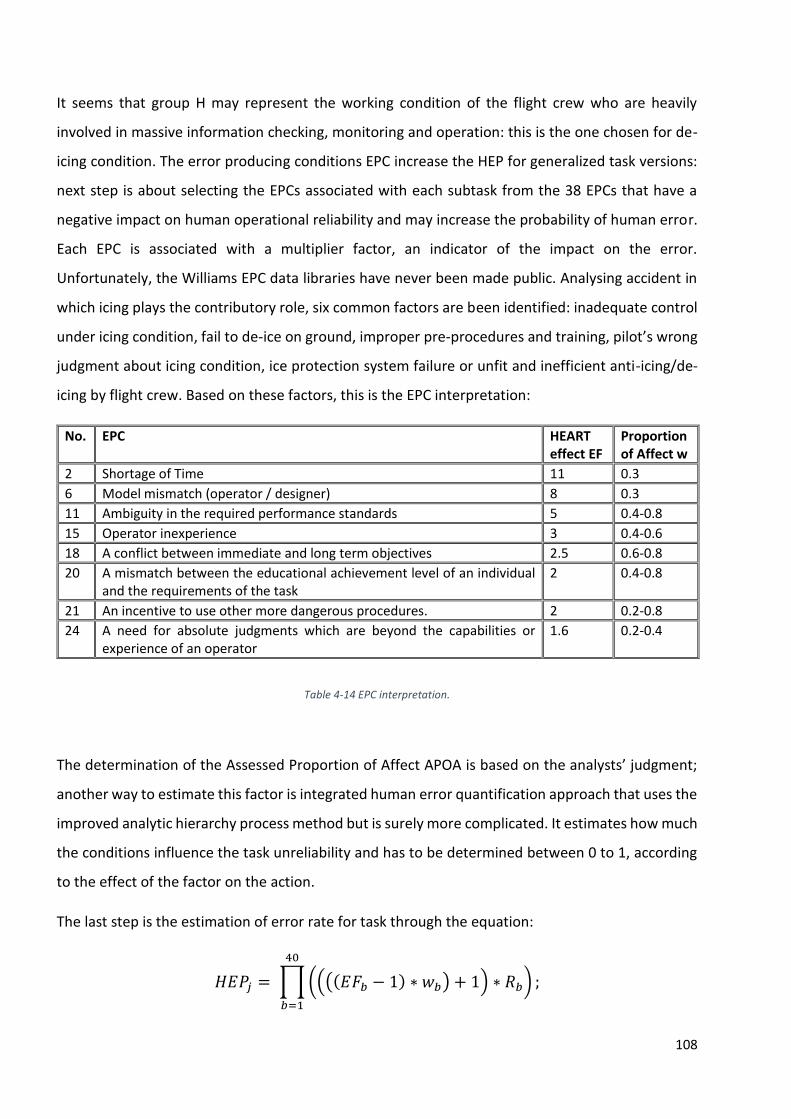
108
It seems that group H may represent the working condition of the flight crew who are heavily
involved in massive information checking, monitoring and operation: this is the one chosen for de-
icing condition. The error producing conditions EPC increase the HEP for generalized task versions:
next step is about selecting the EPCs associated with each subtask from the 38 EPCs that have a
negative impact on human operational reliability and may increase the probability of human error.
Each EPC is associated with a multiplier factor, an indicator of the impact on the error.
Unfortunately, the Williams EPC data libraries have never been made public. Analysing accident in
which icing plays the contributory role, six common factors are been identified: inadequate control
under icing condition, fail to de-ice on ground, improper pre-procedures and training, pilot’s wrong
judgment about icing condition, ice protection system failure or unfit and inefficient anti-icing/de-
icing by flight crew. Based on these factors, this is the EPC interpretation:
No. EPC HEART effect EF
Proportion of Affect w
2 Shortage of Time 11 0.3
6 Model mismatch (operator / designer) 8 0.3
11 Ambiguity in the required performance standards 5 0.4-0.8
15 Operator inexperience 3 0.4-0.6
18 A conflict between immediate and long term objectives 2.5 0.6-0.8
20 A mismatch between the educational achievement level of an individual and the requirements of the task
2 0.4-0.8
21 An incentive to use other more dangerous procedures. 2 0.2-0.8
24 A need for absolute judgments which are beyond the capabilities or experience of an operator
1.6 0.2-0.4
Table 4-14 EPC interpretation.
The determination of the Assessed Proportion of Affect APOA is based on the analysts’ judgment;
another way to estimate this factor is integrated human error quantification approach that uses the
improved analytic hierarchy process method but is surely more complicated. It estimates how much
the conditions influence the task unreliability and has to be determined between 0 to 1, according
to the effect of the factor on the action.
The last step is the estimation of error rate for task through the equation:
𝐻𝐸𝑃𝑗 = ∏ ((((𝐸𝐹𝑏 − 1) ∗ 𝑤𝑏) + 1) ∗ 𝑅𝑏) ;
40
𝑏=1
109
Where j is the number of associated EPC factors and ∏ is the product over all EPC factors and must
be smaller than 1; in the in the end the failure model representation is used for quantification of the
failure rate of the entire task thought Operator Action Event Tree OAET. The validation value is the
task failure probability, calculated by the maximum aircraft in-flight icing probability and
commercial aviation operation data and icing-related incidents in commercial aircraft operators in
a considered period.
𝑇𝐹𝑃 =𝑁𝑢𝑚𝑏𝑒𝑟𝑠 𝑜𝑓 𝑡𝑎𝑠𝑘 𝑓𝑎𝑖𝑙𝑢𝑟𝑒
𝑁𝑢𝑚𝑏𝑒𝑟𝑠 𝑜𝑓 𝑜𝑝𝑝𝑜𝑟𝑡𝑢𝑛𝑖𝑡𝑖𝑒𝑠 𝑖𝑛𝑖𝑡𝑖𝑎𝑡𝑒 𝑡ℎ𝑒 𝑡𝑎𝑠𝑘
The total task failure of provide safe flight under icing condition is 4.8𝐸 − 5. The predictive task
failure rate is 1.2𝐸 − 4, which has the same order of magnitude with observed data. The difference
between the prediction and observation is caused by the incomplete operator report which may
not include all the operational faults during flight.
HEART results are subjective and it is fast and easy to use, but is based on expert opinion and
provides only an estimate that has "a reasonable level of accuracy" but is not necessarily better or
worse than the other techniques in the study; however, it provides an immediate link between
ergonomics and process design, with reliability improvement measures that are a direct conclusion
that can be drawn from the evaluation procedure. Although several researchers have proved that
the HEART taxonomy is suitable for the analysis of aviation operations, more studies are still needed.
FRAT
Every flight has some level of risk and risk is a matter of balance. It’s up to the pilot to review that
risk in advance and then develop the appropriate risk mitigation strategies. Some of them use a
Flight Risk Assessment Tool FRAT to assess the risk associated with hazards common to their
missions. FRATS help pilots to see the potential hazards they may encounter, and they assist them
in devising effective ways to deal with those hazards. There are many ways to identify potential
hazards associated with flight and to assess the likelihood, risk, that identified and unmitigated
hazards could cause an accident or incident. This is the basis for Safety Risk Management, although
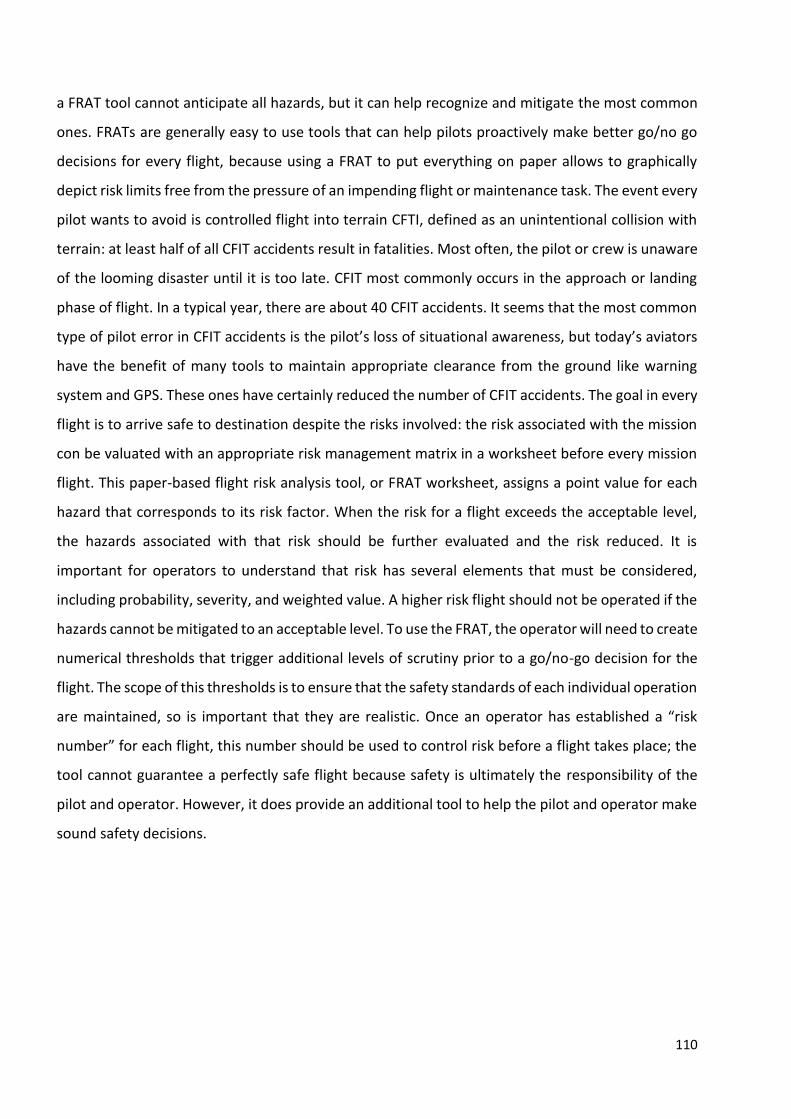
110
a FRAT tool cannot anticipate all hazards, but it can help recognize and mitigate the most common
ones. FRATs are generally easy to use tools that can help pilots proactively make better go/no go
decisions for every flight, because using a FRAT to put everything on paper allows to graphically
depict risk limits free from the pressure of an impending flight or maintenance task. The event every
pilot wants to avoid is controlled flight into terrain CFTI, defined as an unintentional collision with
terrain: at least half of all CFIT accidents result in fatalities. Most often, the pilot or crew is unaware
of the looming disaster until it is too late. CFIT most commonly occurs in the approach or landing
phase of flight. In a typical year, there are about 40 CFIT accidents. It seems that the most common
type of pilot error in CFIT accidents is the pilot’s loss of situational awareness, but today’s aviators
have the benefit of many tools to maintain appropriate clearance from the ground like warning
system and GPS. These ones have certainly reduced the number of CFIT accidents. The goal in every
flight is to arrive safe to destination despite the risks involved: the risk associated with the mission
con be valuated with an appropriate risk management matrix in a worksheet before every mission
flight. This paper-based flight risk analysis tool, or FRAT worksheet, assigns a point value for each
hazard that corresponds to its risk factor. When the risk for a flight exceeds the acceptable level,
the hazards associated with that risk should be further evaluated and the risk reduced. It is
important for operators to understand that risk has several elements that must be considered,
including probability, severity, and weighted value. A higher risk flight should not be operated if the
hazards cannot be mitigated to an acceptable level. To use the FRAT, the operator will need to create
numerical thresholds that trigger additional levels of scrutiny prior to a go/no-go decision for the
flight. The scope of this thresholds is to ensure that the safety standards of each individual operation
are maintained, so is important that they are realistic. Once an operator has established a “risk
number” for each flight, this number should be used to control risk before a flight takes place; the
tool cannot guarantee a perfectly safe flight because safety is ultimately the responsibility of the
pilot and operator. However, it does provide an additional tool to help the pilot and operator make
sound safety decisions.
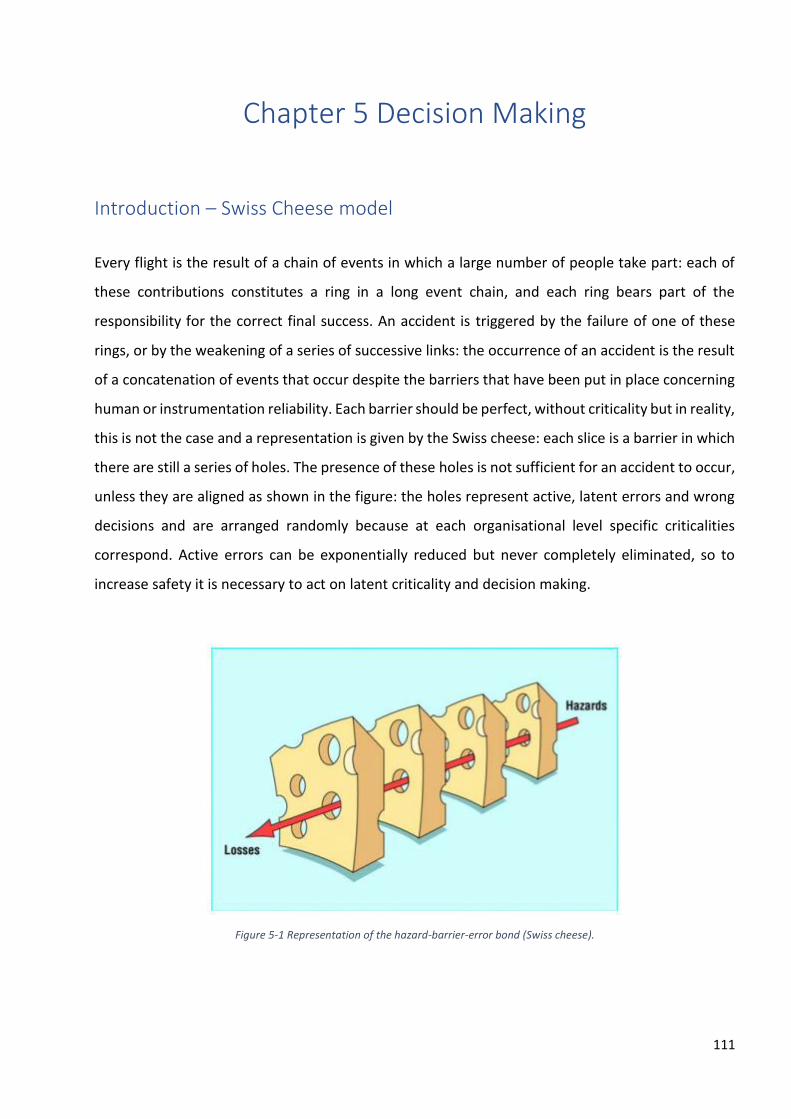
111
Chapter 5 Decision Making
Introduction – Swiss Cheese model
Every flight is the result of a chain of events in which a large number of people take part: each of
these contributions constitutes a ring in a long event chain, and each ring bears part of the
responsibility for the correct final success. An accident is triggered by the failure of one of these
rings, or by the weakening of a series of successive links: the occurrence of an accident is the result
of a concatenation of events that occur despite the barriers that have been put in place concerning
human or instrumentation reliability. Each barrier should be perfect, without criticality but in reality,
this is not the case and a representation is given by the Swiss cheese: each slice is a barrier in which
there are still a series of holes. The presence of these holes is not sufficient for an accident to occur,
unless they are aligned as shown in the figure: the holes represent active, latent errors and wrong
decisions and are arranged randomly because at each organisational level specific criticalities
correspond. Active errors can be exponentially reduced but never completely eliminated, so to
increase safety it is necessary to act on latent criticality and decision making.
Figure 5-1 Representation of the hazard-barrier-error bond (Swiss cheese).
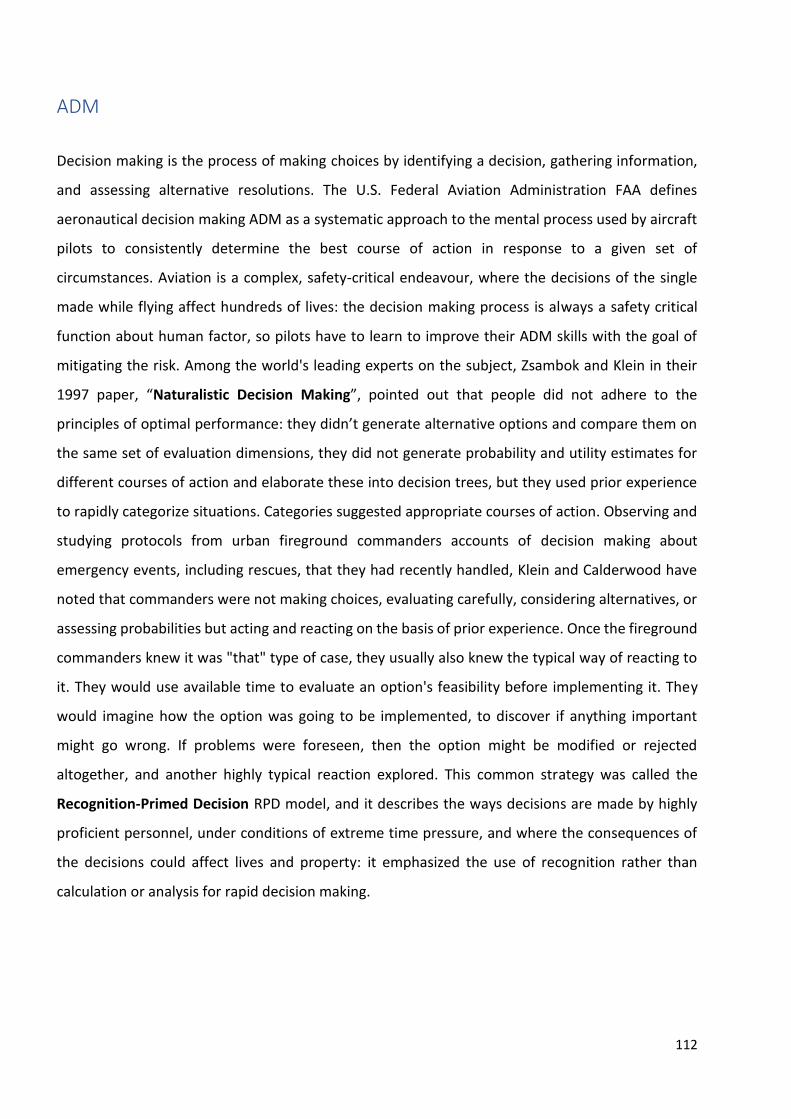
112
ADM
Decision making is the process of making choices by identifying a decision, gathering information,
and assessing alternative resolutions. The U.S. Federal Aviation Administration FAA defines
aeronautical decision making ADM as a systematic approach to the mental process used by aircraft
pilots to consistently determine the best course of action in response to a given set of
circumstances. Aviation is a complex, safety-critical endeavour, where the decisions of the single
made while flying affect hundreds of lives: the decision making process is always a safety critical
function about human factor, so pilots have to learn to improve their ADM skills with the goal of
mitigating the risk. Among the world's leading experts on the subject, Zsambok and Klein in their
1997 paper, “Naturalistic Decision Making”, pointed out that people did not adhere to the
principles of optimal performance: they didn’t generate alternative options and compare them on
the same set of evaluation dimensions, they did not generate probability and utility estimates for
different courses of action and elaborate these into decision trees, but they used prior experience
to rapidly categorize situations. Categories suggested appropriate courses of action. Observing and
studying protocols from urban fireground commanders accounts of decision making about
emergency events, including rescues, that they had recently handled, Klein and Calderwood have
noted that commanders were not making choices, evaluating carefully, considering alternatives, or
assessing probabilities but acting and reacting on the basis of prior experience. Once the fireground
commanders knew it was "that" type of case, they usually also knew the typical way of reacting to
it. They would use available time to evaluate an option's feasibility before implementing it. They
would imagine how the option was going to be implemented, to discover if anything important
might go wrong. If problems were foreseen, then the option might be modified or rejected
altogether, and another highly typical reaction explored. This common strategy was called the
Recognition-Primed Decision RPD model, and it describes the ways decisions are made by highly
proficient personnel, under conditions of extreme time pressure, and where the consequences of
the decisions could affect lives and property: it emphasized the use of recognition rather than
calculation or analysis for rapid decision making.
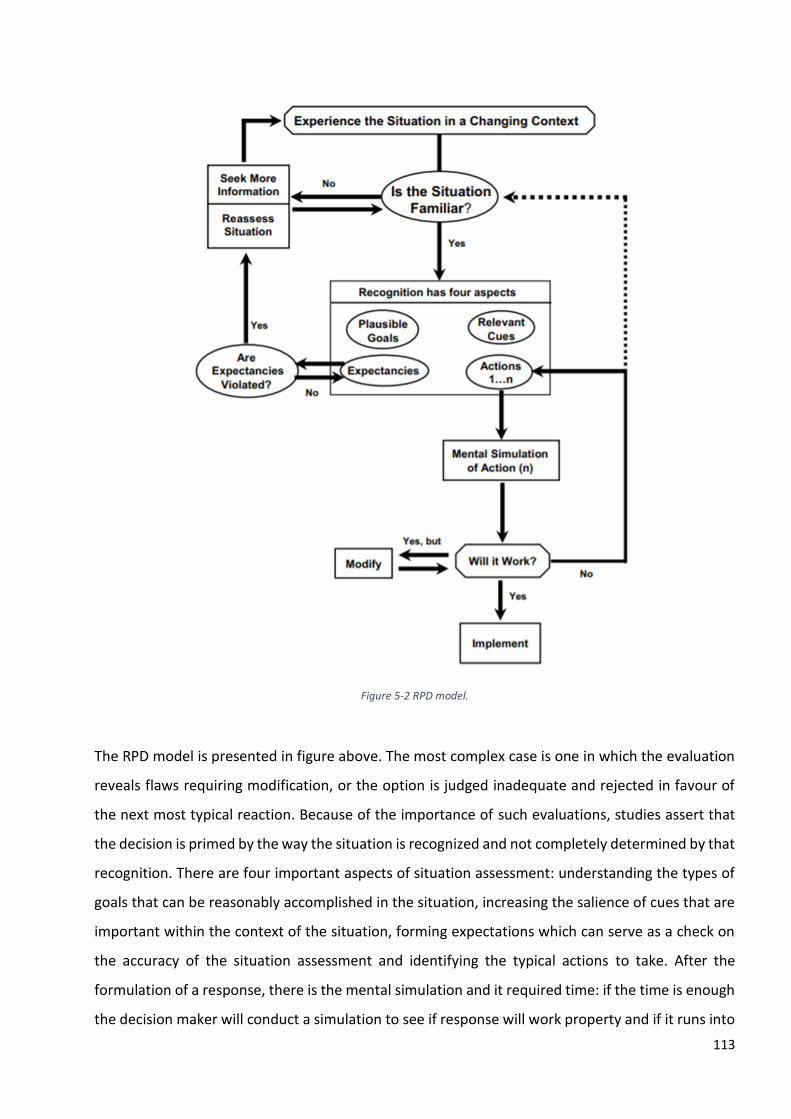
113
Figure 5-2 RPD model.
The RPD model is presented in figure above. The most complex case is one in which the evaluation
reveals flaws requiring modification, or the option is judged inadequate and rejected in favour of
the next most typical reaction. Because of the importance of such evaluations, studies assert that
the decision is primed by the way the situation is recognized and not completely determined by that
recognition. There are four important aspects of situation assessment: understanding the types of
goals that can be reasonably accomplished in the situation, increasing the salience of cues that are
important within the context of the situation, forming expectations which can serve as a check on
the accuracy of the situation assessment and identifying the typical actions to take. After the
formulation of a response, there is the mental simulation and it required time: if the time is enough
the decision maker will conduct a simulation to see if response will work property and if it runs into
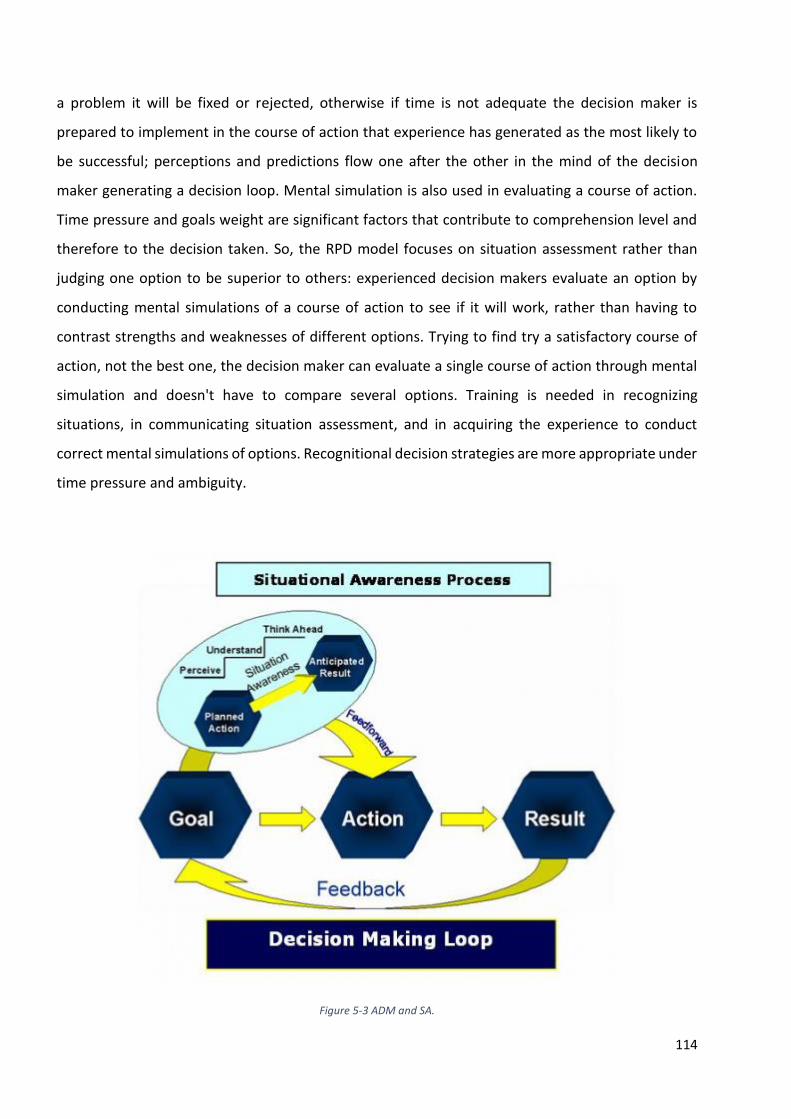
114
a problem it will be fixed or rejected, otherwise if time is not adequate the decision maker is
prepared to implement in the course of action that experience has generated as the most likely to
be successful; perceptions and predictions flow one after the other in the mind of the decision
maker generating a decision loop. Mental simulation is also used in evaluating a course of action.
Time pressure and goals weight are significant factors that contribute to comprehension level and
therefore to the decision taken. So, the RPD model focuses on situation assessment rather than
judging one option to be superior to others: experienced decision makers evaluate an option by
conducting mental simulations of a course of action to see if it will work, rather than having to
contrast strengths and weaknesses of different options. Trying to find try a satisfactory course of
action, not the best one, the decision maker can evaluate a single course of action through mental
simulation and doesn't have to compare several options. Training is needed in recognizing
situations, in communicating situation assessment, and in acquiring the experience to conduct
correct mental simulations of options. Recognitional decision strategies are more appropriate under
time pressure and ambiguity.
Figure 5-3 ADM and SA.
115
A right decision is never unique: ADM has been recognized as critical for safety, a hazard linked to
human factor. According with FAA, pilots must be trained to improve their decision-making and
ADM research led to the publication of six manuals, providing multifaceted material, were oriented
to the decision-making needs of variously rated pilots and designed to reduce the number of
decision-related accidents. When tested, pilots and operators who had received ADM-training
demonstrated a significant percent reduction in accident rate. Good judgment can be taught,
providing a systematic ADM approach to analysing changes that occur during flight and their
outcome for safety. After the training, the decision maker is an expert in the domain and applies his
knowledge to decision situations. Decision-making education and training should be based on the
behavioural and cognitive differences between novices and experts; the main differences between
the two groups regards the mole of information, the time required to lead in to a right decision, a
better adaptation to unexpected situations and less adherence to procedures. To improve decision
making, experience is fundamental, also in new situation: having a large choice of samples in
memory is an excellent way to support decisions. The accumulation of relevant experience is a core
goal of decision-making training, and this process can be oriented in two different ways: generalized
decision making that can be applied in any professional field and specific decision-making training
focuses on improving the decision-making process for particular situations. Decision-making
training is a natural adjunct to crew resource management CRM training because it focuses on how
a crew works together, and decision making in a team environment is a natural part of team
building; focusing on ADM, the training can provide the crew with an improved theoretical
grounding in the subject, broaden their understanding and enhanced teamwork.
SAS and CoA
Orasanu and Fischer (“Errors in Aviation Decision Making”) described a decision process model for
aviation which involves two components: situation assessment SAS and choosing a course of action
CoA.
• SAS involves defining the problem as well as assessing the levels of risk associated with it
and the amount of time available for solving it. Once the problem is defined, a course of
action must be chosen. It also refers to knowledge of risk level and time availability. People
may develop a wrong interpretation of the problem, which leads to a wrong decision
116
because they are solving the wrong problem: errors result from misunderstanding or
ignoring the situation. To improve pilots’ understanding of their problem requires better
diagnostic information and more accessible and integrated display, with different priority
based on risk level (TCAS and Weather/Traffic displays already have it) or on how long it will
take for a condition to degrade to a critical state.
• CoA depends on alternatives¸ and is selected from the options available according to
situation. When there are specific rules to guide the decision, like procedures, the
appropriate response in usual situation must come from there, while choice decisions
depend on prevailing goals and constraints; a CoA error occurs when is established an
accurate picture of the situation, but chosen the wrong course of action. In ruled based
decisions, the appropriate response may not be retrieved from memory and not applied
because some contextual factor mitigated against it; in choice decision, with les constraints,
it becomes harder to evaluate the situation. To aid choosing, options, constraints and the
likelihood of outcomes may be presented thought instrumentation; for example, when
certain kinds of engine anomalies are encountered aid may consist of the most prudent thing
to do, to turn off the engine. Aiding may consist of prompting crews to consider options prior
to jumping to action.
This analysis is supported by Klein’s sources of decision errors: lack of experience, lack of
information, and inadequate simulation. The first may leads to SAS errors because the operator
doesn’t have the right knowledge to an appropriate simulation of reality, while the second regards
those situations in which the decision maker does not have enough information and the last is about
a source of error in an inadequate mental simulation which may lead to wrong choice errors.
DA Teamwork
Standard Operating Procedures SOPs in an ATC Unit are a set of procedures that specify how the
unit’s controllers’ ATC responsibilities are to be coordinated covering every aspect of flight deck
activity and embracing normal, abnormal and emergency situations. Many types of procedure are
rigidly applied, especially in regard to communication. However, with other types of procedure
117
modification may be permitted to suit individual situations and personalities. In fact, they
sometimes are perceived as limiting the flight crew’s judgment and decision. Procedures are based
on long years of experience and have been defined after much research in order to ensure the most
successful outcome from all reasonably likely circumstances: SOPs are safeguards against biased
decision-making. Effective flight crew decision-making requires a joint evaluation of possible options
prior to proceeding with an agreed-upon decision and action because the effect of pressures derived
from delays, company policies, ATC requests, may affects how the crew conducts the flight and also
makes decisions should be acknowledged by the industry. Nevertheless, eliminating all pressures is
not a realistic objective. Thus, company accident-prevention strategies, CRM techniques and
personal lines-of-defence should be used to cope effectively with such pressures. The use of a
tactical-decision-making model for time-critical situations often is an effective technique to lessen
the effects of stress. Several tactical-decision-making models (usually based on memory aids or on
sequential models) have been developed and should be discussed during CRM training. All tactical-
decision-making models share the following phases (refer to the Flight Operation Briefing Note
Operations Golden Rules for detailed information):
• Recognizing the prevailing condition (i.e., identifying the problem);
• Assessing short term and long term consequences on the flight (i.e., collecting the facts
and assessing their operational implications);
• Evaluating available options and procedures (i.e., identifying and evaluating
alternatives);
• Deciding the course of actions (i.e., selecting the best mutually-agreed alternative);
• Taking actions in accordance with the defined procedures and applicable task-sharing
(i.e., implementing the selected option);
• Evaluating and monitoring action results (i.e., confirming expectations versus observed
facts);
• Resuming standard flying duties (i.e., resuming operation in accordance with SOP’s,
including the use of standard calls and normal checklists).
The above decision-making model should optimize the available crew resources in terms of:
• Interpersonal communications;
• Inquiry and advocacy;
• Effective listening;
118
• Tasks prioritization ability;
• Self-confidence, but also self-critical-analysis.
Postponing a decision until that option is no more considered or no longer available is a recurring
pattern in incidents and accidents, particularly in approach and landing accidents. The concepts of
next-target and approach-gate are intended to act as milestones for supporting a timely decision-
making process.
Decision problems in aviation are often so complex that multiple experts and sources of information
are essential to reach a solution; a specialized collection of individuals, a team, who must coordinate
their thoughts and actions to reach a desired state from their initial state. Teams are characterized
by more than one information source with defined roles and responsibilities, tasks that require
interdependence and coordination of knowledge and actions among its members and common and
valued goal. The objective defines the processing domain; for example, flight crews process
information in order to ensure a successful flight, command and control teams process information
in order to ensure predictive ability about the enemy, and medical teams process information in
order to provide the correct treatment plan. The "end" goal provides the very different context of
each of these examples. Groups that make decisions must process information, so the same set of
processes that occur for individuals are conceptually involved in the information processing by a
group. There are some general information-processing categories that may serve to better describe
the intellectual teamwork process and understand where and how team decision making biases
occur:
• Attention/perception: The information perceived depends upon individual attentional
resources and schemas or mental models. Teams born because individual have limited
attentional capacity, so grouping can be the solution that leads to a greater chance of object
detection and problem resolution. If team members have consonant mental models, then
team attentional capacity should be enhanced because there will be less process loss; If
schemas are inconsonant, then misunderstandings and team failures can occur.
• Acquisition: Once information has been attended to the team must acquire it in order to use
it. Team acquisition of information is the most complex component of the team information-
processing model because if only one individual has the information, it is treated as an
individual's opinion about that information, but is not necessary for all the members to have
acquired the information for the team to have acquired it. In highly differentiated teams, an
119
individual member may be the only source for a piece of critical information, and the team
has no choice but to consider that information.
• Encoding: Encoding is the process by which information is translated into a personal mental
representation. Encoding information by a team may result in a shared mental model or a
shared representation and understanding of the decision problem, as well as the context of
that problem.
• Storage: Once information has been encoded, it is then stored. Storage implies what is
captured in group memory. This obviously does not mean that everyone shares all the stored
knowledge, but that they share knowledge of the information category labels and
knowledge of who possesses specialized information, so is usually used the metaphor of
“group mind” even if the process of sharing requires times larger than individuals. Good
teams may overcome this through extensive training or experience together.
• Retrieval: Retrieving the information from memory is different for a team, as opposed to
individual retrieval. Retrieving information from group memory results in superior
remembering than from individuals. This is because groups are more accurate at pointing
out whether retrieved information is correct or not and group members can correct faulty
retrievals even if retrieving information is susceptible to point-of-view errors, less probable
in team.
• Judgement/decision: Finally, all this information processing results in a judgement or
decision response, the effective decision-making moment. To understand team decision
making, one should understand the difference between a collective response and team
decision making as a coordinated series of innumerable small decisions and actions resulting
in a team product. In sum, the idea of the team as an information-processing unit has utility
because it constrains a remarkably complex phenomenon.
Although team decision making is similar to the individual process, it is susceptible to different types
of errors and biases, in fact over 80 percent of airline accidents have been attributed to human
factor, especially poor crew coordination and decision making. Structural effects on team decision-
making errors result from larger, more global organizational processes and context, and are most
relevant at the information acquisition stage of information processing. Such decision-making
dysfunctions can impact multiple levels of team information processing at any point in time. They
include: groupthink, a psychological phenomenon that occurs within a group of people in which the
desire for harmony or conformity in the group results in an irrational or dysfunctional decision-
120
making outcome; Abilene paradox, when a group of people collectively decide on a course of action
that is counter to the preferences of many or all of the individuals in the group provoking common
breakdown of group communication in which each member mistakenly believes that their own
preferences are counter to the group's and, therefore, does not raise objections; dominant
personality usurping the team decision-making process. Errors in team decision making can result
from mismatches in teams and their organizational environment, based on unresolved personality
and ideological conflicts. Cultural differences can cause one individual to be more listened to than
another and thus have a greater impact on decision making. To improve the process the most
important is team training; also, improvements in organizational design and the technologies
developments support decision-making. The computerization of that exchange process will focus
on concepts of group/team memory, information richness, and psychological distance, especially in
distributed environments.
Figure 5-4 Teamwork is the key of success (Emirates).
121
Chapter 6 Sleep Problems
Sleep Inertia
“Sleep inertia” refers to the transitional state of hypovigilance between sleep and wake, marked by
impaired performance, confusion, and a desire to return to sleep. The intensity and duration of
sleep inertia vary based on situational factors, but its effects may last minutes to several hours.
Sleep inertia is a complex normal phenomenon not fully understood, a common post nap grogginess
that can negatively affects the night worker who is required to make cognitively-taking decisions.
From an evolutionary standpoint, sleep inertia is counterproductive, as sudden transitions to
wakefulness seem clearly more adaptive. To some extent, the potential harm of slow transitions to
cognitive baseline may be mitigated by changes in sleep inertia intensity based on sleep timing,
composition, and duration, such that there are times when a sudden awakening impairs cognition
to a lesser extent: sleep inertia is directly related with sleep feature. It reflects the contradictory
needs of maintaining sleep or the brain’s need for a more gradual awakening process due to its
complexity, moreover the biological cause of sleep inertia is linked with adenosine. Adenosine is an
important chemical known as a nucleoside that exists naturally in all cells of the body. It is used to
transfer energy within the cells by forming molecules like adenosine triphosphate ATP and
adenosine diphosphate ADP, and it is also one of the chemical messengers, or neurotransmitters,
within the brain. In addition to various other functions, adenosine has been hypothesized as one of
many neurotransmitters and neuromodulators affecting the complex behaviour of sleep,
particularly the initiation of sleep: if awakening occur before adenosine is fully cleared, it results in
sleep inertia. Adenosine levels are increased by sleep restriction and gradually decrease over hours
of subsequent sleep, such a hypothesis could account for the finding of more intense sleep inertia
following awakenings from recovery sleep than from baseline sleep. This topic will be deepened
later.
The study of the brain regional differences between presleep and postsleep waking period is based
on the observation of electroencephalography EEG of 18 healthy subjects: the participants slept for
two consecutive nights under monitoring (C. Marzano, M. Ferrara, “Electroencephalographic sleep
inertia of the awakening brain”). In one night, they were awakened from stage 2 NREM, while in
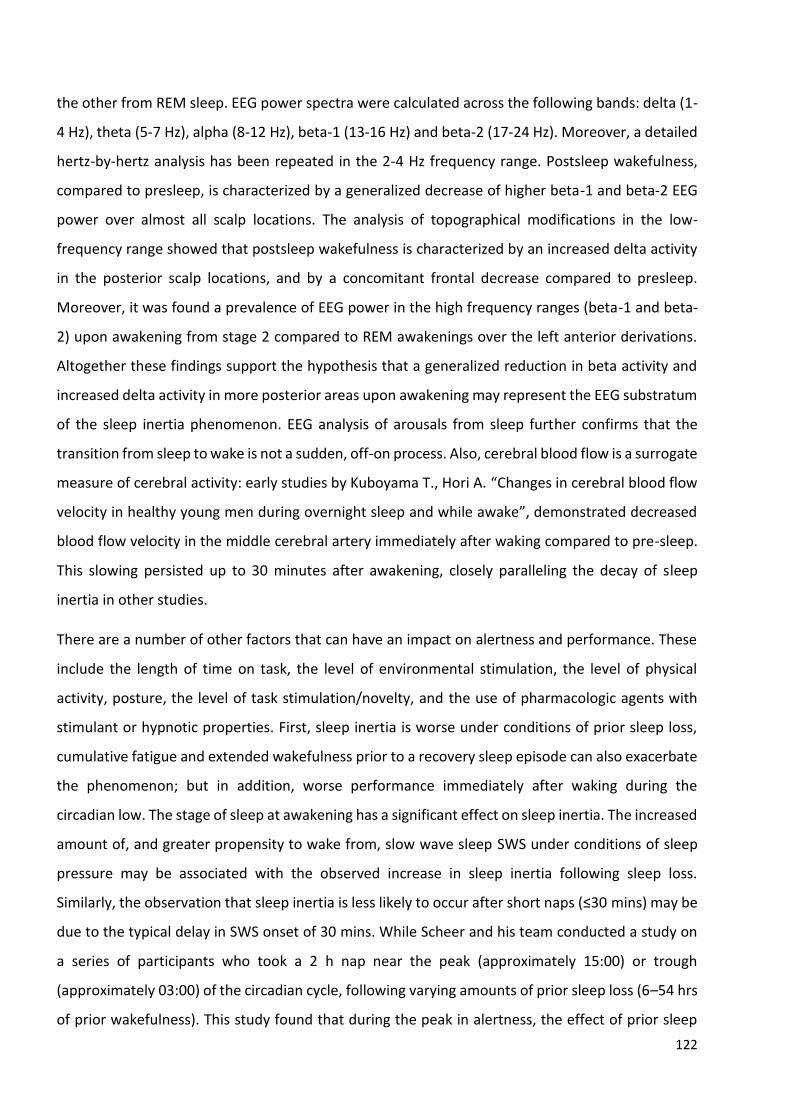
122
the other from REM sleep. EEG power spectra were calculated across the following bands: delta (1-
4 Hz), theta (5-7 Hz), alpha (8-12 Hz), beta-1 (13-16 Hz) and beta-2 (17-24 Hz). Moreover, a detailed
hertz-by-hertz analysis has been repeated in the 2-4 Hz frequency range. Postsleep wakefulness,
compared to presleep, is characterized by a generalized decrease of higher beta-1 and beta-2 EEG
power over almost all scalp locations. The analysis of topographical modifications in the low-
frequency range showed that postsleep wakefulness is characterized by an increased delta activity
in the posterior scalp locations, and by a concomitant frontal decrease compared to presleep.
Moreover, it was found a prevalence of EEG power in the high frequency ranges (beta-1 and beta-
2) upon awakening from stage 2 compared to REM awakenings over the left anterior derivations.
Altogether these findings support the hypothesis that a generalized reduction in beta activity and
increased delta activity in more posterior areas upon awakening may represent the EEG substratum
of the sleep inertia phenomenon. EEG analysis of arousals from sleep further confirms that the
transition from sleep to wake is not a sudden, off-on process. Also, cerebral blood flow is a surrogate
measure of cerebral activity: early studies by Kuboyama T., Hori A. “Changes in cerebral blood flow
velocity in healthy young men during overnight sleep and while awake”, demonstrated decreased
blood flow velocity in the middle cerebral artery immediately after waking compared to pre-sleep.
This slowing persisted up to 30 minutes after awakening, closely paralleling the decay of sleep
inertia in other studies.
There are a number of other factors that can have an impact on alertness and performance. These
include the length of time on task, the level of environmental stimulation, the level of physical
activity, posture, the level of task stimulation/novelty, and the use of pharmacologic agents with
stimulant or hypnotic properties. First, sleep inertia is worse under conditions of prior sleep loss,
cumulative fatigue and extended wakefulness prior to a recovery sleep episode can also exacerbate
the phenomenon; but in addition, worse performance immediately after waking during the
circadian low. The stage of sleep at awakening has a significant effect on sleep inertia. The increased
amount of, and greater propensity to wake from, slow wave sleep SWS under conditions of sleep
pressure may be associated with the observed increase in sleep inertia following sleep loss.
Similarly, the observation that sleep inertia is less likely to occur after short naps (≤30 mins) may be
due to the typical delay in SWS onset of 30 mins. While Scheer and his team conducted a study on
a series of participants who took a 2 h nap near the peak (approximately 15:00) or trough
(approximately 03:00) of the circadian cycle, following varying amounts of prior sleep loss (6–54 hrs
of prior wakefulness). This study found that during the peak in alertness, the effect of prior sleep
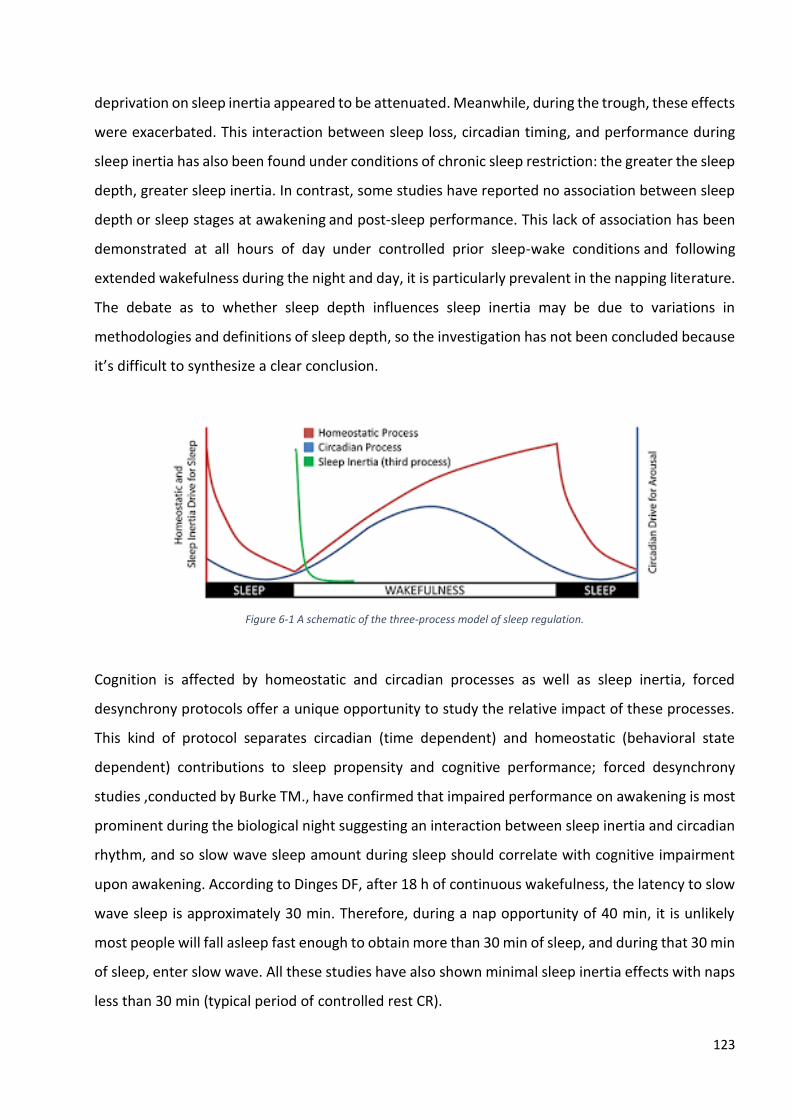
123
deprivation on sleep inertia appeared to be attenuated. Meanwhile, during the trough, these effects
were exacerbated. This interaction between sleep loss, circadian timing, and performance during
sleep inertia has also been found under conditions of chronic sleep restriction: the greater the sleep
depth, greater sleep inertia. In contrast, some studies have reported no association between sleep
depth or sleep stages at awakening and post-sleep performance. This lack of association has been
demonstrated at all hours of day under controlled prior sleep-wake conditions and following
extended wakefulness during the night and day, it is particularly prevalent in the napping literature.
The debate as to whether sleep depth influences sleep inertia may be due to variations in
methodologies and definitions of sleep depth, so the investigation has not been concluded because
it’s difficult to synthesize a clear conclusion.
Figure 6-1 A schematic of the three-process model of sleep regulation.
Cognition is affected by homeostatic and circadian processes as well as sleep inertia, forced
desynchrony protocols offer a unique opportunity to study the relative impact of these processes.
This kind of protocol separates circadian (time dependent) and homeostatic (behavioral state
dependent) contributions to sleep propensity and cognitive performance; forced desynchrony
studies ,conducted by Burke TM., have confirmed that impaired performance on awakening is most
prominent during the biological night suggesting an interaction between sleep inertia and circadian
rhythm, and so slow wave sleep amount during sleep should correlate with cognitive impairment
upon awakening. According to Dinges DF, after 18 h of continuous wakefulness, the latency to slow
wave sleep is approximately 30 min. Therefore, during a nap opportunity of 40 min, it is unlikely
most people will fall asleep fast enough to obtain more than 30 min of sleep, and during that 30 min
of sleep, enter slow wave. All these studies have also shown minimal sleep inertia effects with naps
less than 30 min (typical period of controlled rest CR).
124
Multiple strategies to decrease sleep inertia have been tested, but they are closely related to
environmental and physiological condition, so an exact one is impossible to establish. Drinking
caffeine just before a nap has been suggested as a useful countermeasure for sleepy drivers, both
infusion and chewed gum. Exposure to bright light of various intensities and different moment
throw sleep, does not meaningfully impact sleep inertia as measured subjectively or objectively,
while the use of dawn simulator, a technique that involves timing lights, often called wake up
lights, sunrise alarm clock or natural light alarm clocks, has allowed for improvements in sleepiness
on awakening. Noise effect on sleep inertia as a function of circadian placement of a one-hour nap
is quite complicated: pink noise at 75 decibels improves performance following a nap at midnight,
but it may also worsens performance following a rest at 0400 or a slight deleterious effect those
subjects who did not sleep at all.
Cumulative Fatigue
Business aviation operational demands require 24-hour-a-day activities that can include shift work,
night work, irregular and unpredictable work schedules, and time zone changes; these factors
challenge human physiology and can result in performance-impairing fatigue and an increased risk
to safety so human capability has been recognized as a critical factor since early ‘90. Because of
rhythms of modern life, flight operations often are associated with sleep loss and circadian
disruption, both of which have the potential to result in deleterious effects: fatigue the operator
and lead to a hazard.
There are three types of fatigue:
• Transient fatigue is acute fatigue brought on by extreme sleep restriction or extended hours
awake within 1 or 2 days.
• Cumulative fatigue is fatigue brought on by repeated mild sleep restriction or extended
hours awake across a series of days.
• Circadian fatigue refers to the reduced performance during night-time hours, particularly
during an individual’s “window of circadian low” (WOCL). Typically, it occurs between 0200
and 0600 and there is a second, less pronounced, period of reduced alertness between 1500
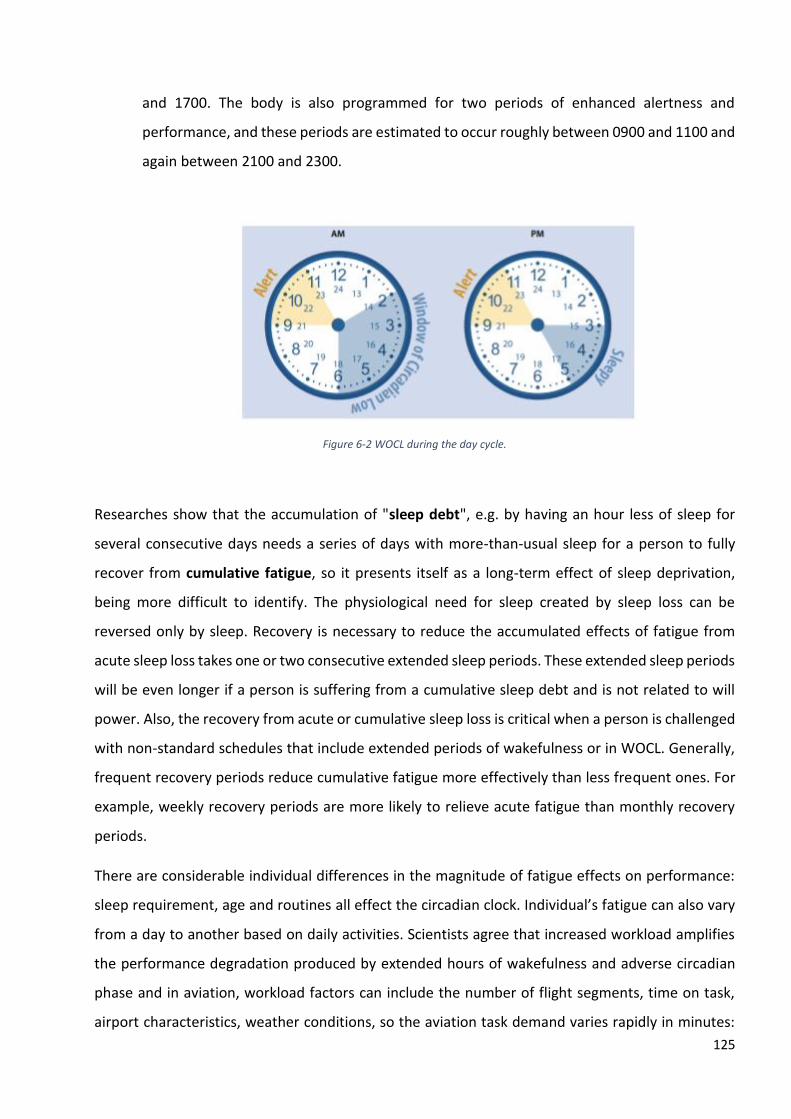
125
and 1700. The body is also programmed for two periods of enhanced alertness and
performance, and these periods are estimated to occur roughly between 0900 and 1100 and
again between 2100 and 2300.
Figure 6-2 WOCL during the day cycle.
Researches show that the accumulation of "sleep debt", e.g. by having an hour less of sleep for
several consecutive days needs a series of days with more-than-usual sleep for a person to fully
recover from cumulative fatigue, so it presents itself as a long-term effect of sleep deprivation,
being more difficult to identify. The physiological need for sleep created by sleep loss can be
reversed only by sleep. Recovery is necessary to reduce the accumulated effects of fatigue from
acute sleep loss takes one or two consecutive extended sleep periods. These extended sleep periods
will be even longer if a person is suffering from a cumulative sleep debt and is not related to will
power. Also, the recovery from acute or cumulative sleep loss is critical when a person is challenged
with non-standard schedules that include extended periods of wakefulness or in WOCL. Generally,
frequent recovery periods reduce cumulative fatigue more effectively than less frequent ones. For
example, weekly recovery periods are more likely to relieve acute fatigue than monthly recovery
periods.
There are considerable individual differences in the magnitude of fatigue effects on performance:
sleep requirement, age and routines all effect the circadian clock. Individual’s fatigue can also vary
from a day to another based on daily activities. Scientists agree that increased workload amplifies
the performance degradation produced by extended hours of wakefulness and adverse circadian
phase and in aviation, workload factors can include the number of flight segments, time on task,
airport characteristics, weather conditions, so the aviation task demand varies rapidly in minutes:
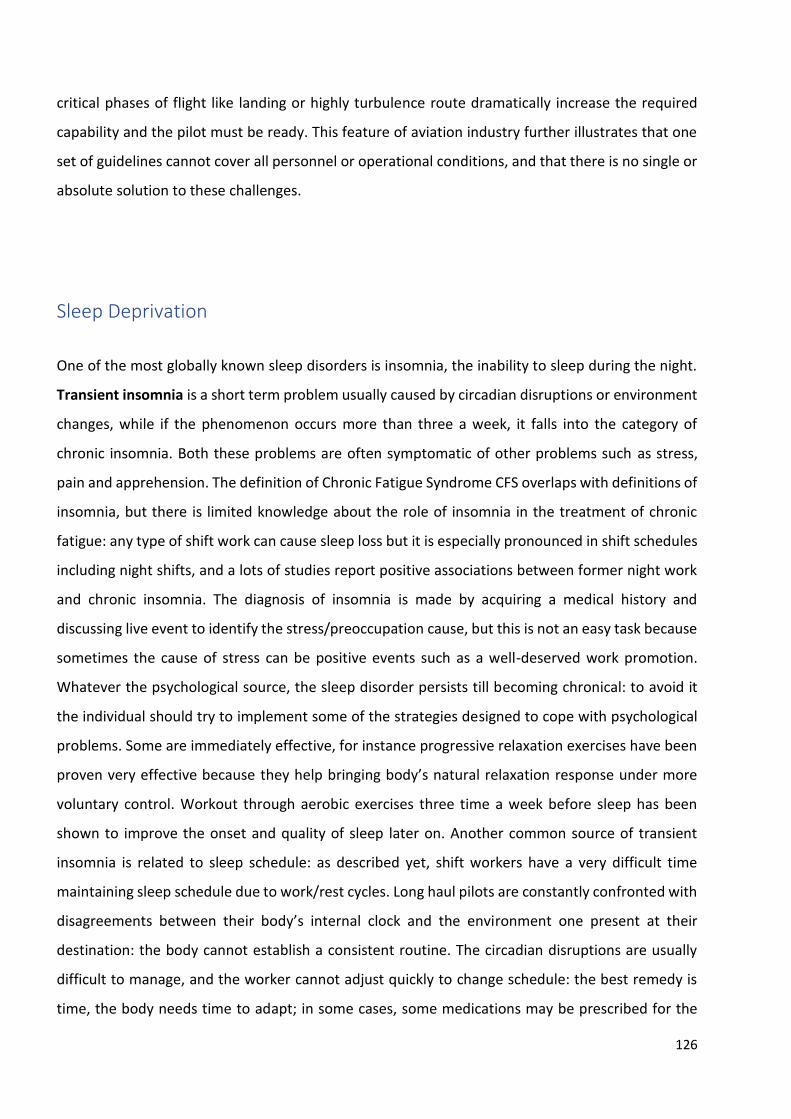
126
critical phases of flight like landing or highly turbulence route dramatically increase the required
capability and the pilot must be ready. This feature of aviation industry further illustrates that one
set of guidelines cannot cover all personnel or operational conditions, and that there is no single or
absolute solution to these challenges.
Sleep Deprivation
One of the most globally known sleep disorders is insomnia, the inability to sleep during the night.
Transient insomnia is a short term problem usually caused by circadian disruptions or environment
changes, while if the phenomenon occurs more than three a week, it falls into the category of
chronic insomnia. Both these problems are often symptomatic of other problems such as stress,
pain and apprehension. The definition of Chronic Fatigue Syndrome CFS overlaps with definitions of
insomnia, but there is limited knowledge about the role of insomnia in the treatment of chronic
fatigue: any type of shift work can cause sleep loss but it is especially pronounced in shift schedules
including night shifts, and a lots of studies report positive associations between former night work
and chronic insomnia. The diagnosis of insomnia is made by acquiring a medical history and
discussing live event to identify the stress/preoccupation cause, but this is not an easy task because
sometimes the cause of stress can be positive events such as a well-deserved work promotion.
Whatever the psychological source, the sleep disorder persists till becoming chronical: to avoid it
the individual should try to implement some of the strategies designed to cope with psychological
problems. Some are immediately effective, for instance progressive relaxation exercises have been
proven very effective because they help bringing body’s natural relaxation response under more
voluntary control. Workout through aerobic exercises three time a week before sleep has been
shown to improve the onset and quality of sleep later on. Another common source of transient
insomnia is related to sleep schedule: as described yet, shift workers have a very difficult time
maintaining sleep schedule due to work/rest cycles. Long haul pilots are constantly confronted with
disagreements between their body’s internal clock and the environment one present at their
destination: the body cannot establish a consistent routine. The circadian disruptions are usually
difficult to manage, and the worker cannot adjust quickly to change schedule: the best remedy is
time, the body needs time to adapt; in some cases, some medications may be prescribed for the
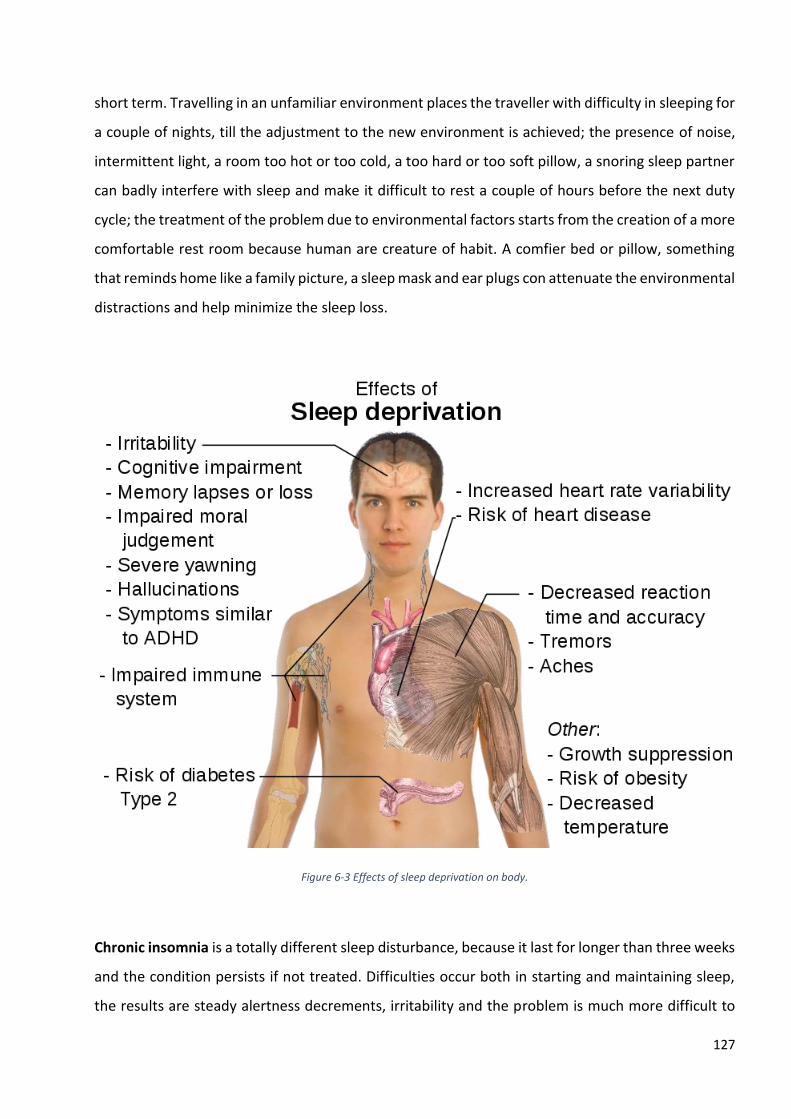
127
short term. Travelling in an unfamiliar environment places the traveller with difficulty in sleeping for
a couple of nights, till the adjustment to the new environment is achieved; the presence of noise,
intermittent light, a room too hot or too cold, a too hard or too soft pillow, a snoring sleep partner
can badly interfere with sleep and make it difficult to rest a couple of hours before the next duty
cycle; the treatment of the problem due to environmental factors starts from the creation of a more
comfortable rest room because human are creature of habit. A comfier bed or pillow, something
that reminds home like a family picture, a sleep mask and ear plugs con attenuate the environmental
distractions and help minimize the sleep loss.
Figure 6-3 Effects of sleep deprivation on body.
Chronic insomnia is a totally different sleep disturbance, because it last for longer than three weeks
and the condition persists if not treated. Difficulties occur both in starting and maintaining sleep,
the results are steady alertness decrements, irritability and the problem is much more difficult to
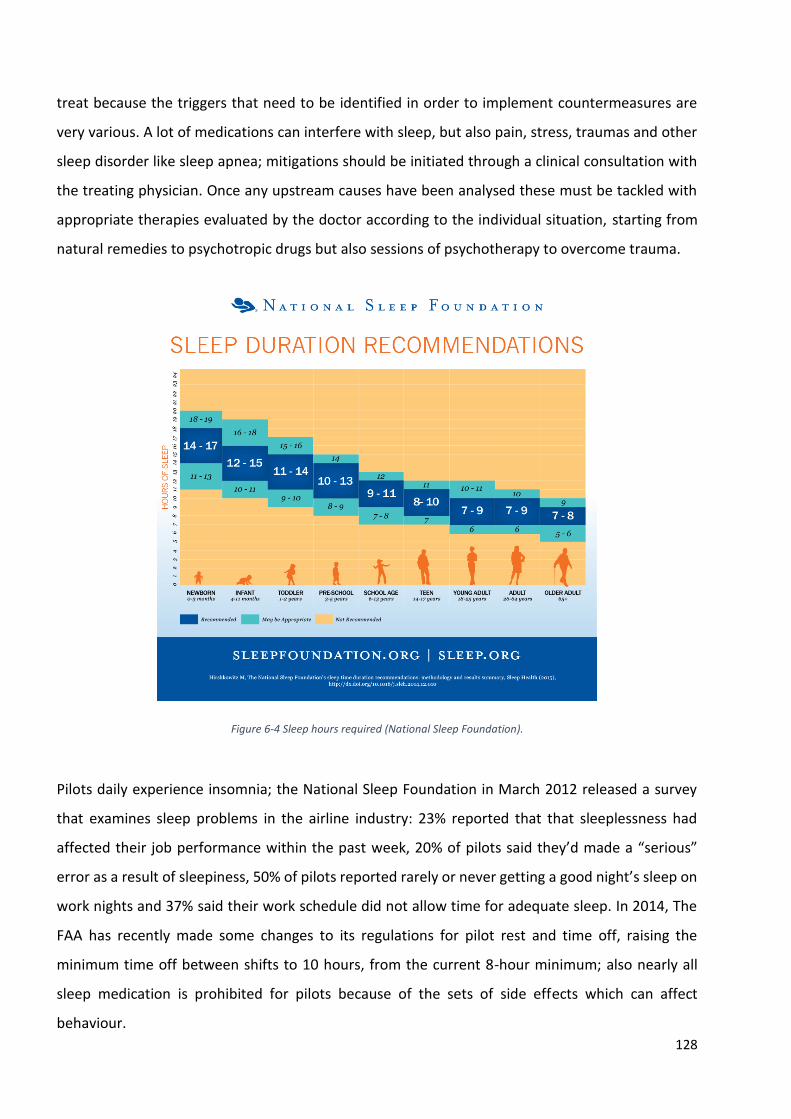
128
treat because the triggers that need to be identified in order to implement countermeasures are
very various. A lot of medications can interfere with sleep, but also pain, stress, traumas and other
sleep disorder like sleep apnea; mitigations should be initiated through a clinical consultation with
the treating physician. Once any upstream causes have been analysed these must be tackled with
appropriate therapies evaluated by the doctor according to the individual situation, starting from
natural remedies to psychotropic drugs but also sessions of psychotherapy to overcome trauma.
Figure 6-4 Sleep hours required (National Sleep Foundation).
Pilots daily experience insomnia; the National Sleep Foundation in March 2012 released a survey
that examines sleep problems in the airline industry: 23% reported that that sleeplessness had
affected their job performance within the past week, 20% of pilots said they’d made a “serious”
error as a result of sleepiness, 50% of pilots reported rarely or never getting a good night’s sleep on
work nights and 37% said their work schedule did not allow time for adequate sleep. In 2014, The
FAA has recently made some changes to its regulations for pilot rest and time off, raising the
minimum time off between shifts to 10 hours, from the current 8-hour minimum; also nearly all
sleep medication is prohibited for pilots because of the sets of side effects which can affect
behaviour.
129
Chapter 7 Fatigue countermeasures
Introduction
Flight crew fatigue can negatively affect performance and pose a hazard to flight safety especially
during the window of circadian low WOCL and despite the best efforts and the best well-trained
flight crew; in addition unexpected events such as delays and high workload due to weather can
increase the risk of a fatal error. If there wasn’t possibility to rest optimally during the schedule rest
periods, the main symptoms that, in aviation, may lead a pilot to believe that his colleague is
fatigued are the following: difficulty concentrating, make a gross mistake, omit specific controls or
actions, burning eye, flipping the wrong switch, excessive pessimism and require more than one
coffee in a short time. In a dated 2009 document, signed J. Caldwell, ”Fatigue Countermeasures in
Aviation” fatigue is treated not as a one-dimensional phenomenon, but rather the product of several
related factors to the physiological needs of sleep and internal biological ones: from a safety
perspective, improperly managed fatigue poses a significant risk to crew, passengers, and aircraft;
humans simply were not equipped (or did not evolve) to operate effectively on the pressured 24/7
schedules that often define today's flight operations and because of this, well-planned, science-
based, fatigue management strategies are crucial for managing sleep debt, sustained periods of
wakefulness, and circadian factors that are primary contributors to fatigue-related flight mishaps.
These strategies should begin with regulatory considerations, starting with more accommodating
working hours, but should include in-flight countermeasures as well as both pre and postflight
interventions. The risks and benefits of each technique should be carefully considered and balanced.
Flight Limitation
Regard flight, duty time limitations and rest requirements for crew members, the EASA Easy Access
Rules for Air Operations ORO.FTL.105 establishes that a crew member remains acclimatised to the
local time of his or her reference time for 47 hours 59 minutes after reporting no matter how many
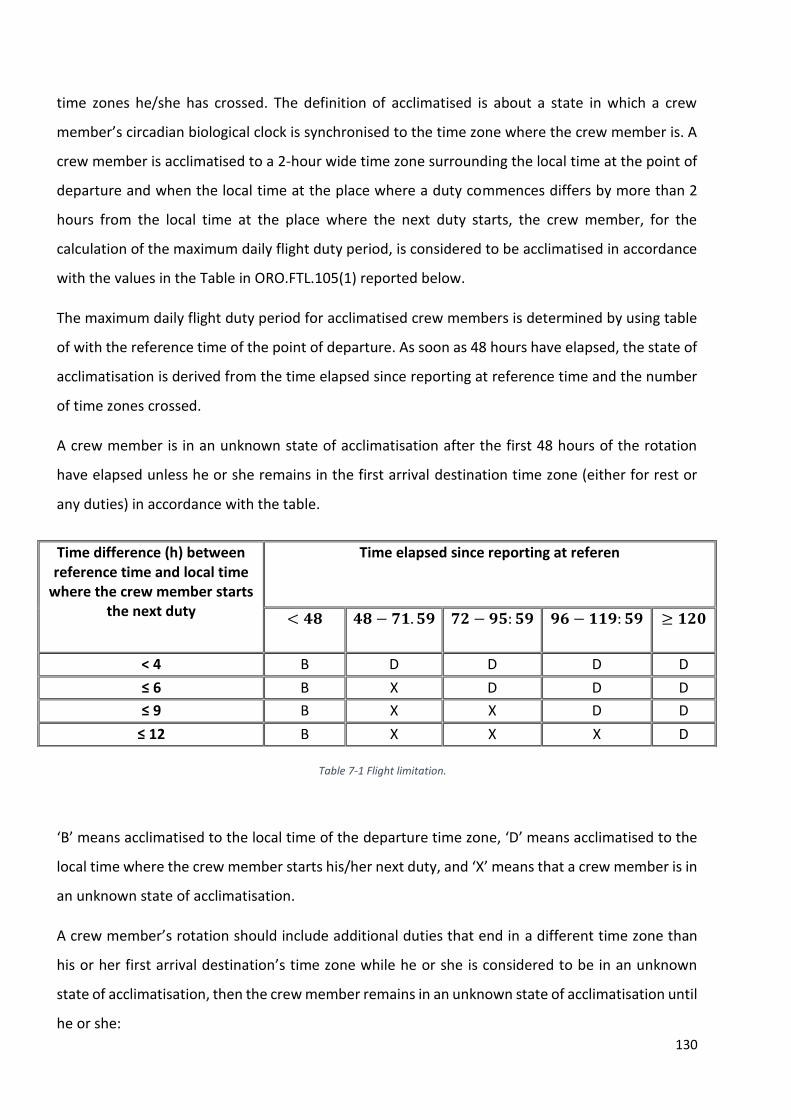
130
time zones he/she has crossed. The definition of acclimatised is about a state in which a crew
member’s circadian biological clock is synchronised to the time zone where the crew member is. A
crew member is acclimatised to a 2-hour wide time zone surrounding the local time at the point of
departure and when the local time at the place where a duty commences differs by more than 2
hours from the local time at the place where the next duty starts, the crew member, for the
calculation of the maximum daily flight duty period, is considered to be acclimatised in accordance
with the values in the Table in ORO.FTL.105(1) reported below.
The maximum daily flight duty period for acclimatised crew members is determined by using table
of with the reference time of the point of departure. As soon as 48 hours have elapsed, the state of
acclimatisation is derived from the time elapsed since reporting at reference time and the number
of time zones crossed.
A crew member is in an unknown state of acclimatisation after the first 48 hours of the rotation
have elapsed unless he or she remains in the first arrival destination time zone (either for rest or
any duties) in accordance with the table.
‘B’ means acclimatised to the local time of the departure time zone, ‘D’ means acclimatised to the
local time where the crew member starts his/her next duty, and ‘X’ means that a crew member is in
an unknown state of acclimatisation.
A crew member’s rotation should include additional duties that end in a different time zone than
his or her first arrival destination’s time zone while he or she is considered to be in an unknown
state of acclimatisation, then the crew member remains in an unknown state of acclimatisation until
he or she:
Time difference (h) between reference time and local time
where the crew member starts the next duty
Time elapsed since reporting at referen
< 𝟒𝟖 𝟒𝟖 − 𝟕𝟏. 𝟓𝟗 𝟕𝟐 − 𝟗𝟓: 𝟓𝟗 𝟗𝟔 − 𝟏𝟏𝟗: 𝟓𝟗 ≥ 𝟏𝟐𝟎
< 4 B D D D D
≤ 6 B X D D D
≤ 9 B X X D D
≤ 12 B X X X D
Table 7-1 Flight limitation.
131
1. has taken the rest period, involving at least a 4-hour time difference to the reference time
stops counting when the crew member returns to home base or new rest locations. For all
the rest period the operator is no longer responsible for the accommodation of the crew
member;
2. has been undertaking duties starting at and returning to the time zone of the new location
until he becomes acclimatised again. To determine the state of acclimatisation, the two
following criteria should be applied: the greater of the time differences between the time
zone where he or she was last acclimatised or the local time of his last departure point and
the new location; and the time elapsed since reporting at home base for the first time during
the rotation.
Example: CM is acclimated to Paris (UTC + 1) (Reference Time) and will begin the next duty period
in Chicago (UTC -6), whereby the Time Difference is 7:00.
The time elapsed since reporting at reference time to the time of report of the next duty. A
conversion to UTC date time will be required to calculate the elapsed time.
A Report in Paris on 15-Feb-2017 at 10:00 (Local) is 15-Feb-2017 at 09:00 (UTC), the next report in
Chicago is on 16-Feb-2017 at 20:00 (Local) is 17-Feb-2017 at 02:00 (UTC), whereby the time elapsed
is 40:00.
▪ Case #1: Since the elapsed time is less than 48:00 (Row 3, Column 1) the crewmember
remains acclimated to Paris time (UTC + 1).
▪ Case #2: Had the departure in Chicago been postponed 24 hours, the elapsed time would be
64:00, the CM has now moved into an unknown state of acclimatization (x) (Row 3, Column
2).
▪ Case #3: Had the departure in Chicago been postponed 60 hours, the elapsed time would be
100:00, the CM has now moved into an acclimated state of acclimatization (Row 3, Column
4). The CM is acclimatized to Chicago Time (UTC -6).
Reference time for the next departure is defined as follows:
1. When a CM begins the next duty period in an (B) Acclimated to Previous Acclimated
Time Zone state to the reference time is the time zone where that cm was last acclimated
to.
132
2. When a CM begins the next duty period in an (X) Unknown state there is no reference time.
3. When a CM begins the next duty period in an (D) Acclimated to Departure state the
reference time is the local time zone where the duty period begins.
4. Should the CM remain within the zone of acclimatisation, the reference time is the local time
zone where the duty period begins.
Rest period is always needed after a duty, as established in ORO.FTL.235. The minimum rest period
at home base provided before undertaking a flight duty period starting at home base shall be at
least as long as the preceding duty period, or 12 hours, whichever is greater. The minimum rest
period away from home base provided before undertaking a duty period starting away from home
base shall be at least as long as the preceding duty period, or 10 hours, whichever is greater. This
period shall include an 8-hour sleep opportunity in addition to the time for travelling and
physiological needs.
Flight time specification schemes shall specify recurrent extended recovery rest periods to
compensate for cumulative fatigue. The minimum recurrent extended recovery rest period shall be
36 hours, including 2 local nights, and in any case the time between the end of one recurrent
extended recovery rest period and the start of the next extended recovery rest period shall not be
more than 168 hours. The recurrent extended recovery rest period shall be increased to 2 local days
twice every month. The operator applies appropriate fatigue risk management to actively manage
the fatiguing effect of night duties of more than 10 hours in relation to the surrounding duties and
rest periods. When rostering night duties of more than 10 hours (referred to below as ‘long night
duties’), it is critical for the crew member to obtain sufficient sleep before such duties when he is
adapted to being awake during day time hours at the local time where he is acclimatised. Optimise
alertness on long night duties is in GM1 CS FTL.1.205; the likelihood of obtaining sleep as close as
possible to the start of the flight duty period should be considered, when rostering rest periods
before long night duties, by providing sufficient time to the crew member to adapt to being awake
during the night. Rostering practices leading to extended wakefulness and state of alert before
reporting for such duties should be avoided. Fatigue risk management principles that could be
applied to the rostering of long night duties may include:
1. avoiding long night duties after extended recovery rest periods
133
2. progressively delaying the rostered ending time of the duty periods preceding long night
duties;
3. starting a block of night duties with a shorter flight duty period;
4. avoiding the sequence of early starts and long night duties.
For a rotation with three or more duty periods, the greatest time zone difference from the original
reference time should be used to determine the minimum number of local nights of rest to
compensate for time zone differences. If such a rotation includes time zones crossings in both
directions, the calculation is based on the highest number of time zones crossed in every flight
duty period during the rotation.
The following guidelines and recommendations address the 24-hour duty and rest scheduling
requirements of the business aviation industry. It is contained in “Principles and Guidelines for Duty
and Rest Scheduling in Corporate and Business Aviation” published by National Business Aviation
Association NBAA and Flight Safety Foundation FSF. Due to individual differences and operational
factors, it is difficult to accurately estimate the adjustment of the circadian rhythm in individuals
when crossing time zones. For purposes of scheduling, a common regulatory approach for
estimating time zone adjustment is the following: for duty periods that cross three or fewer time
zones, the WOCL is roughly 0200 to 0600 home-base/domicile time. For duty periods that cross four
or more time zones, the WOCL is estimated to remain at homebase/domicile time for the first 48
hours only. After a crewmember remains away more than 48 hours from home-base/ domicile, the
WOCL is roughly 0200 to 0600 local time (recommended guidelines related to the WOCL should be
applied when landing or flight time occurs during the WOCL, because duty periods that occur during
the WOCL will have a higher potential for reduced performance and alertness than those that occur
during daytime). Off duty is a period of time in which crewmembers are free of all duties: the
standard off-duty period for recovery should be a minimum of 36 continuous hours, to include two
consecutive nights of recovery sleep, within a seven-day period. It is recommended that following
duty during the WOCL, the off-duty period should be a minimum of 12 uninterrupted hours within
any 24-hour period. If three or more duty periods within a seven-day period encroach on all or any
portion of the WOCL, it is recommended that the standard off-duty period (36 continuous hours
within seven days) be extended to 48 hours to ensure recovery. These are rules for a two members
flight crew, while augmenting the number allows for a sleep opportunity during a duty period so
fatigue is expected to accumulate more slowly and in some circumstances duty period can be
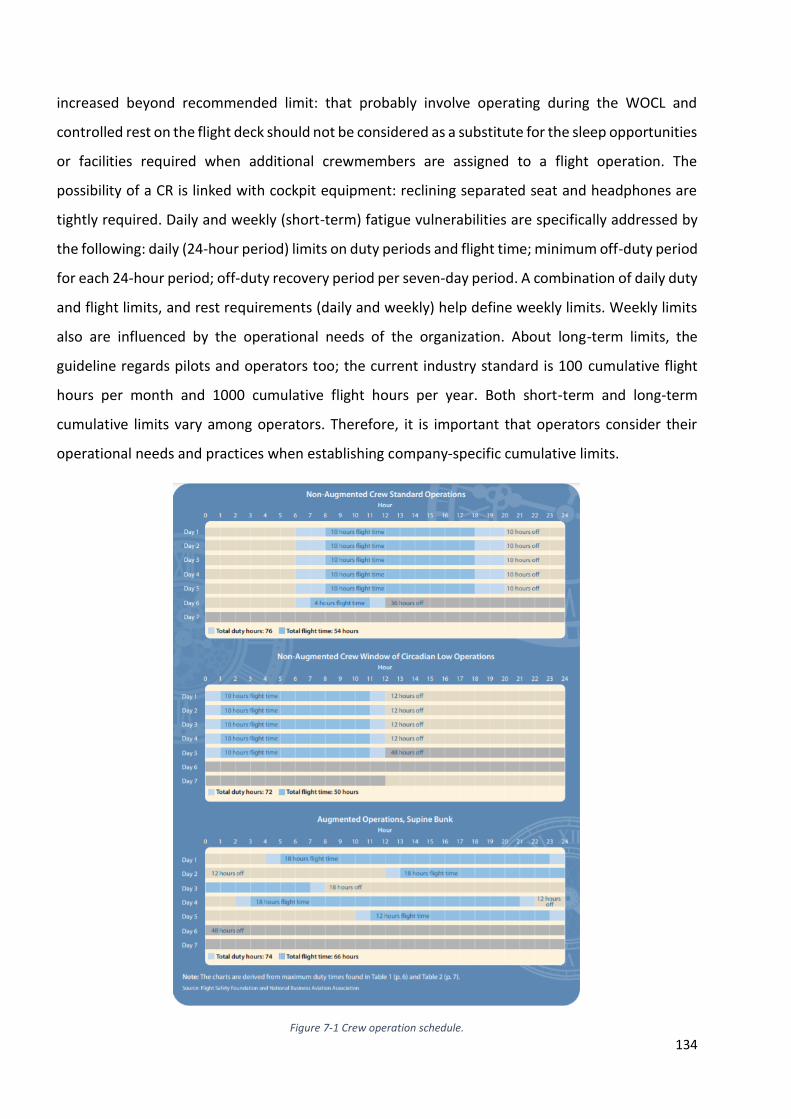
134
increased beyond recommended limit: that probably involve operating during the WOCL and
controlled rest on the flight deck should not be considered as a substitute for the sleep opportunities
or facilities required when additional crewmembers are assigned to a flight operation. The
possibility of a CR is linked with cockpit equipment: reclining separated seat and headphones are
tightly required. Daily and weekly (short-term) fatigue vulnerabilities are specifically addressed by
the following: daily (24-hour period) limits on duty periods and flight time; minimum off-duty period
for each 24-hour period; off-duty recovery period per seven-day period. A combination of daily duty
and flight limits, and rest requirements (daily and weekly) help define weekly limits. Weekly limits
also are influenced by the operational needs of the organization. About long-term limits, the
guideline regards pilots and operators too; the current industry standard is 100 cumulative flight
hours per month and 1000 cumulative flight hours per year. Both short-term and long-term
cumulative limits vary among operators. Therefore, it is important that operators consider their
operational needs and practices when establishing company-specific cumulative limits.
Figure 7-1 Crew operation schedule.
135
Controlled Rest
In some operations, there is another tactical in-flight fatigue management strategy: a flight
crewmember can take a controlled rest CR. In accordance with an approved CR procedure, one
flight crewmember is temporarily relieved of operational duties, and takes a short, in-seat rest
break, during which he closes his eyes and attempts to sleep. CR enables a flight crewmember to
use a period of low workload to obtain a brief period of sleep and thereby improve alertness and
performance, particularly for later, more critical phases of flight such as descent and landing. It is
recommended by ICAO and is practiced in Europe, Canada, Australia, Singapore, Hong Kong, and
the Middle East. In situations where some sleep is possible, but the amount of sleep is limited,
napping is the most effective nonpharmacological technique for restoring alertness, but there is an
thin difference between in-flight rest and controlled rest: the first one involves individual flight crew
taking turns leaving the flight deck, usually for multiple hours, to rest and sleep in blocked-off cabin
seats or a designated rest facility, while CR is not planned before a flight, is taken in-seat on the
flight deck, and involves a short period of rest (usually about 40 minutes) during which a nap is taken
and a direct examination of the effectiveness of a 40 min cockpit nap opportunity, resulting in an
average 26 min nap, revealed significant improvements in subsequent pilot physiological alertness
and psychomotor performance. “Effects of planned cockpit rest: on crew performance and
alertness in long-haul operations” was published as NASA Technical Reports. The study was carried
out on two groups of pilots: a no-rest group and a 40 min rest group, who was allowed a planned
nap during a low workload portion of the flight. During the last 90 min of flight reaction time and
lapse data (failures to respond) from the Psychomotor Vigilance Test PVT indicated faster responses
and fewer lapses in the rest group than in the no-rest group. Sleep loss, due both to a bout of
extended wakefulness (acute sleep loss) and repeated insufficient sleep (cumulative sleep loss),
leads to degradation in alertness and cognitive performance and a sleepy individual is more likely
to experience unintentional lapses in alertness and micro sleep event: during cruise, the flight crew
who did not have a nap opportunity, unintentionally fell asleep on five occasions, sometimes for
more than 10 minutes. This study highlight the prevalence of sleepiness and unintentional sleep
when at work and highlight the potential benefit of CR to maintain alertness and performance, and
to reduce the risk of unintentional events, but the duration and magnitude of nap benefits, and so
also the results of these studies, depend on a number of factors including the length, timing, and
quality of the nap, as well as the prior sleep-wake history of the individual.
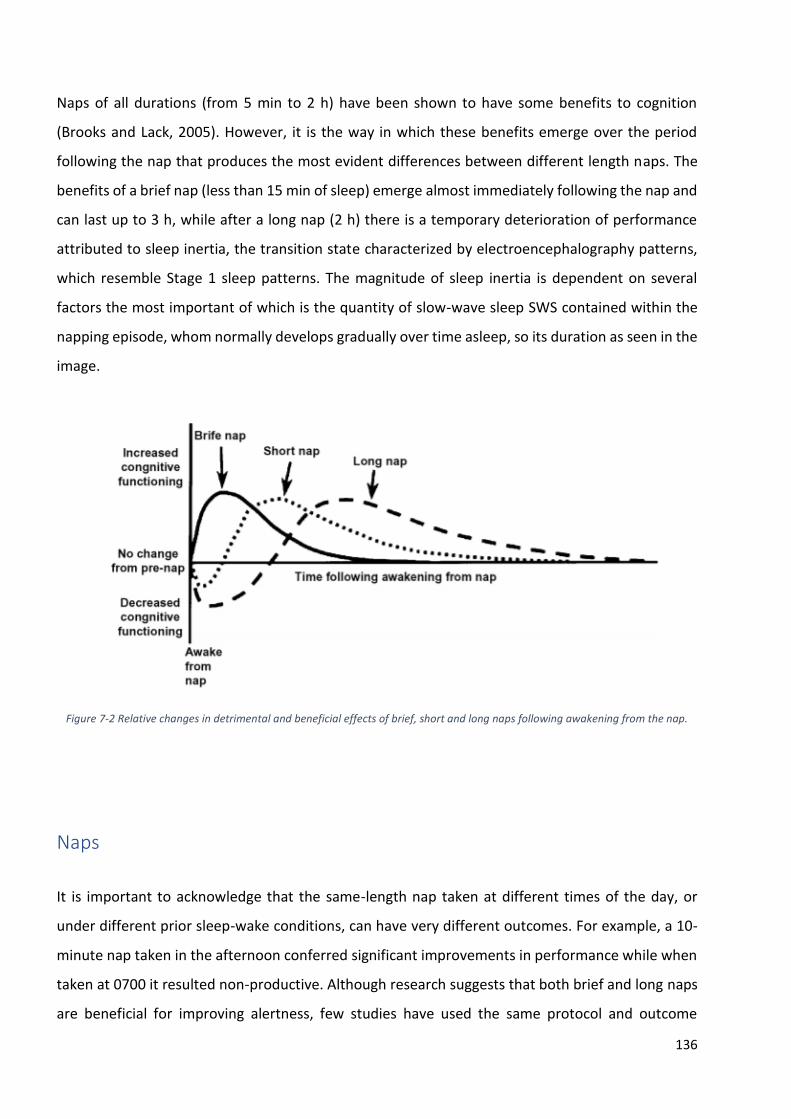
136
Naps of all durations (from 5 min to 2 h) have been shown to have some benefits to cognition
(Brooks and Lack, 2005). However, it is the way in which these benefits emerge over the period
following the nap that produces the most evident differences between different length naps. The
benefits of a brief nap (less than 15 min of sleep) emerge almost immediately following the nap and
can last up to 3 h, while after a long nap (2 h) there is a temporary deterioration of performance
attributed to sleep inertia, the transition state characterized by electroencephalography patterns,
which resemble Stage 1 sleep patterns. The magnitude of sleep inertia is dependent on several
factors the most important of which is the quantity of slow-wave sleep SWS contained within the
napping episode, whom normally develops gradually over time asleep, so its duration as seen in the
image.
Figure 7-2 Relative changes in detrimental and beneficial effects of brief, short and long naps following awakening from the nap.
Naps
It is important to acknowledge that the same-length nap taken at different times of the day, or
under different prior sleep-wake conditions, can have very different outcomes. For example, a 10-
minute nap taken in the afternoon conferred significant improvements in performance while when
taken at 0700 it resulted non-productive. Although research suggests that both brief and long naps
are beneficial for improving alertness, few studies have used the same protocol and outcome
137
measures to directly compare the benefits of brief and long naps. This remains an important
research programme to be pursued. Nevertheless, it is suggested that for sleep restricted individuals
and individuals who have experienced normal nocturnal sleep duration, brief naps and long naps
produce comparable benefits to alertness; it is only in the case of total sleep deprivation that naps
of a longer duration (1–2 h) have been demonstrated to elicit greater alerting benefits than brief
naps. When planning a nap, consideration should be given to these factors in order to minimize
sleep inertia effects: duration (keeping naps shorter than 30 minutes to minimize the likelihood of
entering into deep sleep can reduce the intensity and duration of sleep inertia), pre-sleep loss
(cumulative periods of wakefulness negatively effects napping), time of waking (when the body
clock is promoting sleep, during the WOCL, can exacerbate the effects of sleep inertia).
Sleep is still the best countermeasure to fatigue due to sleep loss, but it’s important to create an
environment that is conductive to restful restorative sleep. The “napping area” must be dark,
comfortable, silent and without distractions. Although slipstream noise can be intense in flights, the
sound of portable generators can be heard through the wall and the vibration of turbulence are
heavy, finding the right place is a fundamental problem. The naps should be as long as possible and
at least 20 minutes should be allowed for sleep inertia to completely dissipate before returning to
duties: the duration recommended is from 40 min to 2 hour, also because the theoretical person
would not be predicted to enter deep sleep until after about 30 min. In the late 1980s, the first study
of the “NASA Nap,” involving three minutes of preparation, a 40-minute nap opportunity, and a 20-
minute recovery period, was undertaken; NASA researchers studied 21 pilots during transoceanic
flights of at least 10 hours in duration, crewed by two pilots and one flight engineer. Participants in
the nap group were given a planned 40-minute nap opportunity in their flight deck seats during a
low-workload portion of the cruise phase of flight. One pilot rested while the other pilot and flight
engineer maintained their regular duties. Pilots slept during 93 percent of these nap opportunities,
took approximately five minutes to fall asleep, and slept, on average, for 26 minutes; pilots who
slept during their CR reported reduced sleepiness at top of descent, and had improved performance
relative to the pilot who remained awake during the CR opportunity.
The studies found that CR reduced, but did not eliminate, fatigue. It can be utilized in flights in which
the low workload cruise phase is of enough duration, on planes equipped with
autopilot/autothrottles, weather radar, FMS, TCAS and appropriate seat. According to ICAO
standards, before a CR both flight crewmembers should conduct a briefing to cover the general
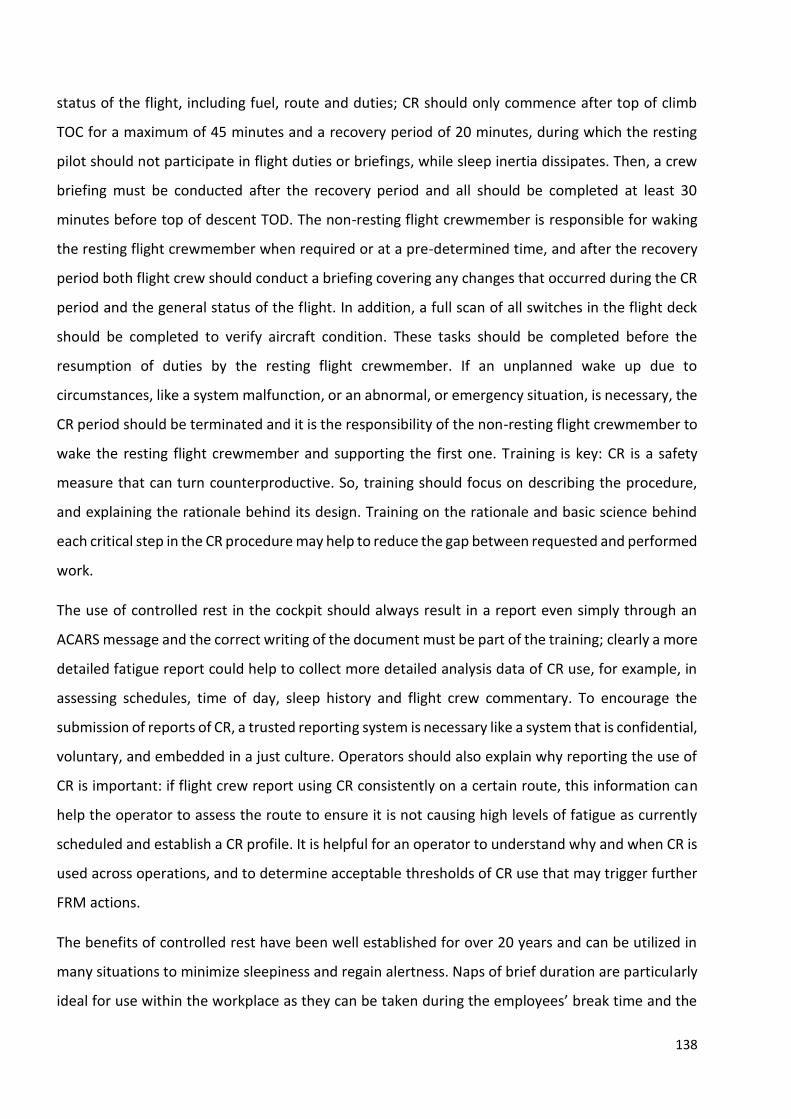
138
status of the flight, including fuel, route and duties; CR should only commence after top of climb
TOC for a maximum of 45 minutes and a recovery period of 20 minutes, during which the resting
pilot should not participate in flight duties or briefings, while sleep inertia dissipates. Then, a crew
briefing must be conducted after the recovery period and all should be completed at least 30
minutes before top of descent TOD. The non-resting flight crewmember is responsible for waking
the resting flight crewmember when required or at a pre-determined time, and after the recovery
period both flight crew should conduct a briefing covering any changes that occurred during the CR
period and the general status of the flight. In addition, a full scan of all switches in the flight deck
should be completed to verify aircraft condition. These tasks should be completed before the
resumption of duties by the resting flight crewmember. If an unplanned wake up due to
circumstances, like a system malfunction, or an abnormal, or emergency situation, is necessary, the
CR period should be terminated and it is the responsibility of the non-resting flight crewmember to
wake the resting flight crewmember and supporting the first one. Training is key: CR is a safety
measure that can turn counterproductive. So, training should focus on describing the procedure,
and explaining the rationale behind its design. Training on the rationale and basic science behind
each critical step in the CR procedure may help to reduce the gap between requested and performed
work.
The use of controlled rest in the cockpit should always result in a report even simply through an
ACARS message and the correct writing of the document must be part of the training; clearly a more
detailed fatigue report could help to collect more detailed analysis data of CR use, for example, in
assessing schedules, time of day, sleep history and flight crew commentary. To encourage the
submission of reports of CR, a trusted reporting system is necessary like a system that is confidential,
voluntary, and embedded in a just culture. Operators should also explain why reporting the use of
CR is important: if flight crew report using CR consistently on a certain route, this information can
help the operator to assess the route to ensure it is not causing high levels of fatigue as currently
scheduled and establish a CR profile. It is helpful for an operator to understand why and when CR is
used across operations, and to determine acceptable thresholds of CR use that may trigger further
FRM actions.
The benefits of controlled rest have been well established for over 20 years and can be utilized in
many situations to minimize sleepiness and regain alertness. Naps of brief duration are particularly
ideal for use within the workplace as they can be taken during the employees’ break time and the
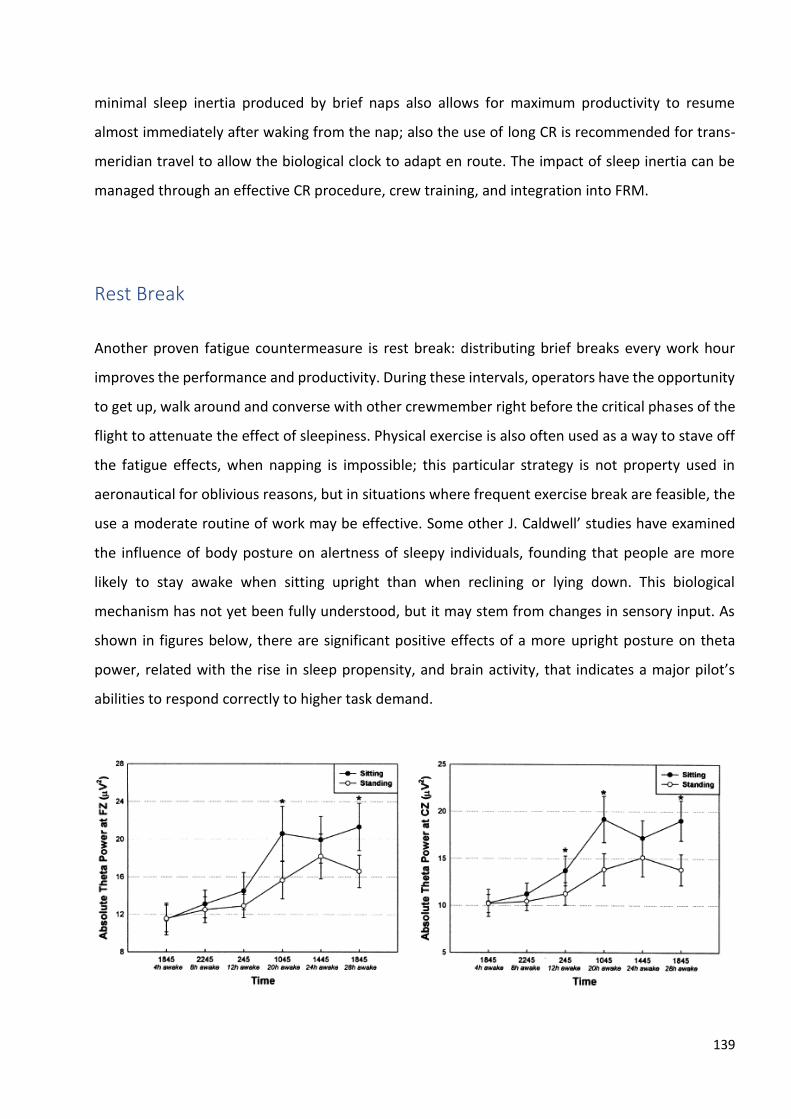
139
minimal sleep inertia produced by brief naps also allows for maximum productivity to resume
almost immediately after waking from the nap; also the use of long CR is recommended for trans-
meridian travel to allow the biological clock to adapt en route. The impact of sleep inertia can be
managed through an effective CR procedure, crew training, and integration into FRM.
Rest Break
Another proven fatigue countermeasure is rest break: distributing brief breaks every work hour
improves the performance and productivity. During these intervals, operators have the opportunity
to get up, walk around and converse with other crewmember right before the critical phases of the
flight to attenuate the effect of sleepiness. Physical exercise is also often used as a way to stave off
the fatigue effects, when napping is impossible; this particular strategy is not property used in
aeronautical for oblivious reasons, but in situations where frequent exercise break are feasible, the
use a moderate routine of work may be effective. Some other J. Caldwell’ studies have examined
the influence of body posture on alertness of sleepy individuals, founding that people are more
likely to stay awake when sitting upright than when reclining or lying down. This biological
mechanism has not yet been fully understood, but it may stem from changes in sensory input. As
shown in figures below, there are significant positive effects of a more upright posture on theta
power, related with the rise in sleep propensity, and brain activity, that indicates a major pilot’s
abilities to respond correctly to higher task demand.
140
Figure 7-3 Body posture affects EEG activity (Caldwell, 2016).
Caffeine
Sleep deprivation and fatigue have detrimental effects on performance in operational settings,
while sleep inertia affects the operator who has just concluded his nap. Both this condition, have a
severe impact on safety: a civilian pilot have the option of refusing to fly if he feels that fatigue has
created an unsafe situation; while a military one, despite having the same option, often chooses to
fly anyway because the drawbacks of his decision, like the lack of assistance to injured people.
Avoiding compromising mission and endangering human life should always be the priority, so in
some situation, chemical method for sustaining alertness may be the better choice. There isn’t the
perfect alertness promoting compound: each one has both advantages and disadvantages related
to effectiveness, abuse, side effect and drug resistance.
Coffee is the most popular beverage after water and is consumed worldwide in an enormous daily
number of cups; everyday people consume coffee or coffeelike product, that are widely available,
in large quantities. Caffeine use is increasing, and the underlying motivations are mainly
concentration and memory enhancement. After ingestion, caffeine is quickly absorbed from the
gastrointestinal tract into the cardiocirculatory where it promptly gets into all the body tissues and
crosses the blood-brain, blood-tissue, and blood-testis barriers. The effect are widely known:
141
attenuating sleepiness, feeling more alert and active, excitability, higher body temperature and
faster hearth rate; but about the potential effects of caffeine, at the cellular level, it can be explained
by three mechanisms of action, but attention will be paid only on the antagonism of adenosine
receptors. Sleep inertia and its neurobiological basis are still quite unknow, but it appears to
intensify with prior sleep loss, and it is more severe when awakening occurs from NREM sleep (long
nap) than from REM sleep (brief nap), especially in WOCL; one of the most widely accepted
hypothesis were postulated by J.H. Benington and H.C. Heller: at biological level, during subsequent
NREM sleep, the synthesis of cerebral glycogen would be possible while adenosine release
continues, so upon abrupt awakening increased levels of adenosine and the corresponding
vigilance-reducing and sleep-inducing effect could persist until adenosine is removed by
metabolism. Hans P.A. Van Dongen and his team, in a 2001 publication, sought to establish the
effects of caffeine on sleep inertia, and the possibility to nullify its effect during operational setting.
The study was conducted on twenty-eight normal healthy subjects, all under observation for 88
hours of extended wakefulness with a total of seven two-hour naps scheduled every 12 hours and
after 24 hours they received either 0.3 mg/kg caffeine in a pill every hour. Blood plasma
concentrations were taken via an indwelling intravenous catheter: a caffeine-containing beverage,
such as coffee, provides a bolus of caffeine that reaches its peak blood plasma concentration within
half an hour after intake on average. The results are encouraging: with a caffeine-containing
beverage after awakening, sleep inertia can be reduced much more quickly than the one to two
hours it may take to dissipate naturally, thanks to the ability to block adenosine receptors and this
is caffeine’s main mechanism of action on the central nervous system for the concentration range
used; these observations are all in line with the above implication of the hypothesis of Benington
and Heller, suggesting precisely that adenosine may be a neurobiological substrate of sleep inertia.
The minimum amount of caffeine recommended to sustain alertness in sleep-deprived people of
circa 70 kg is approximatively 200 mg; using a caffeine method to postpone sleep is ineffective for
heavy and addict users, so they don’t get the boost they really need. A solution could be using
decaffeinated products on light fatigue day, and strictly reserve the use of coffee in the day fatigue
expected to be a significant problem. In the end, when pre-mission sleep is inadequate a slight
pharmacological approach, using caffeine medication, to sustain alertness and performance in
sleepy individuals can be considered.
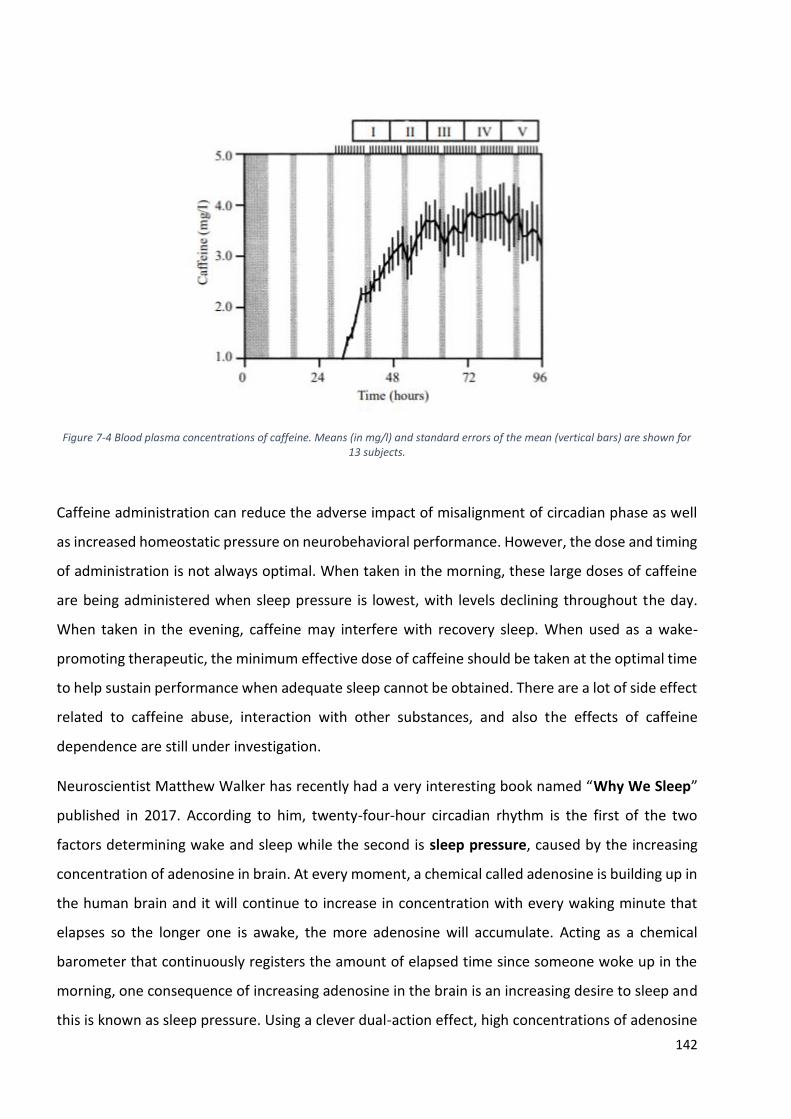
142
Figure 7-4 Blood plasma concentrations of caffeine. Means (in mg/l) and standard errors of the mean (vertical bars) are shown for 13 subjects.
Caffeine administration can reduce the adverse impact of misalignment of circadian phase as well
as increased homeostatic pressure on neurobehavioral performance. However, the dose and timing
of administration is not always optimal. When taken in the morning, these large doses of caffeine
are being administered when sleep pressure is lowest, with levels declining throughout the day.
When taken in the evening, caffeine may interfere with recovery sleep. When used as a wake-
promoting therapeutic, the minimum effective dose of caffeine should be taken at the optimal time
to help sustain performance when adequate sleep cannot be obtained. There are a lot of side effect
related to caffeine abuse, interaction with other substances, and also the effects of caffeine
dependence are still under investigation.
Neuroscientist Matthew Walker has recently had a very interesting book named “Why We Sleep”
published in 2017. According to him, twenty-four-hour circadian rhythm is the first of the two
factors determining wake and sleep while the second is sleep pressure, caused by the increasing
concentration of adenosine in brain. At every moment, a chemical called adenosine is building up in
the human brain and it will continue to increase in concentration with every waking minute that
elapses so the longer one is awake, the more adenosine will accumulate. Acting as a chemical
barometer that continuously registers the amount of elapsed time since someone woke up in the
morning, one consequence of increasing adenosine in the brain is an increasing desire to sleep and
this is known as sleep pressure. Using a clever dual-action effect, high concentrations of adenosine
143
simultaneously turn down the “volume” of wake-promoting regions in the brain and turn up the dial
on sleep-inducing regions. As a result of that chemical sleep pressure, when adenosine
concentrations peak, an irresistible urge for slumber will take hold. It happens to most people after
twelve to sixteen hours of being awake. However, it is artificially possible to mute the sleep signal
of adenosine by using a chemical that makes feel more alert and awake: caffeine.
As said yet, caffeine works by successfully battling with adenosine for the privilege of latching on to
adenosine welcome receptors in the brain. Once caffeine occupies these receptors, however, it does
not stimulate them like adenosine; rather, caffeine blocks and effectively inactivates the receptors,
acting as a masking agent. By hijacking and occupying these receptors, caffeine blocks the sleepiness
signal normally communicated to the brain by adenosine. Levels of circulating caffeine peak
approximately thirty minutes after oral administration, but what is problematic, though, is the
persistence of caffeine in body system. Caffeine has an average half-life (intended as the length of
time it takes for the body to remove 50 percent of a drug’s concentration) of five to seven hours. If
a cup of coffee is taken after evening dinner, around 7:30 p.m, 50 percent of that caffeine may still
be active and circulating throughout the brain tissue by 1:30 a.m. There’s nothing benign about that
50 percent mark because half a shot of caffeine is still plenty powerful, and much more
decomposition work lies ahead throughout the night before caffeine disappears. Sleep will not come
easily or be smooth throughout the night as the brain continues its battle against the opposing force
of caffeine. Most people do not realize how long it takes to overcome a single dose of caffeine, and
therefore fail to make the link between the bad night of sleep we wake from in the morning and the
cup of coffee we had ten hours earlier with dinner.
When the “jolt” of caffeine does wear off, it is removed from the system by an enzyme within the
liver, which gradually degrades it over time. Based in large part on genetics, some people have a
more efficient version of the enzyme that degrades caffeine, allowing the liver to rapidly clear it
from the bloodstream. These rare individuals can drink an espresso with dinner and fall fast asleep
at midnight without a problem. Others, however, have a slower-acting version of the enzyme. It
takes far longer for their system to eliminate the same amount of caffeine. As a result, they are very
sensitive to caffeine’s effects. One cup of tea or coffee in the morning will last much of the day, and
should they have a second cup, even early in the afternoon, they will find it difficult to fall asleep in
the evening. Dr. Walker also affirm that aging alters the speed of caffeine clearance: the older users
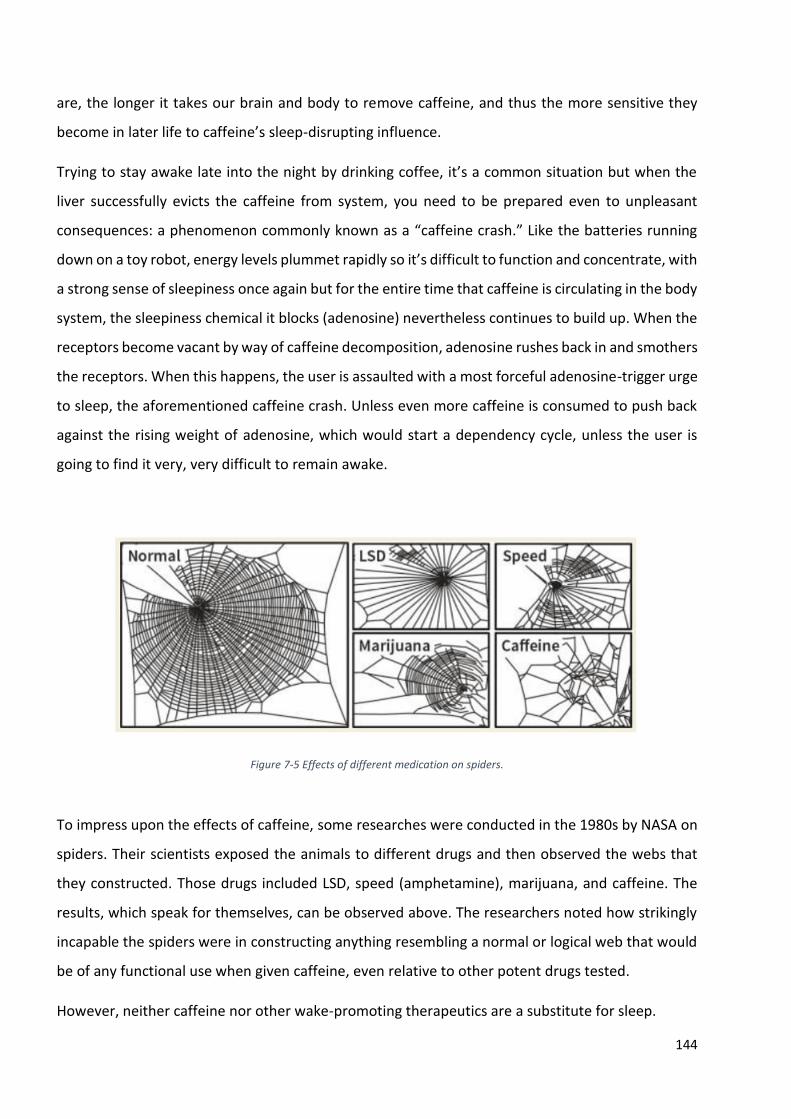
144
are, the longer it takes our brain and body to remove caffeine, and thus the more sensitive they
become in later life to caffeine’s sleep-disrupting influence.
Trying to stay awake late into the night by drinking coffee, it’s a common situation but when the
liver successfully evicts the caffeine from system, you need to be prepared even to unpleasant
consequences: a phenomenon commonly known as a “caffeine crash.” Like the batteries running
down on a toy robot, energy levels plummet rapidly so it’s difficult to function and concentrate, with
a strong sense of sleepiness once again but for the entire time that caffeine is circulating in the body
system, the sleepiness chemical it blocks (adenosine) nevertheless continues to build up. When the
receptors become vacant by way of caffeine decomposition, adenosine rushes back in and smothers
the receptors. When this happens, the user is assaulted with a most forceful adenosine-trigger urge
to sleep, the aforementioned caffeine crash. Unless even more caffeine is consumed to push back
against the rising weight of adenosine, which would start a dependency cycle, unless the user is
going to find it very, very difficult to remain awake.
Figure 7-5 Effects of different medication on spiders.
To impress upon the effects of caffeine, some researches were conducted in the 1980s by NASA on
spiders. Their scientists exposed the animals to different drugs and then observed the webs that
they constructed. Those drugs included LSD, speed (amphetamine), marijuana, and caffeine. The
results, which speak for themselves, can be observed above. The researchers noted how strikingly
incapable the spiders were in constructing anything resembling a normal or logical web that would
be of any functional use when given caffeine, even relative to other potent drugs tested.
However, neither caffeine nor other wake-promoting therapeutics are a substitute for sleep.
145
Chapter 8 CRM
Introduction
Crew Resource Management CRM is the effective use of all available resources for flight crew
personnel to assure a safe and efficient operation, reducing error, avoiding stress and increasing
efficiency. Since the early years of aviation, flight safety has been a constant concern. Research and
development regarding human performance and its limitations have, together with technological
development, supported a continuous improvement of flight safety. An important step in increasing
flight safety was the phasing out of piston-engine aircraft in favor of jet engines, which dramatically
reduced the number of accidents. The new and more reliable engines along with other more reliable
and safe technology, lead to that from 1959 to 1979, the percentage of aviation accidents concluded
to have been caused by technical problems declined to only about fifteen percent. The accident that
resulted in the largest-ever number of fatalities occurred in 1977, when two Boeing 747s collided
on the runway on the island of Tenerife. Along with other major accidents during the 1970s, this
formed the beginning of a new era for flight safety because safety no longer seemed to be primarily
a matter of pilots’ skills in handling their planes or even of technical reliability; pilots’ skills relating
to interaction with other people were found to be at least as important. Today aviation is a complex
environment where human error cause approximately 80 percent of aviation accidents, and thus
CRM is an important part of the defences available to reduce the chances of errors and thereby
improve flight safety.
Originally called Cockpit Resource Management, CRM training emerged after the recognition that
the technical skills of piloting an aircraft were insufficient to ensure safety and best performance; it
was developed as a response to new insights into the causes of aircraft accidents which followed
from the introduction of flight data recorders FDRs and cockpit voice recorders CVRs into modern
jet aircraft. Accidents were occurring for reasons other than inadequate piloting skills or system
failures: inadequate communications between crew members and other parties could lead to a loss
of situational awareness leading to wrong decision making. It was apparent that pilots needed to
learn more about how best to manage all the resources available to them in the cockpit including
other crew-members, procedures, the machine interface, and themselves. The importance of the
146
CRM concept and the utility of the training in promoting safer and more efficient aircraft operations
have now been recognised worldwide, so following a period of experimentation and development
when it was initially met with resistance from flight crews, who felt that it was overly oriented
towards psychology, the techniques embraced by the new training became known collectively as
essential and aviation authorities in many countries have mandated it for pilots, voluntarily
introducing CRM training as part of the courses. CRM can therefore be defined as a management
system which makes optimum use of all available resources and CRM training is about cognitive and
social skills needed to support technical training in order to optimise safe and efficient aircraft
operation. The aim of this training is to make people aware of the inevitable influence exerted on
operations by natural but unconscious tendencies of the human thought with all its typical
ambiguities, distortions, irrationality, focus, incompleteness, absences and to make them
understand the importance of avoiding its negative effects by using intellectual tools, individual and
collective right behaviour. The individual cognitive skills concern information processing, situation
awareness and decision making; interpersonal skills instead concern cooperation, teamwork and
communication capability. Today all flight crew members are required to complete CRM training at
various stages of their careers, including initial and recurrent training and on appointment to
command. Training must be carried out by approved instructors and must follow approved syllabi,
which must be detailed in the Company Flight Operations Manual. CRM training lessons focus on
"knowing how to be" rather than "knowing how to do" and therefore acquiring new NOTECH
knowledge, but "knowing how to be" cannot be learned. Every individual has potentiality and
weaknesses with which he has to deal, and it is necessary to know how to control himself and to be
aware and manage the cognitive processes that determine operational behaviour.
TEM
The role of the pilot-in-command PIC in complex and demanding situations should be emphasized
during CRM training. In fact, a superior pilot uses his superior judgement to avoid bad situations, to
handle and treat errors. Threat and error management uses accident theory based on the work of
James Reason: they have the potential to cause undesired aircraft states, and when this happens,
those states must be managed in order to not cause a catastrophic event. CRM ,as a countermeasure
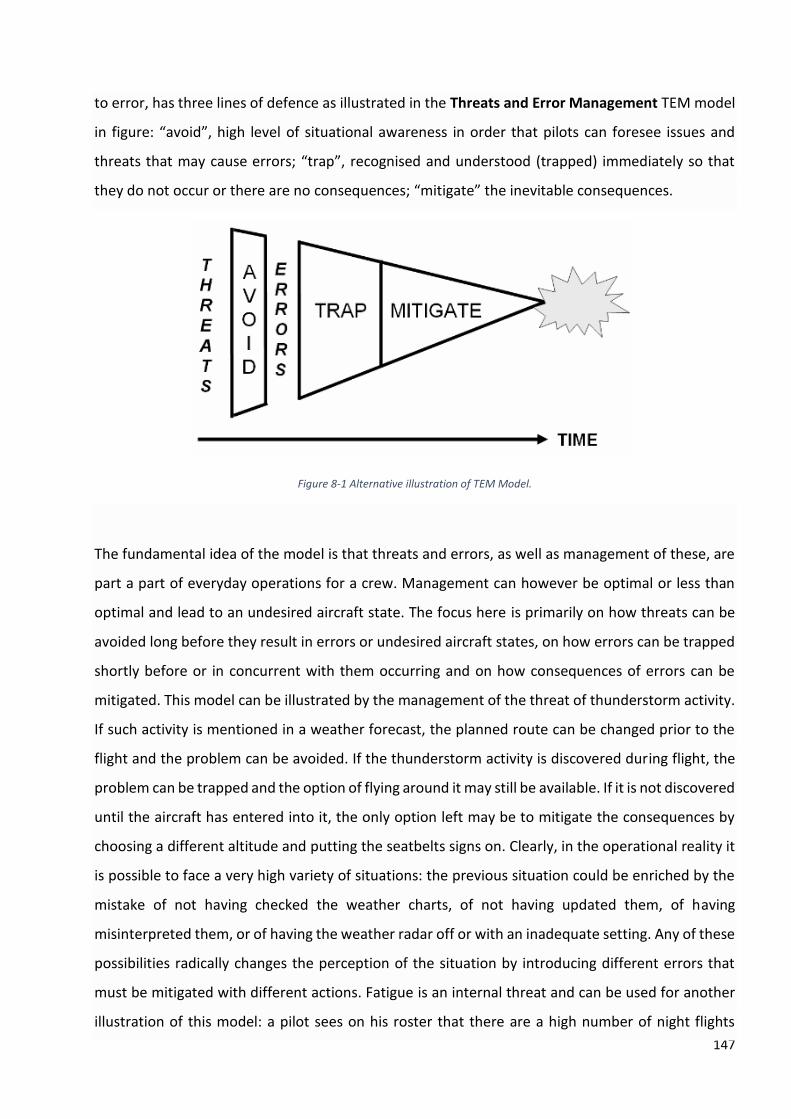
147
to error, has three lines of defence as illustrated in the Threats and Error Management TEM model
in figure: “avoid”, high level of situational awareness in order that pilots can foresee issues and
threats that may cause errors; “trap”, recognised and understood (trapped) immediately so that
they do not occur or there are no consequences; “mitigate” the inevitable consequences.
Figure 8-1 Alternative illustration of TEM Model.
The fundamental idea of the model is that threats and errors, as well as management of these, are
part a part of everyday operations for a crew. Management can however be optimal or less than
optimal and lead to an undesired aircraft state. The focus here is primarily on how threats can be
avoided long before they result in errors or undesired aircraft states, on how errors can be trapped
shortly before or in concurrent with them occurring and on how consequences of errors can be
mitigated. This model can be illustrated by the management of the threat of thunderstorm activity.
If such activity is mentioned in a weather forecast, the planned route can be changed prior to the
flight and the problem can be avoided. If the thunderstorm activity is discovered during flight, the
problem can be trapped and the option of flying around it may still be available. If it is not discovered
until the aircraft has entered into it, the only option left may be to mitigate the consequences by
choosing a different altitude and putting the seatbelts signs on. Clearly, in the operational reality it
is possible to face a very high variety of situations: the previous situation could be enriched by the
mistake of not having checked the weather charts, of not having updated them, of having
misinterpreted them, or of having the weather radar off or with an inadequate setting. Any of these
possibilities radically changes the perception of the situation by introducing different errors that
must be mitigated with different actions. Fatigue is an internal threat and can be used for another
illustration of this model: a pilot sees on his roster that there are a high number of night flights
148
scheduled during a certain period he can request a roster change to avoid problems with fatigue. If
this is not done, the pilot can trap the problem by resting before a flight (or, if possible, use
controlled rest during the flight). If the pilot gets fatigued during flight, the only remaining option
may be to mitigate the consequences, e.g. by drinking coffee.
TEM model is used or understanding events that can affect safety margins during a flight. This means
that it can be applied in several different ways, such as:
• Training: TEM linked with CRM training can orient the crew towards the areas in which it can
most effectively contribute to increasing their abilities to deal with threats and errors.
• Reporting: Reporting forms configured according to the TEM model create a structure in
which crews can describe incidents using the concepts of threats and errors, and thereby
facilitate their understanding of the events.
• Analysis: during the analysis of an occurred incident the TEM model create a structure in
which crews can describe the concepts of threats and errors, and thereby facilitate their
understanding of the events (often associated with Line Operations Safety Audit LOSA
model, that help develop countermeasures to operational errors).
A threat which is not managed properly is connected to crew error (simply since it was not properly
managed), in other words, an inappropriately managed threat constitutes a crew error. TEM errors
have precise consequences: they lead deviation from crew or organizational intentions or
expectations in term of aircraft state and corporate goal, they reduce drastically the safety margin
increasing probability of adverse operational events on the ground or during flight; errors are also
divided into a number of categories. For example, about aircraft handling one of the greater risks is
linked with automation: automation is the technology by which a process or procedure is performed
with minimal human assistance thanks to a control loop. Excluding the human element from the
chain of control has a dual effect: it streamlines operations by making them faster but makes
unplanned actions inevitable; integrate man and technology in a harmonious way, optimising the
respective strengths and weaknesses of the machine and the human element is one of the goal of
CRM. For this to happen correctly, the pilot must remain at the centre of the loop exercising the
strategic control function on the system and never lay down the reliability of the automatic system
and lose sight of the strategic goal. Threat and error management is an important element in the
training of competent pilots that can effectively manage in flight challenges. Flight crew training
stressed the importance of operational procedures and technical knowledge, with less emphasis
149
placed on nontechnical skills, which became isolated from the real-world operational contexts.
Safety training, including TEM, is important because a crew's nontechnical safety related knowledge
helps more in managing errors effectively than crews' familiarization with operations through
experience.
The bad five
Linked to the CRM there are several aspects that concern the behaviours largely conditioned by the
external situations of the moment and therefore very variable, editable by the training. Some bad
attitudes may develop, which then become character aspects, which the man/pilot will nevertheless
have to be able to control, as they are potentially dangerous for flying. The FAA has compiled a list:
• Anti-authority: the anti-authoritarian man does not like and does not need to be told
anything. Anti-authoritarian personalities tend to discard rules and regulations as not
important, or not applicable to them. And because much of the aviation industry is
regulated, this type of pilot usually doesn't get very far without someone noticing and
correcting the behaviour, because a rule-breaker attitude is unproductive (unless breaking
the rules is the right thing). In a team environment, such an attitude can spread resentment
among crew members and CRM should be considered. The idea that authority should not be
questioned can get people into trouble, and in some cases, an accident could have been
avoided if the first officer had trusted his instinct and stood up to the captain
• Impulsiveness: the impulsive must do something, anything, immediately; he does not
choose and evaluate the best of the possible alternatives to get out of an unpleasant
situation but acts according to the first thing that comes to his mind. In an aircraft, making
decisions without thinking about them can be harmful, even fatal. While decisions often
need to be made quickly in the cockpit, it is advisable to remember to slow down and make
considered and calculated decisions instead of instinctive reactions. An impulsive captain
may decide to deviate without consulting other crew members, for example he may
mistakenly identify a faulty engine and pull back the wrong thrust lever if he acts too quickly
and without thinking about what he is doing. Acting quickly can be very dangerous, especially
during flight.
150
• Invulnerability: considering himself untouchable, the invulnerable is sure that nothing will
ever happen to him, and that situations dangerous or accidents only happen to others. A
pilot who possesses the invulnerable personality trait is usually not very good at self-
assessment or risk assessment, and since he does not recognise that he is at risk, he is more
likely to push his own and others' personal limits, even ignoring the safety protocols that are
in place.
• Machism: the macho is convinced that he is the best and attempts continuously to prove it.
Macho pilots like attention and are a little too eager to demonstrate their piloting skills, so
they might take off in bad weather or delay the spin recovery to try and prove their skills.
They are often noisy, but also a shy pilot can be just as macho as anyone else. A pilot who is
susceptible to the type of macho personality should be careful to avoid competing with
others and should realise that taking risks is often a good way to embarrass yourself.
• Renunciation: the resigned person feels that he cannot influence what is happening, that
any things he does he cannot correct a mistake. Pilots who have the attitude of resignation
considers himself to be either lucky or unlucky, takes no initiative, leaves himself overwhelm
by events and give up easily. Giving up is perhaps the worst of dangerous attitudes. Nobody
wants to be on a plane with a pilot who, at the first sign of trouble, raises his arms and
resigns. Giving up or quitting during an emergency is probably the worst thing a pilot can do.
CRM Teamwork
Teamwork requires group members to cooperate in order to accomplish common goals. About the
definition, a working team is a group of individuals working towards a known and shared common
goal with specific tasks and complementary roles providing each other with mutual support; it needs
a pre-established organisation with accepted rules, defined roles and operational hierarchy. Goal
accomplishment requires someone called "leader” to identify what the goals are and at least one
other person, or group of follower people, to perform tasks that will achieve the established goals.
The leader exerts a certain influence on his subordinates: influence is defined as the ability of
someone or something to produce a compelling force that alters the behaviour or opinions of
others. In some leadership settings, influence stems directly from a person's interplay position of
authority, as designated by institutional hierarchy, and can be used to prompt behaviour in others
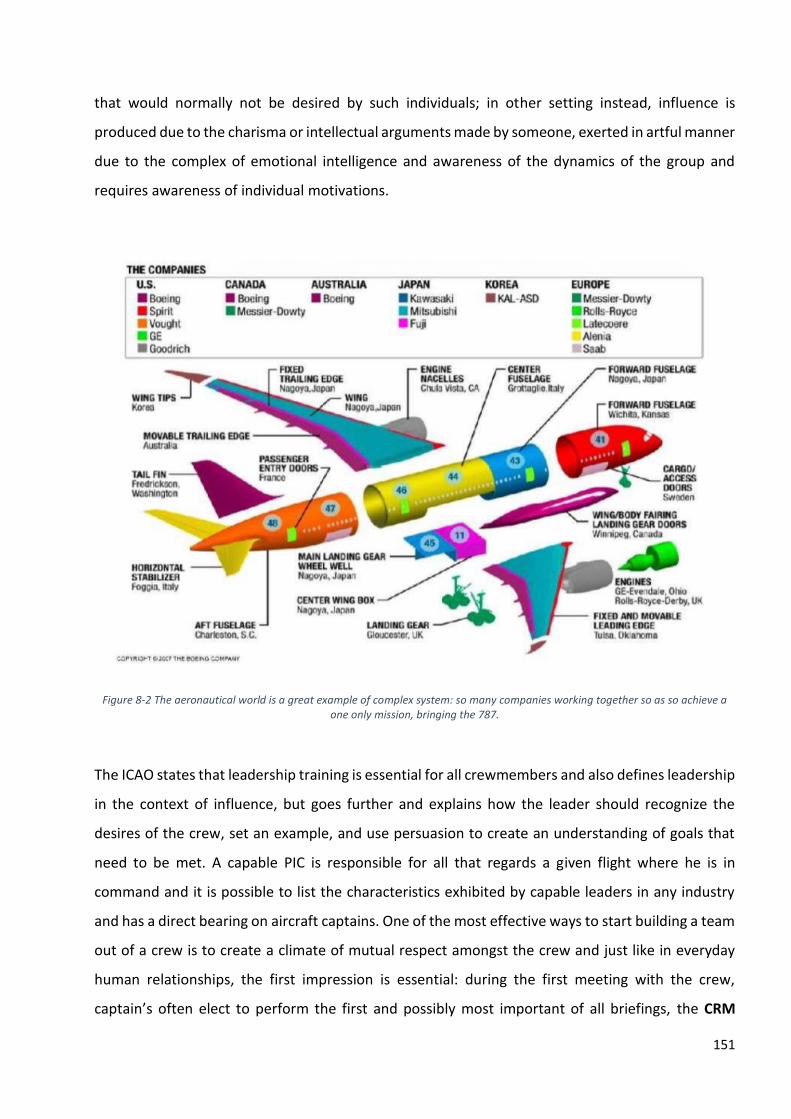
151
that would normally not be desired by such individuals; in other setting instead, influence is
produced due to the charisma or intellectual arguments made by someone, exerted in artful manner
due to the complex of emotional intelligence and awareness of the dynamics of the group and
requires awareness of individual motivations.
Figure 8-2 The aeronautical world is a great example of complex system: so many companies working together so as so achieve a one only mission, bringing the 787.
The ICAO states that leadership training is essential for all crewmembers and also defines leadership
in the context of influence, but goes further and explains how the leader should recognize the
desires of the crew, set an example, and use persuasion to create an understanding of goals that
need to be met. A capable PIC is responsible for all that regards a given flight where he is in
command and it is possible to list the characteristics exhibited by capable leaders in any industry
and has a direct bearing on aircraft captains. One of the most effective ways to start building a team
out of a crew is to create a climate of mutual respect amongst the crew and just like in everyday
human relationships, the first impression is essential: during the first meeting with the crew,
captain’s often elect to perform the first and possibly most important of all briefings, the CRM
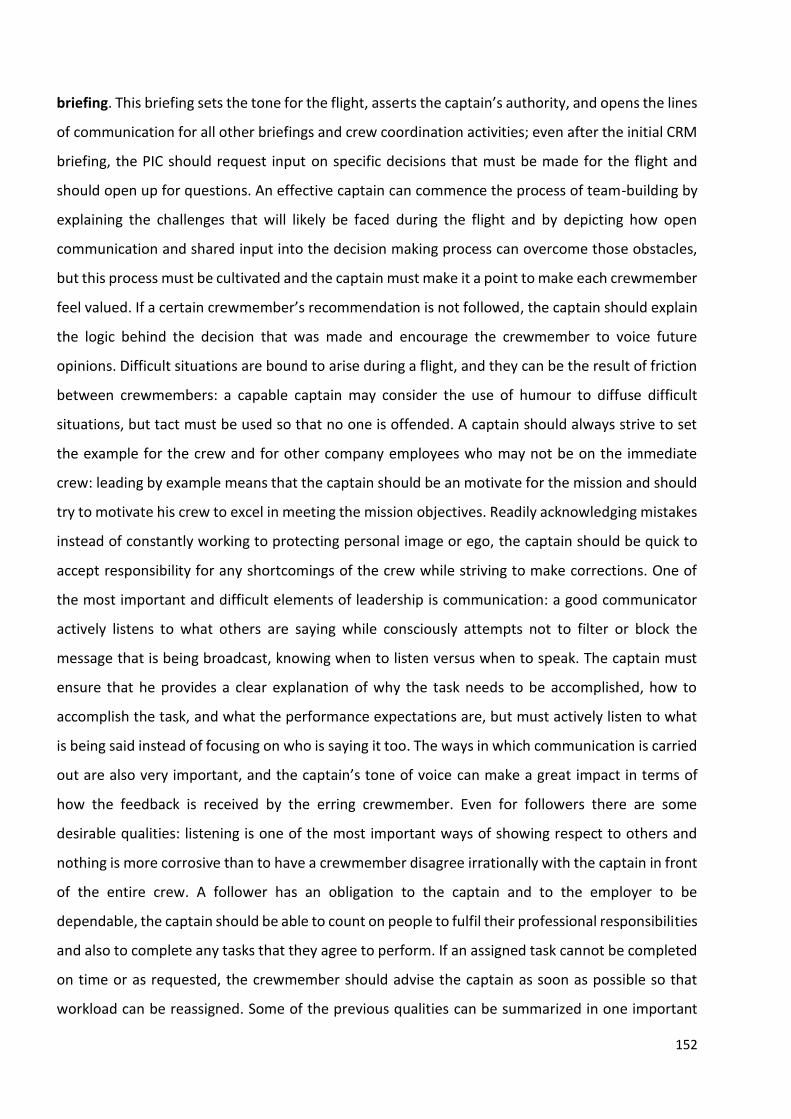
152
briefing. This briefing sets the tone for the flight, asserts the captain’s authority, and opens the lines
of communication for all other briefings and crew coordination activities; even after the initial CRM
briefing, the PIC should request input on specific decisions that must be made for the flight and
should open up for questions. An effective captain can commence the process of team-building by
explaining the challenges that will likely be faced during the flight and by depicting how open
communication and shared input into the decision making process can overcome those obstacles,
but this process must be cultivated and the captain must make it a point to make each crewmember
feel valued. If a certain crewmember’s recommendation is not followed, the captain should explain
the logic behind the decision that was made and encourage the crewmember to voice future
opinions. Difficult situations are bound to arise during a flight, and they can be the result of friction
between crewmembers: a capable captain may consider the use of humour to diffuse difficult
situations, but tact must be used so that no one is offended. A captain should always strive to set
the example for the crew and for other company employees who may not be on the immediate
crew: leading by example means that the captain should be an motivate for the mission and should
try to motivate his crew to excel in meeting the mission objectives. Readily acknowledging mistakes
instead of constantly working to protecting personal image or ego, the captain should be quick to
accept responsibility for any shortcomings of the crew while striving to make corrections. One of
the most important and difficult elements of leadership is communication: a good communicator
actively listens to what others are saying while consciously attempts not to filter or block the
message that is being broadcast, knowing when to listen versus when to speak. The captain must
ensure that he provides a clear explanation of why the task needs to be accomplished, how to
accomplish the task, and what the performance expectations are, but must actively listen to what
is being said instead of focusing on who is saying it too. The ways in which communication is carried
out are also very important, and the captain’s tone of voice can make a great impact in terms of
how the feedback is received by the erring crewmember. Even for followers there are some
desirable qualities: listening is one of the most important ways of showing respect to others and
nothing is more corrosive than to have a crewmember disagree irrationally with the captain in front
of the entire crew. A follower has an obligation to the captain and to the employer to be
dependable, the captain should be able to count on people to fulfil their professional responsibilities
and also to complete any tasks that they agree to perform. If an assigned task cannot be completed
on time or as requested, the crewmember should advise the captain as soon as possible so that
workload can be reassigned. Some of the previous qualities can be summarized in one important
153
quality exhibited through teamwork: a sense of ownership over the profession, the company, and
each flight people are involved in. Such a responsibility is a matter of pride and comes from the
realization that each of our actions impacts the bottom-line of an operation. An example of
ownership is the flight attendant who notices trash on the jetway when getting ready to board the
aircraft and takes the time to remove the trash so that passengers do not see it. Another example
is the first officer who stays behind for an extra minute after a long days’ worth of flying to ensure
that the cockpit is left in a clean and organized fashion.
Teamwork enhances the crew problem solving capability in dealing with normal, abnormal and
emergency situations: it allows the optimum use of all the crew resources. The flight crew is
considered to be the last link in the error chain, but it is also the last line-of-defence and company
safety culture and policies should therefore support the implementation of CRM practices, facilitate
the mitigation of organizational factors and, identify and address precursors of potential incidents
or accidents. Because CRM practices are a key factor in flight crew adherence to and performance
of normal and non-normal procedures and in the interaction with automated systems, CRM issues
are involved to some degree in every incident or accident.
CRM Skills List
Communication Teamwork Task Management
Effective Briefing Sets open tone, seeks input Outlines Plan Allocated Task
Leadership Balance Authority & Assertiveness Uses all available resources Sets high standards
Prep, Planning, Execution Plans & Stays ahead Maintains Situational Awareness Changes plan if needed
Inter Personal Shares Information Suggests Ideas Speaks assertively when needed
Followership Actively monitors & taken part Backs up & supports Prompts appropriately & well
Workload Management Recognises overload in self & others Avoids distraction Takes time
Methods Actively listens Shows & checks understanding Shares assessment/ Mental Model
Crew Relations Tone friendly & relaxed Manages conflicts Adapts to other
Decisions Identifies problems correctly Involves others Evaluates
Table 8-1 CRM Skills List.
154
Complacency
One of the main risks in automation is complacency, the sense of being satisfied, secured and
contented unaware of the potential danger actions made could bring. It arises when one becomes
very familiar with the work he is doing that it becomes repetitive, monotonous and robotic. In
aviation, complacency has been a major concern and is, time and again, a major contributing factor
in many unwarranted accidents caused basically by human factors. Typical situations in which it
occurs task induced complacency: facing routine operation; after a high key period of intense,
mental stimulating and skill induced workload; when vigilance is reduced significantly, and guard is
let down; during large volume of workload. As therefore it appears obvious, fatigue and
complacency are strongly linked. When faced either with fatigue, stress due to external factors such
as insufficient sleep and circadian disruption, people become complacent and start beginning to
see or hear what he expects to see or hear at a given scenario instead of what is actually transpiring
in the real time scenario; this quickly leads to loss of situational awareness. Complacency posts
potential threat that should be given significant emphasis. Take the case of an aircraft maintenance
crew who does checks on aircraft. Every night he should check the aircraft's hydraulic oil: he knows
that the hydraulic oil normally lasts for a week before refilling, but what he doesn’t know is that
there was already a leak that caused an engine inflight shutdown. So, he skips the process unaware
because he has become complacent, triggering the accident. Following correct routine checks,
manuals and standard procedures guarantees safe flight: CRM is a matter of mindset and attitude,
and a key attitude is not to take anything for granted.
CRM Examples
The basic concepts and ideology that make CRM successful with aviation air crews have also proven
successful with other related career fields, for example in firefighting application, but it’s the
aeronautical sector where it has given the most positive results as these situational examples
suggest:
155
Qantas flight 32
On 4 November 2010, while climbing through 7,000 ft after departing from Changi Airport,
Singapore, the Airbus A380 registered VH-OQA, sustained an uncontained engine rotor failure UERF
of the No. 2 engine, a Rolls-Royce Trent 900. The flight crew heard two bangs and a multitude of
warnings and cautions were displayed on the electronic centralised aircraft monitor ECAM. Debris
from the UERF impacted the aircraft, resulting in significant structural and systems damage even a
wing penetration with the hole visible from the windows. In this case, expert use to say that a black
swan event is occurred, an improbable event that can only be guessed at and causes massive
consequences. After assessing the situation and completing a number of initial response actions,
the flight crew was cleared by ATC to conduct a holding pattern to the east of Changi Airport. While
in the holding pattern, the flight crew worked through the procedures relevant to the messages
displayed by the ECAM. During that time the flight crew was assisted by an additional crew that
were on the flight deck as part of a check and training exercise. But this uncontained engine failure
did not precipitate a catastrophic accident, thanks to the work of a united team: the aircraft made
a successful emergency landing at Changi after two hours from its departure. The captain of the
flight was Richard de Crespigny and detailed the accident during a safety seminar in Singapore in
November 2011. At the time of the accident he had 35 years of flying experience. First of all, Captain
de Crespigny argues that he would have not been able to safely land the crippled plane and save all
the passengers without the help of his team in the cockpit, but also without the help of the flight
attendants who were able to keep everyone calm and prevent panic from spreading. Thanks to CRM,
the captain was able to delegate tasks to his flight crew, thus giving his undivided attention to the
problem at hand. The captain is responsible for making the decisions, but he is supported by the
input from the entire crew, both those individuals in the cockpit but also on the ground (air traffic
control, dispatch, maintenance). Crews that work effectively can make better decisions than
individuals because the multiple eyes, ears, hands, and minds can increase their cognitive capacity
and crews can offer multiple options, share workload, and often avoid traps to which individuals are
often susceptible.
US Airways flight 1549
On January 15, 2009 US Airways Flight 1549 departed LaGuardia Airport heading to Charlotte
Douglas International Airport. Less than 2 minutes after take-off, the captain told the control tower
there was an emergency: multiple birdstike and a double ingestion were reported. The first officer
156
was controlling the aircraft. Captain Chesley Sullenberger (29 years of service) took over control of
the airplane and radio communications. With both engines dead and unable to complete the engine
dual failure checklist, the captain started the auxiliary power unit and took control of the aircraft.
Initially, he informed the control tower of his intent to return to LaGuardia; however, he quickly
realized that he was unable to return to the runway and informed the controller that he had no
other alternative but to land on the Hudson River. So, the flight crew decided that an emergency
landing in the Hudson River was necessary. Due to expert crew performance all 155 people aboard
survived the 5 min flight. Analyses from airplane accidents show that failures frequently are related
to pilots’ nontechnical and communications skills rather than to technical flying abilities or to aircraft
malfunctions: to improve this skills CRM training is needed and all crew members of Flight 1549 had
annual training in CRM while PIC Sullenberger had made extensive academic study in this area. The
flight crew avoided violations and procedural errors by following established protocols assiduously
completing all the checklist, that have been used to enhance safety in the aviation industry for many
years, providing clear structure in complex environments. The crew avoided communication errors
by use of the command voice and calling back important communique´s. Faulty communication is a
key area that CRM: errors are mainly due to the hierarchical chain which tends to discourage
appropriate communication and interruptions. Through CRM, pilots are taught methods of limiting
and dealing with interruptions. Skill-based, rule-based, knowledge-based and decisional errors were
avoided due to the simulation training the crew had undergone and the many hours of flying they
had logged, in order to evaluate skill retention and prevent skill decay. Both the captain and the first
officer of Flight 1549 had logged many hours on a cockpit simulator of the Airbus 320 aircraft they
were piloting. They had practiced standard flights as well as emergency scenarios. In addition to
dealing with errors, an effective team leader is responsible for managing information, equipment,
and people; however, without effective leadership, emergency response can be chaotic and
haphazard.
157
Chapter 9 The Model
The following chapter aims to create a model for a qualitative analysis of the phenomenon of
lowering the safety margin when performing high workload tasks. Independently from the field to
which it is applied, the final output of the first operation of the model will be constituted by a safety
margin D obtained as difference of the two curves as in the above graphs: from this moment on,
explanatory and simpler graphs, obtained on Matlab, will be used.
In the graph shown below, it is possible to notice the presence of the classic two curves: the blue
curve represents the human capabilities available in terms of performance, which, as evidenced,
decrease with time as the operator becomes fatigued; the red curve instead represents the task
demand related to a task to be performed whose characteristic in this case is a growing difficulty
request over time, as can be for example a prize game in which the questions at the beginning are
of medium to low difficulty, and then become more and more difficult towards the final question.
A parabolic trend of the curves has been simulated in order to emphasize, beyond a certain point in
time axe, an area of the diagram where the safety margin 𝐷(𝑡) is sufficiently reduced. There is a
zone of the diagram in which this margin is reduced considerably until it changes sign and becomes
negative; it is clear that the zone of the diagram in which the task demand exceeds the available
performance is completely meaningless because In this case the operator fails to perform the task
that is too complicated, or if he wants to try anyway surely he will make a mistake. The lower the 𝐷
margin, the more the operator is unable to perform the task safely, the error rate rises and the
operation must be stopped in order not to compromise safety. Therefore, the aim is to ensure that
the value of 𝐷 is kept strictly positive and higher than a reference value: due to the qualitative
nature of the analysis and the extreme variability that makes two different tasks incontestable, the
safety margin at the initial time 𝐷0 is taken as the reference value. The value of 𝐷 varies punctually
and it decreases from the initial value to its minimum during the operating time.
When D is positive and higher than a predetermined threshold, then we can consider the task as
safely performed; beyond that threshold the difference between the task demand and required is
closer to zero, so it is reasonable to think that as a result of fluctuations of the workload, sometimes
unpredictable, the operator will be overloaded.
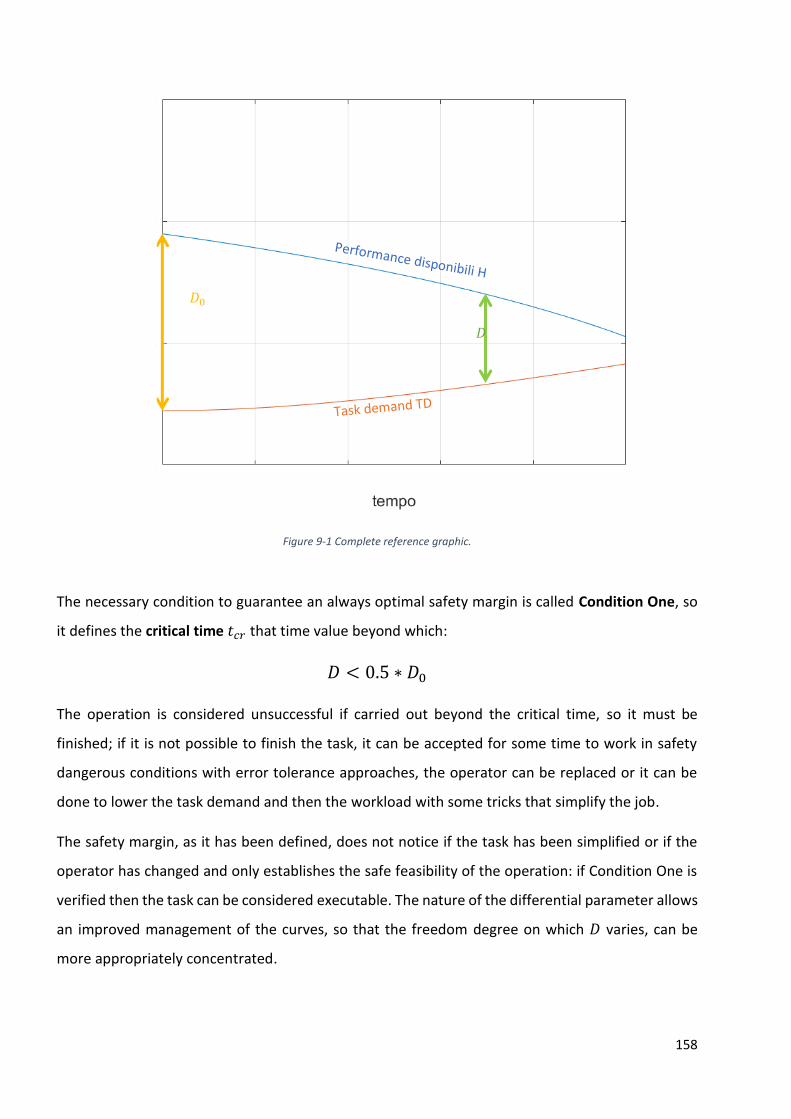
158
Figure 9-1 Complete reference graphic.
The necessary condition to guarantee an always optimal safety margin is called Condition One, so
it defines the critical time 𝑡𝑐𝑟 that time value beyond which:
𝐷 < 0.5 ∗ 𝐷0
The operation is considered unsuccessful if carried out beyond the critical time, so it must be
finished; if it is not possible to finish the task, it can be accepted for some time to work in safety
dangerous conditions with error tolerance approaches, the operator can be replaced or it can be
done to lower the task demand and then the workload with some tricks that simplify the job.
The safety margin, as it has been defined, does not notice if the task has been simplified or if the
operator has changed and only establishes the safe feasibility of the operation: if Condition One is
verified then the task can be considered executable. The nature of the differential parameter allows
an improved management of the curves, so that the freedom degree on which 𝐷 varies, can be
more appropriately concentrated.
𝐷0
𝐷
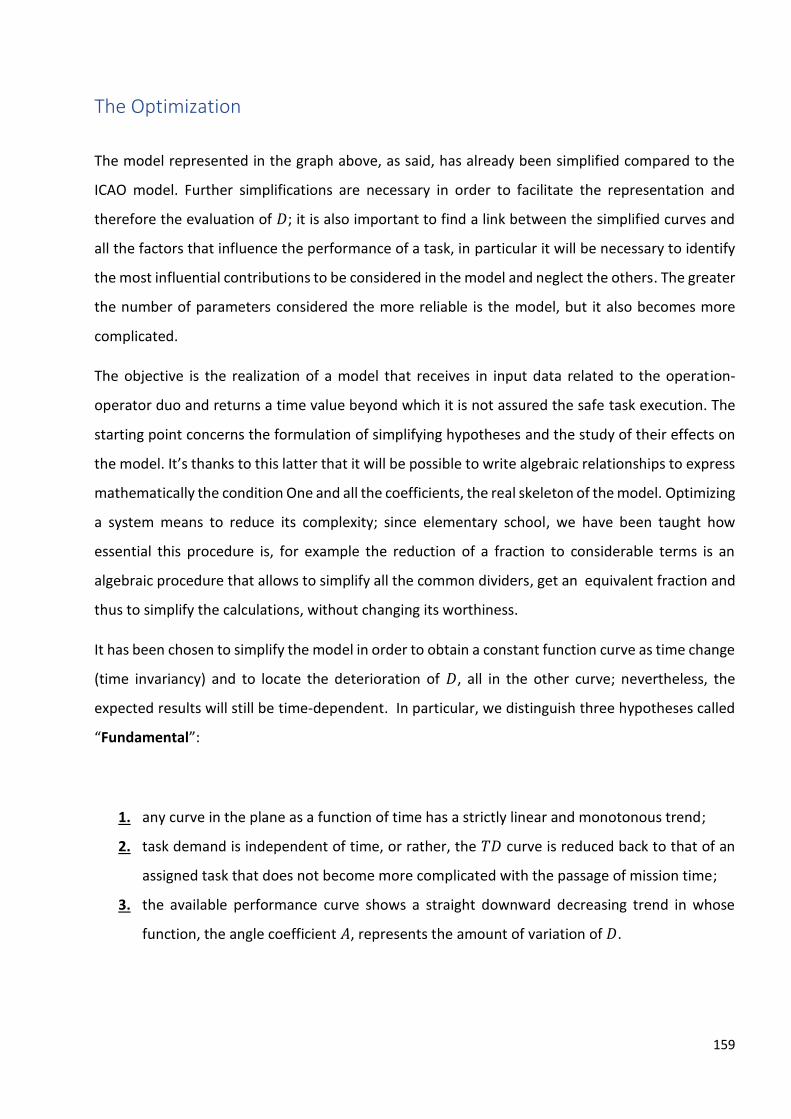
159
The Optimization
The model represented in the graph above, as said, has already been simplified compared to the
ICAO model. Further simplifications are necessary in order to facilitate the representation and
therefore the evaluation of 𝐷; it is also important to find a link between the simplified curves and
all the factors that influence the performance of a task, in particular it will be necessary to identify
the most influential contributions to be considered in the model and neglect the others. The greater
the number of parameters considered the more reliable is the model, but it also becomes more
complicated.
The objective is the realization of a model that receives in input data related to the operation-
operator duo and returns a time value beyond which it is not assured the safe task execution. The
starting point concerns the formulation of simplifying hypotheses and the study of their effects on
the model. It’s thanks to this latter that it will be possible to write algebraic relationships to express
mathematically the condition One and all the coefficients, the real skeleton of the model. Optimizing
a system means to reduce its complexity; since elementary school, we have been taught how
essential this procedure is, for example the reduction of a fraction to considerable terms is an
algebraic procedure that allows to simplify all the common dividers, get an equivalent fraction and
thus to simplify the calculations, without changing its worthiness.
It has been chosen to simplify the model in order to obtain a constant function curve as time change
(time invariancy) and to locate the deterioration of 𝐷, all in the other curve; nevertheless, the
expected results will still be time-dependent. In particular, we distinguish three hypotheses called
“Fundamental”:
1. any curve in the plane as a function of time has a strictly linear and monotonous trend;
2. task demand is independent of time, or rather, the 𝑇𝐷 curve is reduced back to that of an
assigned task that does not become more complicated with the passage of mission time;
3. the available performance curve shows a straight downward decreasing trend in whose
function, the angle coefficient 𝐴, represents the amount of variation of 𝐷.
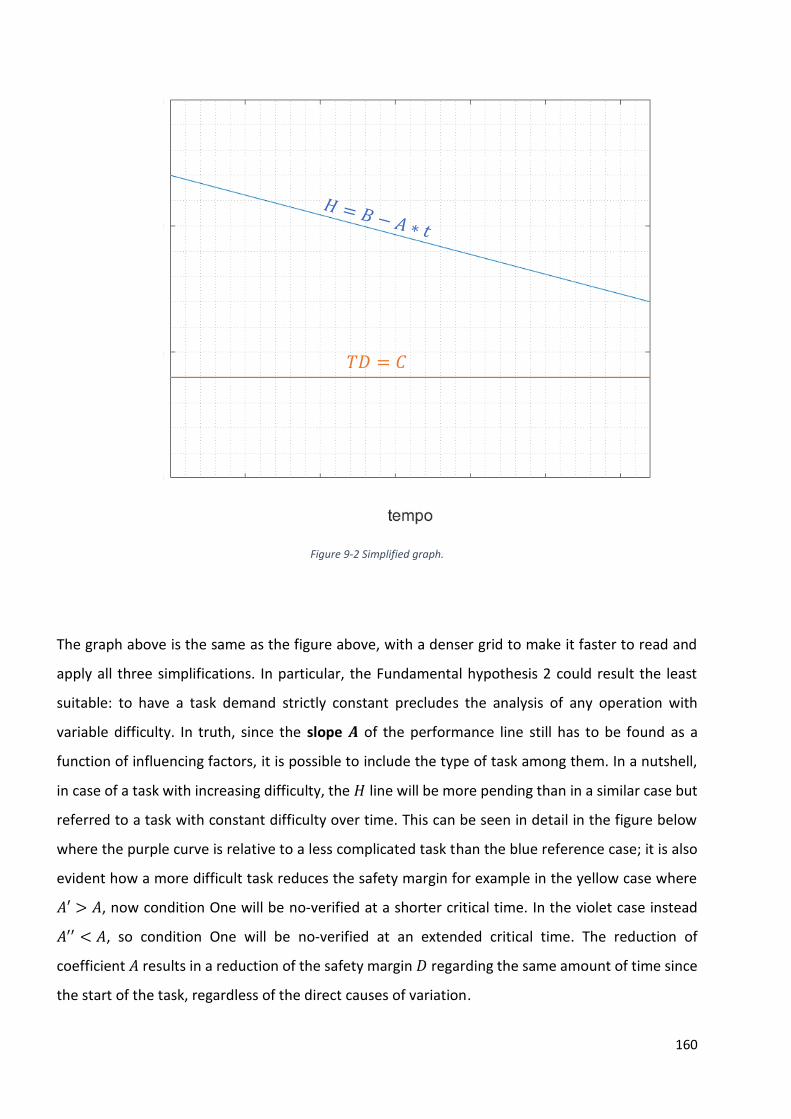
160
Figure 9-2 Simplified graph.
The graph above is the same as the figure above, with a denser grid to make it faster to read and
apply all three simplifications. In particular, the Fundamental hypothesis 2 could result the least
suitable: to have a task demand strictly constant precludes the analysis of any operation with
variable difficulty. In truth, since the slope 𝑨 of the performance line still has to be found as a
function of influencing factors, it is possible to include the type of task among them. In a nutshell,
in case of a task with increasing difficulty, the 𝐻 line will be more pending than in a similar case but
referred to a task with constant difficulty over time. This can be seen in detail in the figure below
where the purple curve is relative to a less complicated task than the blue reference case; it is also
evident how a more difficult task reduces the safety margin for example in the yellow case where
𝐴′ > 𝐴, now condition One will be no-verified at a shorter critical time. In the violet case instead
𝐴′′ < 𝐴, so condition One will be no-verified at an extended critical time. The reduction of
coefficient 𝐴 results in a reduction of the safety margin 𝐷 regarding the same amount of time since
the start of the task, regardless of the direct causes of variation.
𝑇𝐷 = 𝐶
161
Figure 9-3 Variation of A term with task demand.
From the above it is easy to understand how the precise location of the influencing factors is
irrelevant for the calculation of the D margin and therefore the difference in the curves: the
simplified graph and the one shown below are completely equivalent and have the same 𝑫𝟎.
Obviously, the coefficients of the curves have been consistently compared and calculated in a similar
way. Both cases are representative of the same operator performing the same task, but on the one
hand the variability about operator conditions and task difficulty over time have all been
summarized in the H curve and on the other in the 𝑻𝑫 curve. This is even truer according to the
new Fundamental hypothesis 4:
4.
𝐷0 = 𝐵 − 𝐶
𝑇𝐷 = 𝐶
𝐷0
𝐷1(𝑡_𝑐𝑟)
𝐷(𝑡_𝑐𝑟)
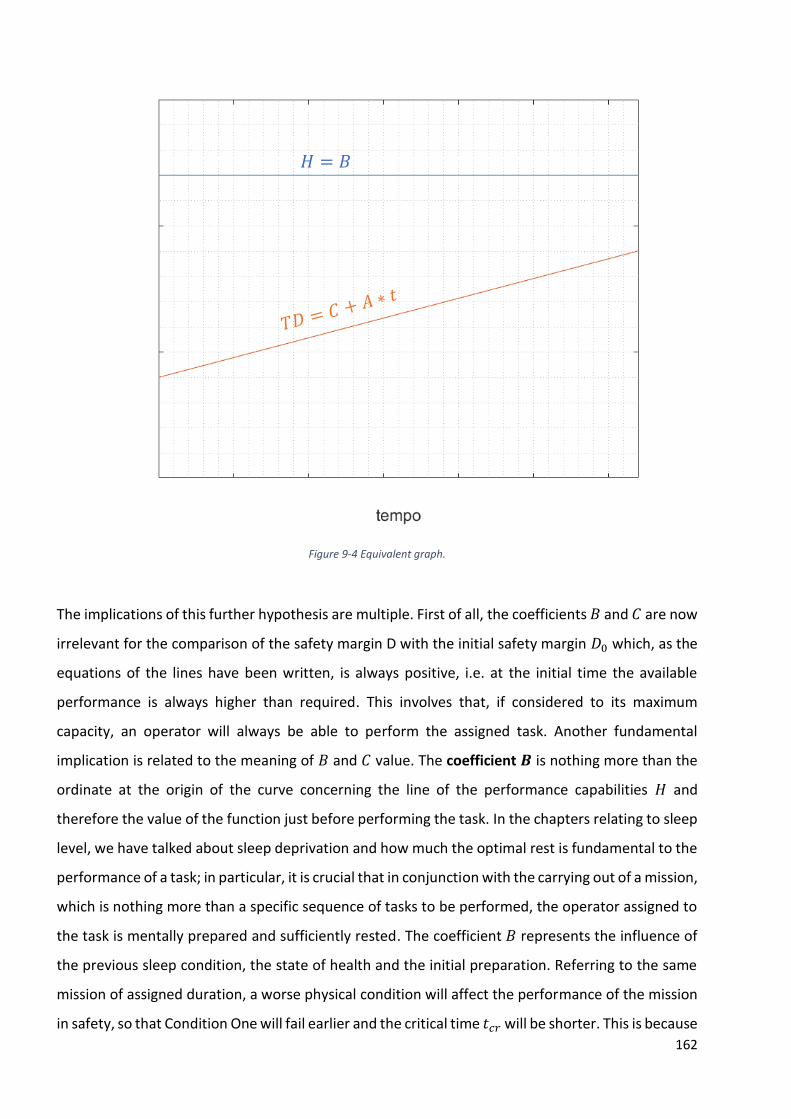
162
Figure 9-4 Equivalent graph.
The implications of this further hypothesis are multiple. First of all, the coefficients 𝐵 and 𝐶 are now
irrelevant for the comparison of the safety margin D with the initial safety margin 𝐷0 which, as the
equations of the lines have been written, is always positive, i.e. at the initial time the available
performance is always higher than required. This involves that, if considered to its maximum
capacity, an operator will always be able to perform the assigned task. Another fundamental
implication is related to the meaning of 𝐵 and 𝐶 value. The coefficient 𝑩 is nothing more than the
ordinate at the origin of the curve concerning the line of the performance capabilities 𝐻 and
therefore the value of the function just before performing the task. In the chapters relating to sleep
level, we have talked about sleep deprivation and how much the optimal rest is fundamental to the
performance of a task; in particular, it is crucial that in conjunction with the carrying out of a mission,
which is nothing more than a specific sequence of tasks to be performed, the operator assigned to
the task is mentally prepared and sufficiently rested. The coefficient 𝐵 represents the influence of
the previous sleep condition, the state of health and the initial preparation. Referring to the same
mission of assigned duration, a worse physical condition will affect the performance of the mission
in safety, so that Condition One will fail earlier and the critical time 𝑡𝑐𝑟 will be shorter. This is because
𝐻 = 𝐵
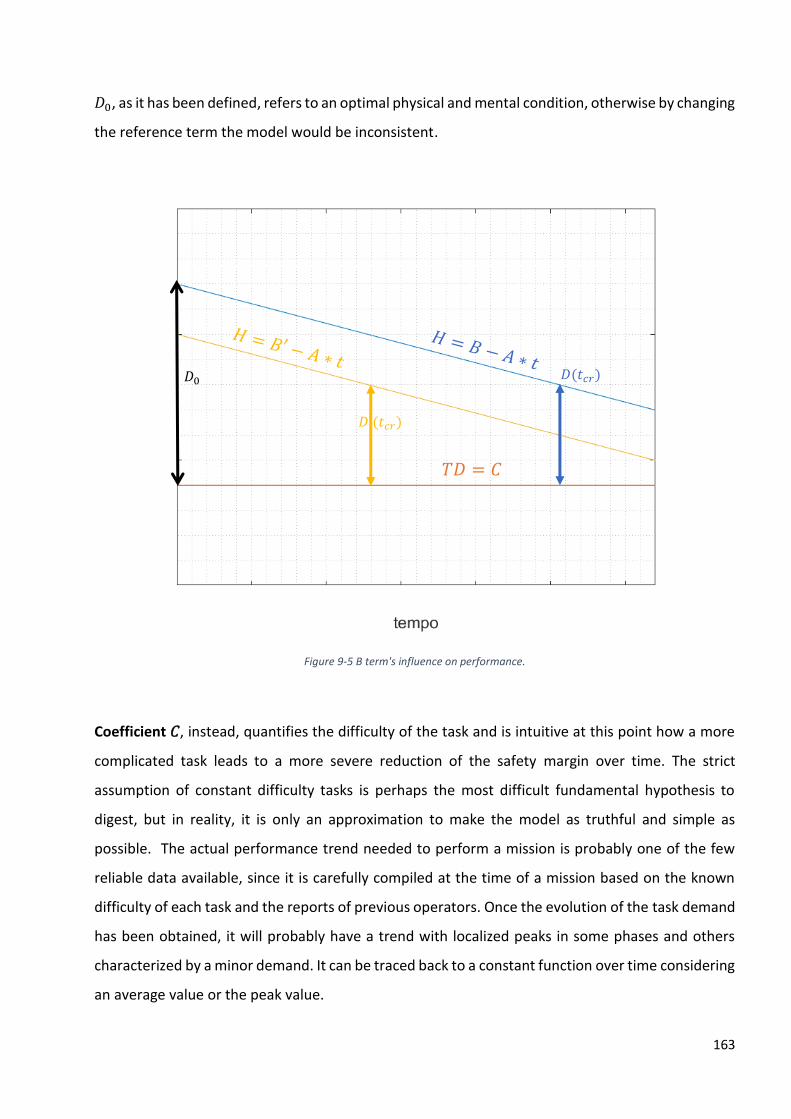
163
𝐷0, as it has been defined, refers to an optimal physical and mental condition, otherwise by changing
the reference term the model would be inconsistent.
Figure 9-5 B term's influence on performance.
Coefficient 𝐶, instead, quantifies the difficulty of the task and is intuitive at this point how a more
complicated task leads to a more severe reduction of the safety margin over time. The strict
assumption of constant difficulty tasks is perhaps the most difficult fundamental hypothesis to
digest, but in reality, it is only an approximation to make the model as truthful and simple as
possible. The actual performance trend needed to perform a mission is probably one of the few
reliable data available, since it is carefully compiled at the time of a mission based on the known
difficulty of each task and the reports of previous operators. Once the evolution of the task demand
has been obtained, it will probably have a trend with localized peaks in some phases and others
characterized by a minor demand. It can be traced back to a constant function over time considering
an average value or the peak value.
𝐷0
𝑇𝐷 = 𝐶
𝐷(𝑡𝑐𝑟)
𝐷′(𝑡𝑐𝑟)
164
By concentrating the two coefficients in 𝐷0, the parameters necessary for verifying condition One
are reduced to two. Just as the functions of the lines of the model have been written, condition
One changes:
𝐷(𝑡) = (𝐻(𝑡)) − (𝑇𝐷);
𝐷(𝑡) = (𝐵 − 𝐴 ∗ 𝑡) − 𝐶;
𝐷(𝑡) = 𝐷0 − 𝐴 ∗ 𝑡;
𝐷(𝑡) < 0.5 ∗ 𝐷0
𝐴 ∗ 𝑡 > 0.5 ∗ 𝐷0;
The term 𝐷0 is the reference value, a function of the health condition of the operator as well as any
previous sleep deprivation, altered mental state or illness, but also of the type of task that has been
assigned. The more difficult a task is, the greater the hours of sleep deprived of the operator, the
smaller 𝐷0 is and the sooner the operator will leave the work safely area. It is a characteristic feature
which represents the excess in terms of available performance that allows the task to be performed;
in the case a mission composed of several consecutive tasks is analysed, the initial safety margin of
a (n)-th phase is equal to the output, again in terms of safety margin, of the (n-1)-th phase. As a
function of the 𝐵 and 𝐶 coefficients, which are unique for each operation-operator pair, 𝐷0 must
also be evaluated for each condition. In order to further simplify the analysis, it will always be
considered an initial excellent condition of the operator who appears in this way alert and alert, as
well as perfectly able to perform the task. In this way, 𝐷0 can be simply traced back to the operation
that is performed according to a set of tabulated values and task difficulty function. The greater the
reference, the longer the time between the start of the task and the critical time 𝑡𝑐𝑟. The latter
represents the time value that corresponds to the exit from Condition One, and therefore the work
in total safety. Clearly, due to the random nature of the phenomenon will not correspond to a
precise time instant, but rather to a time interval that depends on the mission itself; if we consider
missions of short duration (< 6 hours) all the analysis loses meaning because it is reasonable to think,
given the assumptions about the initial state of the operator, that he is able for the duration of the
165
mission to work safely and not exceed its limits. In other words, the critical time is greater than the
duration of the mission. For missions of long duration (> 15 hours), the analysis through the model
object of the report allows you to derive through the limit condition One, the critical time:
𝑡𝑐𝑟 = 0.5 ∗𝐷0
𝐴
To be therefore interpreted as a time interval, with initial reference to the beginning of the mission,
and once exceeded it, it's no longer possible to ensure the carrying out of the mission in totally
safety.
The angular coefficient A of the curve H is, in relation to the curves in the graph, a positive number.
It can be defined as the sum of the contributors penalizing the subject and affecting the state of
alert and performance. All the factors that have been mentioned in the previous paragraphs have
an impact on this coefficient, leading to increase it: the fatigue of the pilot, a disturbing environment
and an excessive workload. In their totality as we have seen they are complex phenomena and
above all characterized by a very high variability linked also to the limits of personal tolerability.
About the level of sleep, the rate at which the operator gets tired will depend on the circadian cycle,
therefore on the adaptation of the internal clock to environmental stimuli; the external
environment will negatively affect performance, think about the performance of a task in a poorly
lit, excessively noisy work environment; finally, the workload will depend on the type of task
assigned and, with reference to aeronautics, in an LTO mission, it will be greater (with consequent
reduction of the safety margin) in the manual flight phases, while during the cruise flight other
factors such as boredom will come into play, with common result a reduction in performance
capabilities. The possible loss of control of the situation is always around the corner when driving
an airplane and pilots must deal with these unpredictable factors every day... at an altitude of
30,000 ft!
For the purpose of writing an expression of the coefficient A, it will be necessary to identify the most
significant contributions: the type of task, as well as the time and place of its performance, heavily
influence the choice of influencing factors.
Think about a specific mission: piloting a rescue helicopter on a hot summer day. The pilot is well
rested and prepared, flies from one point to another continuously, performing a series of take-off-
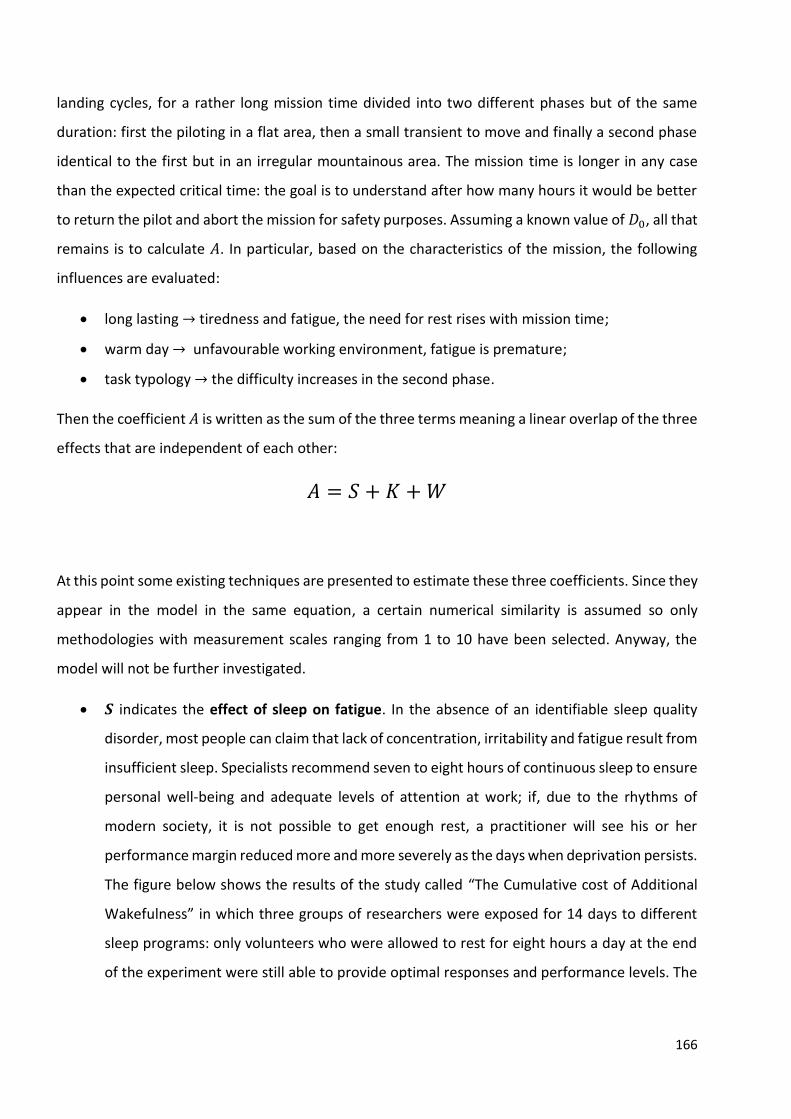
166
landing cycles, for a rather long mission time divided into two different phases but of the same
duration: first the piloting in a flat area, then a small transient to move and finally a second phase
identical to the first but in an irregular mountainous area. The mission time is longer in any case
than the expected critical time: the goal is to understand after how many hours it would be better
to return the pilot and abort the mission for safety purposes. Assuming a known value of 𝐷0, all that
remains is to calculate 𝐴. In particular, based on the characteristics of the mission, the following
influences are evaluated:
• long lasting → tiredness and fatigue, the need for rest rises with mission time;
• warm day → unfavourable working environment, fatigue is premature;
• task typology → the difficulty increases in the second phase.
Then the coefficient 𝐴 is written as the sum of the three terms meaning a linear overlap of the three
effects that are independent of each other:
𝐴 = 𝑆 + 𝐾 + 𝑊
At this point some existing techniques are presented to estimate these three coefficients. Since they
appear in the model in the same equation, a certain numerical similarity is assumed so only
methodologies with measurement scales ranging from 1 to 10 have been selected. Anyway, the
model will not be further investigated.
• 𝑺 indicates the effect of sleep on fatigue. In the absence of an identifiable sleep quality
disorder, most people can claim that lack of concentration, irritability and fatigue result from
insufficient sleep. Specialists recommend seven to eight hours of continuous sleep to ensure
personal well-being and adequate levels of attention at work; if, due to the rhythms of
modern society, it is not possible to get enough rest, a practitioner will see his or her
performance margin reduced more and more severely as the days when deprivation persists.
The figure below shows the results of the study called “The Cumulative cost of Additional
Wakefulness” in which three groups of researchers were exposed for 14 days to different
sleep programs: only volunteers who were allowed to rest for eight hours a day at the end
of the experiment were still able to provide optimal responses and performance levels. The
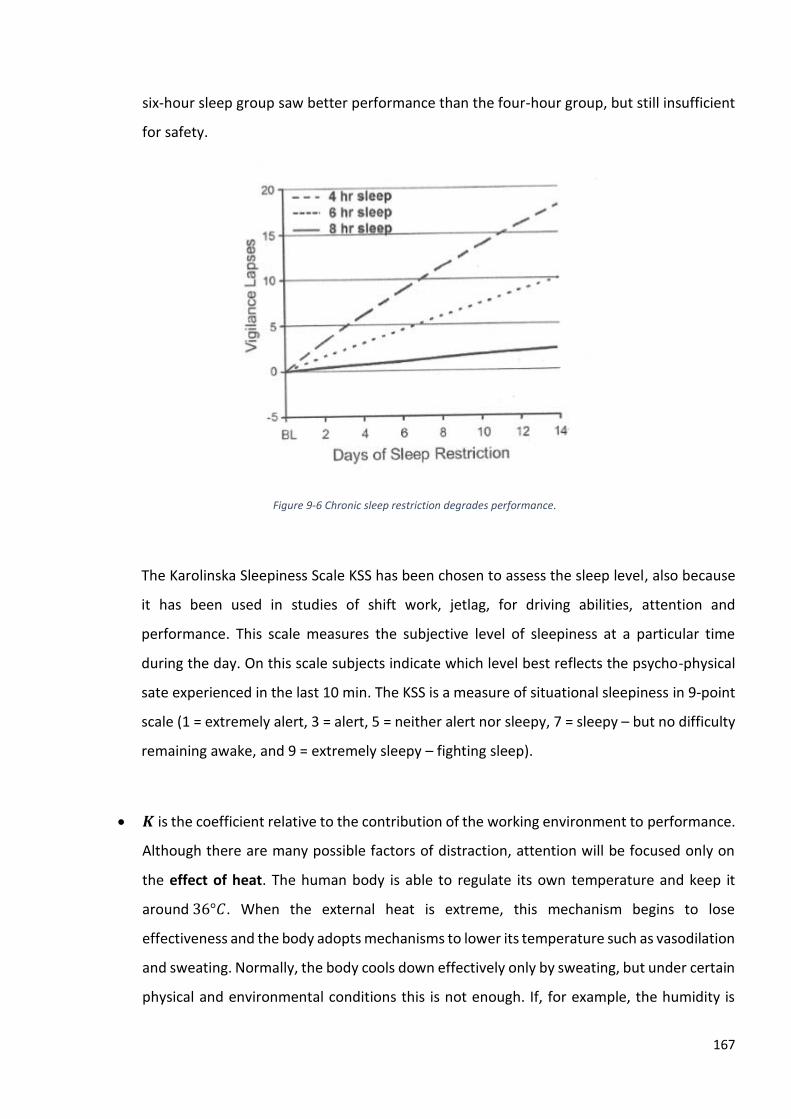
167
six-hour sleep group saw better performance than the four-hour group, but still insufficient
for safety.
Figure 9-6 Chronic sleep restriction degrades performance.
The Karolinska Sleepiness Scale KSS has been chosen to assess the sleep level, also because
it has been used in studies of shift work, jetlag, for driving abilities, attention and
performance. This scale measures the subjective level of sleepiness at a particular time
during the day. On this scale subjects indicate which level best reflects the psycho-physical
sate experienced in the last 10 min. The KSS is a measure of situational sleepiness in 9-point
scale (1 = extremely alert, 3 = alert, 5 = neither alert nor sleepy, 7 = sleepy – but no difficulty
remaining awake, and 9 = extremely sleepy – fighting sleep).
• 𝑲 is the coefficient relative to the contribution of the working environment to performance.
Although there are many possible factors of distraction, attention will be focused only on
the effect of heat. The human body is able to regulate its own temperature and keep it
around 36°𝐶. When the external heat is extreme, this mechanism begins to lose
effectiveness and the body adopts mechanisms to lower its temperature such as vasodilation
and sweating. Normally, the body cools down effectively only by sweating, but under certain
physical and environmental conditions this is not enough. If, for example, the humidity is
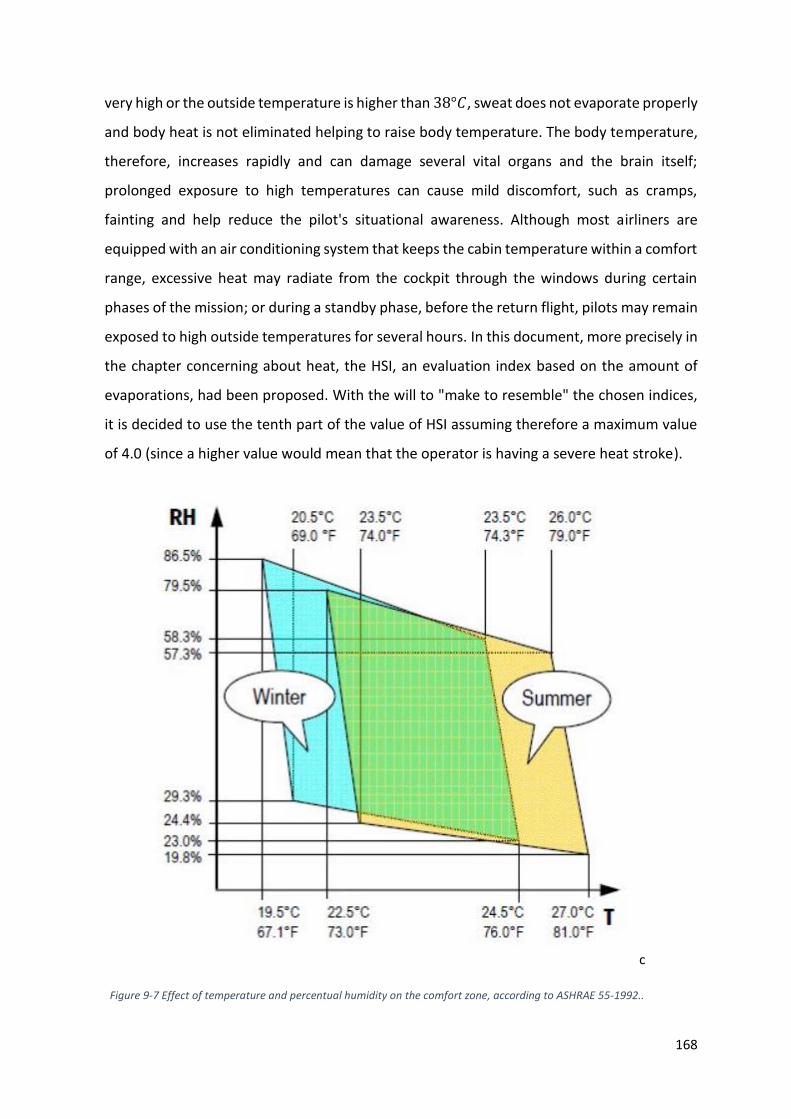
168
very high or the outside temperature is higher than 38°𝐶, sweat does not evaporate properly
and body heat is not eliminated helping to raise body temperature. The body temperature,
therefore, increases rapidly and can damage several vital organs and the brain itself;
prolonged exposure to high temperatures can cause mild discomfort, such as cramps,
fainting and help reduce the pilot's situational awareness. Although most airliners are
equipped with an air conditioning system that keeps the cabin temperature within a comfort
range, excessive heat may radiate from the cockpit through the windows during certain
phases of the mission; or during a standby phase, before the return flight, pilots may remain
exposed to high outside temperatures for several hours. In this document, more precisely in
the chapter concerning about heat, the HSI, an evaluation index based on the amount of
evaporations, had been proposed. With the will to "make to resemble" the chosen indices,
it is decided to use the tenth part of the value of HSI assuming therefore a maximum value
of 4.0 (since a higher value would mean that the operator is having a severe heat stroke).
c
Figure 9-7 Effect of temperature and percentual humidity on the comfort zone, according to ASHRAE 55-1992..
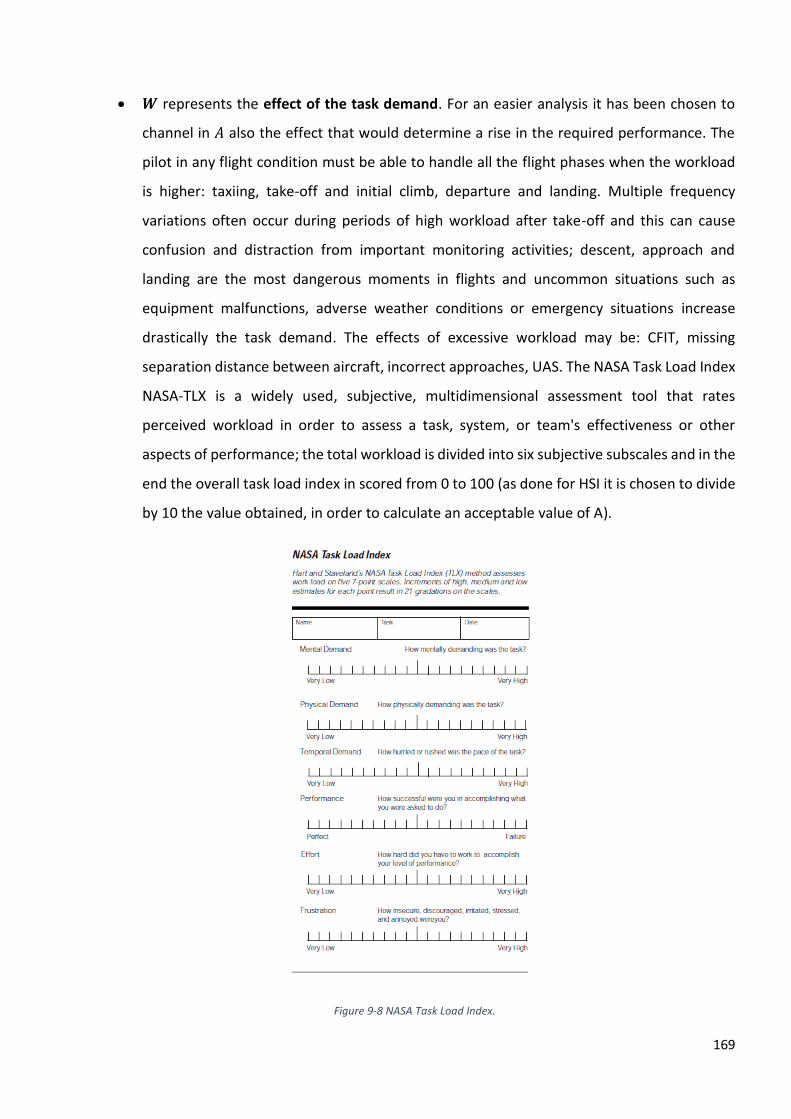
169
• 𝑾 represents the effect of the task demand. For an easier analysis it has been chosen to
channel in 𝐴 also the effect that would determine a rise in the required performance. The
pilot in any flight condition must be able to handle all the flight phases when the workload
is higher: taxiing, take-off and initial climb, departure and landing. Multiple frequency
variations often occur during periods of high workload after take-off and this can cause
confusion and distraction from important monitoring activities; descent, approach and
landing are the most dangerous moments in flights and uncommon situations such as
equipment malfunctions, adverse weather conditions or emergency situations increase
drastically the task demand. The effects of excessive workload may be: CFIT, missing
separation distance between aircraft, incorrect approaches, UAS. The NASA Task Load Index
NASA-TLX is a widely used, subjective, multidimensional assessment tool that rates
perceived workload in order to assess a task, system, or team's effectiveness or other
aspects of performance; the total workload is divided into six subjective subscales and in the
end the overall task load index in scored from 0 to 100 (as done for HSI it is chosen to divide
by 10 the value obtained, in order to calculate an acceptable value of A).
Figure 9-8 NASA Task Load Index.
170
The calculation of the three terms is entrusted to different methodologies whose coherence and
possible correlation must be studied in a single calculation: all three converge in the definition of 𝐴.
The higher the value of the term, the greater the impairing effect of fatigue factors; geometrically,
it represents the angular coefficient of the curve relating to performable human performance, so
considering the equation of the function 𝐻, the greater the value of 𝐴 the faster the margin of safety
decreases. Once this term is calculated and the 𝐷0 term is known, based on the type of mission and
various boundary conditions, Condition One is used to calculate the critical time. Nevertheless, this
calculation represents only a qualitative assessment of a much more complex and articulated
phenomenon, like many others of its kind.
171
Conclusion
Analyses carried out by the National Transportation Safety Board NTSB reveal that about 80% of all
commercial aviation accidents are caused by the "human factor", and of this 80%, as much as 21%
is attributable to the "operational fatigue" phenomenon: in a nutshell, about 16% of the
aforementioned accidents are attributable to an unacceptable level of fatigue in the cockpit; this
means that one in six accidents is fatigue related. In this thesis several researches on fatigue, a topic
still partly unknown, have been proposed. Thanks to all these studies, it has been possible to
ascertain that the main effects of fatigue in aeronautics can be summarized as follows:
• Sleepiness;
• Decreased piloting skills through increased reaction time;
• Increased threshold of acceptable risk;
• Reduced decision-making abilities;
• Reduction in problem-solving abilities;
• Reduced ability to concentrate;
• Impaired judgment;
• Lack of initiative;
• Fixation;
• Weakening of short-term memory.
Four main fatigue factors were recognized: sleep debt, circadian factor, wakefulness and workload.
The pilot realizes that he is fatigued by familiar symptoms, such as burning eyes or difficulty in
concentrating, and must declare his suboptimal state to the other pilot, planning the operations to
be carried out in response. When the performable performance is too low the margin of safety is
reduced to the point of failure: the risk of making a fatal error jumps up. In chapter 4, errors and
intentions are treated the same way: the initial error derives from a very specific (and often unique)
series of actions that gradually violate more and more security barriers; it is practically impossible
to eliminate errors completely, however it is necessary to minimize them by detecting the risks and
mitigating them through concrete actions. Of the various existing methods to assess risk and avoid
failure, one in particular was explored in more detail, but the use of the proposed tool in this chapter
should not be an excuse to not fly, rather a implement to secure the flight and future flights by
launching a fatigue management program and working to correct unsafe or unhealthful workplace
172
conditions or hazard. The goal is not to impede flights by underlining all possible dangers but to
make them acceptable. The Mitigation Table should serve to give a bird's eye view of the mission
and its feasibility; in any case, the method is effective only if the conditions and latent factors related
to the mission and territory are fully known and considered. Compiling the table is immediate but
taking account of all fatigue factors is often too time-consuming, which is why qualitative worst case
scenarios are evaluated. The often fatal consequences of an error derive from the nature of the
flight itself marked by high speed and altitude; as explained in chapter 5, the pilot is required to
have uncommon skills including the cold blood to make decisions in difficult situations with time
pressure and workload against. A correct decision is always related to an extensive and
comprehensive situational awareness; in this direction, accurate and unambiguous transmission of
ATC clearances is essential to prevent flight errors, while consequences of communication failures
can be deadly. Standard language formats and “party-line” (pilots pick up communication between
ATC and other pilots on open radio channels) have been designed to facilitate this type of
communication and maintaining accurate situation awareness.
Working makes people tired, and when one is tired the only real countermeasure, the one that
always pays off, is sleep correctly, but clearly this is not always possible. Sleep disorders impact
many people, affecting their abilities and, in some cases, the quality of their lives, altering the
normal physiological activities of their bodies. Sleep-related problems occur when adequate rest is
not guaranteed: for most people it is sufficient to sleep 7 to 8 hours a night. In chapter 7, some of
the countermeasures have been proposed, which however act as a band-aid, not solving the
problem but mitigating its effects. From the point of view of prevention, it is necessary to rest well
before a job that is considered heavy, preferring thermally and acoustically insulated environments,
ventilated, free from electro-magnetic interference and allowing an adequate number of hours of
sleep. The maximum duty limits that the aviation authorities of all countries have adopted to
prevent pilots from reaching peaks of fatigue that jeopardize safety are also reported. The debate
on these rules is divided: on the one hand, pilots believe that the maximum service times are too
long and must be reduced; on the other, airlines are pushing for intensive use of men and
equipment, which they see as a potential reduction in profit margins. It is in fact, important to
remember that companies must always remain productive in order to continue to exist, and this can
be apparently at odds with safety. Fatigue therefore presents itself as a common and inevitable
enemy to be faced; experience teaches that union is strength so, the CRM described in chapter 8,
173
introduced itself as providing the crew with all available weapons: cooperation and teamwork are
the key for success.
Flight safety passes through the individual actions of all the various constituents of the system, from
managers to pilots; a failure anywhere on the command line can trigger an accident, thus
emphasizing the priority aspect of safety in a complex system like aviation. But safety should be a
core value, not a priority. Our values are more ingrained and do not change as easily as our priorities.
Just think about a student during his studies. His priority will be to pass exams with solid results,
whereas once he has completed his studies, his priority is to find a job: priorities change. Therefore,
safety needs to be a value and not a priority because not matter what an operator is doing, it will
always be there to guide his decisions. If safety is the number one priority but on a particular flight
the new operator’s priority is to get home, he might forget about safety and just press on the
accelerator even if he knows he shouldn’t. The motto behind this philosophy is “Mission First, Safety
Always”; it brings together an inseparable union of ideas and achievement: leaders should
dynamically balance their skills on missions’ accomplishment and getting passengers home safely.
In normal conditions, these two different objectives are coincident; in cases of emergency, however,
the readiness of a pilot must still lead to a decision to secure the situation. To alleviate the workload
on pilot, the last ring of the safety chain, a systemic approach to hazard identification and control
should be emphasized not only by the requirements deciders but also the designers, builders,
operators, investigators, managers, et al. It is important to underline that if the motto was "Safety
First" then all aircrafts should be firmly tied to the ground because the action of flying is inherently
dangerous; as already widely repeated, it is impossible to eliminate all risks and threats.
Only those who dare may fly. Daring means not ignoring, on the contrary accepting after evaluating.
Once a certain risk factor has been identified, it must be corrected immediately before it triggers a
catastrophe. The "it's not broken so it doesn't need fixing" mentality needs to be eradicated, and
more attention must be paid to preventing an accident by identifying and dealing with dangerous
situations. Preventing damage is surely better than treating it, hence the importance of a risk
mitigation system; prevention requires changes and improvements, because trying to avoid an
hazard without changing anything in the system (in a such distorted context) will result in it
happening eventually, and then there is nothing left but to learn from the victims.

174
175
References
1. Fatigue in Aviation, J. Caldwell
2. Human Error, J. Reason
3. Decision Making in Action, I. Klein
4. Multiple Resources and Mental Workload, C. D. Wickens
5. Duty/Rest Guidelines for Business Aviation
6. Slide from CRM Course, Cpt. A. Floriani
7. Applied Ergonomics: Human Factors in Technology and Society, Dr. P. Dempsey
8. EASA FRMS Workshop Cologne 2015, Tritschler
9. SKYBRARY
10. Crew Factors in Flight Operations IX: Effects of Planned Cockpit Rest on Crew Performance and
Alertness in Long Haul Operations, M. Rosekind
11. Nasa Naps, Dr. D. Dinges
12. Sleep inertia: current insights, Hilditch CJ and Mc Hill
13. Waking up is the hardest thing I do all day: Sleep inertia and sleep drunkenness, L. M. Trotti
14. Electroencephalographic sleep inertia of the awakening brain, C. Marzano and M. Ferrara
15. Changes in cerebral blood flow velocity in healthy young men during overnight sleep and while
awake, Kuboyama T. and Hori A.
16. An endogenous circadian rhythm in sleep inertia results in greatest cognitive impairment upon
awakening during the biological night, Scheer FA and Shea TJ
17. Effects of noise on sleep inertia as a function of circadian placement of a one-hour nap, P. Tassi
18. Caffeine: Cognitive and Physical Performance Enhancer or Psychoactive Drug?, S. Cappelletti
19. Caffeine Eliminates Psychomotor Vigilance Deficits from Sleep Inertia, Hans P.A. and Van Dongen
20. Errors in Aviation Decision Making: A Factor in Accidents and Incidents, J. Orasanu
21. Lapsing during Sleep Deprivation Is Associated with Distributed Changes in Brain Activation, M. W.
L. Chee and J. Chow Tan
22. The Bird Strike Challenge Isabel, C. Metz
23. Why we sleep?, M. Walker
24. Human Sleep and Cognition, Gerard A. Kerkhof and Hans P.A.
25. EASA FRMS Workshop Cologne, Tritschler
26. Flight Risk Assessment Tool, FAA
27. Fatigue Risk Assessment Methodologies EASA FRMS Workshop Cologne, Kr. Tritschler 2005
28. A Safety Approach to Predict Human Error in Critical Flight Tasks, S. Kunlun
29. Human Factors Guidelines for Safety Audits Manual, ICAO
30. Model of human factors of situation awareness in SA analysis, M. Gajetti and P. Maggiore
31. Linee di indirizzo per la prevenzione degli effetti del caldo sulla salute, Ministero della Salute
32. Heat stress and public health: a critical review, R. S. Kovats
33. Long-term Climate Change: Projections, Commitments and Irreversibility, M. Collins
34. The Excess Heat Factor: A Metric for Heatwave Intensity and Its Use in Classifying Heatwave Severity,
J. R. Nairn
35. Heat Stress Indices: A Review Paper, M. Beshir
36. Crew Resource Management (AS 387), Prof. A. Cortés
37. Flight Operations Briefing Notes Human Performance CRM Aspects in Incidents / Accidents, Airbus
38. Sleep, Sleepiness, and Circadian Rhythmicity in Aircrews Operating on Transatlantic Routes, H. M.
Wegmann and A. Gunde
39. The Cumulative cost of Additional Wakefulness, H. P.A. Van Dongen

176

177
Acknowledgments
First of all, I would like to thank my Supervisors: to Captain Alessandro Floriani, for his infinite
patience and knowledge, and to Engineer Marco Gajetti, who taught me to think and act like a true
engineer even before being one. Sincerely thanks for believe in me; it has been an honour to learn
from You.
I also want to thank my Family: to my Father (my hero and sponsor) to whom I dedicate this work;
to my Mother, the brightest light I know; to my little Brother, because every goal of mine is and
forever will be yours too. I never would have been able to complete my voyage without You.
Reminder: aim to the Moon.
This last page concludes this work and my university journey. Bye bye!
Cristiano Forcella
Turin, 02-01-2021