Fatigue and Crack Growth under Constant - MDPI
17
metals Article Fatigue and Crack Growth under Constant- and Variable-Amplitude Loading in 9310 Steel Using “Rainflow-on-the-Fly” Methodology James C. Newman, Jr. Citation: Newman, J.C., Jr. Fatigue and Crack Growth under Constant- and Variable-Amplitude Loading in 9310 Steel Using “Rainflow-on-the-Fly” Methodology. Metals 2021, 11, 807. https://doi.org /10.3390/met11050807 Academic Editor: Filippo Berto Received: 17 April 2021 Accepted: 13 May 2021 Published: 15 May 2021 Publisher’s Note: MDPI stays neutral with regard to jurisdictional claims in published maps and institutional affil- iations. Copyright: © 2021 by the author. Licensee MDPI, Basel, Switzerland. This article is an open access article distributed under the terms and conditions of the Creative Commons Attribution (CC BY) license (https:// creativecommons.org/licenses/by/ 4.0/). Department of Aerospace Engineering, Mississippi State University, Mississippi, MS 39762, USA; [email protected]; Tel.: +1-(901)-734-6642 Abstract: Fatigue of materials, like alloys, is basically fatigue-crack growth in small cracks nucleating and growing from micro-structural features, such as inclusions and voids, or at micro-machining marks, and large cracks growing to failure. Thus, the traditional fatigue-crack nucleation stage (N i ) is basically the growth in microcracks (initial flaw sizes of 1 to 30 μm growing to about 250 μm) in metal alloys. Fatigue and crack-growth tests were conducted on a 9310 steel under laboratory air and room temperature conditions. Large-crack-growth-rate data were obtained from compact, C(T), specimens over a wide range in rates from threshold to fracture for load ratios (R) of 0.1 to 0.95. New test procedures based on compression pre-cracking were used in the near-threshold regime because the current ASTM test method (load shedding) has been shown to cause load-history effects with elevated thresholds and slower rates than steady-state behavior under constant-amplitude loading. High load-ratio (R) data were used to approximate small-crack-growth-rate behavior. A crack-closure model, FASTRAN, was used to develop the baseline crack-growth-rate curve. Fatigue tests were conducted on single-edge-notch-bend, SEN(B), specimens under both constant-amplitude and a Cold-Turbistan+ spectrum loading. Under spectrum loading, the model used a “Rainflow-on-the- Fly” subroutine to account for crack-growth damage. Test results were compared to fatigue-life calculations made under constant-amplitude loading to establish the initial microstructural flaw size and predictions made under spectrum loading from the FASTRAN code using the same micro- structural, semi-circular, surface-flaw size (6-μm). Thus, the model is a unified fatigue approach, from crack nucleation (small-crack growth) and large-crack growth to failure using fracture mechanics principles. The model was validated for both fatigue and crack-growth predictions. In general, predictions agreed well with the test data. Keywords: fatigue; crack growth; metallic materials; plasticity; crack closure; spectrum loading 1. Introduction This article is dedicated to Dr. Wolf Elber and his remarkable achievements. On 12 January 2019, Wolf took off on his final flight. His passion was to soar in his glider over the Blue Ridge Mountains in southwest Virginia, USA. With his passing, Metals 2021, 11, 807. https://doi.org/10.3390/met11050807 https://www.mdpi.com/journal/metals
-
Upload
khangminh22 -
Category
Documents
-
view
1 -
download
0
Transcript of Fatigue and Crack Growth under Constant - MDPI
metals
Article
Fatigue and Crack Growth under Constant- andVariable-Amplitude Loading in 9310 Steel Using“Rainflow-on-the-Fly” Methodology
James C. Newman, Jr.
�����������������
Citation: Newman, J.C., Jr. Fatigue
and Crack Growth under Constant-
and Variable-Amplitude Loading in
9310 Steel Using
“Rainflow-on-the-Fly” Methodology.
Metals 2021, 11, 807. https://doi.org
/10.3390/met11050807
Academic Editor: Filippo Berto
Received: 17 April 2021
Accepted: 13 May 2021
Published: 15 May 2021
Publisher’s Note: MDPI stays neutral
with regard to jurisdictional claims in
published maps and institutional affil-
iations.
Copyright: © 2021 by the author.
Licensee MDPI, Basel, Switzerland.
This article is an open access article
distributed under the terms and
conditions of the Creative Commons
Attribution (CC BY) license (https://
creativecommons.org/licenses/by/
4.0/).
Department of Aerospace Engineering, Mississippi State University, Mississippi, MS 39762, USA;[email protected]; Tel.: +1-(901)-734-6642
Abstract: Fatigue of materials, like alloys, is basically fatigue-crack growth in small cracks nucleatingand growing from micro-structural features, such as inclusions and voids, or at micro-machiningmarks, and large cracks growing to failure. Thus, the traditional fatigue-crack nucleation stage (Ni)is basically the growth in microcracks (initial flaw sizes of 1 to 30 µm growing to about 250 µm) inmetal alloys. Fatigue and crack-growth tests were conducted on a 9310 steel under laboratory airand room temperature conditions. Large-crack-growth-rate data were obtained from compact, C(T),specimens over a wide range in rates from threshold to fracture for load ratios (R) of 0.1 to 0.95. Newtest procedures based on compression pre-cracking were used in the near-threshold regime becausethe current ASTM test method (load shedding) has been shown to cause load-history effects withelevated thresholds and slower rates than steady-state behavior under constant-amplitude loading.High load-ratio (R) data were used to approximate small-crack-growth-rate behavior. A crack-closuremodel, FASTRAN, was used to develop the baseline crack-growth-rate curve. Fatigue tests wereconducted on single-edge-notch-bend, SEN(B), specimens under both constant-amplitude and aCold-Turbistan+ spectrum loading. Under spectrum loading, the model used a “Rainflow-on-the-Fly” subroutine to account for crack-growth damage. Test results were compared to fatigue-lifecalculations made under constant-amplitude loading to establish the initial microstructural flawsize and predictions made under spectrum loading from the FASTRAN code using the same micro-structural, semi-circular, surface-flaw size (6-µm). Thus, the model is a unified fatigue approach, fromcrack nucleation (small-crack growth) and large-crack growth to failure using fracture mechanicsprinciples. The model was validated for both fatigue and crack-growth predictions. In general,predictions agreed well with the test data.
Keywords: fatigue; crack growth; metallic materials; plasticity; crack closure; spectrum loading
1. Introduction
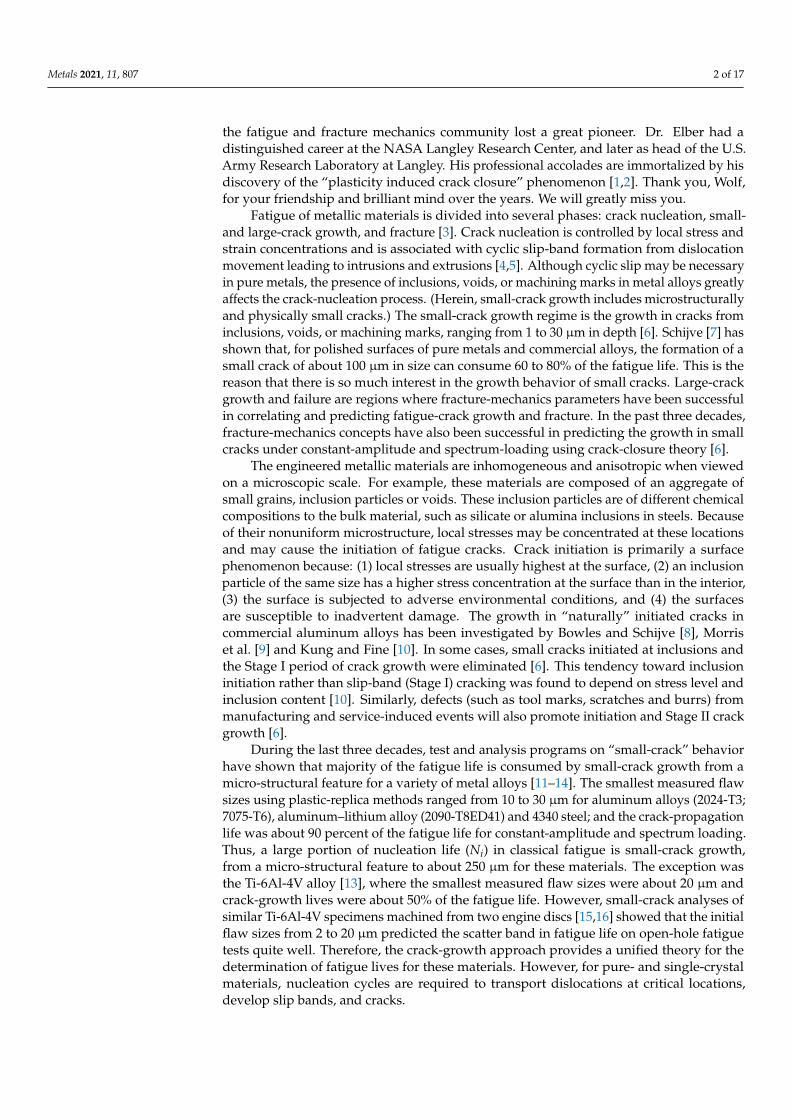
This article is dedicated to Dr. Wolf Elber and his remarkable achievements.
Metals 2021, 11, x. https://doi.org/10.3390/xxxxx www.mdpi.com/journal/metals
Article
Fatigue and Crack Growth under Constant- and Variable-Am-plitude Loading in 9310 Steel Using “Rainflow-On-The-Fly” Methodology James C. Newman, Jr.
Department of Aerospace Engineering, Mississippi State University, Mississippi State, MS 39762, USA; [email protected]; Tel.: +1-(901)-734-6642
Abstract: Fatigue of materials, like alloys, is basically fatigue-crack growth in small cracks nucle-ating and growing from micro-structural features, such as inclusions and voids, or at micro-machin-ing marks, and large cracks growing to failure. Thus, the traditional fatigue-crack nucleation stage (Ni) is basically the growth in microcracks (initial flaw sizes of 1 to 30 μm growing to about 250 μm) in metal alloys. Fatigue and crack-growth tests were conducted on a 9310 steel under laboratory air and room temperature conditions. Large-crack-growth-rate data were obtained from compact, C(T), specimens over a wide range in rates from threshold to fracture for load ratios (R) of 0.1 to 0.95. New test procedures based on compression pre-cracking were used in the near-threshold regime because the current ASTM test method (load shedding) has been shown to cause load-history effects with elevated thresholds and slower rates than steady-state behavior under constant-amplitude loading. High load-ratio (R) data were used to approximate small-crack-growth-rate behavior. A crack-closure model, FASTRAN, was used to develop the baseline crack-growth-rate curve. Fatigue tests were conducted on single-edge-notch-bend, SEN(B), specimens under both constant-ampli-tude and a Cold-Turbistan+ spectrum loading. Under spectrum loading, the model used a “Rain-flow-on-the-Fly” subroutine to account for crack-growth damage. Test results were compared to fatigue-life calculations made under constant-amplitude loading to establish the initial microstruc-tural flaw size and predictions made under spectrum loading from the FASTRAN code using the same micro-structural, semi-circular, surface-flaw size (6-μm). Thus, the model is a unified fatigue approach, from crack nucleation (small-crack growth) and large-crack growth to failure using frac-ture mechanics principles. The model was validated for both fatigue and crack-growth predictions. In general, predictions agreed well with the test data.
Keywords: fatigue; crack growth; metallic materials; plasticity; crack closure; spectrum loading
1. Introduction This article is dedicated to Dr. Wolf Elber and his remarkable achievements.
Citation: Newman, J.C. Jr. Fatigue
and Crack Growth under Constant-
and Variable-Amplitude Loading in
9310 Steel Using “Rainflow-On-The-
Fly” Methodology. Metals 2021, 11,
x. https://doi.org/10.3390/xxxxx
Academic Editor: Filippo Berto
Received: 17 April 2021
Accepted:13 May 2021
Published:
Publisher’s Note: MDPI stays neu-
tral with regard to jurisdictional
claims in published maps and institu-
tional affiliations.
Copyright: © 2021 by the authors.
Submitted for possible open access
publication under the terms and con-
ditions of the Creative Commons At-
tribution (CC BY) license (http://crea-
tivecommons.org/licenses/by/4.0/).
On 12 January 2019, Wolf took off on his final flight. His passion was to soar inhis glider over the Blue Ridge Mountains in southwest Virginia, USA. With his passing,
Metals 2021, 11, 807. https://doi.org/10.3390/met11050807 https://www.mdpi.com/journal/metals
Metals 2021, 11, 807 2 of 17
the fatigue and fracture mechanics community lost a great pioneer. Dr. Elber had adistinguished career at the NASA Langley Research Center, and later as head of the U.S.Army Research Laboratory at Langley. His professional accolades are immortalized by hisdiscovery of the “plasticity induced crack closure” phenomenon [1,2]. Thank you, Wolf,for your friendship and brilliant mind over the years. We will greatly miss you.
Fatigue of metallic materials is divided into several phases: crack nucleation, small-and large-crack growth, and fracture [3]. Crack nucleation is controlled by local stress andstrain concentrations and is associated with cyclic slip-band formation from dislocationmovement leading to intrusions and extrusions [4,5]. Although cyclic slip may be necessaryin pure metals, the presence of inclusions, voids, or machining marks in metal alloys greatlyaffects the crack-nucleation process. (Herein, small-crack growth includes microstructurallyand physically small cracks.) The small-crack growth regime is the growth in cracks frominclusions, voids, or machining marks, ranging from 1 to 30 µm in depth [6]. Schijve [7] hasshown that, for polished surfaces of pure metals and commercial alloys, the formation of asmall crack of about 100 µm in size can consume 60 to 80% of the fatigue life. This is thereason that there is so much interest in the growth behavior of small cracks. Large-crackgrowth and failure are regions where fracture-mechanics parameters have been successfulin correlating and predicting fatigue-crack growth and fracture. In the past three decades,fracture-mechanics concepts have also been successful in predicting the growth in smallcracks under constant-amplitude and spectrum-loading using crack-closure theory [6].
The engineered metallic materials are inhomogeneous and anisotropic when viewedon a microscopic scale. For example, these materials are composed of an aggregate ofsmall grains, inclusion particles or voids. These inclusion particles are of different chemicalcompositions to the bulk material, such as silicate or alumina inclusions in steels. Becauseof their nonuniform microstructure, local stresses may be concentrated at these locationsand may cause the initiation of fatigue cracks. Crack initiation is primarily a surfacephenomenon because: (1) local stresses are usually highest at the surface, (2) an inclusionparticle of the same size has a higher stress concentration at the surface than in the interior,(3) the surface is subjected to adverse environmental conditions, and (4) the surfacesare susceptible to inadvertent damage. The growth in “naturally” initiated cracks incommercial aluminum alloys has been investigated by Bowles and Schijve [8], Morriset al. [9] and Kung and Fine [10]. In some cases, small cracks initiated at inclusions andthe Stage I period of crack growth were eliminated [6]. This tendency toward inclusioninitiation rather than slip-band (Stage I) cracking was found to depend on stress level andinclusion content [10]. Similarly, defects (such as tool marks, scratches and burrs) frommanufacturing and service-induced events will also promote initiation and Stage II crackgrowth [6].
During the last three decades, test and analysis programs on “small-crack” behaviorhave shown that majority of the fatigue life is consumed by small-crack growth from amicro-structural feature for a variety of metal alloys [11–14]. The smallest measured flawsizes using plastic-replica methods ranged from 10 to 30 µm for aluminum alloys (2024-T3;7075-T6), aluminum–lithium alloy (2090-T8ED41) and 4340 steel; and the crack-propagationlife was about 90 percent of the fatigue life for constant-amplitude and spectrum loading.Thus, a large portion of nucleation life (Ni) in classical fatigue is small-crack growth,from a micro-structural feature to about 250 µm for these materials. The exception wasthe Ti-6Al-4V alloy [13], where the smallest measured flaw sizes were about 20 µm andcrack-growth lives were about 50% of the fatigue life. However, small-crack analyses ofsimilar Ti-6Al-4V specimens machined from two engine discs [15,16] showed that the initialflaw sizes from 2 to 20 µm predicted the scatter band in fatigue life on open-hole fatiguetests quite well. Therefore, the crack-growth approach provides a unified theory for thedetermination of fatigue lives for these materials. However, for pure- and single-crystalmaterials, nucleation cycles are required to transport dislocations at critical locations,develop slip bands, and cracks.
Metals 2021, 11, 807 3 of 17
Fatigue-crack growth under variable-amplitude and spectrum loading is composedof complex crack-shielding mechanisms (plasticity, roughness and fretting debris) anddamage accumulation due to cyclic plastic deformations around a crack front in metallicmaterials. Typically, “rainflow” methods [17] are applied to variable-amplitude loading todevelop a load sequence that is used to compute damage accumulation and life becausedamage relations are, generally, a non-linear function of the crack-driving parameters.However, crack-tip damage is only a function of the current loading and load history(material memory). Loading in the future has no bearing on the “current” damage. Thelife-prediction code, FASTRAN [18], has a “rainflow-on-the-fly” methodology [19] tocompute damage as the cyclic load history is applied, and there was no need to reorder thespectra. Herein, several variable-amplitude loading sequences were developed to test andto validate the “rainflow-on-the-fly” subroutine.
The paper presents the results of large-crack-growth-rate tests conducted on compact,C(T), specimens made of 9310 steel [20] over a wide range of constant-amplitude loadingto establish the baseline crack-growth-rate curve for fatigue and crack-growth analyses.Compression pre-cracking methods [21–26] were used to generate test data in the near-threshold regime because the ASTM E-647 test method [27,28] using the load-sheddingprocedure was shown to cause load-history effects and slower crack-growth rates thansteady-state behavior [25,26]. Both compression pre-cracking constant-amplitude (CPCA)and load-reduction (CPLR) methods were used. A crack-closure analysis was used tocollapse the rate data from C(T) specimens into a narrow band over many orders ofmagnitude in rates using a plane-strain constraint factor for low rates and modeled aconstraint-loss regime to plane-stress behavior at high rates. For steels, small- and large-crack data (without load-history effects) tend to agree well [29]. Thus, the high-R large-crackdata in the near-threshold regime is a good estimate for small-crack behavior, as proposedby Herman et al. [30]. A Two-Parameter Fracture Criterion [31] was used to characterizethe fracture behavior. Fatigue tests were conducted on 9310 steel single-edge-notch-bend,SEN(B), specimens [32] under both constant-amplitude and a modified Cold-Turbistan [33]spectrum loading. The test results were compared to the life calculations or predictionsmade using the FASTRAN code.
2. Material and Specimen Configurations
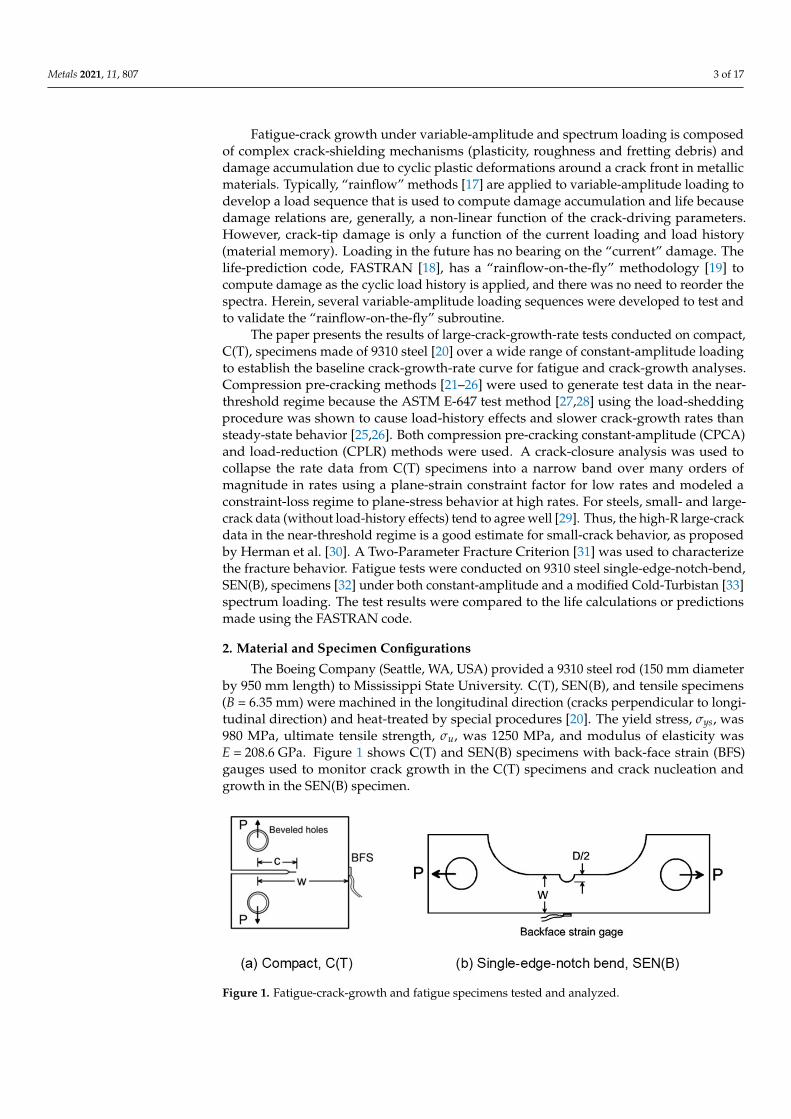
The Boeing Company (Seattle, WA, USA) provided a 9310 steel rod (150 mm diameterby 950 mm length) to Mississippi State University. C(T), SEN(B), and tensile specimens(B = 6.35 mm) were machined in the longitudinal direction (cracks perpendicular to longi-tudinal direction) and heat-treated by special procedures [20]. The yield stress, σys, was980 MPa, ultimate tensile strength, σu, was 1250 MPa, and modulus of elasticity wasE = 208.6 GPa. Figure 1 shows C(T) and SEN(B) specimens with back-face strain (BFS)gauges used to monitor crack growth in the C(T) specimens and crack nucleation andgrowth in the SEN(B) specimen.
Metals 2021, 11, x FOR PEER REVIEW 3 of 19
crystal materials, nucleation cycles are required to transport dislocations at critical loca-tions, develop slip bands, and cracks.
Fatigue-crack growth under variable-amplitude and spectrum loading is composed of complex crack-shielding mechanisms (plasticity, roughness and fretting debris) and damage accumulation due to cyclic plastic deformations around a crack front in metallic materials. Typically, “rainflow” methods [17] are applied to variable-amplitude loading to develop a load sequence that is used to compute damage accumulation and life because damage relations are, generally, a non-linear function of the crack-driving parameters. However, crack-tip damage is only a function of the current loading and load history (ma-terial memory). Loading in the future has no bearing on the “current” damage. The life-prediction code, FASTRAN [18], has a “rainflow-on-the-fly” methodology [19] to compute damage as the cyclic load history is applied, and there was no need to reorder the spectra. Herein, several variable-amplitude loading sequences were developed to test and to vali-date the “rainflow-on-the-fly” subroutine.
The paper presents the results of large-crack-growth-rate tests conducted on com-pact, C(T), specimens made of 9310 steel [20] over a wide range of constant-amplitude loading to establish the baseline crack-growth-rate curve for fatigue and crack-growth analyses. Compression pre-cracking methods [21–26] were used to generate test data in the near-threshold regime because the ASTM E-647 test method [27,28] using the load-shedding procedure was shown to cause load-history effects and slower crack-growth rates than steady-state behavior [25,26]. Both compression pre-cracking constant-ampli-tude (CPCA) and load-reduction (CPLR) methods were used. A crack-closure analysis was used to collapse the rate data from C(T) specimens into a narrow band over many orders of magnitude in rates using a plane-strain constraint factor for low rates and mod-eled a constraint-loss regime to plane-stress behavior at high rates. For steels, small- and large-crack data (without load-history effects) tend to agree well [29]. Thus, the high-R large-crack data in the near-threshold regime is a good estimate for small-crack behavior, as proposed by Herman et al. [30]. A Two-Parameter Fracture Criterion [31] was used to characterize the fracture behavior. Fatigue tests were conducted on 9310 steel single-edge-notch-bend, SEN(B), specimens [32] under both constant-amplitude and a modified Cold-Turbistan [33] spectrum loading. The test results were compared to the life calculations or predictions made using the FASTRAN code.
2. Material and Specimen Configurations The Boeing Company (Seattle, WA, USA) provided a 9310 steel rod (150 mm diame-
ter by 950 mm length) to Mississippi State University. C(T), SEN(B), and tensile specimens (B = 6.35 mm) were machined in the longitudinal direction (cracks perpendicular to lon-gitudinal direction) and heat-treated by special procedures [20]. The yield stress, σys, was 980 MPa, ultimate tensile strength, σu, was 1250 MPa, and modulus of elasticity was E = 208.6 GPa. Figure 1 shows C(T) and SEN(B) specimens with back-face strain (BFS) gauges used to monitor crack growth in the C(T) specimens and crack nucleation and growth in the SEN(B) specimen.
Figure 1. Fatigue-crack-growth and fatigue specimens tested and analyzed. Figure 1. Fatigue-crack-growth and fatigue specimens tested and analyzed.
Metals 2021, 11, 807 4 of 17
3. “Rainflow-on-the-Fly” Methodology
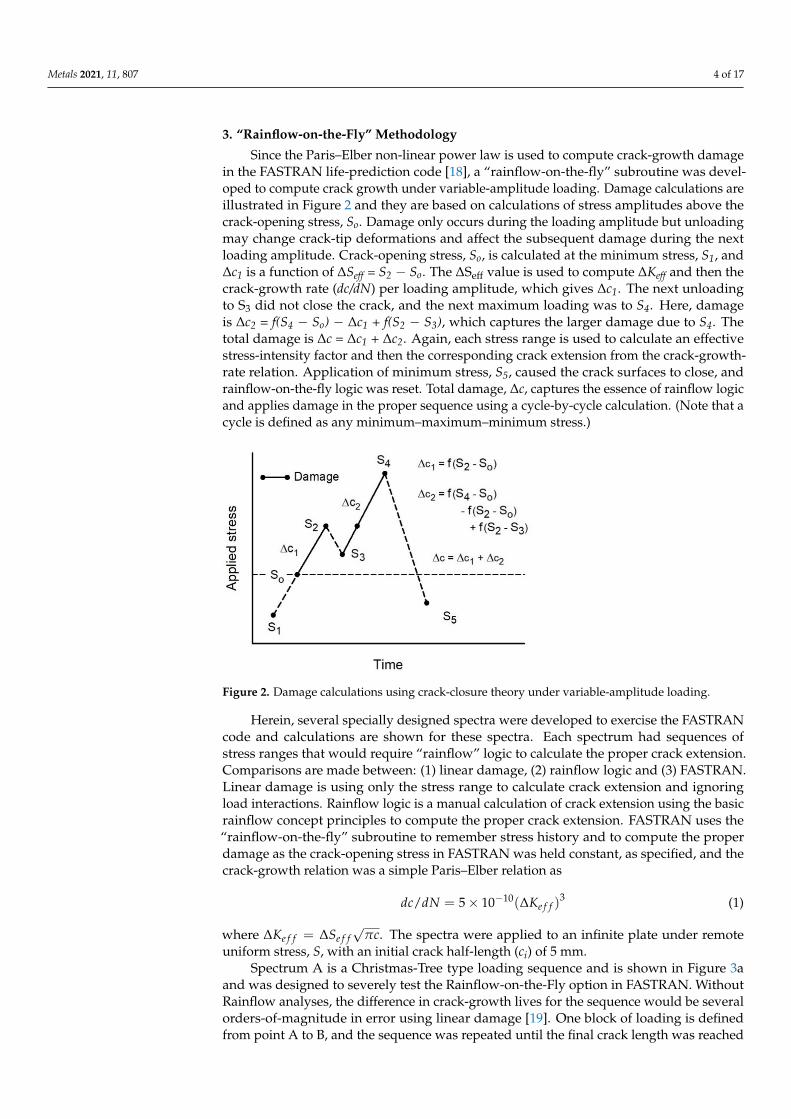
Since the Paris–Elber non-linear power law is used to compute crack-growth damagein the FASTRAN life-prediction code [18], a “rainflow-on-the-fly” subroutine was devel-oped to compute crack growth under variable-amplitude loading. Damage calculations areillustrated in Figure 2 and they are based on calculations of stress amplitudes above thecrack-opening stress, So. Damage only occurs during the loading amplitude but unloadingmay change crack-tip deformations and affect the subsequent damage during the nextloading amplitude. Crack-opening stress, So, is calculated at the minimum stress, S1, and∆c1 is a function of ∆Seff = S2 − So. The ∆Seff value is used to compute ∆Keff and then thecrack-growth rate (dc/dN) per loading amplitude, which gives ∆c1. The next unloadingto S3 did not close the crack, and the next maximum loading was to S4. Here, damageis ∆c2 = f(S4 − So) − ∆c1 + f(S2 − S3), which captures the larger damage due to S4. Thetotal damage is ∆c = ∆c1 + ∆c2. Again, each stress range is used to calculate an effectivestress-intensity factor and then the corresponding crack extension from the crack-growth-rate relation. Application of minimum stress, S5, caused the crack surfaces to close, andrainflow-on-the-fly logic was reset. Total damage, ∆c, captures the essence of rainflow logicand applies damage in the proper sequence using a cycle-by-cycle calculation. (Note that acycle is defined as any minimum–maximum–minimum stress.)
Metals 2021, 11, x FOR PEER REVIEW 4 of 19
3.“. Rainflow-on-the-Fly” Methodology Since the Paris–Elber non-linear power law is used to compute crack-growth damage
in the FASTRAN life-prediction code [18], a “rainflow-on-the-fly” subroutine was devel-oped to compute crack growth under variable-amplitude loading. Damage calculations are illustrated in Figure 2 and they are based on calculations of stress amplitudes above the crack-opening stress, So. Damage only occurs during the loading amplitude but un-loading may change crack-tip deformations and affect the subsequent damage during the next loading amplitude. Crack-opening stress, So, is calculated at the minimum stress, S1, and Δc1 is a function of ΔSeff = S2 − So. The ΔSeff value is used to compute ΔKeff and then the crack-growth rate (dc/dN) per loading amplitude, which gives Δc1. The next unloading to S3 did not close the crack, and the next maximum loading was to S4. Here, damage is Δc2 = f(S4 − So) − Δc1 + f(S2 − S3), which captures the larger damage due to S4. The total damage is Δc = Δc1 + Δc2. Again, each stress range is used to calculate an effective stress-intensity factor and then the corresponding crack extension from the crack-growth-rate relation. Application of minimum stress, S5, caused the crack surfaces to close, and rainflow-on-the-fly logic was reset. Total damage, Δc, captures the essence of rainflow logic and applies damage in the proper sequence using a cycle-by-cycle calculation. (Note that a cycle is defined as any minimum–maximum–minimum stress.)
Herein, several specially designed spectra were developed to exercise the FASTRAN code and calculations are shown for these spectra. Each spectrum had sequences of stress ranges that would require “rainflow” logic to calculate the proper crack extension. Com-parisons are made between: (1) linear damage, (2) rainflow logic and (3) FASTRAN. Lin-ear damage is using only the stress range to calculate crack extension and ignoring load interactions. Rainflow logic is a manual calculation of crack extension using the basic rain-flow concept principles to compute the proper crack extension. FASTRAN uses the “rain-flow-on-the-fly” subroutine to remember stress history and to compute the proper dam-age as the crack-opening stress in FASTRAN was held constant, as specified, and the crack-growth relation was a simple Paris–Elber relation as 𝑑𝑐 𝑑𝑁⁄ = 5 × 10 (∆𝐾 ) (1)
where ∆𝐾 = ∆𝑆 √𝜋𝑐. The spectra were applied to an infinite plate under remote uni-form stress, S, with an initial crack half-length (ci) of 5 mm.
Figure 2. Damage calculations using crack-closure theory under variable-amplitude loading.
Spectrum A is a Christmas-Tree type loading sequence and is shown in Figure 3a and was designed to severely test the Rainflow-on-the-Fly option in FASTRAN. Without Rain-flow analyses, the difference in crack-growth lives for the sequence would be several or-ders-of-magnitude in error using linear damage [19]. One block of loading is defined from point A to B, and the sequence was repeated until the final crack length was reached or
Figure 2. Damage calculations using crack-closure theory under variable-amplitude loading.
Herein, several specially designed spectra were developed to exercise the FASTRANcode and calculations are shown for these spectra. Each spectrum had sequences ofstress ranges that would require “rainflow” logic to calculate the proper crack extension.Comparisons are made between: (1) linear damage, (2) rainflow logic and (3) FASTRAN.Linear damage is using only the stress range to calculate crack extension and ignoringload interactions. Rainflow logic is a manual calculation of crack extension using the basicrainflow concept principles to compute the proper crack extension. FASTRAN uses the“rainflow-on-the-fly” subroutine to remember stress history and to compute the properdamage as the crack-opening stress in FASTRAN was held constant, as specified, and thecrack-growth relation was a simple Paris–Elber relation as
dc/dN = 5× 10⁻¹⁰(∆Ke f f )3 (1)
where ∆Ke f f = ∆Se f f√
πc. The spectra were applied to an infinite plate under remoteuniform stress, S, with an initial crack half-length (ci) of 5 mm.
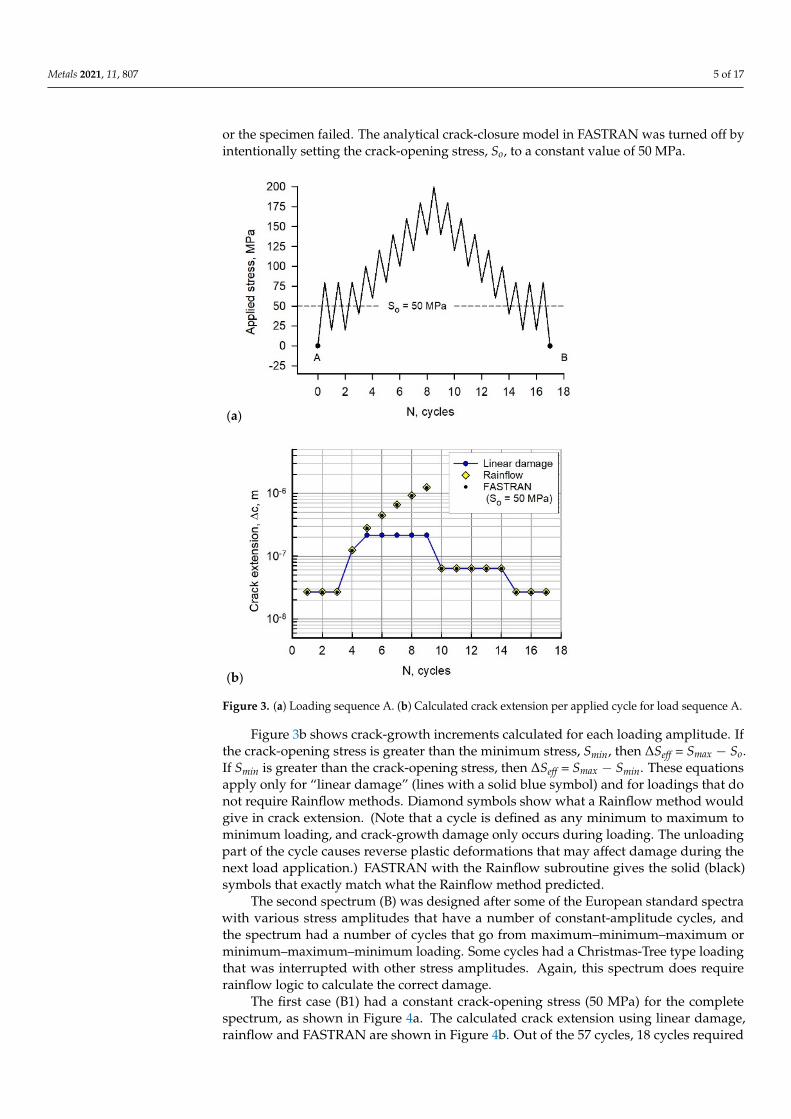
Spectrum A is a Christmas-Tree type loading sequence and is shown in Figure 3aand was designed to severely test the Rainflow-on-the-Fly option in FASTRAN. WithoutRainflow analyses, the difference in crack-growth lives for the sequence would be severalorders-of-magnitude in error using linear damage [19]. One block of loading is definedfrom point A to B, and the sequence was repeated until the final crack length was reached
Metals 2021, 11, 807 5 of 17
or the specimen failed. The analytical crack-closure model in FASTRAN was turned off byintentionally setting the crack-opening stress, So, to a constant value of 50 MPa.
Metals 2021, 11, x FOR PEER REVIEW 5 of 19
the specimen failed. The analytical crack-closure model in FASTRAN was turned off by intentionally setting the crack-opening stress, So, to a constant value of 50 MPa.
Figure 3b shows crack-growth increments calculated for each loading amplitude. If the crack-opening stress is greater than the minimum stress, Smin, then ΔSeff = Smax − So. If Smin is greater than the crack-opening stress, then ΔSeff = Smax − Smin. These equations apply only for “linear damage” (lines with a solid blue symbol) and for loadings that do not require Rainflow methods. Diamond symbols show what a Rainflow method would give in crack extension. (Note that a cycle is defined as any minimum to maximum to minimum loading, and crack-growth damage only occurs during loading. The unloading part of the cycle causes reverse plastic deformations that may affect damage during the next load application.) FASTRAN with the Rainflow subroutine gives the solid (black) symbols that exactly match what the Rainflow method predicted.
(a)
(b)
Figure 3. (a) Loading sequence A. (b) Calculated crack extension per applied cycle for load se-quence A.
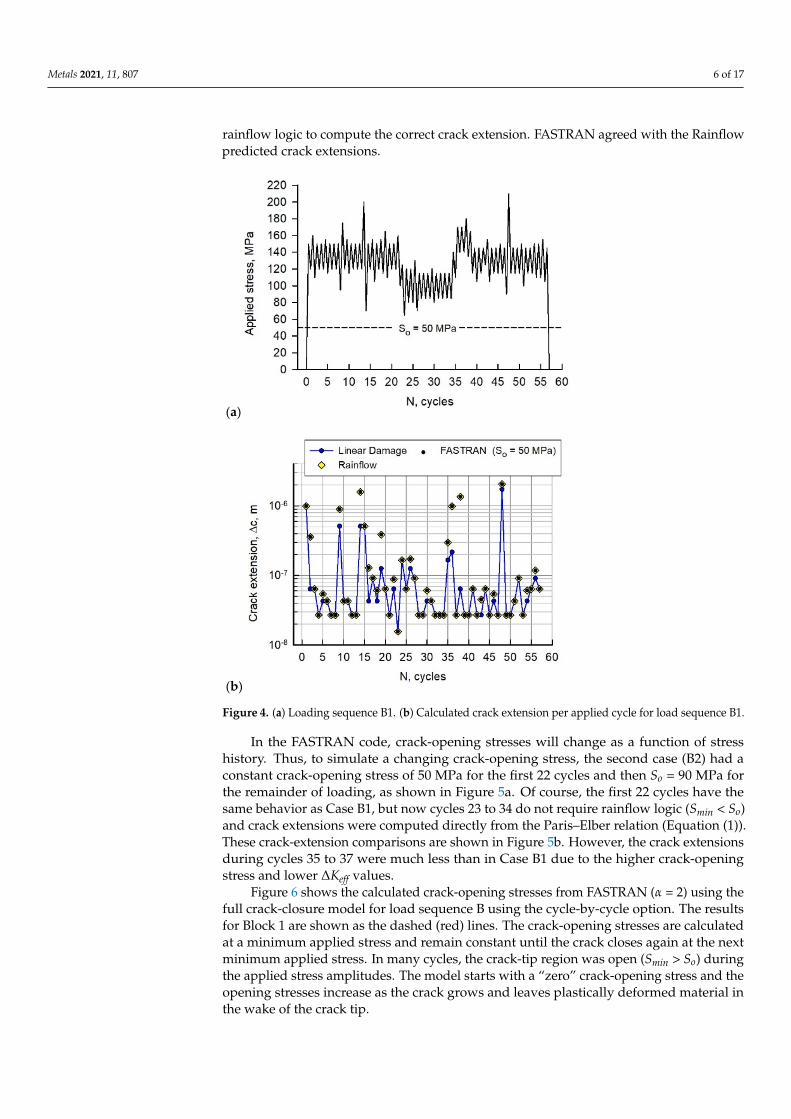
The second spectrum (B) was designed after some of the European standard spectra with various stress amplitudes that have a number of constant-amplitude cycles, and the spectrum had a number of cycles that go from maximum–minimum–maximum or mini-mum–maximum–minimum loading. Some cycles had a Christmas-Tree type loading that was interrupted with other stress amplitudes. Again, this spectrum does require rainflow logic to calculate the correct damage.
The first case (B1) had a constant crack-opening stress (50 MPa) for the complete spectrum, as shown in Figure 4a. The calculated crack extension using linear damage,
Figure 3. (a) Loading sequence A. (b) Calculated crack extension per applied cycle for load sequence A.
Figure 3b shows crack-growth increments calculated for each loading amplitude. Ifthe crack-opening stress is greater than the minimum stress, Smin, then ∆Seff = Smax − So.If Smin is greater than the crack-opening stress, then ∆Seff = Smax − Smin. These equationsapply only for “linear damage” (lines with a solid blue symbol) and for loadings that donot require Rainflow methods. Diamond symbols show what a Rainflow method wouldgive in crack extension. (Note that a cycle is defined as any minimum to maximum tominimum loading, and crack-growth damage only occurs during loading. The unloadingpart of the cycle causes reverse plastic deformations that may affect damage during thenext load application.) FASTRAN with the Rainflow subroutine gives the solid (black)symbols that exactly match what the Rainflow method predicted.
The second spectrum (B) was designed after some of the European standard spectrawith various stress amplitudes that have a number of constant-amplitude cycles, andthe spectrum had a number of cycles that go from maximum–minimum–maximum orminimum–maximum–minimum loading. Some cycles had a Christmas-Tree type loadingthat was interrupted with other stress amplitudes. Again, this spectrum does requirerainflow logic to calculate the correct damage.
The first case (B1) had a constant crack-opening stress (50 MPa) for the completespectrum, as shown in Figure 4a. The calculated crack extension using linear damage,rainflow and FASTRAN are shown in Figure 4b. Out of the 57 cycles, 18 cycles required
Metals 2021, 11, 807 6 of 17
rainflow logic to compute the correct crack extension. FASTRAN agreed with the Rainflowpredicted crack extensions.
Metals 2021, 11, x FOR PEER REVIEW 6 of 19
rainflow and FASTRAN are shown in Figure 4b. Out of the 57 cycles, 18 cycles required rainflow logic to compute the correct crack extension. FASTRAN agreed with the Rain-flow predicted crack extensions.
(a)
(b)
Figure 4. (a) Loading sequence B1. (b) Calculated crack extension per applied cycle for load se-quence B1.
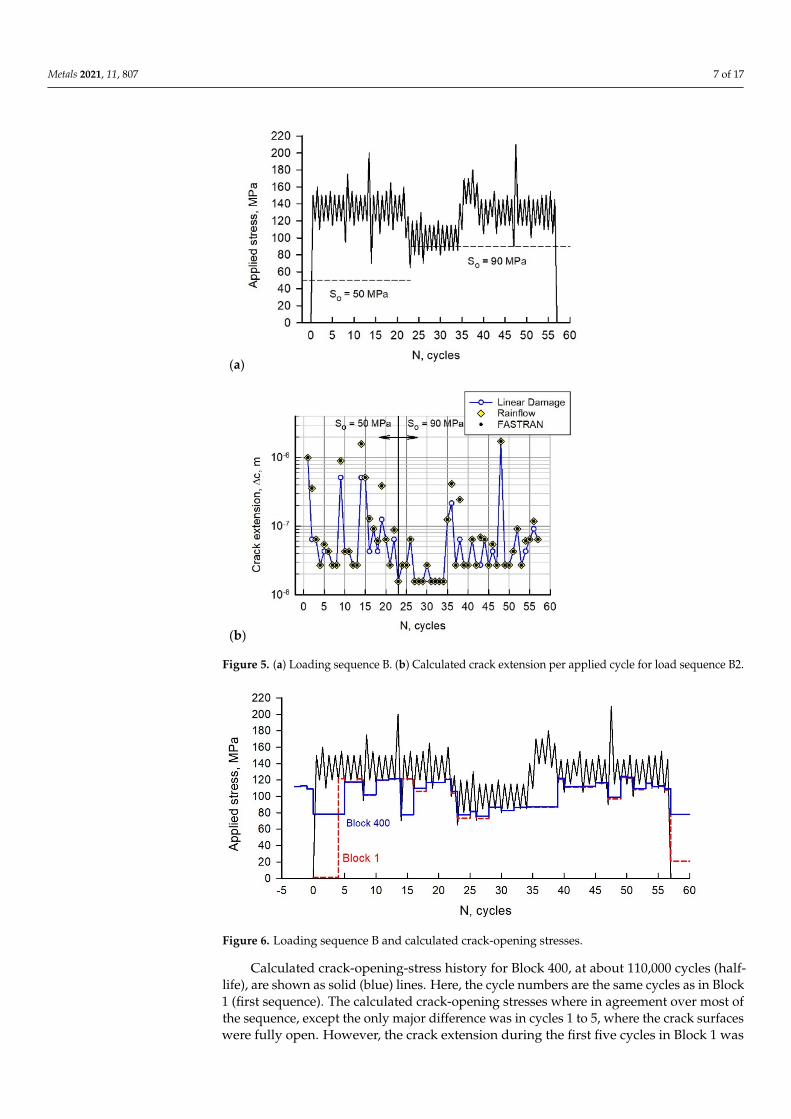
In the FASTRAN code, crack-opening stresses will change as a function of stress his-tory. Thus, to simulate a changing crack-opening stress, the second case (B2) had a con-stant crack-opening stress of 50 MPa for the first 22 cycles and then So = 90 MPa for the remainder of loading, as shown in Figure 5a. Of course, the first 22 cycles have the same behavior as Case B1, but now cycles 23 to 34 do not require rainflow logic (Smin < So) and crack extensions were computed directly from the Paris–Elber relation (Equation (1)). These crack-extension comparisons are shown in Figure 5b. However, the crack exten-sions during cycles 35 to 37 were much less than in Case B1 due to the higher crack-open-ing stress and lower ΔKeff values.
Figure 6 shows the calculated crack-opening stresses from FASTRAN (α = 2) using the full crack-closure model for load sequence B using the cycle-by-cycle option. The re-sults for Block 1 are shown as the dashed (red) lines. The crack-opening stresses are cal-culated at a minimum applied stress and remain constant until the crack closes again at the next minimum applied stress. In many cycles, the crack-tip region was open (Smin > So) during the applied stress amplitudes. The model starts with a “zero” crack-opening stress
Figure 4. (a) Loading sequence B1. (b) Calculated crack extension per applied cycle for load sequence B1.
In the FASTRAN code, crack-opening stresses will change as a function of stresshistory. Thus, to simulate a changing crack-opening stress, the second case (B2) had aconstant crack-opening stress of 50 MPa for the first 22 cycles and then So = 90 MPa forthe remainder of loading, as shown in Figure 5a. Of course, the first 22 cycles have thesame behavior as Case B1, but now cycles 23 to 34 do not require rainflow logic (Smin < So)and crack extensions were computed directly from the Paris–Elber relation (Equation (1)).These crack-extension comparisons are shown in Figure 5b. However, the crack extensionsduring cycles 35 to 37 were much less than in Case B1 due to the higher crack-openingstress and lower ∆Keff values.
Figure 6 shows the calculated crack-opening stresses from FASTRAN (α = 2) using thefull crack-closure model for load sequence B using the cycle-by-cycle option. The resultsfor Block 1 are shown as the dashed (red) lines. The crack-opening stresses are calculatedat a minimum applied stress and remain constant until the crack closes again at the nextminimum applied stress. In many cycles, the crack-tip region was open (Smin > So) duringthe applied stress amplitudes. The model starts with a “zero” crack-opening stress and theopening stresses increase as the crack grows and leaves plastically deformed material inthe wake of the crack tip.
Metals 2021, 11, 807 7 of 17
Metals 2021, 11, x FOR PEER REVIEW 7 of 19
and the opening stresses increase as the crack grows and leaves plastically deformed ma-terial in the wake of the crack tip.
(a)
(b)
Figure 5. (a) Loading sequence B. (b) Calculated crack extension per applied cycle for load se-quence B2.
Figure 5. (a) Loading sequence B. (b) Calculated crack extension per applied cycle for load sequence B2.
Metals 2021, 11, x FOR PEER REVIEW 8 of 19
Figure 6. Loading sequence B and calculated crack-opening stresses.
Figure 6. Loading sequence B and calculated crack-opening stresses.
Calculated crack-opening-stress history for Block 400, at about 110,000 cycles (half-life), are shown as solid (blue) lines. Here, the cycle numbers are the same cycles as in Block1 (first sequence). The calculated crack-opening stresses where in agreement over most ofthe sequence, except the only major difference was in cycles 1 to 5, where the crack surfaceswere fully open. However, the crack extension during the first five cycles in Block 1 was

Metals 2021, 11, 807 8 of 17
a factor of 8 larger than that during the 400th block because of the higher crack-openingstress. Most of the damage from cycles 1 to 5 was from the loading on cycle 1.
4. Fatigue-Crack-Growth and Fracture Tests on 9310 Steel
Compact, C(T), specimens were used to generate the ∆K against rate (dc/dN) data onthe 9310 steel at room temperature and 20 Hertz [20] over a wide range in stress ratios(R = 0.1 to 0.95). These ∆K-rate data are shown in Figure 7. Tests were conducted from nearthreshold to fracture. A BFS gauge was used to monitor crack growth and to measure crack-opening loads using the compliance-offset method. In the low-rate regime, compressionpre-cracking constant amplitude (CPCA) and load reduction (CPLR) methods were usedto generate the ∆K-rate data. In general, the test frequency was dropped to about 5 to8 Hertz as the cracks were grown to failure. The data show the normal spread with the Rvalue but shows more spread in the threshold and fracture regions. In the fracture region,the spread is due to the fracture being controlled by the maximum stress-intensity factorand would not collapse on a ∆K-rate plot. For example, the stress-intensity-factor rangeat failure, ∆Kc = KIe (1 − R), where KIe is the elastic fracture toughness. Thus, high R testswould fracture at a lower ∆Kc value than low R tests. The spread in the threshold regionis suspected to be due to the load-history effects caused by the load-reduction procedureused in the CPLR method. Load-reduction tests, as specified in ASTM E-647 [28], havebeen shown [25,26] to induce more spread in ∆K in the threshold region than the mid-rateregion. The spread has been associated with a rise in the crack-closure behavior duringload-reduction tests [34,35].
Metals 2021, 11, x FOR PEER REVIEW 9 of 19
Calculated crack-opening-stress history for Block 400, at about 110,000 cycles (half-life), are shown as solid (blue) lines. Here, the cycle numbers are the same cycles as in Block 1 (first sequence). The calculated crack-opening stresses where in agreement over most of the sequence, except the only major difference was in cycles 1 to 5, where the crack surfaces were fully open. However, the crack extension during the first five cycles in Block 1 was a factor of 8 larger than that during the 400th block because of the higher crack-opening stress. Most of the damage from cycles 1 to 5 was from the loading on cycle 1.
4. Fatigue-Crack-Growth and Fracture Tests on 9310 Steel Compact, C(T), specimens were used to generate the ΔK against rate (dc/dN) data on
the 9310 steel at room temperature and 20 Hertz [20] over a wide range in stress ratios (R = 0.1 to 0.95). These ΔK-rate data are shown in Figure 7. Tests were conducted from near threshold to fracture. A BFS gauge was used to monitor crack growth and to measure crack-opening loads using the compliance-offset method. In the low-rate regime, com-pression pre-cracking constant amplitude (CPCA) and load reduction (CPLR) methods were used to generate the ΔK-rate data. In general, the test frequency was dropped to about 5 to 8 Hertz as the cracks were grown to failure. The data show the normal spread with the R value but shows more spread in the threshold and fracture regions. In the frac-ture region, the spread is due to the fracture being controlled by the maximum stress-intensity factor and would not collapse on a ΔK-rate plot. For example, the stress-inten-sity-factor range at failure, ΔKc = KIe (1 − R), where KIe is the elastic fracture toughness. Thus, high R tests would fracture at a lower ΔKc value than low R tests. The spread in the threshold region is suspected to be due to the load-history effects caused by the load-reduction procedure used in the CPLR method. Load-reduction tests, as specified in ASTM E-647 [28], have been shown [25,26] to induce more spread in ΔK in the threshold region than the mid-rate region. The spread has been associated with a rise in the crack-closure behavior during load-reduction tests [34,35].
Figure 7. Stress-intensity-factor range against rate for 9310 steel over range in stress ratio (R).
To evaluate the fracture toughness of the material, only the fatigue-crack-growth tests were available. In most tests, the cracks in the C(T) specimens were grown to failure under cyclic loading. Here, the final recorded crack length and the maximum fatigue load were used to calculate KIe (elastic stress-intensity factor at failure), and these results are
Figure 7. Stress-intensity-factor range against rate for 9310 steel over range in stress ratio (R).
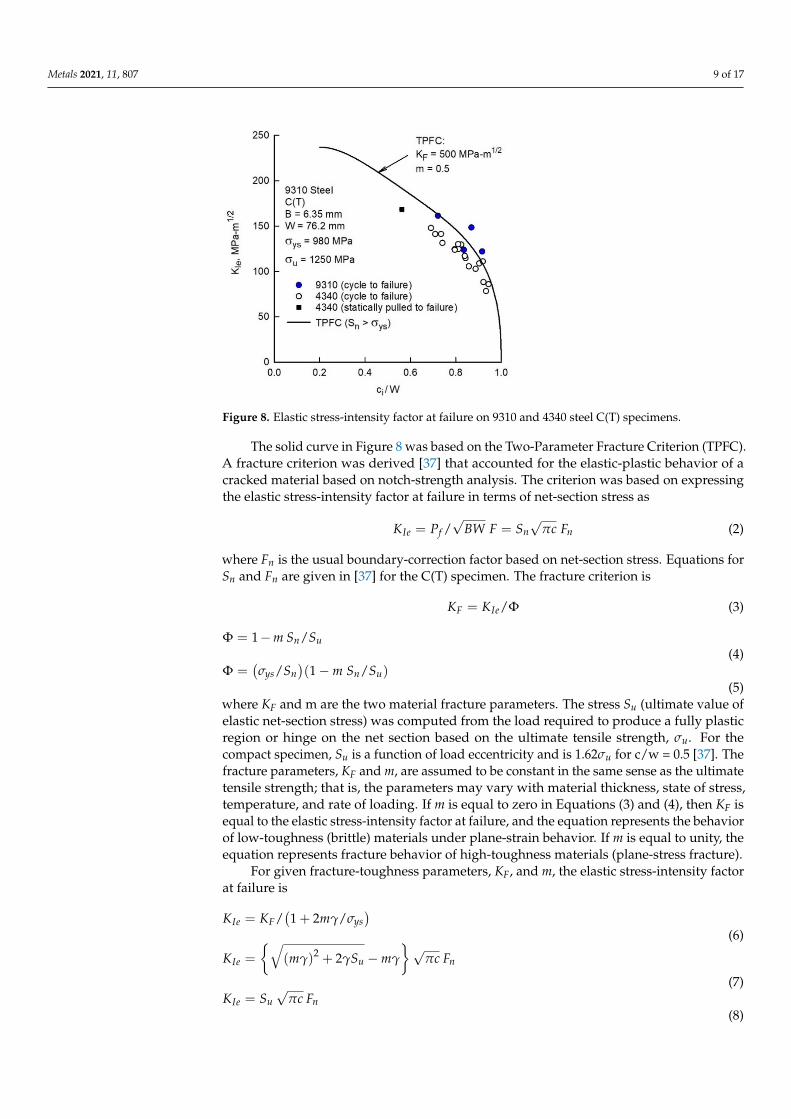
To evaluate the fracture toughness of the material, only the fatigue-crack-growthtests were available. In most tests, the cracks in the C(T) specimens were grown to failureunder cyclic loading. Here, the final recorded crack length and the maximum fatigue loadwere used to calculate KIe (elastic stress-intensity factor at failure), and these results areshown in Figure 8, as solid (blue) circular symbols. Most tests failed at large ci/w ratios(>0.7). For comparison, similar test results conducted on a 4340 steel [36] are shown asopen circular symbols. Here, one 4340 steel specimen was fatigue cracked to a lowercrack-length-to-width ratio and statically pulled to failure (solid square symbol).
Metals 2021, 11, 807 9 of 17
Metals 2021, 11, x FOR PEER REVIEW 10 of 19
shown in Figure 8, as solid (blue) circular symbols. Most tests failed at large ci/w ratios (>0.7). For comparison, similar test results conducted on a 4340 steel [36] are shown as open circular symbols. Here, one 4340 steel specimen was fatigue cracked to a lower crack-length-to-width ratio and statically pulled to failure (solid square symbol).
Figure 8. Elastic stress-intensity factor at failure on 9310 and 4340 steel C(T) specimens.
The solid curve in Figure 8 was based on the Two-Parameter Fracture Criterion (TPFC). A fracture criterion was derived [37] that accounted for the elastic-plastic behav-ior of a cracked material based on notch-strength analysis. The criterion was based on expressing the elastic stress-intensity factor at failure in terms of net-section stress as 𝐾 = 𝑃 /√𝐵𝑊 𝐹 = 𝑆 √𝜋𝑐 𝐹 (2)
where Fn is the usual boundary-correction factor based on net-section stress. Equations for Sn and Fn are given in reference 37 for the C(T) specimen. The fracture criterion is 𝐾 = 𝐾 /Φ (3)Φ = 1 − 𝑚 𝑆 /𝑆 𝑓𝑜𝑟 𝑆 ≤ 𝜎 (4)Φ = (𝜎 /𝑆 )(1 − 𝑚 𝑆 /𝑆 ) 𝑓𝑜𝑟 𝑆 > 𝜎 (5)
where KF and m are the two material fracture parameters. The stress Su (ultimate value of elastic net-section stress) was computed from the load required to produce a fully plastic region or hinge on the net section based on the ultimate tensile strength, σu. For the com-pact specimen, Su is a function of load eccentricity and is 1.62σu for c/w = 0.5 [37]. The fracture parameters, KF and m, are assumed to be constant in the same sense as the ulti-mate tensile strength; that is, the parameters may vary with material thickness, state of stress, temperature, and rate of loading. If m is equal to zero in Equations (3) and (4), then KF is equal to the elastic stress-intensity factor at failure, and the equation represents the behavior of low-toughness (brittle) materials under plane-strain behavior. If m is equal to unity, the equation represents fracture behavior of high-toughness materials (plane-stress fracture).
For given fracture-toughness parameters, KF, and m, the elastic stress-intensity factor at failure is 𝐾 = 𝐾 /(1 + 2𝑚𝛾/𝜎 ) 𝑓𝑜𝑟 𝑆 ≤ 𝜎 (6)𝐾 = (𝑚𝛾) + 2𝛾𝑆 − 𝑚𝛾 √𝜋𝑐 𝐹 𝑓𝑜𝑟 𝑆 > 𝑆 ≤ 𝜎 (7)
Figure 8. Elastic stress-intensity factor at failure on 9310 and 4340 steel C(T) specimens.
The solid curve in Figure 8 was based on the Two-Parameter Fracture Criterion (TPFC).A fracture criterion was derived [37] that accounted for the elastic-plastic behavior of acracked material based on notch-strength analysis. The criterion was based on expressingthe elastic stress-intensity factor at failure in terms of net-section stress as
KIe = Pf /√
BW F = Sn√
πc Fn (2)
where Fn is the usual boundary-correction factor based on net-section stress. Equations forSn and Fn are given in [37] for the C(T) specimen. The fracture criterion is
KF = KIe/Φ (3)
Φ = 1−m Sn/Su f or Sn ≤ σys(4)
Φ =(σys/Sn
)(1−m Sn/Su) f or Sn > σys
(5)where KF and m are the two material fracture parameters. The stress Su (ultimate value ofelastic net-section stress) was computed from the load required to produce a fully plasticregion or hinge on the net section based on the ultimate tensile strength, σu. For thecompact specimen, Su is a function of load eccentricity and is 1.62σu for c/w = 0.5 [37]. Thefracture parameters, KF and m, are assumed to be constant in the same sense as the ultimatetensile strength; that is, the parameters may vary with material thickness, state of stress,temperature, and rate of loading. If m is equal to zero in Equations (3) and (4), then KF isequal to the elastic stress-intensity factor at failure, and the equation represents the behaviorof low-toughness (brittle) materials under plane-strain behavior. If m is equal to unity, theequation represents fracture behavior of high-toughness materials (plane-stress fracture).
For given fracture-toughness parameters, KF, and m, the elastic stress-intensity factorat failure is
KIe = KF/(1 + 2mγ/σys
)f or Sn ≤ σys
(6)
KIe =
{√(mγ)2 + 2γSu −mγ
}√πc Fn f or Su > Sn ≤ σys
(7)KIe = Su
√πc Fn f or Sn = Su
(8)
Metals 2021, 11, 807 10 of 17
where γ = KFσys/[2 Su√
πc Fn]. In 1973, a relationship between KF/E and m [37] was
found for many materials and crack configurations. Herein, the relationship was used tohelp select an m value. As the 9310 steel exhibited a high toughness, an m-value of 0.5was selected. The corresponding KF value was 500 MPa-
√m to fit the 9310 steel fracture
data. Solid curve in Figure 8 was calculated from the TPFC for the 76.2 mm wide compactspecimens. These calculations show how the initial crack length affects the elastic fracturetoughness. In addition, the variation in specimen width (not shown) would greatly affectthe elastic fracture toughness, in that larger width specimens produce large KIe values.
5. Fatigue-Crack-Growth and Crack-Closure Analyses
Crack-opening-stress equations for constant-amplitude loading were developed froman early analytical crack-closure model (So) calculations [38]. As the number of elementswithin the plastic-zone region in the model was increased to 20 [18] and the crack-growthincrement was modelled on a cycle-by-cyclic basis, new So equations were made for asingle crack in a very wide plate under uniform remote applied stress, S. The new set ofequations was developed to fit the results from the revised closure model and, again, gaveSo as a function of stress ratio (R), maximum stress level (Smax/σo) and the constraint factor(α). The new equations are
So/Smax = A0 + A1R+ A2R2 + A3R3 f or R ≥ 0(9)
So/Smax = A0 + A1R f or R < 0(10)
where R = Smin/Smax, Smax < 0.8 σo, and Smin > −σo. The Ai coefficients are functions of αand Smax/σo and are given by
A0 =(
0.9453− 0.514 α + 0.1355 α2 − 0.0133 α3)[cos(β)](0.8 α−0.1) (11)
β = πSmax/(2ασo)
A1
(= 0.5719− 0.1726 α + 0.019 α2
)Smax/σo (12)
A2 = 0.975− A0 − A1 − A3 (13)
A3 = 2A0 + A1 − 1 (14)
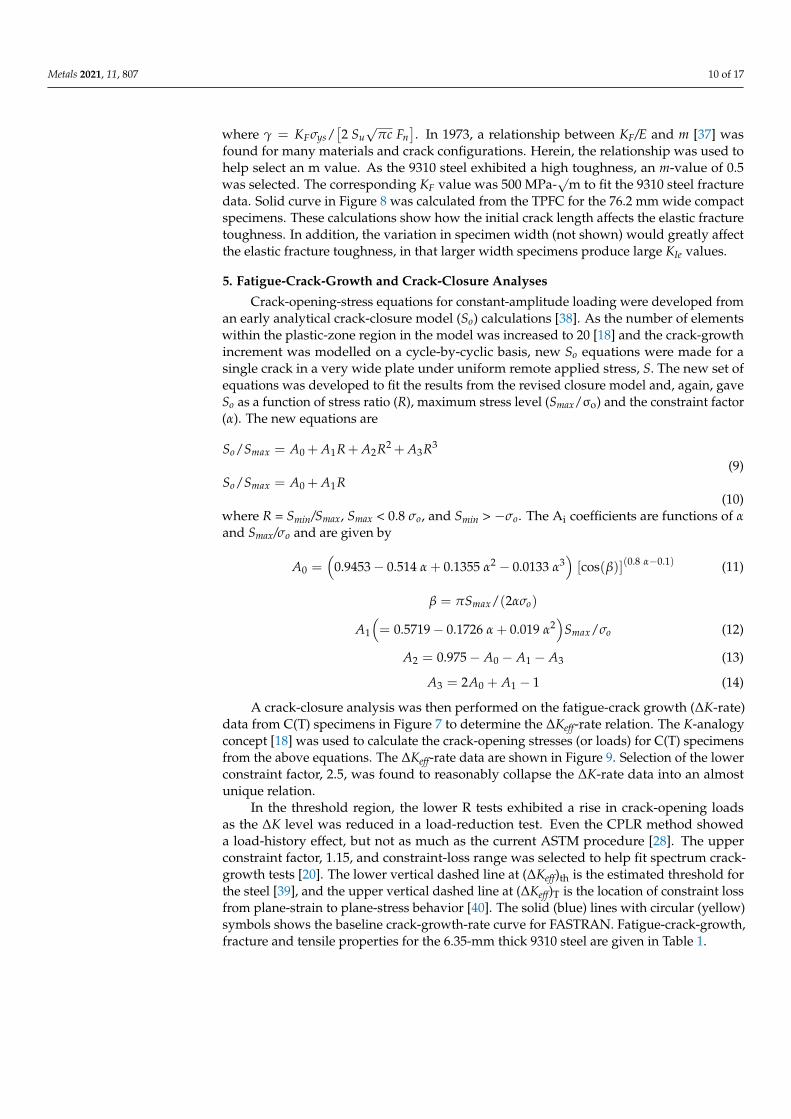
A crack-closure analysis was then performed on the fatigue-crack growth (∆K-rate)data from C(T) specimens in Figure 7 to determine the ∆Keff-rate relation. The K-analogyconcept [18] was used to calculate the crack-opening stresses (or loads) for C(T) specimensfrom the above equations. The ∆Keff-rate data are shown in Figure 9. Selection of the lowerconstraint factor, 2.5, was found to reasonably collapse the ∆K-rate data into an almostunique relation.
In the threshold region, the lower R tests exhibited a rise in crack-opening loadsas the ∆K level was reduced in a load-reduction test. Even the CPLR method showeda load-history effect, but not as much as the current ASTM procedure [28]. The upperconstraint factor, 1.15, and constraint-loss range was selected to help fit spectrum crack-growth tests [20]. The lower vertical dashed line at (∆Keff)th is the estimated threshold forthe steel [39], and the upper vertical dashed line at (∆Keff)T is the location of constraint lossfrom plane-strain to plane-stress behavior [40]. The solid (blue) lines with circular (yellow)symbols shows the baseline crack-growth-rate curve for FASTRAN. Fatigue-crack-growth,fracture and tensile properties for the 6.35-mm thick 9310 steel are given in Table 1.
Metals 2021, 11, 807 11 of 17Metals 2021, 11, x FOR PEER REVIEW 12 of 19
Figure 9. Effective stress-intensity factor range against rate for 9310 steel C(T) specimens.
Table 1. Effective stress-intensity factor range against rate, fracture and tensile properties for 9310 steel (B = 6.35 mm).
ΔKeff, (MPa-m1/2) da/dN and dc/dN (m/cycle) Crack-Growth, Fracture and Tensile Properties
2.30 1.0 × 10⁻¹¹ ΔKo = 0 q = 6 2.45 1.5 × 10⁻¹⁰ α1 = 2.5 at 1.0 × 10⁻⁷ m/cycle 2.80 4.0 × 10⁻¹⁰ α2 = 1.15 at 1.0 × 10⁻⁵ m/cycle 3.50 1.0 × 10⁻⁹ KF = 500 MPa-m1/2 4.40 2.0 × 10⁻⁹ m = 0.5 9.50 1.0 × 10⁻⁸ σys = 980 MPa 20.0 1.0 × 10⁻⁷ σu = 1250 MPa 50.0 8.0 × 10⁻⁷ σo = 1115 MPa
120.0 6.0 × 10⁻⁶ E = 208.6 GPa
6. Fatigue Behavior of Notched Specimens For most fatigue-crack-growth analyses, linear-elastic analyses have been found to
be adequate. The linear-elastic effective stress-intensity factor range developed by Elber [2] is given by Δ𝐾 = (𝑆 − 𝑆 ) √𝜋𝑐 𝐹(𝑐/𝑤) (14)
where Smax is maximum stress, So is crack-opening stress, and F(c/w) is the boundary cor-rection factor. However, for high-stress intensity factors and low-cycle fatigue conditions, linear-elastic analyses are inadequate and nonlinear crack-growth parameters are needed. To account for plasticity, a portion of the Dugdale [41] cyclic-plastic-zone size (ω) has been added to the crack length, c. The cyclic-plastic-zone-corrected effective stress-intensity fac-tor [42,43] is (Δ𝐾 ) = (𝑆 − 𝑆 ) √𝜋𝑑 𝐹(𝑑/𝑤) (15)
where d = c + ω/4 and F(d/w) is the cyclic-plastic-zone-corrected boundary-correction fac-tor. The cyclic plastic zone is given by 𝜛 = (1 − 𝑅 ) 𝜌/4 (16)
where Reff = So/Smax and plastic-zone size (ρ) for a crack in a large plate [41] is
Figure 9. Effective stress-intensity factor range against rate for 9310 steel C(T) specimens.
Table 1. Effective stress-intensity factor range against rate, fracture and tensile properties for 9310 steel(B = 6.35 mm).
∆Keff, (MPa-m1/2) da/dN and dc/dN (m/cycle) Crack-Growth, Fracture andTensile Properties
2.30 1.0 × 10⁻¹¹ ∆Ko = 0 q = 62.45 1.5 × 10⁻¹⁰ α1 = 2.5 at 1.0 × 10⁻⁷ m/cycle2.80 4.0 × 10⁻¹⁰ α2 = 1.15 at 1.0 × 10⁻⁵ m/cycle3.50 1.0 × 10⁻⁹ KF = 500 MPa-m1/2
4.40 2.0 × 10⁻⁹ m = 0.59.50 1.0 × 10⁻⁸ σys = 980 MPa20.0 1.0 × 10⁻⁷ σu = 1250 MPa50.0 8.0 × 10⁻⁷ σo = 1115 MPa120.0 6.0 × 10⁻⁶ E = 208.6 GPa
6. Fatigue Behavior of Notched Specimens
For most fatigue-crack-growth analyses, linear-elastic analyses have been found to beadequate. The linear-elastic effective stress-intensity factor range developed by Elber [2] isgiven by
∆Ke f f = (Smax − So)√
πc F(c/w) (15)
where Smax is maximum stress, So is crack-opening stress, and F(c/w) is the boundary cor-rection factor. However, for high-stress intensity factors and low-cycle fatigue conditions,linear-elastic analyses are inadequate and nonlinear crack-growth parameters are needed.To account for plasticity, a portion of the Dugdale [41] cyclic-plastic-zone size (ω) has beenadded to the crack length, c. The cyclic-plastic-zone-corrected effective stress-intensityfactor [42,43] is
(∆Kp)e f f = (Smax − So)√
πd F(d/w) (16)
where d = c + ω/4 and F(d/w) is the cyclic-plastic-zone-corrected boundary-correctionfactor. The cyclic plastic zone is given by
v = (1− Re f f )2 ρ/4 (17)
where Reff = So/Smax and plastic-zone size (ρ) for a crack in a large plate [41] is
ρ = c {sec[πSmax/(2ασo)]− 1} (18)
Metals 2021, 11, 807 12 of 17
where flow stress, σo, is multiplied by the constraint factor (α). Herein, the cyclic-plastic-zone corrected effective stress-intensity factor range (Equation (17)) will be used in thefatigue-life predictions.
The FASTRAN life-prediction code [18] was used to model crack growth from aninitial micro-structural flaw size to failure and the crack-growth relation used is
dc/dN = C1i[(∆Kp)e f f ]C2i{
1− [∆Ko/(∆Kp)e f f ]p}
/[1− (Kmax/KIe)q] (19)
where C1i and C2i are coefficient and exponent for each linear segment (i = 1 to n), respec-tively. The (∆Kp)eff is cyclic-plastic-zone corrected effective stress-intensity factor, ∆Ko iseffective threshold, Kmax is maximum stress-intensity factor, KIe is elastic fracture toughness(which is, generally, a function of crack length, specimen width, and specimen type), pand q are constants selected to fit test data in either the threshold or fracture regimes,respectively. Herein, no threshold was modeled and ∆Ko was set equal to zero; thus, pwas not needed. Near-threshold behavior was modeled with the multi-linear equation(independent of R). Fracture was modeled using the TPFC (KF and m) [31,37].
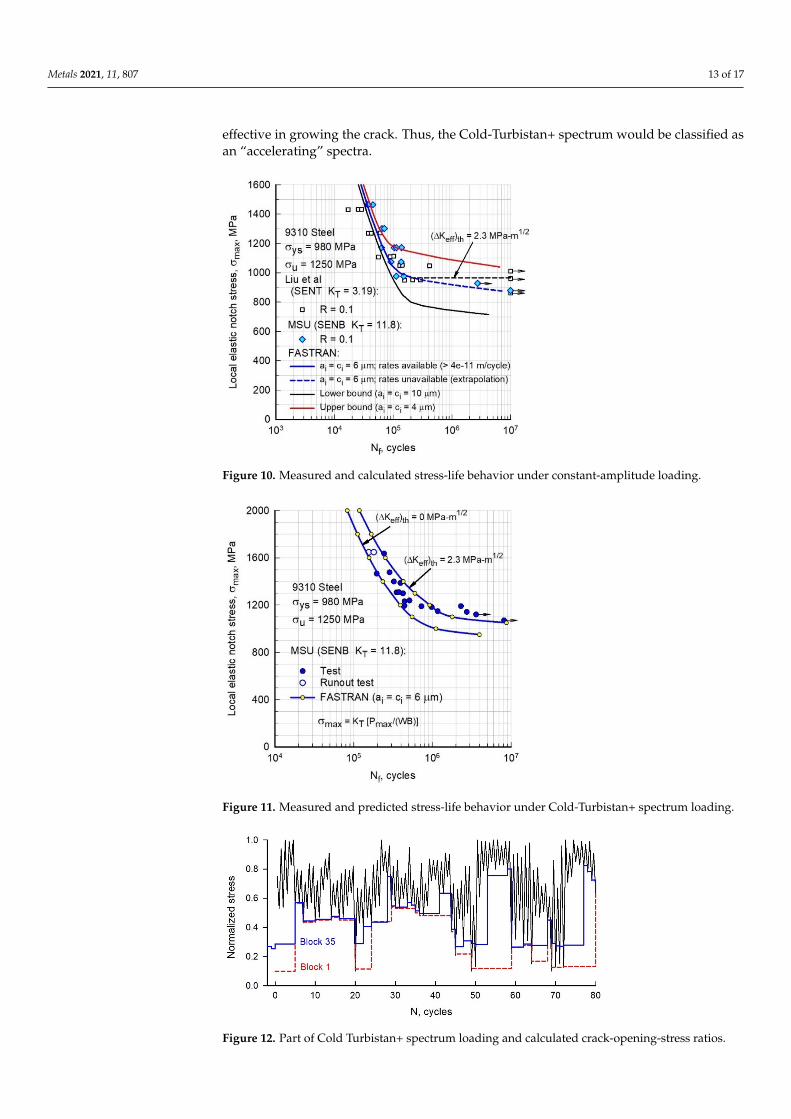
Fatigue tests were conducted on SEN(B) specimens under: (1) constant-amplitudeloading (R = 0.1) and (2) Cold-Turbistan+ loading. The semi-circular edge notch was chem-ically polished. The Cold-Turbistan+ spectrum was obtained from [33], adding a constantload to make the overall R = 0.1 (compression loads not allowed on SEN(B) specimens).Figure 10 shows the constant-amplitude tests plotting σmax (notch root elastic stress) againstcycles to failure (Nf). The square symbols are single-edge-notch tension, SEN(T), speci-mens [44], whereas the solid circular symbols are from the current study. A trial-and-errorprocedure was used to find the 6-µm semi-circular surface flaw at the center of the notchto fit the fatigue data. Herein, the 6-µm flaw is considered an equivalent initial flaw size(EIFS) to fit the S-N behavior under constant-amplitude loading. The solid curve showscalculated lives that used available crack-growth-rate data (rates ≥ 4 × 10⁻¹¹ m/cycle) forσmax ≥ 980 MPa. The dashed (blue) curve used the estimated ∆Keff-rate relation for ratesbelow 4 × 10⁻¹¹ m/cycle (see Figure 9). On Figure 10, the horizontal dashed (black) lineis where ∆Keff = (∆Keff)th = 2.3 MPa
√m. Upper and lower bound calculations were made
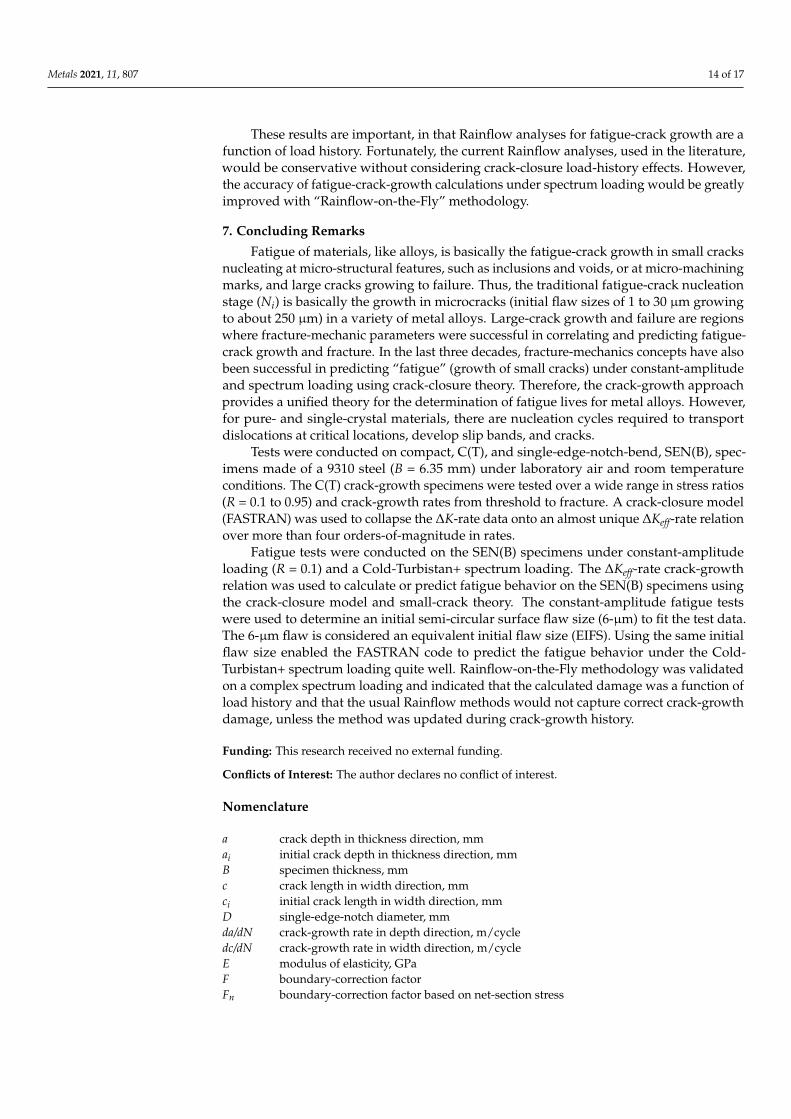
with 4- and 10-µm, respectively.Figure 11 shows the test data (solid circular symbols) under the Cold-Turbistan+
spectrum. The open symbols are the retest of the two runout tests, but at higher appliednotch elastic stress. FASTRAN predictions using the same 6-µm surface flaw fell at thelower bound of the test data using the baseline curve from Figure 9 (Table 1). If a thresholdof 2.3 MPa
√m (no crack growth) was selected, then the cycles to failure were near the
upper bound of the test data. Selecting a ∆Keff-rate relation between the vertical dashedline and the baseline (blue) curve below 10−10 m/cycle, would have given a more accuratepredicted fatigue strength. These results indicate that the selection of the baseline curvein Figure 9 for rates below 10−10 m/cycle is very important. In addition, in the fatigueendurance-limit region, there could also be some build-up of fretting oxide debris on thesmall-crack surfaces, which could increase the fatigue life by elevating the crack-openingloads. Further study is required to include fretting debris on the crack surfaces in theFASTRAN model.
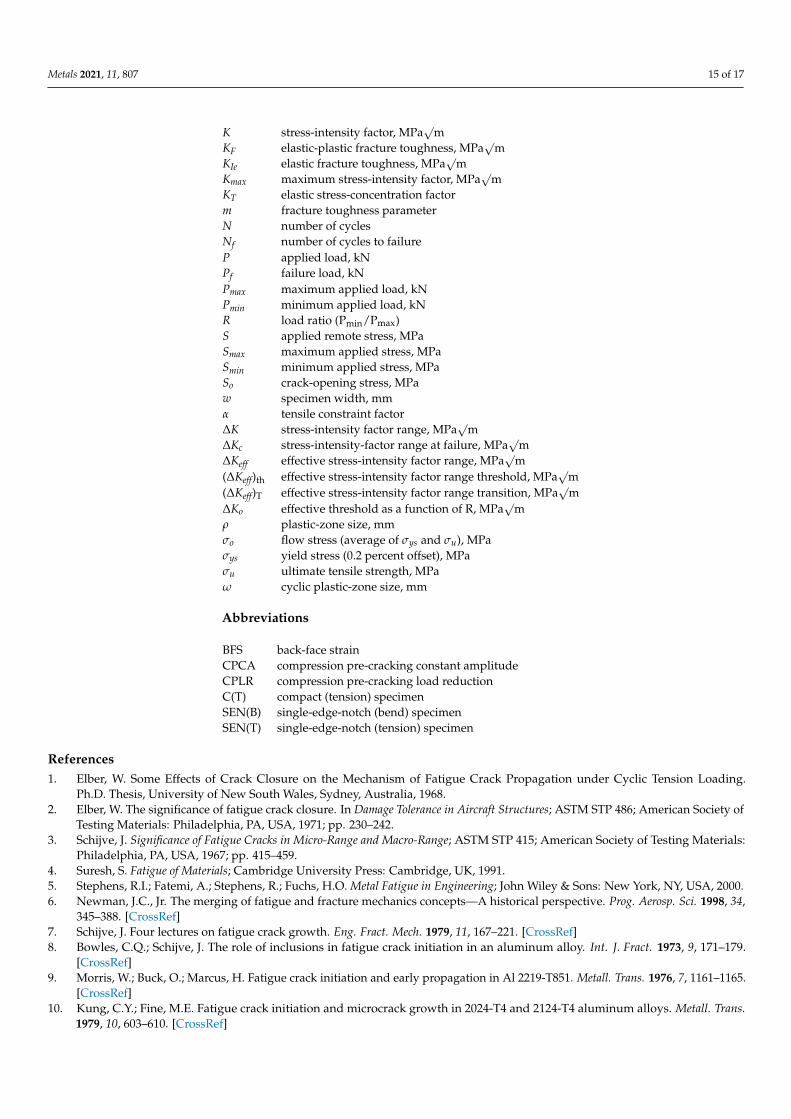
To study the crack-closure behavior and life predictions under the Cold-Turbistan+spectrum, the predicted crack-opening-stress ratios are shown in Figure 12 for a smallportion of the spectrum (first 80 cycles). Here, the FASTRAN code used the full crack-closure model with a constraint factor of 2.5. Calculated crack-opening stresses began atthe minimum stress in the spectrum and the crack-opening stress increases as the crackgrows and leaves plastically deformed material in the wake of the crack tip. Calculationswere also made at Block 35 (about half-life) and show that the crack-opening stressesare, generally, higher than Block 1. These results are somewhat surprising, in that thepredicted crack-opening stresses were generally at the minimum applied stress valuesfor the larger cyclic amplitudes. This would imply that the loading cycle would be fully
Metals 2021, 11, 807 13 of 17
effective in growing the crack. Thus, the Cold-Turbistan+ spectrum would be classified asan “accelerating” spectra.
Metals 2021, 11, x FOR PEER REVIEW 14 of 19
larger cyclic amplitudes. This would imply that the loading cycle would be fully effective in growing the crack. Thus, the Cold-Turbistan+ spectrum would be classified as an “ac-celerating” spectra.
These results are important, in that Rainflow analyses for fatigue-crack growth are a function of load history. Fortunately, the current Rainflow analyses, used in the literature, would be conservative without considering crack-closure load-history effects. However, the accuracy of fatigue-crack-growth calculations under spectrum loading would be greatly improved with “Rainflow-on-the-Fly” methodology.
Figure 10. Measured and calculated stress-life behavior under constant-amplitude loading.
Figure 10. Measured and calculated stress-life behavior under constant-amplitude loading.
Metals 2021, 11, x FOR PEER REVIEW 15 of 19
Figure 11. Measured and predicted stress-life behavior under Cold-Turbistan+ spectrum loading.
Figure 11. Measured and predicted stress-life behavior under Cold-Turbistan+ spectrum loading.
Metals 2021, 11, x FOR PEER REVIEW 16 of 19
Figure 12. Part of Cold Turbistan+ spectrum loading and calculated crack-opening-stress ratios.
7. Concluding Remarks Fatigue of materials, like alloys, is basically the fatigue-crack growth in small cracks
nucleating at micro-structural features, such as inclusions and voids, or at micro-machin-ing marks, and large cracks growing to failure. Thus, the traditional fatigue-crack nuclea-tion stage (Ni) is basically the growth in microcracks (initial flaw sizes of 1 to 30 μm grow-ing to about 250 μm) in a variety of metal alloys. Large-crack growth and failure are re-gions where fracture-mechanic parameters were successful in correlating and predicting fatigue-crack growth and fracture. In the last three decades, fracture-mechanics concepts have also been successful in predicting “fatigue” (growth of small cracks) under constant-amplitude and spectrum loading using crack-closure theory. Therefore, the crack-growth approach provides a unified theory for the determination of fatigue lives for metal alloys. However, for pure- and single-crystal materials, there are nucleation cycles required to transport dislocations at critical locations, develop slip bands, and cracks.
Tests were conducted on compact, C(T), and single-edge-notch-bend, SEN(B), speci-mens made of a 9310 steel (B = 6.35 mm) under laboratory air and room temperature con-ditions. The C(T) crack-growth specimens were tested over a wide range in stress ratios (R = 0.1 to 0.95) and crack-growth rates from threshold to fracture. A crack-closure model (FASTRAN) was used to collapse the ΔK-rate data onto an almost unique ΔKeff-rate relation over more than four orders-of-magnitude in rates.
Fatigue tests were conducted on the SEN(B) specimens under constant-amplitude loading (R = 0.1) and a Cold-Turbistan+ spectrum loading. The ΔKeff-rate crack-growth re-lation was used to calculate or predict fatigue behavior on the SEN(B) specimens using the crack-closure model and small-crack theory. The constant-amplitude fatigue tests were used to determine an initial semi-circular surface flaw size (6-μm) to fit the test data. The 6-μm flaw is considered an equivalent initial flaw size (EIFS). Using the same initial flaw size enabled the FASTRAN code to predict the fatigue behavior under the Cold-Tur-bistan+ spectrum loading quite well. Rainflow-on-the-Fly methodology was validated on a complex spectrum loading and indicated that the calculated damage was a function of load history and that the usual Rainflow methods would not capture correct crack-growth damage, unless the method was updated during crack-growth history.
Funding: This research received no external funding
Conflicts of Interest: The author declares no conflict of interest.
Nomenclature
Figure 12. Part of Cold Turbistan+ spectrum loading and calculated crack-opening-stress ratios.
Metals 2021, 11, 807 14 of 17
These results are important, in that Rainflow analyses for fatigue-crack growth are afunction of load history. Fortunately, the current Rainflow analyses, used in the literature,would be conservative without considering crack-closure load-history effects. However,the accuracy of fatigue-crack-growth calculations under spectrum loading would be greatlyimproved with “Rainflow-on-the-Fly” methodology.
7. Concluding Remarks
Fatigue of materials, like alloys, is basically the fatigue-crack growth in small cracksnucleating at micro-structural features, such as inclusions and voids, or at micro-machiningmarks, and large cracks growing to failure. Thus, the traditional fatigue-crack nucleationstage (Ni) is basically the growth in microcracks (initial flaw sizes of 1 to 30 µm growingto about 250 µm) in a variety of metal alloys. Large-crack growth and failure are regionswhere fracture-mechanic parameters were successful in correlating and predicting fatigue-crack growth and fracture. In the last three decades, fracture-mechanics concepts have alsobeen successful in predicting “fatigue” (growth of small cracks) under constant-amplitudeand spectrum loading using crack-closure theory. Therefore, the crack-growth approachprovides a unified theory for the determination of fatigue lives for metal alloys. However,for pure- and single-crystal materials, there are nucleation cycles required to transportdislocations at critical locations, develop slip bands, and cracks.
Tests were conducted on compact, C(T), and single-edge-notch-bend, SEN(B), spec-imens made of a 9310 steel (B = 6.35 mm) under laboratory air and room temperatureconditions. The C(T) crack-growth specimens were tested over a wide range in stress ratios(R = 0.1 to 0.95) and crack-growth rates from threshold to fracture. A crack-closure model(FASTRAN) was used to collapse the ∆K-rate data onto an almost unique ∆Keff-rate relationover more than four orders-of-magnitude in rates.
Fatigue tests were conducted on the SEN(B) specimens under constant-amplitudeloading (R = 0.1) and a Cold-Turbistan+ spectrum loading. The ∆Keff-rate crack-growthrelation was used to calculate or predict fatigue behavior on the SEN(B) specimens usingthe crack-closure model and small-crack theory. The constant-amplitude fatigue testswere used to determine an initial semi-circular surface flaw size (6-µm) to fit the test data.The 6-µm flaw is considered an equivalent initial flaw size (EIFS). Using the same initialflaw size enabled the FASTRAN code to predict the fatigue behavior under the Cold-Turbistan+ spectrum loading quite well. Rainflow-on-the-Fly methodology was validatedon a complex spectrum loading and indicated that the calculated damage was a function ofload history and that the usual Rainflow methods would not capture correct crack-growthdamage, unless the method was updated during crack-growth history.
Funding: This research received no external funding.
Conflicts of Interest: The author declares no conflict of interest.
Nomenclature
a crack depth in thickness direction, mmai initial crack depth in thickness direction, mmB specimen thickness, mmc crack length in width direction, mmci initial crack length in width direction, mmD single-edge-notch diameter, mmda/dN crack-growth rate in depth direction, m/cycledc/dN crack-growth rate in width direction, m/cycleE modulus of elasticity, GPaF boundary-correction factorFn boundary-correction factor based on net-section stress
Metals 2021, 11, 807 15 of 17
K stress-intensity factor, MPa√
mKF elastic-plastic fracture toughness, MPa
√m
KIe elastic fracture toughness, MPa√
mKmax maximum stress-intensity factor, MPa
√m
KT elastic stress-concentration factorm fracture toughness parameterN number of cyclesNf number of cycles to failureP applied load, kNPf failure load, kNPmax maximum applied load, kNPmin minimum applied load, kNR load ratio (Pmin/Pmax)S applied remote stress, MPaSmax maximum applied stress, MPaSmin minimum applied stress, MPaSo crack-opening stress, MPaw specimen width, mmα tensile constraint factor∆K stress-intensity factor range, MPa
√m
∆Kc stress-intensity-factor range at failure, MPa√
m∆Keff effective stress-intensity factor range, MPa
√m
(∆Keff)th effective stress-intensity factor range threshold, MPa√
m(∆Keff)T effective stress-intensity factor range transition, MPa
√m
∆Ko effective threshold as a function of R, MPa√
mρ plastic-zone size, mmσo flow stress (average of σys and σu), MPaσys yield stress (0.2 percent offset), MPaσu ultimate tensile strength, MPaω cyclic plastic-zone size, mm
Abbreviations
BFS back-face strainCPCA compression pre-cracking constant amplitudeCPLR compression pre-cracking load reductionC(T) compact (tension) specimenSEN(B) single-edge-notch (bend) specimenSEN(T) single-edge-notch (tension) specimen
References1. Elber, W. Some Effects of Crack Closure on the Mechanism of Fatigue Crack Propagation under Cyclic Tension Loading.
Ph.D. Thesis, University of New South Wales, Sydney, Australia, 1968.2. Elber, W. The significance of fatigue crack closure. In Damage Tolerance in Aircraft Structures; ASTM STP 486; American Society of
Testing Materials: Philadelphia, PA, USA, 1971; pp. 230–242.3. Schijve, J. Significance of Fatigue Cracks in Micro-Range and Macro-Range; ASTM STP 415; American Society of Testing Materials:
Philadelphia, PA, USA, 1967; pp. 415–459.4. Suresh, S. Fatigue of Materials; Cambridge University Press: Cambridge, UK, 1991.5. Stephens, R.I.; Fatemi, A.; Stephens, R.; Fuchs, H.O. Metal Fatigue in Engineering; John Wiley & Sons: New York, NY, USA, 2000.6. Newman, J.C., Jr. The merging of fatigue and fracture mechanics concepts—A historical perspective. Prog. Aerosp. Sci. 1998, 34,
345–388. [CrossRef]7. Schijve, J. Four lectures on fatigue crack growth. Eng. Fract. Mech. 1979, 11, 167–221. [CrossRef]8. Bowles, C.Q.; Schijve, J. The role of inclusions in fatigue crack initiation in an aluminum alloy. Int. J. Fract. 1973, 9, 171–179.
[CrossRef]9. Morris, W.; Buck, O.; Marcus, H. Fatigue crack initiation and early propagation in Al 2219-T851. Metall. Trans. 1976, 7, 1161–1165.
[CrossRef]10. Kung, C.Y.; Fine, M.E. Fatigue crack initiation and microcrack growth in 2024-T4 and 2124-T4 aluminum alloys. Metall. Trans.
1979, 10, 603–610. [CrossRef]
Metals 2021, 11, 807 16 of 17
11. Newman, J.C., Jr.; Edwards, P.R. Short-Crack Growth Behaviour in an Aluminum Alloy—An AGARD Cooperative Test Programme;AGARD Report No. 732; North Atlantic Treaty Organization: Neuilly Sur Seine, France, 1988.
12. Mom, A.J.A.; Raizenne, M.D. (Eds.) AGARD Engine Disc Cooperative Test Programme; AGARD Report No. 766; North AtlanticTreaty Organization: Neuilly Sur Seine, France, 1988.
13. Edwards, P.R.; Newman, J.C., Jr. (Eds.) Short-Crack Growth Behaviour in Various Aircraft Materials; AGARD Report No. 767; NorthAtlantic Treaty Organization: Neuilly Sur Seine, France, 1990.
14. Newman, J.C., Jr.; Wu, X.R.; Venneri, S.L.; Li, C.G. Small-Crack Effects in High-Strength Aluminum Alloys—A NASA/CAE CooperativeProgram; NASA RP-1309; National Aeronautics and Space Administration: Washington, WA, USA, 1994.
15. Newman, J.C., Jr. Application of a closure model to predict crack growth in three engine disc materials. Int. J. Fract. 1996, 80,193–218. [CrossRef]
16. Newman, J.C., Jr.; Phillips, E.P.; Everett, R.A., Jr. Fatigue Analyses Under Constant- and Variable-Amplitude Loading Using Small-CrackTheory; NASA TM-209329; National Aeronautics and Space Administration: Washington, WA, USA, 1999.
17. Murakami, Y. The rainflow method in fatigue. In Proceedings of the International Symposium Fatigue Damage Measurementand Evaluation under Complex Loadings, Fukuoka, Japan, 25–26 July 1991.
18. Newman, J.C., Jr. FASTRAN—A Fatigue Crack Growth Life Prediction Code Based on the Crack-Closure Concept, Version 5.4 User Guide;Fatigue and Fracture Associates LLC: Eupora, MS, USA, 2013.
19. Newman, J.C., Jr. Rainflow-on-the-fly methodology: Fatigue-crack growth under aircraft spectrum loading. Adv. Mater. Res. 2014,891, 771–776. [CrossRef]
20. Newman, J.C., Jr.; Yamada, Y.; Ziegler, B.M.; Shaw, J.W. Small- and Large-Crack Databases for Rotorcraft Materials; DOT/FAA/TC-13/29; Department of Transportation: Washington, DC, USA, 2014.
21. Topper, T.H.; Au, P.; El Haddad, M.L. The effects of compressive overloads on the threshold stress intensity for short cracks. InProceedings of the AGARD Conference Proceedings No. 328, Toronto, ON, Canada, 19–24 September 1982; pp. 11.1–11.7.
22. Suresh, S. Crack initiation in cyclic compression and its application. Eng. Fract. Mech. 1985, 21, 453–463. [CrossRef]23. Pippan, R. The growth of short cracks under cyclic compression. Fatigue Fract. Eng. Mater. Struct. 1987, 9, 319–328. [CrossRef]24. Pippan, R.; Plöchl, L.; Klanner, F.; Stüwe, H.P. The use of fatigue specimens pre-cracked in compression for measuring threshold
values and crack growth. ASTM J. Test. Eval. 1994, 22, 98–106.25. Newman, J.C., Jr.; Schneider, J.; Daniel, A.; McKnight, D. Compression pre-cracking to generate near threshold fatigue-crack-
growth rates in two aluminum alloys. Int. J. Fatigue 2005, 27, 1432–1440. [CrossRef]26. Newman, J.C., Jr.; Ruschau, J.J.; Hill, M.R. Improved test method for very low fatigue-crack-growth-rate data. Fatigue Fract. Eng.
Mater. Struct. 2011, 34, 270–279. [CrossRef]27. Hudak, S., Jr.; Saxena, S.; Bucci, R.; Malcolm, R. Development of Standard Methods of Testing and Analyzing Fatigue Crack Growth Rate
Data; AFML TR 78-40; Materials Laboratory: WPAFB, OH, USA, 1978.28. ASTM. Standard Test Method for Measurement of Fatigue Crack Growth Rates; E-647; ASTM International: West Conshohocken, PA,
USA, 2015.29. Swain, M.H.; Everett, R.A.; Newman, J.C., Jr.; Phillips, E.P. The growth of short cracks in 4340 steel and aluminum-lithium 2090.
In AGARD Report No. 767; Edwards, P.R., Newman, J.C., Jr., Eds.; North Atlantic Treaty Organization: Neuilly Sur Seine, France,1990; pp. 7.1–7.30.
30. Herman, W.; Hertzberg, R.; Jaccard, R. A simplified laboratory approach for the prediction of short crack behavior in engineeringstructures. Fatigue Fract. Eng. Mater. Struct. 1988, 11, 303–320. [CrossRef]
31. Newman, J.C., Jr. Fracture analysis of various cracked configurations in sheet and plate materials. In Properties Related to FractureToughness; ASTM STP 605; American Society of Testing Materials: Philadelphia, PA, USA, 1976; pp. 104–123.
32. Ziegler, B.M. Fatigue and Fracture Testing and Analysis on Four Materials. Ph.D. Thesis, Mississippi State University, MississippiState, MS, USA, April 2011.
33. ten Have, A.A. Cold Turbistan—Final Definition of a Standardized Fatigue Test Loading Sequence for Tactical Aircraft Cold Section EngineDisc; NLR TR 87054 L; Nationaal Lucht-en Ruimtevaartlaboratorium: Delft, The Netherlands, 1987.
34. Yamada, Y.; Newman, J.C., Jr. Crack closure under high load-ratio conditions for Inconel 718 near threshold behavior. Eng. Fract.Mech. 2009, 76, 209–220. [CrossRef]
35. Yamada, Y.; Newman, J.C., Jr. Crack closure behavior of 2324-T39 aluminum alloy near threshold conditions for high load ratioand constant Kmax tests. Int. J. Fatigue 2009, 31, 1780–1787. [CrossRef]
36. Newman, J.C., Jr.; Vizzini, A.; Yamada, Y. Fatigue Crack Growth Databases and Analyses for Threshold Behavior in Rotorcraft Materials;DOT/FAA/AR-10/3; Department of Transportation: Washington, DC, USA, 2010.
37. Newman, J.C., Jr. Fracture analysis of surface- and through-cracked sheets and plates. Eng. Fract. Mech. 1973, 5, 667–689.[CrossRef]
38. Newman, J.C., Jr. A crack-opening stress equation for fatigue crack growth. Int. J. Fract. 1984, 24, R131–R135. [CrossRef]39. Newman, J.C., Jr.; Kota, K.; Lacy, T.E. Fatigue and crack-growth behavior in a titanium alloy under constant-amplitude and
spectrum loading. Eng. Fract. Mech. 2018, 187, 211–224. [CrossRef]40. Newman, J.C.; Beukers, A. Effects of constraint on crack growth under aircraft spectrum loading. In Fatigue of Aircraft Materials;
Beukers, A., deJong, T., Sinke, J., Vlot, A., Vogelesang, L.B., Eds.; Langley Research Center: Delft, The Netherlands, 1992;pp. 83–109.

Metals 2021, 11, 807 17 of 17
41. Dugdale, D.S. Yielding of steel sheets containing slits. J. Mech. Phys. Solids 1960, 8, 100–104. [CrossRef]42. Newman, J.C., Jr. Fracture Mechanics Parameters for Small Fatigue Cracks; ASTM STP 1149; American Society of Testing Materials:
West Conshohocken, PA, USA, 1992; pp. 6–33.43. Newman, J.C., Jr.; Swain, M.H.; Phillips, E.P. An assessment of the small-crack effect for 2024-T3. In Small Fatigue Cracks;
Ritchie, R.O., Lankford, J., Eds.; The Metallurgical Society, Inc.: Warrendale, PA, USA, 1986; pp. 427–452.44. Liu, J.Z.; Wu, X.R.; Ding, C.F.; Hu, B.R.; Wang, L.F.; Annigeri, B.; Vestergaard, L.H.; Romanowski, A.; Schneider, G.J.; Forth, S.C.
Crack growth behavior and fatigue-life prediction based on worst-case near-threshold data of a large crack for 9310 steel. FatigueFract. Eng. Mater. Struct. 2002, 25, 467–480. [CrossRef]