Fatigue life evaluation of aligned plant fibre composites through S–N curves and constant-life...
29
Page 1 of 29 Cite as: Shah DU, Schubel PJ, Clifford MJ, Licence P. Composites Science and Technology (2013). 74: p. 139-149. http://dx.doi.org/10.1016/j.compscitech.2012.10.015 Fatigue life evaluation of aligned plant fibre composites through S-N curves and constant-life diagrams Darshil U. Shah a *, Peter J. Schubel a , Mike J. Clifford a , Peter Licence b a Polymer Composites Group, Division of Materials, Mechanics and Structures, Faculty of Engineering, The University of Nottingham, Nottingham, NG7 2RD, UK b School of Chemistry, The University of Nottingham, Nottingham, NG7 2RD, UK *Corresponding author; E-mail: [email protected] Abstract There is a noticeable lack of fatigue data on plant fibre composites (PFCs) which seriously limits their prospective use in fatigue critical components. The objective of this manuscript is to provide a complete set of fatigue data on vacuum infused aligned PFCs. S-N lifetime diagrams have been constructed to investigate the effect of i) plant fibre type/quality, ii) fibre content, iii) textile architecture, and iv) stress ratio, on PFC cyclic loading behaviour. At each stage, the fatigue performance of PFCs is compared to that of E-glass/polyester (GFRP) composites. A comprehensive constant-life diagram has been generated to facilitate life prediction of PFC components. While plant fibre type and quality, textile architecture and composite fibre content have a significant impact on the static properties, they have little impact on the material fatigue strength coefficient b (which dictates the slope of the S-N curve). In essence, higher static properties are a sign of superior fatigue loading capacities throughout their lifetime. Increasing stress ratios lead to improved fatigue performance in PFCs. Fracture mechanisms and modes are the same for composites made from three different bast fibres, but depend on fibre content, textile architecture and stress ratios. Although the absolute fatigue performance of GFRPs is far superior to PFCs, it is a revelation to find that fatigue strength degradation rates are lower in PFCs than in GFRP. Keywords: A. Polymer-matrix composites (PMCs); B. Fatigue; D. Life prediction; Natural fibres
Transcript of Fatigue life evaluation of aligned plant fibre composites through S–N curves and constant-life...
Page 1 of 29
Cite as: Shah DU, Schubel PJ, Clifford MJ, Licence P. Composites Science and
Technology (2013). 74: p. 139-149. http://dx.doi.org/10.1016/j.compscitech.2012.10.015
Fatigue life evaluation of aligned plant fibre composites through S-N curves and constant-life diagrams
Darshil U. Shaha*, Peter J. Schubela, Mike J. Clifforda, Peter Licenceb
a Polymer Composites Group, Division of Materials, Mechanics and Structures, Faculty of
Engineering, The University of Nottingham, Nottingham, NG7 2RD, UK
b School of Chemistry, The University of Nottingham, Nottingham, NG7 2RD, UK
*Corresponding author; E-mail: [email protected]
Abstract
There is a noticeable lack of fatigue data on plant fibre composites (PFCs) which
seriously limits their prospective use in fatigue critical components. The objective of this
manuscript is to provide a complete set of fatigue data on vacuum infused aligned PFCs.
S-N lifetime diagrams have been constructed to investigate the effect of i) plant fibre
type/quality, ii) fibre content, iii) textile architecture, and iv) stress ratio, on PFC cyclic
loading behaviour. At each stage, the fatigue performance of PFCs is compared to that of
E-glass/polyester (GFRP) composites. A comprehensive constant-life diagram has been
generated to facilitate life prediction of PFC components.
While plant fibre type and quality, textile architecture and composite fibre content have a
significant impact on the static properties, they have little impact on the material fatigue
strength coefficient b (which dictates the slope of the S-N curve). In essence, higher static
properties are a sign of superior fatigue loading capacities throughout their lifetime.
Increasing stress ratios lead to improved fatigue performance in PFCs. Fracture
mechanisms and modes are the same for composites made from three different bast
fibres, but depend on fibre content, textile architecture and stress ratios. Although the
absolute fatigue performance of GFRPs is far superior to PFCs, it is a revelation to find
that fatigue strength degradation rates are lower in PFCs than in GFRP.
Keywords: A. Polymer-matrix composites (PMCs); B. Fatigue; D. Life prediction;
Natural fibres
Page 2 of 29
1 Introduction
Natural fibres for composite applications have become a topic of growing interest. Plant
fibres like flax, hemp and jute are viewed as eco-friendly substitutes to traditional
composite reinforcements, specifically E-glass [1-6]. As 87% of the 8.7 million tonne
global fibre reinforced plastics (FRP) market is based on glass fibres [7], plant fibres and
their composites have a great opportunity for development and market capture. While the
use of plant fibres (non-wood and cotton) in composites has increased in the EU from
15,000 tonnes in 1999 to 30,000 tonnes in 2005 to 45,000 tonnes in 2010 [4, 8], today
non-wood plant fibre composites (PFCs) make up only ~1.9% of the 2.4 million tonne
EU FRP market [8]. By application, over 95% of PFCs are used for non-structural
automotive components, manufactured primarily via compression moulding [3, 8].
Although the usage of PFCs is on the rise, certain aspects of their behaviour are still
inadequately understood/investigated. The perceived variability in properties, moisture
sensitivity and water sorption properties, fire retardation properties, complete life-cycle
analysis, durability and recyclability, and mechanical properties when subjected to
atypical structural loading (off-axis, multi-axial, high-strain rate, creep and fatigue), are
some topics that require due attention, particularly if PFCs are to be seriously considered
for structural applications. In particular, there is a noticeable lack of fatigue data on PFCs,
which seriously limits their prospective use in fatigue critical components.
1.1 Literature review A few researchers have attempted to uncover the fatigue behaviour of plant fibres and
their composites. Investigating the cyclic loading behaviour of single leaf fibres, Spatz et
al. [9] observed that the fibre elastic modulus increased with subsequent loading cycles
due to the progressive reorientation of the cellulose microfibrils towards the loading
direction. Baley [10] and Silva et al. [11] also reported this strain hardening behaviour for
flax and sisal fibres. For instance, the flax fibre elastic modulus can increase by 60-80%
between the 1st and the 200th cycle (from 40 GPa to 72 GPa) [10]. With an average UTS
of 400 MPa, sisal fibres can survive at least 106 cycles when subjected to a ratio of
maximum applied fatigue stress to ultimate tensile strength Smax/UTS of 0.5 [11]. The
slope of the S-N curve for a single sisal fibre is ~9% of the UTS per decade of cycles
Page 3 of 29
[11]. In comparison, E-glass fibres with average UTS of 2130 MPa survive at least 106
cycles when subjected to a higher Smax/UTS of 0.8 with their fatigue strength degrading at
a slower rate of 3% per decade of cycles [12]. The fatigue fracture surface of plant fibres
shows formation of micro-cracks in the secondary cell wall, followed by subsequent
propagation to the middle lamellae and delamination between adjacent fibres [11, 13]. In
addition, a characteristic peeling-off of the primary/secondary cell wall layers is also
observed, due to degradation of the cellulosic fibrillar structure and the weakening of the
cellulose/lignin-hemicellulose interface, with increasing load cycles [11, 13].
The fatigue deformation mechanism of a fibre reinforced composite is more complex and
largely dependent on damage accumulation at the fibre/matrix interface [14]. Recently,
Liang et al. [15] compared the tension-tension fatigue behaviour of biaxial flax and glass
epoxy composites. The authors found that while glass/epoxy composites exhibit a higher
resistance to fatigue loading due to their higher static strength, their steeper stress-life (S-
N) curve implies a more significant decrease in fatigue strength with respect to cycles to
failure. In fact, the fatigue stress level drops by 21 MPa/decade for glass/epoxy (UTS of
103 MPa), but by only 7 MPa/decade for flax/epoxy (UTS of 79 MPa). Importantly, the
106 cycle fatigue strength of glass/epoxy (50 MPa) and flax/epoxy (40 MPa) is half their
respective UTS. In composite materials, fatigue damage does not always immediately
reduce the strength of the composite, although it often reduces the stiffness [14]. Liang et
al. [15] reported that while the stiffness of glass/epoxy reduced by 50-70% during the
fatigue life, flax/epoxy composites offered a more stable fatigue performance with a
decrease in stiffness of only 15-20%.
In an extensive study on fibre and interface parameters affecting the tension-tension
fatigue behaviour of PFCs, Gassan [16, 17] recorded the dynamic stress-strain curve and
calculated the specific damping capacity SDC as a value indicative of progressive
material damage. The author found that PFCs with i) fibres of higher strength and
modulus, ii) improved fibre/matrix interface, iii) unidirectional (UD) plies rather than
biaxial architecture, or iv) higher fibre content, possess a) higher damage initiation loads,
b) comparable or lower damage propagation rates, and c) higher failure loads.
Page 4 of 29
Presenting data in the more convenient format of S-N diagrams and constant life
diagrams (albeit for only two stress ratios R), Towo and Ansell [18, 19] studied the effect
of fibre alkali treatment on the fatigue properties of UD sisal composites. They observed
that treated fibre composites exhibit higher static strengths but steeper S-N curves,
leading to better fatigue load carrying capacities for up to ~108 cycles.
Finally, Isaac and co-workers [20-22] have looked into the fatigue properties of non-
woven random mat hemp/polyester composites subjected to low-velocity impact damage,
and water immersion. While it was expected that the fatigue performance of impact
damaged hemp composites would be extremely poor, it was surprising to discover that
water immersion had negligible effect on the S-N curve of the hemp/polyester composite.
At present, there are only limited papers that enable the preliminary design of PFCs
against fatigue. The objective of this manuscript is to provide a complete set of fatigue
data on vacuum-infused aligned PFCs to enable the design of a PFC component against
fatigue. Recently, the authors of this article have applied the data for the fatigue design
and life prediction of a 3.5m long hemp/polyester wind turbine blade [23, 24]. A primary
aim of this article is to characterise the fatigue performance of aligned PFCs through S-N
lifetime diagrams, and specifically investigate the effect of i) plant fibre type, ii) fibre
volume fraction, iii) textile architecture, and iv) stress ratio, on PFC cyclic loading
behaviour. At each stage, the fatigue performance of PFCs has been compared to that of
E-glass/polyester. In addition, to facilitate fatigue life prediction of a PFC component, a
comprehensive constant-life diagram is generated.
2 Experiments
2.1 Reinforcement materials Four commercially available plant fibre yarns/rovings were used as composite
reinforcements. The material properties of the four yarns are tabulated in Table 1. The
yarns are denoted according to their fibre type and twist level; so, J190 is a jute yarn with
a twist level of 190 tpm. The selected yarns enabled studying the effect of fibre type (jute,
hemp and flax) and fibre quality (F50 and F20) on PFC fatigue performance. Note that
fibre quality is defined ‘qualitatively’ by the source of the fibre/yarn and the mechanical

Page 5 of 29
properties of the resulting composite. F50 and F20 yarns/rovings are obtained from
different sources (Table 1) and the static strength of composites made from the yarns are
very different (Table 2). Here, F20 is considered as a yarn with high-quality fibres, while
F50 is a yarn with low-quality fibres.
Table 1. List of plant fibre material and their properties (mean ± stdv.)
Yarn
ID
Fibre
Type Supplier
Price*
[£/kg]
Density†
[gcm-3]
Linear
density†
[tex]
Twist
level†
[tpm]
Apparent
yarn diameter†
[mm]
J190 Jute Janata and Sadat Jute Ltd.
(Bangladesh) ~1.1 1.433 ± 0.005 206 ± 21 190 0.452
H180 Hemp Safilin (Poland) ~7.6 1.531 ± 0.003 278 ± 17 180 0.488
F50 Flax Composites Evolution (UK) ~10.0 1.529 ± 0.003 229 ± 22 50 0.468
F20 Flax Safilin (Poland) ~13.3 1.574 ± 0.004 396 ± 16 20 0.623
*The price of yarn/roving quoted is approximate and based on small quantities. Prices reduce significantly with high quantities (> 5 tonnes). For reference, the price of raw flax/hemp fibre ranges between 0.5-1.5 £/kg, while the price of E-glass is ~1.3 £/kg [25]. †Measured in Ref. [26]. Note that the packing fraction also varies for the different yarns. The ‘apparent’ yarn diameter is based on a measured cross-sectional area (using pycnometry). However, due to the low-twist and thus low packing fraction of F20, it is a tow/roving with a rectangular cross-section.
Table 1 also presents the commercial price of these yarns at the time of writing. Note that
significant scales of economy are linked with bulk orders. Nonetheless, it is clear that
only jute yarn (produced in developing countries such as Bangladesh) is able to compete
against E-glass in terms of cost. Flax and hemp yarns/rovings (often produced in China
but processed in Europe [8]), are up to 10 times more expensive than E-glass. Additional
costs, associated with aligned fabric manufacture, have not been included.
For use as aligned reinforcements, the yarns were processed in the form of UD mat and
stitched biaxial fabric. UD (0°) mats were prepared from all the four yarns using a drum
winding facility and hydroxyethylcellulose binding agent, as described in [27]. Formax
UK Ltd. produced 300 gsm stitched biaxial (±45°) fabric from the F50 yarn. This enabled
studying the effect of textile architecture on the fatigue behaviour of F50 flax composites.
2.2 Composite manufacture Aligned composite laminates (250 mm square, 3-3.5 mm thick) were fabricated using the
vacuum infusion technique in a rigid aluminium mould tool. The reinforcement

Page 6 of 29
mats/fabrics were used as-received (without any preconditioning). Resin infusion was
carried out under vacuum, at 200-300 mbar absolute pressure. All composites were made
with an orthophthalic unsaturated polyester (Reichhold Norpol type 420-100) as the
matrix. The resin was mixed with 0.25 wt% NL49P accelerator (1% Cobalt solution) and
1 wt% Butanox M50 MEKP initiator. Post cure was carried out at 50 °C for 6 h after
ambient cure for 16 h. From the manufacturer’s datasheet, the polyester resin has a cured
density ρm of 1.202 gcm-3.
As tabulated in Table 2, composites with different i) yarn/fibre types (J190, H180, F50
and F20 in [0]4 layup), ii) fibre volume fractions ([0]2-5 layup of J190 generating four
different fibre volume fractions in the range of 17-38%), and iii) textile architectures (F50
in [0]4, [±45]4, and [90]4 layups), were fabricated by the above-mentioned procedure.
The fibre weight fraction wf of a laminate was calculated using the ratio of the mass of
the fabric and the resulting composite laminate. The composite density ρc was measured
using helium pycnometry (minimum of 5 samples). The composite fibre volume fraction
vf was then determined using Eq. 1, allowing for porosity vp. Note the consistency in
fibre/matrix volume fractions and the low void content (with the exception of J190 [0]4)
of the PFCs produced.
)(1);1(; mfpfm
cmf
f
cf vvvwvwv +−=−==
ρρ
ρρ
Eq. 1
2.3 Mechanical testing
2.3.1 Static tests
In order to determine the stress levels for fatigue testing, the static ultimate strengths of
the different composites needed to be measured. The ultimate tensile strength UTS was
measured for all the composites through static tensile tests, conducted according to ISO
527-4:1997, on an Instron 5985 testing machine equipped with a 100 kN load cell. Six
specimens were tested for each type of composite at a cross-head speed of 2 mm/min.
While all specimens were 250 mm long, specimens from UD and biaxial composites had
a different width of 15 mm and 25 mm, respectively. The physical and static mechanical
properties of the composites manufactured are presented in Table 2.

Page 7 of 29
The ultimate compressive strength UCS of H180/polyester was measured through static
compression tests, conducted according to ASTM D3410, on an Instron 5581 testing
machine equipped with a 50 kN load cell and a compression test fixture. Six specimens
(140 mm long, 15 mm wide) were tested at a cross-head speed of 1 mm/min. The test
fixture and selected gauge length of 12.7 mm prevent the specimen from buckling. The
UCS of H180/polyester composite was measured to be 95.1 ± 6.9 MPa.
Table 2. Physical and static mechanical properties (means ± stdv.) of the fabricated composite laminates
Experimental Variable
Fibre type Layup
Fibre volume fraction
Composite density
Void volume fraction
Ultimate Strength
Fatigue
stress ratio R
tested under vf [%] ρ [gcm-3] vp [%]
UTS/(UCS) [MPa]
Fibre type
J190 [0]4 31.7 ± 0.1 1.225 ± 0.002 4.2 ± 0.1 174.1 ± 10.3 0.1*
H180 [0]4 35.6 ± 0.8 1.303 ± 0.006 1.3 ± 0.4 171.3 ± 6.5 0.1*
F50 [0]4 27.7 ± 0.3 1.282 ± 0.004 0.9 ± 0.3 143 ± 6.8 0.1*
F20 [0]4 26.9 ± 0.1 1.291 ± 0.006 0.9 ± 0.4 236.3 ± 12 0.1*
Fibre volume fraction
J190 [0]2 17.1 ± 0.1 1.238 ± 0.003 0.3 ± 0.2 90.2 ± 9.9 0.1*
J190 [0]3 25.2 ± 0.1 1.251 ± 0.004 0.7 ± 0.3 140.7 ± 7.7 0.1*
J190 [0]4 31.7 ± 0.1 1.225 ± 0.002 4.2 ± 0.1 174.1 ± 10.3 0.1*
J190 [0]5 37.8 ± 0.1 1.276 ± 0.002 1.1 ± 0.2 224.7 ± 26.5 0.1*
Textile architecture
F50 [0]4 27.7 ± 0.3 1.282 ± 0.004 0.9 ± 0.3 143 ± 6.8 0.1*
F50 [±45]4 28.9 ± 0.1 1.293 ± 0.005 0.3 ± 0.2 51.4 ± 2.8 0.1*
F50 [90]4 25.8 ± 0.3 1.278 ± 0.004 0.7 ± 0.2 13.2 ± 0.4 0.1*
Stress ratio
H180 [0]4 35.6 ± 0.8 1.303 ± 0.006 1.3 ± 0.4 171.3 ± 6.5 0.1*
H180 [0]4 35.6 ± 0.8 1.303 ± 0.006 1.3 ± 0.4 171.3 ± 6.5 0.3*
H180 [0]4 35.6 ± 0.8 1.303 ± 0.006 1.3 ± 0.4 171.3 ± 6.5 0.5*
H180 [0]4 35.6 ± 0.8 1.303 ± 0.006 1.3 ± 0.4 (95.1 ± 6.9) -1†
H180 [0]4 35.6 ± 0.8 1.303 ± 0.006 1.3 ± 0.4 (95.1 ± 6.9) 2.5‡ *Tension-Tension (TT) mode; †Tension-Compression (TC) mode; ‡Compression-Compression (CC) mode
2.3.2 Fatigue tests
2.3.2.1 Specimen preparation
Rectangular test specimens were obtained by cutting the laminates with a high-speed
diamond cutting machine without any lubrication fluid. All specimen edges and ends
were polished and roughened, respectively, with 600 grit sand paper. Aluminium end-
Page 8 of 29
tabs (50 mm long, 1 mm thick) were then glued to the specimens using Araldite Rapid
adhesive, to protect the specimen surface from damage from the jaws of the test machine.
Table 2 states which composites were tested in tension-tension (TT), tension-compression
(TC) and compression-compression (CC) mode. For tests in TT mode, test specimens
were 250 mm long and 15 mm wide with a gauge length of 150 mm. For tests in TC and
CC modes, test specimens were 120 mm long and 15 mm wide with a smaller gauge
length of 11.5 mm, to prevent specimens buckling under compressive loads.
2.3.2.2 Test parameters
Fatigue tests were performed on a calibrated and PID-tuned Instron 8801 servo-hydraulic
testing machine under load-control. Constant amplitude loads were applied in a
sinusoidal waveform at a frequency of 10 Hz. BS 13003:2003 [28] advices that while
high testing frequencies (of up to 25 Hz) are desirable, to avoid self-generated heating in
the specimen, the rise in specimen surface temperature should normally be limited to 10
°C during the test. [28] does highlight that the limit of 10 °C does not apply to rapid
temperature rises associated with final failure. Gassan et al. [16, 17, 29] observed that for
woven and UD flax/jute composites with a fibre content of 22-40% (similar to this study),
selecting a test frequency of 10 Hz led to a temperature rise of less than 7 °C.
TT mode (R = 0.1) fatigue tests were carried out on all composite samples (Table 2). To
study the effect of stress ratio R on fatigue performance and to then generate a complete
constant-life diagram for H180 composites, only they were studied under five different
stress ratios: R = 0.1, 0.3, 0.5 in TT mode, R = -1 in TC mode, and R = 2.5 in CC mode
(Table 2). Fig. 1 presents example load waveforms used during fatigue testing, showing
definition of terms and illustration of R-values.
Table 3 shows example combinations of fatigue testing parameters (R-values, % stress
level, Smax and Smin) for H180 polyester composites; 1 specimen is tested for each
combination. In accordance with BS 13003:2003 [28], at least five specimens were tested
to failure at a minimum of five levels of maximum (absolute) stress Smax (eg. 90%, 80%,
70%, 60%, 50% and 45% of UTS or UCS), up to at least 106 cycles, for the determination
of the material S-N lifetime diagram. Specimens with failures initiated in the tab area

Page 9 of 29
were not included in the data. While the number of specimens tested do not allow a
statistical analysis, they are sufficient for such exploratory investigations [28].
Fig. 1. Example sinusoidal constant amplitude load waveforms showing definition of terms and illustration of R-values (for a constant Smax of 90% of the UTS or UCS).
Table 3. Example values of Smax/Smin for different R-values and stress levels (% of ultimate strength) for H180/polyester composites.
Ultimate Strength (US)
[MPa] Stress
ratio, R
Smax/Smin (MPa/MPa)
0.9US 0.8US 0.7US 0.6US 0.5US
171.3 ± 6.5 0.1 154.2/15.4 137/13.7 119.9/12 102.8/10.3 85.7/8.6
171.3 ± 6.5 0.3 154.2/46.3 137/41.1 119.9/36 102.8/30.8 85.7/25.7
171.3 ± 6.5 0.5 154.2/77.1 137/68.5 119.9/60 102.8/51.4 85.7/42.9
-95.1 ± 6.9 -1 85.6/-85.6 76.1/-76.1 66.6/-66.6 57.1/-57.1 47.6/-47.6
-95.1 ± 6.9 2.5 -34.2/-85.6 -30.4/-76.1 -26.6/-66.6 -22.8/-57.1 -19/-47.6
2.3.2.3 Data analysis
As illustrated in Fig. 2, after plotting Wohler stress-life (S-N) diagrams, power-law
regression equations (Eq. 2) were determined for each material, where Smax is the
maximum (absolute) stress applied, N is the number of cycles to failure, S0 is the single
cycle (static) ultimate strength of the material, and b is the material fatigue strength
coefficient. Eq. 2 yields a linear S-N curve on a log-log plot. The material fatigue
strength coefficient b is a very useful parameter; a smaller value of b implies a steeper
slope of the logS-logN curve and thus faster fatigue strength degradation every decade of
cycles. For reference, Eq. 2 derives from the integration of the Paris fatigue crack growth
rate law.
bNSS 0max = Eq. 2

Page 10 of 29
While static strength data was plotted on the S-N diagram at N = 1 cycle (Fig. 2), it was
ignored when obtaining the power-law regression equations representing the trend in S-N
data, for three prime reasons. Firstly, the static data was obtained at a strain rate an order
of magnitude below the fatigue strain rate. Secondly, the failure mechanism of a static
failure is fundamentally different to a fatigue failure [30]. Thirdly, as including the static
strength data weakens the strength of the power-law regression (indicated by the
coefficient of determination R2), its omission is reasonable particularly because low-cycle
fatigue (N < 103) is of little interest.
A complete Haigh constant-life diagram was then constructed using data obtained from
the power-law regression lines of the S-N diagrams for H180/polyester composite
specimens tested under the five different stress ratios. A constant-life diagram plots the
mean stress Smean along the x-axis and stress amplitude Samp along the y-axis. The
combination of amplitude stress Samp and mean stress Smean were determined for each
decade of fatigue cycles (eg. 102, 103, 104 and so on), for the five stress ratios. Lines of
constant life were drawn through the corresponding data points. The static failure
conditions, i.e. the end points on the x-axis, were defined by the UCS and the UTS.
1 10 100 1000 10000 100000 1000000
Max
imu
m S
tres
s, S
max
[MP
a]
Cycles to failure, Nf
Steeper → lower b
Static strength
S = S0Nb
Flatter → higher b
Fig. 2. Typical S-N lifetime diagram with example data following a power-law regression curve, where b is the material fatigue strength coefficient.
Page 11 of 29
3 Results and Discussion
3.1 Effect of fibre type
3.1.1 Static tests
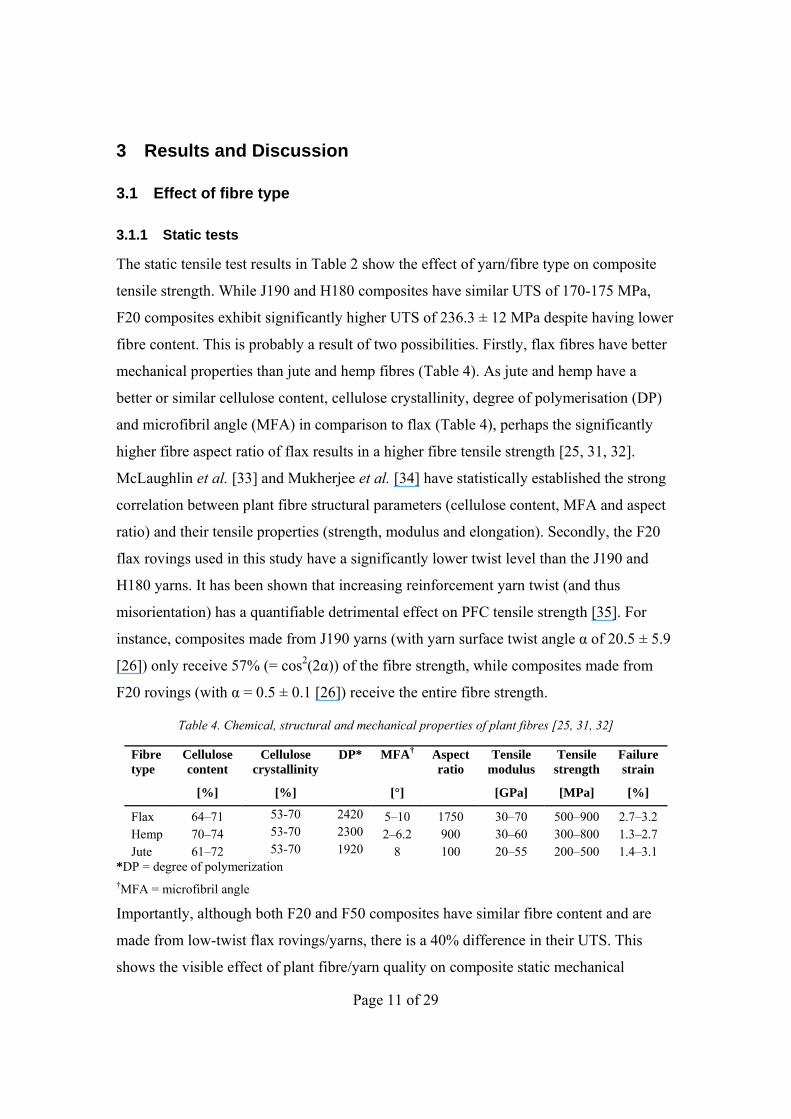
The static tensile test results in Table 2 show the effect of yarn/fibre type on composite
tensile strength. While J190 and H180 composites have similar UTS of 170-175 MPa,
F20 composites exhibit significantly higher UTS of 236.3 ± 12 MPa despite having lower
fibre content. This is probably a result of two possibilities. Firstly, flax fibres have better
mechanical properties than jute and hemp fibres (Table 4). As jute and hemp have a
better or similar cellulose content, cellulose crystallinity, degree of polymerisation (DP)
and microfibril angle (MFA) in comparison to flax (Table 4), perhaps the significantly
higher fibre aspect ratio of flax results in a higher fibre tensile strength [25, 31, 32].
McLaughlin et al. [33] and Mukherjee et al. [34] have statistically established the strong
correlation between plant fibre structural parameters (cellulose content, MFA and aspect
ratio) and their tensile properties (strength, modulus and elongation). Secondly, the F20
flax rovings used in this study have a significantly lower twist level than the J190 and
H180 yarns. It has been shown that increasing reinforcement yarn twist (and thus
misorientation) has a quantifiable detrimental effect on PFC tensile strength [35]. For
instance, composites made from J190 yarns (with yarn surface twist angle α of 20.5 ± 5.9
[26]) only receive 57% (= cos2(2α)) of the fibre strength, while composites made from
F20 rovings (with α = 0.5 ± 0.1 [26]) receive the entire fibre strength.
Table 4. Chemical, structural and mechanical properties of plant fibres [25, 31, 32]
Fibre type
Cellulose content
Cellulose crystallinity
DP* MFA† Aspect ratio
Tensile modulus
Tensile strength
Failure strain
[%] [%] [°] [GPa] [MPa] [%]
Flax 64–71 53-70 2420 5–10 1750 30–70 500–900 2.7–3.2 Hemp 70–74 53-70 2300 2–6.2 900 30–60 300–800 1.3–2.7 Jute 61–72 53-70 1920 8 100 20–55 200–500 1.4–3.1
*DP = degree of polymerization †MFA = microfibril angle
Importantly, although both F20 and F50 composites have similar fibre content and are
made from low-twist flax rovings/yarns, there is a 40% difference in their UTS. This
shows the visible effect of plant fibre/yarn quality on composite static mechanical

Page 12 of 29
properties. Madsen et al. [36] and Baets et al. [37] have shown that an increasing number
of defects and an increasing number of processing steps can reduce fibre/yarn quality and
composite properties. It is encouraging to note that although mechanical properties of
single plant fibres are known to have high variability, at a composite scale, the coefficient
of variation in the UTS of the PFCs is between 4-6%, which is comparable to GFRP [27].
3.1.2 Fatigue tests
Based on static tensile test results, the four different PFCs were subjected to tension-
tension (R = 0.1) fatigue tests at different stress levels (% of respective UTS). Fig. 3
presents S-N fatigue data for these PFCs. The arrowhead at 1.4 x 10⁷ cycles indicates a
‘run-out’ test which did not fail. A gradual decline in fatigue strength with increasing
number of fatigue cycles is observed. It is observed that the power-law model of Eq. 2 is
a good fit to the experimental fatigue data; in fact, all regressions have an R2-value >
0.95. This is generally characteristic of composites whose lifetime is dominated with
matrix crack growth and inter-laminar cracking [38, 39]. Indeed, matrix cracks normal to
the stress direction were found to occur on the specimen surface early in the lifetime. The
type of final failure observed in specimens tested in static tensile tests and tension-tension
fatigue tests was similar; specimens failed in a catastrophic brittle manner with a jagged
fracture surface and often showing delamination and longitudinal splits (sometimes
reaching the tab area) that terminate and arrest at matrix surface crack(s). UD GFRP and
UD carbon fibre composites are known to fail in a similar manner [38-40]. Fracture
modes and surfaces are further discussed in Section 3.4.
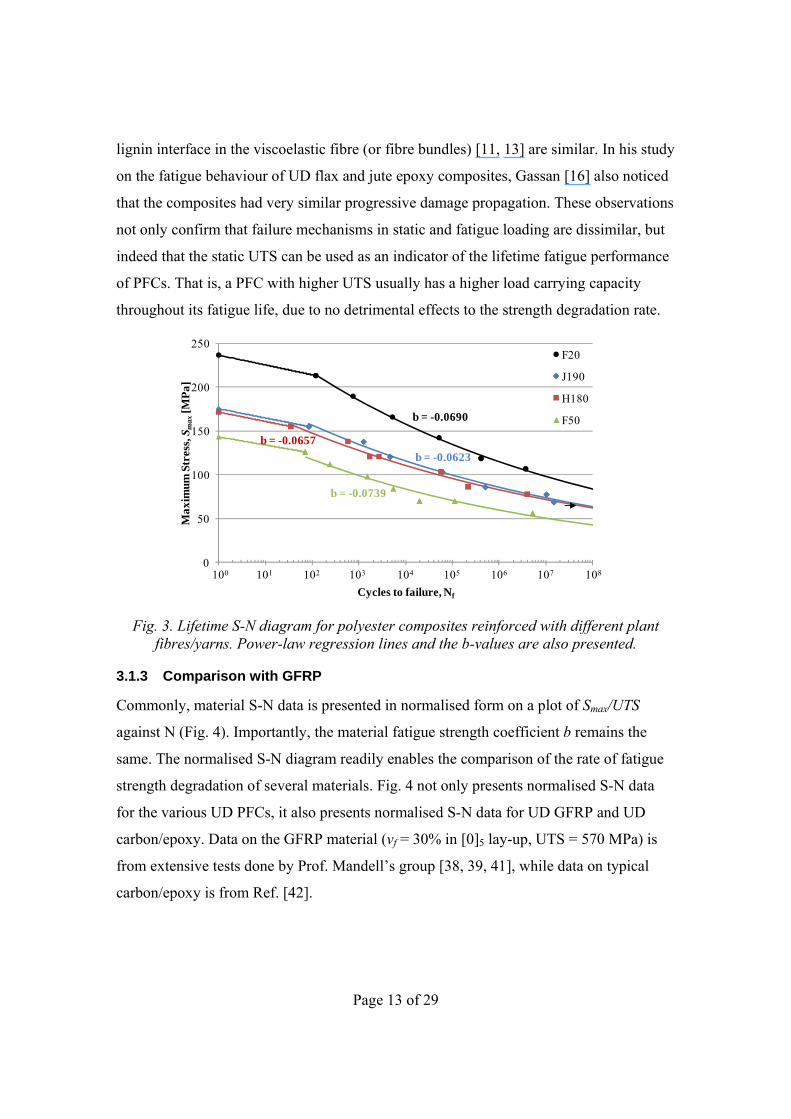
From the S-N diagram in Fig. 3 and Fig. 4, it is observed that although the static UTS of
the PFCs ranges from 140 to 240 MPa, the material fatigue strength coefficients b are
very similar, ranging from -0.0739 to -0.0623. In fact, F20 composites have 40% higher
static UTS than F50 composites but similar rates of fatigue strength degradation (Fig. 4).
This indicates that the fatigue failure mechanism in PFCs, and the resulting gradual
strength degradation, is independent of plant fibre/yarn type. This is possibly because
jute, hemp and flax are structurally very similar (Table 4) and the interfaces that form in
composites reinforced with such fibres are also very similar. Hence, micro-crack growth
rates at i) the fibre/matrix interface in the composite and ii) the cellulose/hemicellulose-
Page 13 of 29
lignin interface in the viscoelastic fibre (or fibre bundles) [11, 13] are similar. In his study
on the fatigue behaviour of UD flax and jute epoxy composites, Gassan [16] also noticed
that the composites had very similar progressive damage propagation. These observations
not only confirm that failure mechanisms in static and fatigue loading are dissimilar, but
indeed that the static UTS can be used as an indicator of the lifetime fatigue performance
of PFCs. That is, a PFC with higher UTS usually has a higher load carrying capacity
throughout its fatigue life, due to no detrimental effects to the strength degradation rate.
0
50
100
150
200
250
1.E+00 1.E+01 1.E+02 1.E+03 1.E+04 1.E+05 1.E+06 1.E+07 1.E+08
Max
imum
Str
ess,
Sm
ax[M
Pa]
Cycles to failure, Nf
F20
J190
H180
F50
100 101 105104103102 108107106
b = -0.0739
b = -0.0657
b = -0.0623
b = -0.0690
Fig. 3. Lifetime S-N diagram for polyester composites reinforced with different plant fibres/yarns. Power-law regression lines and the b-values are also presented.
3.1.3 Comparison with GFRP
Commonly, material S-N data is presented in normalised form on a plot of Smax/UTS
against N (Fig. 4). Importantly, the material fatigue strength coefficient b remains the
same. The normalised S-N diagram readily enables the comparison of the rate of fatigue
strength degradation of several materials. Fig. 4 not only presents normalised S-N data
for the various UD PFCs, it also presents normalised S-N data for UD GFRP and UD
carbon/epoxy. Data on the GFRP material (vf = 30% in [0]5 lay-up, UTS = 570 MPa) is
from extensive tests done by Prof. Mandell’s group [38, 39, 41], while data on typical
carbon/epoxy is from Ref. [42].

Page 14 of 29
0.0
0.1
0.2
0.3
0.4
0.5
0.6
0.7
0.8
0.9
1.0
1.1
1.E+00 1.E+01 1.E+02 1.E+03 1.E+04 1.E+05 1.E+06 1.E+07 1.E+08
Nor
mal
ised
Stre
ss, S
max
/UT
S
Cycles to failure, Nf
J190
H180
F50
F20
E-glass
Carbon–epoxy
100 101 105104103102 108107106
-0.074 < b < -0.062
b = -0.029
b = -0.074
PFCs
Fig. 4. Normalised S-N diagram comparing the tension-tension fatigue performance of UD composites reinforced with plant (shaded), E-glass [39] and carbon fibres [42].
From Fig. 4 it is immediately clear that carbon/epoxy outperforms both GFRP and PFCs
in terms of fatigue properties. While carbon/epoxy composites have a value of b ≈ -0.029,
GFRP and PFCs have a much lower value of b. It is of great interest to observe that
material fatigue strength coefficient of PFCs (b ≈ -0.074 to -0.062) is higher than or
comparable to GFRP (b ≈ -0.074). This implies that damage development and fatigue
strength degradation rates are relatively slower in PFCs. Liang et al. [15] also find that in
comparison to bidirectional flax composites, bidirectional GFRP had a much steeper S-N
curve, implying a more significant decrease in fatigue strength with respect to cycles to
failure. Shahzad et al. [21] also confirm that randomly-oriented short-fibre
hemp/polyester composites and chopped-strand GFRP have a similar fatigue strength
coefficient. However, it should be noted that aligned GFRP has a much higher UTS than
aligned PFCs, and in terms of absolute stress, the fatigue and static properties of GFRP is
significantly better than that of PFCs. This is clearly depicted in Fig. 5.

Page 15 of 29
0
50
100
150
200
250
300
350
400
450
500
550
600
1.E+00 1.E+01 1.E+02 1.E+03 1.E+04 1.E+05 1.E+06 1.E+07 1.E+08
Max
imum
Str
ess,
Sm
ax[M
Pa]
Cycles to failure, Nf
J190
H180
F50
F20
E-glass
100 101 105104103102 108107106
Fig. 5. S-N diagram comparing the tension-tension fatigue performance of UD PFCs and UD GFRP (vf = 30% in [0]5 lay-up, UTS = 570 MPa; material data from [39]).
While it is widely quoted that the fibre/matrix interface in PFCs is weak due to poor
adhesion between hydrophilic plant fibres and hydrophobic matrix [43-45], the interface
in GFRP has been optimised through sizing of glass fibres (specific to a resin system).
Hence, it is surprising that damage accumulation rates in PFCs are slower than in GFRP.
The causes of this behaviour are still unclear, however, there are three possible
explanations. Firstly, several studies [10, 11, 15, 21] have shown that not only do plant
fibres and their composites exhibit strain hardening when subjected to cyclic loads, but
PFCs also show much lower (if any at all) stiffness degradation over their fatigue life in
comparison to GFRP. As mentioned in Section 1.1, Liang et al. [15] observe that the loss
of modulus of biaxial glass/epoxy composites is three times higher than that of flax/epoxy
composites. It is known that the progressive reorientation of cellulose microfibrils in
plant fibres towards the loading direction is the most plausible explanation for this
observation [9, 10, 15]. In constant amplitude load-controlled fatigue tests, a gradual loss
of modulus implies a gradual increase in strain amplitudes and thus faster damage
accumulation. Perhaps, it is this ability of PFCs to maintain stiffness over their fatigue
life which imparts them with slow damage accumulation rates. Secondly, the complex
composite structure of viscoelastic plant fibres may provide them with crack absorbing
and deflecting mechanisms [11, 13, 46]. This includes the ability of plant fibres to i)
‘shed’ layers of damaged structural cell walls [11, 13], ii) continually transfer loads onto

Page 16 of 29
adjacent layers and fibres [11, 13], iii) directly resist against delamination crack growth
through interactions of the cellulose microfibrils and the hemicellulose-lignin matrix by
imperfect microfibrillar alignment and subsequent microfibrillar bridging (relative to the
crack plane) [13], and iv) reshape fibre cells into an ovular rather than circular cross-
section [11], effectively increasing fibre aspect ratio and load-transferring ability [31].
Finally, plant fibres may be more capable of transferring stresses and strains to the
matrix, because unlike E-glass, they have rough surfaces. Sretenovic [47] measured the
development and distribution of strain in a single wood fibre composite by means of
electronic laser speckle interferometry. While it is typically expected that due to the
different elastic modulus of the fibre and the matrix axial strain distribution is
discontinuous across the fibre ends, they found that due to the roughness of wood fibre
ends and the resulting larger effective surface area, the transition of strain from the fibre
to the matrix was continuous.
3.2 Effect of fibre volume fraction Composite mechanical properties can often be tailored by changing, for instance, the
fibre volume fraction. J190/polyester composites were manufactured at four different
fibre volume fractions, ranging from 17 to 38%. The static tests results in Table 2 show
that the UTS of J190/polyester increases linearly with fibre volume fraction (R2 = 0.974),
as per the rule of mixtures [48]. This shows that although different batches/types/quality
of plant fibres may have variable properties, at a composite scale, PFCs made from a
single batch of fibre do follow conventional composite micro-mechanical models [48].
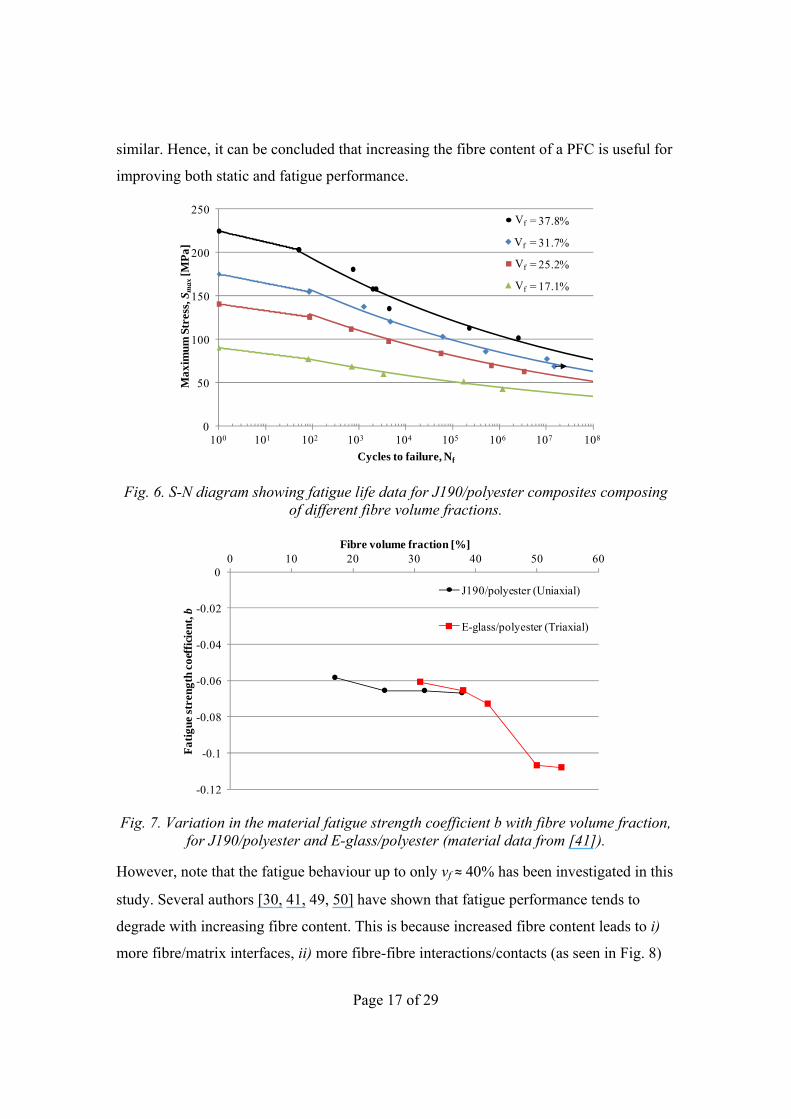
S-N data from tension-tension fatigue tests on these composites is presented in Fig. 6.
Again, the power-law regressions are in good agreement with the experimental data (R2 >
0.95). PFCs with higher fibre content not only exhibit improved static (single cycle)
properties, they also maintain higher fatigue load carrying capacities over their fatigue
life. None of the S-N curves seem to be converging into each other before at least 1010
cycles. In fact, the material fatigue strength coefficient b is fairly constant at b ≈ -0.0646
for all the fibre volume fractions (Fig. 7), despite a small dip at vf = 25%. This implies
that the slope of the S-N curves and the fatigue strength degradation rates are very
Page 17 of 29
similar. Hence, it can be concluded that increasing the fibre content of a PFC is useful for
improving both static and fatigue performance.
0
50
100
150
200
250
1.E+00 1.E+01 1.E+02 1.E+03 1.E+04 1.E+05 1.E+06 1.E+07 1.E+08
Max
imum
Str
ess,
Sm
ax[M
Pa]
Cycles to failure, Nf
Vf = 37.8%
Vf = 31.7%
Vf = 25.2%
Vf = 17.1%
100 101 105104103102 108107106
Vf
Vf
Vf
Vf
Fig. 6. S-N diagram showing fatigue life data for J190/polyester composites composing of different fibre volume fractions.
-0.12
-0.1
-0.08
-0.06
-0.04
-0.02
00 10 20 30 40 50 60
Fat
igue
str
engt
h co
effi
cien
t, b
Fibre volume fraction [%]
J190/polyester (Uniaxial)
E-glass/polyester (Triaxial)
Fig. 7. Variation in the material fatigue strength coefficient b with fibre volume fraction, for J190/polyester and E-glass/polyester (material data from [41]).
However, note that the fatigue behaviour up to only vf ≈ 40% has been investigated in this
study. Several authors [30, 41, 49, 50] have shown that fatigue performance tends to
degrade with increasing fibre content. This is because increased fibre content leads to i)
more fibre/matrix interfaces, ii) more fibre-fibre interactions/contacts (as seen in Fig. 8)

Page 18 of 29
and iii) more regions of high local volume fractions due to increased yarn/strand
compaction [51]. Although the interface enables stress transfer between the fibre and the
matrix, it is also the region where the largest stress/strain gradients lie. Hence, the
interface is where micro-cracks are most likely to grow and propagate. Increasing fibre
content implies that fibres are now closer to each other and hence stress/strain gradients
at the interface are even higher, leading to accelerated crack growth. In addition, touching
fibres are likely sites for crack growth. Samborsky and Mandell [41, 50] have shown that
increasing fibre content beyond 40-45% typically results in a drop in the fatigue strength
coefficient b and thus poorer fatigue performance. Fig. 7 plots the variation in the fatigue
strength coefficient b with increasing fibre content for triaxial GFRP ([0,±45,0] lay-up
with 72%-0's; material data from [41]). Mandell et al. [51] have also demonstrated that
while increasing the localised fibre volume fraction in a composite sample can improve
static properties, it has a detrimental effect on the fatigue performance.
As illustrated in Fig. 8, increasing the fibre content of J190/polyester composites affected
the failure mechanism in tension-tension fatigue. At low fibre content, more matrix
cracks formed at the specimen surface normal to the loading direction, early in the fatigue
life (Fig. 8a). Specimen failure was brittle, matrix dominated, with no longitudinal
splitting and the fracture surface was flat with no delamination. At higher fibre volume
fractions (Fig. 8b), fewer surface matrix cracks formed and specimen failure was brittle,
catastrophic and with extensive fibre failure. The fracture surface was more jagged with
extensive delamination and longitudinal splitting (even extending into the end tabs).
Often, longitudinal splits extended into and arrested at a matrix surface crack normal to
the loading direction. The fracture surfaces of specimen failed under static and fatigue
loading were similar, which is typical of composite materials [30, 41].

Page 19 of 29
Fig. 8. Typical cross-section micrograph (from [48]) and failure modes of J190/polyester composites with a) low (vf = 17%) and b) high (vf = 38%) fibre content subjected to
tension-tension fatigue loading. See text for details.
3.3 Effect of textile architecture To characterise the influence of textile architecture on the fatigue performance of PFCs,
UD ([0]4 and [90]4) and biaxial ([±45]4) F50/polyester composites were manufactured
and tested. Static tensile results in Table 2 show that although the three composites have a
similar fibre content, the UTS of [0]4 composites is 11 and 3 times the UTS of [90]4 and
[±45]4 composites, respectively. Plant fibres are highly anisotropic due to their structure
and composition [52]. It follows that uniaxial composites reinforced with these plant
fibres are also highly anisotropic. In fact, Shah et al. [52] have shown that biaxial
([±45]4) PFCs are a better option than uniaxial PFCs, for applications where loads are at
an off-axis angle larger than 30°.
Page 20 of 29
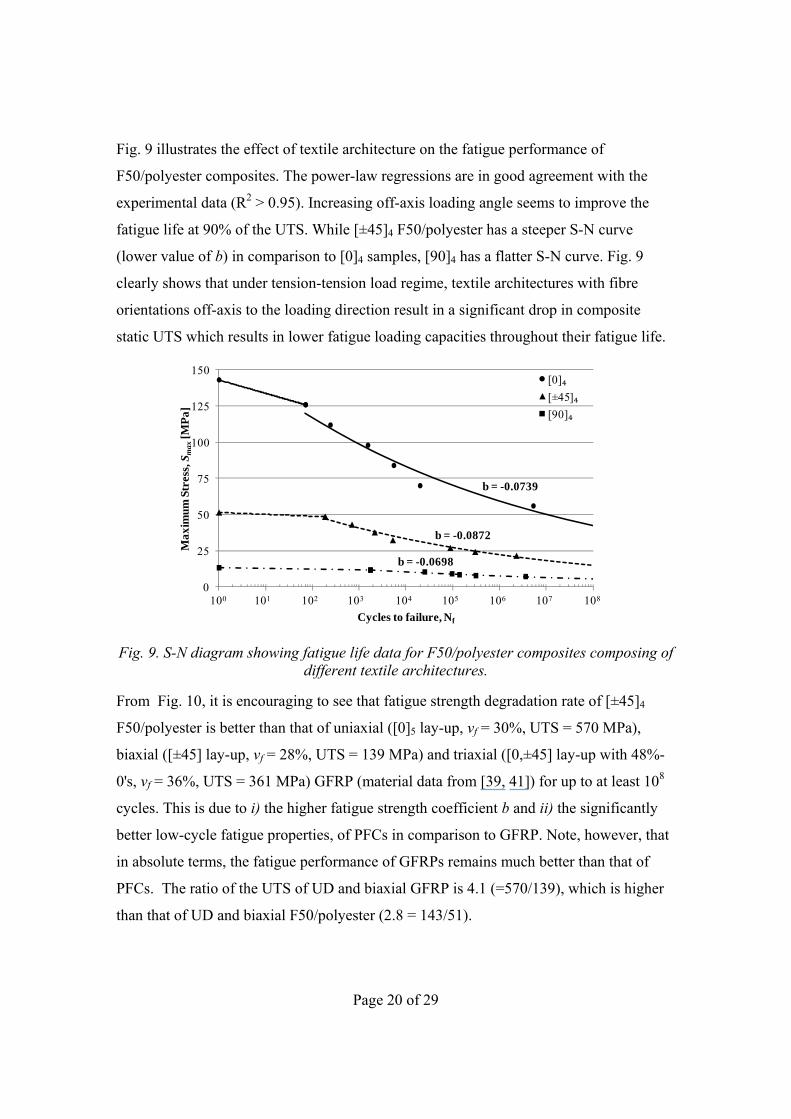
Fig. 9 illustrates the effect of textile architecture on the fatigue performance of
F50/polyester composites. The power-law regressions are in good agreement with the
experimental data (R2 > 0.95). Increasing off-axis loading angle seems to improve the
fatigue life at 90% of the UTS. While [±45]4 F50/polyester has a steeper S-N curve
(lower value of b) in comparison to [0]4 samples, [90]4 has a flatter S-N curve. Fig. 9
clearly shows that under tension-tension load regime, textile architectures with fibre
orientations off-axis to the loading direction result in a significant drop in composite
static UTS which results in lower fatigue loading capacities throughout their fatigue life.
0
25
50
75
100
125
150
1.E+00 1.E+01 1.E+02 1.E+03 1.E+04 1.E+05 1.E+06 1.E+07 1.E+08
Max
imum
Str
ess,
Sm
ax[M
Pa]
Cycles to failure, Nf
[0]₄[±45]₄[90]₄
100 101 105104103102 108107106
b = -0.0739
b = -0.0698
b = -0.0872
Fig. 9. S-N diagram showing fatigue life data for F50/polyester composites composing of different textile architectures.
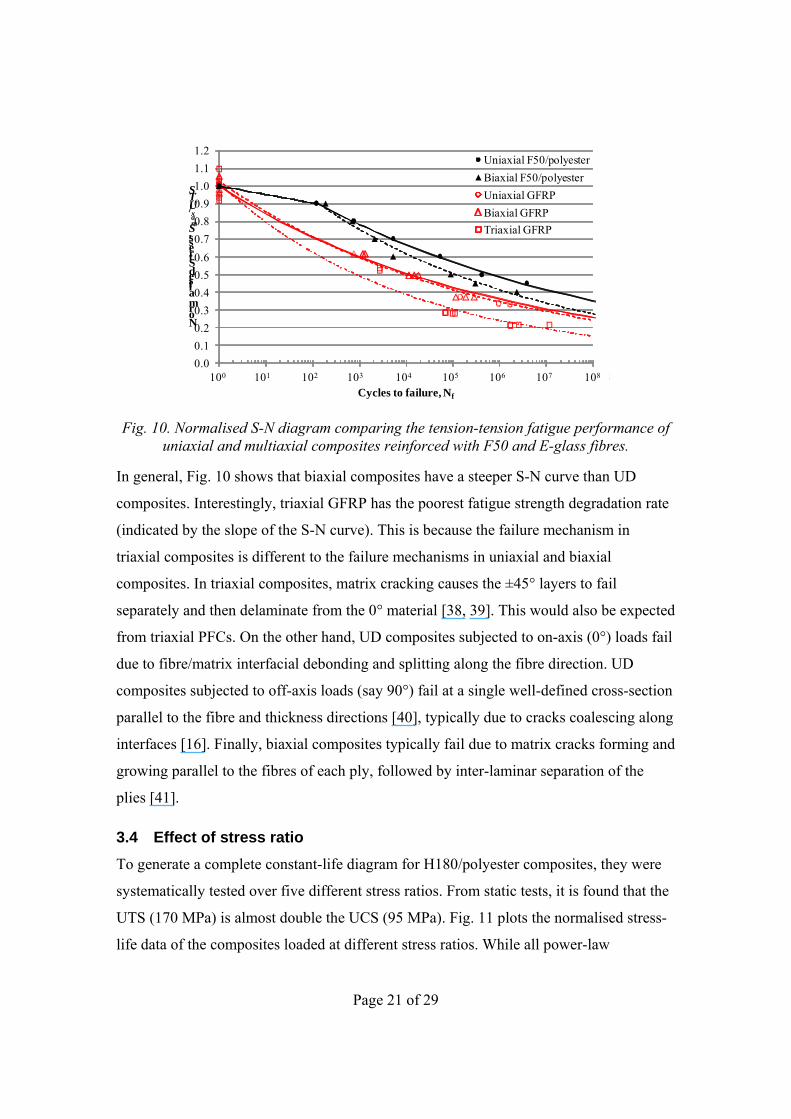
From Fig. 10, it is encouraging to see that fatigue strength degradation rate of [±45]4
F50/polyester is better than that of uniaxial ([0]5 lay-up, vf = 30%, UTS = 570 MPa),
biaxial ([±45] lay-up, vf = 28%, UTS = 139 MPa) and triaxial ([0,±45] lay-up with 48%-
0's, vf = 36%, UTS = 361 MPa) GFRP (material data from [39, 41]) for up to at least 108
cycles. This is due to i) the higher fatigue strength coefficient b and ii) the significantly
better low-cycle fatigue properties, of PFCs in comparison to GFRP. Note, however, that
in absolute terms, the fatigue performance of GFRPs remains much better than that of
PFCs. The ratio of the UTS of UD and biaxial GFRP is 4.1 (=570/139), which is higher
than that of UD and biaxial F50/polyester (2.8 = 143/51).
Page 21 of 29
0.0
0.1
0.2
0.3
0.4
0.5
0.6
0.7
0.8
0.9
1.0
1.1
1.2
1.E+00 1.E+01 1.E+02 1.E+03 1.E+04 1.E+05 1.E+06 1.E+07 1.E+08
Normalised Stress, Smax/UTS
Cycles to failure, Nf
Uniaxial F50/polyester
Biaxial F50/polyester
Uniaxial GFRP
Biaxial GFRP
Triaxial GFRP
100 101 105104103102 108107106
Fig. 10. Normalised S-N diagram comparing the tension-tension fatigue performance of uniaxial and multiaxial composites reinforced with F50 and E-glass fibres.
In general, Fig. 10 shows that biaxial composites have a steeper S-N curve than UD
composites. Interestingly, triaxial GFRP has the poorest fatigue strength degradation rate
(indicated by the slope of the S-N curve). This is because the failure mechanism in
triaxial composites is different to the failure mechanisms in uniaxial and biaxial
composites. In triaxial composites, matrix cracking causes the ±45° layers to fail
separately and then delaminate from the 0° material [38, 39]. This would also be expected
from triaxial PFCs. On the other hand, UD composites subjected to on-axis (0°) loads fail
due to fibre/matrix interfacial debonding and splitting along the fibre direction. UD
composites subjected to off-axis loads (say 90°) fail at a single well-defined cross-section
parallel to the fibre and thickness directions [40], typically due to cracks coalescing along
interfaces [16]. Finally, biaxial composites typically fail due to matrix cracks forming and
growing parallel to the fibres of each ply, followed by inter-laminar separation of the
plies [41].
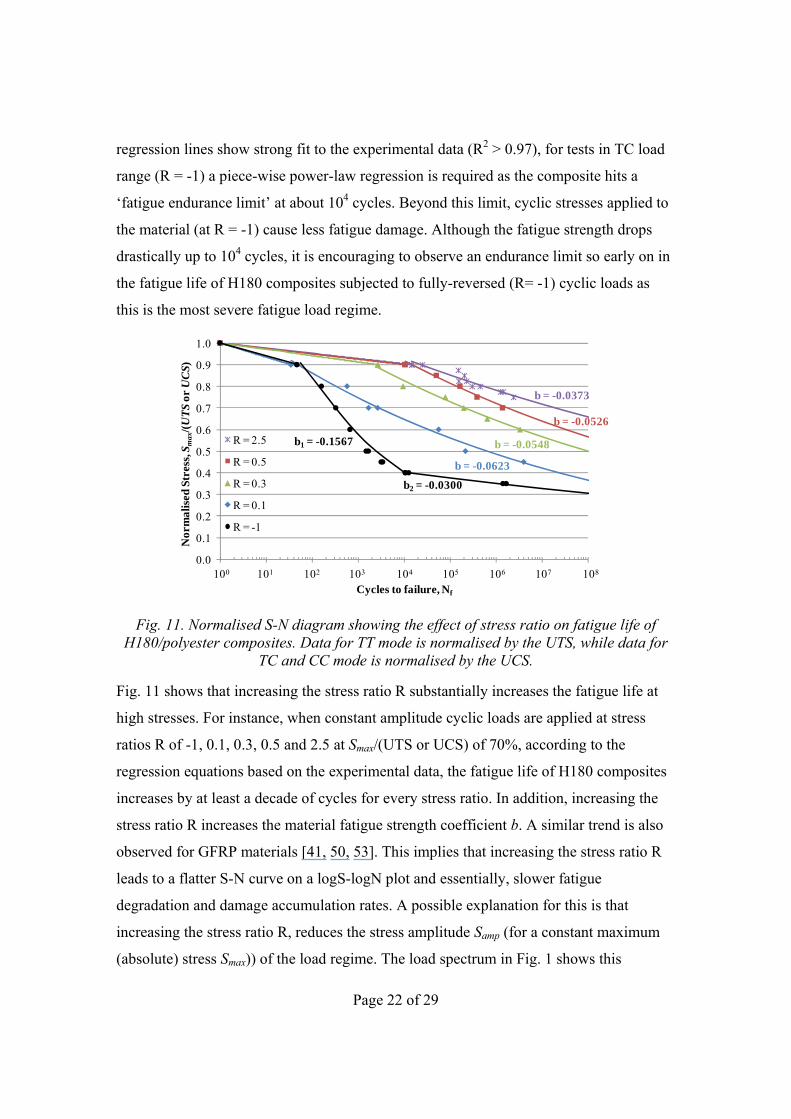
3.4 Effect of stress ratio To generate a complete constant-life diagram for H180/polyester composites, they were
systematically tested over five different stress ratios. From static tests, it is found that the
UTS (170 MPa) is almost double the UCS (95 MPa). Fig. 11 plots the normalised stress-
life data of the composites loaded at different stress ratios. While all power-law
Page 22 of 29
regression lines show strong fit to the experimental data (R2 > 0.97), for tests in TC load
range (R = -1) a piece-wise power-law regression is required as the composite hits a
‘fatigue endurance limit’ at about 104 cycles. Beyond this limit, cyclic stresses applied to
the material (at R = -1) cause less fatigue damage. Although the fatigue strength drops
drastically up to 104 cycles, it is encouraging to observe an endurance limit so early on in
the fatigue life of H180 composites subjected to fully-reversed (R= -1) cyclic loads as
this is the most severe fatigue load regime.
0.0
0.1
0.2
0.3
0.4
0.5
0.6
0.7
0.8
0.9
1.0
1.E+00 1.E+01 1.E+02 1.E+03 1.E+04 1.E+05 1.E+06 1.E+07 1.E+08
Nor
mal
ised
Str
ess,
Sm
ax/(
UT
Sor
UC
S)
Cycles to failure, Nf
R = 2.5
R = 0.5
R = 0.3
R = 0.1
R = -1
b = -0.0623
b = -0.0526
b = -0.0548b1 = -0.1567
b = -0.0373
b2 = -0.0300
100 101 105104103102 108107106
Fig. 11. Normalised S-N diagram showing the effect of stress ratio on fatigue life of H180/polyester composites. Data for TT mode is normalised by the UTS, while data for
TC and CC mode is normalised by the UCS.
Fig. 11 shows that increasing the stress ratio R substantially increases the fatigue life at
high stresses. For instance, when constant amplitude cyclic loads are applied at stress
ratios R of -1, 0.1, 0.3, 0.5 and 2.5 at Smax/(UTS or UCS) of 70%, according to the
regression equations based on the experimental data, the fatigue life of H180 composites
increases by at least a decade of cycles for every stress ratio. In addition, increasing the
stress ratio R increases the material fatigue strength coefficient b. A similar trend is also
observed for GFRP materials [41, 50, 53]. This implies that increasing the stress ratio R
leads to a flatter S-N curve on a logS-logN plot and essentially, slower fatigue
degradation and damage accumulation rates. A possible explanation for this is that
increasing the stress ratio R, reduces the stress amplitude Samp (for a constant maximum
(absolute) stress Smax)) of the load regime. The load spectrum in Fig. 1 shows this
Page 23 of 29
graphically. At higher stress ratios, the material is being subjected to lower stress
amplitudes, and hence it will have to endure lower stress/strain gradients in the fibre,
matrix and at the fibre/matrix interface. This would in turn lead to reduced crack growth
rates and less significant fatigue strength degradation with increasing number of cycles.
The stress ratio also has an effect on the failure mode of the composites. Example failure
surfaces from tests in the different load ranges are shown in Fig. 12. Composites tested
under TT mode (R = 0.1, 0.3 and 0.5) fail in a brittle manner including extensive fibre
fracture, matrix cracking, delamination and longitudinal splitting (Fig. 12a). Crack
growth, in this case, is a result of Mode 1 (opening mode) and Mode 2 (in-plane shear
mode) crack loading [39]. Importantly, single plant fibres subjected to TT fatigue loads
also experience mode mixities (Mode 1 and Mode 2), although Mode 1 prevails due to
lower fracture resistance [13]. Composites tested under TC (R = -1) and CC (R = 2.5)
load range display the typical single-kink failure and wedge-shaped failure, respectively.
Mode 2 (in-plane shear mode) should be the dominant crack loading mechanism for TC
and CC load ranges [39]. In TC load range, the specimen fails when a kink develops at a
plane 45° to the loading direction (Fig. 12b) due to pure in-plane shear resulting from
each half sliding over the other half. Specimen failure in CC load range occurs in the
form of a symmetrical double-kink (Fig. 12c) resulting from both halves forcing into each
other and folding on the same side.

Page 24 of 29
Fig. 12. Typical failure modes of PFCs loaded in a) tension-tension load range, b) tension-compression load range and c) compression-compression load range. See text for
details.
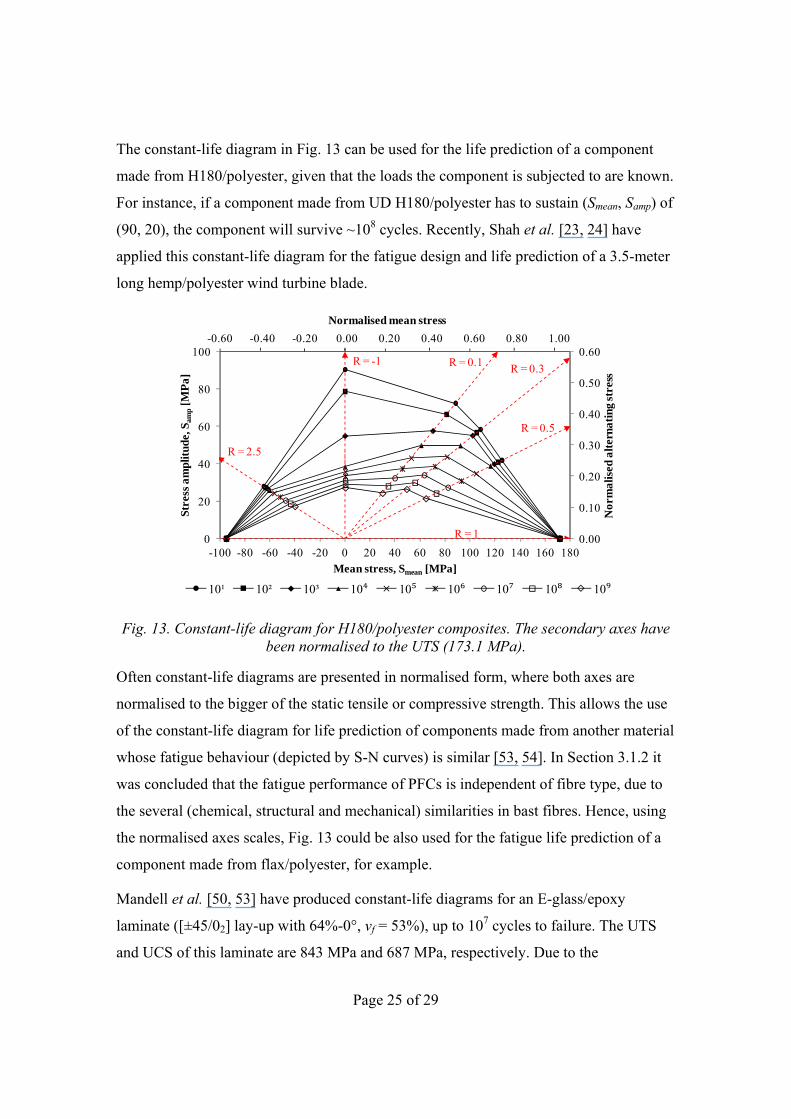
3.5 Constant-life diagram The power-law regression equations describing the trend in the fatigue lifetime data over
different stress ratios can be used to plot a constant-life diagram. This is typically a graph
of stress amplitude Samp against mean stress Smean. Each curve on the graph is a ‘line of
constant life’. Fig. 13 shows a complete Haigh constant-life diagram that has been
constructed for H180/polyester composites. The power-law regression curves have been
extrapolated to 109 cycles to failure. Obviously, the accuracy of this diagram can be
improved by testing more samples at more stress ratios. Although the UCS of
H180/polyester is half the UTS, the CC fatigue behaviour is impressive due to the high
fatigue strength coefficient b (flatter logS-logN curve). In fact, except the low-cycle (N <
103) fully-reversed TC (R= -1) fatigue performance, PFCs offer very stable and useful
fatigue properties.
Page 25 of 29
The constant-life diagram in Fig. 13 can be used for the life prediction of a component
made from H180/polyester, given that the loads the component is subjected to are known.
For instance, if a component made from UD H180/polyester has to sustain (Smean, Samp) of
(90, 20), the component will survive ~108 cycles. Recently, Shah et al. [23, 24] have
applied this constant-life diagram for the fatigue design and life prediction of a 3.5-meter
long hemp/polyester wind turbine blade.
-0.60 -0.40 -0.20 0.00 0.20 0.40 0.60 0.80 1.00
0.00
0.10
0.20
0.30
0.40
0.50
0.60
0
20
40
60
80
100
-100 -80 -60 -40 -20 0 20 40 60 80 100 120 140 160 180
Normalised mean stress
Nor
mal
ised
alt
erna
ting
str
ess
Stre
ss a
mpl
itud
e, S
amp
[MP
a]
Mean stress, Smean [MPa]
10¹ 10² 10³ 10⁴ 10⁵ 10⁶ 10⁷ 10⁸ 10⁹
R = 0.1R = 0.3
R = 0.5
R = -1
R = 1
R = 2.5
Fig. 13. Constant-life diagram for H180/polyester composites. The secondary axes have been normalised to the UTS (173.1 MPa).
Often constant-life diagrams are presented in normalised form, where both axes are
normalised to the bigger of the static tensile or compressive strength. This allows the use
of the constant-life diagram for life prediction of components made from another material
whose fatigue behaviour (depicted by S-N curves) is similar [53, 54]. In Section 3.1.2 it
was concluded that the fatigue performance of PFCs is independent of fibre type, due to
the several (chemical, structural and mechanical) similarities in bast fibres. Hence, using
the normalised axes scales, Fig. 13 could be also used for the fatigue life prediction of a
component made from flax/polyester, for example.
Mandell et al. [50, 53] have produced constant-life diagrams for an E-glass/epoxy
laminate ([±45/02] lay-up with 64%-0°, vf = 53%), up to 107 cycles to failure. The UTS
and UCS of this laminate are 843 MPa and 687 MPa, respectively. Due to the
Page 26 of 29
significantly higher static properties of GFRP compared to PFCs, the fatigue properties of
GFRPs is far superior to PFCs. In fact, the constant-life diagram of GFRP is almost 4-
fold that of H180/polyester.
4 Conclusions
There is a noticeable lack of fatigue data on plant fibre composites (PFCs) which
seriously limits their prospective use in fatigue critical components. The objective of this
manuscript is to provide a complete set of fatigue data on vacuum infused aligned PFCs.
S-N lifetime diagrams have been constructed to specifically investigate the effect of i)
plant fibre type/quality, ii) fibre volume fraction, iii) textile architecture, and iv) stress
ratio, on PFC cyclic loading behaviour. At each stage, the fatigue performance of PFCs
has been compared to that of E-glass/polyester (GFRP) composites (material data from
[41]). To facilitate fatigue design and life prediction of PFC components, a
comprehensive constant-life diagram has been generated.
It has been demonstrated that power-law regression lines are a good fit to S-N fatigue
data for PFCs (R2 > 0.95). While plant fibre type, plant fibre quality, textile architecture
and composite fibre content have a significant impact on the static (tensile) properties of
the PFC, they have little impact on the material fatigue strength coefficient b (which
dictates the slope of the S-N curve). In essence, higher static properties are a sign of
superior fatigue loading capacities throughout the lifetime of PFCs. Increasing stress
ratios lead to improved fatigue performance (increasing b) in PFCs. Fracture mechanisms
and modes are the same for all plant fibre types, but depend on fibre content, textile
architecture and load regimes (stress ratios). Although the absolute fatigue performance
of GFRP is far superior to PFCs, it is a revelation to find that fatigue strength degradation
rates are lower in PFCs than in GFRP.
Acknowledgements
This project is supported by the Nottingham Innovative Manufacturing Research Centre
(EPSRC, project title ‘Sustainable manufacture of wind turbine blades using natural fibre
composites and optimal design tools’). We also thank the suppliers of the different plant
fibre yarns/rovings for their support.
Page 27 of 29
References 1. Wambua P, Ivens J, Verpoest I. Natural fibres: can they replace glass in fibre reinforced plastics?
Composites Science and Technology, 2003, 63: p. 1259-1264. 2. Zini E, Scandola M. Green composites: An overview. Polymer Composites, 2011, 32(12): p. 1905-
1915. 3. Summerscales J, Dissanayake N, Virk AS, Hall W. A review of bast fibres and their composites.
Part 2 – Composites. Composites Part A: Applied Science and Manufacturing, 2010, 41(10): p. 1336-1344.
4. Shahzad A. Hemp fiber and its composites - A review. Journal of Composite Materials, 2012, 46(8): p. 973-986.
5. Dhanasekaran S, Balachandran G. Structural behavior of jute fiber composites - A review. SAE Technical Paper, 2008, 1: p. 2653.
6. Li Y, Mai Y, Ye L. Sisal fibre and its composites: A review of recent developments. Composites Science and Technology, 2000, 60(11): p. 2037-2055.
7. Reux F. Worldwide composites market: Main trends of the composites industry, in 5th Innovative Composites Summit - JEC ASIA 2012. 26-28 June 2012. Singapore.
8. Carus M. Bio-composites: Technologies, applications and markets, in 4th International Conference on Sustainable Materials, Polymers and Composites. 6-7 July 2011. Birmingham, UK.
9. Spatz H, Kohler L, Niklas KJ. Mechanical behaviour of plant tissues: composite materials or structures? The Journal of Experimental Biology, 1999, 202: p. 3269–3272.
10. Baley C. Analysis of the flax fibres tensile behaviour and analysis of the tensile stiffness increase. Composites Part A: Applied Science and Manufacturing, 2002, 33: p. 939-948.
11. Silva F, Chawla N, Filho RDDT. An experimental investigation of the fatigue behaviour of sisal fibers. Materials Science and Engineering A, 2009, 516: p. 90-95.
12. Mandell J, McGarry FJ, Hsieh AJY, Li CG. Tensile fatigue of glass fibers and composites with conventional and surface compressed fibers. Polymer Composites, 1985, 6(3): p. 168-174.
13. Hamad W. On the mechanisms of cumulative damage and fracture in native cellulose fibres. Journal of Materials Science Letters, 1998, 17: p. 433-436.
14. Harris B. Engineering composite materials, 1999. London: The Institute of Materials. 15. Liang S, Gning, PB, Guillaumat, L. A comparative study of fatigue behaviour of flax/epoxy and
glass/epoxy composites. Composites Science and Technology, 2012, 72(5): p. 535-543. 16. Gassan J. A study of fibre and interface parameters affecting the fatigue behaviour of natural fibre
composites. Composites Part A: Applied Science and Manufacturing, 2002, 33: p. 369-374. 17. Gassan J, Bledzki AK. Possibilities for improving the mechanical properties of jute/epoxy
composites by alkali treatment of fibres. Composites Science and Technology, 1999, 59: p. 1303-1309.
18. Towo A, Ansell MP. Fatigue of sisal fibre reinforced composites: Constant-life diagrams and hysteresis loop capture. Composites Science and Technology, 2008, 68: p. 915-924.
19. Towo A, Ansell MP. Fatigue evaluation and dynamic mecahnical thermal analysis of sisal fibre-thermosetting resin composites. Composites Science and Technology, 2008, 68: p. 925-932.
20. Yuanjian T, Isaac, DH. Impact and fatigue behaviour of hemp fibre composites. Composites Science and Technology, 2007, 67: p. 3300-3307.
21. Shahzad A, Isaac DH. Fatigue properties of hemp fibre composites, in 17th International Conference on Composite Materials (ICCM-17). 2009. Edinburgh, UK.
22. Shahzad A. Effects of alkalization on tensile, impact, and fatigue properties of hemp fiber composites. Polymer Composites, 2012, 33(7): p. 1129-1140.
23. Shah D, Schubel PJ, Clifford MJ, Licence P. Fatigue characterisation of plant fibre composites for small-scale wind turbine blade applications, in 5th Innovative Composites Summit - JEC Asia 2012. 26-28 June 2012. Singapore.
24. Shah D, Schubel PJ, Clifford MJ, Licence P. Fatigue characterisation of plant fibre composites for rotor blade applications, in JEC Composites Magazine, No. 73: Special JEC Asia, June 2012. JEC Composites: Paris. p. 51-54.
25. Lewin M. Handbook of fiber chemistry. Third ed, 2007. Boca Raton: CRC Press LLC.

Page 28 of 29
26. Shah D, Schubel PJ, Licence P, Clifford MJ Hydroxyethylcellulose surface treatment of natural fibres: the new ‘twist’ in yarn preparation and optimization for composites applicability. Journal of Materials Science, 2012, 47: p. 2700-2711.
27. Shah D, Schubel PJ, Clifford MJ, Licence P. Mechanical characterization of vacuum infused thermoset matrix composites reinforced with aligned hydroxyethylcellulose sized plant bast fibre yarns, in 4th International Conference on Sustainable Materials, Polymers and Composites. 6-7 July 2011. Birmingham, UK.
28. BS ISO 13003:2003, Fibre-reinforced plastics - Determination of fatigue properties under cyclic loading conditions, 2003. British Standards Institution: London.
29. Gassan J, Bledzki AK. The influence of fiber-surface treatment on the mechanical properties of jute-polypropylene composites. Composites Part A: Applied Science and Manufacturing, 1997, 28A: p. 1001-1005.
30. Nijssen R. Fatigue life prediction and strength degradation of wind turbine rotor blade composites. PhD, 2006. Delft University: Delft, Netherlands.
31. Pickering K, ed. Properties and performance of natural-fibre composites. 2008. CRC Press LLC: Boca Raton.
32. Madsen B. Properties of plant fibre yarn polymer composites - An experimental study. PhD, 2004. Technical University of Denmark: Lyngby, Denmark.
33. McLaughlin E, Tait RA. Fracture mechanism of plant fibres. Journal of Materials Science, 1980, 15: p. 89-95.
34. Mukherjee P, Satyanarayana KG. An empirical evaluation of structure-property relationships in natural fibres and their fracture behaviour. Journal of Materials Science, 1986, 21: p. 4162-4168.
35. Shah D, Schubel PJ, Clifford MJ. Modelling the effect of yarn twist on the tensile strength of unidirectional plant fibre yarn composites. Journal of Composite Materials, 2013, 47(4): p. 425-436.
36. Madsen B, Mehmood S, Aslan M. Variability in properties of natural fibres, in NATEX Workshop. 2012. Chesterfield, UK.
37. Baets J, Plastria D, Ivens J, Verpoest I. Determination of the optimal flax fibre preparation for use in UD-epoxy composites, in 4th International Conference on Sustainable Materials, Polymers and Composites. 6-7 July 2011. Birmingham, UK.
38. Mandell J, Reed RM, Samborsky DD, Pan Q. Fatigue performance of wind turbine blade composite materials. Wind Energy, 1993, 14: p. 191-198.
39. Mandell J, Reed RM, Samborsky, DD. SAND92-7005, Fatigue of fiberglass wind turbine blade materials, 1992. Sandia National Laboratories.
40. Kawai M, Yajima S, Hachinohe A, Takano Y. Off-axis fatigue behaviour of unidirectional carbon fiber-reinforced composites at room and high temperatures. Journal of Composite Materials, 2001, 35: p. 545-575.
41. Samborsky D. Fatigue of E-glass fiber reinforced composite materials and substructures. MSc, 1999. Montana State University: Bozeman.
42. Manwell J, McGowan J, Rogers A. Wind energy explained: Theory, design and application, Second edition, 2009. Chichester: John Wiley and Sons, Ltd.
43. Kalia S, Kaith BS, Kaur I. Pretreatments of natural fibers and their application as reinforcing material in polymer composites - a review. Polymer Engineering and Science, 2009, 49(7): p. 1253-1272.
44. Mwaikambo L, Ansell MP. Chemical modification of hemp, sisal, jute and kapok fibers by alkalization. Journal of Applied Polymer Science, 2002, 84: p. 2222-2234.
45. John M, Anandjiwala RD. Recent developments in chemical modification and characterization of natural fiber-reinforced composites. Polymer Composites, 2008: p. 187-207.
46. Nosti J. Performance analysis and life prediction for small wind turbine blades: A wood laminate case study, 2009. California Polytechnic State University: San Luis Obispo.
47. Sretenovic A, Muller U, Gindl W. Mechanism of stress transfer in a single wood fibre-LDPE composite by means of electronic laser speckle interferometry. Composites Part A: Applied Science and Manufacturing, 2006, 37: p. 1406-1412.
48. Shah D, Schubel PJ, Licence P, Clifford MJ. Determining the minimum, critical and maximum fibre content for twisted yarn reinforced plant fibre composites. Composites Science and Technology, 2012, 72: p. 1909-1917.
Page 29 of 29
49. Boller K. ML-TDR-64-86, Effect of tensile mean stresses on fatigue properties of plastic laminates reinforced with unwoven glass fibers, 1964. Air Force Materials Laboratory: Dayton.
50. Mandell J, Samborsky DD, Agastra P. Composite materials fatigue issues in wind turbine blade construction, in SAMPE 2008. 2008. Long Beach.
51. Mandell J, Samborsky DD, Sutherland HJ. Effects of materials parameters and design details on the fatigue of composite materials for wind turbine blades, in European Wind Energy Conference. 1999. Nice, France.
52. Shah D, Schubel PJ, Clifford MJ, Licence P. The tensile behavior of off-axis loaded plant fiber composites: an insight on the non-linear stress-strain response. Polymer Composites, 2012, 33(9): p. 1494-1504.
53. Samborsky D, Wilson TJ, Mandell JF. Comparison of tensile fatigue resistance and constant life diagrams for several potential wind turbine blade laminates, 2006. American Institute of Aeronautics and Astronautics: Reston.
54. Mandell J, Samborsky DD, Wahl NK, Sutherland HJ. Testing and analysis of low cost composite materials under spectrum loading and high cycle fatigue conditions, in 14th International Conference on Composite Materials (ICCM-14). 2003. San Diego.