Pro-drop parameter, universal grammar and second language ...
Upload
independentCategory
view
0download
0
Published in International Journal of Fatigue Vol. 32, Issue 6, p. 1658 - 1668 (2010) , http://dx.doi.org/10.1016/j.ijfatigue.2010.03.008
1
Characterization of Crack Nucleation in TA6V under Fretting-
Fatigue loading using the potential drop technique
J. Meriaux1,2, S. Fouvry1, K. Kubiak1, S. Deyber2
(1) Laboratoire de Tribologie et de Dynamique des Systèmes (LTDS), Ecole Centrale Lyon,
France (2) SNECMA, Site de Villaroche, 77550 Moissy-Cramayel, France
Abstract
In this work, the crack nucleation under fretting and fretting fatigue loading was investigated
experimentally on a Ti-6Al-4V alloy. The geometry considered is a cylinder on flat contact in
stick slip conditions. A new dual actuator fretting fatigue device was presented and an original
interrupted test expertise methodology was proposed. In order to quantify the crack
nucleation, the fretting fatigue set-up was equipped with a potential drop technique device. A
proper calibration, presented in this paper, allowed a crack nucleation detection threshold of
50 µm with an error threshold of 10% at the maximum. Three parallel studies have been
carried out: fretting loading tests (optical expertise), fretting fatigue test for a lifetime of
100 000 (optical expertise) and fretting fatigue interrupted tests (potential drop technique).
These tests have shown that the addition of a fatigue load can provide a fall of 45% of the
tangential threshold of crack nucleation compared to simple fretting loading. It has been
identified that the crack nucleation is influenced by the fretting and the fatigue forces in two
ways: increasing the fatigue load leads to a decrease of the tangential force nucleation
threshold whereas raising the fretting load leads to a decrease of the nucleation and fracture
fatigue lifetime. All tests curried out with the potential drop technique system have shown that
this technique is very efficient in the case of a fretting fatigue test.
Keywords: fretting fatigue, crack nucleation, Ti-6Al-4V, potential drop technique
Nomenclature
Ra roughness (µm),
d cylindrical sample radius (mm),
Published in International Journal of Fatigue Vol. 32, Issue 6, p. 1658 - 1668 (2010) , http://dx.doi.org/10.1016/j.ijfatigue.2010.03.008
2
V electrical potential at the edge of the crack (V),
V0 electrical potential measured at the beginning of the test (V),
a crack length (µm),
W sample depth (mm),
N number of cycles
po maximal Hertzian pressure in the contact (MPa),
P normal force (N),
δ sliding amplitude (µm),
Q tangential load (N),
Qc critical tangential load (N): tangential load that leads to crack nucleation for a
given N
σfat fatigue load (MPa),
R stress ratio,
N0, Nf cycle limits used to determined the value of V0,
µ coefficient of friction,
aref confidential crack length that corresponds to the definition of the crack nucleation
(50µm < aref < 100µm). This crack length is used to compare the different loading
configurations.
1 Introduction
Fretting fatigue is a critical solicitation that appears on many structures such as the blade/disk
contact of aircraft engines (Figure 1). It is characterized by small displacements between two
bodies, one of which has an applied bulk stress. This phenomenon has been studied for a long
time [1] and induces damage and eventually reduces fatigue resistance. Fretting leads to
premature crack nucleation compared to classic fatigue loading.

Published in International Journal of Fatigue Vol. 32, Issue 6, p. 1658 - 1668 (2010) , http://dx.doi.org/10.1016/j.ijfatigue.2010.03.008
3
Figure 1: Illustration of the typical fretting fatigue contact configuration present at the
dovetail notch of blade disk components in rotating aircraft engines [2].
The fretting fatigue damage is mainly controlled by the sliding condition. A gross slip
condition associated to large sliding amplitude will lead to wear debris formation and third
body ejection. Energy description of wear mechanisms has been developed in several studies
[3]. On the other hand, a partial slip condition will principally induce mode II fatigue crack
nucleation.
In the last decade, the effects of several parameters on the fretting fatigue behaviour have
been investigated for instance the stress gradient [4, 5], the sliding regime [6], the roughness
[7], the residual stresses [8], the microstructure [9, 10] and one of the main factors: the
competition between the fretting and the fatigue loads [11]. In general, the influence of those
parameters is studied with regards to the specimen lifetime, crack nucleation models or a
combination of both: the numerical model is providing the number of cycles to nucleation. It
is also possible to estimate the total life time by fracture mechanics analogy.
The total fretting fatigue life is often considered as the sum of a fretting crack nucleation and
fatigue crack propagation. In those cases, the number of cycles until nucleation can be found
either through performing a simulation or by using experimental detection techniques which
are actually very limited. Many studies have been carried out in order to optimize the
prediction of fretting and fretting fatigue cracks’ nucleation. Most of them use a critical plan
approach such as the SWT criterion [12-14], the Dang Van or the Ruiz parameter [15], the
short crack approach[XX], etc… However, those numerical methods induce new varying
parameters such as the critical volume. The influence of the number of cycles to nucleation on
the total lifetime has already been studied, yet there is a lack of experimental data that can be
used to quantify the crack nucleation. This data deficiency is one of the primary weaknesses
in the current models [16]. Experimental data of crack nucleation is also very important in
Published in International Journal of Fatigue Vol. 32, Issue 6, p. 1658 - 1668 (2010) , http://dx.doi.org/10.1016/j.ijfatigue.2010.03.008
4
order to validate the numerical models. Until now, many different techniques have been
investigated with limited success. The most efficient technique is to correlate surface
profilometry measurement with reduction in fatigue strength [17-19]. An other leading
technique uses fractography and SEM observations combined with fatigue striations analysis
[20]. This last technique allows access to the crack propagation kinetic and analysis of the
crack initiation behaviour, but the crack nucleation analysis threshold is limited to 130 µm
which corresponds to the appearance of fatigue striations.
In this study, we have investigated the general behaviour of Ti-6Al-4V material under fretting
fatigue solicitation in a (P,Q,N) representation [12, 21] .We have developed a specific dual-
actuator fatigue set-up capable of separately applying the fatigue and the fretting load. This
experiment has been equipped with a potential drop technique device in order to precisely
detect and quantify the crack nucleation and propagation. Using a particular calibration, it has
been possible to look at the influence of several parameters in the nucleation life and on total
life.
2 Experimental Conditions
2.1 Material and Contact Parameters
The material used for fretting samples, fretting fatigue samples and pads is an alpha/beta alloy
(Ti-6Al-4V) commonly used in aeronautics (Figure 2). The mechanical properties are shown
in Table 1. A single type of contact has been investigated using controlled roughness (Ra = 0.5
µm) specimens in a cylinder on plane geometry with a constant radius d = 40 mm and a
constant width perpendicular to the sliding direction (plane strain conditions). The maximum
compression stress (Hertzian's contact pressure) at the surface was kept constant for all tests.
The working frequency is equal to 10 Hz, limited by the actuator efficiency, but no major
effect of the frequency has been observed in past studies [20].
Published in International Journal of Fatigue Vol. 32, Issue 6, p. 1658 - 1668 (2010) , http://dx.doi.org/10.1016/j.ijfatigue.2010.03.008
5
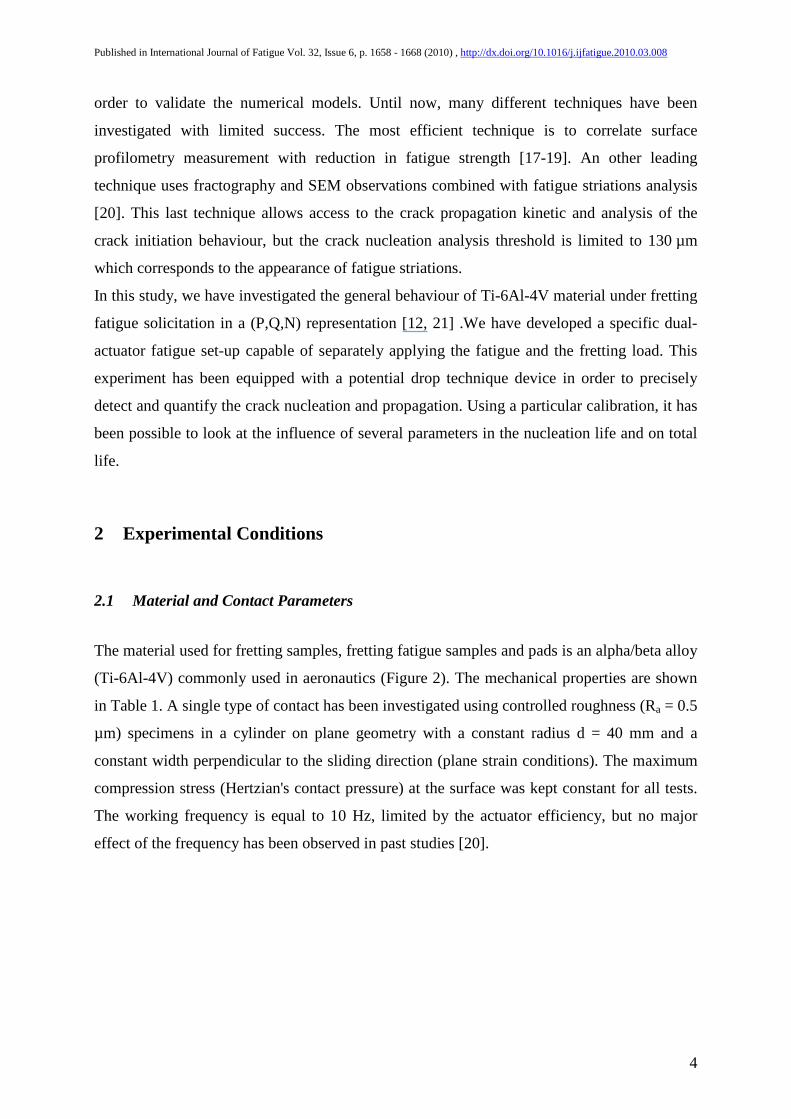
Figure 2: Duplex microstructure of Ti-6Al-4V showing alpha grains and alpha-beta lamellar
structures.
Mechanical properties of Ti-6Al-4V
Elastic modulus (GPa) 119
Poisson ratio 0.29
Yield stress (MPa) 970
Density (g/cm3) 4.4
Vickers hardeness (HV0.3) 360
Table 1: Mechanical properties of Ti-6Al-4V: data provided by SNECMA company.
2.2 Fretting Experimental Set-up
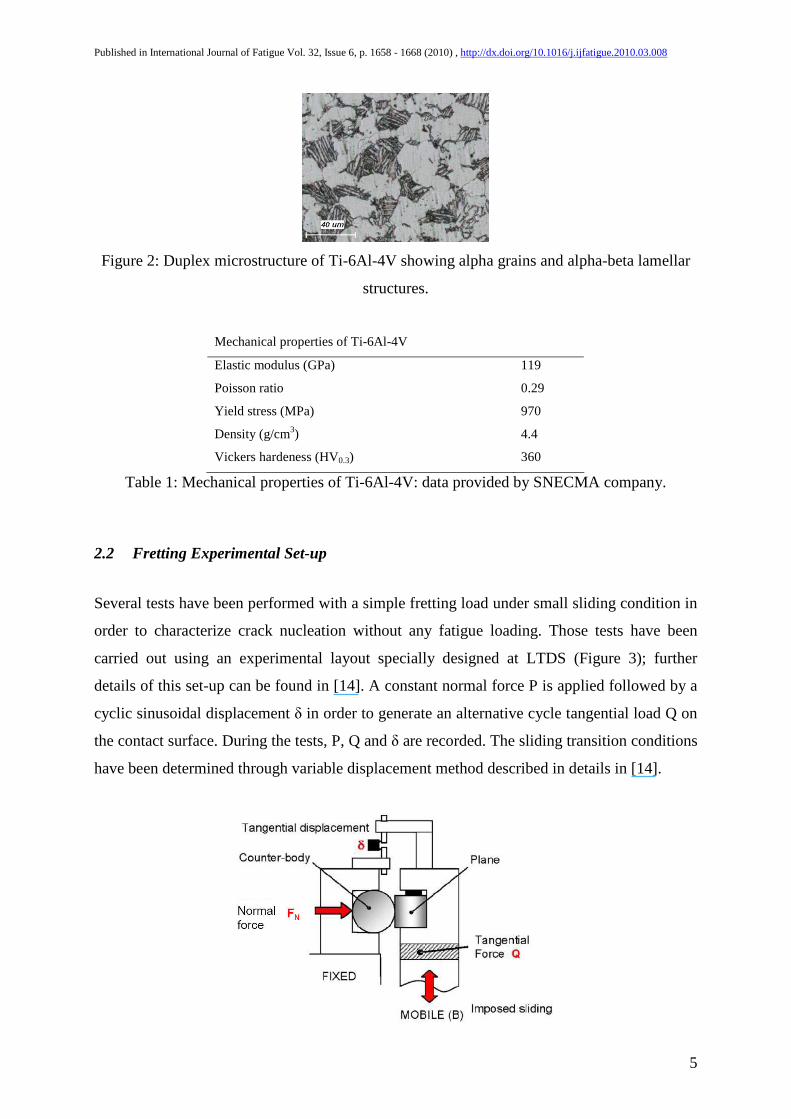
Several tests have been performed with a simple fretting load under small sliding condition in
order to characterize crack nucleation without any fatigue loading. Those tests have been
carried out using an experimental layout specially designed at LTDS (Figure 3); further
details of this set-up can be found in [14]. A constant normal force P is applied followed by a
cyclic sinusoidal displacement δ in order to generate an alternative cycle tangential load Q on
the contact surface. During the tests, P, Q and δ are recorded. The sliding transition conditions
have been determined through variable displacement method described in details in [14].
Published in International Journal of Fatigue Vol. 32, Issue 6, p. 1658 - 1668 (2010) , http://dx.doi.org/10.1016/j.ijfatigue.2010.03.008
6
Figure 3: Schematic diagram of the LTDS fretting system for the cylinder on plane
configuration.
2.3 Fretting Fatigue Experimental Set-up
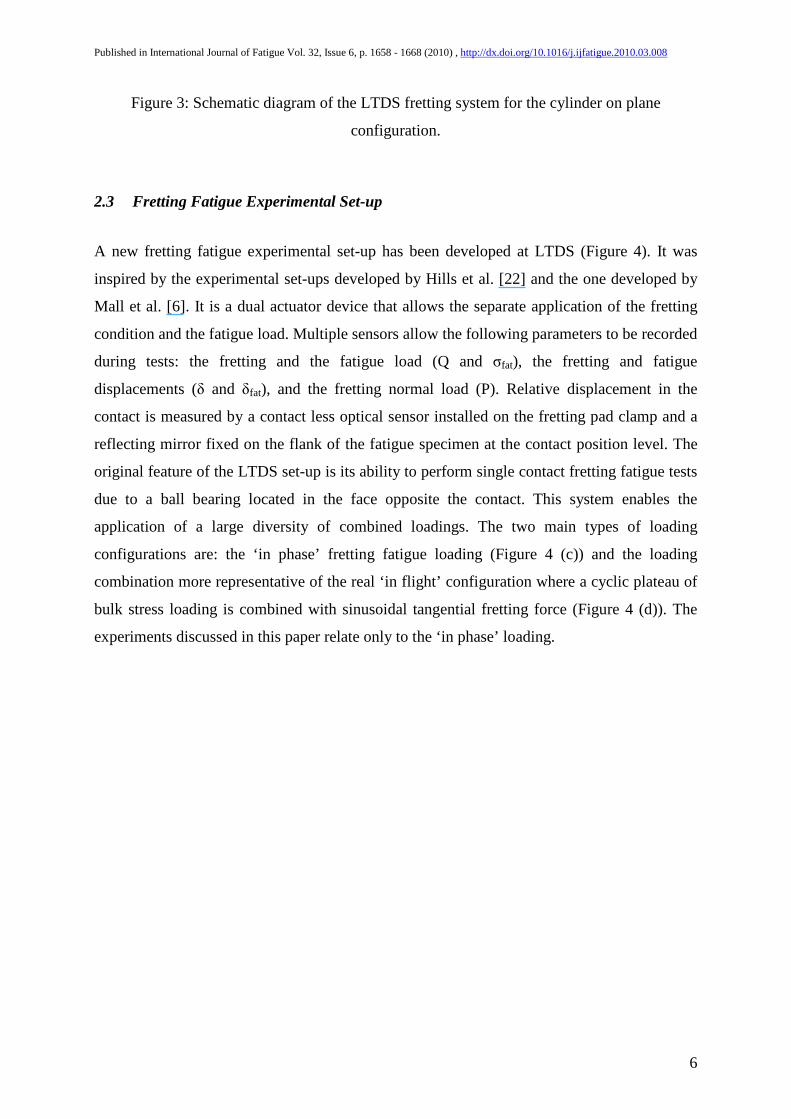
A new fretting fatigue experimental set-up has been developed at LTDS (Figure 4). It was
inspired by the experimental set-ups developed by Hills et al. [22] and the one developed by
Mall et al. [6]. It is a dual actuator device that allows the separate application of the fretting
condition and the fatigue load. Multiple sensors allow the following parameters to be recorded
during tests: the fretting and the fatigue load (Q and σfat), the fretting and fatigue
displacements (δ and δfat), and the fretting normal load (P). Relative displacement in the
contact is measured by a contact less optical sensor installed on the fretting pad clamp and a
reflecting mirror fixed on the flank of the fatigue specimen at the contact position level. The
original feature of the LTDS set-up is its ability to perform single contact fretting fatigue tests
due to a ball bearing located in the face opposite the contact. This system enables the
application of a large diversity of combined loadings. The two main types of loading
configurations are: the ‘in phase’ fretting fatigue loading (Figure 4 (c)) and the loading
combination more representative of the real ‘in flight’ configuration where a cyclic plateau of
bulk stress loading is combined with sinusoidal tangential fretting force (Figure 4 (d)). The
experiments discussed in this paper relate only to the ‘in phase’ loading.

Published in International Journal of Fatigue Vol. 32, Issue 6, p. 1658 - 1668 (2010) , http://dx.doi.org/10.1016/j.ijfatigue.2010.03.008
7
Figure 4: (a) Representation of the LTDS fretting fatigue set-up, (b) close up of the fretting
contact; and the two types of classical configurations: (c) in phase and (d) cyclic constant bulk
stress.
2.4 Post-test Analysis Methodology
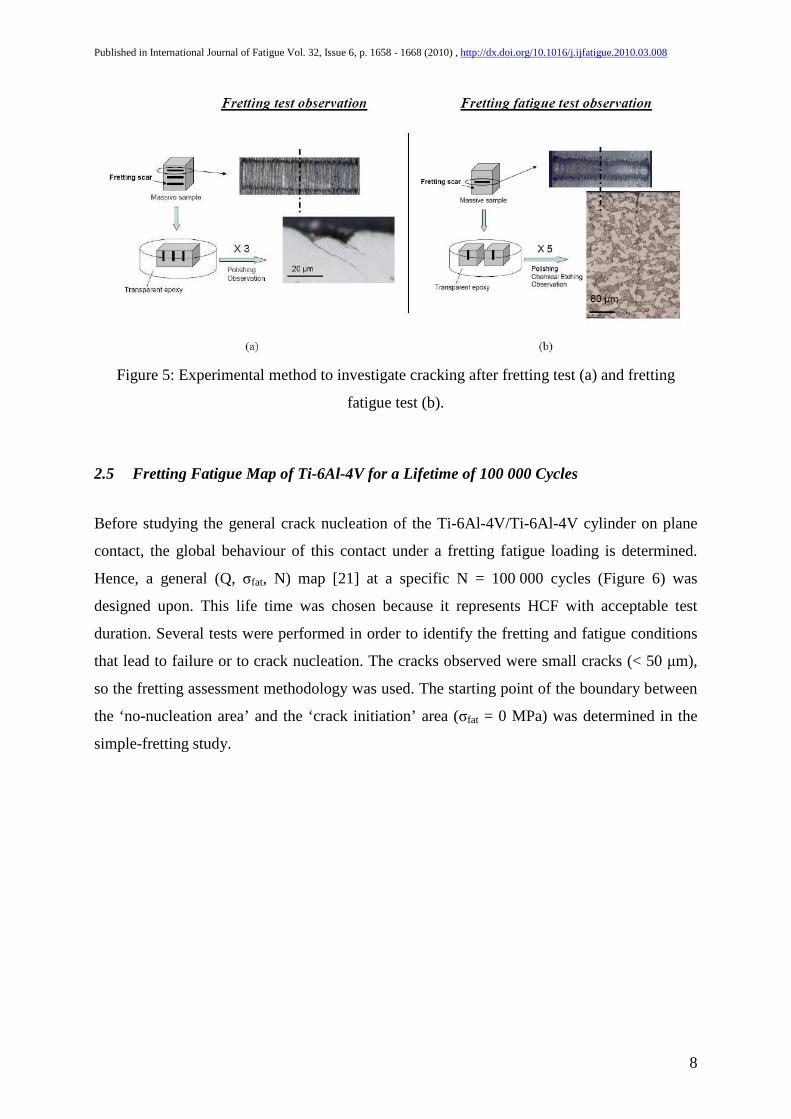
Most of the tests presented here have been interrupted and analysed. Analyses consist of an
optical determination of the crack length. The crack analysis technique has been inspired by
Proudhon et al. [12]. For all fretting tests, the sample is cut in the middle of the scars. Then,
the new surface created is polished and observed with an optical microscope. The polishing
and observation phase is repeated triple in order to evaluate the homogeneity of the crack
length. The scale of crack length studied here (0 to 80 µm) corresponds to a homogeneous
mode II crack propagation in the material. Therefore, the technique used is sufficient for
obtaining proper quantification of crack length.
Regarding the fretting fatigue test, the level of crack length is much higher (50 µm to 1mm)
and the assessments have shown more inhomogeneous cracks. That is why the observations
were taken from ten polishing planes instead of three and a chemical etching with Keller
reactant was carried out on all observed planes (Figure 5).
Published in International Journal of Fatigue Vol. 32, Issue 6, p. 1658 - 1668 (2010) , http://dx.doi.org/10.1016/j.ijfatigue.2010.03.008
8
Figure 5: Experimental method to investigate cracking after fretting test (a) and fretting
fatigue test (b).
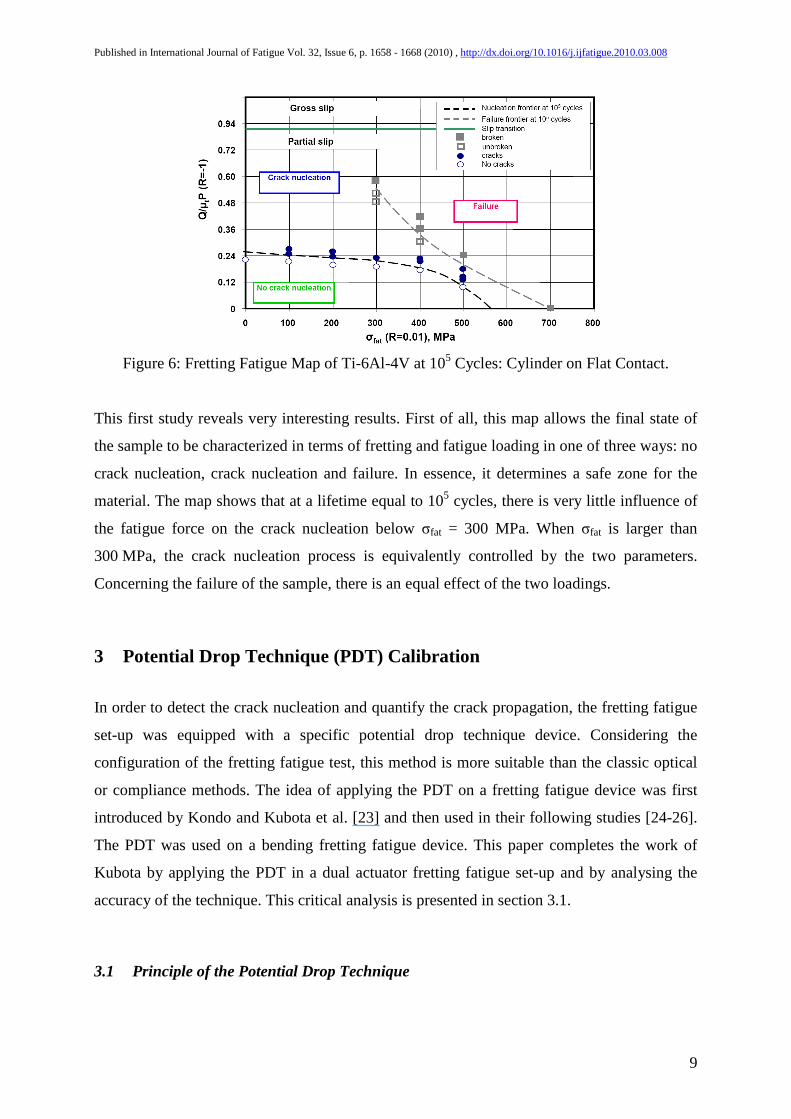
2.5 Fretting Fatigue Map of Ti-6Al-4V for a Lifetime of 100 000 Cycles
Before studying the general crack nucleation of the Ti-6Al-4V/Ti-6Al-4V cylinder on plane
contact, the global behaviour of this contact under a fretting fatigue loading is determined.
Hence, a general (Q, σfat, N) map [21] at a specific N = 100 000 cycles (Figure 6) was
designed upon. This life time was chosen because it represents HCF with acceptable test
duration. Several tests were performed in order to identify the fretting and fatigue conditions
that lead to failure or to crack nucleation. The cracks observed were small cracks (< 50 µm),
so the fretting assessment methodology was used. The starting point of the boundary between
the ‘no-nucleation area’ and the ‘crack initiation’ area (σfat = 0 MPa) was determined in the
simple-fretting study.
Published in International Journal of Fatigue Vol. 32, Issue 6, p. 1658 - 1668 (2010) , http://dx.doi.org/10.1016/j.ijfatigue.2010.03.008
9
Figure 6: Fretting Fatigue Map of Ti-6Al-4V at 105 Cycles: Cylinder on Flat Contact.
This first study reveals very interesting results. First of all, this map allows the final state of
the sample to be characterized in terms of fretting and fatigue loading in one of three ways: no
crack nucleation, crack nucleation and failure. In essence, it determines a safe zone for the
material. The map shows that at a lifetime equal to 105 cycles, there is very little influence of
the fatigue force on the crack nucleation below σfat = 300 MPa. When σfat is larger than
300 MPa, the crack nucleation process is equivalently controlled by the two parameters.
Concerning the failure of the sample, there is an equal effect of the two loadings.
3 Potential Drop Technique (PDT) Calibration
In order to detect the crack nucleation and quantify the crack propagation, the fretting fatigue
set-up was equipped with a specific potential drop technique device. Considering the
configuration of the fretting fatigue test, this method is more suitable than the classic optical
or compliance methods. The idea of applying the PDT on a fretting fatigue device was first
introduced by Kondo and Kubota et al. [23] and then used in their following studies [24-26].
The PDT was used on a bending fretting fatigue device. This paper completes the work of
Kubota by applying the PDT in a dual actuator fretting fatigue set-up and by analysing the
accuracy of the technique. This critical analysis is presented in section 3.1.
3.1 Principle of the Potential Drop Technique
Published in International Journal of Fatigue Vol. 32, Issue 6, p. 1658 - 1668 (2010) , http://dx.doi.org/10.1016/j.ijfatigue.2010.03.008
10
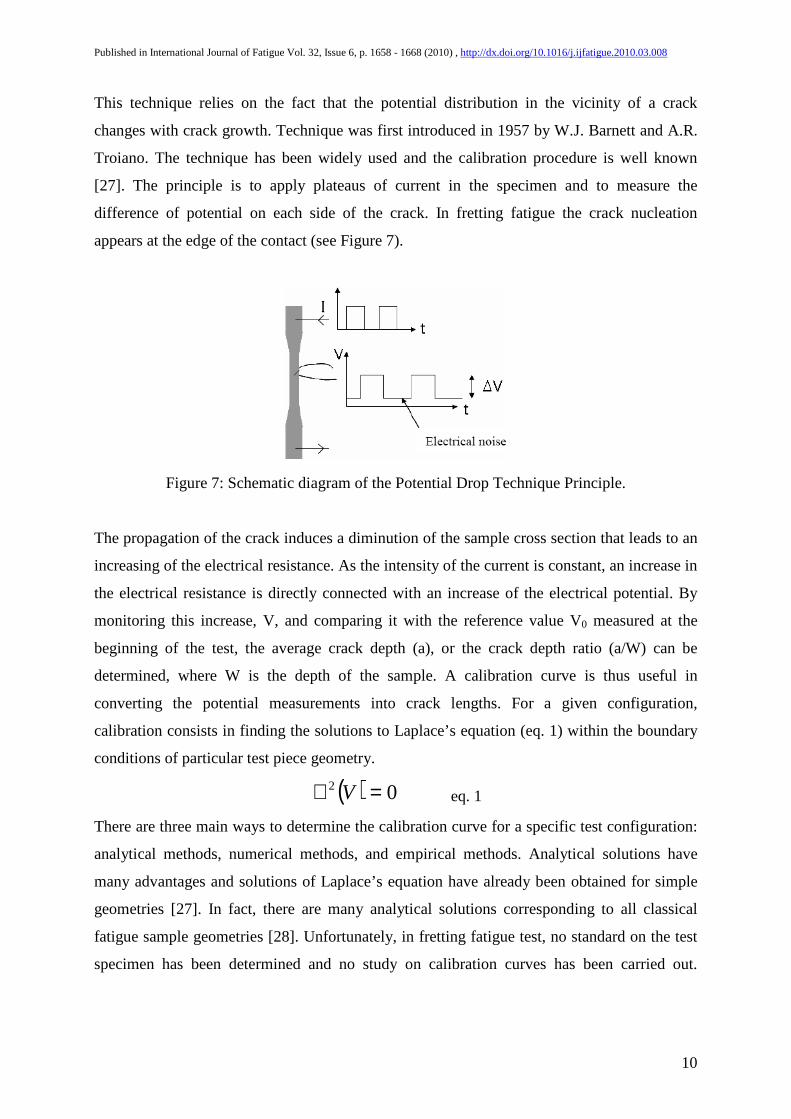
This technique relies on the fact that the potential distribution in the vicinity of a crack
changes with crack growth. Technique was first introduced in 1957 by W.J. Barnett and A.R.
Troiano. The technique has been widely used and the calibration procedure is well known
[27]. The principle is to apply plateaus of current in the specimen and to measure the
difference of potential on each side of the crack. In fretting fatigue the crack nucleation
appears at the edge of the contact (see Figure 7).
Figure 7: Schematic diagram of the Potential Drop Technique Principle.
The propagation of the crack induces a diminution of the sample cross section that leads to an
increasing of the electrical resistance. As the intensity of the current is constant, an increase in
the electrical resistance is directly connected with an increase of the electrical potential. By
monitoring this increase, V, and comparing it with the reference value V0 measured at the
beginning of the test, the average crack depth (a), or the crack depth ratio (a/W) can be
determined, where W is the depth of the sample. A calibration curve is thus useful in
converting the potential measurements into crack lengths. For a given configuration,
calibration consists in finding the solutions to Laplace’s equation (eq. 1) within the boundary
conditions of particular test piece geometry.
( ) 02 =∇ V eq. 1
There are three main ways to determine the calibration curve for a specific test configuration:
analytical methods, numerical methods, and empirical methods. Analytical solutions have
many advantages and solutions of Laplace’s equation have already been obtained for simple
geometries [27]. In fact, there are many analytical solutions corresponding to all classical
fatigue sample geometries [28]. Unfortunately, in fretting fatigue test, no standard on the test
specimen has been determined and no study on calibration curves has been carried out.
Published in International Journal of Fatigue Vol. 32, Issue 6, p. 1658 - 1668 (2010) , http://dx.doi.org/10.1016/j.ijfatigue.2010.03.008
11
Moreover, most of the classical geometries concern pre-cracked sample, which is not the case
of our investigation.
The numerical calibration by using the 2-D or 3-D finite element method also offers multiple
advantages and has been used in many cases for fatigue tests with particular geometries or
loading conditions [29-31]. This method, however, is not adapted to our testing conditions
due to the contact configuration where the fretting pad conducts part of the current. Therefore,
the solution that has been used to obtain the calibration is the empirical method, which
consists in an experimental description of the calibration curve. This calibration was also used
by Kondo and Kubota [23], but not fully described in paper.
3.2 Calibration Methodology
The most important point is to establish the repeatability of the experiment method. The
installation of the electrical set-up is identical for all tests and the determination of the V0 is
calculated as follow:
( )
−
⇒ ∑==−
f
if
N
NN
i
NN V
VNVV
00 0
0
40000 min eq. 2
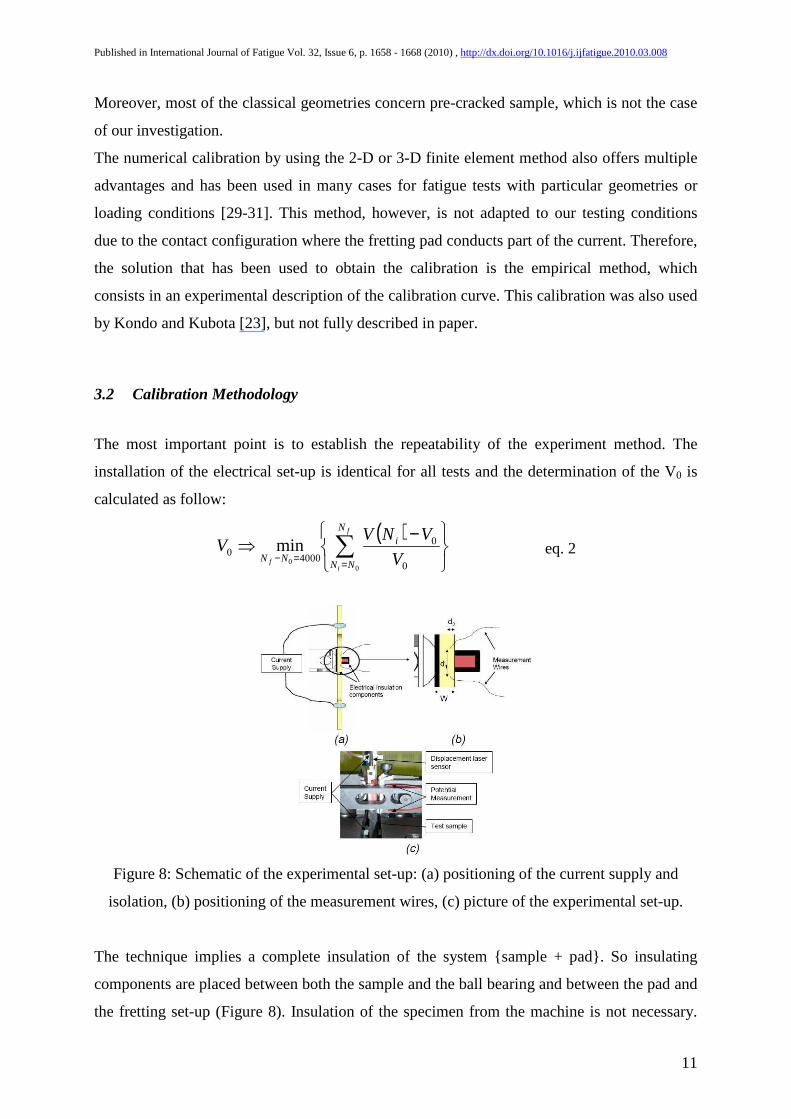
Figure 8: Schematic of the experimental set-up: (a) positioning of the current supply and
isolation, (b) positioning of the measurement wires, (c) picture of the experimental set-up.
The technique implies a complete insulation of the system {sample + pad}. So insulating
components are placed between both the sample and the ball bearing and between the pad and
the fretting set-up (Figure 8). Insulation of the specimen from the machine is not necessary.
Published in International Journal of Fatigue Vol. 32, Issue 6, p. 1658 - 1668 (2010) , http://dx.doi.org/10.1016/j.ijfatigue.2010.03.008
12
The positioning of the measurement wires has been optimised (d1,d2: Figure 8) in order to
obtain noise less potential measurements. D1 must be very small to have a good signal but
large enough to be sure that the crack is located between the two wires. The wires are welded
on samples with a specific ‘spot welding’ device. Even if the test sample is not pre-cracked,
the fretting fatigue configuration, determine the crack initiation to be placed under the edge of
the contact area. The welding process generates an insignificant flaw compared to the contact
gradient influence in terms of crack nucleation.
The objective of conducting the empirical calibration is to perform a number of tests, thereby
obtaining experimental values of {a/W, V/V0} points. Then, several polynomial functions are
used to correlate those experimental points. In order to optimise the calibration, two
methodologies have been used:
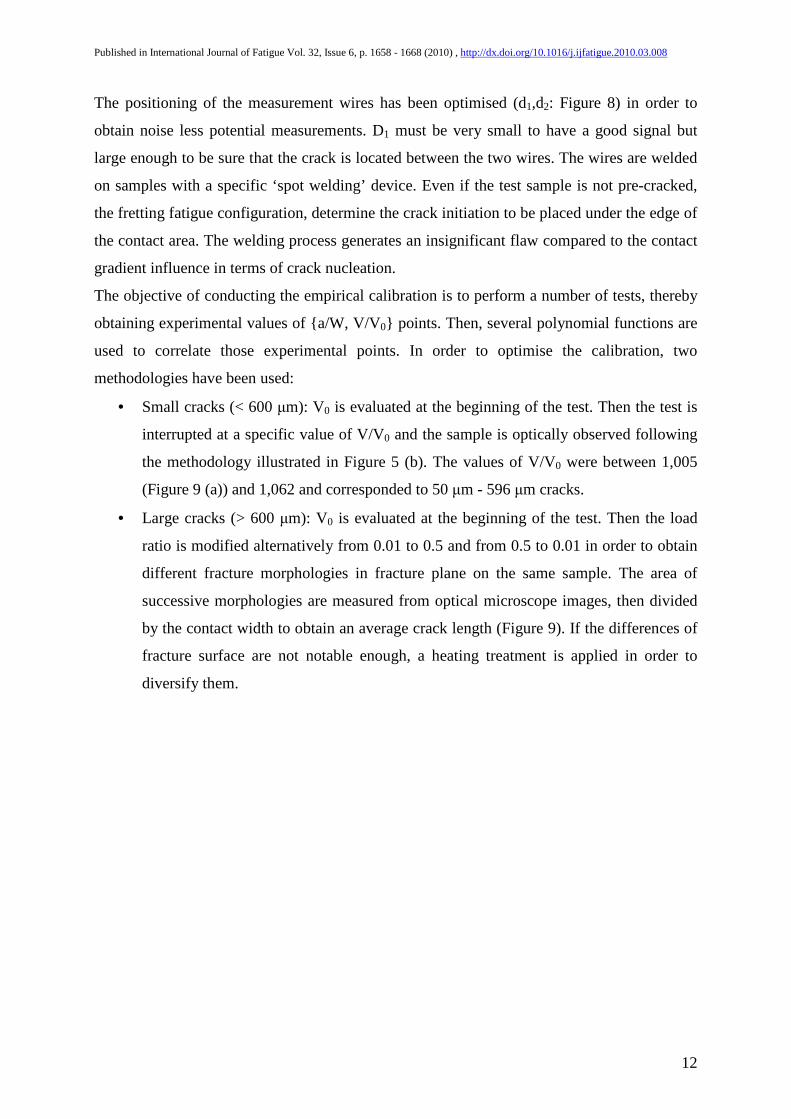
• Small cracks (< 600 µm): V0 is evaluated at the beginning of the test. Then the test is
interrupted at a specific value of V/V0 and the sample is optically observed following
the methodology illustrated in Figure 5 (b). The values of V/V0 were between 1,005
(Figure 9 (a)) and 1,062 and corresponded to 50 µm - 596 µm cracks.
• Large cracks (> 600 µm): V0 is evaluated at the beginning of the test. Then the load
ratio is modified alternatively from 0.01 to 0.5 and from 0.5 to 0.01 in order to obtain
different fracture morphologies in fracture plane on the same sample. The area of
successive morphologies are measured from optical microscope images, then divided
by the contact width to obtain an average crack length (Figure 9). If the differences of
fracture surface are not notable enough, a heating treatment is applied in order to
diversify them.
Published in International Journal of Fatigue Vol. 32, Issue 6, p. 1658 - 1668 (2010) , http://dx.doi.org/10.1016/j.ijfatigue.2010.03.008
13
Figure 9: (a) Typical curve V = f(N): test stopped at V/V0 = 1,05, σfat = 400 MPa and Q*/µtP
= +/- 0.29 and corresponding observation, (b) Typical curve V = f(N) for a long crack
calibration test: σfat = 400 MPa with four conditions changes during one test and
corresponding observations.
3.3 Definitive Calibration
Nine calibration tests were carried out in present study: six for short cracks and three for long
cracks. From both analysis methodologies, we obtain a good general view of the crack
geometry. One observation is that for a crack over 100 µm, the propagation can be very
inhomogeneous. This will be a significant issue because measurement wires are welded on
only one face of the sample. An analysis of the accuracy of the calibration is presented below.
Sufficient information has been obtained in order to find a correct calibration curve. Three
polynomial functions have been used with three different values for each coefficient
depending on the value of V/V0:
6
1
05
2
04
3
03
4
02
5
01 A
V
VA
V
VA
V
VA
V
VA
V
VA
W
a +
+
+
+
+
= eq. 3
Published in International Journal of Fatigue Vol. 32, Issue 6, p. 1658 - 1668 (2010) , http://dx.doi.org/10.1016/j.ijfatigue.2010.03.008
14
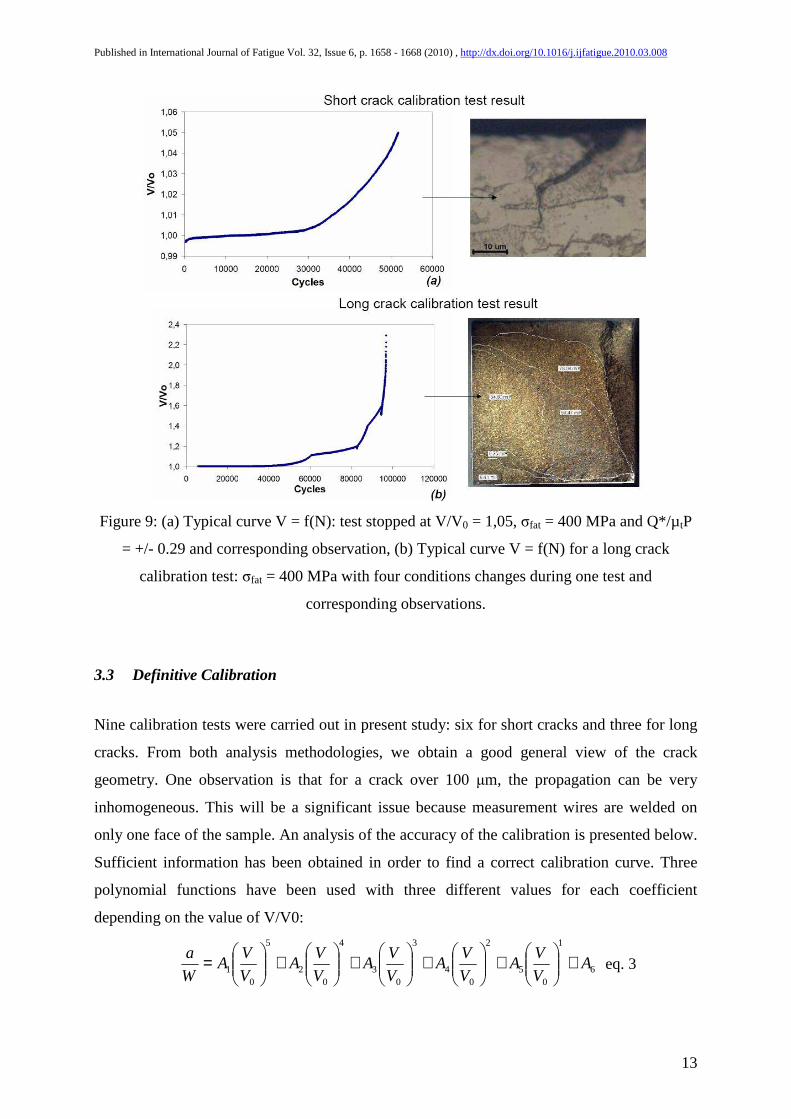
Due to industrial character of presented study the values of the coefficients A1 - A5 are
confidential.
Figure 10: Fretting-fatigue Potential Drop Technique, empirical calibration curve for a
cylinder on flat contact configuration, close-up for short cracks analysis.
Several interesting points can be noted on Figure 10. First of all, with the proposed
methodology, it is possible to obtain a crack nucleation detection threshold at vary small level
of 50 µm which corresponds to a very short crack. It is important to note that SEM
observations of fracture surface have shown that the pure mode II propagation corresponds to
50 µm to 100 µm cracks. Therefore, the detection threshold corresponds either to a pure mode
II crack or to the boundary between pure mode II and mixed mode I-mode II crack
propagation. It is also notable that the calibration curve presents two plateaus: one at a/W =
0.02 and the other at a/W = 0.08 (Figure 10). A plateau corresponds to a large augmentation
of the measured resistance at a stable value of a/W. So those plateaus correspond to a large
opening of the crack without propagation which means that it corresponds to transitions of the
propagation process (mode II to mode I/mode II to mode I). The transition from a pure mode
II propagation to a mode I/mode II propagation creates a crack opening that induces an
increase in the electrical potential. This phenomenon is also related to the way the crack
length is determined. The small crack length is evaluated without distinction between an open
and a closed area: only the global length is being considered. It is also important to notice that
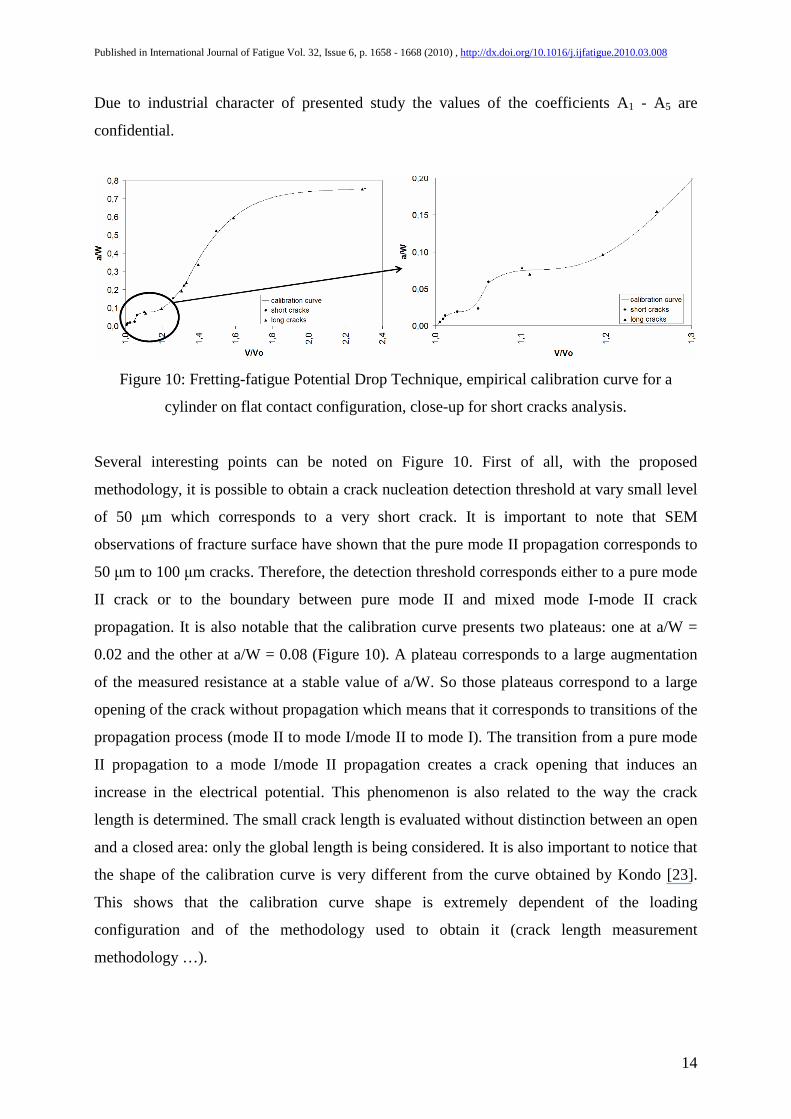
the shape of the calibration curve is very different from the curve obtained by Kondo [23].
This shows that the calibration curve shape is extremely dependent of the loading
configuration and of the methodology used to obtain it (crack length measurement
methodology …).
Published in International Journal of Fatigue Vol. 32, Issue 6, p. 1658 - 1668 (2010) , http://dx.doi.org/10.1016/j.ijfatigue.2010.03.008
15
Figure 11: Calibration Curve between Potential drop and notch depth obtained by Kondo et al.
[23].
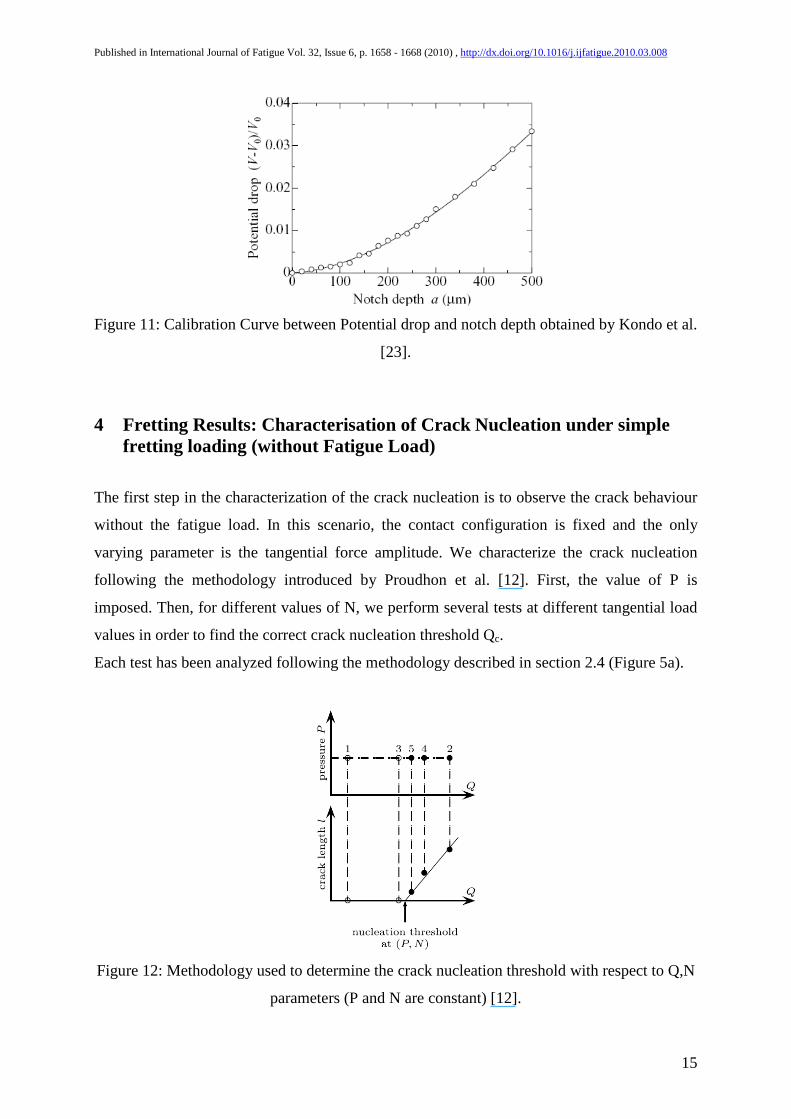
4 Fretting Results: Characterisation of Crack Nucleation under simple fretting loading (without Fatigue Load)
The first step in the characterization of the crack nucleation is to observe the crack behaviour
without the fatigue load. In this scenario, the contact configuration is fixed and the only
varying parameter is the tangential force amplitude. We characterize the crack nucleation
following the methodology introduced by Proudhon et al. [12]. First, the value of P is
imposed. Then, for different values of N, we perform several tests at different tangential load
values in order to find the correct crack nucleation threshold Qc.
Each test has been analyzed following the methodology described in section 2.4 (Figure 5a).
Figure 12: Methodology used to determine the crack nucleation threshold with respect to Q,N
parameters (P and N are constant) [12].
Published in International Journal of Fatigue Vol. 32, Issue 6, p. 1658 - 1668 (2010) , http://dx.doi.org/10.1016/j.ijfatigue.2010.03.008
16
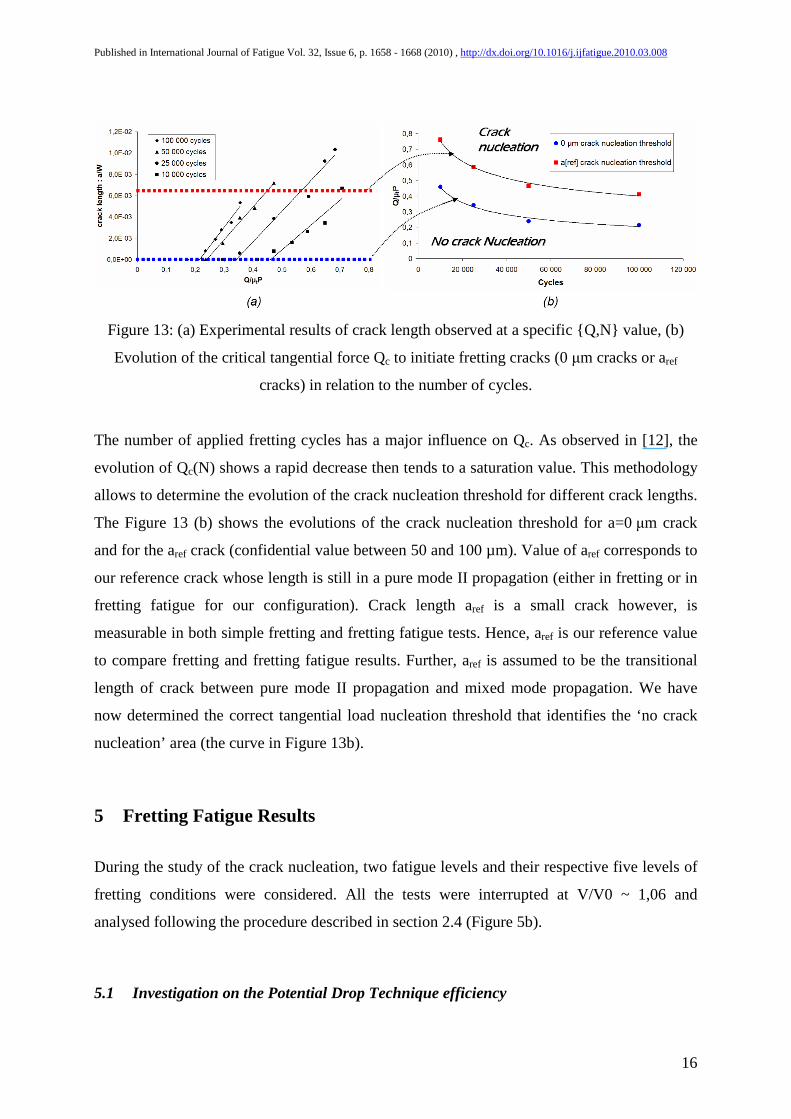
Figure 13: (a) Experimental results of crack length observed at a specific {Q,N} value, (b)
Evolution of the critical tangential force Qc to initiate fretting cracks (0 µm cracks or aref
cracks) in relation to the number of cycles.
The number of applied fretting cycles has a major influence on Qc. As observed in [12], the
evolution of Qc(N) shows a rapid decrease then tends to a saturation value. This methodology
allows to determine the evolution of the crack nucleation threshold for different crack lengths.
The Figure 13 (b) shows the evolutions of the crack nucleation threshold for a=0 µm crack
and for the aref crack (confidential value between 50 and 100 µm). Value of aref corresponds to
our reference crack whose length is still in a pure mode II propagation (either in fretting or in
fretting fatigue for our configuration). Crack length aref is a small crack however, is
measurable in both simple fretting and fretting fatigue tests. Hence, aref is our reference value
to compare fretting and fretting fatigue results. Further, aref is assumed to be the transitional
length of crack between pure mode II propagation and mixed mode propagation. We have
now determined the correct tangential load nucleation threshold that identifies the ‘no crack
nucleation’ area (the curve in Figure 13b).
5 Fretting Fatigue Results
During the study of the crack nucleation, two fatigue levels and their respective five levels of
fretting conditions were considered. All the tests were interrupted at V/V0 ~ 1,06 and
analysed following the procedure described in section 2.4 (Figure 5b).
5.1 Investigation on the Potential Drop Technique efficiency
Published in International Journal of Fatigue Vol. 32, Issue 6, p. 1658 - 1668 (2010) , http://dx.doi.org/10.1016/j.ijfatigue.2010.03.008
17
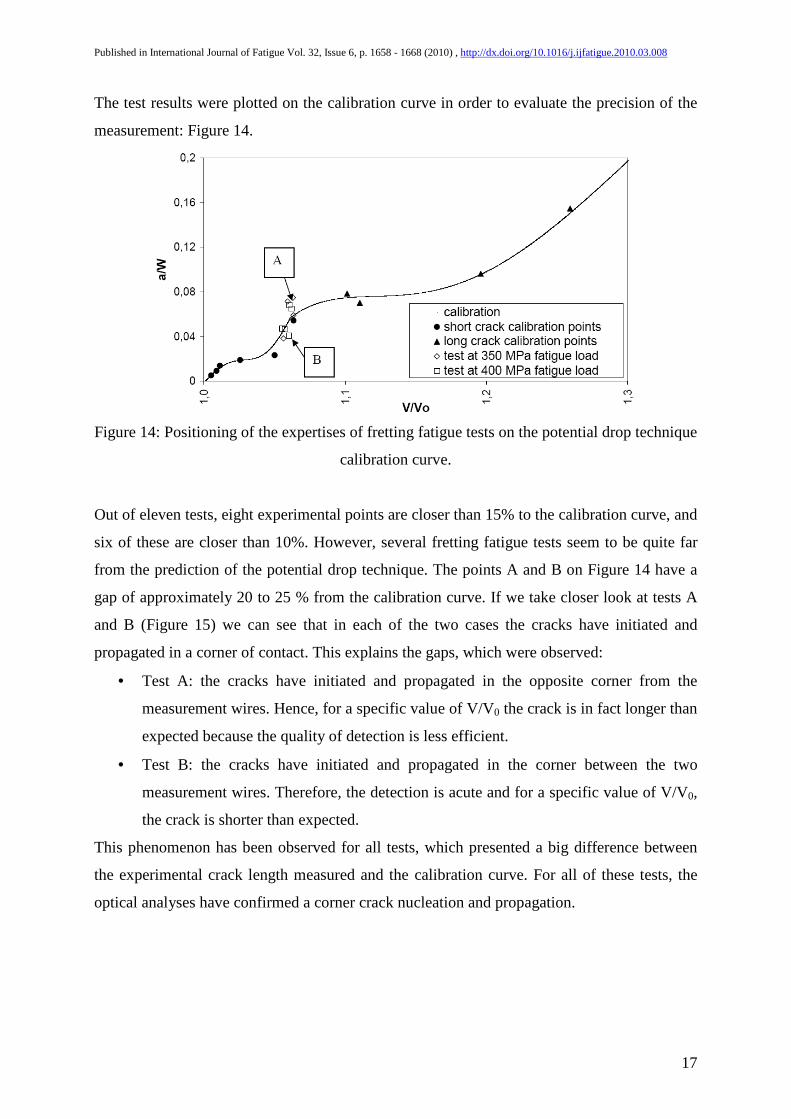
The test results were plotted on the calibration curve in order to evaluate the precision of the
measurement: Figure 14.
Figure 14: Positioning of the expertises of fretting fatigue tests on the potential drop technique
calibration curve.
Out of eleven tests, eight experimental points are closer than 15% to the calibration curve, and
six of these are closer than 10%. However, several fretting fatigue tests seem to be quite far
from the prediction of the potential drop technique. The points A and B on Figure 14 have a
gap of approximately 20 to 25 % from the calibration curve. If we take closer look at tests A
and B (Figure 15) we can see that in each of the two cases the cracks have initiated and
propagated in a corner of contact. This explains the gaps, which were observed:
• Test A: the cracks have initiated and propagated in the opposite corner from the
measurement wires. Hence, for a specific value of V/V0 the crack is in fact longer than
expected because the quality of detection is less efficient.
• Test B: the cracks have initiated and propagated in the corner between the two
measurement wires. Therefore, the detection is acute and for a specific value of V/V0,
the crack is shorter than expected.
This phenomenon has been observed for all tests, which presented a big difference between
the experimental crack length measured and the calibration curve. For all of these tests, the
optical analyses have confirmed a corner crack nucleation and propagation.

Published in International Journal of Fatigue Vol. 32, Issue 6, p. 1658 - 1668 (2010) , http://dx.doi.org/10.1016/j.ijfatigue.2010.03.008
18
Figure 15: Pictures of the two sides of sample A and B: position of the cracks with respect to
the measurement wires.
It could be conclude thant proposed technique is very efficient, but in the case of corner
cracks, a correction is needed. This problem comes from the fact that the acquisition system
contains only one measurement circuit line.
Now the technique can be optimised, however, as an optical analysis allows us to adjust the
calibration curve according to the precise test. A homothety transformation is thus applied to
the coefficients of the polynomial function (Figure 16). Considering a rupture of sample, a
quick optical analysis permits to determine if the crack has propagated in a corner, and if so,
how to optimise the calibration by choosing the A or the B fitted curve. The decrease in
efficiency due to a corner crack on the opposite side of the measurement wire leads to the
crack nucleation detection threshold decreasing to 66 µm. Assuming this we consider the
threshold to be determined by V/V0 = 1,005 and that the worst case calibration curve is the A
curve. in this way, the technique of fitting the curve is validated (the crack nucleation and
propagation processes are always the same) and that the reference calibration curve is correct.
Therefore, the threshold is fixed by a crack length of 50 µm (that has been obtained during the
calibration work) after fitting the calibration curve to the specific test.
Published in International Journal of Fatigue Vol. 32, Issue 6, p. 1658 - 1668 (2010) , http://dx.doi.org/10.1016/j.ijfatigue.2010.03.008
19
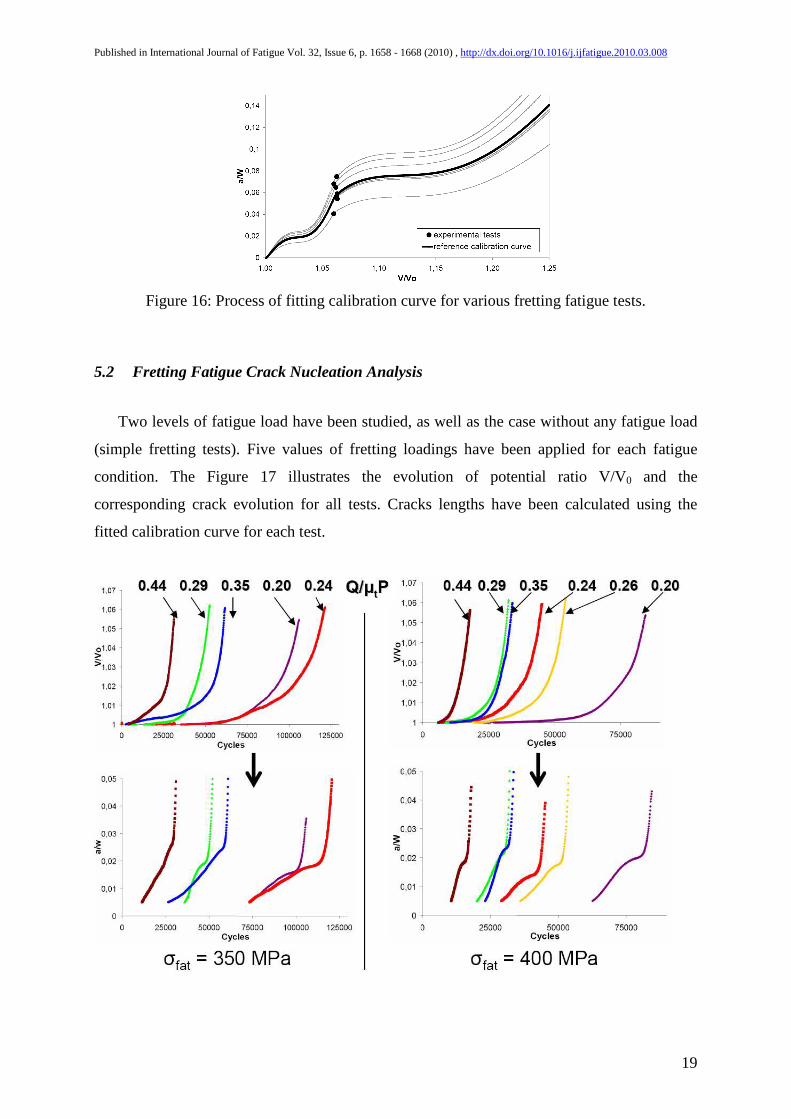
Figure 16: Process of fitting calibration curve for various fretting fatigue tests.
5.2 Fretting Fatigue Crack Nucleation Analysis
Two levels of fatigue load have been studied, as well as the case without any fatigue load
(simple fretting tests). Five values of fretting loadings have been applied for each fatigue
condition. The Figure 17 illustrates the evolution of potential ratio V/V0 and the
corresponding crack evolution for all tests. Cracks lengths have been calculated using the
fitted calibration curve for each test.
Published in International Journal of Fatigue Vol. 32, Issue 6, p. 1658 - 1668 (2010) , http://dx.doi.org/10.1016/j.ijfatigue.2010.03.008
20
Figure 17: Evolution of V/Vo for all fretting fatigue tests and the corresponding crack length
evolutions.
Figure 17 is rich in information; it shows the same curve shape for all tests, thereby validating
the fact that all the tests are reproductive. There are clearly two phases in propagation which
can be identified by the change of the curve’s slope. This behaviour swing appears for crack
lengths between 150 µm and 250 µm. We can also see a general trend that when the tangential
load increases, the number of cycles to nucleate cracks is decreasing. The Figure 17 shows
occasional deviation from this trend, but this can be related to general fatigue dispersion. We
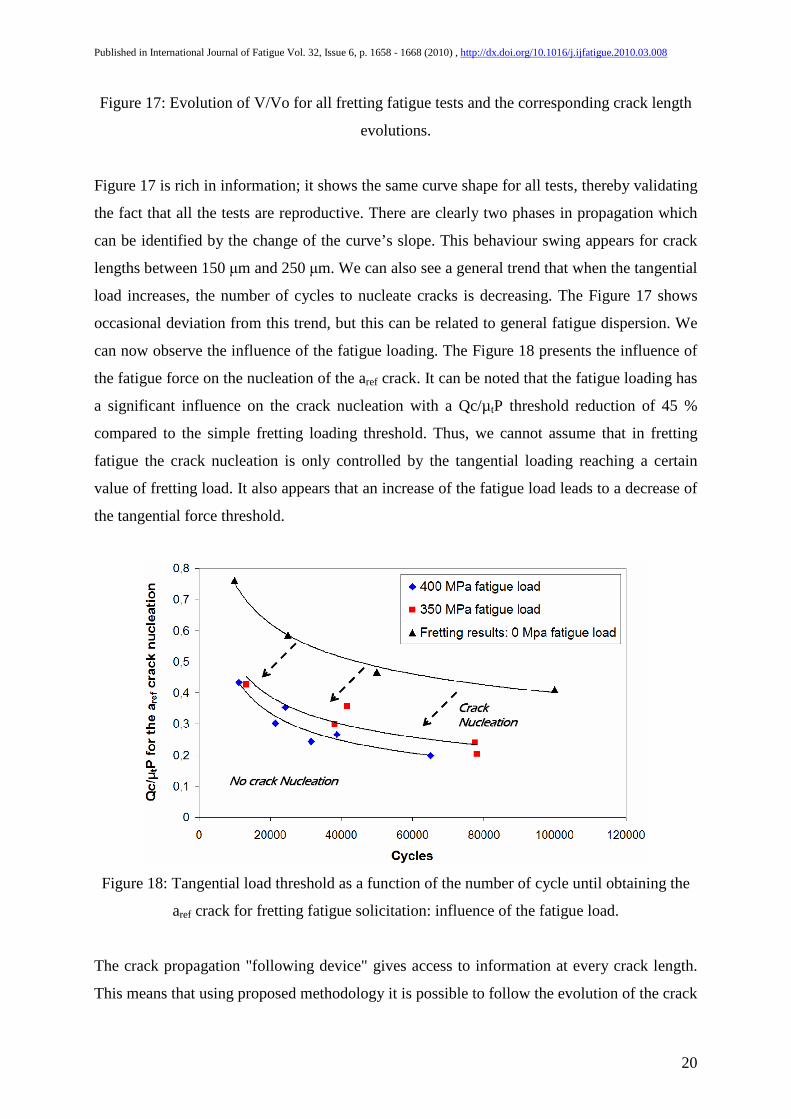
can now observe the influence of the fatigue loading. The Figure 18 presents the influence of
the fatigue force on the nucleation of the aref crack. It can be noted that the fatigue loading has
a significant influence on the crack nucleation with a Qc/µtP threshold reduction of 45 %
compared to the simple fretting loading threshold. Thus, we cannot assume that in fretting
fatigue the crack nucleation is only controlled by the tangential loading reaching a certain
value of fretting load. It also appears that an increase of the fatigue load leads to a decrease of
the tangential force threshold.
Figure 18: Tangential load threshold as a function of the number of cycle until obtaining the
aref crack for fretting fatigue solicitation: influence of the fatigue load.
The crack propagation "following device" gives access to information at every crack length.
This means that using proposed methodology it is possible to follow the evolution of the crack
Published in International Journal of Fatigue Vol. 32, Issue 6, p. 1658 - 1668 (2010) , http://dx.doi.org/10.1016/j.ijfatigue.2010.03.008
21
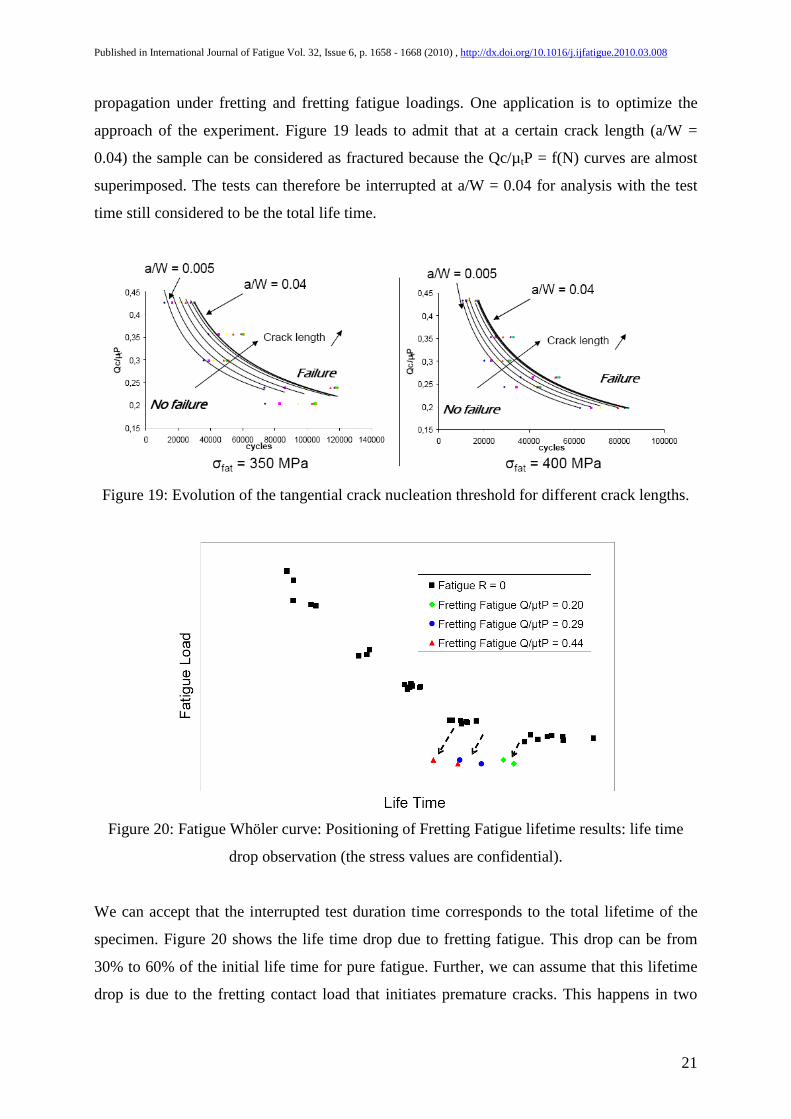
propagation under fretting and fretting fatigue loadings. One application is to optimize the
approach of the experiment. Figure 19 leads to admit that at a certain crack length (a/W =
0.04) the sample can be considered as fractured because the Qc/µtP = f(N) curves are almost
superimposed. The tests can therefore be interrupted at a/W = 0.04 for analysis with the test
time still considered to be the total life time.
Figure 19: Evolution of the tangential crack nucleation threshold for different crack lengths.
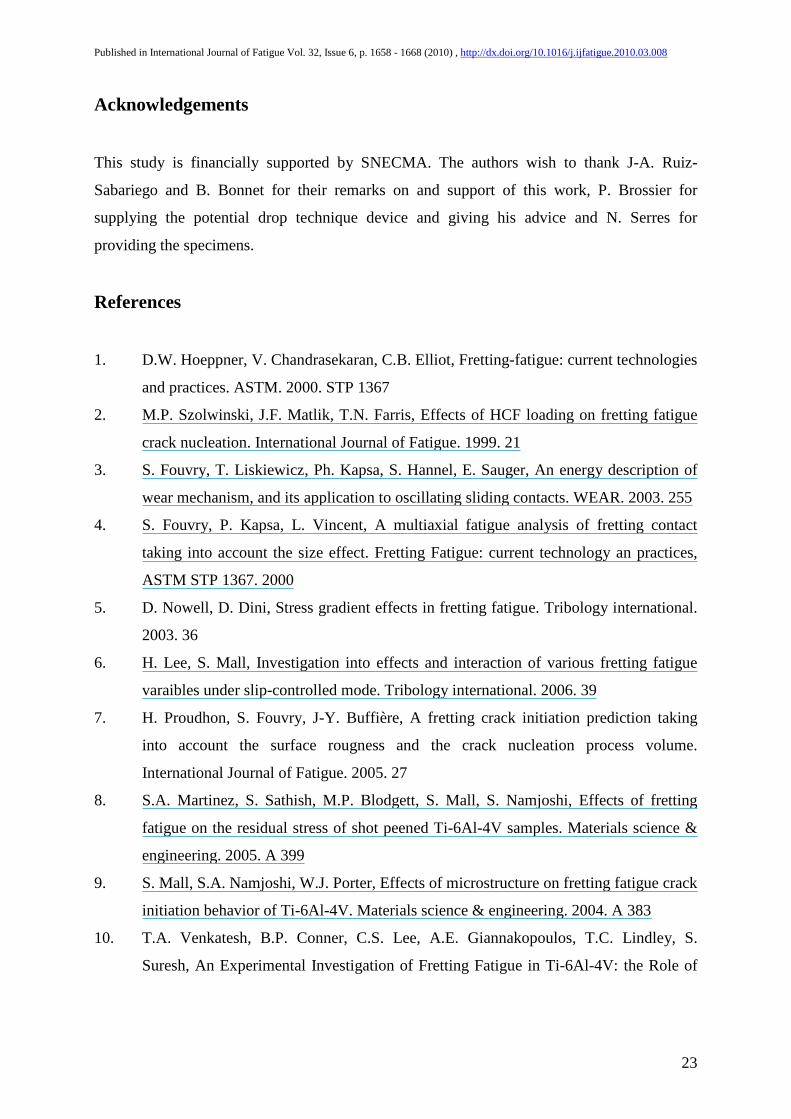
Figure 20: Fatigue Whöler curve: Positioning of Fretting Fatigue lifetime results: life time
drop observation (the stress values are confidential).
We can accept that the interrupted test duration time corresponds to the total lifetime of the
specimen. Figure 20 shows the life time drop due to fretting fatigue. This drop can be from
30% to 60% of the initial life time for pure fatigue. Further, we can assume that this lifetime
drop is due to the fretting contact load that initiates premature cracks. This happens in two

Published in International Journal of Fatigue Vol. 32, Issue 6, p. 1658 - 1668 (2010) , http://dx.doi.org/10.1016/j.ijfatigue.2010.03.008
22
ways: the crack nucleation is accelerated more by the tangential force than by the fatigue load,
and the crack propagation is accelerated more by the fatigue force than by the simple fretting
load. These results confirm what we have shown in Figure 6. Considering the level of fatigue
loading, we have seen in both studies that there is a significant influence of both forces:
fretting and fatigue.
6 Conclusions
Two crack nucleation approaches have been presented: optical analysis and potential drop
technique (PDT). The first breakthrough presented in this paper is the use of the potential
drop technique on a dual actuator fretting fatigue set-up (fretting fatigue in traction). This
paper presents the calibration methodology that led to a crack nucleation detection threshold
of 50 µm. The PDT precision was tested and we have shown that the optimization of the data
treatment can lead to a calibration margin of error below 10%. using proposed methodology it
is possible to detect a 50 µm crack and to measure its propagation rate quantitatively up to
failure of specimen.
Three separate studies were carried out:
• a fretting study which resulted in fast quantification of crack nucleation under
simple fretting load,
• the first representation of the crack nucleation-propagation behaviour of Ti-6Al-
4V, illustrated by a fretting fatigue map (Q, σ) at 100 000 cycles, and
• a fretting fatigue study equipped with a potential drop technique which allowed to
precisely quantify the crack nucleation threshold (Qc). We have shown that the
crack nucleation is not only driven by the fretting loading but also by the fatigue
force in our test configuration.
The potential drop technique also demonstrates a change in the crack propagation behaviour.
Two propagation behaviours have been observed in a range of crack lengths corresponding to
a mode I-mode II propagation. Complementary observations are in progress, with the dual
goal of optimising the quantification of the crack propagation and of linking the quantitative
information to a qualitative explanation of the crack propagation behaviour. Other test
configurations, conditions and loadings will be studied with the potential drop equipment to
complete knowledge of the influence of each parameter on the crack nucleation behaviour.
Published in International Journal of Fatigue Vol. 32, Issue 6, p. 1658 - 1668 (2010) , http://dx.doi.org/10.1016/j.ijfatigue.2010.03.008
23
Acknowledgements
This study is financially supported by SNECMA. The authors wish to thank J-A. Ruiz-
Sabariego and B. Bonnet for their remarks on and support of this work, P. Brossier for
supplying the potential drop technique device and giving his advice and N. Serres for
providing the specimens.
References
1. D.W. Hoeppner, V. Chandrasekaran, C.B. Elliot, Fretting-fatigue: current technologies
and practices. ASTM. 2000. STP 1367
2. M.P. Szolwinski, J.F. Matlik, T.N. Farris, Effects of HCF loading on fretting fatigue
crack nucleation. International Journal of Fatigue. 1999. 21
3. S. Fouvry, T. Liskiewicz, Ph. Kapsa, S. Hannel, E. Sauger, An energy description of
wear mechanism, and its application to oscillating sliding contacts. WEAR. 2003. 255
4. S. Fouvry, P. Kapsa, L. Vincent, A multiaxial fatigue analysis of fretting contact
taking into account the size effect. Fretting Fatigue: current technology an practices,
ASTM STP 1367. 2000
5. D. Nowell, D. Dini, Stress gradient effects in fretting fatigue. Tribology international.
2003. 36
6. H. Lee, S. Mall, Investigation into effects and interaction of various fretting fatigue
varaibles under slip-controlled mode. Tribology international. 2006. 39
7. H. Proudhon, S. Fouvry, J-Y. Buffière, A fretting crack initiation prediction taking
into account the surface rougness and the crack nucleation process volume.
International Journal of Fatigue. 2005. 27
8. S.A. Martinez, S. Sathish, M.P. Blodgett, S. Mall, S. Namjoshi, Effects of fretting
fatigue on the residual stress of shot peened Ti-6Al-4V samples. Materials science &
engineering. 2005. A 399
9. S. Mall, S.A. Namjoshi, W.J. Porter, Effects of microstructure on fretting fatigue crack
initiation behavior of Ti-6Al-4V. Materials science & engineering. 2004. A 383
10. T.A. Venkatesh, B.P. Conner, C.S. Lee, A.E. Giannakopoulos, T.C. Lindley, S.
Suresh, An Experimental Investigation of Fretting Fatigue in Ti-6Al-4V: the Role of
Published in International Journal of Fatigue Vol. 32, Issue 6, p. 1658 - 1668 (2010) , http://dx.doi.org/10.1016/j.ijfatigue.2010.03.008
24
Contact Conditions and Microstructure. Metallurgical and Materials Transactions.
2001. 32A
11. S.A. Namjoshi, S. Mall, Fretting behavior of Ti-6Al-4V under combined high cycle
and low cycle fatigue loading. International Journal of Fatigue. 2001. 23
12. H. Proudhon, S. Fouvry, Determination and prediction of the fretting crack initiation:
introduction of the (P,Q,N) representation and definition of a variation process
volume. International Journal of Fatigue. 2005
13. M.P. Szolwinski, T.N. Farris, Observation, analysis and prediction of fretting fatigue
in 2024-T351 alluminium alloy. WEAR. 1998. 221
14. S. Fouvry, D. Nowell, K. Kubiak, D.A. Hills, Prediction of fretting crack propagation
based on a short crack methodology. Engineering Fracture Mechanics. 2008. 75
15. C.D. Lykins, S. Mall, V. Jain, An Evaluation of parameters for predicting fretting
fatigue crack initiation. International Journal of Fatigue. 2000. 22
16. J.J. Madge, S.B. Leen, P.H. Shipway, A combined wear and crack nucleation-
propagation methodology for fretting fatigue prediction. International Journal of
Fatigue. 2008. 30
17. A. Hutson, S. Sathish, T. Nicholas, Progression of fretting fatigue damage in Ti-6Al-
4V. Tribology international. 2006. 39
18. A.L. Hutson, C. Nelsen, T. Nicholas, Characterization of fretting fatigue crack
initiation processes in CR Ti-6Al-4V. Tribology international. 2003. 36
19. P.D. Nicolaou, E.B. Shell, T.E. Matikas, Microstructural and surface characterization
of Ti-6Al-4V alloys after fretting fatigue. Materials science & engineering. 1999.
A269
20. C.D. Lykins, S. Mall, V. Jain, Combined experimental-numerical investigation of
fretting fatigue crack initiation. International Journal of Fatigue. 2001. 23
21. Kubiak, K., Quantification de la fissuration d'un contact soumis à des sollicitations
complexes en fretting wear et fretting fatigue. PhD manuscript. 2006
22. L.J. Fellows, D. Nowell, D.A. Hills, On the initiation of fretting fatigue cracks.
WEAR. 1997. 205
23. Y. Kondo, C. Sakae, M. Kubota, K. Yanagihara, Non-propagating crack behaviour at
giga-cycle fretting fatigue limit. Fatigue Fract Engng Mater Struct. 2004. 28
24. M. Kubota, N. Noyama, C. Sakae, Y. Kondo, Fretting fatigue in hydrogen gas.
Tribology international. 2006. 39
Published in International Journal of Fatigue Vol. 32, Issue 6, p. 1658 - 1668 (2010) , http://dx.doi.org/10.1016/j.ijfatigue.2010.03.008
25
25. M. Kubota, Y. Tanaka, K. Kuwada, Y. Kondo, Mechanism of reduction of fretting
fatigue limite in hydrogen gas environment. Proceedings of the 3rd International
Conference on Material and Processin ICM&P 2008. 2008
26. M. Kubota, Y. Tanaka, Y Kondo, Fretting fatigue strenght of SCM435H steel and
SUH660 heat-resistant steel in hydrogen gas environment. Tribotest. 2008. 14
27. Johnson, H.H., Calibrating the electrique potential method for studying slow crack
growth. Materials Research & Standards. 1965. 5
28. international, ASTM, Standard test method for measurement of fatigue crack growth
rates. ASTM E647-05. 2007
29. L. Gandossi, S.A. Summers, N.G. Taylor, R.C. Hurst, B.J. Hulm, J.D. Parker, The
potential drop method for monitoring crack growth in real components subjected to
combined fatigue and creep conditions: application of FE techniques for deriving
calibration curves. Pressure Vessels and Piping. 2001. 78
30. M. Andersson, C. Persson, S. Melin, Experimental and numerical investigation of
crack closure measurments with electrical potential drop technique. International
Journal of Fatigue. 2006. 28
31. V. Spitas, C. Spitas, P. Michelis, Real-time measurement of shear fatigue crack
propagation at high-temperature using the potential drop technique. Measurement.
2008. 41
Copyright © 2022 FDOKUMEN