
EFFECT OF OSCILLATION AMPLITUDE ON VELOCITY DISTRIBUTIONS IN AN OSCILLATORY BAFFLED COLUMN (OBC
Upload
khangminh22Category
view
3download
0
Telemark University College
Faculty of Technology Kjølnes 3914 Porsgrunn Norway Lower Degree Programmes – M.Sc. Programmes – Ph.D. Programmes TFver. 0.9
Master’s Thesis 2013
Candidate: P.D.M.Maduranga Amaratunga
Title: Optimization of gas velocity,
pressure drop and column diameter
in CO2 capture

2
Telemark University College Faculty of Technology
M.Sc. Programme
MASTER’S THESIS, COURSE CODE FMH606
Student: P. D. M. Maduranga Amaratunga
Thesis title: Optimization of gas velocity, pressure drop and column diameter in CO2 capture
Signature: . . . . . . . . . . . . . . . . . . . . . . . . . . . . . . . . .
Number of pages: 113
Keywords: Pressure drop, gas velocity, column diameter, structured packing, CFD
Supervisor: Lars Erik Øi, TUC Signature: . . . . . . . . . . . . . . . . . . . . . . . . .
2nd Supervisor: <name> Signature. . . . . . . . . . . . . . . . . . . . . . . . . .
Censor: Magne Hillestad, NTNU Signature: . . . . . . . . . . . . . . . . . . . . . . . . .
Availability: Open
Archive approval (Supervisor Signature): Signature: . . . . . . . . . . . . . . . . . . . . . . Date: . . . . . . . . . . . . . …
Abstract:
CO2 capture and storage (CCS) from fossil fuel fired power plants and also other large point sources is drawing increasing interest as a potential method for the control of greenhouse gas emissions. Among the different CCS technologies, post combustion capture of CO2 using amine based solvents is the most technically viable solution.
The absorption column is the process unit that contributes to the highest cost in post combustion CO2 capture. Therefore optimization of the design parameters related to the absorption unit is very important. It is found very few references regarding the optimum design parameters such as pressure drop, gas velocity and column diameter in literature. In this study, a parameter optimization study for an absorption unit of an amine based CO2 capture process has been performed.
The optimization has aimed to reduce the sum of estimated capital and operating costs by investigating the pressure drop through the packing, superficial gas velocity and hence the diameter of the absorber column. The structured packing, Mellapak 250Y was compared with 1” and 2” metal Pall Rings. The effective interfacial area for structured packing is varied according to some standard correlations and the packing height is dependent on effective interfacial area. With the main assumption that Mellapak 250Y and 1” Pall Rings have an effective
interfacial area in the same order of magnitude and thus, the columns equipped with these two packings have similar packing height, the Mellapak 250Y with 2.0 m/s was calculated to be the optimum. According to the main assumption that Mellapak 250Y has an effective interfacial area twice the value compared to 2” Pall Rings and thus, only half the packing height is needed. Then a gas velocity of 2.5 m/s was calculated to be the optimum with Mellapak 250Y.
An Aspen HYSYS simulation was carried out for the absorption unit to obtain data for other calculations. A CFD simulation was performed using ANSYS FLUENT 13.0 to visualize the initial gas mal-distribution of the packed columns. The k-Ɛ model was used and the packing region was modeled as a porous zone with porosity
0.95 and a viscous resistance 106 m-1. According to the results, the calculated optimum design parameters for the absorption column showed an even distribution for the gas phase and mal-distribution occurred at low gas velocities and low pressure drops.
The work indicates that an optimum gas velocity is in the order of magnitude 2.0 to 2.5m/s and the pressure drop through the structured packing is in the order of magnitude 0.02 to 0.03 bar for large scale CO2 capture with traditional structured packing. To achieve more accurate optimum design parameters pilot or full scale performance data for pressure drop, gas velocity and effective interfacial area is probably necessary.
Telemark University College accepts no responsibility for results and conclusions presented in this report.

3
Table of contents PREFACE .............................................................................................................................................................. 5
NOMENCLATURE .............................................................................................................................................. 6
OVERVIEW OF TABLES AND FIGURES....................................................................................................... 8
1 INTRODUCTION ..................................................................................................................................... 11
1.1 SCOPE AND THE OBJECTIVE OF THE THESIS .............................................................................................. 11
1.2 STRUCTURE OF THE THESIS ...................................................................................................................... 12
2 PROBLEM DESCRIPTION .................................................................................................................... 14
3 THEORY .................................................................................................................................................... 17
3.1 POST COMBUSTION CO2 CAPTURE PROCESS ............................................................................................. 17
3.2 PRESSURE DROP ....................................................................................................................................... 18
3.3 GAS VELOCITY......................................................................................................................................... 20
3.3.1 Liquid Holdup ............................................................................................................................... 21
3.3.2 Loading ......................................................................................................................................... 21
3.3.3 Flooding ........................................................................................................................................ 21
3.4 COLUMN DIAMETER ................................................................................................................................ 22
3.5 COLUMN INTERNALS: DIFFERENT TYPES OF PACKINGS ............................................................................ 24
3.5.1 Random packings .......................................................................................................................... 25
3.5.2 Structured Packing ........................................................................................................................ 25
3.6 EFFECTIVE INTERFACIAL AREA ................................................................................................................ 27
3.7 GAS MAL-DISTRIBUTION WITHIN THE PACKED BEDS ................................................................................ 29
4 LITERATURE REVIEW ON DIFFERENT DESIGN VALUES AND COST DATA ....................... 31
4.1 AVAILABLE VALUES FOR ABSORPTION COLUMN PRESSURE DROP ............................................................ 32
4.2 AVAILABLE VALUES FOR THE GAS VELOCITY .......................................................................................... 34
4.3 AVAILABLE VALUES FOR THE COLUMN DIAMETER .................................................................................. 35
4.3.1 Importance of the absorber column geometry: Circular Vs Rectangular ...................................... 37
4.4 AVAILABLE COST DATA AND COST ESTIMATES ........................................................................................ 39
4.4.1 Cost of packing ............................................................................................................................. 40
4.4.2 Other cost components regarding to post combustion CO2 capture .............................................. 41
5 EVALUATION OF CORRELATIONS FOR CALCULATION OF OPTIMUM PARAMETERS .. 43
5.1 OPTIMIZATION ANALYSIS ........................................................................................................................ 43
5.1.1 Assumptions and other specifications ........................................................................................... 44
5.1.2 Estimation of effective interfacial area.......................................................................................... 45
5.1.3 Column height variation with effective interfacial area ................................................................ 47
5.1.3.1 Effect of interfacial area to Case 1 ............................................................................................................ 47 5.1.3.2 Effect of interfacial area to Case 2 ............................................................................................................ 48
5.1.4 Pressure drop correlations for structured packing ......................................................................... 48
5.1.5 Pressure drop calculation for random packing .............................................................................. 50
5.2 ESTIMATION OF INVESTMENT, OPERATING AND TOTAL COST ................................................................... 50
5.2.1 Case 1: 1” Pall Rings and Mellapak 250Y at different gas velocities ........................................... 51

4
5.2.1.1 Total cost estimate for the structured packing .......................................................................................... 51 5.2.1.2 Total cost estimate for the random packing .............................................................................................. 52
5.2.2 Case 2: 2” Pall Rings and Mellapak 250Y at different gas velocities ........................................... 53
5.2.2.1 Total cost estimate for the structured packing .......................................................................................... 54 5.2.2.2 Total cost estimate for the random packing .............................................................................................. 54
5.3 GENERAL REMARKS ON THE OPTIMIZATION ANALYSIS ............................................................................ 56
6 SIMULATION OF A CO2 ABSORBER USING ASPEN HYSYS ........................................................ 58
6.1 GENERAL OVERVIEW OF THE SIMULATIONS ............................................................................................. 58
6.2 ASPEN HYSYS SIMULATION OF THE ABSORPTION UNIT .......................................................................... 59
6.2.1 Parameters and specifications ....................................................................................................... 60
6.2.2 Results ........................................................................................................................................... 61
7 CFD ANALYSIS OF GAS DISTRIBUTION IN PACKED BEDS ....................................................... 63
7.1 USE OF CFD TO PREDICT GAS/LIQUID MAL-DISTRIBUTION....................................................................... 63
7.2 CFD SIMULATIONS OF PACKED BEDS ....................................................................................................... 64
7.2.1 General specifications for the simulations .................................................................................... 64
7.2.2 Simulations with reduced scale dimensions .................................................................................. 65
7.2.2.1 Geometry and Mesh Generation ............................................................................................................... 65 7.2.2.2 FLUENT simulations................................................................................................................................ 67 7.2.2.3 Results ...................................................................................................................................................... 68
7.2.3 Simulations with real scale dimensions ......................................................................................... 76
7.2.3.1 Geometry and Mesh Generation ............................................................................................................... 76 7.2.3.2 FLUENT simulations................................................................................................................................ 78 7.2.3.3 Results ...................................................................................................................................................... 78
8 DISCUSSION ............................................................................................................................................. 81
8.1 ABSORBER COLUMN PRESSURE DROP ...................................................................................................... 81
8.2 OPTIMIZATION ANALYSIS BASED ON THE CORRELATIONS ........................................................................ 82
8.2.1 Optimization results ...................................................................................................................... 82
8.2.2 Contributors to the total cost ......................................................................................................... 83
8.2.3 Dependence on correlations .......................................................................................................... 83
8.3 OPTIMIZING THE COLUMN DIAMETER ...................................................................................................... 83
8.4 RESULTS FROM THE HYSYS SIMULATIONS ............................................................................................. 84
8.5 CFD ANALYSIS OF GAS DISTRIBUTION ..................................................................................................... 84
8.5.1 Pressure drop profiles .................................................................................................................... 84
8.5.2 Velocity profiles and gas distribution............................................................................................ 85
9 CONCLUSION .......................................................................................................................................... 86
9.1 RECOMMENDATIONS FOR FUTURE WORK................................................................................................ 87
REFERENCES .................................................................................................................................................... 89
APPENDICES ..................................................................................................................................................... 96
APPENDIX 1: PROJECT DESCRIPTION ................................................................................................................. 97
APPENDIX 2: CORRECTION FOR THE HEIGHT BASED ON EFFECTIVE INTERFACIAL AREA .................................... 99
APPENDIX 3: PRESSURE DROP CALCULATION SNAP SHOTS FOR RANDOM PACKING USING TIERLING
CALCULATOR .................................................................................................................................................. 103
APPENDIX 4: SCRIPT CODES FOR THE CFD SIMULATION (SIMULATIONS WITH REAL SCALE SIMULATIONS) ..... 106

5
Preface
This report is the outcome of the work carried out on my Master Thesis “Optimization of gas
velocity, pressure drop and column diameter in CO2 capture”. It contains detailed information
about the optimization of different design parameters related to the absorption unit in a CO2
capture plant according to the description is given in Appendix 1: Project description.
This project helped me to recall a lot of theoretical knowledge even from my bachelor degree
and it has been an interesting project which required me to research about many different
aspects of engineering which has increased my understanding greatly. The skills I have
acquired in this thesis will serve me well in the future. There were few people who helped me
in many different ways to successfully finish this project.
I would like to thank my supervisor, Professor Lars Erik Øi for his help and advices. I am
thankful to him for many helpful meetings and for always being available for my questions.
He guided and directed me nicely to the successful completion of this work and I really
appreciate his support.
I would also like to thank Knut Vågsæther and Chameera Jayarathna, for their valuable
supports and advices in order to succeed in CFD simulations. It is appreciable the helps I
received from the library and the IT department too.
Finally, my gratitude specially goes to my wife for being with me all the time and
encouraging me to successfully finish the thesis. She was really a big helping hand and an
encouragement for me even though she was also busy with the work of her own thesis. I do
not forget to remind my loving parents whose care for me is beyond measure – all through my
life, they have always sacrificed to ensure that I had the best opportunities possible and they
have constantly believed in me and encouraged me to dream big and to pursue those dreams. I
cannot put into words what their support has meant to me over the years and I dedicate this
thesis to them.
Porsgrunn, 03rd June, 2013
P.D.M.Maduranga Amaratunga

6
Nomenclature
Latin Symbols
a Specific area [m2/m3]
A Cross Sectional area [m2]
C Volumetric cost of packing [€/m3]
d Pipe diameter [m]
D Column diameter [m]
F Packing factor [-]
G Gas flux [lb/ft2.h]
H Height of packing [m]
h Operating hours per annum [hrs/year]
k Turbulent kinetic energy [m2/s2]
L Liquid flux [lb/ft2.h]
m Mass flow rate [tonne/day]
n Number of measurements of velocity [-]
T Operating time [years]
v Superficial velocity / average value of all point velocities [m/s]
V Volumetric flow rate [m3/hr]
W Fan effect [kWh]
Greek symbols
π pi (constant – 3.14) [-]
φ Mal-distribution factor [-]
Ɛ Porosity [-]
Ɛ Turbulant dissipation rate [m2/s3]
ν Kinematic viscosity [cst]
μ Viscosity [kg/(m.s)]
ρ Density [kg/m3]
€ EURO [-]
$ Dollar [-]
Δ Difference [-]
7
Subscripts & Superscripts
eff Effective interfacial area
el Electicity
g Gas phase
gas Gas phase
i Gas velocity measurement at the top of the bed
in Inlet
l Liquid phase
liquid Liquid phase
p Geometric area
sup Supeficial velocity
total Total area

8
Overview of tables and figures
List of Figures
Figure 2-1:Main sources of CO2 emissions .............................................................................. 14
Figure 2-2:The widely used basic model for post combustion CO2 capture ............................ 15
Figure 3-1:Post combustion CO2 capture process .................................................................... 18
Figure 3-2:Different forces contribute to the pressure drop through the packing .................... 19
Figure 3-3:Three regions of hydrodynamics in packed columns ............................................. 22
Figure 3-4:Different types of random packings ....................................................................... 26
Figure 3-5:Mellapak 250Y (a) one element (b) positioned into segments for larger diameter 27
Figure 4-1: A counter-current packed absorption column ....................................................... 31
Figure 4-2:Typical CO2 absorption column with rectangular geometry .................................. 38
Figure 4-3:Rectangular absorption column used in an experimental analysis ......................... 39
Figure 5-1:Calculated effective relative interfacial area of Mellapak 250Y as a function of
superficial liquid velocity ......................................................................................................... 46
Figure 5-2:Calculated pressure drop through Mellapak 250Y as a function of gas velocity ... 49
Figure 5-3: Calculated wet pressure drop through Mellapak 250Y as a function of gas velocity
.................................................................................................................................................. 49
Figure 5-4:Operating and investment cost variation for (a) random packing (b) structured
packing in Case 1 ..................................................................................................................... 56
Figure 5-5:Operating and investment cost variation for (a) random packing (b) structured
packing in Case 2 ..................................................................................................................... 56
Figure 6-1:The basic model of an absorption column .............................................................. 59
Figure 6-2:Aspen HYSYS model of the absorption column for CO2 removal ........................ 61
Figure 6-3:Pressure profile within the absorption column ....................................................... 62
Figure 6-4: Temperature profile within the absorption column ............................................... 62
Figure 7-1:Overall view of the mesh for the reduced scale geometry ..................................... 66
Figure 7-2:Pressure profiles within the absorption column for different sub cases ................. 69
Figure 7-3:Static pressure variation within the column ........................................................... 70
Figure 7-4:Velocity contours within the column ..................................................................... 71
Figure 7-5:Velocity vectors within the packed column for Sub case A ................................... 72
Figure 7-6:Velocity vectors within the packed column for Sub case B ................................... 73
Figure 7-7:Velocity vectors within the packed column for Sub case C ................................... 73
Figure 7-8:Velocity vectors within the packed column for Sub case D ................................... 74

9
Figure 7-9:Enlarged view of the velocity vectors at the bottom layer of the packing for Sub
case A ....................................................................................................................................... 74
Figure 7-10:Enlarged view of the velocity vectors at the bottom layer of the packing for Sub
case B ....................................................................................................................................... 75
Figure 7-11:Enlarged view of the velocity vectors at the bottom layer of the packing for Sub
case C ....................................................................................................................................... 75
Figure 7-12:Enlarged view of the velocity vectors at the bottom layer of the packing for Sub
case D ....................................................................................................................................... 76
Figure 7-13:Overall view of the mesh for the real scale geometry .......................................... 77
Figure 7-14:Static pressure variation within the absorption colum in real scal geometry ....... 78
Figure 7-15:Pressure drop through the column in real scale geometry .................................... 79
Figure 7-16:Velocity contours within the column in real scale geometry ............................... 79
Figure 7-17:Velocity vectors within the column in real scale geometry ................................. 80
Figure 7-18:Enlarged view of the velocity vectors at the bottom of the packing in real scale
geometry ................................................................................................................................... 80
List of Tables
Table 4-1:Dimensions of a CO2 absorber for different geometries ......................................... 39
Table 4-2:Volumetric cost of packing available in literature ................................................... 40
Table 4-3:Estimated cost data for absorption columns and flue gas blowers in literature....... 42
Table 5-1:Specifications used in optimization analysis ........................................................... 45
Table 5-2:Calculated effective interfacial areas for the three velocities .................................. 46
Table 5-3:Newly calculated column heights according to the effective interfacial area ......... 47
Table 5-4: Calculated pressure drops for structured packing according to gas velocity .......... 50
Table 5-5:Calculated pressure drops for random packings according to gas velocity ............. 50
Table 5-6:Results of the total cost estimate for Case 1 ............................................................ 53
Table 5-7:Results of the total cost estimate for Case 2 ............................................................ 55
Table 6-1:Parameters and specifications used in HYSYS simulations .................................... 60
Table 6-2:Results from the HYSYS simulations ..................................................................... 61
Table 7-1: GAMBIT properties for the reduced scale geometry ............................................. 66
Table 7-2:Gas phase properties in the FLUENT programe ..................................................... 67
Table 7-3:Boundary values for the four sub cases in reduced scale geometry simulations ..... 68
Table 7-4:The discritization schemes used in FLUENT simulations ...................................... 68
Table 7-5:Superficial gas velocities for the four sub cases ...................................................... 69
Table 7-6:GAMBIT properties for the real scale geometry ..................................................... 77

10
Table 8-1:Pressure drop for each packing at different velocities ............................................. 81
Table 8-2:The overall result obtained from the optimization analysis ..................................... 82
Table 8-3:Total pressure drop through the column for the FLUENT simulations ................... 84
Table 8-4:Deviation from the even distribution in FLUENT simulations ............................... 85
11
1 Introduction
Global climatic change has become a major problem to the present world. Many people and
organizations are discussing about the probable causes and the ways of finding solutions for
the problem. According to the decisions made on the Kyoto Conference 1997, many countries
in the world have agreed to reduce the emissions of greenhouse gases into the atmosphere or
at least to keep them at a lower level (Metz et al., 2005, Singh et al., 2003).
CO2 has been identified and proven as the main gaseous component which contributes for the
greenhouse gas effect to increase of the earth's surface temperature and producing long term
climate changes. (IEA, 2012) emphasizes that, if we let the CO2 emissions to take place in the
same order and would not take any actions to reduce the emissions today, the global
temperature will rise from 6 degrees by 2050. And it will probably cause a dramatic disaster
in the world in future.
Therefore, it is essential to reduce the CO2 emission from large point sources such as power
plants which use fossil fuel and some other industrial applications. Today, Carbon capture and
storage is considered as the main technique for the reduction of CO2 that is released to the
atmosphere due to several anthropogenic sources (Leifsen, 2007, Davison, 2007).
Even though the current world is much relying on Carbon capture and storage, it is
comparably an expensive technique (Leifsen, 2007, Rubin et al., 2007, Mores et al., 2012).
Within the main technique, post combustion capture is widely used and it generally occupies
a method of flue gas cleaning using a potential solvent as an end of pipe solution. Gas
cleaning using solvents can be identified as a common method in the industrial applications
(Chapel et al., 1999). Anyhow, the main concern is about the high investment and operational
cost related with it.
Minimization of equipment size and the energy consumption have been widely discussed to
reduce the cost associated with CO2 capture from process flue gas. The attention draws
mainly to the absorption column, which can be considered as the main process unit within the
CO2 post combustion capture process (Polasek et al., 1983).
1.1 Scope and the objective of the thesis
The main research task in this master thesis is to optimize the design parameters such as
pressure drop, gas velocity and column diameter, related to the CO2 absorption column
occupied in the CO2 capture process by evaluating the cost components related to the

12
absorption unit. It is important and reasonable to look for the available cost data and cost
estimates on the different aspects like packing cost, energy cost, liquid distribution
equipment, etc.
It is aimed to calculate the pressure drop, effective mass transfer area and mass transfer
efficiency as a function of liquid flow and gas flow by evaluating different correlations
available in the literature.
The influence of gas velocity and the pressure drop to the initial gas mal-distribution through
the packing is also checked using some CFD simulations. And an optimization and technical
parameter study for an absorber unit in the CO2 capture process of the flue gas coming from a
gas power plant, using HYSYS is performed.
1.2 Structure of the thesis
The general introduction for the thesis and the task is given in this chapter. But, Chapter 2
describes the main cause or the problem behind the necessity of performing this thesis work.
One of the key points to be noted here is that the presented work is only based on the
parameters related to the absorption unit of the post combustion CO2 capture process.
The most important design parameters related to the absorption column are the pressure drop,
gas velocity and the column diameter. They all are closely related to the cost of the absorption
column either in the way of CAPEX or OPEX. The basic theory about the post combustion
CO2 capture together with the above mentioned design parameters, hydrodynamic factors of
the absorption unit and also the costs related to it are described in Chapter 3.
Chapter 4 looks into the available literature where the details and data are reported about the
main optimizing parameters. In addition, the possible geometries for the absorption tower are
also discussed.
A good knowledge of design correlations is essential to provide the best possible scale-up
data and to optimize the process parameters. Hydrodynamics and mass transfer correlations
for structured packed columns have been compared and evaluated to find the optimum design
configurations in Chapter 5.
Chapter 6 presents the results of Aspen HYSYS simulation performed on the absorption
column with some design parameters available in the literature.

13
Initial gas mal-distribution is one of the drawbacks in structured packings. Chapter 7 contains
the results of CFD simulations which have been performed to visualize the effect of gas
velocity and pressure drop on gas mal-distribution.
Chapter 8 presents the discussion about the different factors that influences the optimum
design of an absorption column in a post combustion CO2 capture and the conclusion is
presented in Chapter 9.
14
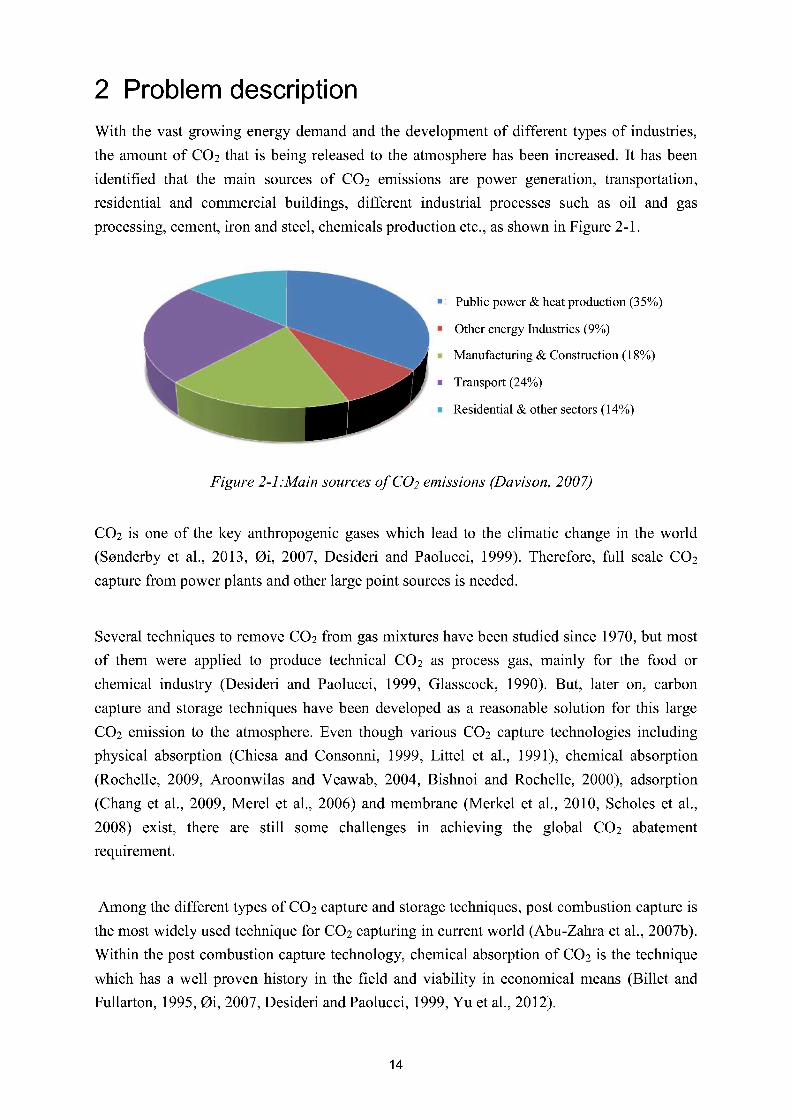
2 Problem descriptionWith the vastgrowing energydemandandthe developmentof different typesof industries,
the amountof CO2 that is beingreleasedto the atmospherehasbeenincreased.It hasbeen
identified that the main sourcesof CO2 emissionsare power generation,transportation,
residential and commercial buildings, different industrial processessuch as oil and gas
processing, cement,iron andsteel, chemicalsproductionetc.,asshownin Figure2-1.
CO2 is one of the key anthropogenicgaseswhich lead to the climatic changein the world
(Sønderbyet al., 2013, Øi, 2007, Desideri and Paolucci,1999). Therefore,full scaleCO2
capturefrom powerplantsandotherlargepoint sourcesis needed.
Severaltechniquesto removeCO2 from gasmixtureshave beenstudiedsince1970,but most
of them were applied to producetechnical CO2 as processgas, mainly for the food or
chemical industry (Desideri and Paolucci,1999, Glasscock,1990). But, later on, carbon
captureandstoragetechniqueshavebeendevelopedas a reasonablesolution for this large
CO2 emissionto the atmosphere.Even though variousCO2 capturetechnologiesincluding
physical absorption(Chiesaand Consonni,1999, Littel et al., 1991), chemicalabsorption
(Rochelle,2009, Aroonwilas and Veawab,2004, Bishnoi and Rochelle,2000), adsorption
(Changet al., 2009, Merel et al., 2006) andmembrane(Merkel et al., 2010, Scholeset al.,
2008) exist, there are still some challengesin achieving the global CO2 abatement
requirement.
Amongthedifferenttypesof CO2 captureandstoragetechniques,postcombustioncaptureis
themostwidely usedtechniquefor CO2 capturingin currentworld (Abu-Zahraet al., 2007b).
Within thepostcombustioncapturetechnology,chemicalabsorptionof CO2 is the technique
which hasa well provenhistory in the field and viability in economicalmeans(Billet and
Fullarton,1995, Øi, 2007, DesideriandPaolucci,1999, Yu etal., 2012).
Publicpower& heatproduction(35%)
OtherenergyIndustries(9%)
Manufacturing& Construction(18%)
Transport(24%)
Residential& othersectors(14%)
Figure 2-1:Main sourcesof CO2 emissions(Davison,2007)

15
On the other hand, the CO2 partial pressure in the combustion flue gas is comparatively low,
which is around 3 – 15 kPa (Yu et al., 2012, Aroonwilas et al., 2003, Abu-Zahra et al., 2007b,
Chapel et al., 1999, Singh et al., 2003). The low partial pressure of CO2 means that there is
only a small driving force available for separation, and large equipment is needed for the CO2
separation. The large volumes of flue gas combined with low partial pressures make the
installation costly and energy intensive. Thus, chemical absorption is the most likely used
technology for post-combustion capture because chemical solvents are less dependent on
partial pressure (Harun et al., 2012). The widely used basic model for the post combustion
CO2 capture is shown in Figure 2-2.
According to the literature, the absorption column in the post combustion CO2 capture process
is the process unit that contributes to a higher portion of the cost associated with post
combustion CO2 capture (Harun et al., 2012, Metz et al., 2005, Peeters et al., 2007, Klemeš et
al., 2007) in addition to the energy cost of the reboiler and the cost of the main heat exchanger
(Kallevik, 2010, Øi, 2007, Karimi et al., 2011). Hence, it is obvious that optimizing the
absorber column design is very much important in reducing the cost associated with CO2
capture (Zakeri et al., 2012, Alix and Raynal, 2009). The most important design parameters
connected with hydrodynamics of an absorption column are the pressure drop, effective
interfacial area and liquid hold up (Peeters et al., 2007, Ataki, 2006). In addition to that, the
superficial gas velocity which is strongly affect to the column diameter can also be considered
as a critical design parameter.
Therefore, it is essential to search for the low cost, new packing materials which give low
pressure drop and reduce the size of the column (Alix and Raynal, 2008, Aroonwilas et al.,
2003) in order to reduce the investment and operational costs in full scale CO2 capture plants.
Figure 2-2:The widely used basic model for post combustion CO2 capture
CO2 Absorber
Flue gas blower / fan
Amine / amine exchanger
Rich amine
Lean amine Amine cooler
Purified gas
Amine stripper
Condensor
Reboiler
Product (CO2)

16
Thus, this report mainly discusses about the absorption unit in the post combustion CO2
capture process and how the optimized design parameters will help to reduce the cost
associated with it. The main task is supported by some CFD simulations to predict the initial
gas mal-distribution in the absorption columns and also by an Aspen HYSYS simulation too.

17
3 Theory
This chapter discuss about the basic theory of some key sub topics which are much related to
this thesis task. It is expected that the reader has a prior knowledge on CO2 capture and only
relevant topics are discussed in detail here.
3.1 Post combustion CO2 capture process
Among the different techniques to capture CO2, post combustion capture seems to be the
technique which has a well proven history in the field and viability in economical means as
described above. (Sønderby et al., 2013) describe four stages of post combustion capture.
They are,
(i) Removing CO2 from the flue gas by absorbing in a packed absorption column.
(ii) CO2 rich amine is lead to the stripper to release the captured CO2 in the presence of
high heat.
(iii) CO2 is compressed and transported to a geological storage site or injected into an oil
and gas reservoir.
(iv) Regenerated lean amine is fed back to the absorber.
The main source of CO2 rich flue gas is the exhaust gas coming from fossil fuel fired power
plants. The exhaust gas has to be cooled before it reaches the capture plant in order to support
the absorption process. Direct contact cooler is used for that purpose and flue gas blower is
used to support the flue gas by giving the required power to overcome the pressure drop
through the absorption column. See Figure 3-1.
After passing through the cooler the flue gas is lead to the bottom of absorption tower, which
is filled with packing material. Inside this absorption unit, CO2 from the raw gas is absorbed
by the solvent which is flowed counter-currently from top to bottom. . The solvent is an amine
or a mixture of amines dissolved in water, which absorb the CO2 in the flue gas. In most of
the processes, mono-ethanolamine (MEA) is the widely used solvent due to its high CO2
reactivity, high limit load and low molecular weight (Desideri and Paolucci, 1999).
The dissolved CO2 gas which is now in the “rich amine” stream is pumped to a stripping
column first being heated by the heat exchanger. Desorption of CO2 takes place in the
desorption tower (stripper), which operates as a distillation column. MEA is regenerated in
the bottom of column using high temperature steam. The amine containing CO2 flows down
the packing material in the stripping tower, while steam and CO2 flow upwards. The mixture

18
of steam and CO2 at the top of the stripper is cooled, and most of the steam is condensed.
CO2 will remain in the gaseous phase.
The amine is collected in the reboiler, where the steam used in desorption process is
generated. The reboiler possesses the largest heat duty in the CO2 separation process making
flue gas blower the second. The CO2 with some water is dehydrated, compressed and then
transported to the geological storage sites (Razi et al., 2012).
3.2 Pressure drop
Generally, the pressure drop is a measure of mechanical energy loss during the transportation
of a fluid through any kind of barrier. The main course for this pressure drop is the excess
liquid accumulation at the interfaces between packing elements (Alix and Raynal, 2008). At
constant gas flow, an increase in liquid to the column will result to increase in pressure drop
until the liquid flooding is attained. At this point, any excess liquid that cannot proceed
through will remain at the top of the packing, causing the entire column to be filled with
liquid and further intensifying the pressure drop. Moreover, at constant liquid flow
Figure 3-1:Post combustion CO2 capture process (Menon and Duss, 2012)
19
downwards, increase in gas flow will lead to rise in pressure drop until flooding rate is
attained and any further increase will not permit the flow of liquid and consequently, leading
to accumulation of liquid at the top of the column and continuous increase in the pressure
drop.
(Zakeri et al., 2012) explain that the gas phase pressure drop is consisted of three major
components. Where,
(i) Gas – liquid interaction on the surface of the liquid film covering the surface.
(ii) Losses related to the abrupt direction changes of gas at the transitions.
(iii) Losses due to the interaction between gas streams at open crossings of gas flow
channels.
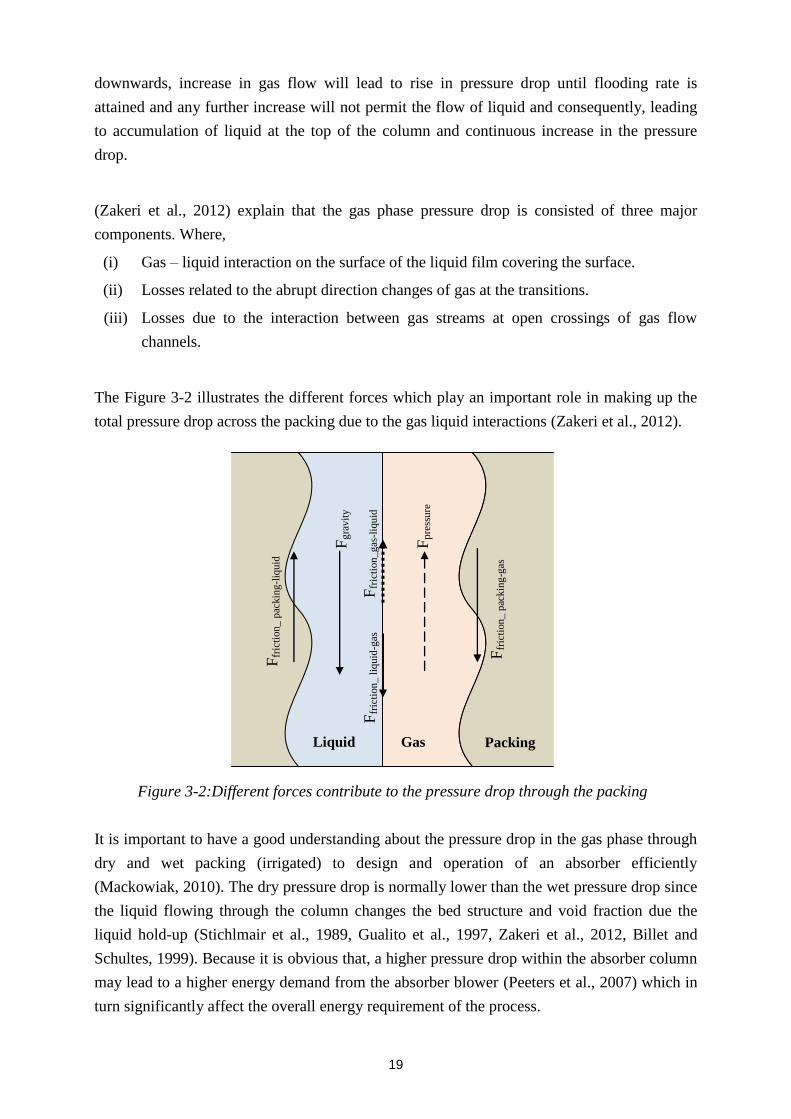
The Figure 3-2 illustrates the different forces which play an important role in making up the
total pressure drop across the packing due to the gas liquid interactions (Zakeri et al., 2012).
It is important to have a good understanding about the pressure drop in the gas phase through
dry and wet packing (irrigated) to design and operation of an absorber efficiently
(Mackowiak, 2010). The dry pressure drop is normally lower than the wet pressure drop since
the liquid flowing through the column changes the bed structure and void fraction due the
liquid hold-up (Stichlmair et al., 1989, Gualito et al., 1997, Zakeri et al., 2012, Billet and
Schultes, 1999). Because it is obvious that, a higher pressure drop within the absorber column
may lead to a higher energy demand from the absorber blower (Peeters et al., 2007) which in
turn significantly affect the overall energy requirement of the process.
Liquid Gas Packing
Fgr
avity
Fpr
essu
re
Ffr
ictio
n_ga
s-liq
uid
Ffr
ictio
n_ li
quid
-gas
Ffr
ictio
n_ p
acki
ng-l
iqui
d
Ffr
ictio
n_ p
acki
ng-g
as
Figure 3-2:Different forces contribute to the pressure drop through the packing
20
The increase in specific area of the packing will result in a lower pressure drop in the
absorber. The pressure drop in the absorber will affect the energy consumption significantly if
the pressure loss becomes high. This is mainly due to the increased duty of the flue gas
blower. According to the studies done by (Peeters et al., 2007), they have calculated 6%
reduction in the energy penalty 3% reduction in the capital costs.
The pressure drop and the separation efficiency are greatly affected by the type and the size of
the packing. Hence, it is a well-known fact that today the trend is for newly designed packing
with improved characteristics to reduce the pressure drop of the absorption column. The
developments are primarily focused on switching from random packings to structured
packings and, in the future, possibly to membrane-based packings (Herzog and Falk-
Pedersen, 2000). But, there will be some limitations with the very high volumetric costs of
membrane packings and on the other hand, the capital costs of the absorber will be reduced
due to the lowered volume.
(Alix and Raynal, 2009) state that the capture process requires very low pressure drop since it
operates downstream of the power plants. Hence, the overall pressure drop of the absorber
including inlet and the outlet of the column should be lower than 100 mbar. (Zakeri et al.,
2012) have studied the pressure drop in different structured packing types and the influence of
the liquid viscosity. With a series of experiments and simulations, they say that the pressure
drop is slightly influenced by the liquid viscosity too. But, below the loading point, pressure
drop is not sensitive to the fluid properties such as viscosity, density etc. (Alix and Raynal,
2009).
3.3 Gas velocity
The rate of exhaust gas from the process or in other terms, the gas velocity through the
absorber is a main parameter which determines the absorber size (i.e. the diameter of the
absorber) to be used. The scrubber should be designed so that the gas velocity through it will
promote good mixing between the gas and liquid phases. If liquid flow rate is specific, the gas
velocity can be increased by using smaller diameters for the absorber.
But, the pressure drop over the absorber column may be increased by increasing the gas
velocity. Even though the degree of contact between gas and liquid phases becomes stronger
with increased gas velocity, the gas flow or the gas capacity in an absorption column is
limited by pressure drop, loading or flooding. Since each mbar of pressure drop saved results
in considerable savings in operating cost (Duss and Menon, 2010), it is important to have a
good understanding about these terms.

21
3.3.1 Liquid Holdup
Generally, the hydrodynamic performance of a packed column is expressed by the pressure
drop through it and also with the liquid holdup. Liquid holdup is defined as the amount of
liquid on the surface of packing, or liquid drops in the space between of the packing segments
(Razi et al., 2012). Knowledge of liquid holdup is important to determine the column
dynamics and will affect both pressure drop and mass transfer in the column, in addition to
having direct implication on column operating weight and thus support structure design. It is
also related to the liquid residence time within the packing and will thereby affect reactions
like absorbent degradation.
3.3.2 Loading
The loading point can be defined as the point where mass transfer efficiency drops
significantly if the flow increases. The loading point is reached when liquid holdup in the
packing starts to increase with increasing gas velocity. With further increase in gas velocity
the liquid will eventually become the continuous phase and gas will bubble through the
column. This undesirable condition is referred to as flooding and causes a large pressure drop
over the column.
3.3.3 Flooding
When the inlet gas flow rate is so high that it interferes with the downward flow of the solvent
liquid, it may cause an upward flow of the liquid through the tower. This is known as flooding
(Razi et al., 2012). Flooding is undesirable because it can cause a large pressure drop across
the packed column as well as other effects that are detrimental to the performance and
stability of the absorption process. Hence, in the design of the absorption packed column,
many parameters need to be considered for efficiency to be attained and also avoid flooding
problem. Flooding corresponds to the maximum hydrodynamic capacity of the system
depending on the packing type and physical properties of the system. Most absorbers are
designed to operate at no more than 70% of the maximum gas velocity that can cause
flooding. Besides a high inlet gas flow rate, low circulation rates and small diameter towers
could also lead to flooding.
Flooding conditions in random packings depend on the method of packing (wet or dry) and
settling of packing. Flooding velocities for structured packings will generally be considerably
greater than for random packing (Treybal, 1980), i.e. structured packing is more resistant to
flooding.

22
The effect of the gas flow rate is normally taken into account through the superficial gas
velocity, or rather as a gas load factor defined as the superficial gas velocity times the square
root of the gas density. The hydrodynamics of packed columns with counter-current gas–
liquid flow can be divided into three regions as shown in Figure 3-3 (Razi et al., 2012) which
can be named as below the loading point, in the loading zone and at or above the flooding.
3.4 Column Diameter
The other important parameter in the design of absorption columns is the column diameter,
which may be calculated when the maximum superficial gas velocity is determined. This
maximum velocity is depending on type of packing and this information is available from the
vendor for most packings (Leifsen, 2007). Once the operational velocity of the gas phase is
established, the column area (and from here the diameter) is calculated as a function of the
largest volume flow of gas in the column and the specified maximum gas velocity as shown in
Equation 3-1.
supv
VA gas
3-1
The relation between the superficial gas velocity and the absorber column diameter can be
presented by rearranging the Equation 3-1.
2sup
4
D
Vv gas
3-2
Dry packing
Wet packing
Flooding
Loading
Log (superficial gas mass velocity)
Log ( ΔP/z)
Loading zone
Figure 3-3:Three regions of hydrodynamics in packed columns

23
And hence, the diameter can be written as,
sup
4
v
VD gas
3-3
(Leifsen, 2007) says that an optimum absorber column should be designed with a diameter
large enough to prevent flooding through the column. He further describes that, a too large
diameter will not favor the energy consumption very much, and other factors will be more
decisive when the column diameter is chosen.
Additionally, the diameter of packed columns is usually based on flooding correlations which
are shown below (Leifsen, 2007).
Flow capacity factor = )(2.32
1.02
glg
FG
Relative flow Capacity = 5.0
l
g
G
L
The flow capacity factor includes a packing factor (F), which is a characteristic of the packing
configuration. Acceptable packing factor values for most packings are made available by the
packing vendor or in open literature.
There are some other ways also in literature (Chapel et al., 1999) to approximate the absorber
column diameter in CO2 capture as shown in Equation 3-4.
2%CO
mKD
3-4
Here, m is the CO2 recovered rate [ daytonne / ] and 2%CO represents the volume percentage
(wet basis) of CO2 in the flue gas before cooling. The constant K has the value of 0.56 at 3%
CO2 and a value of 0.62 at 13% CO2. This equation is applicable for conventional circular
absorber vessels. For very large plants, larger vessels may be economical but, always there is
a limit to increase the diameter because the liquid load [ hmm 23 / ] is reduced and may
become insufficient to wet all the packing, thus reducing the effective contact area. Then, the
height of packing is needed to be determined by the contact area, specific effective area of the
packing and the column diameter. Furthermore, for the flue gas to be absorbed, the liquid
surface must meet the gas. The absorption column is designed for the gas to ascend in contact

24
with the solvent descending. Hence, the intensity of the liquid purification area desired
determines the height of the column.
When it comes to gas sweetening, establishing multiple feeds to the absorber unit will
significantly help to reduce the diameter of the column which in turn helps to reduce the
investment cost (Polasek et al., 1983). But yet, for very large plants, larger vessels may be
economical and the vessel may be more cost effective if constructed with a rectangular cross
section (Duss and Menon, 2010). This will be discussed in the next chapter. According to
some literature, the maximum diameter of the absorbers is more or less set, which means that
no additional reduction in power requirement can be achieved by applying larger column
diameters (Chapel et al., 1999).
3.5 Column internals: Different types of packings
Process units used as mass transfer equipment can be of different types like packed columns,
spray or tray towers.
Packed columns or towers are preferred over spray and tray towers for gas/liquid contacting
when minimizing pressure drop and maximizing mass transfer are important. Packed columns
could be packed randomly or structured. The pressure drop in packed towers is considerably
less than in tray towers and they are often less expensive. However, channeling may occur at
low flow rates.
When it comes to the plate or tray columns, it will probably not be practical for columns with
large diameters more than 15 m since large plates will need extensive mechanical support,
and horizontally flowing liquid will need long flow paths for each plate. But, when fouling is
a problem, tray towers are preferred because they can be cleaned more easily. Spray towers
are used for processing corrosive gases and liquids but typically have a poorer performance
than packed towers. According to a comparison done among the different plate types, random
and structured packings, (Gualito et al., 1997) state that structured packings show excellent
performance in vapor capacity, liquid capacity, efficiency, pressure drop and flexibility etc,
over the other types.
In this report, packed columns and the advantages of traditional structured packings over
random packing are mainly discussed. It can be said that, the packing material is the heart of a
packed column. Because, it is the surface over which the liquid and gas flow to be absorbed,
and it presents a large area for mass transfer. On the other hand, packing material is
responsible for the largest material cost of a packed column. Anyhow, selection of a specific

25
packing material for an industrial application is done depending on the nature of the
contaminants, geometric mode of contact, absorber size and also with other objectives of
absorption. Generally, the main aspects which are considered when selecting the packing
materials are cost, pressure drop, corrosion resistance, specific area, structural strength,
weight, design flexibility etc,.
3.5.1 Random packings
Random packings are simply dumped into the absorption column during installation and
allowed to fall at random. Random packing will have lower investment than structured
packing, and might be an economical alternative even though the pressure drop is higher.
Some of the common types of random packings are shown in Figure 3-4(Maćkowiak, 2009).
When we consider both operating and capital costs being important factors in implementing
carbon capture and storage on a large scale it is very important to improve the efficiency of
the CO2 absorption process while keeping the cost of the equipment to a minimum. Therefore
a randomly packed column with novel internals has the potential to achieve improved
performance with lower operating costs while minimizing capital costs. (Lehner and
Hofstetter, 2012) say that the pressure drop through random packing increases with the
thickness of the random packing.
3.5.2 Structured Packing
Structured packings are considered to be revolutionary column internals that offer an
excellent mass transfer performance while maintaining a lower pressure drop than the
classical random packings (Aroonwilas et al., 1999, Zhao et al., 2011). Owing to their
favorable performance, the structured packings have been received great attention and have
been used in several applications, mostly in distillation (Olujiæ et al., 2003, Spiegel and
Meier, 2003, Rocha et al., 1996). But, there are also many applications reported in the
literature which the structured packings are used in the CO2 absorption process.
According to (Gualito et al., 1997), two generations in structured packings could be
identified. The first kind of structured packing was Sulzer BX packing made up of metal
gauze (woven wire cloth). It has been extensively used earlier, but due to their expensiveness,
several sheet metal structured packings such as Mellapak, Glitsch, Flexipac, Intalox, Maxpak,
Montz etc.,came into play in the 1970’s and currently they are commercially accepted widely
(Fitz et al., 1999, Gualito et al., 1997). The ability to get completely wetted is one important
advantage in Sulzer packing. Because of this reason, (Bravo et al., 1985) assume the effective
interfacial area of Sulzer packing is equal the packing area of it and presents the first model
for the analysis of mass transfer in structured packings.

26
It has been observed that, apart from few number of drawbacks such as the possibility of
plugging, high economic factor, demand for an excellent initial distribution etc. (Wilson,
2004), structured packings are much advantageous due to their low pressure drop for the gas,
higher efficiency and also higher capacity (Kooijman et al., 2002, Øi, 2012, Gualito et al.,
Pall ring, metal
Pall ring, plastic
Pall ring, ceramic
VSP ring, metal
VSP ring, plastic
Ralu-Flow, plastic
Raschig ring, ceramic
Bialecki ring, metal
PSL ring, metal
I-13 ring, metal
Nor-Pak (NSW), plastic
Nor-Pak (d≠h), plastic
Hiflow saddle, plastic
Intalox saddle, plastic
Intalox saddle, ceramic
Supper saddle, plastic
Intalox saddle, metal
Interpack, metal
Hiflow ring, plastic
Hiflow ring(6) 1982, ceramic
Hiflow ring(4) 1988, ceramic
Hiflow ring, metal
Hiflow supper, plastic
Ralu-Ring, plastic
Tellerette size1, plastic
Dtnpac size 1/2, plastic
Glitsch CMR ring, plastic
Glitsch 304, CMR ring, metal
McPac ring, metal
R-Pac, ceramic
Top-Pak, metal
Hackette, plastic
Envipac size 1, plastic
Envipac size 3, plastic
Raschig Super ring, plastic
SR-Pac, ceramic
Figure 3-4:Different types of random packings (Maćkowiak, 2009)

27
1997, Leifsen, 2007, Wang et al., 2012, Arachchige and Melaaen, 2012). Because of these
benefits, nowadays most of the absorption and distillation columns are designed with
structured packings and the prevailing columns with random pakings and plates are retrofitted
with structured packings (Gualito et al., 1997).
In this current analysis, traditional structured packing called Mellapak 250Y of Sulzer
Chemtech is mainly considered. Mellapak 250Y made up of corrugated stainless steel sheets
placed side by side with opposing inclination of the ridges. 250 in the designation means the
nominal surface area in m2/m3 of the packing and Y means the corrugation angle which is 450
from the vertical (Fitz et al., 1999, Duss and Menon, 2010, Schpigel and Meier, 1994). Figure
3-5 (a) shows a Mellapak 250Y packing element for approximately 1 m diameter column
(Spiegel and Meier, 2003) and Figure 3-5 (b) shows a situation where Mellapak 250Y
packing is positioned into segments for large diameter column (Schpigel and Meier, 1994).
Generally, Pall Rings and Mellapak 250Y are considered as some standard types of packings.
More speculated packing types are available today which probably give low pressure drops
but more expensive. For an instance, the structured packing with curved element ends such as
Mellapak Plus of Sulzer Chemtech can be mentioned.
3.6 Effective interfacial area
The effective interfacial area is one of the main parameters which determine the efficiency of
a multiphase contacting process equipment such as an absorption column (Ratnam and
Varma, 1991, Alix and Raynal, 2009), as it directly relates to the mass or heat transfer rate
between the phases. Hence it is important for the design of gas–liquid contacting equipment
(Aroonwilas et al., 2003).
(a) (b)
Figure 3-5:Mellapak 250Y (a) one element (b) positioned into segments for larger diameter
28
There are several definitions of interfacial area per unit volume of packed beds (Weimer and
Schaber, 1997);
(i) The actual interfacial area between gas and liquid.
(ii) The actual interfacial area between the liquid and the solid packing, i.e. the wetted
surface area of the packing.
(iii) The active interfacial area for gas side controlled mass transfer.
(iv) The active interfacial area for liquid side controlled mass transfer.
(v) The active interfacial area for evaporation of liquid.
(vi) The active interfacial area for mass transfer in presence of a chemical reaction.
(vii) The effective interfacial area of a packing depending on the process.
According to (Wang et al., 2005, Razi et al., 2012, Weimer and Schaber, 1997), the effective
interfacial area includes not only films on the packing surface but also drops, jets and sprays
which flow through the voids of the packed bed. Among several parameters determining
interfacial area, wetted surface area is particularly important in two phase flow packed
columns, and can be taken as a reference surface area when considering experimental mass
transfer results. Actually, the wetted area can be divided into two parts: one occupied by the
liquid film flowing over the surface of the packing and the other, the stagnant liquid. In gas
absorption, the fraction of the wetted area occupied by the stagnant liquid soon becomes
saturated with gas, and as renewal of that liquid is insignificant; it does not contribute to mass
transfer.
Sometimes effective interfacial area (aeff) is higher than the specific geometric area (ap) of a
packing. It means that the effective area of the drops and jets trickling in the free volume of
the packing in this case is some greater than its specific surface area. Results of (Wang et al.,
2012) show that the effective area increases with liquid flow rate and is essentially
independent of gas flow rate.
There are three main methods for measuring the effective area (Nakov et al., 2007). They are;
The method of van Krevelen
The method of Shulman
The method using chemical reaction of a pseudo-first-order, proposed by Danckwerts
It is a well noted observation that the maximum interfacial effective area is a specific value,
which varies from packing to packing. For instance, (Aroonwilas et al., 2003) depict that the
maximum interfacial areas for Mellapak 500Y and Mellapak 500X structured packings are
260 and 225 m2/m3, respectively. And, (Weimer and Schaber, 1997) say that, the effective

29
interfacial area of stainless steel Mellapak 250Y packing is about 80 – 90% of its geometric
surface area. (Alix and Raynal, 2009) say that the effective interfacial area of random packing
is much higher than the geometric area of it and linked to the flooding percentage. According
to study done by (Nakov et al., 2007, Weimer and Schaber, 1997), they state that all metal
packings have greater effective interfacial area than all plastic ones with the same specific
area.
3.7 Gas mal-distribution within the packed beds
Among the many industrial applications such as distillation, gas absorption, catalytic reactors,
adsorber beds etc., which require gas to flow through a packed bed, initial gas ditribution is a
very important fact that has to be considered carefully. In most of the industrial distillation
and absorption columns which are filled with regular packings, there is a possibility of
occuring initial gas mal-distribution and longitudinal mixing which results in the reduced
seperation efficiency. Actually, this mal-distribution is not only associated with gas phase but
also with liquid phase too within the column. Thus, they form some deviations of the
production rate, purity or seperation from the parameters calculated for the ideal conditions of
uniform distributions.
Therefore, it is essential to identify what causes the problems in uniform distribution in both
liquid and gas phases and should take the actions. For an instance, To reduce the effect of
liquid mal-distribution on the separation efficiency in tall columns, it is recommended to
install liquid redistributors in certain intervals along the column height and also some form of
gas distributors are also used.
When the gas phase distribution within the column is considered, in most of the applications
gas becomes uniformly distributed across the column cross section when the length or the
depth of the bed is several times greater than its diameter. How ever, the preformance is
suffered from gas mal-distribution when the gas needs to move through a shallow packed bed
(Porter et al., 1993). Here, a shallow packed bed is defined as a column which contains a bed
whose bed diameter is greater than the packed height. Shallow packed beds are used
according to the requirements such as to reduce the pressure drop or due to large gas flows
which cliaim a larger diameter.
In all of these applications it is most important to ensure that the gas is uniformly distributed
across the cross section throughout the packed bed. If it is not achieved in the applications
such as distillation and absorption where the gas is in countercurrent contact with a liquid, a
variation in the ratio of gas to liquid flow can result in reduced driving forces for mass

30
transfer and a reduced separation. (Øi, 2012) states that low pressure drops within the
absorption column may lead to initial gas mal-distribution and it will result in reduced
absorption efficiency of the column.
According to (Duss and Menon, 2010), if the appropriate initial liquid and gas distribution is
assured, there will be no effects from coulmn diameter or wall effects on the packing
performance. For an example, when a structured packing such as stainless steel Mellapak is
used, the maximum packing height is not restricted by the mechanical strength of the packing.
But, the main limitation and the attention must be paid to the formation of mal-distribution.
(Duss and Menon, 2010) state that this issue can be qualitatively assessed by performing a
mal-distribution susceptibility analysis which is based on the hydraulic behaviour of the
system.
From their experimental observations, (Porter et al., 1993) suggest that, ʽʽmal-distribution
factor” can be used as an indication to have an idea of up to which extent the mal-distribution
exsists within the packed bed. The mal-distribution factor is calculated from measurements of
the velocity of the gas emerging from the top of the packed beds at several hundred different
positions. Thus, the mal-distribution factor can be expressed as shown in Equation 3-5;
21
0
2
1
ni
v
v 3-5
The mal-distribution factor is large at short packed depths for a badly distributed flow, and
reduces to a minimum value as the packed height is increased.

31
4 Literature review on different design values and
cost data
When it comes to the design of mass transfer equipment like absorption columns, the column
type (e.g., structured or random packing, valve or sieve trays) and the size of the mass transfer
region (i.e., height of packing, number of trays) are important design variables. In addition to
that, the optimal design is not immediately apparent and involves a trade-off between cost,
availability, and performance. Therefore, the parameters such as pressure drop through the
column, gas velocity and also the column diameter can play important roles in optimization of
an absorption column which is in commercial use.
As it was mentioned in the introduction also, this thesis is mainly discussing about the
absorption column which is used in the post combustion capture. Out of the different
absorption column configurations, a packed column where the two streams (gas and liquid)
flow in a counter current manner is considered. Figure 4-1 shows a counter current flow of a
packed tower.
Figure 4-1: A counter-current packed absorption column (Billet and Fullarton, 1995)

32
It is obvious that, there are some pilot scale as well as commercial scale post combustion CO2
capture plants available currently. But, the technical and the economic data about those
operating plants are not published to the public access. Even the data available in the open
literature are very limited. Therefore, this chapter aims to present a literature review on
different design parameters mainly on pressure drop, gas velocity and column diameter values
which are available in the open literature, and also about some cost data regarding to post
combustion CO2 capture.
4.1 Available values for absorption column pressure
drop
The usual way of defining the pressure drop within the absorption column is that, the
absorption pressure is set to atmospheric pressure at the outlet and atmospheric pressure plus
pressure drop at the inlet. The low pressure drops in the absorption columns will lead to low
energy consumption by flue gas blower / fan and hence the lower cost of the fan.
When the partial pressure of CO2 is increased, the absorption rate in the absorber is also
increased. That gives an idea that, an increase in feed pressure should increase the mass
transfer rate in the absorber. But, there is a penalty in the form of blower power associated
with this. Therefore, these two competing factors must be taken into account in determining
the optimum pressure for the absorber.
In literature, some researchers have reported the pressure drop of the column directly and
some have reported it as the inlet flue gas pressure to the absorber column. The following
values for the absorber pressure drop are available in the literature.
(Desideri and Paolucci, 1999) have used a pressure drop of 0.2 bar (20 kPa) for the
simulations to validate their CO2 removal model and compared with the data available
in the literature for case studies and pilot plant experimental results.
(Rao and Rubin, 2006, Rao et al., 2004) have used a value of 0.14 bar (14 kPa) for the
pressure drop in the absorber column in their simulations as the Amine System
Performance Model parameters.
(Wiggins and Bixler, 1983) have stated about a pressure loss of the absorber as 0.138
bar (13.8 kPa) of the plant at Lubbock, Texas.
(Øi, 2012) states that he has used 1.1 bar as the inlet gas pressure in their simulations
and the typical values found in the literature for pressure drop in absorbers are 0.1 to
0.2 bar.
33
(Abu-Zahra et al., 2007b) have mentioned that the flue gas from a 600 MW coal fired
power plant which they considered for their simulations, has a inlet pressure of 1.016
bar (101.6 kPa).
According to (Dave et al., 2009), they have used a value of 1.05 bar (105 kPa) inlet
gas pressure for their simulations.
A CO2 recovery plant for a 500 MW LNG power plant is conceptually studied by
(Yagi et al., 1992) and the inlet gas pressure was atmospheric.
(Bozzuto et al., 2001) state that the absorber inlet pressure is 0.12 bar (12 kPa) in their
study.
An absorber inlet gas pressure of 1.1 bar has been used by (Greer, 2008) for his study.
(Yu et al., 2012) state that the operation pressure of the absorption unit in post
combustion CO2 capture in the order of magnitude of 1 bar.
According to the study done on capital costs and energy considerations of different
alternative stripper configurations for post combustion CO2 capture by (Karimi et al.,
2011), 1.1 bar has used as the absorber inlet gas pressure.
(Øi, 2007) has used an absorber pressure drop of 0.1 bar for his Aspen HYSYS
simulations.
In the study done by (Leifsen, 2007), the total pressure drop for the absorber was 0.05
bar in the base case.
In a parametric study of the technical performance of CO2 capture plants based on
mono-ethanolamine, the absorber has been simulated at 1.1 bar (110 kPa) with a
pressure drop of 0.048 bar (4.8 kPa) (Abu-Zahra et al., 2007b).
(Øi and Vozniuk, 2010) have used 1.11 bar as the absorber inlet gas pressure for the
base case in their simulation study.
(Freguia and Rochelle, 2003) have reported the typical value for the absorber inlet
pressure as 1 atm.
An upper bound pressure drop of 0.1225 bar (12.25 kPa) for ten stages is considered
by (Mores et al., 2012) as the maximum allowable value reported in literature. And,
1.013 bar (101.3 kPa) has been used for the absorber inlet gas pressure.
(Ziaii et al., 2011) have used 1 bar as the operating pressure for their simulations.
(Chakma et al., 1995) have examined the effect of absorber pressure on the cost of
CO2 removal by varying the absorber pressure from 1.15 to 2 atm and reported that
there is no cost benefit in operating the absorber column at higher pressure.
An inlet absorber gas pressure of 1.113 bar and an outlet gas pressure of 1.023 bar
(which means a pressure drop of 0.09 bar) have been used by (Schach et al., 2010) for
their simulations.

34
(Singh et al., 2003, Hassan, 2005, Hassan et al., 2007) have used a value of 1.2 bar for
the absorber pressure in their simulations.
(Razi et al., 2012) have reported that the inlet flue gas pressure for the absorber unit is
1.016 bar (101.6 kPa) for both coal fired and natural gas fired power plants.
An operating pressure of 1.013 bar (101.3 kPa) for the absorber has been used by
(Alie, 2004) for his simulation study.
An inlet flue gas pressure of 1.1 bar for the absorber from both coal fired and gas fired
power plants, has been used by (Chapel et al., 1999) for the simulations.
(Kallevik, 2010) has used the absorber inlet gas pressure as 1.21 bar (121 kPa) and the
outlet gas pressure as 1.06 bar (106 kPa) in his simulation study. Therefore, he has
used defined a pressure drop of 0.15 bar through the absorber column.
(Peeters et al., 2007) have assumed a short term pressure drop of 0.048 bar in the
absorber unit.
Therefore, it can be easy to get an idea that the optimum pressure drop for an absorber unit in
a post combustion CO2 capture process is around 0.1 bar according to the literature.
4.2 Available Values for the gas velocity
As it described in the section 3.3, superficial gas velocity is a very important parameter which
has to be optimized in order to achieve an economical post combustion CO2 capture process.
It is true that the degree of contact between gas and liquid phases becomes stronger with
increased gas velocity. But, the gas velocity within the absorption column is limited by
pressure drop of the column i.e., the pressure drop over the absorber column is increased by
increasing the gas velocity.
Reduction of gas velocity helps to reduce the pressure drop. Reduction in 1 mbar of pressure
drop results in considerable savings in operating cost. Therefore, it is very important to have a
good understanding about the optimum values for the gas velocity. Because, there should be a
balance between minimizing the pressure drop by decreasing the velocity and increased
process throughput and smaller tower diameter by increasing the velocity (Greer, 2008). The
usual practice in the industry is that the lower and upper bounds for the superficial gas
velocity are also set in such a way to avoid flooding problem and a bad gas–liquid
distribution. Actually, (Brunazzi et al., 2002) illustrate that computing the absorption column
diameter by selecting the gas velocity in the column as the gas velocity at the loading point
might be inadequate.

35
The reported values for the gas velocity used in the absorption of CO2 processes in open
literature are very low. This sub chapter tries to present some of the gas velocity values which
are reported in literature.
(Duss and Menon, 2010, Menon and Duss, 2012) from Sulzer Chemtech AG, have
used a superficial gas velocity of 2.1 m/s for their study.
(Vozniuk, 2010, Øi and Vozniuk, 2010) have used a value of 3 m/s for the gas phase
superficial velocity through the absorption column in their simulation study.
(Menon and Duss, 2011) has used 1.6 m/s as the gas superficial velocity in their
OPEX analysis.
According to the study done by (Leifsen, 2007) for the Mellapak 2X, a maximum
velocity of 3 m/s is recommended. Furthermore, he states that the maximum
acceptable superficial gas velocity is a quality of the packing in terms of at which
flooding can occur.
(Mores et al., 2012) state that the optimum values for the gas velocity range from 70 to
80% of the flooding velocity of the system according to literature.
According to (Billet and Fullarton, 1995), the gas flow within the packed absorption
column is typically between 1 to 4 m/s.
(Kallevik, 2010) has used a value of 3.6 m/s for the vertical gas flow velocity in his
simulation study.
(Hussain et al., 2012) have managed the value of column diameter in their simulations
in order the gas velocity to be higher than 1.5 m/s.
According to a study done by Kansai Electric Power Cooperation (KEPCO) Inc. and
Mitsubishi Heavy Industries (MHI) Ltd, a gas superficial velocity in the range of 1.92
to 3.29 m/s has been found to be optimum for the special type of packing called KP-1
(Mimura et al., 2002).
Some values for gas superficial velocity within the absorption columns range from
0.75 to 3 m/s have been reported in the review study done by (Razi et al., 2012). Most
of them belong to experimental analyses.
According to the above reported values found from literature, gas superficial velocities range
from 2.0 to 3.0 m/s seem to be the optimum range.
4.3 Available values for the column diameter
In the design of an absorption column, the amount of gas to be purified and the extent of
purification which affects the height of the column are two basic factors which determine the

36
size of an absorption column. Generally, the first problem to solve is to identify the column
dimensions that allow the minimum total cost to be obtained.
The absorbers to handle high gas flow rates have to be designed accordingly. That means, due
to the mechanism of mass transfer with chemical reaction, it is not favorable to design such
absorbers at its hydraulic limit (Duss and Menon, 2010). Therefore, most absorption columns
are designed with an increased diameter, which in turn help to reduce the packing height and
hence the pressure drop associated with it. When it comes to the packed columns, it is
assumed that absorber diameter should be ten times greater than the nominal diameter of
packing (Seider et al., 2009).
And also, a change in absorber size will directly affect the energy requirements and capital
costs of the flue gas blower, which is responsible for about 10% of both the energy penalty
and the overall absorption plant costs. It is very important to conserve the absorption rate
when the other parameters such as chemical binding energy of the solvent, are changed
(Peeters et al., 2007).
Similar to that of gas velocity, absorption column diameter values are also very rare to find in
the open literature. Some of the few reported values in the literature are mentioned below.
(Menon and Duss, 2012) from Sulzer Chemtech AG, has reported an internal
absorption column diameter of 23 m for a CO2 capture plant, where the flue gas comes
from a typical 800 MW coal-fired power plant.
A value of 17 m for the absorption column diameter has been used in a simulation
study done by (Leifsen, 2007).
(Rao et al., 2004) have used some values of column diameters for their simulations
range from 7.92 to 12.8 m.
12.8 m has been reported as the maximum column diameter by (Mores et al., 2012,
Chapel et al., 1999) according to literature.
A column diameter of 15.2 m has been used by (Kallevik, 2010) for the simulation
analysis.
(Vozniuk, 2010) has used a value of 17.3 m for a simulation study in the base case
without split stream configuration.
In the conceptual study done by (Yagi et al., 1992) for a CO2 recovery process of a
500 MW LNG power plant, 8 m diameter absorption column is considered with a 47
m packing height.
(Greer, 2008) has used 16 m as the absorption column diameter in their simulation
studies.

37
(Duss and Menon, 2010) from Sulzer Chemtech AG states that, if a single train is
used, a 16 m diameter absorption column can handle a flue gas flow rate of 1.5x10⁶
m3/h.
(Mores et al., 2012) have used an optimum absorption column diameter of 12.2 m in
their simulation study done on different CO2 removal targets.
(Singh et al., 2003) have used four trains of absorbers in their study, where the
columns are about 10 m in diameter in order to eliminate the structural uncertainties.
Because, a single train has resulted in a calculated column diameter of about 19 m.
(Simmonds et al., 2002) have reported that their design called for four absorbers of
10.3 m in diameter.
4.3.1 Importance of the absorber column geometry: Circular
Vs Rectangular
One of the highly discussing topics with regarding to the absorption column diameter
optimization is the geometry of the absorber. Because, in order to reduce the packing volume
and the pressure drop, the circular absorption columns are designed with an increased column
diameter. But, then a question arises whether the design is structurally acceptable or not. To
overcome this issue, some of the companies tend to design the commercial scale absorption
columns with a rectangular geometry.
CO2 capture has a high priority on the agenda of the Norwegian government today. A
collaboration between the government, Gassnova and several major industrial companies with
Aker Kvaerner as one of the leading members has resulted in the project called “Just Catch”
with objective of reducing the operating costs and improving the efficiency of CO2 capture
plants. The aim is to offer a competitive technology for the Norwegian market as well as the
international market. The topic of rectangular shaped absorption column is a highly discussed
topic within the “Just Catch” (de Koeijer et al., 2011).
(Duss and Menon, 2010)) from Sulzer Chemtech say that, the absorption columns used in
CO2 capture process can be built with either circular or in rectangular shape. But, it is up to
the Process Licensor or the Engineering Contractor to analyze the advantages and
disadvantages of the chosen geometry.
Because, in all most all the cases we target to achieve a cost optimized design for the
absorption column being one of the most expensive equipments of the capture process. In that
sense, the materials of construction, choice of beam support options, wind loads, required
throughput per unit etc., for a particular geometry might lead us to a different result than what
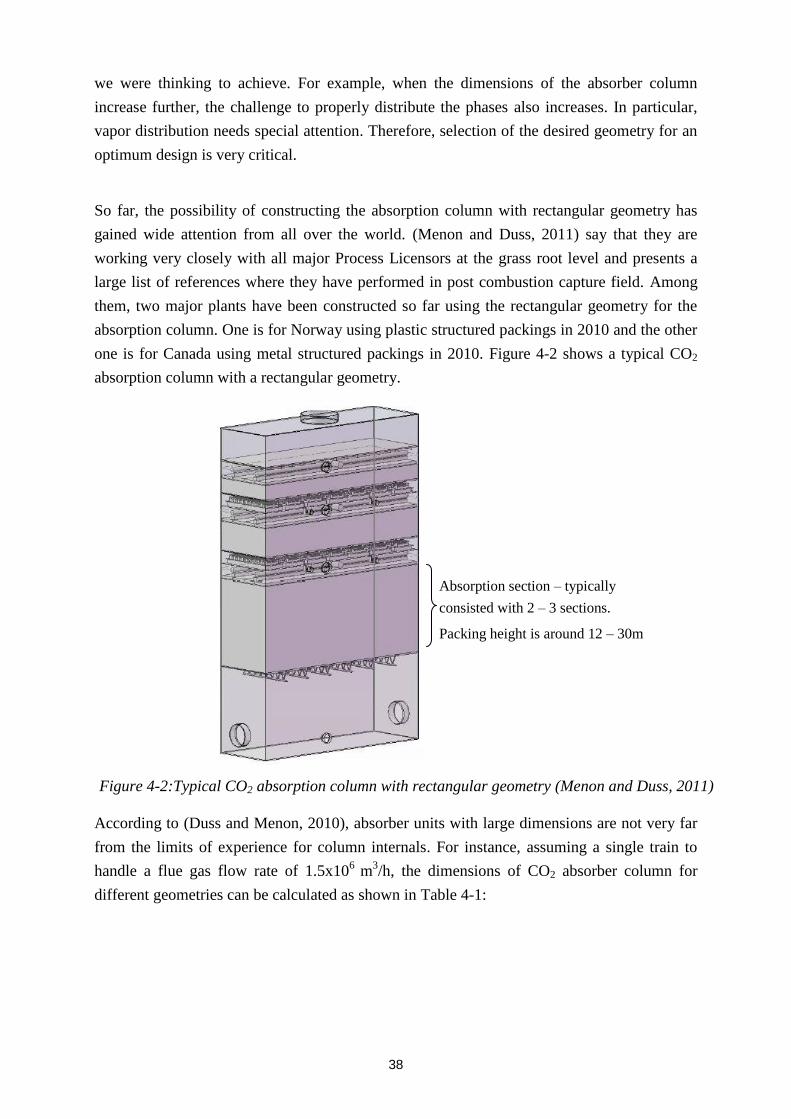
38
we were thinking to achieve. For example, when the dimensions of the absorber column
increase further, the challenge to properly distribute the phases also increases. In particular,
vapor distribution needs special attention. Therefore, selection of the desired geometry for an
optimum design is very critical.
So far, the possibility of constructing the absorption column with rectangular geometry has
gained wide attention from all over the world. (Menon and Duss, 2011) say that they are
working very closely with all major Process Licensors at the grass root level and presents a
large list of references where they have performed in post combustion capture field. Among
them, two major plants have been constructed so far using the rectangular geometry for the
absorption column. One is for Norway using plastic structured packings in 2010 and the other
one is for Canada using metal structured packings in 2010. Figure 4-2 shows a typical CO2
absorption column with a rectangular geometry.
According to (Duss and Menon, 2010), absorber units with large dimensions are not very far
from the limits of experience for column internals. For instance, assuming a single train to
handle a flue gas flow rate of 1.5x10⁶ m3/h, the dimensions of CO2 absorber column for
different geometries can be calculated as shown in Table 4-1:
Absorption section – typically
consisted with 2 – 3 sections.
Packing height is around 12 – 30m
Figure 4-2:Typical CO2 absorption column with rectangular geometry (Menon and Duss, 2011)

39
Table 4-1:Dimensions of a CO2 absorber for different geometries
Geometry Dimensions
Circular 16 m (Diameter)
Square 14 m x 14 m (Length)
Rectangular 20 m x 10 m (Length x Width)
(de Koeijer et al., 2011) state that, the absorber design in Mongstad Technology Centre has a
rectangular outer wall with the internal dimensions of 3.5 x 2 x 62 m which is made up of
concrete with internal polymer lining. According to a study done by (Kamijo et al., 2004),
they conclude that large scale CO2 absorbers for capacity of 5000 - 10000 Metric ton/day can
be realized with the use of rectangular geometries for the absorbers. Figure 4-3 shows the 1
m2 rectangular shaped absorber column used for their experimental analysis.
4.4 Available cost data and cost estimates
In most of the cases, the goals of high CO2 emission reduction efficiencies are however,
penalized by the very high capital and operational costs of the removal plant. Largest
influence on costs must be attributed to the absorber and stripping columns, which have a
large size and require considerable construction and installation work.
According to (Mariz, 1998) the most promising areas for achieving operating cost savings
within post combustion CO2 capture are;
Figure 4-3:Rectangular absorption column used in an experimental analysis
(Kamijo et al., 2004)

40
Reduction of the absorber packing pressure drop
Reduction of steam consumption
Integration of power generation with the stripper reboiler
And the most promising areas for capital cost savings are;
Absorber vessel size
Absorber and flue gas cooling vessel materials
Economics in scale up procedures
Improved oxidation inhibitors
Since each mbar of pressure drop which can be saved, results in considerable savings in
operating cost (Duss and Menon, 2010), it is very important to look into details about which
cost components are the main contributors for a high total cost, particularly with regarding to
the absorption unit.
4.4.1 Cost of packing
This sub chapter presents some cost data for different types of packing available in the open
literature. Similar to the other parameters like gas velocity and column diameter, packing cost
data are also very limited. Table 4-2 lists some volumetric costs of packing for both random
and structured packings. The year for the currency index can be found from the year of the
reference.
Table 4-2:Volumetric cost of packing available in literature
Packing Type Material Volumetric cost Reference
Structured packing AISI 316 2375.70 [€/m3] (Brunazzi et al., 2002)
Structured packing Polypropylene 3356.97 [€/m3]
Raschig Ring 2” AISI 316 1291.14 [€/m3]
Raschig Ring 2” Polypropylene 206.58 [€/m3]
Pall Rings 0.5” Stainless Steel 130 [$/m3] (Loh et al., 2002)
Pall Rings 1” Stainless Steel 118 [$/m3]
Pall Rings 1.5” Stainless Steel 92 [$/m3]
Pall Rings 2” Stainless Steel 76 [$/m3]
Pall Rings 0.5” Polypropylene 33 [$/m3]
Pall Rings 1” Polypropylene 29 [$/m3]
Pall Rings 1.5” Polypropylene 21 [$/m3]
Pall Rings 2” Polypropylene 8 [$/m3]

41
It is an obvious fact that, the cost of the structured packing is higher than the random packing
(Sønderby et al., 2013, Wilson, 2004) but, in most of the cases, structured packings can save
energy and reduce the investment and operational costs significantly by offering low pressure
drops through the packing (Brunazzi et al., 2002). As packing height increases, total surface
area and residence time increases, enhancing absorption. However, more packing necessitates
a larger absorption system, which increases capital cost.
4.4.2 Other cost components regarding to post combustion
CO2 capture
According to (Klemeš et al., 2007) the absorption unit and the compressors are the
equipments with largest impact to the cost in CO2 capture, but the contribution percentage of
each equipment is slightly influenced by the CO2 removal target. That is confirmed by the
study done by (Mores et al., 2012), where the cost component related to the absorption
column which contributes to the total plant cost of CO2 capture is increasing when the target
or the percent CO2 reduction is increased.
Some cost data and estimated cost values for the absorption columns and flue gas blowers are
presented in Table 4-3. It is true that these cost values are depended on the size and also the
capacity of those equipments. But, they are listed in the same manner as they were reported in
the literature and also the year for the currency index can be found from the year of the
reference.
Mellapak 250Y Metal 5940 [€/m3] (Øi and Vozniuk, 2010)
Raschig Ring 2” N/A 1740 [€/m3] (Peeters et al., 2007)
Structured packing N/A 3637 [€/m3]
Raschig Ring 1” Ceramic 510 [$/m3] (Mulet et al., 1981)
Raschig Ring 1” Metal 840 [$/m3]
Raschig Ring 2” Ceramic 360 [$/m3]
Raschig Ring 2” Metal 600 [$/m3]
Intalox Saddles 1” N/A 510 [$/m3]
Intalox Saddles 1” N/A 360 [$/m3]
Pall Rings 1” Metal 840 [$/m3]
Pall Rings 2” Metal 600 [$/m3]

42
Table 4-3:Estimated cost data for absorption columns and flue gas blowers in literature
Item Cost Reference
Absorber (for Base case) 4.81 [Million $] (Karimi et al., 2011)
Blower pump (for Base case) 0.42 [Million $]
Absorber 10.94 [Million €] (Abu-Zahra et al., 2007a)
Gas Blower 3.10 [Million €]
Absorption columns (4 Nos) 29.53 [Million $] (Singh et al., 2003)
Flue gas blower + motor 0.988 [Million €] (Øi and Vozniuk, 2010)
Absorber column 1227 [€/m2] (Peeters et al., 2007)
Absorber column 4.557 [Million $] (Mores et al., 2012)
Gas blower 1.709 [Million $]
Absorber column 16.32 [Million $] (Fisher et al., 2005)
Gas blower 2.04 [Million $]
From the above mentioned cost data and estimations reported in literature, it is obvious that
the right choice of mass transfer equipment is of great importance. The attention must be paid
that, the volumetric cost of structured packing is higher than the random packing. But,
considering about the long term operation structured packing offers an excellent solution
because it reduces the column dimensions (capital expenses, CAPEX) and provides low
pressure drop (operational expenses, OPEX) over the CO2 absorber.

43
5 Evaluation of correlations for calculation of
optimum parameters
In all aspects of industrial activity, one must continuously try to improve the performance and
it is common to aim at a target for ultimate or “best” operating point. Hence, in all most all
the engineering applications, optimization problems can be reduced to a minimization of cost
or maximization of profit.
It is true that, a good knowledge of design correlations is essential to provide the best possible
scale up data. It will help to know and remove technical risks related to the design and
operation of a full scale CO2 capture plant. In this analysis, hydrodynamics and mass transfer
correlations for structured packed columns have been compared to take into account of the
impact of operating conditions and hydraulics of a packed column in a large scale CO2
capture plant. Normally, an average sized power station releases large volumes of flue gas to
the atmosphere. Since coal based and gas based power stations are main emitters of CO2, the
analysis below is restricted to the flue gas released from such a conventional combined cycle
natural gas based power station.
Hence, this chapter presents an overview and evaluation of different correlations available in
the current literature to estimate the important design parameters regarding to the absorption
column. The economic analysis of the packed absorption column, discussed in this chapter
will take into account both the investment costs and the operating costs.
5.1 Optimization analysis
In this optimization analysis, it is aimed to find out the most economical type of packing and
the optimum design parameters for the absorption column based on some assumptions. And
specially, the absorber is considered as a circular tower with usual column internals.
The analysis will be limited to two widely used traditional packing types. They are Mellapack
250Y to represent structured packing and 1”and 2” metallic Pall Rings to represent random
packing. The same approach can be easily extended to all other packings available in the
market. For the convenience of referring, results are presented as two different cases as
follows;
Case 1: Comparison between 1” Pall rings and Mellapak 250Y
Case 2: Comparison between 2” Pall rings and Mellapak 250Y

44
5.1.1 Assumptions and other specifications
In the following analysis the estimation of operating costs have been limited to the following
items:
Power necessary to move the gas phase has been computed using the pressure drop in
the packing.
An energy cost of 0.05 €/kWh and an efficiency of 0.75 have been assumed.
The investment or the capital costs have been computed by taking into account the following
items.
Cost of the packing has been evaluated by multiplying the volume of the packing for
the volumetric packing cost (See Equation 5-2).
CHACpacking 5-1
Assuming the absorption column to be cylindrical,
CHD
C packing
4
2 5-2
In addition to that,
The volume flow rate of gas ( gasV ) is considered to be constant.
The volume flow rate of liquid ( liquidV ) is considered to be constant.
Total area of the column ( totalA ) is constant.
The superficial gas velocity and liquid velocity are directly proportional.
Effective interfacial area is a function of liquid velocity and also gas velocity.
Packing height is dependent on effective interfacial area of the packing used.
In every calculation, three main superficial gas velocity values were considered and the
variation of the other design parameters was analyzed according to that. Gas superficial
velocity of 2.5 m/s was considered as the base case and the other two values were 2.0 m/s and
3.0 m/s. The other specifications are presented in the Table 5-1.

45
Table 5-1:Specifications used in optimization analysis
Specification Value Reference / remarks
Gas volume flow rate, gasV [ hm /3 ] 610547.2 (Vozniuk, 2010)
Gas density, g [ 3/ mkg ] 1.02 (Øi, 2012)
Liquid density, l [ 3/ mkg ] 1050 (Øi, 2012)
Liquid viscosity, l [ )/( smkg ] 0.0023 (Øi, 2012)
Liquid superficial velocity, lv [ sm / ] 0.0041 (Øi, 2012), for the base case
Height of the column, H [ m ] 10 Assumed, for the base case
Operating time, T [ years ] 10 Assumed
Operating hours, th [ yearhours / ] 8000 Assumed
Cost of structured packing, C [€ 3/ m ] 5940 (Øi and Vozniuk, 2010)
Electricity cost, elC [ € kWh/ ] 0.05 (Øi and Vozniuk, 2010)
Efficiency of the absorber fan, [-] 0.75 Assumed
5.1.2 Estimation of effective interfacial area
As it was mentioned in sub chapter 3.6, the effective interfacial area is one of the main
parameters which determine the efficiency of an absorption column. It directly relates to the
mass transfer rate between the phases. Therefore, it is very important for the design of
absorption columns.
It was mentioned already, that the effective interfacial area is mainly depend on the liquid
superficial velocity within the absorption column. In other words, it can be said that the
effective interfacial area ( effa ) is a function of the superficial liquid velocity ( lv ). Many
researchers have done several reviews about different correlations to emphasize the
relationship between the effective interfacial area and the superficial liquid velocity.
For an instance, (Øi, 2012) has used three different correlations from literature to estimate the
effective interfacial area of Mellapak 250Y stainless steel structured packing from Sulzer
Chemtech as a function of the superficial liquid velocity. Figure 5-1 shows the calculated
effective relative interfacial area as a function of superficial liquid velocity using three
correlations of (Billet and Schultes, 1999, de Brito et al., 1992, Rocha et al., 1996).

46
For the current analysis, the “deBrito et al. (1992)” correlation for the effective interfacial
area has been used which is presented in Figure 5-1. The use of the deBrito correlation shown
in this figure is illustrated in the calculation of Appendix 2: Correction for the height based on
effective interfacial area and the newly calculated effective interfacial areas according to the
new superficial liquid velocities are tabulated in Table 5-2.
Table 5-2:Calculated effective interfacial areas for the three velocities
Superficial gas
velocity [ sm / ]
Superficial liquid
velocity [ sm / ]
Effective interfacial
area [ 32 / mm ]
2.0 0.00328 0.78
2.5 (Base case) 0.00410 0.86
3.0 0.00492 0.94
Figure 5-1:Calculated effective relative interfacial area of Mellapak 250Y as a function of
superficial liquid velocity
de Brito et al. (1992)
Billet and Schultes (1999)
Rocha et al. (1996)

47
5.1.3 Column height variation with effective interfacial area
It is a well noted observation that the maximum interfacial effective area is a specific value,
which varies from packing to packing. This sub chapter describes how the different effective
interfacial areas of different packings will affect the column height.
5.1.3.1 Effect of interfacial area to Case 1
In Case 1, 1” metal Pall Rings and stainless steel Mellapak 250Y are compared. It is
necessary to look into the effective interfacial areas of those two types of packings reported in
literature.
According to literature, the specific geometric surface area (ap) of Mellapak 250Y is 250
m2/m3 (Billet and Schultes, 1999, Arachchige and Melaaen, 2012, Razi et al., 2012, Øi, 2012)
and the effective interfacial area (aeff) of that packing is around 80 – 90% of its geometric
surface area (Weimer and Schaber, 1997). For 1” Pall Rings, the specific geometric surface
area (ap) is around 210 – 225 m2/m3 (Billet and Schultes, 1999, Arachchige and Melaaen,
2012, Aroonwilas et al., 1999, Wilson, 2004, Wang et al., 2012, Maćkowiak, 2009, Stichlmair
et al., 1989) and the effective interfacial area (aeff) of that packing is around 100 – 110% of its
geometric surface area (Sahay and Sharma, 1973, Menon and Duss, 2011).
It seems that, the effective interfacial areas for both 1” Pall Rings and Mellapak 250Y lay in a
close range and they both work in a similar efficiency. But, when we consider the different
superficial gas velocities, that will more or less affect the mass transfer rate and the efficiency
of the column and furthermore, it will demand some height changes. Hence, a correction for
the packing heights at different superficial gas velocities was done based on the different
effective interfacial areas. See Appendix 2: Correction for the height based on effective
interfacial area. The newly calculated column heights are tabulated in Table 5-3.
Table 5-3:Newly calculated column heights according to the effective interfacial area
Superficial gas velocity [ sm / ] Column height [ m ]
2.0 8.82 (calculated)
2.5 (Base case) 10.0 (assumed initially)
3.0 10.97 (calculated)

48
5.1.3.2 Effect of interfacial area to Case 2
In Case 2, 2” metal Pall Rings and stainless steel Mellapak 250Y are compared. According to
literature, the specific geometric surface area (ap) and the effective interfacial area (aeff) of
Mellapak 250Y are as mentioned above. But, for 2” Pall rings, the specific geometric surface
area (ap) is around 110 – 115 m2/m3 (Billet and Schultes, 1999, Aroonwilas et al., 1999,
Wilson, 2004) and the effective interfacial area (aeff) of that packing is around 90 – 100% of
its geometric surface area (Weimer and Schaber, 1997, Menon and Duss, 2011).
Therefore, a clear conclusion can be made by looking at the above mentioned values. That is
the effective interfacial area of Mellapak 250Y is twice that value of 2” metal Pall Rings. That
means, it indirectly reveals that the mass efficiency of the structured packing column is twice
of randomly packed column. Hence, the height of the absorption column was assumed for the
two types of packings as follows:
H (When Mellapak 250Y is used) = 10 m
H (When 2” Pall Rings is used) = 20 m
5.1.4 Pressure drop correlations for structured packing
It was mentioned in the early chapters also that, the pressure drop is mainly depend on the
superficial gas velocity within the absorption column. In other words, it can be said that the
column pressure drop is a function of the superficial gas velocity ( supv ). Many researchers
have done several reviews about different correlations to emphasize the relationship between
the column pressure drop and the superficila gas velocity.
For an instance, (Øi, 2012) has used three different correlations from literature to estimate the
dry pressure drop through Mellapak 250Y stainless steel structured packing from Sulzer
Chemtech for the flue gas coming from a gas based power plant. Figure 5-2 shows the
calculated pressure drops as a function of gas velicity using the three correlations of (Rocha et
al., 1993, Billet and Schultes, 1999, Stichlmair et al., 1989).
As another example, (Razi et al., 2012) have used ten different correlations from literature to
estimate the wet pressure drop through Mellapak 250Y stainless steel structured packing for
the flue gas coming from a gas based power plant. Figure 5-3 shows the calculated wet
pressure drops as a function of gas velicity.
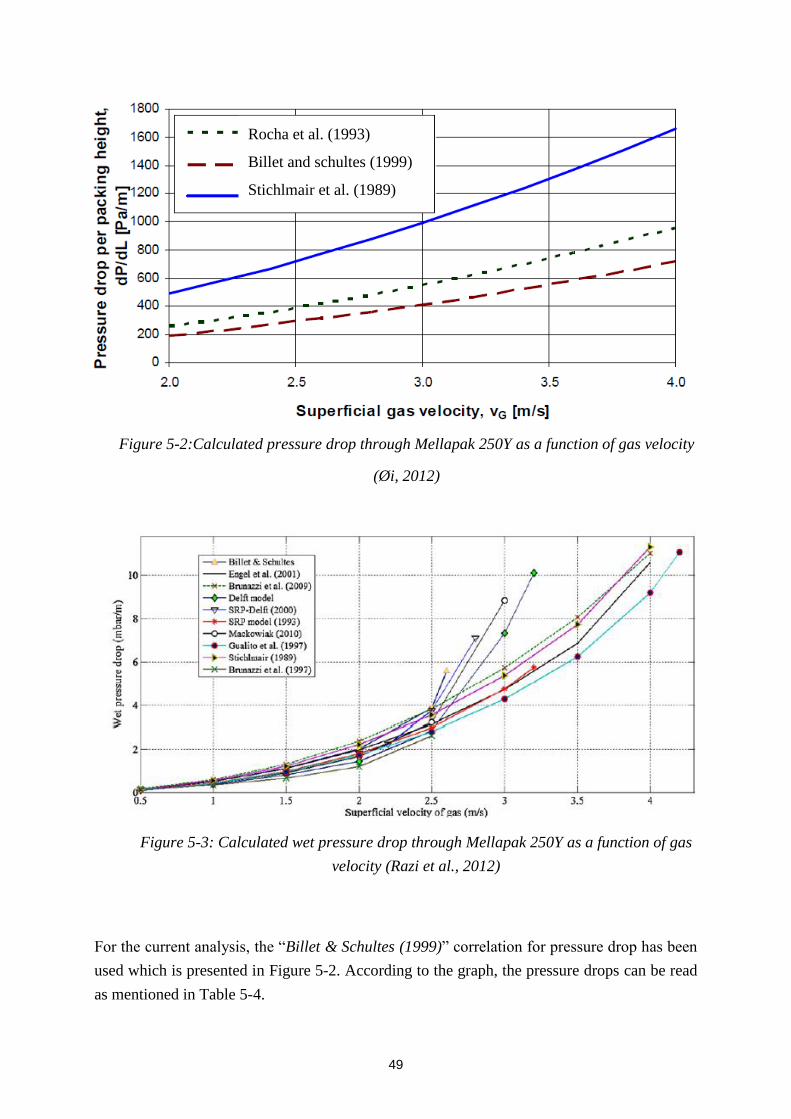
49
For the current analysis, the “Billet & Schultes (1999)” correlation for pressure drop has been
used which is presented in Figure 5-2. According to the graph, the pressure drops can be read
as mentioned in Table 5-4.
Figure 5-3: Calculated wet pressure drop through Mellapak 250Y as a function of gas
velocity (Razi et al., 2012)
Figure 5-2:Calculated pressure drop through Mellapak 250Y as a function of gas velocity
(Øi, 2012)
FT_17
Rocha et al. (1993)
Billet and schultes (1999)
Stichlmair et al. (1989)
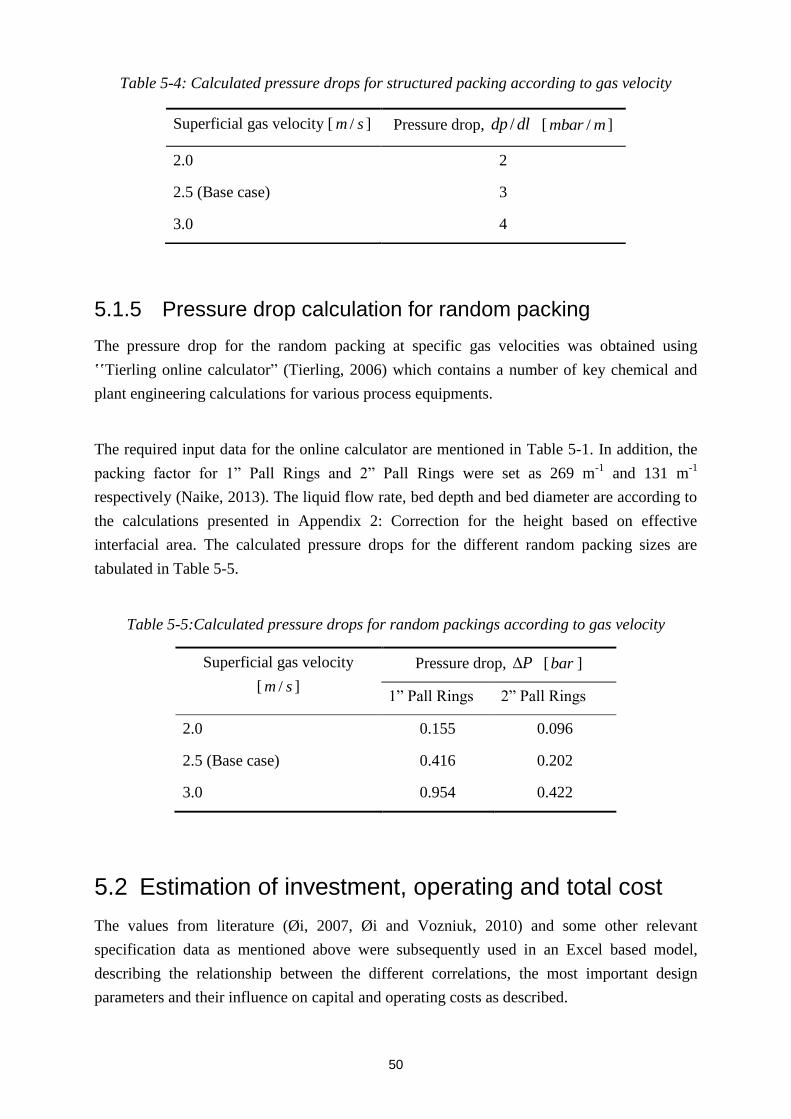
50
Table 5-4: Calculated pressure drops for structured packing according to gas velocity
5.1.5 Pressure drop calculation for random packing
The pressure drop for the random packing at specific gas velocities was obtained using
ʽʽTierling online calculator” (Tierling, 2006) which contains a number of key chemical and
plant engineering calculations for various process equipments.
The required input data for the online calculator are mentioned in Table 5-1. In addition, the
packing factor for 1” Pall Rings and 2” Pall Rings were set as 269 m-1 and 131 m-1
respectively (Naike, 2013). The liquid flow rate, bed depth and bed diameter are according to
the calculations presented in Appendix 2: Correction for the height based on effective
interfacial area. The calculated pressure drops for the different random packing sizes are
tabulated in Table 5-5.
Table 5-5:Calculated pressure drops for random packings according to gas velocity
Superficial gas velocity
[ sm / ]
Pressure drop, P [bar ]
1” Pall Rings 2” Pall Rings
2.0 0.155 0.096
2.5 (Base case) 0.416 0.202
3.0 0.954 0.422
5.2 Estimation of investment, operating and total cost
The values from literature (Øi, 2007, Øi and Vozniuk, 2010) and some other relevant
specification data as mentioned above were subsequently used in an Excel based model,
describing the relationship between the different correlations, the most important design
parameters and their influence on capital and operating costs as described.
Superficial gas velocity [ sm / ] Pressure drop, dldp / [ mmbar / ]
2.0 2
2.5 (Base case) 3
3.0 4
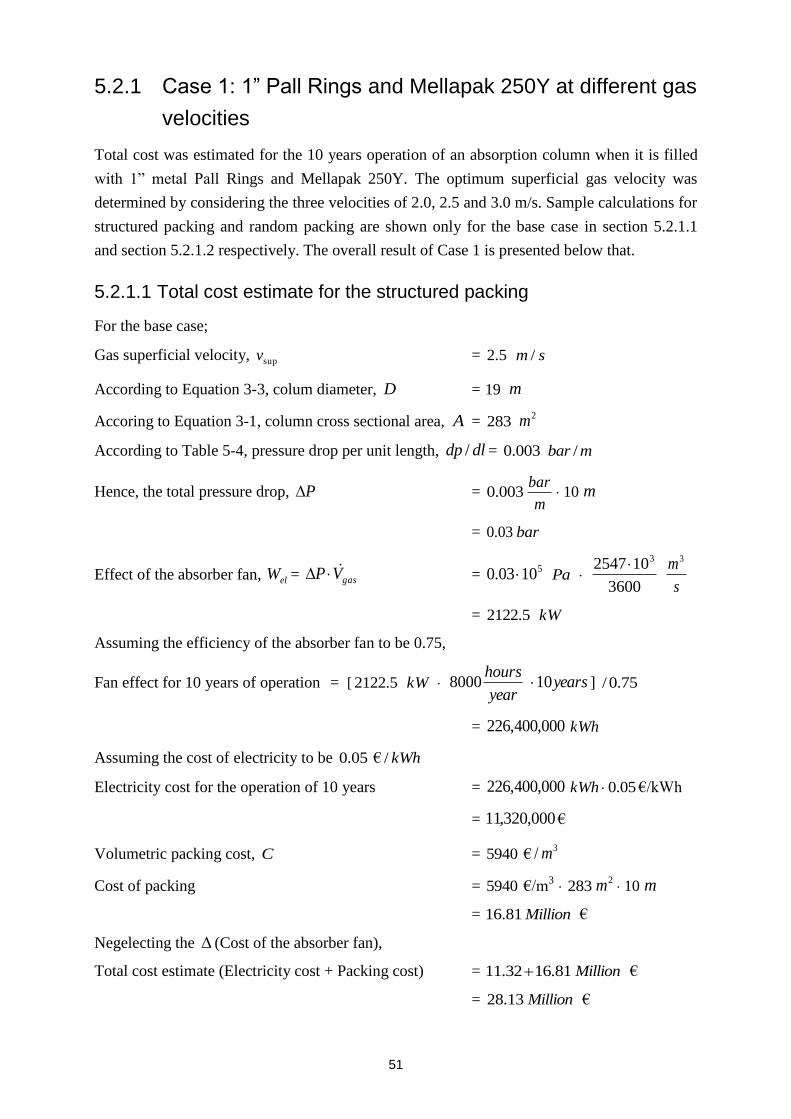
51
5.2.1 Case 1: 1” Pall Rings and Mellapak 250Y at different gas
velocities
Total cost was estimated for the 10 years operation of an absorption column when it is filled
with 1” metal Pall Rings and Mellapak 250Y. The optimum superficial gas velocity was
determined by considering the three velocities of 2.0, 2.5 and 3.0 m/s. Sample calculations for
structured packing and random packing are shown only for the base case in section 5.2.1.1
and section 5.2.1.2 respectively. The overall result of Case 1 is presented below that.
5.2.1.1 Total cost estimate for the structured packing
For the base case;
Gas superficial velocity, supv = 5.2 sm /
According to Equation 3-3, colum diameter, D = 19 m
Accoring to Equation 3-1, column cross sectional area, A = 283 2m
According to Table 5-4, pressure drop per unit length, dldp / = 003.0 mbar /
Hence, the total pressure drop, P = 003.0m
bar 10 m
= 03.0 bar
Effect of the absorber fan, elW = gasVP = 51003.0 Pa 3600
102547 3
s
m3
= 5.2122 kW
Assuming the efficiency of the absorber fan to be 0.75,
Fan effect for 10 years of operation = [ 5.2122 kW year
hours8000 years10 ] 75.0/
= 000,400,226 kWh
Assuming the cost of electricity to be 05.0 € kWh/
Electricity cost for the operation of 10 years = 000,400,226 kWh 05.0 €/kWh
= 000,320,11 €
Volumetric packing cost, C = 5940 € 3/ m
Cost of packing = 5940 €/m3 283 2m 10 m
= 81.16 Million €
Negelecting the (Cost of the absorber fan),
Total cost estimate (Electricity cost + Packing cost) = 81.1632.11 Million €
= 13.28 Million €

52
5.2.1.2 Total cost estimate for the random packing
For the base case;
Gas superficial velocity, supv = 5.2 sm /
According to Equation 3-3, colum diameter, D = 19 m
Accoring to Equation 3-1, column cross sectional area, A = 283 2m
According to Appendix 3: Pressure drop calculation snap shots for Random packing using
Tierling calculator, pressure drop per unit length, dldp / = 0416.0 mbar /
Hence, the total pressure drop, P = 0416.0m
bar 10 m
= 416.0 bar
Effect of the absorber fan, elW = gasVP = 510416.0 Pa 3600
102547 3
s
m3
= 29432 kW
Assuming the efficiency of the absorber fan to be 0.75,
Fan effect for 10 years of operation = [ 29432 kW year
hours8000 years10 ] 75.0/
= 333,413,139,3 kWh
Assuming the cost of electricity to be 05.0 € kWh/ ,
Electricity cost for the operation of 10 years = 333,413,139,3 kWh 05.0 €/kWh
= 667,970,156 €
Volumetric packing cost for 1” Pall Rings, C (Duss et al., 1997)
= 5940 €4.1
7.1/ 3 m
= 7213 € 3/ m
Cost of packing = 7213 €/m3 283 2m 10 m
= 41.20 Million €
Negelecting the (Cost of the absorber fan),
Total cost estimate (Electricity cost + Packing cost) = 41.2097.156 Million €
= 38.177 Million €
Including the above two sample calculations, the total cost estimation results for the three gas
velocities of Case 1 can be summarized as follows.

53
Table 5-6:Results of the total cost estimate for Case 1
Parameter I II III
R1 S R1 S R1 S
Gas superficial velocity [m/s] 2.0 2.0 2.5 2.5 3.0 3.0
Column Diameter [m] 21.2 21.2 19 19 17.3 17.3
Cross sectional area [m2] 353.8 353.8 283 283 235.8 235.8
Column height [m] 8.82 8.82 10 10 10.97 10.97
Pressure drop, dp/dl [bar/m] 0.0176 0.002 0.0416 0.003 0.087 0.0043
Pressure drop [bar] 0.1552 0.0176 0.416 0.03 0.9544 0.0438
Fan effect for 10 years of
operation [GWh] 1171.5 133.12 3139.4 226 7202.46 331.18
Electricity cost for 10 years
of operation [Million €] 58.574 6.656 156.97 11.32 360.12 16.557
Cost of packing [Million €] 22.504 18.532 20.412 16.809 18.66 15.367
Total Cost Estimate
[Million €] 81.078 25.188 177.38 28.13 378.78 31.924
R1 – 1” Metal Pall Rings S – Mellapak 250Y
According to the results shown in Table 5-6, the superficial gas velocity 2.0 m/s shows the
optimum value for an economical absorption column design with Mellapak 250Y structured
packing based on the assumptions mentioned above.
5.2.2 Case 2: 2” Pall Rings and Mellapak 250Y at different gas
velocities
In this case, total cost was estimated for the 10 years operation of an absorption column when
it is filled with 2” metal Pall Rings and Mellapak 250Y. The optimum superficial gas velocity
was determined by considering the three velocities of 2.0, 2.5 and 3.0 m/s. Sample calculation
for random packing is shown only for the base case in section 5.2.2.2. The overall result of
Case 2 is presented below that.
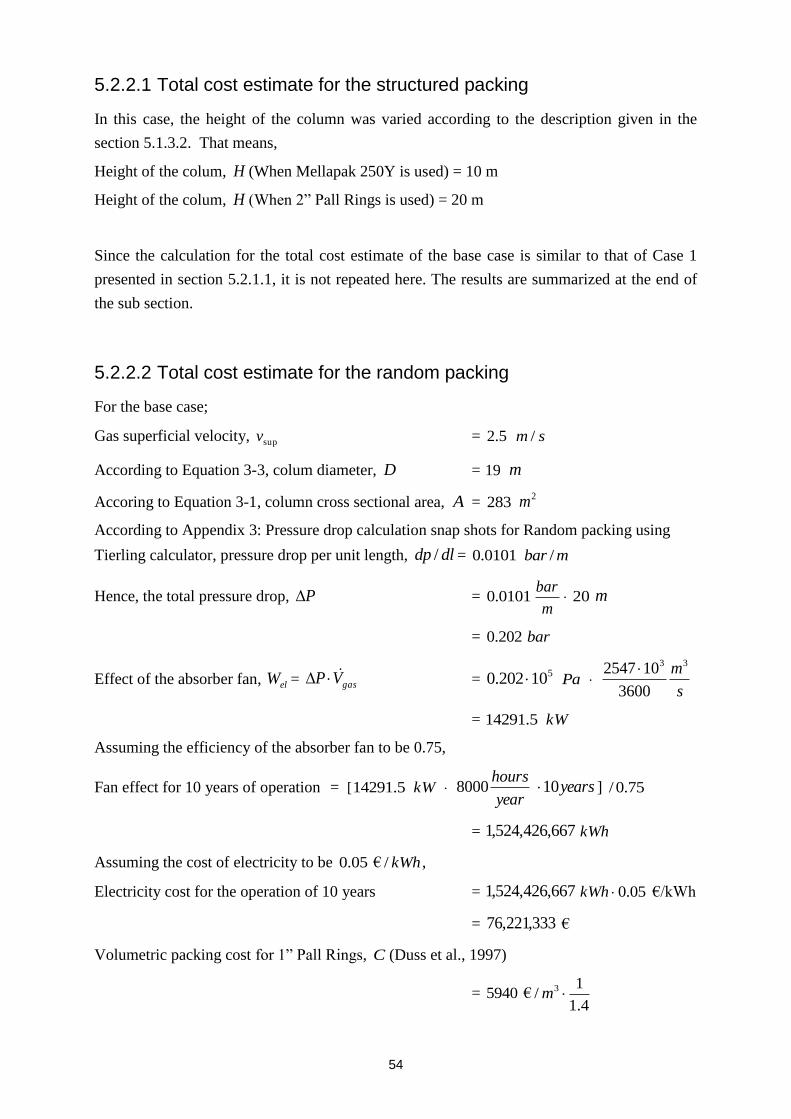
54
5.2.2.1 Total cost estimate for the structured packing
In this case, the height of the column was varied according to the description given in the
section 5.1.3.2. That means,
Height of the colum, H (When Mellapak 250Y is used) = 10 m
Height of the colum, H (When 2” Pall Rings is used) = 20 m
Since the calculation for the total cost estimate of the base case is similar to that of Case 1
presented in section 5.2.1.1, it is not repeated here. The results are summarized at the end of
the sub section.
5.2.2.2 Total cost estimate for the random packing
For the base case;
Gas superficial velocity, supv = 5.2 sm /
According to Equation 3-3, colum diameter, D = 19 m
Accoring to Equation 3-1, column cross sectional area, A = 283 2m
According to Appendix 3: Pressure drop calculation snap shots for Random packing using
Tierling calculator, pressure drop per unit length, dldp / = 0101.0 mbar /
Hence, the total pressure drop, P = 0101.0m
bar 20 m
= 202.0 bar
Effect of the absorber fan, elW = gasVP = 510202.0 Pa s
m33
3600
102547
= 5.14291 kW
Assuming the efficiency of the absorber fan to be 0.75,
Fan effect for 10 years of operation = [ 5.14291 kW year
hours8000 years10 ] 75.0/
= 667,426,524,1 kWh
Assuming the cost of electricity to be 05.0 € kWh/ ,
Electricity cost for the operation of 10 years = 667,426,524,1 kWh 05.0 €/kWh
= 333,221,76 €
Volumetric packing cost for 1” Pall Rings, C (Duss et al., 1997)
= 5940 €4.1
1/ 3 m

55
= 4243 € 3/ m
Cost of packing = 4243 €/m3 283 2m 20 m
= 015.24 Million €
Negelecting the (Cost of the absorber fan),
Total cost estimate (Electricity cost + Packing cost) = 015.24221.76 Million €
= 236.100 Million €
Including the above sample calculation, the total cost estimation results for the three gas
velocities in Case 2 can be summarized as follows.
Table 5-7:Results of the total cost estimate for Case 2
Parameter I II III
R2 S R2 S R2 S
Gas superficial velocity [m/s] 2.0 2.0 2.5 2.5 3.0 3.0
Column Diameter [m] 21.2 21.2 19 19 17.3 17.3
Cross sectional area [m2] 353.8 353.8 283 283 235.8 235.8
Column height [m] 20 10 20 10 20 10
Pressure drop, dp/dl [bar/m] 0.0048 0.002 0.0101 0.003 0.0211 0.004
Pressure drop [bar] 0.0962 0.02 0.202 0.03 0.422 0.04
Fan effect for 10 years of
operation [GWh] 725.989 150.933 1524.4 226.4 3184.69 301.866
Electricity cost for 10 years
of operation [Million €] 36.299 7.546 76.221 11.32 159.234 15.093
Cost of packing [Million €] 30.017 21.012 24.014 16.809 20.011 14.008
Total Cost Estimate
[Million €] 66.316 28.558 100.235 28.13 179.245 29.101
R2 – 2” Metal Pall Rings S – Mellapak 250Y
According to the results shown in Table 5-7, the superficial gas velocity 2.5 m/s shows the
optimum value for an economical absorption column design with Mellapak 250Y structured
packing based on assumptions mentioned above.
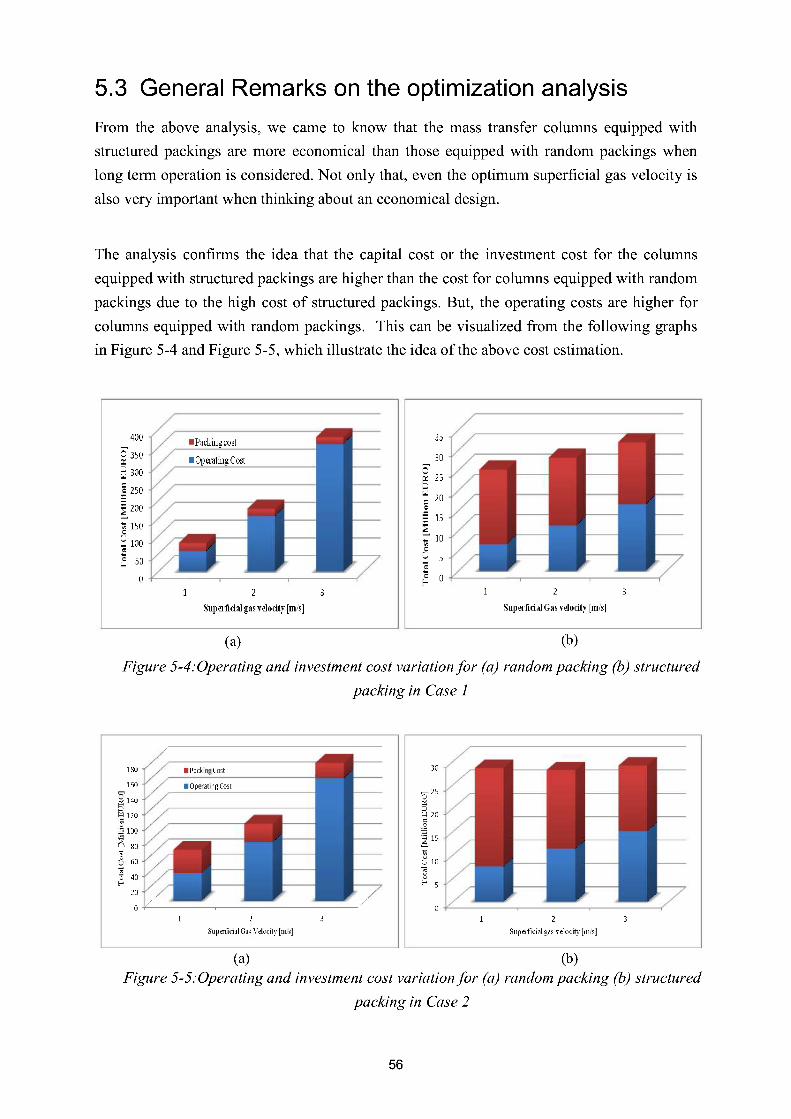
56
5.3 General Remarks on the optimization analysis
From the aboveanalysis,we cameto know that the masstransfercolumnsequippedwith
structuredpackingsare more economicalthan thoseequippedwith randompackingswhen
long termoperationis considered.Not only that,eventheoptimumsuperficialgasvelocity is
alsovery importantwhenthinkingaboutaneconomicaldesign.
The analysisconfirms the idea that the capital cost or the investmentcost for the columns
equippedwith structuredpackingsarehigherthanthecostfor columnsequippedwith random
packingsdueto the high costof structuredpackings.But, the operatingcostsarehigher for
columnsequippedwith randompackings. This canbe visualizedfrom the following graphs
in Figure5-4 and Figure5-5, which illustratetheideaof theabovecostestimation.
(a) (b)
Figure5-4:Operatingandinvestmentcostvariation for (a) randompacking(b) structured
packingin Case1
Figure5-5:Operatingandinvestmentcostvariation for (a) randompacking (b) structured
packingin Case2
(a) (b)

57
Therefore, if structured packings are used, it is possible to use smaller column diameters since
then the investment cost will be reduced due to the reduction of the volume of the column.
In this present analysis, we have used both random and structured packings made up of metal.
But, there have been some studies done in the literature, where the economic performances
vary with the material of the packing type as well (Brunazzi et al., 2002).
It is necessary to point out that in the above economical analysis the cost to install the
equipment has not been taken into account. Actually, installation costs can be identified as a
function of the country where plant is built. This is a great simplification but, it is necessary
to underscore, that the main objective of present work is to show that the correct design of an
absorption column cannot be done, taking into account only technical details (e.g. capacity,
loading point or flooding point), but it is necessary to take into account also the economical
point of view. Therefore if some details are available on the cost necessary to install the
equipment, it is sufficient to introduce another cost item for the above estimate.
And another important fact is that, the depreciation has not been taken into account in this
study. If we consider the depreciation also, the result will tell us some more information about
the costs according to the time period we consider. For an instance, (Brunazzi et al., 2002) say
that, the result of their study is quite surprising since if the depreciation period is short, the
operating costs have a negligible effect and the total cost is essentially due to the capital costs.

58
6 Simulation of a CO2 absorber using Aspen
HYSYS
6.1 General overview of the simulations
It is obvious and natural to use process simulations to evaluate new processes since the testing
is much expensive and time consuming. Therefore, process simulation and modeling have an
important role to play for system optimization and in evaluation of the various process
alternatives. Aspen HYSYS and Aspen Plus are two of the well proven process simulation
softwares to simulate such type of dynamic process plants.
However, the available literature on process simulations on CO2 removal from exhaust gas at
atmospheric pressure is very limited. In literature, it is found some articles where Aspen
HYSYS has been used to simulate the CO2 removal by amine absorption together with some
cost estimates (Vozniuk, 2010, Øi, 2007, Leifsen, 2007). A CO2 removal and liquefaction
system, which separates carbon dioxide from flue gases of conventional power plants, has
been modeled using Aspen Plus by (Desideri and Paolucci, 1999). The work of (Plaza et al.,
2009, Freguia and Rochelle, 2003) also focus on the development of Aspen Plus rate based
model of an absorption / stripping process for CO2 removal while (Abu-Zahra et al., 2007b,
Abu-Zahra et al., 2007a) have performed an optimization and technical and economical
parameter study for a CO2 capture process using ASPEN Plus with the RADFRAC
subroutine.
Calculation of the thermodynamic properties and also the selection of the Amines Property
Package (Leifsen, 2007, Øi, 2007) are very important in these types of process simulation
softwares. The Amines Property Package in HYSYS is a property package designed
especially for modeling of alkanolamine treating units in which H2S and CO2 are removed
from gas streams. The package contains data to model the absorption/desorption process
where aqueous solutions of single amines and aqueous solutions of blended amines are used.
When it comes to a complete process simulation of a gas based power plant together with a
CO2 capture plant, it needs to define all the adiabatic efficiencies of compressors, gas turbines
and steam turbines etc., to achieve the intended results. Other parameters such as amine
circulation rates, absorption column height, absorption temperature, steam temperature etc.,
can be varied in order to achieve a targeted CO2 removal efficiency or energy efficiency of
the plant. Description of thermodynamics and absorption efficiency, convergence and total
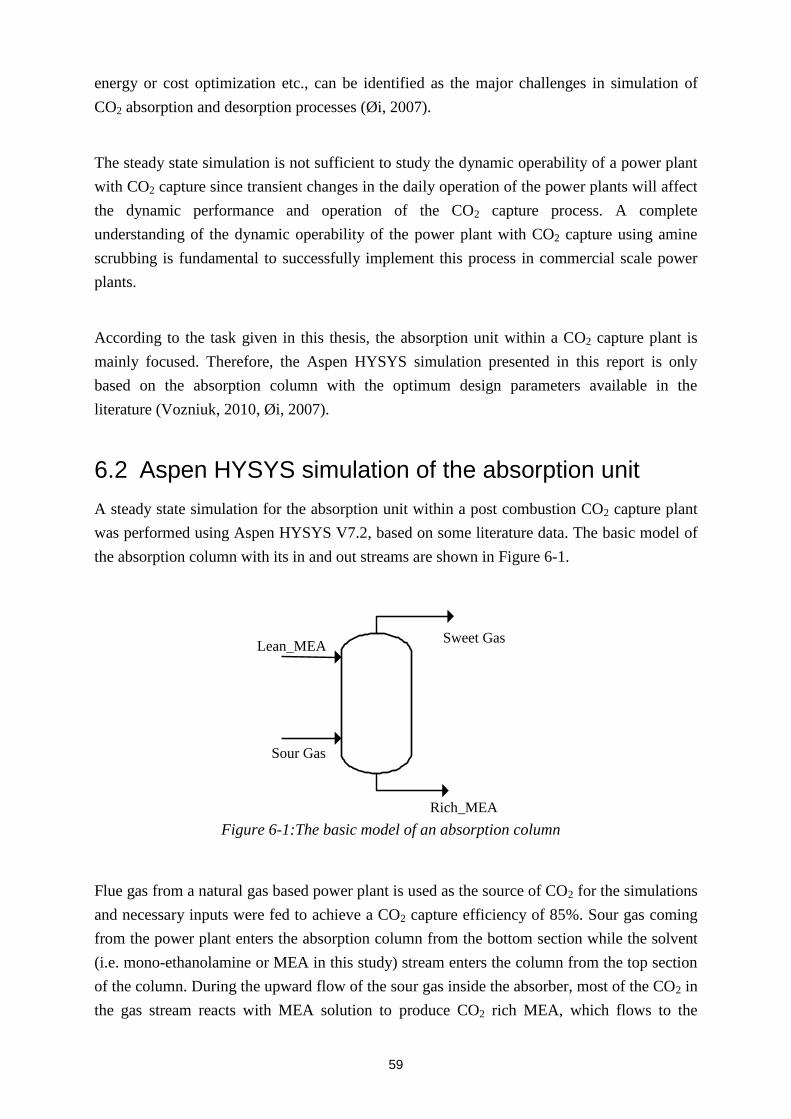
59
energy or cost optimization etc., can be identified as the major challenges in simulation of
CO2 absorption and desorption processes (Øi, 2007).
The steady state simulation is not sufficient to study the dynamic operability of a power plant
with CO2 capture since transient changes in the daily operation of the power plants will affect
the dynamic performance and operation of the CO2 capture process. A complete
understanding of the dynamic operability of the power plant with CO2 capture using amine
scrubbing is fundamental to successfully implement this process in commercial scale power
plants.
According to the task given in this thesis, the absorption unit within a CO2 capture plant is
mainly focused. Therefore, the Aspen HYSYS simulation presented in this report is only
based on the absorption column with the optimum design parameters available in the
literature (Vozniuk, 2010, Øi, 2007).
6.2 Aspen HYSYS simulation of the absorption unit
A steady state simulation for the absorption unit within a post combustion CO2 capture plant
was performed using Aspen HYSYS V7.2, based on some literature data. The basic model of
the absorption column with its in and out streams are shown in Figure 6-1.
Flue gas from a natural gas based power plant is used as the source of CO2 for the simulations
and necessary inputs were fed to achieve a CO2 capture efficiency of 85%. Sour gas coming
from the power plant enters the absorption column from the bottom section while the solvent
(i.e. mono-ethanolamine or MEA in this study) stream enters the column from the top section
of the column. During the upward flow of the sour gas inside the absorber, most of the CO2 in
the gas stream reacts with MEA solution to produce CO2 rich MEA, which flows to the
Lean_MEA
Sour Gas
Rich_MEA
Sweet Gas
Figure 6-1:The basic model of an absorption column

60
bottom of the column. The flue gas leaving at the top of the absorber column called as the
“sweet gas” contains very small amount of non-reacted CO2, Nitrogen, water vapor and trace
amount of MEA.
6.2.1 Parameters and specifications
The simulations were performed to achieve a CO2 removal efficiency of 85%. The parameters
which were used in the simulation are listed in Table 6-1(Øi, 2007).
Table 6-1:Parameters and specifications used in HYSYS simulations
Specification Value
Inlet gas temperature [ C0 ] 40
Inlet gas pressure [ bar ] 1.1
Inlet gas flow rate [ hrkgmole/ ] 85000
CO2 in the inlet gas [ %mol ] 3.73
H2O in the inlet gas [ %mol ] 6.71
Lean_MEA temperature [ C0 ] 40
Lean_MEA pressure [ bar ] 1.1
Lean_MEA flow rate [ hrkgmole/ ] 120000
MEA content in Lean_MEA [ %mass ] 29
CO2 content in Lean_MEA [ %mass ] 5.5
Number of stages [-] 10
Murphree efficiency [-] 0.25
The model was developed in Aspen HYSYS and the absorption column was specified with 10
stages where each stage with a Murphree efficiency of 0.25. That means, an estimated
“Height Equivalent to a Theoretical plate” (HETP) of 4m, is equivalent to 0.25 an efficiency
for each meter of packing. The Kent Eisenberg model is selected in the Amines Property
Package (Øi, 2007). Modified HYSIM Inside-Out algorithm was used as the convergence
criteria and a value of 0.273 was used as the initial damping factor. The column top pressure
was specified as 1.101bar. The Aspen HYSYS model for the absorption column in CO2
removal is presented in Figure 6-2.

61
6.2.2 Results
The results with the compositions of the in and out streams are mentioned in the …..It can be
seen that the CO2 composition in the “sweet gas” stream is very low. The calculated
efficiency results in ≈ 86%.
Table 6-2:Results from the HYSYS simulations
Component Feeds Products
Lean_MEA Sour gas Sweet gas Rich_MEA
Flow rate [ hrkgmole/ ] 120000 85000 85207.78 119792.2
MEA [ %mass ] 0.1121 0 0.0004 0.1120
H2O [ %mass ] 0.8584 0.0670 0.1010 0.8356
CO2 [ %mass ] 0.0295 0.0373 0.0051 0.0524
N2 [ %mass ] 0 0.8957 0.8935 0
Inlet CO2 flow rate = 0373.085000 hrkgmole/
= 5.3170 hrkgmole/
Outlet CO2 flow rate = 0051.078.85207 hrkgmole/
= 557.434 hrkgmole/
Figure 6-2:Aspen HYSYS model of the absorption column for CO2 removal

62
CO2 removal efficency = %1005.3170
557.4345.3170
= 29.86 %
Figure 6-3 and Figure 6-4 show the pressure and temperature variation within the absorption
column top to bottom. The defined pressure drop of 0.09 bar can be clearly seen from the
pressure profile in Figure 6-3. Acording to Figure 6-4, the temperature within the absorption
column has become maximum in between the 3rd and 4th stages from top.
Figure 6-3:Pressure profile within the absorption column
Figure 6-4: Temperature profile within the absorption column

63
7 CFD analysis of gas distribution in packed beds
The initial gas mal-distribution profiles generated within the packed beds has become a
potential drawback of further reduction of pressure drop due to the driving force reduction
(Sønderby et al., 2013, Øi, 2012). It requires excelent initial distribution to achieve the
maximum benefit of the structured packing. Promoting an uniform or even distribution of gas
and liquid is one of the main desirable requirements for the packing of distillation and
absorption columns.
(Falk-Pedersen et al., 2005) suggest membrane reactors as a solution for this gas channeling
or mal-distribution. The results of an experimental study done by (Pavlenko et al., 2009), give
an idea of the effect of the initial mal-distribution over a structured packing on the separation
efficiency of a binary freon mixture. They state that, the rotation angle of structured packed
layers have a significant effect on the efficiency of mixture separation in the case of mal-
distribution.
According to an experimental study done by (Porter et al., 1993) on gas distribution in
shallow packed beds, they illustrates how a rotating gas flow below a packed bed produces a
maldistributed gas flow within the bed and how the mal-distribution is reduced with the
increase of the bed depth. (Øi, 2012) states that low pressure drops within the absorption
column may lead to initial gas mal-distribution and it will result in reduced absorption
efficiency of the column.
7.1 Use of CFD to predict gas/liquid mal-distribution
It has been widely mentioned in literature that the state of the art Computational Fluid
Dynamics (CFD) tool can be easily used in predicting the effect of column internals and other
design parameters on the single phase gas flow field (Duss and Menon, 2010, Olujiæ et al.,
2003, Zhang et al., 2004, Mohamed Ali et al., 2003, Spiegel and Meier, 2003). Hence, CFD
has been used to predict the gas mal-distribution within the packed bed with different design
parameter values of pressure drop and gas velocities (and column diameter) (Olujić et al.,
2006). Vapor distribution is very important for large column diameters and therefore, CFD
studies are required to verify the appropriate dimensioning and location of gas inlet nozzles
and the required distance to the packing (Zhang et al., 2004). Such type of studies will help us
to avoid additional internals for vapor distribution since they increase the overall pressure
drop and overall installed costs.

64
The simulation of two phase flow is still in an early stage. The reason behind it is that the two
phase flow is an intrinsic instationary process (Spiegel and Meier, 2003). The difficulty here
is to develop a correct description of the interaction between the two phases. (Raynal and
Royon-Lebeaud, 2007) also state that, it is a challenge to run computations at large scales
taking into account the gas–liquid interaction and the real geometry of the packing and
original approaches must be developed due to several reasons. But, their study proposes a
methodology that enables representative CFD calculations at large scales.
Most of the studies done using CFD with regarding to the hydrodynamics of fluid flow in
packed columns are limited to very detailed information such as wetting behavior of packings,
corrugation angles etc, for small scale packing sections in single phase (Subramanian and
Wozny, 2012, Wen et al., 2007, Chen et al., 2009, Haghshenas Fard et al., 2007). The effect
of bed structure (void fraction variation) and liquid and vapor phase dispersion have been
taken into consideration in the study done by (Yin et al., 2000) on CFD modeling of mass
transfer processes in randomly packed distillation columns. (Owens et al., 2013) states that
CFD simulation with a k−ε turbulence model provides a wealth of data not readily accessible
by traditional experimental methods and it enables researchers to quickly determine the
regions of packing that exhibit poor flow performance.
Therefore, a 3D simulation for a single phase (gas) flow within a packed bed is performed
using ANSYS FLUENT 13.0 and the results are presented in this chapter.
7.2 CFD simulations of packed beds
A 3D absorption column was drawn in Gambit 2.4 and imported to FLUENT 13.0 to visualize
the gas flow behavior within the packed column. Since the real scale geometry is highly time
consuming in the simulations, reduced scale geometry was considered for the convenience of
simulations to do several trials. Anyhow, once the reduced scale geometry gave better results,
another simulation was performed using the real scale geometry also and the results are
presented in below sections.
7.2.1 General specifications for the simulations
The most important fact is that how we can imitate the action of the packed bed in the
simulations. As it is mentioned in the above section, there are a lot of studies carried out for
the simulation of structured packings with very detailed manner, i.e with the wetting
properties, corrugated angles of packing etc,. But they are all limited to only a very small
piece of packing with single fluid on it.
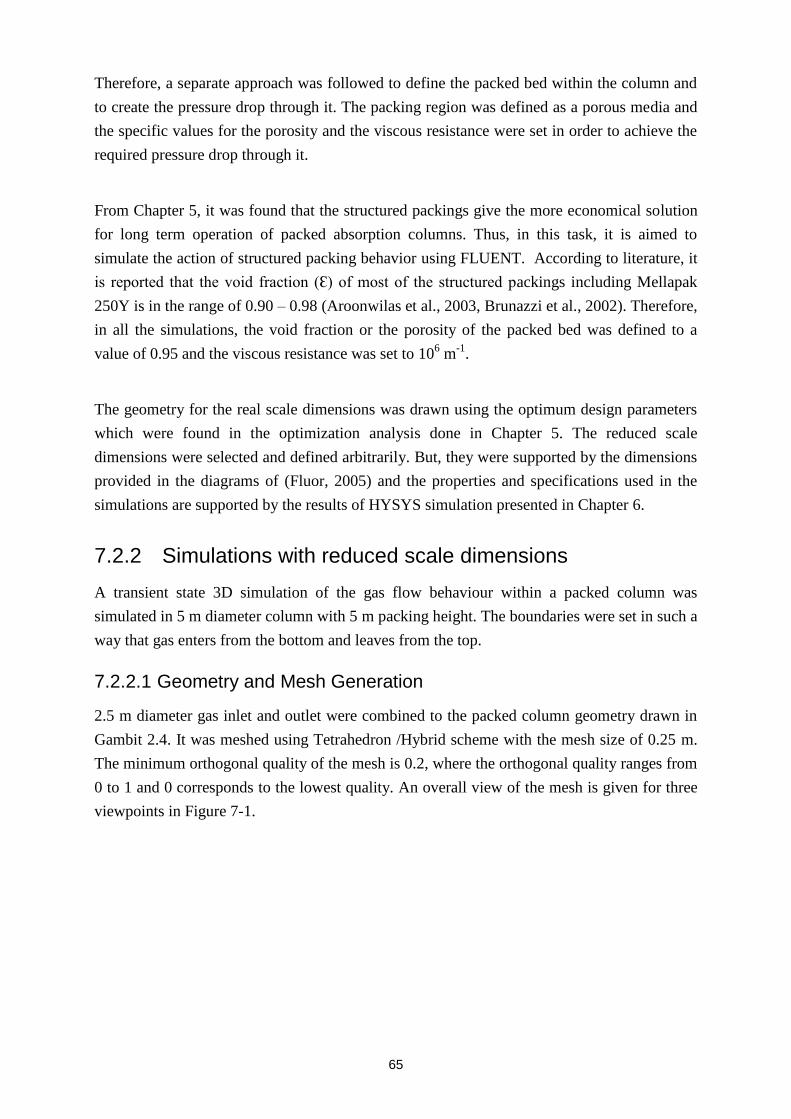
65
Therefore, a separate approach was followed to define the packed bed within the column and
to create the pressure drop through it. The packing region was defined as a porous media and
the specific values for the porosity and the viscous resistance were set in order to achieve the
required pressure drop through it.
From Chapter 5, it was found that the structured packings give the more economical solution
for long term operation of packed absorption columns. Thus, in this task, it is aimed to
simulate the action of structured packing behavior using FLUENT. According to literature, it
is reported that the void fraction (Ɛ) of most of the structured packings including Mellapak
250Y is in the range of 0.90 – 0.98 (Aroonwilas et al., 2003, Brunazzi et al., 2002). Therefore,
in all the simulations, the void fraction or the porosity of the packed bed was defined to a
value of 0.95 and the viscous resistance was set to 106 m-1.
The geometry for the real scale dimensions was drawn using the optimum design parameters
which were found in the optimization analysis done in Chapter 5. The reduced scale
dimensions were selected and defined arbitrarily. But, they were supported by the dimensions
provided in the diagrams of (Fluor, 2005) and the properties and specifications used in the
simulations are supported by the results of HYSYS simulation presented in Chapter 6.
7.2.2 Simulations with reduced scale dimensions
A transient state 3D simulation of the gas flow behaviour within a packed column was
simulated in 5 m diameter column with 5 m packing height. The boundaries were set in such a
way that gas enters from the bottom and leaves from the top.
7.2.2.1 Geometry and Mesh Generation
2.5 m diameter gas inlet and outlet were combined to the packed column geometry drawn in
Gambit 2.4. It was meshed using Tetrahedron /Hybrid scheme with the mesh size of 0.25 m.
The minimum orthogonal quality of the mesh is 0.2, where the orthogonal quality ranges from
0 to 1 and 0 corresponds to the lowest quality. An overall view of the mesh is given for three
viewpoints in Figure 7-1.

66
The geometry consisted of two main regions as the packing region and the rest of the column.
The packing region was defined as a different zone in order the FLUENT to be able to set
unique properties for that region. The properties of the geometry and the mesh drawn in
GAMBIT are listed in Table 7-1.
Table 7-1: GAMBIT properties for the reduced scale geometry
GAMBIT Property Value
Column diameter, D [ m ] 5
Packing height, H [ m ] 5
Total column height [ m ] 20
Gas inlet diameter, d [ m ] 2.5
Gas outlet diameter, d [ m ] 2.5
Mesh Properties :
Size [ m ] 0.25
Number of control volumes [-] 135600
D = 5m
d = 2.5m
d = 2.5m
H = 5m
20m
Figure 7-1:Overall view of the mesh for the reduced scale geometry

67
The boundaries were defined in GAMBIT, so that it facilitates the relevant settings to be set
in FLUENT at each boundary. The gas inlet was set to “velocity inlet” and the gas outlet was
set to “pressure outlet”. The top and the bottom layers of packing region were set as “interior”
in order to get the advantage of data acquisition and at the same time this boundary condition
does not seek for any other data input.
7.2.2.2 FLUENT simulations
The above described GAMBIT geometry was imported into FLUENT. Transient mode was
activated in order to observe the time evolution of the simulation and gravitational field was
activated vertically. Single phase general model was chosen to represent the gas flow and
standard k-Ɛ model was activated to facilitate the turbulent effects. The properties of the gas
phase and FLUENT program used in the simulations are mentioned in the Table 7-2.
Table 7-2:Gas phase properties in the FLUENT programe
Property Value Reference /remarks
Gas density, g [ 3/ mkg ] 1.18 (Øi, 2012)
Gas viscosity, g [ )/( smkg ] 0.000019 (Øi, 2012)
Gravitational acceleration, yF [ 2/ sm ] 9.81 -
Packed bed porosity, [-] 0.95 (Aroonwilas et al., 2003)
Viscous resistance, [ 2/1 m ] 106 Assumed
Turbulent kinetic energy, tk [ 22 / sm ] 1 Assumed
Turbulent dissipation rate, t [ 32 / sm ] 1 Assumed
Four sub cases were simulated in FLUENT for the same geometry mentioned above. The
appropriate boundary values were set depending on the specific case to visualize which gas
velocities or pressure drops will result in initial gas mal-distribution within the packed bed.
The details of the four sub cases are mentioned in Table 7-3.

68
Table 7-3:Boundary values for the four sub cases in reduced scale geometry simulations
Sub case Boundary conditions / values
Inlet gas velocity [m/s] Inlet gauge pressure [bar] Outlet gauge pressure [bar]
A 10 0.1 0
B 6 0.1 0
C 6 0.02 0
D 4 0.001 0
The discritization schemes used in all the four sub cases mentioned above are listed in Table
7-4.
Table 7-4:The discritization schemes used in FLUENT simulations
Spatial Discritization For all sub cases A, B, C & D
Gradient Least squared Cell Based
Pressure Standard
Momentum First Order Up wind
Turbulent kinetic energy First Order Up wind
Turbulent dissipation rate First Order Up wind
Transient Formulation First Order Implicit
Pressure Velocity Coupling SIMPLE scheme
7.2.2.3 Results
Since the gas volume flow rate is constant, flow through the gas inlet pipe and the absorber
column can be written as follows;
sup
22
44v
Dv
dV column
inpipe
gas
7-1
Hence, the inlet gas velocities were set in such a way that, according to the dimensions of the
gas inlet pipe and the column, it will result in a required gas superficial velocity. Therefore,
the gas superficial velocities for the four sub cases can be calculated based on Equation 7-1 as
shown below.

69
Table 7-5:Superficial gas velocities for the four sub cases
Sub case Inlet gas velocity [ sm / ] Superficial gas velocity [ sm / ]
A 10 2.5
B 6 1.5
C 6 1.5
D 4 1.0
Figure 7-2 shows pressure profiles for the four sub cases within the column over a plane
parallel to the gas inlet. It can be clearly seen that the pressure has dropped when the gas is
moving from bottom to top.
Figure 7-3 shows the static pressure variation within the column over a plane parallel to the
gas inlet for all the four cases. The contours are calibrated in Pa.
Sub case A Sub case B
Sub case C Sub case D
Figure 7-2:Pressure profiles within the absorption column for different sub cases

70
Figure 7-4 shows the velocity contours (velocity magnitude in m/s) of the column through a
plane parallel to the gas inlet. The four figures clearly show how the velocity has been
changed within the column when the gas moves upwards.
Sub case C Sub case D
Sub case A Sub case B
Figure 7-3:Static pressure variation within the column
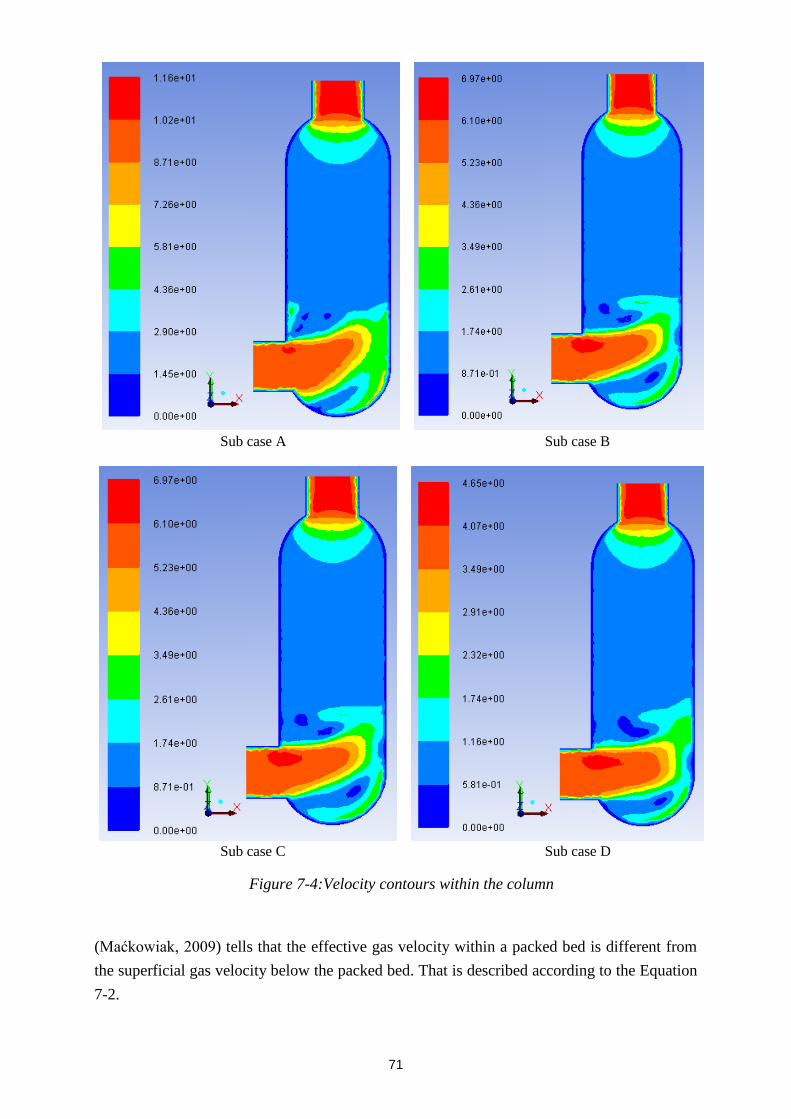
71
(Maćkowiak, 2009) tells that the effective gas velocity within a packed bed is different from
the superficial gas velocity below the packed bed. That is described according to the Equation
7-2.
Sub case A Sub case B
Sub case C Sub case D
Figure 7-4:Velocity contours within the column

72
supvv 7-2
That means the effective gas velocity within the packed bed is always higher than the
superficial gas velocity. That is confirmed by the Figure 7-4.
The velocity vectors throughout the whole column are shown for the four sub cases in Figure
7-5, Figure 7-6, Figure 7-7 and Figure 7-8. Some enlarged views of those figures are also
presented. The way gas behaves within the column and especially near the bottom layer of the
packing region etc, can be seen from those figures.
The sub case A was the simulation which showed a least deviation from the proper (even) gas
distribution.
Figure 7-5:Velocity vectors within the packed column for Sub case A
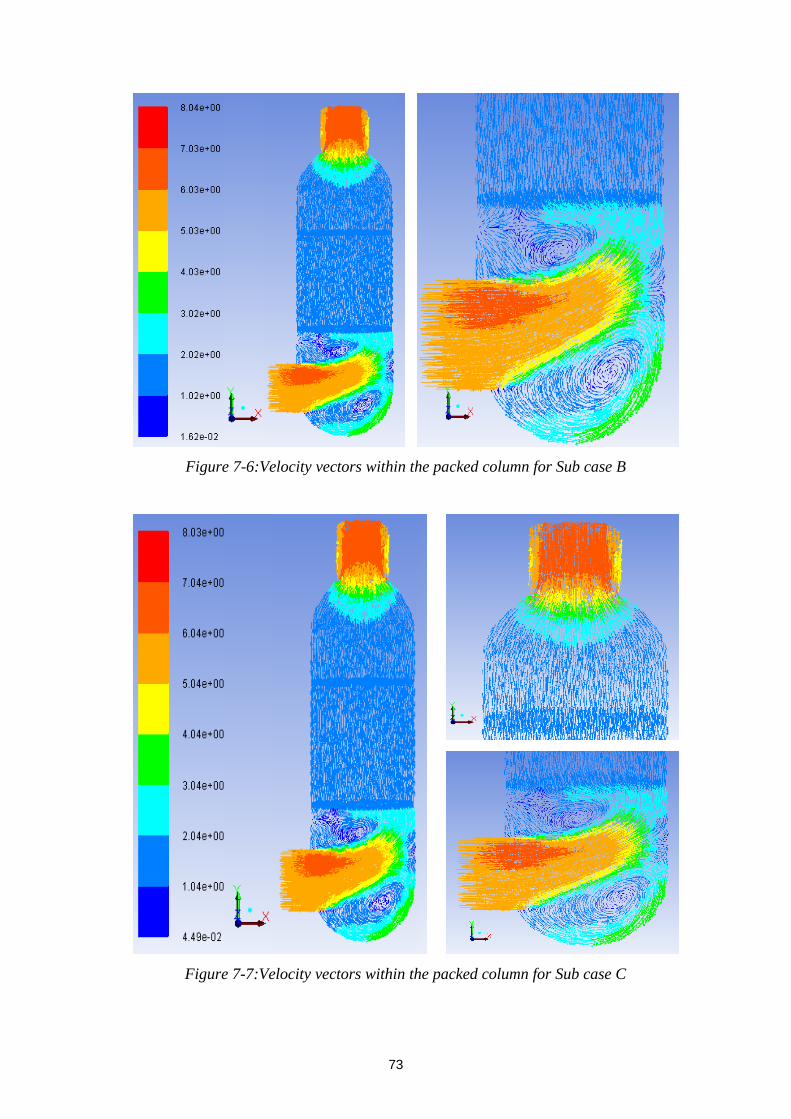
73
Figure 7-6:Velocity vectors within the packed column for Sub case B
Figure 7-7:Velocity vectors within the packed column for Sub case C

74
The most important aspect we wanted to see is the effect of gas velocity and the pressure drop
for initial gas mal-distribution. The following figures show the enlarged views of the velocity
vectors which are originated from the bottom layer of the packing. Figure 7-9, which
represents the sub case A, shows a much better even distribution of gas from the bottom layer
of packing.
Figure 7-8:Velocity vectors within the packed column for Sub case D
Figure 7-9:Enlarged view of the velocity vectors at the bottom layer of the packing for Sub case A

75
When it comes to the simulations with low gas velocities and low pressure drops, the
tendency to occur gas mal-distribution is higher. That can be visualized from the Figure 7-11
& Figure 7-12.
Figure 7-10:Enlarged view of the velocity vectors at the bottom layer of the packing for Sub case B
Figure 7-11:Enlarged view of the velocity vectors at the bottom layer of the packing for Sub case C

76
Therefore, it is clearly seen that the low gas velocities and the low pressure drops lead to the
initial gas mal-distribution within the packed columns which is a draw back in structured
packings. That has to be managed carefully by analyzing the operating conditions precisely
and with the use of studies similar to that has been done in this thesis work
7.2.3 Simulations with real scale dimensions
Since the results of the simulations performed using the reduced scale geometry in FLUENT
showed the idea that low gas velocities and low pressure drops lead to initial gas mal-
distribution in the packed columns, similar simulation was performed with real scale
dimensions of an absorber using the optimum value of gas velocity and pressure drop found
in the optimization analysis. A transient state 3D simulation of the gas flow behaviour within
a packed column was simulated in a 19 m diameter column with 10 m packing height.
7.2.3.1 Geometry and Mesh Generation
7 m diameter gas inlet and outlet were combined to the packed column geometry drawn in
Gambit 2.4. It was meshed using Tetrahedron /Hybrid scheme with the mesh size of 0.25 m.
The minimum orthogonal quality of the mesh is 0.28, where the orthogonal quality ranges
Figure 7-12:Enlarged view of the velocity vectors at the bottom layer of the packing for Sub case D
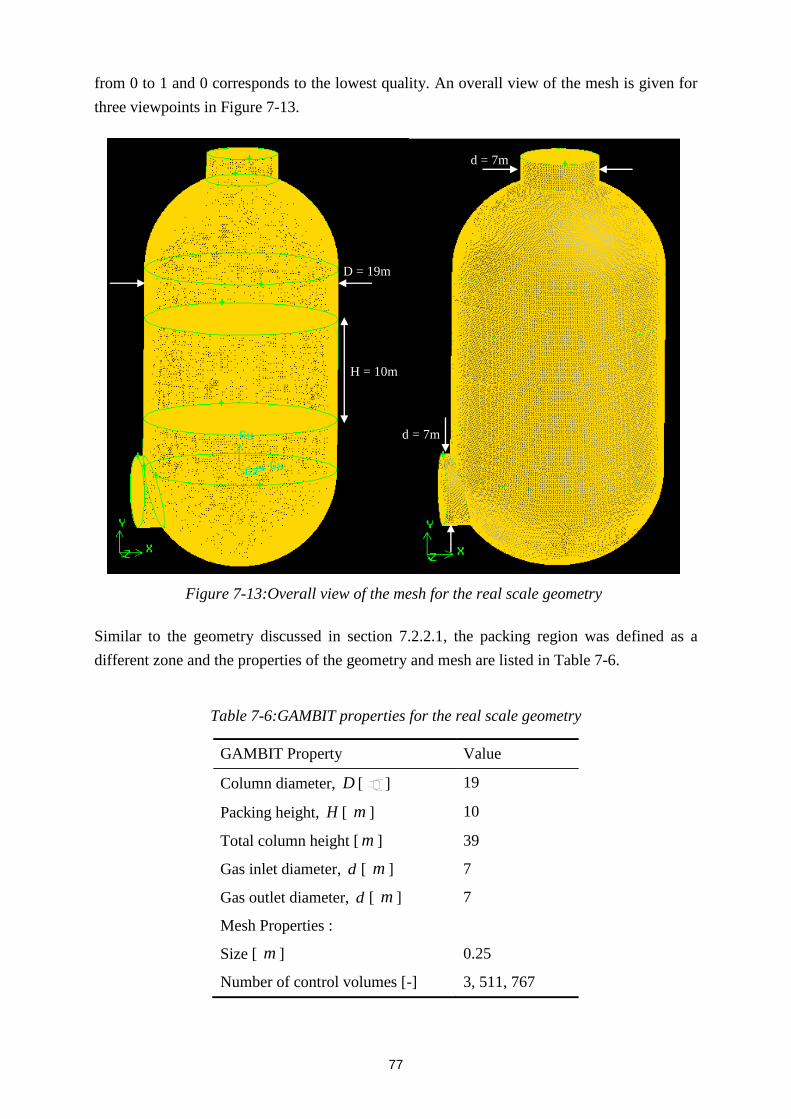
77
from 0 to 1 and 0 corresponds to the lowest quality. An overall view of the mesh is given for
three viewpoints in Figure 7-13.
Similar to the geometry discussed in section 7.2.2.1, the packing region was defined as a
different zone and the properties of the geometry and mesh are listed in Table 7-6.
Table 7-6:GAMBIT properties for the real scale geometry
GAMBIT Property Value
Column diameter, D [ ] 19
Packing height, H [ m ] 10
Total column height [ m ] 39
Gas inlet diameter, d [ m ] 7
Gas outlet diameter, d [ m ] 7
Mesh Properties :
Size [ m ] 0.25
Number of control volumes [-] 3, 511, 767
D = 19m
d = 7m
H = 10m
d = 7m
Figure 7-13:Overall view of the mesh for the real scale geometry

78
The boundaries were also defined in GAMBIT in the similar manner described in section
7.2.2.1.
7.2.3.2 FLUENT simulations
After importing the geometry into FLUENT, transient mode, gravitational field and the
standard k-Ɛ model were activated for the single phase simulation. The properties of the gas
phase and FLUENT program used in the simulations are similar to that of mentioned in the
Table 7-2. Superficial gas velocity 2.5 m/s was used in this simulation with a pressure drop of
0.1 bar. The discritization schemes used in this simulation are similar to that listed in Table
7-4.
7.2.3.3 Results
According to the Equation 7-1, the inlet gas velocity was calculated to be 18.4 m/s and fed to
the simulation in order to achieve gas superficial velocity of 2.5 m/s. The inlet gauge pressure
was set to 0.1 bar and the outlet gauge pressure as 0 bar.
The static pressure variation (contours in Pa) along a plane parallel to the gas inlet is shown in
Figure 7-14 and Figure 7-15 shows how the pressure drops through the packed bed when gas
is moving from bottom to top of the column. The two figures illustrates that the total pressure
drop to be 0.06 bar throughout the whole column.
Figure 7-14:Static pressure variation within the absorption colum in real scal geometry

79
The velocity contours obtained for this simulation show a very clear change in the velocities
when the gas enters to the packing region. According to the Figure 7-16, the gas velocity is a
little bit higher than the superficial gas velocity since it goes through a porous media with a
porosity of 0.95. Figure 7-17 shows the velocity vectors within the column in a plane parallel
to the gas inlet.
Figure 7-15:Pressure drop through the column in real scale geometry
Figure 7-16:Velocity contours within the column in real scale geometry
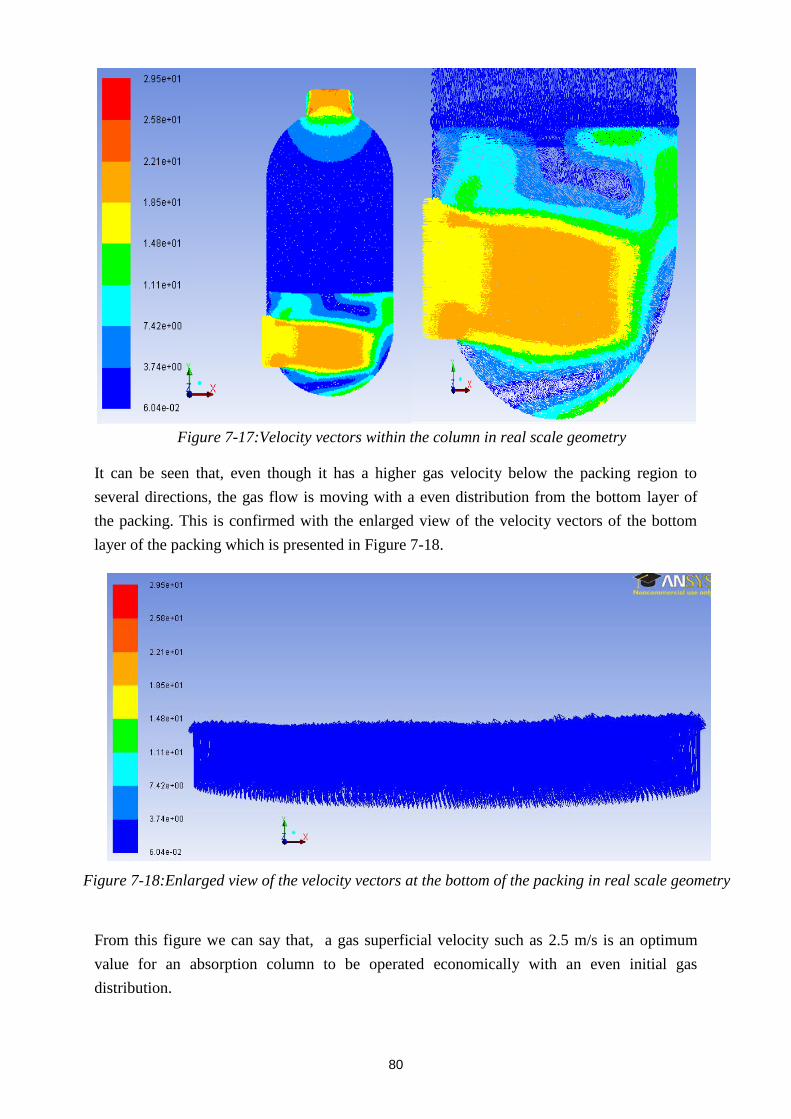
80
It can be seen that, even though it has a higher gas velocity below the packing region to
several directions, the gas flow is moving with a even distribution from the bottom layer of
the packing. This is confirmed with the enlarged view of the velocity vectors of the bottom
layer of the packing which is presented in Figure 7-18.
From this figure we can say that, a gas superficial velocity such as 2.5 m/s is an optimum
value for an absorption column to be operated economically with an even initial gas
distribution.
Figure 7-17:Velocity vectors within the column in real scale geometry
Figure 7-18:Enlarged view of the velocity vectors at the bottom of the packing in real scale geometry

81
8 Discussion
In a large scale power plant with amine based CO2 capture, the absorber needs to be designed
to handle the large volumes of dilute flue gas, and producing the least possible pressure drop
while still maintaining appropriate hydraulic design. Among the many different parameters
which have to be optimized in designing absorption columns, this report mainly discusses
about column pressure drop, gas velocity and the diameter of the column.
8.1 Absorber column pressure drop
The pressure drop per transfer unit of a packing crucially governs the economics of absorption
equipment. As we discussed in the early chapters, the three parameters pressure drop, gas
velocity and the column diameter are all inter-related. Table 8-1 shows the pressure drops
which were calculated in the optimization analysis.
Table 8-1:Pressure drop for each packing at different velocities
Superficial gas
velocity [m/s]
Pressure drop [bar/m]
Mellapak 250Y 1” Pall Rings 2” Pall Rings
2.0 0.002 0.0176 0.00481
2.5 (Base case) 0.003 0.0416 0.0101
3.0 0.004 0.087 0.0211
The values mentioned in the table clearly show that the pressure drop through the column is
increasing with the increased gas velocity. And most importantly, the pressure drop in
structured packing is very low compared to that of random packing. This confirms the idea
that, structured packings offer the best performance characteristics with reduced pressure
drops in mass transfer equipment and hence reduce the operating costs associated with it. But,
it has to be mentioned here, that the pressure drop for the structured packing is calculated
using the “Billet & Schultes (1999)” correlation which gives the lowest value. There are
many possibilities to make this optimization more precise by taking the other information also
into account.
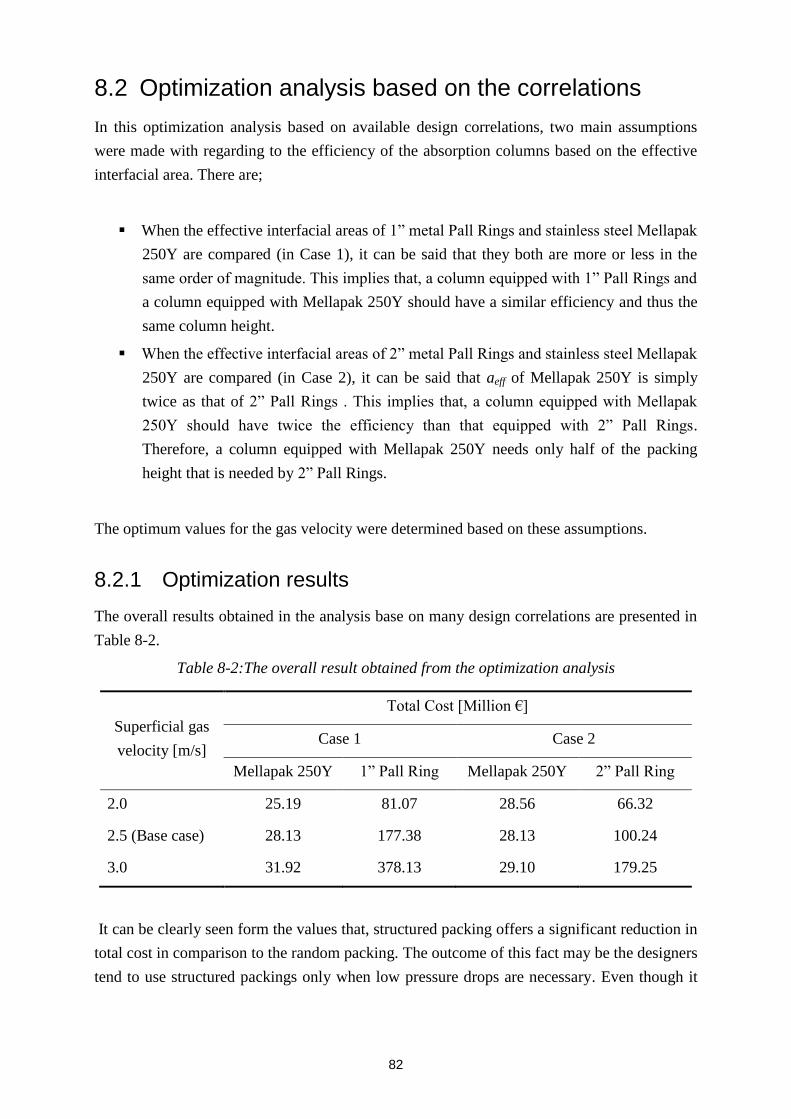
82
8.2 Optimization analysis based on the correlations
In this optimization analysis based on available design correlations, two main assumptions
were made with regarding to the efficiency of the absorption columns based on the effective
interfacial area. There are;
When the effective interfacial areas of 1” metal Pall Rings and stainless steel Mellapak
250Y are compared (in Case 1), it can be said that they both are more or less in the
same order of magnitude. This implies that, a column equipped with 1” Pall Rings and
a column equipped with Mellapak 250Y should have a similar efficiency and thus the
same column height.
When the effective interfacial areas of 2” metal Pall Rings and stainless steel Mellapak
250Y are compared (in Case 2), it can be said that aeff of Mellapak 250Y is simply
twice as that of 2” Pall Rings . This implies that, a column equipped with Mellapak
250Y should have twice the efficiency than that equipped with 2” Pall Rings.
Therefore, a column equipped with Mellapak 250Y needs only half of the packing
height that is needed by 2” Pall Rings.
The optimum values for the gas velocity were determined based on these assumptions.
8.2.1 Optimization results
The overall results obtained in the analysis base on many design correlations are presented in
Table 8-2.
Table 8-2:The overall result obtained from the optimization analysis
Superficial gas
velocity [m/s]
Total Cost [Million €]
Case 1 Case 2
Mellapak 250Y 1” Pall Ring Mellapak 250Y 2” Pall Ring
2.0 25.19 81.07 28.56 66.32
2.5 (Base case) 28.13 177.38 28.13 100.24
3.0 31.92 378.13 29.10 179.25
It can be clearly seen form the values that, structured packing offers a significant reduction in
total cost in comparison to the random packing. The outcome of this fact may be the designers
tend to use structured packings only when low pressure drops are necessary. Even though it
83
shows very small deviations among the cost values in structured packing for the three
velocities in Case 2, it is a way low compared with random packing.
And it is observable form the results that, superficial gas velocity of 2.0 m/s is the optimum
based on the assumptions made for Case 1, and a superficial gas velocity of 2.5 m/s is the
optimum based on the assumptions made for Case 2.
8.2.2 Contributors to the total cost
In the analysis, both capital and operating costs were considered in the estimation of total
cost. It has been concluded that, structured packing offers the best economically viable
solution in both cases. But, it is important to look into the effect of cost components that
contributed to the total cost estimate.
Figure 5-4 and Figure 5-5 clearly show this difference. According to the analysis we can
clearly say that, for both cases, traditional structured packings allow reducing the operating
costs considerably compared with common traditional random packings. On the other hand,
the investment cost for the structured packings is very high compared with the random
packing. That is because of their high volumetric costs. Therefore, it is important to consider
the long term operation and also the conditions of the application according to the pressure
drop requirement.
8.2.3 Dependence on correlations
There is large number of hydrodynamics and mass transfer correlations are available in
literature for both structured and randomly packed column, where few of them have been used
in this optimization analysis too. They are built on a wide range of experimental data and
theoretical principles, and they have different accuracies, limitations, and range of
applicability. According to literature, these correlations for structured packing have been
developed base on small experimental setups. Therefore, it is important to mention that, there
is some uncertainty associated with using these correlations for the cost estimations for large
scale applications, like what is done in this thesis work.
8.3 Optimizing the column diameter
Absorber diameter is one of the major parameters which have been used to optimize the
process in this study. It is obvious that, increased column diameter will greatly reduce packing
height and then the pressure drop by reducing the investment for the packing and also the
operating costs for the flue gas blower etc. But, there are some limitations in over increasing

84
the column diameter such as poor mass transfer within the column and mainly with the
structural instabilities. It is true that, the number of trains can be increased to achieve higher
CO2 removal for a given flue gas flow rate. But, that does not help to reduce the overall cost.
The current trend to overcome this issue is the designing of absorption columns with square
or rectangular geometries. This has been currently on experimental level and it will be a very
big achievement for the frontiers in mass transfer equipment designing to overcome the
barriers in large scale CO2 capture. But, it is clear that an improved and cheaper packing
material or a simpler absorber could reduce the cost of the overall equipment significantly.
8.4 Results from the HYSYS simulations
The HYSYS simulations were performed with the intentions of getting familiar with Aspen
HYSYS and also to get support for the CFD simulations with the data. The required task was
successfully simulated by achieving the required CO2 removal of 85%. Even though only the
absorption column is considered in the simulation according to the given task in this thesis, a
more precise cost optimization can be performed for a whole CO2 capture process and an
Aspen HYSYS simulation will be more useful for that type of situation.
8.5 CFD analysis of gas distribution
The 3D, single phase simulations performed in ANSYS FLUENT were useful to see the
effect of gas velocity and pressure drop for the initial gas mal-distribution within the packed
columns.
8.5.1 Pressure drop profiles
Even though the pressure drop profiles for all the simulations look qualitatively similar in
color schemes (Refer Figure 7-3), the total pressure drops through the columns are different in
magnitude as seen from the Table 8-3.
Table 8-3:Total pressure drop through the column for the FLUENT simulations
Simulation case Total pressure drop [bar]
Reduced scale geometry A 0.0300
B 0.0075
C 0.0045
D 0.0011
Real scale geometry - 0.0060

85
It can be seen that the total pressure drop has been reduced when the defined pressure drop
and the gas velocity are reduced in the simulation settings. According to the results, the sub
case C and D shows very clear trends of initial gas mal-distribution profiles which is also
shown by the very low pressure drops as mentioned in the above table.
8.5.2 Velocity profiles and gas distribution
The initial gas mal-distribution could be easily observable from the velocity vector profiles
shown in Figure 7-9 to Figure 7-12. If a clear even distribution velocity vector profile
originated from the bottom layer of packing is considered as the reference, the deviation of
the obtained results from the reference can be mentioned as in Table 8-4.
Table 8-4:Deviation from the even distribution in FLUENT simulations
Simulation case Deviation from the even distribution
Reduced scale geometry A 5%
B 15%
C 25%
D 40%
Real scale geometry - 10%
These results clearly depict the source of initial gas mal-distribution as the low gas velocities
and low pressure drops through the packed bed of an absorption column. Hence it is important
to note that, there are some restrictions within structured packing of operating in very low
pressure drops, even though that helps to reduce the operating cost significantly. Attention
must be paid about the overall efficiency and the CO2 removal target also when designing an
absorption column for a post combustion CO2 capture plant.

86
9 Conclusion
Increased GHG problem has become a widely discussing topic among the governments and
relevant authorities around the world. CO2 capture and storage is considered as a remedy for
this issue, since CO2 is the largest potential contributor for the GHG effect. Power plants
based on fossil fuels account for a large amount of CO2 emissions into the atmosphere.
Among the many possible techniques of CO2 capturing, post combustion capture using MEA
as the solvent is widely used. It is considered as the most technically viable solution among
the others. But, the cost associated with it is very high and still the engineers have lot to do in
the area of optimization of the process in order to minimize the capital and operating costs.
Absorption unit is one of the main contributors to increase the cost associated with CO2
capture and hence, the main aim of this thesis work was to discuss about the optimization of
different design parameters regarding to the absorption unit.
Challenges when capturing CO2 in post combustion applications using absorption technology
are the size of the columns and column internals, the pressure drop requirements to save
operating costs, and the overall cost of the packing and internals. This paper addresses these
challenges and the following conclusions can be drawn from this:
Structured packing offers the best solution for the absorption process. Even though the
investment cost for the structured packing is higher compared with the random
packing, utilization of structured packing is economical in this type of long term, low
pressure drop applications.
Among the different traditional structured packing types, Sulzer Mellapak 250Y which
has been used in the current analysis can contribute to a cost optimized solution
considering investment and operating costs when designing post combustion
absorbers. The minimized material requirement, the low pressure drop and the high
effective interfacial area offered by Mellapak 250Y are the main performance
characteristics for that conclusion.
According to the values reported in the literature, a pressure drop with the order of
magnitude 0.1 bar is the optimum for the smooth operation of an absorption column.
This could be confirmed form the CFD analysis that a pressure drop of 0.1 bar resulted
with an even distribution within the packed bed.
The optimization analysis mainly indicates that, the gas velocity for large scale CO2
capturing absorption columns with structured packing is in the order of magnitude 2.0
– 2.5m/s, based on some assumptions.
Effective interfacial areas of different packings play an important role in determining
the column height which will indirectly affect the capital and operating costs.

87
With some assumptions, a gas velocity of 2.0 m/s seems to be the optimum value to
have when the column is filled with Mellapak 250Y than it is filled with 1” Pall Rings.
With some other assumptions, a gas velocity of 2.5 m/s seems to be the optimum value
to have when the column is filled with Mellapak 250Y than it is filled with 2” Pall
Rings.
When comparing 1” and 2” metal Pall Rings, 2” Pall Rings show a better performance
in reduced pressure drops and low cost.
For an optimized design of an absorption column, the possibility of increasing the size
of the absorber in terms of diameter is limited since then poor mass transfer and
structural instabilities may occur.
Square or rectangular geometries for the absorber tower is one of the remarkable
technological advancements in the current industry to overcome the diameter
enlargement limitation.
Most of the proposed correlations in literature are not verified for large scale CO2
capture processes, and their application for large scale power plants which ranges
outside the domain of the tested correlations can lead to sizeable errors and deviations.
Therefore, more research work is required to standardize the models and to validate
them for large column diameter applications.
Aspen HYSYS simulations are very helpful to gain a good understanding about the
CO2 capture process and also to acquire necessary data for other simulations.
CFD is a versatile tool for the prediction and testing of initial gas / liquid mal-
distribution within the packed columns.
The simulations done using ANSYS FLUENT showed that, low gas velocities and low
pressure drops within the absorption columns will lead to initial gas mal-distribution
within the packed beds.
9.1 Recommendations for Future Work
Even though the scope of this study has been limited to few parameters, further
optimization of the process would be achieved by considering some other parameters
such as absorption column temperature, packing height etc., related to the absorption
columns occupied in post combustion CO2 capture.
The optimization analysis is only based on the three types of traditional packings,
namely 1” & 2” Pall Rings as random packing and Mellapak 250Y as structured
packing. This can be extended further by in-cooperating some other types of packings
also to check the most economically viable packing type with the optimum design
parameters.

88
But it has to be mentioned here that there are some newly invented random and
structured packing types available in the current marked even with lower pressure
drops than Mellapak 250Y forms. But their costs may vary in a larger span and only
traditional packing types are considered for this analysis.
CFD simulations can be extended further with advanced settings to define the detailed
information of packing characteristics rather than defining the packing region as a
porous zone.
The CFD model can be modified to see the two phase flow within the packed column
where liquid and gas phases move counter currently.
Furthermore, the scope of this cost estimation has been limited to the absorption unit
in the capture plant. Performing a detailed cost analysis of the capture process by
including equipment costs, CO2 compression system, solvent re-claimer, solvent waste
handling system will provide more accurate estimate of the total cost of the capture
plant and also the optimum parameters based on the overall perspective of the capture
plant.
89
References
ABU-ZAHRA, M. R. M., NIEDERER, J. P. M., FERON, P. H. M. & VERSTEEG, G. F. 2007a. CO2 capture from power plants: Part II. A parametric study of the economical performance based on mono-ethanolamine. International Journal of Greenhouse Gas Control, 1, 135-142.
ABU-ZAHRA, M. R. M., SCHNEIDERS, L. H. J., NIEDERER, J. P. M., FERON, P. H. M. & VERSTEEG, G. F. 2007b. CO2 capture from power plants: Part I. A parametric study of the technical performance based on monoethanolamine. International Journal of Greenhouse Gas Control, 1, 37-46.
ALIE, C. F. 2004. CO2 capture with MEA: integrating the absorption process and steam cycle of an existing coal-fired power plant. University of Waterloo.
ALIX, P. & RAYNAL, L. 2008. Liquid distribution and liquid hold-up in modern high capacity packings. Chemical Engineering Research and Design, 86, 585-591.
ALIX, P. & RAYNAL, L. 2009. Pressure drop and mass transfer of a high capacity random packing. Application to CO2 post-combustion capture. Energy Procedia, 1, 845-852.
ARACHCHIGE, U. S. P. & MELAAEN, M. C. 2012. Selection of packing materials for gas absorption. European Journal of Scientific Research, 87, 117-126.
AROONWILAS, A., CHAKMA, A., TONTIWACHWUTHIKUL, P. & VEAWAB, A. 2003. Mathematical modelling of mass-transfer and hydrodynamics in CO< sub> 2</sub> absorbers packed with structured packings. Chemical Engineering Science, 58, 4037-4053.
AROONWILAS, A. & VEAWAB, A. 2004. Characterization and comparison of the CO2 absorption performance into single and blended alkanolamines in a packed column. Industrial & engineering chemistry research, 43, 2228-2237.
AROONWILAS, A., VEAWAB, A. & TONTIWACHWUTHIKUL, P. 1999. Behavior of the mass-transfer coefficient of structured packings in CO2 absorbers with chemical reactions. Industrial & engineering chemistry research, 38, 2044-2050.
ATAKI, A. 2006. Wetting of Structured Packing Elements-CFD and Experiment.
BILLET, R. & FULLARTON, J. W. 1995. Packed towers: in processing and environmental technology, VCH.
BILLET, R. & SCHULTES, M. 1999. Prediction of mass transfer columns with dumped and arranged packings: Updated summary of the calculation method of Billet and Schultes. Chemical Engineering Research and Design, 77, 498-504.
BISHNOI, S. & ROCHELLE, G. T. 2000. Absorption of carbon dioxide into aqueous piperazine: reaction kinetics, mass transfer and solubility. Chemical Engineering Science, 55, 5531-5543.
BOZZUTO, C. R., NSAKALA, Y. N., LILJEDAHL, G. N., PALKES, M., MARION, J. L., VOGEL, D. & GUPTA, J. C. 2001. Engineering feasibility and economics of CO2 capture on an existing coal fired power plant. Ohio Department of Development
BRAVO, J., ROCHA, J. & FAIR, J. 1985. Mass transfer in gauze packings. Hydrocarbon Processing, 64, 91-95.
BRUNAZZI, E., NARDINI, G. & PAGLIANTI, A. 2002. An economical criterion for packed absorption column design. Chemical and biochemical engineering quarterly, 16, 199-206.
90
CHAKMA, A., MEHROTRA, A. K. & NIELSEN, B. 1995. Comparison of chemical solvents for mitigating CO2 emissions from coal-fired power plants. Heat Recovery Systems and CHP, 15, 231-240.
CHANG, F.-Y., CHAO, K.-J., CHENG, H.-H. & TAN, C.-S. 2009. Adsorption of CO2 onto amine-grafted mesoporous silicas. Separation and Purification Technology, 70, 87-95.
CHAPEL, D. G., MARIZ, C. L. & ERNEST, J. Recovery of CO2 from flue gases: commercial trends. Canadian Society of Chemical Engineers Annual Meeting, 1999. 1-16.
CHEN, J., LIU, C., YUAN, X. & YU, G. 2009. CFD simulation of flow and mass transfer in structured packing distillation columns. Chinese Journal of Chemical Engineering, 17, 381-388.
CHIESA, P. & CONSONNI, S. 1999. Shift reactors and physical absorption for low-CO2 emission IGCCs. Journal of engineering for gas turbines and power, 121, 295-305.
DAVE, N., DO, T., PUXTY, G., ROWLAND, R., FERON, P. H. M. & ATTALLA, M. I. 2009. CO2 capture by aqueous amines and aqueous ammonia–A Comparison. Energy Procedia, 1, 949-954.
DAVISON, J. 2007. Performance and costs of power plants with capture and storage of CO2. Energy, 32, 1163-1176.
DE BRITO, M. H., VON STOCKER, U. & BOMIO, P. 1992. Predicting the Liquid Phase Mass Transfer Coefficient—k L—for the Sulzer Structured Packing Mellapak. L Chem. E. syrup, ser, B137-B144.
DE KOEIJER, G., ENGE, Y., SANDEN, K., GRAFF, O. F., FALK-PEDERSEN, O., AMUNDSEN, T. & OVERÅ, S. 2011. CO2 Technology Centre Mongstad–Design, functionality and emissions of the amine plant. Energy Procedia, 4, 1207-1213.
DESIDERI, U. & PAOLUCCI, A. 1999. Performance modelling of a carbon dioxide removal system for power plants. Energy Conversion and Management, 40, 1899-1915.
DUSS, M., MEIERHOFER, H. & BOMIO, P. Comparison between random and structured packings and a model to predict the efficiency of structured packing in distillation and absorption applications. INSTITUTION OF CHEMICAL ENGINEERS SYMPOSIUM SERIES, 1997. HEMSPHERE PUBLISHING CORPORATION, 439-452.
DUSS, M. & MENON, A. 2010. Optimized absorber design for post combustion CCS.
FALK-PEDERSEN, O., GRØNVOLD, M. S., NØKLEBY, P., BJERVE, F. & SVENDSEN, H. F. 2005. CO2 capture with membrane contactors. International journal of green energy, 2, 157-165.
FISHER, K. S., BEITLER, C., RUETER, C., SEARCY, K., ROCHELLE, G. & JASSIM, M. 2005. Integrating MEA regeneration with CO2 compression and peaking to reduce CO2 capture costs. [Accessed 07.02.2013].
FITZ, C. W., KUNESH, J. G. & SHARIAT, A. 1999. Performance of structured packing in a commercial-scale column at pressures of 0.02-27.6 bar. Industrial & engineering chemistry research, 38, 512-518.
FLUOR. 2005. CO2 Capture Study at Mongstad. [Accessed 27.03.2013].
FREGUIA, S. & ROCHELLE, G. T. 2003. Modeling of CO2 capture by aqueous monoethanolamine. AIChE Journal, 49, 1676-1686.
GLASSCOCK, D. A. 1990. Modeling and experimental study of CO2 absorption into aqueous alkanolamines. Doctor of Philosophy Doctoral Dissertation, University of Texas at Austin.

91
GREER, T. 2008. Modeling and simulation of post combustion CO2 capturing.
GUALITO, J., CERINO, F., CARDENAS, J. & ROCHA, J. 1997. Design method for distillation columns filled with metallic, ceramic, or plastic structured packings. Industrial & engineering chemistry research, 36, 1747-1757.
HAGHSHENAS FARD, M., ZIVDAR, M., RAHIMI, R., NASR ESFAHANI, M., AFACAN, A., NANDAKUMAR, K. & CHUANG, K. 2007. CFD simulation of mass transfer efficiency and pressure drop in a structured packed distillation column. Chemical engineering & technology, 30, 854-861.
HARUN, N., NITTAYA, T., DOUGLAS, P. L., CROISET, E. & RICARDEZ-SANDOVAL, L. A. 2012. Dynamic simulation of MEA absorption process for CO2 capture from power plants. International Journal of Greenhouse Gas Control, 10, 295-309.
HASSAN, S. N. 2005. Techno-economic study of CO2 capture process for cement plants. University of Waterloo Ontario.
HASSAN, S. N., DOUGLAS, P. L. & CROISET, E. 2007. Techno-Economic Study of CO2 Capture from an Existing Cement Plant Using MEA Scrubbing. International journal of green energy, 4, 197-220.
HERZOG, H. & FALK-PEDERSEN, O. The Kvaerner membrane contactor: lessons from a case study in how to reduce capture costs. Fifth International Conference on Greenhouse Gas Control Technologies, Cairns, Australia, August, 2000.
HUSSAIN, S., WEERASOORIYA, A., DAYARATHNA, S. & ZARSAV, M. 2012. Simulation and Cost Estimation of CO2 Capture from Aluminum Production. Telemark University College, Norway.
IEA 2012. Energy Technology Perspectives 2012; Pathways to Clean Energy System. In: WRÅKE, M. (ed.). Cadex 15, France: International Energy Agency.
KALLEVIK, O. B. 2010. Cost estimation of CO2 removal in HYSYS.
KAMIJO, T., IMAI, N., IIJIMA, M., TAKASHINA, T. & TANAKA, H. 2004. Recent technology development of KS1 CO2 recovery process. Available: http://www.netl.doe.gov/publications/proceedings/04/carbon-seq/038.pdf [Accessed 24.05.2013].
KARIMI, M., HILLESTAD, M. & SVENDSEN, H. F. 2011. Capital costs and energy considerations of different alternative stripper configurations for post combustion CO2 capture. Chemical Engineering Research and Design, 89, 1229-1236.
KLEMEŠ, J., BULATOV, I. & COCKERILL, T. 2007. Techno-economic modelling and cost functions of CO2 capture processes. Computers & Chemical Engineering, 31, 445-455.
KOOIJMAN, H., KRISHNAMURTHY, K. & BIDDULPHM, W. A new pressure drop model for structured packing. IChemE Symp Ser, 2002. A109-A123.
LEHNER, M. & HOFSTETTER, E. M. 2012. The Effect of the Material Thickness of Random Packing on Pressure Drop and Liquid Hold-Up in Random Packing Columns [Online]. RVT Process Equipment GmbH, Steinwiesen. Available: http://chemicalindustrysuppliersearch.com/companydetails.aspx?id=7526 [Accessed 21.02.2013.
LEIFSEN, H. 2007. Post-Combustion CO2 Capture Using Chemical Absorption: Minimizing Energy Requirement. Norwegian University of Science and Technology.
LITTEL, R., VERSTEEG, G. & SWAAIJ, W. V. 1991. Physical absorption into non-aqueous solutions in a stirred cell reactor. Chemical engineering science, 46, 3308-3313.
LOH, H., LYONS, J. & WHITE, C. 2002. Process Equipment Cost Estimation-Final Report. National Energy Technoloy Center, DOE/NETL-2002/1169.

92
MACKOWIAK, J. 2010. Fluid Dynamics of Packed Columns: Principles of the Fluid Dynamic Design of Columns for Gas/liquid and Liquid/liquid Systems, Springer.
MAĆKOWIAK, J. 2009. Extended channel model for prediction of the pressure drop in single-phase flow in packed columns. Chemical Engineering Research and Design, 87, 123-134.
MARIZ, C. 1998. Carbon dioxode recovery: Large scale design trends. Journal of Canadian Petroleum Technology, 37.
MENON, A. & DUSS, M. 2011. Mellapak CC and AYPlus DC structured packing for post combustion capture. IEAGHG 1st post combustion capture conference. Abu Dhabi, UAE.
MENON, A. & DUSS, M. 2012. Pushing the boundaries in process intensification. Available: http://www.sulzer.com/en/-/media/Documents/Cross_Division/STR/2011/STR_2011_2_e_14_Menon_e.pdf [Accessed 27.02.2013].
MEREL, J., CLAUSSE, M. & MEUNIER, F. 2006. Carbon dioxide capture by indirect thermal swing adsorption using 13X zeolite. Environmental progress, 25, 327-333.
MERKEL, T. C., LIN, H., WEI, X. & BAKER, R. 2010. Power plant post-combustion carbon dioxide capture: An opportunity for membranes. Journal of Membrane Science, 359, 126-139.
METZ, B., DAVIDSON, O., DE CONINCK, H., LOOS, M. & MEYER, L. 2005. IPCC special report on carbon dioxide capture and storage: Prepared by working group III of the intergovernmental panel on climate change. IPCC, Cambridge University Press: Cambridge, United Kingdom and New York, USA, 2.
MIMURA, T., NOJO, T., IIJIMA, M., YOSHIYAMA, T. & TANAKA, H. Recent developments in flue gas CO2 recovery technology. Greenhouse Gas Control Technologies: Proceedings of the 6th International Conference on Greenhouse Gas Control Technologies, 2002. 1057-1062.
MOHAMED ALI, A., JANSENS, P. & OLUJIĆ, Ž. 2003. Experimental characterization and
computational fluid dynamics simulation of gas distribution performance of liquid (re) distributors and collectors in packed columns. Chemical Engineering Research and Design, 81, 108-115.
MORES, P., RODRÍGUEZ, N., SCENNA, N. & MUSSATI, S. 2012. CO2 capture in power plants: Minimization of the investment and operating cost of the post-combustion process using MEA aqueous solution. International Journal of Greenhouse Gas Control, 10, 148-163.
MULET, A., CORRIPIO, A. & EVANS, L. 1981. Estimate costs of distillation and absorption towers via correlations. Chem. Eng., December, 28, 77-82.
NAIKE, P. 2013. High efficient mass transfer technology [Online]. Pingxiang Naike Chemical Industry Equipment Packing Co.,Ltd. Available: http://www.laiko.net/pdlistone/products/7117627.html [Accessed 01.03.2013.
NAKOV, S., KOLEV, N., LJUTZKANOV, L. & KOLEV, D. 2007. Comparison of the effective area of some highly effective packings. Chemical Engineering and Processing: Process Intensification, 46, 1385-1390.
ØI, L. E. Aspen HYSYS simulation of CO2 removal by amine absorption from a gas based power plant. The 48th Scandinavian Conference on Simulation and Modeling (SIMS 2007), 30-31 October, 2007, Göteborg (Särö), 2007. 73-81.
ØI, L. E. 2012. Removal of CO2 from exhaust gas.

93
ØI, L. E. & VOZNIUK, I. 2010. Optimizing CO2 absorption using split-stream configuration. Process and technologies for a sustainable enrgy. Ischia.
OLUJIÆ, B. K., JANSEN, H., RIETFORT, T., ZICH, E. & FREY, G. 2003. Distillation column internals/configurations for process intensification. Chemical Biochemical Engineering Quarterly, 17, 301-309.
OLUJIĆ, Ž., HAARING, J. & VAN BAAK, R. 2006. Effect of a severe form of initial gas maldistribution on pressure drop of a structured packing bed. Chemical Engineering and Processing: Process Intensification, 45, 1059-1064.
OWENS, S. A., PERKINS, M. R., ELDRIDGE, R. B., SCHULZ, K. W. & KETCHAM, R. A. 2013. Computational Fluid Dynamics Simulation of Structured Packing. Industrial & Engineering Chemistry Research, 52, 2032-2045.
PAVLENKO, A., PECHERKIN, N., CHEKHOVICH, V. Y., ZHUKOV, V. & SUNDER, S. 2009. Experimental study of the effect of maldistribution at the structured packing inlet on the freon mixture separation efficiency. Theoretical Foundations of Chemical Engineering, 43, 1-11.
PEETERS, A. N. M., FAAIJ, A. P. C. & TURKENBURG, W. C. 2007. Techno-economic analysis of natural gas combined cycles with post-combustion CO2 absorption, including a detailed evaluation of the development potential. International Journal of Greenhouse Gas Control, 1, 396-417.
PLAZA, J. M., WAGENER, D. V. & ROCHELLE, G. T. 2009. Modeling CO2 capture with aqueous monoethanolamine. Energy Procedia, 1, 1171-1178.
POLASEK, J., BULLIN, J. & DONNELLY, S. 1983. How to reduce costs in amine-sweetening units. Chem. Eng. Prog.;(United States), 79.
PORTER, K. E., ALI, Q. H., HASSAN, A. O. & ARYAN, A. F. 1993. Gas distribution in shallow packed beds. Industrial & engineering chemistry research, 32, 2408-2417.
RAO, A. B. & RUBIN, E. S. 2006. Identifying cost-effective CO2 control levels for amine-based CO2 capture systems. Industrial & engineering chemistry research, 45, 2421-2429.
RAO, A. B., RUBIN, E. S. & BERKENPAS, M. B. 2004. An integrated modeling framework for carbon management technologies. Department of Engineering and Public Policy, Pittsburgh, PA, 15213-3890.
RATNAM, G. V. & VARMA, Y. 1991. Effective interfacial area in gas-liquid cocurrent downflow through packed beds. Bioprocess Engineering, 7, 29-34.
RAYNAL, L. & ROYON-LEBEAUD, A. 2007. A multi-scale approach for CFD calculations of gas–liquid flow within large size column equipped with structured packing. Chemical Engineering Science, 62, 7196-7204.
RAZI, N., BOLLAND, O. & SVENDSEN, H. 2012. Review of design correlations for CO2 absorption into MEA using structured packings. International Journal of Greenhouse Gas Control, 9, 193-219.
ROCHA, J. A., BRAVO, J. L. & FAIR, J. R. 1993. Distillation columns containing structured packings: a comprehensive model for their performance. 1. Hydraulic models. Industrial & engineering chemistry research, 32, 641-651.
ROCHA, J. A., BRAVO, J. L. & FAIR, J. R. 1996. Distillation columns containing structured packings: a comprehensive model for their performance. 2. Mass-transfer model. Industrial & engineering chemistry research, 35, 1660-1667.
ROCHELLE, G. T. 2009. Amine scrubbing for CO2 capture. Science, 325, 1652-1654.
RUBIN, E. S., CHEN, C. & RAO, A. B. 2007. Cost and performance of fossil fuel power plants with CO2 capture and storage. Energy Policy, 35, 4444-4454.

94
SAHAY, B. & SHARMA, M. M. 1973. Effective interfacial area and liquid and gas side mass transfer coefficients in a packed column. Chemical Engineering Science, 28, 41-47.
SCHACH, M.-O., SCHNEIDER, R. D., SCHRAMM, H. & REPKE, J.-U. 2010. Techno-economic analysis of postcombustion processes for the capture of carbon dioxide from power plant flue gas. Industrial & Engineering Chemistry Research, 49, 2363-2370.
SCHOLES, C. A., KENTISH, S. E. & STEVENS, G. W. 2008. Carbon dioxide separation through polymeric membrane systems for flue gas applications. Recent Patents on Chemical Engineering, 1, 52-66.
SCHPIGEL, L. & MEIER, W. 1994. Performance characteristics of various types of MELLAPAK packings (productivity, pressure differential, and deficiency). Chemical and Petroleum Engineering, 30, 118-125.
SEIDER, W. D., SEADER, J. D. & LEWIN, D. R. 2009. Product & Process Design Principles: Synthesis, Analysis And Evaluation, (cd), John Wiley & Sons.
SIMMONDS, M., HURST, P., WILKINSON, M., WATT, C. & ROBERTS, C. A study of very large scale post combustion CO2 capture at a refining & petrochemical complex. Greenhouse Gas Control Technologies: Proceedings of the 6th International Conference on Greenhouse Gas Control Technologies, 2002. 39-44.
SINGH, D., CROISET, E., DOUGLAS, P. L. & DOUGLAS, M. A. 2003. Techno-economic study of CO2 capture from an existing coal-fired power plant: MEA scrubbing vs. O2/CO2 recycle combustion. Energy Conversion and Management, 44, 3073-3091.
SØNDERBY, T. L., CARLSEN, K. B., FOSBØL, P. L., KIØRBOE, L. G. & VON SOLMS, N. 2013. A new pilot absorber for CO2 capture from flue gases: Measuring and modelling capture with MEA solution. International Journal of Greenhouse Gas Control, 12, 181-192.
SPIEGEL, L. & MEIER, W. 2003. Distillation columns with structured packings in the next decade. Chemical Engineering Research and Design, 81, 39-47.
STICHLMAIR, J., BRAVO, J. & FAIR, J. 1989. General model for prediction of pressure drop and capacity of countercurrent gas/liquid packed columns. Gas Separation & Purification, 3, 19-28.
SUBRAMANIAN, K. & WOZNY, G. 2012. Analysis of Hydrodynamics of Fluid Flow on Corrugated Sheets of Packing. International Journal of Chemical Engineering, 2012.
TIERLING, S. 2006. Tierling Site [Online]. Available: http://tierling.home.texas.net/ [Accessed 01.03.2013.
TREYBAL, R. E. 1980. Mass-transfer operations, McGraw-Hill New York.
VOZNIUK, I. O. 2010. Aspen HYSYS process simulation and Aspen ICARUS cost estimation of CO2 removal plant.
WANG, C., PERRY, M., ROCHELLE, G. T. & SEIBERT, A. F. 2012. Packing Characterization: Mass Transfer Properties. Energy Procedia, 23, 23-32.
WANG, G., YUAN, X. & YU, K. 2005. Review of Mass-Transfer Correlations for Packed Columns*. Industrial & engineering chemistry research, 44, 8715-8729.
WEIMER, T. & SCHABER, K. 1997. Absorption of CO2 from the atmosphere as a method for the estimation of effective interfacial areas in packed columns. IChenE symp.ser, 417-427.
WEN, X., AKHTER, S., AFACAN, A., NANDAKUMAR, K. & CHUANG, K. 2007. CFD modeling of columns equipped with structured packings: I. Approach based on detailed packing geometry. Asia‐Pacific Journal of Chemical Engineering, 2, 336-344.

95
WIGGINS, W. R. J. & BIXLER, R. L. 1983. Sources, recovery and transportation of CO2. Journal Name: Energy Prog.; (United States); Journal Volume: 3:3, Medium: X; Size: Pages: 132-134.
WILSON, I. D. 2004. Gas-liquid contact area of random and structured packing. The University of Texas at Austin.
YAGI, T., SHIBUYA, H. & SASAKI, T. 1992. Application of chemical absorption process to CO2 recovery from flue gas generated in power plants. Energy Conversion and Management, 33, 349-355.
YIN, F., SUN, C., AFACAN, A., NANDAKUMAR, K. & CHUANG, K. 2000. CFD modeling of mass-transfer processes in randomly packed distillation columns. Industrial & engineering chemistry research, 39, 1369-1380.
YU, C.-H., HUANG, C.-H. & TAN, C.-S. 2012. A Review of CO2 Capture by Absorption and Adsorption. Aerosol Air Qual. Res, 12, 745-769.
ZAKERI, A., EINBU, A. & SVENDSEN, H. F. 2012. Experimental investigation of pressure drop in structured packings. Chemical Engineering Science, 73, 285-298.
ZHANG, L.-H., ZHOU, H.-Y., LI, A.-G. & DU, Y.-P. 2004. CFD Analysis of Gas Distributor in Packed Column Prediction of Gas Flow and Effect of Tower Internals Geometrv Structure. Transactions of Tianjin University, 10, 270-274.
ZHAO, X., SMITH, K. H., SIMIONI, M. A., TAO, W., KENTISH, S. E., FEI, W. & STEVENS, G. W. 2011. Comparison of several packings for CO2 chemical absorption in a packed column. International Journal of Greenhouse Gas Control, 5, 1163-1169.
ZIAII, S., ROCHELLE, G. T. & EDGAR, T. F. 2011. Optimum design and control of amine scrubbing in response to electricity and CO2 prices. Energy Procedia, 4, 1683-1690.

96
Appendices
Appendix 1: Project description
Appendix 2: Correction for the height based on effective interfacial area
Appendix 3: Pressure drop calculation snap shots for Random packing using Tierling
calculator
Appendix 4: Script codes for the CFD simulation (Simulations with real scale simulations)

97
Appendix 1: Project description

98

99
Appendix 2: Correction for the height based on effective
interfacial area
ggas vAV .............................(1)
lliquid vAV .............................(2)
HAV .................................(3)
efftotal aHAA )( ...................(4)
In other words, efftotal aVA )(
In this calculation Gas volume flow rate( gasV ), liquid voulme flow rate ( liquidV ) and the total
area of the column ( totalA ) are assumed constants.
Calculation of effective interfacial area ( effa ) for the base case (where gv = 2.5 m/s):
gasV = 3102547 h
m3
(constant)
gv = 5.2 s
m
25.2 283)( m
v
VA
g
gas
.......[From Equation (1) ]
mD 0.19)( 5.2
5.2)(H = m10 (Assumed)
Assume, s
mvl 0041.0
lliquid vAV 5.2)( ...............[From Equation (2)]
= 283 0041.02 m s
m
= 16.1 s
m3
= 08.4177 h
m3
(constant)
According to the Figure 5-1, 86.0)( 5.2 effa 3
2
m
m

100
Calculation of effective interfacial area ( effa ) for the gas velocity gv = 3.0 m/s and thus
the height of the column:
0.3gv s
m
0.3,0.3)( ggas vAV ....................(i)
0.3,0.3)( lliquid vAV .................(ii)
5.2,5.2)( lliquid vAV .................(iii)
5.2,5.2)( lvA 0.3,0.3)( lvA [Since (ii) = (iii)]
5.2,5.2)( lvA 0.3,0.3,
lg
gas vv
V
[From equation (i)]
Therefore, 0.3,lv 5.2,
0.3,5.2,
g
gl v
vv
0.3,lv 00492.0 s
m
According to the Figure 5-1, 94.0)( 0.3 effa 3
2
m
m
Therefore, the new cross sectional area can be calculated as;
0.3)(A 0.3,
5.2,5.2)(
l
l
v
vA (Since equation (ii) = (iii) )
sm
smm
/00492.0
/0041.0283 2
83.235 2m
For the new height,
From Equation (4);
totalA 5.25.2 )( effaV ...........(iv)
totalA 0.30.3 )( effaV .............(v)
0.3V 0.3
5.25.2 )(
)(
eff
eff
a
aV [Since (iv) = (v)]
0.30.3 HA 0.3
5.25.25.2 )(
)(
eff
eff
a
aHA
0.3H 0.3
5.2
0.3
5.25.2 )(
)(
eff
eff
a
a
A
AH

101
0.3H
94.0
86.0
83.235
28310
0.3H 97.10 m
Calculation of effective interfacial area ( effa ) for the gas velocity gv = 2.0 m/s and thus
the height of the column:
0.2gv s
m
0.2,0.2)( ggas vAV ....................(vi)
0.2,0.2)( lliquid vAV ..................(vii)
5.2,5.2)( lliquid vAV ..................(viii)
5.2,5.2)( lvA 0.2,0.2)( lvA [Since (vii) = (viii)]
5.2,5.2)( lvA 0.2,0.2,
lg
gas vv
V
[From equation (vi)]
Therefore, 0.2,lv 5.2,
0.2,5.2,
g
gl v
vv
0.2,lv 00328.0 s
m
According to the Figure 5-1, 78.0)( 0.2 effa 3
2
m
m
Therefore, the new cross sectional area can be calculated as;
0.2)(A 0.2,
5.2,5.2)(
l
l
v
vA [Since equation (vii) = (viii) ]
sm
smm
/00328.0
/0041.0283 2
78.353 2m
For the new height,
totalA 5.25.2 )( effaV ...........(ix)
totalA 0.20.2 )( effaV ............(x)
0.2V 0.2
5.25.2 )(
)(
eff
eff
a
aV [Since (ix) = (x)]

102
0.20.2 HA 0.2
5.25.25.2 )(
)(
eff
eff
a
aHA
0.2H 0.2
5.2
0.2
5.25.2 )(
)(
eff
eff
a
a
A
AH
0.2H
78.0
86.0
78.353
28310
0.2H 82.8 m

103
Appendix 3: Pressure drop calculation snap shots for
Random packing using Tierling calculator
Pressure drop calculations for Case 1:
Gas velocity = 2.0 m/s
Gas velocity = 2.5 m/s (Base Case)
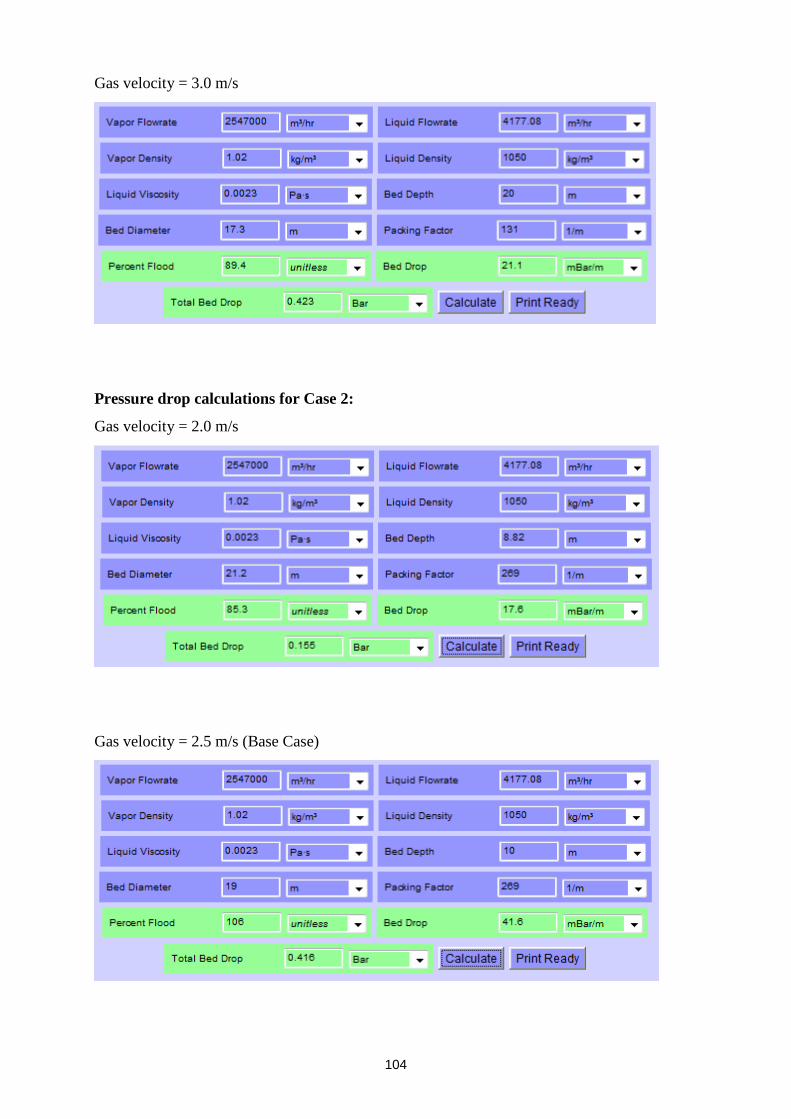
104
Gas velocity = 3.0 m/s
Pressure drop calculations for Case 2:
Gas velocity = 2.0 m/s
Gas velocity = 2.5 m/s (Base Case)

105
Gas velocity = 3.0 m/s

106
Appendix 4: Script codes for the CFD simulation
(Simulations with real scale simulations)
FLUENT
Version: 3d, dp, pbns, ske, transient (3d, double precision, pressure-
based, standard k-epsilon, transient)
Release: 13.0.0
Models
------
Model Settings
----------------------------------------------------------------
Space 3D
Time Unsteady, 1st-Order Implicit
Viscous Standard k-epsilon turbulence model
Wall Treatment Standard Wall Functions
Heat Transfer Disabled
Solidification and Melting Disabled
Species Disabled
Coupled Dispersed Phase Disabled
NOx Pollutants Disabled
SOx Pollutants Disabled
Soot Disabled
Mercury Pollutants Disabled
Material Properties
-------------------
Material: aluminum (solid)
Property Units Method Value(s)
---------------------------------------------------
Density kg/m3 constant 2719
Cp (Specific Heat) j/kg-k constant 871
Thermal Conductivity w/m-k constant 202.4
Material: gas (fluid)
Property Units Method Value(s)
-------------------------------------------------------------------
Density kg/m3 constant 1.1799999
Cp (Specific Heat) j/kg-k constant 1006.43
Thermal Conductivity w/m-k constant 0.0242
Viscosity kg/m-s constant 1.8999999e-05
Molecular Weight kg/kgmol constant 28.966
Thermal Expansion Coefficient 1/k constant 0
Speed of Sound m/s none #f
Cell Zone Conditions
--------------------
Zones
name id type
-----------------------
fluid 2 fluid
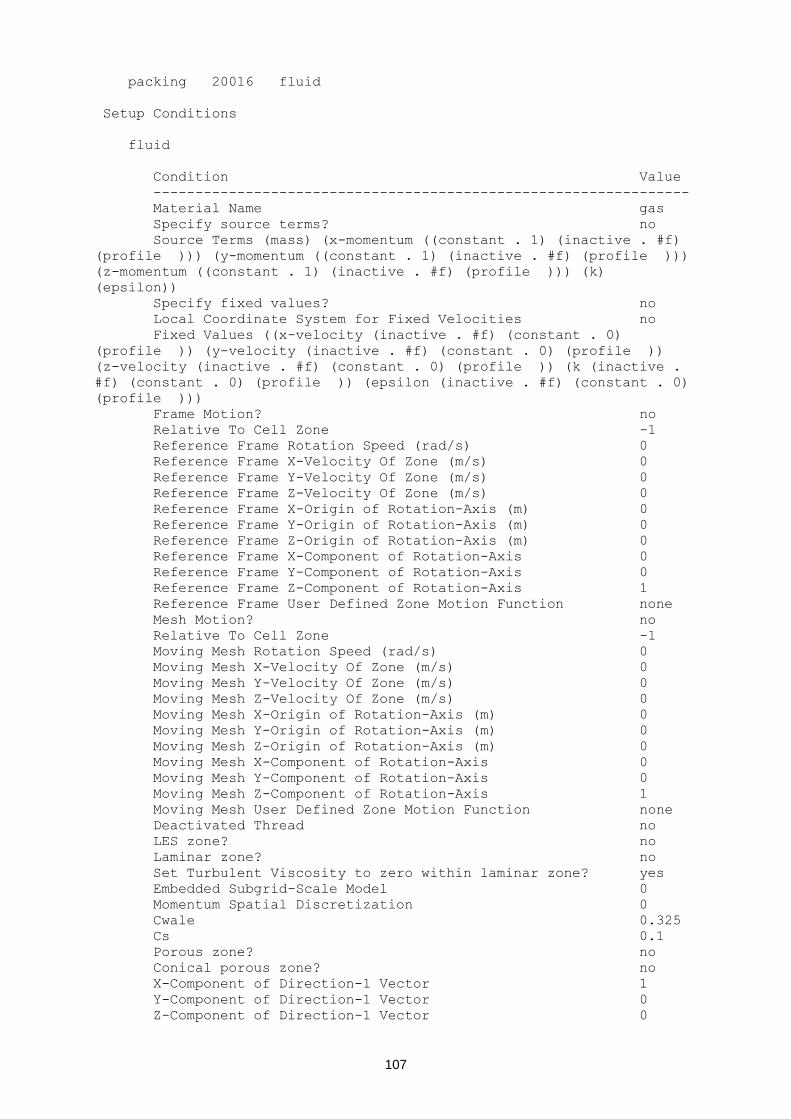
107
packing 20016 fluid
Setup Conditions
fluid
Condition Value
----------------------------------------------------------------
Material Name gas
Specify source terms? no
Source Terms (mass) (x-momentum ((constant . 1) (inactive . #f)
(profile ))) (y-momentum ((constant . 1) (inactive . #f) (profile )))
(z-momentum ((constant . 1) (inactive . #f) (profile ))) (k)
(epsilon))
Specify fixed values? no
Local Coordinate System for Fixed Velocities no
Fixed Values ((x-velocity (inactive . #f) (constant . 0)
(profile )) (y-velocity (inactive . #f) (constant . 0) (profile ))
(z-velocity (inactive . #f) (constant . 0) (profile )) (k (inactive .
#f) (constant . 0) (profile )) (epsilon (inactive . #f) (constant . 0)
(profile )))
Frame Motion? no
Relative To Cell Zone -1
Reference Frame Rotation Speed (rad/s) 0
Reference Frame X-Velocity Of Zone (m/s) 0
Reference Frame Y-Velocity Of Zone (m/s) 0
Reference Frame Z-Velocity Of Zone (m/s) 0
Reference Frame X-Origin of Rotation-Axis (m) 0
Reference Frame Y-Origin of Rotation-Axis (m) 0
Reference Frame Z-Origin of Rotation-Axis (m) 0
Reference Frame X-Component of Rotation-Axis 0
Reference Frame Y-Component of Rotation-Axis 0
Reference Frame Z-Component of Rotation-Axis 1
Reference Frame User Defined Zone Motion Function none
Mesh Motion? no
Relative To Cell Zone -1
Moving Mesh Rotation Speed (rad/s) 0
Moving Mesh X-Velocity Of Zone (m/s) 0
Moving Mesh Y-Velocity Of Zone (m/s) 0
Moving Mesh Z-Velocity Of Zone (m/s) 0
Moving Mesh X-Origin of Rotation-Axis (m) 0
Moving Mesh Y-Origin of Rotation-Axis (m) 0
Moving Mesh Z-Origin of Rotation-Axis (m) 0
Moving Mesh X-Component of Rotation-Axis 0
Moving Mesh Y-Component of Rotation-Axis 0
Moving Mesh Z-Component of Rotation-Axis 1
Moving Mesh User Defined Zone Motion Function none
Deactivated Thread no
LES zone? no
Laminar zone? no
Set Turbulent Viscosity to zero within laminar zone? yes
Embedded Subgrid-Scale Model 0
Momentum Spatial Discretization 0
Cwale 0.325
Cs 0.1
Porous zone? no
Conical porous zone? no
X-Component of Direction-1 Vector 1
Y-Component of Direction-1 Vector 0
Z-Component of Direction-1 Vector 0

108
X-Component of Direction-2 Vector 0
Y-Component of Direction-2 Vector 1
Z-Component of Direction-2 Vector 0
X-Component of Cone Axis Vector 1
Y-Component of Cone Axis Vector 0
Z-Component of Cone Axis Vector 0
X-Coordinate of Point on Cone Axis (m) 1
Y-Coordinate of Point on Cone Axis (m) 0
Z-Coordinate of Point on Cone Axis (m) 0
Half Angle of Cone Relative to its Axis (deg) 0
Relative Velocity Resistance Formulation? yes
Direction-1 Viscous Resistance (1/m2) 0
Direction-2 Viscous Resistance (1/m2) 0
Direction-3 Viscous Resistance (1/m2) 0
Choose alternative formulation for inertial resistance? no
Direction-1 Inertial Resistance (1/m) 0
Direction-2 Inertial Resistance (1/m) 0
Direction-3 Inertial Resistance (1/m) 0
C0 Coefficient for Power-Law 0
C1 Coefficient for Power-Law 0
Porosity 1
packing
Condition Value
----------------------------------------------------------------
Material Name gas
Specify source terms? no
Source Terms ((mass) (x-momentum) (y-momentum) (z-momentum) (k)
(epsilon))
Specify fixed values? no
Local Coordinate System for Fixed Velocities no
Fixed Values ((x-velocity (inactive . #f) (constant . 0)
(profile )) (y-velocity (inactive . #f) (constant . 0) (profile ))
(z-velocity (inactive . #f) (constant . 0) (profile )) (k (inactive .
#f) (constant . 0) (profile )) (epsilon (inactive . #f) (constant . 0)
(profile )))
Frame Motion? no
Relative To Cell Zone -1
Reference Frame Rotation Speed (rad/s) 0
Reference Frame X-Velocity Of Zone (m/s) 0
Reference Frame Y-Velocity Of Zone (m/s) 0
Reference Frame Z-Velocity Of Zone (m/s) 0
Reference Frame X-Origin of Rotation-Axis (m) 0
Reference Frame Y-Origin of Rotation-Axis (m) 0
Reference Frame Z-Origin of Rotation-Axis (m) 0
Reference Frame X-Component of Rotation-Axis 0
Reference Frame Y-Component of Rotation-Axis 0
Reference Frame Z-Component of Rotation-Axis 1
Reference Frame User Defined Zone Motion Function none
Mesh Motion? no
Relative To Cell Zone -1
Moving Mesh Rotation Speed (rad/s) 0
Moving Mesh X-Velocity Of Zone (m/s) 0
Moving Mesh Y-Velocity Of Zone (m/s) 0
Moving Mesh Z-Velocity Of Zone (m/s) 0
Moving Mesh X-Origin of Rotation-Axis (m) 0
Moving Mesh Y-Origin of Rotation-Axis (m) 0
Moving Mesh Z-Origin of Rotation-Axis (m) 0
Moving Mesh X-Component of Rotation-Axis 0

109
Moving Mesh Y-Component of Rotation-Axis 0
Moving Mesh Z-Component of Rotation-Axis 1
Moving Mesh User Defined Zone Motion Function none
Deactivated Thread no
LES zone? no
Laminar zone? no
Set Turbulent Viscosity to zero within laminar zone? yes
Embedded Subgrid-Scale Model 0
Momentum Spatial Discretization 0
Cwale 0.325
Cs 0.1
Porous zone? yes
Conical porous zone? no
X-Component of Direction-1 Vector 1
Y-Component of Direction-1 Vector 0
Z-Component of Direction-1 Vector 0
X-Component of Direction-2 Vector 0
Y-Component of Direction-2 Vector 1
Z-Component of Direction-2 Vector 0
X-Component of Cone Axis Vector 1
Y-Component of Cone Axis Vector 0
Z-Component of Cone Axis Vector 0
X-Coordinate of Point on Cone Axis (m) 1
Y-Coordinate of Point on Cone Axis (m) 0
Z-Coordinate of Point on Cone Axis (m) 0
Half Angle of Cone Relative to its Axis (deg) 0
Relative Velocity Resistance Formulation? yes
Direction-1 Viscous Resistance (1/m2) 1000000
Direction-2 Viscous Resistance (1/m2) 1000000
Direction-3 Viscous Resistance (1/m2) 1000000
Choose alternative formulation for inertial resistance? no
Direction-1 Inertial Resistance (1/m) 0
Direction-2 Inertial Resistance (1/m) 0
Direction-3 Inertial Resistance (1/m) 0
C0 Coefficient for Power-Law 0
C1 Coefficient for Power-Law 0
Porosity 0.95
Boundary Conditions
-------------------
Zones
name id type
----------------------------------
wall 4 wall
gas_out 7 pressure-outlet
gas_in 8 velocity-inlet
wall:009 20023 wall
Setup Conditions
wall
Condition Value
----------------------------------------------------------
Enable shell conduction? no
Wall Motion 0
Shear Boundary Condition 0
Define wall motion relative to adjacent cell zone? yes

110
Apply a rotational velocity to this wall? no
Velocity Magnitude (m/s) 0
X-Component of Wall Translation 1
Y-Component of Wall Translation 0
Z-Component of Wall Translation 0
Define wall velocity components? no
X-Component of Wall Translation (m/s) 0
Y-Component of Wall Translation (m/s) 0
Z-Component of Wall Translation (m/s) 0
Wall Roughness Height (m) 0
Wall Roughness Constant 0.5
Rotation Speed (rad/s) 0
X-Position of Rotation-Axis Origin (m) 0
Y-Position of Rotation-Axis Origin (m) 0
Z-Position of Rotation-Axis Origin (m) 0
X-Component of Rotation-Axis Direction 0
Y-Component of Rotation-Axis Direction 0
Z-Component of Rotation-Axis Direction 1
X-component of shear stress (pascal) 0
Y-component of shear stress (pascal) 0
Z-component of shear stress (pascal) 0
Specularity Coefficient 0
gas_out
Condition Value
---------------------------------------------------------
Gauge Pressure (pascal) 0
Backflow Direction Specification Method 1
Coordinate System 0
X-Component of Flow Direction 1
Y-Component of Flow Direction 0
Z-Component of Flow Direction 0
X-Component of Axis Direction 1
Y-Component of Axis Direction 0
Z-Component of Axis Direction 0
X-Coordinate of Axis Origin (m) 0
Y-Coordinate of Axis Origin (m) 0
Z-Coordinate of Axis Origin (m) 0
Turbulent Specification Method 0
Backflow Turbulent Kinetic Energy (m2/s2) 1
Backflow Turbulent Dissipation Rate (m2/s3) 1
Backflow Turbulent Intensity (%) 10
Backflow Turbulent Length Scale (m) 1
Backflow Hydraulic Diameter (m) 1
Backflow Turbulent Viscosity Ratio 10
is zone used in mixing-plane model? no
Radial Equilibrium Pressure Distribution no
Specify Average Pressure Specification no
Specify targeted mass flow rate no
Targeted mass flow (kg/s) 1
Upper Limit of Absolute Pressure Value (pascal) 5000000
Lower Limit of Absolute Pressure Value (pascal) 1
gas_in
Condition Value
--------------------------------------------------
Velocity Specification Method 2
Reference Frame 0
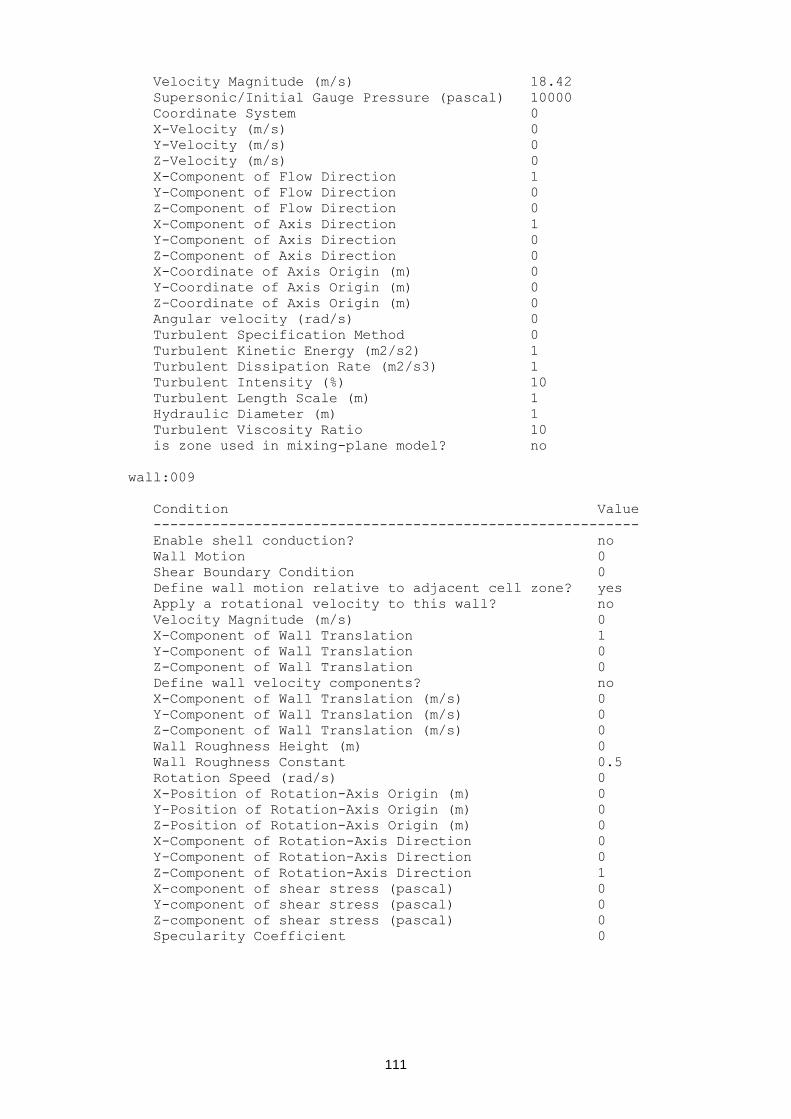
111
Velocity Magnitude (m/s) 18.42
Supersonic/Initial Gauge Pressure (pascal) 10000
Coordinate System 0
X-Velocity (m/s) 0
Y-Velocity (m/s) 0
Z-Velocity (m/s) 0
X-Component of Flow Direction 1
Y-Component of Flow Direction 0
Z-Component of Flow Direction 0
X-Component of Axis Direction 1
Y-Component of Axis Direction 0
Z-Component of Axis Direction 0
X-Coordinate of Axis Origin (m) 0
Y-Coordinate of Axis Origin (m) 0
Z-Coordinate of Axis Origin (m) 0
Angular velocity (rad/s) 0
Turbulent Specification Method 0
Turbulent Kinetic Energy (m2/s2) 1
Turbulent Dissipation Rate (m2/s3) 1
Turbulent Intensity (%) 10
Turbulent Length Scale (m) 1
Hydraulic Diameter (m) 1
Turbulent Viscosity Ratio 10
is zone used in mixing-plane model? no
wall:009
Condition Value
----------------------------------------------------------
Enable shell conduction? no
Wall Motion 0
Shear Boundary Condition 0
Define wall motion relative to adjacent cell zone? yes
Apply a rotational velocity to this wall? no
Velocity Magnitude (m/s) 0
X-Component of Wall Translation 1
Y-Component of Wall Translation 0
Z-Component of Wall Translation 0
Define wall velocity components? no
X-Component of Wall Translation (m/s) 0
Y-Component of Wall Translation (m/s) 0
Z-Component of Wall Translation (m/s) 0
Wall Roughness Height (m) 0
Wall Roughness Constant 0.5
Rotation Speed (rad/s) 0
X-Position of Rotation-Axis Origin (m) 0
Y-Position of Rotation-Axis Origin (m) 0
Z-Position of Rotation-Axis Origin (m) 0
X-Component of Rotation-Axis Direction 0
Y-Component of Rotation-Axis Direction 0
Z-Component of Rotation-Axis Direction 1
X-component of shear stress (pascal) 0
Y-component of shear stress (pascal) 0
Z-component of shear stress (pascal) 0
Specularity Coefficient 0
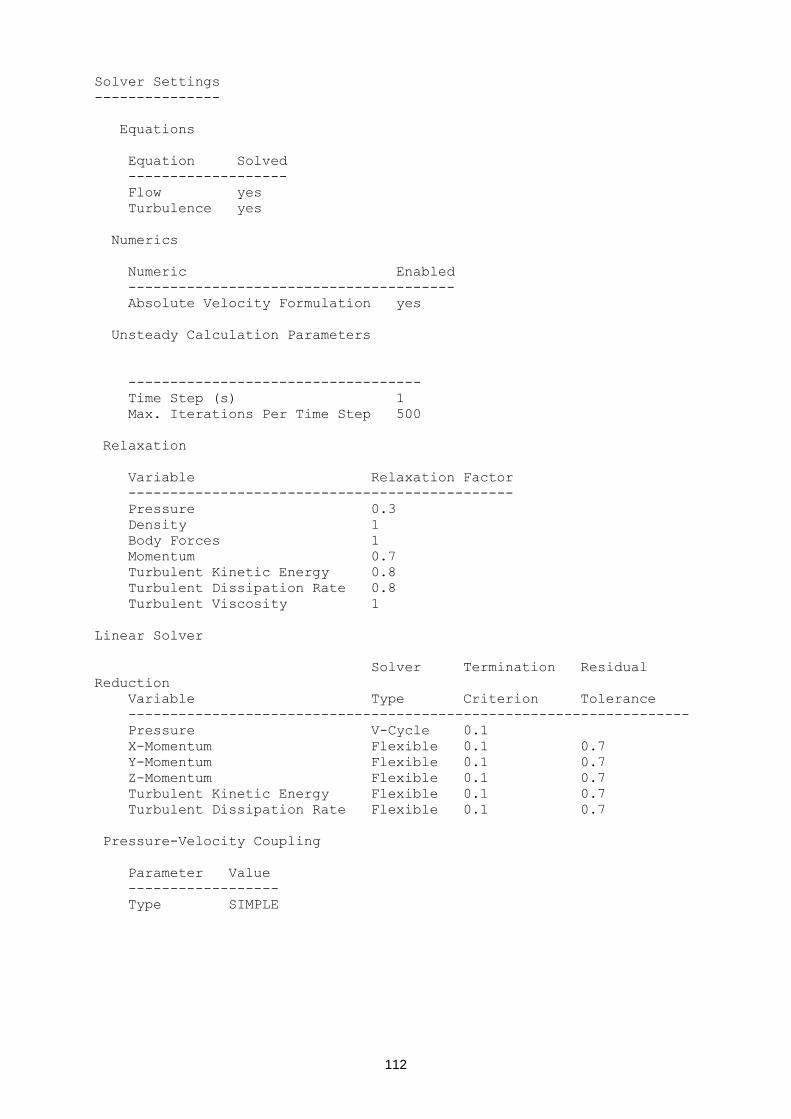
112
Solver Settings
---------------
Equations
Equation Solved
-------------------
Flow yes
Turbulence yes
Numerics
Numeric Enabled
---------------------------------------
Absolute Velocity Formulation yes
Unsteady Calculation Parameters
-----------------------------------
Time Step (s) 1
Max. Iterations Per Time Step 500
Relaxation
Variable Relaxation Factor
----------------------------------------------
Pressure 0.3
Density 1
Body Forces 1
Momentum 0.7
Turbulent Kinetic Energy 0.8
Turbulent Dissipation Rate 0.8
Turbulent Viscosity 1
Linear Solver
Solver Termination Residual
Reduction
Variable Type Criterion Tolerance
-------------------------------------------------------------------
Pressure V-Cycle 0.1
X-Momentum Flexible 0.1 0.7
Y-Momentum Flexible 0.1 0.7
Z-Momentum Flexible 0.1 0.7
Turbulent Kinetic Energy Flexible 0.1 0.7
Turbulent Dissipation Rate Flexible 0.1 0.7
Pressure-Velocity Coupling
Parameter Value
------------------
Type SIMPLE
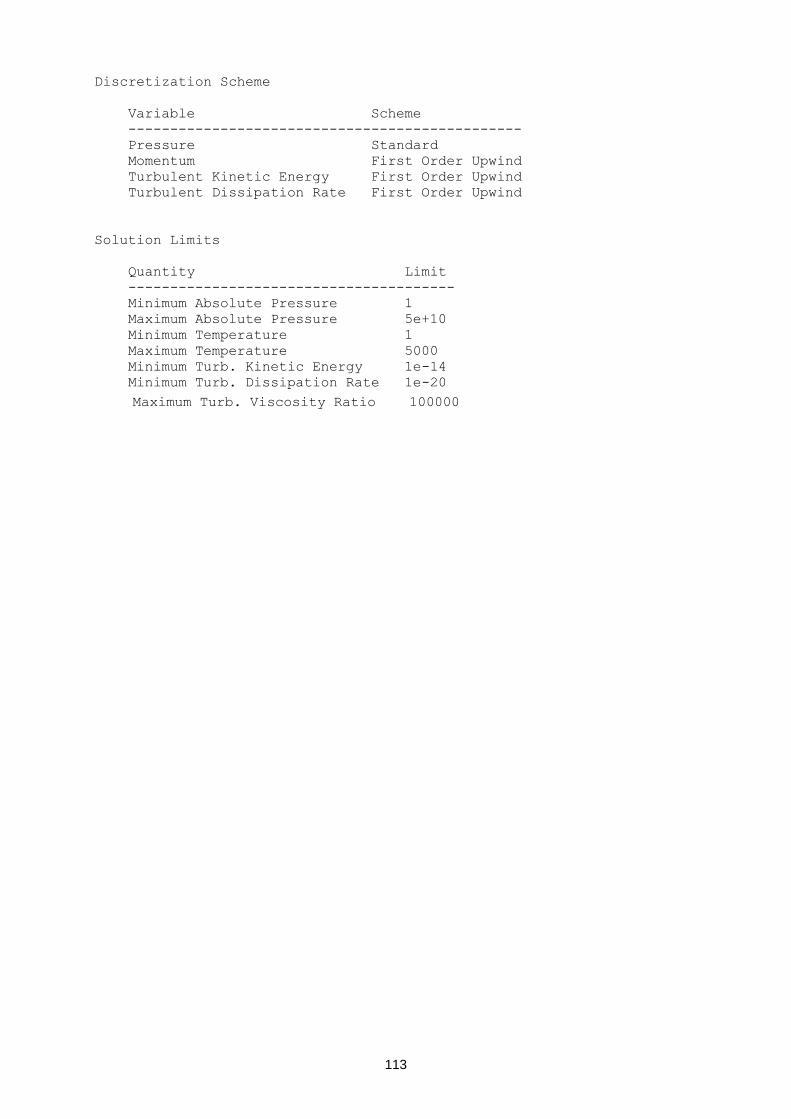
113
Discretization Scheme
Variable Scheme
-----------------------------------------------
Pressure Standard
Momentum First Order Upwind
Turbulent Kinetic Energy First Order Upwind
Turbulent Dissipation Rate First Order Upwind
Solution Limits
Quantity Limit
---------------------------------------
Minimum Absolute Pressure 1
Maximum Absolute Pressure 5e+10
Minimum Temperature 1
Maximum Temperature 5000
Minimum Turb. Kinetic Energy 1e-14
Minimum Turb. Dissipation Rate 1e-20
Maximum Turb. Viscosity Ratio 100000
Copyright © 2022 FDOKUMEN