FACTS Reports - OpenEdition Journals
144
-
Upload
khangminh22 -
Category
Documents
-
view
3 -
download
0
Transcript of FACTS Reports - OpenEdition Journals


is published by Veolia Environment Institute15 rue des Sablons, 75016 Paris – FRANCEinstitut.veolia.org/en/
ISSUING BODYFACTS Reports is published by VertigO on behalf of the Veolia Environment Institute. eISSN: 1867 – 8521
GRAPHIC DESIGNMonsieur KLes Éditions en environnement VertigOeditionsvertigo.org
PRINTED IN FRANCEPure Impression Printed on certified paper
© AUTHORS 2012 - 2013All the articles are distributed under the Creative Commons Attribution License.Authors keep their copyright but allow people to copy, distribute, transmit and adapt their work provided they are properly cited.www.creativecommons.org/licenses/
ACKNOWLEDGEMENTS
This Special Issue on Livelihoods could not exist without the outstanding support of the companies that are en-gaged in the fund and more broadly in the Livelihoods adventure. It could not exist without the members of the Livelihoods Network which have strongly contributed to this Livelihoods issue in sharing the learnings from their field experience.
We are also happy to pay tribute to our institutional partners that have brought so much to Livelihoods since its creation and play an important role in its development: IUCN (International Union for Conservation of Nature), the Ramsar Convention on Wetlands, The World Agroforestry Center (ICRAF), and many others. We also would like to make a special thank you to the French Fund For Global Environment (FFEM) that brings its support to the Livelihoods projects and the activities of the Livelihoods Network.
This Special Issue would not have been possible without the engagement and tenacity of the FACTS Reports team. We thank them very warmly for giving the Livelihoods Network this opportunity. Our thanks also go to all those who have contributed to improving the quality of the articles submitted, and especially the FACTS Reports editorial committee members.

3
ABOUT FACTS
In order to fight poverty across the world, FACTS (Field ACTions Science) has been de-veloping a pioneering concept, based on scientific reasoning, since 2007. It consists in publishing results of field practices to capitalise knowledge and to distribute innovative know-how acquired from experience.
Thus the journal, FACTS Reports, came into existence and aims to publish articles from field actors. It is an international and multidisciplinary journal which applies the scientific approach of peer review and validation. Since its creation in 2008, it has published over 200 articles covering projects on health, economy, education, agriculture and environ-ment. It also publishes thematic or geographic special issues, including:
• Access to Healthcare, Healthcare Funding and Performance• Brazil• Fighting Poverty, between Market and Gift• Migration and Health• Reconciling Poverty Eradication and Protection of the Environment• Urban Agriculture• Women’s and Children’s Health
FACTS has established a platform hosting the first scientifically organised community of field actors.
ABOUT LIVELIHOODS
Livelihoods is a carbon fund that invests in large scale projects of agroforestry, ecosys-tem restoration and access to rural energy. Investors in the fund are corporations that get certified carbon credits with high social and environmental value in return for their invest-ment. Since its creation end 2011, 8 corporations have joined Livelihoods: Danone, which initiated the fund, Crédit Agricole, Schneider Electric, Hermès, SAP, Voyageurs du Monde, CDC Climat, La Poste.
Livelihoods projects are implemented by rural communities with the support of field NGOs. They are designed to provide food security as well as revenue increase to the farmers and their families while contributing to maintain or restore biodiversity, water re-sources, soil organic fertility, etc. Livelihoods Fund has already invested in 6 major proj-ects which are impacting more than one million people. 130 million trees have been planted which will sequestrate 5-7 million Tons of CO2 on 20 years. Livelihoods business model is quite unique with up-front investment to allow poor communities pre-finance their project. A Livelihoods Charter defines the vision and the principles that guide the selection process and the way projects are managed.
In addition to the Livelihoods Fund, a capacity building and knowledge transfer organiza-tion was formed between field practitioners, experts, researchers and the private sector: Livelihoods Network Its mission is to foster innovation and develop tools and methodolo-gies that prove to be efficient in Livelihoods type projects. Companies are invited to bring their own expertise and participate to the co-creation process of the Livelihoods Network.
Consult FACTS Reports on line: factsreports.org

4 FACTS Reports

FACTS HONORARY BOARD
Hélène AHRWEILERPresident, University of EuropeFormer Rector, Paris Academy
Michèle BARZACHFormer French Minister of HealthPresident, UNICEF-France
Jean-Claude BERTHELEMYDean of the School of Economics, University Paris I, Panthéon SorbonneMember of the French Academy of Moral and Political Sciences
Philippe DOUSTE-BLAZYFormer French Minister of HealthChairman, Unitaid
François GROSHonorary Permanent Secretary, French Academy of Sciences
Mohamed HASSANFormer Executive Director Academy of Sciences for the developing world
Pierre Marc JOHNSONFormer Prime Minister of Quebec, Chief Negotiator in Canada-European trade talks
Bernard KOUCHNERFormer French MinisterFounder of Médecins Sans Frontières (Doctors without Borders)
Philippe KOURILSKYProfessor emeritus, Collège de FranceHonorary Director-General, Institut PasteurMember of the French Academy of Sciences
Federico MAYORFormer Director-General, UNESCOPresident, Foundation for a Culture of Peace
Rajendra PACHAURIChairman, Intergovernmental Panel on Climate Change (Nobel Peace Prize, 2007)Director-General, The Energy and Resources Institute
Peter PIOTFormer Executive Director of UNAIDSFormer UN Under-Secretary General
Mamphela RAMPHELEFormer Managing-Director, World BankFormer Vice-Chancellor, Cape Town University
Ellis RUBINSTEINPresident, New York Academy of SciencesPresident, Scientists without Borders
Amartya SENNobel Prize in Economic Sciences, 1998, “Lamont University Professor” and professor of Economics and Philosophy, Harvard University
Ismail SERAGELDINDirector, Library of AlexandriaFormer Vice President Special Programmes, World Bank
Elie WIESELPeace Nobel laureate
FACTS REPORTS EDITORIAL BOARD
Dr. Philippe KourilskyEditor-in-ChiefProfessor emeritus at the Collège de FranceMember of the French Academy of Sciences
Dr. David OjciusDeputy Editor-in-ChiefEditor-in-Chief / HealthProfessor, University of California, Merced
Dr. Henri Rouillé D’Orfeuil Editor-in-Chief / Agriculture and FoodFormer President of Coordination Sud
Dr. Jean-Claude BerthélemyEditor-in-Chief / EconomyDean of the School of Economics, University Paris I, Panthéon Sorbonne
Dr. Georges ValentisManaging DirectorVeolia Environment Institute
Agnès ChamayouEditorial Manager
Fabienne de GuillebonCoordinator of the Special Issue 7, Livelihoods
Acknowledgements to Christine Rodwell (societal relations Manager of Veolia Environnement) and Gisèle Le Cabellec who greatly contributed to the creation of this Special Issue.
5

A.C. Ventura et al: Policultura no semiárido brasileiro
BACK TO THE ROOTS Bernard Giraud p.08
FOREWORDUnbowed Wangari Maathai p.09
SECTION 1: THE MAJOR IMPORTANCE OF THE SOCIAL DIMENSION
COMMENTARY: Culture and Development, an experiment with empowerment Ganesh N. Devy Adivasi Academy of Tejgadh’s project p.13
Oceanium Dakar: The daily struggle for the integrated community-based protection of West Africa’s marine and coastal ecosystems Ismaila Sall and Guillaume Durin OCEANIUM’s project p.19
ALINIHA: Women leaders at the heart of sustainable development in West Africa Jean Goepp Aliniha’s project p.26
SECTION 2: CHALLENGES TOWARDS DEVELOPMENT
What if carbon was much more than just a funding mechanism? Bernard Giraud and Rémi Hemerick Livelihoods Fund’s and SOS Sahel’s projects p.33
Suppressed Demand and the Carbon Markets: Does development have to become dirty before it qualifies to become clean?Looking into Passive Solar Houses (PSH) Marina Gavaldão, William Battye, Mathieu Grapeloup and Yann François GERES’ project p.37
Carbon Intensification and Poverty Reduction in Kenya: lessons from the Kenya Agricultural Carbon Project Bo Lager and Timm Tennigkeit VI Agroforestry’s project p.45
Challenges of Community-Forestry Based Carbon Projects: Process, Participation, Performance Jean-Pierre Rennaud, Jack Ruitenbeek and Timm Tennigkeit Livelihoods Venture’s project p.53
The BipBop programme: Providing access to reliable, affordable and clean energy with a combined approach of investment, offers and training Gilles Vermot Desroches and Thomas André Schneider Electric’s project p.63
CONTENTS
6

A.C. Ventura et al: Policultura no semiárido brasileiro
7
CONTENTS
SECTION 3: SOLUTIONS TO FOREST ISSUES
How to restore dry forest ecosystems Jaime Nalvarte Aider’s project p.77
Community strategy for mangrove forest conservation: Conquista Campesina Conservation Easement Javier Rojas Garcias Pro Natura Sur’s project p.86
Scaling of mangrove afforestation with carbon finance to create significant impact on the biodiversity Ajanta Dey and Roy Chowdhury NEWS’ project p.100
SECTION 4: AGRICULTURAL PROJECTS WITH CO-BENEFITS
Forging a template for sustainable rural development – the Araku way David Hogg and Diana Joseph Naandi Foundation’s project p.115
Scaling up Agroforestry to Achieve Food Security and Environmental Protection among Smallholder Farmers in Malawi T.L. Beedy, O.C. Ajayi, G.W. Sileshi, G. Kundhlande, G. Chiundu and A.J. Simons ICRAF’s project p.125
Developing jatropha projects with smallholder farmersConditions for a sustainable win-win situation for farmers and the project developer Anne-Claire Degail and Julien Chantry Eco Carbone’s project p.131

Back to the roots
One of the most appalling paradoxes of our times is that more than three-quarters of the one billion human beings suffering from malnutrition are small farmers: those who are supposed to be feeding their fellow men haven’t enough to feed their own families. These small farmers, herders or fi shermen are for the most part terribly dependent on natural resources, from which they draw the majority of their own resources. In many cases, they have only their own bodily strength to rely on, occasionally supported by working animals. When the mangrove forests from which they catch the fi sh are destroyed, when the soil loses its fertility as a result of erosion, when deforestation leads to groundwater sources drying up, and when hurricanes ravage the dikes erected to protect their crops, the rural poor are impacted immediately and directly. For them, the deterioration of their ecosystem is a lot more than a conference discussion topic. For them, it means greater pov-erty, food insecurity and real uncertainty about the future.
© Author(s) 2013. This work is distributed under the Creative Commons Attribution 3.0 License.http://factsreports.revues.org/2673Published 19 April 2013
Nevertheless, there is now a growing movement un-derpinned by rural communities and local organisa-tions that aims to redress the balance by experimenting with a range of different eco-agricultural and ‘eco-in-tensive agricultural’ methods. This Livelihoods Special Issue of FACTS Reports points the way towards this new hope for the future: written by those actually in-volved in the projects, it witnesses the commitment shown by hundreds of villages in the Casamance area of Senegal and the Sundarbans of India, who have suc-ceeded in restoring life-supporting mangrove habitats on a very large scale. It gives a voice to organisations working in Kenya, Malawi, Congo and the high-alti-tude valleys of Araku in India to develop agroforestry systems that intelligently combine trees with crops, skilled livestock farming and the organic fertilisation of soils to rapidly increase the yield per hectare of small farming operations at very low investment cost. It tells of successful experiments in providing access to energy, with examples such as the large-scale distribu-tion of more effi cient cookers that reduce wood con-sumption and therefore deforestation.
The bottom line is that this Livelihoods’ Special Issue highlights a very simple thing that we must all take increasingly into account when making decisions, whether public or private, collective or individual: we all live on one planet, and everything that happens is interconnected. Throughout this revue, from the four corners of the world where they are taking direct action for change, the authors send us a series of strong mes-sages and help us to answer some of the most crucial questions for our shared futures: can we successfully feed a global population that will be approaching 9 bil-lion by 2050, without destroying what remains
of natural biodiversity and pure water resources and without accelerating climate change? Will it be possi-ble to keep alive the intimate and complex links be-tween rural societies, the earth and the natural cycles of life? Do we understand how to build a modern world inspired by the best of this heritage to invent forms of rural existence suited to today’s world, and which will make younger generations want to live off the land? How can we build win-win relationships between fast-growing cities and the countryside, with the markets of developed regions near and far, and between big busi-ness and rural communities?
The Livelihoods Fund set up by a number of com-mitted companies is another encouraging sign. By ap-plying the mechanisms of the carbon economy to proj-ects supported by rural communities and organisations capable of deploying them on a large scale, it has, in a very short time, enabled the delivery of projects whose economic, social and ecological impact will be very signifi cant. In addition to the Fund itself, the Livelihoods Network has also been set up to build ac-tive bridges between social entrepreneurs, NGOs, re-search bodies, companies and governments to acceler-ate the transfer of best practices, share expertise and encourage innovation. In short, to build an informal community of actors that think beyond geographic and institutional boundaries, share a single vision, have communal values and are all committed to taking ac-tion at grass roots level.
In re-reading the articles in this special issue, I could not help remembering a proverb that intrigued me as a child: “It is not necessary to hope in order to act.”. The authors of this revue are tireless actors driven by hope: it will be diffi cult to stop them.
Bernard GiraudCo-Founder and President of Livelihoods [email protected]
8 FACTS Reports

“Unbowed”
Wangari Maathai, Nobel Peace Prize winner (1940- 2011)
Abstract. In her autobiography, the late Wangari Maathai, founder of the Green Belt Movement and Nobel Peace Prize winner, talks about the village where she spent her childhood. Through her very personal and beautiful testimonial, Wangari allows us to capture the whole cycle of life, how water, plants, food and liveli-hoods are interconnected.
“Collecting fi rewood for the household was a frequent activ-ity and I would often help my mother do it. The country was dotted with hundreds of huge mĩgumo, or wild fi g trees, their bark the color of elephant skin and thick, gnarled branches...When my mother told me to go and fetch fi rewood, she would warn me, “Don’t pick any dry wood out of the fi g tree, or even around it.” “Why?” I would ask. “Because that’s a tree of God,” she’d reply. “We don’t use it. We don’t cut it. We don’t burn it.”...I later learned that there was a connection between the fi g tree’s root system and the underground water reservoirs. The roots burrowed deep into the ground, break-ing through the rocks beneath the surface soil and diving into the underground water table.
About two hundred yards from the fi g tree there was a stream named Kanungu, with water so clean and fresh that we drank it straight from the stream. As a child, I used to visit the point where the water bubbled up from the belly of the earth to form a stream...At the point where the stream came out of the ground, were planted arrowroots, and along the stream were banana plants, and sugarcane, which were typical food crops. Arrowroots, when cooked, provide a starchy tuber like potatoes, and grow only where there is a lot of water”. Wangari describes the village of her childhood, years later: “I noticed that the rivers would rush down the hillsides and along paths and roads when it rained, and that they were muddy with silt... “That is soil ero-sion,” I remember thinking to myself. I also observed that the cows were so skinny that I could count their ribs. There was little grass or other fodder for them to eat where they grazed, and dur-ing the dry season much of the grass lacked nutrients. The peo-ple, too, looked undernourished and poor and the vegetation in their fi elds was scanty. The soils in the fi elds weren’t performing as they should because their nutrient value had been depleted. Around the village, commercial trees had replaced indigenous forest. I noticed that much of the land that had been covered by trees, bushes, and grasses when I was growing up had been re-placed by tea and coffee. I also learned that someone had ac-quired the piece of land where the fi g tree I was in awe of as a child had stood. The new owner perceived the tree to be a nui-sance because it took up too much space and he felled it to make room to grow tea. By then I understood the connection between the tree and water, so it did not surprise me that when the fi g tree
was cut down, the stream where I had played with the tadpoles dried up. My children would never be able to play with the frogs’ eggs as I had or simply to enjoy the cool, clear water of that stream. Ironically, the area where the fi g tree of my childhood once stood always remained a patch of bare ground where noth-ing grew. It was as if the land rejected anything but the fi g tree itself...
At a seminar organized by the NCWK, a woman researcher presented the results of a study she had done, which found that children in the central region of Kenya were suffering from dis-eases associated with malnutrition. This was an eye-opener for me, since that is where I come from and I knew from personal experience that the central region was one of the most fertile in Kenya. But times had changed. Many farmers had converted practically all of their land into growing coffee and tea to sell in the international market. Consequently, women were feeding their families processed foods like white bread, maize fl our, and white rice, all of which are high in carbohydrates but relatively low in vitamins, proteins, and minerals. Cooking these foods consumed less energy than the foods I had eaten as a child, and this made them attractive and practical, because available fi re-wood for cooking was limited due to deforestation in the region. This shortage of fi rewood, the researcher concluded, was lead-ing directly to malnutrition as people’s diets changed in re-sponse. The most vulnerable were children and the elderly.”
Wangari Maathai, “Unbowed: A Memoir”, Knopf Publishing Group (2006)This excerpt is published with permission.
© Author(s) 2012. This work is distributed under the Creative Commons Attribution 3.0 License.http://factsreports.revues.org/2124Published 10 October 2012
Wangari Maathai was the founder of the Green Belt Movement and the fi rst woman to earn a doctorate in biology in East Africa. A recipient of numerous awards for her work on environmental and social is-sues, in 2004, she was honored with the Nobel Peace Prize. In
2006, she published her memoir, Unbowed. She was also the author of Challenge for Africa andReplenishing the Earth. She lived in Nairobi, Kenya. To learn more about Wangari Maathai and her work, visit the Green Belt Movement website: www.gbmna.org
9www.factsreports.org

10 FACTS Reports
Section 1: The Major Importance of The Social Dimension

Section 1: The Major Importance of The Social Dimension
©hellio-vaningen

12
SECTION 1:
THE MAJOR IMPORTANCE
OF THE SOCIAL DIMENSION
COMMENTARY: Culture and Development, an experiment with empowermentGanesh N. Devy Adivasi Academy of Tejgadh’s project
Oceanium Dakar: The daily struggle for the integrated community-based protection of West Africa’s marine and coastal ecosystems Ismaila Sall and Guillaume Durin OCEANIUM’s project
ALINIHA: Women leaders at the heart of sustainable development in West Africa Jean Goepp Aliniha’s project

© Author(s) 2013. This work is distributed under the Creative Commons Attribution 3.0 License.Published 3 April 2013 http://factsreports.revues.org/2404
COMMENTARY
Abstract. The Adivasi Academy has been implementing a comprehensive cultural approach promoting the Adivisi community’s empowerment in different fi elds such as culture, education, healthcare, agriculture and economy. The Adivasi community had been facing lack of access and marginalization partly due to the British colonialism; during which many cultural misunderstandings related to communities’ and tribes’ costumes occurred. Through notably active campaigns, trainings for local people and highlighting cultural conserva-tion, the Adivasi Academy has achieved many positive outcomes namely major policy debates and commu-nity’s self-reliance. All these show that cultural parameters can play a key role in development. Such compre-hensive cultural approach could be replicated in other community contexts in order to foster development and to fi ght against social exclusions.
Keywords. Empowerment, community, culture, Adivasi, India, colonialism, Criminal Tribes Act, CTA
Culture and Development, an Experiment with Empowerment
Ganesh N. Devy
Ganesh Devy, is a literary scholar and cultural activist. He taught English literature at the M. S. University of Baroda. He founded the Bhasha Research & Publication Centre, Budhan Theatre and the Adivasi Academy. In addition to its many fellow-ships (the Rotary Foundation Fellowship, Commonwealth Academic Exchange Fellowship, Fulbright Fellowship, THB Symons Fellowship and Jawaharlal Nehru Fellowship), numerous publications and awards (In Another Tongue, Tradition and Modernity, Painted Words, Indian Literary Criticism: Theory and Interpretation, A
Nomad Called Thief: Refl ections on Adivasi Voice and Silence and Indigeniety: Expression and Representation, The G. N. Devy Reader), he devotes himself to conservation of threatened languages in India and to the pro-tection of the rights of nomadic and other discriminated tribes. After being the advisor of the Indian govern-ment on those subjects, he is chairing the People’s Linguistic Survey of India, a nation-wide study of over 700 languages.
Bhasha Research and Publication Centre, Baroda
www.bhasharesearch.org
Introduction
I intend to present in this paper the experiments carried out at the Adivasi Academy, Tejgadh (Gujarat state, India) towards the empowerment of the Rathwa tribal community in western India and some of the nomadic communities such as Vadi and Chamtha by foregrounding the art and culture of the commu-nities as a means to their empowerment. The assumption be-hind these experiments was that economic marginalization of a given community can be much better understood by placing the economic and issues in a comprehensive cultural perspec-tive than by looking at them in purely economic terms. The empowerment experiments began with the belief that the
strategies adopted require to situate the immediate material reality within the residual effects of histories of marginaliza-tion or discrimination. This paper proposes that for making any development intervention genuinely sustainable, the syn-chronic (material) as well as the diachronic (historical) per-spectives need to be brought together. It also proposes that the sustainability of an intervention will be ensured by en-hancing the community’s capability to internalize the twin perspective. This paper tries to underscore that the process of internalization of the inter-relatedness of the two dimensions by the community is necessarily an irrational process, and it manifests in the community’s imaginative forms of
13www.factsreports.org

Culture and Development, an Experiment with Empowerment
2 Field Actions Science Reports
expression. The experiment relates to two social groups: the communi-
ties listed in the offi cial records as the Tribes of India, and the communities inscribed in the colonial Indian history as the ‘Criminal Tribes’ (these are not to be confused with the Tribes mentioned in the former category). These latter were ‘noti-fi ed’ as ‘criminal’ during the colonial period (1871 Criminal Tribes Act: Devy, 2007: 14-20; Schwarz, 2010: 9-10), and subsequently ‘denotifi ed’ (1952-56) soon after Independence. They are now known as ‘Denotifi ed and Nomadic Tribes’ (DNTs). The total population of Tribes – also described in the government terminology as Janjati, or known popularly as Adivasis (the indigenous)-- is approximately 90 million, that of the communities notifi ed during the colonial times as ‘criminal tribes’ is projected at 60 million(Devy, 2007) though their exhaustive Census has not been carried out for the last eighty years. Both these are getting rapidly pauper-ized and stand at the tail end of the human development index within the Indian context. The fi gures for their illiteracy, child mortality, food insecurity, indebtedness, non-profi table migration, non-access to credit, and to formal education and healthcare are uniformly higher than the overall national fi g-ures for these categories of disadvantage (Devy, 2007: 128).
The Historical Context of ‘Criminal Tribes’
The British colonial rule in India was not only a political and economic enterprise; it was also an experiment in restructur-ing a complex society. For the fi rst two centuries of colonial contact, beginning with the arrival of the East India Company at Surat in 1600 to the establishment of the Asiatic Society in Bengal towards the end of the 18th century, the colonial imag-ination had great diffi culties in understanding the complex weave of the Indian society. Out of these diffi culties arose many misconceptions and myths about communities and so-cial conventions. At times these were as comical as the idea that India is a country of snake charmers and magicians. But in many instances the wrong reading of the society resulted in untold human misery. This very same ‘knowledge’ formed the basis for formulating law during colonial times. The story of the communities known as ‘denotifi ed’ is without doubt the most mind-boggling tale of inhuman collapse of compassion.
During the 1830s, the colonial government appointed William Henry Sleeman (1788–1856) to prepare a list of in-stances of assaults on wayfarers in central India (Dash, 2005: Chapter II & III). He took to this task with an amazing devo-tion and produced a voluminous list of violent episodes. The list would not have amounted to much had it not been for the turn of events during 1857 in central India. In the wake of the battles fought and lost by the Indian states, all isolated and potential groups of soldiers, and even those who were likely to be in the supply chain for them, came to be seen as candi-dates for the Sleeman-list. Later, it was this list that became the basis of the 1871 Criminal Tribes Act (CTA).
Once the traditional occupations of the nomadic and semi-nomadic communities were brought under the scanner, the colonial government provided for their being offi cially de-clared ‘Criminal Tribes’. The government’s powers to
declare a community ‘criminal’ were made arbitrary to the extent that the question of inclusion of a given community in the list was taken completely out of the judiciary’s purview. After this, even an attempt by any member of the community to move out of the district without informing the local au-thorities became a punishable offence. The act of questioning the notifi cation in any form too came to be seen as a criminal offence. The colonial government’s right to detain such com-munities and to do whatever the government decided to do with their lives came to be seen as a lawful right and duty of the government offi cials. The offi cials were charged to pre-pare Registers of Criminal Tribes; and once a register was prepared for a given district, even the very same offi cial was not allowed to make any deletions in it. The nature of the declaration was made entirely non-negotiable and absolute. The victims of this draconian law were given no legal re-prieve. The onus of proving that they were not criminal fell on them, but they were left with no rational argument since their being born in a certain community itself was seen as a crime. The persons belonging to these tribes had to spend their entire lives proving to the authorities without any spe-cifi c reason that they were not criminals. Thus, life itself be-came a trial for them without any let up whatsoever. The communities ‘Notifi ed’ under the Act acquired the form of some ‘social raw material’ for use in empire-building. The members of these communities came to be used in the colo-nial construction projects of railways and factories. The law provided for the authority to bundle up and shunt them as and where they were of use: “Any tribes, gang or class, which has been declared to be criminal, or any part thereof, may, by or-der of the local government, be removed to any other place of residence” (Devy 2007: 140). Even children were not viewed with any special sympathy. The government decided that the Superintendent of the specifi c settlement was to be asked to function as the ‘mother’ for the children. The infamous CTA asked for forced ‘isolation’ and ‘reform’ of the communities listed. These included coin makers, entertainers, migratory peasants, stray wandering groups, nomadic communities, long-distance traders and such others. The CTA required cre-ation of ‘settlements’ as reformatories with ‘strict proce-dures’. These procedures kept becoming increasingly inhu-man. Forced labour became the daily fate of the inmates. The CTA of 1871 went through several revisions, every revision bringing in new forms of ‘punishment’ for being born within the listed communities. The last of the CTA was passed in 1924. By then a total of 191 communities had been brought under its purview.
The Loss of Forest
About the same time as the CTA was getting formulated, the colonial government produced another list of communities under the caption ‘the Tribes of India’. These were the com-munities that had come in confl ict with the British rule on the issue of imposition of the government’s sovereign authority over the forest areas. During the 1860s, the British had cre-ated a Forest Department, primarily to provide good quality timber for building railways and naval ships. The forest dwelling communities in India opposed the colonial takeover
14 FACTS Reports

Culture and Development, an Experiment with Empowerment
3www.factsreports.org
of their forests (www.vanashakti.in/evolution). They neither cared for the colonial government nor did they understand the idiom of the British law. Not surprisingly, most of these con-fl icts were often violent and involved armed clashes. Since the political idioms of the confl icting parties were radically divergent, it became diffi cult for the colonial rule and its di-plomacy to forge treaties with the forest dwelling communi-ties. Communities located at all such areas of confl ict were bundled together by the colonial government within the term ‘tribe’. Soon after the need to conceptualize ‘tribes’ became clearer, a sophisticated machinery of scholarship was put in place to enumerate, describe and defi ne the Indian tribes. The historical, linguistic and cultural differences among these communities were so vast and complex that it would have been impossible for any rational scheme of sociological clas-sifi cation to place them in a single conceptual category. While all this was happening in India’s political history, already a branch of Orientalism in Europe had emerged in the form of Anthropology, perhaps more appropriately ‘savageology’ (Devy, 1998: 110) Some of the attributes discussed in ‘sava-geology’ were applied to the Indian ‘tribes’, and tribes came to be seen as necessarily primitive. By the end of the 19th century, the concept of tribe and the notion of criminal tribes had received acceptance even among the educated Indians-- writers, journalists and lawyers. As a result, when the 1891 version of the CTA was enacted, or when in the following year the register of forest codes was prepared,(Devy, 2007) there was no evident protest from any quarter. By the turn of the century, the tribe had come to stay as an unchallenged category constitutive of the primitive in Indian society.
Figure 1. © hellio-vaningen
Marginalization and Language
In the pre-colonial Indian epistemologies of language, hierar-chic segregation in terms of a ‘standard’ and a ‘dialect’ was not common. Language diversity was an accepted fact of life. Literary artists could use several languages within a single composition, and their audience accepted the practice as nor-mal. Great works like the epic Mahabharata continued to ex-ist in several versions handed down through a number of dif-ferent languages almost till the beginning of the twentieth century. When literary critics theorized, they took into ac-count literature in numerous languages. Matanga’s medieval
compendium of styles, Brihad-deshi, (Devy, 1992: Chapter II) is an outstanding example of criticism arising out of the principle that language diversity is normal. During the colo-nial times, many of India’s languages were brought into the print medium (Devy, 1992: Chapter III). Writing was known and scripts such as Modi and Nagari were previously in use. Paper too was in use since the Thirteenth Century as a vehicle for written texts (Devy, 1992: Chapter III). However, despite being ‘written’, texts had been circulating mainly through the oral means. Printing technology was introduced in India dur-ing the last quarter of the eighteenth century. With it, new norms of literature were introduced, privileging the written over the oral, and bringing in the idea that a literary text needs be essentially mono-lingual. These ideas, together with the power relation prevailing in the colonial context, started af-fecting the stock of languages in India. The languages that had not been placed within the print technology came to be seen as ‘inferior’ languages. After Independence, the Indian states were conceived as ‘linguistic states’. If a given lan-guage had a script and printed literature, it was granted a ter-ritory as a separate state within the Union of India. Languages that did not have printed literature, even though they had rich traditions of oral literature, were not given such states. The State language became the medium of school education. A special Schedule of Languages (The 8th Schedule) was creat-ed within the Indian Constitution. In the beginning it had a list of fourteen languages. At present the list has twenty-two languages in it. It became obligatory for the government to commit all education related expenditure on these languages alone. The languages spoken in India far outnumber the lan-guages included in the Eighth Schedule. Most of these lan-guages are spoken by the Adivasis and the DNTs and are on way to a rapid extinction, if not already gone.
Cultural Intervention
When I started noticing during the 1980s the alarming dispar-ity between the development of other classes and communi-ties, on the one hand, and the development of the Adivasis and the DNTs, on the other hand, I felt drawn to exploring the link between denial of access to the means of development and the ‘structural aphasia’ imposed on the marginalized lan-guages. Towards this end, ‘Bhasha’, which means ‘language’ or ‘voice’, was founded in 1996 as a Research and Publication Centre (henceforth referred to as Bhasha) for documentation and study of literature in the Adivasi languages. The ultimate horizon of obligations for Bhasha at the moment of its incep-tion was to document and publish fi fty bilingual volumes of Adivasi literature. Little did I know as its founder that beyond the horizon many new worlds were waiting for it!
Within months of commencing the work on the fi fty-vol-ume series, many Adivasi writers and scholars approached me with the idea of starting a magazine in their own languag-es aimed at the Adivasi communities and to be read out rather than for individual reading. Bhasha accepted the idea. The magazine was called ‘Dhol’ (the drums), a term that has a totemic cultural signifi cance for the Adivasis. We started us-ing the state scripts combined with a moderate use of diacritic marks to represent these languages. The response to the
15www.factsreports.org

Culture and Development, an Experiment with Empowerment
4 Field Actions Science Reports
magazine was tremendous. More Adivasis approached Bhasha, and asked for versions of Dhol in their own languag-es. In two years’ time, ‘Dhol’ started appearing in ten Adivasi languages (Kunkna, Ahirani, Gor Banjara, Bhantu, Dehwali, Pawari, Rathwi, Chaudhari, Panchamahali Bhilli, Dungra Bhilli, respectively). When the fi rst issue of Chaudhari lan-guage Dhol was released at the Padam-Dungri village in South Gujarat, it sold 700 copies in less than an hour. This was a record of sorts for a little magazine. Inspired by the success of the oral magazine, our Adivasi collaborators start-ed bringing manuscripts of their autobiographies, poems, es-says and anthropological studies of their communities which they wanted us to publish. Subsequently, in order to highlight the oral nature of Adivasi culture, we launched a weekly ra-dio magazine which was relayed throughout the Adivasi ar-eas of Gujarat and Maharashtra. All these initiatives together gave birth to a small but focused publishing and book distri-bution house, which now works under the name ‘Purva-Prakash’, and is the fi rst community owned publishing pro-gramme for Adivasis and DNTs. Purva-Prakash has been self-supporting though not so much a commercial venture as a cultural and literary platform for intellectual concerns, and a forum for expression in people’s own languages.
Oral literature, unlike written literature, is not an exclusive verbal or lexical art. It is inevitably intermixed with song, music, dance, ritual and craft. So, Bhasha was drawn to the craft of Adivasi communities, initially in western India, and subsequently from all over India. This resulted into Bhasha’s craft collection and craft training initiatives, further leading to the formation of an Adivasi craft-cooperative under the name ‘Tribals First’. The objects one identifi es as craft are not produced in Adivasi communities for aesthetic pleasure alone. They are invariably an integral part of their daily life. Often, such objects carry with them an imprint of the super-natural as conceived in their myth and imagination. The shapes, colours and the forms of these objects refl ect the transactions in the Adivasi collective unconscious. Often, one overlooks the fact that the metaphysical matrix of the Adivasi thought process differs markedly from the philosophic as-sumptions of the dominant cultural traditions in India. Therefore, sometimes simple concepts and ideas, which look perfectly natural and secular, can provoke Adivasis into re-acting negatively, and even violently.
Development Challenges
I learnt the hard way that there is a common source for the dominance of the red colour in Adivasi art, and for their utter unwillingness to donate blood even when a kinsman is in dire need, namely, the supernatural belief that the domain of witchcraft is red in colour. Medical sciences maintain that a certain genetic mutation, required in order to fi ght malarial fevers, has made the Adivasis prone to the Sickle Cell disease (Tapper, 1999). On learning about the Adivasi trauma, we de-cided to check the statistics of the Sickle Cell anemia in Gujarat where Bhasha was most active. Blood testing of the Adivasis is a challenging task. So we decided to draw up mathematical models, and at the same time composed an ex-tensive family-tree through a survey that took us over two
years to complete, to isolate certain localities, villages and families that could provide clues for coming up with the most reliable projections. We found that nearly thirty-four percent of Gujarat’s Adivasis have been ‘carriers’ of the genetic dis-order, and for about three and a half percent of the population the Sickle Cell disorder is ‘manifest’. This means, at least in principle, about two hundred and ten thousand of Gujarat’s seven million Adivasis are likely to not attain the age of thirty (Devy, 2003). What is even more saddening is that the avail-able healthcare system has not been sensitive to the epidemic scale of the gene disorder; and in most instances it remains inaccessible. As a result, Bhasha decided to launch its health-care programme under the title ‘Prakriti’. Obviously, we did not wish to create large hospitals but rather a small and func-tional clinic. To this end, we started training local persons as community health workers so that the patients in the ‘crisis’ situation could be identifi ed and provided immediate relief locally and referred to urban hospitals for further treatment. Thus, beginning with aesthetics, we came up to anesthetics.
Figure 2. © hellio-vaningen
Often, shortages caused by the larger economic forces push a social sector from its subsistence-farming character into be-coming pauperized labour providers. The acute food short-ages faced by the Adivasis in Kalahandi and Koraput in Orissa, and their mass migration to the mining districts in other states are not exceptional stories. Though their main occupation is agriculture, Adivasis have been under-nour-ished throughout India, and sadly enough starvation death is not uncommon among them. In 1999, Bhasha decided to set up food-grain banks for Adivasi women to address the issue of food security. Initially, we had decided to follow the gov-ernment model of food grain banks; but we realized that they had come to be seen by Adivasi villagers as charity distribu-tion events, and so we chose to set up the grain-banks without any government contribution and entirely through local par-ticipation. Our consideration at this stage was that no effort towards reducing the Sickle Cell incidence was likely to suc-ceed if it was seen in isolation from the question of forced migration and food-insecurity. Food-security and healthcare form, for Bhasha, a single concern.
A year earlier, in 1998, we had decided to establish the DNT-Rights Action Group. It was the fi rst national campaign ever taken up for the cause of the DNTs. In this campaign we moved the National Human Rights Commission and various
16 FACTS Reports

Culture and Development, an Experiment with Empowerment
5www.factsreports.org
Ministries of the Central Government to abolish the Habitual Offenders Act and to provide a rights protection mechanism for the DNTs. Bhasha’s energetic campaign for the DNT rights received an overwhelming response from the denoti-fi ed communities. We had opened up a long festering wound. As a leader of that campaign I had to give a very serious thought to turning the anger and frustration among the de-monized, brutalized and politically vandalized DNTs into a constructive energy. In order to contain the anger, I decided to use the most ancient method of getting people angry without making them destructive, which is ‘theatre’. My experience of handling the violence within the minds of these communi-ties has left me profoundly convinced that theatre is probably the most powerful cultural means of sensitizing communities about the mutual entanglement and dependence of economic, social and cultural rights of several competing and clashing social sectors. Bhasha has now its own theatre group ‘Budhan’ named after a DNT killed while in police custody. (Devy, 2003; Schwarz, 2010). Apart from the Budhan Theatre, we have so far successfully established four annual cultural fes-tivals in as many locations of Gujarat, one of which is Dandi–the place made sacred by Gandhi’s salt-satyagraha. Adivasi and nomadic performers go to these four locations on their own and people from several states participate in thousands. These ‘melas’ (festivals) are now there to stay. The DNT rights campaign of Bhasha resulted into setting up of a National Commission by the Government of India. Additionally, a Technical Advisory Group (TAG) was created by the Prime Minister’s Offi ce. I chaired the TAG and pre-pared a comprehensive report for the government which was used for bringing in a new legislation and a comprehensive social security scheme for the DNTs.
Economy and Culture
Ever since the Adivasis were brought under the provisions of the Colonial Forest Department, their access to forest produce has been continuously diminishing and they have depended merely on rain-fed cropping. These historical legacies have forced them into a chronic indebtedness. At the same time, the rising costs of seeds, fertilizers, fodder and electricity, as well as the need for educating children have multiplied the cash needs of the Adivasis. Unlike the caste Indians, who fi rst earn and then spend, the Adivasis like to spend fi rst and then earn, just enough to meet those expenses. As such, their need for short term borrowing has increased over the years. The repayment of loans is very rarely defaulted by them, even when no written contracts are signed. In fact, these needs and habits should have been seen as a great opportunity by the formal banking sector, which is barely in existence in the remote and inac-cessible Adivasi villages. The credit delivery is almost non-existent, and it invariably takes a third party interven-tion to make the system work. For a majority of the Adivasis institutional banking, requiring complicated doc-umentation at every stage, is an alien notion. On the other hand, the procedures of a private money lender are easily understood by the Adivasis though the interest rates are exorbitant.
When we noticed in 1999 that the interest rates ranged between 60 to 120 percent, we took up the task of setting up micro-credit Self-Help-Groups (SHGs). Our challenges were far too many: getting the Adivasis to understand and accept the formal bank institution as an economic person was a challenge of some magnitude; but even greater was the task of educating the bank employees on their own schemes, the micro-credit policies of the NABARD (National Bank for Agricultural and Rural Development) and the economic concerns of an NGO such as Bhasha. The trickiest question was the peculiar social character of the private money lender. These are extremely infl uential among Adivasis, and they maintain extremely complicated and not easily terminable accounts with their clients, a sys-tem that treats cash, land, grains and labour as inter-con-vertible currencies. Not surprisingly, therefore, the mon-ey-lenders teamed up against Bhasha’s SHGs as soon as the Adivasi farmers stopped going to them for loans. I felt quite amazed when some of the SHG members started bringing in currency notes, all new and serially numbered, to pay off the bank loans they had received barely a month ago. On enquiring, we found that the money-lenders had been distributing these notes liberally to whoever was pre-pared to step out of the SHG.
The unease of the money-lenders continued to increase as Bhasha’s Micro-fi nance programme cut into the private credit market. There were moments when I felt that we should get into a dialogue with the money-lenders in order to circumvent the confl ict and to introduce an ethical ele-ment in their operations. But I had a naïve hope that the formal banking system may quickly step in and grab the opportunity. The money-lenders continued to feel threat-ened and destroyed. Their fury expressed itself in March 2002, when the Hindu money lenders bribed, coaxed and threatened a pliable section of the Adivasis into making violent attacks on the families and properties of the Muslim money lenders. Several hundred houses were burnt down, hundreds were injured, many lost their lives, and the live-lihoods of thousands of Adivasis and Muslims were ad-versely affected (Devy, 2003). At the height of the riots we felt that perhaps the money-lenders may succeed in restoring once again their stranglehold on the Adivasi economy. But, we found that more Adivasis started form-ing SHGs after the riots. In 2011, the total number of SHGs formed by Bhasha was at 2200, involving about 25000 families and with a credit worthiness of over 80 million rupees ( approximately two million USD.)
Training the Community for Development
Bhasha has been providing training for the management of the groups, directing them to establishing viable occupa-tions for getting increased income, and enabling them to form small and easily manageable federation of the SHGs. The new occupational avenues we have opened before the Adivasis include honey cultivation, specialized gum-tree plantation, brick-making and masonry, craft training and organic cropping. In the matter of setting up of micro-en-terprises by putting to use the credit available, the
17www.factsreports.org

Culture and Development, an Experiment with Empowerment
6 Field Actions Science Reports
minimum guiding principle we have followed is that the activity should not lead to migration to the urban centres. Therefore, we have been focusing more on the agriculture based value-addition activities.
Figure 3. © hellio-vaningen
Over these years, I have noticed a great hunger for learn-ing among the Adivasis. Contrary to the popular impression, the Adivasis do want to send their children to schools. Their aspirations are belied because the primary education in the Adivasi villages is burdened with its own numerous struc-tural problems. I have noticed that given a set of dedicated teachers even in the tiniest Adivasi hamlets, children shape up as potentially excellent university entrants. Therefore, at Bhasha, we decided to take up a programme of helping Adivasi children by establishing, in about eighty villages, support schools, to help those who have missed schooling altogether, or those who lagged behind in their school studies. Bhasha Trust established the Adivasi Academy at Tejgadh in 1999. Since 2000, we have been teaching the young men and women of the area a subject that we have named ‘Tribal Studies”, by which we mean “The study and understanding of how the Adivasis perceive the world.” The attempt is to make our students refl ect on their own situation, motivate them and to put them onto the great task of empowering the Adivasi villages by helping them to be self-reliant. The Academy offers short term training in micro-fi nance, and Diploma courses in Tribal Rights, Food-Security and Development, Publication and Rural Journalism and Tribal Arts and Museum Studies. The students are required to go out in the villages and set up SHGs, food-grain banks, water banks and promote the use of solar energy and organic farm-ing. Based on their experience of fi eld work, the students are required to write dissertations.
Conclusion
Over the last two decades, the Adivasi Academy has carried out several experiments in the area of Adivasi development. It has initiated major policy debates in relation to the economic, social and cultural rights of the DNTs and the Adivasis. However, the vision inscribed in these experiments has always been that of the communities themselves. The campaigns and the enterprises were more oriented towards generating the process of self-reli-ance rather than achieving quantitative success. There has been
a conscious attempt at recovering the cultural memory of the nomadic and Adivasi communities, and investing it into eco-nomic and social dynamics in such a way that culture could be ‘monetized’. These experiments have, from time to time, faced the orthodoxy of funding agencies in that the ‘projects’ that could not promise a direct economic output were rarely sup-ported by them. This has, however, been seen by the Adivasi Academy as an opportunity to become self-reliant rather than as a stumbling block in ‘development’. It is therefore that the Adivasi Academy has not stopped functioning even for a day despite long spells of having no external funding support. Irrespective of the nature of the interventions, each and every intervention has been fully owned by the Adivasi and the DNT community for which it was conceptualized. This is probably the most signifi cant and ‘valuable’ feature of the Academy’s ex-perimentation. It can therefore be replicated in the context of any community in the world which faces lack of access and margin-alization. Similar experiments elsewhere, taken together with the learning at the Adivasi Academy, will help us in developing the precise method of working out the conversion between eco-nomic capital and social capital.
Note
Information about Criminal Tribes Act 1871 is available in the unpublished report by the Technical Advisory Group (TAG) on Denotifi ed, Nomadic and Semi-Nomadic Tribes (2006) appoint-ed by the Ministry of Social Justice, Government of India. The author was the Chairperson of TAG and the author of the TAG Report. The population of Denotifi ed and Nomadic Tribes can only be estimated on the basis of the 1931 Census which was the last census to have clearly enumerated all nomadic and semi-nomadic communities in India. The estimate of 60 million is based on the fi eld research done by the DNT Rights Action Group from 1998 to 2007 culminating in the drafting of the TAG Report. The Government of India has accepted the TAG recom-mendations to carry out a DNT Census and modifi ed the Census 2011 exercise to include community-wise enumeration of the DNTs.
A Modifi ed version of paper published in The Indian International Centre Quarterly, Autumn 2012.
References
Dash, Mike. 2005. Thug: The True Story of India’s Murderos Cult. London. Granta.
Devy, G. N. 1992. After Amnesia: Tradition and Change in Indian Literary Criticism. Bombay. Orient Longman.
Devy, G. N. 1998. Of Many Heroes: An Indian Essay on Literary Historiography. Hyderabad. Orient Longman.
Devy, G. N. 2006. A Nomad Called Thief: Refl ections on Adivasis Silence. New Delhi. Orient Blackswan.
Devy, G. N. 2007. Report of Technical Advisory Group on Denoti-fi ed, Nomadic and Semi-nomadic Tribes. Offi cial Document, Ministry of Social Justice, Government of India.
Schwarz, Henry. 2010. Constructing Criminal Tribe in Colonial In-dia: acting Like a Thief. Chichester. Wiley-Blackwell.
Tapper, Melbourne. 1999. In the Blood: Sickle Cell Anemia and the Polarities of Race. Philadelphia. The University of Pennsylvania Press.
www.vanashakti.in/evolution.html
18 FACTS Reports

Oceanium Dakar: The daily struggle for the integrated community-based protection of
West Africa’s marine and coastal ecosystems
Ismaïla Sall1 and Guillaume Durin2
1Project Manager, [email protected]
2Communication and Training Manager, [email protected]
OceaniumRoute de la Corniche Est, BP 2224 Dakar Senegal
Tel.: 00 (221) 33 842 40 52 / 00 (221)-77 939 50 [email protected]
www.oceaniumdakar.org
Abstract. The coastlines and deltas of West Africa have suffered—and continue to suffer—signifi cant envi-ronmental damage. Although they fulfi ll crucial functions, their mangroves have been subjected to wide-spread destruction. The Senegalese NGO Oceanium has been combatting this phenomenon since 2006 by sensitizing and involving the surrounding populations. The “Plante ton arbre” (Plant Your Tree) project is a rare example of the large-scale participatory restoration of a severely threatened coastal ecosystem. Its results deserve to be analyzed in greater detail, but it has already demonstrated that a proactive initiative designed to be friendly to people, as well as to the environment, really can make the difference.
Keywords. Mangroves, Senegal, reforestation, local communities, awareness-raising, mobilization, partici-patory method, large scale, replicability, conservation, halieutic resources
© Author(s) 2013. This work is distributed under the Creative Commons Attribution 3.0 License.http://factsreports.revues.org/2564Published 19 April 2013
1. Introduction
Mangroves play an ecological, but also economic and social, role essential to the coastal regions and commu-nities of Senegal. These amphibious forests manage to survive, and even thrive, in brackish wetlands at the mercy of ocean tides. In so doing, they underpin the ex-istence of the people of the Casamance and Sine-Saloum deltas. Fish, shellfi sh, countless butterfl ies and a multitude of birds fi nd, between their roots and in their branches, an ideal place to develop and grow. The man-groves also act as a protective barrier against the winds, recycle large quantities of organic material, and im-prove the quality of the water, making it more suitable for rice-growing. Finally, when sustainably farmed, their leaves, bark and fl owers offer a wide diversity of products of exceptional nutritional and therapeutic val-ue, foremost among them being mangrove honey.
Figure 1. The Oceanium Logo
In Senegal, as in many other tropical countries, these ecosystems have gradually been destroyed.1 Since 2006, however, the Senegalese NGO Oceanium has been mobilizing local communities to restore the 1 UNEP-DEPI, Mangroves of Western and Central Africa,
UNEP-WCMC, 2007, p.27.
19www.factsreports.org

Oceanium Dakar: The daily struggle for the integrated community-based protection of West Africa’s marine and coastal ecosystems
2 Field Actions Science Reports
mangroves. Created in 1984 by Professor Jean-Michel Kornprobst, and subsequently headed by Haïdar El Ali, Oceanium is an environmental protection agency. In its early days, most of its activities centered on the sustainable man-agement of the marine environment. Today, its actions extend over land as well as sea, and are led by a team of profession-als and volunteers in Senegal and in neighboring countries (Gambia, Guinea-Bissau, Mali and Burkina Faso).
In a few short years, more than 400 villages have carried out the largest mangrove reforestation program in the world. This paper briefl y presents the NGO, retraces the history of the project, and tries to answer a number of key questions: Why and how was the program conducted? What, in concrete terms, are Oceanium’s working methods? How can we en-sure that the restoration is sustainable?
The actions implemented by the NGO are designed in a way that refl ects a particular strategy based on the participa-tory protection of natural areas and resources, a strategy put into practice in the “Plante ton arbre” program. With the pub-lication of the interim reports, it is time to assess whether the initial restoration targets have been met, and to weigh up the social and environmental impacts of the efforts undertaken, while outlining the future prospects.
2. Part icipatory protection of natural areas and resources: principles
2.1 F rom the creation of protected marine areas to the fi ght against deforestation
Using intervention methods based on listening, exchange, awareness-raising, and joint action with local communities, Oceanium sets out to change mindsets and behaviors. The primary goal is to ensure that local people understand the im-portance of the struggle to protect their natural heritage and get involved in it, themselves becoming actors in the good management of their environmental resources.
Figure 2. Fishing with nets © hellio-vaningen
Oceanium’s main missions are:
• Environmental education. This begins with an awareness-raising effort aimed at populations whose relationship with nature is often self-evident,
but who frequently do not, or at least not fully, per-ceive the forces that are at work and that threaten the environment in which they live. The Oceanium team shoots its own documentary fi lms, and then tours of schools and villages, organizing debate screenings (cinéma-débats), at which it initiates the discussion, offers explanations, and listens to peo-ple’s reactions and experiences. Depending on the response, it offers everyone the opportunity (through further fi lms, discussions, and easily-ac-cessible scientifi c literature) to learn more about the implications, modalities and means of action.
• The central means of action is the participatory re-forestation of the mangroves. With its permanent network of regional coordinators, the organization sets up large-scale planting campaigns to restore the mangroves in the Casamance, Sine-Saloum and Saint-Louis regions. But the reforestation effort is not limited to restoring the marine or delta ecosys-tems. Building on its own experience, and faced with the magnitude of the damage caused by the destruction of plant cover throughout the area, Oceanium has undertaken to support and organize the planting of Palmyra palms and many other tree species across Senegal (in the regions of Thiès, Tambacounda and Kolda).
• In a separate but complementary strand of this res-toration drive, the Oceanium teams promote or sup-port the creation of community-managed Marine Protected Areas (MPAs), and ecotourism facilities to provide the necessary funding. One of the most successful achievements in this respect was the cre-ation in 2003 of the Ker Bamboung MPA and an ecotourism camp in the Saloum delta, along with the opening of two new MPAs in the Casamance delta.
• To give fresh impetus to sustainable and human de-velopment, Oceanium has set up a microcredit scheme, the Aliniha project, which aims to combat poverty by improving the living conditions of dis-advantaged women in Kayes (Mali), Tambacounda (Senegal) and Gaoua (Burkina Faso) through a combination of microcredit, environmental protec-tion and support for female entrepreneurship.
• Finally, Oceanium refuses to resign itself to the disappearance of outstanding marine species. The organization is therefore active in the rescue and specifi c protection of manatees, dolphins and tur-tles. Once again, this work is done with the involve-ment and participation of local groups sensitized to the defense of wildlife (fi shermen, villagers, youth associations, etc.).
2.2 Proj ects designed with and for local people
One of the key indicators of the success and legitimacy of Oceanium’s projects is the support and strong involvement of
20 FACTS Reports

Oceanium Dakar: The daily struggle for the integrated community-based protection of West Africa’s marine and coastal ecosystems
3www.factsreports.org
the local population. The activities developed by the organi-zation are rooted in community involvement, and must ben-efi t local communities. The aim is to support local dynamics, steering local people toward a form of development that is as endogenous and sustainable as possible. When the synergy works, the protection of nature generates both short and long-term revenues that offset the gains that could have been made from devastating over-exploitation.
By way of example, local small-scale fi shermen, with the support of the organization, set up West Africa’s fi rst working Marine Protected Area (MPA), covering 7,000 hectares in the Saloum delta, and fi nanced by the construction of an eco-guesthouse inside the MPA at Keur Bamboung.
Held up as an example to follow, the project is now over-seen by a management committee made up of 14 villages. The mangrove reforestation projects also galvanize consider-able local participation.2
3. “Plante ton arbre”: the implementation approach
The mangrove restoration program was rolled out in seven main steps, from the training of the intervention teams (1) through to the observation and monitoring of the restored ecosystems (7), via communication for conservation (2), ac-tion planning and coordination (3), collecting (4), planting (5), and evaluation (6).
Figure 3. Planting © hellio-vaningen
Step 1: Planning the action, training the teams
From July to the end of August, Oceanium runs a series of training courses for its teams. From the logistics people to the mappers, to the cinéma-débat moderators and technicians, everyone follows sessions tailored to their own fi eld of com-petence to perfect their skills. They have already been given environmental training, with a particular focus on under-standing and preserving mangrove ecosystems. “Oceanium” as the NGO’s president Haïdar El Ali proudly declares, “is also a school!”3
2 Cf. Summary table of mangrove reforestation campaigns in Section 3.4.
3 Haïdar El Ali, opening the team training seminar in Dakar, July 21,
Step 2: Co mmunicating to raise awareness
For three months, from July to September, Oceanium sends out its fi fteen cinéma-débat units to ply the roads and trails of Senegal, insisting on the importance of indi-viduals and communities taking ownership of the refores-tation initiative. This awareness-raising and behavioral transformation campaign is summed up by the program slogan “Plante ton arbre!” (Plant Your Tree). The teams have organized almost 2,150 cinéma-débats in the villag-es, reaching out to more than 300,000 people with the mes-sage of mangrove reforestation.
One of the great advantages of this communicative ap-proach is, of course, its drawing-power, but also its ability to trigger subsequent discussion. It also helps that the local populations often recognize themselves in the projected fi lm footage, which makes it far easier to explain the ap-proach through this means. This empowerment by exam-ple, and the exchanges that ensue after each projection, also help to forge bonds of trust with villagers. Finally, due to the huge importance of the radio in Africa’s rural areas, the organization’s teams also take part in numerous local and national radio programs.
Oceanium now knows that it can count on thousands of planters to achieve its goal.
Step 3: Coordin ating, team-working and planning
Throughout the campaign, from May to November, the logis-tical and monitoring aspects of the reforestation operations call for an internal organization focused primarily on com-bining effi ciency with solidity and adaptability.
In addition to its national headquarters in Dakar, Oceanium has three regional bases: at Bignona and at Kolda in Casamance, and at Toubacouta in Sine-Saloum. In total, the various project phases—awareness raising, seed collecting, reforestation, and monitoring—occupy about a hundred people.
Step 4: Collect ing propagules and improving living standards
The propagules are collected by groups from women from mid-July onward4 in sectors where the mangrove is thriv-ing. Often assisted by their menfolk and children, the women harvest the propagules from the trees and store them in bags, which will subsequently be sent by truck to the reforestation sites. Collecting the propagules in the mangrove swamps is arduous work, and may impinge on the other activities of village life; the organization there-fore pays the collectors (1.5 euros per bagful of propa-gules), which enables the women to generate income and to meet the needs of their families.
2010. Following the change of government in 2012, Mr. El Ali is now Senegal’s Minister of the Environment and Sustainable Develop-ment.
4 It is traditionally from this period onward that the seeds are deemed ripe enough for planting.
21www.factsreports.org

Oceanium Dakar: The daily struggle for the integrated community-based protection of West Africa’s marine and coastal ecosystems
4 Field Actions Science Reports
Step 5: Transpo rting, sorting, aligning and planting
Once the bags of propagules have been brought in, they are transported to the reforestation site. Before being planted, the propagules are sorted and counted by the women, who pass them on to the planters, standing in lines two meters apart. Holding bowls full of seeds, the planters can now commence the task of reforestation. This step will run from mid-July to the beginning of November. As with the collectors, Oceanium incentivizes the groups of planters by paying 7.5 euros per hectare planted.
Step 6: Measuri ng and classifying
As soon as an area has been planted, the mapper teams, nick-named “the GPS boys”, arrive at the site to measure and clas-sify each parcel of land. All the sites replanted by local groups from 2008 to the present day have been measured, classifi ed, data-processed and logged in a dedicated database.
Step 7: Monitor ing the trees, and watching them grow
By mid-November, the trees are planted. The total surface area that the organization has helped restore covers almost 12,000 hectares in the mangroves of Casamance, Kolda, Sine-Saloum, and even Saint-Louis, where trials are cur-rently being held. This is the world’s largest mangrove re-forestation program. But as every guardian of nature who has ever done any gardening knows, it doesn’t stop there. The planting must be done carefully and wisely, but it is only one step in the process. The essential thing is for the tree to grow, and for the ecosystem to fi nally recover both its strength and its balance. For this reason, monitoring comities are set up and supported in each village commu-nity in the program, and actions are regularly organized to protect and clean young plants.
As they develop, the mangroves absorb large quantities of carbon from the atmosphere, helping to slow down cli-mate change: over the course of 20 years, the reconstituted mangroves of Senegal will be able to capture more than half a million metric tons of CO2.
5 The project has been registered by the United Nations Framework Convention on Climate Change (UNFCCC) and will be recognized by the issuance of certifi ed and verifi ed “carbon credits”. These credits will enable the businesses that have fi nanced the Oceanium project, through the Livelihoods Fund, to reduce their carbon footprint by combining abatement ac-tions (cutting their emissions) with carbon offset, by means of credit schemes with a powerful social and envi-ronmental impact.
4. Restoring Seneg al’s mangroves: overview 2006-2012
4.1 Context: Dam age to the mangroves prior to the program
5 Mangrove plants consist of 90% carbon, and the sediments they help stabilize also store large quantities of carbon. Mangroves are there-fore excellent carbon sinks.
The mangroves of Senegal have sustained serious damage for several decades, especially in the Casamance delta, where some 67,000 hectares of this unique ecosystem have disap-peared. The droughts of the 1970s and 80s, urbanization, overcutting for charcoal production, and the building of roads that cut off the circulation of water have all combined to de-stroy vast areas of mangrove.6
Without the contribution made by the trees, the water has become too salty for rice-growing. The fi sh and shellfi sh have lost their habitat for reproduction and growth. And logically enough, the communities that lived on resources from the mangroves are now beset by poverty.
4.2 2006 to 2007 : the trial period
In 2006, Oceanium, together with the people of Tobor village in Casamance, planted 65,000 mangroves on a damaged strip of land. This participatory reforestation experience was something of a pilot run, and proved highly conclusive. On the human level, all of the villagers—aware that their natural resources were vanishing—were quick to mobilize following the awareness-raising and coordination meetings staged by the NGO. On the environmental level, the recovery rate of the plants was 85%.
This early result motivated the teams to continue the ad-venture. The following year, in 2007, 550,000 mangroves were planted in ten Casamance villages. In 2008, the organi-zation launched “Operation 5 Million Mangroves” in the same region. In all, 5,302,000 trees were planted in the space of six weeks. And by mobilizing more than 32,500 people from 110 different villages, the project showed that it refl ect-ed a genuine popular concern.
4.3 2009: rollou t
The year 2009 was, in a sense, the realization of the part-nership and know-how acquired by Oceanium and the lo-cal communities. With the support of new fi nancial part-ners—Groupe Danone and the foundation Insolites Bâtisseurs, as part of a carbon-funding scheme—the NGO was able to be more ambitious in terms of surface areas, awareness-raising, and methodology.
In three months, from August to October 2009, more than 36 million trees were planted by over 80,000 people from 323 villages in the regions of Casamance and Sine-Saloum. The environmental education effort was also un-precedented, with 200 cinéma-débats organized, reaching a total of some 45,000 people. “Never before have so many trees been planted in so little time”, said the Senegalese and international media in November 2009.
To achieve such a result, Oceanium had to improve its organization. It introduced training for its employees, to enable them, on the one hand, to perform accurate map-ping and monitoring of mangrove stands (GPS training) and on the other, to step up the quality of the awareness-raising campaign (cinéma-débat training).
6 United Nations Food and Agriculture Organization: “Loss of man-groves alarming”, FAO publications, 31 January 2008, Rome, Italy.
22 FACTS Reports

Oceanium Dakar: The daily struggle for the integrated community-based protection of West Africa’s marine and coastal ecosystems
5www.factsreports.org
4.4 2010 to 2012: ful l-scale implementation
In 2010, the story continued. More than 62 million trees, cov-ering more than 4,700 hectares, were planted by just under 110,000 people from 408 villages. In 2011, with the support of the Livelihoods Fund, 4,200 hectares were restored, and a further 460 in 2012. In total, almost 12,000 hectares of man-grove have been restored by the people of Senegal.
The Senegalese government is also involved in the project. A protocol agreement between Oceanium and the Ministry of the Environment and the Protection of Nature7 provides for the monitoring, training and involvement of agents from the designated departments, acting alongside the communities.
Table 1. “Plante ton arbre”: campaign results, 2006 to 2012
Year(s)# propagules planted
Surface area (ha)
Planters involved
2006-2008 5,615,000 400 n/k
2009 36,000,000 1,900 78,726
2010 62,000,000 4,700 109,650
2011 42,000,000 4,200 85,765
2012 4,830,000 460 8,500
4.5 Reinforcing the internal organization and ex-tending the fi eld of action
Thanks to the experience it has acquired over the years, and the support of local communities, Oceanium has been able to extend its fi eld of action in Casamance and Sine-Saloum, and to meet the challenge of restoring damaged areas.
The organization seeks to keep to a reasonable size, to en-sure fl exibility and responsiveness, but during the reforesta-tion campaign it nonetheless employs some one hundred people, most of them from the areas concerned. The network it mobilizes includes coordinators, area managers, village re-lays, drivers, bag checkers, and handlers.
The teams have signifi cant logistical resources, including a fl eet of 4 trucks, 11 people-carriers, 8 4WDs, 60 “Djakarta” motorbikes, and 10 canoes.
Oceanium now insists not only on the need to put every-one’s commitment into practice, but also on the indispensable nature of training and of multi-agency networking, as it seeks to enrich its links with women’s organizations, small-scale entrepreneurs in the social, ecology and solidarity-based economy, popular education movements, agroecology activ-ists, and small farmers’ groups.
5. “Plante ton arbre”: a socially & environmentally coherent program
7 The Protocole d’accord des Plantations 2008-2009, signed in 2011 between the Senegalese Ministry of the Environment, represented by Mr. Djibo Ka, the Department of the Environment and Classifi ed In-stitutions, Groupe Danone, and Oceanium, concerns the monitoring and supervision of plantations.
5.1 A dual success
By integrating all of the energies that came together to pro-duce this result, the President of Oceanium feels that what the organization has “achieved with the local populations is ex-ceptional” and certainly goes well beyond its initial ambi-tion.8 This success nonetheless confi rms that precise, gradu-ated but ambitious goals can be achieved even in a context where the consensus of opinion among coastal environment experts was that there was no hope. The now famous “inte-grated approach” has fully demonstrated its effectiveness on a large scale in the restoration and protection campaign un-dertaken in Senegal.
Today, Oceanium is trying to set up or support new income-generating activities for the communities involved in ecosys-tem conservation. The structure is initiating, or taking part in, a number of pilot programs to ensure that local populations, and in particular Senegalese women, can make a living from transforming the products of what is now a more sustainable form of fi shing, and from small-scale oyster-farming. Elsewhere in the country, it is promoting the pooling of tradi-tional know-how with data from research and action pro-grams in order to disseminate the benefi ts of agro-ecological and agro-forestry practices.
5.2 Exchanging, listening, acting and moving for-ward together
Oceanium is built on an inclusive environmentalist philoso-phy, for which it makes no apology, and which is constantly updated. The idea that village-based ownership is crucial must have tangible consequences. One must be able, in par-ticular, to refrain from imposing one’s own priorities, to al-low for the complexity of local social relationships by mak-ing a conscious effort to keep the conversation going, and to sustain a process of sharing that is both as broad and as deep as possible. Experience shows that another condition of suc-cess is, without doubt, to vary the communication tools and the messages they convey in order to reach out to the greatest number.
Of course, many other organizations active in environmen-tal conservation have also realized the value of a participato-ry approach and have found a way to integrate community input into every step of the project management cycle. But words have to be turned into reality on the ground, and here much remains to be done. Too many meetings or workshops have become “participatory” only to produce yet another re-port, but little in the way of actual listening, or of lasting re-sults. One must take the time to develop dialogue and to build trust, by proving one’s effectiveness in action.
In the words of Haïdar El Ali, “the whole world needs to realize the importance of environmental protection, and must meet the challenge of nature—which is the challenge of the millennium!” To this end, he calls on “NGOs and local asso-ciations to act with local populations, collaboratively and without intermediaries,” adding that “NGOs must set them-selves [ambitious] targets for coordination with local
8 Interview with Haïdar El Ali, Dakar, January 11, 2013.
23www.factsreports.org

Oceanium Dakar: The daily struggle for the integrated community-based protection of West Africa’s marine and coastal ecosystems
6 Field Actions Science Reports
communities, and must work hard to achieve them. In the space of 4 years, we have gone from one replanting village to over 400. This means that Oceanium has found solutions that are applicable locally and reproducible globally. I invite [all willing participants] to do the same, because nature doesn’t wait: this is an emergency. During the ripening season of the mango, the cashew, and indeed the mangrove propagule, we are replanting on a massive scale, because our economy and our societies depend on it.”9 In short, everywhere, the time has come for action.
5.3 A visible recovery of natural resources
Oceanium coordinator Albert Seydi, who comes from the vil-lage of Tobor in Casamance, has observed the phenomenon fi rst-hand: “the halieutic resources are gradually returning; the fi sh and the oysters are increasingly abundant. We are also fi nding species that had disappeared from our water-ways. Not to mention the role played by the mangroves as a natural barrier against salt: last season, we were able to re-cover 30 hectares of rice fi elds.”10
Figure 4. Aerial view of mangrove forest and rice fi elds © hellio-vaningen
In the Marine Protected Area of Keur Bamboung, the same observation is supported by studies carried out by the IRD. The data collected from 2003 to 2007, and then from 2008 to 2010, by different research teams, demonstrate what local people have seen for themselves, namely that the creation of the MPA was followed by an increase both in diversity of species and in overall numbers of the larger fi sh much valued by the local fi shing industry.11
9 H. El Ali, speech at the workshop on overfi shing and land-grabbing, Global Social Forum, Dakar 2011.
10 Albert Seydi, “Mot de remerciement et d’encouragement” (A word of thanks and encouragement), during the Man-grove Caravanʼs stopover in Tobor in December 2010.
11 Tito de Morais L., Simier M., Raff ray J., Sadio O., “Suivi biologique des peuplements de poissons d’une aire protégée en zone de mangrove : le bolon de Bamboung (Sine Saloum, Sénégal)”, Fi-nal report Narou Heuleuk/AFD/IRD conference, Dakar, 2007; Ecoutin J.M., Sadio O., Simier M., Raff ray J., Tito de Morais L., “Comparaison des peuplements de poissons d’une aire protégée en zone de mangrove (le bolong de Bamboung, Sine Sa-loum, Sénégal) avec les peuplements de deux sites proches non pro-tégés de l’exploitation halieutique - Années 2008-2010”, Dakar,
6. “My Mangrove, My Life”12
In a few years, the mangroves restored and preserved by the communities will be teeming with thousands of tons of fi sh per year,13 a valuable resource for the whole of Senegal. It will also play its dual role as a crucial natural barrier against rising sea levels and as a carbon sink, a key asset in the fi ght against global climate change.
This result would of course be completely beyond our reach without the commitment and sustained mobilization of the people of Senegal to protect and preserve these ecosys-tems. Another important aspect—now that we are beginning truly to understand the complex interactions between marine and terrestrial environments—is to be able to extend our knowledge to other mangrove zones and to other types of plant cover in Senegal and the rest of West Africa.
7. C onclusion
The Oceanium project “Plante ton arbre” is a rare example of large-scale ecosystem restoration with and by local people. The reasons for its success include: the link perceived by the villagers between the disappearance of the mangrove and the decline in food resources; the ability of Oceanium to sensi-tize, mobilize, and coordinate the action of local communi-ties; planting methods easily implemented by a large number of villagers, and therefore easily replicated; a supervisory team structure and logistics setup adapted to a project of this type; and, fi nally, a well-structured measuring and monitor-ing system.
The project continues: the challenge now is to pursue planting while also initiating long-term actions aimed at pro-tecting the mangrove and making its resources economically viable for local communities. Efforts must also focus on the spreading the use of “hands-on” environmental education ap-proaches and on restoring plant cover in coastal and inland areas.
8. A cknowledgments
The authors would like to express their gratitude to the entire team at Oceanium Dakar for its involvement and generosity in the fi eld, and to Mr. Maxime Le Hegarat for the long and painstaking upstream task of collecting and formatting. As this paper hopefully refl ects, we continue to learn so much from the many Senegalese men and women who have re-solved to take action; we extend our very warm thanks to them all.
9. R eferences
Ecoutin J.M., Sadio O., Simier M., Raffray J., Tito de Morais L., “Comparaison des peuplements de poissons d’une aire protégée
June 2012.12 Title of workshop on reforestation monitoring and in-
come generation for teams and partners, July 2012.13 The surface area of Senegalʼs mangroves is estimated at
2,000 hectares; the average fi sh and shellfi sh yield is estimated at 90 kg/ha, with a maximum potential of 225 kg/ha.
24 FACTS Reports

Oceanium Dakar: The daily struggle for the integrated community-based protection of West Africa’s marine and coastal ecosystems
7www.factsreports.org
en zone de mangrove (le bolon de Bamboung, Sine Saloum, Sénégal) avec les peuplements de deux sites proches non proté-gés de l’exploitation halieutique - Années 2008-2010”, Dakar, juin 2012.
Tito de Morais L., Simier M., Raffray J., Sadio O., “Suivi biologique des peuplements de poissons d’une aire protégée en zone de mangrove : le bolon de Bamboung (Sine Saloum, Sénégal)”, Rapport fi nal de convention Narou Heuleuk/ AFD/ IRD, Dakar, 2007.
Ndour N., Dieng S. & Fall M., Rôles des mangroves, modes et per-spectives de gestion au Delta du Saloum (Sénégal), Vertigo, vol.11, n°3, décembre 2011.
PNUE-DEPI, Les Mangroves de l’Afrique de l’Ouest et Centrale, UNEP-WCMC, 2007.
Organisation des Nations Unies pour l’Alimentation et l’Agriculture, «Disparition alarmante des mangroves», FAO publications, Rome, Italie 31 janvier 2008.
UICN, Les Mangroves du Sénégal : situation actuelle des ressourc-es, leur exploitation et leur conservation, Rapport fi nal, 2007.
25www.factsreports.org

Aliniha: women leaders at the heart of sustainable development in West Africa
Aliniha’s motto: Woman gives life, micro-credit gives resources,
and the tree gives hope. Together they build the future.
Jean Goepp
Director of Nébéday, E-mail: [email protected], www.nebeday.organd General Secretary of Aliniha International, Email: [email protected], www.aliniha.org
Abstract:Born of an original association between tree southern partners in 2007, Aliniha is a methodology to link up wome n, the pillars of african society, for the sustainable development of their region, through their work and for their benefi t. The Aliniha methodology combines the various areas of expertise of the three social entre-preneurs who created it, namely microfi nance, improving women’s skills, and management and protection of natural resources. The underlying principle is that every woman signing the “Aliniha Charter” benefi ts from a microcredit allowing her to undertaken an economic activity; in return, she undertakes to plant and look after three trees given to her with the money, and to follow the training courses offered by the Aliniha partner structures. The aim is to teach women sustainable management of their resources, be they human (knowl-edge), fi nancial (money) or natural (trees).
In order to make the project sustainable and ensure that the methodology spreads, the three partner organiza-tions founded the Aliniha International association. Aliniha International is a network bringing together wom-en’s associations working for social, economic and environmental development of their respective regions: Gaoua (Burkina Faso), Kayes (Mali)and Tambacounda (Senegal).
Keywords: Sustainable development, Women, Micro-fi nance, Social credit, Management ofnatural resources, Skills improvement, West Africa
Figure 1. Logo of Aliniha
1. Aliniha, collaboration between tree southern partners for the development of skills
Figure 2. Aliniha’s organisation circle
Aliniha is a methodology developed in West Africa, designed and implemented by three African organizations from Burkina Faso, Mali and Senegal, that targets sustainable
© Author(s) 2013. This work is distributed under the Creative Commons Attribution 3.0 License.http://factsreports.revues.org/2365Published 13 February 2013
26 FACTS Reports

2 Field Actions Science Reports
Aliniha: women leaders at the heart of sustainable development in West Africa
development through women. Specifi cally, the Aliniha International member structures support women’s groups and help them organize into associations allowing them to be-come leaders in the fi eld of sustainable development by in-corporating goals concerning natural resources management, social development and economic growth.
Aliniha was born of the meeting in 2007 of three social entrepreneurs from three West
African countries: Burkina Faso, Mali and Senegal. These three development leaders each have a specifi c area of exper-tise: development and improvement of women’s skills, mi-crofi nance and management of natural resources. Together, they decided to pool their experience and incorporate these skills into a joint program: “a woman, a credit, a tree”. Thus a feasibility study was undertaken in 2008 and Aliniha was created in 2009, in three regions:Gaoua in Burkina Faso, Kayes in Mali and Tambacounda in Senegal.
Figure 3. Aliniha’s region map
For three years starting, Aliniha’s three founders – Burkinabe Ini Damien, Malian Alou Keita and Franco-Senegalese Jean Goepp – tested the implementation of this project. In 2012, a decision was made to turn this combina-tion of skills and experiences that is Aliniha into a proper in-ternational structure. Thus on 22 March 2012, Aliniha International was established.
Figure 4. Alou Jean Ini
Institutionalizing the program makes it possible to formal-ize the practices and ensure they can spread more widely.
APFG (Gaoua’s Association for the Feminine Promotion), the association for the promotion of women in Gaoua in-Burkina Faso, was taken as the baseline for the Aliniha mod-el, while its founder Ini Damien was appointed chairwoman of Aliniha International. CAMIDE (Center of support for micro-fi nances and development), the micro-fi nance and de-velopment support center, provides technical support to the micro-fi nance institutions set up to provide social credit and secure savings. Its chairman, Alou Keita, subsequently be-came treasurer of Aliniha International. NEBEDAY (Wolof name of the miracle tree,moringa) is the technical partner as regards the management of natural resources and its founder, Jean Goepp, is the secretary of Aliniha International.
The founding structures consider Aliniha a learning experi-ence allowing its members to acquire new skills, consider new outlooks, and improve their way of working in their own area of expertise. Aliniha’s strength in the promotion of sus-tainable development is truly its local roots, i.e. the legiti-macy of the structures that have set up this network, and there presentativeness of the women. The targets that have been set, the actions that are programmed and the implementation in the fi eld are entirely suited to the needs and problems faced by local populations.
2. Methodology: Aliniha International, a network of women-leaders
In practice, the Aliniha women are taught to bring added val-ue of the natural resources oftheir environment, by trans-forming them into quality products which they can sell for revenue allowing them to improve their daily lives. For in-stance, Burkinabe groups of Aliniha women have set up a shea transformation unit, using a local natural resource to make high quality butter, creams and soaps, in high demand in their region
In Senegal, some Aliniha women grow a tree called mor-inga which has a number of virtues, chief of which is its ef-fectiveness in combating child malnutrition. The women can cook the fresh leaves or grind them. In Mali, many Aliniha women have turned to market gardening; garden products such as groundnuts or capsicum peppers are subsequently sold in the market or transformed into for instance groundnut paste, grilled or dried peanuts,powdered capsicum, dried pep-pers or even capsicum pepper sauce, which are again sold inthe market.
2.1. “Micro-credit gives resources”
To start these activities, women need a minimum amount of money for their working capital.However, the deprived wom-en that Aliniha targets lack the means for funding and fi nan-cial growth. Aliniha’s social credit system provides the means to address this. Women’s groups can request social credit from a micro-fi nance institution that is also part of Aliniha International to carry out their entrepreneurial projects and receive training in micro-fi nance and management of trade activities. The group is jointly liable for the fi nancial support received by each member. A system of fi nancial support lev-els has been established to promote learning on
27www.factsreports.org

3www.factsreports.org
Aliniha: women leaders at the heart of sustainable development in West Africa
how to manage credit, thus avoiding high default risks helped initially by the fact the women can only borrow small amounts of money. At the end of a credit cycle, if the instalments were properly met, the loan can be renewed and the maximum amount per woman is increased. Throughout the cycle (usu-ally 6 months), the group members each pay a contribution to set up a collective savings fund, which serves to guarantee unpaid instalments. If the group misses no instalments, the fund is returned to them on request or can be used to imple-ment community projects.
Figure 5. Granting microcredit © Aliniha
2.2. “The tree gives hope”
Every woman belonging to the group receiving a micro-cred-it is also given 3 seedlings and is taught how to plant and look after them. The underlying idea is that the management of anyresource, whether fi nancial or environmental, requires making a long-term commitment asregards time and energy. This approach is therefore intended to help the women man-age theirresources more sustainably and to develop their awareness of their own impact on their environment.
Figure 6. Women replanting © Aliniha
2.3. “Woman gives life”
With the revenue from their activities, Aliniha women can pay back their credits (including interest) and generate bene-fi ts. This additional income for the family gives to women a
measure of independence and greater weight in decision-making within the family. In addition, women develop skills through the series of training courses tied to the trees and credits, covering many subjects, from literacy skills to management of a revenue-generating activity, through awareness of women’s rights and the protection of the environment. The courses also contribute to the women’s fulfi lment, making them a key architect of change. After attending these courses, women are better armed to incite their families to change their own behaviour. Aliniha therefore puts the woman at the heart of the process, encouraging her to take her own destiny in hand and to be the driver of her own growth.
Figure 7. Hive manufacturing © Aliniha
2.4. A changing participative methodology
The process is opened, allowing all stakeholders of the proj-ect – Aliniha women, partners and employees – to contribute with ideas to improve the model. Every person involved learns and grows from the experience and opinions of his or her partners. “Aliniha”concept of sustainable development, emerging from the pooling of the expertise of APFG, CAMIDE and NEBEDAY, perfectly matches the reality and concerns of the African women involved in the project.
At the beginning of the initiative, in 2008, all activities (training, management of nurseries, collection of savings, re-covery of micro-credits, etc.) were carried out by employees of Alou, Jean and Ini’s respective organizations. In that ap-proach, the Aliniha women, organized into informal groups, were considered as “benefi ciaries” or service clients. Today, the Aliniha women are organized formally into several self-managed Aliniha associations called AAA for the French ac-ronym – 5 in Mali, 3 in Senegal and 3 in Burkina Faso – and have taken over many of these activities, thus becoming “owner participants”.
2.5. From dream to reality: the means for funding
To make the project a success, the social entrepreneurs re-ceived technical and fi nancial support from a Belgian founda-tion, the Fondation Marie et Alain Philippson. Actively com-mitted since 2008 to Aliniha, the Foundation has funded most of the initiative’s structural and operating costs, while provid-ing the fl exibility every pilot project needs and allowing the directors to adapt the structure to their growing experience.
28 FACTS Reports

4 Field Actions Science Reports
Aliniha: women leaders at the heart of sustainable development in West Africa
Eager to ensure a lasting fi nancial support for the activities, the 3 founders worked to diversify the sources of funding, seeking new partners and setting up the means for self-fi nancing.
Aliniha partners encourage the Aliniha associations to be-come self-supporting. That’s why, the Aliniha associations are given a series of responsibilities and work together on common projects whose revenue could, in the future, make up the association’s capital. The aim is to ensure that in the end, boosted by their experience and the training they have received, the women can take over a number of tasks cur-rently carried out by the organization, relying on CAMIDE, NEBEDAY and APFG which are paid service providers to perform those tasks that are beyond their skills. To help them become self-suffi cient, the three partners have set up a series of training courses and help the associations get organized and create common projects with the potential to generate revenue.
The project itself is based on giving micro-credit to the benefi ciaries in order to fi nance the activities they wish to undertake. These credits generate interest that covers the ex-penses associated with managing the micro-fi nance activity. In addition, the women are strongly encouraged to save mon-ey, both individually and collectively. It is a good way for these women to undertake projects without running into debt.
At the same time, the organization encourages the groups and associations to set up a contribution system in their stat-utes. The objective is to create a collective fund, allowing the groups to cover their operating costs and possibly to under-take collective projects.
Figure 8. Training project management © Aliniha
With the idea to enable the sustainability of the activities, whatever the project, the benefi ciaries are always asked to make some form of contribution. For instance, a group of Aliniha women was given a mill but the facility was built by the village, on a piece of land granted to the group. Aliniha women contribute with either manpower or physical means.
It is obvious that the Aliniha project won’t achieve com-plete fi nancial independence since the project comprises a series of social and environmental actions that the project cannot afford by itself and initially generate no revenue. However, project members are working to reduce their reli-ance on outside sources of revenue as much as possible in order to guarantee the project’s viability over the long term.
3. Results: Aliniha, resources bringing hope of a better life
In three countries, Aliniha’s unique approach has resulted in learning and actions that make social, economic and environ-mental impact. To date, 6000 women have signed the ALINIHA charter. This has given them access to a series of training courses, to credit, and since 2008 they have saved almost 100.000 euros. At the same time, their revenue gener-ating activities have diversifi ed, in particular through the sharing of skills between the women in different countries.
Thousands of trees have been planted. Plastic bags have been replaced by baskets and cloth bags – a new a revenue activity for the women. Plant nurseries have been set up,also run by the Aliniha women. Alternatives to burning charcoal, such as the use of gas orgrass briquettes, are also emerging. Lastly, many women have received support to obtain their identity cards, making them full citizens.
A true movement of women-leaders is developing in the three countries, contributing to the region’s economic, social and environmental transformation.
4. Discussion: autonomy and durability of the model
As we have explained, a key concern to guarantee that the model can be extended, replicated and spread is reducing its reliance on outside funding, making sure the growth of its activities does not result in a proportional increase in its fund-ing needs. Consequently, the three socialentrepreneurs are working actively to make the structure self-suffi cient to en-sure the activities are sustainable. This requires giving re-sponsibility to all participants at all levels in setting up sus-tainable funding mechanisms. The principle is to make sure that, whatever the initial source of funding, the project is set up in such a way as to ensure that the activities make it pos-sible to renew the investments and other expenses.
Aliniha international’s ambition is to spread the Aliniha methodology and extend the networkof self-managed Aliniha Associations so that other African regions and countries can benefi t from this original approach to achieve sustainable development.
Aliniha International has multiple missions. These are:
- to organize and facilitate exchanges between the eleven existing AAAs, and between those associations and the partner micro-fi nance institutions;
- to continue to provide the eleven existing AAAs with the support and tools to implement their activities com-bining valorisation of the environment, development and economic growth;
- to help spread the method, working with women’s as-sociations wishing to help reach the goals set by Aliniha International.
In addition, Aliniha International has set itself specifi c goals to contribute to the sustainable development of Africa. As a result, all its members must work towards the following priorities:
29www.factsreports.org

5www.factsreports.org
Aliniha: women leaders at the heart of sustainable development in West Africa
- reduce wood consumption, promote reforestation, and help control erosion;
- give women responsibility in tree planting and sanita-tion activities;
- set up activities run by women to organize production and sale of products bringing added value to natural re-sources (shea, soap, moringa, monkey bread fruit, im-proved cookers);
- implement initiatives to promote women’s access to land;
- set up mechanisms to mobilize and organize savings by women, to use this capital to fund credits.
Figure 9. Women pottery © Aliniha
5. Aliniha International – together we can build the future!
Aliniha is fi rst and foremost a marriage of convictions. At a time of economic, social and ecological crisis, Aliniha pro-vides a chance to work together towards an idealistic goal, placing women – the pillars of African society – at the heart of change. More than the birth of a model, Aliniha represents the emergence of hope for sustainable development in Africa.Joining forces together will help build a shared future.
Today, Aliniha is heading towards new horizons: self-suffi -ciency and internationalization. If you too wish to build a world where natural resources are valued, where women are not spectators but actors, where people do not hold out their hands to receive help but to take opportunities and become masters of their own destiny, join us, and together we will build the future! That is our hope for this project. We will go on monitoring our activities and refi ne our processes to achieve our aims. We will look to report this in future com-munications and publications to provide incentives to others in Africa and beyond.
30 FACTS Reports

Section 2: Challenges Towards Development
©hellio-vaningen

32
SECTION 2:
CHALLENGES TOWARDS DEVELOPMENT
What if carbon was much more than just a funding mechanism? Bernard Giraud and Rémi Hemerick Livelihoods Fund’s and SOS Sahel’s projects
Suppressed Demand and the Carbon Markets: Does development have to become dirty before it qualifies to become clean? Looking into Passive Solar Houses (PSH)Marina Gavaldão, William Battye, Mathieu Grapeloup and Yann François GERES’ project
Carbon Intensification and Poverty Reduction in Kenya: lessons from the Kenya Agricultural Carbon ProjectBo Lager and Timm Tennigkeit VI Agroforestry’s project
Challenges of Community-Forestry Based Carbon Projects: Process, Participation, PerformanceJean-Pierre Rennaud, Jack Ruitenbeek and Timm Tennigkeit Livelihoods Venture’s project
The BipBop programme: Providing access to reliable, affordable and clean energy with a combined approach of investment, offers and trainingGilles Vermot Desroches and Thomas André Schneider Electric’s project

What if carbon was much more than just a funding mechanism?
Bernard Giraud1 and Rémi Hemerick2
1Livelihoods Fund15 rue du Helder 75439
Paris Cedex 09 [email protected]
2SOS Sahel2 avenue Jeanne
92604 Asnières sur Seine cédex [email protected]
Summary. What we agree by common consent to call ‘carbon funding’ is seen primarily by many agencies and NGOs as providing the opportunity to leverage new fi nancial resources at a time when development aid is in-creasingly scarce or diffi cult to secure. But over and above the fi nancial dimension, the methods applied in the context of ‘carbon’ projects lead project developers to work in new ways, take a long-term view of the work they do, and put in place systems to ensure detailed measurement of project impacts. To what degree can the carbon approach contribute to changing the beliefs and practices of development organisations? In respect of which out-comes, and with which limitations? Bernard Giraud, co-founder of the Livelihoods Carbon Investment Fund, and Rémi Hemerick, Chief Executive of the NGO SOS Sahel, expand on their viewpoints as investor and project developer.
Keywords. Carbon fi nance, development, climate change, rural communities, food security, innovative fi nancial model, sustainable agriculture, NGOs, corporate responsibility, agroforestry.
From the 1990s onwards, scientists were alerting the interna-tional community to the risks posed by climate change, and highlighting the role played by greenhouse gases (GHGs). Although there are many GHGs, carbon has become the ‘unit of account’ used to measure emissions resulting from human ac-tivity, as well as the storage capacity of natural and man-made ecosystems. The carbon footprint has therefore become an indi-cator of the pressure imposed by man on our environment.
But looking beyond this recent and rather negative connota-tion, we should remember that carbon plays an essential role that is central to the cycle of life: in plants that fi x carbon using the miracle of photosynthesis, in the organic material that con-ditions soil fertility, and in the many interactions between car-bon and the water cycle.
And then there are all the interactions that inevitably occur in the context of soil fertility, food security, forest cover, water re-sources, and many other environmental aspects. Consequently, even though carbon cannot by itself encompass the full com-plexity of the living world, it could be an interesting and rele-vant indicator of ecosystem vitality and evolution. For example,
evaluating alternative agricultural models from the viewpoint of carbon fl ows may be a relevant way of assessing their ‘sus-tainability’. Furthermore, research and practical experience show that ‘reloading’ natural and semi-natural ecosystems with carbon leads to substantial spin-off benefi ts for other aspects of natural capital, which in turn generate positive consequential effects that improve the lives of local people.
Why give carbon an economic value?
Until recently, the act of emitting carbon had no particular eco-nomic effect on a company, public institution or individual: the collective cost of emissions and their impact on climate change did not form part of the cost of production for business. Conversely, the social cost of emissions (rising sea levels, changes in rainfall, etc.) was met by society as a whole. The European Union’s creation of a market mechanism marked a signifi cant step forward in attributing value to carbon. The prin-ciple is simple and is based on a rarity effect created by a pre-dominantly political decision: to reduce greenhouse gas emis-sions, the European Union decided to cap the emissions of
© Author(s) 2012. This work is distributed under the Creative Commons Attribution 3.0 License.http://factsreports.revues.org/2106Published 10 October 2012
33www.factsreports.org

What if carbon was much more than just a funding mechanism?
2 Field Actions Science Reports
those industries emitting the highest levels of carbon by allocat-ing quotas, which are effectively ‘emission permits’. Companies can achieve their individual emissions reduction targets by in-troducing reduction policies, implementing innovative tech-nologies or buying ‘carbon credits’ by way of compensation or ‘offset’. These credits are generated by projects which enable emissions to be avoided elsewhere, especially in developing countries, through renewable energy projects or polluting in-dustry emission reduction projects, for example. The price of carbon is dictated by demand (and is therefore linked to state-allocated quotas) and the availability of carbon credits. The re-sulting carbon value has the effect of making business more responsible, and encouraging companies to reduce their emis-sions by adopting ‘clean’ technologies and production methods. It also enables signifi cant levels of private-sector funding to be injected into development projects to supplement multilateral and/or bilateral publicly-funded aid. But until now, carbon in-vestment in the countries of the south (via the Clean Development Mechanism or CDM) has focused essentially on industrial emission reduction projects or energy generation projects. Investment in projects relating to natural ecosystems, deforestation or agriculture has been very marginal, since these projects are more complicated to develop and are slow to gener-ate carbon credits, and therefore slower to deliver a return on investment. But recently, we have seen a signifi cant increase in such initiatives, as a result of the acceleration effect created by carbon funding.
Figure 1. © hellio-vaningen
Since the Copenhagen Climate Change Conference, a series of major international conferences have demonstrated the dif-fi culty involved in getting nation states to agree on the progres-sive widespread introduction of this carbon market, which is currently focused essentially on Europe. But despite the prob-lem posed by the absence of any global governance of environ-mental issues, new carbon markets have been launched - or are due to be launched soon - in America and Asia. A so-called ‘voluntary’ market has also developed internationally amongst companies that decide to offset part of their emissions, even though they are no longer affected by the quota obligation. Whether European, North American or based elsewhere, these companies are generally more demanding in terms of the social value of carbon credits, and seek to prioritise those credits that have the highest social and environmental impact. Consequently, they are more highly motivated to invest in
development projects. In this regard, it is helpful to remember that publicly-funded development aid has, until now, focused essentially on infrastructure, education and famine relief proj-ects (with the emphasis on remedial rather than preventive aid, especially in the latter case), and too little on renewable natural capital.
Carbon Markets and the Livelihoods Fund
Without the carbon market, there would be no Livelihoods Fund, or at least not in its current form. What makes Livelihoods different is that invests only in projects that deliver high social and environmental impact for the benefi t of poor rural commu-nities. This fund brings together companies committed to envi-ronmental protection. Their voluntary investment in Livelihoods enables these companies to fund major projects, such as the 3-year restoration of 10,000 hectares of mangrove habitats by 400 villages in Senegal, and the planting of 6 million fruit trees by 300 villages in India. Primarily, these investments generate value for the rural communities that are involved in, and benefi t from, them: for example, restoring the mangrove habitat is about the large-scale re-creation of a food-producing ecosystem through the breeding of fi sh and crustaceans, protecting crops against seawater inundation and putting in place resources that can be exploited sustainably (including biomass, honey and food production). As they grow, these trees store large quanti-ties of carbon, and therefore contribute to slowing the process of climate change. It is this stored carbon that the Livelihoods Fund converts into carbon credits. In return for their invest-ment, the Fund’s partner companies will receive these carbon credits over coming years, and can then use them to offset their own emissions or sell them in the carbon market. One of the special features of the Livelihoods Fund is that these companies (Danone, Schneider Electric, Crédit Agricole, Hermès International, La Poste and CDC Climat) have agreed to pre-fund these projects, which means providing rural communities and development organisations at local level with the fi nancial resources needed at the outset of the project and throughout its life. They therefore accept the risk of investing at the outset, in the knowledge that the carbon credits will be generated over a long period. Selecting high-quality projects and assessing the abilities of project developers to deliver them successfully over the long term are therefore essential aspects of this approach. Unlike traditional subsidies, which are usually granted for a short period (3 years) and justifi ed on the basis of a business report, carbon projects require a long-term partnership under which results are measured and verifi ed: carbon credits are not released on the basis of a report, but require confi rmation of trees ‘in due form’; trees whose growth is verifi ed by indepen-dent auditors! This therefore requires the necessary action to be taken in conjunction with local communities to ensure that their plantations are protected and maintained in the best interests of all stakeholders.
The sit uation that prevailed before the carbon markets were created was one in which all companies and individuals had an unlimited and free right to emit GHGs. Every human activity, whether conducted by companies, public authorities or each of us as individuals, contributes to greenhouse gas emissions. Following the Cancun and Durban Climate Change
34 FACTS Reports

What if carbon was much more than just a funding mechanism?
3www.factsreports.org
Conferences, it is now acknowledged and accepted that global warming cannot be contained within the 2°C limit, given all the consequences that doing so would have for the most vulnerable population groups. With the invention of new production and consumption methods, technological innovation is playing, and will continue to play, a determining role in our ability to reduce our collective environmental footprint. But at the same time, the growth of new industrial power sources and a demographic trend that will see the world’s population exceed 9 billion by 2050 will accelerate the rate of emissions. The good news is that natural ecosystems, forests, mangroves, certain agricultural models and oceans do exactly the reverse by storing enormous quantities of carbon. These systems are crucial for the food-producing resources of hundreds of millions of people living in rural poverty, but in many areas of our planet they are coming under increasing threat. The challenge is precisely to create a ‘bridge’ between these two faces of the same reality. The choice is not between ‘reduction’ and ‘offsetting’, because we are duty bound to pursue both.
What is required is to focus much more closely on offsetting initiatives within projects that have a twofold impact: on the environment and on poverty.
A new approach for development project managers
The reckless exploitation of available natural resources tends to compromise the sustainability of development initiatives. The success of the poverty reduction and food security strategy re-lies on fi nding the right balance between people’s short-term needs and the sustainable management of available resources. So the reason why SOS SAHEL is interested in ‘carbon’ proj-ects is that they offer opportunities for very poor communities living in the areas where we work. Such projects must contrib-ute to meeting their energy and food needs, at the same time as mitigating the negative effects of climate change, especially the reduction of greenhouse gas emissions. In addition to boosting income levels for farming families, our role is also to facilitate change in certain production practices through the widespread development of sustainable, eco-friendly agro-silvo-pastoral systems.
From this point of view, carbon projects oblige development organisations to adopt a systemic approach to modelling that encourages recipient communities and developers to accept re-sponsibility. The result is a focus on initiative effectiveness. In seeking to increase soil and plot biomass, we are also targeting productivity improvements per unit area. The supply of ecosys-tem services contributes not only to carbon sequestration, but also improves water use effi ciency, restores soil fertility and improves crop diversity, etc. In those regions of the Sahel where the desertifi cation process sometimes appears irreversible, car-bon projects can provide a real opportunity for change. They create a virtuous cycle in which communities and developers can engage in sustainable change. They aim to achieve a long-term impact and comply with environmental standards. However, they do require acceptance of the framework in which effi ciency and results are precisely measured over time. This approach is restrictive, requires expertise and high quality standards, but the bottom line is that it produces impressive re-sults and encourages us to think differently about
development.For example, including carbon processes has resulted in the
teams of SOS Sahel acquiring new skills and changing the way in which development initiatives are designed and conducted. In practical terms, you have to be certain that the model or ap-proach developed will deliver the anticipated results before you can deploy the project on a large scale. In order to comply with the requirements surrounding long-term implementation, the teams involved have been trained in risk analysis and new mon-itoring techniques. For example, a more effi cient stove design to save energy must be standardised before it can be introduced on a widespread basis. Its large-scale provision to communities must be done in accordance with this requirement for standardi-sation, at the same time as monitoring the situation to ensure that it is actually being used on a continual basis at local level to guarantee delivery of the anticipated results. It is essential to gain a clearer understanding, not only of the industrial aspects of producing more effi cient stoves, but also of the economic and social conditions of rural families in order to identify an appropriate technology and a product they can actually afford to buy. Experiments like these have demonstrated that the carbon economy can offer a new dimension for the implementation of large-scale projects.
Figure 2. © hellio-vaningen
The conditions required to ensure the success of this type of project
The success of this type of project relies on stakeholder com-mitment. The fi rst stage is a sustained commitment shared by communities, developers (NGOs) like us and political and fi -nancial decision-makers, each of which must benefi t from the value involved in creating the project or the value created by the project. Reliable databases are also essential, and in most cases simply do not exist. Investment relies primarily on the quality of the teams involved and their expertise. Human resources must be available, properly trained and well informed. The in-stitutional framework must be constructed in such a way as to enable all those involved to have a clear understanding of the approach adopted and the desired results. Lastly, the monitoring system must be suffi ciently effi cient and effective to supply project progress data quickly and accurately. In this type of project, everyone must play their part fully and give their long-term commitment.
35www.factsreports.org

What if carbon was much more than just a funding mechanism?
4 Field Actions Science Reports
These new approaches to development show us that it is pos-sible to combine the interests of communities (meeting their long-term basic need for food security, energy security, income, etc.) with good environmental practice and the interests of car-bon funding providers to generate carbon credits. This approach brings with it a permanent system of observation and supervi-sion of those parameters used to evaluate the impact of projects on climate change and social behaviour. NGOs are becoming increasingly expert in a broad range of different areas and com-plex issues. They must adapt, but at the same time they must also retain their expertise and the value they add as local stakeholders working in the fi eld. In achieving this, fi nancial and technologi-cal resources are as essential as increased human expertise.
Applied in this way for the benefi t of development, carbon funding is certainly not a universal panacea. It does not provide a response to every situation, and it must be implemented on the basis of principles for action that guarantee a balanced distribu-tion of the value created. But it does contribute to changing the vision and practices of development stakeholders by breaking down traditional barriers and creating new alliances between NGOs and companies, and between public-sector development aid, philanthropy and private investment. It demands long-term commitment and its results are subject to very precise measure-ment. In this sense, it is now a factor for progress. Lastly, unlike a carbon tax, which would simply boost national budgets, car-bon investments are targeted directly at clearly-identifi ed prac-tical projects.
Bernard Giraud is the co-founder of the Livelihoods Fund, a new type of investment fund that seeks to create value both for investors and the rural communities it invests in. Livelihoods was operated experimentally from 2008 until 2011, when it was offi cially created by Danone in conjunction with other leading companies, includ-ing Schneider-Electric, Hermes International, Credit Agricole, CDC Climat, La Poste and Voyageurs du Monde. The Fund uses the carbon fi nance mechanism to support large-scale ecosystem restoration, agroforestry and energy access projects that provide long-term revenue and food security for local people and high-quality carbon credits for the partner companies, thereby contributing to reducing their carbon footprints.
Before the creation of Livelihoods, Bernard Giraud was Vice-President Sustainability and Shared Value Creation at Groupe Danone, a leading international food company. In this role, he played an important part in establishing Danone as a pioneer in social innovation and integrating social responsibility and sustainable devel-opment into the core strategy and business practices of the company. Bernard Giraud has also served as a board member and CEO of Corporate Social Responsibility Europe (CSR-E), a leading European social responsibility organisation.
Rémi Hémeryck is an agroeconomist, and has been Chief Executive of SOS SAHEL since 2002. Originally from Picardie Verte in northern France, he grew up on his family’s dairy farm in the Pays de Bray
area. He learned the practical aspects of farming from a very early age. At the age of 20, he set off to fi nd out how agriculture worked in other parts of the world, from the American Midwest to Heilongjiang in China, and the Grassfi elds of Northwest Cameroon. For three years, he contributed to the Bafut village community develop-ment project in Cameroon as a Volontaire du Progrès (Volunteer for Progress). Working with Peul farming fami-lies, he surveyed the fl ora of the prairies and mapped the depletion of natural resources, as well as developing pastoral improvement plans.
At the start of the 1990s, he returned to his home region to train young farmers, but it wasn’t long before he was off again, this time to Casamance in Senegal to set up local development projects. In 1995, he conducted a survey of the dairy reblochon economy as part of his studies in agricultural development. He joined SOS SAHEL in 1997, and was its technical director before becoming chief executive.
36 FACTS Reports

© Author(s) 2012. This work is distributed under the Creative Commons Attribution 3.0 License.http://factsreports.revues.org/2175Published 10 October 2012
Suppressed Demand and the Carbon Markets: Does development have to become dirty
before it qualifi es to become clean?Looking into Passive Solar Houses (PSH)
Authors: Marina Gavaldãoi, William Battyeii
i Technical Director – GERES Climate Change Unit; GERES’ (Group on Environment, Renewable Energy and Solidarity) Climate Change Unit, 2 Cours Foch, 13400 Aubagne – France, E-mail: [email protected]
i Former Climate Finance Analyst - GERES Climate Change Unit; GERES’ (Group on Environment, Renewable Energy and Solidarity) Climate Change Unit, 2 Cours Foch, 13400 Aubagne – France
E-mail: [email protected]
Co-Authors: Mathieu Grapeloupiii, Yann Françoisiv iii Communication and advocacy offi cer, GERES’ (Group on Environment, Renewable Energy and Solidar-
ity) Climate Change Unit, 2 Cours Foch, 13400 Aubagne – France, E-mail: [email protected]
iv Carbon fi nance assistant – GERES’ (Group on Environment, Renewable Energy and Solidarity) Climate Change Unit, 2 Cours Foch, 13400 Aubagne – France, E-mail: [email protected]
Acknowledgements. The GERES Climate Change Unit1 wishes to give a special thanks to CDC Climat for its support as well as to all the members of the Suppressed Demand Working Group, Hydrologic Cambodia, colleagues from GERES Cambodia and GERES India. Together we hope to make carbon fi nance a reality for funding development and climate relevant projects in Least Developed Countries and poor regions.
Abstract. Suppressed Demand refers to a situation where Minimum Services Levels (MSL) necessary for human development are unavailable to people or only available to an inadequate level. Numerous barriers, such as low income levels or lack of infrastructure and skills prevent access to MSLs, such as potable water, cooking energy, lighting and electrifi cation. We investigate the concept of suppressed demand as it applies to Clean Development Mechanism (CDM) and market based incentives for GHG emission reductions. We argue that carbon markets have shown signifi cant and catalytic potential for project development so far, but they have had limited impact on the poor, as the poorest tend to emit least. Including “suppressed demand” is in line with the objectives of the CDM and can go some way to re-balance the CDM as the development mecha-nism it was intended to be, and to make it relevant for the poor. Moreover, it is in fact necessary in terms of climate change limitation, as it is necessary to include low emissions areas into emission trading regimes and to incentivize lower emissions growth in poor regions. Through three case studies of CDM relevant develop-ment projects that deal with MSLs, we fi nd that current CDM methods do not adequately address suppressed demand and that simple, transparent and common changes to assessment methods can have a signifi cant im-pact on the leverage potential of these projects in the carbon market. Including “Suppressed Demand” in the CDM in the ways suggested can therefore facilitate project development in low emissions regions, by making it fi nancially viable, and thereby avoid GHG emissions in the future.
Keywords. suppressed demand, Clean Development Mechanism (CDM), small scale, minimum services level, Millennium Development Goals (MDGs), passive solar houses.
1 Swan Fauveaud, William Battye, Kimberly Buss, Marina Gavaldão and Mathieu Grapeloup
37www.factsreports.org

Suppressed Demand and the Carbon Markets: Does development have to become dirty before it qualifi es to become clean?
2 Field Actions Science Reports
1 Introduction
Access to modern forms of energy and other basic services, such as potable water, sanitation and housing, is central to development and poverty alleviation. Lack of access to Minimum Service Levels (MSLs), particularly energy and water, is a serious barrier to economic and social develop-ment and the achievement of the Millennium Development Goals (The Secretary-General’s Advisory Group on Energy and Climate Change, 2010).
Many still remain without services that are able to meet basic human needs. In large swathes of Least Developed Countries (LDCs) and poor regions of Middle Income Countries (MICs), the latent demand for MSLs is currently not being met.
Mitigation of GHG emissions and expansion of basic ser-vices are critical and immediate global imperatives. Poor and under developed regions tend to have low levels of per capita emissions. The latent demand that exists for basic services is “suppressed” due to barriers such as low income, weak infra-structure and inadequate access to technology. Many of to-day’s low income societies have yet to reach level of eco-nomic development that is emissions intensive; they remain reliant on wood fuels, have no electricity and poor access to potable water, and they do not pollute signifi cantly because in many cases they are too isolated or too poor. Pure mitigation instruments that focus only on trying to reduce emissions and not avoid emissions are therefore likely to have minimal im-pact and offer no incentives for alternative “cleaner” devel-opment pathways to the poorest.
2 Re aching the Minimum Service Levels without falling into carbon lock-in
With current trends, despite progress, population growth means that in 2030 the amount of people relying on tradi-tional use of biomass for cooking will be the same as today (OCDE/I.E.A. 2011). In other words, our current actions in the provision of basic services such as energy are failing, both in terms of scale and pace. Moreover, there is a substan-tial inequality in access to services and the quality of services between rich and poor societies. The poorer three quarters of the world’s population use only 10 per cent of global energy (OCDE/I.E.A. 2011). Globally, the IEA estimates that 20% of people live without access to electricity 40% are reliant on biomass for cooking, more than 1 billion people are without access to safe drinking water and 2.6 billion without basic sanitation (OCDE/I.E.A. 2011). Lack of access to modern forms of energy tends to go hand-in-hand with a lack of pro-vision of clean water, sanitation and healthcare.
With income levels far below those of developed coun-tries—and per capita emissions on average just one-sixth those of the industrialized world—developing countries will continue to increase their emissions as basic services are pro-vided to the population (Chandler, Secrest et al. 2002). Given this context, addressing climate change in poor regions of developing countries needs different strategies to take into account their specifi cities that are linked to cultural habitudes and available resources.
The magnitude of the change required in the global sys-tems can be expected to be very important. The immediate need is to secure affordable, clean and reliable MSLs at the household level. If current national and international devel-opment efforts eventually succeed in developing economies and LDCs, energy consumption and provision of basic ser-vices will have to increase substantially. If development goals are to be achieved, MSLs should be universally achieved2.
Limiting the effects of climate change by fi xing maximum temperature rise or GHG concentration will create a space, a “carbon-space” for GHG emissions in a sustainable develop-ment perspective (Opschoor 2009). LDCs and other poor countries require ‘carbon space’, to grow and overcome pov-erty. This is the case in Africa, where a growth in energy ac-cess for productive uses seems essential to break the vicious cycle of low incomes leading to poor access to energy ser-vices (Brew-Hammond 2010). Increasing the provision of MSLs in developing countries, particularly those at the lower end of the per capita income scale, requires a substantial part of this “carbon-space” both on a temporal scale and in terms of emissions.
On the other hand, according to Unruh’s works, the devel-opment into an intensive carbon economy creates infrastruc-tures, institutions and cultural practices. The system created is then dependent of the economic model and so, can be called, “carbon locked-in”; that in its turn inhibits the devel-opment of alternative sources of energy and delays the neces-sary switch to a decarbonized economy. For Unruh, develop-ing countries has the chance to avoid the “carbon lock-in” and to leapfrog into a low carbon economy.
By creating an incentive to the wide implementation of these low-carbon technologies, Suppressed Demand method-ologies could be a relevant mechanism to avoid a global “car-bon lock-in” with disastrous consequences for humanity.
3 Carbon markets and the poor: a contradiction in terms?
The single Kyoto Protocol fl exibility instrument that in-volves developing countries is the Clean Development Mechanism (CDM). It has the twin objectives of reducing emissions and contributing to sustainable development ob-jectives. International carbon markets have a crucial role to play in fi nancing projects and providing innovative technol-ogy and fostering access to clean and renewable energy. Offset markets through the Clean Development Mechanism have resulted in $27 billion in fl ows to developing countries in the past 9 years, catalyzing low carbon investments of over $100 billion (World Bank 2011). These fl ows and catalytic effects on technology and capability are essential for meeting the increasing energy demand and providing basic services (Arens, Burian et al. 2011). Even if the CDM is often framed
2 Such as the UN target to achieve universal access to modern energy services, and for a 40 per cent reduction in energy intensity by 2030, the Stockholm Statement (http://www.worldwaterweek.org/documents/WWW_PDF/2011/2011-Stockholm-Statement.pdf) and the Millennium Development Goal of reducing by half the proportion of the population without sustainable access to safe drinking water and basic sanitation.
38 FACTS Reports

Suppressed Demand and the Carbon Markets: Does development have to become dirty before it qualifi es to become clean?
3www.factsreports.org
as being directly and inherently linked with sustainable de-velopment, looking at the previous projects, the CDM and sustainable development are concepts that are not always wo-ven together. According to the literature a number of CDM projects doesn’t provide local sustainable development ser-vices (Nussbaumer 2009). The sustainable development di-mension is not a requirement of the CDM; it should be seen as a main driver for developing country interest in participat-ing in CDM projects (Gilaua, Buskirk et al. 2007).
Despite the CDM aims, the mechanism has demonstrated its irrelevance to billions of people that lack access to MSLs, especially the Least Developed Countries (LDCs). In fact, LDCs account for just 1.2% of all CDM projects3 and just 0.5% of the Certifi ed Emission Reduction (CER) volume is-sued (UNEP Risoe 2011).
In many Least Developed Countries (LDC) and Middle Income Countries (MIC), the low level of historic emissions leads to such insignifi cant creditable emission reductions that carbon fi nance revenue has a marginal or negligible impact. Moreover, assuming that a continued supply of low/poor quality services will continue throughout a crediting period does not align well with the development aims of CDM (CDM SSC Working Group 2010)4. The challenge is how to reform the CDM and other emerging mechanisms such as Nationally Appropriate Mitigation Actions (NAMA), to cre-ate much greater participation from a wider range of develop-ing countries post-2012 that can transit them to a low carbon development path.
4 “Suppressed demand” within CDM
Unmet latent demand for basic services is termed “suppressed demand”. Suppressed demand occurs where MSLs are un-available or only available to an inadequate level. For exam-ple, households without electricity, those that are dependent on biomass for cooking or those who do not have access to adequate amounts of potable water.
Income poverty, lack of infrastructure such as roads or net-works, high unit costs of energy and services and issues of physical access all suppress demand for services such as cooking energy, clean water or lighting. As these barriers are removed with economic development and technology levels i.e. people gain higher incomes and greater access to services (through government, private or other channels), people will certainly access higher level of service than they currently do.
Considering the concept of suppressed demand, alongside simplifi ed and standardized approaches, to CDM projects is one curative measure to the failures and imbalances of the
3 At validation, Request Registration or Registered4 The SSC WG notes that “particularly in the context of LDCs/SIDs and economically restricted regions of developing countries, over reli-ance on historical data results in very low emission baseline scenarios with consequent disregard for the latent demand for energy and other that exist...an assumption of continued supply of low/poor quality ser-vices throughout the 7 or 10 years of crediting period, as these countries/regions develop, may not align well with the development aims of CDM...such low baseline levels may result in such insignifi cant levels of emission reduction...that carbon credit revenue has a marginal or neg-ligible impact.”
CDM. The concept of suppressed demand and avoided emis-sions has emerged in development and climate policy circles (Winkler and Thorne 2002). It is generally believed that by adequately addressing the issue of suppressed demand in the CDM and NAMA5, can drive access to energy and other es-sential services while decarbonizing simultaneously. It is also thought to go some way to improving the regional distribu-tion of the CDM and increase its relevance to the billions living in conditions of energy poverty and lacking basic ser-vices (Suppressed Demand Working Group).
Basic human needs in the context of the CDM relate main-ly to energy services and other activities, which are relevant as CDM project types. Yet, there is no defi nitive of exhaus-tive list of basic services for human needs or agreement on the adequate quantity or quality of services to meet basic hu-man needs. Article 25 of the UN declaration of Human rights states that “everyone has the right to a standard of living ad-equate for the health and well-being of himself and of his family, including food, clothing, housing …” Access to and delivery of basic needs services is therefore a condition in which the population can obtain water, food, shelter and health services in adequate quantity and quality to ensure sur-vival and satisfy their right to “life with dignity”. The UN also notes that “Energy services […] provide cross-cutting infl uences on both social and economic development, thereby infl uencing a nation’s ability to achieving Millennium Development Goals (MDGs)”.
The CDM interpret basic human needs as “services re-quired to meet basic human needs for example, basic housing and basic energy services including lighting, cooking, and drinking water supply”. In our analysis, basic services refer to: “Basic energy needs for clean cooking, treatment of drink-ing water supply and heating fuels, lighting, electricity (at home and in public services), motive power for productive uses, energy needs for cooling, information and communication”.
Most current CDM project assumes that current emission levels as the baseline. This baseline is then compared with the project to quantify the emission reductions of the project. Setting project baselines in suppressed demand situations as-sume that poor regions will develop in the future. In doing so, GHG emissions will often increase, as technologies, fuels and practices are adopted. For example project dealing with families using wood fuel would assume that the families would migrate up the energy ladder to other more emissions intensive fuels as they became wealthier and had better ac-cess to fuels.
Within the project, although emissions in the region may level off or actually slightly increase relative to the previous scenario, the technology introduced by the CDM project may still result in emissions reductions relative to the baseline sce-nario. In other words, compared with the business-as-usual development path (without clean technologies), the technology introduced through the CDM may be cleaner. In this way the CDM project would ‘leap-frog’ to cleaner technologies and avoid emissions, without the scenario fi rst being dirty.
5 NAMAs, Country targets/pledges, MRV, and other decarbonizing activities linked to energy access and basic services
39www.factsreports.org

Suppressed Demand and the Carbon Markets: Does development have to become dirty before it qualifi es to become clean?
4 Field Actions Science Reports
5 METHOD S
Our method consists in a desk review of the relevant UNFCCC decisions on the integration of suppressed demand on CDM methodologies (Item 3.1) and a case study on Passive Solar Houses located in a TehriGarhwal, in the Uttarakhand state in Northern India (Item 3.2). We used a step by step analysis in order to investigate the project eligi-bility to CDM methodologies and how suppressed demand is treated. Then we discussed the different approaches (consid-ering or not the default values recommended by the Executive Board, as well as the minimum services level recommended by the World Health Organization – WHO) and suggests revi-sions to better include suppressed demand.
6 RESULTS OBTAINED
Integrating Suppressed demand in CDM projects
The modalities and procedures of the CDM state that “the baseline may include a scenario where future anthropogenic emissions are projected to rise above current levels”. The CDM has also prepared guidelines, aiming to achieve consis-tency in the methods to address the situation of suppressed demand in CDM baseline and monitoring methodologies where future emissions by sources may rise above current level. These guidelines aim to “harmonize such approaches across CDM methodologies” and provide approaches that “can be used in baseline and monitoring methodologies to address situations of suppressed demand. They are applicable when a minimum service level, was unavailable to the end user of the service prior to the implementation of the project activity.” (CDM Executive Board 2011)
In the CDM guidance (CDM Executive Board 2011), sup-pressed demand occurs when services for “Minimum Services”, that are required to meet basic human needs, are inadequate. It defi nes the income effect, rebound effect and minimum services. Like this, the current CDM methodolo-gies in rare cases do already account explicitly for suppressed demand. The guidance also suggests methodological ap-proaches for two issues:
I. The identifi cation of the baseline technology/ mea-sure under a suppressed demand situation; and;
II. The identifi cation of the baseline service level that should be used to calculate baseline emissions in a suppressed demand situation.
The CDM guidance aims to establish baseline fuels, tech-nologies and the level of service for determining the Emissions Reductions of a project. In simplifi ed terms, it puts forward a type of barrier analysis for alternative provisioning of service for the baseline. Each alternative (fuel or technol-ogy for example) is ranked in terms of the quality of service they provide.
However, according to our analysis, current interpretations are so far not fi eld tested or proven to have an impact on proj-ect development and can provoke either over crediting or un-der crediting of a certain project activity. Moreover, there is
no defi nitive of exhaustive list of basic services for human needs or agreement on the adequate quantity or quality of services. In many cases this will require political agreements on acceptable levels of service.
7 Case Study: Passive Solar Homes in Nothern India
7.1 Project description:
The project uses solar energy, harnessed through energy effi ciency measures implemented in buildings. A com-bination of energy effi ciency measures as: Improved Insulation (II) and one of the three passive solar tech-nologies for solar gain: Trombe Wall (TW), Direct Gain (DG) or Attached Greenhouse (AGH), are installed.
The project is located in the high altitude desert of the Western Indian Himalayas. Winter temperatures in this area can be as low as -30°C, there is little precipitation and scarce vegetation. Villages are located between 2’700 and 4’600 meters above sea level and are often extremely geographically isolated. Due to the lack of natural resources and/or lack of fi nancial means heating needs during the long winter period (from November to March) are high and indoor temperature fall well below basic minimums.
In this environment, households use substantially more energy than do people living in warmer climates or at lower altitudes. To reduce their fuel consumption and costs, often close the doors and windows. This exacer-bates the amount of smoke in the house and exposes people to greater risks associated with indoor air pollu-tion, such as respiratory diseases.
Over the course of 7 years the project will integrate en-ergy effi ciency measures in 250 households per year in 100 rural and remote villages.
Figure 1. Passive solar house owners from the TehriGarhwal in the Uttarakhand state in Northern India (2008)
40 FACTS Reports

Suppressed Demand and the Carbon Markets: Does development have to become dirty before it qualifi es to become clean?
5www.factsreports.org
7.2 Step 1: CDM Eligibility
The CDM used methodology AMS I.E./Version 046. This category comprises activities to displace the use of non-renewable biomass by introducing renewable en-ergy technologies. Examples of these technologies in-clude but are not limited to biogas stoves, solar cookers and passive solar homes.
7.3 Step 2: How are Suppressed Demand Approaches Applied in the Methodology?
The barrier analysis focuses on one technology and one fuel rather than combinations, which is most likely to happen in the project context. It would also lead to the selection of wood as a baseline fuel as all fossil fuels face signifi cant barriers, typically costs and import dif-fi culties, within this region.
This current CDM methodology accounts of suppressed de-mand in terms of:
III. The type of fuel used in the baseline (baseline weighted emission factor);
IV. service level: actual increases in level of thermal comfort attained in the project i.e. using the project level of service in terms of thermally energy pro-duced by the intervention as a baseline.
(I) Baseline Emission Factor
In AMS I.E, the CDM approach uses the same weighted emission factor from the other cases presented before that is for the substitution of non-renewable woody bio-mass by similar consumers, a value of 81.6 tCO2/TJ7.
The fuel used pre-project can be assumed to be biomass as it represent 99% of the fuel used by households in the Uttarakhand (Saud, Singh et al. 2011). Because the poor people in rural areas lack access to electricity and modern fuels, they rely primarily on human and animal power for mechanical tasks, such as agricultural activi-ties and transport, and on the direct combustion of bio-mass (wood, crop residues, dung) for activities that require heat. Biomass fuels are typically used for cook-ing (which dominates inanimate energy consumption in most warm regions), space heating, heating water for bathing, and meeting some industrial heating needs. According to the International Energy Agency almost
6 For more information please go to: http://cdm.unfccc.int/methodolo-gies/DB/I1DGDUD1D5J0KMLSZFWMD3W9Z47OZZ/view.html consulted on 02/29/20127 “This value represents the emission factor of the substitution fuels likely to be used by similar users, on a weighted average basis. It is as-sumed that the mix of present and future fuels used would consist of a solid fossil fuel (lowest in the ladder of fuel choices), a liquid fossil fuel (represents a progression over solid fuel in the ladder of fuel use choic-es) and a gaseous fuel (represents a progression over liquid fuel in the ladder of fuel use choices). Thus a 50% weight is assigned to coal as the alternative solid fossil fuel (96 tCO 2 /TJ) and a 25% weight is assigned to both liquid and gaseous fuels (71.5 tCO 2 /TJ for kerosene and 63.0 tCO 2 /TJ for Liquefi ed Petroleum Gas (LPG).” (AMS I.E v04)
2.7 billion people relied on the traditional use of bio-mass for cooking in 2009. It concerned 51% of the de-veloping countries population in 2009 and could decrease to 43% according to the I.E.A. New Policies Scenario in case of investments in biogas solutions, ad-vanced cookstoves and LPG solutions (OCDE/I.E.A. 2011).
Space heating requires large amounts of fuel. The study made by GERES in the TehriGarhwal district (India) shows a marked increase in the use of biomass with in-creasing altitude, and fuel use was shown to be two to three times greater in winter than in summer (Biney 2007). The fi rewood consumption was reported at around 1.07 kg/person/day below 500 m altitude, rising by an additional fuel requirement of about 0.8 kg/per-son/day per 1,000 m, to reach 2.8 kg/person/day above 2,000 m.
According to the International Energy Agency “Current Policies” and “New Policies” scenarios fossil fuels would represent respectively 82% and 77% of the In-dian total primary energy demand in 2035 (OCDE/I.E.A. 2011). Therefore the default (Tier 1) emissions factor (EF projected fossil fuel use) suggested by the UN-FCCC looks realistic and balanced. However, it is im-portant to stress that projections are always submitted to uncertainties, and that energy generation in remote areas differs from the national energy mix with for ex-ample high grid connection costs (OCDE/I.E.A. 2011).
In that line, many studies suggest that, at the national level (Tier 2), commercial energy of a higher effi ciency such as LPG and Coal and electricity are steadily re-placing the traditional energy resources being con-sumed in the rural sector. Suffi cient data and analysis exists to develop a likely future energy mix.
However, looking at fuels is not enough. Using differ-ent fuels also means that different technologies will be used – comparatively more effi cient electric heaters or LPG burners would be used. The Tier 3 emissions fac-tor while similar would have radically different make up, 40% Coal, 20% electricity (grid connection - hydro sources) and 40% LPG. The Emissions factor would in this case be lower than both Tier 1 and Tier 2 emissions factors.
(II) Minimum Service Level
The methodology does incorporate desired service lev-els by allowing the quantity of thermal energy generat-ed by the project to be applied to the baseline scenario; however, in the case of projects that do not generate energy, such as PSH projects, minimum service levels are not recognized. There is a large inconsistency in the methodology with regard to this type of project. In fact, in PSH projects, the minimum service level is the in-door temperature achieved, which is not easily convert-ible in emissions equivalent value considering the wide range of different buildings.
41www.factsreports.org

Suppressed Demand and the Carbon Markets: Does development have to become dirty before it qualifi es to become clean?
6 Field Actions Science Reports
Indoor thermal conditions are important for health and comfort, although individuals vary in their temperature requirements. The World Health Organization recom-mends a minimum indoor temperature for health of 18ºC, with up to 20-21ºC for more vulnerable groups, such as older people and young children (World Health Organization 1985). Conversely, Poor People’s Energy Outlook suggests a minimum standard or 12°C (Practi-cal Action 2010).
Considering this range, a Minimum Service Level of an average of between 12°C to 18°C indoor temperatures would be an ideal minimum level of service provided to households. However, in extreme conditions, where outdoor temperature could well reach -20°C this may not be achievable, even if substantial temperature dif-ferentials (between indoor and outdoor temperatures) are achieved; which does not mean that an increase in temperature won’t increase the householder’s comfort. PSH allows higher average indoor temperatures than traditional houses, reducing half to one third of the fuel use (Agniel, Dorjey et al. 2009). Most notably, the aver-age indoor temperature in PSH houses is 20°C more than the outside temperature and is always above 5°C (Agniel, Dorjey et al. 2009).
There are two crucial factors that then become relevant: 1. The temperature difference between outdoors and indoors (pre-project); 2. The input energy required to generate the temperature difference. A simple compari-son between pre-project and project fuel use can easily be drawn. The fuel difference between non-PSH house-holds and PSH households can also be measured, even if it is still diffi cult to do so in rural and mountains areas in winter. However, the proposed methodologi-cal adjustments for suppressed demand from CDM does not account for suppressed demand on minimum service level of temperature comfort.
8 Discussion of the specifi c implications of the project
After analysis, the following propositions were considered to better adapt the methodology for Passive Solar Houses: Table 1: Methodological revisions/considerations suggest-ed: AMS I.E (V4)According to the different propositions above we developed different CERs potential scenarios8 that are presented in ta-ble 2 below. Table 2: Different scenarios with methodolog-ical revisions/considerations - AMS I.E –V4
Under current CDM methods (A) the CER from the project are an average of 1.4 CER/unit/yr. Applying CDM guidance on suppressed demand to the project baseline (B), CER po-tential would be 1.6 CER/unit/yr. Applying the proposed sup-pressed demand approaches with project specifi c data in (C)
8 If you are searching for better understanding of the different scenar-ios please download the full study “Suppressed Demand and the car-bon markets” at http://www.geres.eu/en/educational-guides
would increase the CER potential of the project. Compared to current CDM approaches (A) of 1.4 CER/unit/yr, new ap-proaches (C9) and the difference in between would result in 2.4 CER/unit/yr on average – a 66% increase. Scenario (D), using tier 3 default value reduces the project potential to al-most the same level than (A) with the current CDM methodology.
The case studies provide a new suggested methodology to explore potential approaches for accounting for suppressed demand. The case studies reveal that changes will potentially increase the CER issuance of the Passive Solar Home project considerably, from 1.4 CER/unit/year to 2.4 CER/unit/year.
Suppressed demand methods can maintain close environ-mental integrity by deriving Tier 2 - National
9 Considering: a local fuel emission factor; considering the energy required to heat households according to fi eld mea-surements; minimum standard for heating for a certain amount of days. As well as excluding the fNRB.
Applicability condition
To ensure the integrity of the approach, only PSH technologies that can demonstrate to provide signifi cant temperature difference (indoor and outdoor) in extreme environ-ments. Defi ned as providing indoor tem-perature degrees higher than a compara-tive household (peers). If project do not meet requirements, through a combination of interventions, projects should not be consid-ered as CDM projects.
Service Level
Option A: Minimum Level of Service (180C) in line with WHO recommendations and the number of days heating required when this temperature is reachable.
Option B: When MSL cannot be reached; Temperature differentials and to factor in the number of heating days required per year with an optional default value.
Biomass Savings
Change specifi c to PSH, to refl ect tempera-ture differentials and to factor in the number of heating days required per year.
Emissions Factor
Option A: Tier 1 default weighted average emissions factor 81.6 tCO2/TJ
Option B: Tier 2 or Tier 3 calculated emis-sions factor (tC02e/TJ) i.e. National or Regional specifi c default factor using a barri-er analysis and/or of forecasting cooking en-ergy mix in 2035 (or other agreed reference point) with comparative effi ciencies for ther-mal devices. This fuel mix must be based on published and credible research or energy modeling and verifi ed as being i) conservative and ii) credible.
Table 1. Methodological revisions/considerations suggested: AMS I.E (V4)
42 FACTS Reports

Suppressed Demand and the Carbon Markets: Does development have to become dirty before it qualifi es to become clean?
7www.factsreports.org
and Tier 3 - Local baselines. This, added to clear monitoring requirements, will allow ERs to be credible, transparently calculated and accurate. Quantifi cation of the possible bene-fi ts, in terms of carbon fi nancing potential requires more in depth analysis, but these fi nding suggest that the impacts would be considerable in encouraging project development in suppressed demand regions.
9 Conclusions
Emissions factors or projected fuel use is important to the viability of CDM projects. However, selecting or projecting ‘the expected fuel(s) to be used’ in the baseline can be chal-lenging and be subjected to numerous nonlinear relation-ships. A particularly important factor is the price and avail-ability fuels. However, there are other unpredictable factors such as local barriers to access to types of fuel and the costs of different technologies over time. The CDM currently ap-proach proposes a “Tier 1” approach where globally appli-cable emissions factors for expected fossil fuel use is used. However, the CDM “Tier 1” default value does often not closely match fi eld realities. Methodological options should allow project developers to develop location or technology specifi c values that refl ect local contexts.
Secondly, the CDM put forward a barrier analysis ap-proach to technology and fuel selection. This essentially ranks alternative fuels and technologies and eliminates those that face fi nancial, infrastructure of skills barriers or low pen-etration rates. While simple and easy to use, it can too easily lead to singular outcomes of fuels and technologies, which is unrealistic and can lead to either over or under crediting de-pending on which fuel/technology is selected. It also does not
allow for use of multiple of fuels, common in LDC’s. It is also diffi cult to assess penetration rates as data is often pro-prietary or unavailable. Moreover, looking at current barrier and penetration and does not assess potential changes in the future; however a survey could be included as part of the monitoring plan of the project to overcome this problem.
Add to that, the traditional view on fuel switching in the household sector of developing countries has been that households gradually ascend an “energy ladder”: there is a simple progression from relatively ineffi cient fuels and ener-gy end-use equipment to more effi cient fuels, electricity and equipment, with increasing income levels and urbanization. However, the switch from ineffi cient to more effi cient fuels and equipment is not a linear or unidirectional process as sug-gested by the simple energy ladder theory. Households tend to use multiple fuels, which correspond to a vector of energy services. Complete switching, where one fuel totally substi-tutes for another, is rare. The reasons for multiple fuel use are varied and not dependent on economic factors alone, al-though the affordability or cost of the energy service also has an important bearing on the household’s choice. In some cases, households choose to use more than one fuel because they want to increase the security of supply. In other cases, the choice is dependent on cultural, social or taste preferences.
Basic human needs in the context of the CDM relate mainly to energy services. However, there is no defi nitive of exhaustive list of basic services for human needs or agree-ment on the adequate quantity or quality of services to meet basic human needs. Minimum Service Levels for some ser-vice exists and can be easily identifi ed or adapted to local situations (as for example mountainous areas or drinking
YrNumber of
PSH operating
A = Current CDM
B = Current CDM meth with barrier analysis
C = Suggested new approach with specifi c values
D = Suggested new approach with default
values
1 250 345 406 605 337
2 500 690 811 1’210 673
3 750 1’034 1’217 1’816 1’010
4 1’000 1’379 1’622 2’421 1’346
5 1’250 1’724 2’028 3’026 1’683
6 1’500 2’069 2’434 3’631 2’020
7 1’750 2’413 2’839 4’236 2’356
Total 7 years 1’750 9’653 11’357 16’946 9’425
Annual average
1’379 1’622 2’421 1’346
Average per Household/year
1,4 1,6 2,4 1,3
Table 2. Different scenarios with methodological revisions/considerations - AMS I.E –V4
43www.factsreports.org

Suppressed Demand and the Carbon Markets: Does development have to become dirty before it qualifi es to become clean?
8 Field Actions Science Reports
water requirements). However, even when internationally recognized MSL exist, such as WHO recommendation for indoor temperature of 18°C, these may not be expressed in energy units. Methodological facilitations must be made in order to convert MSLs into CDM relevant energy units and GHG emissions.
Recognition of suppressed demand would not only in-crease the potential of project in poor regions signifi cantly but also provide clear and predictable carbon market incen-tives for projects working in poor, or poorly infrastructured, regions.
GERES, recommend further researches in order to address some of the barriers to the wide spread of Suspressed Demand methodologies. Research on Minimum Service Levels and their conversion into energy units has to be expanded; it rep-resents a big brake to the development of innovative projects. There must be some works to elaborate more pragmatic methodologies in order to do not burden small-scale projects. Transaction costs remain very high, project developer as well as CDM Executive Board and voluntary standards should work to keep it minimum. These researches are necessary to make the carbon fi nance a leverage to sustainable develop-ment and do not replicate our carbon intensive development model.
References
A gniel, A., R. Dorjey, et al. (2009). Improving winter livelihood of rural population in the cold desert of Western Indian Himalayas. Energy and climate change in cold regions of Asia, Ladakh, India.
A rens, C., M. Burian, et al. (2011). The CDM Project Potential in Sub-Saharan Africa with Focus on Selected Least Developed Countries. Wuppertal and Hamburg, Germany, German Federal Ministry for the Environment, Nature Conservation and Nuclear Safety.
B rew-Hammond, A. (2010). “Energy access in Africa: Challenges ahead.” Energy Policy 38: 2291-2301.
Biney, S. (2007); “Improving the winter livelihood of rural popula-tion and setting up sustainable network to disseminate energy effi ciency in the cold desert of Western Indian Himalayas”; GERES.
C DM Executive Board (2011). CDM Executive Board Meeting 62 report - Annex 6. UNFCCC. Marrakesh, Morocco.
C DM SSC Working Group (2010). Twenty-seventh meeting report - Annex 7. UNFCCC. GRID-Arendal, Norway.
C handler, W., T. J. Secrest, et al. (2002). Climate change mitigation in developing countries. Pew Center on Global Climate Change. Arlington, USA.
G ilaua, A. M., R. V. Buskirk, et al. (2007). “Enabling optimal energy options under the Clean Development Mechanism.” Energy Policy 35: 5526–5534.
N ussbaumer, P. (2009). “On the contribution of labelled Certifi ed Emission Reductions to sustainable development: A multi-crite-ria evaluation of CDM projects.” Energy Policy 37: 91–101.
O CDE/I.E.A. (2011). World Energy Outlook. Paris, France, International Energy Agency.
O pschoor, H. (2009). “Sustainable Development and a Dwindling Carbon Space.” Environmental and Resource Economics 45(1): 3-23.
P ractical Action (2010). Poor People’s Energy Outlook 2010. Rugby, UK.
S aud, T., D. P. Singh, et al. (2011). “Spatial distribution of biomass consumption as energy in rural areas of the Indo-Gangetic plain.” Biomass and Bioenergy 35: 932-941.
S uppressed Demand Working Group. “SDWG Conclusions.” from http://sdwg.wikispaces.com/.
T he Secretary-General’s Advisory Group on Energy and Climate Change (2010). Energy for a Sustainable Future: Report and Recommendations. New York, USA.
U NEP Risoe (2011). CDM/JI Pipeline Analysis and Database. Roskilde, Denmark.
U nruh, G. C. and J. Carrillo-Hermosilla (2006). “Globalizing car-bon lock-in.” Energy Policy 34: 1185-1197.
W inkler, H. and S. Thorne (2002). “Baselines for Suppressed Demand: CDM Projects Contribution to Poverty Alleviation.” South African Journal of Economic and Management Sciences 5(2).
W orld Bank (2011). Mobilizing Climate Finance: A Paper prepared at the request of G20 Finance Ministers.
W orld Health Organization (1985). Health Impact of Low Indoor Temperatures. Copenhagen, Denmark.
44 FACTS Reports

Carbon Intensifi cation and Poverty Reduction in Kenya: Lessons from the Kenya Agricultural Carbon Project
Timm Tennigkeit1, Katalin Solymosi2, Matthias Seebauer3 and Bo Lager4
1UNIQUE forestry and land use, GmbH, Freiburg, GermanyE-mail: [email protected]
2Inter-American Development Bank3UNIQUE forestry and land use, Freiburg, Germany
4Concern, Food, Income and Market (FIM) Programme Manager, DPR of Korea and former Programme Director Vi Agroforestry, Nairobi, Kenya
Abstract. The Kenya Agricultural Carbon Project, implemented by the NGO Vi Agroforestry, is breaking new ground in designing and implementing climate fi nance projects in the agricultural sector. For the fi rst time, while increasing agricultural productivity and enhancing resilience to climate change, smallholder farmers in Africa will receive benefi ts for greenhouse gas mitigation based on sustainable agricultural land management. The project has developed an activity monitoring system for sustainable agricultural land management (SALM) practices that en-ables smallholder famers and extension service provider to track and improve farm production. Based on the de-velopment of a carbon accounting methodology this system, in combination with a carbon model, is monitoring soil and biomass carbon sequestration consistent with the Verifi ed Carbon Standard. As a result farmers in Africa for the fi rst time can benefi t from international voluntary carbon markets.
The paper describes the Vi Agroforestry extension approach, outlines the project objectives and activities, and ex-plains the carbon accounting methodology. Project achievements and lessons learned, but also the challenges that still lie ahead are presented. The authors conclude that the project model has great potential for scaling up and provide a potential blueprint for widespread adoption and effective monitoring of sustainable agricultural manage-ment in smallholder conditions.
Keywords. Kenya, agriculture, carbon, climate change, fi nance, resilience, mitigation, sequestration, sustainable management, greenhouse gas, emissions
© Author(s) 2013. This work is distributed under the Creative Commons Attribution 3.0 License.http://factsreports.revues.org/2600Published 19 April 2013
1. Introduction
Western Kenya is a region with a high number and density of poor rural households – many of them fe-male headed – with malnourished children. The re-gion is also important for staple food production, due to relatively favorable site conditions. The medium distance to Nairobi and state of infrastructure may enable the sustainable intensifi cation of smallholder production systems and the successful integration into value chains in the future.
The Kenya Agricultural Carbon Project (KACP) in Western Kenya is the fi rst soil and agricultural car-bon fi nance project in Africa that benefi ts rural com-munities and smallholder farmers. KACP is being implanted by the NGO Vi Agroforestry. The project addresses the challenges of growing land pressure, insecure livelihoods and the relative ineffi ciency of smallholder agricultural production, all of which are exacerbated by negative effects of climate change. Vi’s strong extension approach, coupled
with a newly developed participatory system for monitoring carbon as well as livelihood benefi ts, has engaged over 60,000 smallholder farmers on 45,000 ha of land so far.
Advisory services from the project enable farmers to change agricultural practices that in the future will give them increased risk adjusted crop yields and carbon revenues. The carbon revenues hereby pro-vide the “icing on the cake” and the rigorous perfor-mance monitoring system will focus management and extension to the real benefi ts of carbon seques-tration which are improved soil fertility and resulting crop yields, increased food security, market access for agricultural produce and increased climate resil-ience benefi ts that accrue to farmers and communi-ties. The KACP project is closely integrated into the larger Vi Agroforestry East Africa programme. The main objective of this programme is to improve liv-ing conditions for 250,000 farmer households through sustainable use of natural resources within the Lake Victoria Basin. This is accomplished
45www.factsreports.org

Carbon Intensifi cation and Poverty Reduction in Kenya: Lessons from the Kenya Agricultural Carbon Project
2 Field Actions Science Reports
through 300 Vi Agroforestry local fi eld advisers who support farmer groups by meeting their demands for capacity build-ing and advisory services. The supported farmer groups/or-ganisations are mainly small civil society organisations (61% women members) consisting of community based organisa-tions, common interest groups, training groups and fi nancial services associations.
KACP has also applied rigorous international and national social and environmental safeguards. An environmental im-pact assessment was conducted at an early stage of the proj-ect and as a result, among other things, a pest management plan was developed to monitor upcoming pests and diseases and to introduce safe pesticide management protocols. The project has also developed a grievances procedure for farm-ers and a revenue distribution system for carbon revenues.
2. The extension approach
Vi Agroforestry is a non-governmental, non-profi t Swedish organization registered in Kenya, Tanzania, Uganda, Malawi and Rwanda with almost 30 years working experience in community development. Vi offers small-scale farmers advi-sory services in the areas of farming as a business, fi nancial services, tree planting, agroforestry and sustainable agricul-ture, sustainable energy, climate change adaptation, mitiga-tion and carbon fi nance. Vi´s holistic extension approach is centered on the principle of looking at development from a livelihoods perspective. A strong participatory group exten-sion approach that empowers farmers to take charge of
development efforts is a crucial success factor in the project. The community groups are expected to clarify their own no-tions of poverty and prosperity, identify the ‘stages of prog-ress’ that characterize movements in and out of poverty, iden-tify major livelihood strategies that households employ in the community, and characterize every household according to their livelihood strategies. This provides an opportunity for extension workers to deliberately target the poor, and to iden-tify and promote enterprises that fi t their circumstances in the local village context. The fi eld advisers sensitize as many farmers as possible through existing traditional institutional structures such as Barazas and other organized meetings or groups (e.g. schools and local NGOs). The approach used by Vi Agroforestry is demand-driven provision of advisory ser-vices, where fi eld advisers meet with groups of farming households and make strategic and action plans together in order to identify the specifi c demands and how to meet them.
During the intensive support phase (year 1 to year 4), a KACP fi eld adviser will work with and recruit 600 farmers per year in a location and hence be working with 2,400-3,000 households at the end of the fourth year. Altogether, there are 28 fi eld advisers in 28 administrative locations within the project (see Figure 1 below). After four years, the external extension services and staff recruitment will be reduced based on the consideration that communities – with support from Vi Agroforestry – will by then have established their own extension advice network consisting of local research stations, government extension services, input providers and other agricultural knowledge brokers. The main intention of
Carbon sequestration
Improved agricultural
practices
Farm enterprise advisory
services
3,000 farmer groups
Monitoring & evaluation
Field extension staff in all 28
project locations
Farm enterprise development, finance
coordination & capacity building
Field operation, head unit,
M&E system
Zonal coordinators; 6 zones/ divisions
Environment & climate change, energy, SALM,
seeds
Administration and accounting
VI Carbon Project Office
Figure 1. Schematic structure of the institutional set up of the project
46 FACTS Reports

Carbon Intensifi cation and Poverty Reduction in Kenya: Lessons from the Kenya Agricultural Carbon Project
3www.factsreports.org
the extensive support phase is to strengthen the enabling en-vironment for a farmerled sustainable implementation system under effective guidance from advisory services to make sure that knowledge is established and maintained within the soci-ety after the programme phases out in the area. However, in carbon project areas, extensive extension support will con-tinue and the related costs will be covered from part of the carbon revenues.
In each location local community facilitators and farmer trainers are chosen by the groups and trained in a similar way as the Vi Agroforestry fi eld adviser staff. Groups and organisations are also strengthened in order to put higher demand on the existing service providers in the area. Seeing is believing, and Vi Agroforestry therefore works with methods like farmer fi eld schools, demonstration plots, farmer tours and exposure visits. In order to increase the adoption of a practice, it is easier if the practise has a rela-tion to a traditional practice (e.g. improving on a traditional one) or if it has some immediate benefi ts for the household (i.e. not only longterm benefi ts). All messages are also bet-ter received if they relate directly to the family or household and its needs or challenges. Agroforestry training centres are also used in order to demonstrate the different practices, and to provide a location where farmers can be trained both in theory and practice.
The extension system is set up in a way that a fi xed number of fi eld advisors (28) train registered farmer groups in SALM practices as well as performing the necessary assessments, monitoring and evaluation of project activities. The farmer groups are formally contracted by Vi Agroforestry. The roll out phase for the implementation of SALM activities is planned to last nine years until more than 90% of farmers have adopted SALM practices.The fi eld extension approach consists of fi ve steps:
Step 1) Stakeholder awareness raising as an entry point in the village and at the regional level to explore ex-isting and complementary extension services;
Step 2) Sensitization and trust building with farmer groups;
Step 3) Recruitment of registered farmer groups includ-ing contracting;
Step 4) Strategic planning, training and advisory services for farmers in SALM practices on a group level, including support for village loan and saving associations;
Step 5) Supporting crop processing, marketing and bulk input purchasing activities to strengthen groups and add value to the crops produced.
Besides the advisory services provided by the project, ag-ricultural productivity is promoted through extension pro-vided by the government and other civil society organizations.
The Vi Agroforestry experience shows that the time hori-zon is crucial in any development project. There is a time lag of 2-3 years between the adoption of improved Agroforestry practices until net additional benefi ts accrue.
In addition, farmers have to invest labor and inputs such as seeds and small-scale irrigation in order to increase soil fer-tility and crop yields. Without extension support providing access e.g. to improved seeds and knowledge on the benefi ts of nitrogen fi xing trees and compost making farmers are of-ten not able to improve their farming systems. Furthermore, the increasing population growth rate is resulting in smaller farm sizes per family and therefore without sustainable in-tensifi cation the threatening food security situation in Western Kenya is not expected to improve. In the project on average an extension worker is serving a farming area of 1,000 ha. The extension intensity is high in the beginning and declines over time. The initial time intensive farmer sensitization process is important to demonstrate the bene-fi ts of Agroforestry and to support the establishment of farmer groups that are a precondition to provide any farm enterprise focused extension support. Farmers in general learn best from observing and sharing information with model farmers. Therefore, the extension is supporting the development of farmer fi eld schools and identifi es model farmers that have great knowledge, are interested to learn and test new practices and are willing to share their experi-ences. This extension approach takes time, but ensures sus-tainability. The project shows that if the time needed for implementation is available and the approaches are partici-patory and close to the target group, then the adoption of technologies will be high, since the farmers themselves will realize the benefi ts that actually can change their family from being poor and food and fi rewood self-insuffi cient, to instead becoming a supplier of both.
3. Project objectives and activities
Vi Agroforestry through extension aims at increasing the pro-ductivity of smallholder farmers and enhancing their resil-ience to climate change, while carbon sequestration is con-sidered as a co-benefi t that will be marketed. Therefore, Vi is promoting farming as a business and the adoption of Sustainable Agricultural Land Management (SALM) prac-tices. The KACP covers 60,000 farmers, organized in 3,000 registered farmer groups. The project rolled out over a 6 year period. The project is located in Nyanza and Western Provinces with the two project locations Kisumu and Kitale, both covering a project area of 22,500 ha. The aggregated project area covers 45,000 ha within a larger project region. The project is fi nanced by the Foundation Vi Planterar träd (“We plant trees”), and the Swedish International Development Agency (Sida). The World Bank administered BioCarbon Fund is buying part of the verifi ed emission re-ductions upon delivery, which means pre-fi nancing of the project implementation activities is required.
The package of SALM activities promoted by the KACP includes a large number of practices that go beyond the ob-jective of soil carbon sequestration. In the table below only those SALM practices are listed that contribute to carbon stock enhancement.
47www.factsreports.org

Carbon Intensifi cation and Poverty Reduction in Kenya: Lessons from the Kenya Agricultural Carbon Project
4 Field Actions Science Reports
Table 1. SALM practices promoted in the KACP that contribute to carbon stock enhancement
SALM ACTIVITY DESCRIPTION
Residue management Residues from crops such as maize, beans, cow peas, sweet potatoes as well as deciduous tree litter are left on the soil. This organic matter creates favourable microclimatic conditions that optimize decomposition and mineralization of organic matter (“surface composting”), and protect soil from erosion.
Composting Composting entails controlled biological and chemical decomposition that converts animal and plant wastes to humus. It is an organic fertilizer made from leaves, weeds, manure, house-hold waste and other organic materials from the farm. Proper composting management leads to an increased proportion of humic substances due to high micro-organic activity, and there-fore the quantity and quality of humus in the soil increase.
Cover crops Cover crops are planted on bare or fallow farmland to reduce erosion and mineralization of organic matter. Green manure is a fast growing cover crop sown in a fi eld several weeks or months before the main crop. Before the main crop is planted, the green manure is then ploughed into the soil.
Agroforestry Agroforestry is a major program activity, which was introduced in the project area by the KACP. Based on the experiences of Vi Agroforestry it proved to be a sustainable economic, social and environmental land management system in smallholder conditions in Western Kenya. Agroforestry increases tree cover which contributes to increased biomass above and belowground, and also improves soil carbon. Several agroforestry practices are part of this project activity:• Agro-silviculture that involves selected species of trees (e.g. Sesbania sesban, Markhamia
lutea, Calliandra, Grevilea robusta and others) grown on cropland in a mixed spatial (scat-tered) system.
• Boundary / hedge tree planting involving planting of selected trees along fi eld boundaries, borders and roadsides which can create a micro-climate for crops, and serve as a wind-break, thus stabilizing the soil.
• Woodlots serve as woody biomass pools for the farmers. Generally, about 40 trees planted in one distinct piece of land can be considered a woodlot. Woodlots can be established near homesteads and separately from cropland.
• Tree shading of perennial crops involves trees grown in combination with other perennial crops such as coff ee, sugarcane and tea. These systems potentially increase the produc-tivity of soils through increased litter inputs, enhanced microclimatic conditions and soil nutrient availability.
• Silvo-pastoral systems combine trees and pastures to produce green manure and im-proved fallowing practices.
• Fodder banks can provide essential and improved feeds to livestock. This type of crop is an integral part of the whole livestock feeding and management system. Fodder trees usu-ally include Calliandra, Sesbania sesban, Gliricidia sepium, Moringa oleifera and Cajanus cajan.
4. Monitoring the benefi ts
To quantify carbon offsets, the KACP uses a methodology which is based on an activity baseline and monitoring survey (ABMS) and estimation of soil carbon stock changes using a model. To monitor tree biomass carbon, an existing CDM ap-proved afforestation/reforestation methodology was integrat-ed into the methodology. The methodology is a public good and can be used around the world in various agroecological conditions. The monitoring system takes into account the
multiple benefi ts to smallholders, including increased climate resilience, productivity increases (through the farm enter-prise approach) and reduction/removal of greenhouse gases. The methodology for ‘Adoption of Sustainable Agricultural Land Management (SALM) practices’ was developed by the BioCarbon Fund of the World Bank and approved by the Verifi ed Carbon Standard (VCS) in December 2011, after a number of global expert consultations and a double valida-tion process. The main features of the methodology are pre-sented in Figure 2.
48 FACTS Reports

Carbon Intensifi cation and Poverty Reduction in Kenya: Lessons from the Kenya Agricultural Carbon Project
5www.factsreports.org
According to the methodology, carbon stock changes in different carbon pools (soil, biomass) are determined by combining information on the project area and management practices adopted (activity data) with coeffi cients (emission factors) that quantify the emissions or removals per unit of activity. The approach follows the overall ‘Good Practice Guidance’ of the Intergovernmental Panel on Climate Change (IPCC).
Carbon stock
change C
Emission factor
Activity Data
Figure 2. Key features of the VCS approved SALM methodology
For example, if you want to determine the carbon stock change of a mulching activity, the area on which residue mulching is adopted in the project is required (activity data) as well as the emission factor which indicates how much soil carbon is sequestered per unit area as a direct result of the mulching activity. Normally this factor is expressed in t CO2 per ha per year which can then be easily multiplied by the total area (in hectares) where the activity has been adopted.
To collect the activity data, the methodology proposes the use of an activity baseline and monitoring survey (ABMS). The basic idea is that agricultural activities in the baseline will be assessed, and adoption of SALM practices will be monitored, and activity-based models used to estimate the resulting carbon stock changes. The ABMS was designed in line with the requirements of the methodology and is applied in the KACP. Figure 3 summarizes the ABMS design.
Figure 3. Structure of the ABMS monitoring system
The ABMS monitoring system (1) collects fi eld data using two different monitoring approaches: Permanent Farm Monitoring (PFM) (2) and Farmer Group Monitoring (FGM) (3). The basic distinction between the two monitoring com-ponents is that the PFM is entirely implemented by the fi eld offi cers of Vi Agroforestry on permanent sample farms (socalled ABMS farms) and is a representative survey for the
whole KACP project area. It is used to establish the total KACP baseline conditions and to estimate the exante actual GHG emissions and removals for the whole project area. Further it monitors the overall project performance in terms of project implementation (SALM adoption, crop yield moni-toring) and is used to verify the results of the FGM.
The FGM, on the other hand, is based on self-reporting by all farmers and farmer groups. Farmers and farmer group re-source persons are trained in data collection and record keep-ing by the project extension staff to ensure the accuracy of the system. In this system, farmers annually record all relevant data themselves and report data to the fi eld offi cers via a strong system of verifi cation and data aggregation. The soil model input data (4) combined with the data from the ABMS (5) and additional existing data sets (6), such as climate and soil data, are used to parameterize Roth-C to model the actual (ex-post) GHG emissions and removals from SOC and tree biomass of those farmers that have adopted SALM activities. The results of the group monitoring also serve as a basis to distribute carbon benefi ts to farmer groups.
In the table below the model outputs, i.e. local SOC emis-sion factors, are presented.
Table 2. Roth-C modeled local emission factors
SALM PRACTICES
KISUMU – SOC EMISSION FACTORS IN TCO2/HA/YEAR
KITALE - SOC EMISSION FACTORS IN TCO2/HA/YEAR
Residue management Maize1st season2nd season
0.310.22
0.580.64
Residue management Beans1st season2nd season
0.200.14
0.350.50
Residue management Sorghum1st season2nd season
0.220.16
0.300.42
Composted manure1st season2nd season
0.190.21
0.200.21
Agroforestry (soil fertility trees)1st season2nd season
0.050.02
0.190.10
The result of this whole system is the total project net GHG removals (8), consisting of the carbon stock change in the soil organic carbon pool and the biomass carbon pool, while also considering carbon emissions due to implementation of proj-ect activities.
49www.factsreports.org

Carbon Intensifi cation and Poverty Reduction in Kenya: Lessons from the Kenya Agricultural Carbon Project
6 Field Actions Science Reports
Figure 4 illustrates the data collected for an average house-hold in Kisumu and Kitale. It highlights, for example, that in Kitale farmers’ grains crop yields are higher per hectare (2,253kg/ha/yr compared to 1,140kg/ha/yr), which is because
more farmers use chemical fertilizer. With regard to live-stock, there is a trend that in Kisumu farmers have more live-stock (except poultry) and more land.
Management of project additionality, leakage and non
permanenceA requirement of carbon projects is that they are additional,
do not result in leakage outside the project area and ensure that emission reductions are permanent.
Additionality means that the carbon would not be seques-tered in the absence of carbon fi nance. For the KACP, imple-mentation barriers without carbon fi nance are that the exten-sion services are partly fi nanced from the carbon revenues and that there is a technology barrier to design and implement a climate performance and benefi t monitoring system. The monitoring system is important to ensure intense and focused project implementation.
All possible sources of leakage are mitigated in
the methodology. For example, if due to the project more chemical fertilizer is used, then the embodied emissions in the chemical fertilizer are captured in the monitoring system and deducted from the soil and biomass carbon sequestered. Similarly, if due to the project non-renewable biomass from outside the project area is used inside the project area for cooking, then the related emissions are considered. Finally, the project is expected to increase yields, residues and tree biomass. Farmers may use this to feed additional livestock, resulting in increased livestock emissions. The project will mitigate these emissions by introducing fodder trees and zero grazing systems that will reduce livestock related emissions per product unit. However, since the project activities do not directly promote an increase in livestock numbers, the related
Adults per farm 2.6 / 2.7Children per farm 3.2 / 4.4House constructionWater scarcity 1-4 months 12% / 31%Food security < 6 months 46% / 21%Energy sourceTotal land (ha) 0.7 / 1.1Agricultuture land (ha) 0.5 / 0.8Grassland 0.1 / 0.1
BASELINE PRACTICES
LIVESTOCK
No total units 16.1 / 16.6
TREES ON FARMLAND
No Tillage % of farms 4% / 11% Composting % of farms 6% / 28%
% of farms 58% / 92%
Removal of residues % of farms 31% / 20% Cover crops % of farms 9% / 5%
Calves
Trees / ha 28 / 23
Direct residue mulching % of farms 5% / 22% Terrace field % of farms 6% / 26%
Total % 23% / 44%
AGB t d.m./ha 2.0 / 6.1
Burning of residues % of farms 23% / 14% Water harvesting % of farms 3% / 3%
# units 2.7 / 1.5
Raw manure appl. % of farms 14% / 18% Chemical fertilizer % of farms 28% / 84%
CowsTotal % 69% / 89%# units 4.3 / 2.0
CROPS
GoatsTotal % 55% / 39%
Maize Beans
Tubers & root crops Root crops, other
Others
# units 4.1 / 2.8
% of farms / % of farms 29% / 63%
% of farms / % of farms 10% / 11%
% of farms /
Sheep
% of Ag land / % of Ag land 60% / 78%
% of Ag land / % of Ag land 31% / 78%
% of Ag land /
Total % 28% / 16%# units 5.1 / 2.3Poultry
Outputs per year Outputs per year
Outputs per year Outputs per year
Total % 82% / 93%
Yields kg/ha / Yields kg/ha 724 / 998
Yields kg/ha / Yields kg/ha 952 / 280
# units 11.4 / 14.6
Res. tC/ha / Res. tC/ha 0.20 / 0.21
Res. tC/ha / Res. tC/ha 0.30 / 0.07
PigsTotal % 3% / 4%# units 1.7 / 1.5
80% mud houses
80% wood/ charcoal
97%80%
93%79%
17%47%
32%57%
17,8280.16
11%27%
11400.31
2,2530.63
32870.02
48%92%
KISUMU KITALE
Figure 4. The average farm based on results from the ABMS
50 FACTS Reports

Carbon Intensifi cation and Poverty Reduction in Kenya: Lessons from the Kenya Agricultural Carbon Project
7www.factsreports.org
emissions will not be accounted for. Finally, the project applies a non-permanence risk tool
from the VCS to anticipate the risk of non-permanence. The risk assessment of the KACP was rated relatively low, and subsequently 10% of the credits will be placed in the VCS risk buffer account as an insurance against any non-perma-nence risks.
5. Lessons learned
5.1. Focus on smallholder farmers’ interests
From the farmers’ point of view, the success of an agricul-tural carbon fi nance project is related to increased risk ad-justed crop yields and food security, with carbon revenues as a co-benefi t. Farmers frequently mentioned that due to the project they gained the skills to increase soil fertility e.g. through simply not burning crop residues and compost mak-ing and as a result crop yields and their income have increased For the KACP, the amount of carbon revenues at current car-bon prices is expected to be approximately smaller than the value of the 20% increase in revenues from crop yields. The carbon revenues are partly used to cover the extension cost. The largest share will be disbursed to the farmer groups and within the groups the benefi ts will be distributed according to farm performance indicator and equity consideration. Each farmer group can subsequently decide how to invest the car-bon money. Furthermore, carbon revenues will expire when carbon pools are saturated, while farmers will receive con-tinuous incomes from healthy and productive soils and diver-sifi ed products. Project developers should be careful not to raise false expectations and clearly communicate the amount of carbon revenues that a project may generate. Vi Agroforestry communicated these messages right at the proj-ect inception, hence there are no false expectations.
5.2. A strong extension service with decades of focused extension experience
One of the main diffi culties of smallholder projects is the co-ordination of a large number of farmers. Vi Agroforestry is among the strongest farmer extension organizations in East Africa, with a strong team on the ground and indepth experi-ence. Based on this foundation, the organization is working with and strengthening local institutional structures, such as traditional barazas (community information meetings), schools and local NGOs. The project uses participatory plan-ning, monitoring and evaluation of a farmerled implementa-tion system and takes community-based stakeholders on board to ensure the permanence of the project after an inten-sive development phase.
5.3. The monitoring system used should be cost-effective, demand driven and user friendly
Designing a soil carbon monitoring system that meets the level of accuracy required by international carbon offset stan-dards is a challenge for any smallholder agricultural carbon project. The chosen approach proved to be effi cient in terms
of data collection and can be easily integrated into existing project extension support systems.
Carbon accounting and monitoring must adhere to the prin-ciples of relevance, completeness, consistency, transparency, accuracy and conservativeness to ensure true and fair ac-counting. Conservativeness is important for projects where accuracy may not be fully attained, and may serve as a mod-erator to accuracy to maintain the credibility of project emis-sion quantifi cation. Monitoring systems in smallholder land-use carbon projects should be designed to achieve multiple benefi ts apart from carbon accounting. Above all, they need to be transparent for the farmers who actively reduce emis-sions in the project area in order to ensure ownership of the sequestered carbon and to create a fair distribution of reve-nues. Furthermore, carbon monitoring should support project implementation, extension and impact monitoring. Monitoring can be used to identify specifi c training needs and priority interventions for extension, particularly during the early stages of a project. General livelihood and socio-eco-nomic impact monitoring is also important.
6. The way forward
The project has been successfully validated in May 2012, and the fi rst carbon payments have been received. Farmers have already adopted SALM practices on nearly 50% of the total project area and according to the rollout plan, the total project area of 45,000 ha will be covered by 2017. The fi gure below illustrates the key steps of the project.
Development of the project
started 2007
Carbon purchase agreement signed
with BioCarbon Fund Nov 2010
SALM Methodology
approved Dec 2011
Validation done May
2012First payment
early 2013
Figure 5. Kenya Agricultural Carbon Project’s steps
Scaling up is the way forward, and Vi Agroforestry togeth-er with partners has conducted feasibility assessments in Uganda and Malawi to start similar projects based on their ongoing experience. Meanwhile the KACP serves as a model for Nationally Appropriate Mitigation Actions (NAMAs) in the agricultural sector and a number of government and de-velopment partner initiatives are underway to explore possi-ble modalities based on the Durban Action Plan of the United Nations Framework Convention on Climate Change.
Public awareness raising and consultations are an impor-tant element of further scaling-up for sustainable agricultural management in Africa and other regions. The lessons learned indicate that this model can be used on a large scale and would benefi t from modifi cations and lessons learned from implementation in other geographic locations, social and en-vironmental settings.
7. Acknowledgements
The development of this project started in 2007. Because of the complexity and consensus building required to develop the fi rst soil carbon accounting methodology, several institu-tions have been involved. Besides Vi Agroforestry as the
51www.factsreports.org

Carbon Intensifi cation and Poverty Reduction in Kenya: Lessons from the Kenya Agricultural Carbon Project
8 Field Actions Science Reports
project developer, Joanneum Research (Austria), University of Aberdeen and UNIQUE forestry and land use (Germany) have been instrumental in the development of the new meth-odology. The World Bank BioCarbon Fund, the Agriculture and Rural Development Unit in the Africa region of the World Bank and the Swedish International Development Cooperation Agency (Sida) have provided crucial initial fi -nancial support before revenues from the carbon credits are realised.
8. References
Seebauer, M., Tennigkeit, T., Bird, N., Zanchi, G. 2012. Carbon accounting for smallholder agricultural carbon credits: a Verifi ed Carbon Standard for agricultural land management projects. In: Wollenberg, E., Nihart, A., Tapio-Biström, M-L., Grieg-Gran, M. (Eds.). Climate change mitigation and agriculture. Earthscan, 274-284.
Tennigkeit, T., Kahrl, F., Wölcke, J., Newcombe, K. 2012. Economics of agricul-tural carbon sequestration in sub-Saha-ran Africa. In: Wollenberg, E., Nihart, A., Tapio-Biström, M-L., Grieg-Gran, M. (Eds.). Climate change mitigation and agriculture. Earthscan, 144-158.
Verifi ed Carbon Standard, 2011. Adoption of Sustainable Agricultural Land Management methodology. (Available from http://www.v-c-s.org/methodologies/VM0017 (Accessed 15 April 2012)
Wölcke, J. and Tennigkeit, T. 2009. Harvesting agricultural carbon in Kenya. The International Journal for Rural Development, 43 (1).
World Bank web. 2012. Kenya Agricultural Carbon Project (Available from http://web.worldbank.org/external/projects/main?pagePK=64283627&piPK=73230&theSitePK=40941&menuPK=228424&Projectid=P107798 (Accessed 15 April 2012)
World Bank. 2010. ERPA signed 4 October 2010 and offi cially registered at the BioCarbon Fund webpage at (Available from http://go.worldbank.org/ODSW9CILW0 (Accessed 15 April 2012)
World Bank. 2012. Press release, New Soil Carbon Methodology Approved. (Available from http://go.worldbank.org/ATOU438OV0 (Accessed 15 April 2012)
World Bank, Carbon Finance Unit. 2012. (Available from https://wbcarbonfi nance.org/Router.fm?Page=Projport&ProjID=58099) (Accessed 15 April 2012)
Woelcke, J. 2012. Smart Lessons: More Than Just Hot Air: Carbon Market Access and Climate-Smart Agriculture for Smallholder Farmers
World Bank. 2011. Triple Win of Climate-Smart Agriculture put into Practice, (Available from http://go.worldbank.org/LAS9E5AEU0 (Accessed 15 April 2012)
Sharman, J. 2010. “The winning scenario”. Life on Terra. True Nature Film (Available from http://www.lifeonterra.com/?portfolio=terra-537-a-winning-scenario) (Accessed 15 April 2012)
Sharman, J. 2008. “Africa’s Climate of Change”, True Nature Film (Available from http://www.youtube.com/watch?v=PnVR6XP7PYQ) (Accessed 15 April 2012)
Verifi ed Carbon Standard Association. 2012. Methodology VM0017: Adoption of Sustainable Agricultural Land Management (Available from http://vimeo.com/35279186) (Accessed 15 April 2012)
52 FACTS Reports

Challenges of Community-Forestry Based Carbon Projects: Process, Participation, Performance
Jean-Pierre Rennaud1, Jack Ruitenbeek2, Timm Tennigkeit3
1General Delegate Livelihoods Venture, [email protected] forestry and land use, Freiburg, Germany, [email protected]
Abstract. This paper addresses the challenges in community-based management of carbon projects in devel-oping countries. It is based on four years of experience in identifying, developing, implementing, and monitoring mangrove restoration and agroforestry projects in upland and coastal areas of India, Indonesia, and Senegal. While many of the challenges are common to any typical grass-roots development project, we focus on aspects that are more directly related to carbon sequestration activities. To address all of these challenges, the paper pro-poses some measures that we believe help make implementation and monitoring easier for practitioners in this realm. Our thematic focus of “process”, “participation” and “performance” underscores three key areas we be-lieve merit greater attention in these projects. The process elements are important because of specialized knowl-edge that is often not familiar to communities such as the process of identifying suitable planting sites and arrangements, and suitable implementation arrangements given stakeholder needs requires signifi cant upfront commitment from all involved. The challenges related to process are highlighted through reference to methodol-ogy selection, and the implications it has for site selection through to implementation. The second theme – partici-pation – addresses the peculiar stakeholder interests, interactions and arrangements that arise at all stages of the project. A challenge is meeting all stakeholder expectations and constraints through recognizing that people have different motivations and interests; as examples, active engagement is necessary to fi nd acceptable terms for im-plementation, revenue sharing, and risk sharing. Again, peculiarities of the carbon market – such as carbon property rights – often create uncertainty that must be handled delicately in such circumstances. The fi nal theme – performance – relates to an ongoing need to accommodate a complex array of monitoring, auditing, validation and quality control requirements over a range of multiple objectives. The challenge in this realm is to implement high-scale projects that are economically viable, but which will stretch the capacity of local community-based systems considering compliance requirements with regards to implementation and carbon accounting standards. Hence the interests and requirements of different stakeholders may not be fully aligned. As an example, many carbon projects now have multiple objectives – carbon, biodiversity, and community welfare – but there are few received protocols for addressing these concurrently. An important insight through all of these dimensions is that no single concept of “community” can be universally applied: the connections among stakeholders and others are never as clear as one assumes them to be.
Keywords. carbon methodology, monitoring, high scale implementation, mangrove, agroforestry
1 Introduction
Small local communities worldwide are those most immedi-ately at the front lines of development efforts and climate change impacts. Droughts, fi res, fl oods, cyclonic storms, sea level rise, and changes in the food chain are all hazards as-sociated with climate change impacts. Communities around the world are learning how to adapt; in the absence of such adaptation, they remain exposed to hazards that will threaten their lives and their livelihoods. But these communities – sometimes organized through formal or informal Community Based Organizations (CBOs) – have become
accidental partners in the fi ght against climate change effects. Their partners include international NGOs, multilateral de-velopment banks, and bilateral agencies, various levels of lo-cal government, other CBOs, and the private sector in miti-gating the effects of climate change. But in so doing, they often fi nd themselves in another world.
While communities have been adapting to local weather effects since the dawn of time, the combination of degraded ecosystems, rapid social changes and climate change, often overstretch the capacity to adapt. In this context, climate change mitigation (regarding International Panel for Climate Change defi nition) is an opportunity to increase the adapta-tion capacity through related fi nancing mechanisms and
© Author(s) 2012. This work is distributed under the Creative Commons Attribution 3.0 License.http://factsreports.revues.org/2134Published 10 October 2012
53www.factsreports.org

Challenges of Community-Forestry Based Carbon Projects: Process, Participation, Performance
2 Field Actions Science Reports
evolving partnerships especially on high scale implementa-tions. Thus the concept is new for them, as it is for many of us. In less than one generation, communities in some of the poorest countries in the world now fi nd themselves engaged in a quest that the previous generation could not have imag-ined: the quest to sequester carbon. How do you sequester something you cannot see? Why would you do that? How do you know if you can store it forever? And why would anyone want to pay me for something that I then seem to get to keep? For those of us in the global pursuit for carbon, we tend to treat it little differently than any other commodity. But to the communities at the front lines, the reasons for the pursuit are not always obvious.
This paper describes a brief journey through a handful of projects that have taught us some lessons on the challenges of dealing with community forestry -based implementation and monitoring of carbon projects. We take our examples from mangrove and agroforestry projects across four sites on two continents. Our fi rst challenge is communicating the concepts and methodologies of carbon markets to individuals, com-munities, and other stakeholders on whom we will rely for the next two decades to engage in a process that will involve defi ning, designing, implementing and seeing through a proj-ect that stretches local capacity to its limits. Why will a tree planted on this side of the river count as carbon captured, but a tree planted on the other side not count? Our second chal-lenge is discovering the incentives, motivations and needs of our community partners through participation that allows us to align and reconcile different objectives. Trees bear fruit, decrease wind damage, and capture carbon by producing bio-mass, but what if there are trade-offs between forest liveli-hoods functions and carbon gains? Our third challenge is monitoring the performance of the process and the impacts of implementation efforts alongside community partners. We know that the communities have an interest in the outcomes, but how can methods be aligned to the realities of limited capacity, limited resources, and sometimes arbitrary criteria? Moreover, how can monitoring be completed in what is at times a diffi cult environment?
Our fi ndings are organized around these three themes: pro-cess, participation, and performance. In addressing them we fi rst provide a brief overview of the projects from which we draw our experience.. We then cover the intricacies of differ-ent methodologies and frameworks for looking at carbon projects: these include the Clean Development Mechanisms protocols and other voluntary carbon market protocols such as Verifi ed carbon Standards (VCS) or Gold Standard. The methodologies themselves present challenges that infl uence process, participation, and performance. We then look at some of the key issues within each of our three themes, fi nal-ly closing with lessons and selected recommendations.
2 Project Backgrounds
Our projects draw from a selection of Livelihoods Fund (LV) activities across Africa and Asia. Although they are all forestry projects, they are far from being duplicate s of each other. In fact, their selection shows us immediately that the idea of community can even differ from one project to the next.
2.1 Senegal “Oceanium”
Since 2009, the Livelihoods Fund in partnership with the Senegalese NGO Oceanium have planted over 100 million mangrove trees on 10,500 hectares of land in 450 villages in Casamance and Sine Saloum in Senegal to replenish their food ecosystem, the fi sh and shellfi sh resources, and to lead the fi ght against salinization of agricultural land. Primarily this project has been launched because of the vision of one man – Haidar Ali – asking the population to plant mangrove trees to support their own livelihoods: “Plant a tree in your head” was the basis for community mobilization.
Figure 1. Mobilization of local people in plantations - Senegal
The role of private sector engagement – such as Livelihoods Fund – within such a project is imminent but requires an in-vestment perspective to achieve its goals on time, in quantity, and in quality everywhere at a large scale; this implies that communities must adopt relevant practices for replicating ef-fi cient pilot models . As an example let us fi rst describe soil fertility quality control, which is a key parameter for replica-tion. Scientists can identify the key indicators: salinity, water fl ow, sand content, but they cannot generally identify the ad-equate tools for community people. Villagers are not accus-tomed to using tools such as refractometers. That means that the suitability of the soil quality has to be measured with the villagers in other ways. We found indicators which are few, visible, tangible situations easy to appreciate by the villagers and correlated with soil quality: remaining presence of trees, color of the soil, highest tide coverage . And then depending on this, each plot is clustered as Green (3 indicators OK means very good conditions for growing), Yellow (1-2 indi-cators OK means good conditions for growing), or Red (less than 1 indicator OK means Bad conditions for growing). Another example addresses monitoring of tree stem density. How does one measure tree density on 10.000 ha? The solu-tion is in the process of planting itself. Once again scientists have designed an optimum situation by planting initially 5000 propagules /ha . But practically how does one design a
54 FACTS Reports

Challenges of Community-Forestry Based Carbon Projects: Process, Participation, Performance
3www.factsreports.org
regular process to plant one seed every 2m*1m on 10.000 ha? The solution is a rope where you put a knot every 2 meters and during the planting session each villager is positioned along the rope at each knot and every step they plant one seed.
These indirect “community parameters” have to be cali-brated to give confi dence in the process. For this reason, each campaign is subjected to an external audit by experts, using a dual set of measurements on sampled plots.
2.2 India “NEWS”
India’s Nature, Environment, and Wildlife Society (NEWS) is at the forefront of implementing a 6000 ha mangrove plant-ing scheme in India’s Sundarbans. While many people know of the Sundarbans forest as one of the largest remaining natu-ral mangrove ecosystems in the world, what they do not real-ize is that almost 4 million of India’s poorest population try to eke out a living behind a 150 year old system of dykes on about 70 islands. The dykes protect them from fl ooding, but breaches occur from poor maintenance, or from regular tropi-cal cyclones. The Bay of Bengal is home to the deadliest cy-clones recorded in human history, and increasing sea levels coupled with global warming promise higher storm surges. Mangroves provide a life-saving function as a “bioshield” through dissipating wind and wave energy, while also sup-porting important livelihoods such as fi sheries, honey collec-tion, and a large variety of sustainable uses.
The NEWS’s project was initiated in 2010 as an extension of already successful livelihood activities involving health-care services and income generating schemes. Through mo-bilization of women’s groups, plantations were designed to accept seedlings from nurseries or direct planting. While ac-tivities started in one part of the Sundarbans region, the proj-ect (registered under CDM) needed to go further afi eld to fi nd suitable CDM eligible planting conditions and willing vil-lages. Government authorities of India’s forest department, as well as local government offi cials, have been instrumental in providing permissions relating to land use and carbon rights. To date, some 10 million trees have been planted fo-cusing on 7 species such as Avicennia alba. and Rhizophora mucronata., Bruguiera gymnorrhiza.
Signifi cant logistical challenges are posed by seasonal storms, diffi cult transportation conditions, and residual com-peting demands for land use. Concerning competing demands for land use, as an example of participation, during the vali-dation visit in January 2012, the independent validation ex-pert noticed that there were cows on some mudfl ats that were not part of NEWS’s activities, but that there were no cows on the NEWS/Livelihoods plot. He asked the local village head how that was possible. He explained that there was an old woman that patrolled the area with a stick. “So,” said the vali-dator, “she hits the cows?” “No,” was the reply, “the cow would just come back. She hits the owner of the cow.”
Figure 1. Women looking after their seeds - India
2.3 India “Naandi”
The overall goal of the project developed by Naandi Foundation is to improve the livelihood of small and margin-alized tribal communities in the Araku Valley of Visakhapatnam district in the state of Andhra Pradesh in India. Various horticultural tree species will be planted in a phased approach on 6,000 ha in this CDM project activity. Seven different tree species groups are distinguished based mainly on similar growth conditions (similar biomass accu-mulation rates) and planting densities. All groups will be planted on the 6,000 ha, with different species composition in the mixed stand models. Coffee plantings will be introduced after 3 years on 3,000 ha.
Figure 3. Women working in fruit trees nursery - India -
55www.factsreports.org

Challenges of Community-Forestry Based Carbon Projects: Process, Participation, Performance
4 Field Actions Science Reports
The plantations are all located on degraded land with very low plant cover (more than 57% of the land is classifi ed as barren land.). The horticultural trees will sequester carbon and will turn this degraded, low carbon lands into a fruit and herb bearing secondary forest. The transformation of a low carbon landscape into a high carbon sequestering, multiple use landscape will improve food security, nutrition and pro-vide additional income for the community. The project area will cover 302 villages and approximately 10 planting sites per village, i.e. on in total 3000 discrete areas of non-forested land, each area has a geographical identifi cation.
The planting process is developed as a “one shot process” and is a key performance innovation for the initial sequestra-tion of carbon. It has been developed by villagers together with Naandi fi eld offi cers.
First, the pits are fi lled with topsoil. A biodynamic site fer-tilizer strategy is applied during the time of planting. Cow Pat Pit (CPP) manure consists of fermented cow dung combined with eggshell powder, basalt dust, and herbal preparations, which is retained in a brick pit for a period of 3 to 4 months and mixed with water (1 kg of CPP manure in 40 liters of water per acre before application) .
The participating farmers themselves add 5–6 kg of com-post for each planting pit Approximately 250 g of vermin-culture compost is mixed with the topsoil while fi lling the pit for planting
Healthy, straight-growing grafts from reliable sources are planted at the center of pits with the ball of the earth intact during rainy season. The planting is done for balls in such a way that the roots are not expanded. Plants are watered im-mediately after planting. In the initial one or two years, a stake is provided to make them grow straight.
2.4 Indonesia “Yagasu”
Indonesia’s Yagasu Foundation has an elephant as its symbol: the brand is well recognized in Northern Sumatra and Aceh because of the efforts of Yagasu.I Its few domesticated ele-phants, rescued lives and protected property in the aftermath of the December 2004 tsunami that struck the northern coast of what is now part of this project area. In a project that nomi-nally includes 5000 ha of mangrove plantation, about one-quarter is in or adjacent to some of the most heavily devas-tated shorelines in the world. Where once stood houses and buildings and rice fi elds, now stand a few trees, a tidal marsh, and occasional offerings in memory of the 170,000 people that perished during the tsunami. But these areas, as many others along the North Sumatra coast, were converted de-cades ago to fi sh and shrimp ponds in a national scheme in-tended to improve the lives of coastal people: mangroves were cleared, fi shponds appeared. Coastal erosion and salina-tion, however, undermined these schemes and most ponds were eventually abandoned. The abandoned areas are now a target of this Livelihoods carbon project.
Working through some [90] communities, Yagasu is re-es-tablishing a “Coastal Carbon Corridor” intended to improve fi shery yields and trap sediment. The Livelihoods sponsored project commenced in 2011, building on a number of pilot activities that Yagasu had already successfully completed in
the area. The project has strong support from Provincial min-istries responsible for environment and forestry, and registra-tion of the project nationally under CDM would represent one of the fi rst of its kind for this forest-rich country . By early 2012, some 1.6 million plants (including Rhizophora mucronata, R. apiculata and R. stylosa) were planted along 572 hectares of the coast.
Figure 4. Planting life - the story continues
Based on initial results Yagasu appears to be on the right track from the initial visits and meetings. After showing us their site, we were served cookies and drinks made from mangrove products. The products had already gone through various early stages of nutritional testing and were being sold in Indonesian airports to departing tourists with all proceeds going back to the local communities.
3 Carbon Methodologies
The concept of carbon sequestration in a forest ecosystem is relatively straightforward. A plot of land has growing trees that sequester CO2 from the air and it eventually is stored in the trunk branches, above and below ground in the form of carbon in its biomass. The dry weight of the wood contains about 50% carbon. Credits are typically issued for the carbon sequestered expressed in terms of tons of CO2 equivalent (tCO2e). The role of a methodology and the guiding carbon standard is to determine when a certain activity qualifi es for carbon sequestration and, if it does, how and when the carbon should be counted or credited. A key idea in most methodolo-gies is that only additional or incremental carbon should be counted, and it should be permanently sequestered. Another key concept is that the carbon credit becomes a unique trad-able commodity with market value, meaning it has an identi-fi able source and becomes in effect a private good rather than a public one.
Depending on the carbon standard applied it follows differ-ent compliance procedures and is also named differently as stipulated below. We strongly believe that by extracting from
56 FACTS Reports

Challenges of Community-Forestry Based Carbon Projects: Process, Participation, Performance
5www.factsreports.org
different methodologies key requirements, carbon from most restored and dynamically developing ecosystems can be ac-curately accounted. Numerous formal and informal method-ologies exist to address the eligibility and valuation issue, but we will characterize those treated here as drivers for soil management effi ciency, sustainability (social and economic) for communities in Section IVUNFCCC CDM related carbon credits from forestry generate temporary certifi ed emission reductions (tCER), but despite the spirit of the convention that these should be traded the EU member states did not al-low their use in the European Trading System (ETS). Therefore, the fungibility is limited but companies use them but have to replace them after 20 years or latest after 60 years when registered twice. A number of methodologies have been specifi cally developed for forestry activities considering not only tree biomass but also carbon stock changes in soils and below ground biomass. In the Livelihood projects this inter-nationally accepted standard will be used to validate the proj-ect. The following drivers for communities have been met in each of the Livelihoods projects described above.
• Areas have to be non-forested since 1990, which pres-ents the communities a chance to restore degraded and unproductive areas.
• The project duration (at least 20 years) refers to long term commitment of communities to preserve restored areas, bind communities, project developers, and local authorities. This concept is defi ned as permanency by UNFCCC.
• The UNFCCC procedures require the formal approval by national authorities, which can be considered as a constraint compared to voluntary carbon standards where this is not required. Nevertheless, it’s a way to create a durable relationship and strengthens the legal recognition of the project among the host government, project developers, communities and national author-ities. 1) Reducing Emissions from Deforestation and forest Degradation (REDD+) is an UN sanctioned sys-tem (UN-REDD a respective support program) but currently respective carbon credits cannot be generat-ed and traded under the UN system (only in the volun-tary carbon market;. Respective schemes cover in ge-neral large areas and communities are involved to the extent that they must be engaged to stop deforestation and forest degradation. They also can benefi t from a share of revenue generated by the REDD initiative. The plus of REDD+ indicates that also carbon stock enhancing measures such as biodiversity conservation and timber management are eligible. Eligibility has to be demonstrated using a structured documentation of the baseline situation including information on the land use in the past and what would be the situation without the project against which the additional car-bon enhancing activities can be claimed. Communities need to understand the respective logic and its impli-cations, i.e. can credits be claimed at all and which amount of credits that can be generated. Carbon fi -nance provided to communities for carbon credits is
considered as a way to pay for environmental services. However, there is a distinct difference between ser-vices such as provision of clean water (which can be traded continuously) and carbon where each ton sequestered can be transacted only once, hence when trees are mature no more carbon credits can be genera-ted. Refl ecting the need to align incentives for the community and the climate an up-front investment that generates livelihood benefi ts such as fruit trees or fi sh habitats and provides climate benefi ts permanent-ly even after the carbon crediting period expires is pre-ferred. 2) Originally the Voluntary Carbon Standard but now the Verifi ed Carbon Standard VCS, was de-veloped for voluntary carbon transactions and was de-veloped from the experiences gained from the CDM mechanism (CITE). The VCS seeks to establish high quality carbon credits with the same fungibility as non-forestry related CDM credits, but with potential to consider REDD+ projects and also agricultural soil carbon projects. The VCS is recognizing the perma-nency of the carbon credits from all forest and other land use projects. Carbon credits are issued and ad-justed according to the risk of non-permanency of the projects through recognition of buffer amounts. These buffered carbon credits are constituted by a part of issued carbon credits of each project in a mutual way by VCS to mitigate the risk of failure of some projects. Eligibility requires a structured risk analysis to evalu-ate the “buffer” level involving since the starting point of the project communities on risk allowance. 3) A standard addressing the community oriented non-car-bon project benefi ts is namely the community, bio-diversity and climate adaptation (CCBA) benefi ts. This wider scope is of great interest for investors, which require that projects sequester carbon and gene-rate positive direct and indirect biodiversity and com-munity co-benefi ts. Gold status is awarded when the project conserves globally rare species and has excep-tionally strong community and climate change adapta-tion benefi ts. Monitoring processes have to integrate related community, biodiversity and adaptation bene-fi ts, which in fact are a challenge since the benefi ts are diverse and diffi cult to quantify (e.g. biodiversity benefi ts). However, we think it is very important to quantify respective benefi ts in a robust, but focused manner to make the monitoring of the impacts by the communities themselves as a sustainable way to make them involve in the conservation of the ecosystem. 4) Simplifi ed informal credits or offsets. These represent a broad class, which do not necessarily involve formal tracking. They include a wide range of initiatives: simple tree-planting campaigns funded by individual patrons not necessarily interested in the carbon; un-audited offsets by corporations or individuals; or, au-dited offsets through strict methods that are never in-tended to be traded. We do not spend much time on this category, but we note that it is the type that has the easiest intuitive connection to small communities in developing countries. In the minds of many, a tree
57www.factsreports.org

Challenges of Community-Forestry Based Carbon Projects: Process, Participation, Performance
6 Field Actions Science Reports
planted or protected anywhere should receive a credit. The standards above generally require robust and the-refore complex methodologies and independent third party verifi cation to generate carbon assets.
The most noticeable differences among these methods in-clude issues of eligibility, scale, and scope.
Eligibility refers to the general compliance of a project area to a specifi c standard. In the CDM the defi nition of “forest” differs from one country to the next, within an internationally defi ned range, i.e. minimum canopy cover 10-30%, potential tree height 3-5m, and area 0.1ha-1ha
The scale of a project is a concern in many methodologies. Under CDM, both large and small scale projects exist, de-fi ned by a threshold of the amount of carbon sequestered; a forestry project removing fewer than 16,000 tCO2e a year can qualify for simplifi ed procedures that reduce administrative and monitoring requirements. But the thresholds are quite low; all four projects in this paper are of a size that requires large-scale methods to be applied. Some methodologies al-low extensions to be made, such as the CDM rules governing “Programs of Activities (POA)” which in effect permit in-defi nite number projects to be replicated elsewhere in a coun-try once the initial project has been scrutinized and validated. Scale can also come into play inside a project: the CDM methodologies for reforestation require that 67% of the total project area is identifi ed and delineated before credits can be earned: this is at times diffi cult for community projects re-quiring multi-year planting programs.
Finally, new standards are evolving e.g. to better capture co-benefi ts (e.g. biodiversity and socio-economic) within project boundaries. Meeting related eligibility requirements may underline the “charismatic carbon” associated with the project and may warrant a price premium and will improve the project design or its documentation.
4 Challeng es of Process – Explaining the Concepts
The process elements are important because of specialized knowledge that is often not familiar to communities; the pro-cess of identifying suitable sites, suitable planting arrange-ments, and suitable implementation arrangements given stakeholder needs requires signifi cant upfront commitment from all involved. The challenges related to process are high-lighted here through referencing the standard and methodol-ogy specifi c requirements, and the implications it has for site selection through to implementation.
For all of the project sites discussed above, the basic ap-proach has been to use CDM eligibility and validation proce-dures are applied but Livelihoods Fund may in due course shift to voluntary market criteria, to extend in scope to com-munity and biodiversity benefi ts of the type contemplated in the CCBA. The only exclusion initially was the use avoided deforestation methods, mainly because these generally apply to larger areas, impose signifi cant restrictions on community activities, and are normally too passive.
In Senegal, the most complicated aspect of the methodol-ogy selection and implementation related to the proliferation of small sites. For a total area of 10500 ha, some
5000 separate plots have been registered within the project documents and each of these requires ongoing monitoring. A key challenge faced during the process was quality control of plantation. It was resolved primarily through training local people (“GPS boys”) to register parameters on areal extent, soil quality and density. A second challenge included driving community participation in plantation quality control. This was resolved through community training and information sharing, and providing fi nancial incentives for the communi-ties (not the individuals) related to quality performance; in this context it is important to underline that fi nancial incen-tives should be designed to strengthen the community. Individual cash payments are often counterproductive based on our experience. Important for the community are social events such as festivals where the joint achievements are cel-ebrated and results are presented to the wider public.
A key lesson from the Senegalese project was to design and to make the quality goals simple, understandable and verifi -able by the people and make them proud to reach “their “goal.
In the India project with NEWS, the CDM methodology selection was complicated by a number of factors. First, se-lection of eligible parcels was non-trivial. The estuaries of the Sundarbans stretch 100 km landward with some being stable and accreting, while others are intensively eroding. Moreover, sandbars and shoals have been rising from the estuaries over the past 50 years, sometimes in the middle of the estuaries but more frequently in stable meanders of the rivers. Land-use mapping both for the baseline reference period (1989) and the current period was required to estimate the aerial extent of the eligible parcels. A target of 6000 ha was selected, but that required land use & land cover (LULC) mapping for 1989 and for 2010, coupled with constraints of land avail-ability (e.g., protected forests were excluded) and of villages willing to participate and sign agreements. Experience from Senegal also prompted us to consider small plots of less than 10 ha, and ensure that no single community was responsible for more than about 150 ha. If this sounds like a formidable challenge, it is! Originally, all of the LULC interpretation and Global Positionning System work was done by an indepen-dent wetlands research institute; but to empower the CBO and the villagers and to build the capacity needed to monitor the project, the CBO was supported to take over all of the activities (mapping, eligibility interpretation, and GPS work). Training programs were devised and implemented, and the local communities immediately showed ownership for the introduced technologies and were pride about their accom-plishments and in what they have learned. A second chal-lenge was that the methodology selected itself changed mid-way through project design and implementation; originally the CDM only had small-scale methodologies available but a large-scale methodology became available requiring greater commitments but also providing more scope for fi nding eli-gible land and claiming credits (such as for soil carbon). This shift was taken in stride in consultation with the CBO and the resultant project is now in compliance with the large-scale methodology. The lesson from this exercise was that the grassroots CBOs are willing and able to learn the new tech-nologies and tools available for implementing complex car-bon project protocols.
58 FACTS Reports

Challenges of Community-Forestry Based Carbon Projects: Process, Participation, Performance
7www.factsreports.org
The Sundarbans project also faced important challenges in translating concepts between the CBO (NEWS) and the indi-vidual communities. Carbon sequestration and carbon rights became elusive ideas, but orientation days were conducted for each village to explain some of these concepts. Where possible, local metaphors were used (e.g., “trees giving fresh air”) and many of the local opinion leaders managed to grasp the concepts, even though it was acknowledged that not ev-erybody understood that carbon rights were being transferred to foreign interests. Upon further questioning, many people did not care to learn of the intricacies but trusted their leader-ship and the CBO to give them proper advice. In the India project with Naandi, a key challenge faced during the process was to deal with the mix of trees between carbon effi ciency and communities demand for added revenues from the bio-mass; concurrently an associated challenge was to avoid a multitude of tree species in the mixture. It was resolved pri-marily through selecting 7 different species groups which are distinguished by their similar growth conditions and similar biomass, accumulation rates, planting densities. Each farmer was able to choose from the different tree species groups planted on his or her own land.. Coffee will be introduced after 3 years on 3,000 ha. And one plan which is the only one for the 6,000 ha, displays the spatial distribution of the differ-ent tree species groups within the planting sites.
In Indonesia, a methodological issue is that the CBO origi-nally saw their project as a REDD project, as there were still signifi cant parts of the coastal corridor that were under threat from expanding palm oil plantation. Yagasu’s desire was to protect important natural spaces. But Yagasu also had consid-erable experience with small scale mangrove restoration. Their in-house mapping capacity was already very advanced. By going through the large-scale mangrove methodology re-quirements, Yagasu was able to identify some 10,000 ha of potential reforestation along shorelines and interior aban-doned fi sh ponds. An associated challenge in Indonesia was that national authorities have themselves been working on a new Nusantara methodology just for Indonesia that captures large REDD initiatives and reforestation activities within a decentralized framework. At a central level the familiarity of the issues was thus also very advanced, and it was agreed during the process that coastal mangroves would not play a signifi cant role in the broader national work. The fact that some of the work was in the Aceh tsunami affected area placed a high profi le of importance on the initiative that fa-cilitated national and provincial cooperation in terms of ac-cess to old maps, which helped establish the eligibility of the land.
5 Challenges of Participation
The second theme – participation – addresses treatment of the specifi c stakeholder interests, interactions and arrangements that arise at all stages of the project. Challenges are associat-ed with meeting all of the stakeholder expectations and con-straints; people have different motivations and interests. Active direct engagement is frequently necessary to fi nd ac-ceptable terms for implementation, revenue sharing, and risk sharing. Again, peculiarities of the carbon market – such as
carbon property rights – often create uncertainty that must be handled delicately in such circumstances.
In Senegal, all stakeholders were enthusiastic participants throughout all of the preparation and implementation. In to-tal, the carbon project included some 450.000 individuals at the community level, with coordinating efforts provided by the CBO Oceanium. Nevertheless, there were signifi cant challenges. A key challenge faced during preparation was the interaction between the project developer, villagers on one side and forest department and national authorities on the other side. It was resolved primarily through a formal con-tract committing project developers, communities, forest de-partment, and the Ministry of environment to a 10 year period for shared monitoring activities.
The NEWS carbon project in India was characterized by a wide range of interests among stakeholders. Community members generally acknowledge that mangrove systems are an important barrier to protect dykes. State government offi -cials have an interest in planting forests on new state lands; mud shoals that emerge from the estuaries or along embank-ments are in the fi rst instance state lands. Local village gov-ernments have a say over land use on any lands under their responsibility; such responsibility can be transferred to them for new lands such as shoals. Areas fl ooded and subsequently abandoned because of embankment breaches belong to the private landowners at time of fl ooding, even though these may be unproductive. Finally, open mudfl ats are typically treated by fi shers and pastoral grazers as common property open access areas. In brief, use rights and legal rights over property can overlap or be unclear, and securing proper docu-mentation over carbon ownership has been among the great-est challenges faced by a CBO in a vast territory. The situa-tion is further complicated under CDM because the Designated National Authority (in Delhi – thousands of kilo-meters removed) must approve the project and is itself inter-ested in assuring that stakeholder interests have been prop-erly addressed. To address this, the resolution of all of the potentially confl icting positions was achieved through me-thodical treatment of all interests via participatory meetings, sensitization, and documentation of agreements. Each local community signed agreements on long term protection. Some communities were not interested and mudfl ats adjacent to them were thus excluded from the project. Social networks and contacts of the CBO came into play very strongly to en-sure access to decision-makers and resolve confl icts. A key lesson was that such contacts are an important asset that only established CBOs have. A second challenge was managing expectations inside a community: not every member or household in a village is obliged to participate in the project activity. Payments were distributed only to those working on the project, and small local “self-help” groups were generally formed that required strong commitments from village mem-bers. These groups (typically of women in the majority) were an effective means to address confl icts and to organize nurs-eries and planting. They have also been effective at enforcing encroachment.
In the India project with Naandi, a key challenge faced dur-ing preparation was training the people and giving them the capacity to develop a local nursery and switch from
59www.factsreports.org

Challenges of Community-Forestry Based Carbon Projects: Process, Participation, Performance
8 Field Actions Science Reports
an external supply of plants to a local supply at a level of 1 million trees/year; the project would thus become less vulner-able to the commercial supply of young plants. It was re-solved primarily through the launching of a central managed nursery by Naandi that became a signifi cant supplier of young plants for the communities. It also permitted introduction of improved new practices in the nursery. Finally, it became a training center where the farmers could improve their prac-tices and replicate these to create their own effi cient nursery “business”: providing plants for the local community. A sec-ond challenge specifi c to implementation included introduc-ing fertilization and pest controls as a cost effective manage-ment method, while also promoting a qualitative principles to avoid unsustainable use of chemicals and to encourage or-ganic practices. This was resolved through the elaboration of bio-dynamic process affordable by the communities which are trained by Naandi people and local composting center are developed close to the planting areas. A key lesson from this was that a “bipolar” approach can achieve a high level of qualitative autonomy for the communities on agricultural know-how. The bipolar approach is characterized by a large-scale production center where you can experiment, develop practices and train people on these practices; this in turn is coupled to a smaller satellite center owned by villagers to replicate these practices.
Yagasu’ carbon project in Indonesia stands out among the others as a strong example of captured co-benefi ts from local products. The coastal systems had developed a small tourism industry based on attracting recreational fi shing from nearby Medan; local communities catered to middle-income families escaping the city for a day of fi shing or crabbing. Also, com-mercialization of mangrove products was at a scale we had not yet previously encountered: local communities were making food products, rice substitutes (from Avicennia fl our), syrups, cigarette paper, and various building products in a sustainable manner from the mangroves. A management challenge in this context, however, was that the species suit-able for such livelihood benefi ts were not necessarily the same as those yielding the highest levels of carbon annually. The local Avicennia and Nypa species had more local uses but their carbon potential was far inferior to that of Rhizophera spp; moreover, the desire to use the local mangroves for fi sh-ery-based livelihoods required that areas remain accessible. In the end, through consultations and planning, tradeoffs were made that designed the system in a way that species important to livelihoods could be interplanted with the high carbon species; all of this was moreover done on a mosaic that maintained up to 30% of plantation areas as channels and open water to permit some form of aquaculture (such a sys-tem is not uncommon in natural conditions in any event). The lesson was that if one does not insist on the highest levels of carbon sequestration, then there may be greater community livelihood co-benefi ts and willingness to co-manage the plot.
Another observation made at Yagasu’s sites was that, dur-ing project design and verifi cation, we noticed that the com-munities had a propensity to replace any single tree that died. We normally expect 10% or higher mortality on plantations due to natural causes, and thus plant more densely than the fi nal desired plantation density. This is also a way of letting
the fi ttest survive under natural selection in ecosystems. Replacing a single tree that dies is a labor of love, and the economics make no sense. But the locals feel it is absurd sim-ply to let trees die and plant more than one initially needs. Hence the implementation program was developed to accom-modate replacement planting. For us this underlined the im-portance of being fl exible in a matter that takes into account local preferences.
6 Challenges of Performance Monitoring
Performance monitoring is a key theme as it relates to an on-going need to accommodate a complex array of monitoring, auditing, validation and quality control requirements over a range of multiple objectives. The challenge in this realm is that capacity of local community-based systems is often stretched to the maximum in performance monitoring, and interests of different stakeholders may not be fully aligned. As an example, many carbon projects now have multiple ob-jectives – carbon, biodiversity, and community welfare – but there are few received protocols for addressing these concur-rently. The main strategies for addressing community based monitoring challenges rely on: (i) training; (ii) local innova-tion; and (iii) development of simplifying procedures.
In Senegal, plantations are operated by direct planting of seedlings without any nurseries; monitoring activities are conducted at the community level and focus on aspects such as plantation of the large-scale project and taking care of the young planted seeds. A key monitoring challenge has been to make communities understand the key factors of good planta-tion performance and then to target incentives to these very factors. It was resolved fi nally through the same factors which are described between Livelihoods and the project de-veloper: “GREEN” coded areas (corresponding to good growing conditions) with the right tree density indicated good performance. A second challenge specifi c to monitoring included stratifi cation and how to monitor the evolution of the tree density and then measure the growth of the trees. This was resolved through combining a mix of external expertise informed by local observations, similarly to how soil quality was monitored. A key lesson from this was to choose from the outset the right “community-based” performance incen-tives, and be certain that these factors are included in the common contract you have with the project developer.
Monitoring challenges are signifi cant in the Indian Sundarbans. Destructive sampling is illegal under national laws because mangroves are protected species. Three months of the year the area is prone to storms that routinely take lives and damage property. Loss of life to tigers and snakebite is not uncommon in the region: during the fi rst planting season a villager gathering propagules for the project was attacked and killed by a tiger. Satellite imagery and remote sensing are confounded by high tide levels which submerge plantations; only multiple views might give some idea of plantation ex-tent or condition and these are too costly to purchase given the budgets of most of these projects. Traditional forest men-suration methods work at early stages of plantation growth but once a plantation is 5-10 years old it is impossible to move through and measure safely. Errors are potentially
60 FACTS Reports

Challenges of Community-Forestry Based Carbon Projects: Process, Participation, Performance
9www.factsreports.org
large, and the diversity of species escalates from natural re-generation once the initial plantation has taken hold. At pres-ent, all of the plantations are readily measured but the situa-tion is expected to become more diffi cult. Work has commenced with the Sundarbans Forestry Department to es-tablish protocols that can more readily assess above ground biomass; estimating below ground biomass and soil carbon remains elusive and the project will rely on default method-ologies and calculations for working estimates. In the future, destructive sampling may also be permitted to obtain better estimates, but carbon measurement remains diffi cult under these conditions.
Although carbon monitoring can follow certain standard protocols, monitoring community benefi ts and biodiversity in the Indian Sundarbans is not straightforward. Criteria call for monitoring of indirect and direct impacts, but there are no standards for what might be regarded as positive or negative effects, beyond simply following locally developed prefer-ences. These seem to us somewhat arbitrary, and in any event are more useful as a feedback device for ongoing manage-ment, rather than a defi nitive metric for defi ning success. Much of the problem deals with measurement of the baseline and specifi cation of counterfactual conditions; livelihood ac-tivities can be wiped out in one fell swoop by a bad storm, or by a pest, through little fault of the communities. A diversity of plantation activities might make them more resilient to fu-ture losses, but there is no way of knowing how well they would have done in the absence of the activities. Moreover, most monitoring tends to be input oriented (e.g., people in-volved, hours spent) rather than results oriented (e.g., income levels achieved, health and nutritional status improved). Given that results are often long-term, monitoring timeframes and impacts are more diffi cult to tie to specifi c project activi-ties. Biodiversity impacts fall in a similar realm: the times-cale of the impacts is not in concordance with that of most short term monitoring protocols. At this stage, there has been no particular need for detailed impact monitoring in the Indian Sundarbans, but this may change in the future.
In the India project with Naandi, a key monitoring chal-lenge has been to collect vast amounts of data (area, species mix) for a single plot, to treat these, and to store the informa-tion knowing that carbon project eligibility procedures re-quire saving and being able to trace single items from year 0 to year 20. It was resolved primarily through a tool developed by Naandi called “Livelihoods 360” relying on the mobile phone network. From a standard mobile phone farmers or fi eld offi cers, can collect data which are sent to central serv-ers were the data are treated; the majority of farmers – even the poorest – in these communities now have a mobile phone. This also allows the project developer to send back treated information to the fi eld offi cers and farmers. A second chal-lenge specifi c to monitoring included limited skills of farm-ers, who more accustomed to managing cattle than to manag-ing fruit trees. This was resolved through capacity building in centers such as the central nursery, and it will be developed further.
Many of the general issues faced by others – as noted above – are also faced by Yagasu in Indonesia. But some of Yagasu’s approaches show how innovation can potentially lead to
better performance monitoring. The issue of below ground biomass measurement is problematic worldwide; few empiri-cal studies have been done and results are frequently not eas-ily transferred to other locations because of differences in biophysical conditions. From the outset, Yagasu has main-tained a very high level of research interest and capacity on issues associated with carbon measurement and tree growth. At the proposal stage, for example, staff had been working on fractal models of tree and root growth, which would assist in estimation of below ground biomass using non-destructive methods. Since then, ongoing research programs on BGB will assist in estimates of carbon sequestered by the project. The work can assist projects in the country by providing a benchmark national value for use in those estimates.
7 Su mmary of Recommendations
Against all odds, the communities with which we are work-ing are demonstrating a remarkable capacity to adapt to the processes, participatory models, and demands for clear per-formance monitoring. There are defi nite lapses, but many of these lapses are not of their own making and – to their credit – are usually temporary. We regard this as an incredible achievement given that carbon projects seem to demand con-siderably more effort than other types of community-based initiatives. From this, we identify a number of elements that seem to ensure a greater level of success in such projects.
• Lesson 1. Remember that everyone can learn and be trained.. GPS logging and analyses of criteria of car-bon additionality are now in-house skills that were previously contracted out. Many CBOs have created their own awareness building material on “carbon” to educate local villagers, politicians, or local bureau-crats using local languages and metaphors to convey complex concepts. Branding (“Livelihoods”) is a powerful complementary aspect of the ongoing learn-ing, as people can build trust in the brand and the posi-tive impacts it can have on them.
• Lesson 2. Find the hidden strength in local networks and connections available to the partner CBO. All of the CBOs with which we have worked have a store of local social capital on which they draw. This is seldom obvious, and is not easily described. But it only mani-fests itself when seemingly intractable problems are encountered: ranging from corrupt offi cials, to deaths of local experts, to higher than budgeted expenses for sourcing seedling pots/bags.. Entrepreneurs step in to make bags locally. At times these connections seem to be propelled even further by the momentum of our projects. Recognize this strength when it arises, and do not stand in its way.
• Lesson 3. Go for clarity in targets and standards. Most CBOs we work with have been around for a while, are registered nationally, and are capable ac-countants. They understand accountability very well, and specifi cation of hard targets and standards is both possible and desirable, as it provides a transparent
61www.factsreports.org

Challenges of Community-Forestry Based Carbon Projects: Process, Participation, Performance
10 Field Actions Science Reports
means for everybody to see what happens. Choosing clear achievable targets with the CBOs is more effec-tive than imposing diffi cult to achieve or loosely de-fi ned targets. Also, it is important to specify maximum levels if these are applicable; while for mangrove plants a planting density of 5000 stems a hectare may be best, communities frequently enthusiastically over-plant by a factor of two or three or more. To them this seems prudent, but ecologically the high density be-comes a constraint on plantation growth and may re-quire thinning and additional costs in the future. Communication of the reasons for the target is thus equally important.
• Lesson 4. Be fl exible and patient. This manifests it-self in many ways but it usually relates to the speed at which we expect things to be done versus the speed that is actually achievable. Scaling up small projects is no simple matter. It is generally easier to attach a “car-bon activity” to existing livelihood activities than the other way around. CBOs expanding to new sites need time fi rst to establish a reputation and build trust through conventional livelihood activities: health re-lated interventions coupled with simple income gener-ating schemes are a usual fi rst step. Once these are in place, the more diffi cult concepts and protocols have a better chance of taking hold.
In association with the above, we have found that some of the “rules” and “expectations” can work against these les-sons. Methodologies which lack clear targets, guidelines with no fl exibility, or legal agreements with no scope for delega-tion all stand afoul of some of the above lessons.
We will not list all of the problems that our CBOs encoun-ter, but highlight the three which we believe to be the highest priority.
• Priority 1. Greater methodological fl exibility is need-ed in scaling projects. Most of the standards have not been created regarding high scale community projects such as mangrove projects. In these cases, fl exibility can also provide from the standard itself towards the communities requirements. LV, in collaboration with IUCN and RAMSAR Secretariat proposed a large scale community-based methodology for Mangrove restoration that has been approved by the CDM Board in 2011.
• The methodologies do not lend themselves well to adaptive scaling over a multi-year period. A 6000 ha project cannot be done in one year: it is generally fea-sible within 3 years and lessons learned in early years can be applied in subsequent build out and introduc-tion to other communities. Moreover, attributes of communities will differ in a region and what might work in one community will not work in another; most methodologies assume and require homogeneity in practices to permit fl exible scaling.
• Priority 2. Project scope regarding co-benefi ts needs to be more precisely defi ned in candidate
methodologies, with greater attention also paid to what is meant as the local “community”. There is fre-quently a presumption that everybody in the “commu-nity” has the same interests, but this is not so. One person’s gained fi shery ground is another person’s lost grazing area. Capturing the full extent of impacts may be cumbersome if there are no clear boundaries drawn. We generally use a workaround method that tries to identify all benefi ciaries of a given area or plot, but such identifi cation is diffi cult in the absence of histori-cal baseline studies and under conditions of free and open access to physical data. Simplifi ed protocols to address the scope of co-benefi ts are required.
• Priority 3. Monitoring protocols for co-benefi ts need to be fi eld-tested in practical settings. Most current criteria for monitoring social impacts and biodiversity impacts are either too costly to implement reliably or, leave so much to interpretation that an improvement in social or ecosystem conditions may not be detect-able over the monitoring period. There may also be a disincentive to report correctly if incentive pricing for carbon requires impacts to fall within a specifi c range. In some instances, a prima facie successful project (e.g., one that removes species from threatened status or substantially reduces poverty) could have the unin-tended effect that the project no longer qualifi es for certain preferential (e.g., Gold) status. These criteria are eliminated or expressed in a way that is more meaningful to monitoring by CBOs.
Livelihoods Venture is addressing a number of these. For example, initiatives with IUCN and RAMSAR Secretariat are underway to test potential guidelines for the defi nition (Priority #2) and monitoring (Priority #3) of co-benefi ts. Provisionally this will be done with Yagasu at some of their sites in Indonesia, once these are formally registered as car-bon projects.
In closing, we thank our partners in the CBOs discussed in this paper. Another important lesson we have learned is that a sense of humor also helps considerably when we face the challenges inherent in these carbon projects. Their unfailing sense of good humor has been appreciated more than we can express.
8 Ac knowledgments
Livelihoods Fund CBO from Oceanium (Senegal), Naandi Foundation (India), Nature Environment Wildlife Society (India), Yagasu (Indonesia), IUCN, RAMSAR Convention, Carbon Methodologies standards UNFCCC & Verifi ed car-bon Standard
62 FACTS Reports

© Author(s) 2012. This work is distributed under the Creative Commons Attribution 3.0 License.http://factsreports.revues.org/1997Published 12 september 2012
The BipBop programme: Providing access to reliable, affordable and
clean energy with a combined approach of investment, offers and training
Gilles Vermot Desroches1, Thomas André2
1Sustainability Senior Vice-President, Schneider Electric 2PhD candidate, Department of Economics, Ecole Polytechnique
Abstract. Universal access to clean energy is a major worldwide concern which has been reaffirmed when 2012 was declared by the United Nations as the International Year of Sustainable Energy for All. With this goal in mind, multinational corporations are developing inclusive business approaches targeting low-income populations. To be considered successful, these strategies must participate in development, be sustainable, and impact as many people as possible. We describe the case of Schneider Electric’s BipBop programme which aims to promote access to reliable, affordable and clean energy to the people who need it the most. We present key factors contributing to a broader effectiveness of poverty eradication and protection of the envi-ronment by multinational corporations: engagement of top management; programme alignment with the strategy of the firm; incorporation of the Groups’ entities; balancing global and local actions; and measuring social and environmental results.
Keywords. Base of the Pyramid, Bottom of the Pyramid, inclusive business, Access to Energy, BipBop, Schneider Electric.
1 Background and introduction
When it comes to access to energy, the world is paradoxical and unfair. Two billion people on the planet are energy privi-leged and don’t even question the idea of having energy. On the other hand, 1.3 billion still do not have reliable access to clean electricity (IEA, 2011). They are at the so-called “Base of the Pyramid” or the BoP. For them, sources of energy – kerosene, flashlights, and wood-based biomass – are pollut-ing and expensive, and endanger health. What is even more unfair is that the poorest people pay the most for energy, com-pared with developed countries. BoP populations suffer form a poverty penalty as highlighted by C. K. Prahalad (Prahalad & Fruehauf, 2004). Urban inhabitants in Beijing, Paris, and New York spend from six to eight per cent of their revenue on energy, whereas a person living in an off-grid remote village in India will spend up to 30 per cent for poor quality service (Hammond, Karmer, Katz, Tran, & Walker, 2007). While populations without access to electricity are mainly in Asia (55%) and Sub-Saharan Africa (40%), promoting access to energy is a worldwide challenge.
Access to modern energy not only improves the quality of life of low-income populations, but also facilitates access to healthcare, education and development through entrepre-neurship. The importance of access to clean energy as a first
step to encourage development was not a primary focus when the Millennium Development Goals (MDG) were set in 2000. None of the 8 goals directly emphasizes the need to promote access to energy. The United Kingdom’s Department for International Development clarified two years later the direct and indirect roles of energy in helping to achieve the MDGs (DfID, 2002): energy enables enterprise develop-ment, staple foods need cooking, modern lighting allows evening classes and home study, energy services free girls’ and women’s time from survival activities, indoor air pollu-tion is reduced leading to less respiratory infections, cold generation improves medical facilities, irrigation through electric water pumps reduces pressure on the ecosystem, and cleaner fuels reduce greenhouse gas emissions. Access to en-ergy is now internationally recognized to be a basic need and means for development of worldwide populations. To that end, Ban Ki-Moon, the United Nations Secretary-General, declared 2012 as the International Year of Sustainable Energy for All and fixed an objective of universal energy access to be achieved by 2030.
In this context of international concern, multinational corporations have a role to play. Some of them – utilities, equipment and solution providers - gathered among the World Business Council for Sustainable Development’s Access to Energy Initiative to recognize their role in
S
63www.factsreports.org

G. V. Desroches and T. André: The BipBop programme
2 Field Actions Science Reports
promoting access to energy for all (WBCSD, 2012). Developing pro-poor business approaches within multina-tional corporations raised 10 years ago. The widely popular “Bottom of the Pyramid” strategies from C. K. Prahalad (Prahalad & Fruehauf, 2004) and “Social Business” concept of Muhammad Yunus (Yunus, 2008) led to many initiatives in every sector: SC Johnson in Kenya, Hindustan Unilever in India, Cemex in Brazil, Danone and Veolia Water in partnership with Grameen in Bangladesh, or Lafarge in Indonesia. This dominant enthusiasm faced critiques. Aneel Karnani highlighted the fact that there were no profits at the Bottom of the Pyramid, that BoP strategies were not targeting the poorest of the poor, and that companies should consider them as producers rather than only consumers (Karnani, 2007). More recently, Erik Simanis reaffirmed the importance for companies to focus on their core compe-tencies and their search for profit to make BoP strategies successful (Simanis & Milstein, 2012). Looking at the en-ergy sector, specific obstacles arise. Christine Heuraux highlights the need for high investments of infrastructures leading to the difficult profitability of business models that are often dependent on subsidies (Heuraux, 2010). To be considered successful, BoP strategies need to fulfill three requirements. First, activities must attain social and envi-ronmental objectives, thus being relevant in terms of devel-opment. Second, models must be sustainable to grow in time. Third, programmes must impact as many people as possible through scalability.
This paper describes the case of Schneider Electric as an optimistic example in such a sensitive context. The Group launched in 2009 the BipBop programme – which stands for Business, Innovation and People at the Base of the Pyramid – to promote clean energy access for the people who need it the most worldwide. Business, Innovation, and People, re-spectively, provide investments, create markets to deploy dedicated offers, and support adequate training. Through a description of each pillar, this paper illustrates some estab-lished success factors based on the reasserted description by François Perrot of “BoP 2.0” strategies (Perrot, 2010). The progressive incorporation of business approaches aligns this responsible initiative with the overall strategy of the Group. The engagement of top management permits BipBop to benefit from the different operational and business enti-ties of the company to provide sustainable products and so-lutions. The central management of the programme relies on a decentralized team of collaborators whose role is to adapt actions locally thanks to several partnerships. This balance of global and local actions permitted BipBop to replicate projects in many countries: providing financial support to 6 SMEs in the field of access to energy and job integration; distributing 250,000 renewable energy prod-ucts; electrifying 30 villages; and creating almost 40 train-ing projects in energy management which trained over 12.000 people. BipBop’s social and environmental results are measured and communicated through the Planet & Society Barometer, the Group’s sustainability scorecard, paving the way toward deepened monitoring and evaluation of impacts in the future.
2 Providing Access to Energy: contributing wherever a multinational can make the difference
2.1 BipBop programme: three pillars, one goal
As a global specialist in energy management with operations in more than 100 countries, Schneider Electric offers integrat-ed solutions to make energy safe, reliable, efficient, produc-tive and green across multiple market segments. The Group has leadership positions in energy and infrastructure, indus-trial processes, building automation, and data centres/net-works, as well as a broad presence in residential applications. With sales of 22.4 billion euros in 2011, the company’s >130,000 employees are committed to help individuals and organizations “Make the most of their energy.” The Group has the technologies and the expertise to address the environmen-tal challenges relating to carbon and energy. In addition, it has a presence in more than 100 countries and already makes 39% of its sales in developing economies. Most of the people lacking access to electricity are living in those regions.
Part of the company’s culture is to play an active role in the economic development of the communities in which it is present. Schneider Electric Foundation was created in 1998 to promote youth integration through vocational trainings and employees’ sponsorship, and to provide emergency as-sistance to victims of natural disasters. With the emergence of Corporate Social Responsibility, the Foundation’s director was in charge of creating the Sustainable Development Direction in 2002 under the Executive global function “Strategy & Innovation”. One of his first missions was to es-tablish a sustainability scorecard which defined strategic plans in terms of sustainability for the overall activities of Schneider Electric, measured their progress, and reported them to stakeholders. The Planet & Society Barometer was launched in 2005 and was externally audited. Three years later, following the company’s goal to improve its engage-ment toward surrounding communities and to reaffirm its innovation capacity, Jean-Pascal Tricoire, President and CEO of Schneider Electric, decided to tackle the challenge of energy access through what would become the BipBop programme. Sustainable Development direction inspired from “Bottom of the Pyramid” strategies made popular by C.K. Prahalad in 2004 (Prahalad & Fruehauf, 2004) and “Social Business” approaches driven by Muhammad Yunus, the 2006 Nobel Peace Prize and founder of microfinance institution Grameen Bank (Yunus, 2008).
In early 2009, the BipBop programme was launched to contribute to access to clean energy for low-income popula-tions through the development of a combined approach of philanthropy and business. By investing in communities and stakeholders at the Base of the Pyramid, the programme ad-dresses three key challenges in promoting access to reliable, affordable and clean energy:
• TheBusinesspillar provides financial, technical and managerial support to SMEs and entrepreneurs in the field of access to energy through an impact investment fund in order to stimulate the local economy;
64 FACTS Reports
The BipBop programme

G. V. Desroches and T. André: The BipBop programme
3www.factsreports.org
• TheInnovationpillar develops a cost-effective port-folio of products and solutions providing access to energy for low-income populations and creates markets adapted to local socio-economic contexts in order to tackle the lack of appropriate equipments that answer to local needs;
• ThePeoplepillar creates trainings in energy man-agement trades for disadvantaged youths in order to promote the local development of long term skills and expertise.
Investments through the Business pillar, offers through the Innovation pillar, and training through the People pillar began autonomously. Synergies between them have already started, thus increasing the broader impact of BipBop ac-tivities. BipBop performance monitoring was incorporated into the Planet & Society Barometer in order to track re-sults and to communicate about progress. Innovation and People pillar objectives have been renewed for the period 2012-2014. They respectively have to provide access to en-ergy for one million households and train 30,000 disadvan-taged people in energy management trades at the end of the period. Business pillar monitoring has not been kept under the Barometer. The three-year tracking of its activities would not have been representative because of its longer-term timeframe.
BipBop works as a start-up. This unique positioning within the Group makes it a transversal programme. The central team of an average of 17 people based in France and India rely on several worldwide operational and business entities to fulfil its mission. It takes advantage of every needed qualification thanks to top management engage-ment. Three years after its launch, the programme succeed-ed in balancing support and guidance from the central team, and field projects and learning from a decentralized team of collaborators.
Looking at the corporate level, the BipBop programme is now clearly in line with the Group’s overall strategy. First, it behaves as a solution provider when combining different products, financial support and training to ad-dress the needs of low-income people. Secondly, it focuses on “making energy safe, reliable, efficient, productive, and green” (Schneider-Electric, 2011). Thirdly, sales are focus-ing on new economies and emerging countries. Finally, it strongly emphasizes the need for collaboration through external partnerships. The BipBop programme is an emanation of the progressive evolution of the Group’s re-sponsibility: starting with philanthropy, then building a Corporate Social Responsibility framework, and now moving to enhanced business integration. In this sense, the BipBop programme clearly stands in a logic of “Creating Shared Value” emphasized by Porter and Kramer (Porter & Kramer, 2011).
The synergies built between pillars are paving the way to a systemic approach to tackle the issue of access to energy among poor communities, leading to a sustained economic fabric, improved energy usage, and the development of long term competencies. The following sections describe each of the three approaches.
2.2 BipBop Business: developing local economy through impact investments
Schneider Electric Energy Access (SEEA) fund was creat-ed in July 2009 with the support of the Crédit Coopératif and the consulting firm PhiTrust to work as a global sus-tainable venture capital fund. Its mission is twofold. The fund provides support for the creation and development of enterprises and profitable entities which help the poorest to gain access to clean energy. The fund also sustains the development of entrepreneurship in electricity trades and renewable energies. Alongside its social mission, SEEA has a targeted Return on Investment of 5 to 10%. Therefore, supported companies must have a double objective, clearly identified: generate a strong social added value while re-maining profitable. In this sense, SEEA stands in the field of Impact Investment.
Every company into which the fund may invest must follow three key orientations. A geographical, sectoral, and social filter categorizes eligible companies:
• In France: companies promoting job integration in electricity, targeting fuel poor situations, and working in the field of environmental social housing building. SEEA already agreed to invest up to 100,000 euros in Foncière Chênelet and 150,000 euros in Solasyst. Foncière Chênelet is a real estate developer building energy efficient homes for social housing sector. Solasyst is a job integration company which installs domestic photovoltaic systems.
• In Sub Saharan Africa and Asia: companies manufac-turing, selling, renting or maintaining innovative residential appliances; micro-finance institutions pro-moting individual appliances; and companies install-ing, operating or maintaining decentralized rural electrification facilities. Every company is in the field of renewable energy and is focusing on rural or sub-urban areas. SEEA already invested 100,000 euros in Kayer and 250,000 euros in NICE International. Kayer installs photovoltaic systems and distributes Solar Home Systems in Méckhé region in Senegal. NICE International builds a network of franchises providing access to energy services, and ICT in Gambia and soon in Eastern Africa (see case study “Investment in NICE International”).
Promoting local development while mitigating financial risks requires strict management rules. Investments conclud-ed by SEEA range from 100,000 to 400,000 euros for periods of 5 to 7 years. The fund never takes a majority shareholding in order to remain as a support for impact growth while the entrepreneur keeps hands on its activities. SEEA always in-vest in partnership with recognised players. Previous invest-ments were jointly performed with other impact investment funds such as SIDI, Crédit Coopératif, Rabobank or the Dutch development bank FMO. Other potential investments are being explored with similar partners such as PhiTrust, Investisseur & Partenaire, GVEP or GDF Suez’ programme Rassembleur d’Energie.
65www.factsreports.org
The BipBop programme

G. V. Desroches and T. André: The BipBop programme
4 Field Actions Science Reports
Schneider Electric took advantage of the new French legis-lation of 2008 on employee savings schemes to develop a tailored juridical structure. The law imposes listed firms to propose a solidarity-driven (accredited “solidaire”) savings plan to their employees. In order to better engage every em-ployees as well as giving more sense to such a savings plan, the Group built a mutual fund (SICAV) that invest 5 to 10% of its assets into the SEEA fund. The chosen condition for the savings plan to remain “solidaire” is that SEEA in-vests a minimum of 35% of its assets into French based companies labelled “solidaire”, officially recognizing their affiliation with social economy according to French law. In 2010 and 2011, 2,000 employees of the Group based in France showed their interest in BipBop by investing a total of over 3 million euros on a voluntary basis into the “solidaire” savings plan. Managing the fund internally is an opportunity for the Group to encourage its employees and business part-ners around the world to play an active role in the social com-mitment of the Group. Employees are also involved in SEEA by making the link between the BipBop business mana-gement team and energy entrepreneurs that are looking for financial support. Since early 2012, employees have the pos-sibility to provide technical, managerial or accounting sup-port to entrepreneurs through volunteering missions managed by a dedicated NGO, Schneider Electric Teachers.
Business pillar performance was monitored and reported under the 2009-2011 Planet & Society Barometer. SEEA, through its 6 investments, sustained the creation of almost 400 entrepreneurs onto an objective of 500. SEEA progress tracking has been removed from the new Barometer covering the period 2012-2014. The Group recognized that a three-year monitoring under the Barometer were not the best way to represent SEEA activities which has a timeframe of 5 to 7 years per investment. This removal highlights the willing-ness to evaluate social and environmental performance in a meaningful way.
2.3 BipBop Innovation: deploying offers that meet the means and needs of BoP populations
Innovation for the BipBop programme starts with under-standing the local socio-economic context and needs of those with little or no access to electricity. With this in mind, the aim of the BipBop Innovation pillar is to offer dedicated products and solutions that support sustainable economic and social activities through adequate business models that guarantee their sustainability in the long term. As character-ized by François Perrot (Perrot, 2010), Innovation pillar activities can be defined as a BoP 2.0 strategy. The market is being created to target a low-income population as consum-ers and business partners. A team and budgets are devoted to manage local adaptation and replication. Finally, it is impor-tant to develop partnerships with NGOs or entrepreneurs to combine capabilities.
The Innovation pillar brings technologicalinnovations to provide comprehensive energy access products and solutions that support revenue-generating entrepreneurial activities, foster community services, or meet domestic use. The Offer Creation team Creation team of BipBop Innovation pillar,
Case study: Investment in NICE International (the Gambia)
Access to Information and Communication Technology (ICT) has been recognized to participate to development. Telecommunication networks can provide services that are directly linked with socio-economic development such as entrepreneurship, education, health, agriculture of financial access. However, ICTs need to be leveraged by clean energy.
NICE International is a social venture acting in Eastern Africa and the Gambia (Figure 1). Through its NICE-brand and micro-franchise concept, the company already implemented seven ICT services centres in Gambia. NICE centres are located in peri-urban areas to be accessible by as many customers as possible. The business concept is to sell services made possible thanks to an energy generation point made through a hybrid system solar-grid or solar-genset. All services provided in the NICE-centres are sold on a pay-per-use basis at market-level prices. They are organized into 4 categories, with increasing value to customers: ener-gy services, infrastructure services, value added ser-vices, and revenue generating services. NICE centres started to propose energy services such as battery charging of mobile phones and rechargeable household small batteries, servicing solar energy appliances such as mobile phones chargers, lanterns and radios. Infrastructure services are the core offer of NICE Centres. Examples are computer use, Internet-browsing, VOIP-calling, printing, scanning and cinema.
NICE International plans to extend up to 250 centres in 10 countries starting with Tanzania and Zambia. NICE has been granted 2.5 million euros by European aid to fi-nance the first 50 centres. In this frame of expansion to serve low-income population, Schneider Electric Energy Access fund invested 250,000 euros alongside with Rabobank and the Dutch development bank FMO which respectively co-invested 250,000 and 500,000 euros. This will also permit NICE International to develop their 2 other categories of services through strong local partnerships. Value added services are focusing on em-powering specific target groups such as business develop-ment, e-healthcare, e-banking, or government services. The most important service is education. As an example, NICE centres provide services for youth such as access to Internet, computer based education, and school TV for primary schools. Income generation services would focus on entrepreneurs by providing an infrastructure that allows start-up incubation. Small enterprises may be sec-retarial services, computer-based accounting services, web development (as follow-up of web-design courses) and Internet-trading.
66 FACTS Reports
The BipBop programme

G. V. Desroches and T. André: The BipBop programme
5www.factsreports.org
composed of an average of 5 people based in Bangalore (India), develops specific products and solutions to meet those needs. The portfolio has been segmented into three ranges of products and solutions:
• Portable products: an integrated battery with inverters to plug a CFL bulb and supply small power alternative current appliances.
• Residential or home products: high energy-efficient LED Solar Lighting Systems (called In-Diya), and Solar Home Systems to supply small direct current appliances such as televisions, fans, or radios as well. Both systems are based on photovoltaic electricity gen-eration to recharge their battery. In-Diya may also be supplied by main grid.
• Collective solutions: solar or grid supplied battery charging stations meant for In-Diya batteries, solar wa-ter pumping system (called Water of the Sun), and solar micro off-grid facilities (called Villasol).
The BipBop Innovation pillar also brings businessmod-elinnovations in order to both ensure sustainability and to scale up the deployment of its products and solutions. The Business Development team of BipBop Innovation Pillar, composed of an average of 5 people based in Paris and Grenoble (France), adopts a market creation strategy to reach low income populations. The corporate team of BipBop Innovation relies on and provides support to a Business Development team which is hierarchically related to Operation functions of the Group. Collaborators are ful-ly dedicated to deploy the offer in India, Cameroon, Nigeria, Madagascar, Egypt, and South Africa. Thus, de-centralized field work ensures adequate accesses to mar-kets. Based on a three-year experience, three main business approaches arise:
• Residential and portable products provision through dedicated distribution channels
Residential and portable products have been designed to remain relatively affordable for BoP populations.
Looking at In-Diya solar lighting systems, the compa-ny supported all upfront capital costs covering market-ing and socio-economic studies, R&D of a dedicated product, the set up of a production line, and logistics. In these cases, investments were all supported internally. The distribution of such products present a relatively short return on investment. Even if the creation of dedi-cated distribution channels requires business develop-ers to adopt new mindsets, it still means partnering with intermediaries as in a traditional Business to Business approach. As of December 2012, more than 250,000 residential and portable products were sold mainly in South East Asia and Sub Saharan Africa. Critical chal-lenges to expand the deployment of residential and portable products rely (1) in last mile delivery to guar-antee physical access in remote places, and (2) in pay-ment facilities to overcome financial access barriers. Working with local non-traditional partners (NGOs, cooperatives, entrepreneurs, SMEs, etc) is mandatory to fine tune the distribution based on their knowledge of local specificities and their presence in remote areas. Dedicated partnerships with Micro finance Institutions that create line of credits for energy appliances help end users to purchase products.
• Energy services provision through networks of entrepreneurs
Selling products is not the sole approach to adapt to local context. In some places, it is more relevant to re-evaluate the value proposition by providing services instead of selling products or even kWh. A network of franchise entrepreneurs can propose services such as battery charging, water pumping, grain milling, or times of entertainment through a pay-per-use transactional model (Sireau, 2011). The BipBop team’s role is to ac-company small recognized entrepreneurs living in the communities who are thus closer to end customers. In the case of In-Diya Solar Lighting Systems, an entre-preneur manages a battery charging station. He sells or rents the lamp only, decreasing the price for end- customers compared to the acquisition of a complete kit. He then progressively reimburses his initial invest-ment by renting charged batteries on a daily basis. In such a model, investments are transferred from end cus-tomers to entrepreneurs. Critical challenges to ensure the sustainability of such models rely on the appropriate selection of entrepreneurs, the insurance for them to earn sufficient complementary revenue, and a continu-ous relationship management from the BipBop team. This model is being implemented in 8 states of India, with a network of 200 entrepreneurs (see case study “Entrepreneurs Development Programme in India”).
• Communal solution provision through a project approach
Decentralized rural electrification is a major concern for targeting the 85% of populations without energy access living in rural areas (IEA, 2011). Answering to the diversity of collective, entrepreneurial and domes-tic energy needs of an entire village requires a systemic
Figure 1. NICE International, Gambia.
67www.factsreports.org
The BipBop programme

G. V. Desroches and T. André: The BipBop programme
6 Field Actions Science Reports
approach. Technology providers and utilities need to combine several products and solutions, create local business models, and develop strong projects manage-ment in order to be sustainable. As of April 2012, 30 villages were electrified. Nonetheless, a communal solution provision has limitations such as profitability. A critical challenge in the expansion of such models is the necessity to find fundings to cover the high invest-ment of infrastructure that cannot be supported solely by electricity tariffs paid by low-income customers. Links with authorities and legal entities are an essential criterion for decentralized rural electrification projects. Because electricity prices and markets are regulated, one needs to obtain government approval to implement a specific project in an area and sell electricity at a spe-cific price. These links may lead to Public-Private Partnerships to complement competencies and share investments. Therefore, including from the early stages of a project the ministries of energy, rural electrification agencies or energy regulation offices at the national level, and civil, religious or cultural authorities at the local level, ensures the long-term viability of projects. In September 2011, Schneider Electric Nigeria inau-gurated the electrification of Asore village, the first of a series (see case study “Decentralized Rural Electrification in Nigeria”).
Started in a CSR perspective, the first projects were mainly pilots to experiment both technologies and business models. The Innovation pillar was then organized to gather and coor-dinate needed skills and qualifications that a multinational corporation can bring to answer to a BoP issue such as access to energy. Every link of the value chain is impacted by Schneider Electric’s capabilities: the capacity of innovation through mobilization of worldwide R&D, the cost reduction of BoP products through high volumes of procurements, the offer of high quality products that follow manufacturing standards, the supply of products and solutions in every tar-geted country through internal global logistics management, and the creation of adapted business approaches through a dedicated decentralized team of business developers. The Innovation pillar acknowledges the need to partner with non-conventional actors in order to develop adequate joint actions. Local NGOs, entrepreneurs and SMEs provide a comprehen-sive understanding of communities and socio-economic con-texts. Microfinance Institutions help bypass lack of banking services for end customers. Governments and authorities bring legitimacy, set appropriate tariff policies and co-invest in projects. Donors and private investors build hybrid financ-ing schemes to launch projects.
The top management of the Group set ambitious objectives for the Innovation pillar. Its social and environmental perfor-mance has been incorporated under the Planet & Society Barometer since the beginning of the BipBop programme. It permitted to provide access to clean energy to more than a million BoP households at the end of the period 2009-2011. The willingness to scale-up activities has been reaffirmed by renewing the engagement to target one million new house-holds for the period 2012-2014 of the Barometer. Moreover,
Case study: Entrepreneur Development Programme in India
Project at a glance
Almost 300 million people in India do not have access to electricity. Most of them live in rural areas. To tackle this issue, Schneider Electric through its BipBop programme is building a network of locally based entrepreneurs. They run a Battery Charging Station specifically developed to spread the access to highly energy-efficient LED based lighting systems among poor communities. Entrepreneurs recharge batteries and supply them to people in their village on rent.
A local entrepreneur has to own and operate the Battery Charging Station. Schneider Electric India Foundation provides free of cost the first Battery Charging Station kit (comprising 2 75 Wp panels with module mounting structure, Battery charging station, 10 LED lamps and 20 batteries). A single kit permits the entrepreneur to have 10 customers to whom he will sell only the lamps at 900 INR (13 euros). Then the local entrepreneur needs to deliver charged batteries and collect empty ones on a daily basis. Charged batteries are rented to customers at 10 INR (0.15 euros) (Figure 2).
Schneider Electric teams in India select the entrepre-neurs that initially benefited from a basic electrician train-ing supported by BipBop People pillar (see case study “Vocational training to basic electricity skills in India”). Selected entrepreneurs receive a 1-day complementary training from BipBop team in order to provide them the knowledge to install and maintain the system. They will also learn how to manage their revenues through a basic accounting training. After testing the installation of the Battery Charging Station to be sure the entrepreneurs can start their new business, BipBop teams will manage rela-tionships with them through weekly connections mainly by phone. This ensures to resolve potential issues and to help them to grow their business and start selling other products, hence increasing their revenue.
If entrepreneurs want to increase their number of cus-tomer, they can either buy a complete new kit for 60,000 INR (less than 860 euros) including taxes, with preferential loans from rural banks. In that case, entrepre-neurs reach breakeven after 17 months. Schneider Electric teams in India are identifying partners who would partly subsidize the cost of the kit for the entrepreneur.
As of end of March 2012, 57 entrepreneurs created their business of lighting system distribution and battery rental. Their average revenue is 2,500 to 3,000 INR (35 to 43 euros) per month. Each entrepreneur has an average of 9 customers, thus reaching up to 530 people who now have access to highly energy-efficient lighting systems.
The partnership
Schneider Electric teams in India had to conjugate com-petencies and roles of several partners, including:
The BipBop programme
68 FACTS Reports

G. V. Desroches and T. André: The BipBop programme
7www.factsreports.org
Schneider Electric’s CEO and three of his Executive Directors included this social outcome monitoring as a share of their yearly bonuses, thus reaffirming their engagement and their willingness for BipBop programme to succeed.
2.4 BipBop People: promoting long-term competencies through training
A sustained economic fabric and the availability of adequate products and solutions are irrelevant if one doesn’t have the right people to manage them. Without local skills there can be no sustainable development. This is why the role of the People pillar is central to the BipBop strategy. Its objective is to pro-mote the creation of training for disadvantaged low-income populations in the trades of energy management. Competencies and know-how acquired by local trainees helps them to be hired by companies, provide services, guarantee maintenance of systems, and, in time, set up their own businesses.
Based on the assessment with authorities of local needs in terms of energy management competencies, the People pillar develops three main types of training:
• Relatively short, undemanding and widely accessible basic training typically for electrification of residential and commercial buildings (see case study “Vocational training to basic electricity skills in India”)
• Longer qualifying courses leading to a level of techni-cian or senior technician thanks to the involvement of local Ministries of Education;
• Trainers’ training to support effective and quality dis-semination of knowledge transfer in the long run.
Teaching is not a multinational core competency. Hence, the People pillar always implements projects in partnerships with field-based non-profit entities that will teach trainees:
• NGOs like Aide & Action in India and Haïti, Centre Kram Ngoy in Cambodia, Action Development Edu-cation International (ADEI) in Tanzania, or Operation Blessing China (OBC) in China;
• NGOs managing Electrician Training Programme: Schneider Electric initially partnered with Aide &
Action, Don Bosco Tech India, IMC Society of Government ITI and GMR Varalakshmi Foun-dation in the frame of BipBop People pillar. More than 23 training centres were created to provide 4-months trainings all over India in basic electric-ity trades. Partners now help to select trainees to become entrepreneurs based on criteria defined by Schneider Electric teams. Such NGOs are key players to maintain relationships with entrepre-neurs as they speak local languages.
• Schneider Electric India Foundation: The Foundation in India provides the initial Battery
Charging Station kit free of cost to the entrepreneur, thus helping him to start his activities. The Foundation also provides the pool of resources (trained electri-cians), thanks to its direct links with NGO partners of the Electrician Training Programme, from which Schneider Electric teams can select the candidates who are most suitable for entrepreneurial activities.
• Local entrepreneurs living at the Base of the Pyramid: Entrepreneurs themselves are the stakeholder at the
heart of the programme. Motivation level of entre-preneurs is the most critical aspect of the program. They stick to the program as it helps them earn ad-ditional revenue. Indian team developed a process of “relationship management” under which contact is kept with each entrepreneur at least once a week.
The project today and tomorrow
In 2009, 4 entrepreneurs were supported to understand the sustainability economic viability of the business model. After 2 years, these entrepreneurs are still in the business and are increasing their customer base. Once, the viability of the model was proven, Indian team de-cided to scale up the model to 200 entrepreneurs by May 2012 in order to ensure that the model is not geography specific. As of end of March 2012, 57 entrepreneurs in 8 states of India were managing their own Battery Charging Station. A robust process of relationship man-agement is being followed to understand the progress and resolve issues and complaints.
As a next step entrepreneur are encouraged to get aligned with our distribution model and sell other prod-ucts designed for low-income communities.
Following the results of a study being implemented in conjunction with the Indian Institute of Management (IIM) Lucknow, to better understand the socio-economic impact of Battery Charging Stations on the entrepreneurs and the village, BipBop programme could decide to in-crease up to a total of 750 the entrepreneurs supported. Indian teams are now in process of reaching out to other companies, government agencies and NGOs who would like to partner and scale up the initiative.
Figure 2. EDP, India.
The BipBop programme
69www.factsreports.org

G. V. Desroches and T. André: The BipBop programme
8 Field Actions Science Reports
• Training centres like Institut Supérieur de Technologie d’Afrique Centrale (ISTAC) in Congo and Cameroon, De La Salle Continuous Vocational Training Centre (CVTC) in Cameroon, Serviço Nacional de Apren-dizagem Industrial (SENAI) in Brazil, or Ceduc UCN in Chile;
• Universities like JSS Mahavidyapeetha of Mysore in India, or Quisqueya in Haïti;
• National governments or the French ministry of edu-cation which delegate teachers for training energy management.
In contrast with the two other axes of the BipBop pro-gramme, the People pillar implements projects through dona-tions that can be funding, equipment or competencies. Projects are supported by Schneider Electric Foundation, in the framework of its commitment to sustain professional in-tegration of young people. Local entities of Schneider Electric provide pedagogical materials and their employees train teachers and participate to the construction of curricula. This close link with the Foundation made the People pillar benefit from its experience in implementing local training thanks to 120 volunteering employees that compose the Foundation network of delegates present in 70 countries. The People pil-lar, as an emanation of the philanthropic history of the Group, was the first to be operational. This early stage maturity al-lowed the People pillar to implement, as of January 2012, almost 40 training projects in more than 20 countries.
3 Promising perspectives and conclusions
The BipBop programme was launched in early 2009 due to the willingness of Schneider Electric’s president and CEO, Jean-Pascal Tricoire, to promote access to clean energy for those who need it the most (Schneider-Electric, 2009). The first goals were to increase Corporate Social Responsibility in the many countries where the Group is present as well as to highlight its overall innovation capacity. The three pillars of the programme – Business, Innovation and People – are meant to address the issue of access to energy in a systemic
Case study: Decentralized Rural Electrification in Nigeria
Project at a glance
Nigeria has over 160 million inhabitants of whom 60% live in rural areas with few or none having access to ener-gy. By combining the technologies developed in the frame of BipBop and the skills and competencies of Nigerian teams, Schneider Electric electrified Asore community, a village of about 250 inhabitants, in less than 5 weeks com-bining dedicated off-grid product and solutions.
In the Asore community, a lot of time is spent getting water from the closest source. Also, all the activities that require light must be done during daytime, which is a huge constraint. In the framework of its access to energy programme, the Group combined several products and solutions to help low-income people have access to reli-able, affordable and clean energy. The electrification of the village is an example of BipBop approach, com-bining collaboration, local execution and a sustainable business model.
A technological and business solution to meet the needs of the villagers
The Villasol solution is a standardised solar-powered mi-cro off-grid facility for decentralised rural electrification. It consists of photovoltaic panels, a battery bank and bat-tery charging stations that enable a communal recharge system. In the Asore community, the facility can produce up to 3 Kilowatt; enough capacity to supply domestic, en-trepreneurial and community activities such as schools, battery charging station, or water supply for the 90 house-holds, without connection to the national grid (Figure 3).
BipBop team first assessed community’s basic energy requirements before defining the specification of a tai-lored solution covering:
• Continuous service for lighting and electrical con-nections for the only school in the village as well as the solar powerhouse. These facilities have di-rect connection to the Villasol facility to guarantee power availability at any time
• Fulfilment of the basic households’ lighting needs with In-Diya, a LED based Solar Home Lighting System, for which villagers can recharge battery thanks to a communal charging station at the solar powerhouse. As villagers pay for recharging their battery, they pay more attention to their consump-tion. Battery rental tariffs have been fixed to allow villagers to save money compared to the equivalent amount of kerosene needed for their previous lamps.
A plot of land was donated by the village to house the installation and the community youths mobilized to as-sist in the project deployment (construction, security,
Figure 3. Asore, Nigeria.
The BipBop programme
70 FACTS Reports

G. V. Desroches and T. André: The BipBop programme
9www.factsreports.org
approach: promoting the development of locally-based enter-prises in the field of access to energy through an impact investment fund; spreading products and solutions that are adapted and dedicated for low income populations through a market creation approach; and contributing to the develop-ment of long-term competencies in energy management through adapted training.
The progressive integration of the BipBop programme into the strategy of the Group is a major factor of success. Positioning itself as a solution provider permits it to address the energy needs of low-income communities. The pro-gramme incorporates a deeper business approach by gradu-ally mobilizing different Business, Operation, and Support functions. These global and local actions permit to formalize a mainstream BoP strategy that balances standardization of models and adaptation to the local context. Nonetheless a multinational corporation does not have all the required capa-bilities. This is why inclusiveness of activities strongly relies on a combination of internal and external capabilities thanks to field partnerships. Finally, tracking social achievements of the programme through the Planet & Society Barometer – the Group’s sustainability scorecard – reaffirms the engagement of top management. These factors tend to promise BipBop a strong anchorage in worldwide strategies aiming at tackling basic access issues faced by low-income populations such as access to modern energy.
This paper describes the Schneider Electric experience to-wards reconciling poverty eradication and protection of the environment. While BipBop is relatively young, its achieve-ments illustrate the first criteria for a BoP strategy to become successful. Challenges still remain to reach that status.
First, testifying relevance of activities toward development of populations may not be ensured through the Planet & Society Barometer itself. The social objective of the pro-gramme requires an enlarged measure of every social impact through the creation of a specific extra-financial accounting.
organization). Local technical contractors were pre- qualified, selected and hired to carry out the construction of the power house as well as the purchase, installation and commissioning of the PV panels. Upon completion, the community provides 24 hr security, organizes fees collection from battery recharge at N50 (0.25 euros) and keeps accounts of revenues for monthly maintenance and replacement of batteries to guarantee the sustain-ability of the installation.
Providing a green end to end solution for rural elec-trification of an entire village requires high upfront cost investments. For this pilot project, investments were supported by the company itself. Next villages to elec-trify will be financed through a mix of grants and private investments. The payback of the Villasol instal-lation in Asore is evaluated around 5 years thanks to optimized cabling costs and the battery charging station business model.
Partnerships and key stakeholders
Asore community-oriented project involves the combi-nation of capabilities and roles of many stakeholders:
• Schneider Electric Foundation: The Foundation provided the funding to support the
up-front investment of the installation and thus tes-tify that such electrification is adapted to Nigerian rural context and needs of its inhabitants.
• Schneider Electric Nigeria: The local team in Nigeria had a central role of
project management. They identified the project, managed its implementation and followed up lo-cal suppliers and installers. Once the installation was done, they also conducted an enlightenment campaign to both explain the solutions and pro-vide sensitization on electricity to villagers.
• Asore community: Asore community represents the beneficiaries of
the electrification. There has been a strong involve-ment of the entire community as the installation becomes their own. The community jointly agreed on the land site to provide for the installation of the solution. Some of the inhabitants provided manual labor during the construction of the small building or the installation of the solution. One of its mem-bers has been chosen by the community to ensure the security of the installation, manage collections of funds from battery recharging service and main-tain the system on the long run.
• Ogun State ministry of special duties:
Local authorities are key actors which need to be implied from the early stages of such projects. The Ogun State ministry of special duties provided the government support.
Project’s perspectives
On the 29th of September 2011, Asore rural electrifica-tion project was officially commissioned by the Deputy Governor of the state as well as the Director General of the Energy commission of Nigeria. In attendance also were the Consul general of France, State and Local Government dignitaries, representatives of banks, indus-tries, corporate executives and the company’s partners. About 400 people attended the event; an impressive turnout considering the fact that Asore is approximately a 4 hour drive from Lagos, the nearest commercial city.
As a result of this collaboration with the government, 16 more villages have been already approved to receive the villasol systems with funding from the government. Discussions will continue to increase the replication of the model in other villages in Nigeria. Further develop-ment of Access to Energy projects could arise, leading to a potential wider involvement in that field for Nigeria.
The BipBop programme
71www.factsreports.org

G. V. Desroches and T. André: The BipBop programme
10 Field Actions Science Reports
The aims are twofold. A first objective is to internally monitor in depth the different social outcomes in order to improve the efficiency of its activities. An adaptation from the interna-tional donors’ Logical Framework seems to be a first step (Olsen & Galimidi, 2008). A second objective is to evaluate broader social impacts, and validate them through external actors (Heuraux, 2010). This means proving the attribution of the activities of a BoP strategy towards “Positive and nega-tive, primary and secondary long-term effects produced by a development intervention, directly or indirectly, intended or unintended” (OECD, 2002). Several approaches exist which are more or less stringent. We may use non-experimental techniques like the Progress out of Poverty Index (PPI) de-veloped for the Grameen Foundation but which do not an-swer the specific issue of defining the causal link between activities and observed changes. On the opposite, experimen-tal techniques like Randomized Control Trials promoted by Esther Duflo (Duflo & Kremer, 2003) provide rigorous rand-omized analysis of social impacts but may be costly and inherently difficult to apply for a company.
Secondly, attaining sustainability of models to grow in time is not necessarily dependent only on profit maximization, as advanced by Simanis (Simanis & Milstein, 2012). An extra-financial accounting would also lead to better understanding potential benefits of conducting such responsible programmes. Rather than just looking for direct profitability, the programme can improve brand and reputation, obtain licences to operate, attract and retain talents, represent a source of innovation for
Case study: Vocational training to basic electricity skills in India
Project at a glance
In early 2009, the Electrician’s Training Programme (ETP) was launched with the objective of developing skilled manpower in the electrical sector in India. With a helping hand from the NGO Aide & Action, the GMR Varalakshmi Foundation, the institute Don Bosco Tech and IMC Society of Government ITI, 23 training centres are now providing vocational training in electricity for domestic and commercial buildings to underprivileged young people throughout India.
The students who benefit from this training are essen-tially schools or college drop-outs and unemployed. The training courses take place in 23 electrician training cen-tres which are widely accessible in 12 of the 28 states that compose India (Figure 4).
The partnership
Aide & Action is an international Non Governmental Organization having a legacy of providing vocational train-ing for past 30 years. The association and its 1000 employ-ees are conducting educational projects addressing more than 5 million children in 21 countries around the world.
In its endeavours to extend the training program to unemployed women in the country, Schneider Electric India inaugurated the first all women’s electrician train-ing program in Chennai in partnership with IMC Society of Government ITI (Women), the Training and Employment Department of Chennai’s Government, women self help groups and several other agencies.
Also, partnering with IMC Society of Govt. ITI (Women) is a revolutionary step to empower the women in India to work in the field of electricity.
Moreover, a training centre was inaugurated at Hyderabad International Airport in partnership with GMR Varalakshmi Foundation (GRMVF). As a partner, it is a great asset in mobilizing the candidates and imparting quality training to the unemployed youth in India.
The core project
The trainings take places in 23 electrician training cen-tres widely accessible in the following twelve states in India: Tamil Nadu, Karnataka, Orissa, Bihar, Andhra Pradesh, Delhi, Maharashtra, Meghalaya, West Bengal, Chattisgarh, Jharkhand and Uttar Pradesh.
Within the program, unemployed youths from the Base of Pyramid are provided four months of vocational training to enable them to become electrician. All train-ing centres provide a common curriculum based on Electricity for Residential and Commercial Buildings with courses on house and building wiring, electrical safety or solar based home lighting systems installation.
In addition to the technical training, the trainees are also given training on spoken English, computers, cus-tomer interaction and entrepreneurship. The trainings account for 40 hours per week and 80 days in a year with 30 days of classroom training and 20 days of in-field or on-job training.
The certification is provided by the Group and its partners for all the training centres, which help the can-didates gain easy recognition from their employers.
With the financial support of Schneider Electric Foundation, the Electrician Training Program receives all the equipments and tools required as well as contribu-tion to the payment of salaries of technical trainers. Besides, the program has been supported for the design of the curricula and courses contents to ensure that qual-ity and new market trends are covered.
The project today and tomorrow
Currently, 11 training centres belong to Aide & Action iLead project; four are managed by GMRVF, one belongs to IMC Society of Government ITI. More recently, Indian team has opened 7 new residential electricians training centres in partnership with Don Bosco Tech India, to encourage entrepreneur development. The Electrician’s Training Programme helps nearly 2000 unemployed youth in India every year.
The BipBop programme
72 FACTS Reports

G. V. Desroches and T. André: The BipBop programme
11www.factsreports.org
mature markets, or even constitute markets of tomorrow. Minna Halme discusses different types of Corporate Social Performance that may lead to improved financial perfor-mance (Halme & Laurila, 2009). Extra-financial benefits constitute just as many criteria for sustainable growth of BoP strategies run by Multinational Corporations but need to be further evaluated.
Thirdly, impacting as many people as possible through rep-lication strongly relies on building unconventional alliances. In the company perspective, combining capabilities with cross-sector alliances on the field may be close to a business-to-business approach. However, partners in BoP strategies are generally non-profit organizations or social entrepreneurs, which have different objectives and organizational structures. As proposed by Murphy, Perrot and Rivera-Santos (Murphy, Perrot, & Rivera-Santos, 2012) applying a “relational capac-ity for Social Innovation” (RCSI) model would improve understanding of learning and innovating dynamics of such partnerships. Missions of NGOs, social entrepreneurs, and multinationals are now converging on targeting social and environmental issues through the use of market-based ap-proaches. Each of their historical perspectives influences the emergence of intermediate joint practices, reconciling pov-erty eradication and protection of the environment in an innovative way.
To know more about BipBop programme, see:www.schneider-electric.com/bipbopwww.bipbop-energy.comwww.barometer.schneider-electric.com
Acknowledgement
The authors wish to thank Jean-Pierre Ponssard, and François Perrot from Ecole Polytechnique for their helpful support. We are particu-larly grateful to Sustainable Development Direction team members of Schneider Electric for their availability and insights. Financial support from the Ecole Polytechnique chair FDIR (chair for sustain-able finance and responsible investment) is acknowledged.
References:
DfID. (2002). Energy for the Poor. Underpinning the Millennium Development Goals (pp. 32). London: Department for International Development.
Duflo, E., & Kremer, M. (2003). Use of Randomization in the Evaluation of Development Effectiveness. Paper presented at the Conference on Evaluation and Development Effectiveness, Washington.
Halme, M., & Laurila, J. (2009). Philanthropy, Integration or Innovation? Exploring the Financial and Societal Outcomes of Different Types of Corporate Responsibility. Journal of Business Ethics, 84(3), 325-339. doi: 10.1007/s10551-008-9712-5
Hammond, A. L., Karmer, W. J., Katz, R. S., Tran, J. T., & Walker, C. (2007). The Next 4 Billion. Market Size and Business Strategy at the Base of the Pyramid (pp. 164). Washington: World Ressources Institute, International Finance Corporation.
Heuraux, C. (2010). Access to Energy in Developping Countries: EDF’s Experience with Rural Electrification Using an Innovative Business Model. In P. Crifo & J.-P. Ponssard (Eds.), Corporate Social Responsibility: From Compliance to Opportunity? (pp. 19). Palaiseau: Ecole Polytechnique.
IEA. (2011). Energy for all. Financing access for the poor. In OECD/IEA (Ed.), Special early excerpt of the World Energy Outlook (pp. 52). Paris.
Karnani, A. G. (2007). Fortune at the Bottom of the Pyramid: A Mirage. Ross School of Business Paper, 1035, 42.
Murphy, M., Perrot, F., & Rivera-Santos, M. (2012). New perspec-tives on learning and innovation in cross-sector collaborations. Journal of Business Research, 10. doi: 10.1016/j.jbusres.2012.02.011
OECD. (2002). Evaluation and Aid Effectiveness No. 6 - Glossary of Key Terms in Evaluation and Results Based Management (in English, French and Spanish): OECD Publishing.
Olsen, S., & Galimidi, B. (2008). Catalog of Approaches to Impact Measurement. Assessing Social Impact in Private Ventures (pp. 72): Social Venture Technology Group.
Perrot, F. (2010). Corporate Strategies and the Construction of Markets at the Base of the Pyramid. In P. Crifo & J.-P. Ponssard (Eds.), Corporate Social Responsibility: From Compliance to op-portunity? (pp. 233-253): Les Editions de l’Ecole Polytechnique.
Porter, M., & Kramer, M. (2011). Creating Shared value. How to reinvent capitalism and unleash a wave of innovation and growth. Harvard Business Review, 17.
Prahalad, C. K., & Fruehauf, H. (2004). The fortune at the bottom of the pyramid: Eradicating Poverty Through Profit: Wharton School Publishing.
Schneider-Electric. (2009). Rapport d’activité et de développement durable 2008-2009 (pp. 44): Schneider Electric.
Schneider-Electric. (2011). Strategy & Sustainable Development Report 2010-2011 (pp. 84): Schneider Electric.
Simanis, E., & Milstein, M. (2012). Back to Business Fundamentals: Making BoP Relevant to Core Business. Field Actions Science Report(Special Issue 4), 8.
Sireau, N. (2011). Microfranchising: How Social Entrepreneurs are Building a New Road to Development: Greenleaf Publishing.
WBCSD. (2012). Business Solutions to Enable Energy Access for All (pp. 40). Geneva: World Business Council for Sustainable Development.
Yunus, M. (2008). Creating a World Without Poverty: Social Business and the Future of Capitalism: PublicAffairs.
Figure 4. ETP, India.
The BipBop programme
73www.factsreports.org

74 FACTS Reports
Section 3: Solutions to Forest Issues

Section 3: Solutions to Forest Issues
©hellio-vaningen

76
SECTION 3:
SOLUTIONS TO FOREST ISSUES
How to restore dry forest ecosystemsJaime Nalvarte Aider’s project
Community strategy for mangrove forest conservation: Conquista Campesina Conservation EasementJavier Rojas Garcias Pro Natura Sur’s project
Scaling of mangrove afforestation with carbon finance to create significant impact on the biodiversityAjanta Dey and Roy Chowdhury NEWS’ project

© Author(s) 2012. This work is distributed under the Creative Commons Attribution 3.0 License.http://factsreports.revues.org/2151Published 10 October 2012
How to restore dry forest ecosystems
Jaime Nalvarte
AIDER, Av. Jorge Basadre 180 Dpto. 6, San Isidro, Lima 27, [email protected]
Abstract. AIDER is a Peruvian non-governmental organization working since 1992 on forest management activities, watershed management and urban forest management on tropical humid and dry forest at a national level. AIDER and the José Ignacio Távara Pasapera rural community have been working on dry forest man-agement and recovery since 1992.
This paper summarizes the activity of AIDER in the dry forests for the purpose of recovering degraded forest areas and conserve existing forests by developing sustainable economic activities, all geared to help improve the standard of living of the peasant population.
The actions reported here were conducted under a research methodology called research-action, where AIDER professionals raised possible technical solutions to problems affecting the community (hypothesis), which were then contrasted with reality through the implementation of projects development, and were fi -nally accepted or rejected based on improved results obtained.
From 1992 to date, AIDER has worked in the sustainable management of around 3,000 hectares of dry forest. Additionally, the genetic quality and livestock management techniques are being improved, and have estab-lished vegetable crops at the household level to ensure food security. Now the community is fully committed to achieving sustainable management of their lands and forests, realizing that sustainable management is a key issue to improve their quality of life.
Keywords. Forests, natural resources, sustainable development, agriculture
1 INTRODUCTION
AIDER (Asociación para la Investigación y Desarrollo Integral) carries out forest management and biodiversity conservation projects in dry forest regions of Piura, Tumbes and Lambayeque.
With funding from multiple sources, AIDER manages 3,420 hectares of dry forest: 2,220 hectares in the Piura re-gion and 200 hectares in the Lambayeque region. Its central goal to preserve and restore the dry forest involves: sustain-able use of forests and grasslands, based on a cattle and for-est management plan incorporating forestry and livestock activities, supplemented by the development of other pro-ductive activities which together help improve the popula-tion’s living conditions and avoid desertifi cation of the habitat.
It should be mentioned that this goal is in line with the
country’s commitment to the Convention on Biological Diversity, and the Climate Change and Fight against Desertifi cation agreements.
This report summarizes the AIDER experience in dry for-est management in the Piura region.
1.1 Peru’s dry forest
Peru’s dry forests cover 3.2 million hectares and are mainly located on the north coast, in the Lambayeque, Piura and Tumbes regions. They are located between 0 and 1,000 me-ters above sea level, with average temperatures between 17 and 24 °C, annual rainfall below 1400 mm, and extended droughts lasting 6 to 9 months.
The dry forests are linked to mankind from times immemo-rial and have been a source of food, wood and energy for the native Tallán, Mochica and Chimú prehispanic cultures primar-ily based respectively in Piura, Lambayeque and La Libertad.
77www.factsreports.org

How to restore dry forest ecosystems
2 Field Actions Science Reports
The dry forest species have various uses: the Prosopis pal-lida (algarrobo) is used for burning wood, coal and rural con-structions; the Capparis scabrida (sapote) for craftswork; the Loxopterigium huasango (hualtaco), Tabebuia chrysantha (guayacán) and Alseis peruviana (oreja de león) are used for hardwood fl oors; and the Eriotheca ruizii (pasallo) and Bursera graveolens (palo santo) for fruit crates. The palo santo is also burned as incense in religious festivals and activities.
The use of the fruit of the algarrobo tree is also inherited from the ancient cultures that lived in the dry forests. The fi rst Spanish chroniclers report that the natives ground it into fl ower used to make a kind of bread.
Today, the rural populations continue to gather the algar-roba fruit to eat and to feed their animals. However, a large part of the crop is earmarked for marketing, generating reve-nue for the precarious family economy.
The herbaceous pastures currently feed the low-productiv-ity livestock that the rural families raise extensively, the herds usually being made up of sheep and goats.
The dry forest covers 24% of the Peruvian coastline; and guaranteeing its survival by ensuring it produces sustainably will have a considerable economic, social and ecological im-pact, considering that 69% of the coastal region is occupied by unproductive deserts, crossed by narrow valleys, making up 7% of its surface.
1.2 The rural families of the “Ignacio Távara” community
This project was carried out with the rural families of the hamlets of Santiaguero, San José, Santa Rosa, Sausal, Casaraná, Ñómala and La Rita of the José Ignacio Távara Pasapera Rural Community. This is not a traditional rural community but was started by some 800 families of small cattle-breeders and farmers, settled on the less-productive lands of the former farms of Malinguitas, Ñómala and part of Huápalas, who did not benefi t from the Agrarian Reform of 1968. These families joined forces to form the José Ignacio Távara Pasapera Rural Community, which obtained offi cial recognition from the Ministry of Agriculture in 1986.
This rural community is closely linked to the history of AIDER, since one of the fi rst 2 projects executed by AIDER was developed in this rural community in 1992, thanks to the efforts of its President at the time, Mr. Francisco Bayona. The friendly welcome extended and the commitment of the popu-lation at work, led to continued support and technical assis-tance provided by AIDER through the years.
1.3 Historical background
In the eighteenth century, agricultural activity is focused on “haciendas” (large estates). In Piura, haciendas controlled al-most all of the depopulated large areas adjacent to agricul-tural lands and forests of carob around cultivated fi elds or in the basins of the rivers.
These environmental conditions, of Piura, helped develop a new set of relationships between landowners and laborers. The landowner offered to their farmers an access to grazing
in the depopulated areas (lands without population) and in the forests of carob on his property. Its obvious motivation was to reduce the pressure of the laborers by large areas of fertile land or higher wages, providing to them a supplementary economic activity. Note that the depopulated areas played a minimal role in the income of the haciendas.
At that time, breeders of goats that used the resources of the hacienda were required to pay rent in proportion to herd size. For example, in the Pabur hacienda, breeders of goats living on the grounds of the estate paid 8% of annual produc-tion of their herds, for rental of pasture. They were also re-quired to collect 575 kg of carob pods to the stables of the hacienda.
This arrangement between landowners and farm laborers is the precursor of the mixed system of subsistence farming and breeding goats, is now so common in Piura.
In the mid-nineteenth century, dramatic changes occurred in Piura. The growing international demand for cotton caused many landowners Peruvian redirect their agribusiness, and they replaced their crops of local and regional consumption for commercial and export crops.
In the early twentieth century, 70% of cultivated land of Piura was cotton fi elds. This condition stimulated technologi-cal development. The impact meant a signifi cant increase in the production and pressure to increase the amount of farmland.
Suddenly the land of large farms became a limiting factor for economic growth and the contracts that had previously been so advantageous to the landlords, became an obstacle for further development, and the arable land given to the peasants was worked in small individual batches and less productive. These were the times of confl ict between the ha-ciendas and yanaconas1: the hacienda trying to “get their land” and the yanaconas trying to hold on to their only source of livelihood.
But the cotton plantations had a crucial problem: the tem-porary labor. The task force was constituted of a small core group of skilled workers and a large group of unskilled work-ers hired for short periods, mainly for pest control of cam-paign and the collection of cotton seasons. For the landowner it was a big problem fi nding workers to work only two or three months a year and for low pay.
The peculiar ecological conditions of Piura2 and the exis-tence of an independent pastoral sector helped create a new arrangement between farmers and goat herders. The essence of this arrangement was that the goatherds temporarily work in the cotton plantations in return for access to the stubble fi elds after the harvest.
The mutual benefi t of this arrangement was obvious. Breeders ensured the access of their herds to the cotton stub-ble, which was vital in the dry season and could earn an ad-ditional salary. The farmer, meanwhile, assured labor nearby, who preferred temporary employment without increasing de-mands for high wages, because the livestock was their source
1 Yanacona is a word that in the Inca language, means “servant.”2 The climate in Piura is characterized by average temperatures of 25
degrees Celsius (in summer reaches 37 degrees Celsius) and one or two years with summer rains (consequence of El Niño phenomena), fol-lowed by 2 or 3 years of drought.
78 FACTS Reports

How to restore dry forest ecosystems
3www.factsreports.org
of income.Given the success of this arrangement, free and exclusive
access to agricultural stubble was also extended to farmers living in villages near the hacienda. However, the shepherds living in the property of the hacienda continued to pay an an-nual rent, even if they had migrated and worked in the cotton fi elds.
This was the situation up to 1968. In October of that year, the Military Board that ruled the country, enacted the Agrarian Reform Law. This law expropriated land from landowners and delivered it to the rural workers. In this way it changed the structure of the land, and the haciendas disappeared.
Uncultivated land became the property of the Peruvian State, among them, less productive lands of: Malinguitas, Nomala and Huapalas, whichis where now stands the Rural Community Jose Ignacio Távara Pasapera.
In 1984, eight hundred families of small farmers and peas-ants who had settled there since the beginning of the century and who were not benefi ciaries of the Agrarian Reform of 1968, organized and formed the Rural Community Jose Ignacio Tavara Pasapera3. It was offi cially recognized by the Ministry of Agriculture by Executive Resolution No. 0137-86-AG-II-Piura, dated February 27, 1986, allocating 52,269 hectares of uncultivated land.
2 METHODS
2.1 Localization and limits
The area is located in the districts of Chulucanas (Morropón Province) and Tambogrande (Piura Province), with the fol-lowing geographical limits:
To the North: land owned by various farmers on the left bank of the Piura river.
To the South: land of the San Juan de Catacaos Rural Community.
To the East: land of the former farms Huápalas, Vicús and Km 50, projected in a straight line due South, to the limits of the San Juan de Catacaos Community.
To the West: land of the Cruz de Caña de Castilla and Apóstol San Juan Bautista de Locuto Rural Communities.
The communal land covers 52,269.13 hectares in total, and is recorded in the Piura public register.
2.2 Demographic aspects
It has an estimated population of 9,772 inhabitants, distrib-uted in 16 annexes. The population is predominantly young, since 44.7% are age 15 years or less and 73.4% are age 30 years or less. Overall, the male population is higher than the female population.
3 Jose Ignacio Távara Pasapera, was a teacher, a native of Frias town, in Morropón Province, Piura department. He was elected Provincial mayor for two consecutive terms (1981-1983 and 1984-1986), in which he made clear his concern about rural poverty in the province of Morropón. He died in 1985 without completing his second term. The rural community adopted his name, in gratitude for the strong support and selfl ess efforts provided to the peasant organization to achieve recognition.
Table 1. Population estimates for the José Ignacio Távara Rural Community
Annexes Male Female TotalNumber
of families
San Martín 220 204 424 113
Santa Rosa 130 141 271 83
San José 332 336 668 195
Km 44 77 72 149 35
Km 48 151 155 306 92
Km 50 400 463 863 156
Km 2 132 141 273 59
Sausal 562 485 1,047 201
Ñómala 457 420 877 190
Rinconada 334 300 634 143Nueva Esperanza 113 86 199 42
La Rita 1,313 1,131 2,444 670
Callejones 445 385 830 209
Chuicas 171 142 313 83
Casaraná 94 114 208 58
Dios nos mire 156 110 266 67
Total 5,087 4,685 9,772 2,397
SOURCE: Pre-feasibility study for the project “Reforestation, sustainable production and carbon sequestration in the dry forests of José Ignacio Távara, Piura, Peru”. AIDER, 2008.
2.3 Organization
The maximum authority is the GENERAL ASSEMBLY OF DELEGATES, the communal organization being assigned to a Community Council, with the following associated secre-tariats: Training, Natural Resources, Social Welfare, and Machinery. The Community Council is assisted by a Treasurer and a Secretary, a Community Coordinating Committee and a Technical Consultancy.
At the same time, each Annex has a Local Development Committee and the Delegates elected every two years to rep-resent it before the General Assembly of the Community. The General Assembly meets every month.
2.4 An alternative to existing problems
Working together, the population and AIDER professionals determined the need to work on 3 fronts:
a) Forest management, to recover it, preserve it and obtain sustainable production from it, because the forest is the
79www.factsreports.org

How to restore dry forest ecosystems
4 Field Actions Science Reports
setting where they live and carry out their economic ac-tivities, that provides food for the cattle and various products used by the peasants. During the project it was observed that recovery of the forest could generate ad-ditional revenue through carbon sequestration, and thus activities were integrated for this purpose.
b) Improving the cattle (sheep and goats), because these activities provide meat for food and revenue to pay for their basic necessities.
c) Introducing new farming techniques for year-round pro-duction, of vegetables mainly, because malnutrition is generalized, affecting children in particular.
2.5 Forest and grasslands management
Forestry inventories were carried out which guided the Forest and Grasslands Management Plan to recover the forest of the José Ignacio Távara Pasapera Rural Community, which through felling and poor use of pastures is degraded, as shown by its very low tree density (23 trees/ha) and poor tree coverage (5%).
However, considering there is a need to obtain wood for burning and construction, the plan contemplates the con-trolled extraction of wood from pruning, thinning and selec-tive logging, in areas where the density and coverage allow it.
In addition, the Plan considers planning and optimizing use of the associated grasslands (grass and fodder plants), with the aim of providing food for cattle, ensuring the adequate provision of seeds for the grasslands to regenerate annually.
The following activities are considered: Land planning, Tree Replacement, Forestry Treatments, Grasslands Management and Algarroba fruit harvesting.
2.5.1 Land planning
Four management units were set up: Control areas: they represent the forest’s natural state. They
are left unmanaged and serve as controls to compare the ben-efi ts and impact of the project’s proposed forest management.
Areas of forest management for productive ends: dedicated to forest production. The forestry activities of tree replace-ment, pruning, thinning and selective logging are applied in these areas, as well as Algarroba fruit harvesting and gather-ing of grass for hay-making.
Regeneration areas: areas where tree replacement is being carried out since their low tree density and coverage allow no productive activity. They are protected by fences to keep cat-tle out until natural regeneration or the planted seedlings take root. The grass in these areas is cut for hay-making and storage.
Grazing or corral areas: Intended for rotation grazing of the cattle, with controlled numbers being allowed in, according to the load the area can carry, to avoid overgrazing and ensure adequate seed production for the following season.
2.5.2 Forestry treatments
Shape pruning was applied in the production areas, grazing fi elds and regeneration areas. This pruning was intended to
obtain an ample and well-developed tree crown to promote the production of the algarroba fruit.
Pruning for clearing was carried out in grazing and regen-eration areas, with a view to eliminating dead or diseased branches or those with mechanical damage, liable to be at-tacked by fungi and insects.
In areas with high rates of natural regeneration, selective logging was performed to promote the establishment of the most vigorous species and those with desirable productive characteristics (straight stems for wood production and abun-dant branches for fruit production).
2.5.3 Tree replacement
Initially the project stressed Natural Regeneration Management, so it was protected using rustic fences formed by branches piled up to a height of 1.20 meters surrounding each sapling or group of young saplings.
Although remarkable success has been achieved in protect-ing natural regeneration in the managed area, it is important to note that natural regeneration following the rains is not always abundant and its distribution is very irregular; these factors combined make it unfeasible that the forest will be properly renewed relying only on natural regeneration, and reforesta-tion is obviously required to achieve densities suitable for sus-tainable wood production.
In 2005 a reforestation method through direct planting was tried, using a small-scale drip irrigation system, reusing plas-tic soda bottles. This system has produced very good results and is the reforestation methodology AIDER proposes for the Reforestation, sustainable production and carbon sequestra-tion project for the dry forests of José Ignacio Távara, Piura, Peru, which was approved and registered in 2009 with the Comité Ejecutivo del Mecanismo de Desarrollo Limpio.
This project’s PDD states that, considering 20-year growth periods, each reforested hectare sequesters 108 metric tons of CO2 equivalent. If 30% of the community were reforested (approximately 15,600 hectares), the average annual income from the sale of carbon certifi cates could amount to US$ 84,645, generating 2,038 permanent jobs for the inhabitants.
2.5.4 Harvesting burning wood
Originally the intention was to extract a volume of wood equivalent to the annual volumetric growth of the tree spe-cies, calculated based on the tree stem, which on average is approximately 0.5 cubic meters per hectare. However, as the project unfolded 0.7 cubic meters/ha of wood were obtained by pruning the algarroba, sapote and overo trees, leaving in the forest the 0.5 cubic meters initially scheduled, because the tree stem’s wood was not touched and this volume of wood can be extracted without affecting the ecosystem.
2.5.5 Harvesting and selection of algarroba fruit
The algarroba tree’s fl owering and fructifi cation are not con-stant over time, and depend on many factors such as the amount of rainfall, when it happens.
Over a period of two years during our project, in the fi rst
80 FACTS Reports

How to restore dry forest ecosystems
5www.factsreports.org
year production was not signifi cant due to unseasonable rain-fall, and in the second year, the average amount of algarroba fruit collected was 33.5 kg/ha, equivalent to approximately 0.73 cwt/ha, which is considerable given the low tree density.
2.5.6 Hay-making and storage of grass
The grass for hay-making and storage was cut in the forest regeneration areas and production areas. The opening and maintenance of fi rebreaks was a further source of grass for hay-making. In all, 1.49 metric tons/ha of grass were collected.
2.5.7 Marking out grazing fi elds
Grazing fi elds are squares 500 meters along, i.e. they cover 25 hectares. On average, 405 animals can feed on a fi eld dur-ing three months.
2.5.8 Cattle management
The husbandry activity had poor results as regards production and reproduction, mainly due to the low genetic quality of the native cattle. In addition, there were high rates of mortality, consanguinity, inadequate facilities and defi cient health con-trols, making the activity barely profi table. The activity had a negative impact on the ecosystem through overgrazing which contributed to desertifi cation.
Faced with this situation, the Cattle Management Plan set two targets:
• to improve the genetic quality of native cattle until a pure breed is obtained through crossing.
• to improve on traditional cattle-raising methods, switching extensive to semi-confi ned farming and rais-ing the health conditions by setting up veterinary medi-cal supplies and health calendars.
As a result of the application of the cattle management plan, from 49 pure-bred ewes, 26 pure-bred rams and 624 native ewes, 1440 half-bred and 93 pure-bred progeny were obtained in just two years.
2.5.9 Genetic improvement of native sheep
In 1993, AIDER introduced 4 sheep of the breed “AssBlack” (cross of Assaf and Black Belly breeds). The results were not as good as expected because the animals did not adapt to the local weather and breeding conditions. After that the improv-ing breed selected was the Black Belly hair sheep, character-ized by its high precocity, rusticity, prolifi cacy, polyestrous nature, and low food conversion rate.
Modules were formed with the animals introduced. The modules were basically made up of one ram and one ewe of reproductive age, and they were assigned as revolving assets.
Each benefi ciary managed two production lines:
• Commercial line, comprising all rams obtained from
the cross.
• Breeding line (pure-breed) obtained by mating the rams with the pure-bred Black Belly ewes.
Due to the existing animal husbandry conditions, grading up or back-breeding was considered the most appropriate breeding system. In this way, after the fourth or fi fth genera-tion the Black Belly improving breed would replace a high percentage of the native breed. Animals thus obtained are considered “pure through cross-breeding” and their genotype and phenotype are similar to those of the improving breed.
The following proportion of sexes was used: 1 ram for ev-ery 25 ewes; confi ned mating was considered the best choice for the local type of husbandry, as well as guaranteeing the success of the genetic improvement program.
This type of mating confers the following advantages:
• Dams to be served can be selected
• Serving can be controlled
• Lambing can be scheduled
• Progenitors can be easily identifi ed
• Breeding ram use is more rational
• Allows adequate traceability
3 RESULTS
The results obtained are shown below:
Table 2. Results obtained for Genetic Improvement with Black Belly Sheep
Parameter Native sheep Improved sheep1st generation
Improved sheep 2nd generation
Age at puberty
10 to 12 months 9 months 8.5 months
Number births/year 1 1.7 1.6
Number lambs/birth 1 2.1 1.9
Birth weight 1.25 kg 1.95 1.95
Weight at 90 days 9.5 kg 10.9 kg
(60 days)10.9 kg
(60 days)
Weight at 6 months 22.5 kg rams: 33.5 kg
ewes: 28.4 kgrams: 32.2 kgewes: 27.6 kg
Food conversion 8.0 4.4 4.7
SOURCE: Demonstrative Pilot Units for the development of rural populations of the dry forest, AIDER 2004.
81www.factsreports.org

How to restore dry forest ecosystems
6 Field Actions Science Reports
3.1 Improved husbandry
3.1.1 Newborn lamb care
• Observing normal breathing at birth, disinfecting navel stumps, supervising colostrum nursing and sheltered penning.
• Castration of cross-bred rams at 15 to 30 days of birth. The project promoted the use of knife or open wound castration, a tool available to the farmers.
• Identifi cation to facilitate production records and line of descent.
• Weaning at 13 months, possibly delayed one or two months in times of poor food availability.
3.1.2 Lamb fostering
Applied in the following situations:
• The ewe died giving birth
• The ewe rejected the lamb
• The ewe had insuffi cient milk
• The ewe had more than two lambs
3.1.3 Care of young animals
• Trimming hooves, every 3 months, because they are painful and cause limping if too long, affecting the search for food. In rams it may cause pain during mating.
• Determination of puberty:
• The rams were separated in a special facility because they are more precocious than ewes. They are kept there until 10 months and 35 to 40 kg of body weight. For the ewes, the fi rst estrus was observed, avoiding mating because it is best to mate them from the second cycle and at a minimum weight of 30 kg.
3.1.4 Care of adult ewes
• Mating period: the ewes were given extra feeding (usu-ally algarroba pods) with to promote release of more eggs and achieve multiple births.
• Gestation: lasts 5 months; in the last third, fetuses do 70% of their growing, so in this period ewes were given special feed (algarroba fruit) to ensure the lambs achieve a reasonable birth weight and reduce the risk of mortality at birth.
• Lambing: must take place in a special enclosure (lamb-ing jug) with extreme hygiene to reduce the risk of in-fection in ewes and lambs. This practice was adopted by the cattle breeders because it drastically reduces ewe and lamb mortality during lambing.
3.1.5 Care of breeding rams
• Breeding rams were housed in individual stables. This practice is still not completely accepted, but those ap-plying it achieve better mating control and avoid wounds and lesions resulting from fi ghts when there is more than one breeding ram.
• Mating period: additional feed was provided to coun-terbalance the physical toil and to obtain fruitful cover.
• The appropriate ratio of ewes to breeding rams was pre-served and a record of covers kept.
• Breeding rams were checked periodically for early de-tection of infections and to avoid infecting the ewes.
3.1.6 Animal husbandry
The extensive cattle farming traditionally used by the com-munity caused overgrazing, so it was recommended to pro-gressively replace it by semi-confi ned breeding.
With this system, the cattle is led to the fi elds in the morn-ing and returned to the corrals at noon, remaining corralled until the next morning. The hay and algarroba pods obtained under the Forest and Grasslands Management Plan made this change viable by providing food for the animals while they are in the corrals.
3.1.7 Feeding
The adequate use of existing pastures was rationalized and optimized. The Forest and Grasslands Management Plan de-signed 25-hectare grazing fi elds or enclosures that can sup-port 405 sheep for 3 months. Once the pasture in a grazing sector is depleted the animals are led to another, thus avoid-ing overgrazing.
Hay was stocked for periods of grass shortage, to cover the food requirements until the next rainy period.
3.1.8 Animal health
There are many possible health problems but many can be avoided through adequate hygiene.
Veterinary medical supply kits were set up with the main medicines and vaccines to ensure proper cattle health. On av-erage each supply kit served 12 families.
In addition, a health calendar was determined, as follows:
82 FACTS Reports

How to restore dry forest ecosystems
7www.factsreports.org
3.1.9 Facilities
The switch to semi-confi ned cattle farming can be done using existing facilities, with recommendations to improve hedges and arrange some sectors.
For the construction of new corrals non-fl ooding high ground should be chosen, avoiding wind and damp, on easi-ly-draining dry land. To determine the dimensions, it is con-sidered that each adult animal requires 2.5 m2. Ewing jugs must cover 10% of the total corral area.
3.1.10 Culling
• Cross-bred rams intended for market were castrated within the fi rst month of life and culled after weaning as this is when the meat achieves the best price.
• The ewes not retained for breeding were culled.
• Adult animals with breeding problems were also culled.
3.1.11 Family orchards
Traditionally farming activities are carried out on temporary plots, making use of the rainfall, and producing zarandaja (Dolichos bean), common bean, cajan pea, maize and water-melon. They do not plant any vegetables.
Initially hydroponics was considered as an alternative to grow vegetables in all seasons. The El aim of this activity was not to generate income but rather to counter the vitamin defi -ciencies of the family diet.
Although hydroponics culture was successful, it was ob-served that it would be diffi cult for them to continue with this activity once the funding was gone because the centers sell-ing the necessary supplies are distant. For this reason, the proposal was changed to incorporate supplies available in the forest, switching to family orchards using organic supplies.
The species most planted initially were tomato, carrot, beet, cilantro, onion, lettuce and radish, but depending on the results a selection was made of those with the shortest grow-ing season and most resistant to pests and disease, as well as the local ambient conditions.
4 DISCUSSION
4.1 Specifi c implications of the project
A feature of interest of the proposal for sustainable harvesting of the dry forest, based on a cattle and forest management plan, is that due to the slow returns from forest management, it appears that the main result of the various activities carried out is the farming of a greater number of heads of cattle.
Although this perception does not do justice to the impor-tance of forest management itself and the total benefi ts its generates, it is useful to reinforce the idea of cattle production closely linked to the forest’s condition, because the farmers can see their fl ocks grow and the activities in the forest pro-vide ever more and better products from it, including hay to cover the needs of the growing fl ocks.
This is why, supported by intense social promotion, the ru-ral communities very quickly saw forest management as a necessary activity, but more importantly, this conviction was based on an issue that is highly sensitive for them, since cattle breeding is a sure source of food and revenue to meet their basic requirements, and anything promoting this activity will be well-received by the rural families.
The cattle breeding component of the proposal provides higher revenue than that obtained traditionally, meat produc-tion from sheep and pigs provides the rural families with pe-riodic income to cover their basic requirements and the im-provements achieved in sheep breeding ensure better income than traditional breeding, with the added benefi t of not dam-aging the forest and grasslands. In addition, some farmers sell pure-bred breeding rams, a further source of income.
This is happening while the forest reaches the time of har-vesting, at the end of the season: the time when the main con-tribution from the forestry activity will be obtained and from which point crops will be harvested annually. A fi rst estimate obtained by projecting the increments observed on growing plots, shows that at the end of year 38 there will be sustained crops of at least 23.5 cubic meters of wood, which, added to the volume obtained through thinning, gives a total commer-cial wood yield of 64.75 cubic meters per hectare of managed forest (Palomares et al, 2004).
However, there is a non-wood forest product which can be obtained from the very start: the algarroba pods, the current production of which is 33.58 kg/ha and which will rise as tree density and coverage increase (AIDER, 2000).
To this we must add the acquisition of revenue through car-bon sequestration, estimated on average to be USD 27/ha per
Table 3. Health Calendar (by month)
J F M A M J J A S O N D
CD-T toxoid vaccination X
Enterotoxemia vaccination X X
Internal and external deworming X X
Vitamin doses X X
83www.factsreports.org

How to restore dry forest ecosystems
8 Field Actions Science Reports
annum (AIDER, 2009). On a social plane, it is also important to mention that the ac-
tivities proposed for the project help generate permanent jobs in the cattle and forestry activity.
As regards the family orchards, we are certain that what moti-vated the rural families to adopt this activity into their home eco-nomics was the indisputable proof that it is possible to produce vegetables without depending on rainfall, even in such severe conditions as those of the dry season.
Another aspect to be noted is the possibility of giving new use to buckets, pots, boxes, old suitcases, and in general any con-tainer capable of holding some soil for vegetable production.
Despite the fact that the best part of the vegetable production was intended for home consumption, it should also be stressed that this activity has allowed the families to save:
• less money spent on vegetables, which can be used to meet other needs
• to get vegetables the families need no longer travel to the cities of Piura, Chulucanas and Tambogrande, sav-ing travel time and money
• less money spent on medicines to fi ght defi ciency dis-eases and their sequels, in particular on children.
5 Conclusions
• Dry forests can be devoted to production and their sur-vival ensured to their full potential if they are exploited under a Forest Management Plan.
• For adequate tree replacement, natural regeneration management must be supplemented by management of regrowth, plantation, seed dispersion and/or direct sow-ing, with irrigation.
• The wood obtained as a subproduct of the forestry ac-tivities was used by the families as building material and burning wood for home consumption.
• The main impact observed at this time is the genetic improvement of cattle; a random tour of the community will show a large proportion of cross-bred animals (na-tive with Black Belly).
• Genetic improvement shows positive results as regards number of young per births, number of births per year, precocity, lower food conversion and greater weight gain at 6 months of age.
• The family orchards, independent from rainfall, have played an important part in promoting the growing and consumption of vegetables.
• The vegetables grown in the family orchards have im-proved the nutritional diet of benefi ciary families.
• No industrial pesticides are used in the family orchards, so production causes no contamination.
• The family orchards allow the recycling of bottles and containers, placed near the home, and requiring no fell-ing of trees.
6 Acknowledgements
• AIDER professionals and technicians who conducted this project,
• the rural families of Santiaguero, San José, Sausal, Casaraná, Ñómala and La Rita, in the José Ignacio Távara Pasapera Rural Community, without whose help this project would not have been possible.
7 References
AIDER, 1995. Seco Bosque. Problemas y Alternativas de Manejo de los Bosques Secos del Noroeste Peruano. Medio Ambiente, Revista Peruana de Ecología y Desarrollo. Edición 64, Abril –Mayo.
AIDER, 2000. Recuperación y Producción Sostenida de Bosques y Praderas, un medio de Lucha contra la desertifi cación y la po-breza. Sistematización de un Proyecto Demostrativo Ambiental. Lima.
AIDER, 2001. Recuperación y Producción Sostenida de Bosques y Praderas, un medio de Lucha contra la desertifi cación y la po-breza. Programa APGEP – SENREM, Convenio USAID – CONAM.
AIDER, 2009. “Reforestation, sustainable production and carbon sequestration project in José Ignacio Távara´s dry forest, Piura, Peru” Project Design Document For reforestation and afforesta-tion project activity. CDM-ARR-PDD. Date of the document: 18th June 2009, Version 4
Asencio, F., 1997. La producción de algarroba de los bosques secos. Economía y medio ambiente en la Región Grau. Centro de Estudios Regionales Andinos “Bartolomé de Las Casas” y Central Peruana de Servicios – CEPESER.
Cieza de Leon, P., 1973. La Crónica del Perú. Ediciones PEISA. Colección Biblioteca Peruana. Lima, Perú.
FAO/PNUMA, 1996. Principios de Manejo de Praderas Naturales. Serie: Zonas Áridas y Semiáridas Nº 6. Ofi cina Regional de la FAO para América Latina y el Caribe. Santiago de Chile
Ferreyra, R., 1987. Estudio Sistemático de los algarrobos de la costa norte del Perú. Ministerio de Agricultura, Instituto Nacional Forestal y de Fauna. Dirección de Investigación Forestal y de Fauna. CONCYTEC. Lima, Perú.
INRENA, 1998. Mapa de los Bosques Secos de Piura. Ministerio de Agricultura. Lima, Perú.
Merino, V., 1999. Contribución de la Silvoganadería a la recuper-ación ecológica de los Bosques Naturales de Algarrobo. Documentos del I Congreso Forestal Latinoamericano. Tomos I y III, Colegio de Ingenieros del Perú, consejo departamental de Lima. Capitulo de Ingeniería Forestal. Lima.
Merino, V., 2003. Proyecto “Fondo Rotatorio Comunal: Una Contribución al Desarrollo Económico de las Familias Campesinas de los Bosques Secos”. Documento de Sistematización. Piura, Diciembre.
Palomares, M., 1994 Manejo del Bosque seco y Desertifi cación. Revista Regional Bosques y Desarrollo Nº 12.
Palomares, M., 1994 Una experiencia de desarrollo rural contra la desertifi cación. Revista Regional Bosques y Desarrollo Nº 12.
Palomares, M., 1995. Estimación del crecimiento volumétrico en Bosques Naturales de Algarrobo. En: V Congreso Nacional Forestal. Exposiciones y Resúmenes. Colegio de Ingenieros del Perú, Consejo Departamental de Lima, Capítulo de Ingeniería Forestal, Noviembre.
84 FACTS Reports

How to restore dry forest ecosystems
9www.factsreports.org
Palomares, M., 1996. La deforestación encubierta. Artículo peri-odístico, publicado en la Revista Suceso, del diario Correo, Piura 10 de Noviembre.
Palomares, M., 1996. Manejo del bosque seco del noroeste del Perú. En: Tablero, Revista del Convenio Andrés Bello. Septiembre, Año 20 Nº 53.
Palomares, M., 1998. Desertifi cación o Desarrollo Sostenido: Opciones para hoy y el Nuevo Milenio. Boletín de la RAP. Red Ambiental Peruana, Nº 8, Octubre.
Palomares, M., 1998. Manejo del bosque seco del noroeste del Perú. En: El Desarrollo Sostenible para Sectores Marginales. Experiencia y Modelos. ITACAB. Convenio Andrés Bello, Lima, Perú, 1998.
Palomares, M, et al 2004. Unidades Piloto Demostrativas para el Desarrollo económico de las poblaciones campesinas del Bosque Seco. Documento de Sistematización. Fundación Interamericana. Piura, Perú.
Palomares, M., 2009. Cálculo del carbono secuestrado. Proyecto Reforestación y Secuestro de Carbono en los bosques secos de Ignacio Távara, Chulucanas – Piura.
PROYECTO ALGARROBO, 1993. Mapa e Inventario Forestal de los Bosques Secos de Lambayeque. Chiclayo.
Recavarren et al. 2009. Determinación de los límites del proyecto y estimación de la línea base de Carbono. Proyecto Reforestación y Secuestro de Carbono en los bosques secos de Ignacio Távara, Chulucanas – Piura.
85www.factsreports.org

Community strategy for mangrove forest conservation: Conquista Campesina Conservation Easement
Javier Rojas Garcias
Pronatura Mangrove Expert, [email protected]
Abstract. The drafting of a community plan for mangrove forest conservation in the communal land of Conquista Campesina (Tapachula, Chiapas, Mexico) is part of a more ambitious project aimed at establishing a protected wetlands corridor in the coastal region of the state of Chiapas. The purpose is to guarantee the conservation, protection and restoration of priority wetlands, placing special emphasis on vulnerable ecosystems.
With the technical support of Pronatura Sur A. C. and after signing a conservation agreement (conservation easement), the inhabitants of the communal land undertook to carry out activities for conserving and restoring 824 hectares of land for common use containing 616 hectares of mangroves and 208 hectares waterbodies between natural water channels (esteros) and grasslands.
Zoning of land use was executed through constant monitoring, pursuant to the physical and biological fea-tures of the area, and in agreement with the direct users of the system. In this respect, the proposed categories of action are: ecological rehabilitation areas; areas for the domestic exploitation of mangroves; conservation areas and areas with a potential for exploitation.
On a whole, agreement was reached with respect to these categories with the inhabitants of the Conquista Campesina communal land, in keeping with their interests and needs. The phases of activity identifi ed are: a) use of organic matter, b) use of parts and derivatives and c) rehabilitation of water courses.
Keywords. Mangrove, conservation, community plan, Mexico
1. Introduction.
This study is part of a more ambitious initiative for establish-ing a protected wetlands corridor in the coastal region of the state of Chiapas, promoted by Pronatura A. C. The ultimate objective of this project is to guarantee the protection and restoration of priority wetlands of the entity through alterna-tive legal conservation mechanisms. In particular, the project focuses on vulnerable ecosystems, due to the absence or inef-fi ciency of offi cial strategies to protect them.
Within this context, the Conquista Campesina communal land is located on the Coastal Plain of Chiapas, in the town-ship of Tapachula. It forms part of the Pozuelos-Murillo la-goons system and is also inside the Gancho Murillo Nature Conservation Zone. Unfortunately, this state reserve has no action plan to guarantee the conservation of the ecosystem of reference in the long term. It contains large extensions of mangroves corresponding to the Rhizophora mangle (red mangrove), Avicennia germinans (black mangrove) and Laguncularia racemosa (white mangrove) species. Due to
their nature and extension, these mangrove forests serve as feeding, resting and reproduction areas for a wide range of animal species subject to certain protection categories.
Based on their awareness of the importance of their land, in 2006 the inhabitants of the communal land took the necessary steps to establish the fi rst Community Conservation Easement for protecting and restoring mangrove ecosystems. With the technical support of Pronatura Sur A. C. and after signing this agreement, the inhabitants of the communal land undertook to carry out activities for conserving and restoring 824 hect-ares of land for common use containing 616 hectares of man-groves and 208 hectares of waterbodies between natural ponds (esteros) and grasslands.
Based on a series of previous diagnoses, this common land has diverse problems, arising mainly from the effects of the natural water dynamics resulting from the silting of natural canals (due to sediment pulses from the mid and high parts of the Cahoacan River basin) and the stagnation of the water column as a result of the felling and accumulation of man-grove trees torn down by hurricanes and tropical storms. Both processes have given rise to serious problems
© Author(s) 2012. This work is distributed under the Creative Commons Attribution 3.0 License.http://factsreports.revues.org/2197Published 3 December 2012
86 FACTS Reports

Community strategy for mangrove forest conservation: Conquista Campesina Conservation Easement
2 Field Actions Science Reports
of hypersalinisation and pyritisation in water and soil across extensive areas of this communal land. The effects are quite evident in the death of many mangrove trees, leading to the loss of arboreal diversity (simplifi cation) and structural changes in individuals and populations. According to the monitoring data in the area, the ecosystem has a change rate of approximately 5% per year.
Faced with this scenario, and supported by Pronatura Sur A. C, the inhabitants of the Conquista Campesina communal land decided to set up a series of basic studies for generating a community intervention plan, based on the development of local capacities, the generation of information in situ and the execution of ecological restoration actions in the region.
2. General Objective
To conserve the mangrove ecosystem in the communal land of Conquista Campesina in Tapachula, Chiapas for the social and environmental benefi t of the region, through community planning and the organisation of activities for the ecological rehabilitation and improvement of the area.
3. Specifi c Objectives
To conserve the communal forest areas in which the man-grove species Rhizophora mangle, Avicennia germinans and Laguncularia racemosa are distributed.
To execute actions aimed at ensuring the rehabilitation and improvement of the ecosystem (hydrological rehabilitation, reforestation, extraction of dead wood) in order to recover and increase the extension of the mangrove populations.To develop local technical and organisational capacities for controlling the ecosystems and their resources.
4. Social Participation
As part of the techniques and methods used to analyse com-plex systems, focus on social participation is an effective tool, not only in terms of local knowledge of the region which is extremely useful for understanding the logic of appropriat-ing the resources, but also because the process includes a defi nition of the mechanisms for generating responsibility and awareness among the population regarding environmen-tal protection and conservation and a defi nition of the skills and capacities for achieving that goal.
Within this context, with a view to obtaining fi eld informa-tion, diverse participative techniques were established (work-shops, meetings, etc.) for the purpose of getting the inhabit-ants of the Conquista Campesina communal land to participate in defi ning the work strategies, zoning of the land in keeping with its needs and the available knowledge about it, identify-ing weaknesses and the capacities needed to execute the work, and envisaging the future with respect to the usefulness and environmental services for the mangrove ecosystem.
In this way, the work was carried out in accordance with their traditional community self-help systems (tequios), all of which concluded with the setting up of a permanent brigade formed by a total of ten persons, who received intensive training on diverse topics related to the following aspects: a)
the effect of hurricanes on coastal ecosystems (mangroves, natural water channels, estuaries and coastal lagoons; b) en-vironmental vulnerability and risks; c) main factors deter-mining the structure and function of the mangrove ecosys-tems: hydrological dynamics, salinity and micro topography; d) biological sucesión and natural regeneration in mangrove forests, e) technical concepts for the selective clearing of seedlings; f) basic principles of ecological rehabilitation in mangrove forests: rehabilitation, improvement, reconstruc-tion and recovery; g) rehabilitation of water fl ows, their im-portance and working techniques: removal of silt, digging and consolidation of water channels; h) elements for planning a hydrological rehabilitation project: selection of the sites, diagnosis, design, execution, evaluation and monitoring ac-tivities; i) use of tools and equipment for removing the wood in natural water channels and; j) techniques for dispersing organic matter in mangrove forests: concept, criteria and in-dictors. That training programme had a length of 40 hours of study, divided into eight sessions of fi ve hours, during the course of one month.
Most of these subjects were imparted in theoretical and practical sessions organised in the same areas in which the sampling was done, for the purpose of allowing the brigada to become familiar with the botanical, hydrological and topo-graphical conditions of each site and identify potential limitations.
Figures 1a and 1b. Transects for mangrove linkages mapping
87www.factsreports.org

Community strategy for mangrove forest conservation: Conquista Campesina Conservation Easement
3www.factsreports.org
5. Characterisation of plant associations
The spatial layout of the vegetation and its structure makes it possible to identify the trends in the development of the veg-etation (succession, colonisation, etc.) and the main factors that determine it.
From the ecological standpoint, it is of vital importance to know those trends, since the success of the different phases of the handling activities depends on this: a) selection of the area; b) identifi cation of the most appropriate species to be handled c) individual density; d) appropriate season for the handling activities and; e) monitoring needs with respect to each site.
Within this context, technicians and locals executed inten-sive fi eld work campaigns in order to identify the structure and composition of the mangrove forest. To that end, samples were taken in the area from 14 transects, six of which were laid out transversally to the waterbodies, for the purpose of identifying the effects of the water and salinity in the vegeta-tion distribution. The eight remaining transects were perpen-dicular to the waterbodies, with the aim of corroborating the characterisation model and incorporating the topographical variable as a limiting factor with respect to botanical succes-sion (fi gures 1a and 1b).
As a result of the above, 198 GPS points were taken, ac-companied by 297 photographs. Each point is accompanied by an average of 1.5 photos and an expert description pro-vided by a mangrove forest specialist. The linkage mapping was executed after the fi rst run.
Figure 2. Linkage mapping of vegetation in the Conquista Campesina Community
That mapping was done via a Geographic Information System using the ESRI ArcGIS 9.0 programme. Two differ-ent images were used: a 2006 Digital Globe satellite image in colour available in Google Earth and a black and white digi-tal orthophoto from 1996 supplied by INEGI. Using the GPS points with their photos and descriptions, digital signatures were identifi ed for the vegetation in both images. This made it possible to extrapolate from the points for generating
polygons or segments representing the vegetation cover in Conquista Campesina.
The fi nal result of this process is the linkage mapping shown in Figure 2, for the Conquista Campesina Conservation Easement. This was digitalised on both images (orthophoto and Goble image) through the digital signature recognition arising from the analysis of the information obtained from the transects. In this way, 22 elements in the landscape of the communal area were identifi ed, of which fi ve are non-vegeta-tive geo shapes (water, town, elevated terrain, etc.) and 17 represent natural and induced vegetation groups (Table 1).
Table 1. Linkage mapping categories in the Conquista Campe-sina Community
Geo shapes Land Use
Township Acahual
Water channel Crops
Open clearing Inland vegetation
Waterbody White mangrove
Elevated terrain Open black mangrove
Black mangrove
Red mangrove
Mixed black and white mangrove forest
Mixed red and black mangrove forest
Mixed white and black mangrove forest
Mixed black and red mangrove forest
Mixed black mangrove and inland vegetation forest
Mixed black, red and white mangrove forest
Mixed red and white mangrove forest
Red and black mangrove forest mixed with inland vegetation elements
Mixed red, black and white mangrove forest
Mixed inland vegetation and mangrove forest
Following an analysis of all the information obtained, it is concluded that the mangrove forest on the communal land of Conquista Campesina is formed by three species: Rhizophora mangle (red mangrove); Avicennia germinans (salt-tolerant black mangrove) and Laguncularia racemosa (white mangrove).
The species with the best distribution (in terms of occupied surface area) is A. germinans which shows a colonising trend due to the salinisation processes in the soil and water cur-rently found in the community. In turn, the distribution of
88 FACTS Reports

Community strategy for mangrove forest conservation: Conquista Campesina Conservation Easement
4 Field Actions Science Reports
Rhizophora is affected by the system hydrological behaviour patterns, which determines its establishment only in areas near waterbodies. In the case of Laguncularia, its distribution and abundance is limited by the salinity and by the fl ooding seasons.
The mapped image is linked to a database with specifi c information for each segment. This database makes it possi-ble to produce fi ne-tuned analyses of the structure and com-position of the vegetation, in order to make comparisons and identify succession patterns, depending on the different phys-ical and geographical parameters of the region.
As can be seen in Table 1, in the specifi c case of the man-grove, 14 vegetation patterns were identifi ed, of which four represent segments containing only the species Rhizophora mangle (red mangrove); Avicennia germinans (black or salt-tolerance mangrove) and Laguncularia racemosa (white man-grove) and 10 patterns representing combined segments of two or more of these species and/or non-mangrove vegetation. In each case the number of segments and occupied surface area is shown in order of dominance in fi gures 3, 4 and 5.
Figures 3, 4 and 5. Distribution of Rhizophora mangle (red), Avicennia germinans (black) and Laguncularia recemosa (yellow)
Table 2. Vegetation in the Mangrove forest of the Conquista Campesina Community
Type Type of associated vegetation hectares
2 Black mangrove 168
1 Red mangrove 159
12 Open black mangrove 70
9 Mixed red and black mangrove forest 51
10 Mixed red, black and white mangrove forest 34
6 Mixed black and red mangrove forest 34
7 Mixed black and white mangrove forest 29
4 Mixed white and black mangrove forest 18
3 White mangrove 16
8 Mixed black and red mangrove and inland vegetation forest
14
11 Mixed inland vegetation and mangrove forest
14
7 Mixed black, red and white mangrove forest 9
At present, the entry of freshwater fl ows into the system and the silting of lagoons and channels have led to important changes in the structure and composition of the mangrove forests. If this trend continues, the “simplifi cation” of the ecosystem will be an increasingly more tangible process, characterised by the gradual dwindling of the Rhizophora and Laguncularia species and greater dominance of Avicennia segments. Nevertheless, the latter will undergo changes in the structure of its populations (decrease in tree height and diam-eter) in response to the high concentrations of salinity throughout the region.
Having determined the number of segments for each cate-gory identifi ed, the next step was to identify the surface areas occupied by type, in order to discriminate those with scarcely relevant extensions (less than three hectares). Of the 14 man-grove groups, 12 were fi nally selected. The surface areas of the eliminated ones were included in the most similar catego-ry (Table 2).
6. Determining the number and location of the sampling units
Based on the method, for each type of vegetation, at least three sampling areas or units were selected (30 X 10 m.) for obtaining information about the population composition and structure. For that purpose, the “XToolsPro” 4.1 extension of the ESRI ArcGIS 9.0 programme was used to superimpose a grid with cells of 30 metres (west-east) by 10 metres (north-south) on the communal area (Figure 6).
Then the grid was cut in accordance with the surface area identifi ed for each of the 12 categories. The “XToolsPro” 4.1 extension was used again to calculate the surface area of each cell remaining after executing the cut. Since only whole cells (30m x 10m = 300 m²) are suitable for the sampling units, those with surface areas of less than 300 m²
were ruled out.
After calculating the surface area, the cells below 300 m²
Fig. 3
Fig. 4
Fig.5
89www.factsreports.org
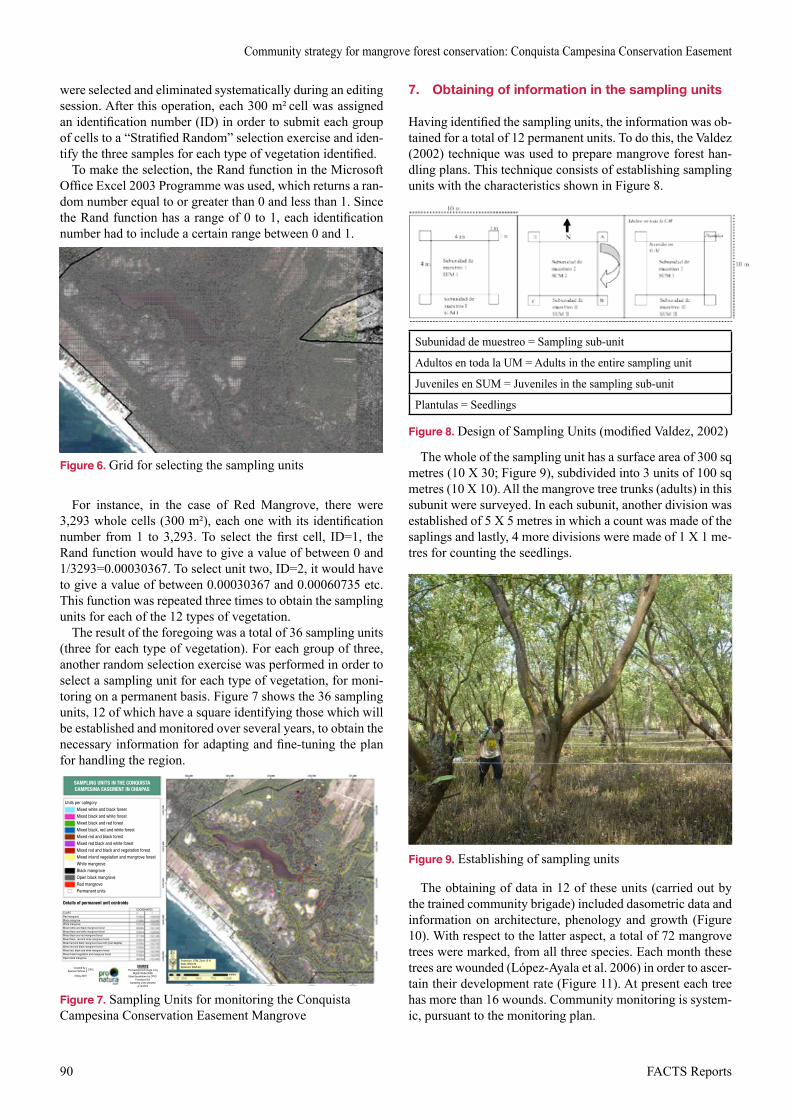
Community strategy for mangrove forest conservation: Conquista Campesina Conservation Easement
5www.factsreports.org
were selected and eliminated systematically during an editing session. After this operation, each 300 m²
cell was assigned
an identifi cation number (ID) in order to submit each group of cells to a “Stratifi ed Random” selection exercise and iden-tify the three samples for each type of vegetation identifi ed.
To make the selection, the Rand function in the Microsoft Offi ce Excel 2003 Programme was used, which returns a ran-dom number equal to or greater than 0 and less than 1. Since the Rand function has a range of 0 to 1, each identifi cation number had to include a certain range between 0 and 1.
Figure 6. Grid for selecting the sampling units
For instance, in the case of Red Mangrove, there were 3,293 whole cells (300 m²), each one with its identifi cation number from 1 to 3,293. To select the fi rst cell, ID=1, the Rand function would have to give a value of between 0 and 1/3293=0.00030367. To select unit two, ID=2, it would have to give a value of between 0.00030367 and 0.00060735 etc. This function was repeated three times to obtain the sampling units for each of the 12 types of vegetation.
The result of the foregoing was a total of 36 sampling units (three for each type of vegetation). For each group of three, another random selection exercise was performed in order to select a sampling unit for each type of vegetation, for moni-toring on a permanent basis. Figure 7 shows the 36 sampling units, 12 of which have a square identifying those which will be established and monitored over several years, to obtain the necessary information for adapting and fi ne-tuning the plan for handling the region.
Units per categoryMixed white and black forestMixed black and white forestMixed black and red forestMixed black, red and white forestMixed red and black forestMixed red black and white forestMixed red and black and vegetation forestMixed inland vegetation and mangrove forestWhite mangroveBlack mangroveOpen black mangroveRed mangrovePermanent units
SAMPLING UNITS IN THE CONQUISTA CAMPESINA EASEMENT IN CHIAPAS
CLASSRed mangroveBlack mangroveWhite mangroveMixed white and black mangrove forestMixed black and white mangrove forestMixed black and red mangrove forestMixed black, red and white mangrove forestMixed red and black mangrove forest with [rest illegible]Mixed red and black mangrove forestMixed red, black and white mangrove forestMixed inland vegetation and mangrove forestOpen black mangrove
Details of permanent unit centroidsCOORDINATES
SOURCEThe background image is by
Digital Globe 2006Stand breakdown by CPIC-
Pronatura SurSampling units selected
at random
Created by Spencer Schnier CPIC
Projection: UTM, Zone 15 NData: WGS 84Spheroid: WGS 84
meters3 May 2007
Figure 7. Sampling Units for monitoring the Conquista Campesina Conservation Easement Mangrove
7. Obtaining of information in the sampling units
Having identifi ed the sampling units, the information was ob-tained for a total of 12 permanent units. To do this, the Valdez (2002) technique was used to prepare mangrove forest han-dling plans. This technique consists of establishing sampling units with the characteristics shown in Figure 8.
Subunidad de muestreo = Sampling sub-unit
Adultos en toda la UM = Adults in the entire sampling unit
Juveniles en SUM = Juveniles in the sampling sub-unit
Plantulas = Seedlings
Figure 8. Design of Sampling Units (modifi ed Valdez, 2002)
The whole of the sampling unit has a surface area of 300 sq metres (10 X 30; Figure 9), subdivided into 3 units of 100 sq metres (10 X 10). All the mangrove tree trunks (adults) in this subunit were surveyed. In each subunit, another division was established of 5 X 5 metres in which a count was made of the saplings and lastly, 4 more divisions were made of 1 X 1 me-tres for counting the seedlings.
Figure 9. Establishing of sampling units
The obtaining of data in 12 of these units (carried out by the trained community brigade) included dasometric data and information on architecture, phenology and growth (Figure 10). With respect to the latter aspect, a total of 72 mangrove trees were marked, from all three species. Each month these trees are wounded (López-Ayala et al. 2006) in order to ascer-tain their development rate (Figure 11). At present each tree has more than 16 wounds. Community monitoring is system-ic, pursuant to the monitoring plan.
90 FACTS Reports

Community strategy for mangrove forest conservation: Conquista Campesina Conservation Easement
6 Field Actions Science Reports
Figure 10. Obtaining of data in the permanent sampling units
Figure 11. Marking the trees in order to verify their develop-ment rate
In each 30X30 metre plot, all the trees with a DPH of more than 7.8 cm were measured and marked. Only in the case of the Rhizophora mangle species was this measurement taken 30cm from the last root of the trunk. In the 5X5 plots, trees thinner than 7.8 cm but taller than 1.5 m were measured for R. mangle and trees higher than 1.3 m for L. racemosa and A. germinans. Lastly, in the 1X1 metre units, measurements were taken of all trees under 1.5 m but taller than 50 cm for R. mangle and trees taller than 30 cm for L. racemosa and A. germinans.
12 types of mangrove forest cover were obtained, charac-terised by the presence of a single species of the three exist-ing in the study area, and based on the combination of these in landscape dominance layouts. Likewise, the population structure variable for integrating open populations (in a natu-ral manner) occupied by the species A. germinans (Table 3) was included.
As can be seen, the Conquista Campesina Community mangrove occupies a surface area of 616 hectares. Of this area, the Black mangrove and Red mangrove species occupy more than 50% (52 hectares) of the total surface area. With respect to the red mangrove, this is explained by the “edge” effect and the development of this species, particularly on the banks of waterbodies and areas which are fl ooded for a peri-od of over six months. In the case of the black mangrove, the occupied surface area is closely related to the increase in in-terstitial salinity throughout the system and the greater toler-ance of this species to such conditions. Due to this hyper-salinisation in the soil and water, the surface area occupied by
L. racemosa (white mangrove) takes on greater signifi cance, since it represents only 2.60% of the total forest cover in the area (16 hectares). Generally speaking, it is seen that white mangrove is the species which has the least tolerance to pro-longed periods of fl ooding and increased salinity. Based on the number of hectares for each type of forest cover and the sampling surface area in plots of 300 m², the sampling inten-sity in all cases was no more than 1% of the total surface area for each type.
Table 3. Surface area and percentage for mangrove forest cover types
Type Attributes hectares %
2 Black mangrove 168 27.27
1 Red mangrove 159 25.81
12 Open black mangrove 70 11.36
9 Mixed red and black mangrove forest 51 8.28
10 Mixed black and red mangrove forest 34 5.52
6 Mixed red, black and white man-grove forest 34 5.52
7 Mixed black and white man-grove forest 29 4.71
4 Mixed white and black man-grove forest 18 2.92
3 White mangrove 16 2.60
8Red and black mangrove forest mixed with inland vegetation elements
14 2.27
11 Mixed inland vegetation and mangrove forest 14 2.27
7 Mixed black, red and white man-grove forest 9 1.46
TOTAL 616 100
Having obtained the results of the community monitoring, the information was submitted by the work brigada to the communal land assembly, in order to report the fi ndings and inform the assembly about the structure of its mangrove for-ests. In terms of characterisation by type of forest, the com-munity initiated the process of zoning the communal land, based on its potential and fragmentation level. To that end, the following types were identifi ed:
Type 1 Red mangrove: this type class includes segments formed entirely by the species R. mangle. In particular, this area contains the tallest trees (taller than 20 metres) with the greatest longevity in the region. Here, there are many speci-mens per surface unit, sometimes forming extensive barriers of trees that are practically impossible to penetrate. It is con-sidered an “edge” forest since it is located on the banks of waterbodies and/or areas with prolonged fl ooding periods. However, it is the area exposed to the greatest risk due to hur-ricanes and strong winds, due to its enormous exposure and the fact that the forests are established on non-consolidated soil (peat). The average salinity in these areas does not
91www.factsreports.org

Community strategy for mangrove forest conservation: Conquista Campesina Conservation Easement
7www.factsreports.org
exceed 40 parts per thousand throughout the whole year. Nonetheless, the area is fl ooded for long periods of time and so the species has specialised structures in its adventitious roots (lenticel hypertrophy). The tree structure has favourable characteristics (long, straight trunks).
Type 2 Black mangrove: this type includes segments con-sisting entirely of the species A. germinans. In all, these areas are covered with trees with a height of more than 15 metres with a BHD of more than 12.7 cm (40 cm in circumference). These areas form part of the “basin” mangrove with low hu-midity periods (less than 3 months). In terms of the lanscape, the cover is comprised of dense canopies with little natural regeneration, due to the concentration of pneumatophores, which makes it impossible for new trees to develop. In gen-eral, these areas have few individuals per surface unit. The tree architecture is characterised by being specimens with branches that start practically from the base. However, in these areas, the local population obtains wood from fallen trees or standing dead trees. The salinity in these areas is higher than 50 parts per thousand, and these conditions may increase during the dry season.
Type 3 Open black mangrove: this type of cover is a true refl ection of the local problem with regard to fragmentation of the mangrove forest, due to the increase in salinity in both water and soil. In general, they are located in shallow basins where the stagnant water evaporates during the dry season, leaving large areas covered with mineral salts. In such condi-tions, only this species is able to withstand saline conditions above 90 parts per thousand. However, that concentration af-fects the development of the trees, for which reason they grow no higher than eight metres. In extremely saline condi-tions, the tree will obviously die, leaving open spaces that are not usually occupied again by new tree species. This gives rise to the formation of small “clumps” of trees on slightly elevated ground (micro topography), where the effects of the soil hypersalinisation are not serious. The importance of these areas, from the standpoint of local exploitation, is that
large quantities of wood can be obtained from them for use as fuel (fi rewood) due to the high death rate of the trees. Based on the landscape transformation rate results, it can be af-fi rmed that these areas are undergoing a process of extension, due mainly to the entry of water (channels and ponds) throughout the system.
Types 4, 5, 6, 7, 8, 12 Mixed forests: these include the pres-ence of two or three mangrove species. In Table 4, the fi rst name assigned to the type determines the species dominance, which is usually over 70%. These types of cover represent transition areas in which the combination of pure segments generates a corridor of large trees (between 20 and 30 me-tres). The number of trees per surface unit is also high, and so these areas are normally exploited using traditional selective techniques. The fl ooding and saline conditions of each site determine the composition of these mixed forests and their dominance.
Type 9: White mangrove: this type consists of segments formed entirely by the species L. racemosa. These areas show high tree densities, usually of the same size. There is a pre-dominance of pre-adult trees with heights of no more than 15 metres. To a large extent, the presence of one size of tree may be due to the selective use of this tree during the juvenile stage, as their characteristics, with straight, think trunks, are highly appreciated for building the roofs of huts and dwell-ings. However, the scant surface area occupied by this spe-cies in pure segments is due to the fact that it has low toler-ance to long fl ooding periods and conditions of extreme salinity. If the current trends of the system in general are maintained, it is extremely likely that this species will even-tually cease to exist in the communal land. At present, this type has extended in high areas that are close to waterbodies.
Types 10 and 11: Mixed forests (inland vegetation): forests that include species other than mangrove. In general, these areas are close to farmlands and/or towns where there is a higher number of shrub and grass species that are typically
Table 4. Control mode and surface area
Type of cover hectares Control method
White mangrove 16 Conservation area
Red mangrove 159
Ecological improvement area
Black mangrove 168
Mixed white and black mangrove forest 18
Mixed black and white mangrove forest 29
Mixed black and red mangrove forest 34
Red and black mangrove forest mixed with inland vegetation elements 14
Mixed red and black mangrove forest 51
Mixed red, black and white mangrove forest 34
Mixed inland vegetation and mangrove forest 14
Open black mangrove 70Ecological rehabilitation area
Waterbodies 208
92 FACTS Reports

Community strategy for mangrove forest conservation: Conquista Campesina Conservation Easement
8 Field Actions Science Reports
found in middle and high zones of the rainforest. This cover is found on the edge of the system, where the trees are not very tall (less than 20 metres). However, their importance lies in their capacity to house and share mangrove fauna species with other inland ecosystems. From the forest standpoint, they do not represent a resource, since the areas have other species of timber-yielding trees apart from mangrove which are more frequently and more intensively used. Here, in gen-eral, the area has no prolonged fl ooding periods and salinity is usually extremely low or non-existent.
For the purpose of adequate conservation and rehabilita-tion of the communal land wetlands, the classifi cation was made pursuant to the physical and biological characteristics of the area, and in agreement with the direct users of the sys-tem. In this respect, the community zoning proposal included a total of 824 hectares, of which 616 hectares correspond to mangrove forests and 208 to waterbodies between water channels, ponds and grasslands.
Due to the fact that the distribution patterns of the different mangrove species are closely linked to the regional hydro-logical dynamics, it is of special interest for the Environmental Control Unit Project for the hydrological system to be con-sidered, in order to execute actions that will guarantee the stability of the ecosystem as a whole. Consequently, the con-trol categories established were as follows:
Conservation areas: areas used to conserve the habitat of the fl ora and fauna identifi ed as being threatened, rare, in danger of extinction or subject to special protection.
Ecological rehabilitation areas: these include areas where forest vegetation, soil productivity and natural hydrological dynamics have been signifi cantly altered, and which there-fore require actions aimed at their rehabilitation.
Table 5. Execution of control phases for the methods identifi ed
Method
Phase
Removal of dead wood (reduction of the pyritisation process)
Structural control of forest. (improving the forest resistance to strong winds)
Rehabilitation of water courses (reduction in water and soil salinisation)
Conservation No No Yes
Ecological improvement
Yes No No
Ecological rehabilitation
Yes Yes Yes
Areas requiring ecological correction with respect to man-groves: these are mangrove areas in which there are large quantities of dead wood, resulting from extreme weather con-ditions, accumulation of mineral salts (salinisation) and soil pyritisation. They also include “edge” forest zones where tropical storms and hurricanes have caused the total or partial felling of trees onto waterbodies, thus provoking the stagna-tion of the water column.
On a whole, agreement was reached with respect to these categories with the inhabitants of the Conquista Campesina
communal land, in keeping with their interests and needs. These are indicated in Table 4. The control phases identifi ed are: a) ecological improvement: removal of wood (parts and derivatives) and sediments; b) structural control of edge for-ests; and c) rehabilitation of water courses, which will be car-ried out in accordance with the pertinent phases set out in Table 5.
8. Conservation area
Objective of the area: to maintain the conditions for the ade-quate development of L. racemosa, a species currently con-sidered to be extremely vulnerable to changes in the environ-ment and to the control of its population.
Benefi t of the area: due to the characteristics of the popula-tions of this species (high density of trees with straight trunks) the area is a perfect nesting and resting site for a large variety of migratory and resident birds, many of which are included in some category of protection. Likewise, the populations of this species have been subjected to relative pressure, caused by the use of wood for construction purposes.
Characterisation: tree populations in good conditions of development, but extremely fragile to changes during the hy-droperiod and increased salinity. At present, they occupy a small part of the communal land and their populations are clearly declining.
Location: forest cover type 3 “pure white mangrove sur-face areas” with a total surface area of 16 hectares.
Activities to be carried out
• Improvement in the soil conditions through hydro-logical rehabilitation work and the erecting of bar-riers for protecting from high tides.
• Pest and disease control
• Establishing of a monitoring programme on the de-velopment of seedlings
• Establishing of a permanent vigilance programme to prevent illegal felling
• Distribution of propagules in areas with optimum conditions for their development
• Establishing of an experiment nursery for this spe-cies, for propagation purposes and as support for natural regeneration.
9. Ecological rehabilitation areas
Objective of the area: to restore the natural conditions of soil and water in order to recover areas altered by the silting of natural water channels and salinisation and pyritisation processes.
Benefi t of the area: the rehabilitation of this area will lead to a reduction in the mangrove forest transformation rate and halt the salinisation and pyritisation of water and soil. This will prevent the fragmentation of priority habitats for migratory birds and lo-cal fauna. On the other hand, water channels, ponds and grass-lands are used for fi shing and navigation, with fi shing being the main economic activity of the community.
93www.factsreports.org

Community strategy for mangrove forest conservation: Conquista Campesina Conservation Easement
9www.factsreports.org
Characterisation: at present, this area is occupied by black mangrove (A. germinans) in isolated groups, due to the high salt concentrations (greater than 90 parts per thousand). Due to this, the population structure is characterised by trees no more than 5 metres in height, with branches starting from the base and a poor chance of survival. In relation to the water-bodies, these are mostly silted with sediments and important masses of dead wood due to the effects of hurricanes and strong winds. Generally speaking, the rehabilitation of at least 20 kilometres of natural ponds and water channels is considered necessary.
Location: type of forest cover 12 (70 hectares) and type of waterbody (208 hectares).
Activities to be carried out:
• hydrological rehabilitation in 15 kilometres of nat-ural ponds and water channels
• rehabilitation and building of 5 kilometres of chan-nel “ditches” for storing water, in order to adapt the water fl ow in seasonally stagnant areas
• removal of dead wood to reduce soil pyritisation processes
• removal of dead wood from natural ponds and wa-ter channels
• removal of sediments from “ditches”
10. Ecological improvement area
Objective of the area: to improve and maintain the commu-nity forest areas affected by waterbodies which are adjacent to the federal zone. This will be done by reducing soil pyriti-sation processes caused by the accumulation of vegetation
Table 6. Schedule of activities for each control area and project phase
PHASE ACTIVITIES MONTHS
CONSERVATION AREA 1 2 3 4 5 6 7 8 9 10 11 12
A3, A2 Improvement of terrain conditions through hydrological rehabilita-tion work and raising protective edges against tides
A1 Pest and disease control
A1 Implementation of a programme for monitoring the development of seedlings
A1 Implementation of a programme of permanent vigilance to prevent illegal felling
A1 Dissemination of propagules in areas with optimum conditions for their development
A1 Implementation of an experimental nursery for this species for prop-agation purposes and in order to support natural regeneration
ECOLOGICAL REHABILITATION AREA
A3, A2 Hydrological rehabilitation of 15 kilometres of natural ponds and channels
A3, A2 Rehabilitation and construction of 5 kilometres of channel “ditches” for storing water for the purpose of allowing a correct water fl ow in seasonally stagnant areas
A1 Removal of dead wood in order to reduce soil pyritisation processes
A1 Removal of dead wood from natural ponds and channels
A2 Removal of sediment from natural ditches
ECOLOGICAL IMPROVEMENT AREA
A1 Removal of dead wood to allow for forest renovation in open areas following the effects of strong winds and hurricanes
A1 Controlling the population density and pruning of trees partly torn down by strong winds, storms and hurricanes
A1 Implementation of a vigilance programme to reduce illegal felling
A1 Pruning of adventitious roots which reduce the water refl ection in channels and ponds
A1 Rescue and transplanting of seedlings totally or partially covered by trees torn down by strong winds, hurricanes and storms
A1, A2 Pest and disease control
PHASES: A1 removal of dead wood; A2 removal of sediments; A3 rehabilitation of water courses
94 FACTS Reports

Community strategy for mangrove forest conservation: Conquista Campesina Conservation Easement
10 Field Actions Science Reports
(wood and derivatives).Benefi t of the area: zones with forest cover in good condi-
tions of development with more than one species at different stages of development. This zone is the main barrier against extreme weather events (hurricanes, cyclones and tropical storms). Likewise they are important habitats for a large vari-ety of water birds which shelter in the roots, thus improving the fi shing potential in the area.
Characterisation: areas of cover with more than one man-grove species of different sizes. It encompasses forest popu-lations of between 20 and 30 metres in height with a high regeneration capacity. Depending on the cover of the domi-nant species, these areas show high concentrations of man-grove trees which have been felled due to adverse weather conditions. In general these areas are permanently or season-ally fl ooded and have non-consolidated soils and a large quantity of organic matter. They are ideal sites for water birds which use the area for nesting, feeding and resting.
Location: type of forest cover 1, 2, 4, 5, 6, 7, 8, 9, 10 and 11, totalling 530 hectares.
Activities to be carried out:
• removal of dead wood to forest regeneration in open areas affected by winds and hurricanes.
• population density control and pruning of trees partly torn down by strong winds, storms and hurricanes.
• implementation of a vigilance programme to re-duce illegal felling
• pruning of adventitious roots that reduce the refl ec-tion of the water in channels and ponds
• rescue and transplanting of seedlings totally or par-tially covered by trees torn down by strong winds, hurricanes and storms.
• pest and disease control
In accordance with the defi nition of control methods for each area in particular, the schedule of activities for a one-year cycle (considering these actions as permanent for con-serving the ecosystem) are as follows (Table 6):
The proposed activities for the area of potential use refer to the parts of the common land affected by adverse weather events, such as: hurricane “STAN” (2005) and Tropical Storm Bárbara (2007).
11. Preparing the site
In accordance with the control method, the activities for pre-paring the site are as follows:
11.1 Conservation area
Planning of hydrological rehabilitation work: identifi cation of historic beds of ponds and natural channels in the area, with a view to designing the hydrological rehabilitation work. For that purpose, traditional knowledge of the area is used to
calculate the dimensions (length and breadth) of these water-bodies before they became silted.
Identifi cation of natural regeneration areas and seeding zones for L. racemosa: paying visits to the area to identify areas for gathering propagules for the species L. racemosa. Based on the knowledge of these areas (location, propagules production capacity, etc.) a harvesting plan will be designed for the propagation of this species in segments containing only white mangrove.
Access to conservation areas: determining of potential ac-cess routes to the conservation areas by recording traditional footpaths and traces of channels that are partially blocked.
Vigilance: identifi cation of the most appropriate areas for establishing control and vigilance stations in the region. Those areas will be located in the main accesses to the area, to restrict traffi c and the illegal felling of trees.
11.2 Ecological rehabilitation areas
Planning of hydrological rehabilitation work (land system): identifi cation of historic beds of ponds and natural channels in the area, with a view to designing the hydrological reha-bilitation work. For that purpose, traditional knowledge of the area is used to calculate the dimensions (length and breadth) of these waterbodies before they became silted.
Planning of hydrological rehabilitation work (water sys-tem): for each pond and channel rehabilitation area, a work plan will be designed for the removal of submerged and par-tially submerged wood. In addition, identifi cation of the sites where the wood is fi nally deposited and/or where alternative use is made of wood using “drill bits” with a low potential for household use.
Reforestation areas: location and recording of conditioned areas in which reforestation could be carried out, due to the reduction in salinity and improvement of the hydroperiod.
Removal of suspended solids: identifi cation and recording of areas in which improvements can be made by removing inorganic suspended solids (waste). Likewise, negotiating a system for stockpiling and controlling inorganic waste from the ecosystem with local and municipal authorities.
11.3 Ecological improvement area
Determining the volume of organic matter which can be used for subsistence purposes: at present an analysis is being made of the information obtained in a total of 20 sampling units. The purpose of this is to calculate the volume of wood torn down by hurricane “STAN” and Tropical Storm “Bárbara”. To that end, all the trees felled were measured, in order to calculate the average volume per surface unit.
Sample gaps and access routes to the area: due to the seed-ling volumes (natural regeneration) present in the area, mak-ing of the necessary calculations for implementing an “ele-vated” access system to the zones from which the felled trees are to be removed. In this way, the wood will be transported from the area using “elevated” ropes and cables, to reduce the impact on natural regeneration. Access by land for monitor-ing the zone is done through the water channels during the dry season.
95www.factsreports.org

Community strategy for mangrove forest conservation: Conquista Campesina Conservation Easement
11www.factsreports.org
Rescue of seedlings buried by fallen trees: estimations are made of the number of seedlings buried by fallen trees, which will be removed and transplanted in areas with the same wa-ter and saline stress characteristics.
Planning of hydrological rehabilitation work: for preven-tion purposes, identifi cation of historic beds of natural ponds and water channels in the area, with a view to designing the hydrological rehabilitation work. For that purpose, traditional knowledge of the area is used to calculate the dimensions (length and breadth) of these waterbodies before they became silted.
Vigilance: identifi cation of the most appropriate areas for establishing control and vigilance stations in the region. Those areas will be located in the main accesses to the area, to restrict traffi c and the illegal felling of trees.
12. Description of the provisional work and activities included in the project
The only work considered that is common to all areas with control methods is work that is aimed at rehabilitating the hydrological dynamics of the ecosystem. In this regard, the provision activity consists of:
Rehabilitation of water fl ows in natural channels and ponds (water medium): this activity does not include the building of structures in the area. Its execution is aimed at restoring the natural dynamics of the water column (fl ows and refl ows). No major machinery is used in designing and executing the work, but tools with a low impact, such as large knives, pul-leys and ropes. The strategy consists of mechanically remov-ing submerged wood from natural ponds and water channels. To that end, the local inhabitants are divided up into work brigades, with the mission of identifying areas of the chan-nels that are partially blocked, and one of the brigades ex-plores the water medium in order to identify the logs and branches that must be removed. That waste is moored and lifted using pulleys with a capacity of one ton and a half (Figure 12).
Figure 12. Procedure for rehabilitating natural ponds and water channels
In the event that the waste material consists of branches, these are chopped and cut into lengths of no more than 20 cm and then distributed evenly in the undergrowth of the ecosystem where it is reduced and integrated into the substrate. In the case of logs, these are removed and transported from the area to sites inside
the community where they are stored and dried, for use as fi re-wood. Using this system, the landscape of the area remains un-altered. However, some temporary alterations may occur in rela-tion to the cloudiness of the water and generation of noise which has an effect on the behaviour of the fauna in the areas of distri-bution. Such alterations are not permanent and limited only to the time during which the activity is carried out.
13. Construction phase
Rehabilitation of natural ponds or “ditches”: this activity is de-signed to rehabilitate natural water channels known locally as “ditches”, which are partly or totally blocked by accumulated sediments. The entry of these channels into the area is the main cause of the death of the mangroves due to the hypersalinisa-tion and pyritisation of the water and soil. The poor circulation of the water gives rise to the stagnation of surface run-off wa-ter, which tends to disappear during the dry season, leading to the concentration of large quantities of mineral salts in the area. To reverse this effect, works are designed to open up natural “ditches” in order to recover the correct fl ow of tidal waters and prevent water stagnation. To execute such work, the for-mer water “veins” are identifi ed and the sediments are removed and retained at both sides of the channel through the construc-tion of barriers (palisades) with dead vegetable matter (branch-es and logs, see Figure 13 and 14).
Figure 13. Rehabilitation of “ditches”
Figure 14. Example of the rehabilitation of a “ditch”, with the work completed
Then these barriers are consolidated by reforestation to prevent them from being damaged by the effects of the tide. The orientation and dimensions of each natural channel are
96 FACTS Reports

Community strategy for mangrove forest conservation: Conquista Campesina Conservation Easement
12 Field Actions Science Reports
calculated based on traditional knowledge of the region by the inhabitants. In this way, the hydrological conditions of these small channels are rehabilitated, which do not usually exceed two metres in width by 1.5 metres in depth.
Like the rehabilitation and pond activities, the “ditch” re-habilitation activities cause certain temporary effects on the behaviour of local fauna, due to the presence of the inhabit-ants and the residual noise caused by the activity. However, in rehabilitating these natural channels, such rehabilitation does not last for long periods of time, and so the impact is temporary and generates no subsequent effects.
The work and activities described above have a long useful life given, provided that no extreme weather conditions de-velop (hurricanes and storms). In such cases, the structure and design of the work are aimed at guaranteeing resistance and permanence, and so a permanent monitoring and mainte-nance programme is set up simultaneously.
14. Operating and maintenance phase
Once the hydrological rehabilitation work has concluded, which are common for all the control areas, an operating and maintenance programme is set up which includes the removal of wood from channels and ponds (water medium) in the event of trees falling due to strong winds, or due to disease or damage to the trees. In the communal land area, most of the “edge” mangrove forests show important inclinations over the waterbodies, and therefore it is necessary to implement a programme for pruning and removing certain specimens, in order to maintain the best conditions in terms of hydrological dynamics. For that purpose, specimens that pose a “risk” are identifi ed and treatment is applied (pruning or removing), de-pending on their probability of falling. The organic deriva-tives of this activity have an adequate potential in terms of subsistence use.
In the case of work for rehabilitating “ditches”, the mainte-nance thereof is only required in the event of hurricanes and tropical storms. Due to its design and architecture, this work is intended to guarantee a long useful life, without the need to implement a permanent maintenance programme. In the event of an accident, the activities to be considered are aimed at removing accumulated sediment, the removal of felled wood, the reconstruction of edges and their subsequent con-solidation and reforestation.
The operating and maintenance activities pose no perma-nent environmental risk in either case. Their application only has effects that are temporary or limited, such as: alteration of the distribution patterns of some species of fauna associated with the site, increase in the cloudiness of the water due to removing sediments from the bottom of the channels, possi-ble changes in the water quality due to accidental spills of fuel from launches, surface changes in the soil structure due to the compacting caused by the movement of the work bri-gades and possible accidental deaths of seedlings resulting from removing silt and the movements of local inhabitants in natural regeneration areas. The containment of such impacts is attenuated by the adequate training of the inhabitants and limitations in the use of mechanical equipment running on fossil fuels (launch motors, chain saws, diggers and in
particular, all the major equipment used to remove silt from the channels.
References
Abdel-Razik, M.S. (1991), Population structure and ecological per-formance of the mangrove Avicennia marina (Forssk.) Vierh. on the Arabian Gulf coast of Qatar, Journal of Arid Environments, 20 (3):331-338.
Alrasjid, H. Effendi, R. (1986), Pengaruh penebangan terhadap kerusakan permudaan alam hutan mangrove di kelompok hutan sungai Sepada, Kalimantan Barat (The effect of felling to the natural regeneration damage of mangrove forest in Sepada river forest complex West Kalimantan). Buletin Penelitian Hutan, 476:1-22.
Ángeles, G. (1997), Historia natural de las especies: Rhizophora mangle, González, E. Dirzo, R. Vogt , RC. Historia Natural de Los Tuxtlas, Universidad Nacional Autónoma de México, México, D.F. p:148-149.
Ayuntamiento de Acapetahua, (2002), Plan de desarrollo municipal, Villa de Acapetahua, Chiapas (2002-2004), Documento de Trabajo.
Bartra, A. (1996), Plantaciones y monterías del sureste durante el Porfi riato, México Bárbaro, El Atajo, México.
Bello, MR. Hernández Romero AH. (2004), Evaluación de la con-taminación por plaguicidas en el sistema lagunar costero Pozuelos Murillo en la región del Soconusco, Chiapas, Informe al H. Ayuntamiento municipal de Tapachula, El Colegio de la Frontera Sur.
Bello, MR. Hernández Romero, AH. Malo Rivera, EA. Tovilla Hernández, C. (2003), Evaluación de la calidad del agua en el sistema lagunar costero “Pozuelos-Murillo” en el Soconusco, Chiapas, Fundación Produce Chiapas, A.C. 30 p.
Bongers, F. Popma, J. Meave del Castillo, J. J. Carabias, J. (1988), Structure and fl oristic composition of the lowland rain forest of Los Tuxtlas, Mexico, Vegetatio 74:55-80.
Brown, (1987), Structural comparisons of mangrove forests near shrimp ponds in southern Ecuador, Interciencia 12 (5):240-243.
Carmona-Díaz, G. Rodríguez-Luna, E. (2001), Estructura, distribu-ción y abundancia del manglar de Sontecomapan, Catemaco, Veracruz, Memorias del XXI Congreso Mexicano de Botánica, Querétaro, Querétaro, 118 p.
Cintron, G. Lugo, AE. Martinez, R. (1985), Structural and function-al properties of mangrove forests, W.G. D’Arcy y M.D. Correa A., eds. The botany and natural history of Panama. Monographs in Systematic Botany from the Missouri Botanical Garden 10:53-66.
Clarke, PJ. Allaway, WG. (1993), The regeneration niche of the grey mangrove (Avicennia marina): effects of salinity, light and sedi-ment factors on establishment, growth and survival in the fi eld, Oecologia 93:548-556.
Clutter, J.L. Fortson, JC. Pienaar, LV. Brister, GH. Bailey, RL. (1983), Timber management: a quantitative approach, John Wiley & Sons, Nueva York, EUA, 333 p.
Bauman, J. Gonzales, SD. (2000), Plan de Conservación de Suelos y Agua Para la Costa de Chiapas, CONAGUA y Centro para la Migración y Desarrollo Internacional, México, 141 pp.
CONAGUA, (2006a), Proyecto de Acuerdo por el que se dan a con-ocer las denominaciones y la ubicación geográfi ca de las vein-ticinco cuencas hidrológicas localizadas en la Región Hidrológica Número 23 denominada Costa de Chiapas, así como la Disponibilidad Media Anual de las Aguas Superfi ciales en las Cuencas Hidrológicas que comprende dicha Región Hidrológica, Gerencia Regional XI - Frontera Sur, México, D.F. 28 paginas.
97www.factsreports.org

Community strategy for mangrove forest conservation: Conquista Campesina Conservation Easement
13www.factsreports.org
CONAGUA, (2006b), Programa Hídrico por Organismo de Cuenca Visión 2030, Región Hidrológico Administrativa XI Frontera Sur, Diagnóstico Hídrico, Tuxtla Gutiérrez, Chiapas, 378 pp.
CONAGUA-Semarnat y Plan Nacional de Desarrollo, (2003) Programa Hidráulico Regional 2002-2006, Región Sur XI, México, 140 pp.
Coutiño Barrios, R. Tovilla Hernández, C. (2003), Guía de aves de la Laguna Pampa “El Cabildo”, ECOSUR, Tapachula, Chiapas, México, 106 p
De la Cruz, H.A. (2004), Análisis de los Aspectos Sociales y del Aprovechamiento Pesquero en La Comunidad de La Palma, Acapetahua, Chiapas, Informe Técnico, Inst. Nal. De la Pesca, Dirección General de Investigación y Desarrollo Tecnológico Pesquero, Centro Regional de Investigación Pesquera, Salina Cruz, Oaxaca, México, 45p.
Estrada-Croker, JC. Alvarez-Vilchis, C. González-García, Y. Hernández-López, M. (2007) Informe de Acciones Realizadas en los Humedales Costeros “El Cabildo Amatal” y “El Gancho Murillo”, Chiapas, México, Resultados 2003-2007, Delegación Regional Tapachula, Instituto de Historia Natural y Ecología, Documento Interno, Tapachula de Córdova y Ordóñez, Chiapas.
FAO, (1994), Directrices para la ordenación de los manglares, Organización de las Naciones Unidas para la Agricultura y la Alimentación (FAO), Subdirección de desarrollo de Recursos Forestales, Dirección de Recursos Forestales, Departamento de Montes, Chile, 345 pp.
Flores, V. González, F. Segura, Z. Ramírez, G. (1992), Mangrove eco-systems of the Pacifi c coast of Mexico: Distribution, structure, lit-terfall, and detritus dynamics, V. Seeliger, Coastal plant communi-ties of Latin America, Academic Press, Nueva York, EUA, pp. 269-288.
García, E. (1987), Modifi caciones al sistema de clasifi cación climáti-ca de Köppen, 4a ed. México, D.F. 217 p.
García, E. (1969), Geografía General de Chiapas, México, 375 pp.Gobierno del Estado de Chiapas, (1992), Informe de Gobierno.
Actividades de fomento y Apoyo a las Pesquerías y Acuicultura en la Costa de Chiapas, Documento de Trabajo, Tuxtla Gutiérrez, 46p.
Hartshorn, G.S. (1989), Application of gap theory to tropical forest management: natural regeneration on strip clearcuts in the Peruvian Amazon, Ecology 70 (3):567-569.
Helbig, CM. (1964), El Soconusco y su Zona Cafetalera en Chiapas, Instituto de Ciencias y Artes de Chiapas, Tuxtla Gutiérrez, Chiapas, México, 133 pp
Jiménez, J. (1999), El manejo de los manglares en el Pacífi co de Centro América: Usos tradicionales y potenciales, Yáñez-Arancibia, A. Lara-Domínguez, AL. (eds) Ecosistemas de man-glar en América Tropical, Instituto de Ecología, México, UICN/HORMA, Costa Rica, NOAA/ NMFS, Silver Spr MD, EUA. p:275- 290.
Jiménez, J.A. (1988), The dynamics of Rhizophora racemosa Meyer forests on the Pacifi c coast of Costa Rica, Brenesia 30:1-12.
Jiménez, J.A. (1990), The structure and function of dry weather man-groves on the Pacifi c coast of Central America, with emphasis on Avicennia bicolor forests, Estuaries 13 (2):182-192
Kjerve, B. Drude, L. Hadji, E. (1997), Mangrove ecosystem studies in Latin America and Africa, UNESCO, Francia, 349 p.
Lacerda L. Schaeffer, Y. (1999), Mangroves of Latin America: the need for conservation and sustainable utilization, Ecosistemas de manglar en América Tropical, Instituto de Ecología, A.C., México, UICN/ HORMA, Costa Rica, NOAA/NMFS, Silver Spr MD, EUA, p:5-8.
Lahmann, E. (1999), La reserva forestal de Térraba-Sierpe, Costa Rica: Un ejemplo de uso adecuado del manglar, Ecosistemas de
manglar en América Tropical, Instituto de Ecología, A.C., México, UICN/HORMA, Costa Rica, NOAA/NMFS, Silver Spr MD, EUA, p:291-298.
López Portillo, J.A. (1982), Ecología de manglares y de otras comuni-dades de halófi tas en la costa de la Laguna de Mecoacán, Tabasco, Tesis Profesional, Facultad de Ciencias, UNAM, México, D.F. 160 p.
López-Ayala, J.L. Valdez-Hernández, JI. Terrazas, T. Valdez-Lazalde, JR. (2006), Anillos de crecimiento y su periodicidad en tres espe-cies tropicales del estado de Colima, México, Agrociencia 40 (4): 533-544.
López-Portillo, J. Ezcurra, E. (2002), Los manglares de México: una revisión, Madera y Bosques Número Especial 1:27-51.
Lot, H. A. Vázquez, Y. Menéndez, L. (1975), Physiognomic and fl o-ristic changes near the northern limit of mangroves in the Gulf Coast of Mexico, Proceedings of International Symposium on Biology and Management of Mangroves, vol. 1:8-11 October 1974, East-West Centre, Honolulu, Hawaii. Institute of Food and Agricultural Sciences, University of Florida, Gainesville, Florida, EUA, pp:52-61.
Lot, A. Novelo, A. (1990), Forested wetlands of Mexico, Forested wetlands, Ecosystems of the world 15, Elsevier, Amsterdam, Holanda, pp. 287-298.
Lugo, A. (2002), Conserving Latin American and Caribbean man-groves: issues and challenges, Madera y Bosques Número Especial 1:5-25.
Magaña, T. Torres, JM. Acosta, M. (1992), Guía de uso de West: pro-grama para estimar parámetros de la función de distribución de probabilidades Weibull, Campo Experimental Valle de México, INIFAP, Chapingo, México, 29 p.
McKee, K.L. (1995), Seedling recruitment patterns in a Belizean mangrove forest: effects of establishment ability and physico-chemical factors, Oecologia 101:448-460.
Menéndez, L. (1979), Los manglares de la laguna de Sontecomapan, Los Tuxtlas, Ver.; estudio fl orístico-ecológico, Tesis Profesional, Facultad de Ciencias, UNAM, México, D.F. 115 p.
Miranda, F. (1975), La Vegetación de Chiapas, Primera Parte, Ediciones del Gobierno del Estado de Chiapas, 2ª. Edición, Tuxtla Gutiérrez, Chiapas, México, 265 pp.
Montes, E. Nazar, B. (1998), Ejido Conquista Campesina, Documento interno, Departamento de Género y Salud Reproductiva, División de Población y Salud, El Colegio de la Frontera Sur- Unidad San Cristóbal.
Morales-Abril, G. (1999), Guía para la elaboración de programas de manejo, Natural Conservancy, EUA.,78 p.
Mülleried, F.K.G. 1957. La geología de Chiapas, México. Gobierno Constitucional del estado de Chiapas. Tuxtla Gutiérrez, Chiapas.
Navarrete Vivanco, L.R.(1999), Diagnóstico socioeconómico de la población del sistema lagunar Chantuto-Panzacola: Julio de 1988 a enero de 1999, Instituto Nacional de Ecología / Instituto de Historia Natural, Acapetahua, Chiapas.
Osborne, K. Smith, TJ. III. (1990), Differential predation on man-grove propagules in open and closed canopy forest habitats, Vegetatio 89:1-6.
Patterson, S. McKee, KL. I.A. Mendelssohn, IA. (1997), Effects of tidal inundation and predation on Avicennia germinans seedling establishment and survival in a subtropical mangal/ salt marsh community, Mangroves and Salt Marshes 1:103-111.
Pennington, T.D. Sarukhán, J. (1998), Manual para la identifi cación de campo de los principales árboles tropicales de México, Instituto Nacional de Investigaciones Forestales. Secretaría de Agricultura y Ganadería, Organización de las Naciones Unidas para la Agricultura y la Alimentación (FAO), México, D.F. y Roma, Italia, 115 p.
98 FACTS Reports

Community strategy for mangrove forest conservation: Conquista Campesina Conservation Easement
14 Field Actions Science Reports
Pool, D.J. Snedaker, SC. Lugo, AE. (1977), Structure of mangrove forests in Florida, Puerto Rico, México and Costa Rica, Biotropica 9 (3):195-212.
PROFEPA, (2002), Programa de Procuración de Justicia Ambiental 2001-2006, México 111 pp.
Pronatura Chiapas A C. (2002), Establecimiento de un Corredor de Humedales del Pacífi co: Fase I, Informe técnico del proyecto ante la North American Conservation Act.
Pronatura Chiapas A. C. (2006), Corredor de Humedales del Pacífi co: Fase II, Informe técnico del proyecto ante la North American Conservation Act.
Pulido, V. (2002), Conservación y Manejo del Manglar en el Área Natural Protegida El Gancho Murillo, Informe Técnico, H. Ayuntamiento de Tapachula, El colegio de la Frontera Sur, 179 p.
Ramírez A. (1995), Estructura y demografía del manglar del estero La Angostura, Laguna Oriental, Oax, y su relación con algunos pará-metros ambientales, Tesis Profesional, Facultad de Estudios Superiores Zaragoza, UNAM, México, D.F. 73 p.
Robertson, A.I. Daniel, PA. Dixon, P. (1991), Mangrove forest struc-ture and productivity in the Fly River estuary, Papua New Guinea, Marine Biology 111 (1):147-155.
Rollet, B. (1978), Description, functioning and evolution of tropical forest ecosystems, 5, Organization, UNESCO, Tropical forest eco-systems (Natural resources research XIV), Paris, France, pp. 112-142.
Rzedowski, J. (1978), Vegetación de México, Editorial Limusa, México, D.F. pp 97-361.
Saifullah, S.M. Shaukat, SS. Shams, S. (1994), Population structure and dispersion pattern in mangroves of Karachi, Pakistan, Aquatic Botany 47:329-340, SAS Institute Inc. 1996. JMP IN® Version 3.1.5 for Windows.
Salazar, R. A. V. (2003), Relación de la estructura y composición de Rhizophora mangle, Laguncularia racemosa, Avicennia germi-nans y Conocarpus erectus con las propiedades fi sicoquímicas del suelo, del sistema lagunar Pozuelos-Murillo, Chiapas, México, Tesis Profesional, facultad de Ciencias Químicas, Campus IV, Universidad Autónoma de Chiapas.
Salinas Orta, H.T. (1997), Encierro rústico para engorda de camarón en laguna “El Campon” con solicitud de siembra con 5 millones de postlarvas de camarón blanco, Opinión Técnica, Centro Regional de Investigación Pesquera de Salina Cruz, Oaxaca, Documento Interno.
SARH, Secretaría de Agricultura y Recursos Hidráulicos, (1982), Atlas Hidrográfi co de la República Mexicana, 187 láminas +54pp. México.
SERNYP, (1998), Estudio Técnico Justifi cativo de los humedales El Gancho-Murillo para proponerlos como Área Natural Protegida, Documento Interno, Gobierno del Estado de Chiapas,50 pp.
Silva, C.A.R. Lacerda, LD. Silva, LFF. Rezende, CE. (1991), Forest structure and biomass distribution in a red mangrove stand in Sepetiba Bay, Rio de Janeiro. Revista Brasileira de Botanica 14(1):21-26.
Silva-Benavides, A.M. (1999), Cuanti-fi cación de la sociobiología del manglar de Purruja, Golfi to: Recomenda-ciones para su manejo, Jornadas de investigación, Vicerrectoría de investigación, Universidad de Costa Rica, 67 p.
Smith III, T.J. (1987), Effects of light and intertidal position on seed-ling survival and growth in tropical tidal forests, Journal of Experimental Marine Biology and Ecology 110:133-146.
Smith III, T.J. (1987a), Effects of seed predators and light level on the distribution of Avicennia marina (Forsk.) Vierh. in tropical, tidal forests, Estuarine, Coastal and Shelf Science 25:43-51.
Sociedad Cooperativa de Producción Pesquera de Bienes y Servicios “La Palma” (1981), Producción de Camarón y Escama en el
periodo 1979-1981, Informe anual a los Socios de la Sociedad Cooperativa.,Septiembre, 12p. Libretas 1,2,3, Anexos II y V, La Palma Mun. Acapetahua.
Srivastava, P.B.L. Daud, K. (1978), Progress of natural regeneration after fi nal felling under the current silvicultural practices in Matang Mangrove Reserve, Pertanika 1 (2):126-135.
Sukardjo, S. (1987), Natural regeneration status of commercial man-grove species (Rhizophora apiculata and Bruguiera gymnorrhiza) in the mangrove forest of Tanjung Bungin, Banyuasin District, South Sumatra, Forest Ecology and Management 20:233-252.
Thom, B.G. (1967), Mangrove ecology and deltaic geomorphology: Tabasco, Mexico, Journal of Ecology 55:301-343.
Tomlinson, P.B. (1986), The Botany of Mangroves, Cambridge University Press. Cambridge, Reino Unido.,98 p.
Tovilla, H. Hernández, CH. Morales, B. Linares, R. Escobar, S. Salas, R. Landeros, J. Aguilar, A. (2004), Mantenimiento de plantaciones de mangle Conocarpus erectus y Rhizophora mangle, en la Reserva de Biosfera La Encrucijada, Informe Técnico, Laboratorio de Ecología de Manglares y Zona Costera, El Colegio de la Frontera Sur.
Tovilla, H.C. (1998), Ecología de los bosques de manglar y algunos aspectos socioeconómicos de la zona costera de Barra de Tecoanapa Guerrero, México, Tesis Doctoral, Facultad de Ciencias, UNAM, México, 365 pp.
Tovilla Hernández, C. (2003), Saneamiento y restauración de la zona de Barra de Cahoacán y Laguna Pozuelos-Murillo, H. Ayuntamiento de Tapachula, 29 p.
Tovilla Hernández, C. Pulido Villareal, M. (2003), Propuesta de manejo de los bosques de manglar de el área natural protegida “El Gancho-Murillo y Cabildo Amatal”, ECOSUR, Tapachula, Chiapas, México, 63 p.
Tovilla-Hernández, C. (2002), Educación ambiental y restauración del manglar en las reservas naturales de “El Gancho-Murillo y Cabildo Amatal, 48 p.
Tovilla-Hernández, C. Román-Salazar, A.V. Simuta-Morales, G.M. Linares-Mazariegos, R.M. (2004), Recuperación del manglar en la barra del río Cahoacán, en la costa de Chiapas, Madera y Bosques, 2: 77-91.
Trejo, T. Durán, R. (1993), Manglares de la península de Yucatán, S.I. Salazar V. y N.E. González, Biodiversidad Marina y Costera de México, CONABIO/ CIQRO, México, D.F. pp. 660-672.
Valdez, H. (1991), Estructura fi sonómica del bosque de mangles de la Laguna de Agua Brava, Nayarit, Tesis Profesional, División de Ciencias Forestales, UACH, Chapingo, Estado de México, 263 p.
Valdez, H. (2002), Aprovechamiento forestal de manglares en el es-tado de Nayarit, costa Pacífi ca de México, Madera y Bosques Número especial: 129-145.
Valdez, H. (2004), Manejo forestal de un manglar al sur de Marismas Nacionales, Nayarit, Madera y Bosques Número especial 2:93-104.
Vázquez, Y. (1971), La vegetación de la Laguna de Mandinga, Veracruz, Anales del Instituto de Biología de la Universidad Nacional Autónoma de México, Serie Botánica 42 (1):49-94.
Velázquez, M. de los Santos P. Valdez, H. (1995), Producción forestal de México, VII Censo agropecuario, 1991, Instituto Nacional de Estadística, Geografía e Informática, Colegio de Postgraduados en Ciencias Agrícolas, México, 170 p.
Voorhies, B. Gasco, J. (1984), El Periodo Postclásico Tardío de Acapetahua, Chiapas, México en: investigaciones recientes en el área Maya, Tomo I, Sociedad Mexicana de Antropología, San Cristobal de las Casas, Chiapas, México, 431-438
Voorhies, B. (1976), The Chantutu People: an Archaic period Society of the Chiapas Litoral México, Ed. New World Archeological Foundation, Brigham Young University, Provo, Utha.
99www.factsreports.org

Scaling of mangrove afforestation with carbon fi nance to create signifi cant impact on the biodiversity –
a new paradigm in biodiversity conservation models
Ajanta Dey1 and Animesh Kar2
1Joint Secretary and Project DirectorNature Environment & Wildlife Society
Member, CEM – IUCN and Associate Editor, [email protected]
2Co-ordinator, Research and MonitoringNature Environment & Wildlife Society
Abstract. Sunderbans has undergone a huge loss of forest cover in the past century. Population pressure ever increasing, the administration is more intent on developing economic activities in the area. However no eco-nomic activities will sustain if the environmental vulnerability of the region is not properly addressed. Mangroves form the basis of the ecosystem and large scale restoration of this mangrove cover on a scientifi c basis can create the necessary impact on the biodiversity and mitigate climate change. The carbon fi nance approach adopted by “Livelihoods” is a tool to create biodiversity-core social business models. This writing reviews into the theory and practices of such a model implemented in Sunderbans and identifi es the prospects and challenges.
Keywords. Mangrove, Climate change, India, Carbon fi nance, Clean Development Mechanism, Forest, REDD+, Ecosystem, Biodiversity, Sustainability
1. “Why and how” of carbon fi nance model for mangrove afforestation
Global Warming and climate change posing a rather gloomy picture for the future of the planet earth, thousands of people living in the coastal region, which happen to be the hub of economic activities, have been exposed to the threats of sea level rise. The last decade has seen tsunami, cyclones, torna-does, of such magnitude and dimension that those suffered are still struggling with the impact and the world has learnt it in the other way. The question was apparent- how nature bal-anced these hazards in her own way? It is the mangroves that creates a bio-shield, helps stabilizing the tidal estuaries, se-quester huge amount of carbon-di-oxide (both below and above ground bio-mass), dissipates and dissuades wind and wave energy. Sunderbans, world’s largest mangrove delta has witnessed sharp decrease in mangrove cover since last one hundred years. The huge population pressure along with hu-man interventions like dams in upper reaches of the Ganga-Bhagirtathi river has created a huge impact on the entire hy-drology of the system and thus has also affected the mangroves. Thus, the importance of conservation of man-
groves have increased manifold in this context.The task is challenging. Mangroves form the basis of
Sunderbans ecosystem and mangrove management – planta-tion and monitoring constitutes a major task of the adminis-trative bodies – mainly the Forest Department and Sunderban Development Board (SDB). The Forest Department is more concentrated on managing the protected area with limited re-sources of staff and funds, while SDB is more focused on supporting socio-economic activities like agriculture, rain-water harvesting, electrifi cation and social forestry activities with additional tasks of mangrove plantation on the village mudfl ats. Thus we have seen mangrove planting initiatives in the past, but they are generally a one or two year bound proj-ect which do not in the design of it hold the sustainability over a longer period. In spite of few cores of investment in mangrove plantation over last ten years, except for some very few areas like in “kanchan dwip” in Bidya River, we fi nd there is no signifi cant patch of mangroves regenerated on the areas outside the protected area, degradation of the same be-ing the order of the day. Hence the tools necessary to develop to grow it into a forest is lacking. A yearly engagement of the departments during monsoon time for plantation of seeds,
© Author(s) 2013. This work is distributed under the Creative Commons Attribution 3.0 License.http://factsreports.revues.org/2674Published 19 April 2013
100 FACTS Reports

Scaling of mangrove afforestation with carbon fi nance to create signifi cant impact on the biodiversity – a new paradigm in biodiversity conservation models
2 Field Actions Science Reports
mostly mono-species, is noticed. The continuous and assured fl ow of funds for the growth and monitoring is also a prereq-uisite for the sustenance of such activities. We also do not come across GPS use to defi ne areas of plantation, bathyme-try-salinity specifi cations of the mudfl ats, survival-mortality data , growth curves, changing pattern in the forest cover and fi nally the engagement of the communities in decision-mak-ing and monitoring of this process.
Since afforestation through carbon fi nancing is a mecha-nism which in its course holds a period of growing and main-taining the carbon stock of the trees over ten or twenty years of time, hence preservation and consolidation of the carbon pool of the mangroves becomes critical for the existence and continuance of the project. The carbon-fi nance model is an upfront investment that assures the fl ow of funds for the plan-tation to grow into a forest cover. It is a long-term investment, high-scaled and creates long term impact, especially the one from Livelihoods mission that support the efforts of agricul-tural and rural communities to live in sustainable ecosystems which serve as the foundation for their food security and pro-vide the resources that ensure their sustainability. Hence it also looks at the economic and social well-being of the vul-nerable communities.
Thus we have a win-win situation for all the stakeholders .It is for the interest of the investors, who invests in funds mobilizing in particular carbon offset mechanisms, that the project is addressed and dealt with all the challenges to maxi-mize the sequestering capacity and hence the growth of the forest cover.
The NGO who is implementing the project gets a long term commitment for the implementation of their mission of pro-tecting ecology and environment and lastly the community gets increased forest cover that protect them from the natural hazards like storms, cyclones and daily tidal infl uences, as also bring livelihood securities by means of increased quality fi sh and crab catch.
2. The project vision
Nature Environment & Wildlife Society (NEWS) has been working as a non-profi t association for protection of wildlife, ecology and the environment in various ecosystems in India through research orientation programmes and also mobiliz-ing communities dependent on ecosystems for security of sustainable livelihoods and engages them in the conservation process.
Livelihoods’ mission is to support the efforts of agricultural and rural communities to live in sustainable ecosystems which serve as the foundation for their food secu-rity and provide the resources that ensure their sustainability, acting as a platform providing the means to restore or pre-serve ecosystems that are degraded or threatened by mobiliz-ing in particular carbon offset mechanisms.
The project funded by Livelihoods and implemented by NEWS in Sundarbans, the world heritage site has the vision of:
• Afforestation of mangroves and restoration of the vi-brancy of the wetlands ecosystem
• Community mobilization and engagement in restora-tion process
• Developing a carbon offset strategy on wetland resto-rations to reduce impact of greenhouse gas emissions
The project aims to:
1. Plant 6000 ha of mangroves in the vulnerable areas in a multi-species environment that will protect the em-bankments from the tidal surges, protect the huge popu-lation of southern Bengal from the onslaughts of cy-clones, storms ;increase the fi sh catch , crabs and reestablish the functioning ecosystem thus helping the community to build resilience against climate change .
2. Engage the community in the implementation process at every level through intense stakeholders meetings, institutionalize the process by involving the panchay-ats – the grass root platforms of the Government and develop mechanisms to create “change agents” espe-cially among women by patronizing self-help group activities.
3. Contribute to the Danone carbon offset strategy and collect carbon credits ,as per the guidelines of Kyoto protocol under the Clean development Mechanism ,to an agreed value beyond which the added values will be shared between community to the extent of 50%.
3. Project: at a glance
The entire project area of 6000 ha is divided into four zones: Bidya-Raimongol, Matla, Saptamukhi-Thakuran and Sagar Island.
3.1 History
The Indian part of Sundarbans cover an area of 9630 sq km which is bounded in the north by an imaginary line called Dampier-Hodges line, in the south by Bay of Bengal : in the east by Icchamalti Raimongol river and Hughly river in the west. It falls within the districts of 24 Parganas, South and North.
It has been declared a Tiger Reserve in 1973, a National Park in 1984, a Biosphere Reserve in 1989 and a World Heritage Site in 1987.
3.2 Terrain and river systems (geomorphology)
Sunderbans is formed by the alluvial deposits carried on by the mighty rivers from Himalayas. Ganga River originating in the Goamukh glacier in the Himalayas traverses through the breadth of the country building rich fertile lands along its banks and is joined by numerous snow-fed rivers from the Himalayas. In its lower course the main distributary is Hughly while the river continues fl owing east into Bay of Bengal. River Brahmaputra originating from the Himalayas fl ows through China and enters India through north-eastern borders and pours into Ganga, about 120 km upstream from the mouth of river Ganga. This river system with Hughly in the
101www.factsreports.org

Scaling of mangrove afforestation with carbon fi nance to create signifi cant impact on the biodiversity – a new paradigm in biodiversity conservation models
3www.factsreports.org
East and River Ganga in the west creates the delta of Sunderbans in the lower reaches of the river with innumera-ble creeks and channels forming a criss-crossed network.The main rivers that constitiute this system in India are Matla, Thakuran, Bidyadhari, Raimongol, Saptamukhani , Goasaba, Icchamati.
Table 1
SITE PLANTING2010
PLANTING 2011
PLANTING 2012
PLANTING 2013
BIDYA-RAIMONGOL
292 132.5 776.6 375
MATLA 409.3 617.3 371 150
SAPTAMUKHI-THAKURAN
64.9 156.4 847 500
SAGAR-PATIBONIA
590 243 475
TOTAL (in ha) 766.2 1496.2 2237.6 1500
Plantation plan until 2012 covers the following villages, panchayats and blocks of Sunderbans.
Table 2
SITE BLOCKS PANCHAYATS VILLAGES
BIDYA-RAIMONGOL
4 17 23
MATLA 4 13 17
SAPTAMUKHI-THAKURAN
5 17 27
SAGAR-PATIBONIA
2 6 9
TOTAL 15 43 76
3.3 In� uences
A close network of rivers, channels and creeks intersects the whole area, thus forming numerous fl at islands which are submerged completely during high spring tides and partially during ordinary high tides. The Hughly River, although a ma-jor tributary of the Ganga River, receives a limited and speci-fi ed discharge from its main constituent river because of the Farakka Barrage and treaty with Bangladesh. “It is fed main-ly by the Rupnarayan and is also connected with the Ganga through the Jalangi River.
But the estuary of the Hughly remains brackish even dur-ing the rains on account of its great width. During the rains, Raimongol receives a considerable quantity of local drain-age. The rivers Matla, Saptamukhi and Thakuran have practi-cally no connection with their original parent stream and are now creeks of the sea” (Government of West Bengal, 2010).
Freshwater fl ow is almost non-existent in the dry season and silts and sediments that enter the estuary from the Bay of Bengal is not fl ushed. Siltation is a major threat that is even challenging the navigability of such big rivers. Thus the natu-ral processes of erosion and accretion, infl uenced by tilts and
shift of tectonic movements along with human interferences, like embankment construction, have made this dynamic del-taic system more complex, added to it is the threat of pre-dicted sea level rise. Because of this embankment the river is dissuaded from natural erosion and accretion process, for which many a time it is found some narrow channels like Durgaduani deepening and cutting its banks sharply and big rivers like Bidya, Thakuran silting heavily.
Figure 1a. Embankment ©hellio-vaningen 1b. Construction of em-bankment ©hellio-vaningen
Thus in present situation identifi cation of stable, accreting lands for af-forestation is a key task.
3.4 Tides
High tides and ebb tides occur twice daily and current chang-es direction every six hours. The spring tides which occur at vernal equinox (March / April) produce the maximum rise and fall as there is then very little current in the rivers. The tidal current passes from west to east. The velocity of tidal current increases in the northern part of the tract where the rivers are narrow and the maximum rise and fall occur where the speed is the highest. Near the sea coast the average rise and fall is about 2.15 m. While a south wind prolongs the period of the fl ow, the north wind shortens the same.
TABLE 3
SITE MAXIMUM TIDE MINIMUM TIDE
SAGAR 5.68 m 0.96 m
102 FACTS Reports

Scaling of mangrove afforestation with carbon fi nance to create signifi cant impact on the biodiversity – a new paradigm in biodiversity conservation models
4 Field Actions Science Reports
However as a rule the fl ow tide in estuarine system lasts a little more than the ebb tides. In the resulting effect, unless there is excess river energy from upstream fl ush, the decanta-tion of traction load sediments take place. Thus, these back-water channels are getting silted up day by day.
The tidal wave makes its way across the Sundarbans from west to east and consequently the tide changes earlier in the west than it does in the east. In large rivers the velocity of the current usually varies from 3 km an hour near the sea surface to 6.5 km an hour higher up in the forests. The speed increas-es further inland on account of gradual narrowing of river channels. The average rise and fall near sea face is about 2m further up it is 3m and where the tide has little or no stream to contend against, an average rise and fall of 5 to 6.5 m is common.
The heights of tidal variations on the mudfl ats are dependent on the accretion pattern, appropriate slope, bathymetry and these
are key for the selection of species on a particular mudfl at that extends even upto 500 m inside the river or lower but then ex-tends over a longer stretch even upto 10 km.
4. Plan for planting different mangrove species at different zones of mudfl at
4.1 Salinity
“The variation of salinity in pre-monsoon, monsoon and post-monsoon season shows signifi cant variations (Mitra et al, 2010). The surface water salinity values ranged from 8.66 psu (at Sagar, south in the western sector during 2010 mon-soon) to 26.59 psu (at Canning in the Central sector during the 2008 premonsoon). The salinity values were signifi cantly higher (p < 0.01) in the central sector compared to the west-ern sector irrespective of seasons and year (Table 5).
Table 4
HEIGHT OF WATER LEVEL AT HIGH TIDE NO OF DAYS IN A MONTH WHEN THE MUDFLAT IS FLOODED BY WATER AT HIGH TIDE SUITABLE MANGROVE SPECIES
Less than 4 m above sea level 30 days Porterasia coarctatqAvicennia alba
Less than 4-4.5 m above sea level 25 days Avicennia albaAvicennia marinaAvicennia offi cinalis
Less than 4.5- 5 m above sea level 20 days Sonneratia apetalaBruguiera gymnorrhizaRhizophora apiculata
Less than 5- 5.5 m above sea level 10 days Rhizophora apiculataSonneratia apetalaBruguiera gymnorrhizaXylocarpus granatumXylocarpus mekongenesisCeriops decandraAegiceras corriculatumHeritiera fomesExcoecaria agallocha
Less than 5.5- 6 m above sea level 2-3 days Sonneratia apetalaBruguiera gymnorrhizAXylocarpus granatumXylocarpus mekongenesisCeriops decandraAegiceras corriculatumHeritiera fomesExcoecaria agallochaPhoenix paludosaNypa fruiticans
More than 6 m above sea level Very occasional Phoenix paludosaCasurina marina
103www.factsreports.org

Scaling of mangrove afforestation with carbon fi nance to create signifi cant impact on the biodiversity – a new paradigm in biodiversity conservation models
5www.factsreports.org
Table 5. Salinity values in different sectors
A: Sagar South (Western Sector) / B: Canning (Central Sector)
SEASONS 2005 2006 2007 2008 2009 2010
A B A B A B A B A B A B
Pre-monsoon 26.10 26.50 25.12 26.00 29.11 26.59 24.04 26.08 23.58 25.95
Monsoon 09.16 10.44 09.02 09.65 09.30 09.98 08.76 09.90 09.08 10.02 08.66 10.13
Post-Monsoon 22.32 23.10 21.67 23.10 21.80 23.88 20.73 24.06 20.04 24.32
Seasonal variation of surface water salinity (in psu) in selected stations during 2005-2010 (Mitra et al, 2010)
Mangroves are typical inhabitants of brackish water envi-ronment and salinity is a major factor in growth and survival of mangroves and different species adapt in a different way to diverse saline conditions. Based on the physiological studies, Bowman (1917) and Davis (1940) concluded that mangroves are not salt lovers, rather salt tolerant. So selection of species is also guided by the salinity conditions prevailing in that par-ticular zone.
Table 6. Salt tolerance of species (Iftekhar et al, 2008)
SPECIESSOIL SALINITY (PPT)
WATER SALINITY (PPT)
SUCCESSIONAL STAGE
Avicennia spp. 7-9 85 Pioneer
Bruguiera spp 8-11 37 Mid-seralCeriops spp 7-13 72 Mid-seralExcoecaria spp. 5-17 85 Mid-seralSonneratia spp. 3-8 44 Pioneer
Xylocarpus spp. 3-10 34 Climax
4.2 Climate
Rainfall: Average annual rainfall is 1920.3 mm, humidity about 82% and is more or less uniform. Average annual tem-perature is 25⁰C.
The climate of Sunderbans is changing in a pattern consis-tent with the global climate change models and suggestions for India are:
• A rise of 2.3⁰ to 4.8⁰C in average for annual tempera-ture between 1980 and 2040.
• A long-term increase in the frequency of tropical de-pressions and cyclones. In the case of the North Indian Ocean it is estimated that the average number of tropi-cal disturbance days could increase from 17 to 29 per year by 2040 (Sundarban Development Board, 2003).
4.3 Flora and fauna
The Sunderbans harbors the most diverse mangrove ecosys-tem of the world with 26 True mangrove species, 29 Mangrove associates and 29 Back mangrove species supporting 40 Families, 60 Genera and 84 species. But it may be noted that although this largest mangrove chunk is quite pristine and protected in the core forested areas, it is all the more degrad-
ed in the inhabited areas. The Sunderbans mangrove ecosystem plays a vital role in
breeding and nursery phases of many riverine and marine species of commercial value. The nutrient rich muddy waters of mangrove vegetation provides shelter, food and spawning ground to innumerable species of fi nfi sh and shellfi sh. The Sunderbans fi shery comprises 18 prawn species, 34 crab spe-cies and 120 fi sh species besides 10 species of turtles. The ecosystem supports frogs and toad species, around 23 snake species and lizards, crocodiles and water monitor. Other di-versity include more than 200 species of birds and mammals like wild boars, spotted deer, porcupines, otters , monkeys. The food chain culminates in Royal Bengal tiger, which is a critically endangered species. Among the faunal distribution, 11 species are rare and endangered.
4.4 Human Settlements and socio-economic pro� le
Although there are evidences of human settlements in Sunderbans from 300 BC to 1200 AD, yet many a time popu-lation was wiped out due to extreme natural disasters. However sources of last human settlements date around 1700 AD. In 1756, when in battle of Plassey, the Nawab of Bengal was defeated by East India Company, the 24 Parganas was handed over to the East India Company. The company leased land to individuals in 1770 to reclaim land for cultivation and timber supply. Life was diffi cult in this salty marsh lands with dense forests and tigers and crocodiles; it failed to attract people from nearby districts to settle in Sunderbans. Forests were cleared, business for timber, honey, paraffi n , salt and fi sh grew. Santhals, Orao, Munda, Kurmi, Bhumij and other tribes came as labourers and gradually settle down. Settlers and embankments were built to sustain living on the sub-merged islands. Thus Sundarbans has a high representation of minority or less developed groups. Scheduled castes and tribes comprise 39% and 7% of the total population resp.
4.5 Population analysis and vulnerability
After Bangladesh war of independence, Sundarbans became choice of hundreds and thousands of political refugees and there was a sudden population splurge. Population growth is very high and is still continuing. As per 2001 Census, the total population of Sundarban region was about 3.7.million. The decennial growth rate during 1991-2001 was 17.4% against the state average of 17.77%. The population density as per 2001 census was 845 per sq. km which is more than the
104 FACTS Reports

Scaling of mangrove afforestation with carbon fi nance to create signifi cant impact on the biodiversity – a new paradigm in biodiversity conservation models
6 Field Actions Science Reports
average for rural West Bengal, reported as 676 per sq. km. The present population is 5.1 Million (2011 census). They have settled in 54 islands out of 102 islands in Sunderbans, the rest 48 are uninhabited and protected where no human activities except forest patrols are allowed. The inhabited is-lands are protected from tidal fl ows, twice each day by 3500 km long earthen unstable embankment, which happen to form the lifeline of the people of Sunderbans.
4.6 Employment pattern
“One of the characteristic statements used to describe the people of Sunderbans is that 85% of the people depend on agriculture. The proportion of the population without work in 1991 was 70% with only 3% in part-time or marginal em-ployment and 27% in main employment categories. Of the main employment, only 10% are employed in agriculture as cultivators and another 10% as labourers. Only 20% of the workforce is employed in agriculture. The Sundarbans, while having 85% of the population involved in agriculture is not as dependent upon this sector as claimed” (Sundarban Development Board, 2003).
Table 7. An analysis of income structure of the targeted community in two villages (plantation sites) in Bidya-Raimonogol zone
MONTHLY INCOME (RS) RAMCHANDRAKHALI JYOTISHPUR
500-1000 11.68 22.06
1001-1500 19.31 36.51
1501-2000 21.09 20.18
2001-2500 18.12 9.41
2501-3000 15.18 7.35
3001-3500 2.59 1.47
3501-4000 7.79 1.47
4501-5000 2.59 1.47
7501-8000 1.29 0.08
8000 and above 0.36 0
People are very poor with more than 41% living below poverty line. Scarcity of drinking water, saline ambience has made life more diffi cult. People are often found to be en-gaged in unsustainable livelihood practices like illegal fi sh-ing (without permit), crab collecting, fi rewood collection, venturing into forest for honey collection illegally. They risk their life and fall easy prey to tiger and crocodile .Women and children are particularly vulnerable towards Post Larvae (PL) shrimp collection The collection of PL shrimp by dragging nets along the mudfl ats just after the high tide recedes causes major health hazards , crocodile victims and also encourages illiteracy among the school children which is an opportunistic source of income for poor people .It also uproots the man-groves naturally collected on the mudfl ats and thus inhibits the process of formation of green belts in natural course . Besides ,each time a net is dragged and the collection taken in a utensil , the PL shrimps are sieved and the rest of the water
with seedlings of other fi shes/invertebrates are thrown away to die on the mudfl ats thus causing a huge biodiversity loss. There are an estimated 1500 to 3000 million PL collected per annum. For each PL collected, the by-catch mortality was es-timated to be 8 fi nfi sh seeds, 30 crab seeds, 150 other prawns, 1 mollusc seeds.
Many migrate outwards to seek opportunities in cities in Kolkata and even outside states (which increased at an alarm-ing rate after cyclone Aila, in May 2009).
4.7 Administration
The Sundarban Biosphere Reserve area is a multiple-use area where there are inhabited and deforested agricultural lands, industries, towns and protected areas. There are 19 commu-nity blocks which before 1883 were forests and are now com-pletely deforested and converted to many production related activities, associated settlements and agriculture.
Out of 9630 sq km, 2585 sq km is Sundarban Tiger Reserve and 1680 sq km of South 24 Parganas Reserved forests falls within protected area management under Sunderban Biosphere Reserve (SBR), Department of Forests, and Government of West Bengal. The Forest Protection Committees (FPC) in Reserve forest areas and Eco Development Committees (EDC) for wildlife sanctuaries are formal bodies of Joint Forest Management committees in Sundarbans between local communities and Forest Department for protection of nature and natural resources within the protected area.
Sunderban Affairs Department with a separate ministry also functions for the development of socio-economic stan-dards of Sundarbans, where Sunderban Development Board (SDB) is the major axis, with its offi ce at Kolkata.
5. Threats and challenges to afforestation programmes
5.1 Fragile ecosystem: factors of climate change
The increase in salinity has signifi cantly infl uenced the man-grove vegetation pattern, where we fi nd gradual replacement of Heritiera fomes (Sundari tree) on the western parts by sa-line dominant Avicennia species. But again specifi c preferen-tial adaptation of Excoecaria agallocha in the high saline central sector has been discussed and documented (Mitra et al, 2010).
5.2 Lack of documentation and monitoring mechanism
If we consider the several projects on Mangroves regenera-tion by Government and Non-Government Agencies over last twenty years, we fi nd there is lack of proper scientifi c ap-proach to methodologies adopted and also documentation of best practices or lessons learnt. They have been sporadic, fragmented and localized with a goal of “plantation” rather than restoration of the ecosystem, hence it missed the larger vision. Thus it resulted in practices of undertaking plantation activity in areas, without intense community participation
105www.factsreports.org

Scaling of mangrove afforestation with carbon fi nance to create signifi cant impact on the biodiversity – a new paradigm in biodiversity conservation models
7www.factsreports.org
and this, followed with poor monitoring mechanism and sus-tained vision of regeneration of forest, failed to produce the required result inspite of the large efforts.
Even in the Management plan of Sunderbans Forest de-partment 2001, there is no intense afforestation programme in the non-forest areas, as with limited funds and human re-sources they are more focused on conservation activities in the protected area. “Plantation of fresh water as well as man-grove plants are done in some of the degraded area. (…) Artifi cial planting had since then been discontinued within the protected area and natural mangroves had covered the areas. Artifi cial regeneration had however, been taken up on mudfl ats, streams banks and charlands in adjacent areas out-side Reserved forests though at a small scale and has been continuing” (Government of West Bengal, 2010).
5.3 Anthropogenic contributors
5.3.1 Shrinking of livelihoods and opportunities
Figure 2a. Fisherman ©hellio-vaningen 2b. Woman in a rice fi eld ©hellio-vaningen
The Government has taken intense programme on generation of income through self-help groups and it appears from re-searches in post-aila period that the dependence on unsustain-able use of ecosystems resources has increased .The general condition of life has not improved rather it appears to be more critical with shrinking agricultural options esp post-aila peri-od when the soil was under saline cover and the regular pad-dy yields decreased , scarcity of freshwater resources adding on to the woes of people. The fi sh catch has also remarkably reduced and changed with commercial catch decreasing (Mitra et al, 2009). Post-Aila period man-animal confl ict
increased as there were reported incidents of tiger attacks on human- killing and injuring many, because more and more number of fi shermen ventured illegally into core areas for an easy catch. Fish catch has declined considerably in the rivers outside the forests. This again brings forth, the importance of mangroves as breeding nurseries of fi shes and fi nfi shes.
Besides in post-Aila, there was a signifi cant migration to other parts of the states and even other states of India in search of menial labour works.
The need of the hour: Scaling of afforestation of man-groves and restoration of ecosystem in Sundarbans, engag-ing community and linking to sustainable business models
5.3.2 Evolution of the sustainable model
NEWS fi rst tried to manage a small plantation (estimated 20 ha) in Dulki opposite Sajnekhali Wildlife Sanctuary in 2006 under UNDP project with the EDC, during implementation of developing alternative sources of income among poor com-munity in the village. It was very successful and then in two phases NEWS implemented “mangrove plantation pro-gramme with community participation” in Amlamethi, Mathurakhand and Sonagaon village for an area of 80 (esti-mated) ha and 60 (estimated) ha with fi nancial support from British High Commission and ABN –AMRO Bank resp in the period 2007-2009.Nurseries were maintained by villag-ers, training were imparted, intense campaigns were raised. It really showed a new path of community model afforestation programme. Simultaneously livelihood promotional activi-ties were undertaken in the adjacent villages to create a sus-tainable ‘care and protection’ initiative for the mangroves .However , a sizeable portion of the plantation was lost when relief operations took place immediately after cyclone Aila and the two year old plants got trampled and ruined. However in Mathurakhand adjacent mudfl ats, the plantation has grown into thick forest.
6. Technical approach
Keeping in mind the fragility of this vibrant ecosystem and the threats and challenges, this initiative from Livelihoods, with NEWS as the implementing partner, addresses all the gaps and issues that we faced during our early programmes and develops a scientifi c approach towards a sustainable model of restoration of mangrove and allied ecosystem in Sunderbans.
6.1 Selection of sites
Science in practice: The accretion and erosion patterns along with a bathymetric fi gure of the rivers were considered and primary selection of plots were done. It was then analysed with landsat images of 1990 to check for existing vegetation. It meant qualifying the requisite CDM standards for large scale methodology for registration as a carbon project in UNFCCC. The socio-economic condition of the communi-ties living adjacent to charlands or mudfl ats were also
106 FACTS Reports

Scaling of mangrove afforestation with carbon fi nance to create signifi cant impact on the biodiversity – a new paradigm in biodiversity conservation models
8 Field Actions Science Reports
considered as this will mean an immediate boosting of the economy at the primary household level by engaging them in nurseries, providing training, making jute bags, taking part in plantation etc. The existing modes of Self-Help groups were taken into consideration for organizing them especially women.
The sites were on ‘charlands’ i.e. islands that emerged in the siltation process and also narrow but continuous patches along the mudfl ats that acted as ‘bio-shield stretches’.
Figure 3a. Replanting ©hellio-vaningen 3b. Watering plantations ©hellio-vaningen
6.2 Species selection and plantation techniques
The Important Values Index (IVI) indicates the structural im-portance of a species within a stand of mixed species. It is calculated by summing up of the relative percentages of basal area, density and frequency, each weighed equally for each species, relatively to the dimensions for the entire stand.
Therefore, Important Value of a species = relative den-sity + relative dominance + relative frequency IVI study undertaken in BALLY ISLAND OF Bidya raimongol zone.Table 8. Important values index for different species
SPECIES IVI
Avicennia marina 129.5
Avicennia alba 128.8
Avicennia offi cinalis 116.6
Important Value Index parameters were calculated on the basis of surveys of the existing vegetation on the selected mudfl ats and the predominant species were valued. Besides
the project being in a multi species scenario, other species were also selected as per the slope of the mudfl ats.
The propagule collection is never easy. From mid-February the seedlings of Rhizophora sp fi rst starts coming followed by Excoecaria sp in Late June , Avicennia Marina in June-July , Bruguiera sp in July-August , Aegiceras sp in July-August , Avicennia Alba from August till October , Sonneretia sp in September. Although the pattern varies with the mon-soonal onset but the arrival of seedlings more or less has the following course. The phenology pattern is also part of the monitoring process.
Table 9
SAPLINGS PLAN : 2011-2012
NURSERY
ZONE SITE SAPLING JUTE BAG
Bidya Raimongol jyotishpur 110000 100000
Bidya Raimongol Balli 140000
Bidya Raimongol Pearatolla 100000
Matla Nikarighata 100000
Matla Kanthalberia 100000
Matla Purandar 105000 100000
Sagar Patibonia 600000 200000
Sagar Rudranagar 500000 200000
Sagar Ramkar Char 500000 200000
Sagar Muriganga II 200000
Sagar Muriganga I 100000
Saptamukhani-Thakuran
Sridharnagar 200000
Saptamukhani-Thakuran
Sitarampur 200000
Saptamukhani-Thakuran
Upendranagar 150000 100000
TOTAL 3105000 900000
The avicennia sp is quite common and for all other species , the seeds that drifted along with the tidal waters into the vil-lage sides were collected by the community and plantation took place by direct seed rowing (avicennia and in some cas-es bruguiera) . For the other species, they are maintained through nurseries. However avicennia is also maintained in nurseries as the mortality for direct seeds plantation hap-pened to be almost 48-52% .In case of plantation through nursery raised saplings, the mortality rate was calculated to be 75-80%.
The cost of nursery raised saplings is higher. For a cost-effective model, the plantation was done in the ratio of 30% saplings and 70 % direct seed plantation.
It is beyond doubt that if jute bags are used in nurseries, it is a more eco-friendly viable option. The jute bag degrades naturally and mixes with the mud, also adds nutrients and strengthens the adhesion capacities, if the sapling is placed in
107www.factsreports.org

Scaling of mangrove afforestation with carbon fi nance to create signifi cant impact on the biodiversity – a new paradigm in biodiversity conservation models
9www.factsreports.org
the pits with the jute bags. It also helps reduce the threading away of fragile roots during transplantation time from ‘pots to pits’. In polypack pots the polythene has to be torn off very carefully and there is always chances of damage of the roots, which are crucial for the proper growth in the initial stage. A simple table chart of root-shoot ratio shows that the man-groves especially avicennia sends clusters of roots, appre-ciable larger than the shoot in the fi rst three months to stabi-lize themselves in the tidal wave energy system. So, jute bags: polypackets ratio is 25: 75 among the nurseries.
6.3 Plantation Establishment Techniques
After identifying the planting site and species, the socio and biophysical attributes, it was necessary to determine what needs to be done to prepare the site , as it often needed some preparation prior to planting. This may include clearing the areas of fern or other weeds (brush), removing standing dead wood that will shade out the area and removing debris. Also evaluating the planting block size, a sharp eye is kept out for areas where people or boats commonly transit. This informa-tion contributes to developing a sketch map of the area.
6.4 Planting organization, area and spacing
Several organizational ideas can be used in planting.
6.4.1 Inverted V shape
An inverted V shape spacing with the point of the V facing the sea defl ect wave impact. Spacing should be less than 0.5 meter. Planting may be done in triangle formation with one of the corners of the triangle pointing seaward. Spacing in be-tween triangles is less than 1 meter and cluster planting may also be done. It is done to act as a wave break. To maximize survival, spacing is made much closer (25x25 centimeters). After 2-3 years, when the clusters are fully established, the gaps can be created for proper growth through a wise man-agement. Even temporary inverted V-shaped bamboo struc-tures were put up to dissipate the wave energy.
This is tried in Rudranagar area of Sagar, where the wind-wave energy from the South-western part of Sagar pounced heavily on the Western part of the island and plantation by other agencies failed several times due to lack of proper tech-nical approach.
Santi Ranjan Mondal, the Upo-Pradhan of the Ramkar Panchayat Samiti of the Sagar Island iterates: “I have seen that for last four years social forestry tried plantation several times here but they failed. It is NEWS who could sustain the plantation for more than a year.”
6.4.2 Strip Planting
The same principle applied in strip planting. Strips (10 or 20x100 or 150 meters) are established at very close spacing to withstand strong waves. Once established, the open areas between strips and shoreline may now be planted at a wider spacing, like in most of the planted sites of Bidya-raimongol, Saptamukhani-Thakuran and Matla.
In some areas where the upper shoreline has become stiff and unsuitable for plantation, the strip plantation is done with avicennia species in lower shoreline and silt thus trapped in the upper shoreline made it ripe for plantation in the coming year.
6.4.3 Seedling density or spacing
Channels of size 1 ft wide & 1 ft deep and 5 ft apart parallel to river fl ow is dug in the month of July for collection of silt to enable the seeds/plants to get new alluvium , after one and a half month of which the mudfl ats became ideal for planta-tion of seedlings.
The areas being island chars and lowlying, channel dug management is not considered. In the initial stage plantation is directed to obtain a plantation density of 4000 per ha. Considering the mortality, this spacing will produce a planta-tion of density 2500-3000 plants per ha, an ideal for optimiz-ing carbon sequestration rate.
A common practice responsible for high mortality rates in mangrove planting is the sowing of propagules more than half their length in the soil. This is done because people be-lieved that waves would dislodge the propagules, if planted too shallow. Propagules show lenticels that exchange air. Burying propagules too deep will render the lenticels useless, carrying a slow death to plants. Generally propagules are sown one third of their length in fi rm substrate and one half of the length in soft substrate.
6.5 Map
The boundary of the entire plantation site was mapped by walking with the geo-positioning satellite (gps) around the plantation area. It was then interpreted in a google earth map and kml fi les generated. It is a tedious task to delineate the boundaries in diffi cult muddy terrain, but it is crucial for the area management for a CDM project. This technique of plan-tation area management is used in mass scale for the fi rst time in Sunderbans and will defi nitely set a role model to create transparency and avoid duplication and overlapping of plan-tation sites. This map forms the backbone of the project plan as any referencing with respect to monitoring can be done with this plan map.
6.6 Care and Maintenance of Plantation
Like any new borne, the fi rst 2 years after the establishment are probably the most instance phase of care of plantation. Generally, from the 3rd through the 4th year the level of the care is somewhat less, when disease spread should be checked.
A typical monitoring structure Zone: Saptamukhi-ThakuranName of the Species: Avicennia albaSite: SitarampurSonneratia griffi thiArea –134 ha
108 FACTS Reports

Scaling of mangrove afforestation with carbon fi nance to create signifi cant impact on the biodiversity – a new paradigm in biodiversity conservation models
10 Field Actions Science Reports
Table 10
SL. NO. QUADRATE LOCATION NO. OF PLANTS/ 100 SQ. MT.
HEIGHT OF THE PLANT(IN CM) REMARKS
1 21040’59.26˝N, 88022’52.34˝E 44 12 Proximal Zone
2 21040’62.50˝N, 88022’54.46˝E 43 14 ,,
3 21040’62.14˝N, 88022’55.24˝E 42 15 ,,
4 21040’63.55˝N, 88022’56.60˝E 42 16 ,,
5 21040’64.10˝N, 88022’56.87˝E 41 15 ,,
6 21040’62.3˝N, 88022’68.6˝E 43 14 ,,
7 21040’66.0˝N, 88022’69.6˝E 42 14 ,,
8 21040’67.8˝N, 88022’71.1˝E 62 16 ,,
9 21040’63.4˝N, 88022’69.8˝E 41 15 ,,
10 21040’64.2˝N, 88022’69.9˝E 42 15 ,,
11 21040’64.6˝N, 88022’69.2˝E 43 14 Distal Zone
12 21040’64.8˝N, 88022’69.3˝E 44 13 ,,
13 21040’65.2˝N, 88022’69.4˝E 42 12 ,,
14 21040’65.9˝N, 88022’69.5˝E 43 15 ,,
15 21040’66.3˝N, 88022’70.0˝E 55 16 ,,
16 21040’66.6˝N, 88022’70.4˝E 57 17 ,,
17 21040’67.1˝N, 88022’70.60˝E 60 17 ,,
18 2104067.3˝N, 88022’70.8˝E 60 18 ,,
19 21040’67.5˝N, 88022’70.85˝E 61 17 ,,
20 21040’67.7˝N, 88022’71.0˝E 62 18 ,,
TOTAL 969 303
Average number of plant/100 sq.mt: 48.45 Average number of plants/1ha (10,000 sq. km.) = 4845Average height of the plant (in cm): 15.15 cm Age of the plants – 5 months
The 6th through the 15th years sees a period of relatively low maintenance.
The 16th through 19th are typically on lower maintenance. By the 20th year possibly the growth is over.
6.7 Removal of branches and other pests, uprooting and replacements of sick or dead plants
Regular visits especially at low tides and intense guarding of the area with community mobilization is an integral part of the maintenance process. Checks should be made so that if a large number of green algae fl oats into the area, regular visit will be able to remove it before it can do much damage. Other debris that might adversely affect the seedlings include piec-es of driftwood, fi shing nets and other heavy naturals or ex-cess silt deposition that can knock over the seedlings or dam-age them.
6.7.1 Common threats
1. Encrusting organizes like barnacles - The shells must be removed by hand once the organism is carefully scrapped off and simple throwing in water will dis-
pose them off as they cannot attach again.
2. Insects and moth larvae eating leaves or damaging roots - These organisms are much easier to remove than barnacles. It should be plucked from the leaves, trunks and branches of the seedlings, placed in a bag and removed from shore for disposal, simply throwing it in the water may allow them to reach another tree.
3. Dead or dying plants - Dead or dying trees should be quickly removed from the area. If seedlings are dying in large numbers, it is important to determine why?
4. Plants entangled in green algae or other debris- to be removed immediately manually.
6.7.2 Natural threats
Hailstorms can damage the axil part of a 2-3 year growing tree and eventually the plant dies. Excessive siltation covers up the lenticels of newly born plants which fail to breathe and die. The southwest winds in the spring time many a times take away lot of deposited silt and the avicennia on the lower shoreline suffers.
109www.factsreports.org

Scaling of mangrove afforestation with carbon fi nance to create signifi cant impact on the biodiversity – a new paradigm in biodiversity conservation models
11www.factsreports.org
6.7.3 Anthropogenic threats
Prawn seed collection, grazing of cows, goats and irregular fi shing and boating activity destroys the newly-sprouted plants. Support to the distressed community with regards to livelihood options reduces the vulnerability of the prawn seed collectors who are discouraged to go for this income option. Supply of fodder grasses that are easily and quickly grown in small plots in homestead , utility of stall feeding of cows and campaigns among local people , fi shing folk about the importance of mangrove regeneration are carried out .This enables community participation and mobilization which are key for the success of the project.
Thus, to our experience the plantation process of man-groves in Sunderbans in the fi rst two to three years is never a steady graph and continuous mending, re-planting is re-quired to stabilize it.In the process the community especially the women group is not only economically benefi ted but they learnt the typi-cality of mangroves, their adaptive nature and also the tech-nicality of their rearing and maintenance. Besides it also gives them a sense of pride bearing the onus of a socially important work.
6.7.4 Partnerships at the highest level
Partnerships at key level were maintained with Institute of Environmental Studies and Wetland Management (IESWM), Kolkata a unit of Department of Environment, Govt of West Bengal and nodal actor of the Integrated Coastal Zone Management (ICZM) project of Govt of India. The site se-lection, CDM eligibility and bathymetric data were
analysed by their Senior Geologist cum Remote sensing specialist. All the trainings of area delineation at communi-ty level were provided by Unique-Landuse, a forestry sup-port initiative.
Panchayats are the institutions of the Government at local levels who are integrated with the project at local decision-making stage. In the process, they are also accustomed with the scientifi c approach of mangrove afforestation pro-grammes. Local Panchayats involved in the project are 43 till 2012 plantation.
Sunderban Biosphere Reserve and Wildlife Wing under Department of Forests, Government of West Bengal are in close association and updated about the project implementation.
The Joint Director, Botanical Survey of India – the lead centre for Sunderbans for Government of India is advisor to the project on species selection, establishing site plantation techniques, building monitoring parameters.
Lack of proper data availability, even of the Department of Forests, Government of West Bengal shows the lacunae in monitoring of mangroves planted, year after year. The monitoring mechanism over ten to twenty years of time are itself going to produce good scientifi c data that can act as base papers for further research activities . Livelihoods, who earns the carbon credits are the investors for the proj-ect. If the project chooses CDM standards, then carbon credits should correspond to 500,000 tonnes of CO² .If the project generates additional carbon credits, 50% of these additional carbon credits shall be transferred to Livelihoods, and the remaining 50% shall be transferred to the commu-nity. Carbon fi nance, in its folded design encompasses a sustainable business model for meeting biodiversity needs especially in afforestation sectors.
Table 11. Community participation: a glimpse
WOMEN IN NURSERIES -2010 TO 2012
ZONE SITE No of Self-help groups worked in nurseries
Total no of women
Bidya Raimongol BALI 16 GROUPS 180
Bidya Raimongol AMLAMETHI (WEST) 17 GROUP 248
Bidya Raimongol AMLAMETHI (EAST) 16 GROUPS 440
Bidya Raimongol RAMCHANDRAKHALI 18 GROUPS 200
Matla KATHALBERIA 11 GROUPS 165
Matla NIKARIGHATA 20 GROUPS 200
Matla JOTISHPUR 35 GROUP 350
Matla PURANDER AND BHARATGARH 30 GROUPS 300
Matla KAIKHALI 13 groups 150
Matla GORANKATHI 16 GROUPS 200
Matla MERIGANJ 2 7 GROUPS 100
Saptamukhani-Thakuran SITARAMPUR 35 GROUPS 420
Sagar SAGAR 57 GROUPS 684
Saptamukhani-Thakuran UPENDRANAGAR AND SRIDHARNAGAR 16 GROUPS 240
3877
110 FACTS Reports

Scaling of mangrove afforestation with carbon fi nance to create signifi cant impact on the biodiversity – a new paradigm in biodiversity conservation models
12 Field Actions Science Reports
7. The Future
Figure 4. Women portraits ©hellio-vaningen
To extend this business model further into forest and wetland conservation projects, the REDD+ is a good mechanism that gives enough scope not only to restore degraded lands but also prevent further degradation of forested lands. However
the investors should believe in the “cap and trade policy” for reducing greenhouse gas emissions for our planet to exist, thrive and grow.
Table 12
AGENCY YEAR AREA PLANTATION BUDGET
TSRD 2007-08 541 676 MAN DAYS http://www.tsrd.org/dnd.php?dndfi le=pdf/AnnualReport.pdf
TSRD 2010-11 495 http://www.tsrd.org/dnd.php?dndfi le=pdf/annualre-port10-11.pdf
*SDB/SOCIAL FORESTRY
2007-08 18000000 http://www.sadepartmentwb.org/Annual_Plan07-08_SocialForestry.htm
NEWS 2009-11 1400 12569161 Annual Report
*These plantation include both forest & non forest land
TSRD – Tagore Society for Rural Development is the biggest agency working in social development sector in Sundarbans
111www.factsreports.org

Scaling of mangrove afforestation with carbon fi nance to create signifi cant impact on the biodiversity – a new paradigm in biodiversity conservation models
13www.factsreports.org
LegendVILLAGE BOUNDARYAQUACULTURE PONDAGRICULTURECREEKHABITATION WITH VEGETATIONBOUNDARY OF MANGROVE FOREST AS ON DECEMBER, 1989BOUNDARY OF MUDFLATAS ON DECEMBER, 1989
MANGROVE FORESTAS ON 2006PLANTATION OF MANGROVEAS ON 2006MARSHY AREAMUDFLATOPEN/VACANT LANDRIVERTERRESTRIAL VEGETATIONWATERLOGGED AREA
DATA SOURCE: LANDSAT IMAGE 1989, DATED 26 TH DECEMBER & , IRS P6 2006, 24 TH FEBRUARY. SURVEY OF INDIA TOPOGRAPHICAL SHEET NO : 79B/12 & 79B/16 VILLAGE MAP
DISTRICT : SOUTH 24 PARGANASBLOCK : GOSABAG.P : BALLY I
LUCC MAP (BASED ON 1989 SATELLITE IMAGE) AROUND PROPOSED MANGROVE SITEWITH SUPERPOSED PLANTATION AREA (AS PER 2010)
88˚42’0”E 88˚43’30”E
88˚42’0”E 88˚43’30”E
22˚6’0”N
22˚4’30”N
22˚6’0”N
22˚4’30”N
N
B I D Y A R I V E R
JHARKHALI COLONY
BIRINCHIPUR
RADHARANIPUR
MATURAKHANDA
AMLAMETHI
DIGHIRPARDIGHIRPAR
Figure 5. CDM eligibility maps used in the initial stage for Bali charland in Bidya-Raimongol zoneScaling of mangrove afforestation with carbon fi nance to create signifi cant impact on the biodiversity – a new paradigm in biodiversity conservation models
14 Field Actions Science Reports
5. REFERENCES
Bowman, Mangrove regeneration and management, 1917.Davis, J.H. The ecology and geological role of mangroves in Florida,
Pap Tortugas Lab (1940) 32:303-412.Government of West Bengal, Department of Forests, Management
plan of Sunderbans, 2010.Iftekhar et al. (2008). Vegetation dynamics in the Bangladesh
Sundarbans mangroves: a review of forest inventories. Wetlands Ecol. Manage. (2008) 16:291–312.
Mitra, A., Chowdhury, R., Sengupta, K. and Banerjee, K., Impact of salinity on mangrove of Indian Sundarbans, Journal of Coastal Environment (2010) 1:71-82.
Sundarban Development Board, Kolkata, republic of India and the Asian Development Bank, Conservation and Livelihoods im-provement in Indian Sundarbans, ADB IA no.3/84 IND – Interim report – Volume 1, May 2003.
Section 4: Agricultural Projects with Co-Benefits
112 FACTS Reports

Section 4: Agricultural Projects with Co-Benefits
©hellio-vaningen

114
SECTION 4:
AGRICULTURAL PROJECTS
WITH CO-BENEFITS
Forging a template for sustainable rural development – the Araku wayDavid Hogg and Diana Joseph Naandi Foundation’s project
Scaling up Agroforestry to Achieve Food Security and Environmental Protection among Smallholder Farmers in Malawi T.L. Beedy, O.C. Ajayi, G.W. Sileshi, G. Kundhlande, G. Chiundu and A.J. Simons ICRAF’s project
Developing jatropha projects with smallholder farmersConditions for a sustainable win-win situation for farmers and the project developer Anne-Claire Degail and Julien Chantry Eco Carbone’s project

Forging a Template for Sustainable Rural Development- The Araku Way
David Hogg1 and Diana Joseph2
1Director of the Araku Integrated Livelihood Programme & Chief Sustainability Offi cer, Naandi Foundation. Email of corresponding author: [email protected]
2Deputy Manager, Livelihoods, Naandi Foundation
Abstract. India, as in most parts of the world, suffers from forest depletion. The marginalised communities dependent on these forests for their sustenance and well-being are the most affected. The Forestry Department’s post-colonial regulations further exacerbate the plight of these people – they have long since lost their sense of shared custodianship of forest and as consequently their nutrition and livelihoods are severely challenged. Under these stressful circum-stances there is no incentive to preserve or restore the remaining forest cover.
This trend needs to be reversed. This programme outlined is designed to facilitate bringing forests and forest ecosys-tems to these communities within their own lands. It is this template that is designed to be implemented as the liveli-hoods and nutritional security panacea. The Adivasi community in Araku already has a robust food cropping rhythm that is subsistence by nature. However the realities of modern life mandate that there is suffi cient cash income for health, educational and other purposes. In consultation with the Adivasi community Naandi Foundation evolved a horticultural development template on marginal, unproductive community lands to enrich their local nutrition, their ecosystem and augment the farmer’s disposable income.
The Araku Valley Livelihood Programme [Naandi Foundation/Livelihoods Fund/Mahindra social enterprise initia-tive] aims to demonstrate and evolve this template in the tribal communities of Araku nestled in the northeast region of the state of Andhra Pradesh adjacent to Orissa. Here in this mineral rich eastern mountain range of peninsular India this social enterprise partnership with the Adivasi (original inhabitants) community is creating a community portfolio of fruit and forest trees that will sustain a healthy carbon rich ecosystem and new found prosperity.
Naandi Foundation has been working in the fi eld of education, health care and coffee with the Araku marginalised communities since 2001. Naandi assisted the community with their coffee plantations to ensure the quality was up-graded and they got good access to markets for their produce. In 2010 Araku tribal farmers evinced interest in restoring their ecosystem by restoring forests of fruit trees that would yield nutritious fruits and cash income from the sale of the extra produce. In collaboration Naandi /Livelihoods Fund/ Mahindra and Mahindra and the tribal community drew up a plan to plant out 6000 hectares of fruit, forest and coffee trees over a fi rst phase fi ve year period pre-fi nanced by the Livelihoods Fund and Mahindra.
Naandi is facilitating the supply of the quality trees, assisting in establishing local tree nurseries, training farmers in horticulture while the community provides their marginal lands and pledges their time for planting and protecting the trees. Despite logistical issues of coordinating 300 village communities and collecting baseline and GPS data the pro-gramme is now successfully into its third year. So far 2.4 million trees on 6000 hectares have been planted and nurtured successfully. The entire tree planting will be completed 2012/13 after which over a 2 year period till 2014 monitoring and assessment mechanisms will be developed to ensure the sustainability of this 20 year programme. Coffee saplings are to be planted in year four and fi ve ie 2013 & 2014.
The goal is sustainable livelihoods pre-fi nanced by anticipated carbon credits. It is an integration of community mo-bilisation through village development committees, agro-forestry and LEISA agronomical practices. By providing initial support to this tribal agricultural community the aim is to make viable its artisanal farming. This support is multi-fold – in equitable market access, in nutritional support/advice especially for mother and child via education initiatives, through support for affordable energy, and access to fi nance – this cultural change we call the “Araku Way”.1
Key words. Adivasi, carbon credits, global positioning system, GPS, low external input sustainable agricul-ture, LEISA, livelihoods, Patta, village horticultural coordinator, VHC, village development committee, VDC, millennium development goal, MDG
1 The Araku Way concept is articulated in India’s Sustainable Development Model - A Framework for Local Nutritional Secu-rity (Mathai & Hogg), a Strategy Paper for Indian rural development 2010-2015.
© Author(s) 2013. This work is distributed under the Creative Commons Attribution 3.0 License.http://factsreports.revues.org/2424Published 3 April 2013
115www.factsreports.org

Forging a Template for Sustainable Rural Development - The Araku Way
2 Field Actions Science Reports
1. Introduction
About 8 percent of the Indian population belongs to a category listed as “Scheduled Tribes” enumerated in the Schedule to Article 342 of the Constitution of India (Census of India, 2011). It is one of the poorest, most undereducated, and most deprived groups in the country, with illiteracy rates and pov-erty rates about twice those of the national average, despite the protection guaranteed to them by the Indian Constitution.
Mostly rural (+90%), the tribals (known as Adivasis or “original inhabitants”) have been traditionally associated with the forests, hills and remote areas, practising a unique life style, having a unique set of cultural and religious beliefs.
Andhra Pradesh, a state in South India, is home to 33 tribal communities constituting 6.75 percent of India’s total tribal population. Although the state’s tribals comprise only 6.59 per-cent of the state’s population, they account for the largest tribal concentration in Southern India and are spread across 6000 vil-lages in nine districts. This zone forms the traditional habitat of 30 tribal communities.
Figure 1. Araku valley © hellio-vaningen
In some districts the tribal population is spread thinly and they live along with non-tribal communities. The indigenous tribes are mostly concentrated in contiguous tracts of the nine districts that have been designated as scheduled areas adminis-tered by the Integrated Tribal Development Agencies (ITDAs).
Visakhapatnam districts is the home of about 19 tribals groups and second largest district in tribal population size in the state. The Agency area consists of the hilly regions covered by the Eastern Ghats with an altitude of about 900 metres dot-ted by several peaks exceeding 1200 metres.
In Araku too, the tribals are in a transition phase from a for-est centred lifestyle to a rural, settled cultivation lifestyle, but the production from agriculture is not commensurate with the food requirements, while the scope for supplementation by way of intake of natural foods is diminishing due to depletion of the forests.
Recognising this, tribal development strategies need to go beyond the obvious land-based livelihoods and should aim to innovate on these practises. Introduction of land-use options that increase resilience and reduce vulnerability of the tribals is
fundamental to livelihood improvement and adaptation to en-vironmental change. Therefore, agroforestry as a land-use ad-aptation can provide livelihood improvement through simulta-neous production of food, fodder and fi rewood as well as mitigation of the impact of climate change.
Drawing on this, Naandi Foundation (See Appendix) in col-laboration with the local tribal community, funded by the Livelihoods Fund2 and Mahindra3, designed a multifunctional agroforestry system in Araku providing the tribals with nutri-tional security, a potential option for livelihood improvement, climate change mitigation and biodiversity conservation.
Non Government Organisations like Naandi fi nd it increas-ingly diffi cult to get up-front funding for rural development projects especially in agriculture. Even Corporate Social Responsibility Funding is rare in this sector. But the need is great and fundamental for rural communities like the Adivasi Tribals for they have no access to markets and very little sup-port for their subsistence agriculture especially in upgrading cultivation technique and investing in primary processing and effective storage. The pre-fi nancing model of the Livelihood Fund and its support from the Livelihood Network (www.live-lihoods.eu) is therefore a welcome innovation and promises to be a game-changer in the rural development front. The latest of sustainable agricultural techniques can be shared with these vulnerable communities and both nutritional security crops and cash crop yields can benefi t.
The accent and thrust of the programme is Livelihoods op-portunities and the 20 year carbon fi nance element assures that support for the community is not just for 5 years but persists for a full 20 years. This allows the community time to “stand on its own feet” and begin developing its own self reliance and social and business entrepreneurship. Critical to this model is the choice of trees – they are revenue generating fruit and tim-ber trees along with judiciously chosen nutritional trees like papaya and drumstick (moringa oleifera). Intercropping with medicinal herbs and vegetables is also supported. The fruits of this functional forest belong to the community of farmers and the programme has a built in guarantee to assist the community sell their produce at a fair price. The programme is organically and fair trade certifi ed assuring a further dividend to farmers. This uniquely symbiotic relationship is the key to its success.
2. Programme Objective
The overall goal of the programme is to improve the liveli-hood of small and marginalized tribal communities in the Araku Valley of Visakhapatnam district in the state of Andhra Pradesh in India. The programme will turn a low
2 Livelihoods Fund is a unique carbon investment fund that mobilizes companies, fi nancial institutions, and large foundations to invest their money in a mutual fund. The Fund uses this money to fi nance the programs in the fi eld. In return, the investors will get carbon cred-its to offset their own C02 emissions or sell the credits if they are not interested in carbon offsets.
3 Mahindra is an India based multinational company with a presence in automotive industry, aerospace, aftermarket, components, consulting services, defense, energy, fi nancial services, logistics, real estate, retail, and two wheelers. Mahindra contributes via its national Corporate So-cial Responsibility funded “Haryali” (Greening) Programme. Mahindra is not associated with the carbon credits element of the programme.
116 FACTS Reports

Forging a Template for Sustainable Rural Development - The Araku Way
3www.factsreports.org
carbon landscape into a high carbon multiple use landscape improving food security and generating additional income for the community. The programme area will cover 6,000 ha, comprising 300 villages reaching out to over 100,000 tribals (25000 familiies) and 6 million trees (3 million fruit & timber trees and 3 million intercropped coffee saplings) will be planted.
Based on ex-ante estimates the programme will sequester the following amount of carbon (tree/ shrub biomass carbon and soil carbon)
Total carbon off sets (20years) 1,330,791tCO2-e
Annual carbon off sets (tCO2/year)
66,540 tCO2-e
Carbon sequestration rate (tCO2/ha/year)
11.1 tCO2-e
The carbon credits are reserved for the Livelihood Fund as per the contract while all products from the fruit and tim-ber forest belong to the farmers and community.
The tribal communities living in the programme area are Bhagathas, Valmikies, Kamaras, Porjas and Kondhs. They converse in a dialect of Adivasi Oriya and Kui. The area is very secluded and still many of the villages are inaccessible by vehicles.
The livelihoods of the tribal communities in the region have a distinct set of economic characteristics which differ widely from the plains adjoining this area of Visakhapatnam, with respect to climate, soil, rainfall, habitat, fl ora, and fau-na. Subsistence agriculture is the primary livelihood for nearly 99% of the tribes and special characteristics are:
• Rainfed agriculture (for food crop security) within their titled lands around the village. The crops com-monly cultivated are traditional paddy (rice), millets, sweet potato, vegetables and pulses. (The destruc-tive slash and burn practice on hill slopes, known as Podu cultivation, is now declining.)
• Gathering of Non Timber Forest Products eg honey, medicinal herbs etc
• Cattle and backyards gardens.
The current annual average income of households in the region ranges between INR.15, 000 to INR 18, 000 (USD 350-400) (Reddy et al., 2010). Indiscriminate Podu cultiva-tion in the past has resulted in barren lands with increased soil erosion leading to environmental degradation has con-tributed to poverty and deprivation in the area. Dependence on forest and land has become extremely diffi cult for the tribal way of life. The rate of growth in population and di-minishing forest cover makes the community extremely vulnerable.
Therefore, an integrated, holistic development approach revolving around building their local resources and skills to improve the agriculture and Non Timber Forest Produce [NTFP] needs to be adopted to address the issue of tribal poverty and build their economies.
3. Programme Implementation
The fi ve year programme began in June 2010 and this fi rst phase will be completed in June 2014. The remaining 15 years will be governed by renewable monitoring contracts between the community, Naandi and the Livelihood Fund/Mahindra.
Like all other developmental interventions of Naandi, this programme activity began with a process of social immersion. Naandi has been working with this community for more than a decade in health care, education and coffee production/market linkage so mutual respect and trust is strong. Several months before the programme activity began, the Naandi staff consult-ed with the marginal tribal farmers understanding their prob-lems and their situation and identifying suitable marginal plots unconnected to their existing food crops lands. The pro-gramme implementation is explained in the steps below.
3.1 Village Sensitisation Process
Naandi made use of its established partnerships and institu-tional set -up with farmer groups to spread word about village level meeting to discuss the Horticulture programme. In par-ticipatory community meetings, the purpose of this pro-gramme, its major objectives and possible impacts were in-troduced. The eligibility criterion were also explained and discussed with the villagers (non-forest condition, degraded land). After intense discussions and consultations with the village assembly, suitable plantation plots were jointly identi-fi ed for each village.
3.2 Participatory village land analysis and Identifi ca-tion of land
An intensive stakeholder consultation was then carried out following standard participatory rural appraisal (PRA) meth-odology. Facilitated by the Naandi staff, farmers participating in the programme joined in a group based analysis to sketch each village showing details concerning different land use, land use changes over the last 20 years and the identifi cation of the planting plots. The village sketch (Figure 1) was jointly elaborated using visualization techniques. Using a set of questions related to the general information on the whole vil-lage, the Naandi team collected details like the annual crop-land, 6-months cultivated cropland, 3-months cultivated cropland, access to roads, location of watercourses and hills, location of forest and, if changed the location of forest in 1990, the main cropping systems, specifi c identifi cation of degraded land, the exact location of the programme planting plots within this identifi ed village land, basic information on households and livestock etc.
117www.factsreports.org

Forging a Template for Sustainable Rural Development - The Araku Way
4 Field Actions Science Reports
Village Land Use SketchDate Mandal Village Village ID No. of plots No. of Acres Total Acres
Planting Site / Plot
Hills
River
Annualcropland
30/09/2011 Pedabayalu Thadiputtu
Degrading Land
Degrading LandNorth
Permanent fallow land 6 ac
Rice 4 ac, Millets 3 ac,Marigold & Groundnut 1 ac
Millets 1 acRice 7 ac Fallow
grazing land4 ac
Turmeric & Piper longum 2 ac,
Ground nut 1 ac
Marigold 4 ac, Millets 1 ac
Turmeric 3 ac,Groundnut 1 ac
Beans 2 ac,Per.fallowland 4 ac,Grevilia+Coffee16 ac
Beans 2 ac, Per.fallow land 40 ac, Grevilia+Coffee 20 ac
Marigold 2 ac
216 5 20 212
6 monthscropland
3 monthscroplandB
A
E
C
D
HH 36Livestock145
Road
Forest &
Graz
ingland 88
ac
Figure 2. Land Use Sketch of Thadipattu Village
3.3 Participatory Field Assessment
After the group-based analysis, the Naandi team together with the farmers participating in the programme assess the plots in the fi eld. For this, a set of plot specifi c questions are analyzed including the testimony whether plot was forested in 1990. After this, each farmer participating has to confi rm the village and plot specifi c analysis with his/ her signature. The Naandi team also verifi es the title of the land by referring to the ‘patta4’. The plots are geo-referenced and the details noted down in the survey questionnaire.
3.4 Village Horticulture Coordinators
The Naandi team identifi ed an active tribal farmer, part of the programme, from each village as a Village Horticulture Coordinator (VHC). The role of the VHC is to mobilise the community and facilitate activities of the programme. The VHCs went through a capacity building process to emerge as key resource personnel for driving the programme agenda. Exposure visits, training, linkages with relevant institutions and government bodies formed part of this process.
3.5 Formation of Village Development Committee
The VHC, along with local village leaders and programme farmers formed the Village Development Committee (VDC) in each village. The VDC mobilises the farmers to share the responsibilities of clearing the land, digging the pits, apply-ing the manure, collecting and planting the saplings, harvest-ing water, constructing tree guards, fencing the plots and
nurturing and protecting the young saplings. Thus, creating a sense of ownership among the benefi ciaries by involving them in every stage of the programme implementation – to ensure its and sustainability thereafter.
3.6 Sapling Identifi cation
A scientifi c methodology (species suitable to the soil and cli-matic conditions) was followed for selection of trees. Farmers part of VDCs as well as horticultural/forestry experts were also consulted so as to maximize the yields and survival rate, keeping the overall aim of the programme i.e. carbon seques-tration and improving the income of the farmers, in mind (Table 1). It was also ensured that trees which were selected had a fruit bearing time/ maturity time between 8 months (Papaya) to 20 years (Teak) so that the farmers do not lose interest in the plantation.
Table 1. Tree species and varieties planted
Treespecies Common name
Mangiferaindica Mango
Bambusaarundinacea Bamboo
Tectonagrandis Teak
Psidiumguajava Guava
Annonasquamosa Custard apple
Citrus sinensis Sweet orange
Citrus aurantifolia Lemon
Emblica offi cinalis Aamla
Moringa oleifera Drumstick
Myristicafragrans Nutmeg
Eugenia caryophyllata / Syzygium aromaticum Clove
Azadirachtaindica Neem
Citrus nobilis Orange
Syzygium cumini Jamun
Carissa carandas Koranda
Achrassapota / Manilkarazapota Sapota
Coff ea arabica Coff ee
Figure 2 displays the spatial distribution of the different tree species groups within the 1 acre planting sites.
4 Patta is the document issued by revenue department in the rank of revenue administrative offi cer of the Taluka. A Taluka is the sub-division of the District. This document ensures that the land is owned by the patta holder i.e., the name mentioned in the patta and that it is not a government land. This also records the type of land in the land registry of the Govt about the type of land, owner of the land and other statistical information required by the Govt.
118 FACTS Reports

Forging a Template for Sustainable Rural Development - The Araku Way
5www.factsreports.org
c
M M
M M
M M
M M
M M
M M
M M
M M
M M
M M
M M
M M
M
M
M
M
M M
M M
M M
M M
M M
M M
M M
M M
M M
M M
M M
M M
M
M
M
M
M M
M M
M M
M M
M M
M M
M M
M M
M M
M M
M M
M M
M
M
M
M
M MM M M MM M M MM M
Single Group Layout (1 acre)
Line-IMango
Line-IIGroup I,II & III
Line-IMango
Line-IIGroup I,II & III
Line-IMango
Line-IIGroup I,II & III
Line-IMango
Line-IIGroup I,II & III
Line-IMango
Line-IIGroup I,II & III
Line-IMango
Line-IIGroup I,II & III
Line-IMango
J C O D G L N P S D
C D L P D
C D L P D
C D L P D
C D L P D
C D L P D
E
J O G N S E
J O G N S E
J O G N S E
J O G N S E
J O G N S E
4.5m 4.5m
9m
4.5m
4.5m
4.5m
9m
Spacing Legend
9mx9m Mango Trees 48
Group-I 12
Group-II 22
Group-III 22
Boundary Trees 44
Mango 48
Sapota / Jamun / Neem / Emblicaofficinalias - 12
Orange / Guava / Sweet Orange
Custard Apple / Lemon / Drumstick / Carica papaya
Bamboo - 12, Teak - 326mx6m
6mx6m
6mx6m
6mx6m
c
M M
M M
M M
M M
M M
M M
M M
M M
M M
M M
M M
M M
M
M
M
M
M M
M M
M M
M M
M M
M M
M M
M M
M M
M M
M M
M M
M
M
M
M
M M
M M
M M
M M
M M
M M
M M
M M
M M
M M
M M
M M
M
M
M
M
M MM M M MM M M MM M
Single Group Layout (1 acre)
Line-IMango
Line-IIGroup I,II & III
Line-IMango
Line-IIGroup I,II & III
Line-IMango
Line-IIGroup I,II & III
Line-IMango
Line-IIGroup I,II & III
Line-IMango
Line-IIGroup I,II & III
Line-IMango
Line-IIGroup I,II & III
Line-IMango
J C O D G L N P S D
C D L P D
C D L P D
C D L P D
C D L P D
C D L P D
E
J O G N S E
J O G N S E
J O G N S E
J O G N S E
J O G N S E
4.5m 4.5m
9m
4.5m
4.5m
4.5m
9m
Spacing Legend
9mx9m Mango Trees 48
Group-I 12
Group-II 22
Group-III 22
Boundary Trees 44
Mango 48
Sapota / Jamun / Neem / Emblicaofficinalias - 12
Orange / Guava / Sweet Orange
Custard Apple / Lemon / Drumstick / Carica papaya
Bamboo - 12, Teak - 326mx6m
6mx6m
6mx6m
6mx6m Figure 3. Sketch showing spatial distribution of the different tree species in a one acre plot
At all stages of the programme the VDCs were consulted and the minutes of the meetings recorded as part of the due diligence process. An MOU was taken up with the VDC towards the implementation of the programme.
As the plantation of horticultural saplings was carried out for the benefi t of the local communities , they would have exclusive possession and use of all the natural re-sources produced including their fruits or other valorised outcomes, with the only exception being the carbon credits generated by programme. The carbon credits generated by this restoration are exclusively allocated to Livelihoods Fund.
3.7 Procurement of Saplings
Seedlings of the saplings identifi ed are produced in central and village nurseries established and promoted by the pro-gramme. For other fruit trees grafted varieties are procured from recognized nurseries and horticulture research stations.
3.8 Land Preparation
Herbaceous vegetation is cleared at the sites to be planted, as it competes for nutrients and light. The vegetative mat-ter is used for composting, mulching as well as fencing within the plots. Land tilling will be done as part of the programme activity, apart from establishment of planting pits. The clearing and planting work is done by individual farmers and community.
3.9 Spacing and Plantation density
The plantation density or the number of trees per hectare is dependent on the spacing maintained for the species. Spacing for the different species of saplings is given in Table 2.
Table 2. Species Planting Density
Species Spacing
Mango Group
Mango 9m X 9m
Mixed Group 1
Sapota 6mX6m
Jamun 6mX6m
Neem 6mX6m
Aamla 6mX6m
Mixed Group 2
Orange 5m X 5m
Guava 5m X 5m
Sweet Orange 5m X 5m
Mixed Group 3
Custard Apple 4mX4m
Lemon 4mX4m
Drumstick 4mX4m
Papaya 4m X 4m
Teak Group
Teak 6mX6m
Bamboo Group
Bamboo 6mX6m
Coff ee Group
Coff ee arabica 2m X 2m
3.10 Planting
The seedlings are transported from the nursery to the benefi cia-ry‘s property. The plant material remains for the shortest possi-ble time at the unloading site, which has water, shade and protec-tion to avoid possible damages. The seedlings are planted on the same day. Transportation from the unloading site to the planting point is done by the communities themselves by carrying them to their fi elds in wooden/iron plates. The planting process is car-ried out in assistance with Naandi fi eld offi cers.
3.11 Plant Protection
To protect the plants, biological pest control agents (eg pan-chakhavya) and fencing is being done. The villagers take great care to ensure that the animals are systematically shep-herded during their grazing. A large number of plots have also been fenced to ensure that the cattle don’t stray into
119www.factsreports.org

Forging a Template for Sustainable Rural Development - The Araku Way
6 Field Actions Science Reports
them. Traditionally in these areas there is a practice of live fencing of Jatropha, agave and other local fencing varieties.
4. Monitoring, Recording and Verifi cation
The monitoring aspect of the agroforestry program is an exact-ing task involving a lot of paperwork for the validation of the carbon audit and also from a general best practice perspective. Naandi identifi ed information technology as an option to effi -ciently track, monitor and review work across the vast and tough terrain. It is also useful in forecasting and procurement of agri-cultural produce in minimum time, and in marketing activities. A mobile phone application named Livelihoods 360, which inte-grates ‘on-fi eld’ process and data management requirement from operations, monitoring and audit perspective has been intro-duced. The application integrates the cultivation & marketing of the existing main cash crops – coffee and pepper and in future will assist in the monitoring the quantum of carbon sequestration through mobile data capture of vitals like height, girth, survival rate etc.
The application, Livelihoods 360 (cf. Appendix) has been de-signed with an aim to capture end to end data.
The application has been enabled for data entry at two points, mobile & online – keeping in consideration Naandi’s require-ments and operational constraints. The mobile application has been re-engineered to work both in offl ine and online mode to cater to low or no-signal strength in the valley. This data is sent real-time to a central server over GPRS connection from various fi eld sites. The entire operation is now able to function on a ‘Just-In-Time’ allotment of resources and forward planning. This data can be viewed by accessing the server online and also insightful Quality and Operations reports can be generated from accurate data that has been captured.
The larger objective of Livelihoods 360 is to capture realistic demographic information encompassing the entire fold of activi-ties in a village in order to understand the overall impact of the intervention and also help identify areas for future interventions. (See Livelihood 360 document, see Appendix & Figure 8)
DonorReports via email
SMS Alerts
Donor
OPS Team
Managers
Auditors
Farmers
GPRS GatewayGPRS Gateway
Livelihoods 360 Server
SMTP(email) Gateway
On Field Data Collection Through Mobile Application
Figure 4. The chart below shows the end to end data manage-ment mechanism of Livelihoods 360
5. Accomplishments
• So far, 14120 committed farmers from 300 villages across three mandals have been involved in this pro-gramme as of November 2012.
• A total of 2.45 million trees of diverse varieties (such as Mango, Neem, Bamboo, Teak, Guava, Custard Apple, Orange, Lemon, Papaya, Sapota Drumsticks (Moringa) etc.) have been planted on 6000 Hectares
• Organic Demo and production units producing CPP (Cow Pat Pit – a bio dynamic biofertiliser), liquid ma-nures and compost have been established at 50 nodal villages for the healthy maintenance of the saplings.
• Baselines of fl ora, fauna and GPS mapping of fi elds is done to monitor and ensure survival of trees.
• A complete audit of all assets in the 300 villages has been done as a baseline for monitoring progress in the coming years
• Local tree nurseries supported by the programme have been developed from the second year and in Year 3 (2012) 70% of the saplings were sources from these local nurseries. The intention is to hand hold these nurseries so that they become viable businesses cater-ing to the needs of the community in the future
6. Challenges
The terrain in Araku is challenging. Villages are spread across undulating hills which are inaccessible by roads and often require an uphill trek between fi ve and 10 kms. These villages are remote with very poor communication network and power supply. This often makes reaching out to the villages quite diffi cult.
• Moreover, the identifi ed plots are spread across similar terrain making it extremely diffi cult to dig pits and fi tting the required design of saplings per acre.
• The programme commenced at a time when the monsoons were almost over. Additionally poor rainfall in the past couple of years added to the problems. Providing additional watering to plants through water tanks has been cost and labour intensive.
• Even after taking due care in selection of the sap-lings the survival rate of 2 to 3 species of saplings was not as per expectations.
• Farmers showed a preference and demand for mono culture plantations like mango and teak. However continuous engagement and discussions with the farmers has led to an understanding of the impor-tance of biodiversity and an assurance from the pro-gramme management side of market access for all products.
120 FACTS Reports

Forging a Template for Sustainable Rural Development - The Araku Way
7www.factsreports.org
7. Impact and Implications for sustainability
The programme is designed to have multiple impacts.
7.1 Environmental impact
The programme will sequester carbon (above ground bio-mass carbon and soil carbon). The additional trees in the landscape will enhance the wildlife habit value and biodiver-sity. In addition, the soil water storage capacity will be en-hanced and soil erosion will be reduced. As a consequence the resilience of the land use systems against climate change, in particular droughts, will be increased.
More specifi cally, environmental impacts, including im-pacts on biodiversity and natural ecosystems include (among others):
• Afforestation and reforestation activities can have negative impacts on biodiversity, if taken up in forest ecosystems with already existing biodiversity value. Conversely, if planting is being promoted on land that is degraded or with no trees, it will have a positive impact on biodiversity.
• Forestry on degraded lands without any trees on them has a positive impact on biodiversity, regeneration of vegetative cover through leading to soil and water conservation and protection of watersheds, and in-creased supply of biomass, which is essential as sus-tainable development issues of mitigation projects.
• Among the many environmental services they pro-vide, the most critical places are soil conservation i.e. protection against erosion and maintenance of fertili-ty, shelter against wind and shade.
• Decreases vulnerability to current climate change and climatic variability
• Forestry on these degraded lands will enrich the soil by fi xing nitrogen, improve drainage, and promote ef-fi cient nutrient cycling. Forestry is an opportunity to optimize land productivity and diversity in output to meet domestic needs and improve the household economy of farmers.
• The programme area is devoid of trees in most of the parcels of lands. A few parcels of land have trees on the bunds which are mature and these trees will not be uprooted. Thus the disturbance to soil will be limited.
• The species proposed are well known and indigenous to rural India
7.2 Socio-Economic impact
The economics of the agricultural mitigation activities has not been analyzed yet, but it is expected that most of the ben-efi ts from carbon sequestration are related to the expected crop yield increase. In the region farmers produce between 100 and 900 kg of Arabica beans per hectare, while in other countries up-to 1,500 kg/ha are produced. Farmers operating at the lower range have a huge potential to increase produc-
tion by adopting best coffee and agricultural practices. Apart from the potential to increase cash crop yields the
proposed integrated livelihood development approach will improve public health, education, product valorisation and subsistence farming activities.
Further, the programme will strengthen community struc-tures which will also help to mitigate confl icts between dif-ferent tribes living in the area. In this view this project aims to:
• Develop innovative approaches that links climate change mitigation, agriculture to upscale soil restoration,
• Investigate added solutions to sustainable development
• Contribute to environmental sustainability and build-ing new relevant partnerships;
• Exploring new ways of fi nancing development, based on community mobilization, built upon Naandi’s out-standing achievement on coffee certifi cation and farmer’s cooperatives.
8. Conclusions
The programme contributes directly to Millennium Development Goal (MDG) 1, target # 1: reducing extreme poverty and target # 2: reducing hunger; and MDG 7- ensur-ing environmental sustainability. It is designed to help rural tribal farmers in the Araku valley achieve sustainable nutri-tional security and meet other basic rural livelihood needs that are in harmony with the environment.
In the long-term, farmers practicing agroforestry using fruit trees, timber trees and coffee will create nutritional secu-rity as well as additional income—thereby contributing to hunger and poverty reduction in the communities.
In terms of the environment, the benefi ts are multiple: Chemical free, sustainable organic practices will lead to im-provement to the natural environment, including increased water retention in soils from higher organic carbon, improve-ments in the water table, reduced soil erosion combined with improved organic matter in soil, leading to better carbon se-questration and increased agro-biodiversity.
The success of a programme lies on the one hand in its abil-ity to achieve its objectives, and on the other hand, its ability to sustain these achievements for the 20 year lifecycle. The sustainability of the project is ensured through the strong in-volvement and participation from programme design to im-plementation of the tribal community, along with the tangible economic and livelihood benefi ts that the community is al-ready receiving and will receive in the future. The project interventions too, have been designed with a gender lens so that women can participate in programme activities.
With minimal or no external inputs required and utilisation of locally and naturally available material to produce high-quality produce, the programme encourages a holistic ap-proach to farming that is more diverse and resistant to exter-nal pressures. With nutritional crops assured, support for coffee production and marketing and a robust agro-forestry
121www.factsreports.org

Forging a Template for Sustainable Rural Development - The Araku Way
8 Field Actions Science Reports
component the community is evolving a wide portfolio of agri-options that derisks it from economic vulnerability.
Naandi envisions that the approach of working with nature, instead of using chemicals and pesticides to fi ght nature, will thereby evolve a replicable development template which will empower the communities to explore their own means of sus-tainable prosperity.
Figure 5. Village Development Committee meeting-Thadiput-tu, September 2011
Figure 6. Naandi personnel explaining the plantation plan at the village © hellio-vaningen
Figure 7. Farmers transporting the saplings for planting
Figure 8. Nurturing and protecting the young saplings by build-ing bio fences
Figure 9. Capturing data through the Livelihoods 360 application
122 FACTS Reports

Forging a Template for Sustainable Rural Development - The Araku Way
9www.factsreports.org
9. References
Census of India (2011): “Provisional Population Totals: Paper 1 of 2011”, Andhra
Pradesh, Director of Census Operations.Gopinath Reddy, K. Anil Kumar (2010): Political Economy of
Tribal Development:A Case Study of Andhra Pradesh, Working Paper No-85, Centre for
Economic and Social Studies , February 2010. Haimendorf, Christoph Von Furer (1985): Tribes of India - The
Struggle for Survival,Delhi, Oxford University Press.Hogg David, Mathai Ajit (2010): India: IFAD’s Sustainable
Development Model –A Framework for Sustainable Local Nutritional Security, Strategy
Paper, April 2010. TANGO International (2009). Sustainability of rural development
projects. Best practices and lessons learned by IFAD in Asia. International fund for Agricultural Development (IFAD).
Occasional Paper No. 8. May 2009.Laxman Rao. S, Priya Deshingkar, John Farrington (2006): “Tribal
Land Alienation inAndhra Pradesh Processes, Impacts and Policy Concerns”, EPW,
Vol. XLI, No. 52, December 30, 2006.Saxena, N C (2006): ‘The Resettlement and Rehabilitation Policy of
India’in Hari Mohan Mathur (ed), Managing Resettlement in India: Approaches, Issues and Experiences, Oxford University Press, New Delhi.
PROJECT DESIGN DOCUMENT for A/R CDM project activities (CDMAR-PDD – UNFCCC/CCNUCC) Title: Araku Valley Livelihood Project, March 2012
APPENDIX
Livelihoods 360
ContextIn order to meet the objectives of the program over the scale of operations in the area, it is imperative that we introduce the use of technology for optimum utilization of both time and resources. The idea of collating the entire set of data under one organized set which is time dependent is very challenging keeping in mind the sheer numbers, the con-nectivity to internet & telephone and the cost involved.
The application in mind had to perform with minimum effort and maintenance integrating the cultivation & mar-keting of the existing main cash crops –Coffee & Pepper and also be able assist the monitoring aspect of Carbon Sequestration Program leading to the cultivation & market-ing of the produce from the planted trees.
BackgroundWe decided to design and develop an application that works at standardizing the end to end data management cycle.
SolutionThis application is an integration of the ‘on-fi eld’ process and their data management requirement from an operations, monitoring and audit perspective. The application is de-signed on a light weight java platform.
• The application has been enabled for data entry at two points, mobile & online – keeping in consider-ation the tough terrain requirements and operational constraints.
• The mobile application has been re-engineered to work both in offl ine and online mode to cater to low or no-signal strength in the valley.
Post the set–up and roll–out of the designed application it will be easier to record any data mode in terms of quality and quantity from all the farmers across different regions, and look at the cumulative collection of data on a daily ba-sis. This application will also facilitate any other informa-tion surrounding the process.
The application will hold static data such as Farmer iden-tifi cation, Farmer details, Farm information etc on the serv-er maintained by offshore and the data can be accessed through a website from anywhere.
The dynamic data which can be categorically defi ned based on the use of the application will be downloaded on the mobile phone of the fi eld staff. The staff member can use the mobile phone to enter the requisite data which will be stored offl ine [in case of no network] and transmit im-mediately to the server.
For example, the Horticulture application will involve a customized solution for baseline data of the existing trees on the plot to the number of trees planted to monitoring the health and survival of the plant for the coming fi ve years. As this is a cumbersome task involving a lot of paper work to provide for the validation of the carbon audit and also from a general best practice perspective, we came across the SMS/GPRS based solution as the most prudent and economical.
Naandi Foundation
The economic reform process started in 1991 in India had forced governments to become leaner and forge public-pri-vate partnerships as the new path to growth and develop-ment. After the mid-term review of the fi rst decade of re-forms, it was clear that these arrangements were not helping the government for improving the provision of basic ser-vices to the poor.
Against this backdrop, the state government of Andhra Pradesh, one of the large, agrarian states from Southern India, came up with the idea of creating an autonomous, secular, apolitical and professional NGO headed by an emi-nent board of leaders, mostly from business and industry. It was hoped that this institution will serve the unmet needs of the government in reaching out to the underserved popula-tions in rural and urban areas.
Accordingly, Naandi Foundation was established in 1998 as a Public Charitable Trust with a vision to eradicate poverty. Naandi was mandated to scout for large scale gov-ernment programs in areas like provision of safe drinking water, basic healthcare, elementary education, water and other agricultural input support to small farmers, etc. Naandi was to get government funding for implementing these pro-grams. Naandi was also encouraged to forge partnerships
123www.factsreports.org

Forging a Template for Sustainable Rural Development - The Araku Way
10 Field Actions Science Reports
with international governments, global developmental or-ganisations, UN bodies, global business corporations and other philanthropic bodies for starting new initiatives or for complementing existing government programs.
Naandi Foundation did all of the above and in the very short span of a decade, managed to successfully carry out numerous large scale programs for the poor. Run by a pro-fessional team of over 5,500 employees, Naandi Foundation has now become the largest multi-sectorial not-for-profi t in India, impacting 5 million lives. Their fl ag-ship programs include supplying hot nutritious meals to one million school going children everyday; providing academ-ic support to over 200,000 children in 2,000 government schools; ensuring access to safe drinking water for over 3 million people; and liberating 100,000 tribal farmers from poverty through sustainable agriculture and access to global markets (the ‘Araku Way’).
124 FACTS Reports

Scaling up Agroforestry to Achieve Food Security and Environmental Protection among
Smallholder Farmers in Malawi
TL Beedy1, GW Sileshi1, G Kundhlande1, G Chiundu1, OC Ajayi2 & AJ Simons2
1World Agroforestry Centre (ICRAF)-Southern Africa, Lilongwe, [email protected] [email protected] [email protected] [email protected]
2World Agroforestry Centre (ICRAF), Nairobi, [email protected]
Abstract. Malawi is a land-locked country in southern Africa. Three-fourths of Malawi’s 13 million people rely on smallholder agriculture for their livelihoods. Increasing population, accelerating deforestation, poor soil and water management, and increasing poverty and land degradation directly impact the food security and human health of millions of Malawians. Cropping systems which combine cereal crops, agroforestry and small doses of inorganic fertilizers produce food-crop yields greater than inorganic fertilizers alone on degraded soils, as well as recuperating soil nutrients over a period of years. These agroforestry practices improve the livelihoods of farm families, lower risks associated with fertilizer price increases and drought and at the same time improve biodiver-sity and nutrient and water cycling in the agro-ecosystem. The World Agroforestry Centre (ICRAF) has a long history of agroforestry research and development in Malawi dating back to the 1980s. In 2007-2011, ICRAF implemented the Malawi Agroforestry Food Security Project (AFSP) through fi nancial support from Irish Aid. ICRAF’s task in AFSP was to build a strong partnership to reach 200,000 farming families in 11 districts. The purpose of AFSP was to combine tested agroforestry practices, effective partnership and informed policies to in-crease food security and income, and improve livelihood opportunities for rural communities in Malawi, through accelerated adoption of fertilizer trees, fruit trees, fodder trees and fuel-wood trees. To accomplish these purposes, ICRAF provided the farming communities with planting material (tree seeds and seedlings), and the knowledge of how to care for them and effectively combine them with food crops. The benefi ciaries of the project saw in-creases in household food security and nutrition. However, diffi culties were encountered in transporting tree seeds and seedlings across eleven districts in a timely fashion, and in managing the fl ow of reporting and disburse-ments of funding among such a large group of collaborators. Several solutions were implemented which im-proved performance in these areas, and which allowed the group to reach very near the targeted number of participants, and to plan for a second phase of the project.
Keywords. Agroforestry, food security, Malawi, World Agroforestry Centre (ICRAF), development partners, soil degradation
1 Introduction
Malawi is a land-locked country in southern Africa that lies along the southern portion of the East African Rift Valley (Figure 1). Three-fourths of Malawi’s population of 13 mil-lion rely on smallholder agriculture for their livelihoods. Increasing population, accelerating deforestation, poor soil and water management, and increasing poverty and land deg-radation directly impact food security and human health of millions of Malawians as well as affecting educational sys-tems, water security, infrastructure, and major economic
sectors, especially agriculture and tourism (Government of Malawi (GoM), 2009).
From the 1990s through the early years of this century, Malawi was a food insecure country, relying on food aid even in years of good rainfall. The poor harvests were the direct re-sult of soils that had over the years been overused, degraded and exhausted. Most smallholder farmers did not use inorganic fertilizers due to high costs, and there were recurring food shortages and malnutrition among children and the elderly (Akinnifesi et al., 2007). Continuous cultivation of maize, the major food crop, on land with neither organic nor inorganic
© Author(s) 2012. This work is distributed under the Creative Commons Attribution 3.0 License.http://factsreports.revues.org/2082Published 10 October 2012
125www.factsreports.org

Scaling up Agroforestry to Achieve Food Security and Environmental Protection among Smallholder Farmers in Malawi
2 Field Actions Science Reports
fertilizers led to low yields and resulted in inability to afford purchases of improved seed and inorganic fertilizer in fol-lowing years. Poverty and vulnerability to shocks (drought, high food prices, sickness, loss of employment) lowered pro-ductivity and women, children and the elderly have been dis-proportionately affected by these shocks (Dorward and Chirwa, 2011). In this context, production shocks from in-creasing variability in rainfall and temperatures due to cli-mate change pose a much greater risk to farming families than would be the case in more developed countries.
While increased use of inorganic fertilizers in the past sev-en years have improved maize yields over the short term, in-organic fertilizers have masked soil nutrient depletion, rather than correcting it, especially soil micronutrients, thus bring into question the possibility of maintaining production levels over the long-term. Many Malawian soils remain nutrient-depleted, and maize production on such degraded land pro-duces lower yield effi ciencies than on adequately nourished land, even given adequate rainfall (Sileshi et al., 2011). Cropping systems which combine cereal crops, agroforestry and small doses of inorganic fertilizers have been shown to produce food-crop yields greater than farmers’ use of inor-ganic fertilizers alone, and have additional benefi ts of helping recuperate soil nutrient balance over a period of years (Akinnifesi et al., 2007). Integration of agroforestry practices into these farming systems improve the livelihoods of farm families by increasing the range of products available and op-portunities to earn cash income, lower risks associated with drought and at the same time improve biodiversity and nutri-ent and water cycling in the agro-ecosystem. Although the
benefi ts to livelihoods and ecosystems may be clear, there is a one to three-year lag between the fi rst use of agroforestry and the appearance of the benefi ts. The poorest farmers may lag in adoption of the systems despite knowing the benefi ts, as their priority is to meet immediate household food and in-come requirements (Ajayi et al., 2008).
Though agroforestry has been promoted in Malawi for some years dating back to the inception of the European Union (EU) funded ADDFOOD project in 1989, most proj-ects have been limited to a small geographical area, while the problem of land degradation is widespread and affects most of the 3.5 million farming households across Malawi. In 2007-2011, the World Agroforestry Centre (ICRAF)-Southern Africa gathered a diverse group of development partners including government departments, farmer organi-zations, Community Based Organisations (CBOs) and Non-Governmental Organisations (NGO) partners in a team effort to provide knowledge and tree seeds and seedlings to small-holders in 11 of Malawi’s 28 districts as part of the Agroforestry Food Security Project (AFSP) funded by Irish Aid. It is believed that projects that offer free tree seed and seedlings, and training in how to plant and care for and inte-grate the trees with cropping systems help to overcome the barrier to adoption among the poorest smallholders. The ma-jor sources of costs for investing in agroforestry trees for smallholders is the cost of seed and seedlings and labour for land preparation and tree establishment, most of which is in-curred upfront, while farmers have to wait for a year or more before they start to realise benefi ts. Poor farmers may lack fi nancial resources for meeting the upfront costs of investing in agroforestry, but once established the trees produce seed that farmers can collect and use to expand the size of their plantations and for replanting in the future. This is in con-trasts with commercial seed for some of the annual crops (e.g., maize) grown by farmers where there is need to pur-chase improved seed every year.
2 Project Objectives
The purpose of AFSP was to combine tested agroforestry practices, effective partnership and informed policies to increase food security, income, and livelihood opportunities for rural communities in Malawi and protect the environment, through accelerated adoption of fertilizer trees, fruit trees, fodder trees and fuel-wood trees (ICRAF, 2011b). The specifi c objectives of the project were:
(a) Target, prioritize, adapt and demonstrate fertilizer, fod-der, fruit and fuel-wood trees portfolio options in elev-en selected districts with suitable biophysical, geo-graphical and social niches for agroforestry interventions, including vulnerable sub-populations (HIV/AIDS affl icted, food insecure, poor, women);
(b) Engage partners in developing and applying strategies for sustainable supply and delivery systems of quality tree germplasm to meet potential massive demand by smallholder farmers;
(c) Engage, mobilize and sensitize policy makers to formu-late appropriate policy mechanisms and instruments for
Chitipa
Karonga
Lake Malawi
Rumphi
Nkhata Bay
Likoma
Mzimba
KasunguNkhota-
kota
Ntchisi
DowaMchinji Salima
DedzaLilongwe
Mangochi
Lake
Mal
awi
Ntcheu
BalakaMachinga
MwanzaBlantyre
Chirad-zulu
Phalombe
MulanjeThyoloChikwawa
Nsanje
Zomba
0 80
N
160 Kilometers
Legend
District boundary
Lakes
AFSP Sites 2007/08
AFSP Sites 2008/09
AFSP Sites 2009/10
Country boundary
All AFSP Sites by Districtsin 2009/10 season
plus2007/08/09 seasons
Malawi
Mozambique
Tanzania
Zambia
Figure 1. AFSP sites in Malawi
126 FACTS Reports

Scaling up Agroforestry to Achieve Food Security and Environmental Protection among Smallholder Farmers in Malawi
3www.factsreports.org
mainstreaming agroforestry and catalyzing its adoption at the district and national levels;
(d) Improve strategies for accessing functional and effi -cient input markets and market support systems for agroforestry products that increase prices paid to farm-ers for their outputs and reduce costs incurred by farm-ers for needed inputs;
(e) Strengthen and mobilise the capacity of national and local institutions and development agencies in scaling up agro-forestry and develop strategies for institution-alizing agroforestry research for development in Malawi;
(f) Mainstream agro-forestry into national development plans and community based land-use and management practices.
3 Project implementation
To accomplish these purposes, ICRAF built partnerships with government departments, farmer associations, NGOs and CBOs. ICRAF functioned as the convener, and most of the partners participated in the project design and implementa-tion. ICRAF signed a memorandum of agreement with the main partners, and directly disbursed funds to the Departments of Agricultural Extension Services (DAES), Land Resources Conservation Department (LRCD), Department of Agricultural Research Services (DARS), and Department of Animal Health and Livestock (DAHL) of the Ministry of Agriculture, Department of Forestry (DoF), Bunda College of the University of Malawi, Mzuzu University and National Farmers’ Association of Malawi (NASFAM). DAES, LRCD and NASFAM have large networks of extension offi cers in all districts in Malawi and were ideally placed to facilitate in the organization of farmer groups, training, delivery of services (e.g., distribution of seeds and information and communica-tion materials) and monitoring and evaluation.
Most of the CBOs and NGOs in Malawi operate in only one or two districts, while the government maintains agricul-tural extension offi cers and land resource conservation
personnel in all districts. Districts were chosen to give broad representation across the three regions and eight agroecosys-tems present in Malawi. However, the government’s exten-sion services are not equally strong in all districts, and are supplemented by the efforts of NGOs and CBOs where they are present. Mapanga CBO in Thyolo district was actively involved in distributing tree seed and seedlings and providing support services to farmers. Through the various partner-ships, ICRAF channelled to the farming communities plant-ing material (tree seeds and seedlings), and the knowledge of how to care for them and effectively combine them with food crops.
Farmers in each district were given their choice of agrofor-estry tree seeds and fruit tree seedlings, so far as supply and logistics allowed. Fertiliser trees were the most widely plant-ed by farmers (planted by all participating households), fol-lowed by fruit trees (24%), and small numbers of household planting fi rewood trees and fodder trees. If left to grow for two seasons or more as would be the case for farmers en-gaged in rotational fallows or fertiliser tree seed production, fertiliser trees can also produce wood that is big enough for use as fi rewood. Of the fertiliser trees, the most commonly distributed seeds were improved Tephrosia vogelli and Sesbania sesban (at 93% combined), with smaller amounts of Gliricidia sepium and Faidherbia albida (ICRAF, 2011b). The fi rst two species were managed as either rotations or re-lay intercrops, depending on availability of land for rotations. Gliricidia and faidherbia were managed as dispersed inter-crops. ICRAF has not promoted alley cropping systems in Malawi, as the rainfall in most areas is not suffi cient to avoid competition of the trees with cereal crops. Some farmers preferred tephrosia because it could be directly sown in the fi eld, avoiding the laborious nursery process. Other farmers preferred gliricidia, because although it required nursery management it only had to be planted once, and would re-sprout after annual coppicing for leaf manure. Gliricidia, however, produces only small amounts of seeds, and so the demand for it was always greater than the supply. The most commonly distributed fruit seedlings were papaya Carica pa-paya and mango Mangifera indica, respectively (ICRAF, 2011b). Papayas were the simplest and most popular fruits
Figure 2. Maize grain yield in six districts as affected by agroforestry and fertilizer use.
Maize aloneMaize + mineral fertilizer
Maize + fertilizer trees + mineral fertilizer
Maize + fertilizer trees
Lilongwe
4500
4000
3500
3000
2500
2000
1500
1000
500
0
Maize grain yield (kg/ha) in different districts as affected by type of plots
Mai
ze g
rain
yie
ld (k
g/ha
)
Districts
Mzimba Machinga Thyolo Mulanje Salima
127www.factsreports.org

Scaling up Agroforestry to Achieve Food Security and Environmental Protection among Smallholder Farmers in Malawi
4 Field Actions Science Reports
for adoption by both the project and the smallholders because they did not require grafting. Mangos were next in popularity, mostly because of a general preference for the fruit for home consumption and local sale.
Partners for AFSP were chosen for their ability to contrib-ute to a team that reached smallholders at the farm level across eleven districts. CBO’s were also included, though they are smaller scale, because of their ability to bring con-textual issues such as gender, HIV/AIDS, and governance into the management of what is essentially a natural resource management project. AFSP sought to capitalise on and fur-ther strengthen coordination of efforts among development partners, as exemplifi ed in the relationship between LRCD, Extension Services, lead farmers, and farmer participants. LRCD maintains only two offi cers in each district to teach soil and water conservation practices, making it impossible for them to directly reach thousands of participating house-holds in each target district. The LRCD offi cers train agricul-tural extension offi cers and lead farmers who in turn train and provide information on soil and water conservation to the rest of the farmers in the communities. During the AFSP staff of the Department of Agricultural Extension Services (DAES) identifi ed, sensitized and trained farmers, and also distributed tree seeds and seedlings to participants. The extension offi -cers also identifi ed lead farmers to be trained to do farmer-to-farmer training at the village level. ICRAF training offi cers and LRCD staff trained the extension offi cers and lead farm-ers in each district on how to integrate agroforestry trees in the local farming systems.
Participation by farmers was voluntary at the village level, and the participants self-organized into groups for training. Participation of men and women at the village level was rough-ly equal; however women’s participation in fi eld days, train-ings, and demonstrations was slightly less than that of men. Lead farmers were often chosen by each group. The extension offi cers and lead farmers in turn trained the participating small-holders. Farmers were given intensive modular trainings in tree nursery care, and planting and management of trees in ap-propriate niches in cropping systems, to empower them to pro-duce organic leaf fertilizer, fruit, fuelwood, and fodder for live-stock (Figure 2) (ICRAF, 2011a). ICRAF partnered with major tree seeds suppliers, the Forestry Research Institute of Malawi (FRIM), and the Land Resources Centre in the private sector to provide tree seeds. Grafted seedlings for fruit trees were pro-duced in ICRAF’s central nursery located at Makoka Agricultural Research Station, and Bvumbwe Agricultural Research Station of DARS.
The most important of the activities was that of the farmers who took the seeds and seedlings, and planted and cared for them on their own farms, reaping the benefi ts of the soil-build-ing leaf matter, fruit, livestock fodder, and cooking fuel. Although the main focus of the project was the farm house-hold, AFSP also built the capacity of national partners, aca-demics, and students through curriculum revision projects in University of Malawi and Mzuzu University. The total capaci-ty-building effort covered a wide range of clients ranging from farming communities to government and NGO development personnel, to universities, so that agroforestry would have a sustainable knowledge base specifi c to the Malawian context.
4 Accomplishments and diffi culties
Implementation of AFSP brought both accomplishments and diffi culties. A total of
184,463 farmers were reached through the project (Table 1), and these farmers saw increases in maize production thus contributing to improvement in household food security and nutrition (Figure 3). According to an external review of the project, the main strength of the AFSP is its relevance to the Malawi Growth and Development Strategy, the Agricultural Sector Wide Approach as well as the Millennium Development Goals. The review also concluded that the project has: (1) improved household food security and nutrition; (2) strength-ened partnerships among stakeholders; (3) built capacity of farmers and extension staff; and (4) mainstreamed agroforestry in university curricula and cross cutting priority areas including gender equality, governance and HIV/AIDS. An assessment of impact of the project in terms of maize yield was conducted across six districts. The results show doubling of maize yields with the addition of agroforestry to the cropping systems (Mwalwanda et al., 2012). One factor that facilitated team-build-ing and team-oriented operations among disparate governmental and non-governmental partners in this project was the relevance of agroforestry to efforts by the Malawi government and local and national NGOs to develop agriculture and protect the local agro-ecosystems.
Figure 3. Women being trained in tree management.
Cooperation between ICRAF, LRCD, and Extension Services was largely responsible for the ability of the project to reach a relatively large scale, however participation was uneven across districts. For example, farmers receiving agro-forestry tree seed in 2010 numbered more than 5,000 in both Mzimba and Lilongwe districts and less in the other districts (ICRAF, 2011b). Mzimba district is physically larger than the other districts, and ICRAF’s offi ces are located in Lilongwe district. Farmers across all districts received simi-lar amounts of seed, but they chose different species. Tephrosia was the most common choice in Mzimba and Lilongwe districts. Demand for gliricidia was strongest in Karonga district, possibly because gliricidia is already much used there, and the example drove increasing demand. Faidherbia, on the other hand, was much less in demand in Salima district, where it is also a common intervention for
128 FACTS Reports

Scaling up Agroforestry to Achieve Food Security and Environmental Protection among Smallholder Farmers in Malawi
5www.factsreports.org
soil fertility. Faidherbia, however, produces relatively more seed than gliricidia, and local seed probably fi lled local de-mand. Though the AFSP was relatively successful in scaling up agroforestry use in two extension areas in each of eleven districts, this is only a small portion farming households, which number over three million. A second phase of AFSP is planned, and further efforts will also be needed from govern-ment, NGO, and CBO groups outside of the AFSP project it-self to fi ll the demand for agroforestry on farmland in Malawi.
The implementation of AFSP was not always smooth. The fi rst major diffi culty encountered was that of transporting seeds and seedlings from the nurseries to the farmers in the districts especially at the beginning of the project. During the fi rst year, ICRAF provided much of the transport for the seeds, and sometimes arrived late, having too few vehicles and personnel to undertake the task. In subsequent years, the agricultural extension service loaned vehicles and personnel, which helped to improve the timeliness of the deliveries. To overcome this challenge, the project encouraged and trained individual farmers in tree seed production and marketing to provide a source of tree seeds at the village level. These farm-ers were also trained to form tree seed associations, and to manage tree seeds storage, and sales within cooperative groups. These activities increased the fl ow of tree seeds with-in the project’s areas.
Transporting fruit seedlings from agricultural experiment stations in the south of Malawi to eleven districts was more problematic than transporting tree seeds. The fruit seedlings sometimes arrived late, and often were weakened by the con-ditions of transport. One remedy for this problem was to train farmers in operation of community tree nurseries (Figure 4), and have trained personnel visit to graft the seedlings. Another remedy was supporting agricultural experiment sta-tions in the center and north of the country to grow seedlings for the project in their region. These remedies increased the fl ow of both indigenous and exotic fruit seedlings to the farmers in the project, but demand for the fruit seedlings ex-ceeded the number delivered in each year.
Both the level of participation and crop performance varied among the districts. The effect of fertilizer trees was greatest
in Salima district, as were overall yields (Figure 3). Both yields and the agroforestry effect were less in Mzimba and Machinga districts. Of the eleven districts participating in the AFSP, the eight most active were recommended for a planned second phase of the project: Dedza, Lilongwe, Thyolo, Karonga, Machinga, Mzimba, Mulanje and Salima.
Figure 4. Farmers demonstrating village nursery operations.
The second major diffi culty was the late reporting of AFSP annual results from the districts and department offi ces, and subsequent late disbursement of funding. This was a problem in the middle to late years of the project, and will be remedied in the second phase of the project. Some districts were late in reporting district-level information on AFSP to the govern-ment departments, who were in turn late in compiling multi-district reports for ICRAF. ICRAF was then delayed in re-porting overall results to Irish Aid, a pre-requisite for subsequent funding disbursement. Rather than risk delaying the farming-season-driven cycle of project activities, ICRAF often pre-fi nanced operations. A pilot project, Evergreen Agriculture which tested the possibilities of interfacing at district rather than department level was implemented by ICRAF in the districts of Kasungu, Mchinji and Chiradzulu in 2010. Based on lessons learned during this project, during planning for the second phase of AFSP in 2012 and
Table 1. The number of households reached, extension staff trained and amount of seed distributed by AFSP
2007/8 2008/9 2009/10 2010/11 Total
Number of farmers reached 42,419 65,522 91,022 37,656 184,463
Number of farmers trained1 1,322 17,141 28,622 33,723 80,828
Number of extension staff trained 123
658 191 255 1,227
Amount of seeds distributed (tons) 24
22.3 17.5 9.6 73.4
Fruit seedlings distributed 27,000 137,000 173,790 29,000 366,810
1 Lead farmers and participants in nursery production and seed production activities.
129www.factsreports.org

Scaling up Agroforestry to Achieve Food Security and Environmental Protection among Smallholder Farmers in Malawi
6 Field Actions Science Reports
subsequent years, ICRAF and partners have proposed to Irish Aid that ICRAF should interface with the LRCD and exten-sion offi ces directly at the district rather than the department level for reporting results and disbursement of funds. ICRAF will also regularly monitor the compilation of data and infor-mation required for fi nancial and technical reporting and pro-vide needed support to the project implementing team at the district level. This will allow project districts that report on schedule to receive funding for subsequent activities, without being delayed by the lack of reporting by colleagues in other districts.
5 Impact and implications for sustainability
The impact of the AFSP was greater in terms of household food security and in terms of scale of operations in the par-ticipating districts than previous agroforestry projects in Malawi. Agroforestry cropping systems increased the yield of the major staple crop, maize by near 100% under small-holder conditions. The fertilizer, fruit, and fodder tree sys-tems which have simple seed management requirements are easily sustainable among smallholders, as they can produce tree seeds for future use within the farming system. Sustainability of fruit tree systems is more complex because of the need for grafting. However, demand for fruit trees is also high, and will give incentive to efforts to maintain the fl ow of grafted seedlings to smallholders. Overall, the project improved food security and livelihoods among participants. Over the longer term, because of improved soil nutrient and water cycling, these systems should also improve ecosystem function and the resilience of the food production system. Increased emphasis on village-level nurseries should increase the production of fruit seedlings locally in the participating villages. Local participants gained technical knowledge about agroforestry/maize cropping systems that will give them confi dence in making natural resource management de-cisions at the farm and village level. They also gained experi-ence in organizing themselves to access goods and services outside the village. Valuable connections were forged be-tween government departments and private extension servic-es, which strengthened delivery of agricultural knowledge and services within the districts. Lessons learned in institu-tional arrangements leading to the recommendation for indi-vidual district reporting should facilitate the fl ow of resources for project functioning in the second phase of AFSP.
6 Conclusions
AFSP assisted 184, 463 farmers in learning and using agro-forestry cropping systems that could help them to cope with increasingly variable rainfall and temperature patterns driven by climate change. It also allowed the partners to verify some of the positive effects of these trees on livelihoods. ICRAF also tested a public/private partnership model for scaling up agroforestry technologies in Malawi, and implemented sev-eral problem-solving strategies during the project. Mainstreaming of agroforestry within the curricula of University of Malawi and Mzuzu University will strengthen agroforestry knowledge within the private and public sectors of agricultural development services. Cooperation between
government departments such as LRCD and DAES with pri-vate extension services such as NASFAM and CBOs such as Mapanga strengthened the delivery of agroforestry tree seeds, seedlings and services at the village level in the respective districts and allowed the project to operate at a broad scale. The scaling up strategy that was successful in Malawi, how-ever, depended on particular international, governmental and local partners and would need to be adjusted for differing in-stitutions in other contexts.
7 Acknowledgements
ICRAF would like to acknowledge Irish Aid for funding AFSP, the efforts of 184,463 farm families participating in AFSP, as well as the district agricultural extension and land resource offi cers in Karonga, Mzimba, Ntchisi, Salima, Dedza, Lilongwe, Ntcheu, Machinga, Mulange, Thyolo, and Chikwawa districts, Mapanga Community-based Organization, the Central Region Milk Producers Association, the Agricultural Extension Services, Land Resource Conservation, and Animal Health and Livestock Development Departments, and the Forestry Research Institute of the Government of Malawi, Bunda College of Agriculture of the University of Malawi, Mzuzu University, and the National Smallholder Farmer’s Union of Malawi for the efforts and expertise applied to the AFSP from 2007 through 2011.
References:
Ajayi, O.C., F. Akinnifesi, G. Sileshi, S. Chakeredza, S. Mng’omba, O. Ajayi, I. Nyoka, and T. Chineke. 2008. Local solutions to global problems: the potential of agroforestry for climate change adaptation and mitigation in southern Africa. Tropical Forests and Climate Change Adaptation (TroFCCA) Regional meeting “Knowledge and Action on Forests for Climate Change Adaptation in Africa,” 18-20 November, Accra, Ghana.
Akinnifesi, F., W. Makumba, G. Sileshi, O. Ajayi, and D. Mweta. 2007. Synergistic effect of inorganic N and P fertilizers and or-ganic inputs from Gliricidia sepium on productivity of inter-cropped maize in Southern Malawi. Plant and Soil 294:203-217.
Dorward, A., and E. Chirwa. 2011. The Malawi agricultural input subsidy programme: 2005/2006 to 2008/2009. The International Journal of Agricultural Sustainability 9:232-247.
GoM. 2009. The Second National Communication of the Republic of Malawi under the Conference of the Parties (COP) of the UNFCCC. Ministry of Lands and Natural Resources, Environmental Affairs Department Lilongwe, Malawi.
ICRAF. 2011a. Agroforestry Food Security Project in Malawi: Phase II Proposal. Southern Africa Regional Programme, Lilongwe, Malawi.
ICRAF. 2011b. Agroforestry Food Security Project in Malawi: Annual Report, 2010, Lilongwe, Malawi.
Mwalwanda, A.B., O.C. Ajayi, F.K. Akinnifesi, T. Beedy, G. Sileshi, and G. Chiundu. 2012. Impact of fertilizer trees on maize pro-duction and food security in six districts of Malawi. ICRAF Working Paper No. 140 World Agroforestry Centre, Nairobi, Kenya.
Sileshi, G., F.K. Akinnifesi, O.C. Ajayi, and B. Muys. 2011. Integration of legume trees in maize-based cropping systems im-proves rain-use effi ciency and yield stability under rain-fed agri-culture. Agricultural Water Management 98:1364-1372.
130 FACTS Reports

Developing jatropha projects with smallholder farmers
Conditions for a sustainable win-win situation for farmers and the project developer
Anne-Claire Degail1 and Julien Chantry2
1M Sc., R&D Coordinator Eco-Carbone, M Sc., CEO Eco-Emerald, Eco-Carbone, 15 Avenue de Ségur, F-75007 Paris, France
2M Sc., CEO Eco-Emerald, Eco-Carbone, 15 Avenue de Ségur, F-75007 Paris, France, E-mail: [email protected]
Abstract. Based on the observation, the analysis and the comparison of four smallholder based jatropha projects developed by Eco-Carbone, located in distinct climatic and socio-economical conditions, this paper aims at drawing on the operator’s experience to show what are the social, technical and economical prerequi-sites and the necessary management strategies, for such projects to be a success, both for the project operator and the farmers.
Beyond the climatic and soil conditions which need to be present, the existing dynamics of the farming sys-tem should be assessed in order to establish whether and how, jatropha can be integrated in the existing farm-ing system. Jatropha shall represent only a complementary income to farmers’ existing agriculture income; therefore, the time, capital and land that farmers will be ready to dedicate to this crop will be proportionate to the revenue they yield.
It is also necessary to assess the government’s energy policy in terms of subsidies and tax. The sale price of the oil and fertiliser will defi ne the purchasing price of the grain from the farmers and therefore, the profi t-ability of establishing jatropha plantations for the farmers and developing the whole project for the operator. A jatropha project will thrive if the mass of grains purchased from the farmers reaches the expected targets. Adapted cultivation practices and improved genetics shall be introduced to optimise the technical potential of jatropha. However, once the trees start producing, the purchasing price is a fundamental variable in the suc-cess of a jatropha project. It needs to be interesting enough for farmers to harvest, shell, dry and sell their grains. However, this level of price can be maintained as long as the project developer can ensure or anticipate suffi cient value extraction from both oil and seedcake commercialization on the market.
Until the trees reach full production, short-term revenue strategies need to be devised for the farmers and for the project operator. These include the production of annual cash crops intercropped with the jatropha which provide an income for the farmers and in some cases, they would also benefi t from a share on the sale in ad-vance of sequestration carbon credits generated by jatropha plantations that the project developer will con-duct in order to fi nance the fi rst years of the project.
Keywords. Smallholder agriculture, jatropha, biofuel projects, private-public partnerships
1. Introduction
Jatropha curcas L. (below referred to as jatropha) is a peren-nial oil-bearing shrub, which originates in Mexico (Heller, 1996) and was disseminated throughout the tropical world during the 17thcentury by Portuguese merchants
and missionaries. During the 17 th century, jatropha oil was produced mainly in Cape Verde. Its oil was then used to make soap.
Jatropha produces fruits if it receives at least 900 mm of rain over at least 4 months and is provided with suffi cient nutrients during the fi rst years of its development (Pirot and
© Author(s) 2012. This work is distributed under the Creative Commons Attribution 3.0 License.http://factsreports.revues.org/2182Published 23 November 2013
131www.factsreports.org

Conditions for a sustainable win-win situation for farmers and the project developer
2 Field Actions Science Reports
Domergue, 2008). Jatropha is sensitive to frost and thus grows only in tropical areas (Jongschaap et al., 2007). Over the years, the propagation through cuttings to develop live hedges has narrowed the already thin genetic base of jatropha exported outside Mexico.
Jatropha has received world attention in the past ten years as a potential feedstock for an alternative to fossil fuel. As such, it is a relatively new plant and research on jatropha cultivation practices and genetic selection to produce oil was only initiated in the late 1990s (Achten et al., 2008, 2010).
This “new” plant was dubbed wrongly a “miracle” crop at a time when fossil fuel prices skyrocketed. This has attracted the attention of NGOs and large multinational companies alike.
Agricultural projects in low-income tropical countries are developed according to a number of different business models, with distinct objectives, implementation modalities, levels of sustainability and involvement of local communities.
On one end of the spectrum are the government led or NGO-led projects, which have the objective to contribute to “pro-poor” development mainly through the improvement of agri-cultural value chains, focussing on the agricultural production by farmers on their land, with their own labour force in order to increase their agricultural income.
Much has been written on the benefi ts and limitations of the project approach (Gittinger, 1984; Dufumier, 1996). The limi-tations being often due to an underestimation of the importance of the fi nancing. As a result, once the funding dries up, the project stops and the farmers are left at best with improved knowledge on a certain crop production but more often with a non-profi table investment (Bako-Arifari and Le Meur, 2001). Unfortunately, not enough attention is given to fostering the market in anticipation of the project’s termination (Grieg-Gran and Wilson, 2007).
A certain number of NGOs initiated small scale projects es-pecially in West Africa aimed at making rural communities self suffi cient in energy (GERES, 2008; Nyetaa, 2012; Fact-Foundation, 2006). This was done with some success albeit concerns on the long term sustainability once the donor fund-ing stops.
At the other end of the spectrum lie company-operated proj-ects where the means of production are contracted by a na-tional or an international company. Land is purchased or rented out for at least 50 years and either farmers in the vicinity or migrant workers are hired as agricultural labourers.
This model has been tried on jatropha in Mozambique, Madagascar and India and has to date not proven to be highly successful for a number of reasons: companies have been ac-cused of land grabbing, of triggering social instability or like palm oil projects, of forest logging.
Such business models applied to jatropha have been the fo-cus of much criticism (Baker and Ebrahim, 2012; Pohl, 2010). Unfortunately these criticisms were also unjustly focussed on the plant itself (Eco-Carbone, 2010).
In the midst of a growing disappointment, a third model has emerged, where smallholder farmers are the actors of their own development and where a long-term economic relationship is developed between a project operator and the farming communities.
There are many “community based” business models
which encompass a wide range of situations. They differ ulti-mately in the level of freedom of choice and decision power that the smallholder farmers’ have in the use of the land they are tilling.
In fact, FAO established the broad conditions for jatropha production to benefi t smallholder farmers and be sustainable (Brittaine and Lutaladio, 2010) and how best to integrate food and energy crops in a sustainable way (Bogdanski et al., 2010).
This paper aims at presenting how these conditions can best be adapted in the fi eld for smallholder jatropha projects to be a sustainable profi table venture both for the farmers and for the project operator.
Based on a close observation of Eco-Carbone’s four small-holder projects, this paper will present the main aspects of each project and discuss the conditions they meet or not to be sustainable ventures for all parties involved.
2. Methodology
Since 20081, Eco-Carbone has been developing integrated jatropha value chains in four sites through the creation of lo-cal subsidiaries, namely:
• Jatropha Mali Initiative (JMI) founded under Malian law in 2008, in Kita, Kangaba and Bafoulabé districts (“Cercles”) in Mali,
• PT Eco-Emerald Indonesia (EEI) founded under Indonesian law in 2009 in Jayapura and Biak Regencies, Papua Province, Indonesia
• Eco-Energy (EEV) founded under Vietnamese law, in 2010, in Bac Binh and Tiy Phong districts of Binh Thuan Province, Vietnam
• Tan Phuc Linh (TPL) founded under Lao law, in 2010 in all districts of Savannakhet Laos.
Figure 1 shows the different locations of the project sites.These projects are closely monitored by Eco-Carbone’s
agronomists and project managers through regular fi eld visits and data collection (localization of plantations, number of trees planted, density of plantation, maintenance status, re-cording of new farmers, contract signing, grain collection data, etc.).
Moreover, research studies have been conducted by agron-omists, in the fi eld, in order to have a better understanding of the dynamics of the farming systems, the place jatropha oc-cupies and could occupy in these systems, whether or not jat-ropha is provoking land use changes, having an impact on food production and forest degradation.
Finally, a number of small scale research experiments aimed at optimizing jatropha cultivation practices in farmers’ conditions were set up in each project sites. These experi-ments provided suffi cient results to be able to demonstrate new techniques to fi eld technicians and to farmers.
This paper relies on all the above-mentioned documenta-tion generated by these activities. 1 Eco-Carbone launched pre-feasibility studies in Mali in 2007 and
founded JMI early 2008
132 FACTS Reports

Conditions for a sustainable win-win situation for farmers and the project developer
3www.factsreports.org
Figure 1. Location of Eco-Carbone’s four project sites
3. Results
3.1 General operational model of Eco-Carbone’s subsidiaries
While Eco-Carbone’s subsidiaries differ in their daily man-agement for cultural, historical and fi nancial reasons, the broad lines of the business models in all four subsidiaries are similar:
• Farmers own the land they till and remain the sole deci-sion makers concerning its use;
• Eco-Carbone’s subsidiary provides free technical ad-vice to farmers through teams of locally based fi eld technicians;
• Eco-Carbone provides seeds or seedlings either free of cost or at a subsidised rate;
• No large advance payments are made, which would distort farmers’ decisions on the short run and encour-age them to plant a crop which may not integrate well in their farming system;
• Eco-Carbone’s subsidiaries purchase jatropha grains from the farmers at a fi xed price for a given quality standard.
3.2 General climatic features of the project sites
3.2.1 Temperature and rainfall
Figure 22 to 5 present the climatic data for the four project sites.
2 Figure 2: source: http://www.gso.gov.vn/default_en.aspx?tabid=466&idmid=3&ItemID=11642 (average monthly temperature proxy Nha Trang) & Phan Thiet climatology centre (average monthly rainfall 2002 to 2007) Figure 3 : source: CMDT rainfall data 1990 to 2003 and Meteorological station for temperature 2010, Kita
Figure 4 : source: http://www.sentani.climatemps.com/ Figure 5 : source: http://www.world-climates.com/city-climate-savan-
nakhet-laos-asia/
Tem
pera
ture
(°C)
Graph 1. Climatic diagram of Binh Thuan
Rain
fall
(mm
)
400
300
200
100
0
200,0
150,0
100,0
50,0
0,0
Jan. Feb. March April May June July August Sept. Oct. Nov. Dec.
AVERAGE YEARLY RAINFALL: 1171mm
Rainfall (mm)Temperature (°C)
Figure 2. Climatic diagram of Binh Thuan
The main features of these climates are:
• A very marked dry season in Mali, Vietnam and Laos, with total rainfall ranging between 980mm (in Kita) and 1460 mm (in Laos) spread over 4 to 5 months
• In Papua rainfall is spread throughout the year with a total rainfall of more than 1 800 mm
• In all project sites the temperature amplitude is limited with temperatures oscillating around 27°C throughout the year. There is never a risk of frost.
3.2.2 Soil conditions (Appendix A)
These soil analyses show the two extreme situations observed in Eco-Carbone’s projects: Vietnam where jatropha is pro-moted on sandy soils with little or no nutrients and Papua where organic matter content of the soil and other nutrients are present in suffi cient quantity.
Tem
pera
ture
(°C)
Graph 2. Climatic diagram of Kita
Rain
fall
(mm
)400
300
200
100
0
200,0
150,0
100,0
50,0
0,0
Jan. Feb. March April May June July August Sept. Oct. Nov. Dec.
AVERAGE YEARLY RAINFALL: 986mm
Rainfall (mm)Temperature (°C)
Figure 3. Climatic diagram of Kita
133www.factsreports.org

Conditions for a sustainable win-win situation for farmers and the project developer
4 Field Actions Science Reports
Tem
pera
ture
(°C)
Graph 3. Climatic diagram of Jayapura
Rain
fall
(mm
)
400
300
200
100
0
200,0
150,0
100,0
50,0
0,0
Jan. Feb. March April May June July August Sept. Oct. Nov. Dec.
AVERAGE YEARLY RAINFALL: 1827mm
Rainfall (mm)Temperature (°C)
Figure 4. Climatic diagram of Jayapura
Tem
pera
ture
(°C)
Graph 4. Climatic diagram of Savannakhet
Rain
fall
(mm
)
400
300
200
100
0
200,0
150,0
100,0
50,0
0,0
Jan. Feb. March April May June July August Sept. Oct. Nov. Dec.
AVERAGE YEARLY RAINFALL: 1457mm
Rainfall (mm)Temperature (°C)
Figure 5. Climatic diagram of Savannakhet
3.2.3 Description of the project sites
The results of the observations and analysis of the four smallholder jatropha projects developed by Eco-Carbone, are sum-marised in Tables 1 to 4Table 1. Socio-economic and political context of the project sites
Mali – Jatropha Mali Initiative Laos – Tan Phuc Linh Vietnam – Eco-Energy Indonesia – Eco-Emerald
Country Population1 15.3 million 6.2 million 87.8 million Indonesia 239.8 million
Papua 2.4 million (Yun, 2010)
GDP/capita2 610 USD 1,130 USD 1,260 USD 2,940 USD
% Pop. living under the poverty line3
47.4% 27.6% 14.5% Indonesia: 12.5%
Papua: 41% (UNDP, 2002)
HDI4 175/177 138/177 128/177 124/177
Specifi c features in the project area
With cotton prices dwindling and a growing insecurity in the country, there are few agricultural market opportunities in the area. Illegal gold mining is a growing activity, which diverts the young agricultural work force from farming activities. This project area is in high need of market openings.
The emergence of new economic developments, the modernisation of the agriculture, new markets (rubber plantation, eucalyptus, sugar cane) through international companies can be observed in Savannakhet. As a consequence, land grabbing is becoming more frequent and with it the risk of smallholder farmers not benefi ting from the boom (Cottin, 2012).
Vietnam is the fastest developing economy in the region. While pockets of poverty remain, the opportunity cost of labour is increasing each year, and farmers have a quick rate of adoption of new farming opportunities. As a result, jatropha, with its comparatively lower income prospects is less considered as an interest-ing opportunity by farmers.
Native Papuans have least benefi tted from the country’s economic boom. The major economic activity is ore extraction by one mining company with negative impacts on local communities. While Papua benefi ts from some government subsidies, farmers have little incentive to modernise their agriculture, as they are not coupled with market incentives.
134 FACTS Reports

Conditions for a sustainable win-win situation for farmers and the project developer
5www.factsreports.org
National policies on energy and biofuels
A net importer of fuel, Mali is focussed on promoting local sources of energy. Jatropha has integrated in the new energy programme of the country. In 2008, the government planned to achieve 39.2 ML jatropha oil by 2013 and 84 ML by 2023. (Gouvernement du Mali, 2008).
In order to achieve these fi gures, Malian govern-ment is currently considering tax exemptions on biofuel producing companies
Laos is geared towards hydropower for electricity production. Substantial infrastructure has been developed recently (i.e. Nam Theun II).
However, Laos imports a large part of its liquid fuel for transportation. To compensate this, Laos is planning the production of 4 ML biofuel by 2015 and that biofuels make up 10% of total fuel use in by 2025 (Vientiane Times, 2012).
In addition, remote villages have yet to be connected to the grid.
Vietnam subsidizes the price of fuel to individual consumers.
Vietnam has made a plan to promote biofuel production in the country in order that biofuels represent 5% of the petrol and diesel used annually in the country within the next 15 years. This represents 1.8 MT ethanol and vegetable oils (Commodity Online, 2010; Advances biofuels USA, 2011). The plan has yet to be implemented. After being the subject of much oversized expectation, jatropha is not promoted anymore by the government.
Indonesia subsidises the price of fuel for private consumption. However, the state is expected to lower or suppress this subsidy soon.
In addition, the Indonesian government has set the target that by 2025, 20% of all diesel use will be fi lled by biodiesel (Hadiwidjoyo, 2009).
There is serious talk to subsidise biofuel production by allocating the subsidy to the biofuel producer (Slette and Wiyono, 2011).
Key economical fi gures on each of the projects’ sites
Price of 1 ManDay unqualifi ed labour (€/MD) 1.52 3.61 4.85 4.09
Price of 1 L diesel at the pump (March 2012) (€/L) 0.910 0.947 0.707 0.368
Market price of 1 kg jatropha grains (€/kg) 0.102 0.135 0.156 0.164
N kg dry grains to sell in one day to justify the labour opportunity cost
15 27 31 25
Table 2. Main agricultural features of the project sites
Mali – JMI TPL – Laos Eco-Energy – Vietnam Eco-Emerald - Indonesia
Farmer land rights Farmers own the land they till through a customary land right system. Apart from families who have re-cently moved in to the area and who are generally not allowed to plant trees on land which is given to them, all families have ac-cess to large areas of land. Land accessibility is gener-ally not an issue in this pro-ject area (Clerino, 2010).
Farmers own the land they till although offi cial land rights have yet to be dis-tributed for all types of land, especially rainfed land where slash and burn practices were and some-times are still carried out (Cottin, 2012).
Farmers own the land they till, although offi cial land rights are rarely issued for non-irrigated land. Planting trees on rainfed land is a means for farmers to secure their land rights (known as “red books”). If the planted trees are listed in the offi -cial “Forest tree list” estab-lished by the Ministry of Forest, farmers are eligible to a 50 year red book. If the tree is not on the list (like jatropha) the red book has a validity of 20 years (Luong, 2012a).
Farmers own the land they till through a customary land right system In case of confl icts with land owner-ship the cultural leaders arbitrate them. This can happen at the level of the villages, the district or even the province (Eco-Carbone, 2012a).
135www.factsreports.org

Conditions for a sustainable win-win situation for farmers and the project developer
6 Field Actions Science Reports
Agriculture production in the project site
Food crops such as millet, sorghum and maize and cash crops such as cotton and groundnut are pro-duced in a rotation on plots located close to the village. Plots are tilled continuous-ly between one to three years depending on their fertility and later left fallow one year depending on the capacity of the farmer to fertilise it.
Cattle are reared on plots further away from the vil-lage (Clerino, 2010).
Irrigated paddy cultivation takes place on paddy fi elds during the rainy season and more rarely also during the dry season.
Rainfed plots are cultivated according to a slash-and-burn system with a 5 to 10 year fallow period. Once the fallow plot is cleared, rainfed paddy, papaya, ba-nana, and other crops are cultivated during the rainy season. The following year the plot is left fallow and a new plot is cleared (Cottin, 2012).
Irrigation paddy cultivation takes place 2 to 3 times per year as irrigation systems are in place during the dry season. Moreover, irrigated paddy fi elds are being in-creasingly used as plots to grow dragon fruit. The cul-tivation of this perennial cactus is intensive in cap-ital and labour and provides high returns.
Along the coast, there are large expanses of unused sandy loams, where cattle are grazed or rainfed crops are produced to a limited extent.
Forests dominate; they serve as hunting and gathering ground. In some areas, this type of land is leased out and logged by companies.
Close to villages, land is cultivated according to a slash-and-burn rotation with a fallow period of up to 20 years. A number of short cycle crops (banana, papaya, cassava, maize, beans, taro, keladi, chilli, sweet potato) are associated.
Finally, large areas are oc-cupied by Imperata cylin-drica, an invasive grass (Degail, 2008a, 2008b; Moenne and Degail, 2012; Falloux, 2008).
Table 3. Features of the introduction of jatropha in the project areas
Mali – JMI TPL – Laos Eco-Energy – Vietnam Eco-Emerald - Indonesia
Jatropha was fi rst introduced in Mali at the time of the French col-onial rule in the early 19th century. It was used as a protective hedge around vegetable gardens.
In the late 1980s the German Cooperation agency (GIZ), studied the potential to use jatropha to make soap and as a biofuel and de-veloped a ten-year project to re-valorize the jatropha hedges (Henning, 2007).
Jatropha is thus well known when JMI starts operating in Kita in 2007. Jatropha is then fi rst promot-ed as a monoculture on marginal land far from the village. This strat-egy proved ineffi cient as the dis-tance and long term expected re-turns of the tree meant that plantations were not taken care of regularly.
Jatropha is now promoted as part of an agro-forestry system, where it is intercropped with the usual annual crops on plots closer to the village. Farmers are increasingly adopting this system (JMI data).
Jatropha was introduced during the French colonial rule and used as a hedge, but at a lesser level than in Mali.
Prior to TPL’s presence, the Farmer Association of Savannakhet, and two major Lao companies, under the impulse of national policies, started planting jatropha trees with farmer communities as early as 2007. With no long-term strategy planned, the operators couldn’t honour their commitments to the farmers and left.
TPL started its activities within this context: farmers knew about jatro-pha but had been left by the previ-ous operators. Their trust was thus limited.
Farmers intercrop jatropha with their rainfed rice and short term crops following the slash and burn of their 3 to 5 year fallow land. Due to their lack of trust in jatropha operators, they didn’t tend to their jatropha plots once they shifted to a new plot and left the old one fallow (Cottin, 2012).
TPL’s main challenge is thus to win the farmers’ trust and deliver qual-ity technical messages for them to take care of their jatropha.
Jatropha pre-existed in Binh Thuan province as large hedges growing on sandy land along paths.
Jatropha is being promoted as a tree which will limit the encroachments of the sand dunes. Initial trials on plots made of sandy loams far from the villages, prone to cattle grazing and subject to little maintenance, not surprisingly gave poor results.
Jatropha is now being promoted in agro-forestry systems where jatro-pha is intercropped with existing annual crops such as cassava. Tests have led to the defi nition of cultiva-tion practices, which make it pos-sible to produce jatropha fruits on sandy loams. This includes adding fertility, cultivating intercrops and using older seedlings than usual (Luong, 2012b).
Alternatively, other more profi table opportunities, associated with a general low density of population, renders it very diffi cult to make jat-ropha cultivation a profi table and interesting venture for farmers and project developers in this area.
Jatropha was introduced in the late 1940s by the Japanese colonial power for biofuel production.
Although farmers did little with the jatropha, they were familiar with the plant when Eco-Emerald start-ed its activities in 2009.
Farmers chose to integrate jatropha as part of their slash-and-burn sys-tem. In this case, jatropha is planted along with a diversity of other crops. The challenge is to persuade farmers to continue maintaining their jatropha once they have shift-ed to another plot.
Jatropha cultivation is also being promoted on imperata grassland, which Papuan farmers, till now didn’t have the means to cultivate. R&D is ongoing to propose the optimal cultivation practices, which reduce the production costs of jatropha while delivering suffi -cient yields. The plantations of jat-ropha have been established by farmers in distant plots; the labour required to harvest, transport and shell the fruits is higher than ex-pected, which has led to the intro-duction by Eco-Emerald of shel-lers, which divide by 5 the shelling time (Fourtet, 2010).
136 FACTS Reports

Conditions for a sustainable win-win situation for farmers and the project developer
7www.factsreports.org
Table 4. Achievements and challenges faced by the four projects
Mali – JMI TPL – Laos Eco-Energy – Vietnam Eco-Emerald - Indonesia
Ach
ieve
men
ts
Between 2008 and 2011
4,500 farmers have planted 4,000,000 jatropha trees with the support of JMI.
About 100 tons of grains have been purchased in 2011/12 to the farmers.
8 tons of oil were produced in 2010/11. Some experiments on locally set-up generators are being conducted.
JMI is now promoting the cropping of sunfl ower, which JMI purchases to produce edible oil sold locally.
Between 2008 and 2012
About 1,000 farmers have planted 550,000 jatropha trees with the support of TPL.
5 MT grains were purchased in 2011 and around 20 T grains are planned for purchase in 2012
First experiments with jatropha oil have been conducted on hand tractors.
TPL continues to strengthen its ties with the association of farmers in Savannakhet and works with it to provide full support to farmers.
Between 2010 and 2012
About 100 farmers have planted 100,000 trees with the support of EEV.
A R&D programme aimed at developing optimal cultivation practices for jatropha to grow and produce fruits, in farmers’ conditions and on poor sandy loams has given some positive results (Luong, 2012b).
Between 2009 and 2012
Around 700 farmers have planted 500,000 trees, which are now producing.
20 tons of grains have been purchased since 2009.
4 tons of oil have been produced so far.
Jatropha starts producing only 4 months after transplanting and the production is the highest among all four projects.
R&D to develop cultivation practices to reclaim imperata grassland through agroforestry systems integrating jatropha and annual crops has started to yield interesting results.
Chal
leng
es
While JMI faces competition from other players in the zone to purchase farmers’ grains, the main challenge remains the long period required for jatropha to produce grain, due to low yearly rainfall, and termite attacks. JMI is developing integrated pest management solutions, promoting agroforestry models and currently testing improved genetics.
TPL needs to build strong trust ties with the farmers. Roads and infrastructure being very poor, TPL also needs to optimise its transport costs in order to become profi table. Moreover, TPL has to focus in the future on areas where alternative farming income opportunities are low and thus where jatropha will be a welcome additional income by farmers.
EEV has yet to be sure jatropha will produce profi table quantities of grain on the sandy loam. Moreover, with a number of alternative farming income opportunities, farmers are not interested in jatropha which requires a lot of work com-pared to the returns. .
Jatropha has yet to be a profi table venture for farmers because of the high opportunity cost of the labour and compet-ing subsidised crops such as cocoa.
Eco-Emerald has to fi nd innovative ways to encourage farmers to plant jatropha, reduce their production costs and improve their productivity in order to increase their profi t/cost ratio.
137www.factsreports.org

Conditions for a sustainable win-win situation for farmers and the project developer
8 Field Actions Science Reports
4. Discussion
Based on the description, achievements and challenges fac-ing the four jatropha projects described above, we discuss here the main aspects, which should be looked into prior to the inception and during the development of any smallholder based jatropha project.
4.1 The necessary climatic, agricultural and socio-economic pre-requisites
4.1.1 Required soil and climatic patterns for jatropha to strive
Jatropha does grow in a diversity of pedo-climatic conditions as soil analysis of the project sites show. Nevertheless, as ob-served especially in Vietnam and Mali where nutrient con-tents of the soil are low, adapted quantities of fertilizers need to be added per planting pit to make sure the seedlings de-velop and produce the following season.
When clay contents are too high and large quantities of rain fall at once as is the case in Laos, Papua and Mali, the soil may become waterlogged and cause the death of even old jatropha trees.
Eco-Carbone’s projects have therefore avoided areas prone to even temporarily fl ooding as well as areas prone to regular cyclones or storms.
4.1.2 Presence of jatropha prior to inception of the project
Introducing new species in an environment not only triggers serious ethical questions, it can also have unforeseen conse-quences, such as undesired crossings or mutations.
Moreover, while jatropha pre-exists on all Eco-Carbone project sites as a hedge, farmers are initially still either reluc-tant to establish the tree in a plantation or rely on their knowl-edge of the tree as a rustic species to limit their maintenance of it. Their acceptance would have been even lower had they not known the plant in the fi rst place.
4.1.3 A secured land access
In all Eco-Carbone project sites, farmers were willing to plant jatropha only on land where they had a secure right, most often a customary land right. Interestingly, in Laos and Vietnam, planting jatropha was a way for farmers to secure formally their land right (Cottin, 2012; Luong, 2012a).
In Chhattisgarh in India, the state government fi nanced the establishment of jatropha plantations in a work-for-money programme. The plantations were established but neither maintained nor harvested. The main reason being the land where the plantations had been established belonged to no one (Chantry and Degail, 2011).
4.1.4 A pro� table complementary agricultural income for farmers
Jatropha, integrated in the farming system, will provide a
complementary income to the existing farming income. Therefore, farmers will be keen to invest their means of pro-duction at the pro rata of their expected returns.
On all four project sites, it is observed that given the choice, farmers do not substitute their existing food crops or cash crops, with a perennial shrub which they only know as a fence. At best, they fi nd ways to include it in their existing farming activities without having it compete for labour espe-cially at the peak times. This observation is further developed by GERES in Mali (Pallière and Fauveaud, 2009).
Be it in Mali, Laos or Vietnam, the inception of the rainy season is peak working time in the agricultural calendar. It is also the best time to transplant jatropha seedlings. In all proj-ect sites, farmers prioritize all the other crops before jatropha. The project teams worked with the farmers to defi ne together a suboptimal time of the year to establish the jatropha planta-tion: either shortly before the inception of the rainy season or directly after the end of the sowing of their usual crops.
Moreover, Eco-Carbone realized how crucial it was to esti-mate the agricultural and non-agricultural income opportuni-ties that different farmers have on a given project site and compare them with the potential income of jatropha. In Vietnam for example, new income opportunities have fl our-ished quickly since 2010 turning the interest away from jatropha.
Studying closely the project sites’ farming system has en-abled Eco-Carbone to propose better adapted techniques and farming practices than the ones, which were presented at the very initial stages. For example, Eco-Carbone promotes to-day the inclusion of jatropha in agro-forestry systems which are being widely adopted by farmers who see many technical and fi nancial advantages in intercropping jatropha with their annual food and cash crop.
Figure 6. Women group in charge of maintaining a nursery in Daféla commune, Kita district, Mali
4.1.5 The required political and economic context
4.1.5.1 General strength of the economy
A country’s Gross Domestic Product per capita, its poverty rate are all indicators which need to be taken cautiously but
138 FACTS Reports

Conditions for a sustainable win-win situation for farmers and the project developer
9www.factsreports.org
which give an indication of the income expectations of the population and the farmers in particular. Jatropha will be all the more adopted by farmers as they are living in areas with low and few income opportunities.
Eco-Carbone has realized that the projects which develop best are those where there is a suffi cient spread between the cost of oil at the pump and the opportunity cost of 1 man-day.
In Mali, for instance, Eco-Carbone can observe more inter-est for jatropha than in other countries. In Mali, one man day has to harvest and sell more than 15kg/day to earn more than if he sold his labour on the unqualifi ed labour market. In Vietnam, this value is doubled, which explains why farmers in Vietnam are much less keen than those in Mali to produce jatropha.
4.1.5.2 National policies on energy
The price of the jatropha oil sold as a fuel is closely related to the price of fossil fuel. The price of fossil fuel depends not only on the world price but also on the legislation in place concerning the price of energy.
Moreover, the government’s position on jatropha and bio-fuel also impacts the profi tability of a project. The contrasting positions of Vietnam and Mali illustrate this. While Mali is slowly developing policies favoring the sector, Vietnam has opted for crops with faster returns such as cassava or sugar cane.
4.2 Key factors in project development
4.2.1 The human dimension: building trust
In such jatropha projects, farmers are at the centre of the ac-tivity. They remain the sole decision makers on their plots, on whether to establish, maintain, harvest and ultimately sell the jatropha grain. The project developer thus needs to build with them a long-term relationship based on trust, mutual respect and a good understanding of their needs and problems in or-der to fi nd adapted solutions.
Figure 7. Farmer training on jatropha transplanting in Doyo-baru, Sentani, Papua
4.2.2 Financing the long-run with short term revenues
This condition concerns both the farmers and the project developer.
Jatropha produces grains at best from year two. Even though it is a complementary cash crop, the farmer does not generate enough revenue for his work on jatropha during the fi rst two years.
For the project developer, there is a long period of time to reach scalable grain quantities. As a consequence, the project developer has to mobilize and secure high amounts of money during these fi rst years. This can become a major risk of fail-ure for the project.
4.2.2.1 Facilitating the generation of short term revenues for the farmer
In order for farmers to both maintain their jatropha planta-tions and generate short-term revenues, Eco-Carbone advises to intercrop jatropha with annual crops. By doing so, farmers maintain their plot and the fertilizer that is spread on the an-nual crops indirectly benefi ts the jatropha. Moreover, when possible as in Mali, the operator purchases the annual crop (sunfl ower) from the farmer, thus securing the short-term revenue.
4.2.2.2 Facilitating the generation of short-term revenues for the project developer
When certain conditions are met, jatropha trees sequestrate carbon and it is possible to generate sequestration carbon credits. Eco-Carbone, in Mali developed a carbon project, which was validated in 2012 (Verifi ed Carbon Standard, 2012).
In 2007, EC’s subsidiary JMI had sold 400,000 tCO2e to Novartis. This fi nancing was crucial for the development of the Malian project. As a counterpart, Novartis receives from JMI, the carbon credits once they are generated. The fi rst de-livery of carbon credits took place in 2012 (Eco-Carbone, 2012b).
4.2.3 Optimising production and purchase
A common observation on all four projects is that the mass of grains produced by the farmers and purchased by the com-pany is a key factor, which determines the survival of a project.
The purchase price is a key driver behind the choice of farmers to get involved in jatropha cultivation. Nevertheless, the project developer has limited room for maneuver to in-crease this purchase price as it mainly depends on the market prices of the end products (oil and fertilizer), which are large-ly out of the project developer’s control.
Therefore on all project sites, Eco-Carbone strives to in-crease the yield potential and lower farmer production costs.
Eco-Carbone has set up an R&D programme on all project sites, aimed at fi nding the optimal cultivation practices, which will increase the yields. Moreover, Eco-Carbone is working closely with Quinvita, a company specialized in jat-ropha breeding in order to select the genetic material best adapted to the different ecological conditions and double the
139www.factsreports.org

Conditions for a sustainable win-win situation for farmers and the project developer
10 Field Actions Science Reports
existing yields (Quinvita, 2011).In Papua, farmers only have machetes, which is not a tool
adapted to cutting grass or to weeding a plot (Mazoyer and Roudart, 2002). After discussions with farmers, simple tools required to cultivate jatropha and reduce their labor inputs (plastic sheets to dry their seeds, whipper snippers to reduce weeding time) were distributed to farmers along with close monitoring of the organization of the farmer groups on how the tools should be shared and maintained.
Harvesting and post harvesting of jatropha is a bottleneck. A mechanical nut-sheller developed by The Full Belly Project, a USA based NGO, was promoted in the Laos, Vietnam and Papua with success. The introduction of these shellers in the communities divided by 5 the labour requirements.
4.2.4 Finding local outlets
In order to maximize the social and economical aspect of such projects oil and the seedcake are sold locally.
Transporting oil to other countries would increase its car-bon footprint; besides, there is a strong demand for such products in countries, which are importing their fuel at high cost.
As a consequence, by selling the jatropha oil in the country where it is produced, Eco-Carbone maximizes its environ-mental benefi t and contributes to lowering the country’s en-ergy expenditures.
Finally, as it is observed in Eco-Carbone’s four projects, farmers are all the more motivated in getting involved in the production of jatropha when they also consume themselves the end products such as oil or organic fertilizers.
5. Conclusion
The jatropha projects described in this paper have had to adapt and be creative in order to jointly benefi t to the com-munities and the project developer.
The selected project site respects a number of economical, climatic and soil conditions. The design and management of the project keeps its long-term social, economical and envi-ronmental sustainability at its centre.
The corner stone guaranteeing the long-term sustainability of a project and thus its benefi t to the communities and the project operator alike is the mass of quality grains collected. This factor is strongly correlated with the yield on the one hand and the economic incentive for farmers to manage their jatropha plantation, harvest, shell and dry the fruits on the other hand.
The jatropha project developer shall thus make sure that all agronomic conditions are gathered for jatropha to grow and produce well, develop R&D experiments to adapt cultivation practices to local conditions, strive to fi nd the best genetics for a given project site and train farmers on all aspects of jatropha management.
The jatropha project developer shall also monitor closely the production costs incurred by the farmers and the benefi ts they yield from the sale of their production. The project op-erator shall thus adjust the price within the range
of its possibilities; largely depending on the price of oil and fertilisers which operators have little power over. The project developer can also dedicate its effort in fi nding ways to add more value to its production: biopesticide production from the oil and animal feed from the seedcake for instance. In parallel, lowering farmers’ production costs is another solu-tion to improve the benefi t/cost ratio of the farmers. It can also entail the identifi cation of appropriate tools such as the shellers introduced recently.
Once yield is secured over a few years time, all the other conditions shall reinforce the alignment of the interests be-tween the communities and the project developer.
Until jatropha reaches maturity, the project developer shall fi nd solutions to ensure short-term revenues for both himself and the communities. In Eco-Carbone’s project, integrating jatropha as part of an agro-forestry system where annual cash and food crops are produced on the same plot has proven an effi cient solution for the communities and so has pre-selling carbon credits for the project developer.
References
Achten, W.M.J. et al. (2008), ‘Jatropha bio-diesel production and use’, Biomass and Bioenergy, 32: 1063–1084.
Achten, W.M.J. et al. (2010), ‘Towards domestication of Jatropha curcas’, Biofuels, 1: 91–107.
Advances biofuels USA (2011) ‘Vietnam Joins Race for Biofuel’, Advances biofuels USA, http://advancedbiofuelsusa.info/viet-nam-joins-race-for-biofuel (Accessed August 24, 2012).
Baker, P., and Z. Ebrahim (2012), Jatropha - an update. Part 1: the business. UK: CABI
Bako-Arifari, N., and P.-Y. Le Meur (2001), ‘Une anthropologie sociale des dispositifs du développement’, L’évaluation des poli-tiques de développement. Approches pluridisciplinaires, Paris: L’Harmattan. pp.121–173
Bogdanski, A., O. Dubois, C. Jamieson, and R. Krell (2010), Making integrated food-energy systems work for people and climate, an overview. Climate, energy and tenure divisions publications. Rome: FAO
Brittaine, R., and N. Lutaladio (2010), Jatropha: a smallholder bio-energy crop, the potential for pro-poor development. Rome: FAO
Chantry, J., and A.-C. Degail (2011), India Field Trip Report, Paris: Eco-Carbone
Clerino, P. (2010), Introduction du Jatropha curcas L. dans les sys-tèmes de productions du cercle de Kita, Mali; dans le cadre d’un projet de reforestation générant des crédits carbone de séquestra-tion, Mémoire de Master, Paris: AgroParisTech
Commodity Online (2010) ‘Vietnam joins race for biofuel’, Commodity Online, http://www.commodityonline.com/news/vietnam-joins-race-for-biofuel-32124-3-32125.html (Accessed August 24, 2012).
Cottin, F. (2012), Dynamiques du système agraire de la région de Savannakhet et leurs implications sur l’introduction d’une nou-velle culture pérenne. Paris: Eco-Carbone.
Degail, A.-C. (2008a), Evaluation of Biak and Jayapura sites for the development of Jatropha curcas plantations. Paris: Eco-Carbone.
Degail, A.-C. (2008b), Mission Report - Jatropha workshop in Biak and Jayapura, Launching the experimental plots. Paris: Eco-Carbone
Dufumier, M. (1996), Les projets de développement agricole: ma-nuel d’expertise. KARTHALA Editions.
140 FACTS Reports

Conditions for a sustainable win-win situation for farmers and the project developer
11www.factsreports.org
Eco-Carbone (2010), ‘Eco-Carbone’s jatropha model: 10 reasons why jatropha can both be a sustainable and a profi table invest-ment’, Paris: Eco-Carbone
Eco-Carbone (2012a), (2012), ‘Papua customary rights’, Paris:Eco-Carbone
Eco-Carbone (2012b), ‘Press release: Eco-Carbone receives VCS certifi cation for the carbon development of its Malian project’, Paris: Eco-Carbone.
Fact-Foundation (2006), ‘Fuels from Agriculture in Communal Technology - Mali - PPO village electrifi cation’, http://www.fact-foundation.com/en/Biofuel_Projects/Biofuel_Projects/Mali_-_PPO_village_electrifi cation
Falloux, F. (2008), Eco-Emerald - Technical Report. Paris: Eco-Carbone.
Fourtet, N. (2010), ‘Décortiqueuse manuelle’, Bamako: GERES.GERES (2008), ‘ALTERRE - Agrocarburants Locaux, TERritoires
Ruraux et Energie’, Groupe Energies Renouvelables, Environnement et Solidarités, http://www.geres.eu/fr/production-denergie-propre/51-alterre-agrocarburants-locaux-territoires-ruraux-et-energie-mali
Gittinger, J. (1984), Economic analysis of agricultural projects. Economic Development Institute The World Bank.
Gouvernement du Mali (2008) ‘Stratégie nationale pour le dévelop-pement des biocarburants’, .
Grieg-Gran, M., and E. Wilson (2007), ‘NGOs as market actors, Roles and responsibilities in supporting small producers in low-income countries’, p. 17, London: International Institute for Environment and Development
Hadiwidjoyo, S. (2009) ‘Indonesia biofuels policy, Deployment and plans’, http://www.iea.org/work/2009/bangkok/1_2_Hadiwidjoyo.pdf (Accessed August 24, 2012).
Heller, J. (1996), Physic nut Jatropha curcas L. Germany: International Plant Genetic Resources Institute
Henning, R.K. (2007), Jatropha curcas in Africa. Weissenberg: Global Facilitation Unit for Underutilized Species
Jongschaap, R.E.E., W.J. Corré, P.S. Bindraban, and W.A. Brandenburg (2007), Claims and Facts on Jatropha curcas L., global Jatropha curcas evaluation, breeding and propagation pro-gramme. Wageningen: Plant Research International B.V., Wageningen UR
Luong, M. (2012a), ‘Red Book - Binh Thuan Province’, Vietnam: Eco-Energy Vietnam.
Luong, M. (2012b), Conditions required to cultivate jatropha on sandy loams in Binh Thuan Province, Vietnam. Binh Thuan: Eco-Energy Vietnam.
Mazoyer, M., and L. Roudart (2002), Histoire des agricultures du monde. Du néolithique à la crise contemporaine. Points Histoire.
Moenne, M., and A.-C. Degail (2012), Imperata study: how to opti-mise jatropha cultivation practices on imperata grasslands. Sentani: Eco-Emerald.
Nyetaa (2012), ‘Mali Folkecenter’, http://www.malifolkecenter.org/Pallière, G., and S. Fauveaud (2009) Les enjeux des agrocarburants
pour le monde paysan au Mali. Bamako: GERESPirot, R., and M. Domergue (2008), Jatropha curcas L, rapport de
synthèse bibliographique. CIRADPohl, C. (2010), jatropha: money doesn’t grow on trees, ten reasons
why jatropha is neither a profi table nor sustainable investment. Friends of the earth
Quinvita (2011) ‘Press release : QUINVITA and Eco-Carbone stra-tegic alliance’, Belgium: Quinvita
Slette, J., and I.E. Wiyono (2011) Indonesia, Biofuels Annual 2011. Jakarta: USDA Foreign Agriculture Service http://gain.fas.usda.gov/Recent%20GAIN%20Publications/Biofuels%20Annual_Jakarta_Indonesia_8-19-2011.pdf (Accessed August 24, 2012).
UNDP (2002) ‘UNDP Indonesia - Supporting Development in Tanah Papua’, United Nations Development Programme, Indonesia, http://www.undp.or.id/papua/
UNDP (2012) ‘International Human Development Indicators - UNDP’, International Human Development Indicators, http://hdr.undp.org/en/data/profi les/
United Nations, Department of Economic and Social Affairs (2010) ‘World Population Prospects, the 2010 Revision’, Population Division, Population Estimates and Projection Section, http://esa.un.org/unpd/wpp/Sorting-Tables/tab-sorting_population.htm
Verifi ed Carbon Standard (2012) ‘Jatropha curcas grouped project in Mali’, The VCS Project Database, https://vcsprojectdata-base2.apx.com/myModule/Interactive.asp?Tab=Projects&a=2&i=829&lat=13.1828259998737&lon=9.32054409999992&bp=1
Vientiane Times (2012) ‘Biofuels a growing industry in Laos’, Yahoo! News Philippines, http://ph.news.yahoo.com/biofuels-growing-industry-laos-054005997.html (Accessed August 24, 2012).
World Bank (2012) ‘Data, Countries and Economies’, http://data.worldbank.org/country/
Yun, J. (2010) ‘The Status of Papua, Indonesia’, http://www.state.gov/p/eap/rls/rm/2010/09/147551.htm
141www.factsreports.org

Conditions for a sustainable win-win situation for farmers and the project developer
12 Field Actions Science Reports
Appendices
Appendix A: Soil Analyses
142 FACTS Reports