Factors Involved in the Regulation of Gastrointestinal Motility ...
409
Factors Involved in the Regulation of Gastrointestinal Motility, Hormone Release, Symptoms and Energy Intake in Health and Patients with Functional Dyspepsia A thesis submitted by Amelia Pilichiewicz For the degree of Doctor of Philosophy Discipline of Medicine University of Adelaide January 2008
-
Upload
khangminh22 -
Category
Documents
-
view
2 -
download
0
Transcript of Factors Involved in the Regulation of Gastrointestinal Motility ...

Factors Involved in the Regulation of
Gastrointestinal Motility, Hormone Release,
Symptoms and Energy Intake in Health and
Patients with Functional Dyspepsia
A thesis submitted by
Amelia Pilichiewicz
For the degree of
Doctor of Philosophy
Discipline of Medicine
University of Adelaide
January 2008

TABLE OF CONTENTS
LIST OF ABBREVIATIONS .................................................................... I
THESIS SUMMARY ............................................................................... III
DECLARATION OF ORIGINALITY .................................................. IX
DEDICATION............................................................................................ X
ACKNOWLEDGEMENTS..................................................................... XI
PUBLICATIONS ARISING FROM THIS THESIS..........................XIV
Chapter 1
EFFECTS OF NUTRIENTS ON THE GASTROINTESTINAL
TRACT, GASTROINTESTINAL HORMONE RELEASE AND
ENERGY INTAKE
1.1 INTRODUCTION ........................................................................................... 1
1.2 ANATOMY AND FUNCTION OF THE GASTROINTESTINAL TRACT.. 2
1.2.1 Stomach ................................................................................................... 2
1.2.2 Pylorus ..................................................................................................... 2
1.2.3 Small intestine.......................................................................................... 3
1.3 GASTROINTESTINAL MOTOR FUNCTION AND ITS ROLE IN
GASTRIC SENSATIONS, APPETITE AND ENERGY INTAKE ................ 4
1.3.1 Fasting motor patterns ............................................................................. 4
1.3.2 Fed motor patterns ................................................................................... 5

1.4 GASTROINTESTINAL HORMONE RELEASE AND SUPPRESSION
AND THEIR EFFECTS ON GASTROINTESTINAL MOTILITY AND
ENERGY INTAKE........................................................................................ 13
1.4.1 Cholecystokinin (CCK) ......................................................................... 14
1.4.2 Peptide Tyrosine Tyrosine (PYY) ......................................................... 16
1.4.3 Ghrelin ................................................................................................... 18
1.4.4 Glucagon-like peptide-1 (GLP-1).......................................................... 20
1.4.5 Glucose-dependent insulinotropic polypeptide (GIP) ........................... 22
1.4.6 Insulin .................................................................................................... 23
1.5 FACTORS THAT MODULATE THE EFFECTS OF NUTRIENTS ON
GASTRIC EMPTYING, MOTILITY, HORMONE
RELEASE/SUPPRESSION, APPETITE AND ENERGY INTAKE............ 25
1.5.1 Effects of length of small intestinal exposure to nutrient ...................... 26
1.5.2 Effects of region of small intestinal exposure to nutrient ...................... 29
1.5.3 Effect of load ......................................................................................... 31
1.5.4 Effects of duration of exposure of the small intestine to nutrient.......... 34
1.6 GASTROINTESTINAL MOTILITY DISORDERS..................................... 37
1.7 SUMMARY................................................................................................... 37
Chapter 2
FUNCTIONAL DYSPEPSIA
2.1 INTRODUCTION ......................................................................................... 38
2.2 DEFINITION OF FUNCTIONAL DYSPEPSIA.......................................... 39
2.3 PREVALENCE AND COSTS OF FUNCTIONAL DYSPEPSIA ............... 40

2.4 PATHOPHYSIOLOGY OF FUNCTIONAL DYSPEPSIA -
RELATIONSHIP TO GASTROINTESTINAL FUNCTION ....................... 42
2.4.1 Helicobacter pylori and acid secretion .................................................. 42
2.4.2 Delayed gastric emptying ...................................................................... 43
2.4.3 Intragastric meal distribution ................................................................. 45
2.4.4 Impaired gastric relaxation .................................................................... 46
2.4.5 Dysfunction of the antrum ..................................................................... 48
2.4.6 Integration of proximal and distal gastric function................................ 50
2.4.7 Visceral hypersensitivity........................................................................ 51
2.5 ROLE OF DIET............................................................................................. 52
2.5.1 Food intolerance .................................................................................... 53
2.5.2 Patterns of food ingestion ...................................................................... 53
2.5.3 Influence of individual macronutrients on symptoms ........................... 54
2.6 GASTROINTESTINAL HORMONE RELEASE AND SUPPRESSION .... 57
2.7 COGNITIVE INFLUENCES ........................................................................ 58
2.8 SUMMARY.................................................................................................... 61
Chapter 3
TREATMENT OPTIONS FOR FUNCTIONAL DYSPEPSIA
3.1. INTRODUCTION ......................................................................................... 62
3.2 COMMON PHARMACOTHERAPIES USED FOR THE TREATMENT OF
FUNCTIONAL DYSPEPSIA........................................................................ 64
3.2.1 Prokinetics ............................................................................................. 64
3.2.2 Fundus-relaxing agents .......................................................................... 70

3.2.3 Antisecretory drugs and antacids........................................................... 71
3.2.4 Helicobacter pylori eradication ............................................................. 73
3.2.5 Tricyclic antidepressants........................................................................ 74
3.3 NON-PHARMACOLOGICAL THERAPY AND ALTERNATIVE
MEDICINCES ............................................................................................... 76
3.3.1 Acupuncture........................................................................................... 76
3.3.2 Hypnotherapy......................................................................................... 77
3.4 HERBAL PREPARATIONS......................................................................... 78
3.4.1 Clinical trials of mono-preparations ...................................................... 79
3.4.2 Clinical trials of combination preparations............................................ 82
3.4.3 Iberogast®.............................................................................................. 85
3.5 SUMMARY................................................................................................... 96
Chapter 4
COMMON METHODOLOGIES
4.1 INTRODUCTION ......................................................................................... 98
4.2 SUBJECTS ..................................................................................................... 98
4.2.1 Subject recruitment ................................................................................ 98
4.2.2 Common exclusion criteria.................................................................. 100
4.2.3 Additional exclusion criteria for functional dyspepsia patients........... 100
4.3 ETHICS COMMITTEE APPROVAL.......................................................... 101
4.4 STUDY TREATMENTS.............................................................................. 101
4.4.1 Yoghurt preloads.................................................................................. 101
4.4.2 Intraduodenal infusions........................................................................ 104

4.4.3 Iberogast®............................................................................................ 105
4.5 TECHNIQUES ............................................................................................ 106
4.5.1 High-resolution manometry................................................................. 106
4.5.2 Barostat ................................................................................................ 109
4.5.3 Scintigraphy ......................................................................................... 111
4.5.4 Ultrasonography................................................................................... 113
4.5.5 Assessment of eating behaviour and perception.................................. 114
4.5.6 Assessment of symptoms, quality of life, personality and psychological
distress .............................................................................................................. 119
4.5.7 Blood sampling .................................................................................... 122
4.5.8 Biochemical analysis ........................................................................... 123
4.6 STATISTICAL ANALYSIS ........................................................................ 126
Chapter 5
EFFECTS OF LOAD, AND DURATION, OF DUODENAL LIPID ON
GUT MOTILITY, PLASMA CCK AND PYY AND ENERGY
INTAKE IN HEALTHY MEN
5.1 SUMMARY.................................................................................................. 127
5.2 INTRODUCTION ....................................................................................... 128
5.3 SUBJECTS AND METHODS .................................................................... 131
5.3.1 Subjects................................................................................................ 131
5.3.2 Study outline ........................................................................................ 131
5.3.3 Intraduodenal infusions........................................................................ 131

5.3.4 Protocol................................................................................................ 132
5.3.5 Measurements ...................................................................................... 133
5.3.6 Data and statistical analyses ................................................................ 134
5.4 RESULTS .................................................................................................... 135
5.4.1 Antropyloroduodenal pressures ........................................................... 135
5.4.2 Plasma hormone concentrations .......................................................... 140
5.4.3 Appetite perceptions ............................................................................ 141
5.4.4 Energy intake ....................................................................................... 142
5.5 DISCUSSION.............................................................................................. 151
5.6 CONCLUSIONS ......................................................................................... 158
Chapter 6
LOAD-DEPENDENT EFFECTS OF DUODENAL LIPID ON
ANTROPYLORODUODENAL MOTILITY, PLASMA CCK AND
PYY, AND ENERGY INTAKE IN HEALTHY MEN
6.1 SUMMARY................................................................................................. 159
6.2 INTRODUCTION ........................................................................................ 160
6.3 SUBJECTS AND METHODS ..................................................................... 162
6.3.1 Subjects................................................................................................ 162
6.3.2 Study outline ........................................................................................ 162
6.3.3 Intraduodenal infusions........................................................................ 162
6.3.4 Protocol................................................................................................ 163
6.3.5 Measurements ...................................................................................... 164

6.3.6 Data and statistical analyses ................................................................ 165
6.4 RESULTS .................................................................................................... 166
6.4.1 Antropyloroduodenal pressures ........................................................... 167
6.4.2 Plasma hormone concentrations .......................................................... 169
6.4.3 Appetite perceptions ............................................................................ 170
6.4.4 Energy intake ....................................................................................... 171
6.4.5 Relations of antropyloroduodenal motility and plasma cholecystokinin
and peptide YY with appetite perceptions and energy intake .............................. 172
6.4.6 Predictors of energy intake .................................................................. 174
6.5 DISCUSSION.............................................................................................. 181
6.6 CONCLUSIONS ......................................................................................... 185
Chapter 7
LOAD-DEPENDENT EFFECTS OF DUODENAL GLUCOSE ON
GLYCAEMIA, GASTROINTESTINAL HORMONES,
ANTROPYLORODUODENAL MOTILITY AND ENERGY INTAKE
IN HEALTHY MEN
7.1 SUMMARY................................................................................................. 187
7.2 INTRODUCTION ....................................................................................... 188
7.3 SUBJECTS AND METHODS .................................................................... 191
7.3.1 Subjects................................................................................................ 191
7.3.2 Study outline ........................................................................................ 191
7.3.3 Intraduodenal infusions........................................................................ 192

7.3.4 Protocol................................................................................................ 192
7.3.5 Measurements ...................................................................................... 193
7.3.6 Statistical analysis................................................................................ 194
7.4 RESULTS .................................................................................................... 196
7.4.1 Blood glucose and plasma hormone concentrations............................ 196
7.4.2 Antropyloroduodenal pressures ........................................................... 200
7.4.3 Energy intake ....................................................................................... 203
7.4.4 Relations between antropyloroduodenal motility, blood glucose,
hormones and energy intake ................................................................................. 203
7.4.5 Predictors of insulin concentrations and energy intake ....................... 205
7.5 DISCUSSION.............................................................................................. 212
7.6 CONCLUSIONS ......................................................................................... 218
Chapter 8
IN FUNCTIONAL DYSPEPSIA ORAL CARBOHYDRATE AND
FAT DIFFERENTIALLY MODULATE SYMPTOMS, GUT
HORMONES AND ANTRAL AREA
8.1 SUMMARY.................................................................................................. 219
8.2 INTRODUCTION ....................................................................................... 220
8.3 SUBJECTS AND METHODS .................................................................... 223
8.3.1 Subjects................................................................................................ 223
8.3.2 Study outline ........................................................................................ 223
8.3.3 Preloads................................................................................................ 223

8.3.4 Protocol................................................................................................ 224
8.3.5 Measurements ...................................................................................... 224
8.3.6 Data and statistical analyses ................................................................ 225
8.4 RESULTS .................................................................................................... 226
8.4.1 Gastrointestinal symptoms and appetite perceptions............................ 226
8.4.2 Blood glucose and plasma hormone concentrations............................ 228
8.4.3 Antral area............................................................................................ 233
8.4.4 Energy intake ....................................................................................... 234
8.4.5 Relations between symptoms, appetite-related sensations, blood glucose,
plasma hormones, antral area and energy intake .................................................. 234
8.5 DISCUSSiON .............................................................................................. 242
8.6 CONCLUSIONS ......................................................................................... 247
Chapter 9
RELATIONSHIP BETWEEN DYSPEPTIC SYMPTOMS AND
DIETARY PATTERNS IN FUNCTIONAL DYSPEPSIA
9.1 SUMMARY.................................................................................................. 248
9.2 INTRODUCTION ........................................................................................ 249
9.3 SUBJECTS AND METHODS ..................................................................... 251
9.3.1 Subjects................................................................................................ 251
9.3.2 Protocol................................................................................................ 252
9.3.3 Measurements ...................................................................................... 252
9.3.4 Data and statistical analysis ................................................................. 254
9.4 RESULTS .................................................................................................... 255

9.4.1 Eating attitudes, upper and lower gastrointestinal symptoms, quality of
life, personality and psychological distress .......................................................... 255
9.4.2 Eating behaviour .................................................................................. 256
9.4.3 Symptom assessment ........................................................................... 256
9.4.4 Relationship between food intake with symptom occurrence and severity
.............................................................................................................. 257
9.4.5 Relationship between food intake and quality of life ........................... 257
9.5 DISCUSSION.............................................................................................. 264
9.6 CONCLUSIONS ......................................................................................... 267
Chapter 10
EFFECTS OF THE HERBAL MEDICATION, IBEROGAST® ON
PROXIMAL GASTRIC VOLUME, ANTROPYLORODUODENAL
MOTILITY AND GASTRIC EMPTYING IN HEALTHY MEN
10.1 SUMMARY................................................................................................. 269
10.2 INTRODUCTION ....................................................................................... 270
10.3 MATERIALS AND METHODS................................................................. 272
10.3.1 Subjects................................................................................................ 272
10.3.2 Study outline ........................................................................................ 272
10.3.3 Composition of Iberogast® and preparation of control solution ......... 273
10.3.4 Protocol................................................................................................ 273
10.3.5 Statistical analysis................................................................................ 276
10.4 RESULTS .................................................................................................... 276

10.4.1 Part A: Effect of Iberogast® on intrabag volume changes (“gastric
relaxation”) ........................................................................................................... 277
10.4.2 Part B: Effect of Iberogast® on antropyloroduodenal motility .......... 277
10.4.3 Part C: Effect of Iberogast® on gastric emptying and intragastric
distribution ............................................................................................................ 279
10.5 DISCUSSION.............................................................................................. 287
10.6 CONCLUSIONS ......................................................................................... 290
Chapter 11
CONCLUSIONS .....................................................................................291
APPENDICES
APPENDIX 1: DIET DIARY...................................................................................... 298
APPENDIX 2: VISUAL ANALOGUE SCALE A ..................................................... 299
APPENDIX 3: VISUAL ANALOGUE SCALE B ..................................................... 300
APPENDIX 4: THREE FACTOR EATING QUESTIONNAIRE.............................. 301
APPENDIX 5: EATING ATTITUDES TEST ............................................................ 307
APPENDIX 6: NWRLC FAT INTAKE SCALE........................................................ 308
APPENDIX 7: NEPEAN DYSPEPSIA INDEX......................................................... 310
APPENDIX 8: EYSENCK .......................................................................................... 319
APPENDIX 9: HAD (VI) ............................................................................................ 320
APPENDIX 10: ZUNG SELF-RATING SCALE....................................................... 322

REFERENCES........................................................................................323

LIST OF ABBREVIATIONS
1.33/50 1.33 kcal/min lipid infusion for 50 min
1.33/150 1.33 kcal/min lipid infusion for 150 min
4/50 4 kcal/min lipid infusion for 50 min
5HT 5-Hydroxy-tryptamine
APD antropyloroduodenal
ALE artichoke leaf extract
ANOVA analysis of variance
AUC area under the curve
BMI body mass index
CCK cholecystokinin
CHO carbohydrate
CV coefficient of variation
EAT Eating Attitudes Test
EPQ Eysenck Personality Questionnaire
FD functional dyspepsia
G1 1 kcal/min glucose infusion
G2 2 kcal/min glucose infusion
G4 4 kcal/min glucose infusion
GIP glucose-dependent insulinotropic polypeptide
GIS gastrointestinal symptom
GLP-1 glucagon-like peptide-1
HAD Hospital Anxiety and Depression
H pylori Helicobacter pylori
I

HS healthy subject
IBS irritable bowel syndrome
IPPW isolated pyloric pressure wave
IL0.25 0.25 kcal/min lipid infusion
IL1.5 1 kcal/min lipid infusion
Il4 4 kcal/min lipid infusion
MI motility index
MDP minimal distending pressure
MMC migrating motor complex
NDI Nepean Dyspepsia Index
NS not significant
NWLRC Northwest Lipid Research Clinic
PWs pressure waves
PWSs pressure wave sequences
PYY peptide tyrosine tyrosine
RMP resting membrane potential
TFEQ Three Factor Eating Questionnaire
THL tetrahydrolipstatin
TMPD transmucosal potential difference
VAS visual analogue scale
II

THESIS SUMMARY
This thesis presents studies relating to effects of different macronutrients,
predominantly fat and carbohydrate, on gastrointestinal motility, hormone
release/suppression, appetite and energy intake in healthy subjects, and on symptom
generation in patients with functional dyspepsia. The three broad areas that have been
investigated in these studies are: (i) the effect of load, and duration, of small intestinal
nutrient exposure on gastric motility, gastrointestinal hormone release/suppression,
appetite and energy intake in healthy subjects, (ii) the dietary factors that may
contribute to symptom generation in patients with functional dyspepsia, through
analysis of diet diaries and acute nutrient challenges, and (iii) the effects of the herbal
medication, Iberogast®, on gastric motility in healthy subjects.
The ingestion of nutrients, triggers a number of gastrointestinal responses, including the
modulation of antropyloroduodenal motility, gastrointestinal hormone
release/suppression, and the suppression of appetite and energy intake, resulting in a
slowing of gastric emptying to an average rate of 1 - 3 kcal/min, which is required for
efficient nutrient digestion and absorption. Additionally, the rate at which glucose
enters the small intestine influences postprandial glycaemia and incretin responses.
These responses have been demonstrated in animals to be dependent on the length, and
region, of the small intestine exposed to fat and glucose, however, this has not been
directly investigated in humans.
Functional dyspepsia is a clinical condition, characterised by chronic upper abdominal
symptoms, such as nausea, bloating and early fullness, without a known cause, which
III

affects approximately 11 - 29 % of the population. Many studies have reported that
disturbed gastric motor activity may be the cause of these symptoms, but patients
frequently experience symptoms following ingestion of food, and some patients report
to eat smaller meals more frequently and avoid fatty and spicy foods. In addition,
laboratory-based studies have indicated that functional dyspepsia patients may be
hypersensitive to fat, but not carbohydrate. To date, the treatments used to reduce
symptoms are frequently directed at the normalisation of gastroduodenal motility, using
prokinetics. However, the beneficial effect of these drugs is relatively small and
variable, and their adverse effects can be substantial. Herbal drug preparations have
recently received considerable interest as an alternative treatment option in functional
dyspepsia. A commercially available herbal preparation, Iberogast® which contains
nine plant extracts, has been reported to improve upper abdominal symptoms in
functional dyspepsia and to decrease fundic tone, increase antral contractility and
decrease afferent nerve sensitivity in experimental animals. The effects of Iberogast®
in the human gastrointestinal tract have not been investigated.
The first three studies presented in this thesis have focused on the effects of delivering
fat and glucose into the small intestine at different loads (Chapter 5, 6 and 7), lower,
comparable to, and higher than gastric emptying normally occurs, and at different
durations of infusion (but still at similar caloric loads - Chapter 5, fat only), on
gastrointestinal motility, plasma hormone release/suppression, glycaemia, and energy
intake in healthy male subjects.
The study in Chapter 5 demonstrated that antral pressure waves and pressure wave
sequences were suppressed, and basal pyloric pressure, isolated pyloric pressure waves,
IV

and plasma cholecystokinin and peptide YY stimulated, during both the low (1.33
kcal/min for 50 min: 67 kcal/min), and high (4 kcal/min for 50 min: 200 kcal), loads of
lipid. The effect of the 4 kcal/min load was sustained so that the suppression of antral
pressure waves and pressure wave sequences and increase in peptide YY remained
evident after cessation of the infusion. The prolonged lipid infusion (1.33 kcal/min for
150 min: 200 kcal) suppressed antral pressure waves, stimulated cholecystokinin and
peptide YY and basal pyloric pressure and tended to stimulate isolated pyloric pressure
waves when compared with saline throughout the entire infusion period. These results
indicate that both the load, and duration, of small intestinal lipid have an influence on
antropyloroduodenal motility and patterns of cholecystokinin and peptide YY release.
Chapter 6 demonstrated that lipid loads lower than gastric emptying normally occurs
(0.25 kcal/min for 50 min: 12.5 kcal) transiently stimulated isolated pyloric pressure
waves and cholecystokinin release and suppressed pressure wave sequences and hunger
scores. Loads comparable to (1.5 kcal/min for 50 min: 75 kcal) and higher (4 kcal/min
for 50 min: 200 kcal), than the normal rate of gastric emptying, were required to
stimulate basal pyloric tone and peptide YY release and suppress antral and duodenal
pressure waves. Only the 4 kcal/min load suppressed energy intake. The effects of
lipid on all parameters, with the exception of hunger, were load-dependent. In addition,
there were relationships between antropyloroduodenal motility and cholecystokinin and
peptide YY concentrations with energy/food intake.
The study in Chapter 7 demonstrated that loads of glucose lower than (1 kcal/min for
120 min: 120 kcal), comparable to (2 kcal/min for 120 min: 240 kcal) and higher than
(4 kcal/min for 120 min: 480 kcal) the rate gastric emptying normally occurs, stimulated
V

blood glucose, plasma insulin, glucagon-like peptide-1, glucose-dependent
insulinotropic polypeptide and cholecystokinin concentrations and suppressed the
number of antral pressure waves, 2 and 4 kcal/min loads were required for the
suppression of duodenal pressure waves and pressure wave sequences and the
stimulation of basal pyloric pressure and suppression of energy intake only after the 4
kcal/min loads. There were also relationships between glucagon-like peptide-1 and
glucose-dependent insulinotropic peptide with basal pyloric tone, and food/energy
intake with pyloric pressures.
The studies presented in the subsequent three chapters investigated the contribution of
dietary factors on the generation of symptoms in patients with functional dyspepsia
when compared with healthy subjects (Chapter 8 and 9) and the effect of Iberogast® on
motility in the healthy gastrointestinal tract (Chapter 10). The effects of equi-caloric
high-carbohydrate vs. high-fat yoghurt preloads on symptom generation, plasma
hormone concentrations, antral area and energy intake were compared between
functional dyspepsia patients and healthy subjects (Chapter 8). Nausea and pain were
greater in patients after the high-fat, when compared with high-carbohydrate and
control, preloads and with healthy subjects. Discomfort was greater after all preloads in
patients when compared with healthy subjects. Fasting cholecystokinin and stimulation
of cholecystokinin by the high-fat preload were greater in patients, while fasting and
postprandial peptide YY were lower in patients than in healthy subjects, with no
differences in fasting, or postprandial, plasma ghrelin between patients and healthy
subjects. Fasting antral area was greater in patients, with no differences postprandially
between patients and healthy subjects. There were no differences in energy intake
between the two groups. The relationship between the effect of dietary intake and
VI

eating behaviour over a 7-day period on the occurrence and severity of abdominal
symptoms was compared between patients and healthy subjects (Chapter 9). The
symptoms experienced by the patients included nausea, fullness discomfort, bloating
and upper abdominal, and epigastric, pain, of a modest severity, which occurred within
30 min of eating. The number of “meals” ingested was significantly less in functional
dyspepsia patients and there was a trend for total energy and fat intake to be less. The
occurrence of these symptoms was also statistically related to the ingestion of fat and
energy intake. The results of these studies indicate that diet, particularly the ingestion
of fat, influences the development of symptoms in a subgroup of patients with
functional dyspepsia.
The study in Chapter 10 evaluated the effect of the herbal drug Iberogast® on gastric
motility in the gastrointestinal tract. Iberogast® increased proximal gastric volume,
increased antral pressure waves without affecting pyloric or duodenal pressures, and
slightly increased the retention of liquid in the total stomach, but had no effect on
gastric emptying of solids or intragastric distribution. These results demonstrate that
Iberogast® affects gastric motility in humans, and the stimulation of gastric relaxation
and antral motility may contribute to the reported therapeutic efficacy of Iberogast® in
functional dyspepsia.
The studies reported in this thesis provide new information about the regulation of
gastric motility, hormone release/suppression, appetite and energy intake, by varying
the loads of lipid and glucose infused into the small intestine in healthy subjects, which
may have implications in patients with altered gastric motor functions, such as obese,
type-2 diabetes and functional dyspepsia patients. In addition, studies in functional
VII

dyspepsia patients revealed that diet, in particular the ingestion of fat, contribute to the
cause of their symptoms, and these findings may have important implications for the
development of diet-based therapies for the treatment of functional dyspepsia.
Furthermore, functional dyspepsia patients with impaired gastric relaxation and antral
dysmotility may benefit from the effects of Iberogast® as demonstrated in the healthy
gastrointestinal tract.
VIII

DECLARATION OF ORIGINALITY
This work contains no material which has been accepted for the award of any other
degree or diploma in any university or other tertiary institution and, to the best of my
knowledge and belief, contains no material previously published or written by another
person, expect where due reference has been made in the text.
I give consent to this copy of my thesis being made available in the University Library.
The author acknowledges that copyright of published works contained within this thesis
resides with the copyright holder/s of these works.
Amelia Pilichiewicz
January 2008
IX

DEDICATION
To all my rocks…
You know who you are…
I am forever grateful…
X

ACKNOWLEDGEMENTS
The studies reported in this thesis were conducted in the Discipline of Medicine and the
Department of Nuclear Medicine, PET and Bone Densitometry at the Royal Adelaide
Hospital. While conducting the research reported in this thesis I was supported by a
Royal Adelaide Hospital Dawes Postgraduate Scholarship.
First, and foremost, I would like to thank my two wonderful supervisors, Dr Christine-
Feinle-Bisset and Professor Michael Horowitz. I have learnt an incredible amount
during my PhD, not only about nutrition and the gastrointestinal tract, but also about
myself. You have both provided me with an enormous amount of encouragement,
guidance, support, wisdom, enthusiasm, friendship and the opportunity to travel
overseas to present my work, which you have spent much time helping me perfect. I
am privileged to have had the opportunity to study under two such inspiring and
dedicated supervisors, and I have very much enjoyed working with you.
Secondly, to “team Christine Feinle-Bisset”, Tanya Little, Kate Feltrin and Ixchel
Brennan (from the cool office). Wow, what a great bunch of girls - I could never have
asked for such a great group to work with. Thank you so much for your friendship,
support and encouragement. I will never forget the times we went out, the laughter,
memories and the enormous amount of “idea-swapping”, which, when it comes down to
it, got me though my studies and my thesis. Also, I would like to thank Diana
Gentilcore and Karen Jones - you both never let me give up, and your patience and
guidance to help me through what I thought was going to be an impossible task, will
never be forgotten.
XI

To my “pseudo mother figures”, Selena Doran and Franca Scopacasa - I will never
forget our “chats”, not only about my studies and technical assistance, but “the bigger
picture”. To Associate Professor Ian Chapmann, Professor Gary Wittert and Sue
O’Connor, for providing me with employment during the last twelve months, while
writing my thesis, and understanding that I was still writing my thesis. Also to my
fellow employees who have all made me laugh, cry and made it easy for me to do
“many” things at once. And to everyone else in the Discipline of Medicine I have not
named, you have all made my last five years very memorable, and provided me with
plenty of laughs and plenty of support.
To the visiting professors that I have been fortunate to work in collaboration with;
Professor Trygve Hausken, Professor Odd Helge Gilja, Professor Jim Meyer, Professor
Nick Talley and Professor Andre Smout - thank you all for teaching me the techniques
used in this thesis and also for the time you spent giving advice regarding my studies.
To the statistician, Nancy Briggs - thank you for performing the numerous amounts of
statistics throughout this thesis, especially for Chapter 9. Also to Antonietta Russo and
Anne Maddox, for your assistance in the gastric emptying studies, Judith Wishart for
performing the hormone assays, the team in ward Q7 for their technical support, and
Professor Gerald Holtmann, for your assistance recruiting the functional dyspepsia
patients.
To the individuals who volunteered their time in aid of my work. I would like to thank
every one of you for trusting me enough to act as subjects in my studies. I have enjoyed
XII

our conversations and most of your wacky stories - without you there would be no
thesis…….
To my “girls” and to my “boys” - thank you all for putting up with me during the time I
was writing my thesis. Your endless friendship, encouragement, kind words, smiling
faces, and the way you all knew how to take me away, just for a drink (or plenty), and
to twist my very malleable rubber arm to make me feel slightly human again, will never
be forgotten. Especially to Dr (hah, I can say that now !) Renee Turner and Leah
Panakera-Thorpe, who have both been there from the beginning of my university career,
your overwhelming friendship, support and “ears”, have made my journey through my
PhD a lot easier. Also to Matt Boundy for your no fuss approach at making me forget
everything that goes wrong, to keep on going, and that everything in life is fixable !!!! I
am forever grateful.
To my flat-mates, Diana, Katie, Tim and Lucas. I have had a lot of fun living with the
four of you and I would sincerely like to thank you for giving me the tremendous
amount of support you have, from cooking me dinner, telling me a joke at the most
inappropriate time and to allow me to take over the back room with all my references
and drafts of my thesis - the mess will be cleaned up soon!!!!
Finally, a special thank you to my family, especially to Mum, Dad, Laura, Nick and
Nanna. Guess what, I am finished. You have all provided me with an enormous
amount of emotional support, stability and good red wine - I could never ask for a better
family.
XIII

PUBLICATIONS ARISING FROM THIS THESIS
The data presented in this thesis has formed the basis for the publications listed below:
Pilichiewicz, AN, Little, TJ, Brennan, IM, Meyer, JH, Wishart, JM, Otto, B, Horowitz,
M, Feinle-Bisset, C 2005, ‘Effects of load, and duration, of duodenal lipid on
antropyloroduodenal motility, plasma CCK and PYY, and energy intake in healthy
men’, Am J Physiol, vol. 290, no. 3, pp. R668-677.
Pilichiewicz, AN, Papadopoulos, P, Brennan, IM, Little, TJ, Meyer, JH, Wishart, JM,
Horowitz, M, Feinle-Bisset, C 2007, ‘Load-dependent effects of duodenal lipid on
antropyloroduodenal motility, plasma CCK and PYY, and energy intake in healthy
men’, Am J Physiol, vol. 293, no. 6, pp. R2170-2178.
Pilichiewicz, AN, Chaikomin, C, Brennan, IM, Wishart, JM, Rayner, CK, Jones, KL,
Smout, AJPM, Horowitz, H, Feinle-Bisset, C 2007 ‘Load-dependent effects of
duodenal glucose on glycemia, gastrointestinal hormones, antropyloroduodenal
motility, and energy intake in healthy men’, Am J Physiol, vol. 293, no. 3, pp. E743-
753.
Pilichiewicz, AN, Feltrin, KL, Horowitz, M, Holtmann, G, Wishart, JM, Jones, KL,
Talley, NJ, Feinle-Bisset, C 2007, ‘In functional dyspepsia oral carbohydrate and fat
differentially modulate symptoms, gut hormones and antral area’, Am J Gastroenterol
(submitted).
XIV

Pilichiewicz, AN, Horowitz, M, Russo, A, Maddox, AF, Jones, KL, Schemann, M,
Holtmann, M, Feinle-Bisset, C 2007, ‘Effects of Iberogast on proximal gastric volume,
antropyloroduodenal motility and gastric emptying in healthy men’, Am J
Gastroenterol, vol. 102, no. 6, pp. 1276-1283.
XV

Nutrients, gastric motility, hormone release and energy intake Chapter 1
Chapter 1
EFFECTS OF NUTRIENTS ON THE
GASTROINTESTINAL TRACT, GASTROINTESTINAL
HORMONE RELEASE AND ENERGY INTAKE
1.1 INTRODUCTION
It is well established that the presence of nutrients, such as fat and carbohydrate, in the
small intestine is associated with a number of gastrointestinal responses, which have
been proposed to mediate, at least in part, the associated inhibition of appetite and
energy intake. These inter-related responses include the modulation of gastric
distension, gastric emptying, gastrointestinal motility, the stimulation of a number of
gastrointestinal hormones, such as cholecystokinin (CCK), peptide YY (PYY),
glucagon-like peptide-1 (GLP-1), and glucose-dependent insulinotropic polypeptide
(GIP), and the suppression of ghrelin. The effects of small intestinal feedback on
gastric emptying, gastrointestinal motility, gastrointestinal hormone
release/suppression, appetite and energy intake are dependent on a number of factors,
including the length and region of the small intestine exposed to nutrients, as well as the
nutrient load and the duration of nutrient exposure. This chapter provides an overview
1

Nutrients, gastric motility, hormone release and energy intake Chapter 1
of the factors involved in the regulation of these parameters by nutrients, which all
impact on the research conducted for this thesis.
1.2 ANATOMY AND FUNCTION OF THE GASTROINTESTINAL
TRACT
1.2.1 Stomach
The stomach is a J-shaped sac-like chamber, which lies between the oesophagus and the
duodenum, the first part of the small intestine. The stomach can be divided
anatomically into the fundus, corpus and antrum (Figure 1.1), and may be considered to
have two functional regions; (i) the proximal compartment, which includes the fundus
and proximal corpus and possesses a thin smooth muscle layer, and acts as a reservoir
for ingested food, and (ii) the distal compartment, which includes the antrum and
possesses of a thicker musculature than the proximal compartment, and is responsible
for the mixing and grinding of solid food.
1.2.2 Pylorus
The pylorus is a short 2 cm region connecting the antrum to the duodenal bulb. The
motility patterns which occur in the pylorus include changes in basal pyloric pressure
(or tone) and the frequency and amplitude of phasic pyloric pressures, also known as
isolated pyloric pressure waves (IPPWs). The primary function of the pylorus is that of
a sieve, to regulate outflow of gastric contents, in response to small intestinal feedback
(Figure 1.1).
2

Nutrients, gastric motility, hormone release and energy intake Chapter 1
1.2.3 Small intestine
The small intestine is a muscular tube, approximately 5 metres in length, which can be
divided into three regions; the duodenum (~ 25 cm), the jejunum (~ 2 m long) and, most
distally, the ileum (~ 3 m long). The small intestine is the primary organ for nutrient
absorption, and triggers feedback signals, which control gastric motility, gastrointestinal
hormone release, appetite and energy intake (Figure 1.1). A number of factors regulate
the effects of small intestinal nutrients and these are discussed in Chapter 1.5.
Pyloric sphincter
Antrum
Corpus
Fundus
Proximal stomach
Distal stomach
Proximalsmall
intestine
Duodenum
Distalsmall
intestine
Jejunum
Ileum
Figure 1.1 Basic anatomy of the stomach and small intestine.
3

Nutrients, gastric motility, hormone release and energy intake Chapter 1
1.3 GASTROINTESTINAL MOTOR FUNCTION AND ITS ROLE IN
GASTRIC SENSATIONS, APPETITE AND ENERGY INTAKE
1.3.1 Fasting motor patterns
During fasting, the gastrointestinal tract exhibits cyclical pattern of motility, termed the
migrating motor complex (MMC). The MMC comprises three phases; phase I, phase II
and phase III (Carlson et al., 1972), which occur over a 90 - 100 min period in humans.
Phase I is characterised by little, or no, contractile activity and usually has a duration of
40 - 60 min; phase II is characterised by intermittent contractions whose frequency
increases progressively, and has a duration between 20 - 40 min; and phase III is a brief
(5 - 10 min) period of contractions which occur at maximal frequency and amplitude,
which is 3 in the stomach, and 12 in the duodenum, contractions per minute. The MMC
propagates aborally along the small intestine, and serves to “sweep” the lumen of
indigestible debris (Sarna and Otterson, 1988) (Figure 1.2A).
4

Nutrients, gastric motility, hormone release and energy intake Chapter 1
5
Figure 1.2 Example of manometric recordings during infusion of saline, representing fasting (A) and infusion of glucose (B), in a healthy young subject. Saline infusion did not change antropyloroduodenal motility. During the glucose infusion, basal pyloric pressure and number of isolated pyloric pressure waves increased and antral motility was inhibited. A3 and A4 represent antral channels; S1 and S2 represent channels along the sleeve which straddles the pylorus; D1 and D2 represent duodenal channels. Adapted from (Verhagen et al., 1998).
1.3.2 Fed motor patterns
Following a meal, a complex and coordinated process of the proximal and distal regions
of the stomach occurs: (i) ingested food is stored in the proximal stomach – which
undergoes “adaptive relaxation” so the meal can be accommodated, without a
substantial increase in intragastric pressure (Azpiroz and Malagelada, 1987), (ii) the
bolus is mixed with gastric secretions and ground into small particles in the distal
NOTE: This figure is included on page 5 of the print copy of the
thesis held in the University of Adelaide Library.

Nutrients, gastric motility, hormone release and energy intake Chapter 1
stomach, or antrum, and (iii) “liquefied” gastric contents are delivered into the
duodenum, at a rate that allows efficient digestion and absorption (Horowitz et al.,
1994). This process is known as gastric emptying. Phasic and tonic pyloric
contractions are considered to play a major role in the regulation of gastric emptying by
acting as a brake; as emptying can only occur when the pylorus is open - in the fed state
there are prolonged periods of closure to allow grinding of food in the antrum
(Horowitz et al., 1994).
There are major differences in gastric emptying patterns of digestible and non-digestible
solids and nutrient and non-nutrient liquids. Emptying of digestible solids is
characterised by a lag phase, before emptying commences, followed by an emptying
phase that approximates an overall linear pattern. The lag phase is dependent on the
time taken for redistribution of food from the proximal to the distal stomach. Nutrient-
containing liquids and liquefied solids empty from the stomach in an overall linear
fashion. In contrast, non-nutrient emptying occurs relatively rapidly in a non-linear,
mono-exponential fashion (Horowitz et al., 1994).
1.3.2.1 Effects of small intestinal nutrients on gastrointestinal motor function
During the digestion process, nutrients are broken down, absorbed and transported
along the gut. These digestive products then interact with the receptors in the small
intestine, and in turn, result in feedback inhibition of gastric emptying (Cooke, 1977,
Heddle et al., 1989, Hunt, 1963, Hunt and Knox, 1968, Lin et al., 1989, Lin et al.,
1990). The motor correlates of the slowing of gastric emptying triggered by the
presence of nutrients in the small intestine include the interruption of the MMC (Figure
6

Nutrients, gastric motility, hormone release and energy intake Chapter 1
1.2B), relaxation of the proximal stomach (Azpiroz and Malagelada, 1985a),
suppression of antral and duodenal motility (Heddle et al., 1988a) and, perhaps most
importantly, the stimulation of phasic and tonic contractions localised to the pylorus
(Heddle et al., 1988c, Tougas et al., 1992) (Figure 1.3). As a result of this feedback
inhibition, gastric emptying of nutrients, in humans, is tightly regulated at 1 - 3 kcal/min
(Hunt et al., 1985), after an initial phase that may be more rapid (Horowitz et al., 1993).
These changes in gastrointestinal motility reflect the interaction of nutrients with the
small intestine. The different macronutrients, fat, carbohydrate and protein, may vary in
their effects on gastrointestinal motility. For example, long chain triglycerides have
been reported to induce proximal gastric relaxation (Azpiroz and Malagelada, 1985a),
slow gastric emptying (Kumar et al., 1987) and stimulate phasic and tonic motility
(Cook et al., 1997, Kumar et al., 1987), to a greater extent than both carbohydrates and
protein.
Small intestinal nutrient infusion of fat, carbohydrate and protein also affect the release
of a number of gastrointestinal hormones, which mediate, at least in part, the effects of
nutrients on gastrointestinal function, as discussed in Chapter 1.4.
7

Nutrients, gastric motility, hormone release and energy intake Chapter 1
Figure 1.3 Motor patterns associated with normal gastric emptying. Adapted from (Rayner and Horowitz, 2005).
1.3.2.1.1 Effects of fat digestion on gastric emptying/motility
The effects of fat in the small intestine on gastrointestinal motility are dependent on the
digestion of triglycerides into free fatty acids by the enzyme lipase. A number of
studies have established the importance of fat digestion and the release of free fatty
acids, by using a pharmacological agent which blocks fat digestion, tetrahydrolipstatin
(THL), also known as orlistat (Borovicka et al., 2000, Feinle et al., 2001b, Feinle et al.,
2003). For example, gastric emptying of a mixed, fat-containing, nutrient meal is
accelerated by THL (Borovicka et al., 2000), and THL attenuates the effect of
intraduodenal fat on proximal gastric relaxation (Feinle et al., 2001b) and
antropyloroduodenal (APD) motility (Feinle et al., 2003) (Figure 1.4).
8

Nutrients, gastric motility, hormone release and energy intake Chapter 1
9
Figure 1.4 Example of antropyloroduodenal pressure patterns during duodenal infusion of a
triglyceride emulsion without (FAT; left) and with (FAT-THL; right) 120 mg of the lipase inhibitor, THL. Left: Infusion of FAT resulted in a “fed” motor pattern, characterised by stimulation of isolated pyloric pressure waves (P) and the inhibition of antral (A) and duodenal (D) pressure waves. Right: In contrast, when THL was co-administered with fat (FAT-THL), there was pronounced propulsive antropyloroduodenal pressure activity. Adapted from (Feinle et al., 2003).
1.3.2.2 Effects of small intestinal nutrients on appetite and energy intake
In humans, infusion of nutrients directly into the small intestine in lean and obese
humans decreases perceptions of hunger, increases fullness and decreases subsequent
energy intake (Chapman et al., 1999, Cook et al., 1997, Lavin et al., 1996, MacIntosh et
al., 2001a). Intravenous administration of nutrients, on the other-hand, has little, if any,
effect on energy intake (Lavin et al., 1996, Welch et al., 1985), indicating the
importance of the interaction of nutrients with small intestinal receptors in the
regulation of appetite and energy intake. Fat, carbohydrate and protein, all reduce
energy intake when infused directly into the small intestine in humans and animals – fat
may be the most potent in increasing fullness and decreasing hunger to a greater extent
than isocaloric glucose and protein in humans and animals (Andrews et al., 1998,
Burton-Freeman et al., 1997, Chapman et al., 1999, Cook et al., 1997). Small intestinal
stimulation of the release, and suppression, of gastrointestinal hormones, mediates, at
NOTE: This figure is included on page 9 of the print copy of the
thesis held in the University of Adelaide Library.

Nutrients, gastric motility, hormone release and energy intake Chapter 1
least in part, the effects of nutrients on appetite and energy intake, as discussed in
Chapter 1.4.
1.3.2.2.1 Effects of fat digestion on appetite and energy intake
Fat digestion is also important in the regulation of appetite and energy (Feltrin et al.,
2004). This has again been established through investigations into the effects of
inhibition of fat digestion using THL (Feinle et al., 2003, O'Donovan et al., 2003). For
example, the inhibitory effect of an oral fat load (70 %) on energy intake is attenuated
by THL in healthy lean subjects (O'Donovan et al., 2003) - the increase in energy intake
approximates the amount of energy lost due to fat malabsorption. Furthermore, when
THL is added to a fat emulsion and infused into the small intestine, energy intake and
appetite are greater compared to when the emulsion is administered alone (Feinle et al.,
2003). THL also reduces the intensity of fullness, nausea and bloating induced by
concurrent gastric distension and duodenal lipid infusion (Feinle et al., 2001b) (Figure
1.5). Taken together, these results establish the important role of luminal free fatty
acids in the regulation of gastrointestinal motility, appetite and energy intake.
10

Nutrients, gastric motility, hormone release and energy intake Chapter 1
Figure 1.5 Effect of lipase inhibition, THL, on fullness (top) and nausea (bottom), induced by a duodenal lipid infusion during gastric distension in healthy subjects (n = 14). Inhibition of fat digestion, by the addition of THL, to the lipid emulsion attenuated fullness (P < 0.05) and nausea (P < 0.05), compared to the lipid emulsion alone. Adapted from (Feinle et al., 2001b).
1.3.2.3 Relationships between the effects of nutrients on appetite, and energy
intake with gastric motor function
There is evidence that the effects of nutrients on appetite and energy intake may
potentially result from the concomitant effects on gastric motor function. For example,
human studies indicate that gastric distension with intragastric volumes > 400 ml
contributes to the generation of postprandial sensations, such as an increase in fullness
and a decrease in hunger, desire to eat and energy intake, in both healthy and obese
subjects (Geliebter et al., 1988a, Geliebter, 1988b), as a result of the activation of
11

Nutrients, gastric motility, hormone release and energy intake Chapter 1
12
mechanoreceptors within the wall of the stomach (Feinle et al., 1996). During proximal
gastric distension, the sensation of fullness is only induced when nutrients are
concurrently infused into the small intestine; e.g. gastric distension alone is perceived as
discomfort or pain (Feinle et al., 1997), indicating that feedback signals arising from the
small intestine are important. Recent studies have also indicated a relationship of
postprandial fullness (Hveem et al., 1996, Jones et al., 1997, Santangelo et al., 1998)
and energy intake (Sturm et al., 2004) with the content of the distal stomach, in healthy
subjects. For example, the perception of fullness induced by a 350 ml glucose drink is
closely related to antral area, while there is no significant relationship between fullness
and the content of either the total, or proximal stomach (Jones et al., 1997) (Figure 1.6).
Figure 1.6 Relationship between antral area and postprandial fullness, after a glucose drink, in
healthy subjects (n = 14). Fullness is related to antral area (r = 0.68, P < 0.01). Adapted from (Jones et al., 1997).
In addition, energy intake 60 min after ingestion of a yoghurt preload is inversely
related to antral area, such that the larger the antral area the smaller the energy intake
(Sturm et al., 2004) (Figure 1.7).
NOTE: This figure is included on page 12 of the print copy of the
thesis held in the University of Adelaide Library.

Nutrients, gastric motility, hormone release and energy intake Chapter 1
13
Figure 1.7 Relationship between energy intake with antral area in healthy young (n = 12) and old
(n = 12) subjects. Energy intake at a meal (kcal) is inversely related to antral area (r = - 0.58, P < 0.001). Adapted from (Sturm et al., 2004).
No study has, to date, attempted to relate the effects of nutrients on appetite and energy
intake with those on APD motility (Chapters 6 and 7).
1.4 GASTROINTESTINAL HORMONE RELEASE AND
SUPPRESSION AND THEIR EFFECTS ON
GASTROINTESTINAL MOTILITY AND ENERGY INTAKE
A number of gastrointestinal hormones, including cholecystokinin (CCK) and glucose-
dependent insulinotropic polypeptide (GIP), secreted from the proximal small intestine,
peptide tyrosine tyrosine (PYY) and glucagon-like peptide-1 (GLP-1), secreted from the
distal small intestine, and insulin secreted from the pancreas, are released in response to
enteral nutrients, while the release of ghrelin, from the stomach, is suppressed. All these
gastrointestinal hormones have been investigated for their potential role in the
regulation of gastric and intestinal motility and appetite.
NOTE: This figure is included on page 13 of the print copy of the
thesis held in the University of Adelaide Library.
Nutrients, gastric motility, hormone release and energy intake Chapter 1
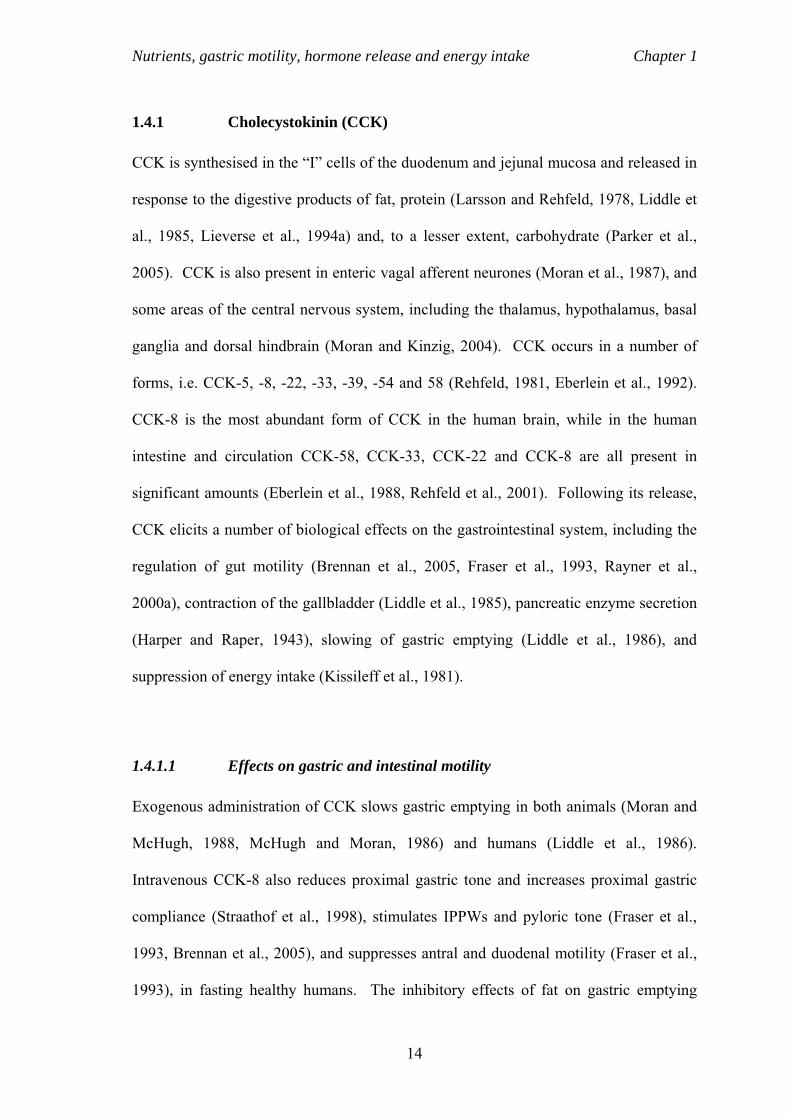
1.4.1 Cholecystokinin (CCK)
CCK is synthesised in the “I” cells of the duodenum and jejunal mucosa and released in
response to the digestive products of fat, protein (Larsson and Rehfeld, 1978, Liddle et
al., 1985, Lieverse et al., 1994a) and, to a lesser extent, carbohydrate (Parker et al.,
2005). CCK is also present in enteric vagal afferent neurones (Moran et al., 1987), and
some areas of the central nervous system, including the thalamus, hypothalamus, basal
ganglia and dorsal hindbrain (Moran and Kinzig, 2004). CCK occurs in a number of
forms, i.e. CCK-5, -8, -22, -33, -39, -54 and 58 (Rehfeld, 1981, Eberlein et al., 1992).
CCK-8 is the most abundant form of CCK in the human brain, while in the human
intestine and circulation CCK-58, CCK-33, CCK-22 and CCK-8 are all present in
significant amounts (Eberlein et al., 1988, Rehfeld et al., 2001). Following its release,
CCK elicits a number of biological effects on the gastrointestinal system, including the
regulation of gut motility (Brennan et al., 2005, Fraser et al., 1993, Rayner et al.,
2000a), contraction of the gallbladder (Liddle et al., 1985), pancreatic enzyme secretion
(Harper and Raper, 1943), slowing of gastric emptying (Liddle et al., 1986), and
suppression of energy intake (Kissileff et al., 1981).
1.4.1.1 Effects on gastric and intestinal motility
Exogenous administration of CCK slows gastric emptying in both animals (Moran and
McHugh, 1988, McHugh and Moran, 1986) and humans (Liddle et al., 1986).
Intravenous CCK-8 also reduces proximal gastric tone and increases proximal gastric
compliance (Straathof et al., 1998), stimulates IPPWs and pyloric tone (Fraser et al.,
1993, Brennan et al., 2005), and suppresses antral and duodenal motility (Fraser et al.,
1993), in fasting healthy humans. The inhibitory effects of fat on gastric emptying
14

Nutrients, gastric motility, hormone release and energy intake Chapter 1
(Fried et al., 1984), proximal gastric compliance (Feinle et al., 1996), and gastric
motility (Schwizer et al., 1997b), are attenuated by administration of the CCK1 receptor
antagonist, loxiglumide, indicating that the inhibitory effects of fat on gastric and
intestinal motility are mediated, at least in part, by CCK.
1.4.1.2 Effects on appetite and energy intake
CCK is the most studied satiety hormone. Central and peripheral administration of
CCK-8 in rats (Gibbs et al., 1973), dogs (Pappas et al., 1985) and rhesus monkeys
(Gibbs et al., 1976), suppresses food intake. In rats these effects are dose-dependent,
and only apparent when administrated close to the start of a meal - if administered 15
min before eating CCK-8 has no effect on meal size (Gibbs et al., 1973). In healthy
young (Lieverse et al., 1995, Kissileff et al., 1981), older (MacIntosh et al., 2001b) and
obese (Pi-Sunyer et al., 1982), individuals, intravenous infusions of CCK-8, in doses
that result in circulating CCK concentrations within the post-prandial range i.e. 5 - 15
pmol/l (Lieverse et al., 1995), decrease food intake. In addition intravenous CCK-8 and
CCK-33 increase the perception of fullness and decrease hunger in healthy humans
(Lieverse et al., 1994b, MacIntosh et al., 2001b).
Only a small number of studies have evaluated the role of endogenous CCK in the
regulation of energy intake, using the CCK1 receptor antagonist, loxiglumide.
Concurrent administration of loxiglumide attenuated the inhibitory effects of an
intraduodenal lipid infusion on energy intake (Lieverse et al., 1994a, Matzinger et al.,
2000). In addition, intravenous infusion of loxiglumide for one hour prior to, and
during, ingestion of a meal, increased energy intake and hunger when compared with
15

Nutrients, gastric motility, hormone release and energy intake Chapter 1
saline infusion (Beglinger et al., 2001). It should be recognised that in these studies, the
effects of loxiglumide were modest at best, i.e. the reduction in energy intake was only
10 % (Lieverse et al., 1994a, Matzinger et al., 2000, Beglinger et al., 2001), whereas the
suppression induced by exogenous CCK approximates 20 % (Lieverse et al., 1995,
Kissileff et al., 1981).
It has been suggested that the effects of CCK to suppress appetite and energy intake are
mediated, in part, by its actions on the gastrointestinal tract (Brennan et al., 2005). The
association between nutrient-induced secretion of CCK with gastrointestinal motility
and energy intake has hitherto not been assessed in humans (Chapters 6 and 7).
1.4.2 Peptide Tyrosine Tyrosine (PYY)
PYY is a 36 amino acid peptide synthesised by endocrine “L” cells, predominantly
located in the ileum and large small intestine (Adrian et al., 1985). PYY is secreted as
PYY(1-36) and degraded to PYY(3-36) by dipeptidyl peptidase IV, and PYY(3-36) is
thought to be the circulating active peptide (Grandt et al., 1994). Receptors that
mediate the effects of PYY belong to the NPY receptor family and include Y1, Y2, Y4
an Y5. PYY(1-36) is an agonist at the Y1 and Y2 receptors (Grandt et al., 1994) and
once PYY(3-36) is formed, it has an affinity for the Y2 receptor (Batterham et al.,
2002). The secretion of PYY from the gut is proportional to the caloric density of
ingested nutrients (Ekblad and Sundler, 2002), with lipids and carbohydrates being the
most important nutrients (Adrian et al., 1985, Greeley et al., 1989), and fatty acids are
the most potent stimulants (Onaga et al., 2002). Plasma PYY levels begin to rise within
15 min after meal ingestion, plateau within approximately 90 min, and remain elevated
16

Nutrients, gastric motility, hormone release and energy intake Chapter 1
for up to 6 hours (Ueno et al., 2008). The release of PYY does not depend solely on
direct exposure of the distal gut to fat; studies in dogs have demonstrated that PYY may
also be released indirectly by fat in the proximal gut (Lin et al., 2000) secondary to the
stimulation of CCK secretion (Lin et al., 2000, Kuvshinoff et al., 1990, McFadden et al.,
1992).
1.4.2.1 Effects on gastric and intestinal motility
PYY(3-36), when infused intramuscularly in rhesus monkey, dose-dependently
decreased liquid gastric emptying of saline (Moran et al., 2005). In humans,
intravenous infusion of PYY(3-36) does-dependently slows mouth-to-caecum transit
and gastric emptying (Savage et al., 1987). As cells for PYY are located in the distal
small intestine and secretion of PYY correlates with fat-induced inhibition of distal gut
motility, it has been suggested that PYY also acts as the primary mediator of a fat-
induced “ileal-break” (Lin et al., 1997).
1.4.2.2 Effects on appetite and energy intake
There are conflicting observations regarding the role of PYY as a regulator of appetite
and energy intake. When PYY is administered centrally in rats, it stimulates feeding
(Hagan, 2002). In contrast, in a recent study in obese humans subcutaneous injections
of PYY(1-36) and PYY(3-36) had no effect on energy intake, but PYY(3-36) dose-
dependently increased ratings of satiety and decreased ratings of hunger, thirst, and
prospective food consumption (Sloth et al., 2007). It is clear that when administered
peripherally, in supraphysiological doses, PYY(3-36) reduces food intake in rodents,
primates and lean and obese humans (Batterham et al., 2002, Batterham et al., 2003a,
17

Nutrients, gastric motility, hormone release and energy intake Chapter 1
Batterham et al., 2003b). It has been suggested that the effect of PYY on food intake is
mediated through its interaction with the Y2 receptor. Y2 receptors are located in the
hypothalamic arcuate nucleus which is a major channel for feeding-related signals
(Woods et al., 1998, Schwartz et al., 2000, Seeley and Woods, 2003, Cone et al., 2001),
and circulating PYY gains access to the brain, as it freely crosses the blood brain barrier
(Nonaka et al., 2003).
When these observations are considered together, it is evident that the role of PYY in
the regulation of appetite and energy intake in humans remains uncertain. The
relationship between nutrient-induced secretion of PYY with gastrointestinal motility
and energy intake has hitherto not been assessed in humans (Chapter 6). Studies
employing a specific receptor antagonist(s) to evaluate the role of endogenous PYY
represent a priority.
1.4.3 Ghrelin
Ghrelin was identified in 1999, as the endogenous ligand for the growth hormone
secretagogue receptor (GHS-R). Ghrelin is a small 28 amino acid peptide with an acyl
side chain that is essential for its biological action (Kojima et al., 1999). Ghrelin
mRNA is expressed predominantly in the stomach (Kojima et al., 1999, Date et al.,
2000), primarily by the oxyntic cells of the fundic mucosa (Kojima et al., 1999). Unlike
the other peptides which have been described, ghrelin is suppressed after enteral
nutrients, rather than stimulated - so that in humans plasma ghrelin rises during fasting
and falls rapidly in response to food ingestion (Cummings et al., 2001). The
suppression of ghrelin occurs in response to administration of nutrients in the stomach,
18

Nutrients, gastric motility, hormone release and energy intake Chapter 1
duodenum or jejunum, and carbohydrate and protein appear to be more potent
suppressors of ghrelin than fat (Overduin et al., 2005, Parker et al., 2005).
1.4.3.1 Effects on gastric and intestinal motility
Ghrelin, when administered intravenously in rats, stimulates gastric acid secretion and
gastric motility in a dose-dependent manner (Kamegai et al., 2001, Nakazato et al.,
2001). These effects are inhibited by vagotomy and administration of atropine, but not
by a histamine H2 receptor antagonist, suggesting that ghrelin affects gastric function
via the vagus nerve (Masuda et al., 2000). In healthy humans exogenous ghrelin when
infused intravenously at 10 pmol/kg/min accelerates gastric emptying (Levin et al.,
2006), but not at 5 pmol/kg/min (Wren et al., 2001), when compared with saline.
Ghrelin also has a prokinetic effect in patients with gastroparesis (Murray et al., 2005,
Tack et al., 2005). Intravenous ghrelin has also been reported to induce premature
phase III activity and increase the tone of the proximal stomach in healthy humans
(Tack et al., 2006). Taken together these observations suggest that ghrelin increases
gastric motility/emptying at doses greater than 5 pmol/kg/min, although studies using
specific ghrelin antagonists are required. The effect of meals high in fat or
carbohydrate, in patients with impaired gastric motility, such as those with functional
dyspepsia (see Chapter 2) on ghrelin secretion has not been evaluated (Chapter 8).
1.4.3.2 Effects on appetite and energy intake
Intravenous ghrelin stimulates food intake in humans. In a study by Wren and
colleagues (Wren et al., 2001), there was a 28 % increase in energy intake from a buffet
meal, and an increase in subjective hunger when compared with saline, in healthy
19

Nutrients, gastric motility, hormone release and energy intake Chapter 1
subjects. The effects of endogenous ghrelin on appetite and energy intake in humans
has not been investigated, therefore, the physiological role of ghrelin in feeding
behaviour has not been established.
1.4.4 Glucagon-like peptide-1 (GLP-1)
GLP-1, a 33 amino acid peptide hormone product of the glucagon gene, is secreted from
the “L” cells, predominantly located in the distal small intestinal mucosa in response to
carbohydrate (Näslund et al., 1998), protein (Herrmann et al., 1995) and fat (Feinle et
al., 2003). GLP-1 plays an important role as an incretin hormone (Kreymann et al.,
1987), enhancing insulin secretion, suppressing glucagon release and stimulating
insulin-independent glucose disposal in peripheral tissues (Gutniak et al., 1992,
D'Alessio et al., 1994), thereby decreasing glycaemia (Nauck et al., 1998).
1.4.4.1 Effects on gastric and intestinal motility
A number of studies have demonstrated that intravenous GLP-1 relaxes the proximal
stomach (Schirra et al., 2002, Delgado-Aros et al., 2002), suppresses antral and
duodenal motility (Schirra et al., 2000) and stimulates pyloric pressures (Schirra et al.,
2000) in humans, which is associated with slowing of gastric emptying (Nauck et al.,
1997, Delgado-Aros et al., 2002, Little et al., 2006b). For example, a recent study
demonstrated that GLP-1 at 0.3 (“physiological” dose) and 0.9 (“supraphysiological”
dose) pmol/kg/min slowed gastric emptying of both solids and liquids (to induce
“gastroparesis” in about half the cohort), and increased meal retention in the distal
stomach (Little et al., 2006b). This inhibitory effect of GLP-1 has been reported in both
healthy (Little et al., 2006b), type-2 diabetes (Meier et al., 2003) and obese (Flint et al.,
20

Nutrients, gastric motility, hormone release and energy intake Chapter 1
2001, Näslund et al., 1998) individuals, and may well be the major mechanism by
which GLP-1 reduces postprandial glycaemic excursions (Horowitz and Nauck, 2006).
In contrast, in another study a “supraphysiological” dose of GLP-1 surprisingly had no
effect on IPPWs or basal pyloric tone, but decreased antral and duodenal pressure
waves (PWs) in healthy human subjects (Brennan et al., 2005). The effect of
endogenous GLP-1 on gastropyloroduodenal motility has been evaluated using its
specific receptor antagonist exendin(9-39). Exendin(9-39) has been reported to block
the effects of GLP-1 on gastric emptying in rats (Tolessa et al., 1998), as well as fasting,
and the effects of small intestinal glucose on APD motility, in humans (Schirra et al.,
2006).
1.4.4.2 Effects on appetite and energy intake
Data relating to the role of GLP-1 in appetite and energy intake regulation are
inconsistent. While most studies have demonstrated that intravenous GLP-1 inhibits
energy intake and/or increases the perception of fullness and decreases hunger in
animals (Turton et al., 1996) in lean, overweight and type-2 diabetes subjects (Näslund
et al., 1998, Verdich et al., 2001a, Gutzwiller et al., 1999a), a few studies have failed to
demonstrated an effect (Brennan et al., 2005, Long et al., 1999). The reduction of food
intake may result from the effects of GLP-1 on gastric motility and gastric emptying,
and appears to be mediated by vagal mechanisms (Delgado-Aros et al., 2002).
Exendin(9-39), has been reported to attenuate the inhibitory effects of GLP-1 on energy
intake in rats (Turton et al., 1996); comparable studies have not been performed in
humans.
21

Nutrients, gastric motility, hormone release and energy intake Chapter 1
The potential relationship between endogenous GLP-1 release by nutrients with
gastrointestinal motility and energy intake in healthy human subjects, has not been
evaluated (Chapter 7).
1.4.5 Glucose-dependent insulinotropic polypeptide (GIP)
GIP is a 42 amino acid peptide that inhibits gastric acid secretion. It is synthesised, and
released from intestinal “K” cells, the majority of which are located in the duodenum
and proximal jejunum (Fehmann et al., 1995). In humans, GIP is secreted in response
to carbohydrate (Rayner et al., 2000b) and fat (Falko et al., 1975). GIP, like GLP-1,
acts as an incretin, as this hormone also simulates insulin release during hyperglycaemia
(Morgan, 1996).
1.4.5.1 Effects on gastric and intestinal motility
The limited information that is available indicates that GIP has no effect on gastric
emptying/motility (Meier et al., 2004, Miki et al., 2005). For example, there was no
difference in gastric emptying rates or emptying half time of a solid meal after treatment
with intravenous GIP at 2 pmol/kg/min or placebo in healthy humans (Meier et al.,
2004). In mice, subcutaneous injection of 100 �g human GIP did not affect
gastrointestinal transit of an orally ingested barium sulphate meal (Miki et al., 2005).
1.4.5.2 Effects on appetite and energy intake
The role of GIP on appetite and energy intake is uncertain. When administered to rats,
GIP had no effect on food intake (Garlicki et al., 1990). A few studies, however, have
22

Nutrients, gastric motility, hormone release and energy intake Chapter 1
reported that appetite and subsequent energy intake after intraduodenal glucose
infusions (Lavin et al., 1998), or a meal (Verdich et al., 2001b) are related to
postprandial GIP responses in lean and obese humans. As these studies have not
evaluated the direct effect of GIP on appetite and energy intake, it is possible that any
effect of GIP may be due to insulin.
1.4.6 Insulin
Insulin is a peptide hormone synthesised in the pancreas within the �-cells of the islet of
Langerhans. Its primary role relates to glucose homeostasis. The magnitude of insulin
secretion in response to carbohydrate is dependent on the release of the incretin
hormones, GLP-1 and GIP.
1.4.6.1 Effects on gastric and intestinal motility
Intravenous infusion of insulin in dogs has reported to enhance gastric motility in a
number of studies (Quigley and Templeton, 1930, Regan, 1933, Nelsen et al., 1966),
possibly due to vagal stimulation induced by hypoglycaemia (Walker et al., 1974). The
effect of insulin on gastric emptying and motility, however, has produced conflicting
results in humans. Hyperinsulinaemia under euglycaemic conditions may slow solid
and liquid gastric emptying, slightly, but significantly, in healthy humans (Kong et al.,
1998, Eliasson et al., 1995), but has little, if any, effect in type-1 or type-2 diabetes
patients (Kong et al., 1999a). In regards to antroduodenal motility, hyperinsulinaemia
may inhibit antral PWs (Gielkens et al., 1997), attenuate antral phase III, and shorten
duodenal phase III, activity (Bjornsson et al., 1995) and inhibits fed jejunal motility,
23
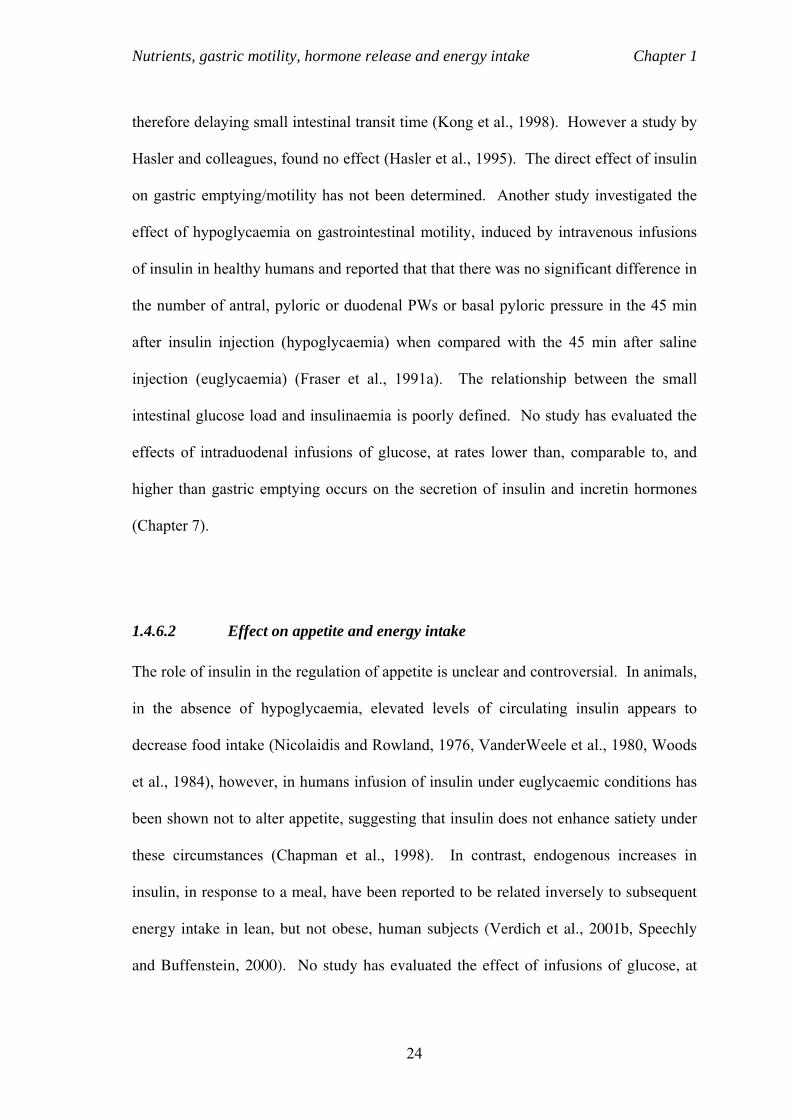
Nutrients, gastric motility, hormone release and energy intake Chapter 1
therefore delaying small intestinal transit time (Kong et al., 1998). However a study by
Hasler and colleagues, found no effect (Hasler et al., 1995). The direct effect of insulin
on gastric emptying/motility has not been determined. Another study investigated the
effect of hypoglycaemia on gastrointestinal motility, induced by intravenous infusions
of insulin in healthy humans and reported that that there was no significant difference in
the number of antral, pyloric or duodenal PWs or basal pyloric pressure in the 45 min
after insulin injection (hypoglycaemia) when compared with the 45 min after saline
injection (euglycaemia) (Fraser et al., 1991a). The relationship between the small
intestinal glucose load and insulinaemia is poorly defined. No study has evaluated the
effects of intraduodenal infusions of glucose, at rates lower than, comparable to, and
higher than gastric emptying occurs on the secretion of insulin and incretin hormones
(Chapter 7).
1.4.6.2 Effect on appetite and energy intake
The role of insulin in the regulation of appetite is unclear and controversial. In animals,
in the absence of hypoglycaemia, elevated levels of circulating insulin appears to
decrease food intake (Nicolaidis and Rowland, 1976, VanderWeele et al., 1980, Woods
et al., 1984), however, in humans infusion of insulin under euglycaemic conditions has
been shown not to alter appetite, suggesting that insulin does not enhance satiety under
these circumstances (Chapman et al., 1998). In contrast, endogenous increases in
insulin, in response to a meal, have been reported to be related inversely to subsequent
energy intake in lean, but not obese, human subjects (Verdich et al., 2001b, Speechly
and Buffenstein, 2000). No study has evaluated the effect of infusions of glucose, at
24

Nutrients, gastric motility, hormone release and energy intake Chapter 1
rates lower than, comparable to and higher than gastric emptying occurs on the
secretion of insulin and related these to effects on subsequent energy intake (Chapter 7).
1.5 FACTORS THAT MODULATE THE EFFECTS OF NUTRIENTS
ON GASTRIC EMPTYING, MOTILITY, HORMONE
RELEASE/SUPPRESSION, APPETITE AND ENERGY INTAKE
A number of factors may influence the effects of small intestinal nutrients on
gastrointestinal motility, hormone release/suppression, appetite and energy intake.
These include; the length and region of small intestine exposed to nutrient, the load of
nutrient delivered into the small intestine, and the duration of exposure of the small
intestine to the nutrient. The influence of length and region have not been extensively
evaluated in humans, however, the effects of different loads (g or kcal/min) and
durations (Castiglione et al., 1998) of small intestinal nutrient infusions on
gastrointestinal motility, hormone release/suppression, appetite and energy intake have
been explored, thereby assessing the effects of length, or region, of exposure indirectly.
It is reasonable to assume that with greater nutritional loads, a greater length of small
intestine would be exposed to the nutrient. For example, in both dogs (Lin et al., 1996)
and rats (Meyer et al., 1998a) ingestion of meals with increasing fat and/or glucose
content results in increasing loads of triglyceride or glucose emptying from the stomach
into the duodenum, associated with increased spread of both fat and glucose to, and
along, the ileum. This caudal spread of digestion and absorption occurs when the
digestive capacity of nutrients, as well as the absorptive capacities for their products per
cm of gut, are exceeded (Meyer et al., 1998a, Meyer et al., 1998c).
25

Nutrients, gastric motility, hormone release and energy intake Chapter 1
1.5.1 Effects of length of small intestinal exposure to nutrient
1.5.1.1 Effects on gastric and intestinal motility
In animals, the effects of nutrients on gastric emptying are dependent on the length of
small intestine exposed to that nutrient, and these effects are also nutrient-specific
(Cooke, 1977, Lin et al., 1989, Lin et al., 1990). In dogs, glucose and fat delayed
gastric emptying when perfused at the duodenojejunal junction, but had no effect when
infused only into the first 5 cm of the duodenum (Cooke, 1977). In this same study,
perfusion of 0.1 M HCl or L-tryptophan into the first 5 cm of the duodenum inhibited
gastric emptying, to the same extent, as perfusion of the entire duodenum and proximal
jejunum (Cooke, 1977). This study, therefore, indicated that exposure of > 5 cm of the
gut to glucose/fat is required to inhibit gastric emptying. Two studies by Lin and
colleagues investigated the effect of exposing various lengths (15, 65, 150 cm and all),
to glucose (at 0.25, 0.5 and 1.0 M) and the fatty acid oleate (at 3, 9 and 27 mM), in dogs
(Lin et al., 1990, Lin et al., 1989). For glucose, no inhibition of gastric emptying was
observed, at any load, when confined to the first 15 cm of the duodenum (Lin et al.,
1989). By contrast, maximal inhibition of gastric emptying was achieved during
glucose perfusions involving 150 cm, and all, of the small intestine. When 65 cm of the
small intestine was exposed to glucose, gastric emptying was inhibited by 50 - 60 %
(Lin et al., 1989). Similar, inhibitory effects on gastric emptying were observed for fat
(oleate), in a dose-dependent manner (Lin et al., 1990) (Figure 1.8). These
observations establish that the length of the small intestine exposed to nutrient is a
determinant of gastric emptying in animals.
26

Nutrients, gastric motility, hormone release and energy intake Chapter 1
27
Figure 1.8 The inhibition index (= 1 - AUColeate/AUCbuffer) for gastric emptying (1 = maximal
inhibition, 0 = minimal inhibition) of 3, 9, 27 mM loads of sodium oleate in carbonate buffer expressed as a function of length of small intestine exposed to nutrient in dogs implanted with small intestinal fistula. Adapted from (Lin et al., 1990).
Less information is available regarding the effect of length of small intestinal exposure
to nutrients on gastric motility in humans. More recently, a study performed in humans
compared the effects of infusing glucose into an isolated 60 cm segment of the proximal
intestine (“short segment”), with an infusion that had access to the entire small intestine
(“long segment”) (Little et al., 2006a). The number of antral PWs was suppressed
during the “long”, not the “short”, segment infusion while pyloric pressures were
stimulated by both infusions (Little et al., 2006a). Taken together, these studies in
animals and humans indicate that feedback from the distal small intestine is an
important regulator in gastric emptying - as more receptors are recruited along the small
intestine, the greater the feedback occurs. The effects of exposing different lengths of
the small intestine, by increasing loads of small intestinal infusions of fat and glucose,
on APD motility, in humans has not been evaluated (Chapters 6 and 7).
NOTE: This figure is included on page 27 of the print copy of the
thesis held in the University of Adelaide Library.

Nutrients, gastric motility, hormone release and energy intake Chapter 1
1.5.1.2 Effects on gastrointestinal hormone release
As discussed in Chapter 1.4, gastrointestinal hormone release in response to nutrients
occurs in differing regions of the small intestine, depending on the location of the
hormone-producing cells. Accordingly, their stimulation or suppression is dependent
on the length of exposure of small intestine exposed to nutrients.
In a recent study, referred to above, the release of insulin, GLP-1, GIP, CCK and
ghrelin was demonstrated to be dependent on the length of small intestine exposed to
glucose in humans (Little et al., 2006a). Plasma GIP and CCK increased similarly after
both “short segment” and “long segment” infusions, however, in contrast plasma GLP-1
only increased and ghrelin suppressed, when > 60 cm of small intestine was exposed to
glucose. Rises in insulin were greater during the long-, than during the short-segment
infusion (Little et al., 2006a). The effect of exposing different lengths of the small
intestine, by increasing loads of small intestinal infusions of fat and glucose, on
gastrointestinal hormone release has not been evaluated (Chapters 5, 6 and 7).
1.5.1.3 Effects on appetite and energy intake
A number of studies have suggested that infusion of either fat and/or carbohydrate into
the duodenum, jejunum or ileum decreases appetite and/or subsequent energy intake in
humans (Chapman et al., 1999, Welch et al., 1988). The extent of this suppression may
be dependent on the length exposed to the nutrient. In rats, studies have been conducted
to assess the effect of length of nutrient exposure on the regulation of appetite and
energy intake directly, and these have demonstrated that when lactose or oleate were
confined to a 35 cm segment of the jejunum, there was no suppression, but, when
28

Nutrients, gastric motility, hormone release and energy intake Chapter 1
allowed access to the entire length of the small intestine, there was potent suppression,
of energy intake (Meyer et al., 1998c). The effect of exposing different lengths of the
small intestine to nutrients on appetite and energy intake in humans have hitherto, not
been investigated.
1.5.2 Effects of region of small intestinal exposure to nutrient
1.5.2.1 Effects on gastric and intestinal motility
Less information is available about the effect of the region of the small intestine
exposed to nutrients on gastric and intestinal motility, probably reflecting the technical
challenges in performing these studies. For several decades, it was believed that
nutrients inhibited gastric emptying by triggering nutrient sensors confined to the
duodenum (Hunt, 1963), however subsequent studies established that there were sensors
in the terminal human ileum that inhibited jejunal motility when the ileum was perfused
with fat (Spiller et al., 1984, Read et al., 1984). More recently a study by Azpiroz and
Malagelda, compared the effects of proximal vs. distal small intestinal nutrients on
gastric motility and reported that the inhibition of fundic tone in dogs, occurred when
the proximal, but not the distal, one-third of the intestine was perfused with fat,
however this effect was the opposite for maltose (Azpiroz and Malagelada, 1985a). In
relation to gastric emptying, a study by Lin and colleagues investigated region-specific
differences in the intestinal inhibition of solid emptying, by infusing glucose into the
first, second, third and fourth quarter of the small intestine, in dogs. They reported that
gastric emptying of solids, but not liquids, was ~ three times more potently inhibited by
glucose in the fourth quarter vs. the first and second quarter of the small intestine,
suggesting that signals arising from the distal small intestine have more potent effects to
29

Nutrients, gastric motility, hormone release and energy intake Chapter 1
inhibit gastric emptying (Lin et al., 1992). The potential region-dependent effect of
nutrients on motility in humans has not been evaluated.
1.5.2.2 Effects on gastrointestinal hormone release
Gastrointestinal hormone release, or suppression, occurs as a result of exposure of
nutrients to different regions of the small intestine, depending on the location of the
hormone-producing cells, as discussed in Chapter 1.4.
1.5.2.3 Effects on appetite and energy intake
The extent of suppression of appetite and energy intake by nutrients has been shown to
be dependent on the region of small intestine exposed to nutrients. In humans, Welch
and colleagues demonstrated that infusion of a 50 % corn oil emulsion into the jejunum
or ileum reduced the period of eating and quantity of food consumed at a buffet meal,
when compared with saline (Welch et al., 1988). However suppression of hunger
before the meal was only evident after the jejunal infusion (Welch et al., 1988). In a
more recent study in humans, glucose was infused into either the proximal (duodenal)
or distal (mid-jejunal), small intestine and hunger scores and energy intake was higher
with mid-jejunal infusions and lower with duodenal infusion (unpublished data). Taken
together these studies indicate differences in the regional effects of lipid and glucose on
appetite and energy intake.
30
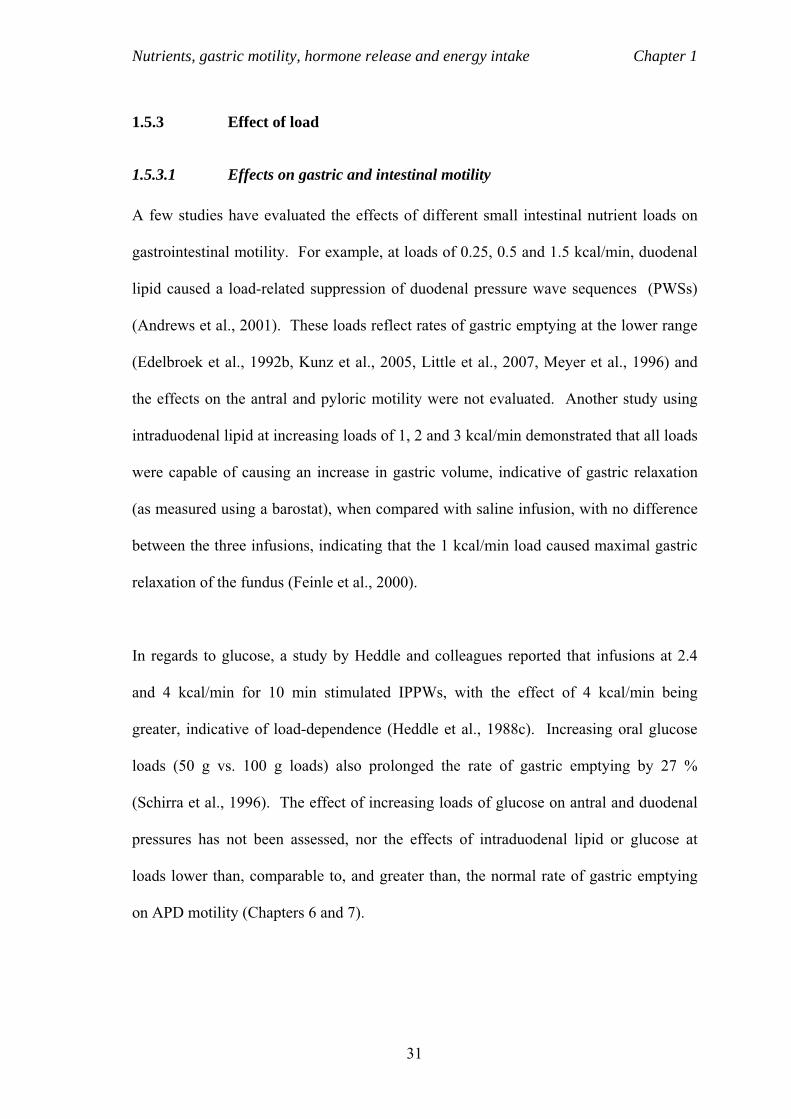
Nutrients, gastric motility, hormone release and energy intake Chapter 1
1.5.3 Effect of load
1.5.3.1 Effects on gastric and intestinal motility
A few studies have evaluated the effects of different small intestinal nutrient loads on
gastrointestinal motility. For example, at loads of 0.25, 0.5 and 1.5 kcal/min, duodenal
lipid caused a load-related suppression of duodenal pressure wave sequences (PWSs)
(Andrews et al., 2001). These loads reflect rates of gastric emptying at the lower range
(Edelbroek et al., 1992b, Kunz et al., 2005, Little et al., 2007, Meyer et al., 1996) and
the effects on the antral and pyloric motility were not evaluated. Another study using
intraduodenal lipid at increasing loads of 1, 2 and 3 kcal/min demonstrated that all loads
were capable of causing an increase in gastric volume, indicative of gastric relaxation
(as measured using a barostat), when compared with saline infusion, with no difference
between the three infusions, indicating that the 1 kcal/min load caused maximal gastric
relaxation of the fundus (Feinle et al., 2000).
In regards to glucose, a study by Heddle and colleagues reported that infusions at 2.4
and 4 kcal/min for 10 min stimulated IPPWs, with the effect of 4 kcal/min being
greater, indicative of load-dependence (Heddle et al., 1988c). Increasing oral glucose
loads (50 g vs. 100 g loads) also prolonged the rate of gastric emptying by 27 %
(Schirra et al., 1996). The effect of increasing loads of glucose on antral and duodenal
pressures has not been assessed, nor the effects of intraduodenal lipid or glucose at
loads lower than, comparable to, and greater than, the normal rate of gastric emptying
on APD motility (Chapters 6 and 7).
31

Nutrients, gastric motility, hormone release and energy intake Chapter 1
1.5.3.2 Effects on gastrointestinal hormone release
Only a handful of studies have evaluated the effects of small intestinal load of fat and/or
glucose on the secretion of gastrointestinal hormones. A study by Feinle and colleagues
demonstrated that duodenal lipid at 1, 2 and 3 kcal/min, for 30 min, increased plasma
CCK and PYY. Only the secretion of CCK was observed to be load-dependent (Feinle
et al., 2000), which was postulated to reflect the short duration period and/or small load
of lipid infused. - As CCK is secreted from cells located in the proximal small intestine
(Buffa et al., 1976), at the site of infusion, all loads of lipid would have caused a
secretion of CCK, whereas the lipolytic products of the lowest loads (i.e. 1 kcal/min)
may not have reached the distal part of the small intestine before being digested and
absorbed, and accordingly, failed to stimulate PYY (Adrian et al., 1985). It is not
known how small intestinal lipid loads that are substantially less than average gastric
emptying, e.g. as would occur when gastric emptying is slowed, affect gut hormone
secretion (Chapter 6).
In regards to glucose, it has been suggested that a threshold of small intestinal glucose
delivery of about 1.8 kcal/min needs to be exceeded in order to stimulate GLP-1
secretion (Schirra et al., 1996). This threshold was suggested as a 1.1 kcal/min
intraduodenal glucose load failed to increase GLP-1 levels, whereas a 2.2 kcal/min load
brought about a steady GLP-1 release (Schirra et al., 1996). However, this observation
is inconsistent with two recent studies which demonstrated that duodenal glucose
infusions at 1 kcal/min were sufficient to stimulate GLP-1, at least transiently, in
healthy humans (Chaikomin et al., 2005, O'Donovan et al., 2004) and type-2 diabetes
patients (O'Donovan et al., 2004). In contrast, the release of GIP has been shown to be
load-dependent, occurring in response to loads as small as 1 kcal/min (Schirra et al.,
32

Nutrients, gastric motility, hormone release and energy intake Chapter 1
1996, Chaikomin et al., 2005, O'Donovan et al., 2004), and eliciting a constant release
with a plateau achieved after ~ 30 min (Schirra et al., 1996). The load that elicits a
maximal GIP response is unknown and no study has evaluated the effect of increasing
duodenal glucose loads on CCK release (Chapter 7).
1.5.3.3 Effects on appetite and energy intake
The effects of lipid and glucose on appetite and energy intake are also dependent on the
nutrient load administered, however, there are differences between fat and glucose. For
lipid, loads as low as 2 kcal/min for 45 min (Castiglione et al., 1998) up to 2.9 kcal/min
for 120 min (MacIntosh et al., 2001a, Chapman et al., 1999) have demonstrated to
reduce energy intake, in healthy young, old and obese individuals. In healthy subjects
lipid, at these loads, also reduced hunger and increased fullness (MacIntosh et al.,
2001a, Chapman et al., 1999). For glucose, intraduodenal loads between 2 (Rayner et
al., 2000b) and 2.9 (Chapman et al., 1999, MacIntosh et al., 2001a) kcal/min for 120
min (corresponding to loads of 240 kcal and 339 kcal, respectively) failed to reduce
energy intake, when compared with saline, in healthy young males. There was,
however, an increase in fullness (MacIntosh et al., 2001a, Chapman et al., 1999). To
date, the only load of glucose that has been shown to reduce energy intake is 3.2
kcal/min for 90 min (288 kcal/min) (Lavin et al., 1998). The effects of loads of
lipid/glucose lower than, comparable to, and greater than the normal rate of gastric
emptying on appetite and energy intake have not been evaluated (Chapters 6 and 7).
33

Nutrients, gastric motility, hormone release and energy intake Chapter 1
1.5.4 Effects of duration of exposure of the small intestine to nutrient
1.5.4.1 Effects on gastric and intestinal motility
Little information is available about the effect of the duration of small intestinal nutrient
exposure on gastrointestinal function. One study, by Edelbroek and colleagues,
demonstrated that glucose infusions, at 2.4 kcal/min, for a long period (i.e. t = 120 min)
and two short periods (i.e. for 20 min at t = 0 - 20 min and t = 80 - 100 min) increased
the number of IPPWs and basal pyloric pressure during the first 20 min, but after this
time there was a decrease, with a subsequent return to baseline. In addition the second
short 20 min infusion of glucose at t = 80 - 100 min increased pyloric pressures, but at a
smaller magnitude when compared with the first 20 min infusion (Edelbroek et al.,
1992a) (Figure 1.9). In this study, antral PWs were suppressed for the entire 120 min
infusion period. This suggests that there may be an “adaptation” in the pyloric motor
response. It would therefore be of interest to assess the effects of “short” and “long”
durations of nutrient infusion on gastrointestinal motility to determine whether there is
an adaptive response (Chapter 5).
34

Nutrients, gastric motility, hormone release and energy intake Chapter 1
Figure 1.9 Number of isolated pyloric pressure waves during the 120 min (�) and two 20 min (�) intraduodenal glucose infusion. There was a stimulation of isolated pyloric pressure waves during the first 20 min of the 120 min infusion (P < 0.05). Both 20 min infusions were associated with stimulation of isolated pyloric pressure waves (P < 0.05). The response to the second infusion was less (P < 0.05) than the first. Data are median values and interquartile ranges. Adapted from (Edelbroek et al., 1992a).
1.5.4.2 Effects on gastrointestinal hormone release
The effect of duration of exposure of the intestine to nutrients on the stimulation of
gastrointestinal hormones has not been assessed in humans (Chapter 5). However, it
can be anticipated that their release would differ depending on the site of secretion of
the hormone and the distribution of digestive products along the gut, which would also
be dependent on the load of the nutrient (Chapter 5).
1.5.4.3 Effects on appetite and energy intake
The duration of nutrient infusions, as well as the time period between the ingestion of a
“preload” and ad libitum food intake has been the reported to influence energy intake
(Castiglione et al., 1998, Rolls et al., 1991). For example, Castiglione and colleagues
investigated the effects of lipid infused into the small intestine at a constant rate (2
35

Nutrients, gastric motility, hormone release and energy intake Chapter 1
kcal/min) over different durations, i.e. 15 min, 45 min and 90 min, on subsequent
energy intake (Castiglione et al., 1998). The 45 min and 90 min infusions reduced
energy intake, in a duration-dependent fashion, when compared with a saline, and the
15 min, infusion. In addition, there was a trend for the 90 min infusion to decrease
hunger and prospective consumption and increase fullness when compared with saline
(Castiglione et al., 1998). These apparent duration-dependent effects to reduce food
intake are likely reflect a combination of factors, including the number of calories,
duration of exposure of any one segment of the small intestine and the length of
intestine exposure. As mentioned in Chapter 1.5.1, the inhibition of gastric emptying
by the presence of nutrients in the small intestine is proportional to the length of the gut
exposed to the nutrient, therefore, the longer the nutrient infusion, the more intestinal
receptors would be recruited thereby a bigger effect on energy intake. Therefore, the
observations by Castiglione and colleagues for the 15 min infusion are indicative of the
delivery of insufficient calories, or possibly an insufficient period of stimulation to elicit
feedback response from the small intestine to inhibit energy intake (Castiglione et al.,
1998).
A study by Rolls and colleagues demonstrated that the duration between a preload and
ad libitum food intake may also affect energy intake in humans (Rolls et al., 1991).
Equi-caloric and equi-volume high-fat or high-carbohydrate preloads were consumed at
three different intervals, i.e. 30, 90 and 180 min, before a self-selected lunch was
served. For the 30 min delayed condition subjects accurately compensated for the
calories in the preload compared with a no preload condition, and the compensation was
less precise as the interval increased (Rolls et al., 1991). A limitation of the two studies
mentioned above is that too many variables may have influenced their observations on
36

Nutrients, gastric motility, hormone release and energy intake Chapter 1
energy intake, such as increasing caloric loads of the preload/infusion as a result of
longer durations. No study has evaluated the effects of small intestinal infusion of
nutrients over different durations, but at the same caloric load, on appetite or energy
intake (Chapter 5).
1.6 GASTROINTESTINAL MOTILITY DISORDERS
A number of disorders of the gastrointestinal tract result in altered gastrointestinal
function, hormone release/suppression, appetite and energy intake. These disorders
include obesity, type-2 diabetes mellitus and functional dyspepsia. Abnormalities of
gastrointestinal function and diet in functional dyspepsia have been described in detail
in Chapter 2.
1.7 SUMMARY
This chapter has reviewed the potential factors involved in the regulation of gastric
emptying, gastrointestinal motility, hormone release/suppression, appetite and energy
intake. The studies described in the subsequent chapters of this thesis address the
following hypotheses:
(i) the load and/or duration of intraduodenal lipid affect APD motility, plasma CCK and
PYY and energy intake (Chapters 5 and 6)
(ii) the load of intraduodenal glucose affect glycaemia, gastrointestinal hormones, APD
motility and energy intake (Chapter 7)
(iii) there are relationships between the effects of intraduodenal lipid and/or glucose on
APD motility, gastrointestinal hormone release and energy intake (Chapters 6 and 7).
37

Functional dyspepsia Chapter 2
Chapter 2
FUNCTIONAL DYSPEPSIA
2.1 INTRODUCTION
Functional dyspepsia (FD) is a clinical syndrome characterised by chronic, or recurrent,
upper gastrointestinal symptoms without a known cause that is identifiable by
conventional diagnostic means. While FD is not life-threatening, it affects quality of
life negatively and accounts for a substantial number of attendances to doctors
(Meineche-Schmidt et al., 1999). Hence, FD represents a substantial source of
morbidity, as well as a considerable financial burden to the health care system.
FD is clearly a heterogenous disorder, and the pathophysiology and aetiology of FD
remain poorly defined, despite considerable research interest. Patients with FD
characteristically report symptoms such as abdominal bloating and discomfort, fullness,
nausea, vomiting and epigastric pain and are often unable to finish normal-sized meals.
Attempts to correlate these symptoms with functional abnormalities have generally been
unsuccessful. Symptoms have been related to a number of gastrointestinal
abnormalities in subgroups of patients. These include disordered gastric emptying and
gastrointestinal motility, Helicobacter pylori infection, visceral hypersensitivity,
functional abnormalities in the central nervous system, and psychological and cognitive
38

Functional dyspepsia Chapter 2
factors (Talley, 1995). Current treatments are, accordingly, targeted at normalisation of
gastric emptying and motility using prokinetic drugs, Helicobacter pylori eradication
and acid suppression. However, the efficacy of all therapies is marginal at best (see
Chapter 3). Current treatments also fail to address the fact that symptoms are frequently
induced, or exacerbated, by the ingestion of food, moreover, there is limited information
about the relationship between symptoms, disordered gastric motor function and
patterns of nutrient intake. This chapter provides an overview of the potential roles of
gastric emptying and motility, nutrient intake, gastrointestinal hormones and cognitive
factors to the pathophysiology of FD. The limitations of previous studies of FD
patients, such as inconsistencies and inadequacies in the methods used, is also
discussed.
2.2 DEFINITION OF FUNCTIONAL DYSPEPSIA
Until recently, the international definition of FD, as adopted by the Rome II working
party, of “discomfort”, or “pain” centred in the upper abdomen, has been most widely
applied (Talley et al., 1999a). FD has been defined by the Rome II international
working party, by, (i) persistent or recurrent dyspepsia (discomfort or pain centred in
the upper abdomen), lasting for at least 12 weeks, which need not be consecutive,
within the preceding 12 months, (ii) no evidence of organic disease (as evaluated by
upper endoscopy and/or ultrasound) that is likely to explain the symptoms, and (iii) no
evidence that dyspepsia is exclusively relieved by defecation or associated with the
onset of a change in stool frequency or stool form (i.e. not irritable bowel syndrome
(IBS) (Talley et al., 1999a)). Patients with FD have been subdivided into three groups,
based on the predominant symptom(s); “dysmotility-like” dyspepsia, if the
39

Functional dyspepsia Chapter 2
predominant symptom is of discomfort (upper abdominal fullness, bloating, belching or
nausea), “ulcer-like” dyspepsia, if the predominant symptom is that of pain, and
“unspecified” (non-specific) dyspepsia, if the predominant symptom(s) fails to meet one
of the two previous descriptions. In 2006, the Rome III criteria were introduced, which
are more user-friendly for both clinical and research settings than the Rome II criteria.
Under the Rome III criteria, FD is divided into two subgroups; meal-induced dyspeptic
symptoms (“postprandial distress syndrome”) and epigastric pain (“epigastric pain
syndrome”) (Drossman and Dumitrascu, 2006). At the time the studies presented in
Chapters 8 and 9 were performed, the Rome III criteria were not available.
2.3 PREVALENCE AND COSTS OF FUNCTIONAL DYSPEPSIA
The prevalence of FD varies considerably between different populations. Although this
may reflect genuine epidemiological differences, it is also clear that the varying
definitions used in different studies may well have contributed to discrepancies. In a
recent survey, using the Rome II criteria, and where symptoms of reflux and IBS were
excluded, the prevalence varied between 11 - 29 % around the world (Li et al., 2002,
Westbrook and Talley, 2002). Population-based studies have also attempted to identify
epidemiological risk factors for FD. These studies have indicated that; FD does not
appear to be related to age, however, FD occurs more frequently in those who are less
than 59 years of age in Japan (Hirakawa et al., 1999), female adults with FD
significantly outnumber males in Australia (Koloski et al., 2002), while ethnicity has
not been investigated (as surveys have only evaluated single/similar ethnic groups)
(Mahadeva and Goh, 2006). There is a strong direct relationship between lower
household income and larger household membership and the incidence in FD in the
40

Functional dyspepsia Chapter 2
USA (Drossman et al., 1993). Psychological disturbances have also been associated
with FD. For example, in the American adult population, sexual, emotional and verbal
abuse, either in childhood or adulthood, are associated with FD (Talley et al., 1994),
and in an Australian survey, levels of anxiety and depression were higher in adult FD
patients (Koloski et al., 2002). Smoking (Bernersen et al., 1996) and regular alcohol
(Mahadeva and Goh, 2006) intake are apparently not risk factors.
FD has substantial implications for medical workload and the economy. In two recent
community surveys of several European and North American populations, 20 % of
people with dyspeptic symptoms had consulted either primary care physicians or
hospital specialists, more than 50 % of sufferers were on medication, and approximately
30 % reported taking days of work or school because of their symptoms (Haycox et al.,
1999, Moayyedi and Mason, 2002). This medical attention may also involve extended
and repeated investigations, plus high prescription costs and follow-up rates, which
together result in considerable direct costs (Agreus, 1993, Jones and Lydeard, 1992).
Only one study has attempted to estimate the costs of FD, in regards to in- and out-
patient care, as well as costs to society for loss of production - a Swedish study in 8
million people (Nyren et al., 1985). The annual expenditure for in-patient care was
estimated to be 10.3 million Swedish Krona (SEK) (~ 1.7 million AUS), and for out-
patient care and drug costs, as determined from a nation-wide sample survey, 197.1
million SEK (~ 32 million AUS) and 60 million SEK (~ 10 million AUS), respectively.
The most dominant item among social costs was loss of production due to short-term
sick leave, which amounts to 2496 SEK (~ 406 million AUS) (Nyren et al., 1985). No
recent studies have evaluated the impact of FD on social and economic trends in other
countries. However, gastroenterologists are now showing increased interest in the
41

Functional dyspepsia Chapter 2
investigation of the pathophysiology of FD and this is likely to promote studies to
clarify its causation, natural history and socio-economic impact, all of which are
currently poorly defined (Tebaldi and Heading, 1998).
2.4 PATHOPHYSIOLOGY OF FUNCTIONAL DYSPEPSIA -
RELATIONSHIP TO GASTROINTESTINAL FUNCTION
A number of gastrointestinal factors have been investigated as potential causes of
symptoms in FD, including Helicobacter pylori infection, hypersensitivity to gastric
acid secretion, delayed gastric emptying, disordered intragastric meal distribution,
impaired gastric relaxation, dysfunction of the antrum and visceral hypersensitivity.
2.4.1 Helicobacter pylori and acid secretion
It is well established that Helicobacter pylori (H pylori) infection is the main cause of
peptic ulcer disease (NIH Consensus Conference, 1994), but its role in the aetiology of
FD is unclear and controversial. Results from a number of therapeutic studies in FD
have demonstrated results in favour of, or against, H pylori eradication therapy for
symptom improvement (Talley, 1994). Gastric inflammation, caused by H pylori, has
been shown to alter gastric function and may thereby cause symptoms (Czinn et al.,
1991, Tytgat et al., 1991). However, a study which compared the symptom profile of
patients with and without H pylori and investigated potential underlying mechanisms
including disturbed gastric emptying, gastric hypersensitivity and gastric
accommodation, failed to demonstrate any association between the prevalence of
symptoms or gastric sensory motor functions in those with or without H pylori (Sarnelli
et al., 2003).
42

Functional dyspepsia Chapter 2
Increased gastric acid secretion and duodenal acid overload have been suggested as
causes of FD in patients with abdominal pain in the fasted state (Nyren et al., 1987),
however, basal and stimulated gastric acid secretion have been reported to be
comparable to that in asymptomatic controls regardless of the subgroup of FD (Nyren et
al., 1987). Another possibility is that FD patients are hypersensitive to acid. Samson
and colleagues reported that the duodenal bulb is hypersensitive to acid infusion, which
induced nausea and decreased duodenal motility in FD patients, but not in controls
(Samsom et al., 1999). However, therapies, such as acid suppressants and antacids (see
Chapter 3.2.3), have had little, if any, effect on symptoms in patients with FD.
Accordingly, the role of acid secretion in the induction of symptom in FD, remains
uncertain.
2.4.2 Delayed gastric emptying
Slowing of gastric emptying in response to nutrients, particularly fat, is caused by the
combined effects of relaxation of the proximal stomach (Azpiroz and Malagelada,
1985b), decreased contractility of the antrum and small intestine (Heddle et al., 1988a)
and stimulation of isolated pyloric pressure waves (Heddle et al., 1988b, Andrews et al.,
1998) (see Chapter 1.3.2). Delayed gastric emptying has long been considered the main
pathogenic mechanism underlying the generation of symptoms in FD. Delayed gastric
emptying has been reported in 20 - 60 % of FD patients (Cuomo et al., 2001, Duan et
al., 1993, Jian et al., 1989, Mittal et al., 1997, Stanghellini et al., 1996, Wegener et al.,
1989). This substantial variability in the prevalence of delayed gastric emptying is
likely to reflect inconsistencies in study design, particularly test meals and methods
used to measure gastric emptying, and the inclusion criteria for FD patients. In
43

Functional dyspepsia Chapter 2
addition, previous studies have failed to demonstrate a meaningful relationship between
the presence of dyspeptic symptoms with a delay in solid/liquid gastric emptying (Gilja
et al., 1996, Talley et al., 2001) or have not evaluated symptoms concurrently with
gastric emptying (Cuomo et al., 2001, Duan et al., 1993, Stanghellini et al., 1996). For
example, a study which measured gastric emptying of a solid meal using radioisotopic
techniques in 343 patients with FD, showed a significant, albeit weak, correlation
between postprandial fullness and vomiting and gastric emptying, suggesting that
patients with delayed gastric emptying are more likely to experience dyspeptic
symptoms (Stanghellini et al., 1996). However, symptoms were evaluated as an
average symptom score, and were not assessed concurrently with gastric emptying.
Moreover, patients were recruited from a tertiary referral centre, hence, the observations
may have been influenced by selection bias, as both symptoms and disturbances in
gastric emptying may have been more severe than in dyspeptic patients recruited from
the general population. In contrast to these findings, a study by Gilja and colleagues
showed no correlation between symptoms experienced after ingestion of a soup meal
and the rate of gastric emptying, despite FD patients reporting significantly higher
symptom scores than healthy control subjects (Gilja et al., 1996). A further study also
failed to demonstrate any association between individual symptoms and the delay in
gastric emptying (as assessed by C13 octanoic acid breath test) in patients with FD
(Talley et al., 2001). Furthermore, Hausken and colleagues reported that symptoms
characteristically occur within minutes of food consumption (approximately 3 min)
(Hausken et al., 1998), while a delay in gastric emptying is characteristically only
quantified much later, e.g. at 120 - 180 min. Therefore, it seems unlikely that dyspeptic
symptoms result from delayed gastric emptying, per se.
44

Functional dyspepsia Chapter 2
Symptoms in FD patients have also been suggested to be the result of accelerated
emptying in the “early phase”, particularly that of fat (Lin et al., 1999). A study by Lin
and colleagues demonstrated that in patients with fat intolerance (as diagnosed by
symptoms of postprandial bloating, early satiety, nausea and pain), gastric emptying of
a fat meal containing 15 or 60 g of fat was faster in the first 15 min, but not at 60 min,
when compared with healthy subjects (Lin et al., 1999). Symptoms, however, were not
evaluated in this study. No study has, to date, evaluated the “early phase” gastric
emptying of fat, and its relationship with symptoms, in patients with FD.
The studies summarised above, therefore, indicate that while delayed gastric emptying
is prevalent in FD, it is unlikely to be a direct cause of symptoms, in at least the
majority of cases, and the potential effect of accelerated “early phase” gastric emptying
has not been evaluated. The lack of a significant contribution of delayed gastric
emptying to dyspeptic symptoms is supported by the fact that in a large proportion of
FD patients gastric emptying is normal.
2.4.3 Intragastric meal distribution
In the healthy stomach, ingested food is stored in the proximal stomach and gradually
transported into the distal stomach where it is “ground” and “mixed” with gastric
secretions and then emptied into the small intestine. In approximately 30 - 40 % of
patients with FD intragastric meal distribution is disturbed (Troncon et al., 1994).
Studies, using scintigraphic (Troncon et al., 1994) and ultrasound (Gilja et al., 1996)
techniques, have demonstrated that in many patients with FD intragastric distribution is
abnormal, such that the relative amount of food present in the distal stomach (or
45

Functional dyspepsia Chapter 2
antrum) is increased. Troncon and colleagues reported that after ingestion of a liquid
meal, the amount of the meal which remained in the proximal half of the stomach was
less in FD patients compared with healthy subjects with a greater proportion in the
distal half of the stomach (Troncon et al., 1994) (Figure 2.1). - Overall gastric emptying
rates were comparable between FD patients and healthy subjects. The disturbance in
the intragastric meal distribution may reflect impaired postprandial relaxation of the
proximal stomach (Tack et al., 1998), and/or dysfunction of the distal stomach
(Hausken and Berstad, 1992b).
Figure 2.1 Representative gamma camera images taken immediately after ingestion of a liquid meal in a healthy subject (left) and a FD patient (right). Images have been divided into proximal and distal gastric regions. In the FD patient relatively more of the meal is in the distal stomach. Adapted from (Troncon et al., 1994).
2.4.4 Impaired gastric relaxation
Gastric relaxation allows the proximal stomach to accommodate a large volume without
a significant increase in intragastric pressure (Blackshaw et al., 1987). The relaxatory
response of the proximal stomach to a meal is impaired in approximately 40 % of
patients with FD (Gilja et al., 1996, Tack et al., 1998, Feinle et al., 2001a, Kim et al.,
2001) (Figure 2.2) and it has been suggested that patients with FD who have impaired
proximal gastric accommodation experience more postprandial symptoms, as assessed
46

Functional dyspepsia Chapter 2
by a global symptom score (Gilja et al., 1996). However, such an association remains
controversial, as investigations into the effects of pharmacological improvements in
gastric accommodation on dyspeptic symptoms have yielded conflicting outcomes
(Tack et al., 1998, Boeckxstaens et al., 2001, Boeckxstaens et al., 2002). A study by
Tack and colleagues suggested that impaired proximal gastric accommodation is
associated with “early satiety”, in that the volume of a nutrient-containing liquid drink
which could be consumed, was less in FD patients when compared with healthy
subjects (Tack et al., 1998). In turn, restoration of proximal gastric accommodation in
patients with FD induced by the fundus-relaxing 5HT-1 (5-Hydroxy-tryptamine-1)
agonist, sumatriptan, improved “early satiety”, in that a greater volume of nutrient-
containing liquid could be consumed (Tack et al., 1998). However, a more recent study
reported that treatment with sumatriptan had no affect on the maximal volume ingested,
or postprandial symptoms when compared with placebo in either FD patients or healthy
subjects (Boeckxstaens et al., 2002). Thus, while there is no doubt that impaired
proximal gastric accommodation is present in a subgroup of patients with FD, its role in
the genesis of symptoms in FD remains uncertain.
47

Functional dyspepsia Chapter 2
Figure 2.2 Mean intragastric volume as measured by a gastric barostat in a healthy subject and a FD patient before and after administration of liquid meal. Ingestion of the meal induced a rapid and sustained increase in intragastric volume in the healthy subject, reflecting a relaxation of the gastric fundus. The mean balloon volume, the average increase in intragastric volume, and the maximum volume increase after the meal, were all significantly less in the FD patient when compared with the healthy the subject (P < 0.05), indicating that the patient had an impaired gastric accommodation. Adapted from (Tack et al., 1998).
2.4.5 Dysfunction of the antrum
Antral dysfunction occurs in ~ 35 % of FD patients (Hausken and Berstad, 1992b), and
there is some, albeit limited, evidence that this may contribute to the generation of
symptoms in a subgroup of patients. Both fasting and postprandial antral volumes are
larger in many FD patients when compared with healthy subjects (Hausken and Berstad,
1992b) (Figure 2.3).
48

Functional dyspepsia Chapter 2
49
Figure 2.3 Fasting and postprandial antral volume in healthy subjects (n = 13) and patients with
FD (n = 13) quantified by two-dimensional ultrasound. A proportion (~ 50 %) of FD patients have greater fasting (* P < 0.05) and postprandial (** P < 0.01) antral sizes when compared with healthy subjects. Adapted from (Hausken and Berstad, 1992b).
Studies in healthy subjects suggest antral volume plays an important role in the
regulation of appetite and energy intake (Jones et al., 1997, Santangelo et al., 1998,
Hveem et al., 1996, Sturm et al., 2004). For example, the perception of postprandial
fullness is strongly related to antral area after ingestion of a glucose drink (Jones et al.,
1997) and a homogenised meal (Santangelo et al., 1998) in healthy subjects (see
Chapter 1.3.2.3 and Figure 1.6). In addition, subsequent food intake is related inversely
to antral size in healthy young and old subjects (Sturm et al., 2004) (see Chapter 1.3.2.3
and Figure 1.7). Abnormal intragastric filling may lead to increased distension of the
distal stomach. As discussed, it has been suggested that increased distal gastric
distension, secondary to changes in intragastric distribution, may contribute to
symptoms in patients with FD (Gilja et al., 1996, Troncon et al., 1994). In healthy
subjects, distal, but not proximal, gastric distension, apparently induce more dyspeptic
symptoms (Ladabaum et al., 1998) - activation of mechano-receptors of the distal
stomach by gastric distension induce more bloating and pain compared with the
distension of the proximal stomach (Ladabaum et al., 1998). It can, therefore, be
NOTE: This figure is included on page 49 of the print copy of the
thesis held in the University of Adelaide Library.

Functional dyspepsia Chapter 2
speculated that abnormal distribution of food to a more sensitive distal stomach plays a
role in symptom generation in at least some patients with FD. Taken together, these
studies suggest that an increase in antral size may contribute to the development of
gastrointestinal symptoms, “appetite-related” sensations and a decrease in energy
intake. However, the effects of antral volume/area on dyspeptic symptoms and energy
intake in patients with FD are unknown.
2.4.6 Integration of proximal and distal gastric function
As discussed above, studies evaluating the effects of proximal and distal stomach on
symptom generation in FD have focussed on their separate contribution(s). However,
their functions are known to be closely related, and, accordingly, assumptions as to the
effects that modulation of the function of one compartment may have on the other often
inappropriate (Troncon et al., 1994). The interrelationship between proximal and distal
gastric function, and its contribution to symptoms, has been evaluated in a study by
Caldarella and colleagues, with the hypothesis that a multiple sensory-reflex
dysfunction affects both regions of the stomach and disrupts their coordinated functions,
i.e. impaired gastric relaxation may increase antral distension, which is predominantly
responsible for the symptoms (Caldarella et al., 2003). In this study antral distension
was associated with impaired reflex relaxation of the fundus, and it was suggested that
impaired fundic accommodation is associated with the transfer of an excessive volume
of chyme into a hypersensitive antrum and, in this way, causes symptoms (Caldarella et
al., 2003).
50

Functional dyspepsia Chapter 2
2.4.7 Visceral hypersensitivity
A more recent area of interest in the investigation of gastrointestinal factors underlying
dyspeptic symptoms has been that of visceral hypersensitivity. As food is ingested,
mechanoreceptors located in the gastric wall are stimulated, the extent of which is
dependent on the amount eaten. When the meal empties to the small intestine, the
chemical/nutritional composition of the meal assumes primary importance in the
regulation of gastric emptying, stimulation of gastrointestinal hormones and suppression
of hunger and subsequent food intake, as a result of exposure of receptors located in the
small intestinal mucosa to nutrients. In patients with FD, these factors, i.e. luminal
physiological stimuli, both mechanical and chemical, may be perceived as unpleasant,
or painful. The effects of mechanical stimulation (distension) and small intestinal
chemosensitivity (nutrient infusions) have both been investigated and shown to cause
altered symptom perception in patients with FD as discussed below.
2.4.7.1 Hypersensitivity to mechanical stimulation
Approximately 35 - 48 % of patients with FD are hypersensitive to gastric distension.
A number of independent groups demonstrated that patients with FD are more sensitive
to mechanical stimulation (distension) of the stomach than healthy subjects (Bradette et
al., 1991, Mearin et al., 1991, Lemann et al., 1991) - during gastric balloon/barostat
distension, patients with FD report both first perception and discomfort at lower
distension volumes or pressures than healthy controls (Figure 2.4). Hypersensitivity to
mechanical distension is also evident in the distal stomach (Caldarella et al., 2003,
Ladabaum et al., 1998) (see Chapter 2.4.5).
51

Functional dyspepsia Chapter 2
Figure 2.4 Intensity of abdominal symptoms during stepwise distension of the proximal stomach in patients with FD (n = 10) and healthy subjects (n = 10). FD patients reported greater scores of discomfort at lower pressures than healthy controls. Adapted from (Mearin et al., 1991).
2.4.7.2 Hypersensitivity to nutrient stimulation
Reports of FD patients that their symptoms are induced, or exacerbated, by food, has
led to the hypothesis that a meal has the capacity to induce symptoms indirectly, by
inducing abnormal gastrointestinal motor function. There has, however, been little
interest in the possible, direct, role of gastrointestinal hypersensitivity to nutrients, as a
pathophysiological mechanism. Although the number of studies is small, it appears that
56 - 100 % of FD patients, particularly women (Houghton et al., 1993), are
hypersensitive to oral and/or small intestinal fat, as will be discussed in Chapter 2.5.3.
2.5 ROLE OF DIET
The majority of studies investigating the pathophysiology of FD have focussed on the
role of gastrointestinal motor/sensory dysfunction and have largely ignored the potential
effect of food intake and individual macronutrients on dyspeptic symptoms.
52

Functional dyspepsia Chapter 2
2.5.1 Food intolerance
Patients with FD frequently report that their symptoms are related to, or exacerbated by,
food, particularly “rich” and fatty foods (Taggart and Billington, 1966, Kaess et al.,
1988). There is also evidence that patients with FD identify the foods which they
believe aggravate their symptoms, and, therefore, avoid eating them (Kearney et al.,
1989). Attempts have also been made to identify specific foods which induce
symptoms: onions, peppers, citrus fruits, spices, as well as fatty foods have all been
reported to induce, or exacerbate, symptoms in FD (Kearney et al., 1989). In another
study FD patients reported to be intolerant of mayonnaise (80 % of patients), nuts (70 %
of patients), fish (60 % of patients) and chocolate (62 % of patients); while the aim of
this study was to assess overall dietary behaviour and not intolerance to specific
macronutrients, it is interesting to note that three of these four foods have a high fat
content (Kaess et al., 1988). The results of these studies are consistent with acute
studies which have identified a role for dietary fat in the induction of symptoms in FD
(Barbera et al., 1995b, Barbera et al., 1995a, Feinle et al., 1997). Studies assessing the
temporal relationship between the ingestion of specific foods and the occurrence and
severity of dyspeptic symptoms in patients with FD are, however, lacking.
2.5.2 Patterns of food ingestion
Very few studies have, to date, investigated whether eating patterns, such as meal
frequency, size and composition, and total energy intake, differ between FD patients
and healthy subjects (Cuperus et al., 1996, Mullan et al., 1994). Snacking was reported
to be greater (by about 9 %), and the number of larger meals lower (by about 24 %) in
FD patients compared with healthy subjects, although these differences were not
53

Functional dyspepsia Chapter 2
statistically significant (Mullan et al., 1994). This study also reported that only 55 % of
patients ate three meals per day compared with 80 % of healthy subjects. In contrast, a
study using food frequency diaries reported no difference in eating patterns, such as
breakfast intake, time spent fasting, meal size, and eating speed between FD patients
and healthy controls (Cuperus et al., 1996). The inconsistencies between these two
studies are likely to reflect discrepancies in the techniques used to assess food intake
and symptoms; and in these studies, the latter were not evaluated concurrently.
Therefore, the impact of eating patterns in patients with FD on, and its contribution to
the development of, dyspeptic symptoms remains uncertain. No studies have evaluated
the effect of dietary modification, presumably the reduction of dietary fat content on,
dyspeptic symptoms. Investigations into the effects of different diet regimes are needed
to establish their effects on the improvement of dyspeptic symptoms in FD.
2.5.3 Influence of individual macronutrients on symptoms
Considering the reports by FD patients that fatty foods exacerbate dyspeptic symptoms,
it is not surprising that a number of laboratory-based studies have investigated the
effects of individual macronutrients, especially fat, on gastric function, food intake, and
their potential role in symptom generation. The incorporation of fat into a soup meal
has been shown to induce more dyspeptic symptoms in FD patients compared to a bland
soup, when no fat was added (Houghton et al., 1993). Other studies have reported that
intraduodenal infusion of lipid, but not glucose, exacerbates dyspeptic symptoms in FD
patients, both before and during gastric distension, when compared with healthy
subjects (Barbera et al., 1995b, Barbera et al., 1995a, Feinle et al., 1997) (Figure 2.5).
54

Functional dyspepsia Chapter 2
The effect of protein on the generation of symptoms in FD patients, has not been
assessed.
Figure 2.5 The volume at which discomfort was perceived during gastric distension and intraduodenal infusions of saline (control), glucose or lipid in healthy subjects (n = 9) (top) and FD patients (n = 9) (bottom). In healthy subjects, discomfort was perceived at higher volumes when lipid was infused into the duodenum compared with saline (* vs. saline; P < 0.05). In FD patients, the gastric volumes at which discomfort occurred were lower during the saline and lipid infusions when compared with glucose († vs. glucose; P < 0.05). In addition, in FD patients discomfort was perceived at lower volumes during the saline and lipid infusions when compared with healthy subjects (# vs. healthy subjects: P < 0.001). Adapted from (Barbera et al., 1995b).
55
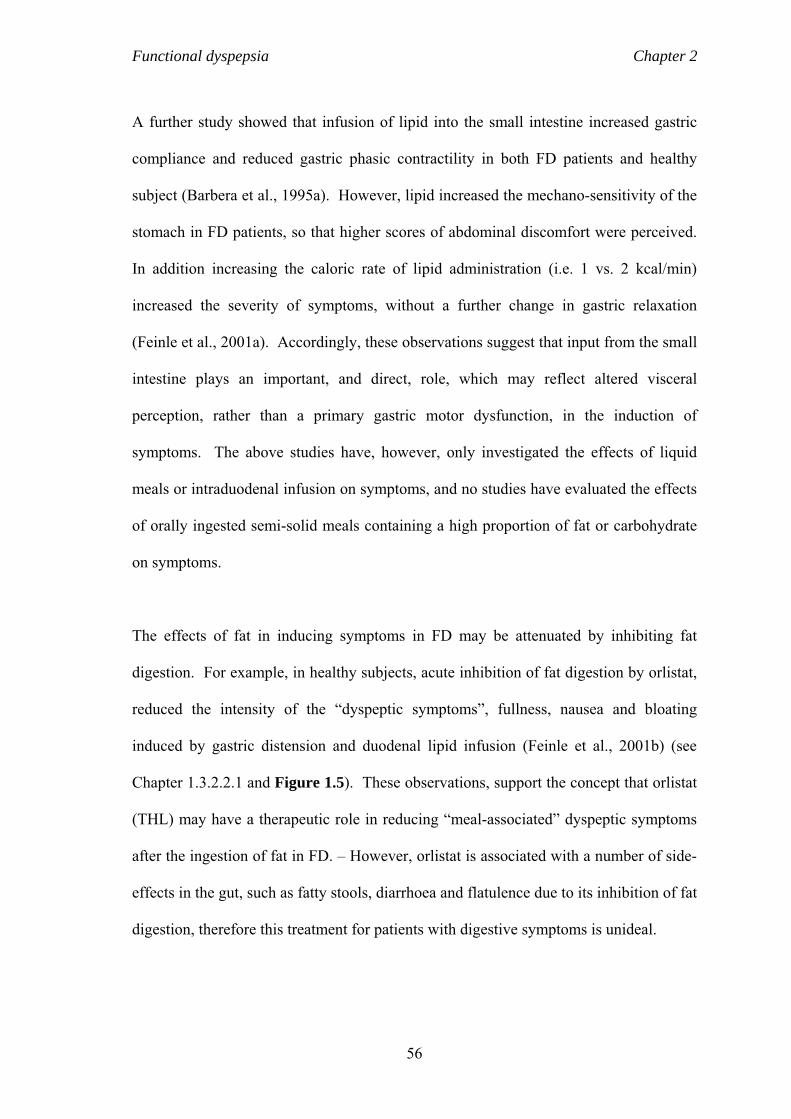
Functional dyspepsia Chapter 2
A further study showed that infusion of lipid into the small intestine increased gastric
compliance and reduced gastric phasic contractility in both FD patients and healthy
subject (Barbera et al., 1995a). However, lipid increased the mechano-sensitivity of the
stomach in FD patients, so that higher scores of abdominal discomfort were perceived.
In addition increasing the caloric rate of lipid administration (i.e. 1 vs. 2 kcal/min)
increased the severity of symptoms, without a further change in gastric relaxation
(Feinle et al., 2001a). Accordingly, these observations suggest that input from the small
intestine plays an important, and direct, role, which may reflect altered visceral
perception, rather than a primary gastric motor dysfunction, in the induction of
symptoms. The above studies have, however, only investigated the effects of liquid
meals or intraduodenal infusion on symptoms, and no studies have evaluated the effects
of orally ingested semi-solid meals containing a high proportion of fat or carbohydrate
on symptoms.
The effects of fat in inducing symptoms in FD may be attenuated by inhibiting fat
digestion. For example, in healthy subjects, acute inhibition of fat digestion by orlistat,
reduced the intensity of the “dyspeptic symptoms”, fullness, nausea and bloating
induced by gastric distension and duodenal lipid infusion (Feinle et al., 2001b) (see
Chapter 1.3.2.2.1 and Figure 1.5). These observations, support the concept that orlistat
(THL) may have a therapeutic role in reducing “meal-associated” dyspeptic symptoms
after the ingestion of fat in FD. – However, orlistat is associated with a number of side-
effects in the gut, such as fatty stools, diarrhoea and flatulence due to its inhibition of fat
digestion, therefore this treatment for patients with digestive symptoms is unideal.
56

Functional dyspepsia Chapter 2
2.6 GASTROINTESTINAL HORMONE RELEASE AND
SUPPRESSION
Gastrointestinal hormones may potentially mediate the effects of nutrients, particularly
fat, on dyspeptic symptoms. The limited number of studies which have investigated the
effects of gastrointestinal hormones on symptom induction FD, have indicated a role of
CCK. An initial study in healthy subjects reported that intravenous CCK-8 induced
nausea when given at high doses (Miaskiewicz et al., 1989). A further study reported
that CCK-8 infusion resulted in dyspeptic symptoms, including; abdominal bloating,
nausea and fullness, which were greater in patients with FD than healthy subjects (Chua
et al., 1994). However, it was not clarified how symptoms were assessed in this study,
and the high dose of CCK-8 would have resulted in supraphysiological plasma levels
(MacIntosh et al., 2001b). The most convincing evidence that there is a role for CCK in
the induction of dyspeptic symptoms, is derived from one study, which used the CCK1
receptor antagonist, dexloxiglumide (Feinle et al., 2001a). In this study symptoms of
fullness, bloating and nausea, induced by duodenal lipid infusion, were reduced by
concurrent administration of dexloxiglumide in patients with FD (Feinle et al., 2001a).
Since data from a small number of FD patients indicate that CCK secretion in response
to duodenal lipid does not differ between FD patients and healthy subjects (Feinle et al.,
2001a), these observations suggest that FD may be associated with an increased
sensitivity to CCK, however, this has not been evaluated.
The effects of GLP-1 and PYY on appetite suppression and gastric motor function are
similar to those of CCK, suggesting that these peptides may play a role in the induction
of dyspeptic symptoms. Intravenous infusion of increasing doses of synthetic human
GLP-1 and PYY dose-dependently reduce energy intake (Gutzwiller et al., 1999b,
57

Functional dyspepsia Chapter 2
Batterham et al., 2002), and induce nausea (Verdich et al., 2001a, Degen et al., 2001), in
healthy subjects. The effects of intravenous GLP-1 and PYY on dyspeptic symptoms
and food intake have not been evaluated in FD. The role of GLP-1 may also be
clarified by assessing the effects of its receptor antagonist, exendin(9-39) (Turton et al.,
1996). A receptor antagonist, for PYY, that is suitable for use in humans is not
currently available.
It has been reported that fasting ghrelin concentrations (active and total) are greater in
patients with FD when compared with healthy subjects (Lanzini et al., 2006, Nishizawa
et al., 2006), however, this result conflicts with an earlier study which showed no
difference in fasting ghrelin concentrations (Shinomiya et al., 2005). Unlike CCK,
GLP-1 and PYY, ghrelin is suppressed by enteral nutrients (Cummings et al., 2001).
The potential effect of nutrient-induced suppression of ghrelin on symptoms in patients
with FD has not yet been investigated.
2.7 COGNITIVE INFLUENCES
There is evidence from a small number of studies that cognitive factors contribute to the
development of symptoms after food ingestion in FD. Cognitive factors influence
eating behaviour in healthy subjects (Cecil et al., 1998). For example a nutrient-
containing soup induces greater perceptions of fullness when subjects are informed of
the nature of the soup when compared with the control condition, in which the subjects
are not explicitly given this information (Cecil et al., 1998). The route by which a meal
is introduced i.e. orally vs. intragastrically, also influences symptoms. For example,
when a high-fat soup was given orally, greater sensations of fullness resulted when
58

Functional dyspepsia Chapter 2
compared to the same high-fat meal given intragastrically. Intragastric administration
of the meal may have by-passed cognitive influences and oro-sensory mechanisms
(such as sight, smell and taste) which may modulate appetite sensations (Cecil et al.,
1999). It is, therefore, conceivable that symptoms in patients with FD in response to
certain foods may be influenced by previous negative learning experiences or
information they received. A recent study evaluated whether information given about
the fat content of an appetising yoghurt would influence symptom development in
patients with FD (Feinle-Bisset et al., 2003). When subjects were given the high-fat
yoghurts, scores of bloating and fullness increased regardless on the information they
received about the nature of the yoghurt. More interestingly, when the patients were
given the low-fat yoghurt and told it was high-fat, symptom scores were similar to those
of the high-fat yoghurt, indicating that foods low in fat may have the capacity to
exacerbate symptoms, when patients with FD believe that the food is high in fat (Feinle-
Bisset et al., 2003) (Figure 2.6).
It is also interesting that the placebo arms of clinical trials in FD patients show a
strikingly high response rate, of the order of 30 - 50 % (Talley and Phillips, 1988). The
mechanism of the apparent therapeutic benefit of placebo in patients with FD, i.e. if the
patient believes in something, this appears to affects symptoms, remains unclear.
Paying attention to the gut may also magnify perceptions of abdominal symptoms in
patients with FD (Accarino et al., 1997). For example, perception of gastric distension
is increased when the patients anticipate the distension. In contrast, distraction during
gut distension, by performing a mental task (Accarino et al., 1997) or by applying a
painless somatic stimulus (Coffin et al., 1994), decreases perception of gastric
distension. It has been speculated that the activation of the endogenous opioid-
59

Functional dyspepsia Chapter 2
mediated analgesia system, reduction of anxiety and modification in patient
expectations may be relevant (Mearin et al., 1999).
Figure 2.6 Effect of cognitive factors on fullness (top) and bloating (bottom) after high-fat or low-fat yoghurts in FD patients (n = 15). The high-fat and low-fat yoghurts were consumed by FD patients on four occasions. On one occasion the patient was given a high-fat yoghurt and informed that it was high-fat (HF - correct) and on the other occasion, a high-fat yoghurt and informed that it was low-fat (HF- wrong). The same applied to the low-fat yoghurts (LF - correct and LF - wrong). Scores for fullness and bloating increased significantly on both occasions when the high-fat yoghurt was given, regardless of the information patients received about the nature of the yoghurt, compared to the low-fat yoghurt (fullness; P < 0.05, bloating; P < 0.05). On the occasion when the low-fat yoghurt was given and patients were informed that it was high-fat (LF - wrong), scores of bloating and fullness were similar to those after the high-fat yoghurt and significantly greater than the low-fat yoghurt (fullness; P < 0.05, bloating; P = 0.05). Adapted from (Feinle-Bisset et al., 2003).
60

Functional dyspepsia Chapter 2
2.8 SUMMARY
This chapter has discussed the potential factors, including gastric emptying, intragastric
distribution, the proximal and distal stomach, visceral hypersensitivity, diet and food
intake, gastrointestinal hormones and cognitive factors, responsible for symptoms in
FD. Many studies evaluating dietary behaviour and food intake in FD are inconclusive,
or have failed to establish a meaningful association between the occurrence of
symptoms and disturbances in gastric motor function. However, a small number of
laboratory-based, acute studies and anecdotal reports from FD patients indicate that
dietary fat may be an important factor in the induction of dyspeptic symptoms, and this
factor has largely been ignored. A study evaluating the comparative effects of oral
carbohydrate and fat on gastrointestinal symptoms, gastrointestinal hormones and antral
area in FD is described in Chapter 8, with the hypothesis that high-fat, but not high-
carbohydrate, meals will induce dyspeptic symptoms and that the latter will be related
to changes in gut hormone responses and antral area. Chapter 9 reports a study which
evaluated the relationship between symptom occurrence and severity and dietary habits
using a 7-day diet/symptom diary, with the hypothesis that patients with FD would
consume smaller meals, experience more meal-associated symptoms, eat more
frequently and that symptoms would be related to the amount of ingested fat when
compared with healthy individuals.
61

Treatment options for FD Chapter 3
Chapter 3
TREATMENT OPTIONS FOR FUNCTIONAL DYSPEPSIA
3.1. INTRODUCTION
A number of different therapies have been, or are being, developed for the treatment of
FD. The rationale for the development of these therapies is based on normalising the
mechanisms that are disturbed and believed to contribute to the development of
symptoms. As outlined in Chapter 2, the pathophysiology of FD is poorly defined,
therefore, it is not surprising that the therapies used to treat the symptoms in FD have
produced poor, and variable, outcomes. Furthermore, because FD is a heterogenous
disease, as discussed in Chapter 2, a uniform response to drug treatment is unlikely to
be achieved. This chapter reviews present and emerging therapies for the treatment of
FD, including, prokinetic drugs that accelerate gastric emptying, drugs designed to
modulate proximal gastric relaxation and gastroduodenal sensory function, suppress
acid secretion, H pylori eradication, antidepressants, as well as non-pharmacological
treatments, including acupuncture and hypnotherapy, and herbal medications (Table
3.1).
62

Treatment options for FD Chapter 3
Table 3.1 Common therapies used for the treatment of symptoms in functional
dyspepsia.
PHARMACOLOGICAL
Prokinetics (3.2.1) Cisapride
Dopaminergic receptor blockers
(Metoclopramide, domperidone, itopride)
Motilin Agonists
(erythromycin, ABT-229)
Fundus relaxing agents (3.2.2) Sumatriptan
Antisecretory (3.2.3) Histamine type-2 receptor antagonists
(cimetidine, ranitidine)
Proton pump inhibitors
(omeprazole)
Antacids (3.2.3)
Helicobacter pylori eradication (3.2.4)
Antidepressants (3.2.5) Tricyclic antidepressants
Serotonin reuptake inhibitors
NON PHARMALOGICIAL
Acupuncture (3.3.1)
Hypnotherapy (3.3.2)
HERBAL PREPARATIONS
Mono-therapies (3.4.2) Banana
Artichoke leaf extract
Tumeric
Capsaicin
Combination preparations (3.4.3 and 3.3.4)
Peppermint/caraway oil
Lomatol®
Peppermint oil/ginger
Iberogast®
63

Treatment options for FD Chapter 3
3.2 COMMON PHARMACOTHERAPIES USED FOR THE
TREATMENT OF FUNCTIONAL DYSPEPSIA
3.2.1 Prokinetics
Prokinetic drugs accelerate gastric emptying by modulating gastrointestinal motility,
through acting on receptors in the gut that enhance the release of acetylcholine,
dopamine, motilin and/or serotonin. Given that a subgroup of patients with FD have
delayed gastric emptying the use of prokinetics has been suggested to be beneficial in
the improvement of symptoms. However, the mechanism(s) by which these drugs
reduce symptoms are unknown, particularly as the relationship between acceleration of
gastric emptying and symptom improvement is inconsistent.
3.2.1.1 Cisapride
Cisapride stimulates motility of the digestive tract by selectively enhancing
acetylcholine release in the myenteric plexus of the gut, probably via acting as a partial
serotonin agonist on the 5-HT4 receptor (McCallum et al., 1988). Cisapride has been
shown to increase lower oesophageal sphincter tone, increase oesophageal motility and
accelerate both gastric emptying and small intestinal transit (Ceccatelli et al., 1988,
Gilbert et al., 1987, Madsen, 1990, Smout et al., 1985). In addition to its effects on
gastric motility, cisapride has also been shown to improve dyspeptic symptoms. As
described in a recent meta-analysis, cisapride, when given at doses between 5 - 20 mg
t.i.d for 2 - 6 weeks, improved global symptom scores and scores for individual
symptoms, including, epigastric pain, early satiety, discomfort, abdominal distension
and nausea, when compared with placebo (Veldhuyzen van Zanten et al., 2001).
64

Treatment options for FD Chapter 3
However, as suggested by this meta-analysis, these studies need to be interpreted with
caution, due to suboptimal study design (i.e. inconsistent symptom assessment),
unclear/inconsistent inclusion criteria (e.g. inclusion of patients with gastroesophageal
reflux disease), short duration of follow-up, and only a modest improvement of
symptoms (Veldhuyzen van Zanten et al., 2001).
Only two studies have, hitherto, assessed whether the improvement of symptoms is
related to the acceleration of gastric emptying by cisapride (Kellow et al., 1995, Jian et
al., 1989). Kellow and colleagues evaluated solid and liquid gastric emptying before a 4
week treatment of cisapride, and, surprisingly, found that bloating improved in the
patients with normal, but not those with delayed, gastric emptying (Kellow et al., 1995),
and an equal reduction of total symptom scores for both cisapride and placebo.
However, this study did not measure gastric empting concomitantly during treatment
with cisapride and evaluation of symptoms, and, therefore, the relationship between
gastric emptying and symptoms generation was not assessed optimally. Jian and
colleagues demonstrated an improvement in solid and liquid gastric emptying, which
correlated with an improvement in symptoms, however, the total number of patients
with delayed gastric emptying was very small, and in this group, symptom reduction did
not reach statistical significance (Jian et al., 1989). Taken together, these studies
suggest that while delayed gastric emptying is evident in FD patients, it is probably not
the primary cause of their symptoms (see Chapter 2.4.2), as those with normal gastric
emptying benefit, at least as much, from the use of cisapride. A major disadvantage in
the use of cisapride is that it has interactions with other drugs and serious, albeit rare,
cardiac side effects with prolonged QT times and ventricular tachycardia. This has led
65

Treatment options for FD Chapter 3
to its withdrawal from the market in the USA, and markedly limited availability in other
countries. Hence, the use of cisapride cannot be recommended.
3.2.1.2 Dopaminergic receptor blockers
Receptors for the ligand, dopamine, are located both centrally, in the brain (Vallone et
al., 2000), and peripherally, predominantly in the gastric and duodenal mucosa
(Hernandez et al., 1987). Dopamine reduces gastric tone and intragastric pressure and
inhibition of antroduodenal contractions, partly through the activation of dopamine D2
receptors (Willems et al., 1985). Blockade of these results would, therefore, result in a
gastroprokinetic effect.
3.2.1.2.1 Metoclopramide
Metoclopramide acts both centrally and peripherally with different effects and
mechanisms. The central effect of metoclopramide result in a decrease in nausea via
blockade of the dopamine (D2), and 5-HT3, receptors, whereas the peripheral effects
enhance gastric motility by its agonistic action on the 5-HT4 receptor and increase in
acetylcholine release. Only a small number of studies have evaluated the efficacy of
metoclopramide and concluded that it improves symptoms in FD, however the
magnitude of improvement is modest (Johnson, 1971, Perkel et al., 1979,
Archimandritis et al., 1992, Fumagalli and Hammer, 1994). To date, no studies have
evaluated the relationships between the effects of metoclopramide on changes in gastric
motility/emptying and symptoms. Due to the ability of metoclopramide to cross the
blood brain barrier, there is a high prevalence of unwanted central nervous system
effects including drowsiness, anxiety and extrapyramidal symptoms (Talley, 1995).
66

Treatment options for FD Chapter 3
Hence, although efficacy has been demonstrated, its unfavourable side-effect profile
generally makes it unsuitable for long-term use.
3.2.1.2.2. Domperidone
Domperidone is a peripheral dopamine (D2) antagonist, and its actions include the
stimulation of oesophageal, gastric and small intestinal motility (Weihrauch et al.,
1979). Domperidone has also been shown to improve symptoms in FD patients when
given at doses between 10 mg t.i.d - 10 mg q.i.d for 2 - 4 weeks compared with placebo
(Veldhuyzen van Zanten et al., 2001). Only two studies have observed both, an
acceleration in gastric emptying, and improvement symptoms using domperidone.
Sarin and colleagues reported that the rate of gastric emptying of a potato curry meal
was faster after 2 weeks of 10 mg domperidone t.d.s, compared with placebo in 44 FD
patients. In this study there was also an improvement in symptoms of belching,
fullness, postprandial abdominal distension and heartburn after domperidone (Sarin et
al., 1986). In the second study, Duan and colleagues reported that domperidone, in a
dose of 20 mg t.i.d for 7 days, accelerated gastric emptying of a “Chinese” meal as
measured by real-time ultrasonography and improved symptoms of bloating and early
satiety in 29 FD patients with delayed gastric emptying (Duan et al., 1993). These two
studies, however, did not indicate whether there was relationship between the
acceleration in gastric emptying and symptom improvement by domperidone.
In female FD patients, domperidone increased the volumes at which symptoms were
perceived during distension of the proximal stomach, indicating that domperidone may
also act by altering visceral hypersensitivity (Bradette et al., 1991).
67

Treatment options for FD Chapter 3
Domperidone does not cross the blood brain barrier in significant quantities, hence
central side-effects are unusual, and is arguably a more appropriate prokinetic than
metoclopramide, however, it is not licensed in the USA. Reported adverse effects of
domperidone include galactorrhoea and breast tenderness from hyperprolactinaemia and
extra-pyramidal movement disorders (Tonini et al., 2004).
3.2.1.2.3 Itopride
Itopride, a dopamine (D2) antagonist with acetylcholinesterase inhibitory actions, has
been reported to stimulate gastric motility in dogs (Iwanaga et al., 1996), accelerate
gastric emptying in patients with chronic gastritis (Harasawa and Miwa, 1993), and
reduce total postprandial gastric volume, without affecting gastric emptying in healthy
humans (Choung et al., 2007). Itopride hydrochloride has also been reported to increase
plasma levels of somatostatin and motilin-immunoreactive substances and decrease
plasma levels of CCK-immunoreactive substances or adrenocorticotropic hormone-
reactive substances under stress in healthy humans (Katagiri et al., 2006). These actions
may prove beneficial in FD patients with impaired proximal gastric relaxation. The
effect of itopride on symptom improvement in FD has produced conflicting results
(Holtmann et al., 2006, Talley et al., 2007). Holtmann and colleagues evaluated the
effects of itopride at 50, 100 and 200 mg t.i.d for 8 weeks in FD patients and reported
that all doses improved symptom scores and quality of life when compared with placebo
(Holtmann et al., 2006). However, a more recent study indicated that itopride at 100 mg
t.i.d for 8 weeks, was not superior to placebo for the treatment of FD (Talley et al.,
2007). Differences in the two studies may include heterogeneity of FD, patient
selection, suboptimal evaluation of symptom intensities or lack of a true efficacy of the
68

Treatment options for FD Chapter 3
drug (Talley et al., 2007). The relationship between the acceleration in gastric motility
and associated reduction in symptoms has not been evaluated.
3.2.1.3 Motilin agonists
Motilin is a 22 amino acid peptide hormone expressed throughout the gastrointestinal
tract, which acts to increase smooth muscle contractions, therefore, enhancing gastric
emptying, increasing antral contractions and antroduodenal coordination, but decreasing
fundic volume and compliance (Feighner et al., 1999, Galligan and Vanner, 2005). The
antibiotic, erythromycin, is a motilin agonist, and has been shown to accelerate gastric
emptying in healthy subjects, as well as patients with diabetic or post-vagotomy
gastroparesis (Peeters, 1993, Kendall et al., 1997, DiBaise and Quigley, 1999). In
patients with FD and delayed gastric emptying, treatment with intravenous
erythromycin enhanced both liquid and solid emptying, when compared with
intravenous saline. In this study, treatment with erythromycin only improved meal-
induced bloating, but had no effect on postprandial fullness, epigastric pain, early
satiety, nausea, vomiting, belching or epigastric burning (Arts et al., 2005). Another
potent motilin agonist, ABT-229, failed to relieve symptoms in patients with or without
delayed gastric emptying, after 4 weeks of treatment at any of four doses (1.25, 2.5, 5
and 10 mg b.d.) compared with placebo (Talley et al., 2000). Results from these studies
suggest that the therapeutic effect of the currently available motilin receptor agonists in
the treatment of FD is modest, at best.
69

Treatment options for FD Chapter 3
3.2.2 Fundus-relaxing agents
While prokinetics accelerate gastric emptying, which physiologically is associated with
an increase in the tonus of the proximal stomach, fundus-relaxing agents decrease the
tone of the fundus, thus, causing proximal gastric relaxation. As discussed in Chapter
2.4.4, impaired proximal gastric relaxation/accommodation is evident in a substantial
subgroup of patients with FD (Gilja et al., 1996, Tack et al., 1998, Feinle et al., 2001a,
Kim et al., 2001), and, therefore, normalisation of this impairment, with the use of
fundus-relaxing agents, may prove beneficial in the relief of symptoms. Treatment with
sumatriptan, a 5-HT1 receptor agonist, has produced conflicting results. Sumatriptan,
relaxes the gastric fundus and reduces pain perception in response to gastric distension
in healthy volunteers (Tack et al., 2000). In patients with FD, restoration of proximal
gastric relaxation with sumatriptan was associated with the ability to consume a greater
volume of a nutrient-containing liquid (Tack et al., 1998). In contrast, a more recent
study failed to establish any relationship between the restoration of proximal gastric
relaxation with sumatriptan and the amount of water or nutrient drink ingested by FD
patients when compared with healthy subjects (Boeckxstaens et al., 2002). To add to
the difficulties in interpreting this information, sumatriptan is known to also increase
antral volume (Vingerhagen et al., 2000) and slow gastric emptying (Coulie et al., 1997,
Houghton et al., 1992) in healthy subjects; as given that increased antral volume and
delayed gastric empting occur frequently in patients with FD, improvement in
symptoms may potentially only occur in patients without these abnormalities.
Sumatriptan has also been reported to relieve symptoms of vomiting and nausea in
patients with cyclic vomiting (Benson et al., 1995). It is possible that sumatriptan may
70

Treatment options for FD Chapter 3
be effective in the treatment of these specific symptoms, if they are dominant in patients
with FD, however, this has not been evaluated.
3.2.3 Antisecretory drugs and antacids
Although at most, only a small number of patients with FD have mild to moderate
hypersensitivity to, or hypersecretion of, gastric acid (Collen and Loebenberg, 1989),
acid suppression treatment is frequently used in an attempt to relieve symptoms in FD.
There are two approaches for gastric acid suppression, antisecretory drugs (histamine
type 2 receptor antagonists and proton pump inhibitors) and antacids. A number of
studies have evaluated the effects of antisecretory drugs and antacids in the treatment of
FD, and the magnitude of symptom improvement has been comparable to that of
placebo.
3.2.3.1 Histamine type 2 receptor antagonists
Histamine type 2 receptor antagonists block the action of histamine on the parietal cells
in the stomach, thereby decreasing acid production. The use of histamine type 2
receptor antagonists for symptom relief in FD has produced conflicting results. Agents
such as cimetidine and ranitidine were commonly prescribed histamine type 2 receptor
antagonists in the 1980’s, and controlled studies have suggested that their therapeutic
effect is both positive (Talley et al., 1986b, Saunders et al., 1986) and negative (Nyren
et al., 1986, Olubuyide et al., 1986), possibly as a result of different subject selection
criteria. For example, those studies which included FD patients without acid-
predominant symptoms, failed to show any clear benefits. Furthermore, in a meta-
analysis, histamine type 2 receptor antagonists improved the symptom of epigastric
71

Treatment options for FD Chapter 3
pain, but not global symptoms, in FD (Redstone et al., 2001). Therefore, patients with
“ulcer-like” dyspepsia or reflux disease, in whom epigastric pain is the predominant
symptom, are more likely to respond to this treatment. Histamine type 2 receptor
antagonists are relatively inexpensive, well tolerated and have few adverse effects,
however, are not a cost-effective treatment because their overall effect on symptoms is
negligible.
3.2.3.2 Proton pump inhibitors
Proton pump inhibitors block the secretion of hydrogen ions in the gastric lumen and
inhibit acid secretion and are more potent inhibitors of acid secretion than histamine
type 2 receptor antagonists. Two large, randomised, double-blind, placebo-controlled
studies, known as the BOND and OPERA studies, assessed the effects of the proton
pump inhibitor, omeprazole (10 or 20 mg), for 4 weeks in 1262 FD patients (Talley et
al., 1998). Complete symptom relief was observed in 38 % of patients on 20 mg
omeprazole, compared with 36 % on 10 mg omeprazole and 28 % on placebo. It is
important, however, to note the high response of FD patients to placebo (see Chapter
2.7). The BOND and OPERA studies demonstrated that the response to proton pump
inhibitors was greater in patients with “ulcer-like” and “reflux-like” dyspepsia,
respectively - in 40 % and 54 % of the 20 mg omeprazole group (P = 0.05) and in 35 %
and 45 % in the 10 mg omeprazole group (P = 0.08 and P = 0.05, respectively),
compared with 27 % and 23 % in the placebo group. In contrast, in patients with
“dysmotility-like” dyspepsia, there was no significant benefit of omeprazole on
symptoms in either 10 mg (32 %) or 20 mg (37 %) over placebo (31 %) (Talley et al.,
72
Treatment options for FD Chapter 3
1998). This indicates that acid suppression therapy has no benefit in patients with
symptoms relating to “dysmotility-like” FD, only “ulcer-like” FD.
3.2.3.3 Antacids
Antacids are commonly used, inexpensive, over-the-counter medications, which patients
tend to purchase before they visit their doctor. To date, there are only four studies
which have assessed the efficacy of antacids (Gotthard et al., 1988, Nyren et al., 1986,
Norrelund et al., 1980, Weberg and Berstad, 1988), and all have failed to demonstrate a
significant improvement in dyspeptic symptoms compared with placebo. Therefore,
there is no evidence that antacids have any beneficial therapeutic effects in FD. This is
not surprising given their modest effect on gastric acidity when administered in
conventional doses.
3.2.4 Helicobacter pylori eradication
H pylori infection is the most important cause of peptic ulcers (NIH Consensus
Conference, 1994). The role of H pylori infection and eradication in FD, however,
remains controversial. Two recent trials have concluded that H pylori eradication
improves quality of life (Suzuki et al., 2005) and provides symptom relief
(Malfertheiner et al., 2003) in FD. A recent meta-analysis and Cochrane Database
systematic review showed that there is a small, but significant, benefit of H pylori
reduction in patients with FD (Moayyedi et al., 2005). Other studies, however, have
failed to demonstrate any benefit (Veldhuyzen van Zanten et al., 2003, Greenberg and
Cello, 1999). Another meta-analysis has indicated that differences in the definition of
FD among studies may have influenced study outcomes (Laine et al., 2001). When
73

Treatment options for FD Chapter 3
patients with heartburn as the predominant symptom were excluded, there was no
evidence of benefit with H pylori therapy (Laine et al., 2001). H pylori eradication
therapy has also been associated with the development of gastro-oesophageal reflux
(Labenz et al., 1997). Based on current evidence this therapy is not recommended for
FD.
3.2.5 Tricyclic antidepressants
The use of antidepressants for the treatment of symptoms in FD has been employed with
the rationale that the brain-gut connection is the mechanism that links the psycho-
emotional state with gastrointestinal dysfunction (Wood et al., 1999). For example,
stress is known to affect the gastrointestinal tract by stimulating the release of
neuropeptides and neurotransmitters, triggering various gastrointestinal responses
(Wood et al., 1999, McMillin et al., 1999). When tricyclic antidepressants are used to
treat FD patients, lower doses are necessary than when treating depression. In a small,
randomised trial, the tricyclic antidepressant, amitriptyline, was found to be more
effective in improving symptoms compared with placebo in a small number of FD
patients (n = 7) after 4 weeks of treatment (Mertz et al., 1998a). The clinical benefit of
amitriptyline has been found not to correlate with changes in perception of gastric
balloon distension, suggesting that the analgesic effect is likely to be mediated centrally,
perhaps through effects on the cortical processing of painful visceral sensations
(Fioramonti and Bueno, 2002, Gorelick et al., 1998). In contrast, another randomised
trial which evaluated the efficacy of the tricyclic antidepressant, desipramine,
demonstrated only a slight benefit of desipramine over placebo in the improvement of
symptoms (desipramine: 60 % vs. placebo: 47 %) (Drossman et al., 2003) - however 28
74

Treatment options for FD Chapter 3
% of patients did not complete the trial due to adverse side effects, or were non-
compliant. The most frequent adverse effects of desipramine relate to the
anticholinergic and antihistaminic effects of the drug, i.e. dry mouth, sleep disturbances,
dizziness and constipation. When the patients who did not complete the study, and
those who were non-compliant, were excluded from the analysis, the desipramine group
demonstrated a greater efficacy than placebo (desipramine: 73 % vs. placebo: 49 %).
This study confirms that not all patients are able to tolerate antidepressants, but indicate
that those who can are likely to experience symptomatic benefit (Drossman et al., 2003).
It is important to note that the relief of symptoms by antidepressants is apparently not
due to their antidepressant effects, given that appear to be just as effective in patients
without psychiatric disorders and psycho-morbidity.
Selective serotonin reuptake inhibitors are another form of antidepressant; they increase
the availability of 5-HT released from synapses in the central and enteric nervous
systems by blocking its transporting protein. To date, there have been no randomised,
placebo-controlled trials, which have evaluated the effect of selective serotonin reuptake
inhibitors in FD. A recent study (Tack et al., 2003) indicates that the selective serotonin
reuptake inhibitor, paroxetine, alters gastric accommodation in healthy subjects, and that
this drug warrants further investigation in patients with FD.
The use of antidepressants has an attached social stigma and, in some cases, a narrow
therapeutic window, hence, their use should be reserved for patients with persistent
severe symptoms who have failed to improve with other forms of therapy.
75

Treatment options for FD Chapter 3
3.3 NON-PHARMACOLOGICAL THERAPY AND ALTERNATIVE
MEDICINCES
Besides the well characterised pharmaceuticals which are commonly prescribed, a
number of non-pharmacological therapies, such as acupuncture and hypnotherapy, as
well as alternative medicines, such as herbal preparations, have been employed in the
treatment of FD.
3.3.1 Acupuncture
Acupuncture has been used to treat gastrointestinal diseases in China for thousands of
years. During the last decade, a number of studies have been performed to examine the
effects of acupuncture on gastric and myoelectrical activity in animals and humans
(Ouyang and Chen, 2004, Sato et al., 1993, Takahashi, 2006, Xu et al., 2004).
Acupuncture is known to have beneficial effects on nausea and vomiting (Gan, 2002,
Hu et al., 1992). There is little information about the effects of acupuncture in the
treatment of FD.
Two acupoints have been identified that influence gastric motility; PC6 is located in the
groove caudal to the flexor carpi radialis and cranial to the superficial digital flexor
muscle, and ST36 is located at the proximal one-fifth of the craniolateral surface of the
leg, distal to the head of the tibia in a depression between the muscle of the cranial tibia
and long digital extensor (Takahashi, 2006). The effects of acupuncture on the
gastrointestinal tract include inhibition of gastric motility when applied to the abdomen
and excitation of gastric motility when applied to the limbs, in rats (Sato et al., 1993).
Acupuncture has also been shown to stimulate vagal activity and reduce both
76

Treatment options for FD Chapter 3
postoperative nausea and vomiting (Gan, 2002) and motion sickness (Hu et al., 1992) in
healthy humans. In one study acupuncture effectively reduced symptoms, mainly
epigastric pain, in 95 % of FD patients, however, no details were provided in regard to
effects on other dyspeptic symptoms (Zhang et al., 1994). Two recent studies reported
that acupuncture in FD patients at the ST36 and PC6 points for 2 weeks accelerated
delayed gastric emptying (Xu et al., 2004, Xu et al., 2006), and relieved symptoms of
early satiety, distension, pain, belching and nausea, but only in those patients with
normal gastric emptying (Xu et al., 2006). Taken together, these studies are suggestive
of a beneficial effect of acupuncture on symptom relief in FD, and that this effect may
be unrelated to changes in gastric empting and/or motility.
3.3.2 Hypnotherapy
Hypnotherapy has proven to be an effective, long-term, treatment for symptoms of IBS
and also improves quality of life (Whorwell et al., 1984, Houghton et al., 1996). Only
one trial has, to date, assessed the efficacy of hypnotherapy, compared with supportive
therapy coupled with placebo medication, or with medical management in the short (16
weeks) and long-term (56 weeks) treatment of 126 FD patients (Calvert et al., 2002).
During the hypnotherapy sessions (12 x 30 min sessions), the FD patients were put
under hypnosis by a qualified therapist using eye fixation and closure, followed by
progressive muscular relaxations. Suggestions of disease improvement were made
using tactile and imagery techniques. The patient was asked to place a hand on their
abdomen and imagine a reduction in all symptoms. Suggestions of positive changes in
motor activity, sensitivity and secretion of acid and mucus were also introduced (Calvert
et al., 2002). Supportive therapy (12 x 30 min sessions) was performed with a clinical
77

Treatment options for FD Chapter 3
research assistant who provided general supportive advice and listened to patients’
concerns about their condition, with no psychological intervention. The medication
used for the supportive therapy or medical management groups was ranitidine (dosage
not indicated) and the patients were told that they were receiving either placebo, or an
active form of a drug that might help their condition. Short- and long-term symptom
scores improved more in the hypnotherapy group when compared with the supportive or
medical treatment. Hypnotherapy also benefited short and long-term quality of life
compared with the other two treatments (Calvert et al., 2002). During a 40 week
follow-up, approximately 82 % of patients in the supportive therapy group and 90 % in
the medical group resorted to some form of medication for relief of their symptoms
compared with 0 % in the hypnotherapy group. Additionally, the number of general
practitioner or physician consultations was lower after hypnotherapy compared with the
other two treatment groups. The long-term benefits and reduction in medication use and
consultation rate suggest major beneficial economic and psychological effects of
hypnotherapy as a treatment for FD and argue for its more widespread use.
3.4 HERBAL PREPARATIONS
Recently, there has been considerable interest in the use of herbal medications for the
treatment of self-managed, chronic gastrointestinal disorders. In accordance with the
European Scientific Co-operative on Phytotherapy, the definition of a herbal drug is
“any medicinal product containing as active ingredients only plants, parts of plants or
plant materials or combinations thereof, whether in the crude or processed state”. The
herbal preparations discussed in this chapter affect gastrointestinal function, either by
inducing gastric tonic or spasmolytic and anti-ulcerongenic actions, or by increasing
78

Treatment options for FD Chapter 3
acid neutralising capacity or flow of bile. Considering subgroups of FD patients have
gastric motor abnormalities and, thus, may benefit from these actions, these herbal
preparations are appealing as potential treatments. Herbal preparations have been
advocated for the relief of symptoms in patients with FD, either alone or in combination
with other herbal drugs (Table 3.1), however, their mechanism(s) of action are poorly
understood and the correlation between any improvement in symptoms and their effects
on gastrointestinal tract has not been investigated.
3.4.1 Clinical trials of mono-preparations
Several single herbal medicinal products have been recommended for the treatment of
symptoms in FD. Only a handful of these products, however, have undergone an
assessment of their safety and efficacy in randomised, placebo-controlled or equivalent
clinical trails.
3.4.1.1 Banana (Musa sapientum)
The use of banana for the treatment of various ailments is traditional in India. It has
been speculated that a flavonoid in unripe banana pulp has anti-ulcerogenic activity as
well as acid neutralising capacity (Lewis et al., 1999, Best et al., 1984). Only one
controlled trial has been conducted assessing the effects of banana powder (“Musapep”
(Reckitt and Coleman, no other information provided)), on gastrointestinal symptoms in
patients with FD (Arora and Sharma, 1990). 22 FD patients received 2 capsules t.i.d of
Musapep (unknown dose) for 8 weeks, and 24 control patients did not receive any
treatment. Gastrointestinal symptoms were partly relieved in 25 %, or completely
relieved in 50 %, of the treatment group and in only 20 % in the untreated group.
79

Treatment options for FD Chapter 3
However, this apparent improvement by Musapep may simply represent a placebo
effect, given that the untreated group received nothing. While this preparation is safe,
cheap and readily available (Arora and Sharma, 1990), further studies are required to
establish efficacy and, if this is demonstrated, define potential mechanisms of action.
3.4.1.2 Artichoke leaf (Cynara scolymus)
Artichoke leaf extracts (ALE) have been shown to have antioxidant and antispasmodic
effects on the gastrointestinal tract (Brown and Rice-Evans, 1998, Perez-Garcia et al.,
2000, Rechner et al., 2001). A study in 516 healthy self-reported FD patients
demonstrated a 40 % improvement in dyspeptic symptoms after 2 months treatment
with 320 or 640 mg of ALE (Marakis et al., 2002). In a recent placebo-controlled,
double-blind clinical trial, 247 FD patients were treated with either ALE preparation (3
x 230 mg plant extract t.d.s) or placebo for 6 weeks (Holtmann et al., 2003). The
magnitude of the improvement in symptoms, specifically fullness (sum of difference to
baseline: ALE, 6.6 � 5.6 vs. placebo, 4.5 � 5.8; P < 0.01) and early satiety (sum of
difference to baseline: ALE, 5.3 � 5.9 vs. placebo 3.1 � 5.8; P < 0.01) was greater
during treatment with ALE compared with placebo. There was an improvement of all
symptoms (fullness, flatulence, early satiety, nausea, vomiting, epigastric pain) in all
subjects with both treatments, although more FD patients responded to the treatment
than the placebo. It is important to note that there was great variability in the responses
to ALE which explain the large standard error (Holtmann et al., 2003). This extract was
also superior to placebo in improving disease-specific quality of life as assessed by the
Nepean Dyspeptic Index (see Chapter 4.5.6.1 and Appendix 4.7). The efficacy of ALE
treatment was rated as “satisfactory”, “good” or “very good” in 85 % of patients
80

Treatment options for FD Chapter 3
compared with 70 % in the placebo group. Similar to other studies investigating
treatments of functional gastrointestinal disorders, there was a remarkable improvement
in symptoms during the placebo treatment. The difference in the global response
between ALE and placebo, however, was 15 %, which is considered within the range of
a therapeutic gain (Dobrilla et al., 1989). The tolerability of both treatments was
regarded as good or very good (ALE vs. placebo, 94 % vs. 96 %), and this treatment
appears to be not associated with any serious adverse effects (Holtmann et al., 2003).
While the above information suggest that ALE is an effective therapy for patients with
FD, further studies are required to confirm this.
3.4.1.3 Tumeric (cucuma longa)
The active component of tumeric, curcumin, has antispasmodic effects on the
gastrointestinal tract and also stimulates bile flow (Thamlikitkul et al., 1989). In a
randomised, double-blind clinical trial in Thailand, 116 patients with so-called acid,
flatulent or atonic dyspepsia received 2 g/day capsules of tumeric or placebo for 7 days.
53 % of patients responded to the placebo, whereas 87 % responded to tumeric. The
efficacy of tumeric was said to be greater and clinically important when compared with
placebo (no other information provided). Nine patients in the tumeric group
experienced adverse events such as nausea, diarrhoea, headache, tiredness and
sleepiness and 10 patients in the placebo group reported nausea, diarrhoea, headache,
constipation, anorexia and tiredness. These adverse effects were described as mild
(Thamlikitkul et al., 1989). This study did not attempt to discriminate the effects
between the three different patient groups; accordingly therefore the effects of tumeric
in patients with FD alone, still has not been identified.
81

Treatment options for FD Chapter 3
3.4.1.4 Capsaicin
Capsaicin (8-methyl-N-vanillyl-6-nonenamide), the active component of red pepper
(capsicum) powder, reduces the activity of nociceptive C-type fibres, which transmit
pain sensations to the central nervous system (Lynn, 1990, Holzer, 1991, Mayer and
Gebhart, 1994). Therefore, capsaicin may be a possible target treatment for visceral
hypersensitivity. A study by Bortolotti and colleagues investigated whether ingestion of
2.5 g/day of red pepper powder, for 5 weeks, would lead to symptom improvement in
patients with FD (Bortolotti et al., 2002). After 3 weeks of treatment with capsaicin, the
overall symptom score and scores for epigastric pain, fullness and nausea were reduced
(60 %) when compared with placebo (30 %) (Bortolotti et al., 2002). While the
therapeutic actions of capsaicin are unclear, it has been suggested that there is a
“desensitisation” effect, which renders the nociceptive C-type fibres, located in the
gastrointestinal tract, less responsive to stimuli that give rise to dyspeptic symptoms
(Bortolotti et al., 2002). Another study indicated that capsaicin alters gastrointestinal
motility, by decreasing gastric tone, inhibiting phasic contractility and increasing the
compliance of the proximal stomach (Lee et al., 2004), in healthy humans. No
significant adverse effects have been observed with the use of capsaicin. Larger scale
studies focussing on the long term effects of capsaicin on the gastrointestinal tract,
including symptoms, have not been conducted.
3.4.2 Clinical trials of combination preparations
The several herbal medicinal products, which are suggested to have beneficial effects on
symptoms, have been evaluated in combination as two or more herbal extracts. It is
unclear which of the herbs is effective, or if they all play a role in alleviating symptoms,
82

Treatment options for FD Chapter 3
however, combination preparations are popular in herbal medicine as traditional
herbalists believe that synergistic interactions can occur between the different
components, thereby eliciting a larger effect than would result from individual
constituents alone (Thompson Coon and Ernst, 2002).
3.4.2.1 Peppermint oil and caraway oil
When given alone, peppermint oil has calcium antagonistic properties, therefore, its
activity is primarily spasmolytic (Hills and Aaronson, 1991), whereas caraway oil
increases muscular tone (May et al., 2000). Considering subgroups of FD patients have
gastric motor abnormalities which may benefit from the spasmolytic and tonic actions
of these separate oils, a fixed combination of these two herbs is appealing as potential
treatments. To date, there have been four randomised clinical trails assessing the effects
of peppermint oil and caraway oil on symptoms in FD.
The first study assessed the effect of a fixed combination of peppermint and caraway
oils (Enteroplant, Dr Willmar Schwabe GmbH, Karlsruhe, Germany; 270 mg/day
peppermint oil and 150 mg/day caraway oil), in 45 FD patients for 4 weeks, and
reported a significant improvement in epigastric pain scores when compared with
placebo (May et al., 1996). A second, similarly designed, study was performed by the
same group using a lower dosage (180 mg/day peppermint oil and 100 mg/day caraway
oil), in 96 FD for 4 weeks (May et al., 2000). There was a statistically significant
reduction in pain intensity (40 % vs. 22 %) and sensations of pressure, heaviness and
fullness (44 % vs. 22 %) compared with placebo, with an overall rating of “much
improved” during the herbal combination and “minimally improved” for the placebo
83

Treatment options for FD Chapter 3
group. Only five subjects reported adverse events during the peppermint and caraway
oil treatment. These adverse events were similar complaints experienced by the patient
before inclusion into the trial, and therefore were unrelated to the study (May et al.,
2000). A further study compared the effects of the fixed combination of peppermint and
caraway oil (180 mg/day peppermint oil and 100 mg/day caraway oil) and the prokinetic
drug, cisapride (30 mg/day), for 4 weeks, in 120 FD patients (Madisch et al., 1999).
Both treatments showed similar improvements in the occurrence and severity of
epigastric pain and discomfort. Taken together, these four studies indicate that there is
good tolerability and lack of adverse effects. However, a shortcoming is that
predominantly only “pain”, and no other dyspeptic symptoms, appears to be relieved.
3.4.2.2 Lomatol®
Lomatol® (Lomapharm, Emmerthal, Germany) contains a combination of extracts of
peppermint leaves, caraway fruit, fennel fruit and wormwood herbs. In a controlled,
randomised, double-blind study, 60 patients complaining of at least one of the following
symptoms; upper abdominal pain, gastrospasms, belching, nausea, retching, heartburn
or loss of appetite, were treated with Lomatol® (25 drops in water t.i.d) for 14 days and
the results compared to treatment with metoclopramide (dose not given). Results
indicated that Lomatol® was superior to metoclopramide in terms of efficacy and
tolerability, and no adverse events were reported (Westphal et al., 1996). This study,
however did not evaluate the effects of Lomatol® in patients characterised with FD
only, therefore, future studies are required to establish the effects of Lomatol® in this
group.
84

Treatment options for FD Chapter 3
3.4.2.3 Peppermint oil and ginger
In the only randomised, double-blind, placebo-controlled study using peppermint oil
and ginger extract (180 mg and 25 mg/day, respectively), as described in a review of
herbal medicinal products for non-ulcer dyspepsia (Thompson Coon and Ernst, 2002),
there was a reported improvement in gastrointestinal symptom scores (not identified) in
74 % of FD patient compared with 30 % in the placebo group. Further studies are
required before recommendation can be made regarding the use of this preparation.
3.4.3 Iberogast®
Iberogast® (Steigerwald Arzneimittelwerk GmbH, Darmstadt, Germany), is a herbal
preparation, which has been used in Europe for the treatment of gastrointestinal diseases
for more than 40 years and was launched on the Australian market in 2004. Iberogast®
is a complex herbal preparation, containing nine constituents, including fresh plant
extract of Iberis amara (bitter candy tuft) and the extracts of eight other dried herbal
drugs, including; Angelicae radix (angelica roots), Matricariae flos (camomile flowers),
Carvi fructus (caraway fruit), Cardui mariae fructus (St. Mary’s thistle fruit), Melissae
folium (balm leaves), Menthae peperitae folium (peppermint leaves), Chelidonii herba
(greater celandine), Liquiritiae radix (liquorice roots) in 30.9 % ethanol (see Table 4.3).
There is evidence that all nine constituents have pharmacological effects on the
gastrointestinal tract (Saller et al., 2002). Arguably the main active ingredient, the
extract of Iberis amara, has a predominantly tonic effect on the gastrointestinal tract,
whereas the properties of the other components have been described as being
spasmolytic (Ammon, 1986). During the last 15 years, the effects and efficacy of
Iberogast® have been evaluated. There has been a number of double-blind,
85

Treatment options for FD Chapter 3
randomised, clinical trials comparing the effects of Iberogast® with placebo and other
pharmacological agents commonly used to treat symptoms in FD. The efficacy of
Iberogast® and other treatments has been determined by the improvement of individual
symptoms or the gastrointestinal symptom (GIS) sum score. The latter contains ten
gastrointestinal symptoms typical of FD, including nausea, retching, vomiting, early
sensation of satiety, lack of appetite, heartburn, retrosternal paresthesia, abdominal
spasms, epigastric pain and flatulence. Patients rated the intensity of these symptoms
on validated four- or five-point Likert scales, ranging from 0 (none) to 3 (pronounced)
or 4 (very pronounced). The use of Iberogast® was not associated with any adverse
effects or interactions with other drugs, so that tolerability was excellent. Only a
handful of studies have investigated the mechanism(s) of action of Iberogast® on the
gastrointestinal tract, and these have been performed mainly in animals, as will be
discussed in Chapter 3.4.4.3.
3.4.3.1 Comparative effects of Iberogast® and placebo in functional dyspepsia
Studies which have compared the effects of Iberogast® with placebo have used the
recommended dose of 20 drops (1.1 ml), three times a day, and indicate that Iberogast®
is superior to placebo in improving dyspeptic symptoms (Nicolay, 1984, Buchert, 1994,
Madisch et al., 2001, Rösch et al., 2002). For example, a study by Buchert (1994)
investigated, in a placebo-controlled, double-blind, parallel, two-arm study, the efficacy
and tolerability of Iberogast® in 243 FD patients (Buchert, 1994) who were treated for 4
weeks with the recommended dose. Efficacy was evaluated on the basis of a GIS score,
which was measured before, and 4 weeks after, initial drug treatment. GIS sum scores
decreased significantly more in the Iberogast®, compared with the placebo, group
86

Treatment options for FD Chapter 3
(Buchert, 1994) (Figure 3.1). At the final visit, 52 out of 83 patients treated with
Iberogast®, compared with 14 out of 80 patients treated with placebo, reported their
most bothersome symptom as “mild” or “absent”. The analysis of individual symptoms
revealed that Iberogast® reduced the score for all symptoms, expect abdominal cramps,
when compared with placebo. Tolerability was rated as “very good” or “good” by 89 %
of patients in the Iberogast® group, but only by 60 % of patients in the placebo group.
A more recent study compared the effects of Iberogast® and STW5-S (an experimental
preparation without bitter candy tuft), with placebo for 4 weeks at the recommended
dose, and demonstrated that both herbal preparations produced a statistically significant
improvement in GIS sum score in 60 FD patients after 2 and 4 weeks of treatment (P <
0.001). There was no overall difference between the two herbal preparations, however,
there was a more rapid improvement in symptoms in the Iberogast® group, which
suggests that the inclusion of bitter candy-tuft (Iberis amara) in the preparation may be
important (Madisch et al., 2001).
87

Treatment options for FD Chapter 3
88
Figure 3.1 Gastrointestinal symptom scores measured at baseline and 4 weeks during treatment
with placebo or 1.1 ml Iberogast®, taken three times per day, in 243 FD patients Iberogast® improved symptoms after 4 weeks of treatment compared with baseline scores (* P < 0.0001). The magnitude of improvement during placebo was less marked (Buchert, 1994).
3.4.3.2 Comparative effects of Iberogast® and prokinetic agents in functional
dyspepsia
Studies have also been performed to compare the effects of Iberogast® with prokinetic
agents commonly used to treat symptoms of FD, including metoclopramide (Nicolay,
1984) and cisapride (Rösch et al., 2002). In an early, single-blind clinical trial, 77 FD
patients were treated with 20 drops of Iberogast®, three times a day for 2 weeks, and
efficacy and tolerability were compared with metoclopramide (10 mg t.i.d) (Nicolay,
1984). In both groups, there were comparable improvements in all symptoms (Figure
3.2), with approximately 50 % of patients reporting resolution of symptoms.
NOTE: This figure is included on page 88 of the print copy of the
thesis held in the University of Adelaide Library.

Treatment options for FD Chapter 3
89
Figure 3.2 Fullness scores at baseline and at 3, 7 and 14 days of treatment with 10 mg
metoclopramide or 1.1 ml of Iberogast®, taken three times per day in 77 FD patients. Fullness scores decreased similarly in both groups (Nicolay, 1984).
However, the tolerability of Iberogast® was predictably superior to that of
metoclopramide. A more recent study compared the effects of Iberogast® with
cisapride in 124 FD patients (Rösch et al., 2002). After 4 weeks, gastrointestinal
symptoms decreased similarly in both treatment groups (Figure 3.3). The tolerability of
the two treatments was also similar (Rösch et al., 2002), however, as discussed (Chapter
3.2.1.1), cisapride is not generally available anymore. An advantage of Iberogast® is
that it targets only the gastrointestinal tract and the enteric nervous system, but not the
central nervous system, like cisapride and metoclopramide, and, therefore, is essentially
free of side-effects. The results from these studies indicate that Iberogast® is an
effective, well tolerated and safe treatment option in FD.
NOTE: This figure is included on page 89 of the print copy of the
thesis held in the University of Adelaide Library.

Treatment options for FD Chapter 3
90
Figure 3.3 Gastrointestinal symptom scores measured at baseline and 4 weeks during treatment
with 10 mg cisapride or 1.1 ml Iberogast®, taken three times per day, in 183 FD patients. Symptom scores decreased similarly with both treatments compared with baseline, with no difference between them (* P < 0.0001) (Rösch et al., 2002).
3.4.3.3 Effects of Iberogast® on gastrointestinal motility and sensitivity
While the above studies have demonstrated improvement in symptoms, they have not
investigated potential mechanism(s) of action of Iberogast®. A limited number of
recent studies have evaluated the mechanisms underlying the effects of Iberogast® in
animal models and more recently in human gastrointestinal tissue. In these studies,
animal (and human) gastric tissues were treated with Iberogast® and its effects on
relaxation, contractile force, resting membrane potential, slow wave frequency and
small intestinal sensitivity were determined. The effect of Iberogast® on gastric
emptying, in vivo, has not yet been investigated.
3.4.3.3.1
One of the first studies to evaluate the effects of Iberogast® on gastric motility
demonstrated a dual action of this herbal preparation, which was region-specific
Proximal and distal gastric motility
NOTE: This figure is included on page 90 of the print copy of the
thesis held in the University of Adelaide Library.

Treatment options for FD Chapter 3
(Hohenester et al., 2004). Isometric muscle tension activity from guinea pig gastric
fundus, corpus and antrum was measured in response to several concentrations (32, 64,
128, 256 and 512 �g/ml) of Iberogast®. Iberogast® evoked a sustained, and reversible,
relaxation of both circular and longitudinal gastric fundus and corpus muscles, in a
concentration-dependent fashion, but had no effect on antral tone (Figure 3.4).
Figure 3.4 Effect of Iberogast® at 64, 128, 256 and 512 �g/ml on the muscle tension (tone) in muscle strips from guinea pig fundus, corpus and antrum. All concentrations of Iberogast® reduced muscle tension in the fundus and corpus, but not the antrum, when compared with basal muscle tone (* P < 0.05) (Hohenester et al., 2004).
In contrast, both the circular and longitudinal muscles from the antrum responded with
an immediate, and long-lasting, increase in contractile force, also in a concentration-
dependent fashion (Hohenester et al., 2004) (Figure 3.5). A preliminary study by the
same group suggested that these observations are also applicable to human gastric
motility. - Muscle preparations from human proximal stomach revealed that Iberogast®
has a strong relaxing effect, corresponding to a reduction in tone (Schemann et al.,
2006). These effects of Iberogast® on gastric motility were further investigated by
determining the pathway(s) involved in its action. - Guinea pig gastric tissue was
incubated with four inhibitors of enteric neural pathways. The effects of Iberogast® on
91

Treatment options for FD Chapter 3
gastric motility were resistant to blockade of nerve conduction by tetrodotoxin,
blockade of synaptic transmission by the N-type Cav-channel blocker �-conotoxin
GVIA, defunctionalisation of capsaicin-sensitive primary afferents by capsaicin and
blockade of nitric oxide synthesis by the nitric oxide synthase inhibitor N-nitro-L-
arginine methyl ester. Moreover, the Iberogast®-induced increase in the contractile
effect of the antrum could not be blocked by the muscarinergic antagonist, atropine. In
addition, the relaxatory effect could not be blocked by the nitric oxide synthase
inhibitor, N-nitro-L-arginine methyl ester. Taken together, these observations indicate
that the action(s) of Iberogast® on proximal gastric relaxation and antral contractility
are not nerve-mediated or involve the nitric oxide pathway, but reflect a direct effect on
smooth muscle cells (Hohenester et al., 2004).
Figure 3.5 Effect of Iberogast® at 32, 64, 128, 256 and 512 �g/ml on the contraction amplitudes in muscle strips from guinea pig antrum. All concentrations of Iberogast® increased the amplitude of contraction of the antrum when compared with basal antral tone (* P < 0.05) (Hohenester et al., 2004).
A recent study reported the effects of the individual components of Iberogast® on
proximal and distal gastric motility in guinea pig gastric tissue (Schemann et al., 2006).
92

Treatment options for FD Chapter 3
The extracts of angelica root, chamomile flower and liquorice root induced a
concentration-dependent relaxation of both the circular and longitudinal muscle strips
from gastric fundus and corpus and a decrease in muscle tone, which was similar to that
of Iberogast®. On the other hand, extracts of greater celandine herb, Melissa leaf,
caraway fruit and bitter candy tuft failed to induce relaxation, but evoked contractions,
in the gastric fundus. No consistent effects were observed for peppermint leaf and milk
thistle fruit extracts. All extracts, except peppermint leaf and milk thistle fruit extracts,
exerted a contractile response in the antrum, mimicking the excitatory effects of
Iberogast® on antral motility. These observations have, therefore, identified plant
extracts within the Iberogast® preparation with purely contractile effects and extracts
with both contractile and relaxatory effects, but none with a sole relaxatory effect. The
observations that some individual extracts have discrepant actions on the proximal, and
the distal, stomach, may not indicate that individual extracts have different region-
specific effects in the proximal and distal stomach as first suggested (Hohenester et al.,
2004), but reflect the differences in smooth muscle physiology, specifically in the
calcium-handling properties of gastric fundus vs. antral smooth muscle (Kong et al.,
1986). This may indicate that the site of action of Iberogast® is exerted on ion channels
and/or signal transduction pathways that are expressed in the proximal and distal
stomach (Schemann et al., 2006). The effects of Iberogast® on gastric and pyloric
motility and gastric emptying in humans have not been evaluated.
3.4.3.3.2 Small intestinal motility
Two recent studies have evaluated the effects of Iberogast® and its individual
components on small intestinal motility; one on the spasmolytic and tonic effects in
93

Treatment options for FD Chapter 3
intestinal smooth muscle of the guinea pig (Ammon et al., 2006) and the other on
intracellular recordings of smooth muscle cells of the circular muscle layer of mouse
small intestine, specifically the resting membrane potential (RMP) and slow wave
frequency and amplitude, which are the electrophysiological basis of smooth muscle
contractility and motility of the intestine (Storr et al., 2004).
Similar to the effect in the proximal stomach, Iberogast® and the individual
components, chamomile flower and liquorice root, but also peppermint leaf, were able
to decrease acetylcholine- and histamine-induced contractions of guinea pig ileum, in a
dose-dependant fashion (Ammon et al., 2006). These spasmolytic effects were also
observed in the duodenum, jejunum and colon. Extracts from bitter candy tuft did not
have a spasmolytic effect. However, both Iberogast® and bitter candy tuft increased
basal resting tone and contractions of the ileum. These observations reinforce the “dual-
action” effect of Iberogast® (Ammon et al., 2006).
Iberogast® dose-dependently depolarises the RMP of smooth muscle cells, which
influences smooth muscle excitability. The mode of action of Iberogast® on changes in
smooth muscle RMP and slow wave rhythmicity is proposed to be by way of blockade
of large conductance calcium channels (Storr et al., 2004). When the individual
components of Iberogast® were investigated, angelica root, chamomile flowers and
greater celandine caused the depolarisation. There was also a dose-dependent reduction
in the amplitude and frequency of slow waves after treatment with Iberogast®. As for
the RMP, the different individual herbal extracts had different effects on slow waves;
angelica root and chamomile flowers blocked slow wave activity, whereas bitter candy
tuft increased the frequency and amplitude. Greater celandine reduced the frequency
94

Treatment options for FD Chapter 3
and amplitude, peppermint leaves only reduced the frequency, and liquorice root and
milk thistle and balm leaves had no effect. No study has evaluated the effects of
Iberogast® on motility in the human small intestine.
3.4.3.3.3 Small intestinal sensitivity
Iberogast® not only exhibits effects on gastrointestinal motility, it also modulates
neuronal activity. Iberogast® decreases afferent nerve discharge at low and high
pressure distensions (10 - 60 cm H2O) compared with control (30.8 % ethanol) in male
Wistar rats (Figure 3.6). Additionally, Iberogast® attenuated a dose-dependent
increase in afferent discharge by pharmacological agents 5-HT and bradykinin. These
observations suggest that Iberogast® decreases the sensitivity of vagal (5-HT sensitive)
and spinal (bradykinin) afferents to low and high pressure distension which reflect a
“desensitising” effect of Iberogast® on the mesenteric intestinal afferent nerve fibres to
chemical (5-HT and bradykinin) and mechanical stimuli (Liu et al., 2004). It is not
possible to determine which components of Iberogast® were responsible for the
decrease in intestinal afferent sensitivity, therefore, future studies are required to
identify these extracts and their particular effects. Furthermore, it would be of interest
to investigate the effects of Iberogast® on the sensitivity to gastric distension and
motility in patients with FD, specifically in response to a meal.
95

Treatment options for FD Chapter 3
Figure 3.6 Afferent nerve responses of the jejunum of Wistar rats, at different levels of
intraluminal pressure following Iberogast® or vehicle (30.8 % ethanol) pre-treatment. Afferent discharge was reduced at all distension pressures following Iberogast® pre-treatment when compared with vehicle (* P < 0.05) (Liu et al., 2004).
3.5 SUMMARY
Treatments used for symptom relief in patients with FD have in general produced
modest and inconsistent effects, and in regards to pharmacotherapies, a number of
adverse events. The use of herbal medications has received substantial attention during
last decade and while it appears clear that a number of these medications improve
symptoms in FD, with few or no adverse effects, their mechanism(s) of action are
poorly defined. One of the latest herbal preparations on the market in Australia,
Iberogast®, improves symptoms in FD and is well tolerated. In animal studies,
treatment with Iberogast®; increases proximal gastric relaxation and contractions of the
antrum, while decreasing vagal sensitivity, which are all logical targets for the
management of FD. The effects of Iberogast® in the healthy human gastrointestinal
tract, specifically proximal gastric volume, contractions in the antrum, pylorus and
96

Treatment options for FD Chapter 3
duodenum and gastric emptying and intragastric distribution, have been investigated
and these results are reported in Chapter 10.
97

Common methodologies Chapter 4
Chapter 4
COMMON METHODOLOGIES
4.1 INTRODUCTION
The methods presented in this chapter are used in the studies described in Chapters 5 -
10. All the techniques have been validated and are well established for the assessment
of gastric emptying, gastroduodenal motility, gastrointestinal hormone
release/suppression, appetite and energy intake.
4.2 SUBJECTS
4.2.1 Subject recruitment
4.2.1.1 Healthy subjects
Healthy male (Chapters 5 - 7 and 9 - 10) and female (Chapters 8 and 9) subjects were
recruited through advertisements in the local newspapers, flyers throughout the
Universities of Adelaide and South Australia, Flinders University, the Royal Adelaide
Hospital and from a list of potential volunteers available within our Department.
98

Common methodologies Chapter 4
4.2.1.2 Functional dyspepsia patients
Patients with FD (Chapters 8 and 9) were recruited from the endoscopy list and
outpatients of the Department of Gastroenterology, Hepatology and General Medicine
at the Royal Adelaide Hospital. Patients were also recruited through the combined use
of advertisements placed in the local newspapers, flyers located within the Royal
Adelaide Hospital and National and Chem-Mart Pharmacies. Gastroenterologists at the
Royal Adelaide Hospital, Queen Elizabeth Hospital and Repatriation Hospital were
informed of the studies and asked to refer suitable patients. FD patients were recruited
based on the criteria set down by the Rome II working party (see Chapter 2.2), and had
to have experienced symptoms for at least 3 months prior to entry into the study.
Additionally, patients were included if the severity of their symptoms was at least
moderate in nature. This was assessed by asking the patients to rate the severity of the
symptoms, upper abdominal pain, bloating, the inability to finish a normal-sized meal
and nausea, on a scale of 0 - 3, where 0 represented “symptom not experienced”, 1
“slight symptoms, but can be ignored”, 2 “moderate symptoms, but not impairing daily
activities” or 3 “severe symptoms, impairing daily activities”. If the total score was > 3
or the score for one symptom was > 2, the patient was invited to participate in the
studies described in Chapters 8 and 9.
Signed informed consent was obtained from each subject prior to participation in a
study. All subjects understood that their participation was voluntary and that they were
free to withdraw from the study at any time and that their medical and nursing care
would not be affected. All subjects were offered an honorarium for their participation.
99

Common methodologies Chapter 4
4.2.2 Common exclusion criteria
Prior to enrolment, each healthy subject and FD patient underwent a screening visit in
person or was questioned over the telephone to exclude individuals who; had a history
of gastrointestinal surgery, took medication which affected gastrointestinal motor
function, body weight or appetite, had any significant illnesses (i.e. diabetes,
cardiovascular or respiratory complications etc), evidence of drug abuse, consumption
of greater than two standard (20 g alcohol) alcoholic drinks per day, smoked more than
ten cigarettes per day, or scored greater than twelve for the eating restraint component
(Factor I) of the “Three-Factor Eating Questionnaire”, for healthy subjects only in
Chapters 5 - 7 (Chapter 4.5.5.4).
4.2.3 Additional exclusion criteria for functional dyspepsia patients
Additional exclusion criteria in patients with FD were;
�� an organic cause of dyspepsia (e.g. gallstones, peptic ulcers) as assessed by
endoscopy and/or ultrasound within 24 months prior to study entry
�� heartburn or lower bowel symptoms as the predominant symptom
�� positive H pylori status as assessed by biopsy with urease test, histological
examination and microbial culture.
�� positive clinically significant results on laboratory test (biochemistry [urea,
electrolytes, calcium, glucose, liver function tests] and haematology [complete
blood examination, erythrocyte sedimentation rate])
�� lactose intolerance as assessed by breath test
100

Common methodologies Chapter 4
4.3 ETHICS COMMITTEE APPROVAL
All protocols were approved by the Royal Adelaide Hospital Research Ethics
Committee, and, where necessary, the Royal Adelaide Hospital Investigational Drug
Sub-Committee (Chapter 10).
4.4 STUDY TREATMENTS
Study treatments were given via two different routes, orally or intraduodenally, to
assess the effects on gastrointestinal motility, hormone release, appetite and energy
intake. Orally administered treatments, so-called preloads, assess the effect of nutrients
incorporated into a meal, therefore factors such as taste, gastric filling and emptying
influence the results. Preloads were consumed within 10 min. Treatments given
directly into the small intestine via an intraduodenal catheter, are able to assess the
direct effect of nutrients without the influence of gastric distension and gastric
emptying. Intraduodenal treatments were infused over a longer period of time (i.e. 50 -
150 min) at constant rates.
4.4.1 Yoghurt preloads
The aim of a well-designed preload is to mask all sensory aspects by ensuring that the
sight, smell, taste and texture of the foods consumed are kept constant (Rolls et al.,
1991). Three yoghurt preloads were used in the study described in Chapter 8, one high
in carbohydrate, one high in fat and a low-nutrient volume control. All yoghurts had
the same sensory properties so that any differences in their effects would be due to the
post-ingestive physiological effects of the nutrients.
101

Common methodologies Chapter 4
The recipes were based on those used previously in studies conducted in the
Department (Vozzo et al., 2003). The yoghurts were prepared in the Departmental
research kitchen using commercially available ingredients. The base ingredients were
natural yoghurt (Farmers Union Natural European Style yoghurt, National Foods Ltd,
Melbourne, VIC, Australia), or fat-free yoghurt (Jalna Dairy foods Pty Ltd, Colac, VIC,
Australia), and mangos (Admiral sliced mangos in natural juice, Riviana Foods Pty Ltd,
Rowville, VIC, Australia). The final macronutrient composition was modified with
respect to; (i) total fat content, with the addition of double-thickened cream and full-fat
milk, and (ii) total carbohydrate content, with the addition of glucose and maltodextrin.
All three yoghurts had the same protein content. The sensory characteristics (sight and
taste) were also standardised with addition of gelatine, artificial sweetener, food
colouring and fruit sauce and were indistinguishable from each other (Table 4.1). A
pilot study was conducted to standardise the sensory characteristics of the yoghurts in
19 healthy subjects. Each subject received each of the three yoghurts and was asked to
rate taste, sweetness, fattiness, colour, bitterness and sourness on a visual analogue
scales (Chapter 4.5.5.2, Appendix 3). There were no significant differences in these
characteristics between the three yoghurts (Table 4.2). The yoghurts were prepared in
the afternoon before the study and allowed to set in the fridge at 4oC overnight.
102

Common methodologies Chapter 4
Table 4.1 Composition of yoghurt preloads.
Low-energy High-carbohydrate High-fat
kcal/100 g 45.0 125.5 125.5
Yoghurt (natural) (g) - 46.8 42.5
Low-fat yoghurt (g) 23.8 - -
Mango (g) 19.5 26.0 25.0
Mango topping (g) 3.5 10.6 6.5
Gelatine (g) 1.3 1.8 1.0
Maltodextrin (g) - 9.4 -
Glucose (g) - 3.1 -
Cream (> 35 g fat) (g) - - 14.0
Milk (full-cream) (g) - - 6.9
Water (g) 52.4 8.0 9.9
Low-fat cream (g) 4.3 - -
Artificial sweetener (g) 0.4 0.1 0.3
Colouring (g) 0.1 0.1 0.2
Salt (pinches) 2.0 - -
kJ from fat (%) 10.8 10.2 55.5
kJ from CHO (%) 55.7 73.8 31.4
kJ from protein (%) 22.5 11.7 10.4
CHO, carbohydrate.
103

Common methodologies Chapter 4
Table 4.2 Scores of taste, sweetness, colour, bitterness, fattiness and sourness of
low-energy, high-carbohydrate and high-fat yoghurt preloads.
Low-energy (“control”)
High-carbohydrate(“high-CHO”)
High-fat(“high-FAT”)
P value
Taste (mm) 63 ± 5 72 ± 5 70 ± 6 NS
Sweetness (mm) 56 ± 5 63 ± 6 60 ± 5 NS
Colour (mm) 53 ± 5 64 ± 5 62 ± 5 NS
Bitterness (mm) 23 ± 5 16 ± 5 17 ± 3 NS
Fattiness (mm) 42 ± 6 35 ± 6 43 ± 5 NS
Sourness (mm) 25 ± 4 17 ± 4 26 ± 4 NS
NS, not significant.
4.4.2 Intraduodenal infusions
4.4.2.1 Triglyceride emulsion
A commercially available lipid emulsion, Intralipid® (10 %, 300 mOsmol/kg, 1.1
kcal/ml, Baxter Healthcare Pty Ltd, Old Toongabbie, NSW, Australia), which consists
predominantly of long-chain triglycerides extracted from soy bean oil (50 g/500 ml),
egg phospholipids (1.2 g/500 ml) and glycerol anhydrous (2.25 g/500 ml), was used as
the nutrient infusion in Chapters 5 and 6. Intralipid® was diluted with isotonic saline
(0.9 %) to achieve the specific loads required, as specified in these chapters. All lipid
emulsions were administered intraduodenally at a rate of 4 ml/min for 150 min in
Chapter 5 so the total volume infused in all study conditions was 600 ml, and for 50 min
in Chapter 6 so that the total volume infused in all study conditions was 200 ml.
Intralipid® was selected as it has been used in the majority of studies evaluating the
104

Common methodologies Chapter 4
effects of lipid on gastrointestinal function and appetite (Feinle et al., 2000, Heddle et
al., 1988a, Castiglione et al., 1998, Andrews et al., 2001, Chapman et al., 1999).
4.4.2.2 Glucose solution
The intraduodenal glucose solutions, used in Chapter 7, were prepared from a 25 %
glucose stock solution, which contained 250 g of glucose powder (Glucodin, Boots
Healthcare, North Ryde, NSW, Australia) dissolved in distilled water to make up 1000
ml of solution, with an osmolarity of 1390 mosmol/l, and administered at: (i) 1
kcal/min, (ii) 2 kcal/min and (iii) 4 kcal/min. This stock solution was used for the 4
kcal/min treatment. For the 2 kcal/min treatment, the 25 % glucose solution was diluted
with iso-osmotic saline (i.e. 1390 mosmol/l) at a 1:1 ratio. For the 1 kcal/min treatment,
the 25 % glucose solution was diluted with iso-osmotic saline at a 1:3 ratio. On the
remaining study day hypertonic saline (4.2 %, 1390 mosmol/l) was given. Accordingly,
all solutions had an osmolarity of 1390 mosmol/l, and they were delivered into the
small intestine at a constant rate of 4 ml/min for 120 min, so that the total volume in all
study conditions was 480 ml.
4.4.3 Iberogast®
Iberogast®, used in the studies described in Chapter 10, is a complex herbal preparation
used for the treatment of abdominal symptoms in patients with FD and irritable bowel
syndrome. It contains nine constituents, including fresh plant extract of Iberis amara
(bitter candy tuft) and the extracts of eight other dried herbal drugs, including;
Angelicae radix (angelica roots), Matricariae flos (camomile flowers), Carvi fructus
(caraway fruit), Cardui mariae fructus (St. Mary’s thistle fruit), Melissae folium (balm
105

Common methodologies Chapter 4
leaves), Menthae peperitae folium (peppermint leaves), Chelidonii herba (greater
celandine), Liquiritiae radix (liquorice roots), in a 30.9 % ethanol solution (Table 4.3).
The recommended dose of Iberogast® is 20 drops (1.1 ml), three times per day.
Table 4.3 Content of Iberogast® per 1.1 ml dose.
Medicinal plant or drug Common name mg
Iberis amara totalis (FP) bitter candy tuft fresh plant 75.0
Carvi fructus (DR) caraway fruits 33.3
Liquiritiae radix (DR) liquorice root 33.3
Menthae piperitae folium (DR) peppermint leaves 16.7
Melissae folium (DR) balm leaves 33.3
Matricariae flos (DR) chamomile flowers 66.7
Chelidonii herba (DR) greater celandine 33.3
Cardui mariae fructus (DR) milk thistle fruits 33.3
Angelicae radix (DR) garden angelica root 33.3
Alcohol (31 % by volume) 34.0
DR, dry drug; FP, fresh plant.
4.5 TECHNIQUES
4.5.1 High-resolution manometry
High-resolution perfusion manometry is a technique used to measure pressures in the
gastrointestinal tract (Heddle et al., 1988c, Dent, 1976), and relies on the occurrence of
luminal-occlusive contractions. This technique employs external transducers linked to a
multi-lumen manometric catheter perfused with water through side-holes spaced along
106

Common methodologies Chapter 4
the tube. These transducers allow concurrent recordings of pressures at multiple points
along the regions of interest.
Subjects were intubated with the silicone rubber manometric catheter (3.5 mm outer
diameter; Dentsleeve, Adelaide, Australia (Chapters 5 and 6) or Dentsleeve
International Ltd. Mui Scientific, Ontario, Canada (Chapters 7 and 10)), via an
anaesthetised (Lignocaine 5 %, ORION Laboratories Pty Ltd, Calcatta, WA, Australia)
nostril, and allowed to pass through the stomach and into the duodenum by peristalsis
(Heddle et al., 1989). The catheter contained six side-holes (0.1 mm diameter: channels
1 - 6), which were positioned in the antrum, and seven side-holes (0.1 mm diameter:
channels 10 - 16) positioned in the duodenum. All side-holes were spaced at 1.5 cm
intervals. The catheter also incorporated a sleeve senor to measure pressures in the
pylorus, which is a mobile and narrow structure (Heddle et al., 1988b), accurately. The
sleeve sensor (channel 7) was 4.5 cm in length, with two side-holes on the back of the
sleeve (0.1 mm diameter: channels 8 and 9) (Dent, 1976). An infusion channel (0.4 ml
diameter) was located 11.75 cm distal to the end of the sleeve sensor (i.e. ~ 14.5 cm
from the pylorus), and used for the delivery of lipid and glucose solutions (Chapters 5 -
7). The correct positioning of the catheter, so that the sleeve sensor straddled the
pylorus, was monitored by continuous measurement of the transmucosal potential
difference (TMPD) between the most distal antral (channel 6) (~ -40 mV), and the most
proximal duodenal (channel 10) (~ 0 mV), channel (Heddle et al., 1989). For this
purpose, an intravenous cannula filled with sterile saline was placed subcutaneously in
the left forearm and used as a reference electrode (Heddle et al., 1989). All manometric
channels were perfused with degassed, distilled water, except for the two TMPD
107

Common methodologies Chapter 4
channels, which were perfused with degassed 0.9 % saline (Heddle et al., 1989) (Figure
4.1).
Figure 4.1 Schematic representation of manometric catheter incorporating six antral and seven duodenal side-holes, spaced 1.5 cm apart, a pyloric sleeve sensor and duodenal infusion port.
Manometric pressures were digitised and recorded on a computer-based system running
commercially available software (Flexisoft®, Version 3, Oakfield Instruments, Assoc
Prof GS Hebbard, Royal Melbourne Hospital, Melbourne, Australia, written in Labview
3.1.1 (National Instruments)), and stored for subsequent analysis. APD pressures were
analysed for the (i) number and amplitude of antral and duodenal PWs, (ii) basal pyloric
pressure, (iii) number and amplitude of IPPWs, and (iv) number of PWSs in the APD
region. Phasic PWs in the antrum and IPPWs were defined by an amplitude of > 10
mmHg, with a minimum interval between peaks of 15 s (Samsom et al., 1998). Basal
pyloric pressure (“tone”) was calculated for each minute by subtracting the mean basal
pressure (excluding phasic pressures) recorded at the most distal antral side-hole from
the mean basal pressure recorded at the sleeve (Heddle et al., 1988b), using custom-
108

Common methodologies Chapter 4
written software (MAD, Prof C-H Malbert, Institut National de la Recherché
Agronomique, Rennes, France). Phasic duodenal PWs were defined by an amplitude of
> 10 mmHg, with a minimum interval of 3 s between peaks (Samsom et al., 1998).
PWSs were defined as two or more temporally related PWs with onsets within � 5 s (in
the antrum), or � 3 s (in the duodenum), of each other (Samsom et al., 1998). PWSs
were characterised according to the distance traveled i.e. over two (1.5 - < 3 cm), three
(3 - < 4.5 cm), four (4.5 - < 6 cm), … , fifteen (21 - < 22.5 cm) channels, and expressed
as the total number of waves, using custom-written software (Gastrointestinal Motility
Unit, University Hospital Utrecht, Utrecht, Netherlands), modified to our requirements.
4.5.2 Barostat
The electronic barostat device is an instrument used to measure intragastric pressure and
volume. The barostat consists of a strain-gauge linked by an electronic relay to an air
aspiration / injection system (Figure 4.2). Both the strain-gauge and injection system
are connected to an ultra-thin, polyethylene bag by means of a single-lumen polyvinyl
catheter. When the stomach contracts, the barostat aspirates air from the bag to
maintain the pre-set pressure within the bag; when the stomach relaxes, air is injected
into the bag (Azpiroz and Malagelada, 1985a). In addition to maintaining a specified
pressure within the bag, the barostat is also capable of performing distensions of the
stomach.
Subjects swallowed the orogastric catheter (4 mm outer diameter, 2 mm inner diameter;
Tygon® tubing, Saint Gobain Performance Plastics, OH, USA), which had an ultrathin,
flaccid, polyethylene bag (capacity 1200 ml) tightly wrapped around its distal end
109

Common methodologies Chapter 4
(Feinle et al., 2000). The catheter was initially advanced to ~ 50 cm. The proximal end
of the catheter was then connected via a three-way tap to the measurement and balloon
ports of a gastric barostat (Distender Series IITM, G & J Electronics Inc, Toronto,
Ontario, Canada). To correctly position the bag in the fundus of the stomach, the bag
was unfolded by manually inflating it with 400 ml then pulling it back gently until its
passage was restricted by the lower oesophageal sphincter and then pushing it aborally
by 2 cm (Feinle et al., 2000). The bag was then deflated. The minimal distending
pressure (MDP) was determined by increasing the pressure in 1 mmHg increments. The
MDP is defined as the lowest pressure level that provides a mean intra-bag volume of
30 ml (Azpiroz and Malagelada, 1990) and is necessary to overcome intra-abdominal
pressure. The pressure was set at 2 mmHg above MDP and the corresponding volume
monitored until stable. After a baseline period the treatment was given, in this case,
Iberogast®, as described in Chapter 10. Changes in intra-bag volume were then
recorded as a measure of gastric relaxation.
Intra-bag pressures and volumes were digitised and recorded on a computer-based
system running commercially available software (Protocol PlusTM, G&J Electronics,
Toronto, Ontario, Canada), and stored for subsequent analysis.
110

Common methodologies Chapter 4
Barostat bag and catheter
Pylorus Antrum
LOS
Fundus
Figure 4.2 Schematic representation of the barostat bag and recording equipment used for
assessment of proximal gastric volume.
4.5.3 Scintigraphy
Scintigraphy is the gold standard and most commonly applied method for the evaluation
of gastric emptying and intragastric distribution and quantifies the rate at which a
radiolabelled meal empties from the stomach, by acquiring images on a computer, via a
gamma camera (Collins et al., 1983).
111

Common methodologies Chapter 4
A dual isotope technique was used to label the solid and liquid components of a meal.
The solid phase consisted of a 100 g ground beef patty (270 kcal, 25 g protein, 21 g fat)
and was labelled with 20 MBq 99mTc-sulfur colloid chicken liver. The liquid phase
consisted of a 150 ml drink containing 10 % dextrose (60 kcal) and was labelled with 6
MBq 67Ga-EDTA (Little et al., 2006b). 99mTc has a half-life of 6 hours and total body
radiation exposure is approximately 0.48 mSv. 67Ga has a half-life of 78 hours and total
body radiation exposure is approximately 1.8 mSv.
Scintigraphic images were acquired in 1 min frames for the first 60 min and thereafter
in 3 min frames. The counts detected by the gamma camera were corrected for subject
movement, radionuclide decay and gamma-ray attenuation, as previously described
(Collins et al., 1983). Regions-of-interest were drawn for total, proximal and distal
gastric regions, with the proximal region corresponding to the fundus and proximal
corpus, and the distal region corresponding to the distal corpus and antrum. The counts
plotted over time represented emptying of the meal from each region and were
expressed as % retention over time (Collins et al., 1983). The lag phases for solid and
liquid meal components were determined as the time period between meal completion
and the appearance of radioactivity in the proximal small intestine (Collins et al., 1983).
The amount of solid remaining in the stomach at t = 100 min and the time for 50 % of
the liquid to empty (T50) were also calculated (Collins et al., 1983). Gastric emptying
was classified as delayed when the solid % retention at t = 100 min was > 61% and/or
liquid T50 was > 31 min, based on an established normal range (Jones et al., 2002).
112

Common methodologies Chapter 4
4.5.4 Ultrasonography
Ultrasonography is a non-invasive technique, which does not expose the subject/patient
to radiation. Two or three-dimensional ultrasound can be used to measure gastric
emptying, intragastric distribution and proximal and antral motility (Holt et al., 1986,
Hausken and Berstad, 1992a, Gentilcore et al., 2006b). Ultrasonography correlates well
with scintigraphy, in that after ingestion of a low and high caloric drink, the time for the
distal stomach content, as measured by scintigraphy, to decrease to 50 % of the
maximum is similar to the ultrasound T50 (time taken for antral area to decease to half
its maximum) (Hveem et al., 1996). Two-dimensional ultrasonography was used for
the measurement of fasting and postprandial antral area, using an Aloka SSD-650 CL
Ultrasound Machine (ALOKA Co., LTD. Japan) with a 3.5 MHz sector transducer. To
optimise precision, the transducer was positioned vertically to obtain a parasagittal
image of the antrum with the superior mesenteric vein and the abdominal aorta in the
longitudinal section and measurements performed at the end of expiration, as described
previously (Hausken and Berstad, 1992b). The outer profile of the areas was outlined,
and the width calculated automatically with the built-in calliper and the calculation
program of the ultrasound apparatus (Figure 4.3).
113

Common methodologies Chapter 4
114
Figure 4.3 Schematic diagram of a two-dimensional ultrasonographic vertical scan through the
antrum, superior mesenteric vein (Mv) and aorta (A) (Hausken and Berstad, 1992b). 4.5.5 Assessment of eating behaviour and perception
4.5.5.1 Diet / symptom diaries
Diet diaries are a commonly used tool for evaluating short-term dietary intake. 7-day
diet diaries (Appendix 1) were used in the study reported in Chapter 9 to quantify food
intake in healthy subjects and FD patients. For this purpose subjects and patients
recorded everything they ate or drank, and the time of the eating or drinking episode,
over a complete 7-day period (i.e. five week days and two weekend days) (Karvetti and
Knuts, 1992). Subjects were asked to weigh as many foods as practical, or,
alternatively, to use cup or spoon measures or common serves e.g. slice of bread. They
were instructed to be as specific as possible, e.g. specify the type of bread
(white/wholemeal), the degree of fat trimming of meat, type of margarine or oil, the
type of milk (whole fat or skim) and the type of cooking method (fried, boiled or
NOTE: This figure is included on page 114 of the print copy of the
thesis held in the University of Adelaide Library.

Common methodologies Chapter 4
roasted). If a recipe was followed the subject was instructed to also record it in the food
diary.
The diary also included a symptom diary (Appendix 1), where all subjects recorded any
symptoms experienced (abdominal pain, cramps, bloating, nausea, uncomfortable
fullness after meals), its severity on a scale out of 10 (with 0 representing “symptom not
present” and 10 “symptom most severe”) and the time at which these symptoms
occurred.
All individual food and beverage items from the diet diaries were entered and the
energy intake (in kcal or kJ), weight (in g or kg), and macronutrient content (absolute
and % of total fat, carbohydrate, protein and alcohol) calculated using commercially
available software (Foodworks Version 2.10, Xyris Software (Australia) Pty Ltd,
Highgate Hill, QLD, Australia). In addition, the frequency of eating, periods between
meals, total number of meal, snack and beverage episodes, were quantified.
4.5.5.2 Visual analogue scale questionnaire
The most common tool used to measure subjective appetite perceptions (specifically
hunger and fullness) during or after a feeding challenge are validated visual analogue
scales (VAS) (Parker et al., 2004, Flint et al., 2000, Sepple and Read, 1989). The VAS
was also used to quantify sensory aspects (i.e. taste, sweetness, fattiness, colour,
bitterness and sourness) of the preloads described in Chapter 4.4.1. The VAS used
comprised of 100 mm horizontal lines with strengths of perceptions anchored at each
end, describing the two different extremes (e.g. 0 mm “I am not hungry”, 100 mm “I am
115

Common methodologies Chapter 4
extremely hungry”). Subjects were asked to place a vertical mark along the line
corresponding to the strength of the perception at that time point at which the VAS was
administered (Appendices 2 and 3). Quantification of each perception was achieved
by measuring the distance from the left end of the line to the vertical mark. Symptoms
of nausea, bloating (Chapter 5 -7), discomfort and pain (Chapters 5 - 7 and 8) were
assessed using VAS. Two pre-treatment VAS were administered and each perception
was averaged to obtain a baseline value. Subsequent VAS were given at different time
intervals throughout the studies, as outlined in Chapters 5 - 7 and 8.
4.5.5.3 Food intake
The most commonly used method to quantify how much food a subject is able to
consume after a specific treatment is ad libitum food intake at a buffet meal (Lavin et
al., 1998, Feltrin et al., 2004). The buffet meal was presented at a fixed time interval,
after a test meal was consumed (Chapter 8), or immediately after the cessation of
intraduodenal infusions (Chapters 5 - 7). The buffet meal contained a variety of
different food items as described in detail in Table 4.4, at quantities in excess of what
the subject was expected to consume (Lavin et al., 1998, Feltrin et al., 2004). The
subject was asked to eat until they were comfortably full or was given up to 30 min. All
food items were weighed before and after presentation to the subject. Subsequently,
energy consumption (kcal or kJ), amount eaten (g or kg) and macronutrient intake of
fat, carbohydrate and protein (absolute (g) and % of total) were calculated using
commercially available software (Foodworks Version 3.01, Xyris Software (Australia)
Pty Ltd, Highgate Hill, QLD, Australia) (Feltrin et al., 2004).
116

Tab
le 4
.4
Com
posi
tion
of th
e bu
ffet
mea
l.
Food
item
s A
mou
nt se
rved
g
Ene
rgy
cont
ent
kJFa
t gC
arbo
hydr
ate
gPr
otei
ng
Who
lem
eal b
read
, 4 sl
ices
a12
5 1,
304
3.6
50.0
12
.6
Whi
te b
read
, 4 sl
ices
a12
5 1,
295
2.9
56.4
11
.8
Ham
, slic
edb
100
453
3.6
0 18
.8
Chi
cken
, slic
edc
100
677
7.0
0 24
.6
Che
ese,
slic
edd
85
1,43
6 28
.3
0.9
21.9
To
mat
o, sl
iced
10
0 56
0.
1 1.
9 1.
0 Le
ttuce
10
0 27
0
0.4
0.9
Cuc
umbe
r, sl
iced
10
0 44
0.
1 1.
0.
5 *S
traw
berr
y yo
ghur
te20
0 96
6 6.
2 33
.8
9.4
Frui
t sal
adf
140
343
0.1
19.3
0.
6 C
hoco
late
cus
tard
g15
0 62
2 5.
3 22
.7
4.8
# Milk
y W
ay®
, 2 b
arsh
35
606
6.0
21.9
1.
8 A
pple
17
0 35
9 0.
2 21
.3
0.5
Ban
ana
190
680
0.2
37.8
3.
2 O
rang
e ju
ice,
uns
wee
tene
di50
0 80
0 5.
0 42
.5
5.0
Iced
cof
feej
600
1,78
8 10
.2
61.8
21
.0
Wat
er
600
0 0
0 0
Mar
garin
ek20
60
9 16
.4
0.1
0.1
May
onna
isel
20
310
6.5
4.0
0.2
Tota
l 3,
260*
or
3,42
5#11
,448
* or
11
,808
#95
.5*
or
95.7
#34
2.7*
or
354.
6#12
9.0*
or
136.
9#
a Sunb
lest
, Ti
ptop
, A
ustra
lia;
b Del
i le
g ha
m,
Woo
lwor
ths,
Aus
tralia
; c V
irgin
ian
chic
ken,
Woo
lwor
ths,
Aus
tralia
; d C
oon
Tast
y C
hees
e sl
ices
, A
ustra
lian
Coo
pera
tive
Food
s Lt
d.,
Aus
tralia
; e Y
opla
it, N
atio
nal
Food
s Lt
d.,
Aus
tralia
; f G
oulb
urn
Val
ley,
SPC
Ard
mon
a O
pera
tions
Ltd
,. A
ustra
lia, g Y
ogo,
Nat
iona
l Foo
ds L
td.,
Aus
tralia
; h Mar
s Inc
, Virg
inia
, USA
; i Dai
ly Ju
ice
com
pany
, Aus
tralia
; j Farm
ers U
nion
, Bal
emar
Pty
. Ltd
., A
ustra
lia; k Fl
ora,
Uni
leve
r A
ustra
lasi
a, A
ustra
lia; l K
raft,
Kra
ft Fo
ods
Ltd.
, Aus
tralia
. Pl
ease
not
e: *
use
d st
udie
s de
scrib
ed in
Cha
pter
s 5
- 7
only
, # use
d in
stud
y de
scrib
ed in
Cha
pter
8 o
nly.
117

Common methodologies Chapter 4
4.5.5.4 Three-factor eating questionnaire
Because most studies in this thesis (Chapters 5 - 9) evaluated the effects of specific
treatments on appetite and energy intake, it was important to identify and exclude
individuals with “abnormal” eating behaviour. The three factor eating questionnaire,
constructed by Stunkard and Messick (1985) (Stunkard and Messick, 1985), assesses
three dimensions of human eating behaviour; (i) cognitive restraint of eating, (ii)
disinhibition of eating and (iii) hunger. The questionnaire contains fifty one items;
twenty one for factor I, sixteen for factor II and fourteen for factor III (see Appendix 4
for scoring and distribution of factors of this questionnaire). The factor relevant to the
studies reported in Chapters 5 - 7 of this thesis is “restrained eating” (Factor I), which is
described as the tendency of individual to restrict their food intake in order to control
their body weight (Herman and Mack, 1975). A score of < 12 for factor I on this
questionnaire was used as a cut off - healthy subjects were excluded from participating
in these studies, if their score was higher than 12, as this classified them as restrained
eaters. For studies 8 and 9, FD patients were not excluded based on their scores, as they
were expected to have some degree of eating restraint.
4.5.5.5 Eating attitudes test
The eating attitudes test (EAT) was developed for evaluating a broad range of
behaviours and attitudes frequently observed in anorexia nervosa or those who are at a
high risk of developing this disorder (Garner and Garfinkel, 1979). This scale contains
forty items which reflect a range of reported “anorexic” behaviours and attitudes, and
subjects were required to judge whether these items applied to them quantitatively as;
“always”, “very often”, “often”, “sometimes”, “rarely”, or “never” (see Appendix 5 for
118

Common methodologies Chapter 4
scoring of this questionnaire). If the subject answered an item which was marked with
an “x” (Appendix 5), it was regarded as the most “symptomatic” response and,
therefore, received a score of three points, and the adjacent alternatives were weighted
as two points and one point, respectively. A minimum cut off score of 30 on this test
was used to differentiate individuals who are “normal” from those with anorexic
behaviour (Garner and Garfinkel, 1979). The EAT was administered to both healthy
controls and FD patients, in the study described in Chapter 9.
4.5.5.6 The Northwest Lipid Research Clinic fat intake scale
The Northwest Lipid Research Clinic fat intake scale provides a reliable and valid
estimate of fat, saturated fat, and cholesterol intake, when compared with 4 day food
records (Retzlaff et al., 1997). This scale is brief, self-administered, hand-scored in
under 3 minutes, with good reproducibility. It contains twelve items, which describe
how many, how much and what type of foods and cooking methods used (Appendix 6).
The maximum score is 44, and a score of less than 24 indicates the diet is moderate to
low in fat and cholesterol. This instrument was administered in both healthy subjects
and patients with FD, in the study described in Chapter 9.
4.5.6 Assessment of symptoms, quality of life, personality and
psychological distress
4.5.6.1 Nepean Dyspepsia Index
The Nepean Dyspepsia Index (NDI) is a multidimensional disease-specific quality of
life instrument, which discriminates dyspepsia from health (Talley et al., 1999b). It can
119

Common methodologies Chapter 4
also be used to assess changes in symptoms. This questionnaire contains two sections;
a symptom checklist and a disease-specific quality of life measure (Appendix 7). The
symptom checklist contains fifteen upper abdominal symptoms. Subjects indicated, on
a 5-point scale, the frequency, intensity and bothersomeness of each symptom in the last
2 weeks, and these scores were added together to give a total symptom score. The
quality of life section contains twenty five items, divided into four sub-scales with
questions relating to; (i) interference, or difficulty, with activities of daily living or work
because of dyspepsia, combined with impaired enjoyment of life and emotional well-
being (questions 1, 9 - 16, 19, 20, 21, 25 (maximum score: 65)), (ii) lack of knowledge
of, and control over, the illness (questions 2, 3, 17, 18, 22 - 24 (maximum score: 35)),
(iii) disturbances in eating or drinking (questions 4 - 6 (maximum score: 15)) and (iv)
sleep disturbances (questions 7 and 8 (maximum score 10)), on a 5-point scale (Talley
et al., 1999b) (Appendix 7). The NDI was administered to both healthy controls and
FD patients, in the study described in Chapter 9.
4.5.6.2 Eysenck Personality Questionnaire
Eysenck Personality Questionnaire is a tool used to measure two traits of personality,
extraversion and neuroticism. The questionnaire contains twenty four items, where the
subject was to answer yes or no to behaviours relating to extraversion (sociable,
dominant, active, impulsive) and neuroticism (anxiety, moodiness, obsessive, guilt)
(Eysenck and Eysenck, 1964) (Appendix 8).
120

Common methodologies Chapter 4
4.5.6.3 The Hospital Anxiety and Depression Scale
The Hospital Anxiety and Depression (HAD) Scale (Appendix 9) was developed to
assess anxiety disorders and depression among patients in non-psychiatric hospitals
(Zigmond and Snaith, 1983). The HAD scale is also a valid measure of severity of
emotional disorders or neurosis which may coexist with a physical illness causing the
patient to be more distressed by the symptoms of the illness which may lead to a
complicated clinical presentation and a poor response to treatment (Zigmond and
Snaith, 1983). This self-assessed questionnaire determines changes in the patients
emotional state. It is subdivided into an anxiety and a depression subscale both
containing seven items. Each item has a choice of four responses, i.e. not at all,
occasionally, quite often, very often. Optimal cut-off scores for depression and anxiety
have not been clearly identified for those with gastrointestinal disorders, but it has been
suggested that scores of > 11 for each subscale should be used (Zigmond and Snaith,
1983). The HAD scale was used in the study described in Chapter 9.
4.5.6.4 Zung self-rating depression scale
The Zung questionnaire was developed to quantify the symptoms of depression in
patients whose primary diagnoses were that of a depressive disorder, but has also
proved useful in patients with other psychiatric disorders, such as; anxiety reactions,
personality disturbances, and psychophysiological disturbances (Zung, 1965). In this
questionnaire, each subject is asked to rate each of the twenty items as to how it applies
to them at the time of testing, in the following four quantitative terms: “a little of the
time”, “some of the time”, “good part of the time”, or “most of the time” (See
Appendix 10 for the scoring of each item). The items included are divided into the
121

Common methodologies Chapter 4
following; pervasive affect (depression, crying spells (questions 1 and 3)), physiological
equivalents (diurnal variations, sleep, appetite, sex, weight loss, gastrointestinal,
cardiovascular and musculoskeletal disturbances (questions 2, 4 - 10 respectively)), or
psychological equivalents (confusion, retardation, agitation, hopelessness, irritability,
indecisiveness, personal devaluation, emptiness, suicidal rumination and dissatisfaction
(questions 11 - 20 respectively)). The maximum score which can be obtained is 80. A
score of < 50 is considered “normal”, i.e. not depressed (Zung, 1965). The Zung
questionnaire was administered to both healthy controls and FD patients, in the study
described in Chapter 9.
4.5.7 Blood sampling
In the studies described in Chapter 5 - 8 an intravenous cannula was inserted into an
antecubital vein for blood sampling. Venous blood samples (~ 10 ml) were taken
during the studies at specified time points as described in individual chapters for
determination of blood glucose and plasma gastrointestinal hormone concentrations.
Blood samples were collected in ice-chilled dipotassium EDTA tubes containing 480 �l
/ 10 ml whole blood of the protease inhibitor, aprotinin (Trasylol®; Bayer Australia Ltd,
Pymble, Australia). Plasma was separated by centrifugation (3200 rpm, 15 min, 4oC)
within 30 min of collection and stored at 70oC until assayed.
122

Common methodologies Chapter 4
4.5.8 Biochemical analysis
4.5.8.1 Blood glucose
Venous blood glucose concentrations (mmol/l) were determined immediately by the
glucose oxidase method, using a portable glucose meter (Medisense Precision QID,
Abbott Laboratories, Bedford, MA, USA). This technique has a coefficient of variation
(CV) of 2.1 - 5.6 %. The accuracy of this method has been confirmed in our laboratory
using the hexokinase technique (Horowitz et al., 1991).
4.5.8.2 Plasma insulin
Plasma insulin was measured by Enzyme-Linked ImmunoSorbent Assay (Diagnostics
Systems Laboratories Inc, Webster, Texas, USA). The intra-assay CV was 2.6 % and
the inter-assay CV was 6.2 %, with a detection limit of 2.6 mU/l (O'Donovan et al.,
2004).
4.5.8.3 Plasma cholecystokinin
Plasma CCK concentrations (pmol/l) were determined after ethanol extraction using a
previously described radioimmunoassay (MacIntosh et al., 2001b). A commercially
available antibody (C258, Lot 105H4852, Sigma Chemical, St Louis, MO, USA) raised
in rabbits against synthetic sulphated CCK-8 was employed. This antibody binds to all
CCK peptides containing the sulphated tyrosine residue in position 7, shows a 26 %
cross-reactivity with unsulphated CCK-8, less than 2 % cross-reactivity with human
gastrin (0.2 % with gastrin I and 1 % with Big gastrin), and does not bind to structurally
123

Common methodologies Chapter 4
unrelated peptides. The intra-assay CV was 9 % and the inter-assay CV was 27 %, with
a detection limit of 2.5 pmol/l.
4.5.8.4 Plasma peptide YY
Plasma PYY concentrations (pmol/l) were measured by radioimmunoassay using an
antiserum (kindly donated by Dr B Otto, Medizinische Klinik, Klinikum Innenstadt,
University of Munich, Munich, Germany) raised in rabbits against human PYY(1-36)
(Sigma-Aldrich, St Louis, MO, USA). This antiserum showed < 0.001 % cross-
reactivity with human pancreatic polypeptide and sulphated CCK-8, and 0.0025 %
cross-reactivity with human neuropeptide Y. Tracer (purchased from Prosearch
International Pty Ltd, Malvern, VIC, Australia) was prepared by radiolabeling synthetic
human PYY(1-36) (Auspep, Parkville, VIC, Australia) using the lactoperoxidase
method. Monoiodo-tyrosine-PYY was separated from free 125iodine, diiodo- and
unlabelled PYY by reverse phase HPLC (Phenomenex Jupiter C4 300A 5u column cat.
no. 00B-4167-EO 250 x 4.6 mm). An elution gradient from 27 - 40 % acetonitrile in
triethylamine phosphoric acid (pH 3.0) yielded 4 peaks of labeled PYY of which peak 3
demonstrated the highest specific binding and was used in the assays. Standards (1.6 -
50 fmol/tube) or samples (200 μl plasma) were incubated in assay buffer (0.05 M
phosphate containing 0.5 % bovine serum albumin (BSA) and 0.02 % azide (pH 7.4))
with 100 μl antiserum at a final dilution of 1:10,000 for 20 - 24 hours at 4oC, 100 μl
iodinated PYY (10,000 cpm) was then added and the incubation continued for another
20 - 24 hours. Separation of the antibody-bound tracer from free tracer was achieved by
addition of 200 μl of dextran-coated charcoal containing gelatin (0.015 g gelatin, 0.09 g
dextran, 0.15 g charcoal/30 ml assay buffer), incubated at 4oC for 20 min, and then
124

Common methodologies Chapter 4
centrifuged at 4oC for 25 min. Radioactivity of the bound fraction was determined by
counting the supernatants in a gamma counter. The intra-assay CV was 12.3 %, the
inter-assay CV was 16.6 %, with a detection limit of 4 pmol/l.
4.5.8.5 Plasma glucagon-like peptide-1
Plasma GLP-1(7-36) amide concentrations (pmol/l) were measured by
radioimmunoassay (Wishart et al., 1998). Ethanol extraction of plasma samples was
undertaken using an antibody supplied by Professor SR Bloom (Hammersmith Hospital,
London) that did not cross-react with glucagon, gastric inhibitory polypeptide, or other
gut or pancreatic peptides and had been demonstrated by chromatography to measure
intact GLP-1(7-36). The intra-assay CV was 17 %, the inter-assay CV was 18 %, with
a detection limit of 1.5 pmol/l.
4.5.8.6 Plasma glucose-dependent insulinotropic polypeptide (GIP)
Plasma GIP was measured by radioimmunoassay (Wishart et al., 1992). The standard
curve was prepared in buffer rather than extracted charcoal-stripped serum and the
radioiodinated label was supplied by ProSearch International (Victoria, Australia). Both
the intra- and inter-assay CVs were 15 %, with a detection limit of 2 pmol/l.
4.5.8.7 Plasma ghrelin
Plasma total ghrelin concentrations (pmol/l) were measured by radioimmunoassay
(Parker et al., 2005), using an antiserum (RAST-4745, Bachem, CA, USA) that does not
cross-react with human secretin, orexin, motilin, galantin or vasoactive intestinal
125

Common methodologies Chapter 4
peptide. The intra-assay CV was 5 %, the inter-assay CV 18 %, with a detection limit
of 40 pg/l.
4.6 STATISTICAL ANALYSIS
A P value of < 0.05 was considered significant. Detailed descriptions of the data and
statistical analysis are provided in the individual chapters.
126

Load vs. duration of lipid Chapter 5
Chapter 5
EFFECTS OF LOAD, AND DURATION, OF DUODENAL
LIPID ON GUT MOTILITY, PLASMA CCK AND PYY AND
ENERGY INTAKE IN HEALTHY MEN
5.1 SUMMARY
Enterally administered lipid modulates APD motility, gut hormone release, appetite and
energy intake. The aim of this study was to determine whether these effects would be
dependent on both the load, and duration, of small intestinal exposure to lipid. 11
healthy men were studied on four occasions in double-blind, randomised, fashion. APD
motility, plasma CCK and PYY concentrations and appetite perceptions were measured
during intraduodenal infusion of lipid (Intralipid®) at (i) 1.33 kcal/min for 50 min, (ii) 4
kcal/min for 50 min and (iii) 1.33 kcal/min for 150 min, or (iv) saline for 150 min.
Immediately after the infusions (i.e. t = 150 min) energy intake was quantified. PWSs
were suppressed, and basal pyloric pressure, IPPWs, plasma CCK and PYY stimulated
(all P < 0.05), during the first 50 min of lipid infusion, in a load-dependent fashion. The
effect of the 4 kcal/min infusion was sustained so that the suppression of antral PWs
and PWSs and increase in PYY remained evident after cessation of the infusion (all P <
0.05). The prolonged lipid infusion (1.33 kcal/min for 150 min) suppressed antral PWs,
127

Load vs. duration of lipid Chapter 5
stimulated CCK and PYY and basal pyloric pressure (all P < 0.05) and tended to
stimulate IPPWs when compared with saline throughout the entire infusion period.
There was no significant effect of any of the lipid infusions on appetite or energy intake,
although nausea was slightly higher (P < 0.05) with the 4 kcal/min infusion. In
conclusion, both the load, and duration, of small intestinal lipid influence APD motility
and patterns of CCK and PYY release.
5.2 INTRODUCTION
Ingestion of fat triggers a number of gastrointestinal responses (Heddle et al., 1988a,
Feinle et al., 2000, Chapman et al., 1999, Matzinger et al., 1999, Cook et al., 1997) as a
result of the interaction of lipolytic products (principally fatty acids) with small
intestinal receptors (Feinle et al., 2003, Feltrin et al., 2004, Malagelada et al., 1976,
Matzinger et al., 2000). Studies in animals indicate that fat-induced small intestinal
feedback on both gastric emptying, intestinal transit and appetite is dependent on both
the length (Lin et al., 1990, Meyer et al., 1998c, Meyer et al., 1998b), and region
(Meyer et al., 1998c, Lin et al., 1997, Meyer et al., 1998b), of small intestine exposed to
fat. The effects of exposing different lengths, or regions, of the small intestine to fat on
gastric emptying, APD motility, gut hormone release or appetite have not been directly
evaluated in humans (Layer et al., 1990, Spiller et al., 1984, Welch et al., 1988);
however, the effects of different loads (g, or kcal, per min) (Feinle et al., 2000, Andrews
et al., 2001) and durations (Castiglione et al., 1998) of small intestinal lipid infusions on
some of these parameters have been explored, indirectly assessing the effects of length,
or region, of exposure. It seems reasonable to assume that with greater lipid loads, a
greater length of small intestine would be exposed to lipid. For example, in both dogs
128

Load vs. duration of lipid Chapter 5
(Lin et al., 1996) and rats (Meyer et al., 1998a) ingestion of meals with an increasing fat
content results in an increasing load of triglyceride emptying from the stomach into the
duodenum, associated with an increasing spread of both lipolysis and absorption of fat
to, and along, the ileum. This caudal spread of digestion and absorption results from
exceeding the digestive capacity of lipase, as well as the absorptive capacities for
lipolytic products per cm of gut (Meyer et al., 1998c, Meyer et al., 1998a).
Much less is known about how the duration of small intestinal fat exposure might affect
gastrointestinal responses. Theoretically, this could have two important effects, i.e. (i)
depending on the rate of intestinal transit, the duration of infusion could affect the
distribution of lipolytic products along the gut, and (ii) at any given rate of infusion, the
duration could affect the total amount of fat digested and absorbed. - Duodenal infusion
of a high lipid load (which exceeds proximal gut lipolytic and absorptive capacities) for
a prolonged period would ultimately result in the release of lipolytic products in both
the proximal, and distal, small intestine, i.e. a long length of contact, while a shorter
infusion at the same rate would limit spread of contact initially to the proximal small
intestine, and then, after cessation of the infusion (as the bolus of fat and lipase moves
distally), to contact in the distal, but no longer the proximal, small intestine. By
contrast, the duration of infusion would not be expected to affect the distribution along
the gut of a low lipid load, because, irrespective of the time period over which the fat
was infused, it would be digested and absorbed efficiently within the proximal small
intestine. The effects of the duration of exposure of the small intestine to lipid on the
simulation of CCK and PYY have also not been assessed in humans. It would,
however, be anticipated that the patterns of release of these hormones would differ in
response to changes in the load, and duration, of lipid infusions, because these affect the
129

Load vs. duration of lipid Chapter 5
distributions of lipolytic products along the gut, and CCK-secreting cells are located in
the proximal small intestine (Buffa et al., 1976), while those which release PYY are
located more distally (Adrian et al., 1985).
The aims of this study were to evaluate the acute effects of load, and duration, of
intraduodenal lipid exposure on APD motor, plasma CCK and PYY, appetite and
energy intake responses in healthy subjects. Accordingly, the effects of “low” (1.33
kcal/min, total: 67 kcal) and “high” (4 kcal/min, total: 200 kcal) lipid loads, infused
intraduodenally for 50 min were quantified. The responses to these 50 min infusions
were compared with those observed in response to infusions of lipid (1.33 kcal/min,
total: 200 kcal) and saline (control), both given over 150 min. Fat empties initially from
the human stomach at rates that vary with the fat content of the meal and the physical
state of fat within the stomach, so that 1.33 kcal/min is a moderate rate typical of a meal
containing 15 - 20 g of oil; whereas 4 kcal/min is a rapid rate typical of a meal
containing 60 g of fat emulsified in a relatively large volume of water, as in a cream
soup or milkshake (Meyer et al., 1999, Meyer et al., 1996). Since transit through the
jejunum is known to take 60 min or less (Williams et al., 1984), it was postulated that
infusion of the 4 kcal/min load for 50 min would result in the release of lipolytic
products in the jejunum between 0 - 50 min, followed by further release of lipolytic
products in the ileum between 50 - 150 min; whereas, by contrast, with the 1.33
kcal/min loads, whether given for 50 or 150 min, lipolytic products would be confined
to the jejunum. If so, the plasma time-courses of CCK and PYY release would be
anticipated to differ fundamentally after the “low” and “high” fat loads.
130

Load vs. duration of lipid Chapter 5
5.3 SUBJECTS AND METHODS
5.3.1 Subjects
11 healthy male subjects (age: 25 � 2 yrs; body mass index (BMI): 23.4 � 0.7 kg/m2)
were recruited according to guidelines described in Chapter 4.2.
5.3.2 Study outline
Each subject was studied on four occasions, separated by 3 - 10 days, on which they
received, in randomised, double-blind fashion, an intraduodenal infusion of a lipid
emulsion, at (i) 1.33 kcal/min for 50 min (“1.33/50”), (ii) 4 kcal/min for 50 min
(“4/50”) or (iii) 1.33 kcal/min for 150 min (“1.33/150”), or (iv) intraduodenal isotonic
saline (“control”) for 150 min. APD pressures, plasma CCK and PYY concentrations,
appetite and energy intake were evaluated.
5.3.3 Intraduodenal infusions
The intraduodenal lipid emulsion (10 % Intralipid®, 300 mOsmol/kg, 1.1 kcal/ml,
Baxter Healthcare Pty Ltd, Old Toongabbie, NSW, Australia) was administered as: (i)
1.33 kcal/min for 50 min, (ii) 4 kcal/min for 50 min and (iii) 1.33 kcal/min for 150 min.
On the remaining study day (iv), isotonic saline was given for 150 min. Conditions (i)
and (ii) were designed to assess the effects of lipid load, resulting in total energy
deliveries of 67 kcal and 200 kcal, respectively, over 50 min. Conditions (ii) and (iii)
allowed evaluation of the effects of identical intraduodenal lipid loads (200 kcal), given
over different time periods (50 min vs. 150 min). In conditions (i) and (ii), the
intraduodenal lipid infusion was followed by an intraduodenal saline infusion between
131

Load vs. duration of lipid Chapter 5
50 - 150 min, so that the infusion duration was identical in all four study conditions.
Lipid solutions were diluted with isotonic saline to achieve the specific loads, and all
infusions were administered at a rate of 4 ml/min, so that the total volume infused in all
study conditions was 600 ml (see Chapter 4.4.2.1). The infusions were prepared by an
investigator who was not otherwise involved in either the performance of the studies or
data analysis. During studies the infusion apparatus was covered at all times.
5.3.4 Protocol
Each subject attended the laboratory in the Discipline of Medicine at 0830 h after an
overnight fast (14 hours for solids, 12 hours for liquids). A manometric catheter was
positioned, as described in Chapter 4.5.1. An intravenous cannula was placed in a
forearm vein for blood sampling.
Once the manometric catheter was positioned correctly, fasting motility was monitored
until the occurrence of a phase III of the interdigestive MMC (Feltrin et al., 2004).
Immediately after cessation of the phase III (at t = -10 min), a baseline blood sample
was taken, and a VAS questionnaire, assessing appetite-related sensations and
gastrointestinal symptoms (Parker et al., 2004), was completed. At t = 0 min, during
phase I of the MMC, the duodenal infusion of lipid or saline was commenced. APD
pressures were monitored throughout the infusion period; VASs were completed every
15 min from t = 0 - 150 min and blood samples taken every 15 min from t = 0 - 30 min
and every 30 min from t = 30 - 150 min. At t = 150 min, the infusion was terminated,
the subject immediately extubated, and then offered a cold, buffet-style, meal (Feltrin et
al., 2004). Each subject was given 30 min (i.e. t = 150 - 180 min) to consume the meal
132

Load vs. duration of lipid Chapter 5
and instructed to eat until comfortably full. After the meal, the intravenous cannula was
removed, and the subject allowed to leave the laboratory.
5.3.5 Measurements
5.3.5.1 Antropyloroduodenal pressures
APD pressures were assessed, and analysed for (i) number and amplitude of antral and
duodenal PWs, (ii) number and amplitude of IPPWs, (iii) basal pyloric pressure and
(iv) number and length of PWSs, as described in Chapter 4.5.1.
5.3.5.2 Plasma cholecystokinin and peptide YYconcentrations
Blood sample collection and analysis of plasma CCK and PYY were performed as
described in Chapters 4.5.7 and 4.5.8.
5.3.5.3 Appetite perceptions
Appetite perceptions (desire to eat, hunger, fullness, prospective consumption (‘how
much would you eat if given a meal now?’)) were rated on VAS, as described in
Chapter 4.5.5.2 (Parker et al., 2004). Nausea and bloating were also assessed (Chapter
4.5.5.2).
5.3.5.4 Energy intake
Assessment of energy intake is described in Chapter 4.5.5.3.
133

Load vs. duration of lipid Chapter 5
5.3.6 Data and statistical analyses
Baseline (“0”) values were calculated as the means of values obtained between t = -10 -
0 min for the number and amplitude of IPPWs and antral and duodenal PWs, basal
pyloric pressure and PWSs, and at t = -10 and 0 min for plasma hormone concentrations
and VAS scores. Antral and duodenal PWs and PWSs were analysed in three periods,
i.e. from t = 0 - 50 min (the duration of the intraduodenal lipid infusion in conditions (i)
and (ii)), t = 50 - 100 min and t = 100 - 150 min (to evaluate the effect of the more
prolonged infusion in condition (iii)). Antral and duodenal motility indices (MI) were
derived using the equation; natural logarithm [(sum of amplitudes x number of phasic
pressure waves) + 1] (Camilleri and Malagelada, 1984). Basal pyloric pressures and the
number and amplitude of IPPWs were expressed as the mean of 10 min periods over the
150 min infusion period. PWSs were expressed as the total number of waves spanning
over two (1.5 < 3 cm), three (3 < 4.5 cm), four (4.5 < 6 cm), … , fifteen (21 < 22.5 cm)
channels. Mean values for plasma CCK and PYY concentrations and VAS scores were
calculated at each time point from t = 0 - 150 min. All motility and VAS data were
expressed as changes from baseline, while plasma CCK and PYY were expressed as
absolute values.
Basal pyloric pressure, the number and amplitude of IPPWs, plasma concentrations of
CCK and PYY and VAS scores were analysed by repeated measures analysis of
variance (ANOVA), with time and treatment as factors. The total number of PWSs was
analysed by repeated measures ANOVA, between t = 0 - 50 min, t = 50 - 100 min and t
= 100 - 150 min, with number and length (cm) as factors. The number, amplitude and
MI of antral and duodenal PWs, between t = 0 - 50 min, t = 50 - 100 min and t = 100 -
134

Load vs. duration of lipid Chapter 5
150 min, and energy intake were analysed by one-way ANOVA. Statistical
significance was accepted at P < 0.05, and data are presented as means ± SEM.
5.4 RESULTS
All subjects tolerated the studies well. Baseline values for motility and VAS data are
given in Table 5.1. There were no differences between the four experimental
conditions.
5.4.1 Antropyloroduodenal pressures
5.4.1.1 Antral pressures waves
5.4.1.1.1 Period 1: 0 - 50 min
There was no effect of treatment on the number, or amplitude, of antral PWs (data not
shown). There was, however, an effect of treatment on the MI of antral PWs (P < 0.05)
(Figure 5.1A); 4/50 (P < 0.01) decreased, and 1.33/50 (P = 0.07) tended to decrease, the
MI when compared with saline, with no difference between saline and 1.33/150 or
between 1.33/50, 1.33/150 and 4/50.
5.4.1.1.2 Period 2: 50 - 100 min
There was no effect of treatment on the number of antral PWs (data not shown). There
was, however, a significant effect of treatment on the amplitude of antral PWs (P <
0.05; saline: 15 ± 8 mmHg, 1.33/50: 16 ± 6 mmHg, 1.33/150: 0 ± 5 mmHg, 4/50: -6 ± 5
mmHg (the negative value reflects the correction for baseline)); 4/50 decreased the
135

Load vs. duration of lipid Chapter 5
amplitude when compared with saline and 1.33/50 (P < 0.05 for both). There was a
trend for 1.33/150 to decrease the amplitude when compared with saline (P = 0.09) and
1.33/50 (P = 0.07). There was no difference between 1.33/150 and 4/50. There was
also an effect of treatment on the MI of antral PWs (P < 0.05) (Figure 5.1B); 1.33/150
and 4/50 decreased the MI when compared with saline and 1.33/50 (P < 0.05 for all),
with no difference between saline and 1.33/50, or between 1.33/150 and 4/50.
5.4.1.1.3 Period 3: 100 - 150 min
There was an effect of treatment on the number of antral PWs (P < 0.01; saline: 62 ± 13,
1.33/50: 32 ± 10, 1.33/150: 2 ± 1, 4/50: 29 ± 13); 1.33/50 (P < 0.05), 1.33/150 (P <
0.001) and 4/50 (P < 0.05) decreased the number of antral PWs when compared with
saline; 1.33/150 decreased the number of antral PWs when compared with 1.33/50 and
4/50 (P < 0.05 for both), with no difference between 1.33/50 and 4/50. There was an
effect of treatment on the amplitude of antral PWs (P < 0.05; saline: 21 ± 5 mmHg,
1.33/50: 30 ± 9 mmHg, 1.33/150: 4 ± 6 mmHg, 4/50: -5 ± 8 mmHg); 4/50 decreased the
amplitude when compared with saline (P < 0.05) and 1.33/50 (P < 0.01); 1.33/150
decreased the amplitude when compared with 1.33/50 (P < 0.05), while there was no
difference between 1.33/150 and 4/50. There was an effect of treatment on the MI for
antral PWs (P < 0.05) (Figure 5.1C); 1.33/150 (P < 0.01) and 4/50 (P < 0.05) decreased
the MI when compared with saline; 1.33/150 decreased the MI when compared with
1.33/50 (P < 0.05), with no differences between 1.33/50 and saline or 4/50, or between
1.33/150 and 4/50.
136

Load vs. duration of lipid Chapter 5
5.4.1.2 Pyloric pressures
5.4.1.2.1 Basal pressures
There was a treatment by time interaction for basal pyloric pressure (P < 0.01) (Figure
5.2A); 1.33/50, 1.33/150 and 4/50 increased basal pyloric pressure when compared with
saline; 1.33/50 between 0 - 20 min, 1.33/150 between 0 - 20 min and 120 - 140 min and
4/50 between 20 - 40 min (P < 0.05 for all). 4/50 increased basal pressure when
compared with 1.33/50 between 20 - 60 min and 1.33/150 between 20 - 40 min (P <
0.01 for both). 1.33/150 increased basal pressure when compared with 1.33/50 between
60 - 70 min and 120 - 150 min (P < 0.05), while there was no difference between
1.33/150 and 4/50 between 40 - 150 min.
5.4.1.2.2 Phasic pressures
There was a treatment by time interaction for the number of IPPWs (P < 0.001) (Figure
5.2B); 1.33/50, 1.33/150 and 4/50 increased the number of IPPWs when compared with
saline, 1.33/50 between 0 - 60 min and 1.33/150 and 4/50 between 0 - 70 min (P < 0.05
for all). There was a trend for 1.33/150 to increase IPPWs between 90 - 120 min (P =
0.08) when compared with saline. 4/50 increased the number of IPPWs more than
1.33/50 between 30 - 70 min and 1.33/150 between 30 - 50 min (P < 0.05 for both).
There was no difference between 1.33/50 and 1.33/150 between 0 - 60 min, however,
between 70 - 110 min the number of IPPWs was greater for 1.33/150 when compared
with 1.33/50 (P < 0.05). There was no difference between 1.33/150 and 4/50 after 70
min, although the mean values for 1.33/150 were higher. There was no effect of
treatment on the amplitude of IPPWs (data not shown).
137

Load vs. duration of lipid Chapter 5
5.4.1.3 Duodenal pressures waves
5.4.1.3.1 Period 1: (0 - 50 min)
There was a trend for an effect of treatment on the number of duodenal PWs (P = 0.08;
saline: 204 ± 24, 1.33/50: 172 ± 34, 1.33/150: 204 ± 35, 4/50: 111 ± 34); the number of
duodenal PWs was less with 4/50 when compared with saline and 1.33/150 (P < 0.05
for both), with no difference between saline, 1.33/50 and 1.33/150. There was no effect
of treatment on the amplitude of duodenal PWs (data not shown). There was an effect
of treatment on the MI of duodenal PWs (P = 0.05) (Figure 5.3A); 4/50 decreased the
MI when compared with saline, 1.33/50 and 1.33/150 (P < 0.05 for all), with no
difference between saline, 1.33/50 and 1.33/150.
5.4.1.3.2 Period 2: (50 - 100 min)
There was no effect of treatment on the number, or amplitude, of duodenal PWs (data
not shown). There was, however, an effect of treatment on the MI of duodenal PWs (P
< 0.05) (Figure 5.3B); the MI during 1.33/50 was greater when compared with saline,
1.33/150 and 4/50 (P < 0.05 for all), while there was no difference between saline,
1.33/150 and 4/50.
5.4.1.3.3 Period 3: (100 - 150 min)
There was an effect of treatment on the number of duodenal PWs (P < 0.01; saline: 277
± 21, 1.33/50: 289 ± 45, 1.33/150: 167 ± 27, 4/50: 350 ± 34); the number of duodenal
PWs was less for 1.33/150 when compared with saline (P < 0.05), 1.33/50 (P < 0.05)
and 4/50 (P < 0.001), with no differences between saline, 1.33/50 and 4/50. There was
138

Load vs. duration of lipid Chapter 5
no effect of treatment on the amplitude of duodenal PWs (data not shown), but there
was a trend for an effect of treatment on the MI of duodenal PWs (P = 0.07) (Figure
5.3C); the MI during 1.33/50 (P = 0.07) and 4/50 (P < 0.01) was greater when compared
with 1.33/150, with no difference between saline, 1.33/50 and 4/50.
5.4.1.4 Pressure wave sequences
Only PWSs which spanned over 2 - 6 channels (i.e. 1.5 - 9 cm) were analysed
statistically, as PWSs spanning over 7 - 15 channels were infrequent (0 - 50 min: saline,
3 � 0; 1.33/50, 2 � 0; 1.33/150, 2 � 0; 4/50, 5 � 1; 50 - 100 min: saline, 6 � 0; 1.33/50, 6
� 1; 1.33/150, 3 � 0; 4/50, 4 � 1; 100 - 150 min: saline, 6 ± 0; 1.33/50, 3 ± 0; 1.33/150,
3 ± 0; 4/50, 7 ± 1).
5.4.1.4.1 Period 1: (0 - 50 min)
There was a treatment by length interaction for the number of PWSs (P < 0.05) (Figure
5.4A); both 1.33/50 and 1.33/150 decreased the number of PWSs that spanned over two
and three channels when compared with saline (P < 0.05 for all). 4/50 decreased the
number of PWSs that spanned over two, three and four channels when compared with
saline (P < 0.05), and the number of PWSs that spanned over two channels when
compared with 1.33/50 and 1.33/150 (P < 0.01). There was no difference between
1.33/50 and 1.33/150.
139

Load vs. duration of lipid Chapter 5
5.4.1.4.2 Period 2: (50 - 100 min)
There was a treatment by length interaction for the number of PWSs (P < 0.05) (Figure
5.4B); 4/50 decreased the number of waves that spanned over two channels when
compared with saline (P < 0.05). The number of waves that spanned over two and three
channels was greater during 1.33/50 when compared with 1.33/150 and 4/50 (P < 0.05
for both), while there was no difference between 1.33/150 and 4/50.
5.4.1.4.3 Period 3: (100 - 150 min)
There was a treatment by length interaction for the number of PWSs (P < 0.05) (Figure
5.4C); 1.33/150 decreased the number of waves that spanned over two channels when
compared with saline, 1.33/50 and 4/50 (P < 0.01 for all).
5.4.2 Plasma hormone concentrations
5.4.2.1 Cholecystokinin
There was a treatment by time interaction for plasma CCK concentrations (P < 0.001)
(Figure 5.5A). Plasma CCK concentrations reached a maximum at 15 min during all
lipid treatments (1.33/50: 9.3 � 1.1 pmol/l, 1.33/150: 9.2 � 1.1 pmol/l, 4/50, 11.8 � 1.4
pmol/l). During 1.33/50 and 1.33/150, plasma CCK declined after 15 min, returning to
baseline values for 1.33/50 by 90 min, while for 1.33/150 levels gradually decreased,
but were still higher than baseline at 150 min (P < 0.01). During 4/50, CCK
concentrations plateaued between 15 - 60 min, and thereafter progressively decreased to
be just above baseline at 90 min. 1.33/50, 1.33/150 and 4/50 increased plasma CCK
when compared with saline during the first 60 min of the infusion (P < 0.01 for all) and
140

Load vs. duration of lipid Chapter 5
the effect of 4/50 was greater when compared with 1.33/50 and 1.33/150 (P < 0.01 for
both), with no difference between 1.33/50 and 1.33/150. During 1.33/150, plasma CCK
concentrations were greater when compared with saline, 1.33/50 and 4/50 between 90 -
150 min (P < 0.05 for all), with no difference between saline, 1.33/50 and 4/50.
5.4.2.2 Peptide YY
There was a treatment by time interaction for plasma PYY concentrations (P < 0.001)
(Figure 5.5B). With both 1.33/50 and 1.33/150, PYY concentrations reached a
maximum (1.33/50: 17.3 � 1.4 pmol/l, 1.33/150: 18.7 ± 2.2 pmol/l) at 30 min, after
which levels for 1.33/50 gradually declined, while for 1.33/150 levels remained
constant until 150 min. In response to 4/50, there was a marked stimulation of PYY
concentrations with a peak at 60 min (36.7 � 3.8 pmol/l) and a decline after that time,
although levels were still higher than baseline at 150 min (P < 0.001). 1.33/50,
1.33/150 and 4/50 increased plasma PYY when compared with saline over the entire
infusion period (P < 0.05 for all), and the effect of 4/50 was greater when compared
with 1.33/50 between 30 - 150 min, and with 1.33/150 between 30 - 120 min (P < 0.05
for all). There was no difference between 1.33/50 and 1.33/150 during the first 90 min
of infusion, while PYY was higher during 1.33/150 between 120 - 150 min (P < 0.01).
5.4.3 Appetite perceptions
While there was no effect of treatment on appetite perceptions, mean scores for
prospective consumption were less during 4/50 when compared with the other infusions
between 0 - 105 min (P = 0.28) (Figure 5.6A). There was an effect of treatment on
scores for nausea (P < 0.05) (Figure 5.6B); although mean scores were low, they were
141

Load vs. duration of lipid Chapter 5
greater during 4/50 when compared with saline, 1.33/50 and 1.33/150 (P < 0.05 for all)
between 0 - 60 min, with no difference between saline, 1.33/50 and 1.33/150.
5.4.4 Energy intake
There was no effect of treatment on energy intake, the amount eaten, or macronutrient
distribution of food eaten at the buffet meal, however, mean energy intake was lower
following 1.33/150 (P = 0.3) (Table 5.2).
142

Load vs. duration of lipid Chapter 5
Figure 5.1 Motility index for antral pressure waves between (A) 0 - 50 min, (B) 50 - 100 min and (C) 100 - 150 min, during intraduodenal infusion of 10 % Intralipid® at 1.33 kcal/min for 50 min, 1.33 kcal/min for 150 min and 4 kcal/min for 50 min, or saline for 150 min. (A) * vs. saline; P = 0.07, # vs. saline; P < 0.01. (B) * vs. saline and 1.33/50; P < 0.05. (C) * vs. saline; P < 0.05, # vs. 1.33/50; P < 0.05. Data are means � SEM (n = 11).
143

Load vs. duration of lipid Chapter 5
Figure 5.2 (A) Basal pyloric pressure and (B) number of isolated pyloric pressure waves (IPPWs) during intraduodenal infusion of 10 % Intralipid® at 1.33 kcal/min for 50 min (�), 1.33 kcal/min for 150 min (�) and 4 kcal/min for 50 min (�), or saline for 150 min (�). (A) * 1.33/50 vs. saline; P < 0.05, # 4/50 vs. saline; P < 0.05, § 1.33/150 vs. saline; P < 0.05, � 1.33/50 vs. 4/50; P < 0.01; � 1.33/150 vs. 4/50; P < 0.01, � 1.33/150 vs. 1.33/50; P < 0.05. (B) * 1.33/50, 1.33/150 and 4/50 vs. saline; P < 0.05, # 1.33/150 and 4/50 vs. saline and 1.33/50; P < 0.05, � 4/50 vs. 1.33/50 and 1.33/150; P < 0.05, � 1.33/150 vs. 1.33/50; P < 0.05. Data are means � SEM (n = 11).
144

Load vs. duration of lipid Chapter 5
Figure 5.3 Motility index for duodenal pressure waves between (A) 0 - 50 min, (B) 50 - 100 min
and (C) 100 - 150 min, during intraduodenal infusion of 10 % Intralipid at 1.33 kcal/min for 50 min, 1.33 kcal/min for 150 min, and 4 kcal/min for 50 min, or saline for 150 min. (A) * vs. saline, 1.33/50 and 1.33/150; P < 0.05. (B) * vs. saline, 1.33/150 and 4/50; P < 0.05. (C) * vs. 1.33/150; P = 0.07, # vs. 1.33/150; P < 0.01. Data are means � SEM (n = 11).
145

Load vs. duration of lipid Chapter 5
Figure 5.4 Pressure wave sequences between (A) 0 - 50 min, (B) 50 - 100 min and (C) 100 - 150 min, during intraduodenal infusion of 10 % Intralipid® at 1.33 kcal/min for 50 min, 1.33 kcal/min for 150 min and 4 kcal/min for 50 min, or saline for 150 min. (A) * vs. saline; P < 0.05, § vs. 1.33/50 and 1.33/150; P < 0.01. (B) * vs. saline; P < 0.05, # vs. 1.33/150 and 4/50; P < 0.05. (C) * vs. saline, 1.33/50 and 4/50; P < 0.01. Data are means � SEM (n = 11).
146

Load vs. duration of lipid Chapter 5
Figure 5.5 Plasma concentrations of (A) cholecystokinin (CCK) and (B) peptide YY (PYY) during intraduodenal infusion of 10 % Intralipid® at 1.33 kcal/min for 50 min (�), 1.33 kcal/min for 150 min (�) and 4 kcal/min for 50 min (�), or saline for 150 min (�). (A) * 1.33/50, 1.33/150 and 4/50 vs. saline; P < 0.01, # 4/50 vs. 1.33/50 and 1.33/150; P < 0.01, § vs. saline, 1.33/50 and 4/50; P < 0.01. (B) * 1.33/50, 1.33/150 and 4/50 vs. saline; P < 0.05, # 4/50 vs. 1.33/50 and 1.33/150; P < 0.05, § 1.33/150 vs. 1.33/50; P < 0.01, � 1.33/150 and 4/50 vs. 1.33/50; P < 0.05. Data are means � SEM (n = 11).
147

Load vs. duration of lipid Chapter 5
Figure 5.6 Scores for (A) prospective consumption and (B) nausea during intraduodenal infusion of 10 % Intralipid® at 1.33 kcal/min for 50 min (�), 1.33 kcal/min for 150 min (�) and 4 kcal/min for 50 min (�), or saline for 150 min (�). (A) 4/50 tended to decrease prospective consumption when compared with saline. (B) # vs. saline, 1.33/50 and 1.33/150; P < 0.05. Data are means � SEM (n = 11).
148

Load vs. duration of lipid Chapter 5
Table 5.1 Motility indices of antral and duodenal pressure waves, basal pyloric
pressure, number of isolated pyloric pressure waves, plasma
cholecystokinin and peptide YY concentrations and nausea at baseline,
before intraduodenal infusions of 10 % Intralipid® or saline commenced.
Control(saline)
1.33 kcal/ 50 min
1.33 kcal/ 150 min
4 kcal/ 50 min
Motility index
Antral PWs (mmHg) 3.7 � 0.7 2.3 � 0.6 3.4 � 0.8 4.3 � 0.8
Duodenal PWs (mmHg) 7.0 � 0.9 5.8 � 0.6 6.2 � 0.7 6.3 � 0.5
Pyloric pressure
Basal (mmHg) 0.4 � 4.5 0.0 � 2.7 -2.7 � 4.4 -2.1 � 1.8
IPPWs (number) 1.3 � 0.6 2.0 � 0.8 4.1 � 1.8 1.1 � 0.6
Plasma hormones
CCK (pmol/l) 3.6 � 0.4 3.1 � 0.5 3.3 � 0.5 3.1 � 0.4
PYY (pmol/l) 7.5 � 1.3 8.7 � 1.4 9.8 � 1.3 8.0 � 1.0
Nausea (mm) 8.1 � 2.7 6.0 � 2.5 6.6 � 2.3 6.7 � 2.6
Data are means � SEM (n = 11). PWs, pressure waves; IPPWs, isolated pyloric pressure waves; CCK, cholecystokinin; PYY, peptide YY.
149

Load vs. duration of lipid Chapter 5
Table 5.2 Energy content (kJ), weight (g) and macronutrient distribution (% energy
derived from fat, carbohydrate or protein) of food consumed at a buffet
meal after intraduodenal infusions of 10 % Intralipid® or saline.
Control(saline)
1.33 kcal/ 50 min
1.33 kcal/ 150 min
4 kcal/ 50 min
P value (ANOVA)
Energy (kJ) 5712 � 443 6051 � 534 5857 � 488 6102 � 600 NS
Weight (g) 1433 � 111 1467 � 141 1340 � 87 1489 � 128 NS
% kJ from fat 29 � 2 30 � 2 32 � 2 29 � 2 NS
% kJ from CHO 50 � 3 50 � 3 47 � 3 50 � 3 NS
% kJ from protein 20 � 1 21 � 1 21 � 2 20 � 1 NS
Data are means � SEM (n = 11). CHO, carbohydrate; NS, not significant.
150

Load vs. duration of lipid Chapter 5
5.5 DISCUSSION
As anticipated from previous studies (Little et al., 2005, Andrews et al., 2001, Feinle et
al., 2000), APD motor and hormone responses to the intraduodenal infusions between 0
- 50 min were dependent on the rate of lipid infusions, i.e. over the first 50 minutes,
responses to 1.33/50 were comparable to those to 1.33/150, but less than those to the
4/50 infusion. Thus, the inhibition of duodenal pressure waves and APD pressure wave
sequences, as well as the stimulation of basal pyloric pressures, IPPWs, plasma CCK
and PYY and the induction of mild nausea were greater during the 4 kcal/min infusion
than either of the 1.33 kcal/min infusions; in turn, the 1.33 kcal/min infusion, over a
prolonged period, evoked higher basal pyloric pressures, more IPPWs, greater
suppression of antral pressure waves, and greater plasma CCK and PYY responses than
saline (control).
Such dose-responsiveness reflects two phenomena: (i) the concentration of the
stimulating nutrients (in this case, fatty acids and monoglycerides) exceeds thresholds
for detection by sensors located along the gut. For example, as the load (kcal/min) of
triglyceride entering the duodenum increases, so do the rates of release, and thus
luminal concentrations, of lipolytic products (Meyer et al., 1994), and (ii) with further
increases in the rate of duodenal entry of triglycerides, hydrolysis takes longer to
complete, and consequently lipolytic products are distributed further downstream.
Also, mainly because of the slow rates of aqueous diffusion of poorly soluble, lipolytic
products, absorption is also slow, hence, an increasing length of gut is required to
complete the absorptive process as duodenal loads increase (Lin et al., 1996, Meyer et
al., 1998a, Meyer et al., 1998c). For example, Lin and colleagues reported that a 15 g
151

Load vs. duration of lipid Chapter 5
fat emulsion emptied initially from the canine stomach at 0.9 kcal/min, but only 7 % of
this duodenal load reached the ileum (i.e. was not absorbed proximally); in contrast, a
60 g fat emulsion emptied initially at 2 kcal/min, with 30 % of this load reaching the
ileum (Lin et al., 1996). Some responses to luminal nutrients, including the inhibition
of gastric emptying of aqueous contents (Lin et al., 1990) and energy intake (Meyer et
al., 1998c), increase with the length of gut contacted; other nutrient-driven responses
appear to be uniquely mediated by ileal mechanisms (Lin et al., 1997, Spiller et al.,
1984, Layer et al., 1990).
In the present study, it was postulated that: (i) intestinal transit would carry the 4/50
bolus into the ileum after the first hour and that this transit would displace lipolytic
products from more than 30 % of the infused load from the jejunum to the ileum where
digestion and absorption would continue over the 100 min after cessation of the fat
infusion, (ii) a correspondingly prolonged stimulation of ileal neural reflexes and/or
release of ileal peptides would sustain a feedback inhibition of upper gastrointestinal
pressures, but (iii) suppression of energy intake may not be apparent, as this is driven
maximally by combined feedback from both proximal and distal gut sensors (Meyer et
al., 1998c, Meyer et al., 1998b), and is less when lipolytic products are confined to the
ileum (Welch et al., 1988, Meyer et al., 1998b). These observations suggested that
these predictions were correct; after the 4/50 load (as opposed to the 1.33/50 infusion)
continuing feedback from the ileum is attested to by sustained alterations in upper
gastrointestinal pressures and continuing release of PYY, yet CCK had returned to
baseline by 90 min and there was no suppression of energy intake at 150 min. While
this study did not directly measure the distribution of lipolytic products along the gut,
the simplest explanation for the persisting alterations in motility and changing ratios of
152

Load vs. duration of lipid Chapter 5
CCK:PYY in the plasma beyond 90 min after the 4/50 bolus is the persistence of
lipolytic products in the ileum from 90 - 150 min.
Arguably the most striking, and novel, observation was the effect of altering the rate,
and duration, of duodenal infusion of 200 kcal of fat on the time-course of plasma CCK
and PYY secretion. During the 4/50 infusion, CCK rose rapidly, peaked at 15 min, and
then remained elevated for a further 45 min at a concentration which was about twice
the level sustained throughout the 1.33/150 infusion. Soon after cessation of the 4/50
infusion at 50 min, CCK fell to basal values. In contrast to the rapid fall of CCK,
plasma concentrations of PYY peaked at 60 min and remained elevated between 50 -
150 min after cessation of the 4/50 infusion. Although PYY fell progressively after the
4/50 infusion was stopped at 50 min, plasma PYY levels remained significantly higher
between 50 - 120 min when compared with the relatively constant level evident
between 30 - 150 min during the 1.33/150 infusion. By contrast, after cessation at 50
min of the lower, 1.33/50, lipid load, both CCK and PYY fell rapidly to levels
indistinguishable from control values, presumably because lipolysis of fat was
completed, and thus lipolytic products were removed from the gastrointestinal lumen.
The elevation of PYY between 50 - 150 min after the 4/50 infusion was stopped is
presumably attributable to the presence of lipolytic products from this infusion in the
gastrointestinal lumen, as a result of continuing lipolysis in the ileum or ileocolon as the
50 min bolus of fat and lipase moved along the distal small intestine. If so, the rapid
decline in plasma CCK after cessation of the 4/50 infusion reflected not the
disappearance of lipolytic products from the gastrointestinal lumen, but rather their
movement distally, out of the CCK-bearing area of the jejunum (Buffa et al., 1976), into
the PYY-rich area of the ileocolon (Adrian et al., 1985). By contrast, the nearly steady
153

Load vs. duration of lipid Chapter 5
plasma concentrations of both CCK and PYY sustained by the infusion of 1.33/150
must have reflected the continuing presence of lipolytic products in the CCK-bearing
area of the proximal small intestine.
Although the explanation put forth in the preceding paragraph adequately explains the
time courses for the plasma CCK and PYY responses, it is at odds with a canine study
(Lin and Chey, 2003). In dogs, as in humans, CCK is stored in jejunal (Buffa et al.,
1976), while PYY is stored in ileocolonic (Taylor, 1985), mucosa. In the study by Lin
and colleagues (Lin and Chey, 2003), duodenally infused oleic acid was either confined
to the proximal small intestine, infused into the distal small intestine, or simultaneously
infused into both the proximal, and distal, small intestine in dogs. When oleic acid
infusion was confined to the proximal small intestine, PYY rose slowly (peaking at 90
min), but substantially. On the other hand, PYY concentrations were some 20 % higher
when the oleic acid was in direct contact with the distal bowel mucosa (whether infused
distally or both proximally and distally), and the release of PYY by fat confined to the
proximal small intestine was shown to be mediated, at least in part, by CCK (Lin et al.,
2000). The observations described thus far are not in conflict with the scenario
suggested in the preceding paragraph. However, in contrast to the present study, in
dogs infusion of oleic acid induced similar rises in plasma CCK, whether confined to
the proximal or distal small intestine (Lin and Chey, 2003). Thus, it can be speculated
that the mechanism(s) for fat-induced CCK release in the dog may differ substantially
from that in humans.
The much higher CCK release between 15 - 60 min in response to the 4 kcal/min,
compared with 1.33 kcal/min, infusion might reflect a more rapid release, and thus
154

Load vs. duration of lipid Chapter 5
higher luminal concentrations, of lipolytic products in the proximal small intestine
(Meyer et al., 1994); that is, a concentration-dependent release of CCK by fatty acids.
Alternatively, it may reflect the much longer length of jejunal exposure to lipolytic
products in the CCK-bearing region. If the latter were correct, the modest, but
significant, release of PYY by the 1.33 kcal/min loads must have resulted from indirect,
probably CCK-mediated, stimulation of PYY release (Lin et al., 2000), rather than
release by direct contact, because the maximal CCK-bearing areas of the small intestine
are proximal to the maximal PYY bearing areas, with minimal overlap.
A second interesting observation in the present study was the difference in the effect of
lipid on antral and duodenal pressure waves during the first 50 min of infusion. The
suppression of antral pressure waves was similar for all lipid infusions, however, there
was no suppressive effect of both 1.33 kcal/min infusions on duodenal pressure waves,
when compared with saline. This demonstrates that the 1.33 kcal/min load may be
sufficient to have a maximal inhibitory effect on the antrum, but did not reach the
threshold needed for suppression in the duodenum. To date, only one study has
demonstrated load-related effects of lipid on intestinal motility, in which the number of
duodenal pressure wave sequences was reported to decrease as the duodenal load of
lipid increased (Andrews et al., 2001). However, in this study only relatively low loads
of lipid were used (0.25 - 1.5 kcal/min), and the effects of lipid on pressures in the
antrum and pylorus were not evaluated. In contrast, proximal gastric relaxation in
response to duodenal lipid (Intralipid® as used in this study) at 1, 2 and 3 kcal/min, as
measured by an electronic barostat, was found not to be load-dependent, as maximal
relaxation occurred at the lowest load of 1 kcal/min (Feinle et al., 2000). These
observations taken together indicate that there are regional differences in the upper
155

Load vs. duration of lipid Chapter 5
gastrointestinal tract in relation to the nutrient load required for a maximal inhibitory
effect. It is also interesting that the inhibitory effect of the 4/50 infusion on antral
pressure waves persisted to some extent after this infusion was stopped, particularly
between 50 - 100 min, and were still present, between 100 - 150 min. Similarly, antral
pressure waves continued to be strongly inhibited for the entire 150 min during the
1.33/150 infusion. The sustained inhibition of antral pressure waves after the 4/50 or
the 1.33/150 infusion might be explained by persisting elevation of PYY, although it
should be recognised that Raybould and colleagues (Raybould et al., 1999) have
demonstrated in rats that PYY does not play a role in the inhibition of gastric emptying
(not exactly the same as inhibition of antral or duodenal motility) after either duodenal
or ileal infusion of lipid. By contrast, the time-courses of both basal pyloric pressures
and IPPWs correspond closely to the time-courses of plasma CCK observed after the
three lipid infusions, if it is assumed that the pylorus responded similarly to plasma
CCK concentrations of 6 pmol/l or above.
Appetite scores and energy intake were not affected by any of the lipid infusions,
although there was a significant, albeit slight, increase in nausea, and a tendency for
reduced scores for prospective consumption, during 4/50 compared with the other
infusions. The lack of effect of the 4/50 infusion on energy intake is likely to be
accounted for by the experimental paradigm in which the meal was consumed 100 min
after cessation of the lipid infusion, at a time when plasma concentrations of CCK and
the number of IPPWs had declined to baseline, concentrations of PYY had waned, and
unabsorbed lipolytic products had diminished and probably contacted only a portion of
distal bowel mucosa. For example, Castiglione and colleagues (Castiglione et al., 1998)
assessed the effect of 20 % Intralipid® on energy intake over different durations of
156

Load vs. duration of lipid Chapter 5
infusion (15 min (30 kcal), 45 min (90 kcal), or 90 min (180 kcal)) in healthy subjects
and found a reduction in energy intake only for the 45 min and 90 min infusions. In
contrast, in this study the 1.33/50 (67 kcal) and 4/50 (200 kcal) lipid infusions were
discontinued 100 min before the evaluation of energy intake, so that only the 1.33/150
(200 kcal) infusion, which ceased immediately before the meal, was comparable to the
90 min infusion in Castiglione’s study. Moreover, in this study there was no reduction
in energy intake after the 150 min infusion. This may reflect the higher rate of infusion
(2 kcal/min) used by Castiglione and colleagues (Castiglione et al., 1998) over a period
of time sufficient to permit caudal movement of digesting fat and lipase, thereby
exposing lipolytic products to a sufficient length of bowel to induce an effect on energy
intake (Meyer et al., 1998c). In contrast, in this study, lipolysis and absorption were
probably completed over a shorter length of small intestine during a slower lipid
infusion of 1.33/150. Higher loads of intraduodenal lipid (2 - 2.9 kcal/min) have been
shown to reduce hunger and suppress subsequent energy intake, even after shorter
infusion periods in healthy young (Feinle et al., 2003), old (Cook et al., 1997,
MacIntosh et al., 1999) and obese (Chapman et al., 1999) subjects.
Suppression of energy intake by small intestinal fat is likely mediated by combinations
of neural responses to luminal nutrients and nutrient-stimulated release of anorexogenic
peptides, including CCK, PYY, and GLP-1. Recently, it has been observed that energy
intake was not suppressed by increasing loads of duodenally infused lauric acid until the
rate of fatty acid entry was high enough to sustain a plasma level of CCK around 7.5
pmol/l (4 pmol/l above basal) (Little et al., 2005), substantially greater than the CCK
concentration at 150 min after the sustained 1.33/150 infusion. Thus, it is probable that
this study did not observe a reduction in energy intake after any of our infusions
157

Load vs. duration of lipid Chapter 5
because the potent effects of the short-duration, but high-dose, 4/50, infusion had
disappeared by 150 min, while the sustained 1.33/150 infusion was an impotent dose.
5.6 CONCLUSIONS
In summary, this study establishes that there are regional differences in the regulation of
APD motility and the release of CCK and PYY in response to small intestinal fat, as
demonstrated by altering the load, and duration, of intraduodenal lipid infusion. While
sustained exposure of the small intestine to lipid was associated with sustained
suppression of antral pressure waves, there was an attenuation in the stimulation of
pyloric pressures and plasma CCK, which may account for the absence of a significant
effect on energy intake.
158

Load of lipid Chapter 6
Chapter 6
LOAD-DEPENDENT EFFECTS OF DUODENAL LIPID ON
ANTROPYLORODUODENAL MOTILITY, PLASMA CCK
AND PYY, AND ENERGY INTAKE IN HEALTHY MEN
6.1 SUMMARY
Both the load and duration of small intestinal lipid infusion affect APD motility and
CCK and PYY release at loads comparable to, and higher than, the “normal” gastric
emptying rate. The effects of intraduodenal lipid loads well below the mean rate of
gastric emptying on (i) APD motility, CCK and PYY, and appetite and energy intake,
and (ii) the relationships with APD motility, CCK and PYY, appetite and energy intake,
were determined. 16 healthy males were studied on four occasions in double-blind,
randomised fashion. APD motility, plasma CCK and PYY, and appetite perceptions
were measured during 50 min intraduodenal lipid (Intralipid®) infusions at; (i) 0.25
(“IL0.25”), 1.5 (“IL1.5”) and 4 (“IL4”) kcal/min or, (iv) saline (“control”), after which
energy intake at a buffet meal was quantified. IL0.25 stimulated IPPWs and CCK
release, albeit transiently, and suppressed antral PWs, PWSs and hunger (P < 0.05), but
had no effect on basal pyloric pressure or PYY, when compared with control. Loads >
1.5 kcal/min were required for the stimulation of basal pyloric pressures and PYY and
159

Load of lipid Chapter 6
suppression of duodenal PWs (P < 0.05). All these effects were related to the lipid load
(r > 0.5 or < -0.5, P < 0.05). Only IL4 reduced energy intake ([kJ], control: 5388 � 257,
IL0.25: 5360 � 186, IL1.5: 5164 � 296, IL4: 4753 � 272*; *vs. control and IL0.25, P <
0.05). In conclusion, in healthy males the effects of intraduodenal lipid on APD
motility, plasma CCK and PYY, appetite and energy intake are load-dependent, and the
threshold-loads required to elicit responses vary for these parameters.
6.2 INTRODUCTION
The presence of fat in the small intestine is associated with a number of changes in
gastrointestinal function, including modulation of APD motility (specifically,
suppression of antral (Heddle et al., 1989) and duodenal (Andrews et al., 2001)
pressures and stimulation of IPPWs and basal pyloric pressure (Cook et al., 1997,
Heddle et al., 1989)), resulting in the modulation of gastric emptying (Heddle et al.,
1989) and gastrointestinal hormone secretion (MacIntosh et al., 1999), including CCK
from the proximal (Buffa et al., 1976), and PYY from the distal (Adrian et al., 1985),
small intestine. Small intestinal fat also has the capacity to suppress appetite and
energy intake (Chapman et al., 1999).
The effects of fat on gastrointestinal function and energy intake are dependent on fat
digestion (Feinle et al., 2001b, Feinle et al., 2003, Borovicka et al., 2000, Schwizer et
al., 1997a). On contact with sensors in the small intestine, lipolytic products, especially
fatty acids, stimulate gut hormone secretion, modulate gastrointestinal motility, and
suppress energy intake (Feinle et al., 2003, Little et al., 2005, Feltrin et al., 2004).
These responses depend on the load of lipid delivered to the small intestine (Feltrin et
160

Load of lipid Chapter 6
al., 2007, Chapter 5), as well as the region (Welch et al., 1988, Meyer et al., 1998b,
Meyer et al., 1998c), and length (Lin et al., 1990, Meyer et al., 1998b, Meyer et al.,
1998c) of small intestine contacted. The rate of postprandial gastric emptying of lipid is
highly variable, ranging from ~ 0.4 to 4.1 kcal/min in normal human subjects
(Edelbroek et al., 1992b, Kunz et al., 2005, Little et al., 2007, Meyer et al., 1996).
Much of this variability is accounted for by how thoroughly water-insoluble fat is
dispersed in meal contents along the antropyloric region. There is very little
information as to how triglycerides may evoke the above responses during digestion
after entering the small intestine over this range of caloric loads.
A recent study has suggested that suppression of energy intake may relate to changes in
APD motility, particularly that of the pylorus (Brennan et al., 2005). In healthy subjects
intravenous infusion of CCK (1.8 pmol/kg/min) markedly stimulated IPPWs and basal
pyloric pressures, which was associated with suppression of energy intake; while GLP-
1, in the dose used (0.9 pmol/kg/min), did not stimulate pyloric pressures or suppress
energy intake (Brennan et al., 2005). The association between nutrient-induced changes
in APD motility and energy intake has not been assessed.
The first aim of this study was, therefore, to evaluate the load-dependent effects of
intraduodenal lipid on APD motility, plasma CCK and PYY, and appetite and energy
intake. For this purpose, Intralipid® (the most commonly used triglyceride emulsion in
physiological studies of this kind) was infused into the duodenum at rates of 0.25, 1.5
and 4 kcal/min and the effects compared with those of a 0.9 % saline control infusion.
The doses selected, thus, encompassed the range of rates of gastric emptying of dietary
fat hitherto reported in humans (Edelbroek et al., 1992b, Kunz et al., 2005, Little et al.,
161

Load of lipid Chapter 6
2007, Meyer et al., 1996). The second aim was to determine potential relationships
between the effects of intraduodenal lipid on appetite and energy intake and those on
APD motility and plasma CCK and PYY.
6.3 SUBJECTS AND METHODS
6.3.1 Subjects
16 healthy males (age: 31 � 3 yrs; BMI: 23.8 � 0.5 kg/m2) were recruited according to
the guidelines described in Chapter 4.2.
6.3.2 Study outline
Each subject was studied on four occasions, each separated by 3 - 7 days, on which they
received, in randomised, double-blind fashion, an intraduodenal infusion of a lipid
emulsion, at (i) 0.25 kcal/min (“IL0.25”), (ii) 1.5 kcal/min (“IL1.5”), or (iii) 4 kcal/min
(“IL4”), or (iv) isotonic saline (“control”), each for 50 min. APD pressures, plasma
CCK and PYY concentrations, appetite and energy intake were evaluated.
6.3.3 Intraduodenal infusions
The intraduodenal lipid emulsion (10 % Intralipid®, 300 mOsmol/kg, 1.1 kcal/ml,
Baxter Healthcare Pty Ltd, Old Toongabbie, NSW, Australia) was administered as: 0.25
kcal/min, 1.5 kcal/min and 4 kcal/min. These rates were chosen to encompass loads
lower than the rate of normal gastric emptying (0.25 kcal/min), as well as loads
reflecting the lower to intermediate (1.5 kcal/min) and higher (4 kcal/min) rates
162

Load of lipid Chapter 6
observed during the postprandial time-course of gastric emptying (Meyer et al., 1996,
Little et al., 2007).
Lipid solutions were diluted with isotonic saline to achieve the specific loads, and all
infusions were administered at a rate of 4 ml/min, so that the total volume infused in all
study conditions was 200 ml (see Chapter 4.4.2.1). The infusions were prepared by an
investigator who was not otherwise involved in either the performance of the studies or
data analysis. During studies the infusion apparatus was covered at all times.
6.3.4 Protocol
Subjects attended the laboratory in the Discipline of Medicine at 0830 h after an
overnight fast (14 hours for solids, 12 hours for liquids). A manometric catheter was
positioned, as described in Chapter 4.5.1. An intravenous cannula was placed in a
forearm vein for blood sampling.
Once the manometric catheter was positioned correctly, fasting motility was monitored
until the occurrence of a phase III of the interdigestive MMC (Feltrin et al., 2004).
Immediately after cessation of the phase III (at t = -10 min), a baseline blood sample
was taken, and a VAS questionnaire, assessing appetite-related sensations and
gastrointestinal symptoms (Parker et al., 2004), was completed. At t = 0 min, during
phase I of the MMC, the duodenal infusion of lipid or saline commenced and continued
for 50 min. APD pressures were recorded during the 10 min baseline period (t = -10 - 0
min) and during the infusion period (t = 0 - 50 min). Throughout the infusion, 10 ml
blood samples were taken and VAS completed at 10 min intervals. At t = 50 min, the
163

Load of lipid Chapter 6
infusion was terminated, the subject immediately extubated, and then offered a cold,
buffet-style, meal (Feltrin et al., 2004). Each subject was given 30 min (i.e. t = 150 -
180 min) to consume the meal and instructed to eat until comfortably full. After the
meal, the intravenous cannula was removed, and the subject allowed to leave the
laboratory.
6.3.5 Measurements
6.3.5.1 Antropyloroduodenal pressures
APD pressures were assessed, and analysed for (i) number and amplitude of antral and
duodenal PWs, (ii) number and amplitude of IPPWs, (iii) basal pyloric pressure and
(iv) number and length of PWSs, as described in Chapter 4.5.1.
6.3.5.2 Plasma cholecystokinin and peptide YY concentrations
Blood sample collection and analysis of plasma CCK and PYY are described in
Chapters 4.5.7 and 4.5.8.
6.3.5.3 Appetite perceptions
Appetite perceptions (desire to eat, hunger, fullness, prospective consumption (‘how
much would you eat if given a meal now?’)) were rated on VAS, as described in
Chapter 4.5.5.2 (Parker et al., 2004). Nausea and bloating were also assessed (Chapter
4.5.5.2).
164

Load of lipid Chapter 6
6.3.5.4 Energy intake
Assessment of energy intake is described in Chapter 4.5.5.3.
6.3.6 Data and statistical analyses
Baseline values (“0”) were calculated as the mean values obtained between t = -10 - 0
min for the number and amplitude of IPPWs and antral and duodenal PWs, basal
pyloric pressures and PWSs, and at t = -10 and 0 min for plasma hormone
concentrations and VAS scores. The numbers of antral and duodenal PWs were
expressed as total numbers, whereas amplitudes and MI were expressed as mean values,
over the 50 min infusion (i.e. t = 0 - 50 min). Antral and duodenal MI were derived
using the equation, MI = natural logarithm [(sum of amplitudes x number of phasic
pressure waves) + 1] (Camilleri and Malagelada, 1984). Basal pyloric pressures and the
number and amplitude of IPPWs were expressed as means of 10 min periods over the
50 min infusion period. APD PWSs were expressed as the total number of PWs
spanning over two (1.5 - 3 cm), three (3 - 4.5 cm), ... , fifteen (21 - 22.5 cm) channels
during the 50 min infusion period. All motility and VAS data were expressed as
changes from baseline, whilst plasma CCK and PYY were expressed as absolute values.
The number, amplitude and MI of antral and duodenal PWs and the parameters
measured from the buffet meal (energy intake (kJ), amount eaten (g), macronutrient
distribution (%)) were analysed by one-way ANOVA. Basal pyloric pressure, the
number and amplitude of IPPWs, plasma concentrations of CCK and PYY and VAS
scores were analysed by repeated-measures ANOVA, with time and treatment as
factors. The total number of PWSs was analysed by repeated-measures ANOVA, with
165

Load of lipid Chapter 6
number and length (cm) as factors. Post-hoc paired comparisons, corrected for multiple
comparisons by Bonferroni’s correction, were performed if ANOVAs revealed
significant effects.
Correlations, corrected for repeated measures, were determined for (i) the total number
of antral and duodenal PWs and APD PWSs, mean amplitude and MI of antral and
duodenal PWs, area under the curve (AUCs; calculated using the trapezoidal rule) for
number and amplitude of IPPWs, basal pyloric pressures, plasma CCK and PYY and
appetite perception scores between t = 0 - 50 min, as well as energy intake and amount
eaten at the buffet meal, with the ln (natural logarithm) - transformed loads of lipid
administered and (ii) appetite perceptions and energy intake (and amount eaten) with
APD motility and plasma CCK and PYY, for both AUCs and values at t = 50 min,
using the method described by Bland and Altman (Bland and Altman, 1995). Only r
values > 0.5 were considered physiologically relevant. When correlations between the
above variables were found, multiple regression analysis was performed to establish
determinants of energy and food intake. Statistical significance was accepted at P <
0.05, and data are presented as means ± SEM.
6.4 RESULTS
All subjects tolerated the experimental conditions well. Baseline values for motility and
VAS data are given in Table 6.1. There were no differences between the four
experimental conditions.
166
Load of lipid Chapter 6
6.4.1 Antropyloroduodenal pressures
6.4.1.1 Antral pressure waves
IL0.25, IL1.5 and IL4 decreased the number of antral PWs when compared with control
(P < 0.05 for all), with no significant differences between the lipid treatments (Table
6.2). IL1.5 and IL4 decreased the amplitude and MI of antral PWs, when compared
with control and IL0.25 (P < 0.05 for all); there was no difference between control and
IL0.25 or between IL1.5 and IL4 (Table 6.2). There was an inverse relationship
between the number (r = -0.69, P < 0.05), amplitude (r = -0.81, P < 0.05) and MI (r = -
0.74, P = 0.05) of antral PWs with the load of lipid administered.
6.4.1.2 Pyloric pressures
6.4.1.2.1 Basal pressures
There was a treatment by time interaction for basal pyloric pressures (P < 0.001)
(Figure 6.1A). IL1.5 (P < 0.05) and IL4 (P < 0.001) stimulated basal pyloric pressure
between t = 10 - 50 min when compared with control. IL1.5 stimulated basal pyloric
pressure between t = 20 - 40 min (P < 0.05), and IL4 between t = 10 - 50 min (P <
0.01), when compared with IL0.25. IL4 stimulated basal pressure between t = 20 - 50
min when compared with IL1.5 (P < 0.01). There was no difference between control
and IL0.25. By the end of the infusion (i.e. t = 40 - 50 min) basal pyloric pressures had
returned to levels close to baseline for control, IL0.25 and IL1.5, however remained
elevated for IL4 (P < 0.01). There was a direct relationship between the AUC for basal
pyloric pressure with the load of lipid administered (r = 0.82, P < 0.05).
167

Load of lipid Chapter 6
6.4.1.2.2 Phasic pressures
There was a treatment by time interaction for the number of IPPWs (P < 0.001) (Figure
6.1B). IL0.25, IL1.5 and IL4 increased the number of IPPWs when compared with
control; IL0.25 between t = 0 - 20 min (P < 0.001), and IL1.5 (P < 0.01) and IL4 (P <
0.001) between t = 0 - 50 min. IL1.5 and IL4 increased the number of IPPWs when
compared with IL0.25; IL1.5 between t = 20 - 50 min (P < 0.01), and IL4 between t = 0
- 50 min (P < 0.05). IL4 increased the number of IPPWs when compared with IL1.5
between t = 20 - 50 min (P < 0.05). After t = 20 min, the number of IPPWs began to
slightly decline for IL1.5 and IL4, however, during IL0.25 the numbers were not
sustained and fell to values similar to control. There was a treatment by time interaction
for the amplitude of IPPWs (P < 0.05) (Figure 6.1C). IL0.25, IL1.5 and IL4 increased
the amplitude of IPPWs when compared with control; IL0.25 between t = 10 - 30 min
(P < 0.05), and IL1.5 (P < 0.05) and IL4 (P < 0.01) between t = 10 - 50 min. IL4
increased the amplitude of IPPWs between t = 20 - 50 min (P < 0.05) when compared
with IL0.25, and between t = 30 - 40 min when compared with IL1.5. There was no
difference between IL0.25 and IL1.5. There was a direct relationship between the AUC
for the number (r = 0.80, P < 0.001) and amplitude (r = 0.68, P < 0.05) of IPPWs with
the load of lipid administered.
6.4.1.3 Duodenal pressure waves
IL1.5 and IL4 decreased the number, amplitude and MI of duodenal PWs when
compared with control and IL0.25 (P < 0.05 for all), with no differences between
control and IL0.25, or between IL1.5 and IL4 (Table 6.2). There was an inverse
relationship between the number (r = -0.79, P < 0.0001), amplitude (r = -0.64, P <
168

Load of lipid Chapter 6
0.001) and MI (r = -0.67, P < 0.05) of duodenal PWs with the load of lipid
administered.
6.4.1.4 Pressure wave sequences
Only PWSs that spanned 2 - 6 channels (1.5 - 9 cm) were analysed statistically, as
PWSs spanning over 7 - 15 channels were infrequent (no/50 min; control, 6 ± 3; IL0.25,
3 ± 2; IL1.5, 2 ± 1; IL4, 1 ± 1).
There was a treatment by length interaction for the number of PWSs spanning two (1.5 -
3 cm), three (3 - 4.5 cm), four (4.5 - 6 cm), five (6 - 7.5 cm) and six (7.5 - 9 cm)
channels (P < 0.001) (Figure 6.2). IL0.25 decreased the number of PWSs that spanned
over two channels (P < 0.01), IL1.5 over two and three channels (P < 0.001) and IL4
over two to six channels (P < 0.05), when compared with control. IL1.5 decreased the
number of PWSs spanning over two to four channels (P < 0.05), and IL4 over two to
five channels (P < 0.05), when compared with IL0.25. IL4 decreased the number of
PWSs spanning two channels compared with IL1.5 (P < 0.05). There was an inverse
relationship between the total number of PWSs with the load of lipid administered (r = -
0.80, P < 0.001).
6.4.2 Plasma hormone concentrations
6.4.2.1 Cholecystokinin
There was a treatment by time interaction for plasma CCK concentrations (P < 0.001)
(Figure 6.3A). Plasma CCK rapidly increased during all lipid infusions, after which
169

Load of lipid Chapter 6
levels plateaued for IL1.5 and IL4, and decreased to baseline values by t = 30 min for
IL0.25. IL0.25, IL1.5 and IL4 increased plasma CCK when compared with control;
IL0.25 between t = 10 - 20 min (P < 0.05) and IL1.5 (P < 0.01) and IL4 (P < 0.001)
between t = 10 - 50 min. IL1.5 (P < 0.05) and IL4 (P < 0.01) increased plasma CCK
between t = 10 - 50 min when compared with IL0.25, and IL4 between t = 20 - 50 min
when compared with IL1.5 (P < 0.01). There was a direct relationship between the
AUC for plasma CCK concentrations with the load of lipid (r = 0.96, P < 0.001).
6.4.2.2 Peptide YY
There was a treatment by time interaction for plasma PYY concentrations (P < 0.001)
(Figure 6.3B). There was an ongoing rise in PYY in response to IL1.5 and IL4. IL1.5
and IL4 increased plasma PYY when compared with control and IL0.25; IL1.5 between
t = 10 - 50 min (P < 0.05, for both) and IL4 between t = 20 - 50 min (P < 0.001, for
both). IL4 increased plasma PYY when compared with IL1.5 between t = 30 - 50 min
(P < 0.01). There was no difference between control and IL0.25. There was a direct
relationship between the AUC for plasma PYY concentrations and the load of lipid (r =
0.91, P < 0.001).
6.4.3 Appetite perceptions
There was a treatment by time interaction for hunger (P < 0.001) (Figure 6.4A).
Hunger was less during IL0.25 between t = 30 - 50 min (P < 0.05) and during IL1.5 and
IL4 between t = 20 - 50 min (P < 0.05 for both), when compared with control, during
which hunger increased progressively throughout the infusion period. IL4 decreased
hunger at t = 40 and 50 min when compared with IL0.25, and at t = 50 min when
170

Load of lipid Chapter 6
compared with IL1.5 (P < 0.05 for both). There was no difference between IL0.25 and
IL1.5. There was no effect of treatment on scores of fullness (data not shown). There
was a treatment by time interaction for nausea (P = 0.05) (Figure 6.4B). Although
scores were very low, IL4 increased nausea between t = 30 - 50 min, when compared
with control, IL0.25 and IL1.5 (P < 0.01 for all). During IL1.5 nausea was increased at
t = 50 min when compared with IL0.25 (P < 0.05). There were no differences between
control and IL0.25 or IL1.5. There was no effect of treatment on scores of bloating
(data not shown). There were no significant relationships between hunger or nausea
with the load of lipid.
6.4.4 Energy intake
There was an effect of treatment on the energy (kJ) and amount (g) (Table 6.2)
consumed at the buffet meal (P < 0.05). IL4 reduced the energy and amount of food
consumed when compared with control (P < 0.01) and IL0.25 (P < 0.05). There were
no differences between control, IL0.25 and IL1.5, or between IL1.5 and IL4. There was
no difference in the macronutrient distribution between the four experimental conditions
(Table 6.2). There was an inverse relationship between the energy (r = -0.63, P < 0.05)
and amount (r = -0.61, P < 0.05) consumed at the buffet meal with the load of lipid
administered.
171

Load of lipid Chapter 6
6.4.5 Relations of antropyloroduodenal motility and plasma
cholecystokinin and peptide YY with appetite perceptions and
energy intake
6.4.5.1 Relationships between antropyloroduodenal motility with appetite
perceptions, energy intake and amount eaten
There were no significant relationships between antral and duodenal PWs, and the AUC
for basal pyloric pressure, IPPWs or PWSs with energy intake. There were direct
relationships between the amount eaten with the number (r = 0.42, P < 0.05) and
amplitude (r = 0.54, P < 0.05) of antral PWs, and an inverse relationship with the
number of IPPWs (r = -0.56, P < 0.05). There were direct relationships between the
number (r = 0.57, P < 0.05) and MI (r = 0.55, P < 0.05) of duodenal PWs and PWSs (r =
0.58, P < 0.05) with scores for hunger. There were no relationships between antral and
duodenal PWs, basal pyloric pressure, IPPWs or PWSs with scores for fullness, nausea
or bloating.
6.4.5.2 Relationships between plasma cholecystokinin and peptide YY with
appetite perceptions, energy intake and amount eaten
There were inverse relationships between energy intake with AUC (r = -0.63, P < 0.01)
and the values at t = 50 min (r = -0.61, P < 0.01) for plasma CCK and AUC (r = -0.50, P
< 0.05) and the values at t = 50 min (r = -0.62, P < 0.05) for plasma PYY. There were
inverse relationships between the amount eaten with AUC (r = -0.60, P < 0.001) and
values at t = 50 min (r = -0.58, P < 0.01) for CCK and AUC (r = -0.52, P < 0.01) and
values at t = 50 min (r = -0.62, P < 0.01) for plasma PYY. There was an inverse
relationship between hunger (r = -0.49, P < 0.05) and a direct relationship between
172

Load of lipid Chapter 6
nausea (r = 0.55, P < 0.05) scores with plasma CCK. There were no correlations
between appetite perceptions with PYY concentrations.
6.4.5.3 Relationships between appetite perceptions with energy intake
There was a direct relationship between hunger scores with energy intake (r = 0.51, P =
0.07) and the amount eaten (r = 0.51, P < 0.05). There were no significant relationships
between fullness, nausea or bloating scores with either energy intake or the amount
eaten at the buffet meal.
6.4.5.4 Relationships between antropyloroduodenal motility with plasma
cholecystokinin and peptide YY
There were inverse relationships between the number (r = -0.64, P < 0.05) and
amplitude (r = -0.64, P < 0.05) of antral PWs, the number (r = -0.70, P < 0.001) and
amplitude (r = -0.54. P < 0.001) of duodenal PWs and the number of APD PWSs (r = -
0.72, P < 0.001), and direct relationships between the number (r = 0.82, P < 0.001) and
amplitude (r = 0.65, P < 0.01) of IPPW and basal pyloric tone (r = 0.75, P < 0.05), with
the AUC for plasma CCK. There were inverse relationships between the number (r = -
0.61, P < 0.001) and amplitude (r = -0.59, P < 0.05) of antral PWs, the number (r = -
0.68, P < 0.001) of duodenal PWs and the number of APD PWSs (r = -0.57, P < 0.001),
and direct relationships between the number (r = 0.80, P < 0.01) and amplitude (r =
0.68, P < 0.05) of IPPWs, with the AUC for plasma PYY.
173

Load of lipid Chapter 6
6.4.5.5 Relationships between plasma peptide YY with plasma cholecystokinin
There was a direct relationship between plasma PYY with plasma CCK (r = 0.89, P <
0.001).
6.4.6 Predictors of energy intake
Multiple regression analysis of the combined data for CCK and PYY identified CCK
concentrations at t = 50 min as an independent predictor of energy intake (� = -128.148,
P < 0.05), but not the amount eaten. For the combined data of the number and
amplitude of antral PWs and the number of IPPWs, multiple regression analysis
identified the AUC for the number of IPPWs as an independent predictor of the amount
eaten (� = -0.467, P < 0.01).
174

Load of lipid Chapter 6
Figure 6.1 Effects of intraduodenal infusion, between t = 0 - 50 min, of Intralipid® at 0.25 (�)
(“IL0.25”), 1.5 ( ) (“IL1.5”) and 4 (�) (“IL4”) kcal/min, or saline ( ) (“control”), on (A) basal pyloric pressure, * vs. control; P < 0.05, # vs. IL0.25; P < 0.05, § vs. IL1.5; P < 0.01. (B) number of isolated pyloric pressure waves (IPPWs), * vs. control; P < 0.01, # vs. IL0.25; P < 0 .05, § IL1.5; P < 0.05, and (C) amplitude of IPPWs, * vs. control, # vs. IL0.25, § IL1.5; P < 0.05. Data are means � SEM (n = 16).
175

Load of lipid Chapter 6
Figure 6.2 Effects of intraduodenal infusion, between t = 0 - 50 min, of Intralipid® at 0.25 (“IL0.25”), 1.5 (“IL1.5”) and 4 (“IL4”) kcal/min, or saline (“control”), on pressure wave sequences, * vs. control, # vs. IL0.25, § vs. IL1.5; P < 0.05. Data are means � SEM (n = 16).
176

Load of lipid Chapter 6
Figure 6.3 Effects of intraduodenal infusion, between t = 0 - 50 min, of Intralipid® at 0.25 (�) (“IL0.25”), 1.5 ( ) (“IL1.5”) and 4 (�) (“IL4”) kcal/min, or saline ( ) (“control”), on plasma concentrations of (A) cholecystokinin, * vs. control; P < 0.05, # vs. IL0.25; P < 0.05, § vs. IL1.5; P < 0.01, and (B) peptide YY, * vs. control; P < 0.05, # vs. IL0.25; P < 0.05, § IL4 vs. IL1.5; P < 0.01. Data are means � SEM (n = 16).
177

Load of lipid Chapter 6
Figure 6.4 Effects of intraduodenal infusion, between t = 0 - 50 min, of Intralipid® at 0.25 (�) (“IL0.25”), 1.5 ( ) (“IL1.5”) and 4 (�) (“IL4”) kcal/min, or saline ( ) (“control”), on perceptions of (A) hunger, * vs. control; P < 0.05, # vs. IL0.25; P < 0.05, § vs. IL1.5; P < 0.001, and (B) nausea, * vs. control, # vs. IL0.25, § vs. IL1.5; P < 0.05. Data are means � SEM (n = 16).
178

Load of lipid Chapter 6
Table 6.1 Baseline values for antral and duodenal pressure waves, basal pyloric
pressure, number and amplitude of isolated pyloric pressure waves,
hunger, fullness, nausea and bloating, i.e. before commencement of
intraduodenal infusions of 10% Intralipid® or saline.
Saline(control) IL0.25
IntralipidIL1.5 IL4
Antral PWs
Number 2 � 1 5 � 2 5 � 1 3 � 1
Amplitude (mmHg) 7 � 2 11 � 2 9 � 2 7 � 2
Motility index (mmHg) 2 � 1 3 � 1 3 � 1 2 � 1
Duodenal PWs
Number 29 � 6 38 � 9 35 � 7 29 � 6
Amplitude (mmHg) 17 � 2 17 � 2 18 � 2 16 � 1
Motility index (mmHg) 5 � 0 6 � 0 6 � 0 5 � 0
Pyloric pressures
Basal (mmHg) 2 � 4 -3 � 1 -1 � 3 -1 � 2
No of IPPWs 1 � 0 1 � 0 1 � 1 1 � 0
Amplitude of IPPW (mmHg) 5 � 3 8 � 4 8 � 4 6 � 3
VAS
Hunger (mm) 48 � 7 52 � 7 54 � 7 51 � 7
Fullness (mm) 10 � 4 7 � 2 7 � 2 9 � 3
Nausea (mm) 7 � 2 9 � 3 6 � 2 8 � 3
Bloating (mm) 4 � 1 8 � 2 8 � 3 5 � 2
Data are means � SEM (n = 16). IPPWs, isolated pyloric pressure waves; PWs, pressure waves; VAS, visual analogue scales; IL0.25, 0.25 kcal/min; IL1.5, 1.5 kcal/min; IL4, 4 kcal/min.
179

Load of lipid Chapter 6
Table 6.2 Mean values for antral and duodenal pressure waves during
intraduodenal infusion of 10 % Intralipid and saline, and energy intake,
amount eaten and % macronutrient distribution at the buffet meal.
Saline(control) IL0.25
IntralipidIL1.5 IL4
P value(ANOVA)
Antral PWs
Number/50 min 51 � 12 29 � 8* 9 � 3* 10 � 5* < 0.001
Amplitude (mmHg)
22 � 5 26 � 9 4 � 2*# 8 � 3*# < 0.05
MI (mmHg) 4 � 1 3 � 1 1 � 1*# 1 � 1*# < 0.01
Duodenal PWs
Number/50 min 329 � 32 317 � 32 207 � 34*# 133 � 21*# < 0.001
Amplitude (mmHg)
13 � 2 16 � 3 5 � 2*# 7 � 2*# < 0.01
MI (mmHg) 5 � 0 5 � 1 3 � 1*# 3 � 0*# < 0.01
Food intake
Energy (kJ) 5388 � 257 5360 � 186 5164 � 296 4753 � 272*# < 0.05
Amount (g) 1425 � 101 1371 � 95 1327 � 111 1231 � 109*# < 0.05
% kJ from fat 35 � 1 34 � 2 35 � 1 35 � 1 NS
% kJ from CHO 43 � 1 42 � 2 41 � 2 43 � 1 NS
% kJ from protein 23 � 1 24 � 1 23 � 1 23 � 1 NS
Data are means � SEM (n = 16). CHO, carbohydrate; MI, motility index; NS, not significant; PWs, pressure waves; IL0.25, 0.25 kcal/min; IL1.5, 1.5 kcal/min; IL4, 4 kcal/min. Significant differences: * from control, # from IL0.25.
180

Load of lipid Chapter 6
6.5 DISCUSSION
This study has demonstrated for the first time that duodenal lipid loads as low as 0.25
kcal/min are able to stimulate IPPWs and CCK release and suppress antral PWs, APD
PWSs and hunger in healthy subjects, while higher loads were required for the
stimulation of basal pyloric pressure, PYY release and the suppression of duodenal
pressures and energy intake. The effects of duodenal lipid on energy intake/amount of
food eaten were related to the release of CCK and stimulation of IPPWs.
In this study the effects of intraduodenal lipid at loads that encompass rates below,
similar to, and above, the normal range of gastric emptying were evaluated and
demonstrated a load-dependent suppression of antral and duodenal, and stimulation of
pyloric, motility. Duodenal lipid loads between 1 - 4 kcal/min are known to stimulate
pyloric pressures and suppress antral and duodenal PWs (Heddle et al., 1989, Heddle et
al., 1988a, Chapter 5). This study has now demonstrated that lipid loads below the
normal range of gastric emptying (0.25 kcal/min) also have the capacity to stimulate
IPPWs and suppress antral PWs and APD PWSs. At higher loads (IL1.5 and IL4),
hydrolysis takes longer to complete, resulting, as shown in previous studies (Lin et al.,
1996, Meyer et al., 1998c, Meyer et al., 1998a), in the digestion process and lipolytic
products being distributed further downstream, where more chemo-sensors are
contacted, inducing a greater inhibitory response on gastric emptying, as reflected in the
observed effects on APD motility with the larger lipid loads. This concept is supported
by a study in dogs, which demonstrated that the magnitude of feedback inhibition of
gastric emptying is dependent on the length of the gut exposed to lipid (Lin et al.,
1990).
181

Load of lipid Chapter 6
The data also confirm the findings in Chapter 5 of regional differences between antrum,
pylorus and duodenum in relation to the load of lipid required to stimulate a response.
In this study, while the lowest load (0.25 kcal/min) was sufficient to suppress antral
PWs and APD PWSs and temporarily stimulate IPPWs, higher loads (� 1.5 kcal/min)
were required to stimulate basal pyloric pressure and suppress duodenal PWs,
suggesting that the mechanisms that regulate duodenal pressures are less sensitive to
lipid than those of the antrum and pylorus.
It has been established that there is a load-dependent stimulation of CCK (Feinle et al.,
2000, Chapter 5) and PYY (Chapter 5) in response to increasing small intestinal lipid
loads. In this study, the lowest load (0.25 kcal/min) stimulated CCK release during the
first 20 min of infusion, but did not stimulate PYY. The CCK response to 0.25
kcal/min, however, was not sustained, presumably because the lipolytic products of this
small load would have been rapidly digested and absorbed. This may also account for
the lack of an increase in PYY during the 0.25 kcal/min infusion, as lipolytic products
would not have reached the distal part of the small intestine to directly stimulate PYY
secretion. While CCK is known to indirectly stimulate PYY, the data suggest that a
certain amount/concentration of CCK is required, confirming previous findings of a
lack of PYY release during perfusion of free fatty acids into the first 45 cm of canine
small intestine (Aponte et al., 1985). With the higher loads (1.5 kcal/min and 4
kcal/min) plasma PYY increased more slowly, and progressively, than CCK, in that,
while plasma CCK peaked within 20 min and then plateaued, plasma PYY continued to
rise until the cessation of the infusion. These results are consistent with the release of
CCK from I cells located in the proximal small intestine (Buffa et al., 1976) and the
release of PYY from L cells located in the distal small intestine (Adrian et al., 1985).
182

Load of lipid Chapter 6
The substantial increase in CCK during IL1.5 and IL4, but not IL0.25, within 10 min of
the infusion is, therefore, likely to have contributed to the initial rise in PYY. In
contrast, towards the end of infusion, particularly with the highest load (4 kcal/min),
lipid would have most likely reached the more distal parts of the small intestine
(although it should be recognised that this was not measured in this study), stimulating a
greater release of PYY by direct nutrient contact with PYY releasing cells (Adrian et
al., 1985).
This is the first study to assess the effect of very low and relatively high loads of lipid
on energy intake. A similar study was conducted, in which 20 % Intralipid® was
infused at a constant rate (2 kcal/min) over different durations, and a reduction in
energy intake was observed after 45 min (90 kcal) and 90 min (180 kcal), but not 15
min (30 kcal), infusions (Castiglione et al., 1998). In this study, only IL4 (200 kcal)
reduced energy intake. Taken together these observations indicate that loads greater
than 1.5 kcal/min for 50 min (75 kcal), but less than 2 kcal/min for 45 min (90 kcal)
(Castiglione et al., 1998), represent the minimum required to reduce energy intake,
raising the question as to whether load, rate and/or duration of small intestinal lipid is
responsible for the reduction in energy intake. As reported in Chapter 5, duodenal
infusion of 10 % Intralipid at 1.33 kcal/min for 150 min, which also yields 200 kcal, is
insufficient to reduce energy intake in healthy subjects. During this slower infusion,
lipolysis and absorption may well have been completed over a shorter length of small
intestine, which may account for the absence of any effect of loads at 0.25 kcal/min and
1.5 kcal/min on energy intake in the present study. As the load of 1.5 kcal/min is
considered similar to “average” gastric emptying, the data may also suggest that, if the
duration of infusion was longer, plasma PYY may have continued to rise (to a specific
183

Load of lipid Chapter 6
threshold), to have an effect on energy intake. It is important to recognise that, unlike
duodenal infusions, gastric emptying of fat is not a steady process, but rather, is usually
more rapid early after a meal, slowing later, and presumably predominantly pulsatile,
rather than continuous (Malbert and Ruckebusch, 1989), a pattern that is likely to result
in a different distribution of free fatty acids along the gut.
It is well documented that gastrointestinal hormones, particularly CCK and PYY,
mediate, at least in part, the modulation of gastrointestinal motility by lipid (Fraser et
al., 1993, Brennan et al., 2005, Savage et al., 1987, Katschinski et al., 1996), and this
study has demonstrated positive correlations between pyloric pressures, and negative
correlations between antral and duodenal PWs and APD PWSs, with CCK and PYY.
Interestingly, only concentrations of CCK and PYY, but not APD motility, were
significantly correlated with energy intake. However, there were correlations between
the amount of food eaten at the buffet meal with motility, suggesting that different
mechanisms may be responsible for the regulation of food intake vs. energy intake.
Previous studies have suggested that the stimulation of the pylorus may have a critical
involvement in the suppression of energy intake (Brennan et al., 2005, Xu et al., 2005),
however, these studies did not directly assess the effects of nutrient-induced stimulation
of pyloric pressures. Intravenous infusions of CCK and PYY have been shown to
decrease hunger perceptions and suppress energy intake in humans (Brennan et al.,
2005, Batterham et al., 2002), although it is important to recognise that the effects of
exogenous PYY relate specifically to PYY(3-36) (Batterham et al., 2002).
Nevertheless, in this study the substantial increase in plasma CCK and PYY, as well as
pyloric pressures, which were all significantly greater during IL4 infusion compared
with the other lipid infusions, may have contributed to the decrease in energy intake, in
184

Load of lipid Chapter 6
that the sum of the various parameters may have reached a critical threshold to result in
the decrease in energy intake. There was a slight increase in nausea during IL4 before
the buffet meal, however, mean scores were very low, and no subject actually reported
nausea. Moreover, there was no correlation between nausea scores with energy intake.
6.6 CONCLUSIONS
This study establishes that intraduodenal lipid at loads that encompass rates below,
similar to, and above normal gastric emptying, suppress antral and duodenal PWs, APD
PWSs, appetite and energy intake and stimulate basal pyloric pressure, IPPWs, plasma
CCK and PYY, in a load-dependent manner. While loads as low as 0.25 kcal/min
modulate antral and pyloric pressures and transiently increase plasma CCK, higher
loads (1.5 and 4 kcal/min) have greater effects and are required for stimulation of PYY,
and only the highest load suppresses energy intake. Presumably, at the higher loads,
lipid was distributed further along the small intestine, stimulating more chemosensors
and, thus, providing greater feedback inhibition/stimulation.
These observations may have implications for our understanding of conditions
associated with altered gastrointestinal function in response to consumption of high-
caloric diets (Boyd et al., 2003, Castiglione et al., 2002), such as in obesity. The few
studies that have compared gastric motility and hormone release between obese and
healthy lean subjects have produced inconsistent observations (Tosetti et al., 1996,
Maddox et al., 1989). Individuals habitually consuming high-caloric diets may well be
less sensitive to nutrient stimuli and, therefore, it is reasonable to assume that higher
loads may be required to induce similar responses to those demonstrated in the current
185

Load of lipid Chapter 6
study. It would, accordingly, be of interest to compare the thresholds required for the
stimulation, or suppression of gastric motility, hormone release, appetite and energy
intake in lean and obese subjects.
186

Load of glucose Chapter 7
Chapter 7
LOAD-DEPENDENT EFFECTS OF DUODENAL
GLUCOSE ON GLYCAEMIA, GASTROINTESTINAL
HORMONES, ANTROPYLORODUODENAL MOTILITY
AND ENERGY INTAKE IN HEALTHY MEN
7.1 SUMMARY
Gastric emptying is a major determinant of glycaemia, gastrointestinal hormone release
and appetite. The aim of this study was to determine the effects of different
intraduodenal glucose loads on glycaemia, insulinaemia, plasma GLP-1, GIP and CCK,
APD motility and energy intake in healthy subjects. Blood glucose, plasma hormone
and APD motor responses to 120 min intraduodenal infusions of glucose at (i) 1
(“G1”), (ii) 2 (“G2”), and (iii) 4 (“G4”) kcal/min, or (iv) saline (“control”) were
measured in 10 healthy males in double-blind, randomised fashion. Immediately after
each infusion energy intake at a buffet meal was quantified. Blood glucose rose in
response to all glucose infusions (P < 0.05 vs. control), with the effect of G4 and G2
being greater than that of G1 (P < 0.05), but with no difference between G2 and G4.
The rises in insulin, GLP-1, GIP and CCK were related to the glucose load (r > 0.82, P
< 0.05). All glucose infusions suppressed antral PWs (P < 0.05), but only G4 decreased
187

Load of glucose Chapter 7
duodenal PWs (P < 0.01), resulted in a sustained stimulation of basal pyloric pressure
(P < 0.01) and decreased energy intake (P < 0.05). In conclusion, variations in
duodenal glucose loads have differential effects on blood glucose, plasma insulin, GLP-
1, GIP and CCK, APD motility and energy intake in healthy subjects. These
observations have implications for strategies to minimise postprandial glycaemic
excursions in type-2 diabetes.
7.2 INTRODUCTION
The rate of gastric emptying of carbohydrate, particularly glucose, has an impact on
glycaemia (Horowitz et al., 1993), appetite (Cook et al., 1997, Lavin et al., 1996) and
energy intake (Lavin et al., 1998). In healthy subjects, glucose solutions are known to
empty from the stomach in an overall linear rate of ~ 2 - 3 kcal/min (Horowitz et al.,
1996); this tight regulation results primarily from a length-dependent feedback arising
from the small intestine (Lin et al., 1989), which in turn modulates APD motility and is
associated with the release of a number of gastrointestinal hormones, including CCK
(Liddle et al., 1985) and the incretin hormones, GLP-1 and GIP (Lavin et al., 1998,
O'Donovan et al., 2004, Schirra et al., 1996). The relationships of glycaemia, hormone
release and changes in gastric motility with the duodenal glucose load, particularly the
time-course of these effects, are poorly defined.
The rate of gastric emptying is a major determinant of the glycaemic response to a meal
- even relatively minor changes in small intestinal glucose delivery may have major
effects on glycaemic and insulinaemic responses in healthy subjects (Chaikomin et al.,
2005) and non-insulin treated type-2 diabetics (O'Donovan et al., 2004). In type-1
188

Load of glucose Chapter 7
diabetes the initial postprandial insulin requirement is less when gastric emptying is
slower (Ishii et al., 1994, Ohlsson et al., 2006). These observations have substantial
implications for dietary and pharmacological strategies to minimise postprandial
glycaemic excursion in diabetes (Rayner et al., 2001) and, thereby, reduce the risk of
micro- (Ceriello, 1998) and macrovascular (Saydah et al., 2001) complications. Hence,
it is important to define the relationship between glycaemic and insulinaemic responses
with enteral glucose delivery. The secretion of GLP-1 and GIP accounts for ~ 50 % of
the insulin response to oral glucose in healthy subjects (Nauck et al., 2004). It has been
suggested that a threshold of small intestinal glucose delivery of about 1.8 kcal/min
needs to be exceeded in order to stimulate GLP-1 release (Schirra et al., 1996).
However, this observation is inconsistent with two recent studies, which have
demonstrated that duodenal glucose infusion at 1 kcal/min was sufficient for the, albeit
transient, stimulation of GLP-1 in healthy subjects and type-2 patients (O'Donovan et
al., 2004, Chaikomin et al., 2005). In contrast, there is evidence that the release of GIP
is load-dependent; however, the load that elicits the maximum response is not known
(O'Donovan et al., 2004, Chaikomin et al., 2005). The presence of glucose in the
proximal small intestine also stimulates the release of CCK (Little et al., 2006a),
although this response is less marked than that to protein or fat (Liddle et al., 1985).
Whether the release of CCK by glucose is load-dependent remains to be determined.
The slowing of gastric emptying by glucose in the small intestine is associated with
suppression of antral and duodenal PWs and stimulation of phasic and tonic pressures
localised to the pylorus (Heddle et al., 1988c, Edelbroek et al., 1992a). Studies in
animals indicate that small intestinal feedback on gastric emptying is load-, but not
concentration-, dependent (Lin et al., 1989). In humans, intraduodenal infusions of
189

Load of glucose Chapter 7
glucose at 2.4 kcal/min and 4 kcal/min for 10 min stimulate phasic pressure waves
localised to the pylorus and increase basal pyloric pressure, with a greater response to 4
kcal/min, indicative of load-dependence (Heddle et al., 1988c). However, in another
study, duodenal infusion of glucose at 2.4 kcal/min for 120 min increased the number
of IPPWs and basal pyloric pressure during the first 20 min, but after this time there
was a decrease, with a subsequent return to baseline (Edelbroek et al., 1992a),
suggesting that there may be “adaptation” in the pyloric motor response during more
sustained small intestinal glucose exposure. In contrast, antral PWs remained
suppressed throughout the glucose infusion (Edelbroek et al., 1992a). The effects of
enteral glucose on gastric motility may also be secondary to the consequent rise in
blood glucose - acute hyperglycaemia (blood glucose 12 - 16 mmol/l) is associated with
suppression of antral waves (Hasler et al., 1995) and stimulation of pyloric contractions
(Fraser et al., 1991b). Changes in blood glucose that are within the normal postprandial
range also affect gastrointestinal motility and gastric emptying (Schvarcz et al., 1997,
Hasler et al., 1995).
Perceptions of appetite and energy intake are suppressed by small intestinal infusion of
glucose in young, obese, and healthy older subjects (Cook et al., 1997, Lavin et al.,
1998, Chapman et al., 1999). These effects may relate to the release of CCK and GLP-
1 (Kissileff et al., 1981, Verdich et al., 2001a). It has recently been suggested that the
suppression of energy intake may relate to changes in APD motility, particularly that of
the pylorus (Brennan et al., 2005, Xu et al., 2005). In a recent study, intravenous
infusion of CCK was shown to markedly stimulate IPPWs and basal pyloric pressures,
and this was associated with suppression of energy intake; while GLP-1, at least in the
dose used, failed to suppress energy intake, or stimulate pyloric pressures (Brennan et
190

Load of glucose Chapter 7
al., 2005). A further study in animals also supports the concept that the stimulation of
pyloric motility may, per se, reduce energy intake (Xu et al., 2005). - It is not known
whether the effects of enteral glucose on energy intake and APD motility are related,
nor whether the suppression of energy intake by glucose is load-dependent in humans.
The aims of this study were to evaluate, in healthy subjects, the effects of different
intraduodenal glucose loads on glycaemia, insulin, incretin and CCK release, APD
motility and energy intake, as well as the relationships between these parameters. It
was hypothesised that: (i) the effects of intraduodenal infusion of glucose at loads
lower than (1 kcal/min), comparable to (2 kcal/min) and higher than (4 kcal/min) the
rate of normal gastric emptying on these parameters would be load-dependent (and in
the case of GLP-1 be evident early) and (ii) the effects of small intestinal glucose on
energy intake would be related to those on APD motility.
7.3 SUBJECTS AND METHODS
7.3.1 Subjects
10 healthy males (age: 32 � 4 yrs; BMI: 25.1 � 0.4 kg/m2) were recruited according to
guidelines described in Chapter 4.2.
7.3.2 Study outline
Each subject was studied on four occasions, each separated by 3 - 7 days, on which
they received, in randomised, double-blind fashion, an intraduodenal infusion of a 25 %
glucose (1390 mosmol/L) solution, at (i) 1 kcal/min (“G1”), (ii) 2 kcal/min (“G2”), or
191

Load of glucose Chapter 7
(iii) 4 kcal/min (“G4”), or (iv) intraduodenal hypertonic (4.2 %, 1390 mosmol/L) saline
(“control”), for 120 min. Blood glucose, plasma insulin, GLP-1, GIP and CCK, APD
pressures and energy intake were evaluated.
7.3.3 Intraduodenal infusions
The intraduodenal glucose infusion was administered as: (i) 1 kcal/min, (ii) 2 kcal/min
and (iii) 4 kcal/min, for 120 min. The intraduodenal glucose solutions were prepared
by dissolving glucose powder (Glucodin, Boots Healthcare, North Ryde, NSW,
Australia) in distilled water and diluting with hypertonic saline to achieve the specific
loads. Thus, all infusions had a concentration of 1390 mosmol/l and were administered
at a rate of 4 ml/min, so that the total volume infused was 480 ml in all study conditions
(Chapter 4.4.2.2). The infusions were prepared by an investigator who was not
otherwise involved in either the performance of the studies or data analysis. During
studies the infusion apparatus was covered at all times.
7.3.4 Protocol
Each subject attended the laboratory in the Discipline of Medicine at 0830 h after an
overnight fast (14 hours for solids, 12 hours for liquids). A manometric catheter was
positioned, as described in Chapter 4.5.1. An intravenous cannula was placed in a
forearm vein for blood sampling.
Once the manometric catheter was positioned correctly, fasting motility was monitored
until the occurrence of a phase III of the interdigestive MMC (Feltrin et al., 2004).
Immediately after the cessation of phase III activity (at t = -15 min), a baseline blood
192

Load of glucose Chapter 7
sample was taken. At t = 0 min, during phase I of the MMC (Feltrin et al., 2004), the
intraduodenal infusion commenced and was continued for 120 min. APD pressures
were recorded during the 15 min baseline period (i.e. t = -15 - 0 min) and the infusion
period (i.e. t = 0 - 120 min). Blood samples were taken at 15 min intervals between t =
0 - 60 min, and then at 30 min intervals between t = 60 - 120 min. At t = 120 min, the
infusion was terminated and the manometric catheter removed. Each subject was then
presented with a standard, cold, buffet-style meal and allowed 30 min (i.e. t = 120 - 150
min) to eat freely until they were comfortably full (Feltrin et al., 2004). Further blood
samples were taken at t = 150 min and 180 min. At t = 180 min the intravenous
cannula was removed and the subject allowed to leave the laboratory.
7.3.5 Measurements
7.3.5.1 Blood glucose, plasma insulin, glucagon-like peptide-1, glucose-
dependent insulinotropic polypeptide and cholecystokinin
concentrations
Blood sample collection and analysis of blood glucose, plasma insulin, GLP-1, GIP and
CCK are described in Chapters 4.5.7 and 4.5.8.
7.3.5.2 Antropyloroduodenal pressures
APD pressures were assessed, and analysed for (i) number and amplitude of antral and
duodenal PWs, (ii) number and amplitude of isolated IPPWs, (iii) basal pyloric pressure
and (iv) number and length of pressure wave sequences PWSs, as described in Chapter
4.5.1.
193

Load of glucose Chapter 7
7.3.5.3 Energy intake
Assessment of energy intake is described in Chapter 4.5.5.3.
7.3.6 Statistical analysis
Baseline values (“0”) were calculated as the total values obtained for the number of
IPPWs, antral and duodenal PWs and PWSs, and the mean values obtained for
amplitude of IPPWs, antral and duodenal PWs and basal pyloric pressure, between t = -
15 - 0 min, and the mean values for plasma hormone concentrations at t = -15 and 0
min. Antral and duodenal PWs were expressed as total numbers in all six antral, and all
seven duodenal, side-holes, respectively. Basal pyloric pressures and number and
amplitude of IPPWs were expressed as the mean of 15 min periods over the 120 min
infusion period. APD PWSs were expressed as the total number of PWs spanning over
two (1.5 - 3 cm), three (3 - 4.5 cm), ... , fifteen (21 - 22.5 cm) channels during the 120
min infusion period. All motility data were expressed as changes from baseline, whilst
blood glucose and plasma insulin, GLP-1, GIP, and CCK were expressed as absolute
values. Blood glucose and plasma hormone data were evaluated, a priori, for two time
periods; t = 0 - 120 min (“entire infusion” period) and t = 120 - 180 min (“post-meal”
period). For GLP-1 an additional period from t = 0 - 30 min was evaluated, to define
the “early response” (O'Donovan et al., 2004, Chaikomin et al., 2005). Peak hormone
concentrations and the times at which they occurred were calculated by determining the
highest concentration and its timing in each subject. The AUC for hormone
concentrations, basal pyloric pressure, and number and amplitude of IPPWs during the
infusion period were determined using the trapezoidal rule.
194

Load of glucose Chapter 7
Numbers and amplitudes of antral and duodenal PWs and energy intake were analysed
by one-way ANOVA. Blood glucose and plasma hormone concentrations, basal
pyloric pressure and number and amplitude of IPPWs were analysed by repeated-
measures ANOVA, with time and treatment as factors. The total number of PWSs was
analysed by repeated-measures ANOVA, with number and length (cm) as factors. Peak
glucose and hormone concentrations (and the times at which these occurred) and the
AUCs were analysed using Student’s t-test.
Correlations, corrected for repeated measures, were determined for (i) the total number
and mean amplitude of antral and duodenal PWs, AUC for basal pyloric pressures,
number and amplitude of IPPWs, APD PWSs, blood glucose and plasma insulin, GLP-
1, GIP, and CCK concentrations between t = 0 - 120 min, and energy intake and
amount eaten at the buffet meal with the ln (natural logarithm) - transformed glucose
loads, and (ii) energy intake and amount eaten with APD motility, blood glucose and
plasma insulin, GLP-1, GIP and CCK concentrations, as their total or AUC values and
values at t = 120 min, using the method described by Bland and Altman (Bland and
Altman, 1995). Only r values > 0.5 were considered physiologically relevant. When
correlations between the above variables were found, multiple regression analysis was
performed to establish determinants of insulin release and energy intake at the buffet
meal. Statistical significance was accepted at P < 0.05, and data are presented as means
± SEM.
195

Load of glucose Chapter 7
7.4 RESULTS
The studies were well tolerated by all, but one, subject who experienced quite marked
nausea during the control infusion. That study was completed and all data were
included in the analysis. Fasting concentrations of blood glucose and plasma insulin,
GIP, GLP-1 and CCK did not differ between the four study days (Table 7.1). For the
analysis of GLP-1, data in 9 of the 10 subjects were available for analysis.
7.4.1 Blood glucose and plasma hormone concentrations
7.4.1.1 Blood glucose (Figure 7.1A)
7.4.1.1.1 Infusion period
Blood glucose concentrations were higher during all glucose infusions, from t = 15 -
120 min, when compared with control (P < 0.05). The increase in blood glucose
between t = 15 - 60 min was greater during G2 and G4, when compared with G1 (P <
0.05 for both). There was no difference between G2 and G4. Peak glucose
concentrations were higher during G2 and G4, when compared with G1 (P < 0.01),
with no difference between G2 and G4 (Table 7.2). After ~ t = 60 min blood glucose
progressively fell (P < 0.01) during G2 and G4, to concentrations close to baseline by t
= 120 min (P = 0.07 for both). The AUC between t = 0 - 120 min, was greater for G1,
G2 and G4 compared with control (Table 7.2). There was no relationship between the
AUC for blood glucose with the load of glucose administered.
196

Load of glucose Chapter 7
7.4.1.1.2 Post-meal period
Blood glucose concentrations decreased after all glucose infusions when compared with
both control and levels immediately before the meal (i.e. t = 120 min) (P < 0.001) - the
magnitude of the fall was greater for G4 than for G1 and G2 (P < 0.05). In contrast,
there was an increase in blood glucose (P < 0.001) after the control infusion.
7.4.1.2 Insulin (Figure 7.1B)
7.4.1.2.1 Infusion period
There was a rise in insulin with all glucose infusions when compared with control (P <
0.05); between t = 60 - 120 min for G1, t = 45 - 120 min for G2, and t = 15 - 120 min
for G4, with no difference between G1 and G2. Insulin concentrations were
substantially greater during G4 when compared with G1 and G2 between t = 30 - 120
min (P < 0.05). The AUC for plasma insulin was greater for G2 and G4, when
compared with control, and for G4 when compared with G1 and G2 (P < 0.001), with
no difference between G1 and G2 (Table 7.2). The AUC for plasma insulin and the
load of glucose administered were related (r = 0.89, P < 0.01).
7.4.1.2.2 Post-meal period
Plasma insulin concentrations fell after G4 (P < 0.001) to levels comparable to G1 and
G2. In contrast, there was an increase in plasma insulin after control (P < 0.001) - at t =
180 min, insulin concentrations after control were greater than those after the glucose
infusions (P < 0.05).
197

Load of glucose Chapter 7
7.4.1.3 Glucagon-like peptide-1 (Figure 7.1C)
7.4.1.3.1 Infusion period
Between t = 0 - 30 min, there was a prompt rise (i.e. within 15 min) in plasma GLP-1
with all glucose infusions, when compared with control (P < 0.05), with no difference
between G1 and G2. GLP-1 concentrations were higher during G4 when compared
with G1 and G2 (P < 0.01). Between t = 15 - 30 min, plasma GLP-1 fell during G1 and
G2, and there were no longer any differences between G1, G2 and control. At t = 30
min plasma GLP-1 remained higher during G4 when compared with control, G1 and
G2 (P < 0.001).
Between t = 0 - 120 min, G2 and G4, but not G1, increased plasma GLP-1 when
compared with control; G2 at t = 15 min and G4 between t = 15 - 120 min (P < 0.05).
During G4 there was a progressive rise in plasma GLP-1 (P < 0.001) and levels were
much higher compared with G1 between t = 15 - 120 min and with G2 between t = 30 -
120 min (P < 0.05 for both). There was no difference between control, G1 and G2,
except at t = 15 min. The AUC for plasma GLP-1 was greater for G4 when compared
with control, G1 and G2 (Table 7.2). The AUC for plasma GLP-1 and the load of
glucose administered were related (r = 0.89, P < 0.01).
7.4.1.3.2 Post-meal period
Plasma GLP-1 decreased after G4 and increased with control, and both these
concentrations were higher than those following G1 and G2 (P < 0.01). At t = 180 min,
there was no difference between control and any glucose infusion.
198

Load of glucose Chapter 7
7.4.1.4 Glucose-dependent insulinotropic polypeptide (Figure 7.1D)
7.4.1.4.1 Infusion period
All treatments increased plasma GIP between t = 15 - 120 min when compared with
control (P < 0.001 for all), with rapid rises followed by relatively stable levels. G2 and
G4 increased plasma GIP when compared with G1 between t = 15 - 120 min, and t = 30
- 120 min, respectively (P < 0.05 for all). Plasma GIP was higher during G4 when
compared with G2 between t = 30 - 90 min (P < 0.05). Peak GIP concentrations were
greater in response to G2 and G4 when compared with G1 (P < 0.001), and G4 when
compared with G2 (P < 0.05) (Table 7.2). The AUC for plasma GIP was greater for all
glucose treatments, when compared with control (Table 7.2). The AUC for plasma
GIP and the load of glucose administered were related (r = 0.91, P < 0.01).
7.4.1.4.2 Post-meal period
There were no changes in GIP for G2 and G4, with levels remaining elevated
compared with control and G1 (P < 0.01), but there were increases after control and G1
(i.e. t = 150 min). At t = 180 min, there was no difference between control and any
glucose infusion.
7.4.1.5 Cholecystokinin (Figure 7.1E)
7.4.1.5.1 Infusion period
There was a rapid increase in CCK during all glucose treatments, after which
concentrations remained relatively stable. G1 and G2 increased plasma CCK when
compared with control at t = 15 min (P < 0.01). CCK remained elevated compared
199

Load of glucose Chapter 7
with baseline during G1 and G2 between t = 15 - 120 min (P < 0.01). G4 increased
plasma CCK when compared with control, G1 and G2 between t = 15 - 120 min (P <
0.001 for all). Both peak plasma CCK and the AUC for plasma CCK were greater for
G4 when compared with control, G1 and G2 (P < 0.01) (Table 7.2). The AUC for
plasma CCK and the load of glucose administered were related (r = 0.82, P < 0.01).
7.4.1.5.2 Post-meal period
CCK concentrations increased after control, G1 and G2 (P < 0.001 for all), but not after
G4, immediately after consumption of the buffet meal (i.e. t = 150 min). There were no
differences between the treatments.
7.4.2 Antropyloroduodenal pressures
7.4.2.1 Antral pressure waves
There was a treatment effect for the number, but not the amplitude, of antral PWs (P <
0.01) (Table 7.3). G1 (P < 0.05), G2 (P < 0.05) and G4 (P < 0.001) decreased the
number of antral PWs when compared with control, with no significant difference
between them, although the mean value was least for G4. There was no significant
relationship between the number or amplitude of antral PWs and the load of glucose
administered.
200

Load of glucose Chapter 7
7.4.2.2 Pyloric pressures
7.4.2.2.1 Basal pressures
There was a treatment by time interaction for basal pyloric pressures (P < 0.001)
(Figure 7.2A). G1, G2 and G4 stimulated basal pyloric pressure when compared with
control; G1 and G2 between t = 90 - 105 min (P < 0.05) and G4 between t = 15 - 120
min (P < 0.01). During G4 basal pyloric pressure progressively rose until t = 60 min (P
< 0.001), after which it fell slightly. G2 stimulated basal pyloric pressure between t =
15 - 45 min (P < 0.05) and G4 between t = 15 - 120 min (P < 0.01), when compared
with G1. G4 stimulated basal pyloric pressure between t = 30 - 120 min when
compared with G2 (P < 0.01). The AUC for basal pyloric pressure and the load of
glucose administered were related (r = 0.83, P < 0.01).
7.4.2.2.2 Phasic pressures
There was no effect of treatment on the number (Figure 7.2B) or amplitude of IPPWs
(data not shown). All infusions initially stimulated IPPWs (P < 0.05), and this increase
was greater during G4 when compared with control (between t = 15 - 45 min), G1
(between t = 0 - 45 min) and G2 (between t = 15 - 30 min) (P < 0.05 for all). With all
infusions there was a subsequent decline in the number of IPPWs. There were no
significant relationships between the number or amplitude of IPPWs and the load of
glucose administered.
201

Load of glucose Chapter 7
7.4.2.3 Duodenal pressures waves
There was a treatment effect for the number, but not the amplitude, of duodenal PWs (P
< 0.001) (Table 7.3). G4 decreased the number of duodenal PWs compared with
control (P < 0.001), G1 (P < 0.001) and G2 (P < 0.01), with no difference between G1,
G2 and control. There was an inverse relationship between the number, but not the
amplitude, of duodenal PWs with the load of glucose administered (r = - 0.75, P <
0.001).
7.4.2.4 Pressure wave sequences
Only PWSs that spanned 2 - 9 channels (1.5 - 13.5 cm) were analysed statistically, as
PWSs spanning over 10 - 15 channels were infrequent (control: 3.4 � 0.3; G1: 1.6 �
0.2; G2: 2.3 � 0.2; G4: 1.2 � 0.1). There was a treatment by length interaction for the
number of PWSs spanning two (1.5 - 3 cm), three (3 - 4.5 cm), four (4.5 - 6 cm), five (6
- 7.5 cm), six (7.5 - 9 cm), seven (9 - 10.5 cm), eight (10.5 - 12 cm) and nine (12 - 13.5
cm) channels (P < 0.05) (data not shown). G2 decreased the number of PWSs that
spanned over two channels (P < 0.001) and G4 over two to four channels (P < 0.001),
when compared with control. G2 (P < 0.05) and G4 (P < 0.01) decreased the number of
PWSs that spanned over two and three channels compared with G1. There were no
differences between control and G1 or G2 and G4. There was an inverse relationship
between the number of PWSs with the load of glucose administered (r = - 0.70, P <
0.05).
202

Load of glucose Chapter 7
7.4.3 Energy intake
There was an effect of treatment on the amount eaten (g) at the buffet meal (P < 0.001)
(Table 7.4). G2 (P < 0.05) and G4 (P < 0.001) reduced the amount eaten when
compared with control, and G4 when compared with G1 (P < 0.001) and G2 (P < 0.01).
There was also an effect of treatment on the energy consumed at the meal (P < 0.01), so
that G4 reduced energy intake when compared with G1 (P < 0.001) and G2 (P < 0.01),
with a trend for a decrease compared with control (P = 0.09) (Table 7.4). There was no
effect of treatment on % energy from fat, carbohydrate or protein (Table 7.4). There
was an inverse relationship between the amount of food (r = - 0.79, P < 0.001) and
energy (r = -0.73, P < 0.01) consumed at the buffet meal with the load of glucose
administered.
7.4.4 Relations between antropyloroduodenal motility, blood glucose,
hormones and energy intake
7.4.4.1 Relations of antropyloroduodenal motility with blood glucose and
plasma hormone concentrations
There was an inverse relationship between the number (r = -0.66, P < 0.05) of antral
PWs and the number (r = -0.52, P < 0.01) and amplitude (r = -0.61, P < 0.01) of
duodenal PWs, and a direct relationship between basal pyloric pressure (r = 0.68, P <
0.05), with the AUC for blood glucose. There was an inverse relationship between the
number of antral PWs (r = -0.74, P < 0.05), the number (r = -0.71, P < 0.001) and
amplitude (r = -0.70, P < 0.05) of duodenal PWs and number of PWSs (r = -0.53, P <
0.05), and a direct relationship between basal pyloric pressure (r = 0.89, P < 0.01), with
the AUC for plasma insulin. There was an inverse relationship between the number (r
203

Load of glucose Chapter 7
= -0.64, P < 0.01) and amplitude (r = -0.66, P < 0.05) of duodenal PWs, and a direct
relationship between basal pyloric pressure (r = 0.84, P < 0.05), with the AUC for
plasma GLP-1. There was an inverse relationship between the number (r = -0.63, P <
0.05) of antral PWs, the number (r = -0.57, P < 0.01) and amplitude (r = -0.67, P <
0.01) of duodenal PWs and the number of PWSs (r = -0.57, P < 0.05), and a direct
relationship between basal pyloric pressure (r = 0.68, P < 0.001), with the AUC for
plasma GIP. There was an inverse relationship between the number of antral PWs (r =
-0.59, P < 0.05) and the number (r = -0.76, P < 0.01) and amplitude (r = -0.62, P < 0.05)
of duodenal PWs, and a direct relationship between basal pyloric pressure (r = -0.81, P
< 0.05), with the AUC for plasma CCK.
7.4.4.2 Relation of blood glucose and plasma hormone concentrations with
energy intake and amount eaten
There was an inverse relationship between the AUC for blood glucose (r = -0.50, P <
0.05), insulin (r = -0.77, P < 0.01), GLP-1 (r = -0.71, P = 0.06) and GIP (r = -0.61, P =
0.01) and the values at t = 120 min for insulin (r = -0.76, P < 0.05) and GLP-1 (r = -
0.71, P < 0.71) with the amount eaten. There was an inverse relationship between the
AUC for insulin (r = -0.62, P < 0.01) and GLP-1 (r = -0.80, P = 0.07) and the values at t
= 120 min for insulin (r = -0.62, P < 0.01) and CCK (r = -0.52, P < 0.05) with energy
intake.
204

Load of glucose Chapter 7
7.4.4.3 Relation of antropyloroduodenal motility with energy intake and
amount eaten
There was an inverse relationship between the amount eaten at the meal and the AUC
for basal pyloric pressure (r = 0.70, P < 0.05), but no relationships between any other
motility parameter with energy intake.
7.4.4.4 Relation of plasma insulin with blood glucose and plasma glucagon-
like peptide-1 and glucose-dependent insulinotropic polypeptide
There was a direct relationship between the AUC for blood glucose (r = 0.76, P <
0.001), plasma GLP-1 (r = 0.85, P < 0.001) and GIP (r = 0.77, P < 0.01)) with plasma
insulin.
7.4.5 Predictors of insulin concentrations and energy intake
Multiple regression analysis of the combined data for blood glucose and incretin
hormones demonstrated that blood glucose (� = 9.18, P < 0.05), plasma GLP-1 (� =
2.08, P < 0.001) and GIP (� = 0.65, P < 0.05) were independent predictors of plasma
insulin concentrations.
Multiple regression analysis of the combined data for blood glucose, all hormones and
motility parameters showed that only basal pyloric pressure was associated with the
amount eaten at the buffet meal (� = -0.35, P < 0.05). The AUC for plasma insulin (� =
0.54, P < 0.01) and values at t = 120 min for plasma insulin (� = -29.33, P<0.01) and
CCK (� = -437.79, P < 0.01) were predictors of energy intake.
205

Load of glucose Chapter 7
Figure 7.1 (A) Blood glucose, and plasma (B) insulin, (C) glucagon-like peptide-1 (GLP-1), (D)
glucose-dependent insulinotropic polypeptide (GIP), and (E) cholecystokinin (CCK) concentrations in response to 120 min intraduodenal glucose (25 %, 1390 osmol/l) infusions at 1 ( ) (“G1”), 2 ( ) (“G2”), or 4 (�) (“G4”) kcal/min, or saline (4.2 %, 1390 osmol/l) control ( ) (“C”), in 10 healthy males. (A) * vs. control; P < 0.05, # vs. G1; P < 0.05, § vs. G2; P < 0.05. (B) * vs. control; P < 0.05, # vs. G1; P < 0.05, § vs. G2; P < 0.05. (C) * vs. control; P < 0.05, # vs. G1; P < 0.05, § vs. G2; P < 0.05. (D) * vs. control; P < 0.01, # vs. G1; P < 0.05, § vs. G2; P < 0.05. (E) * vs. control; P < 0.05, # vs. G1; P < 0.01, § vs. G2; P < 0.01. Data are means � SEM (n = 10).
206

Load of glucose Chapter 7
Figure 7.2 (A) Basal pyloric pressures, and (B) isolated pyloric pressure waves (IPPWs) in response to 120 min intraduodenal glucose (25 %, 1390 osmol/l) infusions at 1 ( ) (“G1”), 2 ( ) (“G2”), or 4 (�) (“G4”) kcal/min, or saline (4.2 %, 1390 osmol/l) control ( ) (“C”), in 10 healthy males. (A) * vs. control; P < 0.05, # vs. G1; P < 0.05, § vs. G2; P < 0.01. (B) * vs. control; P < 0.05, # vs. G1; P < 0.05, § vs. G2; P < 0.05. Data are means � SEM (n = 10).
207

Load of glucose Chapter 7
Table 7.1 Baseline values for antral and duodenal pressure waves, basal pyloric
pressure, number and amplitude of isolated pyloric pressure waves,
blood glucose and plasma insulin, glucagon-like peptide-1, glucose-
dependent insulinotropic polypeptide and cholecystokinin concentrations
(i.e. prior to commencement of intraduodenal infusions of 25 % (1390
mosmol/l) glucose (at 1 (“G1”), 2 (“G2”) or 4 (“G4”) kcal/min) or 4.2 %
(1390 mosmol/l) saline).
Saline(Control) G1
GlucoseG2 G4
P value (ANOVA)
Antral PWs
Number 1.7 � 0.7 4.2 � 2.0 4.0 � 2.1 3.3 � 2.2 NS
Amplitude (mmHg) 7.7 � 2.1 7.5 � 2.6 12.0 � 2.0 10.4 � 5.6 NS
Pyloric pressures
Basal (mmHg) -0.2 � 1.4 2.1 � 2.3 -3.0 � 5.6 5.6 � 6.1 NS
IPPW (number) 0.1 � 0.1 1.6 � 1.6 0 � 0 0 � 0 NS
IPPW (mmHg) 3.0 � 3.0 4.2 � 4.2 0 � 0 0 � 0 NS
Duodenal PWs
Number 32.2 � 10.1 41.1 � 11.2 41.4 � 9.0 46.8 � 18.1 NS
Amplitude (mmHg) 14.1 � 2.8 19.9 � 2.5 17.4 � 3.1 16.4 � 2.3 NS
Glucose (mmol/l) 5.2 � 0.3 5.0 � 0.2 5.4 � 0.2 5.1 � 0.2 NS
Insulin (mU/l) 2.3 � 0.3 2.9 � 0.3 2.6 � 0.3 2.6 � 0.2 NS
GLP-1 (pmol/l) 8.6 � 1.4 9.1 � 1.9 8.8 � 0.6 10.9 � 1.7 NS
GIP (pmol/l) 7.4 � 1.3 13.4 � 3.3 8.9 � 1.9 7.3 � 1.5 NS
CCK (pmol/l) 2.9 � 0.3 3.3 � 90.3 3.0 � 0.2 3.0 � 0.2 NS
Data are means � SEM (n = 10). CCK, cholecystokinin; GIP, glucose-dependent insulinotropic polypeptide; GLP-1, glucagon-like peptide-1; IPPWs, isolated pyloric pressure waves; NS, not significant; PWs, pressure waves.
208

Load of glucose Chapter 7
Table 7.2 Peak concentrations, their timing and areas under the curve (AUC) for blood
glucose and plasma insulin, glucagon-like peptide-1, glucose-dependent
polypeptide and cholecystokinin concentrations during intraduodenal
infusions of 25 % (1390 mosmol/l) glucose (at 1 (“G1”), 2 (“G2”) or 4
(“G4”) kcal/min) or 4.2 % (1390 mosmol/l) saline) between t = 0 - 120 min.
Saline (Control) G1
GlucoseG2 G4
P value (ANOVA)
Peak concentration
Glucose (mmol/l) 5.5 � 0.3 7.5 � 0.6* 8.7 � 0.4*# 9.1 � 0.4*# < 0.001
Insulin (mU/l) 4.3 � 0.5 29.8 � 16.2 40.9 � 20.7 137.0 � 24.9 NS
GLP-1 (pmol/l) 69.0 � 9.8 75.3 � 10.8 78.4 � 4.9 96.0 � 8.7 NS
GIP (pmol/l) 9.0 � 2.3 31.9 � 2.3* 41.8 � 3.5*# 52.2 � 3.2*#§ < 0.001
CCK (pmol/l) 5.2 � 0.3 5.6 � 0.5 5.4 � 0.3 7.4 � 0.6*#§ < 0.01
Timing of peak (min)
Glucose 74 � 14 68 � 9 48 � 7 45 � 4 NS
Insulin 69 � 10 75 � 11 78 � 5 96 � 9 NS
GLP-1 98 � 10 51 � 16 26 � 7 75 � 17 NS
GIP 20 � 5 20 � 4 80 � 17 99 � 8 NS
CCK 62 � 1 53 � 1 63 � 13 30 � 8 NS
AUCs
Glucose (mmol/l.min) -6 � 9 147 � 38* 198 � 36* 226 � 26* < 0.001
Insulin (mU/l.min) 72 � 26 1885 � 1037 2625 � 390* 7980 � 1209*#§ < 0.05
GLP-1 (pmol/l.min) 591 � 119 212 � 301 447 � 182 1805 � 445*#§ < 0.001
GIP (pmol/l.min) -225 � 106 1146 � 486* 2846 � 306* 3648 � 329* < 0.001
CCK (pmol/l.min) 142 � 28 146 � 40 156 � 23 344 � 4*#§ < 0.001
Data are means � SEM (n = 10). AUC, area under the curve; CCK, cholecystokinin; GIP, glucose-dependent insulinotropic polypeptide; GLP-1, glucagon-like peptide-1; IPPWs, isolated pyloric pressure waves; NS, not significant; PWs, pressure waves. Significant differences: * from control, # from G1, § from G2.
209

Load of glucose Chapter 7
Table 7.3 Antral and duodenal pressure wavess during intraduodenal infusions of
25 % (1390 mosmol/l) glucose (at 1 (“G1”), 2 (“G2”) or 4 (“G4”)
kcal/min) or 4.2 % (1390 mosmol/l) saline) between t = 0 - 120 min.
Saline(Control) G1
GlucoseG2 G4
P value (ANOVA)
Antral PWs
Number 70 � 16 40 � 10* 40 � 12* 24 � 7* < 0.01
Amplitude (mmHg)
26 � 6 27 � 7 8 � 3 22 � 11 NS
Duodenal PWs
Number 928 � 78 1132 � 25 865 � 118 390 � 93*#§ < 0.001
Amplitude (mmHg)
15 � 3 11 � 4 9 � 4 7 � 2 NS
Data are means � SEM (n = 10). NS, not significant; PWs, pressure waves. Significant differences: * from control, # from G1, § from G2.
210
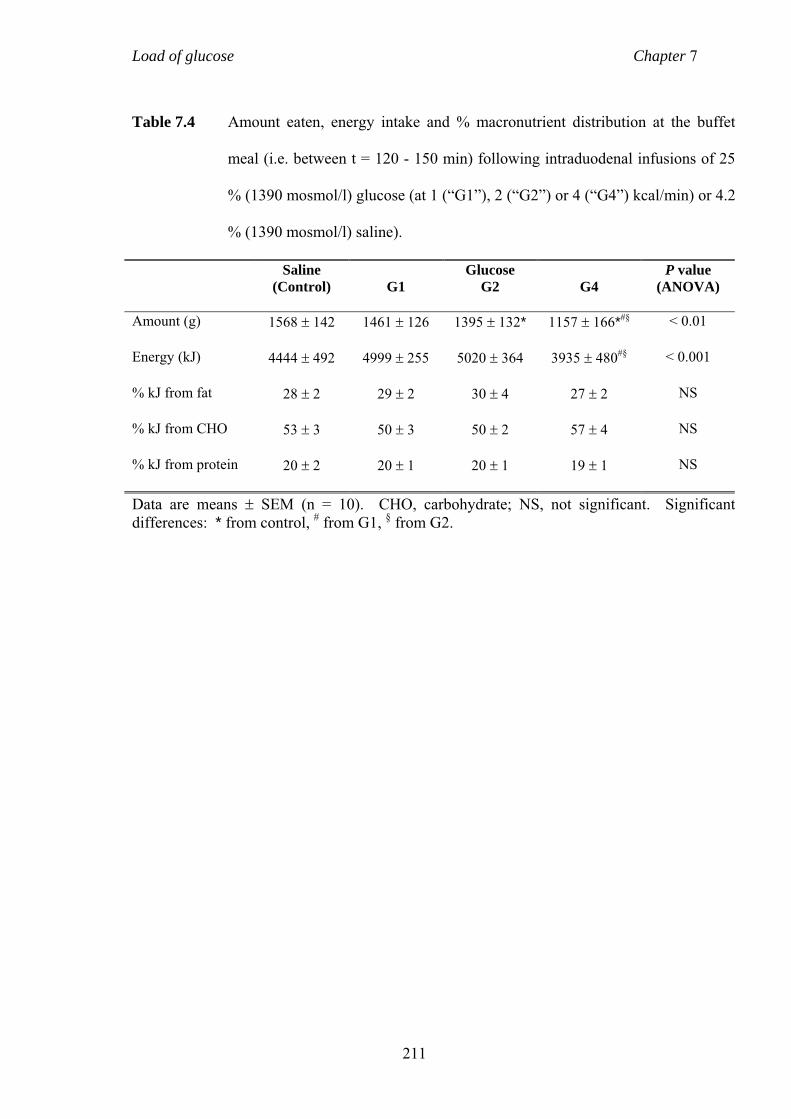
Load of glucose Chapter 7
Table 7.4 Amount eaten, energy intake and % macronutrient distribution at the buffet
meal (i.e. between t = 120 - 150 min) following intraduodenal infusions of 25
% (1390 mosmol/l) glucose (at 1 (“G1”), 2 (“G2”) or 4 (“G4”) kcal/min) or 4.2
% (1390 mosmol/l) saline).
Saline(Control) G1
GlucoseG2 G4
P value (ANOVA)
Amount (g) 1568 � 142 1461 � 126 1395 � 132* 1157 � 166*#§ < 0.01
Energy (kJ) 4444 � 492 4999 � 255 5020 � 364 3935 � 480#§ < 0.001
% kJ from fat 28 � 2 29 � 2 30 � 4 27 � 2 NS
% kJ from CHO 53 � 3 50 � 3 50 � 2 57 � 4 NS
% kJ from protein 20 � 2 20 � 1 20 � 1 19 � 1 NS
Data are means � SEM (n = 10). CHO, carbohydrate; NS, not significant. Significant differences: * from control, # from G1, § from G2.
211

Load of glucose Chapter 7
7.5 DISCUSSION
This study provides novel insights into the effects of administration of glucose directly
into the small intestine, at loads lower than (1 kcal/min), comparable to (2 kcal/min),
and higher (4 kcal/min) than the rate at which gastric emptying normally occurs, on
blood glucose, plasma insulin, GLP-1, GIP and CCK concentrations, APD motility and
energy intake in healthy males. Of particular note are that: (i) while there was a rise in
blood glucose in response to all glucose infusions, there was no difference in the
overall response to 2 and 4 kcal/min, (ii) while a progressive rise in plasma insulin
occurred in response to all glucose infusions, there was no difference between 1 and 2
kcal/min, and a substantially greater response to 4 kcal/min, (iii) there was a transient,
modest, rise in plasma GLP-1 in response to intraduodenal glucose, but a sustained
elevation was only evident with 4 kcal/min, which was progressive from ~ t = 45 min,
and a “meal-related” rise in GLP-1 occurred following the 1 and 2 kcal/min, but not the
4 kcal/min, infusion, (iv) there was a load-dependent stimulation of GIP and CCK with
a subsequent plateau and a “meal-related” increase only after control and 1 kcal/min for
GIP, and after control and the 1 and 2 kcal/min infusions for CCK, (v) antral pressures
were suppressed by all glucose infusions, while the stimulation of basal pyloric
pressure and suppression of duodenal PWs only occurred during the 4 kcal/min
infusion, (vi) a reduction in food intake was evident after the 2 and 4 kcal/min, but not
the 1 kcal/min, infusion, and (vii) there were significant relationships between blood
glucose, plasma insulin, GLP-1, GIP and CCK with APD motility, energy intake and
the amount eaten, and between pyloric pressures with the amount eaten.
212

Load of glucose Chapter 7
This study establishes that there are substantial variations in the effect of different
duodenal glucose loads on glycaemia, insulinaemia and incretin hormones. While,
predictably, all loads increased blood glucose, the 2 and 4 kcal/min infusions resulted
in comparable blood glucose profiles, suggesting that the 2 kcal/min load was sufficient
to cause a maximal response. The maximal capacity of glucose absorption from the
small intestine into the systemic circulation is probably ~ 0.5 g per minute or 2
kcal/min per 30 cm (Duchman et al., 1997, Holdsworth and Dawson, 1964),
accordingly, the 2 and 4 kcal/min loads used are equal to, or exceed, the maximal
absorption capacity of a segment of the small intestine the length of the duodenum.
The comparable glucose responses are likely to reflect the substantially greater insulin
response to the 4 kcal/min load. Similarly, presumably as a result of the insulin
response, blood glucose concentrations fell during the 2 and 4 kcal/min infusions after
~ t = 60 min despite the ongoing entry of glucose into the small intestine. The
differential insulin response to the 2 and 4 kcal/min infusions, accordingly, cannot be
accounted for by glycaemia and is likely to reflect the differential secretion of GLP-1
and GIP. As GIP is released from duodenal K cells (Fehmann et al., 1995), which are
located near the site of infusion, the observed load-dependent increase and subsequent
plateau are not unexpected (Schirra et al., 1996). However, the GIP response to the 4
kcal/min was only marginally greater than that to the 2 kcal/min glucose infusion, and
GIP did not increase postprandially after the 4 kcal/min infusion, suggesting that the
latter results in a maximal, or close to maximal, response. GLP-1 is released from L
cells whose density is greatest in the distal small intestine (Eissele et al., 1992). Hence,
a gradual, progressive rise in GLP-1 may have been anticipated. Schirra and colleagues
have suggested that GLP-1 secretion requires a threshold of glucose delivery of ~ 1.8
kcal/min to be exceeded (Schirra et al., 1996). However, the present, as well as two
213

Load of glucose Chapter 7
other (O'Donovan et al., 2004, Chaikomin et al., 2005), studies have established the
capacity of loads as low as 1 kcal/min to cause an early, transient, stimulation of
plasma GLP-1, albeit modest in magnitude. While the latter may reflect the presence of
L cells in the duodenum (Theodorakis et al., 2006), a recent study suggests that GLP-1
is only released in response to glucose when more than 60 cm of small intestine is
exposed (Little et al., 2006a). Hence, the “early”, transient GLP-1 response may be
accounted for by, initially, relatively more rapid small intestinal transit and subsequent
slowing. Studies in rodents also indicate that GLP-1 may be released through a
neuroendocrine loop to the distal small intestine, whereby the release of GIP from
duodenal K cells in response to glucose acts through vagal afferent pathways to
simulate the L cell indirectly (Rocca and Brubaker, 1999, Roberge and Brubaker,
1993). Accordingly, the mechanism(s) underlying the initial increase in plasma GLP-1
warrant further investigation. The GLP-1 response to the 4 kcal/min infusion was
substantially greater than to the other glucose loads and progressive; this is likely to
reflect the spread of glucose over a longer length of small intestine; the enteral glucose
load which results in a maximum GLP-1 response remains to be determined. Given the
comparable GIP, but vastly different GLP-1, responses to the 2 and 4 kcal/min
infusions, it seems reasonable to speculate that the stimulation of GLP-1 was primarily
responsible for the increased insulin response. In contrast, GIP may be responsible for
the insulin response to the lower duodenal glucose loads, although there are clear
limitations in attempting to estimate the relative contributions of GLP-1 and GIP to
postprandial insulin release on a molar plasma level basis (Schirra et al., 2006).
Clearly, the observations in the present study, in healthy subjects, should not be
extrapolated directly to type-2 diabetes, which is characterised by a delay in insulin
release (O'Donovan et al., 2004), impaired secretion of GLP-1 (Toft-Nielsen et al.,
214

Load of glucose Chapter 7
2001), an impaired insulinotropic effect of GIP, but not GLP-1 (Holst and Gromada,
2004), and a high prevalence of disordered gastric emptying and gastroduodenal
motility (Horowitz et al., 1989). However, it will be important to determine the effects
of different small intestinal glucose loads in this group. CCK is released from I cells,
which are confined to the proximal small intestine (Polak et al., 1975), therefore, as
expected with GIP, all glucose infusions stimulated plasma CCK concentrations in a
load-dependent fashion.
The tight regulation of glucose entry into the small intestine in health reflects the
integration of motor activity in the proximal stomach, antrum, pylorus and duodenum
(Heddle et al., 1988c, Edelbroek et al., 1992a) - the stimulation of pressure waves
localised to the pylorus may be the most important mechanism (Tougas et al., 1992).
All glucose treatments, as well as the control, stimulated IPPWs during the first 30 min
of infusion, followed by a decline. The response to control is not surprising, given that
it would have provided an osmotic stimulus known to slow gastric emptying (Barker et
al., 1974) and the highest glucose load (4 kcal/min) stimulated IPPWs more, for some
45 min. Consistent with our observations, Edelbroek and colleagues, reported in
healthy men that intraduodenal glucose infusion at 2.4 kcal/min for 120 min initially
stimulated IPPWs and basal pyloric pressure, but these responses were not sustained
(Edelbroek et al., 1992a), suggesting that there may be adaptation of the pylorus to the
presence of glucose in the small intestine. The current study also confirms previous
data, showing sustained suppression of antral PWs during intraduodenal glucose
infusion (Rayner et al., 2000b, Heddle et al., 1988c, Edelbroek et al., 1992a). In a
recent study, suppression of antral motility was evident when glucose was infused at
3.5 kcal/min for 60 min into both the duodenum and distal small intestine (i.e. allowed
215

Load of glucose Chapter 7
access to the entire small intestine), and not when it was confined to the proximal 60
cm (Little et al., 2006a). Hence, the observed suppression of antral PWs by the 1
kcal/min load is perhaps surprising, as one would not expect this load to reach beyond
the proximal 60 cm of the small intestine before being absorbed, but this may reflect
the longer duration of glucose infusion in this study. The effects of intraduodenal
glucose on motility may also be secondary to the consequent elevation in blood glucose
(Barnett and Owyang, 1988, Fraser et al., 1991b, Hebbard et al., 1996), although this
cannot explain the discordant duodenal and pyloric responses to the 2 and 4 kcal/min
infusions given that the glycaemic responses were comparable. That the magnitude of
the rise in blood glucose was related to the suppression of antral PWs is not surprising
given that blood glucose concentrations as low as ~ 8 mmol/l can inhibit antral
pressures (Barnett and Owyang, 1988) and slow gastric emptying when compared with
euglycaemia (~ 4 - 6 mmol/l) (Barnett and Owyang, 1988). The effects of
hyperglycaemia on motility do not appear to be mediated by hyperinsulinaemia (Kong
et al., 1999b).
There is a close relationship between the initial rise in blood glucose after oral
carbohydrate and gastric emptying (Horowitz et al., 1993). Accordingly, interventions
which result in a slowing of gastric emptying, and are associated with a pattern of APD
motility which favours this, may reduce postprandial glycaemic excursions (Gentilcore
et al., 2006a). In this study there were significant relationships between rises in blood
glucose, plasma insulin, GLP-1, GIP and CCK with the stimulation of basal pyloric
tone and the suppression of duodenal PWs, which may account for slowing of gastric
emptying. The observed relationship between plasma GIP with the suppression of
antral PWs is surprising given that GLP-1, not GIP, appears to be important in the
216

Load of glucose Chapter 7
regulation of gastric emptying (Meier et al., 2004, Schirra et al., 2000). Although there
was a significant relationship between both plasma GLP-1 and CCK concentrations
with the glucose load, this was not reflected in the AUCs and should, accordingly, be
viewed circumspectly.
Energy intake was only suppressed after the highest glucose load (4 kcal/min; total 480
kcal), although the amount (in grams) of food consumed was also reduced by the 2
kcal/min infusion. That a decrease in energy intake was only evident after 4 kcal/min
is not surprising, as previous studies employing glucose loads of 2 kcal/min for 90 min
(180 kcal) (Rayner et al., 2000b) and 2.86 kcal/min for 120 min (343 kcal) (Chapman et
al., 1999, MacIntosh et al., 2001a) failed to show any reduction in energy intake in
healthy young males. The only study, to date, which has determined a reduction in
energy intake during intraduodenal glucose infusion, compared with saline, used a 3.2
kcal/min infusion of glucose for 90 min, which approximates to 288 kcal (Lavin et al.,
1998). Interestingly, this load (288 kcal) is less than that in studies providing 2.86 kcal
for 120 min (Chapman et al., 1999, MacIntosh et al., 2001a), in which no reduction in
energy intake was observed. This may indicate that the rate of glucose infusion or,
similarly, the length of small intestinal exposure to glucose, rather than the duration of
infusion per se, are more important in the regulation of energy intake, since digestion
and absorption are likely to be completed over a shorter length of intestine during
slower infusions. The effect of exposing greater lengths of the small intestine (e.g. to
the mid-jejunum) warrants further investigation. There is evidence that interplays exist
between gastrointestinal hormones, motility, insulin release and energy intake. The
present study suggests basal pyloric tone, and CCK and insulin were independent
predictors of food and energy intake, respectively. Both exogenous and endogenous
217

Load of glucose Chapter 7
CCK slow gastric emptying/motility and decrease energy intake, but have no effect on
insulin secretion (Brennan et al., 2005, Kissileff et al., 1981, Fried et al., 1991,
Schwizer et al., 1997b, Beglinger et al., 2001). Exogenous and endogenous GLP-1
modulate gastric motility, stimulate insulin secretion and decrease energy intake (Little
et al., 2006b, Schirra et al., 2000, Schirra et al., 2006). The substantial increase in
GLP-1 concentrations during the 4 kcal/min may have contributed to the observed
decrease in energy intake, by stimulating insulin release (Verdich et al., 2001b). It has
recently been suggested that the stimulation of pyloric motility may, per se, diminish
energy intake (Brennan et al., 2005, Xu et al., 2005). In a recent study, intravenous
CCK stimulated pyloric pressures and decreased energy intake, whereas GLP-1, at least
in the dose used, failed to stimulate pyloric pressures and did not decrease energy
intake (Brennan et al., 2005).
7.6 CONCLUSIONS
In summary, this study has established that variations in the delivery of glucose into the
small intestine have differential effects on blood glucose, insulin, incretin and CCK
responses, gastrointestinal motility and energy intake in healthy subjects. These
observations have implications for an understanding of the regulation of postprandial
glycaemia and energy intake in type-2 diabetes.
218

Differential effects of nutrients in FD Chapter 8
Chapter 8
IN FUNCTIONAL DYSPEPSIA ORAL CARBOHYDRATE
AND FAT DIFFERENTIALLY MODULATE SYMPTOMS,
GUT HORMONES AND ANTRAL AREA
8.1 SUMMARY
In patients with FD symptoms are frequently triggered, or exacerbated, by fatty foods.
It was hypothesised that in FD a high-fat (“high-FAT”) meal would induce more
symptoms than a high-carbohydrate (“high-CHO”) preload, associated with altered
secretion of CCK, PYY and ghrelin and increased antral size, when compared with
healthy subjects. FD symptoms, appetite perceptions, plasma hormones and antral area
were measured in 8 FD patients and 8 healthy subjects on three separate days, after
ingestion of high-CHO or high-FAT (500 kcal/400 g) preloads, or a low-nutrient control
(180 kcal/400 g); energy intake was quantified 60 min later. Nausea (P < 0.01) and pain
(P = 0.05) were greater in FD after the high-FAT, when compared with high-CHO and
control, meals and with healthy subjects. Discomfort was greater after all preloads in
FD when compared with healthy subjects (P < 0.05). Fasting CCK and stimulation of
CCK by the high-FAT preload were greater in FD (P < 0.01), while fasting and
postprandial PYY were lower in FD than in healthy subjects (P < 0.001), with no
219

Differential effects of nutrients in FD Chapter 8
differences in fasting, or postprandial, plasma ghrelin between FD and healthy subjects.
Fasting antral area was greater in FD (P < 0.05), with no differences postprandially
between FD and healthy subjects. There were no differences in energy intake between
the two groups. In conclusion, in FD (i) a high-FAT preload induces more symptoms
than an isocaloric high-CHO preload and (ii) fasting and postprandial plasma CCK are
greater and PYY concentrations less. These findings have important implications for
the development of diet-based therapies for the treatment of FD.
8.2 INTRODUCTION
FD is a common chronic condition, for which the aetiology and pathophysiology remain
poorly defined (Talley et al., 1999a). Many patients report that ingestion of food,
particularly high-fat meals, induces, or exacerbates, their symptoms (Kaess et al., 1988,
Kearney et al., 1989, Mullan et al., 1994). While such observations suggest that FD
patients may be hypersensitive to foods rich in fat, the role of dietary fat in symptom
induction has hitherto received relatively little attention. The addition of 30 g
margarine to a soup has been reported to result in greater symptoms (including
epigastric pain, bloating, fullness and nausea) in patients, when compared with a soup
without fat (Houghton et al., 1993). Furthermore, ingestion of a palatable yoghurt
containing 24 g fat increased bloating, fullness and nausea in patients with FD, when
compared with a control yoghurt containing 1 g fat, by 30 - 40 % (Feinle-Bisset et al.,
2003). In these studies symptoms were unrelated to either the rate of gastric emptying
(Houghton et al., 1993) or intragastric volume (Feinle-Bisset et al., 2003), suggesting
that the symptomatic responses may be mediated from the small intestine.
Intraduodenal infusion of lipid has been reported to induce symptoms in FD patients,
220

Differential effects of nutrients in FD Chapter 8
but not in healthy subjects (Barbera et al., 1995b, Feinle et al., 2001a). Moreover, FD
patients may be particularly sensitive to the presence of fat in the small intestine in that
while intraduodenal lipid induced symptoms (Barbera et al., 1995b, Barbera et al.,
1995a, Feinle et al., 2001a), an isocaloric glucose infusion did not (Barbera et al.,
1995b). Whether the apparent “specificity” in the symptomatic response to nutrients,
i.e. to lipid, but not glucose, also applies to orally ingested meals, is not known. This
information is of fundamental relevance to the design of diet-based therapies for the
treatment of FD.
The gastrointestinal hormones, CCK, PYY and ghrelin, play an important role in the
regulation of appetite and gastrointestinal motor function, and their release is modulated
by food ingestion (Adrian et al., 1985, Erdmann et al., 2003, Liddle et al., 1985). With
the exception of CCK, there is little information about their possible role in symptom
generation in FD. The stimulation of plasma CCK by intraduodenal lipid has been
reported to be comparable in healthy subjects and FD patients (Feinle et al., 2001a),
while intravenous CCK induced greater bloating, nausea and fullness in FD patients
when compared with healthy subjects (Chua et al., 1994), suggesting that CCK
hypersecretion may not be an underlying mechanism, but that FD patients may be more
sensitive to CCK. The specific CCK1 receptor antagonist, loxiglumide, attenuated the
symptomatic responses to duodenal lipid in FD (Feinle et al., 2001a), thus, the effects of
dietary fat on symptoms may be mediated by CCK. While both fat and carbohydrate
stimulate CCK (Liddle et al., 1985) and suppress ghrelin (Erdmann et al., 2003) in
healthy subjects, fat is a more effective CCK-secretagogue and carbohydrate suppresses
ghrelin more effectively, while fatty acids are the most potent stimulants of PYY
secretion (Onaga et al., 2002). It is, therefore, conceivable that gut hormone responses
221

Differential effects of nutrients in FD Chapter 8
may be exaggerated in FD, particularly to high-fat meals, leading to greater symptoms.
Fasting plasma ghrelin concentrations have been reported to be greater (Lanzini et al.,
2006), or not different (Shinomiya et al., 2005), in FD. There is no information about
plasma PYY responses, or the relationships between symptoms with hormone
responses, in FD.
Changes in gut motor function have been described in FD, including accelerated
(initial) and delayed (overall) gastric emptying (Delgado-Aros et al., 2004, Stanghellini
et al., 1996), impaired proximal gastric relaxation (Tack et al., 1998), increased
perception of gastric distension (Mearin et al., 1991), and antral and duodenal
dysmotility (Malagelada and Stanghellini, 1985, Stanghellini et al., 1992). A wide
fasting antrum and increased postprandial antral filling have been described in
subgroups of FD patients in some (Hausken and Berstad, 1992b, Troncon et al., 1994),
but not all (Ahluwalia et al., 1996), studies. In healthy subjects, the only function that
has been related to “meal-related fullness” and a decrease in energy intake is that of the
antrum (Jones et al., 1997, Sturm et al., 2004). In contrast, the relationship between
dyspeptic symptoms and antral area is unclear (Hausken and Berstad, 1992b, Hausken
and Berstad, 1994).
Therefore, it was hypothesised that in FD patients, a high-fat preload would induce
more symptoms than a high-carbohydrate preload, and this will correspond to changes
in plasma CCK, PYY and ghrelin and antral area.
222

Differential effects of nutrients in FD Chapter 8
8.3 SUBJECTS AND METHODS
8.3.1 Subjects
8 female FD patients (age range: 23 - 56 years; BMI range: 20.0 - 26.7 kg/m2) were
recruited according to guidelines described in Chapter 4.2. Details of the symptoms and
their severity reported by FD patients at screening are described in Table 8.1. 8 female
healthy subjects (age range: 20 - 50 years; BMI range: 19.9 - 24.2 kg/m2) were recruited
according to guidelines described in Chapter 4.2, in addition these subjects were age,
BMI and gender “matched” to those of a patient.
8.3.2 Study outline
Each subject attended the laboratory at 0900 h, after an overnight fast (14 hours for
solids, 12 hours for liquids) on three occasions, separated by 3 - 10 days, for
assessments of meal-related gastrointestinal symptoms, appetite, hormone secretion,
antral area and energy intake in response to (i) a high-carbohydrate, (ii) a high-fat or
(iii) a control preloads. The subjects were informed that the study aim was to evaluate
the effects of the meals on “stomach function and hormone secretion”. They were
unaware that the main endpoint was the symptomatic response.
8.3.3 Preloads
Three yoghurts, one high in carbohydrate (‘high-CHO’), one high in fat (‘high-FAT’)
and a low-nutrient volume ‘control’, were used as preloads. The composition of these
preloads are described in Chapter 4.4.1 and Table 4.1.
223

Differential effects of nutrients in FD Chapter 8
8.3.4 Protocol
Each subject was seated in a 75º recumbent position, and an intravenous line
established in a forearm vein for blood sampling. At baseline (t = -10 min), a VAS,
assessing symptoms and appetite, was completed, a blood sample taken, and antral area
measured. Then subjects consumed 400 g of one of the preloads, in double-blind,
randomised fashion, over 10 min. Subsequently, VAS were completed, blood samples
taken and antral areas measured at 10 min intervals for 60 min (t = 0 - 60 min).
Subjects were then presented with a standardised, cold, buffet style meal and allowed
30 min (t = 60 - 90 min) to eat freely until they were comfortably full (Feltrin et al.,
2004). A further VAS was completed, blood sample taken and antral area measured at
t = 90 min, after which the intravenous line was removed and the subject allowed to
leave.
8.3.5 Measurements
8.3.5.1 Gastrointestinal symptoms and appetite
Symptoms of nausea, bloating, abdominal discomfort and pain, as well as fullness and
hunger, were rated on 100 mm VAS, as described in Chapter 4.5.5.2 (Parker et al.,
2004).
8.3.5.2 Energy intake
Assessment of energy intake is described in Chapter 4.5.5.3. Habitual diets were also
assessed prior to study commencement. For this purpose, each subject was asked to
record everything they ate and drank, weighing foods where possible, and otherwise
224

Differential effects of nutrients in FD Chapter 8
recording portion sizes, over a complete 7-day period in diet diaries designed
specifically for this purpose, as described in Chapter 4.5.5.1 and Appendix 4.1.
8.3.5.3 Blood glucose and plasma cholecystokinin, peptide YY and ghrelin
Blood sample collection and analysis of blood glucose and plasma CCK, PYY and
ghrelin were performed as described in Chapters 4.5.7 and 4.5.8.
8.3.5.4 Antral area
Measurement of antral area is described in Chapter 4.5.4.
8.3.6 Data and statistical analyses
Mean values for VAS scores, blood glucose, plasma hormone concentrations and antral
area, obtained at t = -10 and 0 min, were taken as baseline values (“0”). Subsequently,
these parameters were evaluated over two time periods; between t = 0 - 60 min (in
response to the test-meal), and between t = 60 - 90 min (in response to the buffet meal).
VAS scores, plasma hormone concentrations and antral area in response to the preloads
were analysed by repeated-measures ANOVA, with time, treatment and subject group
as factors. Energy intake and the amount eaten were analysed by one-way ANOVA.
Post-hoc paired comparisons, corrected for multiple comparisons by Bonferroni’s
correction, were performed if ANOVAs revealed significant effects.
225

Differential effects of nutrients in FD Chapter 8
Correlations, corrected for repeated measures, were determined between AUCs
(calculated using the trapezoidal rule) for dyspeptic symptoms, appetite-related
sensations, blood glucose, plasma hormones, antral area and energy intake and amount
eaten, using values at t = 60 min, as described (Bland and Altman, 1995). Only r values
> 0.5 were considered physiologically relevant. Statistical significance was accepted at
P < 0.05, and data are presented as means ± SEM.
8.4 RESULTS
The preloads were all well tolerated. Habitual dietary intakes did not differ between FD
patients and healthy subjects (energy intake/week, FD: 47967 ± 6908 kJ, health: 50585
± 4038 kJ). The eating restraint score in healthy subjects was 4.5 ± 0.9 (range: 2 - 7)
and in FD patients 8.9 ± 1.7 (range: 4 - 18), thus, only one FD patient (score: 18) was a
restrained eater.
8.4.1 Gastrointestinal symptoms (Figure 8.1) and appetite perceptions
(Figure 8.2)
8.4.1.1 Baseline
There were no differences in symptoms or appetite perceptions between study days
(data not shown). Scores for bloating (P < 0.001) and pain (P = 0.07) were higher, and
hunger was less (P < 0.05), in FD patients than healthy subjects, with no differences in
scores for nausea, discomfort or fullness, between the two groups (Table 8.2).
226

Differential effects of nutrients in FD Chapter 8
8.4.1.2 After preload (t = 0 - 60 min)
In the patients, there were treatment and time effects for both nausea and pain (P <
0.05). Scores for nausea (P < 0.01) and pain (P = 0.05) rose immediately after the high-
FAT meal, were greater when compared with control and high-CHO (P < 0.05) and
remained elevated until t = 60 min and t = 40 min, respectively. There was no
difference between control and high-CHO. There was an effect of time, but not
treatment, on scores for bloating and discomfort (P < 0.001). Bloating increased from
baseline after control between t = 0 - 40 min (P < 0.05) and after high-FAT between t =
0-60 min (P < 0.01), but not significantly after high-CHO. Discomfort increased from
baseline after control between t = 0-50 min (P < 0.05), after high-CHO between t = 0 -
40 min (P = 0.05) and after high-FAT between t = 0-60 min (P < 0.001). There was a
treatment by time interaction for fullness (P < 0.05). Scores for fullness rose
immediately after ingestion of all meals (P < 0.001), plateaued subsequently with high-
FAT, and decreased after control and high-CHO. Scores were less after high-CHO at t
= 10 and 20 min (p = 0.05), and greater after high-FAT at t = 50 min (P < 0.01), when
compared with control, and greater at t = 20 and 30 min after high-FAT, when
compared with high-CHO (P < 0.05).
After high-FAT, scores for nausea (P < 0.05), pain (P < 0.05) and bloating (P = 0.08)
were greater in FD patients than in healthy subjects. There were no significant
differences in these scores between FD patients and healthy subjects following high-
CHO or control, although mean scores were higher in the patients. Scores for
discomfort were greater in FD patients than in healthy subjects after all preloads (P <
0.05), with no differences in scores for fullness or hunger.
227

Differential effects of nutrients in FD Chapter 8
8.4.1.3 After buffet meal (t = 60 - 90 min)
In FD patients, scores for nausea increased following control (P < 0.05), but not high-
CHO or high-FAT. Scores for pain increased following high-FAT (P < 0.05), but not
high-CHO or control. Scores for bloating, discomfort and fullness increased, and
hunger decreased, following all treatments (P < 0.05), with no differences between
treatments for any symptom or appetite score.
Scores for nausea and pain were greater after high-FAT, and for bloating after both
high-CHO and high-FAT, in FD patients than healthy subjects (P < 0.05), with no
differences following control. Discomfort was greater after all preloads in FD patients
than healthy subjects (P < 0.05). There were no differences in scores for fullness and
hunger after any preloads, between the two groups.
8.4.2 Blood glucose and plasma hormone concentrations (Figure 8.3)
8.4.2.1 Blood glucose
8.4.2.1.1 Baseline
There was no difference in blood glucose concentrations between study days (Figure
8.3A) or between the two subject groups (Table 8.2).
8.4.2.1.2 After preload (t = 0 - 60 min)
In the patients there was a treatment by time interaction for blood glucose (P < 0.001).
Blood glucose rose immediately after ingestion of high-CHO (P < 0.05), and 10 min
after ingestion of control (P < 0.001), with no significant rise after high-FAT. Blood
228

Differential effects of nutrients in FD Chapter 8
glucose was higher after high-CHO between t = 0-60 min when compared with control
(P < 0.05), and lower after high-FAT when compared with control (P < 0.01) between t
= 10 - 30 min and high-CHO (P < 0.05) between t = 0 - 60 min.
There was no difference in the blood glucose response to any preload between FD
patients and healthy subjects.
8.4.2.1.3 After buffet meal (t = 60 - 90 min)
There was a significant rise in blood glucose following control (P < 0.001) and high-
FAT (P < 0.05), but not high-CHO, with no differences between treatments in the
patients.
There was no difference in the blood glucose response following the buffet meal
between FD patients and healthy subjects.
8.4.2.2 Cholecystokinin
8.4.2.2.1 Baseline
There was no difference in plasma CCK between study days (Figure 8.3B). Plasma
CCK was slightly, but significantly, higher in FD patients than in healthy subjects (P <
0.05) (Table 8.2).
229

Differential effects of nutrients in FD Chapter 8
8.4.2.2.2 After preload (t = 0 - 60 min)
In the patients there was a treatment by time interaction for plasma CCK (P < 0.01).
Plasma CCK rose immediately after all preloads (P < 0.001) and was greater after high-
CHO (P < 0.01) and high-FAT (P < 0.01) between t = 0 - 10 min and 30 - 60 min,
respectively, when compared with control, with no difference between high-CHO and
high-FAT.
After high-FAT, plasma CCK was greater in FD patients between t = 0 - 60 min, when
compared with healthy subjects (P < 0.05). In contrast, there were no significant
differences in plasma CCK between FD patients and healthy subjects following high-
CHO or control, although mean CCK concentrations were higher (P = 0.1) following
high-CHO in FD patients.
8.4.2.2.3 After buffet meal (t = 60 - 90 min)
There was a significant rise in plasma CCK following control (P < 0.01), and a trend for
a rise following high-CHO (P = 0.07) and high-FAT (P = 0.06), with no differences
between treatments.
Plasma CCK was greater in patients than healthy subjects following high-CHO (P <
0.01), but not following high-FAT and control, although mean values were greater in
the patients following both preloads.
230

Differential effects of nutrients in FD Chapter 8
8.4.2.3 Peptide YY
8.4.2.3.1 Baseline
There was no difference in plasma PYY concentrations between study days (Figure
8.3C). Plasma PYY was lower in FD patients than in healthy subjects (P < 0.001)
(Table 8.2).
8.4.2.3.2 After preload (t = 0 - 60 min)
In the patients there was a treatment by time interaction for plasma PYY (P < 0.05).
Plasma PYY rose immediately after ingestion of high-CHO and high-FAT (P < 0.01),
but not after control, reached a maximum at t = 10 min, and then plateaued. Plasma
PYY was greater after high-CHO and high-FAT, between t = 10 - 40 min and 10 - 60
min, respectively, when compared with control (P < 0.05), and greater after high-FAT
at t = 20 min and t = 50 min, when compared with high-CHO (P < 0.05).
Plasma PYY was less following control (P < 0.05) and high-CHO (P < 0.01) between t
= 0 - 60 min in patients when compared with healthy subjects, with no difference
between the two groups following high-FAT, although mean PYY concentrations were
lower in the patients.
8.4.2.3.3 After buffet meal (t = 60 - 90 min)
There was a rise in plasma PYY following control (P = 0.05) and high-CHO (P < 0.05),
and a trend for a rise following high-FAT (P = 0.07), with no differences between
treatments in the patients.
231

Differential effects of nutrients in FD Chapter 8
Plasma PYY was lower following control (P = 0.05) and high-CHO (P < 0.05), and
tended to be lower following high-FAT (P = 0.07), in FD patients compared with
healthy subjects.
8.4.2.4 Ghrelin
8.4.2.4.1 Baseline
There was no difference in plasma ghrelin concentrations between study days (Figure
8.3D) or between the two subject groups (Table 9.2).
8.4.2.4.2 After preload (t = 0 - 60 min)
In the patients there was a time effect for plasma ghrelin (P < 0.05). Both high-CHO
and high-FAT, but not control, suppressed plasma ghrelin, compared with baseline,
high-CHO between t = 0 - 60 min (P < 0.01) and high-FAT at t = 20 min and between t
= 40 - 60 min (P = 0.05).
There was no difference in plasma ghrelin between preloads or between FD patients and
healthy subjects.
8.4.2.4.3 After buffet meal (t = 60 - 90 min)
Plasma ghrelin was less following high-CHO and high-FAT when compared with
control (P < 0.05), with no difference between the two nutrients in the patients.
232

Differential effects of nutrients in FD Chapter 8
There was no difference in plasma ghrelin following any preload between the two
subject groups.
8.4.3 Antral area (Figure 8.4)
8.4.3.1 Baseline
There was no difference in antral area between study days (data not shown), but antral
area was slightly, but significantly, greater in FD than in healthy subjects (P < 0.05)
(Table 8.2).
8.4.3.2 After preload (t = 0 - 60 min)
In the patients there was a treatment by time interaction for antral area (P < 0.001).
Antral area rose immediately after ingestion of all preloads (P < 0.001), and was greater
after control and high-FAT, between t = 0 - 10 min, when compared with high-CHO (P
< 0.01). Antral area decreased (P = 0.05) after both control and high-FAT, from t = 10
min and t = 40 min, respectively, but not for high-CHO, and remained higher for high-
CHO between t = 40 - 60 min (P = 0.05), and for high-FAT between t = 30 - 60 min (P
< 0.05), when compared with control, with no difference between high-CHO and high-
FAT between t = 20 - 60 min.
There was no difference in antral area after any preload between the two subject groups,
except after high-CHO between t = 0-10 min when antral area was lower in the patients
(P < 0.05).
233

Differential effects of nutrients in FD Chapter 8
8.4.3.3 After buffet meal (t = 60 - 90 min)
There were no differences in antral area between preloads or between the two subject
groups.
8.4.4 Energy intake
There were no differences in energy intake or the amount eaten at the buffet meal
between preloads, or between FD patients and healthy subjects (Table 8.3).
8.4.5 Relations between symptoms, appetite-related sensations, blood
glucose, plasma hormones, antral area and energy intake
There were direct relationships between scores for nausea (r = 0.67, P = 0.08) and pain
(r = 0.72, P < 0.01) with the AUC for CCK and inverse relationships between AUCs of
scores for discomfort (r = -0.86, P = 0.08), bloating (r = -0.63, P < 0.05) and fullness (r
= -0.77, P = 0.09) with the amount eaten.
234

Differential effects of nutrients in FD Chapter 8
Figure 8.1 Effects of orally ingested control ( ), high-carbohydrate (high-CHO) (�) and high-fat (high-FAT) (�) yoghurt preloads on (A) nausea, (B) pain, (C) bloating, and (D) discomfort in patients with functional dyspepsia (FD) (closed symbols) and healthy subjects (HS) (opened symbols). * vs. control, † vs. high-CHO, # vs. healthy subjects; P < 0.05. Data are means ± SEM (n = 8 FD and HS).
235

Differential effects of nutrients in FD Chapter 8
Figure 8.2 Effects of orally ingested control ( ), high-carbohydrate (high-CHO) (�) and high-fat (high-FAT) (�) yoghurt preloads on (A) fullness, and (B) hunger in patients with functional dyspepsia (FD) and healthy subjects (HS). * vs. control, † vs. high-CHO; P < 0.05. Data are means ± SEM (n = 8 FD and HS).
236

Differential effects of nutrients in FD Chapter 8
Figure 8.3 Effects of orally ingested control ( ), high-carbohydrate (high-CHO) (�) and high-fat (high-FAT) (�) yoghurt preloads on (A) blood glucose, and plasma (B) cholecystokinin (CCK), (C) peptide YY (PYY), and (D) ghrelin concentrations in patients with functional dyspepsia (FD) and healthy subjects (HS). * vs. control, † vs. high-CHO, # vs. healthy subjects; P < 0.05. Data are means ± SEM (n = 8 FD and HS).
237

Differential effects of nutrients in FD Chapter 8
Figure 8.4 Effects of orally ingested control ( ), high-carbohydrate (high-CHO) (�) and high-fat (high-FAT) (�) yoghurt preloads on antral area in patients with functional dyspepsia (FD) and healthy subjects (HS). * vs. control, † vs. high-CHO; P < 0.05. Data are means ± SEM (n = 8 FD and HS).
238

Differential effects of nutrients in FD Chapter 8
Table 8.1 Symptoms reported by the functional dyspepsia patients at screening
interview.
Patient no Symptom Severity (out of 3)
1 Upper abdominal/epigastric pain 1
Bloating 2
Early fullness after meals 2
Nausea/vomiting 1
2 Upper abdominal/epigastric pain 3
Bloating 3
Early fullness after meals 2
Nausea/vomiting 2
3 Upper abdominal/epigastric pain 2
Bloating 2
Early fullness after meals 2
Nausea/vomiting 2
4 Upper abdominal/epigastric pain 1
Bloating 2
Early fullness after meals 2
Nausea/vomiting 2
5 Upper abdominal/epigastric pain 3
Bloating 3
Nausea/vomiting 1
6 Upper abdominal/epigastric pain 2
Bloating 3
Early fullness after meals 3
Nausea/vomiting 1
7 Upper abdominal/epigastric pain 2
Bloating 3
Early fullness after meals 2
Nausea/vomiting 1
8 Upper abdominal/epigastric pain 1
Bloating 3
Nausea/vomiting 2
239

Differential effects of nutrients in FD Chapter 8
Table 8.2 Baseline values (i.e. prior to ingestion of preloads) for gastrointestinal
symptoms, appetite-related sensations, blood glucose, plasma
cholecystokinin, peptide YY and ghrelin and antral area, in patients with
functional dyspepsia and healthy subjects.
FD patients Healthy subjects P value
Gastrointestinal symptoms
Nausea (mm) 17 � 5 9 � 4 NS
Pain (mm) 8 � 2 4 � 2 0.07
Bloating (mm) 19 � 4 2 � 1 < 0.001
Discomfort (mm) 12 � 2 9 � 3 NS
Appetite-related sensations
Fullness (mm) 12 � 3 17 � 5 NS
Hunger (mm) 40 � 7 61 � 6 < 0.05
Hormone concentrations
Blood glucose (mmol/l) 5.8 � 0.1 5.8 � 0.2 NS
Plasma CCK (pmol/l) 3.4 � 0.3 2.7 � 0.2 < 0.05
Plasma PYY (pmol/l) 9.4 � 1.4 17.7 � 1.7 < 0.001
Plasma ghrelin (pmol/l) 475 � 131 428 � 144 NS
Antral area (cm2) 4.2 � 0.3 3.4 � 0.2 < 0.05
Data are means of three study days � SEM (n = 8). CCK, cholecystokinin; FD, functional dyspepsia; NS, not significant; PYY, peptide YY.
240

Differential effects of nutrients in FD Chapter 8
Table 8.3 Energy intake and amount consumed at the buffet meal (i.e. between t =
60 - 90 min) following consumption of control, high-carbohydrate and
high-fat preloads, in functional dyspepsia patients and healthy subjects.
Control High-CHO High-FAT P value
Functional dyspepsia
Energy (kJ) 3387 � 707 3382 � 564 3653 � 758 NS
Amount consumed (g) 876 � 160 863 � 144 833 � 152 NS
Healthy subjects
Energy (kJ) 2786 � 347 2542 � 340 2587 � 235 NS
Amount consumed (g) 861 � 94 719 � 87 777 � 84 NS
Data are means � SEM (n = 8). CHO, carbohydrate; NS, not significant.
241

Differential effects of nutrients in FD Chapter 8
8.5 DISCUSSION
This is the first study to evaluate in FD the comparative effects of orally ingested meals
varying in their macronutrient composition (i.e. either high in fat or carbohydrate) on
symptoms, plasma CCK, PYY and ghrelin concentrations, antral area and energy
intake. The major findings are that in FD patients, (i) a high-FAT meal induced
substantially greater symptoms, particularly nausea and pain, than an equicaloric high-
CHO meal, (ii) fasting plasma CCK concentrations were greater, as was the stimulation
of plasma CCK by the high-FAT meal, than in healthy subjects, (iii) fasting and
postprandial PYY concentrations were less than in healthy subjects, (iv) fasting ghrelin
and the magnitude of postprandial ghrelin suppression did not differ from that in
healthy subjects, (v) fasting antral area was slightly greater than in healthy subjects, and
(vi) scores for nausea and pain were related directly to plasma CCK concentrations.
One of the major findings was that the induction of gastrointestinal symptoms after the
oral preloads was “nutrient-specific”. Consumption of a high-FAT preload was
associated with a substantially greater increase in nausea and pain when compared with
a high-CHO meal in FD, with scores increasing immediately after completion of
ingestion. These data extend findings from studies which found that both small
intestinal infusion, and oral ingestion, of fat induce symptoms in FD (Barbera et al.,
1995b, Feinle-Bisset et al., 2003, Houghton et al., 1993) and that equicaloric small
intestinal fat, but not glucose, loads exacerbate dyspeptic symptoms during concomitant
gastric distension (Barbera et al., 1995b). This study has now demonstrated, in a
standardised fashion, that dietary factors, specifically the macronutrient composition of
a meal, affect symptoms in FD, particularly nausea and pain. In contrast, scores for
242

Differential effects of nutrients in FD Chapter 8
discomfort rose after all preloads (including control) in the patients, and a further rise
was apparent following ingestion of the buffet meal, suggesting that simple distension
of the stomach, irrespective of the caloric or macronutrient content of a meal, underlies
certain symptoms in FD (Mearin et al., 1991).
A second novel observation relates to the effects of meals on gut hormones involved in
appetite regulation i.e. CCK, PYY and ghrelin, in FD. While plasma CCK
concentrations increased promptly in response to all preloads in both subject groups, the
responses to both the high-FAT and high-CHO meals were greater in FD patients than
in controls (although in case of the high-CHO preloads this difference was not
statistically significant), with no difference between the two preloads. The results are
unexpected for two reasons. Firstly, the only previous study comparing plasma CCK
concentrations in FD and health reported no differences in fasting concentrations or the
stimulation of CCK by intraduodenal lipid (Feinle et al., 2001a), which led to the
suggestion that FD patients may be hypersensitive to the actions of CCK (Feinle et al.,
2001a). The present study results of greater, albeit modestly, fasting levels in the FD
patients were clear-cut and consistent across all subjects. The cause of this is uncertain,
but may be attributable to different patterns of prior nutrient intake (French et al., 1995).
It is also unclear why the responses to oral and intraduodenal lipid should be different.
FD patients would, as a group, be expected to have slower gastric emptying (Delgado-
Aros et al., 2004, Stanghellini et al., 1996), which, in turn, would be expected to be
associated with a slower rise in plasma CCK. Secondly, given that in the patients the
high-FAT preload resulted in more symptoms, particularly nausea and pain, compared
with the high-CHO preload, and the data from previous studies implicating a role for
CCK in symptom induction in FD (Chua et al., 1994, Feinle et al., 2001a), it would be
243

Differential effects of nutrients in FD Chapter 8
expected that plasma CCK to be greater following the high-FAT, compared with the
high-CHO, preload, although it is now well established that both carbohydrate and fat
release CCK (Liddle et al., 1985, Parker et al., 2005). Nonetheless, this study found
significant correlations between scores for nausea and pain and plasma CCK
concentrations.
Both fasting and postprandial PYY concentrations were lower in the patients, which
was unexpected, particularly also in the light of elevated CCK levels; it is well
established that CCK stimulates PYY (Lin et al., 2000). This suggests a disturbance in
CCK-induced PYY stimulation, however, whether, and, if so, how, this could relate to
symptom generation is unclear. Interestingly, in the patients plasma PYY
concentrations following the high-FAT preload were greater than following the high-
CHO preload, a difference that may, at least in part, have contributed to greater
symptoms following the high-fat preload.
Ghrelin is an orexigenic hormone and implicated in preprandial hunger and meal
initiation, in part because circulating levels increase before, and decrease after, meals
(Cummings et al., 2001). Fasting plasma ghrelin has been reported to be greater
(Lanzini et al., 2006), or not different (Shinomiya et al., 2005), in FD, and this study
found no differences between patients and healthy subjects. The effects of nutrients on
postprandial ghrelin concentrations in patients with FD have hitherto not been
evaluated. Glucose and amino acids suppress ghrelin more rapidly and potently than
lipids (Erdmann et al., 2003). Both the high-FAT and high-CHO meals suppressed
ghrelin secretion compared with the control preload, and to a comparable extent in both
244

Differential effects of nutrients in FD Chapter 8
subject groups, suggesting that nutrient-induced suppression of ghrelin secretion is
intact in FD and, thus, unlikely to contribute to symptoms.
Antral area increased immediately after ingestion of all preloads and remained higher
following both the high-CHO and high-FAT preloads, and slightly higher following the
high-FAT, than the high-CHO, preloads. Except in the fasting state, there were no other
differences between the two subject groups. Antral dysfunction has been reported to
occur in about 35 % of patients with FD (Hausken and Berstad, 1992b), therefore, other
motor functions, not measured in the current study, including impaired proximal gastric
accommodation (Tack et al., 1998), delayed or accelerated gastric emptying (Delgado-
Aros et al., 2004, Stanghellini et al., 1996), or accelerated emptying in the “early
phase”, particularly of fat (Lin et al., 1999), may have contributed to symptom
induction after the high-FAT preload.
Energy intake, as reported in the one-week diet diaries or from the buffet meal, did not
differ between the two subject groups or when comparing the nutrient-meals with
control, although the lack of effect of the nutrient-containing meals to suppress energy
intake in the healthy subjects could be a type 2 error, given that mean energy intake
following the high-CHO and high-FAT preloads was ~ 200 kJ less when compared with
the control preload. It is surprising that the patients consumed amounts that were
comparable with those of the healthy subjects and continued to eat despite experiencing
significant symptoms, although this indicates that the patients appear to ignore signals
from the gastrointestinal tract that indicate pathophysiological changes.
245

Differential effects of nutrients in FD Chapter 8
This study design warrants some comment, particularly given that it is the first to
address in FD patients the comparative effects of the macronutrients, fat and
carbohydrate, on symptom induction. For this purpose the investigator designed semi-
solid yoghurts rich in either carbohydrate or fat. While most meals ingested on a daily
basis would have different textures and consistencies and contain protein, and the fat
and carbohydrate contents of the preloads used in the study were at the extreme ends of
what would be ingested in a normal meal, the investigator believed that the preloads
were appropriate to evaluate the hypotheses as to the potential differences in symptoms
induced by carbohydrate- and fat-containing meals. The fat component of the high-fat
yoghurt was cream and the carbohydrate was predominantly maltodextrin, hence, the
possibility that the response may be specific to these nutrients cannot be excluded. The
time interval between the preloads and the buffet meal (i.e. 60 min) was selected on the
basis of a previous study, in which energy intake from a buffet meal 60 min after a
nutrient preload was shown to be inversely related to antral area in healthy young and
older subjects (Sturm et al., 2004). This study evaluated antral area only, hence, any
conclusions as to the relevance of any disturbances in proximal gastric function cannot
be drawn, and the study period of 60 min was insufficient to quantify overall gastric
emptying. While the subject numbers were relatively small, they were based on a
previous study (Feinle-Bisset et al., 2003), and the data, particularly those relating to
symptoms, are very clear-cut. Nevertheless, this study cannot exclude with entire
certainty the occurrence of type 2 errors with some parameters, such as the lack of a
statistically significant difference in plasma CCK between FD patients and healthy
subjects following the high-CHO meal. Also this study cannot draw any firm
conclusions as to the applicability of the data to men, given that our cohort included
females only.
246

Differential effects of nutrients in FD Chapter 8
8.6 CONCLUSIONS
In summary, this study has shown that in FD (i) a high-FAT meal potently induces
meal-related symptoms, particularly nausea and pain, and (ii) both fasting and
postprandial CCK concentrations are elevated. This data suggest that a reduction in
both the amount eaten and the fat content of the diet may help to alleviate meal-related
symptoms in FD. This issue should now be evaluated in a large cohort of patients.
247

Role of diet in FD Chapter 9
Chapter 9
RELATIONSHIP BETWEEN DYSPEPTIC SYMPTOMS
AND DIETARY PATTERNS IN FUNCTIONAL DYSPEPSIA
9.1 SUMMARY
Patients with FD often report that their symptoms are related to the ingestion of food,
particularly fatty foods. There is limited evidence that eating patterns and nutrient
intake may differ between FD patients and healthy individuals. The relationship
between symptoms and dietary factors in FD has not been evaluated. 20 FD patients
(17 female; age: 45 ± 3 (range: 23 - 73) yr; BMI: 24.0 ± 0.9 (range: 19.3 - 25.7) kg/m )
and 21 healthy subjects (18 female; age: 40 ± 4 (range: 20 - 74) yr; BMI: 22.9 ± 0.5
(range: 18.6 - 26.5) kg/m ) completed detailed diet and symptom diaries in which all
foods and drinks and the times when these were consumed, as well as the occurrence,
timing, and severity of dyspeptic symptoms (including nausea, discomfort, fullness,
bloating, upper abdominal/epigastric pain), were recorded over a 7-day period. Data
from the diet diaries were analysed for the number of meals, light meals, snacks and
drinks, as well as energy intake and macronutrient distribution. The number of “meals”
was less (healthy subjects: 7 (2 - 16), FD: 5 (1 - 10); P < 0.01), and total energy (healthy
subjects: 56570 (34780 - 98997) kJ, FD: 48131 (17844 - 97548) kJ; P = 0.1) and fat
(healthy subjects: 514 (301 - 703) g, FD: 479 (89 - 798) g; P = 0.1) intake tended to be
2
2
248

Role of diet in FD Chapter 9
less, in FD patients compared with HS. In FD patients, symptoms were usually modest
in severity (score out of 10; 5 (3 - 8)) and occurred within 31 (8 - 64) min of eating.
There were a number of relationships between symptoms and dietary factors; fullness
was related directly to both the amount of fat ingested (z = 1.91, P < 0.05) and overall
energy intake (z = 2.12, p < 0.05), and inversely to the amount of carbohydrate ingested
(z = -1.9, P = 0.05). There was a tendency for bloating to be related directly to the
amount of fat ingested (z = 1.68, P = 0.09). There were no significant relationships
between symptom severity and any of the dietary variables. These observations suggest
that FD patients may consume a smaller number of meals and that symptoms are
associated with energy and fat intake; the consumption of smaller meals with a low fat
content may, accordingly, prove beneficial in the management of FD.
9.2 INTRODUCTION
The pathophysiology and aetiology of FD remain poorly defined. Many patients report
that their symptoms are related to the ingestion of food (Kearney et al., 1989, Mullan et
al., 1994), however, only few studies have investigated this putative association. Two
studies reported that dyspeptic symptoms were associated with ingestion of onions,
peppers, fried and fatty foods, alcohol, citrus fruits, and spicy foods (Kearney et al.,
1989, Mullan et al., 1994), or “rich” cakes and carbonated beverages (Mullan et al.,
1994). Another study, using a questionnaire of about 39 different foods, found that
subjects with FD identified 22 of these which they believed aggravated their symptoms,
and, therefore, avoided them (Kaess et al., 1988). Of these foods, the highest rates of
intolerance were for mayonnaise (80 %), nuts (70 %), fish (66 %) and chocolate (62 %)
- three out of these four foods have a high fat content (Kaess et al., 1988).
249

Role of diet in FD Chapter 9
It is uncertain whether patterns of eating and nutrient intake are different in FD. The
prevalence of snacking has been reported to be greater (by about 9 %), and the number
of larger meals to be lower (by about 24 %), in FD patients compared with healthy
subjects, but these differences were not statistically significant (Mullan et al., 1994).
Furthermore, in this study only 55 % of FD patients consumed three meals per day
compared with 80 % of healthy subjects (Mullan et al., 1994), although interpretation is
difficult as definitions of “meals” and “snacks” were not provided (Mullan et al., 1994).
In contrast, a study using food frequency diaries reported no differences in eating
patterns, including the number of regular meals and total number of eating episodes
between patients with FD and healthy subjects (Cuperus et al., 1996), however, food
intake was only evaluated in food categories, and not as individual food items. A
further study, which employed a 7-day diet history to assess nutrient intake, found no
significant differences in nutrient intake, except that the subjects with FD had a
significantly lower intake of dietary fibre (Kearney et al., 1989). Accordingly, previous
studies have yielded inconsistent observations with regard to eating patterns in FD.
Furthermore, none of these studies evaluated the relationship between symptoms with
eating patterns by concurrent measurement.
Many FD patients report that they can only eat small meals and do not tolerate fat,
consistent with the outcome of laboratory-based studies demonstrating diminished
tolerance of volume/pressure, as indicated by increased sensitivity to distension of the
proximal (Mertz et al., 1998b, Barbera et al., 1995b, Barbera et al., 1995a) and distal
(Caldarella et al., 2003) stomach in ~ 35 % of patients, reduced ingestion capacity
during an oral nutrient drink test (Tack et al., 1998) in ~ 40 % of patients (Tack et al.,
2001) and increased sensitivity to oral and duodenal fat administration in ~ 60 - 70 % of
250

Role of diet in FD Chapter 9
patients (Houghton et al., 1993, Barbera et al., 1995a, Feinle et al., 2001a) . While the
potential contribution of specific dietary macronutrients to symptom generation in FD
has not been evaluated, a recent study has demonstrated that meals high in fat increase
symptoms of nausea and pain to a greater extent than high carbohydrate preloads in FD
(see Chapter 8).
Patients with FD as a group report to have more life stress and psychological distress, as
well as a reduced quality of life compared with healthy individuals (Talley et al., 1990,
Talley and Piper, 1986, Talley et al., 1986a, Hui et al., 1991, Bennett et al., 1991).
While it would not be surprising if eating attitudes in FD were abnormal and impact on
eating behaviour and/or symptoms, these factors have not been formally analysed in FD
and related to food intake.
The aims of this study were to assess eating habits, and the occurrence and severity of
symptoms, as well as relationships between them, in FD. It was hypothesised that
patients with FD (i) would consume smaller meals and experience more “meal-
associated” symptoms, but eat more frequently, when compared with healthy subjects
and (ii) the occurrence and severity of symptoms would be related directly to the
amount eaten, as well as the amount of fat in the diet.
9.3 SUBJECTS AND METHODS
9.3.1 Subjects
20 FD patients (17 female, 3 male; age: 45 ± 3 (range: 23 - 73) years; BMI: 24.0 ± 0.9
(range: 19.3 - 35.7) kg/m2) were recruited, as described in Chapter 4.2. 21 healthy
251

Role of diet in FD Chapter 9
subjects (18 female, 3 male; age: 40 ± 4 (range: 20 - 74) years; BMI: 22.9 ± 0.5 (range:
18.6 - 26.5) kg/m2) were recruited, as described in Chapter 4.2. Subjects were also age,
BMI and gender “matched” to those of a patient.
9.3.2 Protocol
Each patient and healthy subject completed a diet diary, in which they recorded all
foods and drinks consumed, and the time of each eating or drinking episode, over an
entire 7-day period (i.e. five week days and two weekend days) (Karvetti and Knuts,
1992), while maintaining their usual eating habits, as described in Chapter 4.5.5.1. All
symptoms experienced (including abdominal pain, cramps, bloating, nausea,
uncomfortable fullness after meals), were also recorded in a symptom diary, described
in Chapter 4.5.5.1. The subjects were informed that the study aim was to determine
whether there were differences in food intake in patients who suffer digestive symptoms
when compared with healthy subjects. They were unaware that the main endpoint was
the association between symptom occurrence and food intake.
9.3.3 Measurements
9.3.3.1 Assessment of eating attitudes, upper and lower gastrointestinal
symptoms, quality of life, personality and psychological distress
To obtain demographic information in each patient and healthy subject, regarding eating
attitudes, upper and lower gastrointestinal symptoms, quality of life, personality and
psychological distress, a number of questionnaires were completed. These included; (i)
Three Factor Eating questionnaire (Stunkard and Messick, 1985) (Chapter 4.5.5.4), (ii)
252

Role of diet in FD Chapter 9
Eating Attitudes Test (Garner and Garfinkel, 1979) (Chapter 4.5.5.5), (iii) Northwest
Lipid Research Clinical Fat Intake Scale (Retzlaff et al., 1997) (Chapter 4.5.5.6), (iv)
Nepean Dyspeptic Index (Talley et al., 1999b) (Chapter 4.5.6.1), (v) Eysenck
Personality Questionnaire (Eysenck and Eysenck, 1964) (Chapter 4.5.6.2), (vi) Hospital
anxiety and depression (“HAD”) scale (Zigmond and Snaith, 1983) (Chapter 4.5.6.3),
and (vii) Zung self-rating depression scale (Zung, 1965) (Chapter 4.5.6.4).
9.3.3.2 Diet diaries
The total number of consecutive eating/drinking episodes for the week was determined.
These episodes were classified in five categories; (i) meals, (ii) light meals, (iii) snacks,
(iv) caloric drinks and (v) non-caloric drinks. Breakfast, lunch and dinner were
generally classified as either “meals” or “light meals”. “Meals” were defined as the
main eating occasion(s) of the day and comprised foods traditionally eaten as a main
meal (e.g. continental breakfast, pasta, meat and vegetables, 4 slices of pizza etc).
“Light meals” were defined as episodes where the amount ingested would be less than
expected at a main meal (by ~ 30 %) (e.g. cereals, sandwiches, 2 slices of pizza, salads
containing meat). “Snacks” were defined as eating episodes in which consumption was
less and easier to prepare than “meals” or “light meals”, usually consists of one food
item (e.g. biscuits, chocolate, crisps, fruit, yoghurt, slice of pizza) and consumed at
times between meals. A “caloric drink” was defined as any beverage that contained
nutrients (e.g. coca cola, coffee with milk and/or sugar, juice, milkshakes, alcohol). A
“non-caloric” drink was defined as any beverage that contained no calories (e.g. water,
diet drinks, black coffee/tea).
253

Role of diet in FD Chapter 9
Foods consumed within a time interval of less than 15 min were considered to be part of
one eating episode. The intervals between eating episodes during the day and night
were also calculated.
9.3.3.3 Symptom diaries
Symptoms were divided into three categories: “meal-associated” symptoms (bloating,
nausea, upper abdominal pain, belching, epigastric pain, fullness, vomiting, discomfort),
which occurred within a 2-hour period after completion of eating (Caldarella et al.,
2003), “other” gastrointestinal symptoms - any other symptom(s) (heartburn, diarrhoea,
constipation, lower abdominal pain) that occurred within a 2-hour period after eating, or
“meal-unrelated” - any symptom which occurred more than 2 hours after, or before, an
eating episode (e.g. when the subject awoke). Symptom severity was classified as;
“mild” (score between 1 - 3 out of 10) not influencing usual activities, “modest” (score
between 4 - 7) diverting from, but not requiring modification of, daily activities, or
“strong” (score between 8 - 10) impairing daily activities. The times at which these
symptoms occurred were evaluated.
9.3.4 Data and statistical analysis
Questionnaire data, numbers of total eating and drinking episodes, meals, light meals,
snacks, and drinks, energy intake, weight, macronutrient distribution, and inter-meal
intervals were compared between patients with FD and healthy subjects using the Mann
Whitney U-test (Wilcoxon rank sum test). To evaluate the relationship between
symptoms and food intake, due to repeated measures over time and day, food intake and
occurrence/severity were modelled with a generalised estimating question, with
254

Role of diet in FD Chapter 9
multinomial distribution and cumulative log link. Relationships between NDI subscales
and food intake were analysed, using Spearman's rho correlations. Statistical
significance was accepted at P < 0.05, and data are presented as median (ranges).
9.4 RESULTS
9.4.1 Eating attitudes, upper and lower gastrointestinal symptoms, quality
of life, personality and psychological distress (Table 9.1)
There was a significant difference in eating attitudes between FD patients and healthy
subjects (P < 0.01), indicating that the FD patients had greater concerns about eating.
There were no differences in scores for any factor of the Three Factor Eating
questionnaire or the fat intake scale between the two groups. Upper abdominal
symptoms, as assessed by the Nepean Dyspeptic Index, were greater in FD patients
when compared with healthy subjects (P < 0.0001). There was a significant difference
in the quality of life between FD patients and healthy subjects. Scores for (i)
interference, or difficulty with activities of daily living, or work because of dyspepsia,
combined with impaired enjoyment of life and emotional well being (P < 0.0001), (ii)
lack of knowledge of, and control over, the illness (P < 0.0001), (iii) disturbances in
eating and drinking (P < 0.0001) and (iv) sleep disturbances (P < 0.001), were greater in
FD patients when compared with healthy subjects, indicating that the patients with FD
had a poorer quality of life. There was no difference in personality, i.e. neuroticism and
extroversion, between the two groups. Both FD patients and healthy subjects presented
with the same degree of anxiety, as measured by the HAD scale, however, depression
tended to be higher in FD patients (P = 0.08). Psychological distress, as measured by
the Zung depression scale, was greater in FD patients when compared with healthy
255

Role of diet in FD Chapter 9
subjects (P < 0.01). However, only 2 FD patients (and no healthy subjects) were
“depressed” (i.e. score > 50).
9.4.2 Eating behaviour
The number of meals consumed (P < 0.01) was less in FD patients when compared with
healthy subjects. There were no other significant differences in total eating or drinking
episodes, light meals, snacks and drinks consumed (Table 9.2). There was no
difference in the total weight, carbohydrate, protein or alcohol content of foods
consumed, or the % distribution of macronutrients, between FD patients and healthy
subjects, although fat and energy intake tended to be less in the FD patients (P = 0.1)
(Table 9.3). There was also no difference in the time interval between meals (FD:
median = 162 min (range: 100 - 320 min) vs. healthy subjects: median = 172 min (120 -
347 min)) or the duration of the overnight fast (FD: median = 733 min (450 - 905 min)
vs. healthy subjects: median = 669 min (527 – 910 min)) between FD patients and
healthy subjects.
9.4.3 Symptom assessment
No healthy subject experienced any symptoms during the 7-day assessment. FD
patients reported a total of 612 symptoms, or 26 (1 - 92) per patient; 64 % (0 - 100 %)
of these were “meal-associated” with a severity of 5 (3 - 8) and occurring 31 min (8 - 64
min) after eating, 9 % (0 - 43 %) were “other” gastrointestinal symptoms with a severity
of 5 (3 - 8) and occurring 25 min (5 - 120 min) after eating, while 14 % (0 - 36 %) were
“meal-unrelated” with a severity of 5 (2 - 7) and occurring 135 min (-180 - 0 min and
120 - 200 min) before, or after, eating. The percentage of total, meal-associated, other
256

Role of diet in FD Chapter 9
gastrointestinal, and meal-unrelated, symptoms experienced and their severity are
summarised in Table 9.4. The occurrence, severity and timing of individual “meal-
associated” symptoms are summarised in Table 9.5.
9.4.4 Relationship between food intake with symptom occurrence and
severity
Only the relationship between “meal-associated” symptoms with dietary factors was
analysed as the number of “other” and “meal unrelated” symptoms was low.
The occurrence of overall meal-associated symptoms was positively related to energy
intake (z = 2.02, P < 0.05), and inversely related to the ingestion of carbohydrate (%: z
= -2.08, P < 0.05). There was no relation between symptoms with fat, protein, alcohol
(g and %) or weight consumed. When individual symptoms were analysed, fullness
was related directly to fat (absolute and %: z = 1.91. P < 0.05), protein (absolute: z =
2.64, P < 0.001; %: z = 1.82, P = 0.06) and energy intake (z = 2.12, P < 0.05), and
inversely related to carbohydrate (%: z = -1.9, P = 0.05), consumption. Bloating was
related to the ingestion of fat (z = 1.68, P = 0.09). There was no significant relationship
between the severity of symptoms and energy intake, or the amount and macronutrient
content of foods consumed
9.4.5 Relationship between food intake and quality of life
In FD patients there was a direct relationship between fat (r = 0.50, P < 0.05) and
protein (r = 0.4, P = 0.06), and an inverse relationship between carbohydrate (r = -0.60,
257

Role of diet in FD Chapter 9
P < 0.01) intake with scores for disturbance in eating and drinking, as measured by the
Nepean Dyspeptic Index, in FD patients. There was no other significant relationship
between food intake and quality of life scores in FD patients or healthy subjects.
258

Role of diet in FD Chapter 9
Table 9.1 Scores for eating attitudes, quality of life, and personality/psychological
distress, in functional dyspepsia patients and healthy subjects.
FD patients Healthysubjects
P value
Eating attitudes
TFEQ (Factor 1) (cut off = 12; max =21)
7 (range: 1 - 18)
6 (range: 1 - 14)
NS
TFEQ (Factor 2) (max =16) 4 (range: 0 - 13)
5 (range: 1 - 10)
NS
TFEQ (Factor 3) (max =14) 4 (range: 0 - 11)
4 (range: 1 - 10)
NS
Eating attitudes test (cut off = 30) 15 (range: 5 - 47)
9 (range: 1 - 31)
< 0.01
Fat intake scale (max = 44) 26 (range: 15 - 35)
27 (range: 21 - 40)
NS
Upper abdominal symptoms and quality of life
Symptoms (max = 195) 56 (range: 6 - 132)
4 (range: 0 - 31)
< 0.0001
Interference/difficulty with activities (max = 65)
28 (range: 17 - 46)
13 (range: 13 - 13)
< 0.0001
Lack of knowledge or control (max = 35)
16 (range: 10 - 28)
7 (range: 7 - 10)
< 0.0001
Eating/drinking disturbances (max =15) 8 (range: 4 - 14)
3 (range: 3 - 5)
< 0.0001
Sleep disturbances (max = 10) 4 (range: 0 - 10)
2 (range: 2 - 2)
< 0.001
Personality/psychological distress
EPQ (neuroticism) (max score = 12) 4 (range: 0 - 12)
4 (range: 0 - 9)
NS
EPQ (extroversion) (max score =12) 8 (range: 0 - 11)
7 (range: 2 - 12)
NS
HAD (anxiety) (cut off = 11) 14 (range: 7 - 23)
12 (range: 8 - 17)
NS
HAD (depression) (cut off = 11) 11 (range: 7 - 20)
8 (range: 7 - 16)
= 0.08
Zung depression scale (cut off = 50) 37 (range: 27 - 55)
32 (range: 21 - 46)
< 0.05
Data are median (ranges) (n = 20 FD patients and 21 healthy subjects). EPQ, Eysenck personality questionnaire; FD, functional dyspepsia; HAD, Hospital Anxiety and Depression scale; NS, not significant; NDI, Nepean Dyspeptic Index; TFEQ, Three Factor Eating questionnaire. Factor 1: cognitive restraint of eating, Factor 2: disinhibition of eating and Factor 3: hunger.
259

Role of diet in FD Chapter 9
Table 9.2 Number of eating and drinking episodes, meals, light meals, snacks,
caloric and non-caloric drinks and total weight and energy consumed
during a 7-day period in functional dyspepsia patients and healthy
subjects.
FD patients Healthy subjects P value
Total number episodes 46 (range: 25 - 96)
44 (range: 21 - 84)
NS
Eating episodes 32 (range: 18 - 40)
29 (range: 21 - 46)
NS
Drinking episodes 14 (range: 1 - 57)
10 (range: 0 - 39)
NS
Meals 5 (range: 1 - 10)
7 (range: 2 - 16)
< 0.01
Light meals 13 (range: 4 - 19)
10 (range: 4 - 17)
NS
Snacks 15 (range: 3 - 25)
11 (range: 0 - 29)
NS
Caloric drinks 4 (range: 1 - 36)
3 (range: 0 - 30)
NS
Non-caloric drinks 9 (range: 0 - 21)
5 (range: 0 - 29)
NS
% meals 122 (range: 2- 26)
15 (range: 6 - 52)
= 0.06
% light meals 28 (range: 6 - 57)
21 (range: 10 - 57)
NS
% snacks 30 (range: 8 - 44)
27 (range: 0 - 54)
NS
% caloric drinks 10 (range: 2 - 46)
7 (range: 0 - 46)
NS
% non-caloric drinks 17 (range: 0 - 36)
10 (range: 0 - 48)
NS
Data are median (ranges) (n = 20 FD patients and 21 healthy subjects). FD, functional dyspepsia; NS, not significant.
260

Role of diet in FD Chapter 9
Table 9.3 Macronutrient distribution (g and % kJ) of fat, carbohydrate, protein and
alcohol during a 7-day period, in functional dyspepsia patients and
healthy subjects.
FD patients Healthy subjects P value
Weight (g) 16404 (range: 7827 - 31454)
18825 (range: 6683 - 22491)
NS
Energy (kJ) 48131 (range: 17844 - 97548)
56570 (range: 34780 - 78997)
= 0.1
Fat (g) 479 (range: 89 - 798)
564 (range: 301 - 703)
= 0.1
Carbohydrate (g) 1337 (range: 629 - 2459)
1578 (range: 856 - 2496)
NS
Protein (g) 511 (range: 237 - 1051)
531 (range: 335 - 846)
NS
Alcohol (g) 14 (range: 0 - 490)
19 (range: 0 - 279)
NS
% fat 29.5 (range: 15.3 - 45.0)
28.3 (range: 16.0 - 38.3)
NS
% carbohydrate 49.6 (range: 25.8 - 60.4)
51.2 (range: 37.0 - 62.7)
NS
% protein 17.8 (range: 10.3 - 25.1)
16.0 (range: 12.5 - 22.7)
NS
% alcohol 0.8 (range: 0 - 259)
1.3 (range: 0 – 19.2)
NS
Data are median (ranges) (n = 20 FD patients and 21 healthy subjects). FD, functional dyspepsia; NS, not significant.
261

Role of diet in FD Chapter 9
Table 9.4 The % and severity of total, meal-associated, other gastrointestinal, and
meal-unrelated symptoms, experienced.
Mild (0 - 3) Modest (4 - 7) Strong (8 - 10)
Total (%) 25 (0 - 100) 54 (0 - 100) 18 (0 - 30)
Meal-related (%) 36 (0 - 100) 52 (0 - 100) 3 (0 - 42)
Other (%) 0 (0 - 100) 73 (0 - 100) 0 (0 - 71)
Meal-unrelated (%) 0 (0 - 100) 75 (0 - 100) 0 (0 - 27)
Data are median (ranges) (n = 20 functional dyspepsia patients).
262

Role of diet in FD Chapter 9
Table 9.5 The occurrence and severity of individual meal-associated symptoms and
the timing of their occurrence after meals.
Occurrence (%) Severity (out of 10) Timing (min)
Bloating 28 (7 - 57) 5 (2 - 9) 30 (1 - 94)
Nausea 11 (4 - 51) 5 (3 - 8) 37 (10 - 95)
Upper abdominal pain 11 (2 - 72) 6 (3 - 8) 25 (6 - 60)
Belching 37 (3 - 41) 4 (3 - 8) 40 (12 - 59)
Epigastric pain 28 (5 - 97) 4 (3 - 6) 31 (2 - 105)
Fullness 20 (3 - 86) 6 (2 - 7) 14 (1 - 68)
Vomiting 3 (3 - 3) 8 (8 - 8) 1 (1 -1)
Discomfort 22 (14 - 50) 5 (4 - 7) 45 (16 - 60)
Data are median (ranges) (n = 20 functional dyspepsia patients).
263

Role of diet in FD Chapter 9
9.5 DISCUSSION
This is the first study to formally evaluate eating behaviour in FD patients and healthy
subjects and the relationship between symptoms with food intake. The major findings
are that in FD patients: (i) symptoms are related to food intake, specifically there were
relationships between the occurrence of fullness with fat and energy intake and bloating
with fat intake, (ii) the number “meals” consumed is less, but there is no difference in
the number of eating episodes (i.e. light meals, snacking, drinking), or the weight or
macronutrient content consumed, except for a tendency for a reduction in fat and energy
intake, (iii) symptoms occurred in all patients, within 30 min of eating and usually at a
modest severity, and (v) the quality of life is a determinant of fat and protein intake.
This study demonstrated a relationship between symptom occurrence and food intake.
The occurrence of symptoms was related to energy intake and inversely related to the
ingestion of carbohydrate; in particular, fullness and bloating were related to the intake
of fat, and fullness to energy intake. These observations are consistent with those of a
laboratory-study by Barbera and colleagues, which demonstrated that duodenal
infusions of fat, but not glucose, exacerbated symptoms in FD (Barbera et al., 1995b).
In the latter study, duodenal infusion of fat induced the perception of discomfort at
lower gastric volumes (as measured by a barostat), in FD patients, while in healthy
subjects the fat infusion increased gastric volume (Barbera et al., 1995b). Conversely,
in both FD patients and healthy subjects, intraduodenal infusion of glucose increased
gastric volume comparably (Barbera et al., 1995b). The increased feeling of discomfort
during the fat infusion may be transposed to the present study to account for the greater
264

Role of diet in FD Chapter 9
perception of “fullness” during fat, and why symptoms were inversely related to intake
of glucose/carbohydrate.
The second observation was that while there was no overall difference in the total
number of eating episodes, FD patients consumed fewer full meals. Taken together,
with the outcome of a previous study (Mullan et al., 1994), these findings suggest that
patients with FD may eat smaller meals in an attempt to reduce their symptoms. In the
present study there was no difference in the weight, carbohydrate, protein or alcohol
consumed, but a trend for decreased fat and energy intake in FD patients. The absence
of significant differences may represent a type 2 error. Given that the occurrence of
symptoms was related to fat and energy intake, this may suggest an important first
“point-of-call” for dietary therapy, i.e., reducing fat and energy intake (coupled with
diminished meal size) may alleviate symptoms, particularly fullness and bloating. It has
been reported previously that there are differences in energy, carbohydrate and vitamin
C intakes in both male and female FD patients; which are gender specific, i.e. energy,
carbohydrate, fat, protein and vitamin C intakes were reported to be less in female FD
patients, compared with healthy subjects, with no differences in male subjects (Mullan
et al., 1994). As the cohort that comprises the current study included three males, by
chance, it was not possible evaluate the possible effect of gender.
All FD patients reported some symptoms throughout the week, being “meal-
associated”, ”other” or “meal-unrelated” - this observation is interesting as, despite
small differences in fat and energy intake, total food intake was not different between
FD and healthy subjects. The majority of these symptoms, as expected, were “meal-
265

Role of diet in FD Chapter 9
associated”, reflecting the cohort recruited and rigorous inclusion criteria. These
symptoms were perceived ~ 30 min after meal ingestion and were of moderate severity.
The effect of food intake on these symptoms, within this time frame, may reflect other
gastrointestinal factors, such as the secretion of the hormones, CCK and PYY. Both
hormones have been demonstrated to mediate, at least in part, the effect of meals to
reduce of hunger and increase fullness (Gutzwiller et al., 2000, Degen et al., 2005). The
study reported in Chapter 8 has demonstrated that fasting and postprandial CCK
concentrations after a high fat preload are higher in FD patients when compared with
healthy subjects - this increase in CCK was also associated with higher scores for
nausea and pain.
As expected, FD patients had a poorer quality of life, as well as greater symptom scores,
when compared with healthy subjects – given the inclusion criteria, it was not surprising
that no healthy subject experienced gastrointestinal symptoms. A previous study
indicated that patients had the capacity to identify foods that exacerbate their symptoms
and, therefore, avoided them (Kearney et al., 1989), however, this association was
anecdotal and not formally assessed. In the present study, however, there was a
significant relationship between fat intake and the subscale of the Nepean Dyspeptic
Index relating to disturbances in eating or drinking. These items include statements of
“the ability to eat/drink is disturbed by stomach problems”, “diet changed due to
stomach problems” and “enjoyment of eating/drinking reduced due to stomach
problems”. This observation is consistent with the concept that patients are aware that
eating is the cause of their symptoms, as suggested by their baseline questionnaire
answers, and may indicate why fat ingestion was less when compared with healthy
subjects, given that this may be associated with the occurrence of symptoms. It has
266

Role of diet in FD Chapter 9
been reported that eating attitudes, as assessed by the eating attitudes test, did not differ
between patients with IBS and healthy subjects (Sullivan et al., 1997). However, in the
current study differences were apparent which were indicative of higher prevalence of
anoretic behaviours in the FD group. Depression scores were also significantly greater
in patients when compared with healthy subjects consistent with previous observations
(Van Oudenhove et al., 2007, Soo et al., 2003, Koloski et al., 2002). It may be possible
that depression, anxiety and poor quality of life explain a particular dietary behaviour or
at least the increased aversion against certain nutrients psychologically.
Our study design warrants some comment, particularly given that it is the first to
address the influence of dietary factors, and its relationship on symptom induction in
FD patients. While our subject numbers were relatively small, the resulting data,
particularly those relating symptoms to energy and fat intake, appear very clear-cut.
Nevertheless, as mentioned, type 2 errors cannot be excluded and to the applicability of
these observations to men, remain uncertain.
9.6 CONCLUSIONS
In summary, this study has shown in a cohort of FD patients that (i) symptoms are
related to fat and energy intake, (ii) FD patients eat fewer “meals” compared with
healthy subjects, with a tendency to consume less fat and energy intake, (iii) symptoms
usually occur within 30 min of eating and are of a modest severity, and (v) the quality
of life was a determinant of fat and protein intake. These observations suggest that FD
patients may consume a smaller number of meals and that symptoms are associated
267

Role of diet in FD Chapter 9
with energy and fat intake; the consumption of smaller meals with a low fat content
may, accordingly, prove beneficial in the management of FD.
268

Iberogast® on gastric relaxation, motility and emptying Chapter 10
Chapter 10
EFFECTS OF THE HERBAL MEDICATION,
IBEROGAST® ON PROXIMAL GASTRIC VOLUME,
ANTROPYLORODUODENAL MOTILITY AND GASTRIC
EMPTYING IN HEALTHY MEN
10.1 SUMMARY
The herbal preparation, Iberogast®, has been reported to improve upper abdominal
symptoms in FD and to decrease fundic tone, increase antral contractility and decrease
afferent nerve sensitivity in experimental animals. The effects of Iberogast® on the
human gastrointestinal tract have not been evaluated. The aim of this study was to
investigate the effects of Iberogast® and control, each administered orally as a single
dose (1.1 ml), in double-blind, randomised fashion, on proximal gastric volume (Part
A), APD motility (Part B) and gastric emptying and intragastric distribution of a
solid/liquid meal (Part C) for 120 min, in 9 (Part A), 12 (Part B) and 8 (Part C) healthy
males. Iberogast® increased proximal gastric volume (max volume; control: 104 � 12
ml, Iberogast®: 174 ± 23 ml; P < 0.05) (Part A), increased the MI of antral PWs in the
first 60 min (P < 0.05) without affecting pyloric or duodenal pressures (Part B), and
slightly increased the retention of liquid in the total stomach between 10 - 50 min (P <
269

Iberogast® on gastric relaxation, motility and emptying Chapter 10
0.01), but had no effect on gastric emptying of solids or intragastric distribution (Part
C). Iberogast® affects gastric motility in humans, probably in a region-dependent
manner. The stimulation of gastric relaxation and antral motility may contribute to the
reported therapeutic efficacy of Iberogast® in FD.
10.2 INTRODUCTION
Abnormalities in gastric motor and sensory function have been investigated widely as a
potential cause of symptoms in FD (Stanghellini et al., 1996, Gilja et al., 1996, Tack et
al., 1998, Kim et al., 2001, Hausken and Berstad, 1992b, Schwartz et al., 2001, Bradette
et al., 1991, Lemann et al., 1991, Mearin et al., 1991, Barbera et al., 1995b, Feinle et al.,
2001a). The documented disturbances include delayed gastric emptying (Stanghellini et
al., 1996), impaired proximal gastric relaxation (Gilja et al., 1996, Kim et al., 2001,
Tack et al., 1998), decreased contractile activity of the antrum (Hausken and Berstad,
1992b) and abnormal duodenal motility (Schwartz et al., 2001), as well as increased
sensitivity to mechanical (Bradette et al., 1991, Mearin et al., 1991, Lemann et al.,
1991) and chemical (Barbera et al., 1995b, Feinle et al., 2001a) stimuli. Treatment for
symptom relief is, accordingly, frequently directed at the normalisation of
gastroduodenal motility using prokinetic drugs (Talley et al., 2000, Moayyedi et al.,
2003, Corinaldesi et al., 1987). However, the beneficial effect of these drugs is
relatively small and variable (Talley et al., 2000, Corinaldesi et al., 1987, Moayyedi et
al., 2003), and their adverse effects can be substantial (Vitola et al., 1998).
Herbal drug preparations have recently received considerable interest as an alternative
treatment option in FD (Arora and Sharma, 1990, Holtmann et al., 2003, May et al.,
270

Iberogast® on gastric relaxation, motility and emptying Chapter 10
2000). Clinical trials of herbal medicines, administered either alone (Arora and
Sharma, 1990, Holtmann et al., 2003), or as combination preparations (May et al.,
2000), have established their capacity to improve symptoms. A commercially available
herbal preparation, Iberogast®, which contains nine plant extracts, has been evaluated
in a number of trials and demonstrated to be superior to placebo (Buchert, 1994,
Madisch et al., 2004), and of comparable efficacy to pharmacological agents, including
metoclopramide (Nicolay, 1984) and cisapride (Rösch et al., 2002), in improving
symptoms in FD and irritable bowel syndrome. In these studies, Iberogast® was
administered at a dose of 20 drops (1.1 ml) three times per day over periods of 2
(Nicolay, 1984) or 4 (Buchert, 1994, Madisch et al., 2004, Rösch et al., 2002) weeks.
Iberogast® has not been associated with any adverse effects.
To date, the limited number of studies which have investigated the potential
mechanisms of action underlying the beneficial effects of Iberogast® have been
performed primarily in animal models (Liu et al., 2004, Storr et al., 2004, Hohenester et
al., 2004), with some preliminary evidence from human gastric tissue (Schemann et al.,
2006). These studies suggest that Iberogast® has a dual action on the gastrointestinal
tract. For example, Iberogast® decreases fundic tone, while increasing antral motility,
in muscle strips from guinea pig stomach in a concentration-dependent manner
(Hohenester et al., 2004). Preliminary experiments on human gastric muscle
preparations demonstrated that Iberogast® relaxes the proximal stomach, comparable in
magnitude to the effect in the guinea pig stomach (Schemann et al., 2006). Additional
actions of Iberogast® in rats include decreased sensitivity of vagal and spinal afferents
to low and high pressure distension in response to chemical (5-HT and bradykinin) and
271

Iberogast® on gastric relaxation, motility and emptying Chapter 10
mechanical (distension) stimuli (Liu et al., 2004), indicating that Iberogast® also affects
sensory gut function.
The aims of this study were to determine the effects of Iberogast® on proximal gastric
volume, pressures in the antrum, pylorus and duodenum, and gastric emptying
(including intragastric meal distribution) in healthy men.
10.3 MATERIALS AND METHODS
10.3.1 Subjects
Healthy male subjects were recruited according to guidelines described in Chapter 4.2.
10.3.2 Study outline
The study consisted of three parts which evaluated the effects of Iberogast® on (i)
proximal gastric volume (“relaxation”) (Part A), (ii) APD motility (Part B) and (iii)
gastric emptying and intragastric distribution (Part C). Subjects attended at 0900 h after
an overnight fast (14 hours for solids and 12 hours for liquids), either the Discipline of
Medicine (Parts A and B) or the Department of Nuclear Medicine, PET and Bone
Densitometry (Part C). In each part, subjects were studied on two occasions, separated
by 3 - 10 days, on which they received, in double-blind, randomised fashion, an oral
dose (1.1 ml) of either Iberogast® or control, each with 50 ml water. Part A was
performed first, followed by Part B, then Part C. Ten of the fourteen subjects recruited
participated in more than one part.
272

Iberogast® on gastric relaxation, motility and emptying Chapter 10
10.3.3 Composition of Iberogast® and preparation of control solution
Iberogast® (Steigerwald Arzneimittelwerk GmbH, Darmstadt, Germany; donated by
Mr N. Pollard, Flordis Herbal Medicines Pty Ltd, Epping, NSW, Australia) is a
complex herbal preparation, containing nine constituents, including fresh plant extract
of Iberis amara (bitter candy tuft) and the extracts of eight dried herbs (Angelicae radix
(angelica roots), Matricariae flos (camomile flowers), Carvi fructus (caraway fruit),
Cardui mariae fructus (St. Mary’s thistle fruit), Melissae folium (balm leaves), Menthae
peperitae folium (peppermint leaves), Chelidonii herba (greater celandine), Liquiritiae
radix (liquorice roots)) in 30.9 % ethanol (see Chapter 4.4.3 and Table 4.3).
The control solution was prepared by diluting 100 % ethanol with water to achieve an
alcohol content of 30.9 %, thus 1.1 ml of solution contained 0.34 ml ethanol.
Iberogast® was administered in the recommended dose of 1.1 ml (20 drops). The
solutions were drawn into a syringe that had been covered with aluminum foil, by one
of the investigators who was not directly involved in the performance of the study or
data analysis, and injected into the subject’s mouth.
10.3.4 Protocol
10.3.4.1 Part A: Effect of Iberogast® on proximal gastric volumes
9 healthy males (age: 29 � 4 yrs; BMI: 23 � 1 kg/m2) were included. Subjects
swallowed a single-lumen polyvinyl orogastric catheter as described in Chapter 4.5.2.
Subjects were then seated in a 75º recumbent position. Intrabag pressure was set at
MDP, as described in Chapter 4.5.2, and following a 10 min “baseline” period, each
subject was given either Iberogast® or control with 50 ml water. Volume changes in
273

Iberogast® on gastric relaxation, motility and emptying Chapter 10
the bag were recorded for 120 min. The catheter was then removed, and the subject
allowed to leave the laboratory.
Intrabag pressures and volumes were digitised and recorded on a computer-based
system running commercially available software (Protocol PlusTM, G & J Electronics,
Toronto, Ontario, Canada). Absolute volumes were expressed as means of 10 min
segments for baseline (i.e. t = -10 - 0 min) and during the following 120 min. The
average maximum volume was calculated by determining the highest volume, and time
point at which this occurred, in each subject. The AUC for gastric volume between t =
0 - 120 min was determined using the trapezoidal rule.
10.3.4.2 Part B: Effect of Iberogast® on antropyloroduodenal pressures
12 healthy males (age: 28 � 4 yrs; BMI: 24 � 2 kg/m2) were included. A manometric
catheter was positioned, as described in Chapter 4.5.1. Once the manometric catheter
was positioned correctly, fasting motility was monitored until the occurrence of a phase
III of the interdigestive MMC (Feltrin et al., 2004). At t = 0 min, i.e. during phase I of
the MMC, the subject was given either Iberogast® or control with 50 ml water, and
APD pressures were monitored for 120 min. The manometric assembly was then
removed and the subject allowed to leave the laboratory.
APD pressures were assessed as described in Chapter 4.5.1. APD pressures were
analysed for (i) number and amplitude of antral and duodenal PWs, (ii) number and
amplitude of IPPWs, (iii) basal pyloric pressure and (iv) number and length of PWSs
(Chapter 4.5.1).
274

Iberogast® on gastric relaxation, motility and emptying Chapter 10
Baseline values were calculated as the means of values obtained between t = -10 - 0 min
for the number and amplitude of antral and duodenal PWs, IPPWs and basal pyloric
pressure. Basal pyloric pressures and the number and amplitude of IPPWs and antral
and duodenal PWs were expressed as means of 10 min segments. Antral and duodenal
MI were also calculated (Camilleri and Malagelada, 1984). The AUC for the number,
amplitude and MI of antral and duodenal PWs, basal pyloric pressure and number and
amplitude of IPPWs from t = 0 - 120 min was determined using the trapezoidal rule.
Episodes of phase III of the MMC were excluded if they occurred more than 60 min
after the treatment was given (i.e. t = 60 - 120 min), i.e. when they were more likely to
be the result of fasting rather than of the treatment.
10.3.4.3 Part C: Effect of Iberogast® on gastric emptying and intragastric
distribution
8 healthy males (age: 31 � 4 yrs; BMI: 25 � 1 kg/m2) were included. Subjects were
seated with their back upright against a gamma camera. Each subject was given either
Iberogast® or control with 50 ml of water, immediately before a mixed solid/liquid
meal, described in Chapter 4.5.3, which was consumed within 5 min. The time of
completion of the meal was defined as t = 0 min. Gastric emptying was measured for
120 min.
Radioisotopic data were acquired as described in Chapter 4.5.3 For both the solid and
the liquid meal components, the amounts remaining in the total, proximal and distal
stomach between t = 0 - 120 min were derived at 10 min intervals, as well as the AUC.
The lag phase for solid and liquid was determined and the amount of solid remaining in
275

Iberogast® on gastric relaxation, motility and emptying Chapter 10
the stomach at t = 100 min and the time for 50 % of the liquid to empty (T50) were
calculated as described in Chapter 4.5.3.
10.3.5 Statistical analysis
Gastric volume (Part A), number, amplitude and MI of antral and duodenal PWs, basal
pyloric pressure, number and amplitude of IPPWs (Part B) and amount of solid and
liquid remaining in the total, proximal and distal stomach (Part C), between 0 - 60 min
and 0 - 120 min, were analysed by repeated-measures ANOVA, with time and treatment
as factors. AUCs for gastric volume, APD motility and the amount of solid and liquid
remaining in the total, proximal and distal stomach, the maximal effect of treatment
(and the time at which this occurred) on gastric volume, the lag phase of solid and
liquid, retention of solid at t = 100 min and the T50 of liquids were analysed by
Student’s t - test. Statistical significance was accepted at P < 0.05, and data are
presented as means ± SEM.
10.4 RESULTS
The studies were tolerated well. Only one subject was able to distinguish between
control and Iberogast®; four subjects reported a mildly unpleasant taste after both
treatments which lasted for a few seconds. None of the subjects experienced any
adverse effects (including nausea).
276

Iberogast® on gastric relaxation, motility and emptying Chapter 10
10.4.1 Part A: Effect of Iberogast® on intrabag volume changes (“gastric
relaxation”)
Mean MDP was 8 ± 0 mmHg for control and 8 ± 1 mmHg for the study with
Iberogast®. The balloon volumes at MDP, before administration of the treatments, did
not differ on the two days (control: 49 ± 4 ml, Iberogast®: 53 ± 5 ml). There were
effects of treatment and time on intra-bag volume between 0 - 120 min (Figure 10.1) -
while intra-bag volume increased gradually on both days, the magnitude of this increase
was greater with Iberogast® than control (P < 0.05). The increase in intra-bag volume
from baseline was marginal for control, and evident only between 100 - 120 min (P <
0.05), whereas the rise after Iberogast® was substantial and occurred between 40 - 120
min (P < 0.05). Maximum intra-bag volume (control: 104 � 12 ml at 64 � 15 min,
Iberogast®: 174 ± 23 ml at 69 ± 12 min; P < 0.05 for volume) and the AUC (control:
7130 � 765 ml.min, Iberogast®: 12400 � 1850 ml.min; P < 0.05) were also greater with
Iberogast®.
10.4.2 Part B: Effect of Iberogast® on antropyloroduodenal motility
Phase III episodes were observed in five subjects (in two subjects they occurred during
both control and Iberogast®, in two subjects during Iberogast® only and in one subject
during control only), and on three occasions, this was in the first 60 min (twice during
control and once during Iberogast® treatment).
10.4.2.1 Antral pressure waves
There was no effect of treatment on the number (Figure 10.2A) or amplitude (Figure
10.2B) of antral PWs, although mean values were slightly greater following Iberogast®
277
Iberogast® on gastric relaxation, motility and emptying Chapter 10
when compared with control. However, there was an effect of treatment on the MI
(Figure 10.2C) of antral PWs. The MI was greater following Iberogast® compared
with control in the first 60 min (P < 0.01). There was no effect of treatment on the
AUCs for the number, amplitude or MI (Table 10.1), although mean values were
greater following Iberogast® when compared with control.
10.4.2.2 Pyloric pressures
There was no effect of treatment on basal pyloric pressure (Figure 10.3A), or the
number (Figure 10.3B) or amplitude (Figure 10.3C) of IPPWs. There was an effect of
time on both the number and amplitude of IPPWs; after an initial rise during the first 20
min following administration of both control (non-significant) and Iberogast® (P <
0.05), values returned to near baseline. There was no effect of treatment on the AUCs
for basal pyloric pressure, or the number or amplitude of IPPWs (Table 10.1).
10.4.2.3 Duodenal pressure waves
There was an effect of time, but not of treatment, on the number (Figure 10.4A),
amplitude (Figure 10.4B) and MI (Figure 10.4C) of duodenal PWs. During both
treatments there was an initial rise (P < 0.05) in all three parameters, and while the
effect of Iberogast® appeared to be slightly greater than that of control, this was not
significant. There was no effect of treatment on the AUCs for the number, amplitude or
MI (Table 10.1).
278

Iberogast® on gastric relaxation, motility and emptying Chapter 10
10.4.3 Part C: Effect of Iberogast® on gastric emptying and intragastric
distribution
10.4.3.1 Solid meal
There was no difference in the lag phase (control: 16 � 4 min, Iberogast®: 19 � 5 min),
the amount of solid remaining in the total (Figure 10.5A), proximal (Figure 10.5B) or
distal (Figure 10.5C) stomach, or the AUCs (Table 10.2) between treatments. There
was no difference in the % retention of solid at t = 100 min between the two treatments
(control: 40 ± 4 %, Iberogast®: 43 ± 5 %). Gastric emptying was delayed in one
subject during Iberogast® treatment (retention at 100 min = 63 %).
10.4.3.2 Liquid meal
There was no difference in the lag phase between treatments (control: 1 � 0 min,
Iberogast®: 1 � 0 min), however, there was a treatment by time interaction for the
amount of liquid remaining in the total stomach (P < 0.01) (Figure 10.5D). Intragastric
retention of liquid was slightly greater during Iberogast® when compared with control
between 10 - 50 min (P < 0.05). There was no difference between treatments in the
amount of liquid remaining in the proximal (Figure 10.5E) or distal (Figure 10.5F)
stomach. There was no effect of treatment on AUCs for liquid emptying in total,
proximal or distal stomach (Table 10.2). There was no difference in the T50 of liquid
between the two treatments (control: 20 ± 3 min, Iberogast®: 23 ± 2 min). Gastric
emptying was delayed in one subject during Iberogast® treatment (T50 = 32 min).
279

Iberogast® on gastric relaxation, motility and emptying Chapter 10
Figure 10.1 Intra-bag volume, as means of 10 min segments, after oral administration of 1.1 ml
control solution ( ), or Iberogast® ( ), with 50 ml water. * vs. control; P < 0.05. Data are means � SEM (n = 9).
280

Iberogast® on gastric relaxation, motility and emptying Chapter 10
Figure 10.2 (A) Number, (B) amplitude and (C) motility index (MI) of antral pressure waves, as means of 10 min segments, after oral administration of 1.1 ml control solution ( ), or Iberogast® ( ), with 50 ml water. * vs. control; P < 0.01. Data are means � SEM (n = 12).
281

Iberogast® on gastric relaxation, motility and emptying Chapter 10
Figure 10.3 (A) Basal pyloric pressure, (B) number and (C) amplitude of isolated pyloric pressure waves, as means of 10 min segments, after oral administration of 1.1 ml control solution ( ), or Iberogast® ( ), with 50 ml water. Data are means � SEM (n = 12).
282
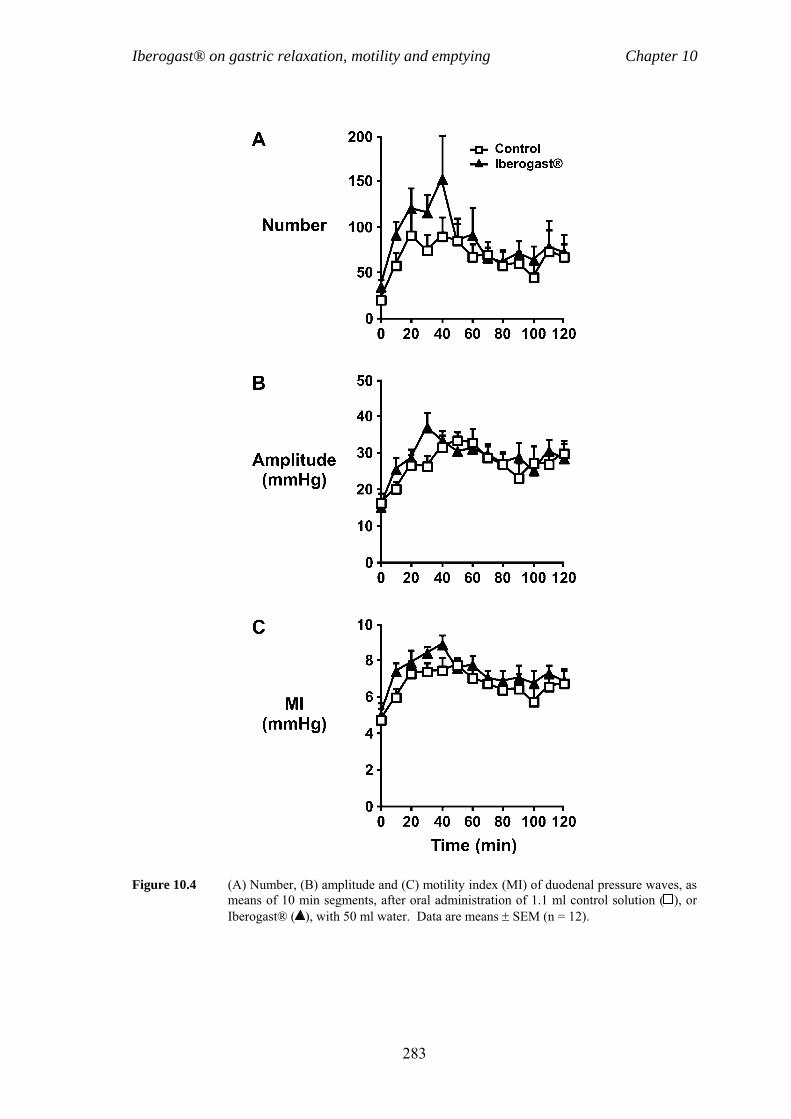
Iberogast® on gastric relaxation, motility and emptying Chapter 10
Figure 10.4 (A) Number, (B) amplitude and (C) motility index (MI) of duodenal pressure waves, as means of 10 min segments, after oral administration of 1.1 ml control solution ( ), or Iberogast® ( ), with 50 ml water. Data are means � SEM (n = 12).
283

Iberogast® on gastric relaxation, motility and emptying Chapter 10
Figure 10.5 Gastric emptying and intragastric distribution of solid (A, B, C) and liquid (D, E, F) meal components, after oral administration of 1.1 ml control solution ( ), or Iberogast® ( ), with 50 ml water. * vs. control; P < 0.05. Data are means � SEM (n = 8).
284

Iberogast® on gastric relaxation, motility and emptying Chapter 10
Table 10.1 Area under the curves for the number, amplitude and motility index of
antral and duodenal pressure waves, basal pyloric pressure and number
and amplitude of isolated pyloric pressure waves after control or
Iberogast® between t = 0 - 120 min.
Control Iberogast®
Antral pressure waves
Number (min) 1150 ± 279 1810 ± 598
Amplitude (mmHg.min) 3730 ± 480 4490 ± 612
MI (mmHg.min) 447 ± 49 559 ± 48
Pyloric pressures
Basal pyloric pressure
(mmHg.min)*
-94 ± 89 -102 ± 76
Number IPPWs (min) 267 ± 79 264 ± 57
Amplitude IPPWs (mmHg.min) 2510 ± 484 2500 ± 493
Duodenal pressure waves
Number (min) 8040 ± 1150 10390 ± 1940
Amplitude (mmHg.min) 3230 ± 192 3450 ± 226
MI (mmHg.min) 799 ± 38 880 ± 42
Data are means � SEM (n = 12). MI, motility index; IPPWs, isolated pyloric pressure waves. * The negative values indicate that both treatments decreased tone compared with baseline.
285

Iberogast® on gastric relaxation, motility and emptying Chapter 10
Table 10.2. Area under the curves for the gastric emptying profiles of solid and
liquid meal components from the total, proximal and distal stomach after
control or Iberogast® from t = 0 - 120 min.
Control Iberogast®
Solid gastric emptying
Total (%.min) 8330 ± 286 8580 ± 348
Proximal (%.min) 4810 ± 439 5120 ± 600
Distal (%.min) 3530 ± 593 3490 ± 539
Liquid gastric emptying
Total (%.min) 3310 ± 247 3720 ± 237
Proximal (%.min) 1520 ± 200 1720 ± 242
Distal (%.min) 1780 ± 243 2000 ± 175
Data are means � SEM (n = 8).
286

Iberogast® on gastric relaxation, motility and emptying Chapter 10
10.5 DISCUSSION
This study establishes for the first time that Iberogast® affects gastric motility in
humans and suggests that these effects may be region-dependent. Specifically,
Iberogast® increased proximal gastric relaxation substantially, increased the MI of
antral PWs and slowed gastric emptying of liquid slightly, but had no significant effect
on fasting duodenal or pyloric motility, solid gastric emptying or intragastric meal
distribution, in healthy males.
The pathophysiology of FD remains poorly defined, and heterogenous. Treatment
options, including prokinetics (Talley et al., 2000, Corinaldesi et al., 1987, Moayyedi et
al., 2003) and proton pump inhibitors (Talley et al., 1998), have resulted in variable and
less than optimal responses. The therapeutic benefits of relatively inexpensive herbal
drugs in patients with functional gastrointestinal disorders appear to be significant and
their use is devoid of adverse effects. For example, Iberogast® is superior to placebo
(Buchert, 1994, Madisch et al., 2004) and comparable to metoclopramide (Nicolay,
1984) and cisapride (Rösch et al., 2002) in the management of FD. The current study
demonstrated that Iberogast® increased proximal gastric relaxation, as reflected by an
increase in intra-bag volume at constant pressure, which was sustained for the duration
of the study (120 min), and also increased the MI of antral PWs during the first 60 min
after administration. These results are consistent with observations in animals
(Hohenester et al., 2004) and suggest that the effects of Iberogast® on gut motility are
also region-dependent in healthy humans. Moreover, these effects may potentially
account for improvement in dyspeptic symptoms, as impaired proximal gastric
relaxation and antral hypomotility affect some 40 - 70 % of FD patients (Gilja et al.,
287

Iberogast® on gastric relaxation, motility and emptying Chapter 10
1996, Tack et al., 1998, Kim et al., 2001, Malagelada and Stanghellini, 1985). In
contrast, Iberogast® had no apparent effect on either duodenal pressures, phasic or tonic
pyloric motility, or solid gastric emptying and had a minimal, albeit significant, effect to
slow liquid emptying. The latter is not surprising, given that Iberogast® relaxes the
fundus and increases contractile activity in the antrum; one would, therefore, not expect
any major change in gastric emptying. The absence of any effect of Iberogast® on
intragastric meal distribution is perhaps surprising, given the enhancement of proximal
gastric relaxation, but this may be because the test meal was relatively small and low in
energy (330 kcal). It would be of interest, to evaluate the effects of Iberogast® on the
intragastric distribution of meals of higher caloric content and volume. In a rat model
Iberogast® decreased afferent nerve sensitivity in response to mechanical ramp
distension of an intestinal loop at increasing pressures (0 - 60 cmH20) (Liu et al., 2004),
accordingly, evaluation of the effects of Iberogast® on gastric sensitivity in humans is
also warranted. Studies to evaluate the effects of Iberogast® on proximal gastric
accommodation, antral, pyloric and small intestinal motility and gastric emptying, as
well as gastric sensitivity, in FD patients are indicated, particularly given that our study
has now demonstrated that Iberogast® modulates gastric motility in humans.
While the data do not provide any insight regarding the site of action of Iberogast®, a
recent study on isolated guinea pig stomach preparations clearly indicates a direct
muscle effect of the drug (Hohenester et al., 2004). In contrast, the site of action of
Iberogast® in regards to its effect on gastric sensitivity has not been established, and the
concept that the effect of Iberogast® may be mediated from the small intestine, as is the
case with nutrient-regulation of gastric emptying (Heddle et al., 1989), warrants
exploration.
288

Iberogast® on gastric relaxation, motility and emptying Chapter 10
It is important to recognise potential limitations of the study. Iberogast® contains a
number of components, and it is, therefore, unknown, which extract(s) is (are)
responsible for the demonstrated effects on proximal gastric relaxation, antral motility
and liquid gastric emptying in humans. However, the mode of action of Iberogast® has
recently been investigated in guinea pig stomach preparations, and the data provide
evidence that the region-dependent effects of Iberogast® are not due to the differential
actions of the individual components of Iberogast® on the fundus or antrum, but rather
the specific properties of fundus vs. antrum muscle (Kong et al., 1986). The effects of
Iberogast® on gastric motility are not attributable to the ethanol in this preparation, as
the control solution contained an identical amount, and concentration, of alcohol. The
effects of a single-dose of Iberogast® was evaluated, and the effects of different doses,
as well as chronic administration, are unknown. In addition, our study was an
investigation in a relatively small number of healthy subjects, therefore, future studies
in male and female patients with FD are required. Furthermore, while this study
evaluated the effects of Iberogast® in the fasting gastrointestinal tract, the evaluation of
the effects of Iberogast® on postprandial gastrointestinal motor function is of high
clinical relevance. Iberogast® and control solutions were consumed immediately
before 50 ml of water, and only one subject was able to distinguish between control and
Iberogast® and only four reported a transient (i.e. immediately after the treatment was
taken) unpleasant taste following both treatments. Accordingly, the observed effects on
motility are most unlikely to be attributable to an aversive effect.
289

Iberogast® on gastric relaxation, motility and emptying Chapter 10
10.6 CONCLUSIONS
In summary, this study demonstrated that Iberogast® has region-dependent effects on
gastric motility in humans - Iberogast® increased proximal gastric relaxation, increased
antral motility and slowed gastric emptying of liquid slightly, but had no effect on
pyloric and duodenal motility or solid gastric emptying in healthy male subjects. The
effects on gastric motility may contribute to the beneficial effect of Iberogast® in FD.
290

Conclusions Chapter 11
Chapter 11
CONCLUSIONS
Gastrointestinal function is influenced by a number of factors, including exposure of the
small intestine to nutrients and gastrointestinal hormone release/suppression, all of
which play a role in the regulation of appetite and energy intake, i.e. suppression of
appetite and subsequent energy intake by meal ingestion is mediated, at least in part, by
gastric emptying, gastrointestinal motility and the release of CCK, PYY, GLP-1, GIP
and suppression of ghrelin. In patients with FD, gastrointestinal function is frequently
disturbed and symptoms are anecdotally often induced, or exacerbated by food
ingestion, however there is limited information about the associations between
symptoms, food ingestion and gut function. Furthermore, the therapeutic benefit of
currently available pharmacotherapies targeted at symptom improvement by
normalising gastrointestinal function is marginal at best, so that there is an urgent need
for more effective treatments.
The studies included in this thesis have focused on the effects of different
macronutrients, predominantly fat and carbohydrate, on gastrointestinal motility,
hormone release/suppression, appetite and energy intake in healthy subjects and on
symptom generation in FD by addressing three broad issues: (i) the effect of load, and
291

Conclusions Chapter 11
duration, of small intestinal nutrient exposure on APD motility, hormone
release/suppression, appetite and energy intake in healthy subjects (Chapters 5 - 7), (ii)
potential dietary factors that contribute to symptom generation in patients with FD
(Chapters 8 and 9), and (iii) the effects of the herbal medication, Iberogast®, on gastric
motility in healthy subjects (Chapter 10).
A numbers of factors may influence the effects of small intestinal nutrients on
gastrointestinal motility, hormone release/suppression, appetite and energy intake.
Studies in animals and, one recent study in humans, have demonstrated that the length
of the small intestine exposed to nutrients is important. While the effects of the load of
small intestinal nutrients and duration of nutrient exposure have been evaluated in
humans, the effects of energy loads lower than, comparable to, and greater than, the
normal rate of gastric emptying on gastrointestinal motility, hormone
release/suppression, appetite and energy intake, in healthy humans, or the relationships
between these parameters, have hitherto not been evaluated.
The study described in Chapter 5 compared the effects of a low (1.33 kcal/min) and
high (4 kcal/min) intraduodenal load of lipid during a “short infusion” (50 min), with a
low load (1.33 kcal/min) during a “long infusion” (150 min). Antral PWs and PWSs
were suppressed, and basal pyloric pressure, IPPWs, plasma CCK and PYY stimulated,
by both the low, and high, loads. The effect of the high lipid load was sustained, so that
the suppression of antral PWs and PWSs and increase in PYY were evident after the
cessation of the infusion. The prolonged intraduodenal lipid infusion suppressed antral
PWs, stimulated CCK and PYY and basal pyloric pressure, and tended to stimulate
IPPWs, when compared with saline throughout the infusion period. These observations
292

Conclusions Chapter 11
indicate that both the load, and duration, of small intestinal lipid have an influence on
APD motility and patterns of CCK and PYY release.
The study described in Chapter 6 evaluated the effects of intraduodenal lipid, at loads
lower than (0.25 kcal/min for 50 min: 12.5 kcal), comparable to (1.5 kcal/min for 50
min: 75 kcal) and higher (4 kcal/min for 50 min: 200 kcal) than normal gastric
emptying in healthy subjects. The lowest lipid load transiently stimulated IPPWs and
CCK release and suppressed PWSs and hunger scores. Loads comparable to, and
higher than, the normal rate of gastric emptying, were required to stimulate basal
pyloric pressure and PYY release, and suppress antral and duodenal PWs. Only the
highest load suppressed energy intake. The effects of intraduodenal lipid on all
parameters, with the exception of hunger, were load-dependent, but the threshold-loads
required to elicit responses varied between parameters. There were also significant
relationships between energy intake with APD motility and CCK and PYY
concentrations. In obese subjects, there is evidence that gastrointestinal motility and
hormone secretion are abnormal. Many of these individuals habitually consuming high-
caloric diets and may well be less sensitive to nutrient stimuli, therefore, it is possible
that higher small intestinal lipid loads may be required to induce similar responses to
those observed in this study. It would, accordingly, be of interest to compare the
thresholds required, and “dose-responses” for the stimulation, or suppression of gastric
motility, hormone release/suppression, appetite and energy intake in lean and obese
subjects.
The study described in Chapter 7 evaluated the effect of intraduodenal glucose loads
lower than (1 kcal/min for 120 min: 120 kcal), comparable to (2 kcal/min for 120 min:
293

Conclusions Chapter 11
240 kcal), and higher than (4 kcal/min for 120 min: 480 kcal) the normal rate of gastric
emptying, in healthy subjects. All loads stimulated blood glucose, plasma insulin, GLP-
1, GIP and CCK concentrations and suppressed antral PWs, however, loads
comparable, and higher than, normal gastric emptying were required for the suppression
of duodenal PWs and PWSs and the stimulation of basal pyloric pressure, and
suppression of energy intake was only evident after the highest load. There were also
significant relationships between food/energy intake with insulin, GLP-1 and GIP and
pyloric pressures. Interestingly, the glycaemic responses to the 2 kcal/min and 4
kcal/min infusions were comparable, which is attributable to the substantially greater
insulin and GLP-1 stimulation in response to the latter. Type-2 diabetes is associated
with abnormalities in gastrointestinal function and hormone release, therefore the
observations derived from this study have implications for an understanding of the
regulation of postprandial glycaemia and energy intake in type-2 diabetes and studies in
this group are warranted.
Patients with FD, report that their symptoms are related to the ingestion of food, and
while there is evidence that there are differences in eating behaviour between FD
patients and healthy subjects, information is limited and inconsistent. In addition, no
study has hitherto correlated the occurrence, and severity, of symptoms with food
intake. A limited number of laboratory-based studies have reported that fat, not
glucose, exacerbates dyspeptic symptoms, and fasting CCK concentrations and fasting
and postprandial antral size, are increased in FD compared, however the relationship
between symptoms with fat intake, antral size and gastrointestinal hormone release has
not been assessed. In the study described in Chapter 8, symptoms, plasma CCK, PYY
and ghrelin, and antral area and energy intake were compared in FD patients and
294

Conclusions Chapter 11
healthy subjects after ingestion of high-carbohydrate, high-fat and low energy control
yoghurt preloads. Nausea and pain were greater in FD after the high-fat, when
compared with high-carbohydrate, and control, preloads and with healthy subjects.
Discomfort was greater after all preloads in FD when compared with healthy subjects.
Fasting CCK and the stimulation of CCK by the high-fat preload were greater in FD,
while fasting and postprandial PYY were less in FD than in healthy subjects, with no
differences in fasting, or postprandial, plasma ghrelin between FD and healthy subjects.
Fasting antral area was greater in FD, with no differences postprandially between FD
and healthy subjects. There were no differences in energy intake between the two
groups. In the study reported in Chapter 9, dietary factors, and the occurrence and
severity of symptoms, were compared in cohorts of FD patients and healthy subjects.
The number of “meals” was slightly less, and total energy and fat intake tended to be
less, in FD patients. Symptoms experienced by the patients were modest and occurred
within ~ 30 min of eating. There were a number of relationships between symptoms
with dietary factors: perhaps of most interest was that fullness was related directly to the
amount of fat ingested and to overall energy intake, and inversely to the amount of
carbohydrate and that there was a tendency for bloating to be related directly to the
amount of fat ingested. Taken together, the observations from these two studies suggest
that FD patients may consume a smaller number of meals and that symptoms are
associated with energy and fat intake. Hence, the consumption of smaller meals with a
low fat content may prove beneficial in the management of FD. The cause(s) of the
elevated fasting and postprandial plasma CCK and reduced postprandial PYY
concentrations remain to be determined. It is, however, clear that the observations
reported in Chapters 8 and 9 have important implications for the development of diet-
based therapies for FD.
295

Conclusions Chapter 11
There has been considerable interest in the use of herbal preparations in patients with
FD, in particular the use of the combination preparation, Iberogast®. While a number
of clinical studies have reported that Iberogast® was superior to placebo, with an
efficacy comparable to other pharmacotherapies, to improve symptoms in FD patients,
the mechanisms underlying the action of Iberogast® have only been evaluated in animal
models. In these studies, Iberogast® decreased fundic tone, while increasing antral
motility in muscle strips from guinea pig stomach in a concentration-dependent manner,
and decreased sensitivity of vagal and spinal afferent to low and high pressure
distension. These studies therefore indicate that Iberogast® affects gastrointestinal
motility and sensory function. In the study described in Chapter 10, the effects of
Iberogast® on proximal gastric volume, pressures in the antrum, pylorus and
duodenum, and gastric emptying were determined in healthy subjects. Iberogast®
increased proximal gastric volume and the motility index of antral PWs, without
affecting pyloric or duodenal pressures, and increased the retention of liquid in the total
stomach, without affecting gastric emptying of solids or intragastric distribution, in
healthy men. This study, accordingly establishes that Iberogast® has region-dependent
effects on gastric motility in humans, by increasing proximal gastric relaxation and
decreasing antral motility. As FD is a heterogenous disorder, in which subgroups of
patients have impaired proximal gastric relaxation and increased antral filling, these
effects may contribute to the beneficial effect of Iberogast® in FD. An immediate
priority is, therefore, to investigate the effects of Iberogast® on gastric motility and
sensitivity in patients with FD.
296

Conclusions Chapter 11
The studies presented in this thesis provide novel insights into the effects of nutrients
and the herbal medication, Iberogast®, on gastrointestinal function. Specifically, the
effects of fat and carbohydrate on gastroduodenal motility, hormone release/suppression
and appetite and energy intake in healthy subjects, and symptom generation in patients
with FD, and the effects of Iberogast® on gastroduodenal motility in healthy subjects.
Gastric motor function, hormone release and energy intake may be disturbed in obesity,
type-2 diabetes and FD, and it would be appropriate to extend these observation to these
groups.
297

APP
EN
DIX
1
DIE
T D
IAR
Y
FOO
D IN
TA
KE
SY
MPT
OM
OC
CU
RR
EN
CE
Tim
eD
escr
iptio
n of
food
and
dri
nk c
onsu
med
A
mou
ntT
ime
Sym
ptom
Seve
rity
(1 –
10)
E
XA
MPL
E07
00‘W
eetb
ix’
3 bi
scui
t m
ilk (f
ull c
ream
) 1/
2 cu
p br
ead
(whi
te)(
toas
ted)
1
slic
em
arga
rine
(low
-sal
t, po
lyun
sat)
2 ts
p or
ange
juic
e (u
nsw
eete
ned)
1
glas
s 07
05 -
0725
U
pper
abd
omin
al p
ain
4
1000
coff
ee (i
nsta
nt)
1 cu
p su
gar (
whi
te)
2 ts
p bi
scui
ts (m
ilk a
rrow
root
) Arn
ott’s
2
bisc
uit
1230
brea
d (w
hite
) 2
slic
es
mar
garin
e (lo
w-s
alt,
poly
unsa
t) Fl
ora
2 ts
p ha
m (s
have
d, sh
ould
er)
1 sl
ice
1235
– 1
240
Upp
er a
bdom
inal
pai
n 3
chee
se (l
ow-f
at c
hedd
er)
1 sl
ice
1235
- 12
55
Blo
atin
g2
1730
stea
k (b
eef)
(gril
led)
20
0 g
pota
to (w
ith sk
in)(
bake
d)
200
g be
ans (
fren
ch)(
boile
d)
60 g
br
ead
(whi
te)
1 ro
ll 17
35 -
1745
N
ause
a1
2200
milk
(ful
l cre
am)
250
ml
‘Milo
’ 2
tsp
bisc
uits
(Arn
ott’s
milk
cof
fee)
2
bisc
uits
298
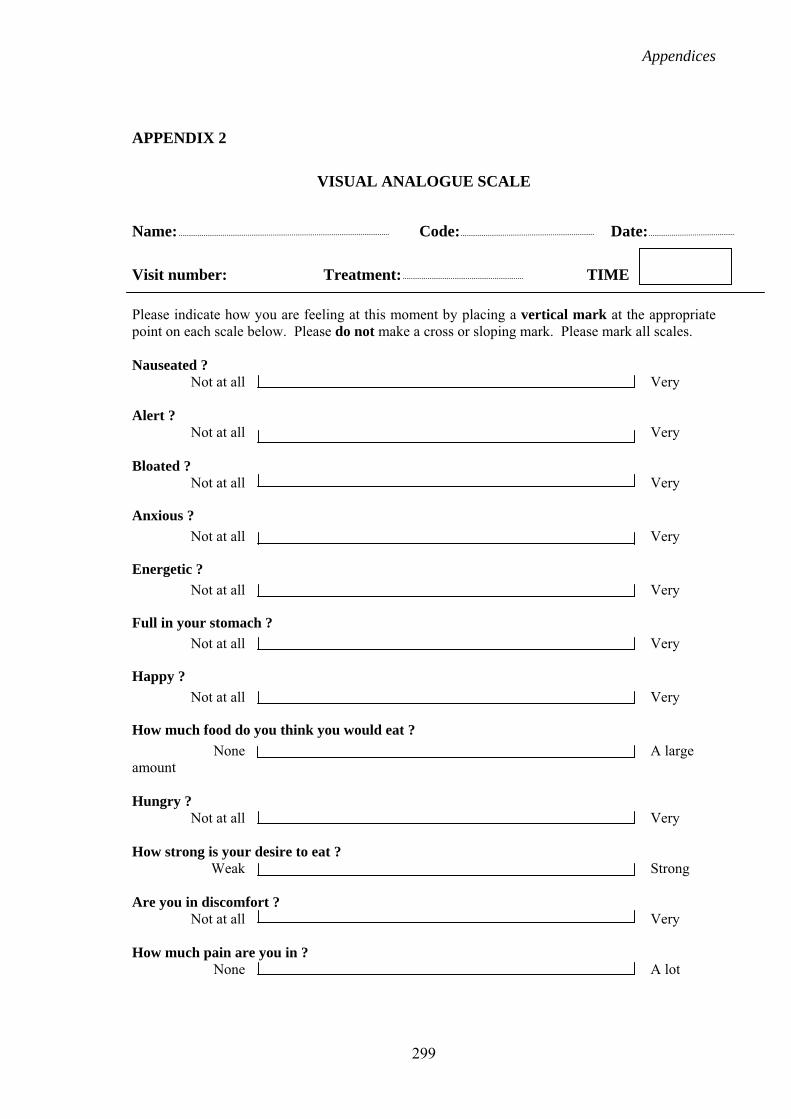
Appendices
APPENDIX 2
VISUAL ANALOGUE SCALE
Name: Code: Date:
Visit number: Treatment: TIME
Please indicate how you are feeling at this moment by placing a vertical mark at the appropriate point on each scale below. Please do not make a cross or sloping mark. Please mark all scales.
Nauseated ? Not at all Very
Alert ? Not at all Very
Bloated ? Not at all Very
Anxious ? Not at all Very
Energetic ? Not at all Very
Full in your stomach ? Not at all Very
Happy ? Not at all Very
How much food do you think you would eat ? None A largeamount
Hungry ? Not at all Very
How strong is your desire to eat ? Weak Strong
Are you in discomfort ? Not at all Very
How much pain are you in ? None A lot
299

Appendices
APPENDIX 3
VISUAL ANALOGUE SCALE
Name: Study code:
Date: Visit number:
Please rate the characteristics of the yoghurt by placing a vertical mark at the appropriate point on
each scale below. Please do not make a cross or sloping mark. Please mark all scales.
How tasty was the yoghurt ?
Very tasty Not tasty at all
How sweet was the yoghurt ?
Very sweet Not sweet at all
Rate the colour of the yoghurt:
Intense Not intense
How bitter was the yoghurt ?
Bitter Not bitter at all
How fatty was the yoghurt ?
Fatty Not fatty at all
How sour was the yoghurt ?
Sour Not sour at all
300

Appendices
APPENDIX 4
THREE FACTOR EATING QUESTIONNAIRE
Read each of the following 36 statements carefully. If you agree with the statement or feel that it is true as applied to you, answer true by circling the (T). If you disagree with the statement, or feel that it is false as applied to you, answer false by circling the (F). Be certain to answer all of the questions. *F: Factor
1. When I smell a freshly baked pizza, I find it very difficult to keep from eating, even if I
have just finished a meal. (F2)
(T) (F)
2. I usually eat too much at social occasions, like parties and picnics. (F2)
(T) (F)
3. I am usually so hungry that I eat more than three times a day. (F3)
(T) (F)
4. When I have eaten my quota of calories/fat, I am usually good about not eating any
more. (F1)
(T) (F)
5. Dieting is so hard for me because I just get too hungry. (F3)
(T) (F)
6. I deliberately take small helpings as a means of controlling my weight. (F1)
(T) (F)
7. Sometimes things just taste so good that I keep on eating even when I am no longer
hungry. (F2)
(T) (F)
8. Since I am often hungry, I sometimes wish that while I am eating, an expert would tell
me that I have had enough or that I can have something more to eat. (F3)
(T) (F)
9. When I feel anxious, I find myself eating. (F2)
(T) (F)
10. Life is too short to worry about dieting. (F1)
(T) (F)
301

Appendices
11. Since my weight goes up and down, I have gone on reducing diets more than once.
(F2)
(T) (F)
12. I often feel so hungry that I just have to eat something. (F3)
(T) (F)
13. When I am with someone who is overeating, I usually overeat too. (F2)
(T) (F)
14. I have a pretty good idea of the number of calories/grams of fat in common foods. (F1)
(T) (F)
15. Sometimes when I start eating, I just can’t seem to stop. (F2)
(T) (F)
16. It is not difficult for me to leave something on my plate. (F2)
(T) (F)
17. At certain times of the day, I get hungry because I have got used to eating then. (F3)
(T) (F)
18. While on a diet, if I eat food that is not allowed, I consciously eat less for a period of
time to make up for it. (F1)
(T) (F)
19. Being with someone who is eating often makes me hungry enough to eat also. (F3)
(T) (F)
20. When I feel blue, I often overeat. (F2)
(T) (F)
21. I enjoy eating too much to spoil it by counting calories, counting grams of fat or
watching my weight. (F1)
(T) (F)
22. When I see a real delicacy, I often get so hungry that I have to eat right away. (F3)
(T) (F)
23. I often stop eating when I am not really full as a conscious means of limiting the
amount I eat. (F1)
(T) (F)
24. I get so hungry that my stomach often seems like a bottomless pit. (F3)
(T) (F)
302

Appendices
25. My weight has hardly changed at all in the last ten years. (F2)
(T) (F)
26. I am always hungry, so it is hard for me to stop eating before I finish the food on my
plate. (F3)
(T) (F)
27. When I feel lonely, I console myself by eating. (F2)
(T) (F)
28. I consciously hold back at meals in order not to gain weight. (F1)
(T) (F)
29. I sometimes get very hungry late in the evening or at night. (F3)
(T) (F)
30. I eat anything I want any time I want. (F1)
(T) (F)
31. Without even thinking about it, I take a long time to eat. (F2)
(T) (F)
32. I count calories/grams of fat as a conscious means of controlling my weight. (F1)
(T) (F)
33. I do not eat some foods because they make me fat. (F1)
(T) (F)
34. I am always hungry enough to eat at any time. (F3)
(T) (F)
35. I pay a great deal of attention to changes in my figure. (F1)
(T) (F)
36. While on a diet, if I eat a food that is not allowed, I often then splurge and eat other
high calorie foods. (F2)
(T) (F)
303
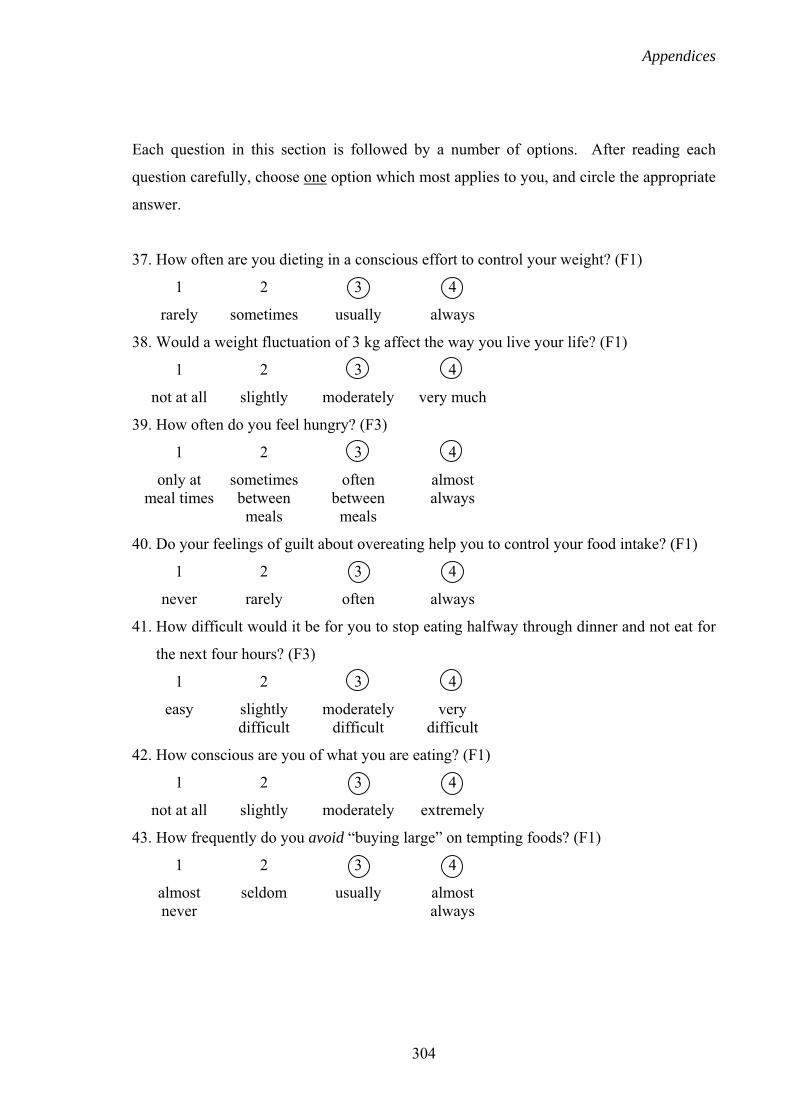
Appendices
Each question in this section is followed by a number of options. After reading each
question carefully, choose one option which most applies to you, and circle the appropriate
answer.
37. How often are you dieting in a conscious effort to control your weight? (F1)
1 2 3 4
rarely sometimes usually always
38. Would a weight fluctuation of 3 kg affect the way you live your life? (F1)
1 2 3 4
not at all slightly moderately very much
39. How often do you feel hungry? (F3)
1 2 3 4
only at sometimes often almost meal times between between always meals meals
40. Do your feelings of guilt about overeating help you to control your food intake? (F1)
1 2 3 4
never rarely often always
41. How difficult would it be for you to stop eating halfway through dinner and not eat for
the next four hours? (F3)
1 2 3 4
easy slightly moderately very difficult difficult difficult
42. How conscious are you of what you are eating? (F1)
1 2 3 4
not at all slightly moderately extremely
43. How frequently do you avoid “buying large” on tempting foods? (F1)
1 2 3 4
almost seldom usually almost never always
304

Appendices
44. How likely are you to shop for low calorie or low fat foods? (F1)
1 2 3 4
unlikely slightly moderately very likely likely likely
45. Do you eat sensibly in front of others and splurge alone? (F2)
1 2 3 4
never rarely often always
46. How likely are you to consciously eat slowly in order to cut down on how much you
eat? (F1)
1 2 3 4
unlikely slightly moderately very likely likely likely
47. How frequently do you skip dessert because you are no longer hungry (F3)
1 2 3 4
almost seldom at least almost never once a week every day
48. How likely are you to consciously eat less than you want? (F1)
1 2 3 4
unlikely slightly moderately very likely likely likely
49. Do you go on eating binges even though you are not hungry? (F2)
1 2 3 4
never rarely sometimes at least once a week
305

Appendices
50. To what extent does this statement describe your eating behaviour? (F1)
“I start dieting in the morning, but because of any number of things that happen during
the day, by evening I have given up and eat what I want, promising myself to start
dieting again tomorrow.”
1 2 3 4
not like little like pretty good describes me me description me of me perfectly
51. On a scale of 1 to 6, where 1 means no restraint in eating (eat whatever you want,
whenever you want it) and 6 means total restraint (constantly limiting food intake and
never “giving in”), what number would you give yourself? (F2)
1 eat whatever you want, whenever you want it
2 usually eat whatever you want, whenever you want it
3 often eat whatever you want, whenever you want it
4 often limit food intake, but often “give in”
5 usually limit food intake, rarely “give in”
6 constantly limit food intake, never “give in”
306

Appendices
APPENDIX 5
EATING ATTITUDES TEST
Please place an (X) under the column which applies best to each of the statements. Please answer each question carefully.
always very often some- rarely never often times
1. I like eating with other people ( ) ( ) ( ) ( 1 ) ( 2 ) ( x ) 2. I prepare food for others, but do not eat what I prepare ( x ) ( 2 ) ( 1 ) ( ) ( ) ( ) 3. I become anxious prior to eating ( x ) ( 2 ) ( 1 ) ( ) ( ) ( ) 4. I am terrified about being overweight ( x ) ( 2 ) ( 1 ) ( ) ( ) ( ) 5. I avoid eating when I am hungry ( x ) ( 2 ) ( 1 ) ( ) ( ) ( ) 6. I find myself preoccupied with food ( x ) ( 2 ) ( 1 ) ( ) ( ) ( ) 7. I have gone on eating binges where I feel
that I may not be able to stop ( x ) ( 2 ) ( 1 ) ( ) ( ) ( ) 8. I cut my food into small pieces ( x ) ( 2 ) ( 1 ) ( ) ( ) ( ) 9. I am aware of the caloric content of foods that I eat ( x ) ( 2 ) ( 1 ) ( ) ( ) ( ) 10. I particularly avoid foods with a high carbohydrate content (eg bread, potatoes, rice, etc) ( x ) ( 2 ) ( 1 ) ( ) ( ) ( ) 11. I feel bloated after meals ( x ) ( 2 ) ( 1 ) ( ) ( ) ( ) 12. I feel that others would prefer if I ate more ( x ) ( 2 ) ( 1 ) ( ) ( ) ( ) 13. I vomit after I have eaten ( x ) ( 2 ) ( 1 ) ( ) ( ) ( ) 14. I feel extremely guilty after eating ( x ) ( 2 ) ( 1 ) ( ) ( ) ( ) 15. I am preoccupied with a desire to be thinner ( x ) ( 2 ) ( 1 ) ( ) ( ) ( ) 16. I exercise strenuously to bum off calories ( x ) ( 2 ) ( 1 ) ( ) ( ) ( ) 17. I weigh myself several times a day ( x ) ( 2 ) ( 1 ) ( ) ( ) ( ) 18. I like my clothes to fit tightly ( ) ( ) ( ) ( 1 ) ( 2 ) ( x ) 19. I enjoy eating meat ( ) ( ) ( ) ( 1 ) ( 2 ) ( x ) 20. I wake up early in the morning ( x ) ( 2 ) ( 1 ) ( ) ( ) ( ) 21. I eat the same foods day after day ( x ) ( 2 ) ( 1 ) ( ) ( ) ( ) 22. I think about burning up calories when I exercise ( x ) ( 2 ) ( 1 ) ( ) ( ) ( ) 23. I have regular menstrual periods ( ) ( ) ( ) ( 1 ) ( 2 ) ( x ) 24. Other people think that I am too thin ( x ) ( 2 ) ( 1 ) ( ) ( ) ( ) 25. I am preoccupied with the thought of having fat on my body ( x ) ( 2 ) ( 1 ) ( ) ( ) ( ) 26. I take longer than others to eat my meals ( x ) ( 2 ) ( 1 ) ( ) ( ) ( ) 27. I enjoy eating at restaurants ( ) ( ) ( ) ( 1 ) ( 2 ) ( x ) 28. I take laxatives ( x ) ( 2 ) ( 1 ) ( ) ( ) ( ) 29. I avoid foods with sugar in them ( x ) ( 2 ) ( 1 ) ( ) ( ) ( ) 30. I eat diet foods ( x ) ( 2 ) ( 1 ) ( ) ( ) ( ) 31. I feel that food controls my life ( x ) ( 2 ) ( 1 ) ( ) ( ) ( ) 32. I display self control around food ( x ) ( 2 ) ( 1 ) ( ) ( ) ( ) 33. I feel that others pressure me to eat ( x ) ( 2 ) ( 1 ) ( ) ( ) ( ) 34. I give too much time and thought to food ( x ) ( 2 ) ( 1 ) ( ) ( ) ( ) 35. I suffer from constipation ( x ) ( 2 ) ( 1 ) ( ) ( ) ( ) 36. I feel uncomfortable after eating sweets ( x ) ( 2 ) ( 1 ) ( ) ( ) ( ) 37. I engage in dieting behaviour ( x ) ( 2 ) ( 1 ) ( ) ( ) ( ) 38. I like my stomach to be empty ( x ) ( 2 ) ( 1 ) ( ) ( ) ( ) 39. I enjoy trying rich new foods ( ) ( ) ( ) ( 1 ) ( 2 ) ( x ) 40. I have the impulse to vomit after meals ( x ) ( 2 ) ( 1 ) ( ) ( ) ( )
Score: the selected column receives the corresponding score; 0, 1, 2, 3 (“x”)
307

Appendices
APPENDIX 6
NWRLC FAT INTAKE SCALE
Check the answer which best describes the way you have been eating over the past month.
1. How many ounces of meat, fish or poultry do you usually eat? _ 1. I do not eat meat, fish or poultry. _ 2. I eat 3 ounces or less per day. _ 3. I eat 4-6 ounces per day. _ 4. I eat 7 or more ounces per day.
*3 ounces of meat, fish or chicken in any ONE of the following: 1 regular hamburger, 1 chicken breast, 1 chicken leg (thigh and drumstick), 1 pork chop or 3 slices of pre-sliced lunch meat.
2. How much cheese do you eat per week? _ 1. I do not eat cheese. _ 2. I eat whole milk cheese less than once a week and/or use only low fat cheese
such as diet cheese, low fat cottage cheese, or ricotta. _ 3. I eat whole milk cheese once or twice per week (such as cheddar, swiss,
monterey jack). _ 4. I eat whole milk cheese three of more times per week.
3. What type of milk do you use? _ 1. I use only skim or 1% milk or don’t use milk.
_ 2. I usually use skim milk or 1% milk but use others occasionally. _ 3. I usually use 2% or whole milk.
4. How many visible egg yolks do you use per week? _ 1. I avoid all egg yolks or use less than one per week and/or use on egg
substitute. _ 2. I eat 1-2 egg yolks per week. _ 3. I eat 3 or more egg yolks per week.
5. How often do you eat these meats: regular hamburger, bologna, salami, hot dogs, corned beef, spareribs, sausage, bacon, braunsweiger, or liver? Do not count others. _ 1. I do not eat any of these meats.
_ 2. I eat them about once per week or less. _ 3. I eat them about 2 to 4 times per week. _ 4. I eat more than 4 servings per week.
308

Appendices
6. How many commercial baked goods and how much regular ice cream do you usually eat? (Example: cake, cookies, coffee cake, sweet rolls, donuts, etc. Do not count low fat versions.)
_ 1. I do not eat commercial baked goods and ice cream. _ 2. I eat commercial baked goods or ice cream once per week or less. _ 3. I eat commercial baked goods or ice cream 2 to 4 times per week. _ 4. I eat commercial baked goods or ice cream more than 4 times per week.
7. Which is the main type of fat you cook with? _ 1. I use nonstick spray or I do not use fat in cooking. _ 2. I use liquid oil (Examples: safflower, sunflower, corn, soybean, and olive
oil.) _ 3. I use margarine. _ 4. I use butter, shortening, bacon drippings, or lard.
8. How often do you eat snack foods such as chips, fries or party cracker? _ 1. I do not eat these snack foods. _ 2. I eat one serving of these snacks per week. _ 3. I eat thee snacks 2 to 4 times per week.
9. What spread do you usually use on bread, vegetables, etc? _ 1. I do not use any spread. _ 2. I use diet or light margarine. _ 3. I use margarine. _ 4. I use butter.
10. How often do you eat as a snack candy bars, chocolate or nuts? _ 1. Less than once per week. _ 2. One to 3 times per week. _ 3. More than 3 times per week.
11. When you use recipes or convenience foods, how often are they low fat? _ 1. Almost always. _ 2. Usually. _ 3. Sometimes. _ 4. Seldom or never.
12. When you eat away from home, how often do you choose low fat foods? _ 1. Almost always. _ 2. Usually. _ 3. Sometimes. _ 4. Seldom or never.
To score: Add the points for each answer. If you have 24 or less, your diet is moderate to low in fat and cholesterol. If your score is greater than 24, look for high fat choices you could change.
309

Appendices
APPENDIX 7
NEPEAN DYSPEPSIA INDEX
NDI
Thank you for helping us with this research. This questionnaire contains
detailed questions about your stomach problems, and how they are
affecting you and your life.
Some of the questions are quite personal, but the information you provide
will be treated with confidentiality and sensitivity.
THIS IS THE UPPER ABDOMEN (stomach)
Navel (belly button)
310

Appendices
1. In the table below, please WRITE NUMBERS to indicate the frequency, intensity, and bothersomeness of any stomach problems you have had in the last TWO WEEKS. The diagram on the front page shows your "UPPER ABDOMEN" - please look at this diagram when answering items about problems with your "UPPER ABDOMEN".
DURING THE LAST TWO
WEEKS,
DID YOU HAVE ANY OF
THE FOLLOWING
STOMACH PROBLEMS?
How OFTEN did you have it?
0 = Not at all 1 = One to four days 2 = Five to eight days
3 = Nine to twelve days 4 = Every day / almost
every day
If you had this problem,
how INTENSE was it usually?
0 = Not at all 1 = Very mild
2 = Mild 3 = Moderate
4 = Severe 5 = Very severe
If you had this problem, how BOTHERSOME
was it? 0 = Not at all 1 = A little bit 2 = Moderately 3 = Quite a bit 4 = Extremely
PAIN OR ACHE IN UPPER ABDOMEN
DISCOMFORT IN UPPER ABDOMEN
BURNING SENSATION IN UPPER ABDOMEN
BURNING SENSATION IN CHEST (HEARTBURN)
CRAMPS IN UPPER ABDOMEN
PAIN OR ACHE IN CHEST
INABILITY TO FINISH A REGULAR MEAL
BITTER / SOUR TASTING FLUID THAT COMES UP INTO YOUR MOUTH OR THROAT
FULLNESS AFTER EATING OR SLOW DIGESTION
PRESSURE IN UPPER ABDOMEN
BLOATING IN UPPER ABDOMEN
NAUSEA
BURPING / BELCHING
VOMITING
BAD BREATH
311

Appendices
THE FIGURE ON THE FRONT PAGE SHOWS YOUR UPPER ABDOMEN. THE REMAINING QUESTIONS WHICH ASK ABOUT "STOMACH PROBLEMS" ARE
REFERRING TO PAIN, DISCOMFORT, OR OTHER PROBLEMS WITH YOUR UPPER ABDOMEN.
1. Have your stomach problems (remember, this means pain, discomfort or other problems in your upper abdomen) been interfering with your daily activities during the last 2 weeks?
1 STOMACH PROBLEMS DID NOT INTERFERE WITH USUAL ACTIVITIES 2 STOMACH PROBLEMS DISTRACTED ME FROM MY USUAL ACTIVITIES 3 STOMACH PROBLEMS PREVENTED MY USUAL ACTIVITIES 4 STOMACH PROBLEMS HAVE REQUIRED BEDREST
2. Have you felt UPSET or ANNOYED in the last 2 weeks by not being able to adequately CONTROL or CURE your stomach problems?
1 NOT AT ALL OR NOT APPLICABLE (my symptoms are adequately controlled or cured)
2 A LITTLE 3 MODERATELY 4 QUITE A LOT 5 EXTREMELY
3. Have you felt UPSET or ANNOYED in the last 2 weeks by NOT KNOWING what CAUSES your stomach problems?
1 NOT AT ALL OR NOT APPLICABLE (I know what causes my stomach problems) 2 A LITTLE 3 MODERATELY 4 QUITE A LOT 5 EXTREMELY
IN THE NEXT QUESTIONS, “DRINKING” MEAN BOTH NON-ALCOHOLIC DRINKS (SOFT DRINKS, JUICE, MILK, WATER, TEA, COFFEE, ETC) AND
ALCOHOLIC DRINKS (WINE, BEER, SPIRITS, ETC). PLEASE THINK ABOUT ALL THESE TYPE OF DRINKS WHEN ANSWERING THE NEXT THREE
QUESTIONS.
4. Has your ABILITY to EAT or DRINK (including when, what, and how much) been disturbed by your stomach problems in the last 2 weeks?
1 NOT AT ALL 2 A LITTLE 3 MODERATELY 4 QUITE A LOT 5 EXTREMELY
312

Appendices
QUESTIONS ASKING ABOUT "STOMACH PROBLEMS" REFER TO PAIN, DISCOMFORT, OR OTHER PROBLEMS WITH YOUR UPPER ABDOMEN.
5. Did you CHANGE YOUR DIET because of your stomach problems in the last 2 weeks?
1 NOT AT ALL 2 A LITTLE 3 MODERATELY 4 QUITE A LOT 5 EXTREMELY
6. In the last 2 weeks, have your stomach problems disturbed your ENJOYMENT of EATING and/or DRINKING (including your appetite, and how you feel afterwards)?
1 NOT AT ALL 2 A LITTLE 3 MODERATELY 4 QUITE A LOT 5 EXTREMELY
7. Has your ABILITY to SLEEP been disturbed by your stomach problems in the last 2 weeks?
1 NOT AT ALL 2 A LITTLE 3 MODERATELY 4 QUITE A LOT 5 EXTREMELY
8. Has the QUALITY of your SLEEP been disturbed by your stomach problems in the last 2 weeks?
1 NOT AT ALL 2 A LITTLE 3 MODERATELY 4 QUITE A LOT 5 EXTREMELY
9. Has your ABILITY to WORK or STUDY been disturbed by your stomach problems in the last 2 weeks?
1 NOT AT ALL OR NOT APPLICABLE (I do not work or study) 2 A LITTLE 3 MODERATELY 4 QUITE A LOT 5 EXTREMELY
313

Appendices
10. Has your ENJOYMENT of WORK or STUDY been disturbed by your stomach problems in the last 2 weeks?
1 NOT AT ALL OR NOT APPLICABLE (I have not worked or studied in the last 2 weeks)
2 A LITTLE 3 MODERATELY 4 QUITE A LOT 5 EXTREMELY
11. Excluding work or study, has your ABILITY to perform your usual daily tasks (like housework, yard work, or other necessary activities of everyday life) been disturbed by your stomach problems in the last 2 weeks?
1 NOT AT ALL 2 A LITTLE 3 MODERATELY 4 QUITE A LOT 5 EXTREMELY
12. Excluding work or study, has your ENJOYMENT of your usual daily tasks (like housework, yard work, or other necessary activities of everyday life) been disturbed by your stomach problems in the last 2 weeks?
1 NOT AT ALL 2 A LITTLE 3 MODERATELY 4 QUITE A LOT 5 EXTREMELY
13. Has your ENJOYMENT of time spent with FRIENDS or other SOCIAL ACTIVITIES been disturbed by your stomach problems in the last 2 weeks?
1 NOT AT ALL OR NOT APPLICABLE 2 A LITTLE 3 MODERATELY 4 QUITE A LOT 5 EXTREMELY
14. Has your ABILITY to engage in things you usually do for LEISURE (like recreation, going out, hobbies, sports) been disturbed by your stomach problems in the last 2 weeks?
1 NOT AT ALL 2 A LITTLE 3 MODERATELY 4 QUITE A LOT 5 EXTREMELY
314

Appendices
15. Has your ENJOYMENT of things you usually do for LEISURE (like recreation, going out, hobbies, sports) been disturbed by your stomach problems in the last 2 weeks?
1 NOT AT ALL OR NOT APPLICABLE (I have not been able to do any of these things in the past 2 weeks)
2 A LITTLE 3 MODERATELY 4 QUITE A LOT 5 EXTREMELY
QUESTIONS ASKING ABOUT "STOMACH PROBLEMS" REFER TO PAIN, DISCOMFORT, OR
OTHER PROBLEMS WITH YOUR UPPER ABDOMEN.
16. Has your GENERAL EMOTIONAL WELL-BEING been disturbed by your stomach problems in the last 2 weeks?
1 NOT AT ALL 2 A LITTLE 3 MODERATELY 4 QUITE A LOT 5 EXTREMELY
17. Have you been ANXIOUS, NERVOUS, or WORRIED in the last 2 weeks because of your stomach problems?
1 NOT AT ALL 2 A LITTLE 3 MODERATELY 4 QUITE A LOT 5 EXTREMELY
18. Have you been DEPRESSED, SAD, or MISERABLE in the last 2 weeks because of your stomach problems?
1 NOT AT ALL 2 A LITTLE 3 MODERATELY 4 QUITE A LOT 5 EXTREMELY
315

Appendices
19. Have you been IRRITABLE, TENSE or FRUSTRATED in the last 2 weeks because of your stomach problems?
1 NOT AT ALL 2 A LITTLE 3 MODERATELY 4 QUITE A LOT 5 EXTREMELY
20. Have you felt HELPLESS or LACKING EMOTION or MOTIVATION in the last 2 weeksbecause of your stomach problems?
1 NOT AT ALL 2 A LITTLE 3 MODERATELY 4 QUITE A LOT 5 EXTREMELY
21. Have you had DIFFICULTY THINKING or CONCENTRATING in the last 2 weeks because of your stomach problems?
1 NOT AT ALL 2 A LITTLE 3 MODERATELY 4 QUITE A LOT 5 EXTREMELY
QUESTIONS ASKING ABOUT "STOMACH PROBLEMS" REFER TO PAIN, DISCOMFORT, OR
OTHER PROBLEMS WITH YOUR UPPER ABDOMEN.
22. Have you WONDERED whether your stomach problems might be due to a very SERIOUS illness (such as cancer or a heart problem), in the last 2 weeks?
1 ALMOST NEVER 2 SOMETIMES 3 FAIRLY OFTEN 4 VERY OFTEN 5 ALWAYS
23. Have you WONDERED whether you will ALWAYS have these stomach problems, in the last 2 weeks?
1 ALMOST NEVER 2 SOMETIMES 3 FAIRLY OFTEN 4 VERY OFTEN 5 ALWAYS
316

Appendices
24. Have you felt TIRED, WEAK OR LOW IN ENERGY in the last 2 weeks because of your stomach problems?
1 NOT AT ALL 2 A LITTLE 3 MODERATELY 4 QUITE A LOT 5 EXTREMELY
25. Has your OVERALL HEALTH been affected by your stomach problems in the last 2 weeks?
1 NOT AT ALL 2 A LITTLE 3 MODERATELY 4 QUITE A LOT 5 EXTREMELY
317
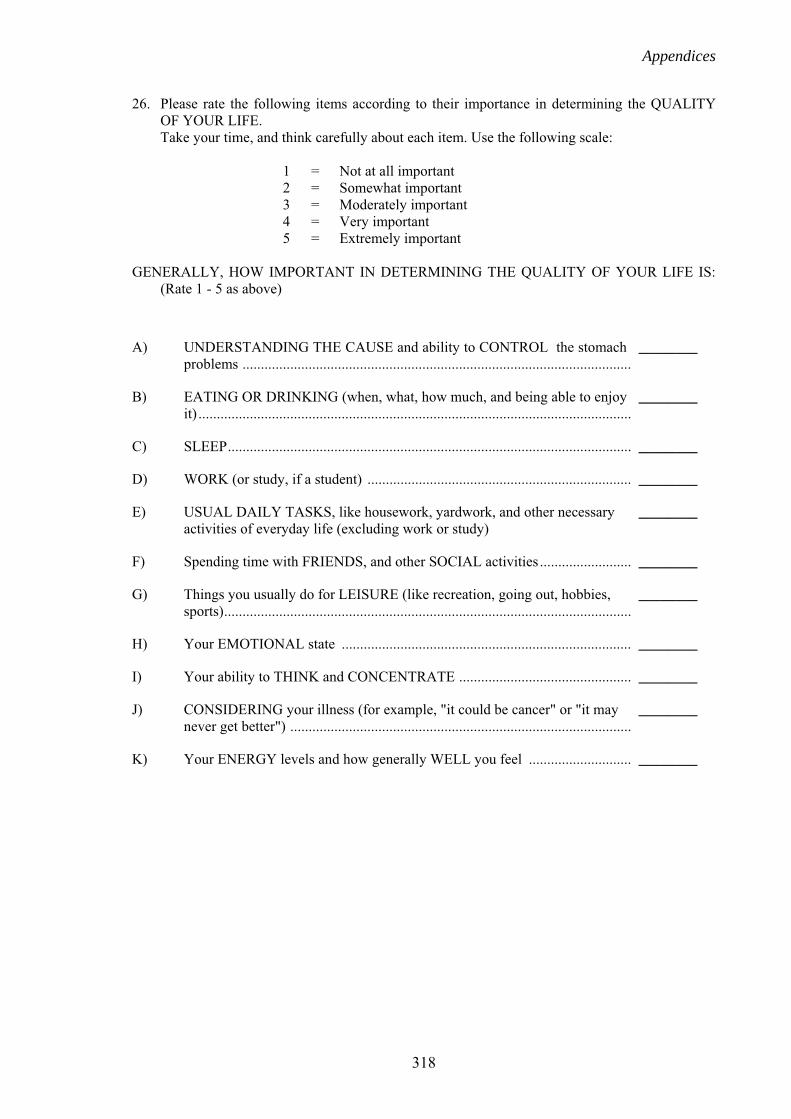
Appendices
26. Please rate the following items according to their importance in determining the QUALITY OF YOUR LIFE.
Take your time, and think carefully about each item. Use the following scale:
1 = Not at all important 2 = Somewhat important 3 = Moderately important 4 = Very important 5 = Extremely important
GENERALLY, HOW IMPORTANT IN DETERMINING THE QUALITY OF YOUR LIFE IS: (Rate 1 - 5 as above)
A) UNDERSTANDING THE CAUSE and ability to CONTROL the stomach problems ..........................................................................................................
________
B) EATING OR DRINKING (when, what, how much, and being able to enjoy it) ......................................................................................................................
________
C) SLEEP.............................................................................................................. ________
D) WORK (or study, if a student) ........................................................................ ________
E) USUAL DAILY TASKS, like housework, yardwork, and other necessary activities of everyday life (excluding work or study)
________
F) Spending time with FRIENDS, and other SOCIAL activities ......................... ________
G) Things you usually do for LEISURE (like recreation, going out, hobbies, sports)...............................................................................................................
________
H) Your EMOTIONAL state ............................................................................... ________
I) Your ability to THINK and CONCENTRATE ............................................... ________
J) CONSIDERING your illness (for example, "it could be cancer" or "it may never get better") .............................................................................................
________
K) Your ENERGY levels and how generally WELL you feel ............................ ________
318

Appendices
APPENDIX 8
EYSENCK
The following questions refer to how you have been feeling generally, not just how you feel today. Please answer each question by putting a circle around the ‘YES’ or ‘NO’ that follows each question. There are no right or wrong answers, and no trick questions. Please work quickly and do not think too long about the exact meaning of the question.
YES NO 1. Does your mood often go up and down? 1 2
2. Are you a talkative person? 1 2
3. Do you ever feel ‘just miserable’ for no reason? 1 2
4. Are you rather lively? 1 2
5. Are you an irritable person? 1 2
6. Do you enjoy meeting new people? 1 2
7. Are your feelings easily hurt? 1 2
8. Can you usually let yourself go and enjoy yourself at a lively party? 1 2
9. Do you often feel ‘fed up’? 1 2
10. Do you usually take the initiative in making new friends? 1 2
11. Would you call yourself a nervous person? 1 2
12. Can you easily get some life into a rather dull party? 1 2
13. Are you a worrier? 1 2
14. Do you tend to keep in the background on social occasions? 1 2
15. Would you call yourself highly strung? 1 2
16. Do you like mixing with people? 1 2
17. Do you worry too long after an embarrassing experience? 1 2
18. Do you like plenty of bustle and excitement around you? 1 2
19. Do you suffer from nerves? 1 2
20. Are you mostly quiet when you are with other people? 1 2
21. Do you often feel lonely? 1 2
22. Do other people think of you as being lonely? 1 2
23. Are you often troubled about feelings of guilt? 1 2
24. Can you get a party going? 1 2
Score: Yes = 1, No = 0 (questions 1 - 13 and 15 - 19 and 21 - 24) Yes = 0, No = 1 (Question 14 and 20)
319
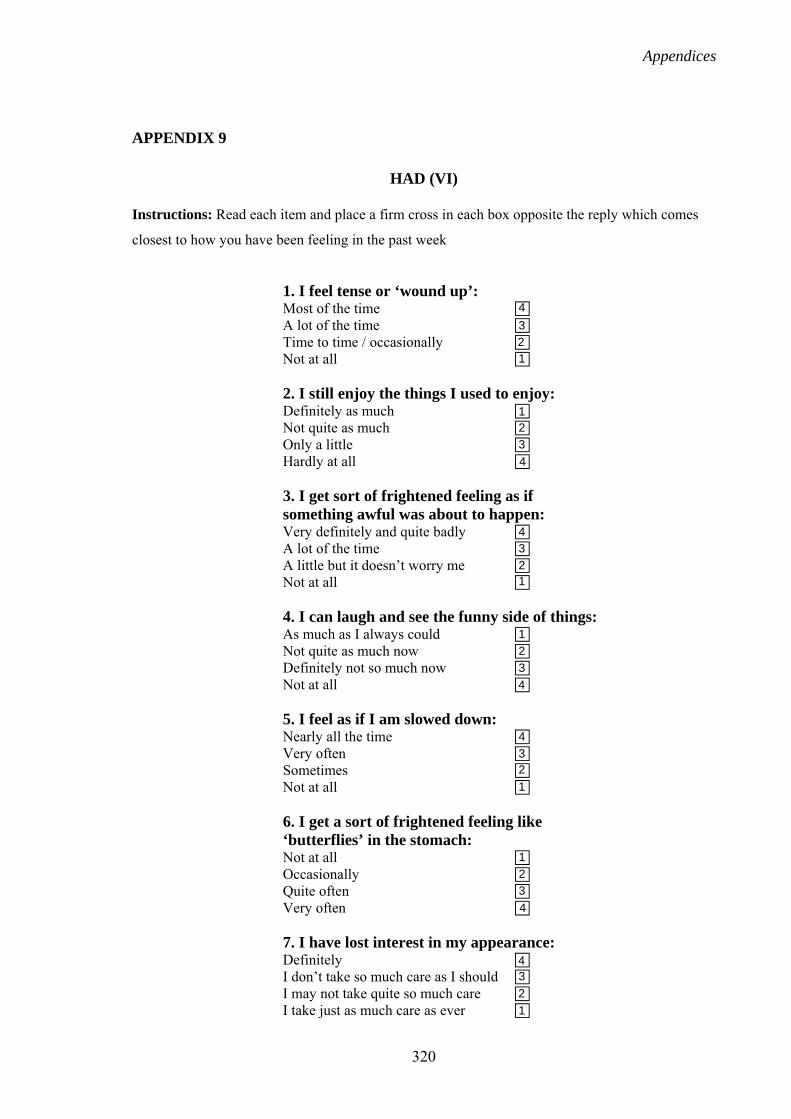
Appendices
APPENDIX 9
HAD (VI)
Instructions: Read each item and place a firm cross in each box opposite the reply which comes
closest to how you have been feeling in the past week
1. I feel tense or ‘wound up’: Most of the time �A lot of the time �
4
Time to time / occasionally �3
Not at all �21
2. I still enjoy the things I used to enjoy: Definitely as much �Not quite as much �
1
Only a little �2
Hardly at all �34
3. I get sort of frightened feeling as if something awful was about to happen: Very definitely and quite badly �A lot of the time �
4
A little but it doesn’t worry me �3
Not at all �12
4. I can laugh and see the funny side of things:As much as I always could �Not quite as much now �
1
Definitely not so much now �2
Not at all �34
5. I feel as if I am slowed down:Nearly all the time �Very often �
4
Sometimes �3
Not at all �21
6. I get a sort of frightened feeling like‘butterflies’ in the stomach: Not at all �Occasionally �
1
Quite often �2
Very often �34
7. I have lost interest in my appearance: Definitely �I don’t take so much care as I should �I may not take quite so much care �
34
I take just as much care as ever �21
320

Appendices
8. I feel restless as if I have been on the move: Very much indeed �Quite a lot �
4
Not very much �3
Not at all �21
9. Worrying thoughts go through my mind: A great deal of the time �A lot of the time �
4
From time to time but not that often �3
Not at all �21
10. I feel cheerful: Not at all �Not often �
4
Sometimes �3
Most of the time �21
11. I can sit at ease and relaxed: Definitely �Usually �Not often �
21
Not at all �34
12. I look forward with enjoyment to things: As much as I ever did �Rather less than I used to �
1
Definitely �2
Hardly at all �34
13. I get sudden feelings of panic: Very often indeed �Quite often �
4
Not very often �3
Not at all �21
14. I can enjoy a good book or radio or TV program:
1
Often �Sometimes �
1
Not often �2
Very seldom �34
321

Appendices
APPENDIX 10
ZUNG SELF-RATING SCALE
Please answer the questions by marking the box that best describes your response. If a question does not apply, mark the box that is closest to answering your question.
None or a little of the time
Some of the time
Good part of the time
Most or all of the time
1. I feel downhearted, blue an sad 1 2 3 42. Morning is when I feel the best 4 3 2 13. I have crying spells or feel like it 1 2 3 44. I have trouble sleeping through the night
1 2 3 4
5. I eat as much as I used to do 4 3 2 16. I enjoy looking at, talking to, an being with attractive women/men
4 3 2 1
7. I notice that I am losing weight 1 2 3 48. I have trouble with constipation 1 2 3 49. My heart beats faster than usual 1 2 3 410. I get tired for no reason 1 2 3 411. My mind is as clear as it used to be
4 3 2 1
12. I find it easy to do the things I used to
4 3 2 1
13. I am restless and can’t sleep 1 2 3 414. I feel hopeful about the future 4 3 2 115. I am more irritable than usual 1 2 3 416. I find it easy to make dscisions 4 3 2 117. I feel that I am useful and needed
4 3 2 1
18. My life is pretty full 4 3 2 119. I feel that others would be better off if I were dead
1 2 3 4
20. I still enjoy the things I used to do
4 3 2 1
322

References
REFERENCES
Accarino, AM, Azpiroz, F and Malagelada, JR 1997, 'Attention and distraction: effects
on gut perception', Gastroenterology, vol. 113, no. 2, pp. 415-422.
Adrian, TE, Ferri, GL, Bacarese-Hamilton, AJ, Fuessl, HS, Polak, JM and Bloom, SR
1985, 'Human distribution and release of a putative new gut hormone, peptide
YY', Gastroenterology, vol. 89, no. 5, pp. 1070-1077.
Agreus, L 1993, 'Socio-economic factors, health care consumption and rating of
abdominal symptom severity. A report from the abdominal symptom study',
Fam Pract, vol. 10, no. 2, pp. 152-163.
Ahluwalia, NK, Thompson, DG, Mamtora, H and Hindle, J 1996, 'Evaluation of gastric
antral motor performance in patients with dysmotility-like dyspepsia using real-
time high-resolution ultrasound', Neurogastroenterol Motil, vol. 8, no. 4, pp.
333-338.
Ammon, H 1986, 'Untersuchungen über die Wirkung von STW5 (Iberogast®), STW6
(Iberis amara Frischpflanzenauszug) und STW7 (Iberogast ®-Drogen ohne
Iberis) auf die durch Acetylcholin ausgelöste Kontraktion des isolierten
Meerschweinchendarmes [Investigation of the action of STW5 (Iberogast),
STW6 (Iberis amara fresh plant extract) and STW7 (Iberogast drugs without
Iberis amara) on the contraction of isolated guinea pig intestine induced by
acetylcholine]', Pharmazeutisches Institut der Univ. Tubingen, Lehrstuhl
Pharmakologie fur Naturwissenschaftler, vol. STW FD 01/86. Darmstadt,
Steigerwald.
323

References
Ammon, HP, Kelber, O and Okpanyi, SN 2006, 'Spasmolytic and tonic effect of
Iberogast (STW 5) in intestinal smooth muscle', Phytomedicine, vol. 13, no.
Suppl 5, pp. 67-74.
Andrews, JM, Doran, S, Hebbard, GS, Rassias, G, Sun, WM and Horowitz, M 1998,
'Effect of glucose supplementation on appetite and the pyloric motor response to
intraduodenal glucose and lipid', Am J Physiol, vol. 274, pp. G645-652.
Andrews, JM, Doran, SM, Hebbard, GS, Malbert, CH, Horowitz, M and Dent, J 2001,
'Nutrient-induced spatial patterning of human duodenal motor function.' Am J
Physiol, vol. 280, pp. G501-509.
Aponte, GW, Fink, AS, Meyer, JH, Tatemoto, K and Taylor, IL 1985, 'Regional
distribution and release of peptide YY with fatty acids of different chain length',
Am J Physiol, vol. 249, no. 6 Pt 1, pp. G745-750.
Archimandritis, A, Tzivras, M, Fertakis, A, Emmanuel, A, Laoudi, F, Kalantzis, N,
Anthopoulou, H and Michailidis, D 1992, 'Cisapride, metoclopramide, and
ranitidine in the treatment of severe nonulcer dyspepsia', Clin Ther, vol. 14, no.
4, pp. 553-561.
Arora, A and Sharma, MP 1990, 'Use of banana in non-ulcer dyspepsia', Lancet, vol.
335, no. 8689, pp. 612-613.
Arts, J, Caenepeel, P, Verbeke, K and Tack, J 2005, 'Influence of erythromycin on
gastric emptying and meal related symptoms in functional dyspepsia with
delayed gastric emptying', Gut, vol. 54, no. 4, pp. 455-460.
Azpiroz, F and Malagelada, JR 1985a, 'Intestinal control of gastric tone', Am J Physiol,
vol. 249, pp. G501-509.
Azpiroz, F and Malagelada, JR 1985b, 'Physiological variations in canine gastric tone
measured by an electronic barostat', Am J Physiol, vol. 248, pp. G229-237.
324

References
Azpiroz, F and Malagelada, JR 1987, 'Gastric tone measured by an electronic barostat in
health and postsurgical gastroparesis', Gastroenterology, vol. 92, no. 4, pp. 934-
943.
Azpiroz, F and Malagelada, JR 1990, 'Isobaric intestinal distension in humans: sensorial
relay and reflex gastric relaxation', Am J Physiol, vol. 258, no. 2 Pt 1, pp. G202-
207.
Barbera, R, Feinle, C and Read, NW 1995a, 'Abnormal sensitivity to duodenal lipid
infusion in patients with functional dyspepsia', Eur J Gastroenterol Hepatol, vol.
7, no. 11, pp. 1051-1057.
Barbera, R, Feinle, C and Read, NW 1995b, 'Nutrient-specific modulation of gastric
mechanosensitivity in patients with functional dyspepsia', Dig Dis Sci, vol. 40,
no. 8, pp. 1636-1641.
Barker, GR, Cochrane, GM, Corbett, GA, Hunt, JN and Roberts, SK 1974, 'Actions of
glucose and potassium chloride on osmoreceptors slowing gastric emptying', J
Physiol (Lond), vol. 237, no. 1, pp. 183-186.
Barnett, JL and Owyang, C 1988, 'Serum glucose concentration as a modulator of
interdigestive gastric motility', Gastroenterology, vol. 94, no. 3, pp. 739-744.
Batterham, RL, Cohen, MA, Ellis, SM, Le Roux, CW, Withers, DJ, Frost, GS, Ghatei,
MA and Bloom, SR 2003a, 'Inhibition of food intake in obese subjects by
peptide YY3-36', N Engl J Med, vol. 349, no. 10, pp. 941-948.
Batterham, RL, Cowley, MA, Small, CJ, Herzog, H, Cohen, MA, Dakin, CL, Wren,
AM, Brynes, AE, Low, MJ, Ghatei, MA, Cone, RD and Bloom, SR 2002, 'Gut
hormone PYY(3-36) physiologically inhibits food intake', Nature, vol. 418, no.
6898, pp. 650-654.
325

References
Batterham, RL, Le Roux, CW, Cohen, MA, Park, AJ, Ellis, SM, Patterson, M, Frost,
GS, Ghatei, MA and Bloom, SR 2003b, 'Pancreatic polypeptide reduces appetite
and food intake in humans', J Clin Endocrinol Metab, vol. 88, no. 8, pp. 3989-
3992.
Beglinger, C, Degen, L, Matzinger, D, D'Amato, M and Drewe, J 2001, 'Loxiglumide, a
CCK-A receptor antagonist, stimulates calorie intake and hunger feelings in
humans', Am J Physiol, vol. 280, no. 4, pp. R1149-1154.
Bennett, E, Beaurepaire, J, Langeluddecke, P, Kellow, J and Tennant, C 1991, 'Life
stress and non-ulcer dyspepsia: a case-control study', J Psychosom Res, vol. 35,
no. 4-5, pp. 579-590.
Benson, JM, Zorn, SL and Book, LS 1995, 'Sumatriptan in the treatment of cyclic
vomiting', Ann Pharmacother, vol. 29, no. 10, pp. 997-999.
Bernersen, B, Johnsen, R and Straume, B 1996, 'Non-ulcer dyspepsia and peptic ulcer:
the distribution in a population and their relation to risk factors', Gut, vol. 38, no.
6, pp. 822-825.
Best, R, Lewis, DA and Nasser, N 1984, 'The anti-ulcerogenic activity of the unripe
plantain banana (Musa species)', Br J Pharmacol, vol. 82, no. 1, pp. 107-116.
Bjornsson, ES, Urbanavicius, V, Eliasson, B, Attvall, S, Smith, U and Abrahamsson, H
1995, 'Effects of insulin and beta-adrenergic blockade on the migrating motor
complex in humans', Scand J Gastroenterol, vol. 30, no. 3, pp. 219-224.
Blackshaw, LA, Grundy, D and Scratcherd, T 1987, 'Vagal afferent discharge from
gastric mechanoreceptors during contraction and relaxation of the ferret corpus',
J Auton Nerv Syst, vol. 18, no. 1, pp. 19-24.
326

References
Bland, JM and Altman, DG 1995, 'Calculating correlation coefficients with repeated
observations: Part 1--Correlation within subjects', BMJ, vol. 310, no. 6977, pp.
446.
Boeckxstaens, GE, Hirsch, DP, Kuiken, SD, Heisterkamp, SH and Tytgat, GN 2002,
'The proximal stomach and postprandial symptoms in functional dyspeptics', Am
J Gastroenterol, vol. 97, no. 1, pp. 40-48.
Boeckxstaens, GE, Hirsch, DP, van den Elzen, BD, Heisterkamp, SH and Tytgat, GN
2001, 'Impaired drinking capacity in patients with functional dyspepsia:
relationship with proximal stomach function', Gastroenterology, vol. 121, no. 5,
pp. 1054-1063.
Borovicka, J, Schwizer, W, Guttmann, G, Hartmann, D, Kosinski, M, Wastiel, C,
Bischof-Delaloye, A and Fried, M 2000, 'Role of lipase in the regulation of
postprandial gastric acid secretion and emptying of fat in humans: a study with
orlistat, a highly specific lipase inhibitor', Gut, vol. 46, no. 6, pp. 774-781.
Bortolotti, M, Coccia, G, Grossi, G and Miglioli, M 2002, 'The treatment of functional
dyspepsia with red pepper', Aliment Pharmacol Ther, vol. 16, no. 6, pp. 1075-
1082.
Boyd, KA, O'Donovan, DG, Doran, S, Wishart, J, Chapman, IM, Horowitz, M and
Feinle, C 2003, 'High-fat diet effects on gut motility, hormone, and appetite
responses to duodenal lipid in healthy men', Am J Physiol, vol. 285, pp. G188-
196.
Bradette, M, Pare, P, Douville, P and Morin, A 1991, 'Visceral perception in health and
functional dyspepsia. Crossover study of gastric distension with placebo and
domperidone', Dig Dis Sci, vol. 36, no. 1, pp. 52-58.
327

References
Brennan, IM, Feltrin, KL, Horowitz, M, Smout, AJ, Meyer, JH, Wishart, J and Feinle-
Bisset, C 2005, 'Evaluation of interactions between CCK and GLP-1 in their
effects on appetite, energy intake and antropyloroduodenal motility in healthy
men', Am J Physiol, vol. 288, pp. R1477-1485.
Brown, JE and Rice-Evans, CA 1998, 'Luteolin-rich artichoke extract protects low
density lipoprotein from oxidation in vitro', Free Radic Res, vol. 29, no. 3, pp.
247-255.
Buchert, D 1994, 'Wirkung einer fixen Kombination bei gesicherter Non- Ulcus-
Dyspepsie [Action of a fixed combination for assured non-ulcer dyspepsia]',
Zeitschr f Phytother, vol. 15, pp. 24-25.
Buffa, R, Solcia, E and Go, VL 1976, 'Immunohistochemical identification of the
cholecystokinin cell in the intestinal mucosa', Gastroenterology, vol. 70, no. 4,
pp. 528-532.
Burton-Freeman, B, Gietzen, DW and Schneeman, BO 1997, 'Meal pattern analysis to
investigate the satiating potential of fat, carbohydrate, and protein in rats', Am J
Physiol, vol. 273, pp. R1916-1922.
Caldarella, MP, Azpiroz, F and Malagelada, JR 2003, 'Antro-fundic dysfunctions in
functional dyspepsia', Gastroenterology, vol. 124, no. 5, pp. 1220-1229.
Calvert, EL, Houghton, LA, Cooper, P, Morris, J and Whorwell, PJ 2002, 'Long-term
improvement in functional dyspepsia using hypnotherapy', Gastroenterology,
vol. 123, no. 6, pp. 1778-1785.
Camilleri, M and Malagelada, JR 1984, 'Abnormal intestinal motility in diabetics with
the gastroparesis syndrome', Eur J Clin Invest, vol. 14, no. 6, pp. 420-427.
328

References
Carlson, GM, Bedi, BS and Code, CF 1972, 'Mechanism of propagation of intestinal
interdigestive myoelectric complex', Am J Physiol, vol. 222, no. 4, pp. 1027-
1030.
Castiglione, KE, Read, NW and French, SJ 1998, 'Food intake responses to upper
gastrointestinal lipid infusions in humans.' Physiol Behav, vol. 64, no. 2, pp.
141-145.
Castiglione, KE, Read, NW and French, SJ 2002, 'Adaptation to high-fat diet
accelerates emptying of fat but not carbohydrate test meals in humans', Am J
Physiol, vol. 282, no. 2, pp. R366-371.
Ceccatelli, P, Janssens, J, Vantrappen, G and Cucchiara, S 1988, 'Cisapride restores the
decreased lower oesophageal sphincter pressure in reflux patients', Gut, vol. 29,
no. 5, pp. 631-635.
Cecil, JE, Francis, J and Read, NW 1998, 'Relative contributions of intestinal, gastric,
oro-sensory influences and information to changes in appetite induced by the
same liquid meal', Appetite, vol. 31, no. 3, pp. 377-390.
Cecil, JE, Francis, J and Read, NW 1999, 'Comparison of the effects of a high-fat and
high-carbohydrate soup delivered orally and intragastrically on gastric emptying,
appetite, and eating behaviour', Physiol Behav, vol. 67, no. 2, pp. 299-306.
Ceriello, A 1998, 'The emerging role of post-prandial hyperglycaemic spikes in the
pathogenesis of diabetic complications', Diabet Med, vol. 15, no. 3, pp. 188-193.
Chaikomin, R, Doran, S, Jones, KL, Feinle-Bisset, C, O'Donovan, D, Rayner, CK and
Horowitz, M 2005, 'Initially more rapid small intestinal glucose delivery
increases plasma insulin, GIP, and GLP-1 but does not improve overall glycemia
in healthy subjects', Am J Physiol, vol. 289, no. 3, pp. E504-507.
329

References
Chapman, IM, Goble, EA, Wittert, GA and Horowitz, M 1999, 'Effects of small-
intestinal fat and carbohydrate infusions on appetite and food intake in obese
and nonobese men', Am J Clin Nutr, vol. 69, no. 1, pp. 6-12.
Chapman, IM, Goble, EA, Wittert, GA, Morley, JE and Horowitz, M 1998, 'Effect of
intravenous glucose and euglycemic insulin infusions on short-term appetite and
food intake', Am J Physiol, vol. 274, pp. R596-R603.
Choung, RS, Talley, NJ, Peterson, J, Camilleri, M, Burton, D, Harmsen, WS and
Zinsmeister, AR 2007, 'A double-blind, randomized, placebo-controlled trial of
itopride (100 and 200 mg three times daily) on gastric motor and sensory
function in healthy volunteers', Neurogastroenterol Motil, vol. 19, no. 3, pp.
180-187.
Chua, ASB, Dinan, TG, Rovati, LC and Keeling, PWN 1994, 'Cholecystokinin
hyperresponsiveness in dysmotility-type nonulcer dyspepsia', Ann NY Acad Sci,
vol. 713, pp. 298-299.
Coffin, B, Azpiroz, F and Malagelada, JR 1994, 'Somatic stimulation reduces
perception of gut distention in humans', Gastroenterology, vol. 107, no. 6, pp.
1636-1642.
Collen, MJ and Loebenberg, MJ 1989, 'Basal gastric acid secretion in nonulcer
dyspepsia with or without duodenitis', Dig Dis Sci, vol. 34, no. 2, pp. 246-250.
Collins, PJ, Horowitz, M, Cook, DJ, Harding, PE and Shearman, DJ 1983, 'Gastric
emptying in normal subjects - a reproducible technique using a single
scintillation camera and computer system', Gut, vol. 24, no. 12, pp. 1117-1125.
Cone, RD, Cowley, MA, Butler, AA, Fan, W, Marks, DL and Low, MJ 2001, 'The
arcuate nucleus as a conduit for diverse signals relevant to energy homeostasis',
Int J Obes Relat Metab Disord, vol. 25, no. Suppl 5, pp. S63-67.
330

References
Cook, CG, Andrews, JM, Jones, KL, Wittert, GA, Chapman, IM, Morley, JE and
Horowitz, M 1997, 'Effects of small intestinal nutrient infusion on appetite and
pyloric motility are modified by age', Am J Physiol, vol. 273, pp. R755-761.
Cooke, AR 1977, 'Localization of receptors inhibiting gastric emptying in the gut',
Gastroenterology, vol. 72, pp. 875-880.
Corinaldesi, R, Stanghellini, V, Raiti, C, Rea, E, Salgemini, R and Barbara, L 1987,
'Effect of chronic administration of cisapride on gastric emptying of a solid meal
and on dyspeptic symptoms in patients with idiopathic gastroparesis', Gut, vol.
28, no. 3, pp. 300-305.
Coulie, B, Tack, J, Maes, B, Geypens, B, De Roo, M and Janssens, J 1997,
'Sumatriptan, a selective 5-HT1 receptor agonist, induces a lag phase for gastric
emptying of liquids in humans', Am J Physiol, vol. 272, no. 4 Pt 1, pp. G902-
908.
Cummings, DE, Purnell, JQ, Frayo, RS, Schmidova, K, Wisse, BE and Weigle, DS
2001, 'A preprandial rise in plasma ghrelin levels suggests a role in meal
initiation in humans.' Diabetes, vol. 50, no. 8, pp. 1714-1719.
Cuomo, R, Sarnelli, G, Grasso, R, Bruzzese, D, Pumpo, R, Salomone, M, Nicolai, E,
Tack, J and Budillon, G 2001, 'Functional dyspepsia symptoms, gastric
emptying and satiety provocative test: analysis of relationships', Scand J
Gastroenterol, vol. 36, no. 10, pp. 1030-1036.
Cuperus, P, Keeling, PW and Gibney, MJ 1996, 'Eating patterns in functional
dyspepsia: a case control study', Eur J Clin Nutr, vol. 50, no. 8, pp. 520-523.
Czinn, SJ, Bertram, TA, Murray, PD and Yang, P 1991, 'Relationship between gastric
inflammatory response and symptoms in patients infected with Helicobacter
pylori', Scand J Gastroenterol Suppl, vol. 181, pp. 33-37.
331

References
D'Alessio, DA, Kahn, SE, Leusner, CR and Ensinck, JW 1994, 'Glucagon-like peptide 1
enhances glucose tolerance both by stimulation of insulin release and by
increasing insulin-independent glucose disposal', J Clin Invest, vol. 93, no. 5, pp.
2263-2266.
Date, Y, Kojima, M, Hosoda, H, Sawaguchi, A, Mondal, MS, Suganuma, T, Matsukura,
S, Kangawa, K and Nakazato, M 2000, 'Ghrelin, a novel growth hormone-
releasing acylated peptide, is synthesized in a distinct endocrine cell type in the
gastrointestinal tracts of rats and humans', Endocrinology, vol. 141, no. 11, pp.
4255-4261.
Degen, L, Matzinger, D, Drewe, J and Beglinger, C 2001, 'The effect of cholecystokinin
in controlling appetite and food intake in humans', Peptides, vol. 22, no. 8, pp.
1265-1269.
Degen, L, Oesch, S, Casanova, M, Graf, S, Ketterer, S, Drewe, J and Beglinger, C 2005,
'Effect of peptide YY3-36 on food intake in humans', Gastroenterology, vol.
129, no. 5, pp. 1430-1436.
Delgado-Aros, S, Camilleri, M, Cremonini, F, Ferber, I, Stephens, D and Burton, DD
2004, 'Contributions of gastric volumes and gastric emptying to meal size and
postmeal symptoms in functional dyspepsia', Gastroenterology, vol. 127, no. 6,
pp. 1685-1694.
Delgado-Aros, S, Kim, DY, Burton, DD, Thomforde, GM, Stephens, D, Brinkmann,
BH, Vella, A and Camilleri, M 2002, 'Effect of GLP-1 on gastric volume,
emptying, maximum volume ingested, and postprandial symptoms in humans',
Am J Physiol, vol. 282, no. 3, pp. G424-431.
Dent, J 1976, 'A new technique for continuous sphincter pressure measurement',
Gastroenterology, vol. 71, no. 2, pp. 263-267.
332

References
DiBaise, JK and Quigley, EM 1999, 'Efficacy of prolonged administration of
intravenous erythromycin in an ambulatory setting as treatment of severe
gastroparesis: one center's experience', J Clin Gastroenterol, vol. 28, no. 2, pp.
131-134.
Dobrilla, G, Comberlato, M, Steele, A and Vallaperta, P 1989, 'Drug treatment of
functional dyspepsia. A meta-analysis of randomized controlled clinical trials', J
Clin Gastroenterol, vol. 11, no. 2, pp. 169-177.
Drossman, DA and Dumitrascu, DL 2006, 'Rome III: New standard for functional
gastrointestinal disorders', J Gastrointestin Liver Dis, vol. 15, no. 3, pp. 237-
241.
Drossman, DA, Li, Z, Andruzzi, E, Temple, RD, Talley, NJ, Thompson, WG,
Whitehead, WE, Janssens, J, Funch-Jensen, P, Corazziari, E and et al. 1993,
'U.S. householder survey of functional gastrointestinal disorders. Prevalence,
sociodemography, and health impact', Dig Dis Sci, vol. 38, no. 9, pp. 1569-1580.
Drossman, DA, Toner, BB, Whitehead, WE, Diamant, NE, Dalton, CB, Duncan, S,
Emmott, S, Proffitt, V, Akman, D, Frusciante, K, Le, T, Meyer, K, Bradshaw, B,
Mikula, K, Morris, CB, Blackman, CJ, Hu, Y, Jia, H, Li, JZ, Koch, GG and
Bangdiwala, SI 2003, 'Cognitive-behavioral therapy versus education and
desipramine versus placebo for moderate to severe functional bowel disorders',
Gastroenterology, vol. 125, no. 1, pp. 19-31.
Duan, LP, Zheng, ZT and Li, YN 1993, 'A study of gastric emptying in non-ulcer
dyspepsia using a new ultrasonographic method', Scand J Gastroenterol, vol. 28,
no. 4, pp. 355-360.
333

References
Duchman, SM, Ryan, AJ, Schedl, HP, Summers, RW, Bleiler, TL and Gisolfi, CV
1997, 'Upper limit for intestinal absorption of a dilute glucose solution in men at
rest', Med Sci Sports Exerc, vol. 29, no. 4, pp. 482-488.
Eberlein, GA, Eysselein, VE, Davis, MT, Lee, TD, Shively, JE, Grandt, D, Niebel, W,
Williams, R, Moessner, J, Zeeh, J and et al. 1992, 'Patterns of prohormone
processing. Order revealed by a new procholecystokinin-derived peptide', J Biol
Chem, vol. 267, no. 3, pp. 1517-1521.
Eberlein, GA, Eysselein, VE and Goebell, H 1988, 'Cholecystokinin-58 is the major
molecular form in man, dog and cat but not in pig, beef and rat intestine',
Peptides, vol. 9, no. 5, pp. 993-998.
Edelbroek, M, Horowitz, M, Fraser, R, Wishart, J, Morris, H, Dent, J and Akkermans, L
1992a, 'Adaptive changes in the pyloric motor response to intraduodenal
dextrose in normal subjects', Gastroenterology, vol. 103, no. pp. 1754-1761.
Edelbroek, M, Horowitz, M, Maddox, A and Bellen, J 1992b, 'Gastric emptying and
intragastric distribution of oil in the presence of a liquid or a solid meal', J Nucl
Med, vol. 33, no. 7, pp. 1283-1290.
Eissele, R, Goke, R, Willemer, S, Harthus, HP, Vermeer, H, Arnold, R and Goke, B
1992, 'Glucagon-like peptide-1 cells in the gastrointestinal tract and pancreas of
rat, pig and man', Eur J Clin Invest, vol. 22, no. 4, pp. 283-291.
Ekblad, E and Sundler, F 2002, 'Distribution of pancreatic polypeptide and peptide YY',
Peptides, vol. 23, no. 2, pp. 251-261.
Eliasson, B, Bjornsson, E, Urbanavicius, V, Andersson, H, Fowelin, J, Attvall, S,
Abrahamsson, H and Smith, U 1995, 'Hyperinsulinaemia impairs gastrointestinal
motility and slows carbohydrate absorption', Diabetologia, vol. 38, no. 1, pp. 79-
85.
334

References
Erdmann, J, Lippl, F and Schusdziarra, V 2003, 'Differential effect of protein and fat on
plasma ghrelin levels in man', Regul Pept, vol. 116, no. 1-3, pp. 101-107.
Eysenck, SB and Eysenck, HJ 1964, 'An Improved Short Questionnaire for the
Measurement of Extraversion and Neuroticism', Life Sci, vol. 3, pp. 1103-1109.
Falko, JM, Crockett, SE, Cataland, S and Mazzaferri, EL 1975, 'Gastric inhibitory
polypeptide (GIP) stimulated by fat ingestion in man', J Clin Endocrinol Metab,
vol. 41, no. 2, pp. 260-265.
Fehmann, HC, Goke, R and Goke, B 1995, 'Cell and molecular biology of the incretin
hormones glucagon-like peptide-I and glucose-dependent insulin releasing
polypeptide', Endocr Rev, vol. 16, no. 3, pp. 390-410.
Feighner, SD, Tan, CP, McKee, KK, Palyha, OC, Hreniuk, DL, Pong, SS, Austin, CP,
Figueroa, D, MacNeil, D, Cascieri, MA, Nargund, R, Bakshi, R, Abramovitz, M,
Stocco, R, Kargman, S, O'Neill, G, Van Der Ploeg, LH, Evans, J, Patchett, AA,
Smith, RG and Howard, AD 1999, 'Receptor for motilin identified in the human
gastrointestinal system', Science, vol. 284, no. 5423, pp. 2184-2188.
Feinle, C, D'Amato, M and Read, NW 1996, 'Cholecystokinin-A receptors modulate
gastric sensory and motor responses to gastric distension and duodenal lipid',
Gastroenterology, vol. 110, no. 5, pp. 1379-1385.
Feinle, C, Grundy, D, Otto, B and Fried, M 2000, 'Relationship between increasing
duodenal lipid doses, gastric perception, and plasma hormone levels in humans',
Am J Physiol, vol. 278, no. 5, pp. R1217-1223.
Feinle, C, Grundy, D and Read, NW 1997, 'Effects of duodenal nutrients on sensory and
motor responses of the human stomach to distension', Am J Physiol Gastrointest
Liver Physiol, vol. 273, pp. G721-G726.
335

References
Feinle, C, Meier, O, Otto, B, D'Amato, M and Fried, M 2001a, 'Role of duodenal lipid
and cholecystokinin A receptors in the pathophysiology of functional dyspepsia',
Gut, vol. 48, no. 3, pp. 347-355.
Feinle, C, O'Donovan, DG, Doran, S, Andrews, JM, Wishart, J, Chapman, I and
Horowitz, M 2003, 'Effects of fat digestion on appetite, APD motility, and gut
hormones in response to duodenal fat infusion in humans', Am J Physiol, vol.
284, pp. G798-807.
Feinle, C, Rades, T, Otto, B and Fried, M 2001b, 'Fat digestion modulates
gastrointestinal sensations induced by gastric distention and duodenal lipid in
humans', Gastroenterology, vol. 120, pp. 1100-1107.
Feinle-Bisset, C, Meier, B, Beglinger, C and Fried, M 2003, 'Role of cognitive factors in
symptom induction following high and low fat meals in patients with functional
dyspepsia', Gut, vol. 10, pp. 1414-1418.
Feltrin, KL, Little, TJ, Meyer, JH, Horowitz, M, Rades, T, Wishart, J and Feinle-Bisset,
C 2007, 'Effects of lauric acid on upper gut motility, plasma cholecystokinin and
peptide YY, and energy intake are load, but not concentration, dependent in
humans', J Physiol, vol. 581, no. Pt 2, pp. 767-777.
Feltrin, KL, Little, TJ, Meyer, JH, Horowitz, M, Smout, AJ, Wishart, J, Pilichiewicz,
AN, Rades, T, Chapman, IM and Feinle-Bisset, C 2004, 'Effects of
intraduodenal fatty acids on appetite, antropyloroduodenal motility, and plasma
CCK and GLP-1 in humans vary with their chain length', Am J Physiol, vol. 287,
no. 3, pp. R524-533.
Fioramonti, J and Bueno, L 2002, 'Centrally acting agents and visceral sensitivity', Gut,
vol. 51, no. Suppl 1, pp. i91-95.
336

References
Flint, A, Raben, A, Blundell, JE and Astrup, A 2000, 'Reproducibility, power and
validity of visual analogue scales in assessment of appetite sensations in single
test meal studies', Int J Obes Relat Metab Disord, vol. 24, no. 1, pp. 38-48.
Flint, A, Raben, A, Ersboll, AK, Holst, JJ and Astrup, A 2001, 'The effect of
physiological levels of glucagon-like peptide-1 on appetite, gastric emptying,
energy and substrate metabolism in obesity', Int J Obes Relat Metab Disord, vol.
25, no. 6, pp. 781-792.
Fraser, R, Fone, D, Horowitz, M and Dent, J 1993, 'Cholecystokinin octapeptide
stimulates phasic and tonic pyloric motility in healthy humans', Gut, vol. 34, no.
1, pp. 33-37.
Fraser, R, Fuller, J, Horowitz, M and Dent, J 1991a, 'Effect of insulin-induced
hypoglycaemia on antral, pyloric and duodenal motility in fasting subjects', Clin
Sci Colch, vol. 81, no. 2, pp. 281-285.
Fraser, R, Horowitz, M and Dent, J 1991b, 'Hyperglycaemia stimulates pyloric motility
in normal subjects', Gut, vol. 32, no. 5, pp. 475-478.
French, SJ, Murray, B, Rumsey, RD, Fadzlin, R and Read, NW 1995, 'Adaptation to
high-fat diets: effects on eating behaviour and plasma cholecystokinin', Br J
Nutr, vol. 73, no. 2, pp. 179-189.
Fried, GM, Ogden, WD, Greeley, GH, Jr. and Thompson, JC 1984, 'Physiologic role of
cholecystokinin in the intestinal phase of pancreatic polypeptide release', Ann
Surg, vol. 200, no. 5, pp. 600-604.
337

References
Fried, M, Erlacher, U, Schwizer, W, Lochner, C, Koerfer, J, Beglinger, C, Jansen, JB,
Lamers, CB, Harder, F, Bischof-Delaloye, A, Stalder, GA and Rovati, L 1991,
'Role of cholecystokinin in the regulation of gastric emptying and pancreatic
enzyme secretion in humans. Studies with the cholecystokinin-receptor
antagonist loxiglumide', Gastroenterology, vol. 101, no. 2, pp. 503-511.
Fumagalli, I and Hammer, B 1994, 'Cisapride versus metoclopramide in the treatment of
functional dyspepsia. A double-blind comparative trial', Scand J Gastroenterol,
vol. 29, no. 1, pp. 33-37.
Galligan, JJ and Vanner, S 2005, 'Basic and clinical pharmacology of new motility
promoting agents', Neurogastroenterol Motil, vol. 17, no. 5, pp. 643-653.
Gan, TJ 2002, 'Postoperative nausea and vomiting--can it be eliminated?' Jama, vol.
287, no. 10, pp. 1233-1236.
Garlicki, J, Konturek, PK, Majka, J, Kwiecien, N and Konturek, SJ 1990,
'Cholecystokinin receptors and vagal nerves in control of food intake in rats', Am
J Physiol, vol. 258, pp. E40-45.
Garner, DM and Garfinkel, PE 1979, 'The Eating Attitudes Test: an index of the
symptoms of anorexia nervosa', Psychol Med, vol. 9, no. 2, pp. 273-279.
Geliebter, A 1988a, 'Gastric distension and gastric capacity in relation to food intake in
humans', Physiol Behav, vol. 44, no. 4-5, pp. 665-668.
Geliebter, A, Westreich, S and Gage, D 1988b, 'Gastric distention by balloon and test-
meal intake in obese and lean subjects', Am J Clin Nutr, vol. 48, no. 3, pp. 592-
594.
338

References
Gentilcore, D, Chaikomin, R, Jones, KL, Russo, A, Feinle-Bisset, C, Wishart, JM,
Rayner, CK and Horowitz, M 2006a, 'Effects of fat on gastric emptying of and
the glycemic, insulin, and incretin responses to a carbohydrate meal in type 2
diabetes', J Clin Endocrinol Metab, vol. 91, no. 6, pp. 2062-2067.
Gentilcore, D, Hausken, T, Horowitz, M and Jones, KL 2006b, 'Measurements of
gastric emptying of low- and high-nutrient liquids using 3D ultrasonography and
scintigraphy in healthy subjects', Neurogastroenterol Motil, vol. 18, no. 12, pp.
1062-1068.
Gibbs, J, Falasco, JD and McHugh, PR 1976, 'Cholecystokinin-decreased food intake in
rhesus monkeys', Am J Physiol, vol. 230, no. 1, pp. 15-18.
Gibbs, J, Young, RC and Smith, GP 1973, 'Cholecystokinin decreases food intake in
rats', J Comp Physiol Psychol, vol. 84, no. 3, pp. 488-495.
Gielkens, HA, Verkijk, M, Frolich, M, Lamers, CB and Masclee, AA 1997, 'Is the effect
of acute hyperglycaemia on interdigestive antroduodenal motility and small-
bowel transit mediated by insulin?' Eur J Clin Invest, vol. 27, no. 8, pp. 703-710.
Gilbert, RJ, Dodds, WJ, Kahrilas, PJ, Hogan, WJ and Lipman, S 1987, 'Effect of
cisapride, a new prokinetic agent, on esophageal motor function', Dig Dis Sci,
vol. 32, no. 12, pp. 1331-1336.
Gilja, OH, Hausken, T, Wilhelmsen, I and Berstad, A 1996, 'Impaired accommodation
of proximal stomach to a meal in functional dyspepsia.' Dig Dis Sci, vol. 41, no.
4, pp. 689-696.
339

References
Gorelick, AB, Koshy, SS, Hooper, FG, Bennett, TC, Chey, WD and Hasler, WL 1998,
'Differential effects of amitriptyline on perception of somatic and visceral
stimulation in healthy humans', Am J Physiol, vol. 275, no. 3 Pt 1, pp. G460-
466.
Gotthard, R, Bodemar, G, Brodin, U and Jonsson, KA 1988, 'Treatment with
cimetidine, antacid, or placebo in patients with dyspepsia of unknown origin',
Scand J Gastroenterol, vol. 23, no. 1, pp. 7-18.
Grandt, D, Schimiczek, M, Beglinger, C, Layer, P, Goebell, H, Eysselein, VE and
Reeve, JR, Jr. 1994, 'Two molecular forms of peptide YY (PYY) are abundant in
human blood: characterization of a radioimmunoassay recognizing PYY 1-36
and PYY 3-36', Regul Pept, vol. 51, no. 2, pp. 151-159.
Greeley, GH, Jr., Hashimoto, T, Izukura, M, Gomez, G, Jeng, J, Hill, FL, Lluis, F and
Thompson, JC 1989, 'A comparison of intraduodenally and intracolonically
administered nutrients on the release of peptide-YY in the dog', Endocrinology,
vol. 125, no. 4, pp. 1761-1765.
Greenberg, PD and Cello, JP 1999, 'Lack of effect of treatment for Helicobacter pylori
on symptoms of nonulcer dyspepsia', Arch Intern Med, vol. 159, no. 19, pp.
2283-2288.
Gutniak, M, Orskov, C, Holst, JJ, Ahren, B and Efendic, S 1992, 'Antidiabetogenic
effect of glucagon-like peptide-1 (7-36)amide in normal subjects and patients
with diabetes mellitus', N Engl J Med, vol. 326, no. 20, pp. 1316-1322.
Gutzwiller, JP, Drewe, J, Göke, B, Schmidt, H, Rohrer, B, Lareida, J and Beglinger, C
1999a, 'Glucagon-like peptide-1 promotes satiety and reduces food intake in
patients with diabetes mellitus type 2', Am J Physiol, vol. 276, pp. R1541-1544.
340

References
Gutzwiller, JP, Drewe, J, Ketterer, S, Hildebrand, P, Krautheim, A and Beglinger, C
2000, 'Interaction between CCK and a preload on reduction of food intake is
mediated by CCK-A receptors in humans', Am J Physiol, vol. 279, no. 1, pp.
R189-195.
Gutzwiller, JP, Goke, B, Drewe, J, Hildebrand, P, Ketterer, S, Handschin, D,
Winterhalder, R, Conen, D and Beglinger, C 1999b, 'Glucagon-like peptide-1: a
potent regulator of food intake in humans', Gut, vol. 44, no. 1, pp. 81-86.
Hagan, MM 2002, 'Peptide YY: a key mediator of orexigenic behavior', Peptides, vol.
23, no. 2, pp. 377-382.
Harasawa, S and Miwa, T 1993, 'Effect of itopride hydrochloride on gastric emptying in
chronic gastritis patients', Jpn Pharmacol Ther, vol. 21, no. 11, pp. 4189-4195.
Harper, AA and Raper, HS 1943, 'Pancreozymin, a stimulant of the secretion of
pancreatic enzymes in extracts of the small intestine', J Physiol, vol. 102, no. 1,
pp. 115-125.
Hasler, WL, Soudah, HC, Dulai, G and Owyang, C 1995, 'Mediation of hyperglycemia-
evoked gastric slow-wave dysrhythmias by endogenous prostaglandins',
Gastroenterology, vol. 108, no. 3, pp. 727-736.
Hausken, T and Berstad, A 1992a, 'Cisapride treatment of patients with non-ulcer
dyspepsia and erosive prepyloric changes. A double-blind, placebo-controlled
trial', Scand J Gastroenterol, vol. 27, no. 3, pp. 213-217.
Hausken, T and Berstad, A 1992b, 'Wide gastric antrum in patients with non-ulcer
dyspepsia. Effect of cisapride', Scand J Gastroenterol, vol. 27, no. 5, pp. 427-
432.
341

References
Hausken, T and Berstad, A 1994, 'Effect of glyceryl trinitrate on antral motility and
symptoms in patients with functional dyspepsia', Scand J Gastroenterol, vol. 29,
no. 1, pp. 23-28.
Hausken, T, Gilja, OH, Undeland, KA and Berstad, A 1998, 'Timing of postprandial
dyspeptic symptoms and transpyloric passage of gastric contents', Scand J
Gastroenterol, vol. 33, no. 8, pp. 822-827.
Haycox, A, Einarson, T and Eggleston, A 1999, 'The health economic impact of upper
gastrointestinal symptoms in the general population: results from the
Domestic/International Gastroenterology Surveillance Study (DIGEST)', Scand
J Gastroenterol Suppl, vol. 231, pp. 38-47.
Hebbard, GS, Sun, WM, Dent, J and Horowitz, M 1996, 'Hyperglycaemia affects
proximal gastric motor and sensory function in normal subjects', Eur J
Gastroenterol Hepatol, vol. 8, no. 3, pp. 211-217.
Heddle, R, Collins, PJ, Dent, J, Horowitz, M, Read, NW, Chatterton, B and Houghton,
LA 1989, 'Motor mechanisms associated with slowing of the gastric emptying of
a solid meal by an intraduodenal lipid infusion', J Gastroenterol Hepatol, vol. 4,
no. 5, pp. 437-447.
Heddle, R, Dent, J, Read, NW, Houghton, LA, Toouli, J, Horowitz, M, Maddern, GJ
and Downton, J 1988a, 'Antropyloroduodenal motor responses to intraduodenal
lipid infusion in healthy volunteers', Am J Physiol, vol. 254, pp. G671-679.
Heddle, R, Dent, J, Toouli, J and Read, NW 1988b, 'Topography and measurement of
pyloric pressure waves and tone in humans', Am J Physiol, vol. 255, pp. G490-
497.
Heddle, R, Fone, D, Dent, J and Horowitz, M 1988c, 'Stimulation of pyloric motility by
intraduodenal dextrose in normal subjects', Gut, vol. 29, no. 10, pp. 1349-1357.
342

References
Herman, CP and Mack, D 1975, 'Restrained and unrestrained eating', J Pers, vol. 43, no.
4, pp. 647-660.
Hernandez, DE, Mason, GA, Walker, CH and Valenzuela, JE 1987, 'Dopamine
receptors in human gastrointestinal mucosa', Life Sci, vol. 41, no. 25, pp. 2717-
2723.
Herrmann, C, Goke, R, Richter, G, Fehmann, HC, Arnold, R and Goke, B 1995,
'Glucagon-like peptide-1 and glucose-dependent insulin-releasing polypeptide
plasma levels in response to nutrients', Digestion, vol. 56, no. 2, pp. 117-126.
Hills, JM and Aaronson, PI 1991, 'The mechanism of action of peppermint oil on
gastrointestinal smooth muscle. An analysis using patch clamp
electrophysiology and isolated tissue pharmacology in rabbit and guinea pig',
Gastroenterology, vol. 101, no. 1, pp. 55-65.
Hirakawa, K, Adachi, K, Amano, K, Katsube, T, Ishihara, S, Fukuda, R, Yamashita, Y,
Shiozawa, S, Watanabe, M and Kinoshita, Y 1999, 'Prevalence of non-ulcer
dyspepsia in the Japanese population', J Gastroenterol Hepatol, vol. 14, no. 11,
pp. 1083-1087.
Hohenester, B, Rühl, A, Kelber, O and Schemann, M 2004, 'The herbal preparation
STW5 (Iberogast®) has potent and region-specific effects on gastric motility',
Neurogastroenterol Motil, vol. 16, pp. 765-773.
Holdsworth, CD and Dawson, AM 1964, 'The Absorption of Monosaccharides in Man',
Clin Sci, vol. 27, pp. 371-379.
Holst, JJ and Gromada, J 2004, 'Role of incretin hormones in the regulation of insulin
secretion in diabetic and nondiabetic humans', Am J Physiol, vol. 287, no. 2, pp.
E199-206.
343

References
Holt, S, Cervantes, J, Wilkinson, AA and Wallace, JH 1986, 'Measurement of gastric
emptying rate in humans by real-time ultrasound', Gastroenterology, vol. 90, no.
4, pp. 918-923.
Holtmann, G, Adam, B, Haag, S, Collet, W, Grunewald, E and Windeck, T 2003,
'Efficacy of artichoke leaf extract in the treatment of patients with functional
dyspepsia: a six-week placebo-controlled, double-blind, multicentre trial',
Aliment Pharmacol Ther, vol. 18, no. 11-12, pp. 1099-1105.
Holtmann, G, Talley, NJ, Liebregts, T, Adam, B and Parow, C 2006, 'A placebo-
controlled trial of itopride in functional dyspepsia', N Engl J Med, vol. 354, no.
8, pp. 832-840.
Holzer, P 1991, 'Capsaicin: cellular targets, mechanisms of action, and selectivity for
thin sensory neurons', Pharmacol Rev, vol. 43, no. 2, pp. 143-201.
Horowitz, M, Cunningham, KM, Wishart, JM, Jones, KL and Read, NW 1996, 'The
effect of short-term dietary supplementation with glucose on gastric emptying of
glucose and fructose and oral glucose tolerance in normal subjects',
Diabetologia, vol. 39, no. 4, pp. 481-486.
Horowitz, M, Dent, J, Fraser, R, Sun, W and Hebbard, G 1994, 'Role and integration of
mechanisms controlling gastric emptying', Dig Dis Sci, vol. 39, no. 12 Suppl, pp.
7S-13S.
Horowitz, M, Edelbroek, MA, Wishart, JM and Straathof, JW 1993, 'Relationship
between oral glucose tolerance and gastric emptying in normal healthy subjects',
Diabetologia, vol. 36, no. 9, pp. 857-862.
344

References
Horowitz, M, Harding, PE, Maddox, AF, Wishart, JM, Akkermans, LM, Chatterton, BE
and Shearman, DJ 1989, 'Gastric and oesophageal emptying in patients with type
2 (non-insulin-dependent) diabetes mellitus', Diabetologia, vol. 32, no. 3, pp.
151-159.
Horowitz, M, Maddox, AF, Wishart, JM, Harding, PE, Chatterton, BE and Shearman,
DJC 1991, 'Relationships between oesophageal transit and solid and liquid
gastric emptying in diabetes mellitus', Eur J Nucl Med, vol. 18, pp. 229-234.
Horowitz, M and Nauck, MA 2006, 'To be or not to be--an incretin or enterogastrone?'
Gut, vol. 55, no. 2, pp. 148-150.
Houghton, LA, Fowler, P, Keene, ON and Read, NW 1992, 'Effect of sumatriptan, a
new selective 5HT1-like agonist, on liquid gastric emptying in man', Aliment
Pharmacol Ther, vol. 6, no. 6, pp. 685-691.
Houghton, LA, Heyman, DJ and Whorwell, PJ 1996, 'Symptomatology, quality of life
and economic features of irritable bowel syndrome--the effect of hypnotherapy',
Aliment Pharmacol Ther, vol. 10, no. 1, pp. 91-95.
Houghton, LA, Mangnall, YF, Dwivedi, A and Read, NW 1993, 'Sensitivity to nutrients
in patients with non ulcer dyspepsia', Eur J Gastroenterol Hepatol, vol. 5, pp.
109-113.
Hu, S, Stern, RM and Koch, KL 1992, 'Electrical acustimulation relieves vection-
induced motion sickness', Gastroenterology, vol. 102, no. 6, pp. 1854-1858.
Hui, WM, Shiu, LP and Lam, SK 1991, 'The perception of life events and daily stress in
nonulcer dyspepsia', Am J Gastroenterol, vol. 86, no. 3, pp. 292-296.
Hunt, JN 1963, 'The duodenal regulation of gastric emptying', Gastroenterology, vol.
45, no. 2, pp. 149-156.
345

References
Hunt, JN and Knox, MT 1968, 'A relation between the chain length of fatty acids and
the slowing of gastric emptying', J Physiol (Lond), vol. 194, no. 2, pp. 327-336.
Hunt, JN, Smith, JL and Jiang, CL 1985, 'Effect of meal volume and energy density on
the gastric emptying of carbohydrates', Gastroenterology, vol. 89, no. 6, pp.
1326-1330.
Hveem, K, Jones, KL, Chatterton, BE and Horowitz, M 1996, 'Scintigraphic
measurement of gastric emptying and ultrasonographic assessment of antral
area: relation to appetite', Gut, vol. 38, no. 6, pp. 816-821.
Ishii, M, Nakamura, T, Kasai, F, Onuma, T, Baba, T and Takebe, K 1994, 'Altered
postprandial insulin requirement in IDDM patients with gastroparesis', Diabetes
Care, vol. 17, no. 8, pp. 901-903.
Iwanaga, Y, Miyashita, N, Saito, T, Morikawa, K and Itoh, Z 1996, 'Gastroprokinetic
effect of a new benzamide derivative itopride and its action mechanisms in
conscious dogs', Jpn J Pharmacol, vol. 71, no. 2, pp. 129-137.
Jian, R, Ducrot, F, Ruskone, A, Chaussade, S, Rambaud, JC, Modigliani, R, Rain, JD
and Bernier, JJ 1989, 'Symptomatic, radionuclide and therapeutic assessment of
chronic idiopathic dyspepsia. A double-blind placebo-controlled evaluation of
cisapride', Dig Dis Sci, vol. 34, no. 5, pp. 657-664.
Johnson, AG 1971, 'Controlled trial of metoclopramide in the treatment of flatulent
dyspepsia', Br Med J, vol. 2, no. 5752, pp. 25-26.
Jones, KL, Doran, SM, Hveem, K, Bartholomeusz, FD, Morley, JE, Sun, WM,
Chatterton, BE and Horowitz, M 1997, 'Relation between postprandial satiation
and antral area in normal subjects', Am J Clin Nutr, vol. 66, no. 1, pp. 127-132.
346

References
Jones, KL, Russo, A, Berry, MK, Stevens, JE, Wishart, JM and Horowitz, M 2002, 'A
longitudinal study of gastric emptying and upper gastrointestinal symptoms in
patients with diabetes mellitus', Am J Med, vol. 113, no. 6, pp. 449-455.
Jones, R and Lydeard, S 1992, 'Dyspepsia in the community: a follow-up study', Br J
Clin Pract, vol. 46, no. 2, pp. 95-97.
Kaess, H, Kellermann, M and Castro, A 1988, 'Food intolerance in duodenal ulcer
patients, non ulcer dyspeptic patients and healthy subjects. A prospective study',
Klin Wochenschr, vol. 66, no. 5, pp. 208-211.
Kamegai, J, Tamura, H, Shimizu, T, Ishii, S, Sugihara, H and Oikawa, S 2001,
'Regulation of the ghrelin gene: growth hormone-releasing hormone upregulates
ghrelin mRNA in the pituitary', Endocrinology, vol. 142, no. 9, pp. 4154-4157.
Karvetti, RL and Knuts, LR 1992, 'Validity of the estimated food diary: comparison of
2-day recorded and observed food and nutrient intakes', J Am Diet Assoc, vol.
92, no. 5, pp. 580-584.
Katagiri, F, Shiga, T, Inoue, S, Sato, Y, Itoh, H and Takeyama, M 2006, 'Effects of
itopride hydrochloride on plasma gut-regulatory peptide and stress-related
hormone levels in healthy human subjects', Pharmacology, vol. 77, no. 3, pp.
115-121.
Katschinski, M, Schirra, J, Begliner, C, Langbein, S, Wank, U, D'Amato, M and
Arnold, R 1996, 'Intestinal phase of human antro-pyloro-duodenal motility:
cholinergic and CCK-mediated regulation', Eur J Clin Invest, vol. 26, no. 7, pp.
574-583.
Kearney, J, Kennedy, NP, Keeling, PW, Keating, JJ, Grubb, L, Kennedy, M and
Gibney, MJ 1989, 'Dietary intakes and adipose tissue levels of linoleic acid in
peptic ulcer disease', Br J Nutr, vol. 62, no. 3, pp. 699-706.
347

References
Kellow, JE, Cowan, H, Shuter, B, Riley, JW, Lunzer, MR, Eckstein, RP, Hoschl, R and
Lam, SK 1995, 'Efficacy of cisapride therapy in functional dyspepsia', Aliment
Pharmacol Ther, vol. 9, no. 2, pp. 153-160.
Kendall, BJ, Chakravarti, A, Kendall, E, Soykan, I and McCallum, RW 1997, 'The
effect of intravenous erythromycin on solid meal gastric emptying in patients
with chronic symptomatic post-vagotomy-antrectomy gastroparesis', Aliment
Pharmacol Ther, vol. 11, no. 2, pp. 381-385.
Kim, DY, Delgado-Aros, S, Camilleri, M, Samsom, M, Murray, JA, O'Connor, MK,
Brinkmann, BH, Stephens, DA, Lighvani, SS and Burton, DD 2001,
'Noninvasive measurement of gastric accommodation in patients with idiopathic
nonulcer dyspepsia', Am J Gastroenterol, vol. 96, no. 11, pp. 3099-3105.
Kissileff, HR, Pi-Sunyer, FX, Thornton, J and Smith, GP 1981, 'C-terminal octapeptide
of cholecystokinin decreases food intake in man', Am J Clin Nutr, vol. 34, no. 2,
pp. 154-160.
Kojima, M, Hosoda, H, Date, Y, Nakazato, M, Matsuo, H and Kangawa, K 1999,
'Ghrelin is a growth-hormone-releasing acylated peptide from stomach', Nature,
vol. 402, no. 6762, pp. 656-660.
Koloski, NA, Talley, NJ and Boyce, PM 2002, 'Epidemiology and health care seeking
in the functional GI disorders: a population-based study', Am J Gastroenterol,
vol. 97, no. 9, pp. 2290-2299.
Kong, MF, Chapman, I, Goble, E, Wishart, J, Wittert, G, Morris, H and Horowitz, M
1999a, 'Effects of oral fructose and glucose on plasma GLP-1 and appetite in
normal subjects', Peptides, vol. 20, no. 5, pp. 545-551.
348

References
Kong, MF, King, P, Macdonald, IA, Blackshaw, PE, Horowitz, M, Perkins, AC,
Armstrong, E, Buchanan, KD and Tattersall, RB 1999b, 'Euglycaemic
hyperinsulinaemia does not affect gastric emptying in type I and type II diabetes
mellitus', Diabetologia, vol. 42, no. 3, pp. 365-372.
Kong, MF, King, P, Macdonald, IA, Blackshaw, PE, Perkins, AC, Armstrong, E,
Buchanan, KD and Tattersall, RB 1998, 'Effect of euglycaemic
hyperinsulinaemia on gastric emptying and gastrointestinal hormone responses
in normal subjects', Diabetologia, vol. 41, no. 4, pp. 474-481.
Kong, YC, Lee, CM, Wong, MK and Xu, SB 1986, 'Smooth muscle relaxant effect of
dehydroindicolactone', Gen Pharmacol, vol. 17, no. 5, pp. 593-595.
Kreymann, B, Williams, G, Ghatei, MA and Bloom, SR 1987, 'Glucagon-like peptide-1
7-36: a physiological incretin in man', Lancet, vol. 2, no. 8571, pp. 1300-1304.
Kumar, D, Ritman, EL and Malagelada, JR 1987, 'Three-dimensional imaging of the
stomach: role of pylorus in the emptying of liquids', Am J Physiol, vol. 253, no.
1 Pt 1, pp. G79-85.
Kunz, P, Feinle-Bisset, C, Faas, H, Boesiger, P, Fried, M, Steingotter, A and Schwizer,
W 2005, 'Effect of ingestion order of the fat component of a solid meal on
intragastric fat distribution and gastric emptying assessed by MRI', J Magn
Reson Imaging, vol. 21, no. 4, pp. 383-390.
Kuvshinoff, BW, Rudnicki, M, McFadden, DW, Nussbaum, MS and Fischer, JE 1990,
'Release of intraluminal and circulatory peptide YY after intravenous CCK-8 in
conscious dogs', Curr Surg, vol. 47, no. 5, pp. 338-340.
Labenz, J, Blum, AL, Bayerdorffer, E, Meining, A, Stolte, M and Borsch, G 1997,
'Curing Helicobacter pylori infection in patients with duodenal ulcer may
provoke reflux esophagitis', Gastroenterology, vol. 112, no. 5, pp. 1442-1447.
349

References
Ladabaum, U, Koshy, SS, Woods, ML, Hooper, FG, Owyang, C and Hasler, WL 1998,
'Differential symptomatic and electrogastrographic effects of distal and proximal
human gastric distension', Am J Physiol, vol. 275, no. 3 Pt 1, pp. G418-424.
Laine, L, Schoenfeld, P and Fennerty, MB 2001, 'Therapy for Helicobacter pylori in
patients with nonulcer dyspepsia. A meta-analysis of randomized, controlled
trials', Ann Intern Med, vol. 134, no. 5, pp. 361-369.
Lanzini, A, Magni, P, Petroni, ML, Motta, M, Lanzarotto, F, Villanacci, V, Amato, M,
Mora, A, Bertolazzi, S, Benini, F and Ricci, C 2006, 'Circulating ghrelin level is
increased in coeliac disease as in functional dyspepsia and reverts to normal
during gluten-free diet', Aliment Pharmacol Ther, vol. 23, no. 7, pp. 907-913.
Larsson, LI and Rehfeld, JF 1978, 'Distribution of gastrin and CCK cells in the rat
gastrointestinal tract. Evidence for the occurrence of three distinct cell types
storing COOH-terminal gastrin immunoreactivity', Histochemistry, vol. 58, no.
1-2, pp. 23-31.
Lavin, JH, Wittert, G, Sun, WM, Horowitz, M, Morley, JE and Read, NW 1996,
'Appetite regulation by carbohydrate: role of blood glucose and gastrointestinal
hormones', Am J Physiol, vol. 271, pp. E209-214.
Lavin, JH, Wittert, GA, Andrews, JM, Yeap, B, Wishart, JM, Morris, HA, Morley, JE,
Horowitz, M and Read, NW 1998, 'Interaction of insulin, glucagon-like peptide
1, gastric inhibitory polypeptide, and appetite in response to intraduodenal
carbohydrate.' Am J Clin Nutr, vol. 68, no. 3, pp. 591-598.
Layer, P, Peschel, S, Schlesinger, T and Goebell, H 1990, 'Human pancreatic secretion
and intestinal motility: effects of ileal nutrient perfusion', Am J Physiol, vol. 258,
no. 2 Pt 1, pp. G196-201.
350

References
Lee, KJ, Vos, R and Tack, J 2004, 'Effects of capsaicin on the sensorimotor function of
the proximal stomach in humans', Aliment Pharmacol Ther, vol. 19, no. 4, pp.
415-425.
Lemann, M, Dederding, JP, Flourie, B, Franchisseur, C, Rambaud, JC and Jian, R 1991,
'Abnormal perception of visceral pain in response to gastric distension in chronic
idiopathic dyspepsia. The irritable stomach syndrome', Dig Dis Sci, vol. 36, no.
9, pp. 1249-1254.
Levin, F, Edholm, T, Schmidt, PT, Gryback, P, Jacobsson, H, Degerblad, M, Hoybye,
C, Holst, JJ, Rehfeld, JF, Hellstrom, PM and Naslund, E 2006, 'Ghrelin
stimulates gastric emptying and hunger in normal-weight humans', J Clin
Endocrinol Metab, vol. 91, no. 9, pp. 3296-3302.
Lewis, DA, Fields, WN and Shaw, GP 1999, 'A natural flavonoid present in unripe
plantain banana pulp (Musa sapientum L. var. paradisiaca) protects the gastric
mucosa from aspirin-induced erosions', J Ethnopharmacol, vol. 65, no. 3, pp.
283-288.
Li, Y, Nie, Y, Sha, W and Su, H 2002, 'The link between psychosocial factors and
functional dyspepsia: an epidemiological study', Chin Med J (Engl), vol. 115,
no. 7, pp. 1082-1084.
Liddle, RA, Goldfine, ID, Rosen, MS, Taplitz, RA and Williams, JA 1985,
'Cholecystokinin bioactivity in human plasma. Molecular forms, responses to
feeding, and relationship to gallbladder contraction', J Clin Invest, vol. 75, no. 4,
pp. 1144-1152.
Liddle, RA, Morita, ET, Conrad, CK and Williams, JA 1986, 'Regulation of gastric
emptying in humans by cholecystokinin', J Clin Invest, vol. 77, no. 3, pp. 992-
996.
351

References
Lieverse, RJ, Jansen, JB, Masclee, AA and Lamers, CB 1995, 'Satiety effects of a
physiological dose of cholecystokinin in humans', Gut, vol. 36, no. 2, pp. 176-
179.
Lieverse, RJ, Jansen, JB, Masclee, AA, Rovati, LC and Lamers, CB 1994a, 'Effect of a
low dose of intraduodenal fat on satiety in humans: studies using the type A
cholecystokinin receptor antagonist loxiglumide', Gut, vol. 35, no. 4, pp. 501-
505.
Lieverse, RJ, Jansen, JB, Masclee, AM and Lamers, CB 1994b, 'Satiety effects of
cholecystokinin in humans', Gastroenterology, vol. 106, no. 6, pp. 1451-1454.
Lin, HC and Chey, WY 2003, 'Cholecystokinin and peptide YY are released by fat in
either proximal or distal small intestine in dogs', Regul Pept, vol. 114, no. 2-3,
pp. 131-135.
Lin, HC, Chey, WY and Zhao, X 2000, 'Release of distal gut peptide YY (PYY) by fat
in proximal gut depends on CCK', Peptides, vol. 21, no. 10, pp. 1561-1563.
Lin, HC, Doty, JE, Reedy, TJ and Meyer, JH 1989, 'Inhibition of gastric emptying by
glucose depends on length of intestine exposed to nutrient.' Am J Physiol, vol.
256, pp. G404-411.
Lin, HC, Doty, JE, Reedy, TJ and Meyer, JH 1990, 'Inhibition of gastric emptying by
sodium oleate depends on length of intestine exposed to nutrient', Am J Physiol,
vol. 259, pp. G1031-1036.
Lin, HC, Kim, BH, Elashoff, JD, Doty, JE, Gu, YG and Meyer, JH 1992, 'Gastric
emptying of solid food is most potently inhibited by carbohydrate in the canine
distal ileum', Gastroenterology, vol. 102, no. 3, pp. 793-801.
Lin, HC, Van Citters, GW, Zhao, XT and Waxman, A 1999, 'Fat intolerance depends on
rapid gastric emptying', Dig Dis Sci, vol. 44, no. 2, pp. 330-335.
352

References
Lin, HC, Zhao, XT and Wang, L 1996, 'Fat absorption is not complete by midgut but is
dependent on load of fat', Am J Physiol, vol. 271, no. 1 Pt 1, pp. G62-67.
Lin, HC, Zhao, XT and Wang, L 1997, 'Intestinal transit is more potently inhibited by
fat in the distal (ileal brake) than in the proximal (jejunal brake) gut', Dig Dis
Sci, vol. 42, no. 1, pp. 19-25.
Little, TJ, Doran, S, Meyer, JH, Smout, AJ, O'Donovan, DG, Wu, KL, Jones, KL,
Wishart, J, Rayner, CK, Horowitz, M and Feinle-Bisset, C 2006a, 'The release of
GLP-1 and ghrelin, but not GIP and CCK, by glucose is dependent upon the
length of small intestine exposed', Am J Physiol, vol. 291, no. 3, pp. E647-655.
Little, TJ, Feltrin, KL, Horowitz, M, Smout, AJ, Rades, T, Meyer, JH, Pilichiewicz,
AN, Wishart, J and Feinle-Bisset, C 2005, 'Dose-related effects of lauric acid on
antropyloroduodenal motility, gastrointestinal hormone release, appetite, and
energy intake in healthy men.' Am J Physiol, vol. 289, pp. R1090-1098.
Little, TJ, Pilichiewicz, AN, Russo, A, Phillips, L, Jones, KL, Nauck, MA, Wishart, J,
Horowitz, M and Feinle-Bisset, C 2006b, 'Effects of intravenous glucagon-like
peptide-1 on gastric emptying and intragastric distribution in healthy subjects:
relationships with postprandial glycemic and insulinemic responses', J Clin
Endocrinol Metab, vol. 91, no. 5, pp. 1916-1923.
Little, TJ, Russo, A, Meyer, JH, Horowitz, M, Smyth, DR, Bellon, M, Wishart, JM,
Jones, KL and Feinle-Bisset, C 2007, 'Free fatty acids have more potent effects
on gastric emptying, gut hormones and appetite than triacylglycerides',
Gastroenerology, vol. 133, no. 4, pp. 1124-1131.
353

References
Liu, CY, Muller, MH, Glatzle, J, Weiser, D, Kelber, O, Enck, P, Grundy, D and Kreis,
ME 2004, 'The herbal preparation STW 5 (Iberogast) desensitizes intestinal
afferents in the rat small intestine', Neurogastroenterol Motil, vol. 16, no. 6, pp.
759-764.
Long, SJ, Sutton, JA, Amaee, WB, Giouvanoudi, A, Spyrou, NM, Rogers, PJ and
Morgan, LM 1999, 'No effect of glucagon-like peptide-1 on short-term satiety
and energy intake in man', Br J Nutr, vol. 81, no. 4, pp. 273-279.
Lynn, B 1990, 'Capsaicin: actions on nociceptive C-fibres and therapeutic potential',
Pain, vol. 41, no. 1, pp. 61-69.
MacIntosh, CG, Andrews, JM, Jones, KL, Wishart, JM, Morris, HA, Jansen, JB,
Morley, JE, Horowitz, M and Chapman, IM 1999, 'Effects of age on
concentrations of plasma cholecystokinin, glucagon-like peptide 1, and peptide
YY and their relation to appetite and pyloric motility', Am J Clin Nutr, vol. 69,
no. 5, pp. 999-1006.
MacIntosh, CG, Horowitz, M, Verhagen, MA, Smout, AJ, Wishart, J, Morris, H, Goble,
E, Morley, JE and Chapman, IM 2001a, 'Effect of small intestinal nutrient
infusion on appetite, gastrointestinal hormone release, and gastric myoelectrical
activity in young and older men', Am J Gastroenterol, vol. 96, no. 4, pp. 997-
1007.
MacIntosh, CG, Morley, JE, Wishart, J, Morris, H, Jansen, JB, Horowitz, M and
Chapman, IM 2001b, 'Effect of exogenous cholecystokinin (CCK)-8 on food
intake and plasma CCK, leptin, and insulin concentrations in older and young
adults: evidence for increased CCK activity as a cause of the anorexia of aging',
J Clin Endocrinol Metab, vol. 86, no. 12, pp. 5830-5837.
354

References
Maddox, A, Horowitz, M, Wishart, J and Collins, P 1989, 'Gastric and oesophageal
emptying in obesity', Scand J Gastroenterol, vol. 24, no. 5, pp. 593-598.
Madisch, A, Heydenreich, CJ, Wieland, V, Hufnagel, R and Hotz, J 1999, 'Treatment of
functional dyspepsia with a fixed peppermint oil and caraway oil combination
preparation as compared to cisapride. A multicenter, reference-controlled
double-blind equivalence study', Arzneimittelforschung, vol. 49, no. 11, pp. 925-
932.
Madisch, A, Holtmann, G, Mayr, G, Vinson, B and Hotz, J 2004, 'Treatment of
functional dyspepsia with a herbal preparation. A double-blind, randomized,
placebo-controlled, multicenter trial', Digestion, vol. 69, no. 1, pp. 45-52.
Madisch, A, Melderis, H, Mayr, G, Sassin, I and Hotz, J 2001, 'Ein Phytotherapeutikum
und seine modifizierte Rezeptur bei funktioneller Dyspepsie [A phytotherapeutic
and its modified formulation for functional dyspepsia]', Zeitschr f Gastroenterol,
vol. 39, pp. 1-8.
Madsen, JL 1990, 'Effects of cisapride on gastrointestinal transit in healthy humans',
Dig Dis Sci, vol. 35, no. 12, pp. 1500-1504.
Mahadeva, S and Goh, KL 2006, 'Epidemiology of functional dyspepsia: a global
perspective', World J Gastroenterol, vol. 12, no. 17, pp. 2661-2666.
Malagelada, JR, DiMagno, EP, Summerskill, WH and Go, VL 1976, 'Regulation of
pancreatic and gallbladder functions by intraluminal fatty acids and bile acids in
man', J Clin Invest, vol. 58, no. 2, pp. 493-499.
Malagelada, JR and Stanghellini, V 1985, 'Manometric evaluation of functional upper
gut symptoms', Gastroenterology, vol. 88, pp. 1223-1231.
Malbert, CH and Ruckebusch, Y 1989, 'Duodenal bulb control of the flow rate of
digesta in the fasted and fed dog', J Physiol, vol. 409, pp. 371-384.
355

References
Malfertheiner, P, J, MO, Fischbach, W, Layer, P, Leodolter, A, Stolte, M, Demleitner,
K and Fuchs, W 2003, 'Helicobacter pylori eradication is beneficial in the
treatment of functional dyspepsia', Aliment Pharmacol Ther, vol. 18, no. 6, pp.
615-625.
Marakis, G, Walker, AF, Middleton, RW, Booth, JC, Wright, J and Pike, DJ 2002,
'Artichoke leaf extract reduces mild dyspepsia in an open study', Phytomedicine,
vol. 9, no. 8, pp. 694-699.
Masuda, Y, Tanaka, T, Inomata, N, Ohnuma, N, Tanaka, S, Itoh, Z, Hosoda, H, Kojima,
M and Kangawa, K 2000, 'Ghrelin stimulates gastric acid secretion and motility
in rats', Biochem Biophys Res Commun, vol. 276, no. 3, pp. 905-908.
Matzinger, D, Degen, L, Drewe, J, Meuli, J, Duebendorfer, R, Ruckstuhl, N, D'Amato,
M, Rovati, L and Beglinger, C 2000, 'The role of long chain fatty acids in
regulating food intake and cholecystokinin release in humans', Gut, vol. 46, no.
5, pp. 688-693.
Matzinger, D, Gutzwiller, JP, Drewe, J, Orban, A, Engel, R, D'Amato, M, Rovati, L and
Beglinger, C 1999, 'Inhibition of food intake in response to intestinal lipid is
mediated by cholecystokinin in humans', Am J Physiol, vol. 277, no. 6, pp.
R1718-1724.
May, B, Kohler, S and Schneider, B 2000, 'Efficacy and tolerability of a fixed
combination of peppermint oil and caraway oil in patients suffering from
functional dyspepsia', Aliment Pharmacol Ther, vol. 14, no. 12, pp. 1671-1677.
May, B, Kuntz, HD, Kieser, M and Kohler, S 1996, 'Efficacy of a fixed peppermint
oil/caraway oil combination in non-ulcer dyspepsia', Arzneimittelforschung, vol.
46, no. 12, pp. 1149-1153.
356
References
Mayer, EA and Gebhart, GF 1994, 'Basic and clinical aspects of visceral hyperalgesia',
Gastroenterology, vol. 107, no. 1, pp. 271-293.
McCallum, RW, Prakash, C, Campoli-Richards, DM and Goa, KL 1988, 'Cisapride. A
preliminary review of its pharmacodynamic and pharmacokinetic properties, and
therapeutic use as a prokinetic agent in gastrointestinal motility disorders',
Drugs, vol. 36, no. 6, pp. 652-681.
McFadden, DW, Rudnicki, M, Kuvshinoff, B and Fischer, JE 1992, 'Postprandial
peptide YY release is mediated by cholecystokinin', Surg Gynecol Obstet, vol.
175, no. 2, pp. 145-150.
McHugh, PR and Moran, TH 1986, 'The stomach, cholecystokinin, and satiety', Fed
Proc, vol. 45, no. 5, pp. 1384-1390.
McMillin, DL, Richards, DG, Mein, EA and Nelson, CD 1999, 'The abdominal brain
and enteric nervous system', J Altern Complement Med, vol. 5, no. 6, pp. 575-
586.
Mearin, F, Balboa, A, Zarate, N, Cucala, M and Malagelada, JR 1999, 'Placebo in
functional dyspepsia: symptomatic, gastrointestinal motor, and gastric sensorial
responses', Am J Gastroenterol, vol. 94, no. 1, pp. 116-125.
Mearin, F, Cucala, M, Azpiroz, F and Malagelada, JR 1991, 'The origin of symptoms on
the brain-gut axis in functional dyspepsia', Gastroenterology, vol. 101, no. 4, pp.
999-1006.
Meier, JJ, Gallwitz, B, Salmen, S, Goetze, O, Holst, JJ, Schmidt, WE and Nauck, MA
2003, 'Normalization of glucose concentrations and deceleration of gastric
emptying after solid meals during intravenous glucagon-like peptide 1 in
patients with type 2 diabetes', J Clin Endocrinol Metab, vol. 88, no. 6, pp. 2719-
2725.
357

References
Meier, JJ, Goetze, O, Anstipp, J, Hagemann, D, Holst, JJ, Schmidt, WE, Gallwitz, B
and Nauck, MA 2004, 'Gastric inhibitory polypeptide does not inhibit gastric
emptying in humans', Am J Physiol, vol. 286, no. 4, pp. E621-625.
Meineche-Schmidt, V, Talley, NJ, Pap, A, Kordecki, H, Schmid, V, Ohlsson, L,
Wahlqvist, P, Wiklund, I and Bolling-Sternevald, E 1999, 'Impact of functional
dyspepsia on quality of life and health care consumption after cessation of
antisecretory treatment. A multicentre 3-month follow-up study', Scand J
Gastroenterol, vol. 34, no. 6, pp. 566-574.
Mertz, H, Fass, R, Kodner, A, Yan-Go, F, Fullerton, S and Mayer, EA 1998a, 'Effect of
amitriptyline on symptoms, sleep, and visceral perception in patients with
functional dyspepsia', Am J Gastroenterol, vol. 93, no. 2, pp. 160-165.
Mertz, H, Fullerton, S, Naliboff, B and Mayer, EA 1998b, 'Symptoms and visceral
perception in severe functional and organic dyspepsia', Gut, vol. 42, no. 6, pp.
814-822.
Meyer, JH, Elashoff, JD and Lake, R 1999, 'Gastric emptying of indigestible versus
digestible oils and solid fats in normal humans', Dig Dis Sci, vol. 44, no. 6, pp.
1076-1082.
Meyer, JH, Gu, YG, Jehn, D and Doty, JE 1994, 'Factors that affect the performance of
lipase on fat digestion and absorption in a canine model of pancreatic
insufficiency', Pancreas, vol. 9, no. 5, pp. 613-623.
Meyer, JH, Hlinka, M, Kao, D, Lake, R, MacLaughlin, E, Graham, LS and Elashoff, JD
1996, 'Gastric emptying of oil from solid and liquid meals. Effect of human
pancreatic insufficiency', Dig Dis Sci, vol. 41, no. 9, pp. 1691-1699.
358

References
Meyer, JH, Hlinka, M, Khatibi, A, Raybould, HE and Tso, P 1998a, 'Role of small
intestine in caloric compensations to oil premeals in rats', Am J Physiol, vol.
275, pp. R1320-1333.
Meyer, JH, Hlinka, M, Tabrizi, Y, DiMaso, N and Raybould, HE 1998b, 'Chemical
specificities and intestinal distributions of nutrient-driven satiety.' Am J Physiol,
vol. 275, pp. R1293-1307.
Meyer, JH, Tabrizi, Y, DiMaso, N, Hlinka, M and Raybould, HE 1998c, 'Length of
intestinal contact on nutrient-driven satiety', Am J Physiol, vol. 275, pp. R1308-
1319.
Miaskiewicz, SL, Stricker, EM and Verbalis, JG 1989, 'Neurohypophyseal secretion in
response to cholecystokinin but not meal-induced gastric distention in humans',
J Clin Endocrinol Metab, vol. 68, no. 4, pp. 837-843.
Miki, T, Minami, K, Shinozaki, H, Matsumura, K, Saraya, A, Ikeda, H, Yamada, Y,
Holst, JJ and Seino, S 2005, 'Distinct effects of glucose-dependent insulinotropic
polypeptide and glucagon-like peptide-1 on insulin secretion and gut motility',
Diabetes, vol. 54, no. 4, pp. 1056-1063.
Mittal, BR, Dhiman, RK, Maini, A, Sewatkar, AB and Das, BK 1997, 'Gastric emptying
in patients with non ulcer dyspepsia (dysmotility type)', Trop Gastroenterol, vol.
18, no. 2, pp. 67-69.
Moayyedi, P and Mason, J 2002, 'Clinical and economic consequences of dyspepsia in
the community', Gut, vol. 50, no. Suppl 4, pp. iv10-12.
Moayyedi, P, Soo, S, Deeks, J, Delaney, B, Harris, A, Innes, M, Oakes, R, Wilson, S,
Roalfe, A, Bennett, C and Forman, D 2005, 'Eradication of Helicobacter pylori
for non-ulcer dyspepsia', Cochrane Database Syst Rev, vol. 1, pp. CD002096.
359

References
Moayyedi, P, Soo, S, Deeks, J, Delaney, B, Innes, M and Forman, D 2003,
'Pharmacological interventions for non-ulcer dyspepsia', Cochrane Database
Syst Rev, vol. 1, pp. CD001960.
Moran, TH and Kinzig, KP 2004, 'Gastrointestinal satiety signals II. Cholecystokinin',
Am J Physiol, vol. 286, no. 2, pp. G183-188.
Moran, TH and McHugh, PR 1988, 'Gastric and nongastric mechanisms for satiety
action of cholecystokinin', Am J Physiol, vol. 254, no. 4 Pt 2, pp. R628-632.
Moran, TH, Smedh, U, Kinzig, KP, Scott, KA, Knipp, S and Ladenheim, EE 2005,
'Peptide YY(3-36) inhibits gastric emptying and produces acute reductions in
food intake in rhesus monkeys', Am J Physiol, vol. 288, no. 2, pp. R384-388.
Moran, TH, Smith, GP, Hostetler, AM and McHugh, PR 1987, 'Transport of
cholecystokinin (CCK) binding sites in subdiaphragmatic vagal branches', Brain
Res, vol. 415, no. 1, pp. 149-152.
Morgan, LM 1996, 'The metabolic role of GIP: physiology and pathology', Biochem Soc
Trans, vol. 24, no. 2, pp. 585-591.
Mullan, A, Kavanagh, P, O'Mahony, P, Joy, T, Gleeson, F and Gibney, MJ 1994, 'Food
and nutrient intakes and eating patterns in functional and organic dyspepsia.' Eur
J Clin Nutr, vol. 48, no. 2, pp. 97-105.
Murray, CD, Martin, NM, Patterson, M, Taylor, SA, Ghatei, MA, Kamm, MA,
Johnston, C, Bloom, SR and Emmanuel, AV 2005, 'Ghrelin enhances gastric
emptying in diabetic gastroparesis: a double blind, placebo controlled, crossover
study', Gut, vol. 54, no. 12, pp. 1693-1698.
Nakazato, M, Murakami, N, Date, Y, Kojima, M, Matsuo, H, Kangawa, K and
Matsukura, S 2001, 'A role for ghrelin in the central regulation of feeding',
Nature, vol. 409, no. 6817, pp. 194-198.
360

References
Näslund, E, Gutniak, M, Skogar, S, Rossner, S and Hellström, PM 1998, 'Glucagon-like
peptide-1 increases the period of postprandial satiety and slows gastric emptying
in obese men', Am J Clin Nutr, vol. 68, no. 3, pp. 525-530.
Nauck, MA, Baller, B and Meier, JJ 2004, 'Gastric inhibitory polypeptide and glucagon-
like peptide-1 in the pathogenesis of type 2 diabetes', Diabetes, vol. 53, no.
Suppl 3, pp. S190-196.
Nauck, MA, Niedereichholz, U, Ettler, R, Holst, JJ, Orskov, C, Ritzel, R and
Schmiegel, WH 1997, 'Glucagon-like peptide-1 inhibition of gastric emptying
outweighs its insulinotropic effects in healthy humans', Am J Physiol, vol. 273,
no. 5 Pt 1, pp. E981-988.
Nauck, MA, Weber, I, Bach, I, Richter, S, Orskov, C, Holst, JJ and Schmiegel, W 1998,
'Normalization of fasting glycaemia by intravenous GLP-1 ([7-36 amide] or [7-
37]) in type 2 diabetic patients', Diabet Med, vol. 15, no. 11, pp. 937-945.
Nelsen, TS, Eigenbrodt, EH and Keoshian, LA 1966, 'Motor responses of the canine
stomach to insulin and feeding', Arch Surg, vol. 92, no. 3, pp. 379-385.
Nicolaidis, S and Rowland, N 1976, 'Metering of intravenous versus oral nutrients and
regulation of energy balance', Am J Physiol, vol. 231, no. 3, pp. 661-668.
NIH Consensus Conference 1994, 'Helicobacter pylori in peptic ulcer disease. NIH
Consensus Development Panel on helicobacter pylori in peptic ulcer disease',
JAMA, vol. 272, no. 1, pp. 65-69.
Nicolay, K 1984, 'Functional gastroenteropathies in therapeutic blind comparison of
metoclopramide with the phytopharmaceutical Iberogast', Gastro Entero
Hepatologie, vol. 2, pp. 24-28.
361

References
Nishizawa, T, Suzuki, H, Nomoto, Y, Masaoka, T, Hosoda, H, Mori, M, Ohara, T,
Morishita, T, Kanagawa, K and Hibi, T 2006, 'Enhanced plasma ghrelin in
patients with functional dyspepsia', Aliment Pharmacol Ther, vol. 24, no. Suppl.
4, pp. 104-110.
Nonaka, N, Shioda, S, Niehoff, ML and Banks, WA 2003, 'Characterization of blood-
brain barrier permeability to PYY3-36 in the mouse', J Pharmacol Exp Ther,
vol. 306, no. 3, pp. 948-953.
Norrelund, N, Helles, A and Schmiegelow, M 1980, '[Uncharacteristic dyspepsia in
general practice. A controlled trial with an antacid (Alminox)]', Ugeskr Laeger,
vol. 142, no. 27, pp. 1750-1753.
Nyren, O, Adami, HO, Bates, S, Bergstrom, R, Gustavsson, S, Loof, L and Nyberg, A
1986, 'Absence of therapeutic benefit from antacids or cimetidine in non-ulcer
dyspepsia', N Engl J Med, vol. 314, no. 6, pp. 339-343.
Nyren, O, Adami, HO, Gustavsson, S, Lindgren, PG, Loof, L and Nyberg, A 1987, 'The
"epigastric distress syndrome". A possible disease entity identified by history
and endoscopy in patients with nonulcer dyspepsia', J Clin Gastroenterol, vol. 9,
no. 3, pp. 303-309.
Nyren, O, Adami, HO, Gustavsson, S, Loof, L and Nyberg, A 1985, 'Social and
economic effects of non-ulcer dyspepsia', Scand J Gastroenterol Suppl, vol. 109,
pp. 41-47.
O'Donovan, D, Feinle-Bisset, C, Wishart, J and Horowitz, M 2003, 'Acute effects of
lipase inhibition on subsequent food intake in humans', Br J Nutr, vol. 90, pp.
849-852.
362

References
O'Donovan, DG, Doran, S, Feinle-Bisset, C, Jones, KL, Meyer, JH, Wishart, JM,
Morris, HA and Horowitz, M 2004, 'Effect of variations in small intestinal
glucose delivery on plasma glucose, insulin, and incretin hormones in healthy
subjects and type 2 diabetes', J Clin Endocrinol Metab, vol. 89, no. 7, pp. 3431-
3435.
Ohlsson, B, Melander, O, Thorsson, O, Olsson, R, Ekberg, O and Sundkvist, G 2006,
'Oesophageal dysmotility, delayed gastric emptying and autonomic neuropathy
correlate to disturbed glucose homeostasis', Diabetologia, vol. 49, no. 9, pp.
2010-2014.
Olubuyide, IO, Ayoola, EA, Okubanjo, AO and Atoba, MA 1986, 'Non-ulcer dyspepsia
in Nigerians clinical and therapeutic results', Scand J Gastroenterol Suppl, vol.
124, pp. 83-87.
Onaga, T, Zabielski, R and Kato, S 2002, 'Multiple regulation of peptide YY secretion
in the digestive tract', Peptides, vol. 23, no. 2, pp. 279-290.
Ouyang, H and Chen, JD 2004, 'Review article: therapeutic roles of acupuncture in
functional gastrointestinal disorders', Aliment Pharmacol Ther, vol. 20, no. 8,
pp. 831-841.
Overduin, J, Frayo, RS, Grill, HJ, Kaplan, JM and Cummings, DE 2005, 'Role of the
duodenum and macronutrient type in ghrelin regulation', Endocrinology, vol.
146, no. 2, pp. 845-850.
Pappas, TN, Melendez, RL, Strah, KM and Debas, HT 1985, 'Cholecystokinin is not a
peripheral satiety signal in the dog', Am J Physiol, vol. 249, no. 6 Pt 1, pp. G733-
738.
363

References
Parker, B, Sturm, K, MacIntosh, CG, Feinle, C, Horowitz, M and Chapman, IM 2004,
'Relation between food intake and visual analogue scale ratings of appetite and
other sensations in healthy older and young subjects', Eur J Clin Nutr, vol. 58,
no. 2, pp. 212-218.
Parker, BA, Doran, S, Wishart, J, Horowitz, M and Chapman, IM 2005, 'Effects of
small intestinal and gastric glucose administration on the suppression of plasma
ghrelin concentrations in healthy older men and women', Clin Endocrinol (Oxf),
vol. 62, no. 5, pp. 539-546.
Peeters, TL 1993, 'Erythromycin and other macrolides as prokinetic agents',
Gastroenterology, vol. 105, no. 6, pp. 1886-1899.
Perez-Garcia, F, Adzet, T and Canigueral, S 2000, 'Activity of artichoke leaf extract on
reactive oxygen species in human leukocytes', Free Radic Res, vol. 33, no. 5, pp.
661-665.
Perkel, MS, Moore, C, Hersh, T and Davidson, ED 1979, 'Metoclopramide therapy in
patients with delayed gastric emptying: a randomized, double-blind study', Dig
Dis Sci, vol. 24, no. 9, pp. 662-666.
Pi-Sunyer, X, Kissileff, HR, Thornton, J and Smith, GP 1982, 'C-terminal octapeptide
of cholecystokinin decreases food intake in obese men', Physiol Behav, vol. 29,
no. 4, pp. 627-630.
Polak, JM, Bloom, SR, Rayford, PL, Pearse, AG, Buchan, AM and Thompson, JC
1975, 'Identification of cholecystokinin-secreting cells', Lancet, vol. 2, no. 7943,
pp. 1016-1018.
364

References
Quigley, JP and Templeton, RD 1930, 'Action of insulin on the motility of the
gastrointestinal tract. III (a) Action on the pyloric pouch (b) Action on the
stomach following double sympathectomy', Am J Physiol, vol. 91, no. 2, pp.
475-481.
Raybould, HE, Tabrizi, Y, Meyer, JH and Walsh, JH 1999, 'PYY immunoneutralization
does not alter lipid-induced inhibition of gastric emptying in rats', Regul Pept,
vol. 79, no. 2-3, pp. 125-130.
Rayner, CK and Horowitz, M 2005, 'New management approaches for gastroparesis',
Nat Clin Pract Gastroenterol Hepatol, vol. 2, no. 10, pp. 454-462; quiz 493.
Rayner, CK, Park, HS, Doran, SM, Chapman, IM and Horowitz, M 2000a, 'Effects of
cholecystokinin on appetite and pyloric motility during physiological
hyperglycemia', Am J Physiol, vol. 278, pp. G98-104.
Rayner, CK, Park, HS, Wishart, JM, Kong, MF, Doran, SM and Horowitz, M 2000b,
'Effects of intraduodenal glucose and fructose on antropyloric motility and
appetite in healthy humans', Am J Physiol Regul Integr Comp Physiol, vol. 278,
pp. R360-366.
Rayner, CK, Samsom, M, Jones, KL and Horowitz, M 2001, 'Relationships of upper
gastrointestinal motor and sensory function with glycemic control', Diabetes
Care, vol. 24, no. 2, pp. 371-381.
Read, NW, McFarlane, A, Kinsman, RI, Bates, TE, Blackhall, NW, Farrar, GB, Hall,
JC, Moss, G, Morris, AP, O'Neill, B, Welch, I, Lee, Y and Bloom, SR 1984,
'Effect of infusion of nutrient solutions into the ileum on gastrointestinal transit
and plasma levels of neurotensin and enteroglucagon', Gastroenterology, vol.
86, no. 2, pp. 274-280.
365

References
Rechner, AR, Pannala, AS and Rice-Evans, CA 2001, 'Caffeic acid derivatives in
artichoke extract are metabolised to phenolic acids in vivo', Free Radic Res, vol.
35, no. 2, pp. 195-202.
Redstone, HA, Barrowman, N and Veldhuyzen Van Zanten, SJ 2001, 'H2-receptor
antagonists in the treatment of functional (nonulcer) dyspepsia: a meta-analysis
of randomized controlled clinical trials', Aliment Pharmacol Ther, vol. 15, no. 9,
pp. 1291-1299.
Regan, JF 1933, 'The action of insulin on the motility of the empty stomach', Am J
Physiol, vol. 104, no. 1, pp. 91-95.
Rehfeld, JF 1981, 'Four basic characteristics of the gastrin-cholecystokinin system', Am
J Physiol, vol. 240, no. 4, pp. G255-266.
Rehfeld, JF, Sun, G, Christensen, T and Hillingso, JG 2001, 'The predominant
cholecystokinin in human plasma and intestine is cholecystokinin-33', J Clin
Endocrinol Metab, vol. 86, no. 1, pp. 251-258.
Retzlaff, BM, Dowdy, AA, Walden, CE, Bovbjerg, VE and Knopp, RH 1997, 'The
Northwest Lipid Research Clinic Fat Intake Scale: validation and utility', Am J
Public Health, vol. 87, no. 2, pp. 181-185.
Roberge, JN and Brubaker, PL 1993, 'Regulation of intestinal proglucagon-derived
peptide secretion by glucose-dependent insulinotropic peptide in a novel
enteroendocrine loop', Endocrinology, vol. 133, no. 1, pp. 233-240.
Rocca, AS and Brubaker, PL 1999, 'Role of the vagus nerve in mediating proximal
nutrient-induced glucagon-like peptide-1 secretion', Endocrinology, vol. 140, no.
4, pp. 1687-1694.
366

References
Rolls, BJ, Kim, S, McNelis, AL, Fischman, MW, Foltin, RW and Moran, TH 1991,
'Time course of effects of preloads high in fat or carbohydrate on food intake
and hunger ratings in humans.' Am J Physiol, vol. 260, no. 4, pp. R756-763.
Rösch, W, Vinson, B and Sassin, I 2002, 'A randomised clinical trial comparing the
efficacy of a herbal preparation STW 5 with the prokinetic drug cisapride in
patients with dysmotility type of functional dyspepsia', Z Gastroenterol, vol. 40,
no. 6, pp. 401-408.
Saller, R, Pfister-Hotz, G, Iten, F, Melzer, J and Reichling, J 2002, '[Iberogast: a modern
phytotherapeutic combined herbal drug for the treatment of functional disorders
of the gastrointestinal tract (dyspepsia, irritable bowel syndrome)--from
phytomedicine to "evidence based phytotherapy", A systematic review]', Forsch
Komplementarmed Klass Naturheilkd, vol. 9, no. Suppl 1, pp. 1-20.
Samsom, M, Roelofs, JM, Akkermans, LM, van Berge Henegouwen, GP and Smout, AJ
1998, 'Proximal gastric motor activity in response to a liquid meal in type I
diabetes mellitus with autonomic neuropathy', Dig Dis Sci, vol. 43, no. 3, pp.
491-496.
Samsom, M, Verhagen, MA, vanBerge Henegouwen, GP and Smout, AJ 1999,
'Abnormal clearance of exogenous acid and increased acid sensitivity of the
proximal duodenum in dyspeptic patients', Gastroenterology, vol. 116, no. 3, pp.
515-520.
Santangelo, A, Peracchi, M, Conte, D, Fraquelli, M and Porrini, M 1998, 'Physical state
of meal affects gastric emptying, cholecystokinin release and satiety', Br J Nutr,
vol. 80, no. 6, pp. 521-527.
367

References
Sarin, SK, Sharma, P, Chawla, YK, Gopinath, P and Nundy, S 1986, 'Clinical trial on
the effect of domperidone on non-ulcer dyspepsia', Indian J Med Res, vol. 83,
pp. 623-628.
Sarna, SK and Otterson, MF 1988, 'Gastrointestinal motility: some basic concepts',
Pharmacology, vol. 36 Suppl 1, pp. 7-14.
Sarnelli, G, Cuomo, R, Janssens, J and Tack, J 2003, 'Symptom patterns and
pathophysiological mechanisms in dyspeptic patients with and without
Helicobacter pylori', Dig Dis Sci, vol. 48, no. 12, pp. 2229-2236.
Sato, A, Sato, Y, Suzuki, A and Uchida, S 1993, 'Neural mechanisms of the reflex
inhibition and excitation of gastric motility elicited by acupuncture-like
stimulation in anesthetized rats', Neurosci Res, vol. 18, no. 1, pp. 53-62.
Saunders, JH, Oliver, RJ and Higson, DL 1986, 'Dyspepsia: incidence of a non-ulcer
disease in a controlled trial of ranitidine in general practice', Br Med J (Clin Res
Ed), vol. 292, no. 6521, pp. 665-668.
Savage, AP, Adrian, TE, Carolan, G, Chatterjee, VK and Bloom, SR 1987, 'Effects of
peptide YY (PYY) on mouth to caecum intestinal transit time and on the rate of
gastric emptying in healthy volunteers', Gut, vol. 28, no. 2, pp. 166-170.
Saydah, SH, Miret, M, Sung, J, Varas, C, Gause, D and Brancati, FL 2001,
'Postchallenge hyperglycemia and mortality in a national sample of U.S. adults',
Diabetes Care, vol. 24, no. 8, pp. 1397-1402.
Schemann, M, Michel, K, Zeller, F, Hohenester, B and Rühl, A 2006, 'Region-specific
effects of STW 5 and its components in gastric fundus, corpus and antrum',
Phytomedicine, vol. 13, no. Suppl 1, pp. 90-99.
368

References
Schirra, J, Houck, P, Wank, U, Arnold, R, Goke, B and Katschinski, M 2000, 'Effects of
glucagon-like peptide-1(7-36)amide on antro-pyloro-duodenal motility in the
interdigestive state and with duodenal lipid perfusion in humans', Gut, vol. 46,
no. 5, pp. 622-631.
Schirra, J, Katschinski, M, Weidmann, C, Schafer, T, Wank, U, Arnold, R and Goke, B
1996, 'Gastric emptying and release of incretin hormones after glucose ingestion
in humans', J Clin Invest, vol. 97, no. 1, pp. 92-103.
Schirra, J, Nicolaus, M, Roggel, R, Katschinski, M, Storr, M, Woerle, HJ and Goke, B
2006, 'Endogenous glucagon-like peptide 1 controls endocrine pancreatic
secretion and antro-pyloro-duodenal motility in humans', Gut, vol. 55, no. 2, pp.
243-251.
Schirra, J, Wank, U, Arnold, R, Goke, B and Katschinski, M 2002, 'Effects of glucagon-
like peptide-1(7-36)amide on motility and sensation of the proximal stomach in
humans', Gut, vol. 50, no. 3, pp. 341-348.
Schvarcz, E, Palmer, M, Aman, J, Horowitz, M, Stridsberg, M and Berne, C 1997,
'Physiological hyperglycemia slows gastric emptying in normal subjects and
patients with insulin-dependent diabetes mellitus', Gastroenterology, vol. 113,
no. 1, pp. 60-66.
Schwartz, MP, Samsom, M and Smout, AJ 2001, 'Chemospecific alterations in
duodenal perception and motor response in functional dyspepsia', Am J
Gastroenterol, vol. 96, no. 9, pp. 2596-2602.
Schwartz, MW, Woods, SC, Porte, D, Jr., Seeley, RJ and Baskin, DG 2000, 'Central
nervous system control of food intake', Nature, vol. 404, no. 6778, pp. 661-671.
369

References
Schwizer, W, Asal, K, Kreiss, C, Mettraux, C, Borovicka, J, Remy, B, Guzelhan, C,
Hartmann, D and Fried, M 1997a, 'Role of lipase in the regulation of upper
gastrointestinal function in humans', Am J Physiol, vol. 273, no. 3 Pt 1, pp.
G612-620.
Schwizer, W, Borovicka, J, Kunz, P, Fraser, R, Kreiss, C, D'Amato, M, Crelier, G,
Boesiger, P and Fried, M 1997b, 'Role of cholecystokinin in the regulation of
liquid gastric emptying and gastric motility in humans: studies with the CCK
antagonist loxiglumide', Gut, vol. 41, no. 4, pp. 500-504.
Seeley, RJ and Woods, SC 2003, 'Monitoring of stored and available fuel by the CNS:
implications for obesity', Nat Rev Neurosci, vol. 4, no. 11, pp. 901-909.
Sepple, CP and Read, NW 1989, 'Gastrointestinal correlates of the development of
hunger in man', Appetite, vol. 13, no. 3, pp. 183-191.
Shinomiya, T, Fukunaga, M, Akamizu, T, Irako, T, Yokode, M, Kangawa, K, Nakai, Y
and Nakai, Y 2005, 'Plasma acylated ghrelin levels correlate with subjective
symptoms of functional dyspepsia in female patients', Scand J Gastroenterol,
vol. 40, pp. 648-653.
Sloth, B, Davidsen, L, Holst, JJ, Flint, A and Astrup, A 2007, 'Effect of subcutaneous
injections of PYY1-36 and PYY3-36 on appetite, ad libitum energy intake, and
plasma free fatty acid concentration in obese males', Am J Physiol, vol. 293, no.
2, pp. E604-609.
Smout, AJ, Bogaard, JW, Grade, AC, ten Thije, OJ, Akkermans, LM and Wittebol, P
1985, 'Effects of cisapride, a new gastrointestinal prokinetic substance, on
interdigestive and postprandial motor activity of the distal oesophagus in man',
Gut, vol. 26, no. 3, pp. 246-251.
370

References
Soo, S, Moayyedi, P, Deeks, J, Delaney, B, Lewis, M and Forman, D 2003,
'Psycholgical interventions for non-ulcer dyspepsia', Cochrane Database Syst
Rev, vol. 2, pp. CD002301.
Speechly, DP and Buffenstein, R 2000, 'Appetite dysfunction in obese males: evidence
for role of hyperinsulinaemia in passive overconsumption with a high fat diet',
Eur J Clin Nutr, vol. 54, no. 3, pp. 225-233.
Spiller, RC, Trotman, IF, Higgins, BE, Ghatei, MA, Grimble, GK, Lee, YC, Bloom, SR,
Misiewicz, JJ and Silk, DB 1984, 'The ileal brake - inhibition of jejunal motility
after ileal fat perfusion in man', Gut, vol. 25, no. 4, pp. 365-374.
Stanghellini, V, Ghidini, C, Maccarini, MR, Paparo, GF, Corinaldesi, R and Barbara, L
1992, 'Fasting and postprandial gastrointestinal motility in ulcer and non-ulcer
dyspepsia', Gut, vol. 33, no. 2, pp. 184-190.
Stanghellini, V, Tosetti, C, Paternico, A, Barbara, G, Morselli-Labate, AM, Monetti, N,
Marengo, M and Corinaldesi, R 1996, 'Risk indicators of delayed gastric
emptying of solids in patients with functional dyspepsia', Gastroenterology, vol.
110, no. 4, pp. 1036-1042.
Storr, M, Sibaev, A, Weiser, D, Kelber, O, Schirra, J, Goke, B and Allescher, HD 2004,
'Herbal extracts modulate the amplitude and frequency of slow waves in circular
smooth muscle of mouse small intestine', Digestion, vol. 70, no. 4, pp. 257-264.
Straathof, JW, Mearadji, B, Lamers, CB and Masclee, AA 1998, 'Effect of CCK on
proximal gastric motor function in humans.' Am J Physiol, vol. 274, pp. G939-
944.
Stunkard, AJ and Messick, S 1985, 'The three-factor eating questionnaire to measure
dietary restraint, disinhibition and hunger', J Psychosom Res, vol. 29, no. 1, pp.
71-83.
371

References
Sturm, K, Parker, B, Feinle-Bisset, C, Jones, KL, Chapman, I and Horowitz, M 2004,
'Energy intake and appetite are related to antral area in healthy young and older
subjects', Am J Clin Nutr, vol. 80, no. 3, pp. 656-667.
Sullivan, G, Blewett, AE, Jenkins, PL and Allison, MC 1997, 'Eating attitudes and the
irritable bowel syndrome', Gen Hosp Psychiatry, vol. 19, no. 1, pp. 62-64.
Suzuki, H, Masaoka, T, Sakai, G, Ishii, H and Hibi, T 2005, 'Improvement of
gastrointestinal quality of life scores in cases of Helicobacter pylori-positive
functional dyspepsia after successful eradication therapy', J Gastroenterol
Hepatol, vol. 20, no. 11, pp. 1652-1660.
Tack, J, Broekaert, D, Coulie, B, Fischler, B and Janssens, J 2003, 'Influence of the
selective serotonin re-uptake inhibitor, paroxetine, on gastric sensorimotor
function in humans', Aliment Pharmacol Ther, vol. 17, no. 4, pp. 603-608.
Tack, J, Caenepeel, P, Fischler, B, Piessevaux, H and Janssens, J 2001, 'Symptoms
associated with hypersensitivity to gastric distention in functional dyspepsia',
Gastroenterology, vol. 121, no. 3, pp. 526-535.
Tack, J, Coulie, B, Wilmer, A, Andrioli, A and Janssens, J 2000, 'Influence of
sumatriptan on gastric fundus tone and on the perception of gastric distension in
man', Gut, vol. 46, no. 4, pp. 468-473.
Tack, J, Depoortere, I, Bisschops, R, Delporte, C, Coulie, B, Meulemans, A, Janssens, J
and Peeters, T 2006, 'Influence of ghrelin on interdigestive gastrointestinal
motility in humans', Gut, vol. 55, no. 3, pp. 327-333.
Tack, J, Depoortere, I, Bisschops, R, Verbeke, K, Janssens, J and Peeters, T 2005,
'Influence of ghrelin on gastric emptying and meal-related symptoms in
idiopathic gastroparesis', Aliment Pharmacol Ther, vol. 22, no. 9, pp. 847-853.
372

References
Tack, J, Piessevaux, H, Coulie, B, Caenepeel, P and Janssens, J 1998, 'Role of impaired
gastric accommodation to a meal in functional dyspepsia', Gastroenterology,
vol. 115, no. 6, pp. 1346-1352.
Taggart, D and Billington, BP 1966, 'Fatty foods and dyspepsia', Lancet, vol. 27, no. 2,
pp. 465-466.
Takahashi, T 2006, 'Acupuncture for functional gastrointestinal disorders', J
Gastroenterol, vol. 41, no. 5, pp. 408-417.
Talley, NJ 1994, 'A critique of therapeutic trials in Helicobacter pylori-positive
functional dyspepsia', Gastroenterology, vol. 106, no. 5, pp. 1174-1183.
Talley, NJ 1995, 'Review article: functional dyspepsia--should treatment be targeted on
disturbed physiology?' Aliment Pharmacol Ther, vol. 9, no. 2, pp. 107-115.
Talley, NJ, Fett, SL, Zinsmeister, AR and Melton, LJ, 3rd 1994, 'Gastrointestinal tract
symptoms and self-reported abuse: a population-based study', Gastroenterology,
vol. 107, no. 4, pp. 1040-1049.
Talley, NJ, Fung, LH, Gilligan, IJ, McNeil, D and Piper, DW 1986a, 'Association of
anxiety, neuroticism, and depression with dyspepsia of unknown cause. A case-
control study', Gastroenterology, vol. 90, no. 4, pp. 886-892.
Talley, NJ, McNeil, D, Hayden, A and Piper, DW 1986b, 'Randomized, double-blind,
placebo-controlled crossover trial of cimetidine and pirenzepine in nonulcer
dyspepsia', Gastroenterology, vol. 91, no. 1, pp. 149-156.
Talley, NJ, Meineche-Schmidt, V, Pare, P, Duckworth, M, Raisanen, P, Pap, A,
Kordecki, H and Schmid, V 1998, 'Efficacy of omeprazole in functional
dyspepsia: double-blind, randomized, placebo-controlled trials (the Bond and
Opera studies)', Aliment Pharmacol Ther, vol. 12, no. 11, pp. 1055-1065.
373

References
Talley, NJ and Phillips, SF 1988, 'Non-ulcer dyspepsia: potential causes and
pathophysiology', Ann Intern Med, vol. 108, no. 6, pp. 865-879.
Talley, NJ, Phillips, SF, Bruce, B, Twomey, CK, Zinsmeister, AR and Melton, LJ, 3rd
1990, 'Relation among personality and symptoms in nonulcer dyspepsia and the
irritable bowel syndrome', Gastroenterology, vol. 99, no. 2, pp. 327-333.
Talley, NJ and Piper, DW 1986, 'Major life event stress and dyspepsia of unknown
cause: a case control study', Gut, vol. 27, no. 2, pp. 127-134.
Talley, NJ, Stanghellini, V, Heading, RC, Koch, KL, Malagelada, JR and Tytgat, GN
1999a, 'Functional gastroduodenal disorders', Gut, vol. 45, no. Suppl 2, pp. 37-
42.
Talley, NJ, Tack, J, Ptak, T, Gupta, R and Giguere, M 2007, 'Itopride in functional
dyspepsia: Results of two phase III multicenter, randomized, double-blind,
placebo-controlled trials', Gut, (in press).
Talley, NJ, Verlinden, M and Jones, M 1999b, 'Validity of a new quality of life scale for
functional dyspepsia: a United States multicenter trial of the Nepean Dyspepsia
Index', Am J Gastroenterol, vol. 94, no. 9, pp. 2390-2397.
Talley, NJ, Verlinden, M and Jones, M 2001, 'Can symptoms discriminate among those
with delayed or normal gastric emptying in dysmotility-like dyspepsia?' Am J
Gastroenterol, vol. 96, no. 5, pp. 1422-1428.
Talley, NJ, Verlinden, M, Snape, W, Beker, JA, Ducrotte, P, Dettmer, A, Brinkhoff, H,
Eaker, E, Ohning, G, Miner, PB, Mathias, JR, Fumagalli, I, Staessen, D and
Mack, RJ 2000, 'Failure of a motilin receptor agonist (ABT-229) to relieve the
symptoms of functional dyspepsia in patients with and without delayed gastric
emptying: a randomized double-blind placebo-controlled trial', Aliment
Pharmacol Ther, vol. 14, no. 12, pp. 1653-1661.
374

References
Taylor, IL 1985, 'Distribution and release of peptide YY in dog measured by specific
radioimmunoassay', Gastroenterology, vol. 88, no. 3, pp. 731-737.
Tebaldi, M and Heading, RC 1998, 'Clinical economics review: functional (non-ulcer)
dyspepsia', Aliment Pharmacol Ther, vol. 12, no. 1, pp. 11-19.
Thamlikitkul, V, Bunyapraphatsara, N, Dechatiwongse, T, Theerapong, S, Chantrakul,
C, Thanaveerasuwan, T, Nimitnon, S, Boonroj, P, Punkrut, W, Gingsungneon, V
and et al. 1989, 'Randomized double blind study of Curcuma domestica Val. for
dyspepsia', J Med Assoc Thai, vol. 72, no. 11, pp. 613-620.
Theodorakis, MJ, Carlson, O, Michopoulos, S, Doyle, ME, Juhaszova, M, Petraki, K
and Egan, JM 2006, 'Human duodenal enteroendocrine cells: source of both
incretin peptides, GLP-1 and GIP', Am J Physiol Endocrinol Metab, vol. 290,
no. 3, pp. E550-559.
Thompson Coon, J and Ernst, E 2002, 'Systematic review: herbal medicinal products for
non-ulcer dyspepsia', Aliment Pharmacol Ther, vol. 16, no. 10, pp. 1689-1699.
Toft-Nielsen, MB, Damholt, MB, Madsbad, S, Hilsted, LM, Hughes, TE, Michelsen,
BK and Holst, JJ 2001, 'Determinants of the impaired secretion of glucagon-like
peptide-1 in type 2 diabetic patients', J Clin Endocrinol Metab, vol. 86, no. 8,
pp. 3717-3723.
Tolessa, T, Gutniak, M, Holst, JJ, Efendic, S and Hellstrom, PM 1998, 'Glucagon-like
peptide-1 retards gastric emptying and small bowel transit in the rat: effect
mediated through central or enteric nervous mechanisms', Dig Dis Sci, vol. 43,
no. 10, pp. 2284-2290.
375

References
Tonini, M, Cipollina, L, Poluzzi, E, Crema, F, Corazza, GR and De Ponti, F 2004,
'Review article: clinical implications of enteric and central D2 receptor blockade
by antidopaminergic gastrointestinal prokinetics', Aliment Pharmacol Ther, vol.
19, no. 4, pp. 379-390.
Tosetti, C, Corinaldesi, R, Stanghellini, V, Pasquali, R, Corbelli, C, Zoccoli, G, Di
Febo, G, Monetti, N and Barbara, L 1996, 'Gastric emptying of solids in morbid
obesity', Int J Obes Relat Metab Disord, vol. 20, no. 3, pp. 200-205.
Tougas, G, Anvari, M, Dent, J, Somers, S, Richards, D and Stevenson, GW 1992,
'Relation of pyloric motility to pyloric opening and closure in healthy subjects',
Gut, vol. 33, no. 4, pp. 466-471.
Troncon, LE, Bennett, RJ, Ahluwalia, NK and Thompson, DG 1994, 'Abnormal
intragastric distribution of food during gastric emptying in functional dyspepsia
patients', Gut, vol. 35, no. 3, pp. 327-332.
Turton, MD, O'Shea, D, Gunn, I, Beak, SA, Edwards, CM, Meeran, K, Choi, SJ, Taylor,
GM, Heath, MM, Lambert, PD, Wilding, JP, Smith, DM, Ghatei, MA, Herbert, J
and Bloom, SR 1996, 'A role for glucagon-like peptide-1 in the central
regulation of feeding', Nature, vol. 379, no. 6560, pp. 69-72.
Tytgat, GN, Noach, L and Rauws, EA 1991, 'Helicobacter pylori', Scand J
Gastroenterol Suppl, vol. 187, pp. 1-8.
Ueno, H, Yamaguchi, H, Mizuta, M and Nakazato, M 2008, 'The role of PYY in
feeding regulation', Regul Pept, vol. 145, no. 1-3, pp. 12-16.
Vallone, D, Picetti, R and Borrelli, E 2000, 'Structure and function of dopamine
receptors', Neurosci Biobehav Rev, vol. 24, no. 1, pp. 125-132.
376

References
Van Oudenhove, L, Vandenberghe, J, Geeraerts, B, Vos, R, Persoons, P, Demyttenaere,
K, Fischler, B and Tack, J 2007, 'Relationship between anxiety and gastric
sensorimotor function in functional dyspepsia', Psychosom Med, vol. 69, no. 5,
pp. 455-463.
VanderWeele, DA, Pi-Sunyer, FX, Novin, D and Bush, MJ 1980, 'Chronic insulin
infusion suppresses food ingestion and body weight gain in rats', Brain Res Bull,
vol. 5, no. 4, pp. 7-11.
Veldhuyzen van Zanten, S, Fedorak, RN, Lambert, J, Cohen, L and Vanjaka, A 2003,
'Absence of symptomatic benefit of lansoprazole, clarithromycin, and
amoxicillin triple therapy in eradication of Helicobacter pylori positive,
functional (nonulcer) dyspepsia', Am J Gastroenterol, vol. 98, no. 9, pp. 1963-
1969.
Veldhuyzen van Zanten, SJ, Jones, MJ, Verlinden, M and Talley, NJ 2001, 'Efficacy of
cisapride and domperidone in functional (nonulcer) dyspepsia: a meta-analysis',
Am J Gastroenterol, vol. 96, no. 3, pp. 689-696.
Verdich, C, Flint, A, Gutzwiller, JP, Naslund, E, Beglinger, C, Hellstrom, PM, Long,
SJ, Morgan, LM, Holst, JJ and Astrup, A 2001a, 'A meta-analysis of the effect
of glucagon-like peptide-1 (7-36) amide on ad libitum energy intake in humans',
J Clin Endocrinol Metab, vol. 86, no. 9, pp. 4382-4389.
Verdich, C, Toubro, S, Buemann, B, Lysgard Madsen, J, Juul Holst, J and Astrup, A
2001b, 'The role of postprandial releases of insulin and incretin hormones in
meal-induced satiety--effect of obesity and weight reduction', Int J Obes Relat
Metab Disord, vol. 25, no. 8, pp. 1206-1214.
377

References
Verhagen, MA, Samsom, M and Smout, AJ 1998, 'Effects of intraduodenal glucose
infusion on gastric myoelectrical activity and antropyloroduodenal motility', Am
J Physiol, vol. 274, no. 6 (Pt 1), pp. G1038-1044.
Vingerhagen, S, Hausken, T, Gilja, OH and Berstad, A 2000, 'Influence of a 5HT1
receptor agonist on gastric accommodation and initial transpyloric flow in
healthy subjects', Neurogastroenterol Motil, vol. 12, no. 1, pp. 95-101.
Vitola, J, Vukanovic, J and Roden, DM 1998, 'Cisapride-induced torsades de pointes', J
Cardiovasc Electrophysiol, vol. 9, no. 10, pp. 1109-1113.
Vozzo, R, Wittert, G, Cocchiaro, C, Tan, WC, Mudge, J, Fraser, R and Chapman, I
2003, 'Similar effects of foods high in protein, carbohydrate and fat on
subsequent spontaneous food intake in healthy individuals', Appetite, vol. 40, no.
2, pp. 101-107.
Walker, GD, Stewart, JJ and Bass, P 1974, 'The effect of parietal cell and truncal
vagotomy on gastric and duodenal contractile activity of the unanesthetized dog',
Ann Surg, vol. 179, no. 6, pp. 853-858.
Weberg, R and Berstad, A 1988, 'Low-dose antacids and pirenzepine in the treatment of
patients with non-ulcer dyspepsia and erosive prepyloric changes. A
randomized, double-blind, placebo-controlled trial', Scand J Gastroenterol, vol.
23, no. 2, pp. 237-243.
Wegener, M, Borsch, G, Schaffstein, J, Reuter, C and Leverkus, F 1989, 'Frequency of
idiopathic gastric stasis and intestinal transit disorders in essential dyspepsia', J
Clin Gastroenterol, vol. 11, no. 2, pp. 163-168.
Weihrauch, TR, Forster, CF and Krieglstein, J 1979, 'Evaluation of the effect of
domperidone on human oesophageal and gastroduodenal motility by
intraluminal manometry', Postgrad Med J, vol. 55, no. Suppl 1, pp. 7-10.
378

References
Welch, IM, Saunders, K and Read, NW 1985, 'Effect of ileal and intravenous infusions
of fat emulsions on feeding and satiety in human volunteers', Gastroenterology,
vol. 89, no. 6, pp. 1293-1297.
Welch, IM, Sepple, CP and Read, NW 1988, 'Comparisons of the effects on satiety and
eating behaviour of infusion of lipid into the different regions of the small
intestine', Gut, vol. 29, pp. 306-311.
Westbrook, JI and Talley, NJ 2002, 'Empiric clustering of dyspepsia into symptom
subgroups: a population-based study', Scand J Gastroenterol, vol. 37, no. 8, pp.
917-923.
Westphal, J, Horning, M and Leonhardt, K 1996, 'Phytotherapy in functional upper
abdominal complaints. Results of a clinical study with a preparation of several
plants', Phytomedicine, vol. 2, pp. 1-12.
Whorwell, PJ, Prior, A and Faragher, EB 1984, 'Controlled trial of hypnotherapy in the
treatment of severe refractory irritable-bowel syndrome', Lancet, vol. 2, no.
8414, pp. 1232-1234.
Willems, JL, Buylaert, WA, Lefebvre, RA and Bogaert, MG 1985, 'Neuronal dopamine
receptors on autonomic ganglia and sympathetic nerves and dopamine receptors
in the gastrointestinal system', Pharmacol Rev, vol. 37, no. 2, pp. 165-216.
Williams, NS, Meyer, JH, Jehn, D, Miller, J and Fink, AS 1984, 'Canine intestinal
transit and digestion of radiolabeled liver particles', Gastroenterology, vol. 86,
no. 6, pp. 1451-1459.
Wishart, J, Morris, HA and Horowitz, M 1992, 'Radioimmunoassay of gastric inhibitory
polypeptide in plasma', Clin Chem, vol. 38, no. 10, pp. 2156-2157.
379

References
Wishart, JM, Horowitz, M, Morris, HA, Jones, KL and Nauck, MA 1998, 'Relation
between gastric emptying of glucose and plasma concentrations of glucagon-like
peptide-1', Peptides, vol. 19, no. 6, pp. 1049-1053.
Wood, JD, Alpers, DH and Andrews, PL 1999, 'Fundamentals of
neurogastroenterology.' Gut, vol. 45, no. Suppl 2, pp. II6-II16.
Woods, SC, Seeley, RJ, Porte, D, Jr. and Schwartz, MW 1998, 'Signals that regulate
food intake and energy homeostasis', Science, vol. 280, no. 5368, pp. 1378-1383.
Woods, SC, Stein, LJ, McKay, LD and Porte, DJ 1984, 'Suppression of food intake by
intravenous nutrients and insulin in the baboon.' Am J Physiol, vol. 247, pp.
R393-401.
Wren, AM, Seal, LJ, Cohen, MA, Brynes, AE, Frost, GS, Murphy, KG, Dhillo, WS,
Ghatei, MA and Bloom, SR 2001, 'Ghrelin enhances appetite and increases food
intake in humans', J Clin Endocrinol Metab, vol. 86, no. 12, pp. 5992-5995.
Xu, S, Hou, X, Zha, H, Gao, Z, Zhang, Y and Chen, JD 2006, 'Electroacupuncture
accelerates solid gastric emptying and improves dyspeptic symptoms in patients
with functional dyspepsia', Dig Dis Sci, vol. 51, no. 12, pp. 2154-2159.
Xu, S, Zha, H, Hou, X and Chen, J 2004, 'Electroacupuncture accelerates solid gastic
emptying in patients with functional dyspepsia', Gastroenerology, vol. 126, pp.
T1163 (abstract).
Xu, X, Zhu, H and Chen, JD 2005, 'Pyloric electrical stimulation reduces food intake by
inhibiting gastric motility in dogs', Gastroenterology, vol. 128, no. 1, pp. 43-50.
Zhang, AL, Chen, RX, Kang, MF, Fan, HL and Wang, WL 1994, 'Clinical investigation
of acupuncture in the treatment of gastric dysmotility', Chin Acupunct, vol. 14,
pp. 1-3.
380

References
Zigmond, AS and Snaith, RP 1983, 'The hospital anxiety and depression scale', Acta
Psychiatr Scand, vol. 67, no. 6, pp. 361-370.
Zung, WW 1965, 'A Self-Rating Depression Scale', Arch Gen Psychiatry, vol. 12, pp.
63-70.
381