Tenofovir renal toxicity targets mitochondria of renal proximal tubules
Upload
independentCategory
view
2download
0
Kidney International, Vol. 45 (1994), pp. 953—961
LABORATORY INVESTIGATION
Factors in the development of secondary hyperparathyroidismduring graded renal failure in the rat
J0RDI BOVER, MARIANO RODRIGUEZ,' PEDRO TRINIDAD,2 AQUILES JARA,MARIA E. MARTINEZ,3 LoR1tINE MACHADO, FRANCISCO LLACH,
and ARNOLD J. FELSENFELD
Department of Medicine, Wadsworth VAMC and UCLA, Los Angeles, California, USA
Factors in the development of secondary hyperparathyroidism duringgraded renal failure in the rat. Secondary hyperparathyroidism (2° HPT)develops as a result of renal failure. Hypocalcemia, phosphorus reten-tion, calcitnol deficiency and skeletal resistance to the calcemic actionof parathyroid hormone (PTH) are closely interrelated pathogenicfactors important for the development of 2° HPT in renal failure. Sinceprevious studies have mainly focused on advanced renal failure, onlylimited data are available in early renal failure. The goal of the presentstudy was to evaluate how alterations in the dietary calcium andphosphorus composition affect the factors known to contribute to thegenesis of 2° HPT in early and more advanced renal failure. To achievethis goal, graded differences in renal function were surgically induced in453 rats while the dietary content of calcium and phosphorus wasvaried. Three different diets were used: (1) a high phosphorus diet(HPD), to induce phosphorus retention and stimulate 2° HPT; (2) a highcalcium diet (HCaD), to inhibit calcitriol synthesis; and (3) a moderatecalcium-moderate phosphorus diet (MCaPD), to separate the effects ofhigh dietary phosphorus and calcium. Based on the serum creatinine(Scr) concentration rats were assigned to one of four different groups:(1) normal renal function (Sr 0.3 mg/dl); (2) mild renal failure (Sr 0.4to 0.6 mg/dl); (3) moderate renal failure (Se. 0.7 to 0.8 mg/dl); or (4)advanced renal failure (Se. � 0.9mg/dl). As the severity of renal failureincreased, progressive 2° HPT developed in each of the dietary groups.In the HPD group, the increase in PTH in normals from 47 2 to 13514 pg/mI in mild renal failure (P < 0.001) was associated with hyper-phosphatemia, a decrease in calcitriol and a decreased calcemic re-sponse to PTH. In the HCaD group, the increase in PTH in normalsfrom 42 2 to 74 4 pg/mI in mild renal failure (P < 0.001) wasassociated with a decrease in calcitriol. In the MCaPD group, 2° HPTdeveloped (40 2 vs. 70 4 pg/ml, normals vs. mild renal failure, P <0.001) despite normal serum calcium, phosphorus and calcitriol levels;however, a decreased calcemic response to PTH was observed. Inadvanced renal failure, progressive increases of PTH were observed inall groups, but PTH levels were approximately three-fold greater in theHPD than the HCaD and MCaPD groups (410 24, 114 14 and 13817 pg/mI, respectively; P < 0.001). While serum calcitriol levels weremarkedly decreased in the HPD and HCaD groups in advanced renalfailure, normal calcitriol levels were present in the MCaPD group. Insummary, the development and magnitude of 2° HPT in the HPD groupcould be best explained by the contribution of several additive factorswhich included: hypocalcemia, phosphorus retention, a calcitriol defi-
Current addresses: 'Hospital Reina Sofia, Cordoba, Spain. 2CentroMedico Nacional "Siglo XXI", Ciudad de Mexico D.F., Mexico.
La Paz, Madrid, Spain.
Received for publication August 19, 1991and in revised form November 3, 1993Accepted for publication November 5, 1993
© 1994 by the International Society of Nephrology
ciency and a decreased calcemic response to PTH. In the HCaD group,a calcitriol deficiency appeared to be the most important factor for thedevelopment of 2° HPT. In the MCaPD group, a decreased calcemicresponse to PTH, which may have been due to uremia, was the onlyfactor to which 2° HPT could be attributed.
Considerable effort has been devoted to identifying the fac-tors which are important for the genesis of secondary hyper-parathyroidism (2° HPT) in renal failure. These factors include:(1) hypocalcemia [1—41; (2) phosphorus retention [1, 2, 5]; (3) adeficiency of calcitriol [6, 71;and (4) skeletal resistance to thecalcemic action of parathyroid hormone (PTH) [8—111. Sincethese pathogenic factors are closely interrelated, evaluating theindependent effect of each factor is often difficult. Hypocalce-mia and a calcitriol deficiency have been shown to directlystimulate PTH synthesis and secretion [4, 6, 12, 13]. Bothphosphorus retention [10, 14] and a calcitriol deficiency [81independently contribute to the decreased calcemic response toPTH. Phosphorus retention has also been shown to inducehypocalcemia [10, 15] and decrease calcitriol production [16—18]. Furthermore, Lopez-Hilker et al have even suggested thatphosphorus retention may directly stimulate PTH secretion[19]. Finally, since the genesis of 2° HPT is multifactorial, it islikely that much of the reported contradictory data regardingthe genesis of 2° HPT in the early stages of renal failure may bedue to differences in the combination of factors contributing tothe development of 2° HPT.
Despite the large body of information on the pathogenesis of2° HPT, this information generally lacks an integrative ap-proach; this is especially true in early renal failure in which onlylimited data are available. During the past several years wehave developed an experimental model in the rat in which thedegree of surgically induced renal failure can be controlled [10,11]. Thus, our goal in the present study was to evaluate indifferent stages of renal failure, how changes in dietary calciumand phosphorus composition affect the factors known to beimportant for the the development and magnitude of 2° HPT. Toaccomplish this goal, we performed a series of studies in whichthe dietary calcium and phosphorus intake was varied in normalrats and in azotemic rats with graded degrees of renal failure. Inaddition, the calcemic response (CR) to PTH which has not
953
954 Bover et a!: Pathogenesis of secondary hyperparathyroidism
been determined in most studies addressing the pathogenesis of2° HPT was evaluated in rats with early renal failure.
Methods
Male Wistar rats weighing 120 to 160 grams were selected forstudy. All rats underwent arterial ligation of the left kidney orsham operation. To obtain different degrees of renal function,one to three branches of the renal artery in the hilum wereligated. This was followed one week later by a right nephrec-tomy or sham operation. During surgical procedures, rats wereanesthetized with 50 mg/kg of sodium pentobarbital (Nembutal,Abbott Laboratories, Chicago, Illinois, USA) administeredintraperitoneally. Rats were housed in individual cages andpair-fed; each rat received 12 to 15 grams of food daily and wasallowed free access to water. Rats ingesting less than 12 gramsper day were removed from the study.
Three different diets were used in the 453 rats studied: (1) ahigh phosphorus diet (HPD; 0.6% calcium, 1.2% phosphorus) toinduce phosphorus retention and 2° HPT [10, 111; (2) a highcalcium diet (HCaD; 1.2% calcium, 0.6% phosphorus) to inhibitcalcitriol synthesis [20] and to evaluate the effect of high dietarycalcium on the development of 2° HPT; and (3) a moderatecalcium-moderate phosphorus diet (MCaPD; 0.6% calcium,0.6% phosphorus) to contrast the effects of high dietary phos-phorus and calcium on the development of 2° HPT. All dietswere provided by the same supplier (ICN, Cleveland, Ohio,USA) and contained the same vitamin D (100 IU/lOO g of diet)and caloric content. In general, the calcium and phosphoruscontent of our three study diets were in the range stated to benormal for the rat [21—23]. The only exception was the phos-phorus content of the high phosphorus diet which was mini-mally greater than the highest phosphorus content (1%) re-ported as a normal diet [23]. The study diets were begunimmediately after the right nephrectomy or the correspondingsham operation. After 16 to 20 days on the respective diets,blood was obtained after overnight fasting for determination ofserum calcium, phosphorus, creatinine, PTH and calcitriol.Based on the serum creatinine concentration, rats were as-signed to one of the four following groups: (1) normal renalfunction; serum creatinine � 0.3 mg/dl (N = 136 rats); (2) mildrenal failure; serum creatinine 0.4 to 0.6 mg/dl (N = 150 rats);(3) moderate renal failure; serum creatinine 0.7 to 0,8 mgldl(N = 90 rats); and (4) advanced renal failure; serum creatinine�0.9 mg/dl (N = 77 rats).
Urinary studiesTo assess the relative effect of the different content of dietary
calcium and phosphorus, a 24 hour urine for calcium, phospho-rus, and creatinine was collected during the last day of the studydiet in a select number of rats with normal renal function andwith mild renal failure. To determine whether dietary changesinduced subtle differences not detected by the measurement ofserum PTH, urinary cyclic AMP, a marker of PTH biologicalactivity, was measured in rats with normal renal function. Forthese urinary studies, rats were housed in individual metaboliccages and urine was collected for 24 hours.
PTH infusionTo evaluate the importance of the CR to PTH in the early
development of 2° HPT, a 48-hour PTH infusion was performed
in rats with mild renal failure. The use of this method todetermine the calcemic response to PTH has been described indetail previously [10, 111. Briefly, 1-34 rat PTH (Bachem,Torrance, California, USA) from a single lot was administeredat a constant rate of 0.11 ug/l00 g body wt/hr using a subcuta-neously implanted miniosmotic pump (Model 2001, Alza, PaloAlto, California, USA). The CR to PTH was defined as theincrease in serum calcium (post-infusion minus basal calcium)after a 48-hour PTH infusion. In our previous studies, ratsreceived a specific study diet for a specified time period andthen were changed to a calcium-free, low phosphorus (0.16%)diet during the PTH infusion to evaluate the skeletal response toF1'H [10, 11]. However, for the present study we reasoned thatthe actual response to PTH is modified by the study diet. Thus,although the response to a PTH infusion during the ingestion ofthe study diet reflects both the skeletal response to PTH and gutabsorption of calcium, it more closely resembles the 16 to 20day period during the induction of 2° HPT in which rats ingestedthe study diet.
Serum calcium was measured by atomic absorption (PerkinElmer, Norwalk, Connecticut, USA); serum phosphorus, uri-nary calcium, and urinary phosphorus with specific kits (Sigma,St. Louis, Missouri, USA); and serum and urinary creatininewith a creatinine analyzer (Beckman, Fullerton, California,USA). Serum PTH was determined using a N-terminal radio-immunoassay (INS, Nichols, San Juan Capistrano, California,USA); this assay has been validated previously for the deter-mination of circulating PTH in the rat [10, 11, 24]. The intra-assay and interassay coefficients of variation were 5.8% and9%, respectively. Serum calcitriol was measured in 171 ratsusing a radioreceptor assay (INS, Nichols); the intraassay andinterassay coefficients of variation were 7.2% and 10.4%, re-spectively. A previous comparison of this assay with a conven-tional radioreceptor assay after double column separationshowed a significant correlation approaching identity (r = 0.93,N 32) [10]. Urinary cyclic AMP was measured with aconventional radioimmunoassay kit (Incstar, Stillwater, Minne-sota, USA).
StatisticsComparisons of the serum data, either among groups with the
same renal function (different diet) or among groups with thesame diet (different renal function) were assessed by ANOVAfollowed by the Duncan's multiple comparison test. The rela-tion between two variables was assessed by Pearson's linearcorrelation. Since the urinary data were not normally distrib-uted, comparisons were performed with non-parametric tests,the Kruskal-Wallis followed by the Mann Whitney. P valuesless than 0.05 were considered significant. Results are ex-pressed as the mean standard error (SE).
ResultsAs shown in Table 1, in rats with normal renal function,
serum calcium was similar in the three dietary groups andserum phosphorus was lower in the HPD than the other twogroups (P < 0.01). The PTH level was higher in the HPD thanthe MCaPD group (P < 0.03) and urinary cyclic AMP (Table 2)greater in the HPD than both the HCaD and MCaPD groups(73 4 vs. 57 4 and 61 3 pmollmin, respectively, P < 0.01).Serum calcitriol was lower in the HCaD than the other two
*
/ I
Bover et al: Pathogenesis of secondary hyperparathyroidism 955
Table 1. Biochemical data for normal renal function and each stageof renal failure
Serum HPD HCaD MCaPD
Normal renal function(N = 136) N — 66 N = 40 N — 30Creatinine mg/dl 0.25 0.01 0.24 0.01 0.25 0.01Calcium mg/dl 9.9 0.1 9.8 0.1 9.9 0.1Phosphorus mg/dl 7.6 0.2 8.2 0.2a 8.3 0.2kPTHC pg/miCa1citrio1' pg/mi
47 2189 1 1
42 2136 9
40 2185 l7''
Mild renal failure (N=-150) N=56 N=45 N49Creatinine mg/di 0.50 0.01 0.50 0.01 0.49 0.01Calcium mg/dl 9.7 0.1 9.8 0.1 10.0 0.1Phosphorus mg/di 8.8 0.3 8.0 o.2 77 0.2PTH pg/mi 135 14 74 4 70 4Calcitriol pg/mi 152 1 1 88 9 227 1 1ab
Moderate renal failure(N = 90) N = 46 N = 24 N = 20Creatinine mg/di 0.75 0.01 0.76 0.01 0.73 0.01Calcium mg/di 8.7 0.2 9.8 0.2 10.0 0.lPhosphorus mg/di 11.8 0.6 7.8 0.3a 7.7 0.3aPTH pg/miCalcitriol pg/mi
3 10 24103 13
87 682 10
107 l5220 23ab
Advanced renalfailure (N — 77) N = 48 N = 16 N — 13
Creatinine mg/di 1.07 0.02 1.06 0.05 1.00 0.04Calcium mg/di 7.0 0.2 9.9 o.2 98 o.2Phosphorus mg/di 16.4 0.7 7.7 0.4a 79 0.2aPTHpg/mlCalcitriol pg/mi
410 2452 13
114 l455 8
138 l7230
Data are: mean SE ; N = number of rats.ap<005vs HPDb p < 0.05 vs. HCaDC Total PTH measurements = 378; respective numbers in each group
starting with normal renal function were 127, 120, 66 and 65.d Total calcitriol measurements = 171 ; respective numbers in each
group starting with normal renal function were 46, 62, 36 and 27.
groups (P < 0.001). As shown in Table 2, urinary calciumexcretion was greater in the HCaD than the HPD group (P <0.05); urinary phosphorus was greater in the HPD than theother two groups (P < 0.01) and greater in the MCaPD than theHCaD group (P < 0.01). The tubular reabsorption of phospho-rus (TRP) was less in the HPD than the other two groups (P <0.001), and lower in the MCaPD than the HCaD group (P <0.01).
In rats with mild renal failure , serum calcium was notdifferent among the three groups (Table 1); however, serumphosphorus was greater in the HPD than the other two groups(P < 0.001). Although all three groups developed 2° HPT, the PTHlevel was approximately twofold higher in the HPD group (P <0.001). The serum calcitriollevel was highest in the MCaPD groupbut was also greater in the HPD than the HCaD group (P <0.001).As shown in Table 2, urinary calcium excretion was greater in theHCaD group than the HPD group (P < 0.05). Urinary phosphoruswas greater in the HPD than the other two groups (P < 0.01) andgreater in the MCaPD than the HCaD group (P < 0.01). TheTRP was less in the HPD than the other two groups (P < 0.001),and lower in the MCaPD than the HCaD group (P < 0.01).
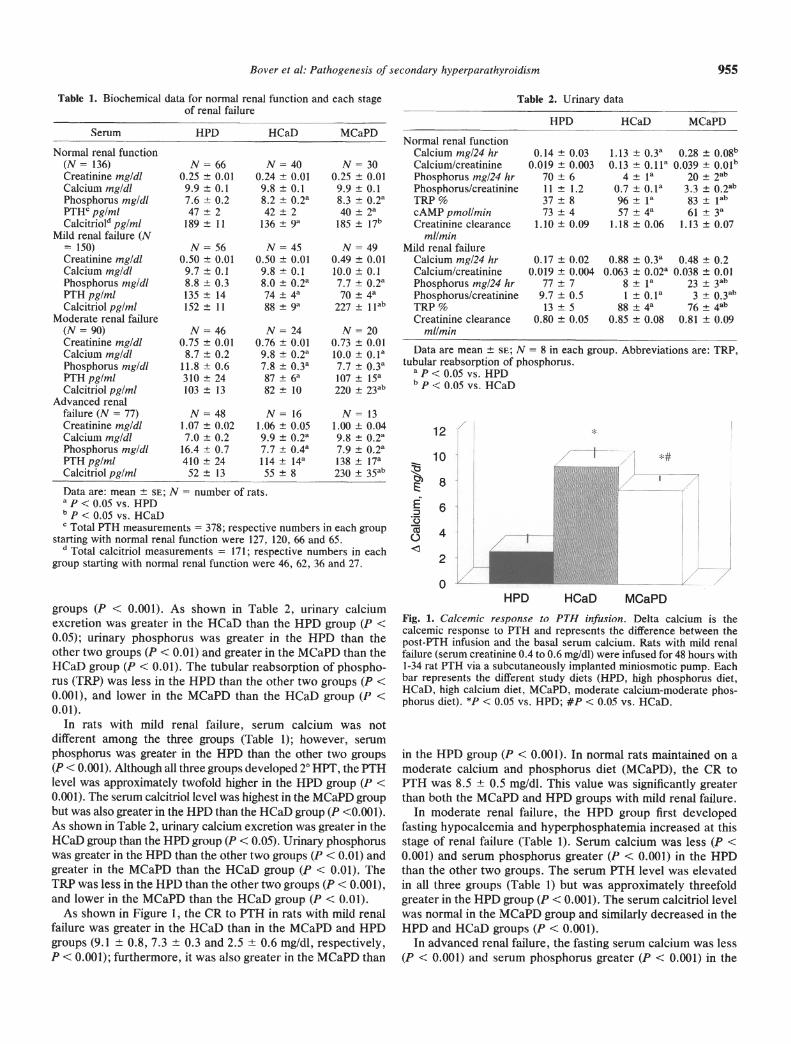
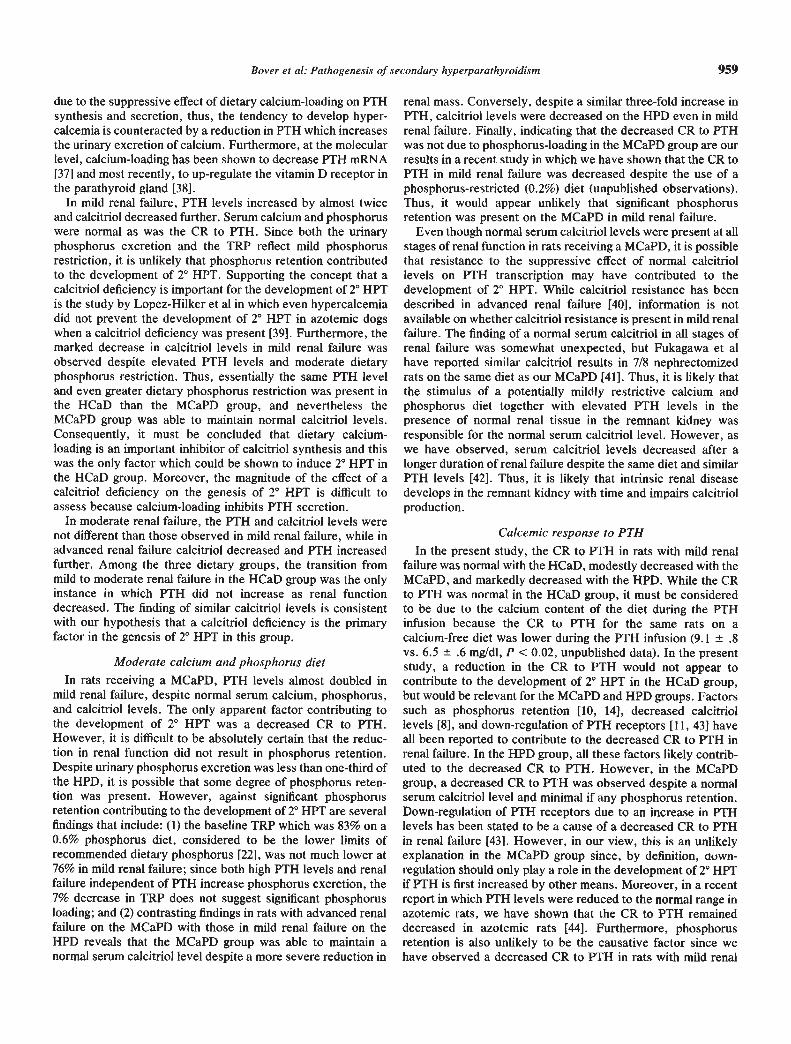
As shown in Figure 1, the CR to PTH in rats with mild renalfailure was greater in the HCaD than in the MCaPD and HPDgroups (9.1 0.8, 7.3 0.3 and 2.5 0.6 mg/dl, respectively,P < 0.001); furthermore, it was also greater in the MCaPD than
Table 2. Urinary data
HPD HCaD MCaPD
Normal renal functionCalcium mg/24 hrCalcium/creatinine
0.14 0.030.019 0.003
1.13 0.30.13 0.1l
0.28 0.08"0.039 0.0l'
Phosphorus mg/24 hrPhosphorus/creatinine
70 611 1.2
4 l0.7 0.la
20 2ab3.3 0.2a
TRP % 37 8 96 l 83 1abcAMP pmoi/min 73 4 57 4a 61 3Creatinine clearance 1.10 0.09 1.18 0.06 1. 13 0.07
mi/mmMild renal failure
Calcium mg/24 hr 0.17 0.02 0.88 0.3a 0.48 0.2Calcium/creatinine 0.019 0.004 0.063 0.02k 0.038 0.01Phosphorus mg/24 hrPhosphorus/creatinine
77 79.7 0.5
8 l1 0.la
233 0.3'
TRP % 13 5 88 4 76
Creatinine clearance 0.80 0.05 0.85 0.08 0.81 0.09mi/mm
Data are mean SE; N = 8 in each group. Abbreviations are: TRP,tubular reabsorption of phosphorus.
ap< •5 vs. HPDb p < 0.05 vs. HCaD
12
10
E 8
I:2
0HPD HCaD MCaPD
Fig. 1. Caicemic response to PTH mnfusmon. Delta calcium is thecalcemic response to PTH and represents the difference between thepost-PTH infusion and the basal serum calcium. Rats with mild renalfailure (serum creatinine 0.4 to 0.6 mg/dl) were infused for 48 hours with1-34 rat PTH via a subcutaneously implanted miniosmotic pump. Eachbar represents the different study diets (HPD, high phosphorus diet,HCaD, high calcium diet, MCaPD, moderate calcium-moderate phos-phorus diet). *J < 0.05 vs. HPD; #P < 0.05 vs. HCaD.
in the HPD group (P < 0.001). In normal rats maintained on amoderate calcium and phosphorus diet (MCaPD), the CR toPTH was 8.5 0.5 mg/dl. This value was significantly greaterthan both the MCaPD and HPD groups with mild renal failure.
In moderate renal failure, the HPD group first developedfasting hypocalcemia and hyperphosphatemia increased at thisstage of renal failure (Table 1). Serum calcium was less (P <0.001) and serum phosphorus greater (P < 0.001) in the HPDthan the other two groups. The serum PTH level was elevatedin all three groups (Table 1) but was approximately threefoldgreater in the HPD group (P < 0.001). The serum calcitriol levelwas normal in the MCaPD group and similarly decreased in theHPD and HCaD groups (P < 0.00 1).
In advanced renal failure, the fasting serum calcium was less(P < 0.001) and serum phosphorus greater (P < 0.001) in the
I0C.)
C)
E
a)Cl)
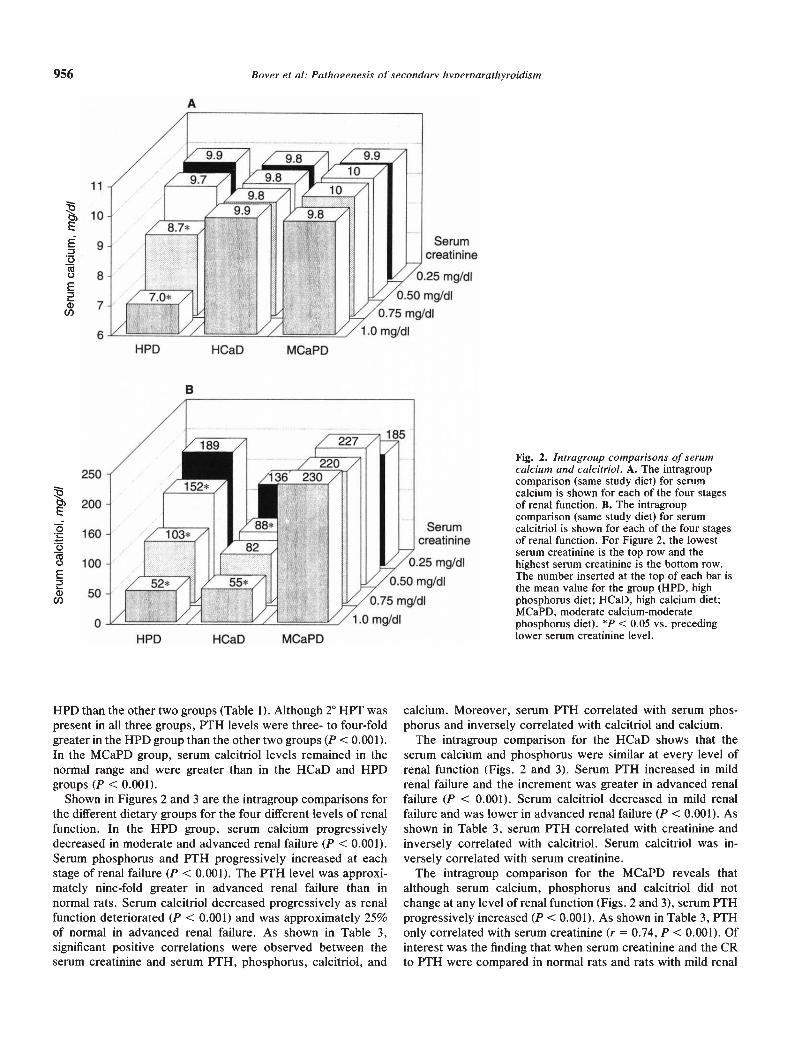
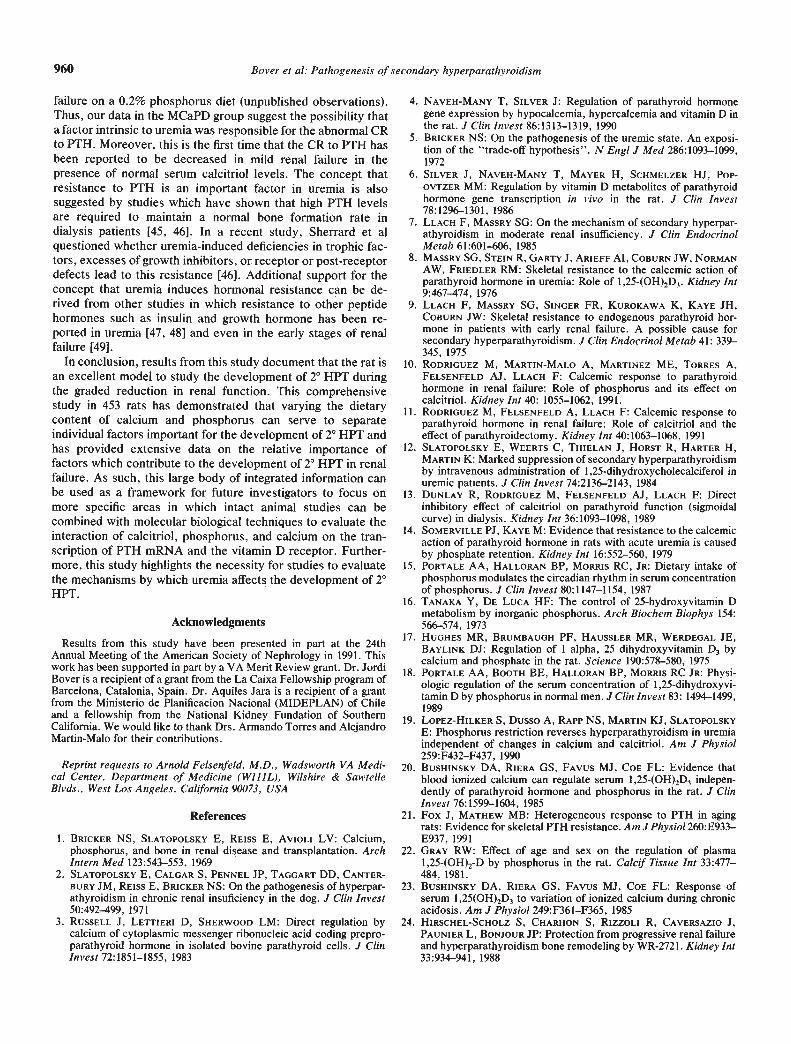
Fig. 2. Intragroup comparisons of serumcalcium and calcitriol. A. The intragroupcomparison (same study diet) for serumcalcium is shown for each of the four stagesof renal function. B. The intragroupcomparison (same study diet) for serumcalcitriol is shown for each of the four stagesof renal function. For Figure 2, the lowestserum creatinine is the top row and thehighest serum creatinine is the bottom row.The number inserted at the top of each bar isthe mean value for the group (HPD, highphosphorus diet; HCaD, high calcium diet;MCaPD, moderate calcium-moderatephosphorus diet). *R < 0.05 vs. precedinglower serum creatinine level.
HPD than the other two groups (Table 1). Although 2° HPT waspresent in all three groups, PTH levels were three- to four-foldgreater in the HPD group than the other two groups (P < 0.001).In the MCaPD group, serum calcitriol levels remained in thenormal range and were greater than in the HCaD and HPDgroups (P < 0.001).
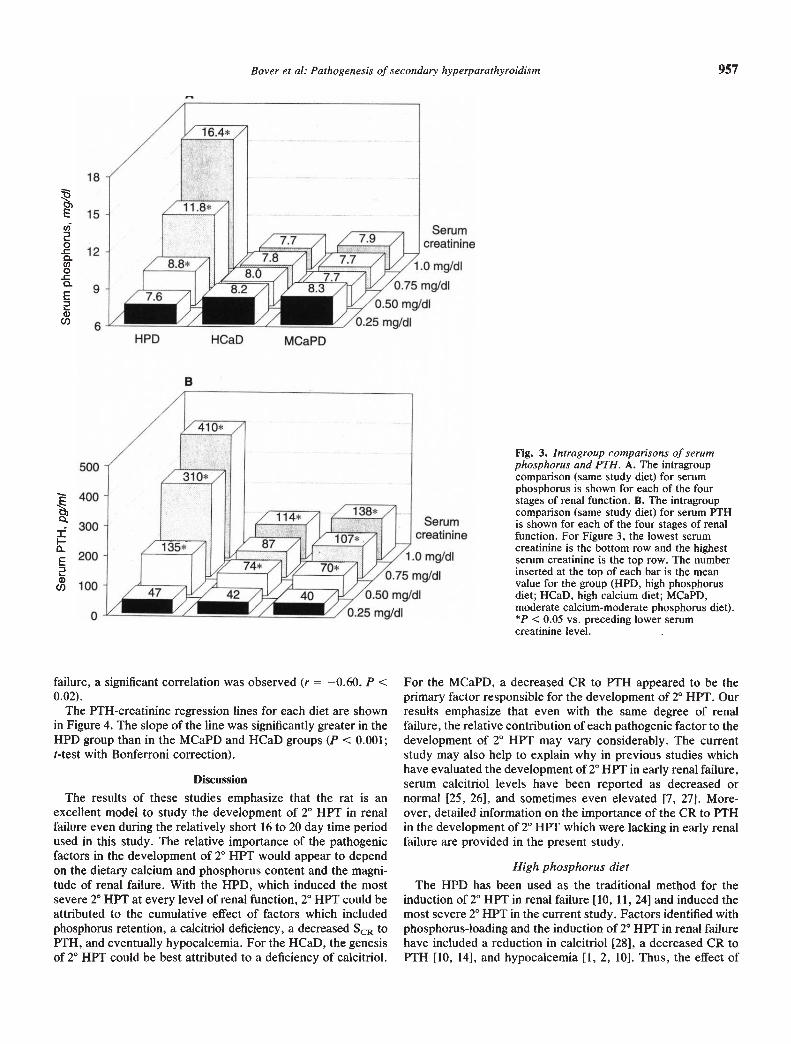
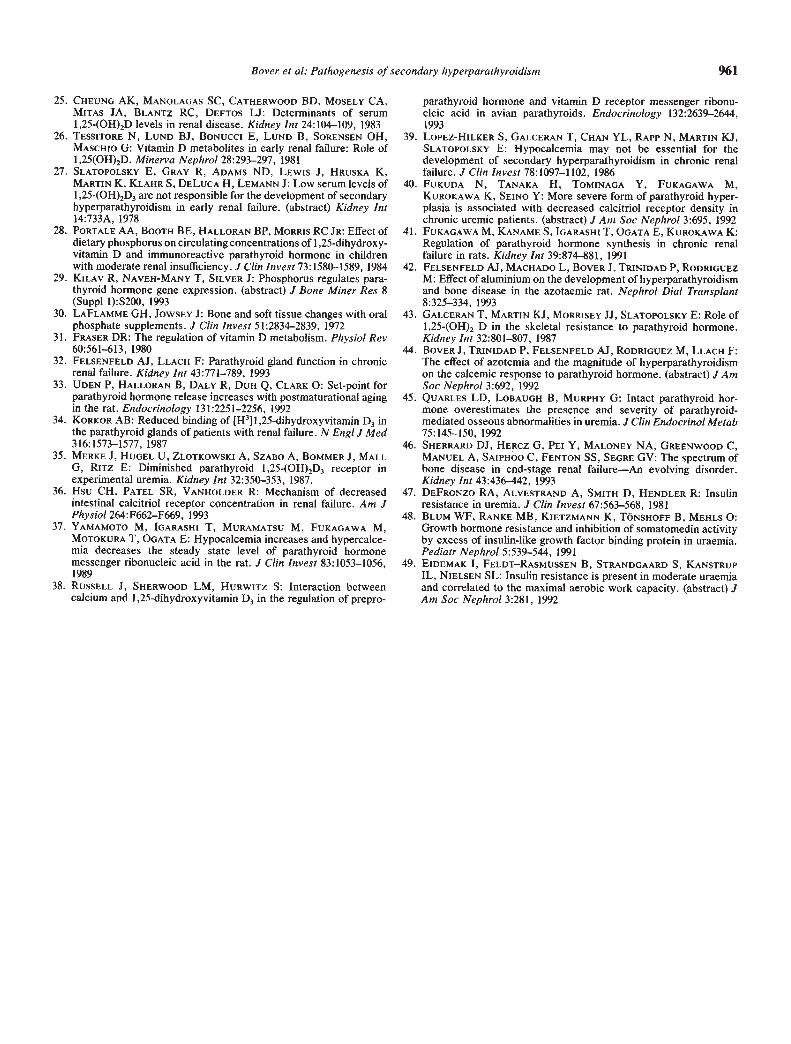
Shown in Figures 2 and 3 are the intragroup comparisons forthe different dietary groups for the four different levels of renalfunction. In the HPD group, serum calcium progressivelydecreased in moderate and advanced renal failure (P < 0.001).Serum phosphorus and PTH progressively increased at eachstage of renal failure (P < 0.001). The PTH level was approxi-mately nine-fold greater in advanced renal failure than innormal rats. Serum calcitriol decreased progressively as renalfunction deteriorated (P < 0.001) and was approximately 25%of normal in advanced renal failure. As shown in Table 3,significant positive correlations were observed between theserum creatinine and serum PTH, phosphorus, calcitriol, and
calcium. Moreover, serum PTH correlated with serum phos-phorus and inversely correlated with calcitriol and calcium.
The intragroup comparison for the HCaD shows that theserum calcium and phosphorus were similar at every level ofrenal function (Figs. 2 and 3). Serum PTH increased in mildrenal failure and the increment was greater in advanced renalfailure (P < 0.001). Serum calcitriol decreased in mild renalfailure and was lower in advanced renal failure (P < 0.001). Asshown in Table 3, serum PTH correlated with creatinine andinversely correlated with calcitriol. Serum calcitriol was in-versely correlated with serum creatinine.
The intragroup comparison for the MCaPD reveals thatalthough serum calcium, phosphorus and calcitriol did notchange at any level of renal function (Figs. 2 and 3), serum PTHprogressively increased (P < 0.001). As shown in Table 3, PTHonly correlated with serum creatinine (r = 0.74, P < 0.001). Ofinterest was the finding that when serum creatinine and the CRto PTH were compared in normal rats and rats with mild renal
956 Bover et a!: Paihovenesis of secondary hvnernarathyroidism
1,
Serumcreatinine
/,/o.25 mg/dI/o.5o mgldl
/o.75 mg/dI/i .0 mg/dI
A
11
10
9
8
7
HPD HCaD MCaPD
B
250
200
160
100
50
I-It'D HGaD MGaFD
7.7
A
_______ Serum______ creatinine
0.75 mg/dI
0.50 mg/dI
HCaD MCaPD
B
Serumcreatinine
1.0 mg/dI
500
300
200
100
I
Bover et a!: Paihogenesis of secondary hyperparathyroidism 957
Fig. 3. Intragroup comparisons of serumphosphorus and PTH. A. The intragroupcomparison (same study diet) for serumphosphorus is shown for each of the fourstages of renal function. B. The intragroupcomparison (same study diet) for serum PTHis shown for each of the four stages of renalfunction. For Figure 3, the lowest serumcreatinine is the bottom row and the highestserum creatinine is the top row. The numberinserted at the top of each bar is the meanvalue for the group (HPD, high phosphorusdiet; HCaD, high calcium diet; MCaPD,moderate calcium.moderate phosphorus diet).*P < 0.05 vs. preceding lower serumcreatinine level.
failure, a significant correlation was observed (r = —0.60, P <0.02).
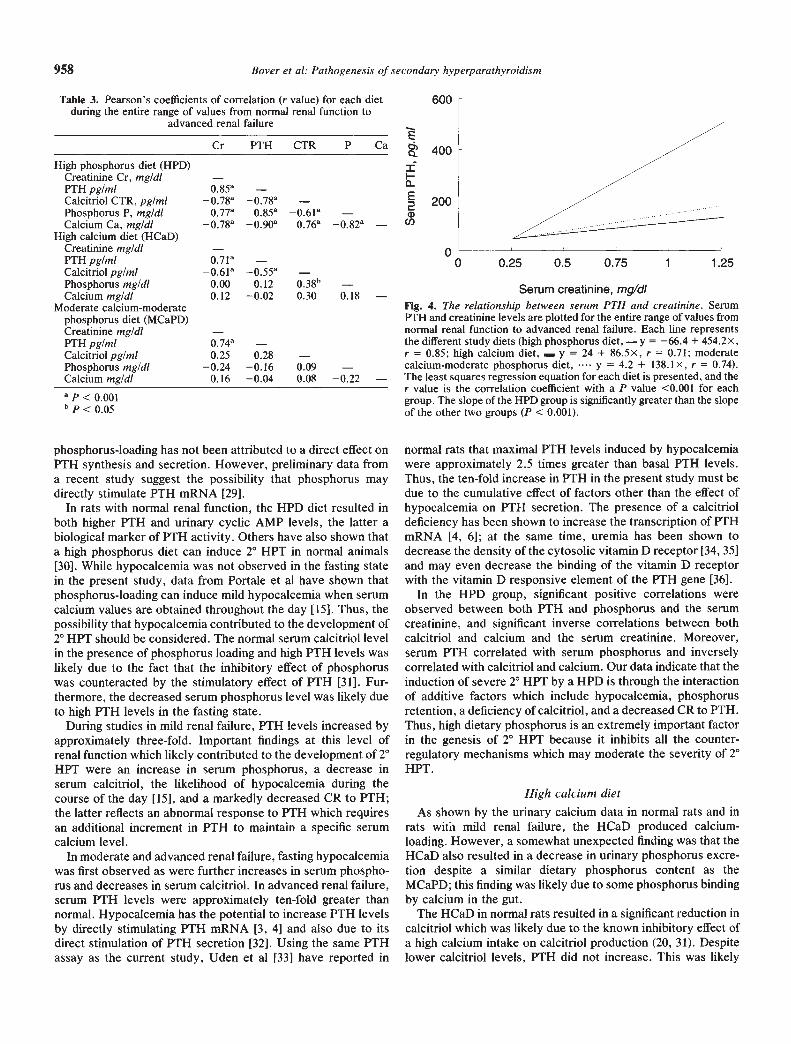
The PTH-creatinine regression lines for each diet are shownin Figure 4. The slope of the line was significantly greater in theHPD group than in the MCaPD and HCaD groups (P < 0.001;t-test with Bonferroni correction).
Discussion
The results of these studies emphasize that the rat is anexcellent model to study the development of 2° HPT in renalfailure even during the relatively short 16 to 20 day time periodused in this study. The relative importance of the pathogenicfactors in the development of 2° HPT would appear to dependon the dietary calcium and phosphorus content and the magni-tude of renal failure. With the HPD, which induced the mostsevere 2° HPT at every level of renal function, 2° HPT could beattributed to the cumulative effect of factors which includedphosphorus retention, a calcitriol deficiency, a decreased SCR toPTH, and eventually hypocalcemia. For the HCaD, the genesisof 2° HPT could be best attributed to a deficiency of calcitriol.
For the MCaPD, a decreased CR to PTH appeared to be theprimary factor responsible for the development of 2° HPT. Ourresults emphasize that even with the same degree of renalfailure, the relative contribution of each pathogenic factor to thedevelopment of 2° HPT may vary considerably. The currentstudy may also help to explain why in previous studies whichhave evaluated the development of 2° HPT in early renal failure,serum calcitriol levels have been reported as decreased ornormal [25, 26], and sometimes even elevated [7, 27]. More-over, detailed information on the importance of the CR to PTHin the development of 2° HPT which were lacking in early renalfailure are provided in the present study.
High phosphorus dietThe HPD has been used as the traditional method for the
induction of 2° HPT in renal failure [10, 11, 24] and induced themost severe 2° HPT in the current study. Factors identified withphosphorus-loading and the induction of 2° HPT in renal failurehave included a reduction in calcitriol [28], a decreased CR toPTH [10, 14], and hypocalcemia [1, 2, 10]. Thus, the effect of
958 Bover et al: Pathogenesis of secondary hyperparathyroidism
Cr PTH CTR P Ca
High phosphorus diet (HPD)Creatinine Cr, mg/di —PTH pg/mi 0.85aCalcitriol CTR, pg/mi o.78°Phosphorus P, mg/di 0.77a 0.85a 0.61aCalcium Ca, mg/dl 0.90a 0.76a
High calcium diet (HCaD)Creatinine mg/dl —PTH pg/mi 0.71°Calcitriol pg/mi —0.61° —0.55° —Phosphorus mg/di 0.00 0.12 038bCalcium mg/dl 0.12 —0.02 0.30 0.18 —
Moderate calcium-moderatephosphorus diet (MCaPD)Creatinine mg/di —PTH pg/mi 0.74aCalcitnol pg/mi 0.25 0.28 —Phosphorus mg/dl —0.24 —0.16 0.09 —Calcium mg/dl 0.16 —0.04 0.08 —0.22 —
phosphorus-loading has not been attributed to a direct effect onPTH synthesis and secretion. However, preliminary data froma recent study suggest the possibility that phosphorus maydirectly stimulate P1'H mRNA [29].
In rats with normal renal function, the HPD diet resulted inboth higher PTH and urinary cyclic AMP levels, the latter abiological marker of PTH activity. Others have also shown thata high phosphorus diet can induce 2° HPT in normal animals[30]. While hypocalcemia was not observed in the fasting statein the present study, data from Portale et al have shown thatphosphorus-loading can induce mild hypocalcemia when serumcalcium values are obtained throughout the day [15]. Thus, thepossibility that hypocalcemia contributed to the development of2° HPT should be considered. The normal serum calcitriol levelin the presence of phosphorus loading and high PTH levels waslikely due to the fact that the inhibitory effect of phosphoruswas counteracted by the stimulatory effect of PTH [31]. Fur-thermore, the decreased serum phosphorus level was likely dueto high PTH levels in the fasting state.
During studies in mild renal failure, PTH levels increased byapproximately three-fold. Important findings at this level ofrenal function which likely contributed to the development of 2°HPT were an increase in serum phosphorus, a decrease inserum calcitriol, the likelihood of hypocalcemia during thecourse of the day [15], and a markedly decreased CR to PTH;the latter reflects an abnormal response to PTH which requiresan additional increment in PTH to maintain a specific serumcalcium level.
In moderate and advanced renal failure, fasting hypocalcemiawas first observed as were further increases in serum phospho-rus and decreases in serum calcitriol. In advanced renal failure,serum PTH levels were approximately ten-fold greater thannormal. Hypocalcemia has the potential to increase PTH levelsby directly stimulating PTH mRNA [3, 4] and also due to itsdirect stimulation of PTH secretion [32]. Using the same PTHassay as the current study, Uden et al [33] have reported in
00 0.25 0.5 0.75 1 1.25
Serum creatinine, mgldiFig. 4. The reiationship between serum PTH and creatinine. SerumP1'H and creatinine levels are plotted for the entire range of values fromnormal renal function to advanced renal failure. Each line representsthe different study diets (high phosphorus diet, — y = —66.4 + 454.2x,r = 0.85; high calcium diet, — y = 24 + 86.5x, r = 0.71; moderatecalcium-moderate phosphorus diet, y = 4.2 + 138,1x, r = 0.74).The least squares regression equation for each diet is presented, and ther value is the correlation coefficient with a P value <0.001 for eachgroup. The slope of the HPD group is significantly greater than the slopeof the other two groups (P < 0.001).
normal rats that maximal PTH levels induced by hypocalcemiawere approximately 2.5 times greater than basal PTH levels.Thus, the ten-fold increase in PTH in the present study must bedue to the cumulative effect of factors other than the effect ofhypocalcemia on PTH secretion. The presence of a calcitrioldeficiency has been shown to increase the transcription of PTHmRNA [4, 6]; at the same time, uremia has been shown todecrease the density of the cytosolic vitamin D receptor [34, 35]and may even decrease the binding of the vitamin D receptorwith the vitamin D responsive element of the PTH gene [36].
In the HPD group, significant positive correlations wereobserved between both PTH and phosphorus and the serumcreatinine, and significant inverse correlations between bothcalcitriol and calcium and the serum creatinine. Moreover,serum PTH correlated with serum phosphorus and inverselycorrelated with calcitriol and calcium. Our data indicate that theinduction of severe 2° HPT by a HPD is through the interactionof additive factors which include hypocalcemia, phosphorusretention, a deficiency of calcitriol, and a decreased CR to PTH.Thus, high dietary phosphorus is an extremely important factorin the genesis of 2° HPT because it inhibits all the counter-regulatory mechanisms which may moderate the severity of 2°HPT.
High calcium dietAs shown by the urinary calcium data in normal rats and in
rats with mild renal failure, the HCaD produced calcium-loading. However, a somewhat unexpected finding was that theHCaD also resulted in a decrease in urinary phosphorus excre-tion despite a similar dietary phosphorus content as theMCaPD; this finding was likely due to some phosphorus bindingby calcium in the gut.
The HCaD in normal rats resulted in a significant reduction incalcitriol which was likely due to the known inhibitory effect ofa high calcium intake on calcitriol production (20, 31). Despitelower calcitriol levels, PTH did not increase. This was likely
Table 3. Pearson's coefficients of correlation (r value) for each dietduring the entire range of values from normal renal function to
advanced renal failure
600
400
200
E
II-0E
wU)
a p < 0.001b p < 0.05
Bover et a!: Pathogenesis of secondary hyperparathyroidism 959
due to the suppressive effect of dietary calcium-loading on PTHsynthesis and secretion, thus, the tendency to develop hyper-calcemia is counteracted by a reduction in PTH which increasesthe urinary excretion of calcium. Furthermore, at the molecularlevel, calcium-loading has been shown to decrease PTHmRNA[371 and most recently, to up-regulate the vitamin D receptor inthe parathyroid gland [38].
In mild renal failure, PTH levels increased by almost twiceand calcitriol decreased further. Serum calcium and phosphoruswere normal as was the CR to PTH. Since both the urinaryphosphorus excretion and the TRP reflect mild phosphorusrestriction, it is unlikely that phosphorus retention contributedto the development of 2° HPT. Supporting the concept that acalcitriol deficiency is important for the development of 2° HPTis the study by Lopez-Hilker et al in which even hypercalcemiadid not prevent the development of 2° HPT in azotemic dogswhen a calcitriol deficiency was present [39]. Furthermore, themarked decrease in calcitriol levels in mild renal failure wasobserved despite elevated PTH levels and moderate dietaryphosphorus restriction. Thus, essentially the same PTH leveland even greater dietary phosphorus restriction was present inthe HCaD than the MCaPD group, and nevertheless theMCaPD group was able to maintain normal calcitriol levels.Consequently, it must be concluded that dietary calcium-loading is an important inhibitor of calcitriol synthesis and thiswas the only factor which could be shown to induce 2° HPT inthe HCaD group. Moreover, the magnitude of the effect of acalcitriol deficiency on the genesis of 2° HPT is difficult toassess because calcium-loading inhibits PTH secretion.
In moderate renal failure, the PTH and calcitriol levels werenot different than those observed in mild renal failure, while inadvanced renal failure calcitriol decreased and PTH increasedfurther. Among the three dietary groups, the transition frommild to moderate renal failure in the HCaD group was the onlyinstance in which PTH did not increase as renal functiondecreased. The finding of similar calcitnol levels is consistentwith our hypothesis that a calcitriol deficiency is the primaryfactor in the genesis of 2° HPT in this group.
Moderate calcium and phosphorus dietIn rats receiving a MCaPD, PTH levels almost doubled in
mild renal failure, despite normal serum calcium, phosphorus,and calcitriol levels. The only apparent factor contributing tothe development of 2° HPT was a decreased CR to PTH.However, it is difficult to be absolutely certain that the reduc-tion in renal function did not result in phosphorus retention.Despite urinary phosphorus excretion was less than one-third ofthe HPD, it is possible that some degree of phosphorus reten-tion was present. However, against significant phosphorusretention contributing to the development of 2° HPT are severalfindings that include: (1) the baseline TRP which was 83% on a0.6% phosphorus diet, considered to be the lower limits ofrecommended dietary phosphorus [22], was not much lower at76% in mild renal failure; since both high PTH levels and renalfailure independent of PTH increase phosphorus excretion, the7% decrease in TRP does not suggest significant phosphorusloading; and (2) contrasting findings in rats with advanced renalfailure on the MCaPD with those in mild renal failure on theHPD reveals that the MCaPD group was able to maintain anormal serum calcitriol level despite a more severe reduction in
renal mass. Conversely, despite a similar three-fold increase inP1'H, calcitriol levels were decreased on the HPD even in mildrenal failure. Finally, indicating that the decreased CR to P'FHwas not due to phosphorus-loading in the MCaPD group are ourresults in a recent study in which we have shown that the CR toPTH in mild renal failure was decreased despite the use of aphosphorus-restricted (0.2%) diet (unpublished observations).Thus, it would appear unlikely that significant phosphorusretention was present on the MCaPD in mild renal failure.
Even though normal serum calcitriol levels were present at allstages of renal function in rats receiving a MCaPD, it is possiblethat resistance to the suppressive effect of normal calcitriollevels on PTH transcription may have contributed to thedevelopment of 2° HPT. While calcitriol resistance has beendescribed in advanced renal failure [40], information is notavailable on whether calcitriol resistance is present in mild renalfailure. The finding of a normal serum calcitriol in all stages ofrenal failure was somewhat unexpected, but Fukagawa et alhave reported similar calcitriol results in 7/8 nephrectomizedrats on the same diet as our MCaPD [41]. Thus, it is likely thatthe stimulus of a potentially mildly restrictive calcium andphosphorus diet together with elevated PTH levels in thepresence of normal renal tissue in the remnant kidney wasresponsible for the normal serum calcitriol level. However, aswe have observed, serum calcitriol levels decreased after alonger duration of renal failure despite the same diet and similarPTH levels [42]. Thus, it is likely that intrinsic renal diseasedevelops in the remnant kidney with time and impairs calcitriolproduction.
Calcemic response to PTHIn the present study, the CR to PTH in rats with mild renal
failure was normal with the HCaD, modestly decreased with theMCaPD, and markedly decreased with the HPD. While the CRto PTH was normal in the HCaD group, it must be consideredto be due to the calcium content of the diet during the PTHinfusion because the CR to PTH for the same rats on acalcium-free diet was lower during the PTH infusion (9.1 .8vs. 6.5 .6 mg/dl, P < 0.02, unpublished data). In the presentstudy, a reduction in the CR to PTH would not appear tocontribute to the development of 2° HPT in the HCaD group,but would be relevant for the MCaPD and HPD groups. Factorssuch as phosphorus retention [10, 14], decreased calcitriollevels [8], and down-regulation of PTH receptors [11, 43] haveall been reported to contribute to the decreased CR to PTH inrenal failure. In the HPD group, all these factors likely contrib-uted to the decreased CR to PTH. However, in the MCaPDgroup, a decreased CR to PTH was observed despite a normalserum calcitriol level and minimal if any phosphorus retention.Down-regulation of PTH receptors due to an increase in PTHlevels has been stated to be a cause of a decreased CR to PTHin renal failure [43]. However, in our view, this is an unlikelyexplanation in the MCaPD group since, by definition, lown-regulation should only play a role in the development of 2° HPTif PTH is first increased by other means. Moreover, in a recentreport in which PTH levels were reduced to the normal range inazotemic rats, we have shown that the CR to PTH remaineddecreased in azotemic rats [44]. Furthermore, phosphorusretention is also unlikely to be the causative factor since wehave observed a decreased CR to PTH in rats with mild renal
960 Bover et a!: Pathogenesis of secondary hyperparathyroidism
failure on a 0.2% phosphorus diet (unpublished observations).Thus, our data in the MCaPD group suggest the possibility thata factor intrinsic to uremia was responsible for the abnormal CRto PTH. Moreover, this is the first time that the CR to PTH hasbeen reported to be decreased in mild renal failure in thepresence of normal serum calcitriol levels. The concept thatresistance to PTH is an important factor in uremia is alsosuggested by studies which have shown that high PTH levelsare required to maintain a normal bone formation rate indialysis patients [45, 46]. In a recent study, Sherrard et alquestioned whether uremia-induced deficiencies in trophic fac-tors, excesses of growth inhibitors, or receptor or post-receptordefects lead to this resistance [46]. Additional support for theconcept that uremia induces hormonal resistance can be de-rived from other studies in which resistance to other peptidehormones such as insulin and growth hormone has been re-ported in uremia [47, 48] and even in the early stages of renalfailure [49].
In conclusion, results from this study document that the rat isan excellent model to study the development of 2° HPT duringthe graded reduction in renal function. This comprehensivestudy in 453 rats has demonstrated that varying the dietarycontent of calcium and phosphorus can serve to separateindividual factors important for the development of 2° HPT andhas provided extensive data on the relative importance offactors which contribute to the development of 2° HPT in renalfailure. As such, this large body of integrated information canbe used as a framework for future investigators to focus onmore specific areas in which intact animal studies can becombined with molecular biological techniques to evaluate theinteraction of calcitriol, phosphorus, and calcium on the tran-scription of PTH mRNA and the vitamin D receptor. Further-more, this study highlights the necessity for studies to evaluatethe mechanisms by which uremia affects the development of 2°HPT.
Acknowledgments
Results from this study have been presented in part at the 24thAnnual Meeting of the American Society of Nephrology in 1991. Thiswork has been supported in part by a VA Merit Review grant. Dr. JordiBover is a recipient of a grant from the La Caixa Fellowship program ofBarcelona, Catalonia, Spain. Dr. Aquiles Jara is a recipient of a grantfrom the Ministerio de Planificacion Nacional (MIDEPLAN) of Chileand a fellowship from the National Kidney Fundation of SouthernCalifornia. We would like to thank Drs. Armando Torres and AlejandroMartin-Malo for their contributions.
Reprint requests to Arnold Felsenfeld, M.D., Wadsworth VA Medi-cal Center, Department of Medicine (WJJIL), Wilshire & SawtelleBlvds., West Los Angeles, California 90073, USA
References
1. BRICKER NS, SLATOPOL5KY E, REIss E, AvIoLI LV: Calcium,phosphorus, and bone in renal disease and transplantation. ArchIntern Med 123:543—553, 1969
2. SLATOPOL5KY E, CALGAR 5, PENNELJP, TAGGART DD, CANTER-BURY JM, REIss E, BRICKER NS: On the pathogenesis of hyperpar-athyroidism in chronic renal insuficiency in the dog. J Cliii invest50:492—499, 1971
3. RUSSELL J, LETTIERI D, SHERWOOD LM: Direct regulation bycalcium of cytoplasmic messenger ribonucleic acid coding prepro-parathyroid hormone in isolated bovine parathyroid cells. J ClinInvest 72:1851—1855, 1983
4. NAVEH-MANY T, SILVER J: Regulation of parathyroid hormonegene expression by hypocalcemia, hypercalcemia and vitamin D inthe rat. J Clin Invest 86:1313—1319, 1990
5. BRICKER NS: On the pathogenesis of the uremic state. An exposi-tion of the "trade-off hypothesis". N EngI J Med 286:1093—1099,1972
6. SILVER J, NAVEH-MANY T, MAYER H, SCHMELZER HJ, Pop-OVTZER MM: Regulation by vitamin D metabolites of parathyroidhormone gene transcription in vivo in the rat. J Clin invest78:1296—1301, 1986
7. LLACH F, MASSRY SG: On the mechanism of secondary hyperpar-athyroidism in moderate renal insufficiency. J Clin EndocrinolMetab 61:601—606, 1985
8. MASSRY SG, STEIN R, GARTY J, ARIEFF AL, COBURN JW, NORMANAW, FRIEDLER RM: Skeletal resistance to the calcemic action ofparathyroid hormone in uremia: Role of I ,25-(OH)2D3. Kidney mt9:467—474, 1976
9. LLACH F, MASSRY 5G. SINGER FR, KUROKAWA K, KAYE JH,COBURN JW: Skeletal resistance to endogenous parathyroid hor-mone in patients with early renal failure. A possible cause forsecondary hyperparathyroidism. J Clin Endocrinol Metab 41: 339—345, 1975
10. RODRIGUEZ M, MARTIN-MALO A, MARTINEZ ME, TORRES A,FELSENFELD AJ, LLACH F: Calcemic response to parathyroidhormone in renal failure: Role of phosphorus and its effect oncalcitriol. Kidney Int 40: 1055—1062, 1991.
11. RODRIGUEZ M, FEL5ENFELD A, LLACH F: Calcemic response toparathyroid hormone in renal failure: Role of calcitriol and theeffect of parathyroidectomy. Kidney mt 40:1063—1068, 1991
12. SLATOPOLSKY E, WEERTS C, THIELAN J, HORST R, HARTER H,MARTIN K: Marked suppression of secondary hyperparathyroidismby intravenous administration of I ,25-dihydroxycholecalciferol inuremic patients. J Clin Invest 74:2136—2143, 1984
13. DUNLAY R, RODRIGUEZ M, FELSENFELD AJ, LLACH F: Directinhibitory effect of calcitriol on parathyroid function (sigmoidalcurve) in dialysis. Kidney mt 36:1093—1098, 1989
14. SOMERVILLE PJ, KAYE M: Evidence that resistance to the calcemicaction of parathyroid hormone in rats with acute uremia is causedby phosphate retention. Kidney ut 16:552—560, 1979
15. PORTALE AA, HALLORAN BP, MoRRIs RC, JR: Dietary intake ofphosphorus modulates the circadian rhythm in serum concentrationof phosphorus. J Cliii Invest 80:1147—1154, 1987
16. TANAKA Y, DE LUCA HF: The control of 25-hydroxyvitamin Dmetabolism by inorganic phosphorus. Arch Biochem Biophys 154:566—574, 1973
17. HUGHES MR, BRUMBAUGH PF, HAU5SLER MR, WERDEGAL JE,BAYLINK DJ: Regulation of 1 alpha, 25 dihydroxyvitamin D3 bycalcium and phosphate in the rat. Science 190:578—580, 1975
18. PORTALE AA, BOOTH BE, HALLORAN BP, MORRIS RC JR: Physi-ologic regulation of the serum concentration of 1 ,25-dihydroxyvi-tamin D by phosphorus in normal men. J Cliii Invest 83: 1494—1499,1989
19. LOPEZ-HILKER 5, Dusso A, RAPP NS, MARTIN KJ, SLATOPOLSKYE: Phosphorus restriction reverses hyperparathyroidism in uremiaindependent of changes in calcium and calcitriol. Am J Physiol259:F432—F437, 1990
20. BUSHINSKY DA, RIERA GS, FAVU5 MJ, COE FL: Evidence thatblood ionized calcium can regulate serum I ,25-(OH)2D3 indepen-dently of parathyroid hormone and phosphorus in the rat. J ClinInvest 76:1599—1604, 1985
21. Fox J, MATHEW MB: Heterogeneous response to PTH in agingrats: Evidence for skeletal P'FH resistance. Am JPhysiol 260:E933-.E937, 1991
22. GRAY RW: Effect of age and sex on the regulation of plasma1 ,25-(OH)2-D by phosphorus in the rat. Calcif Tissue mt 33:477—484, 1981.
23. BUSHINSKY DA, RIERA GS, FAvus MJ, C0E FL: Response ofserum I ,25(OH)2D3 to variation of ionized calcium during chronicacidosis. Am J Physiol 249:F36l—F365, 1985
24. HIRSCHEL-SCHOLZ 5, CHARHON 5, RIZZOLI R, CAVERSAZIO J,PAUNIER L, BONJOUR JP: Protection from progressive renal failureand hyperparathyroidism bone remodeling by WR-2721. Kidney mt33:934—941, 1988
Bover et a!: Pathogenesis of secondary hyperparathyroidism 961
25. CHEUNG AK, MANOLAGAS SC, CATHERWOOD BD, MOSELY CA,MITAS JA, BLANTZ RC, DEFTOS U: Determinants of serum1 ,25-(OH)2D levels in renal disease, Kidney mt 24:104—109, 1983
26. TEssIToit N, LUND BJ, BoNucci E, LUND B, SORENSEN OH,MASCHJO 0: Vitamin D metabolites in early renal failure: Role of1 ,25(OH)2D. Minerva Nephrol 28:293—297, 1981
27. SLATOPOLSKY E, GRAY R, ADAMS ND, LEWIS J, HRUSKA K,MARTIN K, KLAHR S, DELUCA H, LEMANN J: Low serum levels ofI ,25-(OH)2D3 are not responsible for the development of secondaryhyperparathyroidism in early renal failure, (abstract) Kidney mt14:733A, 1978
28. PORTALE AA, BOOTH BE, HALLORAN BP, MORRIS RC JR: Effect ofdietary phosphorus on circulating concentrations of 1 ,25-dihydroxy-vitamin D and immunoreactive parathyroid hormone in childrenwith moderate renal insufficiency. J C/in Invest 73:1580—1589, 1984
29. KILAV R, NAVEH-MANY T, SILVER J: Phosphorus regulates para-thyroid hormone gene expression. (abstract) J Bone Miner Res 8(Suppi l):S200, 1993
30. LAFLAMME OH, JOWSEY J: Bone and soft tissue changes with oralphosphate supplements. J C/in In vest 5 1:2834—2839, 1972
31. FRASER DR: The regulation of vitamin D metabolism. Physiol Rev60:561—613, 1980
32. FELSENFELD AJ, LLACH F: Parathyroid gland function in chronicrenal failure. Kidney Int 43:771—789, 1993
33. UDEN P, HALLORAN B, DALY R, DUH Q, CLARK 0: Set-point forparathyroid hormone release increases with postmaturational agingin the rat. Endocrinology 131:2251—2256, 1992
34. KORKOR AB: Reduced binding of [H3]l,25-dihydroxyvitamjn D3 inthe parathyroid glands of patients with renal failure. N Engi I Med316:1573—1577, 1987
35. MERKEJ, HUGEL U, ZLOTKOWSKI A, SZABO A, BOMMER J, MALLG, RITZ F: Diminished parathyroid l,25-(OH)2D3 receptor inexperimental uremia. Kidney mt 32:350—353, 1987.
36. Hsu CH, PATEL SR, VANHOLDER R: Mechanism of decreasedintestinal calcitriol receptor concentration in renal failure. Am JPhysiol 264:F662—F669, 1993
37. YAMAMOTO M, IGARASHI T, MURAMATSU M, FUKAGAWA M,MOTOKURA T, OGATA E: Hypocalcemia increases and hypercalce-mia decreases the steady state level of parathyroid hormonemessenger ribonucleic acid in the rat. J C/in Invest 83:1053—1056,1989
38. RUSSELL J, SHERWOOD LM, HURWITZ S: Interaction betweencalcium and I ,25-dihydroxyvitamin D3 in the regulation of prepro-
parathyroid hormone and vitamin D receptor messenger ribonu-cleic acid in avian parathyroids. Endocrinology 132:2639—2644,1993
39. LOPEZ-HILKER S, GALCERAN T, CHAN YL, RAPP N, MARTIN KJ,SLATOPOLSKY E: Hypocalcemia may not be essential for thedevelopment of secondary hyperparathyroidism in chronic renalfailure. J C/in Invest 78: 1097—1102, 1986
40. FUKUDA N, TANAKA H, TOMINAGA Y, FUKAGAWA M,KUROKAWA K, SEINO Y: More severe form of parathyroid hyper-plasia is associated with decreased calcitriol receptor density inchronic uremic patients. (abstract) JAm Soc Nephro/ 3:695, 1992
41. FUKAGAWA M, KANAME S, IGARASHI T, OGATA E, KUROKAWA K:Regulation of parathyroid hormone synthesis in chronic renalfailure in rats. Kidney mt 39:874—881, 1991
42. FELSENFELD AJ, MACI-IADO L, BOVER J, TRINIDAD P, RODRIGUEZM: Effect of aluminium on the development of hyperparathyroidismand bone disease in the azotaemic rat. Nephrol Dial Transplant8:325—334, 1993
43. GALCERAN T, MARTIN KJ, MORRISEY JJ, SLATOPOLSKY F: Role of1 ,25-(OH)2 D in the skeletal resistance to parathyroid hormone.Kidney Int 32:801—807, 1987
44. BOVER J, TRINIDAD P, FELSENFELD AJ, RODRIGUEZ M, LLACH F:The effect of azotemia and the magnitude of hyperparathyroidismon the calcemic response to parathyroid hormone. (abstract) J AmSoc Nephro/ 3:692, 1992
45. QUARLES LD, LOBAUGH B, MURPHY G: Intact parathyroid hor-mone overestimates the presence and severity of parathyroid-mediated osseous abnormalities in uremia. J C/in Endocrino! Metab75:145—150, 1992
46. SHERRARD Di, HERCZ G, PEI Y, MALONEY NA, GREENWOOD C,MANUEL A, SAIPHOO C, FENTON SS, SEGRE GV: The spectrum ofbone disease in end-stage renal failure—An evolving disorder.Kidney mt 43:436—442, 1993
47. DEFRONZO RA, ALVESTRAND A, SMITH D, HENDLER R: Insulinresistance in uremia. J C/in Invest 67:563—568, 1981
48. BLuM WF, RANKE MB, KIETZMANN K, TONSHOFF B, MEHLS 0:Growth hormone resistance and inhibition of somatomedin activityby excess of insulin-like growth factor binding protein in uraemia.PediatrNephro/ 5:539—544, 1991
49. ELDEMAK I, FELDT—RASMUSSEN B, STRANDGAARD S, KANSTRUPIL, NIELSEN SL: Insulin resistance is present in moderate uraemiaand correlated to the maximal aerobic work capacity. (abstract) JAm Soc Nephrol 3:281, 1992
Copyright © 2022 FDOKUMEN