Factors Controlling Peat Compaction in Alluvial Floodplains: A Case Study in the Cold-Temperate...
12
Journal of Sedimentary Research, 2010, v. 80, 155–166 Research Article DOI: 10.2110/jsr.2010.015 FACTORS CONTROLLING PEAT COMPACTION IN ALLUVIAL FLOODPLAINS: A CASE STUDY IN THE COLD-TEMPERATE CUMBERLAND MARSHES, CANADA SANNEKE VAN ASSELEN, 1 ESTHER STOUTHAMER, 1 AND NORMAN D. SMITH 2 1 Department of Physical Geography, Utrecht University, P.O. Box 80115, 3508 TC Utrecht, The Netherlands 2 Department of Geosciences, University of Nebraska, Lincoln, Nebraska 68588-0340, U.S.A. e-mail: [email protected] ABSTRACT: Subsidence due to peat compaction may have important implications in alluvial floodplains, because it leads to wetland loss, land inundation, and damage to buildings and infrastructure. Furthermore, it potentially influences spatial and temporal river sedimentation patterns, and hence the evolution of alluvial floodplains. As the vast majority of peatlands occur in cold temperate regions, alluvial plains situated in such areas are most susceptible to these implications. To determine which locations within alluvial floodplains are most vulnerable to high amounts of compaction-induced subsidence, it is necessary to quantify compaction and to identify which factors influence the amount and rate of peat compaction. For this, we carried out field work in the Cumberland Marshes (east-central Saskatchewan, Canada) guided by the following two questions: (1) how much peat compaction has occurred over the past decades to centuries, and (2) which factors control the amount and rate of peat compaction at the same timescale. To address these questions, we used methods involving construction of stratigraphic cross sections, organic-matter content and bulk-density measurements, and radiocarbon dating. A new sampling device was devised to sample uncompacted peat in the field. Results show that peat layers have compacted up to 43% within a few centuries, with compaction rates of up to 6.08 mm/yr. The dominant factors influencing peat compaction are: (1) organic- matter content, (2) stress imposed on a peat layer, and, to a lesser extent, (3) plant species composition. In an alluvial setting, crevasse splays and natural levees are sites that are most susceptible to high amounts of peat compaction at short timescales (10 0 –10 2 years). Sheet-like splay deposits initially compact underlying peat uniformly, whereas differential compaction commonly occurs beneath natural levees due to lateral variations in sediment thickness. Subsidence due to peat compaction creates additional accommodation space and hence locally enhances floodplain sedimentation rates. INTRODUCTION Many modern alluvial floodplains contain thick peat layers, in particular those located in (cold) temperate climatic settings above 45u N, where most peatlands are found (Charman 2002). Because peat is the most compressible of all natural soils (Allen 1999), compaction of peat layers potentially leads to substantial amounts of subsidence. This may have important consequences in alluvial settings. For example, in populated areas, subsidence due to compaction may cause damage to buildings and infrastructure. In coastal areas, it may accelerate relative sea-level rise, resulting in wetland loss and land inundation (e.g., Long et al. 2006; To ¨ rnqvist et al. 2008). Furthermore, peat compaction creates accommodation space for fluvial deposition, and in this way is an important factor controlling spatial and temporal fluvial deposition patterns in deltas and floodplains (e.g., Allen 1999; Michaelsen et al. 2000; Rajchl and Ulic ˇny 2005; Day and Giosan 2008; Van Asselen et al. 2009). To assess the impact of peat compaction, it is necessary to quantify the amount and rate of peat compaction in Holocene alluvial successions. So far, this has mainly been done using empirical or geotechnical models (for an overview see Van Asselen et al. 2009). Results of such modeling studies need to be verified with field data. However, only a few field studies have attempted to quantify peat compaction in Holocene strata. Basically two methods have been used in these studies: (1) the amount of compaction is calculated from estimates of the initial dry bulk density, derived from relations between the dry bulk density of uncompacted peat samples and physical characteristics such as organic matter content (Bird et al. 2004), and (2) the amount of compaction is estimated using radiocarbon-dated basal peat samples to reconstruct initial elevations of peat formation of currently subsided peat samples (Bloom 1964; Haslett et al. 1998; To ¨ rnqvist et al. 2008). Both methods have been used to quantify compaction of peat layers formed in tidal marshes buried by marine deposits during transgression, on millennial timescales. To ¨ rnqvist et al. (2008) applied the second method to calculate peat compaction in the Mississippi delta and found a significant relationship between overburden thickness and compaction rate. In this study, both methods are used to quantify peat compaction in the Cumberland Marshes (CM), a cold temperate wetland in the interior of Canada, on short temporal (10 1 –10 2 yr) and small spatial scales (10 0 – 10 1 m 2 ). The study site was recently (, 135 years ago) invaded by an avulsion of the Saskatchewan River (Smith et al. 1998), which led to alluvial deposition over a peat layer that started to form up to approximately 3000 years ago (Morozova and Smith 2003). This setting allowed us to (1) quantify peat compaction occurring over decades to centuries and (2) identify and evaluate the factors controlling the amount and rate of peat compaction on the same timescales. Regarding the second objective, (1) variations in stress imposed by deposits overlying the Copyright E 2010, SEPM (Society for Sedimentary Geology) 1527-1404/10/080-155/$03.00
-
Upload
independent -
Category
Documents
-
view
5 -
download
0
Transcript of Factors Controlling Peat Compaction in Alluvial Floodplains: A Case Study in the Cold-Temperate...
Journal of Sedimentary Research, 2010, v. 80, 155–166
Research Article
DOI: 10.2110/jsr.2010.015
FACTORS CONTROLLING PEAT COMPACTION IN ALLUVIAL FLOODPLAINS: A CASE STUDY IN THECOLD-TEMPERATE CUMBERLAND MARSHES, CANADA
SANNEKE VAN ASSELEN,1 ESTHER STOUTHAMER,1 AND NORMAN D. SMITH2
1Department of Physical Geography, Utrecht University, P.O. Box 80115, 3508 TC Utrecht, The Netherlands2Department of Geosciences, University of Nebraska, Lincoln, Nebraska 68588-0340, U.S.A.
e-mail: [email protected]
ABSTRACT: Subsidence due to peat compaction may have important implications in alluvial floodplains, because it leads towetland loss, land inundation, and damage to buildings and infrastructure. Furthermore, it potentially influences spatial andtemporal river sedimentation patterns, and hence the evolution of alluvial floodplains. As the vast majority of peatlands occur incold temperate regions, alluvial plains situated in such areas are most susceptible to these implications. To determine whichlocations within alluvial floodplains are most vulnerable to high amounts of compaction-induced subsidence, it is necessary toquantify compaction and to identify which factors influence the amount and rate of peat compaction. For this, we carried outfield work in the Cumberland Marshes (east-central Saskatchewan, Canada) guided by the following two questions: (1) howmuch peat compaction has occurred over the past decades to centuries, and (2) which factors control the amount and rate ofpeat compaction at the same timescale. To address these questions, we used methods involving construction of stratigraphiccross sections, organic-matter content and bulk-density measurements, and radiocarbon dating. A new sampling device wasdevised to sample uncompacted peat in the field. Results show that peat layers have compacted up to 43% within a fewcenturies, with compaction rates of up to 6.08 mm/yr. The dominant factors influencing peat compaction are: (1) organic-matter content, (2) stress imposed on a peat layer, and, to a lesser extent, (3) plant species composition. In an alluvial setting,crevasse splays and natural levees are sites that are most susceptible to high amounts of peat compaction at short timescales(100–102 years). Sheet-like splay deposits initially compact underlying peat uniformly, whereas differential compactioncommonly occurs beneath natural levees due to lateral variations in sediment thickness. Subsidence due to peat compactioncreates additional accommodation space and hence locally enhances floodplain sedimentation rates.
INTRODUCTION
Many modern alluvial floodplains contain thick peat layers, inparticular those located in (cold) temperate climatic settings above 45uN, where most peatlands are found (Charman 2002). Because peat is themost compressible of all natural soils (Allen 1999), compaction of peatlayers potentially leads to substantial amounts of subsidence. This mayhave important consequences in alluvial settings. For example, inpopulated areas, subsidence due to compaction may cause damage tobuildings and infrastructure. In coastal areas, it may accelerate relativesea-level rise, resulting in wetland loss and land inundation (e.g., Long etal. 2006; Tornqvist et al. 2008). Furthermore, peat compaction createsaccommodation space for fluvial deposition, and in this way is animportant factor controlling spatial and temporal fluvial depositionpatterns in deltas and floodplains (e.g., Allen 1999; Michaelsen et al.2000; Rajchl and Ulicny 2005; Day and Giosan 2008; Van Asselen et al.2009).
To assess the impact of peat compaction, it is necessary to quantify theamount and rate of peat compaction in Holocene alluvial successions. Sofar, this has mainly been done using empirical or geotechnical models (foran overview see Van Asselen et al. 2009). Results of such modeling studiesneed to be verified with field data. However, only a few field studies haveattempted to quantify peat compaction in Holocene strata. Basically twomethods have been used in these studies: (1) the amount of compaction is
calculated from estimates of the initial dry bulk density, derived fromrelations between the dry bulk density of uncompacted peat samples andphysical characteristics such as organic matter content (Bird et al. 2004),
and (2) the amount of compaction is estimated using radiocarbon-datedbasal peat samples to reconstruct initial elevations of peat formation of
currently subsided peat samples (Bloom 1964; Haslett et al. 1998;Tornqvist et al. 2008). Both methods have been used to quantifycompaction of peat layers formed in tidal marshes buried by marine
deposits during transgression, on millennial timescales. Tornqvist et al.(2008) applied the second method to calculate peat compaction in the
Mississippi delta and found a significant relationship between overburdenthickness and compaction rate.
In this study, both methods are used to quantify peat compaction in theCumberland Marshes (CM), a cold temperate wetland in the interior ofCanada, on short temporal (101–102 yr) and small spatial scales (100–
101 m2). The study site was recently (, 135 years ago) invaded by anavulsion of the Saskatchewan River (Smith et al. 1998), which led to
alluvial deposition over a peat layer that started to form up toapproximately 3000 years ago (Morozova and Smith 2003). This settingallowed us to (1) quantify peat compaction occurring over decades to
centuries and (2) identify and evaluate the factors controlling the amountand rate of peat compaction on the same timescales. Regarding thesecond objective, (1) variations in stress imposed by deposits overlying the
Copyright E 2010, SEPM (Society for Sedimentary Geology) 1527-1404/10/080-155/$03.00

peat layer and (2) peat type (organic matter content and plant speciescomposition) were recorded at high spatial resolution.
GEOGRAPHICAL SETTING
The Cumberland Marshes, also referred to as the Saskatchewan RiverDelta (Dirschl 1972), are located on the border of the provinces ofSaskatchewan and Manitoba, Canada (Fig. 1). The Marshes are situatedin the western margin of the lacustrine plain of the former glacial LakeAgassiz (Schreiner 1983; Morozova and Smith 1999), downstream of asharp gradient reduction of the Saskatchewan River, whose drainagebasin extends from the continental divide in the Canadian RockyMountains to Lake Winnipeg (Fig. 1). Alluvial deposition began around8700–8200 cal yr BP, following withdrawal of glacial Lake Agassiz(Morozova and Smith 1999). In the subsequent millennia, alluvialaggradation resulted in numerous avulsions of the Saskatchewan River(Morozova and Smith 1999, 2000), which resulted in episodic redistribu-tion of alluvial sedimentation. The most recent avulsion occurred in the1870s (Smith et al. 1989; Smith et al. 1998), which initiated the formationof a progradational alluvial wedge in the northwestern part of theCumberland Marshes. This avulsion affected about 500 km2 of formerpeatland, an area which is now characterized by anastomosing channels,splay complexes, wetlands, and shallow lakes. The alluvial wedge overliesa layer of peat typically a few decimeters to over 1 m in thickness. Mostpeat-forming vegetation in the area receives nutrients from mineral soils,transported by groundwater and rivers, which results in formation ofpredominantly fen peat. In some isolated localities, however, where plantsreceive nutrients only from atmospheric deposition, nutrient-poorconditions prevail, and consequently bogs are present (Dirschl 1972).Hence, in this study, fens and bogs are distinguished based on the mainwater source at the time of formation, which influences the nutrient statusand thereby the main peat-forming vegetation (Charman 2002). Theorganic content of peat depends on factors that control the amount ofinorganic sediments received by floodbasins, such as distance to an activechannel, presence of alluvial ridges that act as barriers to floodbasindeposition, and channel abandonment (Davies-Vollum and Smith 2008).
The substrate underlying the peat layer consists of predominantly fine-grained floodbasin deposits of previous main channels of the Saskatch-ewan River and smaller tributaries (Smith et al. 1998). In the area of thecurrent avulsion belt, these sediments are typically found about 2 to 4 mbelow the surface mainly as stiff, well-compacted, gray silt and silty clay(mud). The high stiffness and the presence of concretions and oxidationstains indicate soil formation during which the sediment has beencompacted. Furthermore, silt and clay are much less compressible thanpeat (Mesri and Ajlouni 2007; Locher and Bakker 1990). For thesereasons, the substrate is assumed to be essentially incompressible atcentennial timescales.
The Cumberland Marshes region has a daily mean temperature of 18uCfor July and 223uC for January, and the mean duration of the frost-freeperiod is about 102 days. Mean annual precipitation is 433 mm, of whichabout 270 mm falls during the growing season (Dirschl and Coupland1972).
METHODS
Site Selection
Four study sites were selected to represent different environmentalsettings (Fig. 1). In the North Angling Channel (NAC) and Muskeg Lake
Splay (MLS) sites, the peat layer is overlain by crevasse-splay deposits.The Mossy River (MR) and James Bond River (JBR) sites were selectedbecause the peat is overlain by variably thick natural-levee deposits and,at greater distance from the channel, by either thin clayey floodbasindeposits (JBR) or no overburden at all (MR).
Cross Sections
Stratigraphic cross sections were constructed to gain insight into thepaleogeographic development of a specific site. Cross sections wereoriented perpendicular to the main flow direction, running from the trunkchannel towards the floodbasin. In total, six cross sections distributedover the four study sites were constructed, based on logged borehole dataretrieved with Edelman and (mainly) gouge augers. Coring depth wasdetermined by the depth of the mud substrate beneath the peat, typically2–4 m below the surface. Spacing between coring sites was determinedbased on surface relief and was usually in the range of 2–10 m. Each corewas logged at 10-cm intervals for sediment texture, organic-mattercontent, color, plant remains, oxidation/reduction characteristics, calciumcarbonate content, and other relevant properties such as the occurrence ofshell fragments, concretions, and sediment-layer transitions.
Quantifying Peat Compaction
The amount of peat compaction was determined by two differentmethods: (1) measuring changes in dry bulk density (rdry) with depth, and(2) where possible, by reconstructing initial elevations of peat formationand isochrones using AMS radiocarbon dating.
During compaction, pore volume decreases and rdry increases. Hence,changes in rdry of buried peat, compared to the rdry of surface peat, whichis generally in an uncompacted state, can be used to estimate the relativeamount of compaction. A prerequisite for this method is that thecompacted and uncompacted samples should be of the same peat type,i.e., they should have a similar plant species composition and organic-matter content. Accordingly, changes in rdry were measured at differentcore sites within the same peat layer. Sampling locations were determinedbased on variations of thickness and type of alluvial deposits overlyingthe peat layer. Peat samples were taken at 5-cm intervals directly from a3-cm-wide gouge auger using a 1 cm 3 1 cm 3 5 cm sampler. The corewas first cut lengthways in half using a thin stretched wire so that theinner part of the core could be sampled. Each 5 cm3 peat sample wasdried at 105uC and weighed on an electronic scale (accuracy of 0.01 g) todetermine dry bulk density (rdry 5 dried weight / 5 cm3). The sampleswere subsequently heated at 550uC for 4 hours to determine loss onignition (LOI 5 (dried weight – ashed weight / dried weight) * 100%).For determining dry bulk density, the greatest error is introduced by theuse of the 5 cm3 field sampler. It is estimated that the error in volume maybe up to 10% (5 6 0.5 cm3). According to standard rules of errorpropagation, the fractional uncertainty in the bulk density calculations is10%.
Surface peat generally has a very loose structure and heterogeneousplant species composition that may consist partly of a living root mat,which makes it difficult to extract an undisturbed peat sample with fixedvolume. Using the gouge auger in combination with the 5 cm3 samplerintroduces significant disturbance and compaction of surficial peatsamples. Therefore, we devised a new coring device that takes sufficientlylarge samples (708 cm3) to account for the high variability and tominimize disturbance of the fragile structure of peat during sampling(e.g., Lefebvre et al. 1984; Buttler et al. 1998; Givelet et al. 2004). Details
RFIG. 1.—Location of the Cumberland Marshes and the four study sites. 1 5 North Angling Channel (NAC) cross section, 2 5 James Bond River (JBR) cross
section, 3 5 Mossy River (MR) cross section, 4 5 Muskeg Lake Splay (MLS). CAC 5 Centre Angling Channel, CC 5 Cadotte Channel, H 5 Horseshoe, starslabelled with coring numbers indicate sampling locations in the MLS (after Smith and Perez-Arlucea 1994; Morozova and Smith 2000).
156 S. VAN ASSELEN ET AL. J S R

FACTORS CONTROLLING PEAT COMPACTION IN ALLUVIAL SETTINGS (CUMBERLAND MARSHES) 157J S R
concerning the construction and usage of this sampler are described inVan Asselen and Roosendaal (2009). The uncompacted peat sample wasdried at 105uC to determine dry bulk density. To determine LOI, asubsample over the entire length of the large sample was removed andseparately dried at 105uC. The dried subsample was further subdivided tomeet the capacity of the crucibles, in which they were burned for 4 hoursat 550uC.
The rdry and LOI data for uncompacted peat samples were used todevelop an equation for calculating uncompacted dry bulk density(rdry,uncomp) of the compacted peat samples, based on the LOI. Based on aDutch classification system of peat soils, samples with a LOI . 20% areregarded as peat (De Bakker and Schelling 1966). The data were bestdescribed using a nonlinear regression:
rdry,uncomp~aexp bLOIð Þ, ð1Þ
in which a and b are parameters that may differ for different peat types(see Section 4). The rdry,uncomp was subsequently used to calculate thedecompacted thickness (hdecomp) of each 5 cm3 sample ignoring lateralstrain (hdecomp 5 (rdry,comp/rdry,uncomp)*5). Percentage of compaction isexpressed as the ratio between the volume reduction a 5 cm3 sample hasexperienced (hred 5 1*1*(hdecomp – 5) – 1*1*5) and the calculateddecompacted thickness of a 5 cm3 peat sample:
compaction~hred
hdecomp
|100% ð2Þ
The decompacted thickness of a peat layer could be calculated bysumming the decompacted thicknesses calculated for each 5 cm. Like the5 cm3 samples, compaction percentage of a peat layer was calculatedusing Equation 2.
Constructing isochrones and initial elevations of peat formation forestimating the amount of peat compaction requires detailed vertical timecontrol. For this, peat samples of 1–2 cm thickness were extracted fromthe gouge auger at varying depths of up to 20 cm. The samples weretreated with a 5% KOH solution, after which they were washed and wet-sieved over a 150 mm mesh. Next, macrofossils of terrestrial vegetationwere selected from the residue using a microscope and submitted forAMS dating. The radiocarbon dates were calibrated using Oxcal 4.1(Bronk Ramsey 2001) with the INTCAL04 calibration curve (Reimer etal. 2004) and the Sequence deposition model, which assumes thatdeposition occurs in a specific order, i.e., age increases with depth(Bronk Ramsey 2008).
Dated peat that directly overlies the compacted mud substrate isassumed not to have experienced any subsidence due to compaction. Theelevation of such basal peat samples is used to reconstruct the level ofinitial peat formation at a certain time. The elevation of peat samples ofthe same age that experienced subsidence due to compaction is used toestimate the amount of compaction (fig. 13 in Van Asselen et al. 2009). Aprecondition of this method is that the incompressible substrateunderlying the peat layer has significant relief, which allows basal peatsamples to be taken at different depths.
Compaction Rates
Compaction rates were calculated by dividing the calculated volumereduction by the time of initiation of inorganic deposition overlying thepeat layer as determined by AMS radiocarbon dating of the top of thepeat layer. Hence, it is assumed that the peat layer did not significantlycompact until it was loaded by fluvial deposits. In this way, maximumcompaction rates are calculated, inasmuch as some of the totalcompaction might have occurred before the start of sediment loadingdue to microbiological processes (e.g., decay of organic matter), chemical
processes (e.g., oxidation and shrinkage above the groundwater table),and self-weight (Allen 1999; Van Asselen et al. 2009). Compaction due toself-weight is of minor importance in this study because the high-organicpeat has a low mass density and consists largely of water (approximately90% for uncompacted peat). Furthermore, in our study sites the watertable is at or near the surface during most of the frost-free season, andhence, compaction due to biological and chemical processes is likely to bemuch less then compaction caused by loading. This was supported byfield observations; extremely wet conditions prevailed in the summerseason, and investigated peat layers were generally poorly decomposed.Also, peat layers without overburden were visually less compacted.Analyses of such peat layers showed that the dry bulk density is in thesame range as the dry bulk density of uncompacted surface peat (seeResults section below, Amount and Rate of Peat Compaction). Thecalculated compaction rates are average values; higher rates might forexample occur shortly after loading.
Similarly, peat accumulation rates could be estimated by dividing thethickness of the peat layer by the duration of peat accumulation (5 datedbase of peat layer minus dated top of peat layer). Accumulation ratebased on the present thickness includes both peat formation andcompaction processes, whereas the rate based on the calculateddecompacted thickness is corrected for compaction.
The amount and rate of peat compaction in cold temperate settingsmay be affected by frost, which is therefore a possible source of error inour calculations. Frost may lead to small seasonal changes in surfaceelevation due to expansion (freezing) and collapse (ice melt) of pores(Roulet 1991; Petrone et al. 2008). Because this process is largelyreversible, it does not significantly alter the total amount of compactionon longer time periods (decades or more). The timing of compactiondepends on the depth of the frost line. If the entire peat layer is frozen,compaction is impeded during the frost season. In this scenario,compaction rates, as calculated in this study, may be underestimated. Ifonly the top peat layer, or the inorganic sediment layer overlying the peat,is frozen, compaction may continue during the frost season. Because theseasonal variations in the depth of the frost line are unknown for ourstudy sites, we were not able to quantify this process, and hence, onlyrecognize this process to be a possible source of error in calculatingcompaction rates.
Calculation of Effective Stress
To determine the pressure exerted by the inorganic sediment overlyingthe peat layer, the effective stress (s9) imposed by the overburden iscalculated from Terzaghi’s formula s9 5 s – u (Terzaghi 1943), in whichs is the total stress [Pa] and u is the pore water pressure [Pa]. This wasdone for all cores in which the peat layer was sampled for rdry and LOI.The total stress is calculated by
s~hrsg, ð3Þ
in which h is the thickness [cm], rs is the saturated density of a certaintexture class [g/cm3], and g is the gravity constant. Similarly, u iscalculated by
u~hrwg, ð4Þ
in which h is the thickness of the water column and rw is the density ofwater (5 1 g/cm3). The thickness and texture of an inorganic sedimentlayer overlying the peat layer is determined in the field during logging ofthe cores. The saturated density of a specific texture class is calculatedfrom the mass and dry bulk densities of the different texture classes. Todetermine the mass density of a texture class, the percentage of clay, silt,and sand were estimated from the American soil texture triangle (http://www.pedosphere.com/resources/bulkdensity/triangle_us.cfm; Table 1).
158 S. VAN ASSELEN ET AL. J S R

RESULTS
Interpretations of Cross Sections
North Angling Channel
The NAC cross section (Fig. 2) runs from the distal edge of thenorthern levee of the NAC northward into the Cadotte crevasse-splay
complex (Fig. 1; Perez-Arlucea and Smith 1999). The NAC was activebefore the 1870s avulsion, and the Cadotte splay was initiated shortlyafter the avulsion. In the southern portion of the cross section, thesubstrate underlying the peat layer consists of old NAC levee deposits,which are relatively coarse grained, mainly silt and fine sand. In thenorthern portion, the substrate consists of finer floodbasin deposits,
TABLE 1.— Values for mass density, pore volume, dry bulk density, and degree of saturation used to calculate the saturated volumic mass.
Mass densitya
[g/cm3]Dry bulk densityb
[g/cm3]Pore volumec
[-]Degree of saturation
[%]Saturated volumic massd
[g/cm3]
clay 2.578 1.15 0.554 98 1.693silty clay 2.590 1.22 0.529 98 1.738sandy clay 2.606 1.32 0.493 98 1.804silty clay loam 2.601 1.26 0.516 98 1.765sandy clay loam 2.601 1.4 0.462 98 1.853clay loam 2.585 1.3 0.497 98 1.787silt loam 2.597 1.35 0.480 98 1.821silt 2.610 1.47 0.437 99 1.903loam 2.617 1.42 0.457 99 1.873sandy loam 2.636 1.55 0.412 99 1.958loamy sand 2.633 1.65 0.373 100 2.023sand 2.629 1.7 0.353 100 2.053
a Mass density 5 1/((forg/1470) + (fclass?fclay/2700) + (fclass?fsilt + sand/2650)), with f 5 fraction.b Saxton et al. (1986); http://www.pedosphere.com/resources/bulkdensity/triangle_us.cfm?269,216.c Pore volume 5 (1-dry bulk density/mass density).d Saturated volumic mass 5 (dry bulk density + fsat?pore volume).
FIG. 2.— North Angling Channel cross section. For location see Figure 1. Sampled cores are indicated with a thick vertical black line (94, 101, 102, 104, and 108).
FACTORS CONTROLLING PEAT COMPACTION IN ALLUVIAL SETTINGS (CUMBERLAND MARSHES) 159J S R

mainly stiff silty clay. The peat layer is 10 to 60 cm thick and is coveredby an alluvial sequence 1 to 2 m thick consisting of crevasse-splay sheetdeposits, crevasse-channel deposits, and overbank deposits (of thecrevasse channels; overbank deposits of the NAC are of minorimportance). The peat layer consists mainly of brownish fen peat(Fig. 3A) containing predominantly woody (mainly willow) and herba-ceous plant (mainly horsetail, sedge, and reed) remains. At some locationsat the base of the peat layer, detrital peat (Fig. 3C) is found containingaquatic plant remains. This indicates shallow lakes were present,especially during the initial phase of peat formation, which startedaround 2000 cal yr BP at this site (Fig. 2; UtC-15420).
Perez-Arlucea and Smith (1999) interpreted the clayey layer overlyingthe peat in this area as lacustrine and marsh facies deposited shortlyfollowing the 1870s avulsion, which induced flooding. Some of our datesindicate, however, that peat formation ended approximately 400 to 500cal yr BP (Fig. 2; UtC-15416, UtC-15418). Especially the uppermost datein core NAC104 (UtC-15421; Fig. 2) was unexpectedly old (820 cal yrBP). Based on historical data and previous work (Smith et al. 1998; Perez-Arlucea and Smith 1999), we assume that most alluvial deposition, andhence loading of the peat layer, began approximately 135 years ago.Slightly older calibrated ages of the top of the peat layer are likely due tofluvial erosion of the top of the peat layer following the 1870s avulsion.Also, calibration of samples younger than approximately 400 radiocar-bon years often results in a wide range of calibrated age of up to about300 cal years (Reimer et al. 2004), which makes it difficult to estimate thecalibrated age accurately.
The coarsening-upward trend observed in the overlying alluvialdeposits indicates continuous progradation of the Cadotte crevasse splayinto the former peatland. This phase was followed by channelization anddevelopment of small levees. The succession observed in our cross sectionreflects the attainment of stage II splay development of Smith et al. (1989;see also Perez-Arlucea and Smith 1999).
Mossy River
The Mossy River (MR) was an independent and active tributary channelprior to the 1870s avulsion. The MR cross section extends from the northlevee of the Mossy River to the northwest (Figs. 1, 4). The substrateunderlying the peat layer consists of older levee deposits of the MR in thesouth and stiff fine-grained floodbasin deposits farther northward in thecross section. Peat formation started in the northern part of the transect atapproximately 2150 cal yr BP (Fig. 4; UtC-15438) and progressivelyextended southward, thereby gradually covering the sloping levee of theMR. The peat layer varies in thickness from only 15 cm close to the MRchannel to about 2 m in the floodbasin, where peat is still actively forming.Here, the upper first meter consists of floating root and peat mats. Duringfloods, fine suspended sediment is trapped in these floating mats. Mainlyreddish-brown fen peat is found (Fig. 3B), containing predominantlymosses and herbaceous plant remains (sedge, horsetail, reed), andoccasionally woody remains. This peat is characterized by a dense networkof fine roots. In contrast, the thin peat layer found within the MR levee hasa loose structure, is more decomposed, and contains tree and sedgeremains. It is interpreted as a forest litter layer and indicates a period of lowfluvial activity of the Mossy River during which litter from plants and treesaccumulated on the levee surface.
The top of this peat layer yielded a radiocarbon age of 186 6 35 yr BP(UtC-15429). Calibration of this age, using Oxcal Version 4.1, results intwo ranges (at 68.2% probability): 291–265 cal yr BP (22%) and 217–146cal yr BP (46.2%). We assume that the youngest range is correct: renewedlevee formation started after the Mossy River was annexed by the 1870savulsion, which caused an increase in channel size, discharge, and input ofinorganic sediments.
James Bond River
The James Bond River (JBR) is a small distributary of the CentreAngling Channel (Fig. 1). The 1870s avulsion invaded the area south of
FIG. 3.— Photographs of the main peat types: A) brownish-fen peat, B) reddish-brown peat and C) detritus peat.
160 S. VAN ASSELEN ET AL. J S R

the NAC in the 1920s and 1930s (Perez-Arlucea and Smith 1999). Beforethat time, most flow was directed from the New Channel to the area northof the NAC, while the area south of the NAC consisted mostly of peatlandand shallow lakes. The JBR cross section runs from the JBR south levee ina southwestern direction (Figs. 1, 5). The substrate in this area consistsentirely of stiff, sometimes silty, clay, a floodbasin deposit probably of theAncestral South Angling Channel (Morozova and Smith 1999). In thisarea, peat formation started at approximately 2800 cal yr BP (Fig. 5; UtC-15443, UtC-15448). In general, detrital peat averaging 20 cm in thicknessoccurs at the base of the peat layer, indicating accumulation in a shallowlake. The detrital peat grades rapidly upwards into thicker peat consistingof herbaceous, moss, and wood remains, suggesting that the lake evolvedinto a fen. Throughout the peat layer of 90 to 140 cm thick, minerogenicinput varies considerably with depth, indicating periods of peatlandflooding. The peat layer is overlain by silty clay that contains shellfragments and plant remains. Two radiocarbon dates from the top of thepeat layer indicate that sediment deposition started around 300 cal yr BP,before the 1870s avulsion. This is most unlikely, inasmuch as aerialphotographs and historical maps (unpublished) suggest that this area wasinvaded no sooner than early twentieth century. Furthermore, thecalibrated range calculated for the uppermost date of core JB146 yielded500–270 and 169–154 cal yr BP at 68% probability and 517–0 cal yr BP at95% probability, so the 300 cal yr BP presented in Fig. 5 (UtC-15444) isuncertain. For these reasons, we assume that most loading due to alluvialdeposition has occurred during the last 80 years.
The coarsening-upward trend observed in the overlying sedimentprofile indicates increased fluvial activity of the JBR, which probablystarted as a crevasse of the Centre Angling Channel. Overbank depositsof the JBR range in thickness from 230 cm (maximum levee thickness) to90 cm (floodbasin, Fig. 5).
Amount and Rate of Peat Compaction
North Angling Channel
The brownish forest-sedge peat occurring at the NAC site has LOIvalues mostly around 85%, with lower values at the transitions to
overlying and underlying floodbasin deposits (Appendix 1, see Acknowl-edgments section for JSR’s Data Archive). Peat in core NAC94, whichlies closest to the NAC, has a relatively low LOI, which indicates a higherinput of inorganic sediment at this location. Davies-Vollum and Smith(2008) also found that peat formed close to active channels tend to havelow organic contents. In general, peat with a low LOI has a high rdry
(Table 2; Fig 6A).
Uncompacted peat samples were obtained from the nearby fenenclosed on three sides by a large bend of the NAC west of the studysite (locally called the ‘‘Horseshoe,’’ Fig. 1). Here, the young peat iscomposed mainly of sedge and woody remains, and thus is similar to thepeat found in the NAC cross section. Fitting values of LOI versus rdry forthe uncompacted peat samples yielded the following equation(R2 5 0.99; Fig. 6A):
rdry,uncomp~0:7703 exp{0:0202LOI ð5Þ
For most 5 cm3 samples, the calculated compaction percentage liesbetween 30 and 50% (Appendix 1). Because uncompacted detrital peatwas not found, Equation 5 was also used to calculate compaction ofdetrital peat. This did not introduce a large error in calculating the totalcompaction of the peat layer because the detrital peat material, occurringat the base of the peat layer, is only 0 to 10 cm thick. In two cases,however, the compaction calculated for a detrital peat sample is unusuallyhigh (Appendix 1: 50% at the base of NAC101 and 63% at the base ofNAC104). The initial rdry of the detrital peat is likely to be higher thanthe rdry of the forest peat, due to the finer and denser structure of detritalpeat. Using a higher initial rdry would lead to lower calculatedcompaction percentages.
The amount of compaction does not show a clear relationship withLOI. Only in cores NAC102 and NAC104 does compaction seem toincrease with increasing LOI (Fig. 6B). The calculated compaction foreach core varies between 34% and 39% (Table 3). Assuming anuncertainty of 10% in the determination of the rdry (Section 3), allcompaction values presented in this paper appeared to have an
FIG. 4.— Mossy River cross section. Forlegend see Figure 2.
FACTORS CONTROLLING PEAT COMPACTION IN ALLUVIAL SETTINGS (CUMBERLAND MARSHES) 161J S R

uncertainty of 6 6–7% except for the MR130 core, where exceptionally
low rdry were measured and compaction percentages have an uncertainty
of 6 10%. Our data suggest that the peat layer has been uniformly
compacted under the load of the crevasse-splay deposits.
For core NAC108, the amount of compaction was also estimated by
using the isochrone method. The elevation of radiocarbon date UtC-
15428 was used to reconstruct the level of peat formation 300 cal yr BP.
By comparing the elevations of this level to that of date UtC-15424,
compaction of 45% was calculated, which is reasonably similar to the
compaction values calculated from rdry measurements.
Mossy River
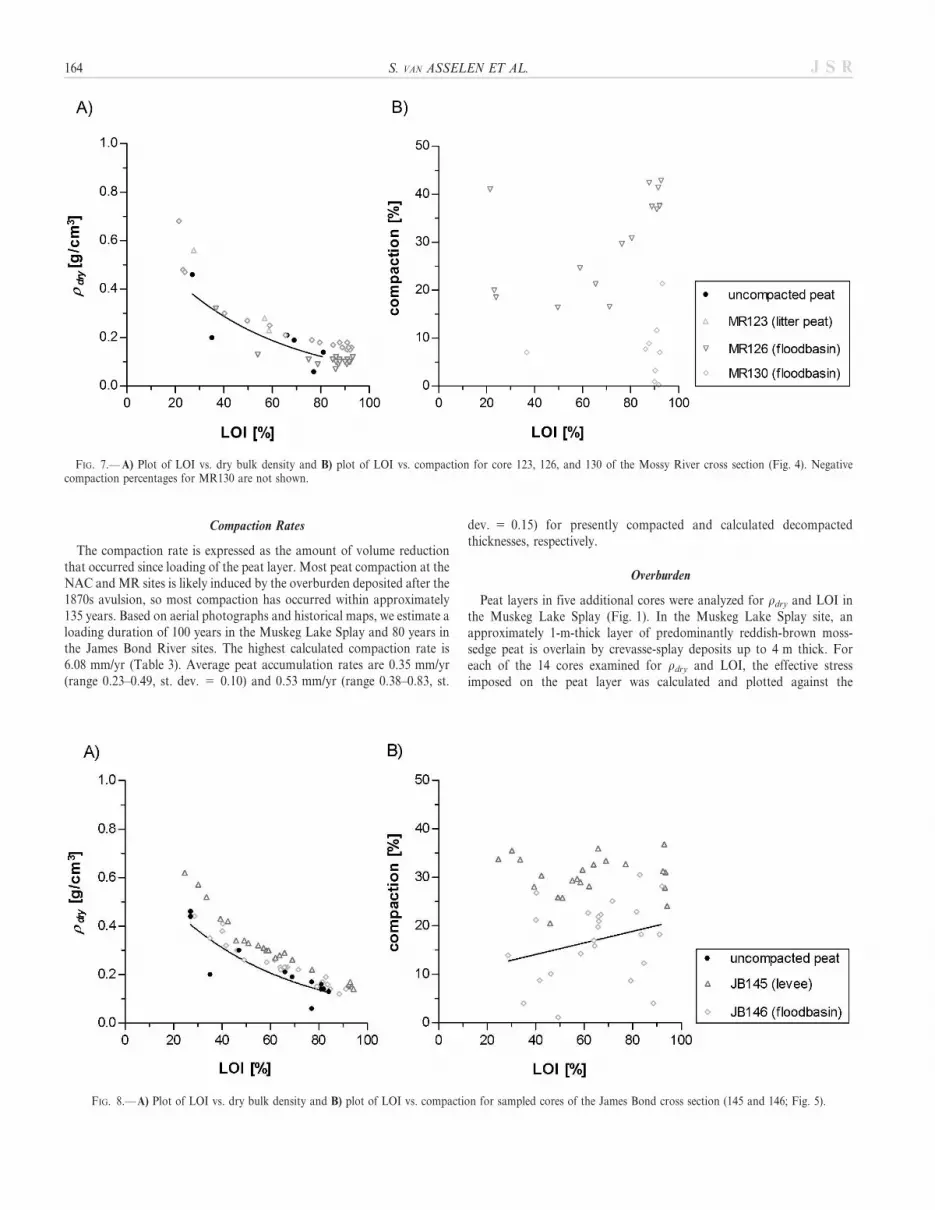
Three cores of the MR cross section were analyzed for rdry and LOI(Fig. 3; Appendix 2, see Acknowledgments section for JSR’s DataArchive). The forest-litter peat formed on the natural levee close to thechannel (MR123) has a lower organic-matter content than peat formedfarther into the floodbasin (MR126 and MR130), reflecting a higherinput of inorganic sediment close to the channel (see also Davies-Vollumand Smith 2008). In cores MR126 and MR130, a decrease in LOI isobserved at 21.5 m and 21.7 m, respectively, relative to the top of thelevee. This is likely caused by an episodic increase in river sediment due toflooding and/or to local trapping of fine suspended sediment byvegetation. In general, peat with a relatively high LOI has a relativelylow rdry (Fig. 7A; Table 2).
Uncompacted peat samples were obtained from the uppermost meternear core M130 and in the peatland farther northward. LOI and rdry
measurements of these samples were used to construct the followingequation to calculate rdry,uncomp for compacted peat (R2 5 0.58; Fig. 7A):
rdry,uncomp~0:6212 exp{0:0204LOI ð6Þ
Compaction of core MR123 was not calculated, because uncompactedforest-litter peat was not found. Calculated compaction was 30% for coreMR126 and 24% for core MR130 (Table 3). The value 24% suggestsexpansion of the peat layer, which could be caused by high saturation atthis site, inducing floating and expansion. Alternatively, the negativevalue may be caused by errors introduced during sampling (Section 3).Still, our data strongly suggest that little if any compaction occurred incore MR130 except for some compaction due to its own weight at thebase of the peat layer, where compaction calculated for each 5 cm3
sample slightly increases (Appendix 2). Except for samples with a verylow LOI (, 40%), compaction increases with increasing LOI (Fig. 7B).
The percentage of compaction was calculated in this cross section fromisochrone reconstructions. This indicates compaction of about 15% of thebase of the peat layer at core 130 (Fig. 4). Calculating compaction of the
FIG. 5.— James Bond River cross section. For legend see Figure 2.
TABLE 2.—Mean dry bulk densities for different LOI ranges of sampled cores derived from the North Angling Channel (NAC), Mossy River (MR), andJames Bond River (JBR) study sites (core numbers are given). Standard deviation / number of samples are indicated in italics in parentheses below
mean value.
LOI [%]
Mean dry bulk density [g/cm3]
NAC MR JBR
94 101 102 104 108 123 126 130 145 146
90–100 - - - - - - 0.16(0.01 / 5)
0.10(0.01 / 7)
0.15(0.01 / 5)
0.14(0.01 / 2)
80–90 - 0.21(0.02 / 8)
0.21(0.01 / 6)
0.24(0.02 / 7)
0.25(0.02 / 5)
- 0.17(0.01 / 3)
0.10(0.01 / 7)
- 0.16(0.03 /5)
70–80 0.24(0.03 / 2)
0.24(0.02 / 2)
0.26(0.05 / 4)
0.26(- / 1)
0.27(0.06 /2)
- 0.18(0.01 / 2)
0.11(- / 1)
0.22(- / 1)
0.19(0.05 /2)
60–70 0.31(0.04 / 2)
0.39(- / 1)
- 0.26(- / 1)
0.27(- / 1)
- 0.21(- / 1)
- 0.28(0.01 / 4)
0.23(0.01 /7)
50–60 0.40(- / 1)
- - 0.66(- / 1)
- 0.26(0.04 / 2)
0.25(- / 1)
0.13(- / 1)
0.31(0.01 / 5)
-
40–50 - - - - - - 0.28(0.02 / 2)
- 0.37(0.04 / 3)
0.33(0.06 /5)
30–40 0.74(- / 1)
- - 0.47(0.03 / 2)
- - - 0.32(- / 1)
0.51(0.07 / 3)
0.35(- / 1)
20–30 0.91(- / 1)
- - - 0.75(- / 1)
0.56(- / 1)
0.54(0.12 / 3)
- 0.62(- / 1)
0.44(- / 1)
162 S. VAN ASSELEN ET AL. J S R
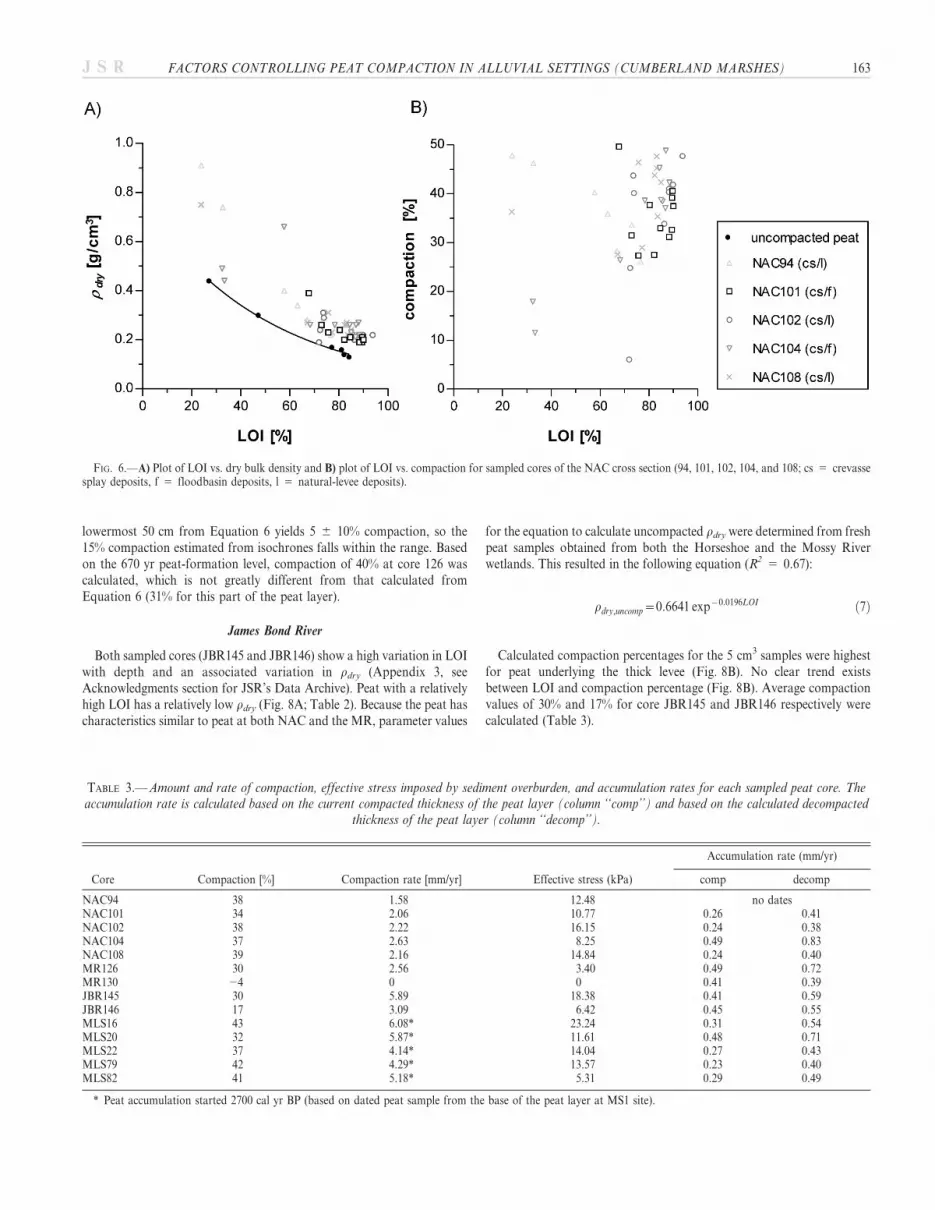
lowermost 50 cm from Equation 6 yields 5 6 10% compaction, so the15% compaction estimated from isochrones falls within the range. Basedon the 670 yr peat-formation level, compaction of 40% at core 126 wascalculated, which is not greatly different from that calculated fromEquation 6 (31% for this part of the peat layer).
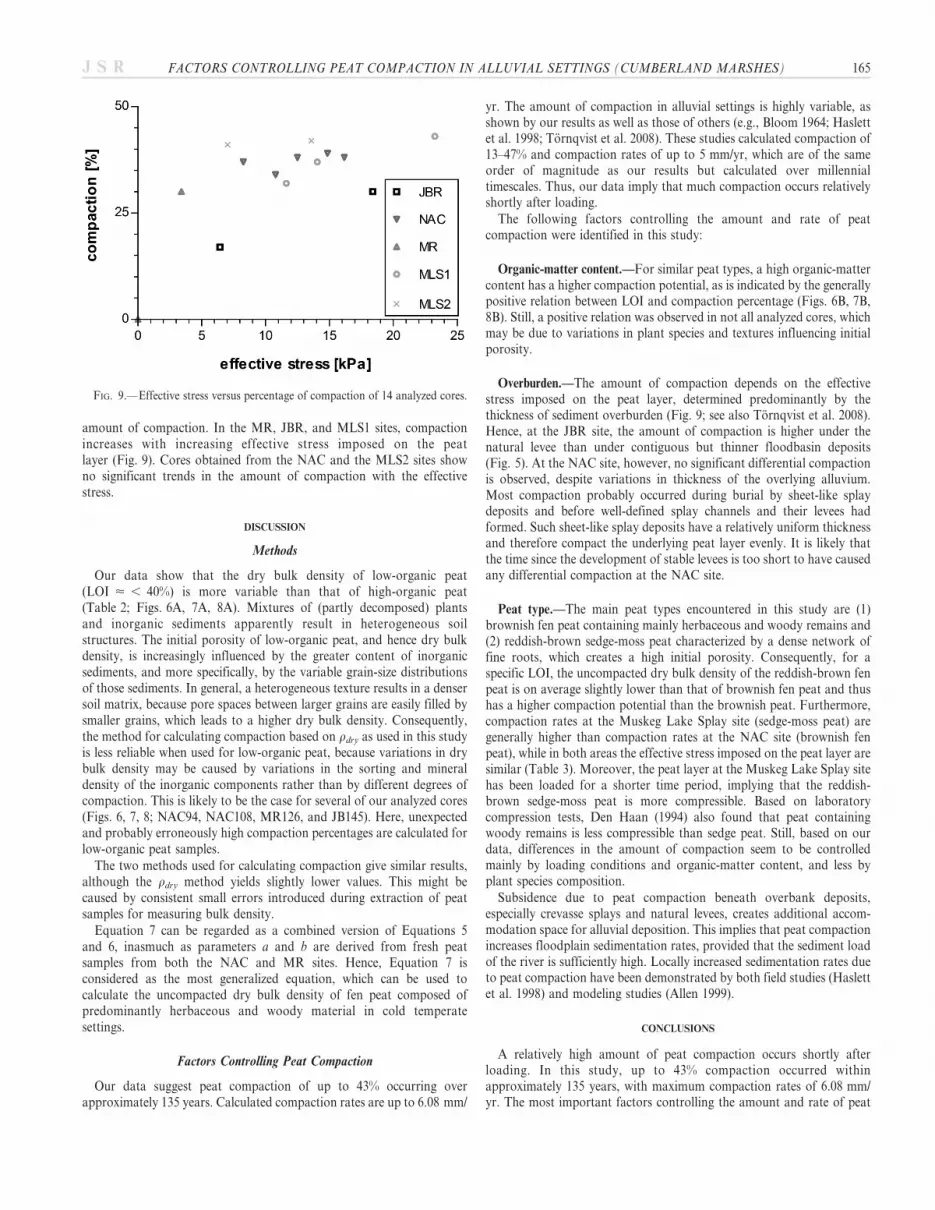
James Bond River
Both sampled cores (JBR145 and JBR146) show a high variation in LOIwith depth and an associated variation in rdry (Appendix 3, seeAcknowledgments section for JSR’s Data Archive). Peat with a relativelyhigh LOI has a relatively low rdry (Fig. 8A; Table 2). Because the peat hascharacteristics similar to peat at both NAC and the MR, parameter values
for the equation to calculate uncompacted rdry were determined from freshpeat samples obtained from both the Horseshoe and the Mossy Riverwetlands. This resulted in the following equation (R2 5 0.67):
rdry,uncomp~0:6641 exp{0:0196LOI ð7Þ
Calculated compaction percentages for the 5 cm3 samples were highestfor peat underlying the thick levee (Fig. 8B). No clear trend existsbetween LOI and compaction percentage (Fig. 8B). Average compactionvalues of 30% and 17% for core JBR145 and JBR146 respectively werecalculated (Table 3).
TABLE 3.—Amount and rate of compaction, effective stress imposed by sediment overburden, and accumulation rates for each sampled peat core. Theaccumulation rate is calculated based on the current compacted thickness of the peat layer (column ‘‘comp’’) and based on the calculated decompacted
thickness of the peat layer (column ‘‘decomp’’).
Core Compaction [%] Compaction rate [mm/yr] Effective stress (kPa)
Accumulation rate (mm/yr)
comp decomp
NAC94 38 1.58 12.48 no datesNAC101 34 2.06 10.77 0.26 0.41NAC102 38 2.22 16.15 0.24 0.38NAC104 37 2.63 8.25 0.49 0.83NAC108 39 2.16 14.84 0.24 0.40MR126 30 2.56 3.40 0.49 0.72MR130 24 0 0 0.41 0.39JBR145 30 5.89 18.38 0.41 0.59JBR146 17 3.09 6.42 0.45 0.55MLS16 43 6.08* 23.24 0.31 0.54MLS20 32 5.87* 11.61 0.48 0.71MLS22 37 4.14* 14.04 0.27 0.43MLS79 42 4.29* 13.57 0.23 0.40MLS82 41 5.18* 5.31 0.29 0.49
* Peat accumulation started 2700 cal yr BP (based on dated peat sample from the base of the peat layer at MS1 site).
FIG. 6.—A) Plot of LOI vs. dry bulk density and B) plot of LOI vs. compaction for sampled cores of the NAC cross section (94, 101, 102, 104, and 108; cs 5 crevassesplay deposits, f 5 floodbasin deposits, l 5 natural-levee deposits).
FACTORS CONTROLLING PEAT COMPACTION IN ALLUVIAL SETTINGS (CUMBERLAND MARSHES) 163J S R
Compaction Rates
The compaction rate is expressed as the amount of volume reductionthat occurred since loading of the peat layer. Most peat compaction at theNAC and MR sites is likely induced by the overburden deposited after the1870s avulsion, so most compaction has occurred within approximately135 years. Based on aerial photographs and historical maps, we estimate aloading duration of 100 years in the Muskeg Lake Splay and 80 years inthe James Bond River sites. The highest calculated compaction rate is6.08 mm/yr (Table 3). Average peat accumulation rates are 0.35 mm/yr(range 0.23–0.49, st. dev. 5 0.10) and 0.53 mm/yr (range 0.38–0.83, st.
dev. 5 0.15) for presently compacted and calculated decompactedthicknesses, respectively.
Overburden
Peat layers in five additional cores were analyzed for rdry and LOI inthe Muskeg Lake Splay (Fig. 1). In the Muskeg Lake Splay site, anapproximately 1-m-thick layer of predominantly reddish-brown moss-sedge peat is overlain by crevasse-splay deposits up to 4 m thick. Foreach of the 14 cores examined for rdry and LOI, the effective stressimposed on the peat layer was calculated and plotted against the
FIG. 7.— A) Plot of LOI vs. dry bulk density and B) plot of LOI vs. compaction for core 123, 126, and 130 of the Mossy River cross section (Fig. 4). Negativecompaction percentages for MR130 are not shown.
FIG. 8.— A) Plot of LOI vs. dry bulk density and B) plot of LOI vs. compaction for sampled cores of the James Bond cross section (145 and 146; Fig. 5).
164 S. VAN ASSELEN ET AL. J S R
amount of compaction. In the MR, JBR, and MLS1 sites, compactionincreases with increasing effective stress imposed on the peatlayer (Fig. 9). Cores obtained from the NAC and the MLS2 sites showno significant trends in the amount of compaction with the effectivestress.
DISCUSSION
Methods
Our data show that the dry bulk density of low-organic peat(LOI < , 40%) is more variable than that of high-organic peat(Table 2; Figs. 6A, 7A, 8A). Mixtures of (partly decomposed) plantsand inorganic sediments apparently result in heterogeneous soilstructures. The initial porosity of low-organic peat, and hence dry bulkdensity, is increasingly influenced by the greater content of inorganicsediments, and more specifically, by the variable grain-size distributionsof those sediments. In general, a heterogeneous texture results in a densersoil matrix, because pore spaces between larger grains are easily filled bysmaller grains, which leads to a higher dry bulk density. Consequently,the method for calculating compaction based on rdry as used in this studyis less reliable when used for low-organic peat, because variations in drybulk density may be caused by variations in the sorting and mineraldensity of the inorganic components rather than by different degrees ofcompaction. This is likely to be the case for several of our analyzed cores(Figs. 6, 7, 8; NAC94, NAC108, MR126, and JB145). Here, unexpectedand probably erroneously high compaction percentages are calculated forlow-organic peat samples.
The two methods used for calculating compaction give similar results,although the rdry method yields slightly lower values. This might becaused by consistent small errors introduced during extraction of peatsamples for measuring bulk density.
Equation 7 can be regarded as a combined version of Equations 5and 6, inasmuch as parameters a and b are derived from fresh peatsamples from both the NAC and MR sites. Hence, Equation 7 isconsidered as the most generalized equation, which can be used tocalculate the uncompacted dry bulk density of fen peat composed ofpredominantly herbaceous and woody material in cold temperatesettings.
Factors Controlling Peat Compaction
Our data suggest peat compaction of up to 43% occurring overapproximately 135 years. Calculated compaction rates are up to 6.08 mm/
yr. The amount of compaction in alluvial settings is highly variable, asshown by our results as well as those of others (e.g., Bloom 1964; Haslettet al. 1998; Tornqvist et al. 2008). These studies calculated compaction of13–47% and compaction rates of up to 5 mm/yr, which are of the sameorder of magnitude as our results but calculated over millennialtimescales. Thus, our data imply that much compaction occurs relativelyshortly after loading.
The following factors controlling the amount and rate of peatcompaction were identified in this study:
Organic-matter content.—For similar peat types, a high organic-mattercontent has a higher compaction potential, as is indicated by the generallypositive relation between LOI and compaction percentage (Figs. 6B, 7B,8B). Still, a positive relation was observed in not all analyzed cores, whichmay be due to variations in plant species and textures influencing initialporosity.
Overburden.—The amount of compaction depends on the effectivestress imposed on the peat layer, determined predominantly by thethickness of sediment overburden (Fig. 9; see also Tornqvist et al. 2008).Hence, at the JBR site, the amount of compaction is higher under thenatural levee than under contiguous but thinner floodbasin deposits(Fig. 5). At the NAC site, however, no significant differential compactionis observed, despite variations in thickness of the overlying alluvium.Most compaction probably occurred during burial by sheet-like splaydeposits and before well-defined splay channels and their levees hadformed. Such sheet-like splay deposits have a relatively uniform thicknessand therefore compact the underlying peat layer evenly. It is likely thatthe time since the development of stable levees is too short to have causedany differential compaction at the NAC site.
Peat type.—The main peat types encountered in this study are (1)brownish fen peat containing mainly herbaceous and woody remains and(2) reddish-brown sedge-moss peat characterized by a dense network offine roots, which creates a high initial porosity. Consequently, for aspecific LOI, the uncompacted dry bulk density of the reddish-brown fenpeat is on average slightly lower than that of brownish fen peat and thushas a higher compaction potential than the brownish peat. Furthermore,compaction rates at the Muskeg Lake Splay site (sedge-moss peat) aregenerally higher than compaction rates at the NAC site (brownish fenpeat), while in both areas the effective stress imposed on the peat layer aresimilar (Table 3). Moreover, the peat layer at the Muskeg Lake Splay sitehas been loaded for a shorter time period, implying that the reddish-brown sedge-moss peat is more compressible. Based on laboratorycompression tests, Den Haan (1994) also found that peat containingwoody remains is less compressible than sedge peat. Still, based on ourdata, differences in the amount of compaction seem to be controlledmainly by loading conditions and organic-matter content, and less byplant species composition.
Subsidence due to peat compaction beneath overbank deposits,especially crevasse splays and natural levees, creates additional accom-modation space for alluvial deposition. This implies that peat compactionincreases floodplain sedimentation rates, provided that the sediment loadof the river is sufficiently high. Locally increased sedimentation rates dueto peat compaction have been demonstrated by both field studies (Haslettet al. 1998) and modeling studies (Allen 1999).
CONCLUSIONS
A relatively high amount of peat compaction occurs shortly afterloading. In this study, up to 43% compaction occurred withinapproximately 135 years, with maximum compaction rates of 6.08 mm/yr. The most important factors controlling the amount and rate of peat
FIG. 9.—Effective stress versus percentage of compaction of 14 analyzed cores.
FACTORS CONTROLLING PEAT COMPACTION IN ALLUVIAL SETTINGS (CUMBERLAND MARSHES) 165J S R

compaction are organic-matter content and weight of sediment overbur-den. To a lesser extent, plant species composition influences thecompressibility of peat. High-organic peat containing mainly roots andsmall fibers is most susceptible to compaction. Hence, sites where high-organic peat underlies thick crevasse splays or natural levees are mostsusceptible to subsidence due to compaction. Shortly (decades) afterdeposition of crevasse sheet deposits, relatively uniform peat compactionoccurs. Differential compaction results when stable natural leveesdevelop; a higher amount of compaction occurs under levees than inthe adjoining floodbasins. Subsidence due to compaction at such sitescreates additional accommodation space for alluvial deposition, whichenhances floodplain sedimentation rates.
ACKNOWLEDGMENTS
Chris Roosendaal, Ingwer Bos, Willem Toonen, and our local guide GaryCarriere are thanked for their assistance during the fieldwork in the Cumber-land Marshes. We thank Nelleke van Asch for selecting macrofossils ofterrestrial vegetation suitable for radiocarbon dating, which was performed atthe R.J. van de Graaff laboratory, Utrecht University. This research was fundedby the Netherlands Organization for Scientific Research–Earth and LifeSciences (NWO-ALW, project 814.01.014) and Utrecht University, Faculty ofGeosciences. This paper benefited greatly from reviews by Jackie Huntoon,Greg Nadon, and an anonymous reviewer. The three Appendices are availablefrom JSR’s Data Archive: http://www.sepm.org/jsr/jsr_data_archive.asp.
REFERENCES
ALLEN, J.R.L., 1999, Geological impacts on coastal wetland landscapes: some generaleffects of sediment autocompaction in the Holocene of northwest Europe: TheHolocene, v. 9, p. 1–12.
BIRD, M.I., FIFIELD, L.K., CHUA, S., AND GOH, B., 2004, Calculating sedimentcompaction for radiocarbon dating of intertidal sediments: Radiocarbon, v. 46, p.421–435.
BLOOM, A.L., 1964, Peat accumulation and compaction in a Connecticut coastal marsh:Journal of Sedimentary Petrology, v. 34, p. 599–603.
BRONK RAMSEY, C., 2001, Development of the radiocarbon calibration program OxCal:Radiocarbon, v. 43, p. 355–363.
BRONK RAMSEY, C., 2008, Deposition models for chronological records: QuaternaryScience Reviews, v. 27, p. 42–60.
BUTTLER, A., GROSVERNIER, P., AND MATTHEY, Y., 1998, A new sampler for extractingundisturbed surface peat cores for growth pot experiments: New Phytologist, v. 140,p. 155–160.
CHARMAN, D., 2002, Peatlands and Environmental Change: Chichester, England, JohnWiley & Sons, 301 p.
DAVIES-VOLLUM, K.S., AND SMITH, N.D., 2008, Factors affecting the accumulation oforganic-rich deposits in a modern avulsive floodplain: examples from the CumberlandMarshes, Saskatchewan, Canada: Journal of Sedimentary Research, v. 78, p. 683–692.
DAY, J.W., AND GIOSAN, L., 2008, Survive or subside?: Nature Geoscience, v. 1, p.156–157.
DE BAKKER, H., AND SCHELLING, J., 1966 (in Dutch), Systeem van Bodemclassificatievoor Nederland: Wageningen, The Netherlands, Pudoc, 217 p.
DEN HAAN, E.J., 1994, Vertical compression of soils [Ph.D. Thesis]: Delft UniversityPress, 96 p.
DIRSCHL, H.J., 1972, Geobotanical processes in the Saskatchewan River Delta:Canadian Journal of Earth Sciences, v. 9, p. 1529–1549.
DIRSCHL, H.J., AND COUPLAND, R.T., 1972, Vegetation patterns and site relationships inthe Saskatchewan River delta: Canadian Journal of Botany, v. 50, p. 647–675.
GIVELET, N., LE ROUX, G., CHEBURKIN, A., CHEN, B., FRANK, J., GOODSITE, M.E.,KEMPTER, H., KRACHLER, M., NOERNBERG, T., RAUSCH, N., RHUINBERGER, S., ROOS-BARRACLOUGH, F., SAPKOTA, A., SCHOLZ, C., AND SHOTYK, W., 2004, Suggestedprotocol for collecting, handling and preparing peat cores and peat samples forphysical, chemical, mineralogical and isotopic analyses: Journal of EnvironmentalMonitoring, v. 6, p. 481–492.
HASLETT, S.K., DAVIES, P., CURR, R.H.F., DAVIES, C.F.C., KENNINGTON, K., KING, C.P.,AND MARGETTS, A.J., 1998, Evaluating late-Holocene relative sea-level change in theSomerset Levels, southwest Britain: The Holocene, v. 8, p. 197–207.
LEFEBVRE, G., LANGLOIS, P., LUPIEN, C., AND LAVALLEE, J.G., 1984, Laboratory testingand in situ behaviour of peat as embankment foundation: Canadian GeotechnicalJournal, v. 21, p. 322–337.
LOCHER, W.P., AND BAKKER, H., 1990 (in Dutch), Bodemkunde van Nederland, Deel 1,Algemene bodemkunde: Malmberg, Den Bosch, 439 p.
LONG, A.J., WALLER, M.P., AND STUPPLES, P., 2006, Driving mechanisms of coastalchange: Peat compaction and the destruction of late Holocene coastal wetlands:Marine Geology, v. 225, p. 63–84.
MESRI, G., AND AJLOUNI, M., 2007, Engineering properties of fibrous peats: Journal ofGeotechnical and Geoenvironmental Engineering, v. 133, p. 850–866.
MICHAELSEN, P., HENDERSON, R.A., CROSDALE, P.J., AND MIKKELSEN, S.O., 2000, Faciesarchitecture and depositional dynamics of the Upper Permian Rangal Coal Measures,Bowen Basin, Australia: Journal of Sedimentary Research, v. 70, p. 879–895.
MOROZOVA, G.S., AND SMITH, N.D., 1999, Holocene avulsion history of the lowerSaskatchewan fluvial system, Cumberland Marshes, Saskatchewan–Manitoba,Canada, in Smith, N.D., and Rogers, J., eds., Fluvial Sedimentology VI, InternationalAssociation of Sedimentologists, Special Publication 28, p. 231–249.
MOROZOVA, G.S., AND SMITH, N.D., 2000, Holocene avulsion styles and sedimentationpatterns of the Saskatchewan River, Cumberland Marshes, Canada: SedimentaryGeology, v. 130, p. 81–105.
MOROZOVA, G.S., AND SMITH, N.D., 2003, Organic matter deposition in theSaskatchewan River floodplain (Cumberland Marshes, Canada): effect of prograda-tional avulsions: Sedimentary Geology, v. 157, p. 15–29.
PEREZ-ARLUCEA, M., AND SMITH, N.D., 1999, Depositional patterns following the 1870savulsion of the Saskatchewan River (Cumberland Marshes, Saskatchewan, Canada):Journal of Sedimentary Research, v. 69, p. 62–73.
PETRONE, R.M., DEVITO, K.J., SILINS, U., MENDOZA, C., BROWN, S.C., KAUFMAN, S.C.,AND PRICE, J.S., 2008, Transient peat properties in two pond–peatland complexes inthe sub-humid Western Boreal Plain, Canada: Mires and Peat, v. 3, p. 1–13.
RAJCHL, M., AND ULICNY, D., 2005, Depositional record of an avulsive fluvial systemcontrolled by peat compaction (Neogene, Most Basin, Czech Republic): Sedimentol-ogy, v. 52, p. 601–626.
REIMER, P., BAILLIE, M., BARD, E., BAYLISS, A., BECK, J., BERTRAND, C., BLACKWELL, P.,BUCK, C., BURR, G., CUTLER, K., DAMON, P.E., EDWARDS, R., FAIRBANKS, R.,FRIEDRICH, M., GUILDERSON, T., HOGG, A., HUGHEN, K., KROMER, B., MCCORMAC, G.,MANNING, S., RAMSEY, C., REIMER, R., REMMELE, S., SOUTHON, J., STUIVER, M.,TALAMO, S., TAYLOR, F., VAN DER PLICHT, J., AND WEYHENMEYER, C., 2004, IntCal04terrestrial radiocarbon age calibration, 0–26 cal kyr BP: Radiocarbon, v. 46, p.1029–1058.
ROULET, N.T., 1991, Surface level and water table fluctuations in a subarctic fen: Arcticand Alpine Research, v. 23, p. 303–310.
SAXTON, K.E., RAWLS, W.J., ROMBERGER, J.S., AND PAPENDICK, R.I., 1986, Estimatinggeneralized soil–water characteristics from texture: Soil Sciences Society of America,Journal, v. 50, p. 1031–1036.
SCHREINER, B.T., 1983, Lake Agassiz in Saskatchewan, in Teller, J.T., and Clayton, L.,eds., Glacial Lake Agassiz, Geological Association of Canada, Special Paper 26, p.75–96.
SMITH, N.D., CROSS, T.A., DUFFICY, J.P., AND CLOUGH, S.R., 1989, Anatomy of anavulsion: Sedimentology, v. 36, p. 1–23.
SMITH, N.D., SLINGERLAND, R.L., PEREZ-ARLUCEA, M., AND MOROZOVA, G.S., 1998, The1870s avulsion of the Saskatchewan River: Canadian Journal of Earth Sciences, v. 35,p. 453–466.
TERZAGHI, K., 1943, Theoretical Soil Mechanics: New York, John Wiley and Sons,528 p.
TORNQVIST, T.E., WALLACE, D.J., STORMS, J.E.A., WALLINGA, J., VAN DAM, R.L.,BLAAUW, M., DERKSEN, M.S., KLERKS, C.J.W., MEIJNEKEN, C., AND SNIJDERS, E.M.A.,2008, Mississippi Delta subsidence primarily caused by compaction of Holocenestrata: Nature Geoscience, v. 1, p. 173–176.
VAN ASSELEN, S., AND ROOSENDAAL, C., 2009, A new method for determining the bulkdensity of uncompacted peat from field settings: Journal of Sedimentary Research,v. 79, p. xx–xx.
VAN ASSELEN, S., STOUTHAMER, E., AND VAN ASCH, T.W.J., 2009, Effects of peatcompaction on delta evolution: a review on processes, responses, measuring andmodeling: Earth Science Reviews, v. 92, p. 35–51.
Received 30 January 2009; accepted 10 September 2009.
166 S. VAN ASSELEN ET AL. J S R