Sediment Accretion in Tidal Freshwater Forests and Oligohaline Marshes of the Waccamaw and Savannah...
15
1 23 Estuaries and Coasts Journal of the Coastal and Estuarine Research Federation ISSN 1559-2723 Estuaries and Coasts DOI 10.1007/s12237-013-9744-7 Sediment Accretion in Tidal Freshwater Forests and Oligohaline Marshes of the Waccamaw and Savannah Rivers, USA Scott H. Ensign, Cliff R. Hupp, Gregory B. Noe, Ken W. Krauss & Camille L. Stagg
-
Upload
independent -
Category
Documents
-
view
1 -
download
0
Transcript of Sediment Accretion in Tidal Freshwater Forests and Oligohaline Marshes of the Waccamaw and Savannah...
1 23
Estuaries and CoastsJournal of the Coastal and EstuarineResearch Federation ISSN 1559-2723 Estuaries and CoastsDOI 10.1007/s12237-013-9744-7
Sediment Accretion in Tidal FreshwaterForests and Oligohaline Marshes of theWaccamaw and Savannah Rivers, USA
Scott H. Ensign, Cliff R. Hupp, GregoryB. Noe, Ken W. Krauss & CamilleL. Stagg

1 23
Your article is protected by copyright and
all rights are held exclusively by Coastal
and Estuarine Research Federation (outside
the USA). This e-offprint is for personal
use only and shall not be self-archived
in electronic repositories. If you wish to
self-archive your article, please use the
accepted manuscript version for posting on
your own website. You may further deposit
the accepted manuscript version in any
repository, provided it is only made publicly
available 12 months after official publication
or later and provided acknowledgement is
given to the original source of publication
and a link is inserted to the published article
on Springer's website. The link must be
accompanied by the following text: "The final
publication is available at link.springer.com”.
Sediment Accretion in Tidal Freshwater Forestsand Oligohaline Marshes of the Waccamawand Savannah Rivers, USA
Scott H. Ensign & Cliff R. Hupp & Gregory B. Noe &
Ken W. Krauss & Camille L. Stagg
Received: 13 December 2012 /Revised: 4 November 2013 /Accepted: 15 November 2013# Coastal and Estuarine Research Federation (outside the USA) 2013
Abstract Sediment accretion was measured at four sites invarying stages of forest-to-marsh succession along a fresh-to-oligohaline gradient on the Waccamaw River and its tributaryTurkey Creek (Coastal Plain watersheds, South Carolina) andthe Savannah River (Piedmont watershed, South Carolina andGeorgia). Sites included tidal freshwater forests, moderatelysalt-impacted forests at the freshwater–oligohaline transition,highly salt-impacted forests, and oligohaline marshes.Sediment accretion was measured by use of feldspar markerpads for 2.5 year; accessory information on wetland inunda-tion, canopy litterfall, herbaceous production, and soil char-acteristics were also collected. Sediment accretion rangedfrom 4.5 mm year−1 at moderately salt-impacted forest onthe Savannah River to 19.1 mm year−1 at its relict, highlysalt-impacted forest downstream. Oligohaline marsh sedimentaccretion was 1.5–2.5 times greater than in tidal freshwaterforests. Overall, there was no significant difference in accre-tion rate between rivers with contrasting sediment loads.Accretion was significantly higher in hollows than on hum-mocks in tidal freshwater forests. Organic sediment accretionwas similar to autochthonous litter production at all sites, butinorganic sediment constituted the majority of accretion atboth marshes and the Savannah River highly salt-impactedforest. A strong correlation between inorganic sedimentaccumulation and autochthonous litter production indicateda positive feedback between herbaceous plant production andallochthonous sediment deposition. The similarity in rates of
sediment accretion and sea level rise in tidal freshwater forestsindicates that these habitats may become permanently inun-dated if the rate of sea level rise increases.
Keywords Tidal freshwater wetland . Tidal freshwaterforestedwetland . Tidal swamp . Tidal freshwater marsh .
Sediment accretion . Sea level rise . River geomorphology .
Coastal geomorphology
Introduction
At the interface between rivers and estuaries, riparian tidalwetlands provide critical ecological habitats and affect ele-mental transport between the world’s terrestrial and marineenvironments. The spatial extent of tidal wetlands and theirvegetation are changing as sea level rises, with the mostdramatic changes occurring in the freshwater portion of theestuary (Conner et al. 2007 and references therein; Barendregtet al. 2009 and references therein). At the upstream limit oftidal influence, tidal freshwater forested wetlands dominatethe riparian zone and are advancing upstream as sea levelrises. At the downstream end of this tidal freshwater zone,periodic salinity intrusion and tidal inundation forces succes-sion of riparian forests to oligohaline marshes (Yanosky et al.1995; Krauss et al. 2009; Cormier et al. 2013). Yet sea levelrise, salinity intrusion, and tidal inundation are not the onlyvariables that influence habitat change of these tidal wetlands.Elevation change, due in part to sediment accretion, alsoaffects the relative influence of sea level rise. Sediment accre-tion in tidal wetlands provides an important mechanism forreducing sensitivity of these habitats and their ecosystemfunctions (e.g., carbon and nutrient sequestration, sedimenttrapping) to future sea level rise.
The current study focuses on the accretion deficit in tidalwetlands: the difference between accretion rate and sea level
Communicated by Bob Christian
S. H. Ensign (*) : C. R. Hupp :G. B. NoeNational Research Program, U.S. Geological Survey,Reston, VA, USAe-mail: [email protected]
K. W. Krauss :C. L. StaggNational Wetlands Research Center, U.S. Geological Survey,Lafayette, LA, USA
Estuaries and CoastsDOI 10.1007/s12237-013-9744-7
Author's personal copy
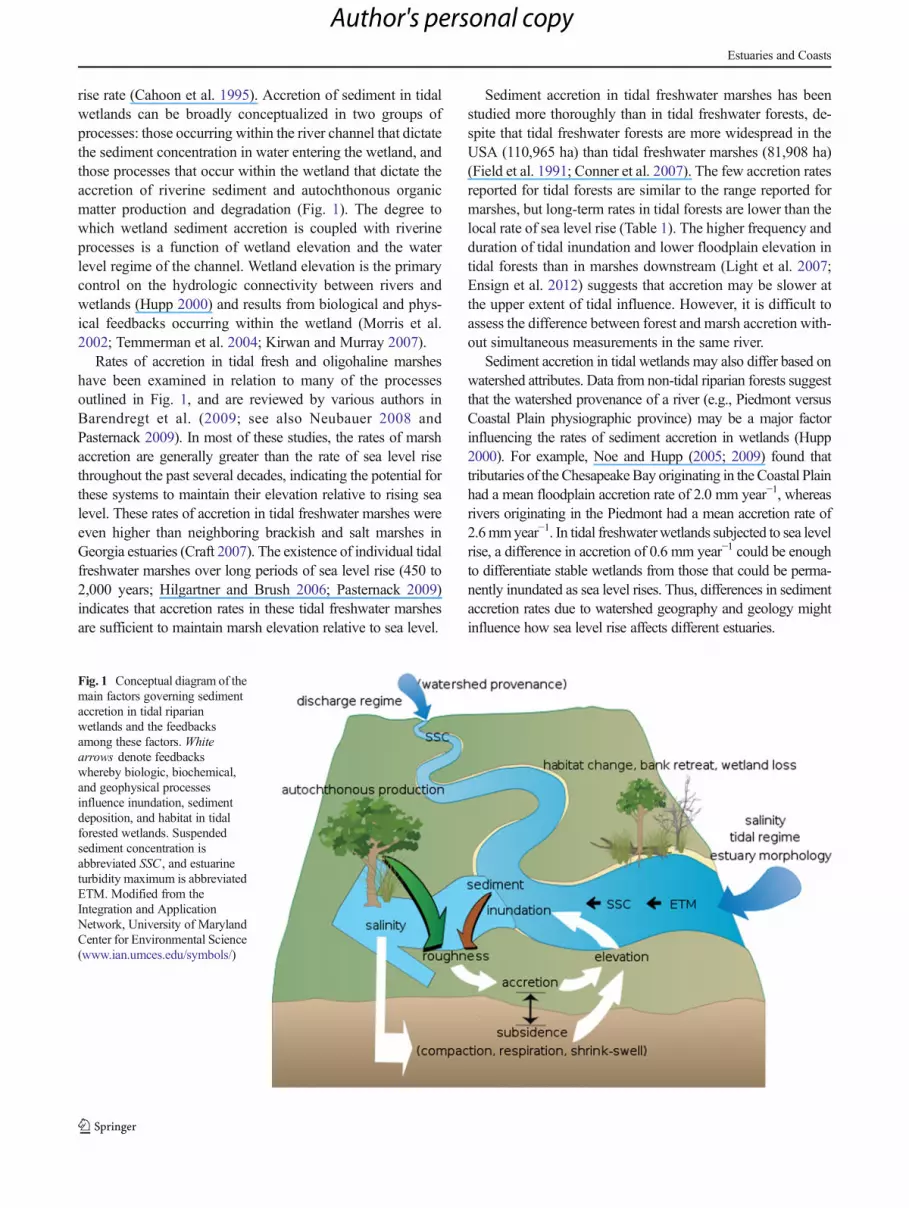
rise rate (Cahoon et al. 1995). Accretion of sediment in tidalwetlands can be broadly conceptualized in two groups ofprocesses: those occurring within the river channel that dictatethe sediment concentration in water entering the wetland, andthose processes that occur within the wetland that dictate theaccretion of riverine sediment and autochthonous organicmatter production and degradation (Fig. 1). The degree towhich wetland sediment accretion is coupled with riverineprocesses is a function of wetland elevation and the waterlevel regime of the channel. Wetland elevation is the primarycontrol on the hydrologic connectivity between rivers andwetlands (Hupp 2000) and results from biological and phys-ical feedbacks occurring within the wetland (Morris et al.2002; Temmerman et al. 2004; Kirwan and Murray 2007).
Rates of accretion in tidal fresh and oligohaline marsheshave been examined in relation to many of the processesoutlined in Fig. 1, and are reviewed by various authors inBarendregt et al. (2009; see also Neubauer 2008 andPasternack 2009). In most of these studies, the rates of marshaccretion are generally greater than the rate of sea level risethroughout the past several decades, indicating the potential forthese systems to maintain their elevation relative to rising sealevel. These rates of accretion in tidal freshwater marshes wereeven higher than neighboring brackish and salt marshes inGeorgia estuaries (Craft 2007). The existence of individual tidalfreshwater marshes over long periods of sea level rise (450 to2,000 years; Hilgartner and Brush 2006; Pasternack 2009)indicates that accretion rates in these tidal freshwater marshesare sufficient to maintain marsh elevation relative to sea level.
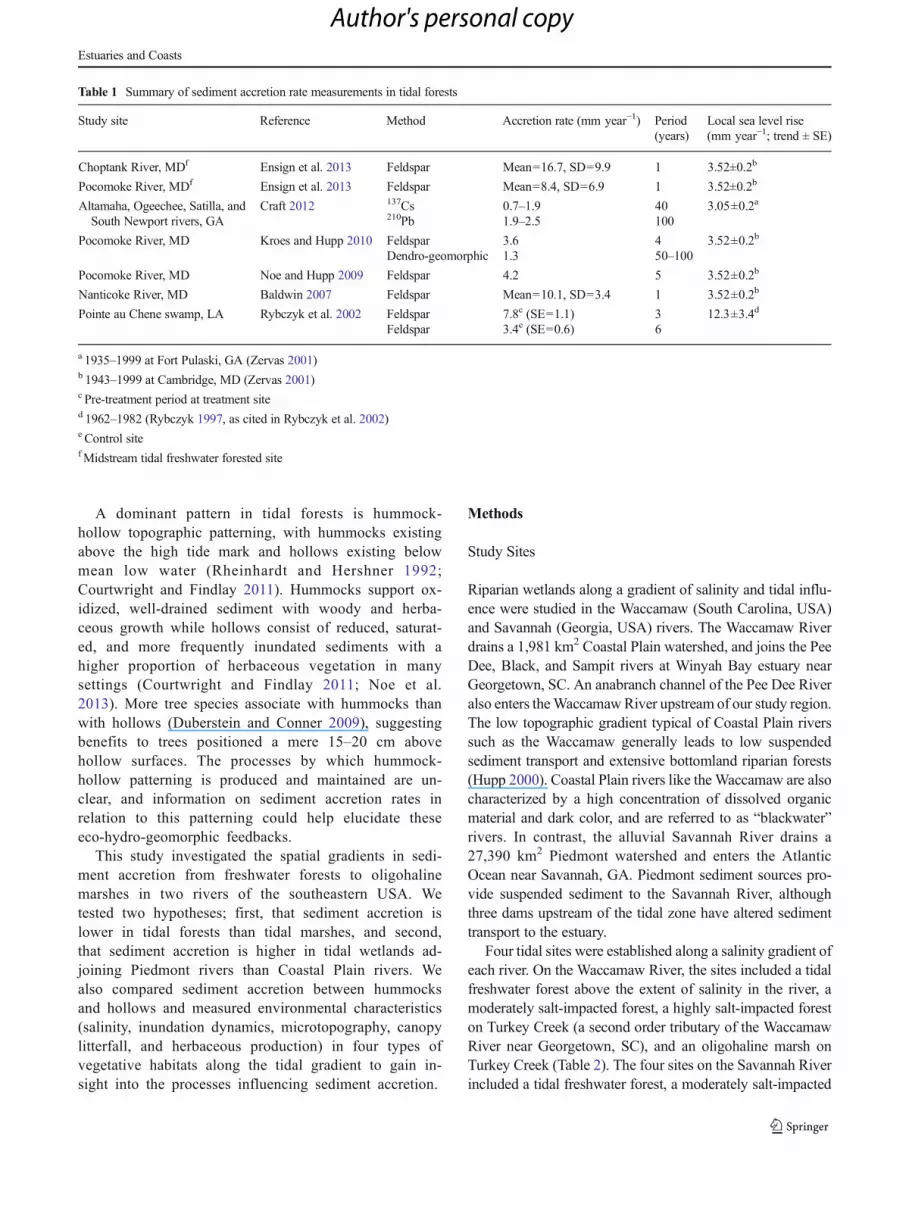
Sediment accretion in tidal freshwater marshes has beenstudied more thoroughly than in tidal freshwater forests, de-spite that tidal freshwater forests are more widespread in theUSA (110,965 ha) than tidal freshwater marshes (81,908 ha)(Field et al. 1991; Conner et al. 2007). The few accretion ratesreported for tidal forests are similar to the range reported formarshes, but long-term rates in tidal forests are lower than thelocal rate of sea level rise (Table 1). The higher frequency andduration of tidal inundation and lower floodplain elevation intidal forests than in marshes downstream (Light et al. 2007;Ensign et al. 2012) suggests that accretion may be slower atthe upper extent of tidal influence. However, it is difficult toassess the difference between forest and marsh accretion with-out simultaneous measurements in the same river.
Sediment accretion in tidal wetlands may also differ based onwatershed attributes. Data from non-tidal riparian forests suggestthat the watershed provenance of a river (e.g., Piedmont versusCoastal Plain physiographic province) may be a major factorinfluencing the rates of sediment accretion in wetlands (Hupp2000). For example, Noe and Hupp (2005; 2009) found thattributaries of the ChesapeakeBay originating in the Coastal Plainhad a mean floodplain accretion rate of 2.0 mm year−1, whereasrivers originating in the Piedmont had a mean accretion rate of2.6mmyear−1. In tidal freshwaterwetlands subjected to sea levelrise, a difference in accretion of 0.6 mm year−1 could be enoughto differentiate stable wetlands from those that could be perma-nently inundated as sea level rises. Thus, differences in sedimentaccretion rates due to watershed geography and geology mightinfluence how sea level rise affects different estuaries.
Fig. 1 Conceptual diagram of themain factors governing sedimentaccretion in tidal riparianwetlands and the feedbacksamong these factors. Whitearrows denote feedbackswhereby biologic, biochemical,and geophysical processesinfluence inundation, sedimentdeposition, and habitat in tidalforested wetlands. Suspendedsediment concentration isabbreviated SSC , and estuarineturbidity maximum is abbreviatedETM. Modified from theIntegration and ApplicationNetwork, University of MarylandCenter for Environmental Science(www.ian.umces.edu/symbols/)
Estuaries and Coasts
Author's personal copy
A dominant pattern in tidal forests is hummock-hollow topographic patterning, with hummocks existingabove the high tide mark and hollows existing belowmean low water (Rheinhardt and Hershner 1992;Courtwright and Findlay 2011). Hummocks support ox-idized, well-drained sediment with woody and herba-ceous growth while hollows consist of reduced, saturat-ed, and more frequently inundated sediments with ahigher proportion of herbaceous vegetation in manysettings (Courtwright and Findlay 2011; Noe et al.2013). More tree species associate with hummocks thanwith hollows (Duberstein and Conner 2009), suggestingbenefits to trees positioned a mere 15–20 cm abovehollow surfaces. The processes by which hummock-hollow patterning is produced and maintained are un-clear, and information on sediment accretion rates inrelation to this patterning could help elucidate theseeco-hydro-geomorphic feedbacks.
This study investigated the spatial gradients in sedi-ment accretion from freshwater forests to oligohalinemarshes in two rivers of the southeastern USA. Wetested two hypotheses; first, that sediment accretion islower in tidal forests than tidal marshes, and second,that sediment accretion is higher in tidal wetlands ad-joining Piedmont rivers than Coastal Plain rivers. Wealso compared sediment accretion between hummocksand hollows and measured environmental characteristics(salinity, inundation dynamics, microtopography, canopylitterfall, and herbaceous production) in four types ofvegetative habitats along the tidal gradient to gain in-sight into the processes influencing sediment accretion.
Methods
Study Sites
Riparian wetlands along a gradient of salinity and tidal influ-ence were studied in the Waccamaw (South Carolina, USA)and Savannah (Georgia, USA) rivers. The Waccamaw Riverdrains a 1,981 km2 Coastal Plain watershed, and joins the PeeDee, Black, and Sampit rivers at Winyah Bay estuary nearGeorgetown, SC. An anabranch channel of the Pee Dee Riveralso enters theWaccamawRiver upstream of our study region.The low topographic gradient typical of Coastal Plain riverssuch as the Waccamaw generally leads to low suspendedsediment transport and extensive bottomland riparian forests(Hupp 2000). Coastal Plain rivers like the Waccamaw are alsocharacterized by a high concentration of dissolved organicmaterial and dark color, and are referred to as “blackwater”rivers. In contrast, the alluvial Savannah River drains a27,390 km2 Piedmont watershed and enters the AtlanticOcean near Savannah, GA. Piedmont sediment sources pro-vide suspended sediment to the Savannah River, althoughthree dams upstream of the tidal zone have altered sedimenttransport to the estuary.
Four tidal sites were established along a salinity gradient ofeach river. On the Waccamaw River, the sites included a tidalfreshwater forest above the extent of salinity in the river, amoderately salt-impacted forest, a highly salt-impacted foreston Turkey Creek (a second order tributary of the WaccamawRiver near Georgetown, SC), and an oligohaline marsh onTurkey Creek (Table 2). The four sites on the Savannah Riverincluded a tidal freshwater forest, a moderately salt-impacted
Table 1 Summary of sediment accretion rate measurements in tidal forests
Study site Reference Method Accretion rate (mm year−1) Period(years)
Local sea level rise(mm year−1; trend ± SE)
Choptank River, MDf Ensign et al. 2013 Feldspar Mean=16.7, SD=9.9 1 3.52±0.2b
Pocomoke River, MDf Ensign et al. 2013 Feldspar Mean=8.4, SD=6.9 1 3.52±0.2b
Altamaha, Ogeechee, Satilla, andSouth Newport rivers, GA
Craft 2012 137Cs 0.7–1.9 40 3.05±0.2a210Pb 1.9–2.5 100
Pocomoke River, MD Kroes and Hupp 2010 Feldspar 3.6 4 3.52±0.2b
Dendro-geomorphic 1.3 50–100
Pocomoke River, MD Noe and Hupp 2009 Feldspar 4.2 5 3.52±0.2b
Nanticoke River, MD Baldwin 2007 Feldspar Mean=10.1, SD=3.4 1 3.52±0.2b
Pointe au Chene swamp, LA Rybczyk et al. 2002 Feldspar 7.8c (SE=1.1) 3 12.3±3.4d
Feldspar 3.4e (SE=0.6) 6
a 1935–1999 at Fort Pulaski, GA (Zervas 2001)b 1943–1999 at Cambridge, MD (Zervas 2001)c Pre-treatment period at treatment sited 1962–1982 (Rybczyk 1997, as cited in Rybczyk et al. 2002)e Control sitefMidstream tidal freshwater forested site
Estuaries and Coasts
Author's personal copy
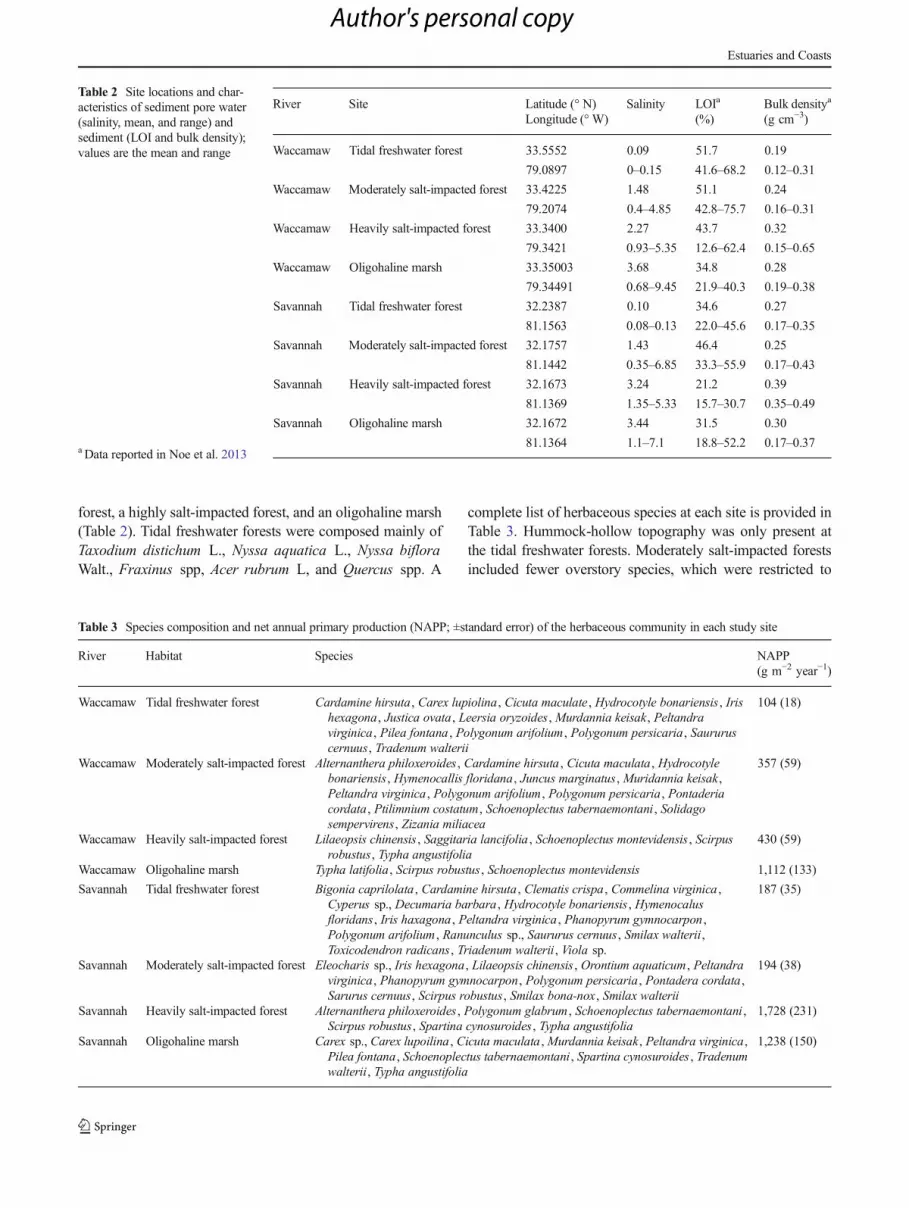
forest, a highly salt-impacted forest, and an oligohaline marsh(Table 2). Tidal freshwater forests were composed mainly ofTaxodium distichum L., Nyssa aquatica L., Nyssa bifloraWalt., Fraxinus spp, Acer rubrum L, and Quercus spp. A
complete list of herbaceous species at each site is provided inTable 3. Hummock-hollow topography was only present atthe tidal freshwater forests. Moderately salt-impacted forestsincluded fewer overstory species, which were restricted to
Table 2 Site locations and char-acteristics of sediment pore water(salinity, mean, and range) andsediment (LOI and bulk density);values are the mean and range
a Data reported in Noe et al. 2013
River Site Latitude (° N) Salinity LOIa Bulk densitya
(g cm−3)Longitude (° W) (%)
Waccamaw Tidal freshwater forest 33.5552
79.0897
0.09
0–0.15
51.7
41.6–68.2
0.19
0.12–0.31
Waccamaw Moderately salt-impacted forest 33.4225
79.2074
1.48
0.4–4.85
51.1
42.8–75.7
0.24
0.16–0.31
Waccamaw Heavily salt-impacted forest 33.3400
79.3421
2.27
0.93–5.35
43.7
12.6–62.4
0.32
0.15–0.65
Waccamaw Oligohaline marsh 33.35003
79.34491
3.68
0.68–9.45
34.8
21.9–40.3
0.28
0.19–0.38
Savannah Tidal freshwater forest 32.2387
81.1563
0.10
0.08–0.13
34.6
22.0–45.6
0.27
0.17–0.35
Savannah Moderately salt-impacted forest 32.1757
81.1442
1.43
0.35–6.85
46.4
33.3–55.9
0.25
0.17–0.43
Savannah Heavily salt-impacted forest 32.1673
81.1369
3.24
1.35–5.33
21.2
15.7–30.7
0.39
0.35–0.49
Savannah Oligohaline marsh 32.1672
81.1364
3.44
1.1–7.1
31.5
18.8–52.2
0.30
0.17–0.37
Table 3 Species composition and net annual primary production (NAPP; ±standard error) of the herbaceous community in each study site
River Habitat Species NAPP(g m−2 year−1)
Waccamaw Tidal freshwater forest Cardamine hirsuta, Carex lupiolina, Cicuta maculate , Hydrocotyle bonariensis , Irishexagona, Justica ovata, Leersia oryzoides , Murdannia keisak, Peltandravirginica, Pilea fontana , Polygonum arifolium , Polygonum persicaria, Saururuscernuus, Tradenum walterii
104 (18)
Waccamaw Moderately salt-impacted forest Alternanthera philoxeroides , Cardamine hirsuta , Cicuta maculata , Hydrocotylebonariensis, Hymenocallis floridana, Juncus marginatus , Muridannia keisak,Peltandra virginica, Polygonum arifolium , Polygonum persicaria, Pontaderiacordata, Ptilimnium costatum, Schoenoplectus tabernaemontani , Solidagosempervirens, Zizania miliacea
357 (59)
Waccamaw Heavily salt-impacted forest Lilaeopsis chinensis , Saggitaria lancifolia , Schoenoplectus montevidensis , Scirpusrobustus, Typha angustifolia
430 (59)
Waccamaw Oligohaline marsh Typha latifolia, Scirpus robustus , Schoenoplectus montevidensis 1,112 (133)
Savannah Tidal freshwater forest Bigonia caprilolata , Cardamine hirsuta , Clematis crispa , Commelina virginica ,Cyperus sp., Decumaria barbara , Hydrocotyle bonariensis , Hymenocalusfloridans , Iris haxagona , Peltandra virginica, Phanopyrum gymnocarpon ,Polygonum arifolium , Ranunculus sp., Saururus cernuus, Smilax walterii ,Toxicodendron radicans , Triadenum walterii , Viola sp.
187 (35)
Savannah Moderately salt-impacted forest Eleocharis sp., Iris hexagona, Lilaeopsis chinensis , Orontium aquaticum, Peltandravirginica, Phanopyrum gymnocarpon, Polygonum persicaria, Pontadera cordata ,Sarurus cernuus, Scirpus robustus, Smilax bona-nox , Smilax walterii
194 (38)
Savannah Heavily salt-impacted forest Alternanthera philoxeroides , Polygonum glabrum , Schoenoplectus tabernaemontani ,Scirpus robustus, Spartina cynosuroides , Typha angustifolia
1,728 (231)
Savannah Oligohaline marsh Carex sp., Carex lupoilina , Cicuta maculata ,Murdannia keisak, Peltandra virginica,Pilea fontana , Schoenoplectus tabernaemontani , Spartina cynosuroides , Tradenumwalterii , Typha angustifolia
1,238 (150)
Estuaries and Coasts
Author's personal copy
T. distichum and N. biflora , and the introduction ofoligohaline marsh species. The highly salt-impacted forestswere composed of a monoculture of living and dead T.distichum and an understory of oligohaline marsh plants.The marshes were composed solely of emergent herbaceousspecies, and were representative of healthy oligohaline marshcommunities in the area. A detailed description of the foreststructure at all sites as well as surficial hydrology and biogeo-chemistry are provided in Cormier et al. (2013), Noe et al.(2013), and Krauss et al. (2009).
Sediment Accretion and Characterization
Accretion of sediment at each site was measured along threetransects perpendicular to the river channel and separated by50–100 m. Transects ranged in length from 50 to 80 m, withfive plots located equidistant along each transect, beginning5 m from the channel. Comparison between accretion inhummocks and hollows was made by use of five paired plotsin tidal freshwater forest sites in each river. At each plot,a 2-cm deep, 50-cm wide marker horizon was created byusing white feldspar clay powder (Minspar 200, TheQuartz Corp, Spruce Pine, NC). The clay becomes a firm,durable marker after it absorbs water, and allows accuratemeasurement of short-term net vertical accretion rates abovethe clay surface (Hupp and Bazemore 1993). Feldspar clayalso accommodates fine root growth to facilitate sedimentparticle retention, as would occur naturally. The depth ofburial of the marker horizons was determined by slicingvertically through the horizon with a knife and twisting theblade to allow insertion of a ruler to measure the depth of theclay layer. Marker horizons were installed in September 2009and measured in March 2012. Repeated measurement ofvertical accretion by multiple observers was used to developa 95 % confidence interval of measurement precision.Surficial sediments (0–5 cm) at each site were assayed forpercent organic material (loss on ignition, LOI) and bulkdensity (Noe et al. 2013). Twelve sediment samples from eachsite were dried to a constant weight at 60 °C and thencombusted at 550 °C for 4 h to remove organic matter.Sediment organic fraction and bulk density were used tointerpret the contribution of allochthonous mineral matterversus organic matter to sediment accretion.
Topography and Inundation
Vented pressure transducers (Infinities USA, Port Orange,Florida, USA) were installed 1-m deep in a 7.6-cm diameterPVC pipe that was backfilled with gravel around the pipe. Onetransducer was installed near the middle of each site in a lowelevation area. Water depth was logged at 1-h intervals andfiltered using a 4-h moving average to remove brief periods ofinundation resulting from heavy rainfall that might pond on
the wetland. The elevation of each feldspar pad was surveyedrelative to the pressure transducer by means of an auto-leveland rod. Water level recorded at the well was extrapolated toeach pad to allow calculation of the frequency and duration ofinundation (submergence) at each pad.
In addition to the water level monitoring wells, fourgroundwater salinity monitoring wells were installed at eachsite by use of screened 3.2 cm diameter PVC pipe installed to0.6 m depth and backfilled with gravel. Two wells were sited15 m from the channel and two others were sited 35 m fromthe channel. Salinity was measured monthly by using a YSIModel 30 after the well was first pumped dry and allowed torefill with soil pore water. Further details on pore watersampling are provided in Cormier et al. (2013).
Litterfall, Herbaceous Production, Temperature, and Salinity
Canopy litterfall was measured in ten, 0.25 m2 traps placedsystematically and evenly across each site; leaves, reproduc-tive parts, and branches were collected, dried, and weighted.Traps were emptied monthly from September 2009 throughDecember 2010; sampling was not performed in June2010 at Waccamaw heavily salt-impacted forest and atSavannah moderately and heavily salt-impacted forests,or in December 2010 at Waccamaw tidal freshwater andmoderately salt-impacted forests. Further details on canopylitterfall sampling are provided in Cormier et al. (2013).
Understory production was estimated by harvesting herba-ceous plants quarterly over a period of 1 year (April 2011–April 2012) and summing the change in live and dead biomassfrom all sampling intervals to generate a rate of production(g m−2 year−1) (Smalley 1959). Herbaceous plants were har-vested along two transects that were perpendicular to the riverchannel, 25 m in length, and separated by 50–100 m. Five0.25 m2 plots were randomly located along each transect.Species within the plot were identified before harvest. Allplant material was sorted into live and dead biomass, driedat 60 °C for 3–5 days and weighed.
Organic and inorganic sediment accumulation was com-pared with above-ground autochthonous tree and herbaceouslitter production. The annual areal rate of organic sedimentaccumulation was calculated as the product of LOI/100, bulkdensity, and accretion rate. Annual areal rate of inorganicsediment accumulation was calculated as the product of 1-LOI/100, bulk density, and accretion rate. Canopy litterfalldata from September 2009 through August 2010 were used tocalculate an annual average rate, and this was added to theannual herbaceous production rate.
Statistical Analyses
Analysis of variance (ANOVA) was performed to test whethersediment accretion differed between wetland habitats, and
Estuaries and Coasts
Author's personal copy
whether sediment accretion differed between rivers drainingPiedmont versus Coastal Plain watersheds. An additionalvariable, distance from the river channel, was added to theanalysis to examine its relationship to sediment accretionrate. A paired t test was used to examine the differencebetween sediment accretion in hummocks versus hollows.Linear regression was used to compare the relationshipsbetween sediment accretion rates, accumulation rates, andautochthonous production. Sediment accretion data werenormalized by square root transformation and equality ofvariance was examined by use of Bartlett’s test to meet theparametric assumptions. Simplification of the ANOVAmodelswas performed by using sequential F tests (α =0.05) andAkaike Information Criterion (AIC) in order to reduce thenumber of explanatory variables and thereby increase statisticalpower of the tests. All statistical analyses were performed byuse of R (R Core Development Team 2011).
Results
Sediment Accretion
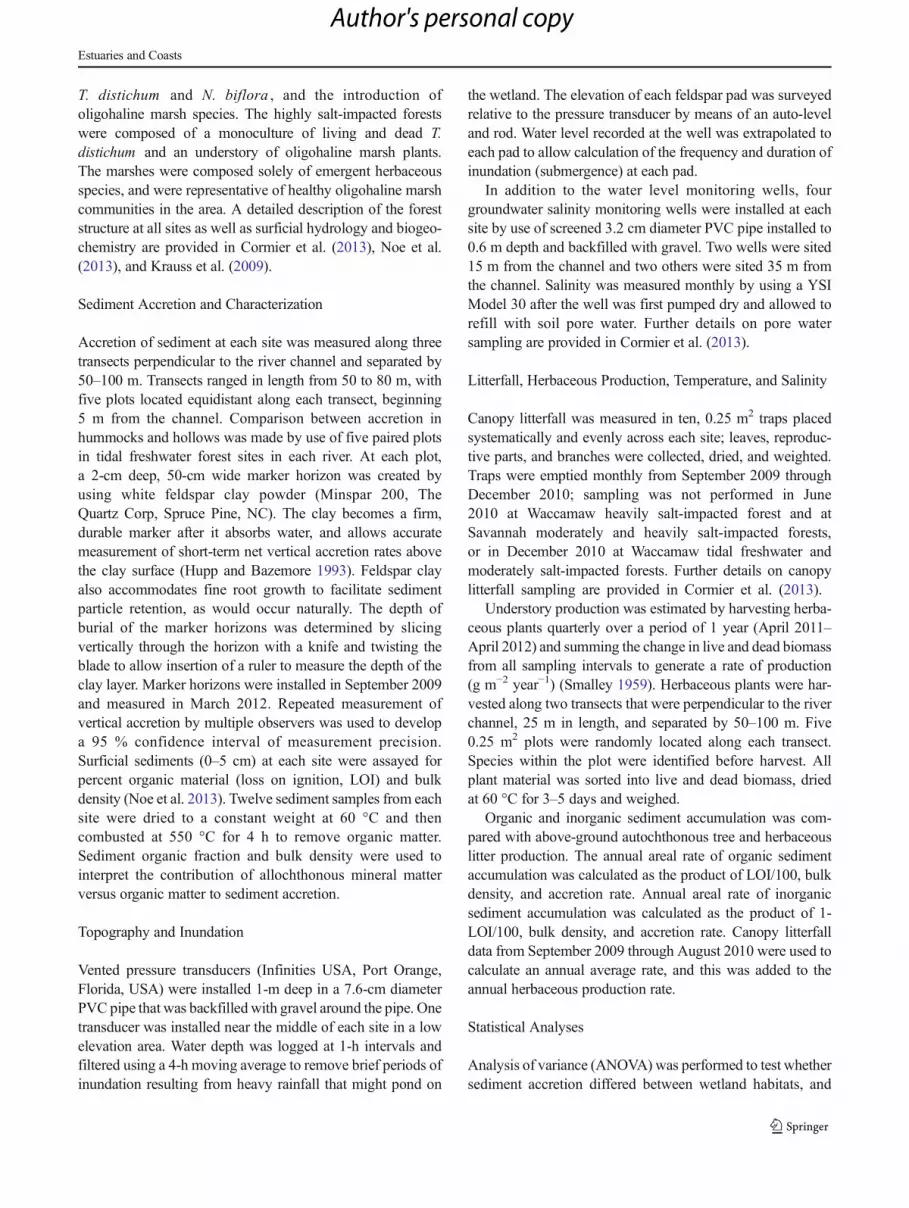
Mean accretion rates on the Savannah River were 6 mm year−1
(tidal freshwater forest), 4.5 mm year−1 (moderately salt-impacted forest), 19.1 mm year−1 (heavily salt-impacted
forest), and 15.2 mm year−1 (marsh; Fig. 2). Mean accre-tion rates on the Waccamaw River were 7.4 mm year−1
(tidal freshwater forest), 10.1 mm year−1 (moderately salt-impacted forest), 7.5 mm year−1 (heavily salt-impactedforest), and 11.4 mm year−1 (marsh). On the SavannahRiver sites, three pads at the tidal freshwater forest andone pad at the heavily salt-impacted forest were not found,and on the Waccamaw River two pads at the moderatelysalt-impacted forest, three pads at the heavily salt-impactedforest, and three pads at the marsh were not found. Markerpads are sometimes lost to erosion at low elevations, andtherefore the mean rates for these sites may be slightlybiased (12 out of 125 were not found) toward higheraccretion (Cahoon and Lynch 1997).
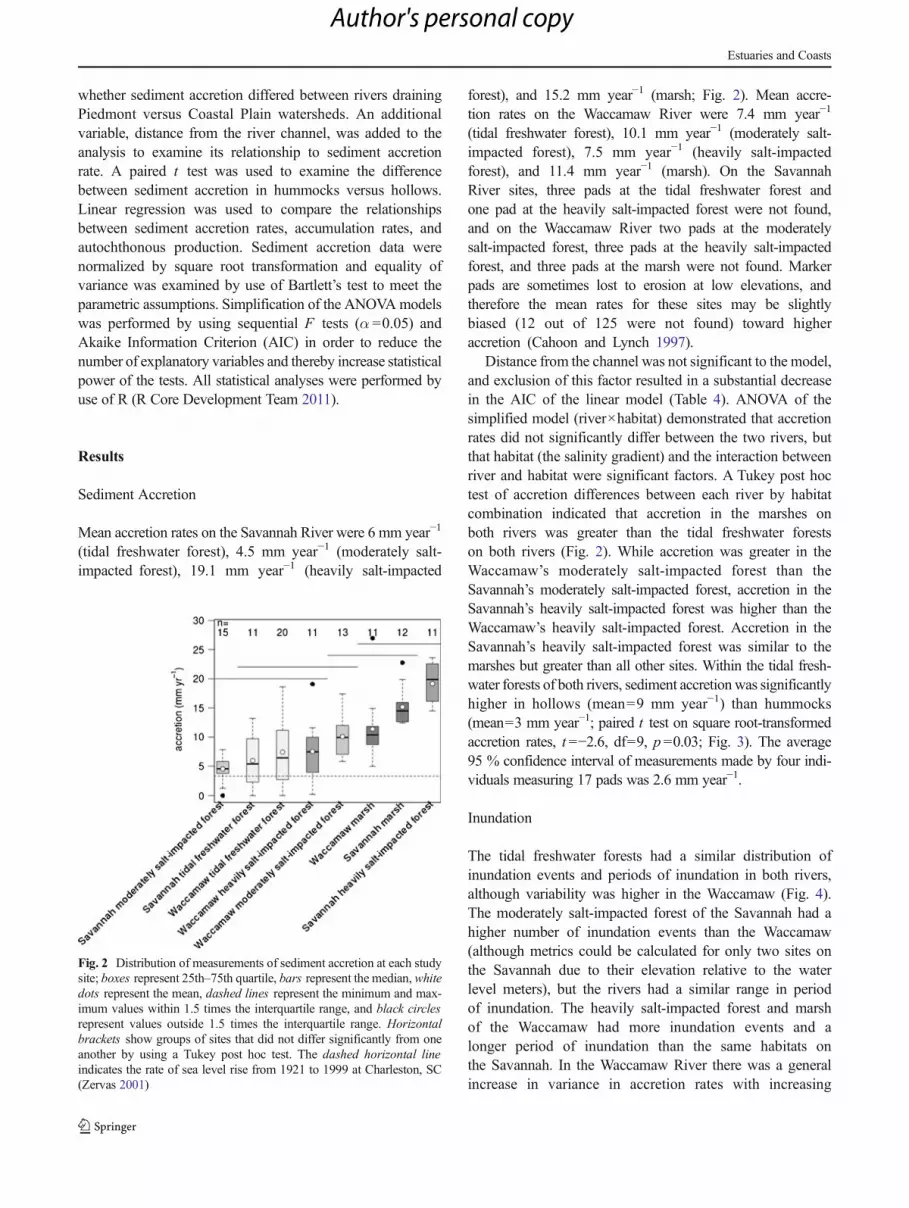
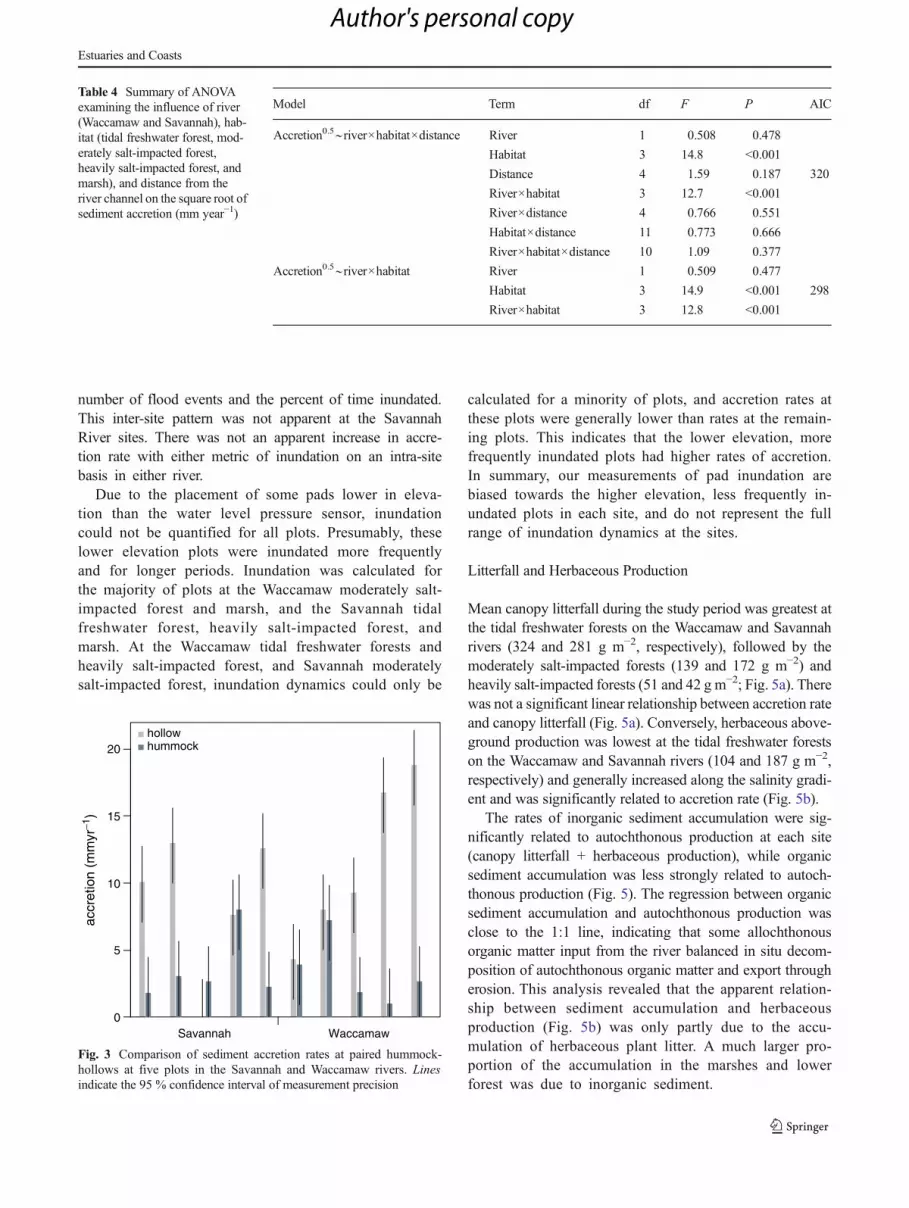
Distance from the channel was not significant to the model,and exclusion of this factor resulted in a substantial decreasein the AIC of the linear model (Table 4). ANOVA of thesimplified model (river×habitat) demonstrated that accretionrates did not significantly differ between the two rivers, butthat habitat (the salinity gradient) and the interaction betweenriver and habitat were significant factors. A Tukey post hoctest of accretion differences between each river by habitatcombination indicated that accretion in the marshes onboth rivers was greater than the tidal freshwater forestson both rivers (Fig. 2). While accretion was greater in theWaccamaw’s moderately salt-impacted forest than theSavannah’s moderately salt-impacted forest, accretion in theSavannah’s heavily salt-impacted forest was higher than theWaccamaw’s heavily salt-impacted forest. Accretion in theSavannah’s heavily salt-impacted forest was similar to themarshes but greater than all other sites. Within the tidal fresh-water forests of both rivers, sediment accretionwas significantlyhigher in hollows (mean=9 mm year−1) than hummocks(mean=3 mm year−1; paired t test on square root-transformedaccretion rates, t =−2.6, df=9, p=0.03; Fig. 3). The average95 % confidence interval of measurements made by four indi-viduals measuring 17 pads was 2.6 mm year−1.
Inundation
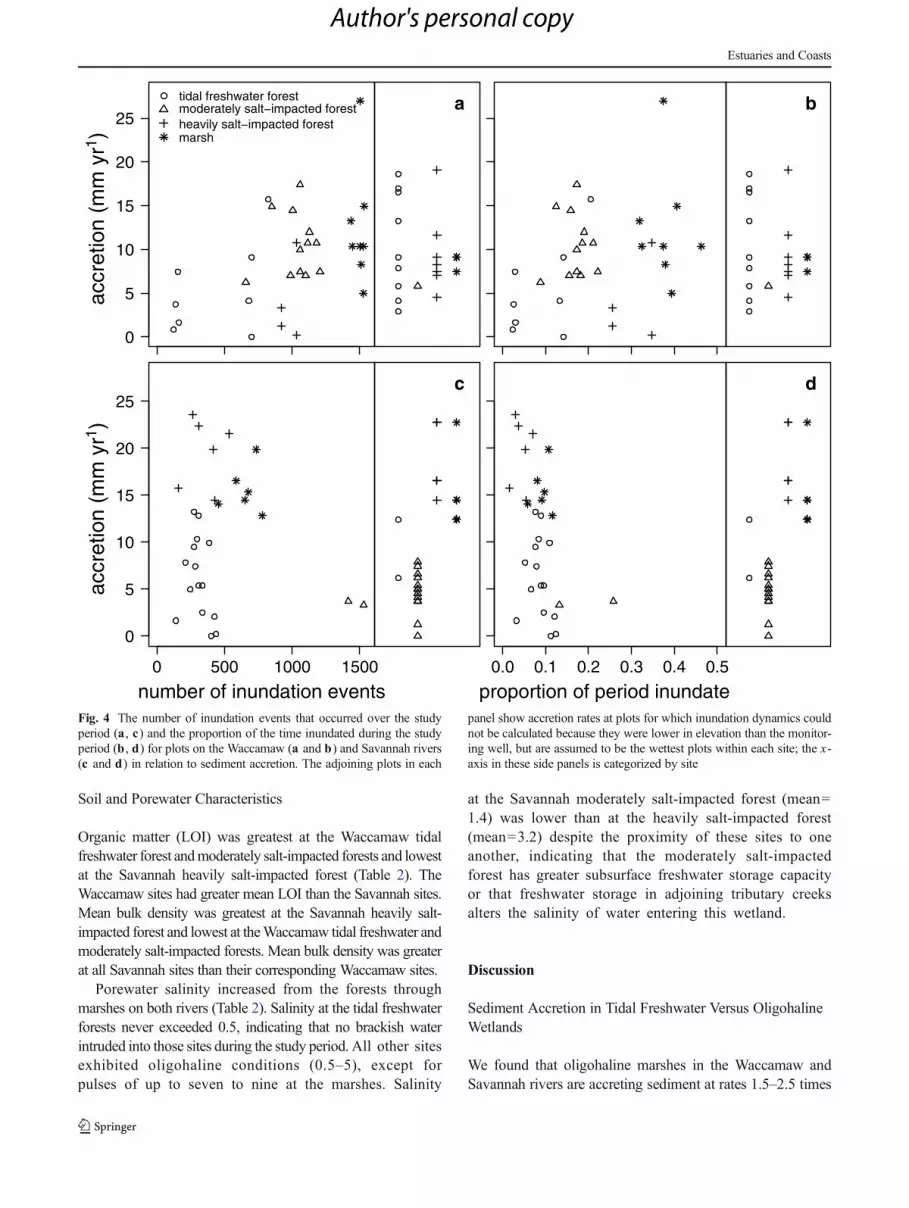
The tidal freshwater forests had a similar distribution ofinundation events and periods of inundation in both rivers,although variability was higher in the Waccamaw (Fig. 4).The moderately salt-impacted forest of the Savannah had ahigher number of inundation events than the Waccamaw(although metrics could be calculated for only two sites onthe Savannah due to their elevation relative to the waterlevel meters), but the rivers had a similar range in periodof inundation. The heavily salt-impacted forest and marshof the Waccamaw had more inundation events and alonger period of inundation than the same habitats onthe Savannah. In the Waccamaw River there was a generalincrease in variance in accretion rates with increasing
Fig. 2 Distribution of measurements of sediment accretion at each studysite; boxes represent 25th–75th quartile, bars represent the median,whitedots represent the mean, dashed lines represent the minimum and max-imum values within 1.5 times the interquartile range, and black circlesrepresent values outside 1.5 times the interquartile range. Horizontalbrackets show groups of sites that did not differ significantly from oneanother by using a Tukey post hoc test. The dashed horizontal lineindicates the rate of sea level rise from 1921 to 1999 at Charleston, SC(Zervas 2001)
Estuaries and Coasts
Author's personal copy
number of flood events and the percent of time inundated.This inter-site pattern was not apparent at the SavannahRiver sites. There was not an apparent increase in accre-tion rate with either metric of inundation on an intra-sitebasis in either river.
Due to the placement of some pads lower in eleva-tion than the water level pressure sensor, inundationcould not be quantified for all plots. Presumably, theselower elevation plots were inundated more frequentlyand for longer periods. Inundation was calculated forthe majority of plots at the Waccamaw moderately salt-impacted forest and marsh, and the Savannah tidalfreshwater forest, heavily salt-impacted forest, andmarsh. At the Waccamaw tidal freshwater forests andheavily salt-impacted forest, and Savannah moderatelysalt-impacted forest, inundation dynamics could only be
calculated for a minority of plots, and accretion rates atthese plots were generally lower than rates at the remain-ing plots. This indicates that the lower elevation, morefrequently inundated plots had higher rates of accretion.In summary, our measurements of pad inundation arebiased towards the higher elevation, less frequently in-undated plots in each site, and do not represent the fullrange of inundation dynamics at the sites.
Litterfall and Herbaceous Production
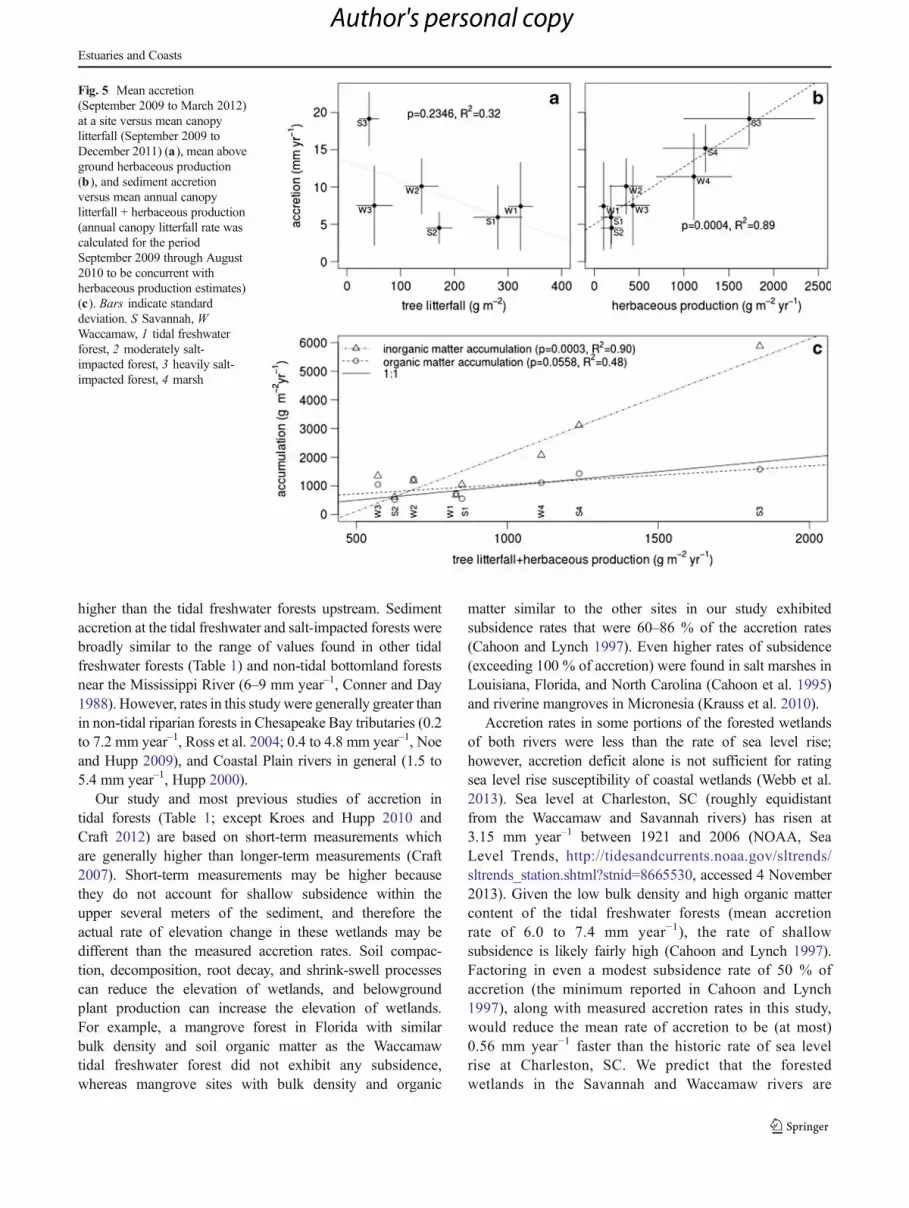
Mean canopy litterfall during the study period was greatest atthe tidal freshwater forests on the Waccamaw and Savannahrivers (324 and 281 g m−2, respectively), followed by themoderately salt-impacted forests (139 and 172 g m−2) andheavily salt-impacted forests (51 and 42 g m−2; Fig. 5a). Therewas not a significant linear relationship between accretion rateand canopy litterfall (Fig. 5a). Conversely, herbaceous above-ground production was lowest at the tidal freshwater forestson the Waccamaw and Savannah rivers (104 and 187 g m−2,respectively) and generally increased along the salinity gradi-ent and was significantly related to accretion rate (Fig. 5b).
The rates of inorganic sediment accumulation were sig-nificantly related to autochthonous production at each site(canopy litterfall + herbaceous production), while organicsediment accumulation was less strongly related to autoch-thonous production (Fig. 5). The regression between organicsediment accumulation and autochthonous production wasclose to the 1:1 line, indicating that some allochthonousorganic matter input from the river balanced in situ decom-position of autochthonous organic matter and export througherosion. This analysis revealed that the apparent relation-ship between sediment accumulation and herbaceousproduction (Fig. 5b) was only partly due to the accu-mulation of herbaceous plant litter. A much larger pro-portion of the accumulation in the marshes and lowerforest was due to inorganic sediment.
Table 4 Summary of ANOVAexamining the influence of river(Waccamaw and Savannah), hab-itat (tidal freshwater forest, mod-erately salt-impacted forest,heavily salt-impacted forest, andmarsh), and distance from theriver channel on the square root ofsediment accretion (mm year−1)
Model Term df F P AIC
Accretion0.5∼river×habitat×distance River 1 0.508 0.478
Habitat 3 14.8 <0.001
Distance 4 1.59 0.187 320
River×habitat 3 12.7 <0.001
River×distance 4 0.766 0.551
Habitat×distance 11 0.773 0.666
River×habitat×distance 10 1.09 0.377
Accretion0.5∼river×habitat River 1 0.509 0.477
Habitat 3 14.9 <0.001 298
River×habitat 3 12.8 <0.001
0
5
10
15
20
accr
etio
n (m
myr
−1)
Savannah Waccamaw
hollowhummock
Fig. 3 Comparison of sediment accretion rates at paired hummock-hollows at five plots in the Savannah and Waccamaw rivers. Linesindicate the 95 % confidence interval of measurement precision
Estuaries and Coasts
Author's personal copy
Soil and Porewater Characteristics
Organic matter (LOI) was greatest at the Waccamaw tidalfreshwater forest andmoderately salt-impacted forests and lowestat the Savannah heavily salt-impacted forest (Table 2). TheWaccamaw sites had greater mean LOI than the Savannah sites.Mean bulk density was greatest at the Savannah heavily salt-impacted forest and lowest at theWaccamaw tidal freshwater andmoderately salt-impacted forests. Mean bulk density was greaterat all Savannah sites than their corresponding Waccamaw sites.
Porewater salinity increased from the forests throughmarshes on both rivers (Table 2). Salinity at the tidal freshwaterforests never exceeded 0.5, indicating that no brackish waterintruded into those sites during the study period. All other sitesexhibited oligohaline conditions (0.5–5), except forpulses of up to seven to nine at the marshes. Salinity
at the Savannah moderately salt-impacted forest (mean=1.4) was lower than at the heavily salt-impacted forest(mean=3.2) despite the proximity of these sites to oneanother, indicating that the moderately salt-impactedforest has greater subsurface freshwater storage capacityor that freshwater storage in adjoining tributary creeksalters the salinity of water entering this wetland.
Discussion
Sediment Accretion in Tidal Freshwater Versus OligohalineWetlands
We found that oligohaline marshes in the Waccamaw andSavannah rivers are accreting sediment at rates 1.5–2.5 times
0
5
10
15
20
25ac
cret
ion
(mm
yr1 )
tidal freshwater forestmoderately salt−impacted forestheavily salt−impacted forestmarsh
0 500 1000 1500
number of inundation events
0
5
10
15
20
25
accr
etio
n (m
m y
r1 )a
c
0.0 0.1 0.2 0.3 0.4 0.5
proportion of period inundate
b
d
Fig. 4 The number of inundation events that occurred over the studyperiod (a , c) and the proportion of the time inundated during the studyperiod (b , d) for plots on the Waccamaw (a and b) and Savannah rivers(c and d) in relation to sediment accretion. The adjoining plots in each
panel show accretion rates at plots for which inundation dynamics couldnot be calculated because they were lower in elevation than the monitor-ing well, but are assumed to be the wettest plots within each site; the x-axis in these side panels is categorized by site
Estuaries and Coasts
Author's personal copy
higher than the tidal freshwater forests upstream. Sedimentaccretion at the tidal freshwater and salt-impacted forests werebroadly similar to the range of values found in other tidalfreshwater forests (Table 1) and non-tidal bottomland forestsnear the Mississippi River (6–9 mm year–1, Conner and Day1988). However, rates in this studywere generally greater thanin non-tidal riparian forests in Chesapeake Bay tributaries (0.2to 7.2 mm year–1, Ross et al. 2004; 0.4 to 4.8 mm year–1, Noeand Hupp 2009), and Coastal Plain rivers in general (1.5 to5.4 mm year–1, Hupp 2000).
Our study and most previous studies of accretion intidal forests (Table 1; except Kroes and Hupp 2010 andCraft 2012) are based on short-term measurements whichare generally higher than longer-term measurements (Craft2007). Short-term measurements may be higher becausethey do not account for shallow subsidence within theupper several meters of the sediment, and therefore theactual rate of elevation change in these wetlands may bedifferent than the measured accretion rates. Soil compac-tion, decomposition, root decay, and shrink-swell processescan reduce the elevation of wetlands, and belowgroundplant production can increase the elevation of wetlands.For example, a mangrove forest in Florida with similarbulk density and soil organic matter as the Waccamawtidal freshwater forest did not exhibit any subsidence,whereas mangrove sites with bulk density and organic
matter similar to the other sites in our study exhibitedsubsidence rates that were 60–86 % of the accretion rates(Cahoon and Lynch 1997). Even higher rates of subsidence(exceeding 100 % of accretion) were found in salt marshes inLouisiana, Florida, and North Carolina (Cahoon et al. 1995)and riverine mangroves in Micronesia (Krauss et al. 2010).
Accretion rates in some portions of the forested wetlandsof both rivers were less than the rate of sea level rise;however, accretion deficit alone is not sufficient for ratingsea level rise susceptibility of coastal wetlands (Webb et al.2013). Sea level at Charleston, SC (roughly equidistantfrom the Waccamaw and Savannah rivers) has risen at3.15 mm year–1 between 1921 and 2006 (NOAA, SeaLevel Trends, http://tidesandcurrents.noaa.gov/sltrends/sltrends_station.shtml?stnid=8665530, accessed 4 November2013). Given the low bulk density and high organic mattercontent of the tidal freshwater forests (mean accretionrate of 6.0 to 7.4 mm year−1), the rate of shallowsubsidence is likely fairly high (Cahoon and Lynch 1997).Factoring in even a modest subsidence rate of 50 % ofaccretion (the minimum reported in Cahoon and Lynch1997), along with measured accretion rates in this study,would reduce the mean rate of accretion to be (at most)0.56 mm year−1 faster than the historic rate of sea levelrise at Charleston, SC. We predict that the forestedwetlands in the Savannah and Waccamaw rivers are
Fig. 5 Mean accretion(September 2009 to March 2012)at a site versus mean canopylitterfall (September 2009 toDecember 2011) (a), mean aboveground herbaceous production(b), and sediment accretionversus mean annual canopylitterfall + herbaceous production(annual canopy litterfall rate wascalculated for the periodSeptember 2009 through August2010 to be concurrent withherbaceous production estimates)(c). Bars indicate standarddeviation. S Savannah, WWaccamaw, 1 tidal freshwaterforest, 2 moderately salt-impacted forest, 3 heavily salt-impacted forest, 4 marsh
Estuaries and Coasts
Author's personal copy
very susceptible to submergence if the rate of sea levelrise increases, a fate also observed for tidal freshwaterforests in Georgia by Craft (2012).
Tidal Wetland Sediment Accretion in Piedmont VersusCoastal Plain Rivers
We expected to find differences in accretion rate between aPiedmont (Savannah) and Coastal Plain (Waccamaw) river,but there was no overall difference between these systems.The only significant difference in accretion rate between therivers involved an interaction between river and habitattype. Our expectations were based on previous compari-sons in accretion rate between Coastal Plain and Piedmontrivers (Noe and Hupp 2009), and the corresponding highersediment load in Piedmont rivers (Hupp 2000). The pre-dicted sediment yield from the Savannah watershed(44 t km−2 year−1, McCarney-Castle et al. 2010) is fargreater than the Waccamaw watershed sediment yield of14 t km−2 year−1 (Phillips 1991). These differences occurdespite the fact that reservoir trapping following damconstruction on the Savannah River was predicted toreduce the sediment load by 69 % (McCarney-Castleet al. 2010). The lower LOI and higher bulk density offloodplain sediments on the Savannah than Waccamawfurther highlight the difference in suspended sedimentcharacteristics between the rivers, with the Savannah hav-ing a greater mineral versus organic content.
Our inability to detect a difference in accretion rate betweenthe Waccamaw and Savannah rivers may be in part due tothree factors which we did not measure. First, sediment load inthe portion of the Coastal Plain Waccamaw River we studiedis influenced by an anabranch channel of the neighboring PeeDee River (draining a Piedmont watershed). Thus, our sites onthe Coastal Plain, Waccamaw River have a Piedmont sedi-ment source that may have increased the similarity in sedi-ment accretion between the Waccamaw and Savannah.Second, both the Waccamaw (Goñi et al. 2009) andSavannah rivers (Mulholland and Olsen 1992) exhibit tidalflood-dominant sediment transport in their saline reaches,meaning that there is a net upstream movement of sedimentfrom the lower estuary to the upper estuary. Flood-dominantsediment transport is a common condition in many estuaries(Meade 1969), but it is not clear how far upstream this phe-nomenon extends relative to our study sites and to what extentthis process contributes to over-bank deposition of material onthe floodplain. Third, the estuarine turbidity maximum (ETM)likely occurs within the oligohaline-to-mesohaline portion ofboth rivers and may influence in-channel suspended sedimentand subsequent overbank deposition. Previous studies of sed-iment accretion in tidal wetlands have attributed higher flood-plain accretion to proximity to the ETM (Darke andMegonigal 2003), and this phenomenon may over-shadow
differences in suspended sediment concentration that resultfrom watershed origin.
Relative to non-tidal riparian wetlands, tidal riparian wetlandsappear to be buffered from watershed-derived sediment andconcomitant riparian sediment deposition. With up to 100 % ofthe watershed-derived sediment load potentially trapped by non-tidal riparian floodplains (Noe and Hupp 2009), relatively littlesediment may be transported through the river network to thetidal zone. In the Pee Dee River, a Piedmont river that joins theWaccamaw near our study sites, only 4 % of the watershed-derived sediment was estimated to reach the estuary (Phillips1992). The Cape Fear River, a tidal river draining a Piedmontwatershed, has little inorganic sediment of Piedmont mineralogyin its floodplain, with the majority of the floodplain sedimentoriginating from the lower Coastal Plain (Benedetti et al. 2006).There are circumstances when significant watershed-derivedsediment does reach the tidal zone, such as during intensiveagricultural land clearing in the 1800s and more recent silvicul-tural activity (Hilgartner and Brush 2006), and during extremeriver discharge events (Ensign et al. 2013). Future research isneeded to identify thresholds in watershed and stream networksize, river transport capacity, and floodplain accommodationspace that govern the geomorphic connectivity between water-sheds and tidal rivers.
Processes Governing Sediment Accretion in Tidal Wetlands
Processes occurring at the habitat scale (the distance separatingour study sites, 1–10 km) were the major factors affectingaccretion rate. This is best exemplified by the contrast inaccretion rates occurring on the Savannah River where themaximum and minimum accretion rates observed in the studyoccurred between two sites less than 2 km apart. This contrastmay be due to the large difference in autochthonous productionbetween these two sites. While autochthonous litter productionat the Savannah heavily salt-impacted forest was the highest inthe study, organic sediment at that site constituted a smallproportion of overall accretion (21 %). In contrast, autochtho-nous litter production at the Savannahmoderately salt-impactedforest was the second lowest in the study but organic sedimentat this site constituted 46 % of overall accretion. The higherstem and litter density at the heavily salt-impacted forests mayhave indirectly contributed to sediment accretion by increasingsurface roughness of the floodplain which enhanced depositionof inorganic suspended sediment during tidal inundation(Leonard 1997; Pasternack and Brush 2002).
Inorganic sediment was primarily responsible for the dif-ference in sediment accretion between forest and marsh(Fig. 5c). This indicates greater inorganic suspended sedimentconcentration (SSC) in water inundating the marshes or morefrequent inundation and subsequent deposition. Previous stud-ies have identified sediment concentration of in-flowing wateras a determinant of marsh accretion rate (Temmerman et al.
Estuaries and Coasts
Author's personal copy
2004), although differences in channel SSC were not mea-sured in this study. We speculate that the oligohaline marshes(and adjoining Savannah heavily salt-impacted forest) werecloser to the ETM and this zone of both rivers had flood-dominant sediment transport occurring (Meade 1969) andtherefore inorganic SSC was greater at these sites.
We did not find evidence that frequency or duration ofinundation were related to accretion of either inorganicor total material. The site with the greatest number ofinundation events and longest period of inundation(Savannah moderately salt-impacted forest) was also thesite with negligible inorganic sediment deposition.Furthermore, no measure of inundation dynamics exhibitedany obvious intra-site relationship with accretion rate. Wealso investigated the relationship between proximity to thechannel and accretion, expecting to find higher accretionat plots closer to the channel and exposed to highersuspended sediment concentration based on previous re-search in tidal forested wetlands (Ross et al. 2004; Kroeset al. 2007), non-tidal coastal plain riparian wetlands(Hupp 2000), and tidal freshwater marshes (Palinkaset al. 2013). However, proximity of plots to the channelwas not a significant factor in the ANOVA model. Inreconciling these results with our expectations, it shouldbe emphasized that we measured net accretion. Whileplots closer to the river may be inundated more frequentlyand with higher sediment concentration, they are alsoexposed to potentially higher flow velocity and greatererosion.
There was significantly greater sediment accretion in hol-lows than hummocks. More anaerobic soils (Noe et al. 2013)and subsequently slower decomposition in hollows than hum-mocks (Courtwright and Findlay 2011) may explain the dif-ferences in sediment accretion we observed. Alternatively,erosion of sediment from higher elevation (hummocks) tolower elevation (hollows) may contribute to higher sedimentaccretion in hollows, but we expect this redistribution processis counteracted by other mechanisms involving feedbacksbetween vegetation and biogeochemistry that result in thelong-term maintenance of this topographic pattern (Noe2013). Since greater inputs of new sediment to hollows areopposite to the processes necessary to generate higher hum-mocks and lower hollows, more information is needed on thefactors affecting both shallow subsidence as well as rootgrowth to explain the formation and maintenance of thistopographic pattern in tidal freshwater forests.
Feedbacks and Morphodynamics of Tidal Rivers
Feedbacks in ecological and geomorphic systems play a crit-ical role in the evolution of landforms (Murray et al. 2008;Noe 2013). Data from this study provide insight on onepotential feedback highlighted in our conceptual model
(Fig. 1). Succession of forest to marsh occurs at salinity of∼2, and results in significant declines in canopy litterfallproduction, lower tree basal area increments, lower tree den-sities, and a greater number of dead trees (Yanosky et al. 1995;Krauss et al. 2009; Cormier et al. 2013). Simultaneous in-creases in herbaceous marsh production (Chabreck andLinscombe 1982; McKee and Mendelssohn 1989; thisstudy) and roughness reduce surface water flow velocityand result in higher sediment settling rates (Leonard 1997)compared to the freshwater forests with low ground cover.This influx of inorganic sediment and sorbed nitrogen andphosphorus may stimulate marsh production, organic matteraccretion, and subsequent inorganic sediment depositionin a positive feedback on wetland elevation. A similarfeedback mechanism has been identified in models ofsalt marsh elevation change (Morris et al. 2002; Kirwanand Murray 2007).
In contrast, salinity may also contribute to a positive bio-geochemical feedback on subsidence in tidal forests. Thecontribution of sulfate to soil porewater can increase microbialrespiration (Neubauer 2013), contributing to shallow subsi-dence of wetland sediments (Cahoon and Lynch 1997). Treemortality associated with salinification of tidal forests alsostimulates soil nitrogen mineralization and likely enhancesshallow subsidence (Noe et al. 2013). As subsidence occursand inundation frequency increases, increased soil redox cycling(Ensign et al. 2008) drives further mineralization, subsidence,and expansion of saline water into tidal wetlands.
These feedbacks between salinity and wetland elevationoccur at the scale of a wetland plant community, marshes inthe first example and forests in the second, where saltwaterintrusion is an independent factor. At broader spatial andtemporal scales salinity intrusion up-river into the tidal fresh-water rivers is dependent on river morphology. The volumeof the channel and intertidal zone, together with the tidaldynamics and freshwater river discharge, govern the longitu-dinal salinity profile of an estuary. As tidal wetlands aresubmerged and shorelines erode as sea level rises, volume ofthe estuary and salinity intrusion increase. Therefore, feed-backs between salinity and wetland elevation at the habitatlevel may influence longer-term feedbacks between salinityand estuarine morphology. The low rate of sediment accretionin the tidal freshwater forests relative to sea level rise mayresult in gradually larger intertidal volume and propagation ofsalinity upstream. Quantification of these feedbacks throughfield data, mathematical modeling, and experimentation isneeded to improve existing models (e.g., Brinson et al. 1995)of tidal landscape evolution.
Acknowledgments We thank Jackie Batson, Ed Schenk, Nick Ostroski,Nicole Cormier, and Sara Ulrich for field and laboratory assistance. Supportwas provided by theU.S. Geological SurveyClimate and LandUseChangeResearch and Development Program, U.S. Geological Survey National
Estuaries and Coasts
Author's personal copy
Research Program, the U.S. Geological Survey Mendenhall ResearchFellowship Program, and Aquatic Analysis and Consulting, LLC. Anyuse of trade, firm, or product names is for descriptive purposes only anddoes not imply endorsement by the U.S. Government.
References
Baldwin, A.H. 2007. Vegetation and seed bank studies of salt-pulsedswamps of the Nanticoke River, Chesapeake Bay. In Ecology oftidal freshwater forested wetlands of the Southeastern United States ,ed.W.H. Connor, T.W. Doyle, and K.W. Krauss, 139–160. Springer:Netherlands.
Barendregt, A., D. Whigham, and A. Baldwin. 2009. Tidal freshwaterwetlands . Backhuys: Leiden.
Benedetti, M., M. Raber, M. Smith, and L. Leonard. 2006. Mineralogicalindicators of alluvial sediment sources in the Cape Fear River Basin,North Carolina. Physical Geography 27: 258–281.
Brinson, M., R. Christian, and L. Blum. 1995. Multiple states in the sea-level induced transition from terrestrial forest to estuary. Estuariesand Coasts 18: 648–659.
Cahoon, D.R., and J.C. Lynch. 1997. Vertical accretion and shallowsubsidence in a mangrove forest of southwestern Florida, U.S.A.Mangroves and Salt Marshes 1: 173–186.
Cahoon, D.R., D.J. Reed, and J.W. Day Jr. 1995. Estimating shallowsubsidence in microtidal salt marshes of the southeastern UnitedStates: Kaye and Barghoorn revisited. Marine Geology 128: 1–9.
Chabreck, R.H., and R.G. Linscombe. 1982. Changes in vegetative typesin Louisiana coastal marshes over a 10-year period. Proceedings ofthe Louisiana Academy of Science 44: 98–102.
Conner, W.H., and J.W. Day Jr. 1988. Rising water levels in CoastalLouisiana: implications for two coastal forested wetland areas inLouisiana. Journal of Coastal Research 4: 589–596.
Conner, W.H., T.W. Doyle, and K.W. Krauss. 2007. Ecology of tidalfreshwater forested wetlands of the Southeastern United States .Netherlands: Springer.
Cormier, N., K.W. Krauss, and W.H. Conner. 2013. Periodicity in stemgrowth and litterfall in tidal freshwater forested wetlands: influenceof salinity and drought on nitrogen recycling. Estuaries and Coasts36: 533–546. doi:10.1007/s12237-012-9505-z.
Courtwright, J., and S.E.G. Findlay. 2011. Effects of microtopography onhydrology, physicochemistry, and vegetation in a tidal swamp of theHudson River. Wetlands 31: 239–249.
Craft, C. 2007. Freshwater input structures soil properties, vertical accre-tion, and nutrient accumulation of Georgia and U.S. tidal marshes.Limnology and Oceanography 52: 1220–1230.
Craft, C.B. 2012. Tidal freshwater forest accretion does not keep pacewith sea level rise.Global Change Biology. doi:10.1111/gcb.12009.
Darke, A.K., and J.P. Megonigal. 2003. Control of sediment depositionrates in two mid-Atlantic Coast tidal freshwater wetlands. Estuarine,Coastal and Shelf Science 57: 255–268.
Duberstein, J.A., andW.H. Conner. 2009. Use of hummocks and hollowsby trees in tidal freshwater forested wetlands along the SavannahRiver. Forest Ecology and Management 258(7): 1613–1618.
Ensign, S.H., M.F. Piehler, and M.W. Doyle. 2008. Riparian zone deni-trification affects nitrogen flux through a tidal freshwater river.Biogeochemistry 91: 133–150.
Ensign, S.H., K. Siporin, M.F. Piehler, M.W. Doyle, and L. Leonard.2012. Hydrologic versus biogeochemical controls of denitrificationin tidal freshwater wetlands. Estuaries and Coasts. doi:10.1007/s12237-012-9491-1.
Ensign, S.H., G.B. Noe, and C.R. Hupp. 2013. Linking channel hydrol-ogy with riparian wetland accretion in tidal rivers. Journal ofGeophysical Research Earth Surface . doi:10.1002/2013JF002737.
Field, D.W., A.J. Reyer, P.V. Genovese, and B.D. Shearer. 1991. Coastalwetlands of the United States. A special NOAA 20th anniversaryReport. Strategic assessment Branch, Ocean Assessments Division,Office of Oceanography and Marine Assessments, National OceanService . Washington: National Oceanic and AtmosphericAdministration and the U.S. Fish and Wildlife Service.
Goñi, M.A., G. Voulgaris, and Y.H. Kim. 2009. Composition and fluxesof particulate organic matter in a temperate estuary (Winyah Bay,South Carolina, U.S.A.) under contrasting physical forcings.Estuarine. Coastal and Shelf Science 85: 273–291.
Hilgartner, W.B., and G.S. Brush. 2006. Prehistoric habitat stability andpost-settlement habitat change in a Chesapeake Bay freshwater tidalwetland, U.S.A. The Holocene 16: 479–494.
Hupp, C.R. 2000. Hydrology, geomorphology and vegetation of CoastalPlain rivers in the south-eastern U.S.A. Hydrological Processes 14:2991–3010.
Hupp, C.R., and D.E. Bazemore. 1993. Temporal and spatial patterns ofwetland sedimentation, West Tennessee. Journal of Hydrology 141:179–196.
Kirwan, M.L., and A.B. Murray. 2007. A coupled geomorphic andecological model of tidal marsh evolution. Proceedings of theNational Academy of Sciences of the United States of America104: 6118–6122.
Krauss, K.W., J.A. Duberstein, T.W. Doyle, W.H. Conner, R.H. Day,L.W. Inabinette, and J.L. Whitbeck. 2009. Site condition, structure,and growth of baldcypress along tidal/non-tidal salinity gradients.Wetlands 29: 505–519.
Krauss, K.W., D.R. Cahoon, J.A. Allen, K.C. Ewel, J.C. Lynch, and N.Cormier. 2010. Surface elevation change and susceptibility of dif-ferent mangrove zones to sea-level rise on Pacific High Islands ofMicronesia. Ecosystems 13: 129–143.
Kroes, D.E., and C.R. Hupp. 2010. The effect of channelization onfloodplain sediment deposition and subsidence along the PocomokeRiver. Journal of the American Water Resources Association 46:686–699.
Kroes, D.E., C.R. Hupp, and G.B. Noe. 2007. Sediment, nutrient, andvegetation trends along the tidal, forested Pocomoke River,Maryland. In Ecology of tidal freshwater forested wetlands of theSoutheastern United States , ed. W.H. Connor, T.W. Doyle, andK.W. Krauss, 113–137. Springer: Netherlands.
Leonard, L. 1997. Controls of sediment transport and deposition in anincised mainland marsh basin, southeastern North Carolina.Wetlands17: 263–274.
Light, H.M., M.R. Darst, and R.A. Mattson. 2007. Ecological characteris-tics of tidal freshwater forests along the Lower Suwannee River,Florida. In Ecology of tidal freshwater forested wetlands of theSoutheastern United States , ed. W.H. Connor, T.W. Doyle, andK.W. Krauss, 291–320. Springer: Netherlands.
McCarney-Castle, K., G. Voulgaris, and A.J. Kettner. 2010. Analysis offluvial suspended sediment load contribution through Anthropocenehistory to the South Atlantic Bight coastal zone, U.S.A. The Journalof Geology 118: 399–416.
McKee, K.L., and I.A. Mendelssohn. 1989. Response of freshwatermarsh plant community to increased salinity and increased waterlevel. Aquatic Botany 34: 301–316.
Meade, R.H. 1969. Landward transport of bottom sediments in estuariesof the Atlantic coastal plain. Journal of Sedimentary Research 39:222–234.
Morris, J.T., P.V. Sundareshwar, C.T. Nietch, B. Kjerfve, and D.R.Cahoon. 2002. Response of coastal wetlands to rising sea level.Ecology 83: 2869–2877.
Mulholland, P.J., and C.R. Olsen. 1992. Marine origin of Savannah Riverestuary sediments: evidence from radioactive and stable isotopetracers. Estuarine, Coastal and Shelf Science 34: 95–107.
Murray, A.B.., M.A.F. Knaapen, M. Tal, and M.L. Kirwan. 2008.Biomorphodynamics: Physical-biological feedbacks that shape
Estuaries and Coasts
Author's personal copy
landscapes. Water Resources Research 44, doi:10.1029/2007WR006410.
Neubauer, S.C. 2008. Contributions of mineral and organic componentsto tidal freshwater marsh accretion. Estuarine, Coastal and ShelfScience 78: 78–88.
Neubauer, S.C. 2013. Ecosystem responses of a tidal freshwater marshexperiencing saltwater intrusion and altered hydrology. Estuariesand Coasts 36: 491–507. doi:10.1007/s12237-011-9455-x.
Noe, G.B. 2013. Interactions among hydrogeomorphology, vegetation,and nutrient biogeochemistry in floodplain ecosystems. In Treatiseon geomorphology, Vol. 12, ecogeomorphology, ed. J.F. Shroder,D.R. Butler, and C.R. Hupp, 307–321. San Diego: Academic Press.
Noe, G.B., and C.R. Hupp. 2005. Carbon, nitrogen, and phosphorusaccumulation in floodplains of Atlantic Coastal Plain rivers,U.S.A. Ecological Applications 15: 1178–1190.
Noe, G., and C. Hupp. 2009. Retention of riverine sediment and nutrientloads by Coastal Plain floodplains. Ecosystems 12(5): 728–746.
Noe, G.B., K. Krauss, G. Lockaby, W. Conner, and C. Hupp. 2013. Theeffect of increasing salinity and forest mortality on soil nitrogen andphosphorus mineralization in tidal freshwater forested wetlands.Biogeochemistry 114: 225–244. doi:10.1007/s10533-012-9805-1.
Palinkas, C.M., K.A.M. Engelhardt, and D. Cadol. 2013. Evaluatingphysical and biological influences on sedimentation in a tidal fresh-water marsh with 7Be. Estuarine, Coastal and Shelf Science 129:152–161.
Pasternack, G.B. 2009. Hydogeomorphology and sedimentation in tidalfreshwater wetlands. In Tidal freshwater wetlands , ed. A.Barendregt, D. Whigham, and A. Baldwin, 31–40. Leiden:Backhuys.
Pasternack, G.B., and G.S. Brush. 2002. Biogeomorphic controls onsedimentation and substrate on a vegetated tidal freshwater delta inupper Chesapeake Bay. Geomorphology 43: 293–311.
Phillips, J.D. 1991. Fluvial sediment delivery to a Coastal Plain estuary inthe Atlantic Drainage of the United States. Marine Geology 98(1):121–134.
Phillips, J.D. 1992. The source of alluvium in large rivers of the lowercoastal plain of North Carolina. Catena 19: 59–75.
R Development Core Team. 2011. R: A language and environment forstatistical computing. Vienna: R Foundation for Statistical Computing.ISBN 3-900051-07-0.
Rheinhardt, R.D., and C. Hershner. 1992. The relationship of below-ground hydrology to canopy composition in five tidal freshwaterswamps. Wetlands 12: 208–216.
Ross, K.M., C.R. Hupp, and A.D. Howard. 2004. Sedimentation infloodplains of selected tributaries of the Chesapeake Bay, InRiparian vegetation and fluvial geomorphology, ed. S.J. Bennettand A. Simon, American Geophysical Union.
Rybczyk, J.M. 1997. The use of secondarily treated wastewater effluentfor forested wetland restoration in a subsiding coastal zone. BatonRouge: Ph.D. Dissertation. Louisiana State University.
Rybczyk, J.M., J.W. Day, and W.H. Conner. 2002. The impact of waste-water effluent on accretion and decomposition in a subsiding forestedwetland. Wetlands 22: 18–32.
Smalley, A.E. 1959. The role of two invertebrate populations, Littorinairrorata and Urchelimum fidicinium, in the energy flow of a saltmarsh ecosystem . Athens: Ph. D. thesis, Univ. of Georgia.
Temmerman, S., G. Govers, S. Wartel, and P. Meire. 2004. Modellingestuarine variations in tidal marsh sedimentation: response to chang-ing sea level and suspended sediment concentrations. MarineGeology 212: 1–19.
Webb, E.L., D.A. Friess, K.W. Krauss, D.R. Cahoon, G.R. Guntenspergen,and J. Phelps. 2013. A global standard for monitoring coastalwetland vulnerability to accelerated sea-level rise. Nature ClimateChange 3: 458–465.
Yanosky, T.M., C.R. Hupp, and C.T. Hackney. 1995. Chloride concen-trations in growth rings of Taxodium distichum in a saltwater-intruded estuary. Ecological Applications 5: 785–792.
Zervas, C. 2001. Sea Level Variations of the United States 1854–1999.NOAA Technical Report NOS CO-OPS 36. National Oceanic andAtmospheric Administration.
Estuaries and Coasts
Author's personal copy