Accretion discs and planet formation around young stars ...
168
Imperial College London Department of Physics Accretion discs and planet formation around young stars Marija Jankovic Submitted in part fulfilment of the requirements for the degree of Doctor of Philosophy at Imperial College London, June 2020
-
Upload
khangminh22 -
Category
Documents
-
view
0 -
download
0
Transcript of Accretion discs and planet formation around young stars ...

Imperial College London
Department of Physics
Accretion discs and planet formationaround young stars
Marija Jankovic
Submitted in part fulfilment of the requirements
for the degree of Doctor of Philosophy at
Imperial College London, June 2020

Declaration of Originality
This thesis is my own work, except where specifically indicated in the text. Some parts ofthis thesis are based on work completed in collaboration with others, and some have also beenpublished as journal articles:
Chapter 2 is based on work that has been completed in collaboration with S. Mohanty,J. Tan and J. E. Owen, and is published asSubhanjoy Mohanty, Marija R. Jankovic, Jonathan C. Tan, and James E. Owen, Inside-out Planet Formation. V. Structure of the Inner Disk as Implied by the MRI, Astrophys-ical Journal, 861, 144 (2018)
Chapters 3 and 4 are based on work that has been completed in collaboration with J. E.Owen and S. Mohanty, and is published asMarija R. Jankovic, James E. Owen, and Subhanjoy Mohanty, Close-in Super-Earths: Thefirst and the last stages of planet formation in an MRI-accreting disc, Monthly Noticesof the Royal Astronomical Society, 484, 2296–2308 (2019)
Chapters 5 and 6 are based on work that has been completed in collaboration with S.Mohanty, J. E. Owen and J. Tan.
Marija Jankovic (2020)
Copyright Declaration
The copyright of this thesis rests with the author. Unless otherwise indicated, its con-tents are licensed under a Creative Commons Attribution-Non Commercial-No Derivatives 4.0International Licence (CC BY-NC-ND).
Under this licence, you may copy and redistribute the material in any medium or formaton the condition that; you credit the author, do not use it for commercial purposes and do notdistribute modified versions of the work.
When reusing or sharing this work, ensure you make the licence terms clear to others bynaming the licence and linking to the licence text.
Please seek permission from the copyright holder for uses of this work that are not includedin this licence or permitted under UK Copyright Law.
2

Abstract
Among the extrasolar planets discovered so far, the most abundant are the close-in super-
Earths. These are planets with sizes between that of the Earth and Neptune, and orbits
typically smaller than Mercury’s. In this thesis, I study the innermost regions of accretion
discs surrounding young stars, and if and how close-in super-Earths can form at such short
orbital periods.
I start by discussing a simple model of the inner disc structure coupled to a detailed pre-
scription of disc accretion due to the magneto-rotational instability (MRI). I use the inferred
structure of the gas to show that the MRI leads to accumulation of dust in the inner disc,
as necessary for the formation of solid planet cores. Next, assuming that solid cores do form
in the inner disc, I investigate the accretion and evolution of planetary atmospheres. I show
that, despite the MRI-accreting inner disc being gas-poor, the predicted planet atmospheres
are at least as large as observed. Finally, I present an improved model of the inner disc that
accounts for disc heating due to accretion and stellar irradiation, vertical energy transport, dust
opacities, and dust effects on disc ionization. The optically-thick inner disc is weakly affected
by stellar irradiation, and also convectively unstable. Dust controls the ionization state of the
inner disc, and thus the onset of the MRI. I show that sustained dust accumulation can occur
in the inner disc, without suppressing the MRI. If planets form in the inner disc, larger gas
accretion rates (and thus earlier times in the disc lifetime) are favoured.
The work in this thesis advances our knowledge of the planet-forming environment at short
orbital distances and supports the hypothesis that super-Earths could form near their present
orbits. This work also identifies impediments to planet formation in the inner disc which require
further study.
3

Acknowledgements
I gratefully acknowledge generous support from the President’s PhD scholarship of the Imperial
College London, the Dositeja stipend from the Fund for Young Talents of the Serbian Ministry
for Youth and Sport, ERC-STG-2019 grant (PEVAP) and the Dr Francis John Warner Prize.
I would like to express my deepest gratitude to my supervisor, Subhanjoy Mohanty, for
sharing with me his deep knowledge and passion for astrophysics, his guidance, and the metic-
ulous comments that helped improve this thesis. I am most appreciative of his patience and
exceptional support. Furthermore, I am extremely grateful to James Owen, for countless in-
sightful suggestions, stimulating discussions, and constructive comments. I am most thankful
for his kindness and warm encouragement. I must also thank Jonathan Tan whose ideas and
expertise were instrumental in developing this work.
I would like to thank Thomas Haworth for his persistent help, valuable advice and moral
support. I also thank Richard Booth, Steven Desch, Eve Lee, Colin McNally, Neal Turner,
Lauren Weiss, and Zhaohuan Zhu for helpful discussions.
I have truly enjoyed my time at Imperial. I would like to express my gratitude to the
members (past and present) of the Imperial Astrophysics group, for the friendly and engaging
working environment.
Special thanks to my family and friends for their continued support and encouragement.
Finally, and above all, thank you, Vanja, for your love and support.
4

Contents
Abstract 3
Acknowledgements 4
1 Introduction 9
1.1 Extrasolar planets . . . . . . . . . . . . . . . . . . . . . . . . . . . . . . . . . . . 9
1.2 Protoplanetary discs . . . . . . . . . . . . . . . . . . . . . . . . . . . . . . . . . 12
1.2.1 Thin circumstellar discs . . . . . . . . . . . . . . . . . . . . . . . . . . . 15
1.2.2 Viscous accretion discs . . . . . . . . . . . . . . . . . . . . . . . . . . . . 16
1.2.3 Source of viscosity . . . . . . . . . . . . . . . . . . . . . . . . . . . . . . 18
1.2.4 Evolution of dust . . . . . . . . . . . . . . . . . . . . . . . . . . . . . . . 21
1.3 Formation of close-in super-Earths . . . . . . . . . . . . . . . . . . . . . . . . . 23
1.3.1 Migration scenario . . . . . . . . . . . . . . . . . . . . . . . . . . . . . . 24
1.3.2 Formation in the inner disc . . . . . . . . . . . . . . . . . . . . . . . . . 25
1.4 Thesis outline . . . . . . . . . . . . . . . . . . . . . . . . . . . . . . . . . . . . . 27
2 MRI-accreting inner disc 28
2.1 Introduction . . . . . . . . . . . . . . . . . . . . . . . . . . . . . . . . . . . . . . 28
2.2 Methods . . . . . . . . . . . . . . . . . . . . . . . . . . . . . . . . . . . . . . . . 29
2.2.1 Standard α-disc model . . . . . . . . . . . . . . . . . . . . . . . . . . . . 29
2.2.2 MRI-driven viscosity parameter α . . . . . . . . . . . . . . . . . . . . . . 30
2.2.3 Self-consistent α-disc model . . . . . . . . . . . . . . . . . . . . . . . . . 35
2.3 Results . . . . . . . . . . . . . . . . . . . . . . . . . . . . . . . . . . . . . . . . . 36
2.3.1 Fiducial model . . . . . . . . . . . . . . . . . . . . . . . . . . . . . . . . 36
2.3.2 Varying model parameters . . . . . . . . . . . . . . . . . . . . . . . . . . 47
2.4 Discussion and conclusions . . . . . . . . . . . . . . . . . . . . . . . . . . . . . . 54
3 Early stages of planet formation in the inner disc 56
3.1 Introduction . . . . . . . . . . . . . . . . . . . . . . . . . . . . . . . . . . . . . . 56
3.2 Methods . . . . . . . . . . . . . . . . . . . . . . . . . . . . . . . . . . . . . . . . 57
3.2.1 Gas disc model . . . . . . . . . . . . . . . . . . . . . . . . . . . . . . . . 57
3.2.2 Dust evolution model . . . . . . . . . . . . . . . . . . . . . . . . . . . . . 58
3.2.3 Numerical methods . . . . . . . . . . . . . . . . . . . . . . . . . . . . . . 60
3.3 Results . . . . . . . . . . . . . . . . . . . . . . . . . . . . . . . . . . . . . . . . . 61
3.4 Implications for planetesimal formation . . . . . . . . . . . . . . . . . . . . . . . 64
3.5 Discussion and conclusions . . . . . . . . . . . . . . . . . . . . . . . . . . . . . . 67
5

4 Atmospheres of planets formed in the inner disc 694.1 Introduction . . . . . . . . . . . . . . . . . . . . . . . . . . . . . . . . . . . . . . 694.2 Methods . . . . . . . . . . . . . . . . . . . . . . . . . . . . . . . . . . . . . . . . 70
4.2.1 Accretion of planetary atmospheres . . . . . . . . . . . . . . . . . . . . . 704.2.2 Photoevaporation of planetary atmospheres . . . . . . . . . . . . . . . . 71
4.3 Results . . . . . . . . . . . . . . . . . . . . . . . . . . . . . . . . . . . . . . . . . 724.3.1 Accretion of planetary atmospheres . . . . . . . . . . . . . . . . . . . . . 724.3.2 Photoevaporation of planetary atmospheres . . . . . . . . . . . . . . . . 74
4.4 Comparison to observations . . . . . . . . . . . . . . . . . . . . . . . . . . . . . 744.5 Discussion and conclusions . . . . . . . . . . . . . . . . . . . . . . . . . . . . . . 79
5 Improved model of the MRI-accreting inner disc 815.1 Introduction . . . . . . . . . . . . . . . . . . . . . . . . . . . . . . . . . . . . . . 815.2 Methods . . . . . . . . . . . . . . . . . . . . . . . . . . . . . . . . . . . . . . . . 82
5.2.1 The disc model . . . . . . . . . . . . . . . . . . . . . . . . . . . . . . . . 825.2.2 Opacities . . . . . . . . . . . . . . . . . . . . . . . . . . . . . . . . . . . 855.2.3 Viscosity . . . . . . . . . . . . . . . . . . . . . . . . . . . . . . . . . . . . 875.2.4 Ionization . . . . . . . . . . . . . . . . . . . . . . . . . . . . . . . . . . . 885.2.5 Numerical methods . . . . . . . . . . . . . . . . . . . . . . . . . . . . . . 92
5.3 Results . . . . . . . . . . . . . . . . . . . . . . . . . . . . . . . . . . . . . . . . . 955.3.1 Disc thermal structure and the MRI . . . . . . . . . . . . . . . . . . . . 965.3.2 Disc chemical structure and the MRI . . . . . . . . . . . . . . . . . . . . 102
5.4 Discussion . . . . . . . . . . . . . . . . . . . . . . . . . . . . . . . . . . . . . . . 1095.4.1 Effects of dust . . . . . . . . . . . . . . . . . . . . . . . . . . . . . . . . . 1095.4.2 Importance of stellar irradiation . . . . . . . . . . . . . . . . . . . . . . . 1105.4.3 Convective instability in the inner disc . . . . . . . . . . . . . . . . . . . 1115.4.4 Energy transport by turbulent elements . . . . . . . . . . . . . . . . . . . 1125.4.5 Ambipolar diffusion in the strong-coupling regime . . . . . . . . . . . . . 112
5.5 Conclusions . . . . . . . . . . . . . . . . . . . . . . . . . . . . . . . . . . . . . . 113
6 Dependence on dust, disc and stellar parameters 1156.1 Introduction . . . . . . . . . . . . . . . . . . . . . . . . . . . . . . . . . . . . . . 1156.2 Methods . . . . . . . . . . . . . . . . . . . . . . . . . . . . . . . . . . . . . . . . 1166.3 Results . . . . . . . . . . . . . . . . . . . . . . . . . . . . . . . . . . . . . . . . . 118
6.3.1 Dust-to-gas ratio and dust size . . . . . . . . . . . . . . . . . . . . . . . 1196.3.2 Gas accretion rate, stellar mass and dead-zone viscosity . . . . . . . . . . 124
6.4 Location of the pressure maximum . . . . . . . . . . . . . . . . . . . . . . . . . 1256.5 Discussion . . . . . . . . . . . . . . . . . . . . . . . . . . . . . . . . . . . . . . . 129
6.5.1 Dust growth . . . . . . . . . . . . . . . . . . . . . . . . . . . . . . . . . . 1296.5.2 Dust accumulation . . . . . . . . . . . . . . . . . . . . . . . . . . . . . . 133
6.6 Conclusions . . . . . . . . . . . . . . . . . . . . . . . . . . . . . . . . . . . . . . 135
7 Summary and Outlook 1377.1 Summary . . . . . . . . . . . . . . . . . . . . . . . . . . . . . . . . . . . . . . . 1377.2 Outlook . . . . . . . . . . . . . . . . . . . . . . . . . . . . . . . . . . . . . . . . 140
Bibliography 142
6

List of Figures
1.1 Extrasolar planets with known mass or radius . . . . . . . . . . . . . . . . . . . 111.2 Mass-radius relationship for a set of extrasolar planets . . . . . . . . . . . . . . 131.3 Radius distribution for short-period planets . . . . . . . . . . . . . . . . . . . . 141.4 Illustration of the onset of the magneto-rotational instability . . . . . . . . . . . 191.5 Illustration of the MRI active and dead zones . . . . . . . . . . . . . . . . . . . 201.6 Illustration of a dust trap . . . . . . . . . . . . . . . . . . . . . . . . . . . . . . 221.7 Illustration of key transitions in protoplanetary discs . . . . . . . . . . . . . . . 23
2.1 Fractional ionization in the inner disc . . . . . . . . . . . . . . . . . . . . . . . . 372.2 Ambipolar, Ohmic and Hall resistivities . . . . . . . . . . . . . . . . . . . . . . . 382.3 Relative importance of the Ohmic, Hall and ambipolar resistivities . . . . . . . . 392.4 The MRI-active, dead, zombie and Hall zones for the fiducial model . . . . . . . 402.5 Midplane fractional ionization and MRI criteria . . . . . . . . . . . . . . . . . . 412.6 Magnetic field strength for the fiducial model . . . . . . . . . . . . . . . . . . . 412.7 Vertically-averaged viscosity parameter for the fiducial model . . . . . . . . . . . 422.8 Disc structure for the fiducial model . . . . . . . . . . . . . . . . . . . . . . . . . 432.9 Surface density profile for various accretion rates . . . . . . . . . . . . . . . . . . 442.10 Rate of change of the surface density with the accretion rate . . . . . . . . . . . 452.11 Rates of change of viscosity parameter and sound speed with the accretion rate . 462.12 Rosseland-mean opacity . . . . . . . . . . . . . . . . . . . . . . . . . . . . . . . 462.13 Comparison of the recombination timescale and the dynamical timescale . . . . 472.14 MRI zones for different dead-zone viscosity parameters . . . . . . . . . . . . . . 482.15 Magnetic field strength and viscosity parameter for different dead-zone viscosity
parameters . . . . . . . . . . . . . . . . . . . . . . . . . . . . . . . . . . . . . . . 492.16 Disc structure for different dead-zone viscosity parameters . . . . . . . . . . . . 492.17 Radial location of the pressure maximum and the dead-zone viscosity parameter 492.18 MRI zones for different accretion rates . . . . . . . . . . . . . . . . . . . . . . . 502.19 Relative importance of the resistivities for different accretion rates . . . . . . . . 512.20 Magnetic field strength and viscosity parameter for different accretion rates . . . 512.21 Disc structure for different accretion rates . . . . . . . . . . . . . . . . . . . . . 522.22 Radial location of the pressure maximum and the accretion rate . . . . . . . . . 522.23 MRI zones for M 0.1 Md . . . . . . . . . . . . . . . . . . . . . . . . . . . . . 532.24 Magnetic field strength and viscosity parameter for M 0.1 Md . . . . . . . . . 532.25 Disc structure for M 0.1 Md . . . . . . . . . . . . . . . . . . . . . . . . . . . 54
3.1 Gas disc structure . . . . . . . . . . . . . . . . . . . . . . . . . . . . . . . . . . . 593.2 Dust-to-gas ratio . . . . . . . . . . . . . . . . . . . . . . . . . . . . . . . . . . . 613.3 Dust particle size limits . . . . . . . . . . . . . . . . . . . . . . . . . . . . . . . 633.4 Criteria for streaming and gravitational instabilities . . . . . . . . . . . . . . . . 66
7

4.1 Envelope mass fraction of accreted atmospheres . . . . . . . . . . . . . . . . . . 724.2 Envelope mass fractions of the atmospheres after accounting for photoevaporation 754.3 Mass-radius relationship for sub-Neptune planets . . . . . . . . . . . . . . . . . 764.4 Sub-Neptune planets with measured masses and radii and predictions from models 78
5.1 Opacities for micron grains . . . . . . . . . . . . . . . . . . . . . . . . . . . . . . 865.2 Ionization fraction for various effective dust-to-gas ratios . . . . . . . . . . . . . 915.3 Comparison of temperature in models of varying complexity . . . . . . . . . . . 975.4 Radiative and convective zones in the inner disc . . . . . . . . . . . . . . . . . . 975.5 Ratio of the total irradiation heating to the total viscous dissipation . . . . . . . 985.6 Disc structure for models with and without irradiation . . . . . . . . . . . . . . 995.7 Comparison of the local viscosity parameter in models of varying complexity . . 1005.8 Comparison of the viscosity parameter and magnetic field strength in models of
varying complexity . . . . . . . . . . . . . . . . . . . . . . . . . . . . . . . . . . 1015.9 Comparison of models with various thermal and non-thermal sources of ionization1035.10 Disc structure for the model with thermal ionization and dust effects . . . . . . 1045.11 Disc structure for the model with all sources of ionization . . . . . . . . . . . . . 1065.12 Local viscosity parameter for the model with all sources of ionization . . . . . . 1065.13 Ionization rates due to stellar X-rays and cosmic rays . . . . . . . . . . . . . . . 1075.14 Degeneracy in the vertical disc structure . . . . . . . . . . . . . . . . . . . . . . 1085.15 Comparison of the recombination timescale and the dynamical timescale . . . . 113
6.1 Opacities for various dust grain sizes . . . . . . . . . . . . . . . . . . . . . . . . 1176.2 Opacities as a function of dust grain size . . . . . . . . . . . . . . . . . . . . . . 1186.3 Results for the thermally-ionized disc for various dust properties . . . . . . . . . 1206.4 Results for the full model for various dust properties . . . . . . . . . . . . . . . 1226.5 Viscosity parameter and ionization levels for a high dust-to-gas ratio . . . . . . . 1246.6 Results for the full model for various disc and stellar parameters . . . . . . . . . 1266.7 Radial location of the pressure bump as a function of maximum dust grain size . 1286.8 Radial location of the pressure bump, grain size and Stokes number in the frag-
mentation limit . . . . . . . . . . . . . . . . . . . . . . . . . . . . . . . . . . . . 132
8

1 Introduction
The past few decades have seen unprecedented advances in planetary science, starting with the
first discovery of a planet orbiting a main sequence star other than the Sun in 1995. Thousands
more extrasolar planets have been discovered since then. It emerged that most stars host
planetary systems that are quite dissimilar to the Solar system. By far the most prevalent
planets seem to be of size between that of the Earth and Neptune, in orbits typically smaller
than Mercury’s. The abundance of these so-called close-in super-Earths has opened many new
questions in the theory of how planets form.
All planets are believed to have formed in discs of gas and dust that surround young,
newly-formed stars, the so-called protoplanetary discs. Our understanding of protoplanetary
discs has also greatly advanced due to modern observational facilities. However, observations
show us that planets are incredibly common at small orbital radii, whereas the structure of
protoplanetary discs at such small radii is difficult to observe due to large distances to these
objects. In this thesis I aim to bridge this gap by building theoretical models of the structure of
the innermost regions of protoplanetary discs, and examining how they set the initial conditions
for planet formation.
This chapter starts with a brief overview of the currently known extrasolar planet population
and properties of the close-in super-Earths. Then, I introduce the basic concepts in the theory
of protoplanetary discs, focusing on the special conditions that arise in the innermost regions
of these objects. Last, I discuss our current understanding of how the super-Earths might have
formed, and outline the new work presented in this thesis.
1.1. Extrasolar planets
Two methods are responsible for the vast majority of extrasolar planet (or exoplanet) discoveries
so far: radial velocity and transit photometry. A planet-hosting star orbits around their joint
centre of mass, periodically moving forwards and backwards relative to an observer. The radial
velocity method detects this motion by measuring the Doppler shift in the light emitted by
the star. This is a function of planet mass and the system inclination relative to the observer,
and the radial velocity method obtains a lower limit on the planet mass. Transit photometry
measures a decrease in the light received from the star when a planet transits over the stellar
disc. It yields the planet radius. Therefore, in general, we may only know either the (minimum)
9

CHAPTER 1. INTRODUCTION
mass or the radius of a planet. Where possible, planets are detected with one method and
confirmed with the other, providing both. A radial-velocity mass of a transiting planet is
also its actual mass, since inclination is known. Additionally, in some cases it is possible to
obtain masses of planets through transit photometry only. In multi-planet systems planets
interact gravitationally and this can cause small transit timing variations (TTVs). Precise
measurements coupled to dynamical modelling can then be used to infer planet masses (Agol
et al. 2005; Holman and Murray 2005).
Unfortunately, both mass and radius are known for only a small number of exoplanets.
Therefore, Fig. 1.1 shows planet (minimum) mass as a function of orbital period in one panel,
and planet radius in the other, for sets of planets for which these quantities have been de-
termined (and also includes a small portion of planets discovered through other, less common
detection methods). Both panels illustrate the diversity of the extrasolar planets discovered
so far. Three groupings of planets are evident in the planet mass-period plot: short-period
(Hot) and long-period (Cold) Jupiter-sized giants, and short-period super-Earths. Neither Hot
Jupiters nor super-Earths have analogues in the Solar system.
These plots are, naturally, highly biased by the sensitivity of the detection methods. Such
biases have been well characterized for the most successful planet finder to date, NASA’s Kepler
mission (Borucki et al. 2010). The main biases introduced by the transit photometry survey
by Kepler are incompleteness due to the requirement that a planet’s orbit is aligned with
the observer’s line of sight, false positives (i.e., non-planet transits), incompleteness due to
the transit-detecting algorithm missing planet transits in the data and uncertainties in stellar
parameters (e.g. Fressin et al. 2013; Dressing and Charbonneau 2013; 2015). By removing
these biases it is possible to calculate the occurrence rates, i.e., the average number of planets
of certain properties per star. Such analyses have shown that planets around other stars are
very common. In an early study based on the first 16 months of Kepler data Fressin et al.
(2013) estimated that there are 0.7 planets per star with orbital periods up to 85 days, the
vast majority of which (0.65 planets per star) are planets with radii in the range 0.8 4 R`,
i.e. super-Earths. This is roughly consistent with estimates from radial velocity surveys that
the occurrence rate of Hot Jupiters is in the range 0.1%-1% and the occurrence rate of Cold
Jupiters of the order of several 1% (Mayor et al. 2011; Santerne et al. 2016). Unsurprisingly,
the actual detected population (shown in Fig. 1.1) is highly biased towards giant planets.
Estimates based on the full four-year Kepler data set yield even higher occurrence rates for
the super-Earths. Focusing on M dwarf stars, Dressing and Charbonneau (2015) estimated 2.5
planets per star in the super-Earth size range and orbital periods up to 200 days. More recent
studies estimated that for orbital periods of 0.5 256 days there are 3.5 super-Earths per star
for FGK type stars and between 4.2 and 8.4 super-Earths per star for M dwarfs (Hsu et al.
2019; 2020). As can be inferred from these high occurrence rates, the super-Earths readily
appear in multi-planet systems (e.g. Borucki et al. 2011). It is estimated that at least 42% of
all Sun-like stars have planet systems with at least 7 planets (Mulders et al. 2018) that are
10

CHAPTER 1. INTRODUCTION
Figure 1.1: Extrasolar planets with known mass (or the lower limit on mass, see text; top) andwith known radius (bottom) as functions of orbital period. Note the three groupings of planetsin the mass-period plot: super-Earths, Hot Jupiters and Cold Jupiters. Obtained from NASAExoplanet Archive. Courtesy NASA/JPL-Caltech.
11

CHAPTER 1. INTRODUCTION
nearly coplanar.
Evidently, the close-in super-Earths are incredibly common around low-mass stars. What
are these planets like? Some indications of the structure and composition of super-Earths are
gained from those planets for which both radius and mass have been determined. Fig. 1.2 shows
the mass-radius relationship for the observed planets and also theoretical predictions for planets
made purely of iron, silicates or water ice. Importantly, many of the planets have radii well
above the pure water ice radius at a given mass, indicating that they must contain a significant
volume of gas on top of a solid core, most likely made of hydrogen and helium (as found by e.g.
Marcy et al. 2014; Weiss and Marcy 2014; Rogers 2015). A small amount of mass is needed in
a H/He envelope to make a large difference in planet radius. Assuming that the super-Earths
have rocky cores, Wolfgang and Lopez (2015) estimate that only about 1% to 10% percent of
planet mass is needed in the envelope to explain the radii of the super-Earths.
In the presence of a gaseous envelope, determination of the core composition becomes a
degenerate problem, e.g., it cannot be determined how much, if any, water ice is present in the
core. The bottom panel of Fig. 1.2 zooms into a region of the radius-mass plane showing small
planets. There appears to be a transition radius of about 1.5 R`, above which most of the
planets are of density so low that they must contain large amounts of volatiles (Rogers 2015).
Most of the planets smaller than about 1.5 R` appear consistent with an iron-rock (Earth-
like) composition (Dressing et al. 2015), and those that do not, have large mass uncertainties
(Jontof-Hutter 2019).
Fortunately, some advances can be gained even without the mass measurements, using the
radius distribution alone. Fig. 1.3 shows a de-biased radius distribution of the close-in planets
based on the Kepler survey. It shows the relative scarcity of giant close-in planets relative to
the super-Earths. It also reveals that the super-Earths are, in fact, made up of two populations.
This gap in the radius distribution of close-in super-Earths had been predicted by models of
atmospheric evolution (Owen and Wu 2013). These models predict that all close-in super-Earths
were initially formed with large H/He envelopes; however, the ones that are least massive and
closest to the star lost their envelopes due to photoevaporation by high-energy stellar flux. The
location of the gap in these models is sensitive to the composition of the solid planet core, and
the observed gap is consistent with an Earth-like (i.e., rock-iron) composition (Owen and Wu
2017; Van Eylen et al. 2018; Wu 2019).
The close-in super-Earths stand in stark contrast to the inner region of the Solar system,
as they typically have orbital periods shorter than Mercury’s, while many of them are more
massive than all of the terrestrial planets combined. Given their occurrence rate around low-
mass stars, explaining how these planets form is undoubtedly a vital task.
12

CHAPTER 1. INTRODUCTION
Figure 1.2: Planet radius as a function of planet mass for a set of extrasolar planets withtheoretical predictions for pure iron, silicate rock and water ice planets (top) and the samefigure zoomed into small planets (bottom). In the top panel, orange squares show planets whosemasses are determined using TTVs and green circles planets whose masses are determined usingthe radial velocity method. In the bottom panel, planet data are colour-coded according to theincident flux, as indicated in plot legend. In both panels, solid and dashed lines show theoreticalpredictions, as indicated in plot legend (Zeng and Sasselov 2013; Fortney et al. 2007; Grassetet al. 2009). Republished with permission of Annual Reviews, Inc., from Jontof-Hutter (2019);permission conveyed through Copyright Clearance Center, Inc.
13

CHAPTER 1. INTRODUCTION
Figure 1.3: Completeness-corrected radius distribution for planets with orbital periods shorterthan 100 days (solid black line) including the small radii for which completeness is low (solidgrey line) and the uncorrected radius distribution (dotted grey line). The uncertainties in theoccurrence rates are based on simulated planet populations. The median uncertainty in radiusis shown in the upper right. Adapted from Fulton et al. (2017). ©AAS. Reproduced withpermission.
1.2. Protoplanetary discs
Stars form when parts of cold dense clouds of interstellar matter (ISM) gravitationally collapse.
Since these clouds are slowly rotating, their gravitational contraction combined with conserva-
tion of angular momentum also results in the formation of a disc around the newly-formed star
(e.g. Terebey et al. 1984). It is believed that planets form in these discs, and hence they are
commonly referred to as protoplanetary discs.
Since they form out of ISM, protoplanetary discs are expected to start out with 99% of their
mass in gas and 1% of their mass in solid dust grains (Mathis et al. 1977). The dust grains
absorb stellar light in the optical waveband and re-emit it in the infrared. The resulting infrared
excess in the spectral distribution (SED) of young stellar objects has long been detected (e.g.
Mendoza 1966, 1968) and its dusty disc origin understood (e.g. Adams et al. 1987). Inferred disc
masses are in the range of 103 101 Md (Beckwith et al. 1990; Beckwith and Sargent 1991;
Andrews and Williams 2005; 2007). The disc-like geometry of these objects was first confirmed
with Hubble Space Telescope images of light scattered off dust grains (O’dell and Wen 1994).
Dust thermal emission was resolved using millimetre interferometry, revealing dust disc sizes
of few hundreds of AU (Dutrey et al. 1996). The more abundant gas component of these discs
is more difficult to detect, since it is largely made up of relatively cold molecular hydrogen.
Nevertheless, observations of molecular lines of trace species such as CO yield insight into the
14

CHAPTER 1. INTRODUCTION
kinematics of these objects, which is to first order determined by simple Keplerian rotation
around the central star (e.g. Sargent and Beckwith 1987; Simon et al. 2000).
Protoplanetary discs accrete onto the star. Material flows from the inner disc edge onto
the star along magnetic field lines, emitting broad atomic emission lines (Muzerolle et al. 1998;
2001). As the material falls onto the stellar surface it creates shocks and emits UV continuum
radiation (Gullbring et al. 1998). Both effects can be used to infer the mass accretion rate
onto the star, which is typically in the range of 1010 106 Md yr1 (Hartmann et al. 1998).
While these measurements only constrain accretion within a few stellar radii from the star,
the obtained accretion rates are found to be correlated with the observed total disc dust mass,
implying that the disc evolves as a whole (Manara et al. 2016).
Eventually, protoplanetary discs disperse. The vast majority of the youngest stars host
discs, but very few stars older than a few Myr have one (Haisch et al. 2001; Mamajek 2009).
Importantly, the disc lifetime sets the timescale for planet formation. Any planet with a H/He
atmosphere accreted from the protoplanetary disc, including the close-in super-Earths, had to
have formed while the gaseous disc was still around. Furthermore, accretion in protoplanetary
discs is detected up to somewhat smaller, but comparable stellar ages as the infrared excess
(Fedele et al. 2010). This means that accretion and its effects on disc structure are important
during planet formation.
In the remainder of this section I will discuss the basics of the structure and evolution of
protoplanetary discs, starting with some basic notions about the structure of thin circumstellar
discs. I will discuss the basic theory of how accretion controls the disc evolution and the
processes driving accretion, focusing on the short orbital distances at which the super-Earths
are observed. Last, I will discuss theoretical expectations and observational evidence of dust
growth and evolution in protoplanetary discs.
1.2.1. Thin circumstellar discs
Throughout this work I will consider axisymmetric discs, i.e. I will assume that rotational
shear azimuthally smooths all disturbances. Although there are certainly some exceptions to
this among the observed discs, the majority are indeed axisymmetric. Protoplanetary discs are
also observed to be geometrically thin, i.e., their height is much smaller than their radius. It
is thus commonly assumed that in the time necessary for the disc to evolve over large radial
distances, the disc vertical structure settles into hydrostatic equilibrium. As most discs are
observed to be much less massive than their host star, I will also neglect the disc self-gravity.
Then, in the vertical direction, thermal pressure balances stellar gravity,
dP
dz ρ GMz
pr2 z2q32 , (1.1)
15

CHAPTER 1. INTRODUCTION
where P is gas thermal pressure, ρ is disc density and M stellar mass. For a thin disc in which
z ! r, adopting the ideal gas law, the vertical disc structure is determined by
dP
dz PΩ2
Kz
c2s
, (1.2)
where cs is the speed of sound, and ΩK is the Keplerian angular velocity.
The disc angular velocity Ω is not strictly Keplerian. Even in a disc that is only slowly
evolving in the radial direction (ur ! rΩ), Ω is affected by the radial gas thermal pressure
gradient,
rΩ2 rΩ2K
1
ρ
dP
dr. (1.3)
This term can be safely neglected when considering gas disc evolution, so that Ω ΩK. How-
ever, it is hugely important in the evolution of dust in circumstellar discs, as discussed further
below. Here I have also assumed that the disc angular velocity Ω is constant with height, since
the disc is thin.
1.2.2. Viscous accretion discs
In order for disc material to accrete onto the star it has to lose angular momentum. How
exactly this happens in protoplanetary discs is an unsolved problem. One possibility is that
a shear stress redistributes angular momentum throughout the disc. Consider a differentially
rotating disc as a series of infinitesimal rings and a Newtonian shear stress of the form
Wrφ ρνrBΩ
Br , (1.4)
where ν is kinematic viscosity. In a Keplerian disc such shear stress between two rings will slow
down the inner ring and speed up the outer. Material slowing down in the gravitational field
of the star will flow inwards, accreting, and matter speeding up will move outwards, carrying
angular momentum away. In protoplanetary discs molecular viscosity is negligible. However,
as discussed further below, other processes can produce the same behaviour.
The theory of evolution of viscously accreting discs was set out by Shakura and Sunyaev
(1973) and Lynden-Bell and Pringle (1974). From conservation of angular momentum it follows
that
ρur1
r
Bpr2ΩqBr p∇W qφ (1.5)
in a thin axisymmetric disc. For the viscous stress given by eq. (1.4),
ρur1
r
Bpr2ΩqBr 1
r2
BBrr2ρνr
BΩ
Br. (1.6)
Here viscosity ν can be a function of both height above disc midplane and of radius. The
16
CHAPTER 1. INTRODUCTION
equation of mass continuity isBρBt
1
r
BBr prρurq 0. (1.7)
Vertically integrating eq. (1.7) and (1.6) yields
BΣ
Bt 1
2πr
B 9M
Br 0, (1.8)
1
2π9MBBrr2Ω
BBrr2Σνr
BΩ
Br, (1.9)
where 9M 2πr³88
dzρur is the inwards gas accretion rate, Σ ³88
dzρ is the gas surface
density and ν ³88
dzρνΣ is the vertically-averaged viscosity.
Therefore, in a Keplerian disc, the gas accretion rate is given by
9M 6π
rΩ
BBrr2ΩνΣ
. (1.10)
Substituting eq. (1.10) into the mass continuity equation yields
BΣ
Bt 3
r
BBrr12 B
Brr12νΣ
, (1.11)
i.e., that time evolution of the gas surface density is governed by what is essentially a diffusion
equation. Time-dependent solutions to this equation are given by Lynden-Bell and Pringle
(1974) for some special cases of viscosity. For example, they show that for constant viscosity or
viscosity that is a power-law function of radius, gas flows inwards onto the star at the inner disc
edge, and viscously spreads at the outer edge. In this work I will primarily consider steady-state
solutions, in which the gas accretion rate 9M is radially constant. Radially integrating eq. (1.9)
from the inner disc edge, rin, to an arbitrary radius r,
1
2π9Mpr2Ω r2
inΩinq r2ΣνrBΩ
Br |rrin. (1.12)
Here, the right-hand side requires specifying a boundary condition at the inner disc edge. In
reality this depends on the complicated nature of gas flows and the magnetic field between the
inner disc edge and stellar surface (Bouvier et al. 2007). A simple way to specify this boundary
condition is to assume that the boundary layer between the disc and the star is thin (rin R,
e.g. Frank et al. 2002). Within this thin layer the angular velocity of material has to decrease
from its Keplerian value in the disc to the rotation velocity of the star, and so at some point
in the boundary layer BΩBr 0. Therefore, in steady state,
9M 3πνΣf1r , (1.13)
where fr 1aRr.
17

CHAPTER 1. INTRODUCTION
Finally, to obtain the full description of the system, one needs to consider the energy balance.
If the only source of heat is dissipation due to the viscous stress, then at any point in the disc
the viscous dissipation rate and the cooling rate are balanced, i.e.
9
4ρνΩ2 ∇.F, (1.14)
where F is the energy transport flux, e.g. radiative flux. In a thin disc one can expect the heat to
escape vertically much more easily than in the radial direction, so that F Fz. Furthermore,
at disc midplane F 0 due to symmetry. Then, vertically integrating eq. (1.14) from disc
midplane to disc surface yields
Ftot 9
8ΣνΩ2 3
8πΩ2
9Mfr, (1.15)
where Ftot is the total heat flux that escapes through one side of the disc and the second
equality is obtained by substituting Σν from eq. (1.13). Therefore, the total viscous dissipation
at a given radius depends only on the gas accretion rate 9M and stellar parameters.
Further progress can only be made by specifying the energy transport flux F and the
viscosity ν. In radiative energy transport, flux F is a function of disc structure and disc
radiative properties, i.e. absorptivity and emissivity of the material. This inter-dependency
will be considered with varying degrees of complexity in this thesis, and so I defer further
discussion to relevant chapters. As for the viscosity ν, it was already noted that it must arise
from pseudo-viscous processes in the disc. Its origin is discussed in the next section.
1.2.3. Source of viscosity
Shakura and Sunyaev (1973) argued that viscosity in accretion discs comes from turbulence.
Essentially, correlated fluctuations in radial and azimuthal velocities due to turbulent motions
yield a shear stress analogous to the viscous stress given by eq. (1.4). If a magnetic field is
present, the same is true of fluctuations in the radial and azimuthal components of the field. In
both cases it is convenient to assume that the shear stress is proportional to the gas pressure,
with a dimensionless proportionality constant α. In the case of turbulent velocity fluctuations,
for example, α is a square of the ratio of the turbulent velocity to the speed of sound (e.g.
Balbus and Hawley 1998). Then, since supersonic turbulence would lead to shocks and quickly
dissipate, Shakura and Sunyaev argue that α 1, placing a constraint on the magnitude of
shear stress in discs. Furthermore, shear stress is given by eq. (1.4) if viscosity ν is given by
ν αc2
s
Ω, (1.16)
connecting the Shakura and Sunyaev α parameter to the above formulation of a viscous accre-
tion disc.
18

CHAPTER 1. INTRODUCTION
Figure 1.4: Illustration of the onset of the magneto-rotational instability. Two fluid elements(grey cubes), coupled to the magnetic field (red line), are initially at the same orbital radius(left), rotating around the star at the same azimuthal velocity (black arrows). Following aperturbation in the radial direction, the inner element has a higher azimuthal velocity thanthe outer, and the magnetic field line is stretched (right). This results in the growth of theperturbation as discussed in Section 1.2.3.
What instability or instabilities may give rise to turbulence in protoplanetary discs? First,
consider a well ionized disc, so that the gas is perfectly coupled to the magnetic field and the
induction equation isBBBt ∇ pvBq, (1.17)
where B is the magnetic field strength. In this so-called ideal magnetohydrodynamic (MHD)
regime, a rotating disc threaded by a magnetic field is unstable to small perturbations if dΩdr 0, i.e. if the angular velocity decreases outwards (Balbus and Hawley 1991). The onset of the
magneto-rotational instability (MRI) is illustrated in Fig. 1.4 for an initially vertical magnetic
field. A small perturbation leads to a radial displacement of two fluid elements. Due to the
resulting difference in their angular velocities, with the outer element moving slower than the
inner one, the fluid elements move apart azimuthally. This stretches the magnetic field line
(shown in red) coupled to the fluid elements. Magnetic tension acts to reduce this stretch.
However, pulling the inner fluid element back reduces its angular momentum, causing it to
fall further inwards, and vice versa for the outer fluid element. As a result, the instability
grows and at the same time transports angular momentum outwards, as needed for accretion.
Furthermore, for the instability to develop, the magnetic field strength can be arbitrarily weak,
but not arbitrarily strong - roughly, the magnetic pressure needs to be smaller than the gas
pressure. The instability also develops quickly, with the growth timescale being of the order of
the local orbital period in the linear regime.
In the non-linear regime, explored through numerical simulations, the MRI leads to MHD
turbulence. Shear stress is measured in simulations by averaging over turbulent fluctuations in
velocity and magnetic field strength. The viscosity parameter α due to the MRI is found to
be in the range 103 101 in homogeneous local simulations threaded by a uniform magnetic
field (Hawley and Balbus 1992; Hawley et al. 1995), homogeneous local zero net magnetic flux
19

CHAPTER 1. INTRODUCTION
simulations (Hawley et al. 1996), and stratified local zero net flux simulations (Brandenburg
et al. 1995; Stone et al. 1996). These results were confirmed more recently to be independent
of spatial resolution in the simulations (Simon et al. 2009; Davis et al. 2010; Shi et al. 2010).
Therefore, if protoplanetary discs were well ionized, they would easily become turbulent due
to the MRI. However, ionization levels are expected to be low in these discs and non-ideal MHD
effects are expected to play a significant role in disc evolution. For the conditions relevant in
protoplanetary discs, collisional coupling between neutral and charged particles remains strong.
Because of this, the Lorentz force effectively acts on the neutrals too, i.e., on the fluid as a
whole. However, when the fluid is weakly ionized, the coupling between the fluid and the
magnetic field weakens. The induction equation becomes (Balbus 2011)
BBBt ∇ pvBq ∇ pηOp∇Bq ηAp∇BqK ηHp∇Bq Bq. (1.18)
Here, B is a unit vector and “K” denotes the component of a vector perpendicular to B. The
first term on the right-hand side is the advective term, which is the same as in the ideal case
given by eq. (1.17). The second and the third terms are due to Ohmic and ambipolar diffusion,
proportional to the Ohmic resistivity ηO and the ambipolar resistivity ηA, respectively. If
Ohmic diffusion is important, collisions of charged particles with neutrals decouple the charged
particles (and thus the fluid overall) from the magnetic field. If ambipolar diffusion is important,
charged particles remain coupled to the magnetic field, but the collisions with the neutrals are
not efficient enough to couple the entire fluid to the field. By decoupling the fluid from the
magnetic field, Ohmic and ambipolar diffusion stabilize the disc against the MRI. Finally, the
fourth term is due to the Hall effect. While it is also proportional to what is dimensionally a
resistivity ηH, it is not a diffusive term.
The fluid ionization fraction at which Ohmic diffusion, for example, suppresses the MRI
is of the order of x 1013 (e.g. Fromang et al. 2013). However, the ionization levels in
protoplanetary discs can be even lower. The main sources of ionization are typically considered
to be thermal (collisional) ionization, stellar X-rays and cosmic rays. Thermal ionization only
becomes important above about a 1000 K, the ionization temperature of potassium (Umebayashi
and Nakano 1988). It is thus only relevant in the innermost, hot regions of protoplanetary discs.
Stellar X-rays and cosmic rays can only penetrate mass columns of the order of 10 g cm2 and
100 g cm2, respectively (Glassgold et al. 1997; Umebayashi and Nakano 1981). Since the disc
surface density is expected to be higher than such mass columns in the bulk of the disc, X-rays
and cosmic rays may only be relevant in the uppermost layers, near disc surface, and in the
outer regions of the disc. Fig. 1.5 illustrates the structure of the inner protoplanetary disc that
emerges from this analysis. In the ionized regions the MRI is expected to be active, driving
turbulence and efficient accretion. The cold dense regions, on the other hand, form the so-called
dead zone, where ionization is too low to support the MRI (Gammie 1996; Jin 1996).
In the dead zone, in the absence of (the coupling with) the magnetic field, various hydrody-
20

CHAPTER 1. INTRODUCTION
dead zone
active zone
X-rays
cosmic rays
thermal ionization
Figure 1.5: Illustration of the inner protoplanetary disc showing key ionization mechanismsand the MRI active and dead zones (Gammie 1996).
namic instabilities can drive turbulence under the right conditions (Pfeil and Klahr 2019; Lyra
and Umurhan 2019). However, the resulting viscosity is expected to be far smaller than in the
MRI-active zone (e.g. Lesur and Papaloizou 2010; Nelson et al. 2013; Stoll and Kley 2014).
Therefore, it is expected that the viscosity, or accretion efficiency, decreases with distance from
the star with a potentially sharp drop at the transition between the active and the dead zone.
Finally, given the difficulties in producing turbulence in protoplanetary discs, it must be
recognised that accretion might be (at least partially) driven by non-viscous processes. In the
bulk of the disc, the Hall effect can be the dominant non-ideal MHD effect. Unlike the diffusive
terms, it does not merely suppress the MRI. Rather, the Hall effect can drive large scale laminar
flows through the disc (although this depends on the alignment of the magnetic field with the
disc rotation axis; Lesur et al. 2014). Additionally, in the presence of a magnetic field threading
the disc MHD winds can be launched from the disc surface, lifting angular momentum from the
disc (Suzuki and Inutsuka 2009; Suzuki et al. 2010; Moll 2012; Bai and Stone 2013; Fromang
et al. 2013; Lesur et al. 2013). It appears likely that both the Hall effect and MHD winds play a
significant role in the overall evolution of discs, driving gas accretion at a much larger range of
radii than the MRI (Bai 2017). Nevertheless, the structure of the innermost, thermally-ionized
regions of discs are still likely to be strongly affected by the MRI, and especially so the disc
midplane where planets are expected to form.
1.2.4. Evolution of dust
Protoplanetary discs are expected to start out with small (sub-micron) ISM-like dust grains.
Dust thermal emission offers evidence for grain growth to larger sizes. In optically thin regions
of the disc the emitted flux is directly proportional to dust emissivity, which itself is a function
of dust grain size (Beckwith and Sargent 1991). Comparison of the slope of the disc spectral
energy distribution (SED) at millimetre wavelengths with the predicted slope of dust emissivity
as a function of wavelength shows growth beyond millimetre sizes (D’Alessio et al. 2001).
Dust grain size determines the dust spatial evolution. Small dust grains are entrained
21

CHAPTER 1. INTRODUCTION
with the gas, well mixed throughout the disc, slowly accreting onto the star. On the other
hand, larger dust grains are only partially coupled to the gas through gas drag. As discussed
above, as the gas thermal pressure decreases with distance from the star the pressure gradient
effectively lowers the gravitational force, making the gas orbital velocity slightly sub-Keplerian.
As partially-decoupled dust grains tend towards Keplerian orbits, they feel drag from the slower
gas. This causes the dust grains to lose angular momentum and fall radially towards the star.
The effect is known as radial drift and it is expected to be most drastic for centimetre-sized dust,
as larger bodies become completely decoupled from the gas (Weidenschilling 1977). Indeed,
observations show that discs appear significantly smaller in the dust continuum than in the gas
line emission, with a steep drop in the dust continuum at disc outer edge, a signature of radial
drift (Panic et al. 2009; Andrews et al. 2012; Rosenfeld et al. 2013; Trapman et al. 2020).
Additionally, for dust grains at a finite height above the disc midplane, Keplerian orbits
around the central star are inclined relative to the midplane (because the plane of a Keplerian
orbit must pass through the centre of the star). The gas drag tends to damp the resulting
relative velocity between the dust and the gas in the vertical direction. As a result, dust grains
also fall, or settle, vertically towards the disc midplane (Weidenschilling 1977). The dust is not,
however, expected to settle in the midplane, as turbulent motions in the disc lift and mix the
grains. The dust vertical structure is then determined as an equilibrium between settling and
turbulent mixing (Dubrulle et al. 1995).
The radial drift of dust has an important consequence in discs which feature a local gas
pressure maximum, see Fig. 1.6. In the region of positive pressure gradient the gas is super-
Keplerian, reversing the effect of gas drag on the dust grains. Therefore, just inwards of
a pressure maximum, dust grains radially drift outwards. For dust grains that encounter a
pressure maximum while radially drifting inwards from the outer disc, the pressure maximum
acts as a trap, where over time dust can accumulate (e.g. Haghighipour and Boss 2003; Pinilla
et al. 2012). The resulting dust structure in the disc is a dust ring. Many of such dust rings have
been observed in protoplanetary discs (e.g. ALMA Partnership et al. 2015; Andrews et al. 2018;
Long et al. 2019), with direct kinematic evidence that the dust rings correspond to locations
of gas pressure maxima (Teague et al. 2018).
Radial drift, vertical settling, turbulent mixing and, for the smallest grains, Brownian mo-
tion, also drive collisions between dust grains (Testi et al. 2014). Dust growth occurs when
such collisions result in sticking. Growth by sticking easily produces particles up to millimeters
in size; however, collisional velocities increase with grain size and at higher velocities collisions
are more likely to result in bouncing or even fragmentation of dust grains (Blum and Munch
1993), impeding growth beyond millimetre sizes (Zsom et al. 2010; Birnstiel et al. 2011). Even
if some lucky particles surmount these barriers (Windmark et al. 2012a;b; Garaud et al. 2013),
they are prone to fast radial drift towards the star. Nevertheless, in many discs at least some
of the dust must somehow form large planet-size bodies (since planets exist).
Finally, it is important to note that the composition of dust grains varies spatially inside
22

CHAPTER 1. INTRODUCTION
Figure 1.6: Illustration of a radial midplane gas pressure profile in a disc featuring a localmaximum (indicated by a dashed line). Blue arrows show directions of radial drift of dustgrains embedded in such a disc.
Water ice lineGas disc
inner edge
MRI dead zoneinner edge
Silicate sublimation
line
Figure 1.7: Illustration of a protoplanetary disc showing the gas disc inner edge, silicate subli-mation line, MRI dead zone inner edge and water ice line.
discs. The temperature in protoplanetary discs can vary from a few tens of Kelvin in the
outermost disc to a few thousand near the star, covering the sublimation points of all key
materials. Water is only condensed beyond the so-called ice line, where the temperature falls
below 150 K. Furthermore, from observations of disc emission in the near-infrared, very little
to no dust is expected to exist inside the sublimation line of silicates where temperatures are
higher than 1500 K (Hillenbrand et al. 1992; Natta et al. 2001). Naturally, spatial variations
in the composition of planet-building material leave an imprint on planetary systems. For
example, the terrestrial planets and the main asteroid belt in the Solar system are relatively
dry, and it is thought that the Earth’s entire water content was delivered by scattered water-rich
asteroids formed in the outer Solar system (Morbidelli et al. 2000).
1.3. Formation of close-in super-Earths
In this chapter so far I have discussed the known exoplanet population and the structure and
evolution of protoplanetary discs, inside which planets are believed to form. From the detected
exoplanet population it is inferred that roughly half of all Sun-like and lower mass stars host
one or more close-in super-Earth-sized planets. It follows then that protoplanetary discs must
23

CHAPTER 1. INTRODUCTION
efficiently produce such planets. However, how, and even where exactly inside protoplanetary
discs, the close-in super-Earths form is an open question.
The main theoretical problem in forming super-Earths is in the large amount of solid mass
required to assemble these planets. Assuming that planets form near their present orbital
distances (i.e. in situ) from locally available material, a model of a protoplanetary disc can
be constructed such that contains the minimum amount of dust required to build solid planet
cores. For the Solar system, such model is known as the Minimum mass Solar nebula (MMSN;
Hayashi 1981). Close to the star the MMSN has sufficient amounts of dust to form the terrestrial
planets. To build the close-in super-Earths, a disc would have to be significantly richer in solids
at short orbital distances (Raymond et al. 2008; Chiang and Laughlin 2013). While this led
some authors to conclude that the super-Earths cannot have formed in situ (e.g. Raymond et al.
2008), others proposed that the proto-Solar system might have been an exception rather than
the rule, and that the typical protoplanetary disc is indeed more massive (Chiang and Laughlin
2013). However, a minimum mass nebula is an idealization, and growing planets cannot access
all of the material available in the disc. After taking this into account, and also considering
that solids comprise only about a percent of total disc mass, the required disc mass is found
to be close to or above the criterion for gravitational stability of the disc (Schlichting 2014).
Other problems also arise if the super-Earths form in discs that are rich in both dust and gas.
For example, in a massive gaseous disc, accretion of gas onto super-Earth-sized solid cores is so
efficient that the planets would easily accumulate Jupiter-sized atmospheres (Lee et al. 2014),
whereas Jupiter-sized planets are much less common than the super-Earths.
There are two main ways to solve this problem, both relying on the fact that the solid-to-gas
ratio need not (and almost certainly does not) stay constant throughout disc lifetime. First,
when small dust grains grow into pebbles, they radially drift inwards, towards the star, due
to gas drag (see Section 1.2.4). If the drift can be stopped or slowed down at short orbital
periods, the pebbles accumulate there, enhancing the solid-to-gas ratio. Second, large planet-
sized bodies interact with the gaseous disc gravitationally and this can cause them to move
(migrate) radially (e.g. Goldreich and Tremaine 1979; 1980; Kley and Nelson 2012). It is thus
possible for a planet to form at an orbital distance different to the one we observe today, where
the conditions for planet formation are more favourable, following which the planet migrates
to its final orbit. The latter, the so-called migration scenario, has been studied in more detail,
and so I will discuss it first.
1.3.1. Migration scenario
Planets (or planet embryos) can launch spiral density waves in the disc (Goldreich and Tremaine
1979; 1980). As these waves propagate outwards through the disc, through gas that rotates
slower than the planet, they add angular momentum to the gas. The opposite is true for the
waves propagating inwards. To conserve angular momentum, a back-reaction torque acts on
24

CHAPTER 1. INTRODUCTION
the planet. Due to a slight asymmetry, regions from which the density waves are launched
exterior to the planet are closer to the planet than the ones interior to it. Consequently, the
net torque acting on the planet causes it to move inwards. A planet also interacts with the
material near its orbit, i.e., the material that corotates with it. The torque that acts on the
planet from the corotation region is sensitive to the disc structure, and can also act to drive
outwards planet migration (e.g. Paardekooper and Mellema 2006). At some locations then,
such as the inner disc edge, the net torque may be zero, and migration stalls (Masset et al.
2006). It is thus possible that super-Earths form at an orbital distance different to the one we
observe today, and then migrate inwards through gravitational interactions with the disc (e.g.
Terquem and Papaloizou 2007; Ogihara and Ida 2009; Cossou et al. 2014).
Super-Earths might form more easily at larger orbital distances due to several factors. Fur-
ther away from the star there is more material to form planets. Observations of protoplanetary
discs show that the radial surface density profiles are shallow, so the amount of mass available
at a given orbital distance increases radially outwards (typically Σprq9r1, e.g. Williams and
Cieza 2011, although, note that there is a large spread in the observed Σprq profiles, and also
that such observations are limited to the outer regions of discs). From theoretical models, in the
MMSN, for example, there is enough mass to form the super-Earths at a few AU from the star
(Schlichting 2014). Moreover, beyond the water ice line, where the temperature is low enough
for water to condense into ice (see Fig. 1.7), the amount of solids increases by a factor of 2–4
(Lodders 2003). Furthermore, the proximity of the water ice line in particular could be fertile
ground for the further growth of radially drifting pebbles, overcoming the dust growth barriers
discussed in Section 1.2.4 (Ida and Guillot 2016; Drazkowska and Alibert 2017; Schoonenberg
and Ormel 2017; Schoonenberg et al. 2018; 2019). Additionally, larger solid bodies can grow
by capturing and accreting the pebbles, and this process is also thought to be more efficient if
the pebbles are icy (Morbidelli et al. 2015). Once sufficiently large bodies form near or beyond
the ice line, they migrate inwards, concurrently growing further by colliding and merging with
each other. This typically results in a system of super-Earth-sized planets tightly packed near
the inner disc edge (Terquem and Papaloizou 2007; Ogihara and Ida 2009; Cossou et al. 2014).
There are two main arguments against the migration scenario. First, as a system of plan-
ets collectively migrates inwards, it forms a resonant chain (e.g. Cresswell and Nelson 2006;
Terquem and Papaloizou 2007; Ogihara and Ida 2009; Ida and Lin 2010). Most of the observed
close-in super-Earths do not lie in such resonant orbits (Burke et al. 2014). The most promis-
ing mechanism to break the resonant chains (i.e., to bring the theory in agreement with the
data) is that once the gaseous disc dissipates, planetary systems become dynamically unstable
and go through one last phase of scattering and collisions. If this happens, the final planetary
system is no longer in resonance (Terquem and Papaloizou 2007; Ida and Lin 2010; Cossou
et al. 2014; Coleman and Nelson 2016). How often this happens in real systems is, however,
unclear. Matching the observed properties of super-Earth systems requires 95% of the systems
to become unstable, whereas in simulated systems this number ranges from 45% to 95% de-
25
CHAPTER 1. INTRODUCTION
pending on uncertain model parameters (Izidoro et al. 2017; 2019). Moreover, it is generally
found that such a phase of giant impacts strips the planets of their atmospheres (Inamdar and
Schlichting 2015; Poon et al. 2020), whereas a large number of the close-in super-Earths have
significant H/He envelopes (admittedly, some authors argue that super-Earths can efficiently
accrete their atmospheres even with very little gas remaining in the disc; Lee and Chiang 2016).
It is important to add, however, that convergent migration which leads to planets in resonance
is a feature of migration inside viscous (turbulent) discs. Predictions differ in simulations of
planet migration inside inviscid (laminar) discs (e.g. those that accrete primarily via magne-
tohydrodynamic winds or Hall-driven radial flows, Nelson 2018). In inviscid discs, systems of
super-Earths do not end up in resonances in the first place (McNally et al. 2019), and so the
giant impact phase need not happen.
The second argument against the migration scenario is related to the composition of the
planets. If the embryos of the super-Earths form near or outside the water ice line, the super-
Earths should be water-rich (Ogihara and Ida 2009; McNeil and Nelson 2010; Izidoro et al.
2019). This is the case even if planet embryos form both inside and outside the ice line, as the
water-rich embryos further out migrate inwards and collide with the purely rocky ones (Izidoro
et al. 2019). In contrast, the solid cores of the super-Earths are inferred to be consistent with a
rock-iron, Earth-like composition, as discussed in Section 1.1. This problem for the migration
scenario seems inescapable at present.
1.3.2. Formation in the inner disc
The Earth-like composition of the super-Earths implies that they form near their present orbits,
or at the very least inside the water ice line. As discussed above, formation of super-Earths at
short orbital distances requires a delivery of solid material to the inner disc from the outer. It
has been proposed that this delivery happens in the form of pebbles that radially drift inwards
due to gas drag, and whose radial drift is stopped or slowed down at short orbital distances
(Hansen and Murray 2012; Boley and Ford 2013; Chatterjee and Tan 2014, see also Kretke
et al. (2009)). Radially drifting pebbles are stripped of their water ice at the water ice line,
but up to a half of their material is in the form of silicates and iron (Lodders 2003), which
continues its radial drift inwards.
The pebble-driven formation of the super-Earths in the inner disc has been mostly explored
within the so-called inside-out planet formation scenario (IOPF; Chatterjee and Tan 2014;
2015; Hu et al. 2016; 2018). In this scenario, radially-drifting pebbles halt their drift in a local
gas pressure maximum present in the inner disc (as inwards of the pressure maximum radial
drift switches direction; see discussion in Section 1.2.4 and Fig. 1.6). Such a local gas pressure
maximum is expected to arise in the inner disc, if the disc is in steady state and if gas accretion
is driven by the MRI. As discussed in Section 1.2.3, MRI-driven viscosity (and hence accretion
efficiency) is expected to decrease with increasing distance from the star as the disc transitions
26
CHAPTER 1. INTRODUCTION
from being hot and thermally-ionized to cold and weakly ionized. To maintain a steady state,
i.e. a constant gas accretion rate, eq. (1.13) implies that gas surface density should increase
outwards in this region. The viscosity reaches a minimum at the inner edge of the MRI dead
zone (Fig. 1.5). At that location then, one expects a local maximum in both gas surface density
and gas pressure. The location of this pressure maximum is estimated to be at an orbital
distance of a few tenths of an AU (Gammie 1996; Chatterjee and Tan 2014), roughly consistent
with the orbital distances of the super-Earths.
If a local gas pressure maximum can indeed trap radially drifting pebbles, enough solids
could accumulate over time to form a planet. One suggestion is that pebbles accumulate at
the pressure maximum until the resulting ring of pebbles becomes gravitationally unstable and
collapses into a planet-sized body (Chatterjee and Tan 2014). In IOPF, once the planet forms,
it is not expected to migrate inwards, as it remains trapped inside the gas surface density
maximum at which it formed (Hu et al. 2016). This surface density maximum acts as a trap for
the planet in the same manner as the disc inner edge (Masset et al. 2006). Instead, the planet is
expected to carve out a gap in the disc (Chatterjee and Tan 2014; Hu et al. 2016). It has been
hypothesized that the material interior to the gap would then accrete onto the star, leaving
the material exterior to the gap exposed to stellar X-rays. Stellar X-rays would ionize the
innermost region of the remnant disc, pushing the inner edge of the MRI dead zone outwards.
A second planet may then form at the new local gas pressure maximum, and the process may
be repeated for the third planet etc. (i.e., the planet system is formed inside-out). However,
it is not clear that super-Earths formed via IOPF would indeed be immune to migration. The
MRI-induced planet trap is expected to move inwards as the disc evolves, and the planet would
move with it (Coleman and Nelson 2014).
Formation of the super-Earths in the inner disc has been explored in much less detail,
yet it appears necessary to explain the rocky composition of these planets. In particular, the
structure of an MRI-accreting inner disc has not been modelled in detail, and it is not clear
if temperatures remain high enough in the inner disc for the local gas pressure maximum to
persist throughout the disc lifetime. Similarly, the hypothesis that the MRI-induced pressure
maximum leads to pebble accumulation remains to be tested, and the growth of pebbles to
larger bodies investigated.
1.4. Thesis outline
The aim of this thesis is to investigate the structure of the innermost regions of protoplanetary
discs and to explore if these regions can support formation of the close-in super-Earths. The
first question to consider is if the inner edge of the MRI dead zone, and the local gas pressure
maximum, indeed occur at orbital distances at which we observe the close-in super-Earths.
In Chapter 2 I present theoretical models of the inner regions of viscously accreting discs in
27

CHAPTER 1. INTRODUCTION
which the viscosity is self-consistently calculated from the criteria for the onset of the MRI.
Then, Chapter 3 deals with the question of whether such an MRI-accreting inner disc leads
to accumulation of dust. Assuming that super-Earth-sized solid planet cores do form in the
MRI-accreting inner disc, in Chapter 4 I investigate accretion of gas onto these cores, i.e. the
formation of planet atmospheres. The atmospheres of the super-Earths affect greatly their radii,
and coupling the accreted atmospheres with a simple model of their subsequent evolution allows
comparison to the observed planet properties. The models presented in Chapter 2 adopt many
assumptions about the disc structure, making the problem tractable enough for a preliminary
study. These assumptions are lifted in Chapter 5, which presents a detailed model of disc
physical and chemical structure. Then, in Chapter 6 I investigate how this new model depends
on various disc and stellar parameters. Finally, in Chapter 7 I summarise the main findings
and discuss the remaining open problems.
28

2 MRI-accreting inner disc
2.1. Introduction
For the super-Earths to form near their present short orbits, the inner protoplanetary disc
must become enriched in solids. This may happen via the following process. Small solids (dust
grains, or pebbles) radially drift through protoplanetary discs towards the star due to gas drag.
Concurrently, in steady state, the inner protoplanetary disc is expected to feature a local gas
pressure maximum, at the boundary between the MRI-active and the MRI-dead zones. This
pressure maximum may trap the radially-drifting pebbles, and super-Earths might then form
from the accumulated pebbles (e.g. Chatterjee and Tan 2014). To investigate whether the inner
disc indeed features a local gas pressure maximum, I produce models of the inner disc in which
the disc accretes viscously via turbulence induced by the MRI.
The boundary between the MRI-active and the MRI-dead zone in the inner disc has been
previously studied using numerical MHD simulations (Dzyurkevich et al. 2010; Flock et al.
2017). These simulations can directly probe the turbulent motions of the fluid and the evolution
of the magnetic field. However, they are computationally expensive; thus, they either use a
fixed, prescribed temperature profile (Dzyurkevich et al. 2010), or cannot be run for long enough
to reach a steady state (Flock et al. 2017). As such, they can be used to study the formation
of the pressure maximum at this boundary, but they cannot predict its location in a real,
steady-state disc. Additionally, the cited studies only consider the MRI-dead zone arising due
to Ohmic diffusion, whereas ambipolar diffusion can also suppress the MRI.
The formation of the pressure maximum due to the MRI can also be studied using much
simpler and computationally cheaper viscous disc models (e.g. Terquem 2008; Kretke and Lin
2007; Kretke et al. 2009; Kretke and Lin 2010; Chatterjee and Tan 2014). This is achieved
by parametrizing the viscosity arising from the MRI as a function of disc structure parameters
(e.g. temperature, density). However, previous studies either adopt simplified parametrizations
that do not consider the detailed physics of gas ionization and the coupling between the gas
and the magnetic field, or they make ad hoc assumptions about the magnetic field strength.
In the study presented in this chapter, viscosity is parametrized based on MRI criteria
extracted from MHD simulations (Sano and Stone 2002; Turner et al. 2007; Bai and Stone 2011;
Bai 2011a), with a detailed calculation of magnetic resistivities and a physically motivated
choice of the magnetic field strength at every orbital radius. Additionally, both Ohmic and
29

CHAPTER 2. MRI-ACCRETING INNER DISC
ambipolar diffusion are taken into account. On the other hand, I use a simplified model for
the disc structure. It is assumed that the inner disc is vertically isothermal, disc opacity is
a constant, and there is only a single ionized species. Both heating by stellar irradiation and
ionization of the disc by stellar X-rays are neglected. These are considerable simplifications,
which will be re-considered in Chapter 5. However, the models presented here still capture the
basic physics expected to set the structure of the inner disc, and the simplicity allows clear
insights into the MRI-driven accretion in the inner disc and the inner disc structure.
2.2. Methods
In Section 2.2.1 I discuss the adopted model of the disc structure, Section 2.2.2 explains how
a viscosity driven by the MRI is calculated, and Section 2.2.3 how the disc structure and the
MRI viscosity are coupled to obtain a self-consistent model.
2.2.1. Standard α-disc model
To model the disc structure, I employ the standard Shakura-Sunyaev α-disc model. This is
a model of a thin steady-state viscously accreting disc, with the viscosity parametrized using
the Shakura and Sunyaev (1973) α parameter. The basics of thin viscous discs were covered
in the previous Chapter. In this model it is further assumed that the heat released through
viscous dissipation is transported vertically by radiation and that the disc is optically thick,
i.e. that the optical depth at disc midplane τmid 12Σκ " 1. Here, κ is the Rosseland-mean
opacity, assumed to be vertically constant. Then, the disc midplane temperature is given by
(e.g. Hubeny 1990)
σT 4mid
3
8τmidFacc, (2.1)
where Facc is the total heat flux leaving through one side of the disc, given by eq. (1.15).
Equation (2.1) implies that the temperature varies with optical depth, and thus varies with
height above disc midplane. However, the dependence is weak, T9τ14. Hence, in this model
it is assumed that the disc is vertically isothermal with the temperature at all heights equal
to the temperature at the midplane. The solution to the hydrostatic equilibrium, eq. (1.2), is
then given by
P pr, zq Pmidprqez2
H2 , (2.2)
where Pmid is the pressure at midplane and H ?2csΩ is the disc pressure scale height.
Adopting the ideal gas law, an analogous expression describes the vertical density (ρ) profile,
with
ρmid Σ?πH
. (2.3)
Gathering expressions for the midplane density and temperature, eqns. (2.3) and (2.1), total
30

CHAPTER 2. MRI-ACCRETING INNER DISC
viscous dissipation, eq. (1.15), the relation between the disc surface density, vertically-averaged
viscosity and accretion rate, eq. (1.13), and the parametrization of viscosity, eq. (1.16), one
obtains (e.g. Hu et al. 2016)
Σ 275
365π35pµmp
kBq45G15σ
15SBκ
15α45M15 pfr 9Mq35r35, (2.4)
ρmid 285
31310π910pµmp
kBq65G1120σ
310SB κ310α710M1120
pfr 9Mq25r3320, (2.5)
Tmid 315
275π25pµmp
kBq15G310σ
15SB κ15α15M310
pfr 9Mq25r910, (2.6)
Pmid 215
31110π1310pµmp
kBq25G1720σ
110SB κ110α910M1720
pfr 9Mq45r5120, (2.7)
where fr 1b
Rr
. This series of expressions show simple relationships between the quantities
describing the disc structure and stellar parameters, disc accretion rate 9M , opacity κ and
vertically-averaged viscosity parameter α. The latter is in general a pressure-weighted average,
and in the case of a vertically-isothermal disc equal to a density-weighted average,
α ³88
αPdz³88
Pdz³88
αρdz³88
ρdz. (2.8)
In principle, both the opacity κ and viscosity parameter α are functions of the disc structure.
For simplicity, in this work it is assumed that the opacity is constant everywhere in the disc and
equals κ 10 cm2 g1, consistent with typical properties of small dust grains in protoplanetary
discs (e.g. Wood et al. 2002). The dependence of the viscosity parameter α on the disc structure
is, on the other hand, the key ingredient of the model presented here and is discussed in the
next section.
2.2.2. MRI-driven viscosity parameter α
In the following, I discuss the criteria for the onset of the MRI, calculation of the ionization
state of the gas, calculation of the coupling between the gas and the magnetic field (i.e., the
resistivities), and finally the calculation of the viscosity parameter α due to the MRI.
2.2.2.1. Criteria
The viscosity that the MRI induces depends, first of all, on whether a certain region of the disc
is unstable to the MRI. As discussed in Chapter 1, there are three effects that can modify the
onset of the MRI: Ohmic diffusion, ambipolar diffusion and the Hall effect. Ohmic diffusion can
suppress the MRI entirely by decoupling the magnetic field from the gas. Numerical simulations
(Sano and Stone 2002; Turner et al. 2007) show that Ohmic diffusion does not suppress the
31

CHAPTER 2. MRI-ACCRETING INNER DISC
MRI if
Λ v2Az
ηOΩ¡ 1, (2.9)
where Λ is the Ohmic Elsasser number, ηO is the Ohmic resistivity and vAz the vertical com-
ponent of the local Alfven velocity (vAz Bz?
4πρ, where Bz is the vertical component of the
magnetic field strength and ρ is the local gas density). This criterion expresses the requirement
that for the MRI to be active, the MRI growth rate must be larger than the Ohmic diffusion
rate (Fleming et al. 2000). The growth rate of the fastest-growing MRI mode is Ω and the
wavenumber of that mode is k ΩvAz. From eq. (1.18), one can also see that for a given
wavenumber k, the Ohmic diffusion rate is ηOk2. Then, the comparison of the two rates
yields eq. (2.9). Note that the dependence on the vertical component of the Alfven velocity
vAz (and the magnetic field strength Bz), rather than the total vA (and the total magnetic
field strength B), comes from the notion that the Ohmic diffusion affects smaller lengthscale
perturbations most easily, and in a thin disc those are in the vertical direction (Turner et al.
2007).
Ambipolar diffusion may also suppress the MRI. A criterion analogous to the above has
been investigated (Hawley and Stone 1998) using the ambipolar Elsasser number
Am v2A
ηAΩ, (2.10)
where ηA is the ambipolar resistivity. However, Bai and Stone (2011) showed that when ions
and neutrals in the gas are strongly coupled, behaving as a single fluid under the influence of the
magnetic field, ambipolar diffusion will not suppress the MRI even if Am 1, if the magnetic
pressure is sufficiently weak compared to the gas pressure. That is, for a plasma β-parameter,
β P PB, where PB B28π is the magnetic field pressure, the MRI will not be suppressed
if
β ¡ βmin, (2.11)
where the minimum value βmin is given by
βminpAmq
50
Am1.2
2
8
Am0.3 1
212
. (2.12)
For the ions and neutrals to be strongly coupled it is required that the density of ions be much
lower than the density of neutrals, and that the recombination timescale trcb for ions be much
shorter than the dynamical timescale, i.e. trcb ! tdyn 1Ω. I assume that both of these
conditions are fulfilled, and a posteriori check if this is true. Furthermore, note that while the
Ohmic Elsasser number depends on the vertical component of the magnetic field strength Bz,
the ambipolar Elsasser number depends on the total strength B. The two are not independent,
however, and numerical simulations show that B2z B225 Sano et al. (2004).
32
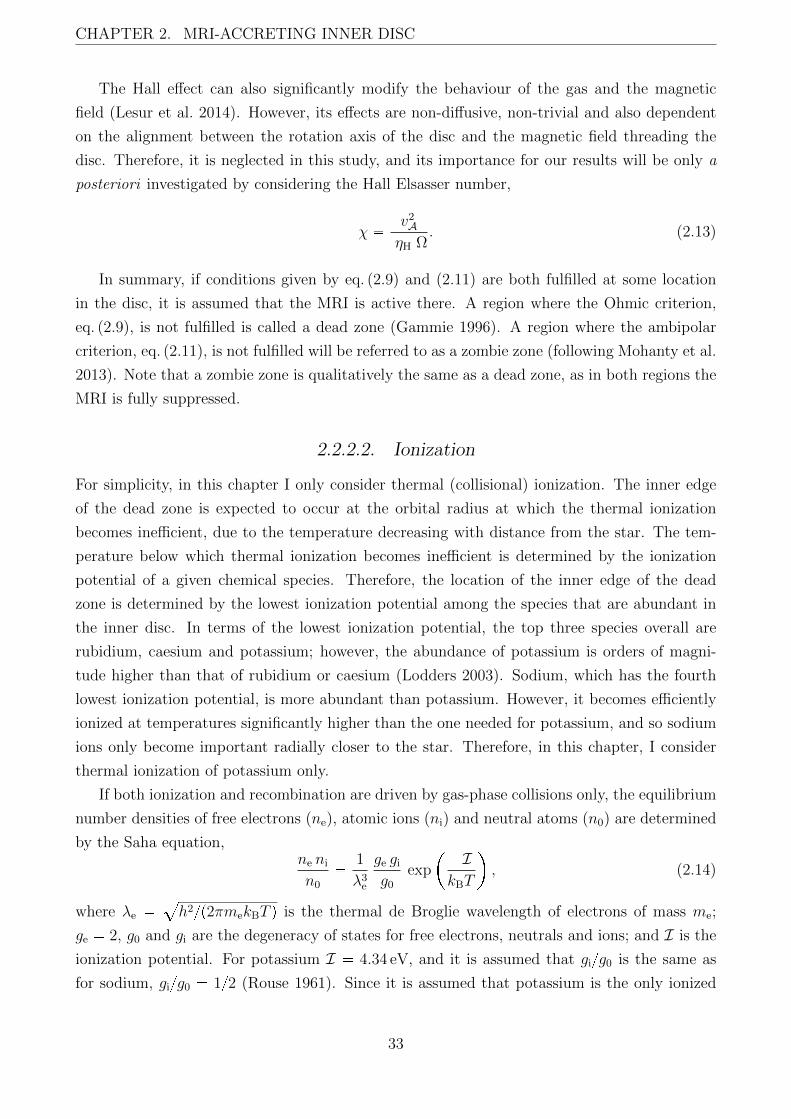
CHAPTER 2. MRI-ACCRETING INNER DISC
The Hall effect can also significantly modify the behaviour of the gas and the magnetic
field (Lesur et al. 2014). However, its effects are non-diffusive, non-trivial and also dependent
on the alignment between the rotation axis of the disc and the magnetic field threading the
disc. Therefore, it is neglected in this study, and its importance for our results will be only a
posteriori investigated by considering the Hall Elsasser number,
χ v2A
|ηH|Ω . (2.13)
In summary, if conditions given by eq. (2.9) and (2.11) are both fulfilled at some location
in the disc, it is assumed that the MRI is active there. A region where the Ohmic criterion,
eq. (2.9), is not fulfilled is called a dead zone (Gammie 1996). A region where the ambipolar
criterion, eq. (2.11), is not fulfilled will be referred to as a zombie zone (following Mohanty et al.
2013). Note that a zombie zone is qualitatively the same as a dead zone, as in both regions the
MRI is fully suppressed.
2.2.2.2. Ionization
For simplicity, in this chapter I only consider thermal (collisional) ionization. The inner edge
of the dead zone is expected to occur at the orbital radius at which the thermal ionization
becomes inefficient, due to the temperature decreasing with distance from the star. The tem-
perature below which thermal ionization becomes inefficient is determined by the ionization
potential of a given chemical species. Therefore, the location of the inner edge of the dead
zone is determined by the lowest ionization potential among the species that are abundant in
the inner disc. In terms of the lowest ionization potential, the top three species overall are
rubidium, caesium and potassium; however, the abundance of potassium is orders of magni-
tude higher than that of rubidium or caesium (Lodders 2003). Sodium, which has the fourth
lowest ionization potential, is more abundant than potassium. However, it becomes efficiently
ionized at temperatures significantly higher than the one needed for potassium, and so sodium
ions only become important radially closer to the star. Therefore, in this chapter, I consider
thermal ionization of potassium only.
If both ionization and recombination are driven by gas-phase collisions only, the equilibrium
number densities of free electrons (ne), atomic ions (ni) and neutral atoms (n0) are determined
by the Saha equation,ne ni
n0
1
λ3e
ge gi
g0
exp
IkBT
, (2.14)
where λe ah2p2πmekBT q is the thermal de Broglie wavelength of electrons of mass me;
ge 2, g0 and gi are the degeneracy of states for free electrons, neutrals and ions; and I is the
ionization potential. For potassium I 4.34 eV, and it is assumed that gig0 is the same as
for sodium, gig0 12 (Rouse 1961). Since it is assumed that potassium is the only ionized
33

CHAPTER 2. MRI-ACCRETING INNER DISC
species, charge conservation requires that ne ni. Then, it also follows that n0 nK,tot ne,
where nK,tot is the total number density of potassium ions and neutrals (nK,tot 1.97107nH2 ,
following Keith and Wardle 2014).
Finally, since it is assumed that free electrons can only recombine in collisions with potas-
sium ions, the recombination rate is given by dnedt keineni, where kei 31011?T cm3 s1
(Ilgner and Nelson 2006). The recombination timescale is then trcb nepdnedtq 1pkeineq.
2.2.2.3. Resistivities
In this work, The Ohmic, Hall and ambipolar resistivities are calculated following Wardle
(2007), first expressing them as
ηO c2
4πσO
, (2.15)
ηH c2
4πσK
σH
σK, (2.16)
ηA c2
4πσK
σP
σK ηO. (2.17)
where σO, σH and σP are the Ohmic, Hall and Pederson conductivities, respectively, and σK aσ2
H σ2P is the total conductivity perpendicular to the magnetic field. The conductivites are
given by
σO ec
B
¸j
nj |Zj| βj (2.18)
σH ec
B
¸j
nj Zj1 β2
j
(2.19)
σP ec
B
¸j
nj |Zj| βj1 β2
j
(2.20)
where the sums are over all charged species j (here, these are free electrons and potassium
ions), mj is particle mass, nj the number density, and Zje the charge of each species. Further,
βj is the Hall parameter, the ratio of the gyrofrequency of a particle to its collision frequency
with neutral particles. It is given by
βj |Zj|eBmj c
1
γjρn
, (2.21)
where γj is the drag coefficient and ρn is the mass density of neutral particles (and γjρn the
collision frequency with neutrals). The drag coefficient γj is calculated as
γj xσvyjmj mn
, (2.22)
34

CHAPTER 2. MRI-ACCRETING INNER DISC
wheremn µmH is the mean neutral particle mass, and xσvyj the rate coefficient for momentum
transfer in collisions between charged species j and neutrals. The latter are given by Wardle
(1999),
xσvye 1015
128 kBT
9πme
12
cm3 s1, (2.23)
xσvyi 1.6 109 cm3 s1, (2.24)
for electrons and ions, respectively.
2.2.2.4. Viscosity
If criteria (2.9) and (2.11) are met, the MRI induces turbulence. Turbulence produces a time-
and volume-averaged shear stress, measured in numerical simulations (Sano et al. 2004) to be
! Wrφ " 1
2! PB " . (2.25)
In the framework of viscous accretion discs, at any location in the disc the shear stress is given
by eq. (1.4),
Wrφ 3
2αP, (2.26)
where I have substituted viscosity in terms of the Shakura-Sunyaev α parameter using eq. (1.16).
Therefore, the MRI-driven α viscosity is
α 1
3
PBP
1
3β. (2.27)
The time and volume average symbols have been dropped here for simplicity, and it is implicitly
assumed that at any location in the disc α, PB and P are averages over some finite volume and
time.
Furthermore, numerical simulations show that when the MRI is suppressed by Ohmic dif-
fusion (i.e., in the dead zone, where criterion (2.9) is not met), there is a non-zero shear stress
induced by the adjacent MRI-active zone. The resulting viscosity parameter in the dead zone
is of the order of αDZ 104 (e.g. Dzyurkevich et al. 2010). Purely hydrodynamic instabilities
may also produce a weak stress in the dead zone (e.g. Lesur and Papaloizou 2010; Nelson et al.
2013; Stoll and Kley 2014). In this work I assume that the viscosity parameter is constant in
the dead zone, and explore a range of values (αDZ 105 103). For simplicity, the same
value is adopted for the viscosity parameter in the zombie zone (where the MRI is suppressed
by ambipolar diffusion). Additionally, in this model αDZ also denotes a minimum value of α.
That is, even if the Ohmic and ambipolar criteria indicate that the MRI should be active, if
eq. (2.27) yields a viscosity parameter lower than αDZ, it is assumed that α αDZ.
The criteria for the MRI and the value of the MRI-driven viscosity in the active zone all
35

CHAPTER 2. MRI-ACCRETING INNER DISC
depend on the magnetic field strength. The Ohmic and ambipolar criterion are functions of the
vertical component of the magnetic field strength Bz and the total strength B, respectively,
and the value of α in the active zone is also a function of the total strength B. As already noted
above, simulations show that B2z B225 (Sano et al. 2004), and so one only needs to consider
either Bz or B. Furthermore, following Bai (2011a), I assume that the magnetic field strength is
vertically constant. Then, at any orbital radius, one only needs to consider a single value of B.
In this model, this value is chosen at each radius such that maximizes the accretion efficiency
(viscosity parameter). How exactly this is done is described further below; here I only discuss
the motivation behind this choice. First note that, as discussed in Chapter 1, an arbitrarily
weak magnetic field is required to start the instability. The induced magnetohydrodynamic
turbulence amplifies the magnetic field strength. This cannot go on infinitely, as there is a
maximum B at which the MRI may be active without being quenched by ambipolar diffusion.
Choosing this maximum B would, by definition, yield no active MRI. Instead, it is assumed
that the MRI amplifies the field until a point at which further increase in the magnetic field
strength implies a lower accretion efficiency given the above MRI criteria, i.e., it is assumed
that B is a monotonously increasing function of the accretion efficiency. Similar arguments
were employed by Bai (2011a) and Mohanty et al. (2013).
Finally, in the standard α-disc model discussed above, at any given orbital radius the disc
structure depends on the vertically-averaged viscosity parameter α, defined in eq. (2.8). The
MRI-driven α varies with height above disc midplane. At a given value of the magnetic field
strength, the Ohmic and ambipolar criteria depend on gas pressure, density and resistivities
(which are also functions of the ionization levels). In general, for a given disc structure (tem-
perature, pressure and density) one could evaluate the ionization levels, resistivities and the
MRI criteria at a number of points above disc midplane. Then, in the MRI-active zones α
follows from eq. (2.27), and in the MRI-dead and zombie zones α αDZ. A pressure-weighted
(or a density-weighted) average α could then be evaluated numerically. However, the obtained
structure of the different MRI zones allows for some simplifications. It is found that there is,
generally, a dead zone around disc midplane, a zombie zone in the disc upper layers, and an
active zone in between. Therefore, to calculate α from a given disc structure, first I use a
root-finding algorithm (specifically, the bisection method) to find the height of the dead zone,
i.e., the height at which the Ohmic criterion eq. (2.9) is fulfilled (hDZ, which may be zero). The
same is repeated to find the height of the boundary between the active and the zombie zone
(hZZ). The vertically-averaged MRI-driven α is then given by
α ³hDZ
0αDZPdz
³hZZ
hDZ
13PBdz
³8hZZ
αDZPdz³80Pdz
, (2.28)
where I use eq. (2.27) for the value of α in the active zone. Since PB is vertically-constant, the
second term in the numerator is calculated trivially. Furthermore, since it is assumed that the
36

CHAPTER 2. MRI-ACCRETING INNER DISC
disc is vertically isothermal, pressure as a function of height is given by eq. (2.2) and so the rest
of the integrals are calculated using the well-known Error function.
2.2.3. Self-consistent α-disc model
The key parameters of the model presented here are the disc accretion rate 9M , stellar mass M,
stellar radius R and the value of viscosity parameter in the dead zone αDZ. If these parameters
are specified, a self-consistent solution for the disc structure can be obtained as follows. At a
given orbital radius and an input vertically-averaged viscosity parameter αin, equations (2.4,
2.2), along with the ideal gas law, yield the temperature, pressure and density at an arbitrary
height above disc midplane. Then, as described in Section 2.2.2, this inferred disc structure
can be used to calculate the MRI-driven αout. At a fixed value of the magnetic field strength
B, I use a root-finding method (bisection) to find the self-consistent value αin αout.
At a fixed value of B, the solution appears to always be unique. However, there is an infinite
number of solutions with varying B. At low enough and high enough B the only solution is the
one where the MRI is completely suppressed, αin αout αDZ. In the innermost disc, i.e., at
short orbital radii, there is a range of B for which the MRI is active, and αin αout α peaks
at some value of B. This determines our chosen solution. At larger orbital radii, the MRI is
suppressed at any value of B, as expected in the absence of non-thermal sources of ionization;
there α αDZ. At any radius, a scan over B is performed in the range 105 103 G. If there
is a range of values for which an MRI-active zone exists, α is maximized as a function of B
within that range.
The numerical procedures described in this section have been implemented as an extension
of the code originally developed by S. Mohanty.
2.3. Results
Section 2.3.1 presents an in-depth analysis of the ionization, MRI-driven viscosity and the
structure of the disc, for a fiducial model with a gas accretion rate 9M 109 Md yr1, stellar
mass M 1 Md and a dead-zone viscosity parameter αDZ 104. I also analyse the stability
of the obtained steady-state disc structure to surface density perturbations, and consider the
validity of the strong-coupling assumption. In Section 2.3.2, I consider the effects of varying the
above three model parameters. For a Solar mass star (the fiducial choice), I assume the stellar
radius is R 2.33 Rd, based on the stellar models of Baraffe et al. (1998) and a stellar age of
1 Myr. In all models the inner disc boundary is at the stellar radius and the outer boundary is
at the orbital radius outwards from which the MRI is completely suppressed.
37

CHAPTER 2. MRI-ACCRETING INNER DISC
Figure 2.1: Fractional ionization (nenH2) and molecular hydrogen density (nH2) as a functionof height above disc midplane (in units of disc scale height zH at each radius), at differentorbital radii for the fiducial disc model.
2.3.1. Fiducial model
2.3.1.1. Ionization and resistivities
Molecular hydrogen is by far the most abundant species in discs, and so the number density
of neutral particles and the total number density of particles are approximately equal to that
of molecular hydrogen, nn ntot nH2 . Therefore, when considering the ionization levels in
the disc, the relevant quantity is the ratio nenH2 (where ne n, since potassium is the only
ionized species). Fig. 2.1 shows nenH2 for the fiducial disc model as a function of height above
disc midplane (z), at different orbital radii. For reference, also shown is the number density
of molecular hydrogen (nH2). Two trends emerge. First, as expected, the fractional ionization
near the disc midplane (at small heights) decreases with orbital radius (this is further discussed
below). Second, at all radii nenH2 increases with height above the midplane. The latter follows
simply from the solution to the Saha equation: since the temperature is vertically constant, and
density decreases with height, the fraction nenH2 increases with height. As nH2 Ñ 0 towards
disc surface, ne Ñ nK.
Fig. 2.2 shows the resulting ambipolar, Ohmic and Hall resistivities (ηA, ηO and |ηH|, respec-
tively). The Ohmic resitivity is inversely proportional to the fractional ionization and directly
proportional to the density of neutrals (through its dependence on the Hall parameter of each
charged species). As a result, the Ohmic resitivity decreases with height above disc midplane at
all radii. The reverse is true for the ambipolar and Hall resistivities, which both increase with
the decreasing gas density and thus with height. To compare the three resistivities, Fig. 2.3
38

CHAPTER 2. MRI-ACCRETING INNER DISC
Figure 2.2: Ambipolar (ηA), Ohmic (ηO) and Hall (|ηH|) resistivities as a function of heightabove disc midplane (in units of disc scale height zH at each radius), at different orbital radiifor the fiducial disc model.
shows in different colours different regions of the disc according to the relative ratios between
the three resistivities. High in the disc atmosphere ambipolar resistivity dominates, and lower
below, in the bulk of the disc, Hall resistivity. For this fiducial model, Ohmic resistivity is not
dominant at any location in the disc.
2.3.1.2. Active, dead and zombie zones
Fig. 2.4 shows the regions in the disc where the MRI is active, the dead zone (where the MRI
is suppressed due to Ohmic diffusion, and the Ohmic Elsasser number Λ 1), the zombie zone
(where the MRI is suppressed due to ambipolar diffusion, and the plasma parameter β βmin).
Also shown is the Hall zone (where Hall Elsasser number χ 1), where the Hall effect can be
expected to alter the MRI and the disc structure. This is, however, neglected, and the Hall
zone is shown only as an indication of where the results presented here might be inapplicable
(see discussion at the end of this section). Furthermore, the midplane values of nenH2 , β and
Λ are shown as functions of radius in Fig. 2.5, and Fig. 2.6 shows the magnetic field strength
B.
From the inner disc edge to the outer edge where the MRI becomes completely suppressed,
three distinct regions appear as a result of the competing influences of Ohmic and ambipolar
diffusion. From the inner disc edge to about 0.05 AU, the height of the active zone is limited by
the ambipolar diffusion only. Due to the high ionization levels near disc midplane, as well as
low densities (discussed further below), Ohmic resistivity is low in this region, and Λ " 1. To
39

CHAPTER 2. MRI-ACCRETING INNER DISC
Figure 2.3: Relative importance of the Ohmic (ηO), Hall (|ηH|) and ambipolar (ηA) resistivitiesas a function of location in the disc, for the fiducial disc model. The top panel shows verticallocation in units of height above disc midplane; the bottom panel shows vertical location in unitsof column density measured from the disc surface. The dashed line in both panels indicatesone pressure scale height.
40

CHAPTER 2. MRI-ACCRETING INNER DISC
Figure 2.4: The MRI-active (Λ ¡ 1 and β ¡ βmin), dead (Λ 1), zombie (β βmin) and Hall(χ 1) zones as a function of disk location. The top panel shows vertical location in unitsof height above disc midplane; the bottom panel shows vertical location in units of columndensity measured from the disc surface. The dashed line in both panels indicates one pressurescale height. Note that the active zone exists at all orbital radii shown here, although beyond0.09 AU it is a thin layer sandwiched between the dead and zombie zones
41

CHAPTER 2. MRI-ACCRETING INNER DISC
Figure 2.5: Top: Fractional abundance of free electrons as a function of radius, expressedrelative to both the number density of hydrogen molecules (nenH2 ; left axis) and numberdensity of potassium (nenK; right axis). Middle: Plasma β parameter, minimum value βmin
required for active MRI, and ambipolar Elsasser number Am. Bottom: Ohmic Elsasser numberΛ.
42

CHAPTER 2. MRI-ACCRETING INNER DISC
Figure 2.6: Magnetic field strength B as a function of radius, for the fiducial disc model. Filledcircles are the model results, and the solid line is a combined polynomial fit to these results.
maintain the highest accretion efficiency at each radius against ambipolar diffusion, magnetic
field strength decreases with radius.
From 0.05 AU to about 0.09 AU, Λ 1. This region still features no dead zone. However,
Ohmic diffusion indirectly influences the disc structure. The most efficiently accreting state
in this region is that in which the magnetic field strength B increases with radius, to keep
midplane Λ at unity. On the other hand, this results in an increased suppression of the MRI
by ambipolar diffusion, and so the active zone diminishes in this region.
At about 0.09 AU, the solution changes qualitatively. The MRI-active zone is here a thin
layer between the dead zone around midplane, and the zombie zone in the disc upper layers.
As the ionization levels and the magnetic field strength drop even further, this layer becomes
thinner and thinner, and at about 0.25 AU the MRI is completely suppressed.
The Hall zone mostly overlaps with the dead zone in Fig. 2.4, and also covers parts of the thin
active layer. The Hall effect on accretion is dependent on the alignment between the magnetic
field threading the disc and the rotation axis of the disc. It could either act to completely
suppress the MRI (moving the outer boundary of the model shown here inwards), or to drive
laminar accretion near disc midplane. In the latter case, the influence on the disc structure
would depend on the ratio of the accretion efficiencies in the MRI-active and the Hall zone.
The fact that the Hall zone overlaps with a significant part of (although not with the entire)
inner disc indicates importance of including it in future studies. However, as the accretion is
laminar in the Hall-dominated regions, it cannot be trivially accounted for in the viscous disc
framework.
2.3.1.3. Viscosity, disc structure and pressure maximum
The vertically-averaged viscosity parameter α that results from the discussed structure of active,
dead and zombie zones is shown in Fig. 2.7 as a function of radius. At the inner disc edge, where
nearly all of the potassium is ionized, α 0.08. Radially outwards α decreases until at about
43

CHAPTER 2. MRI-ACCRETING INNER DISC
Figure 2.7: Vertically-averaged viscosity parameter α as a function of radius for the fiducialdisc model. Filled circles represent the model results; the solid line is a combined polynomialfit to these results. The outer boundary of the model is at 0.25 AU, the radius at which αdecreases to the minimum, dead-zone value αDZ 104. Beyond this radius it is assumed thatα αDZ (dashed horizontal line).
0.25 AU it reaches the minimum value α αDZ. This is the location at which the thin MRI-
active layer completely disappears in Fig. 2.4. Outwards from this location it is simply assumed
that α remains at the constant dead-zone value.
Fig. 2.8 shows the resulting disc temperature, midplane density and pressure, and the surface
density, as functions of radius. Most importantly, in line with expectations, the inner disc
features a local gas pressure maximum. The pressure maximum is located at 0.25 AU, where
α falls to the minimum value. Interestingly, this corresponds to the location where the MRI
becomes suppressed at all heights, but not to the inner edge of the dead zone (which occurs
where the MRI is suppressed at midplane but still survives higher up), which appears at about
0.09 AU (see Fig. 2.4). Therefore, this potential pebble trap lies in the region where the disc
midplane is only weakly turbulent. The location of the pressure maximum is also the location of
the overall maximum in the surface density. Inwards of this location, the MRI-driven accretion
efficiency (i.e., α) increases; at a constant gas accretion rate, this leads to a decrease in the
surface density. Finally, note that inwards of the pressure maximum, the temperature profile is
nearly flat. The temperature at the location of the pressure maximum is 1000 K, as expected
from the ionization potential of potassium. Outwards from the pressure maximum, temperature
decreases with radius much more steeply.
2.3.1.4. Viscous instability
The models considered here are steady-state models, meaning that all quantities are assumed
to be constant in time, with a gas accretion rate that is also constant at all radii. A viscous disc
that is in steady-state, however, can still be unstable to surface density perturbations (viscously
unstable, Lightman and Eardley 1974; Pringle 1981). Consider the time evolution equation for
44

CHAPTER 2. MRI-ACCRETING INNER DISC
Figure 2.8: Various disc structure quantities as a function of radius, for the fiducial disc model.Top left: (Vertically constant) temperature. Top right and bottom left: Midplane pressureand midplane density. Bottom right: Surface density. Solid lines show the results of the self-consistent MRI-accreting model, ending at the radius where α falls to αDZ. Beyond this radius,dashed lines show the results based on an assumption that α αDZ.
the surface density, eq. (1.11). In steady-state, BΣBt 0, corresponding to a solution Σ Σ0.
Then, consider a small perturbation, Σ0 Ñ Σ0 δΣ, leading to a perturbation in x νΣ,
x0 Ñ x0 δx, where δx pBxBΣqδΣ. Here, note that in a thin disc, both the hydrostatic
and thermal equilibria are established on timescales much shorter than the viscous timescale,
so on a viscous timescale ν can be considered a function of Σ only (at a given orbital radius).
Substituting δΣ, δx into eq. (1.11) yields
BpδxqBt
BxBΣ
1
r
BBr
3 r12 BBrr12 δx
. (2.29)
This is a diffusion equation in x, with a diffusion constant BxBΣ. If BxBΣ ¡ 0, a small
perturbation δx diminishes. However, if BxBΣ 0, a small perturbation grows, i.e., leads to
an instability.
This instability criterion can be re-formulated in terms of the steady-state solutions that
are calculated here, if it is assumed that, following the perturbation in the surface density, the
disc viscosity, temperature and the accretion rate quickly evolve to the steady-state solution in
which the surface density equals the perturbed value Σ0 δΣ. Under that assumption, 9M9x,
and the instability develops if B 9MBΣ 0, or, equivalently,
BΣB 9M 0. (2.30)
The above assumption is likely to hold since the disc viscosity and accretion come from the
MRI, which develops on the dynamical timescale (the thermal timescale also being shorter than
45

CHAPTER 2. MRI-ACCRETING INNER DISC
Figure 2.9: Surface density Σ as a function of radius, for a number of steady-state modelsolutions with M 1 Md, αDZ 104 and varying accretion rate in the range 9M 109.3 108.7 Md yr1. Outwards of 0.03 AU, at a fixed orbital radius the surface density increaseswith decreasing accretion rate.
the viscous timescale). Therefore, the steady-state models with varying gas accretion rate can
be used to check if the inner disc is viscously unstable.
This is done in Fig. 2.9 and Fig. 2.10. Fig. 2.9 shows the surface density as a function of
radius for a number of steady-state solutions with varying gas accretion rate around the fiducial
value of 9M 109 Md yr1. The plot clearly shows that beyond 0.03 AU the surface density
increases with decreasing 9M . Fig. 2.10 shows this more formally, i.e., it shows the derivative
BΣB 9M evaluated using steady-state solutions at 9M 109 Md yr1 1%, with BΣB 9M 0
outwards of 0.03 AU. Therefore, a large part of the inner disc is unstable to surface density
perturbations, or viscously unstable.
What would be the outcome of this instability? If a positive perturbation in surface density
(i.e., an over-density, δΣ ¡ 0) leads to a lower gas accretion rate, the over-density would grow.
Conversely, if δΣ 0, producing a local under-density, the accretion rate increases, expelling
even more material from the under-density. Therefore, the viscous instability would create
axisymmetric over- and under-densities, i.e., rings and gaps in the disc.
Finally, consider the viscosity ν in terms of the Shakura-Sunyaev α parameter. The insta-
bility criterion can then be written as (within the steady-state formulation)
Bpln αqBpln 9Mq 2
Bpln csqBpln 9Mq ¡ 1. (2.31)
The first and the second term on the left-hand side are plotted in Fig. 2.11 (from the same
calculation as Fig. 2.10). This explicitly shows that it is the dependence of the MRI-driven α
on the gas accretion rate (and the surface density) that drives the instability, while variations
in the sound speed cs are small.
46

CHAPTER 2. MRI-ACCRETING INNER DISC
Figure 2.10: Derivative |BΣB 9M | as a function of radius for the fiducial disc model. The solidline denotes BΣB 9M ¡ 0 (viscously stable) while the dashed line denotes BΣB 9M 0 (viscouslyunstable). Outwards of 0.03 AU, disc is viscously unstable.
Figure 2.11: Derivatives BplnαqBpln 9Mq (top) and 2BplncsqBpln 9Mq (bottom) as a function ofradius for the fiducial disk model.
47

CHAPTER 2. MRI-ACCRETING INNER DISC
Figure 2.12: Rosseland mean opacity (in cm2 g1) calculated a posteriori for the fiducial discmodel, as a function of disc location (with height in units of vertical column density). Thedashed curve denotes one pressure scale height. Over most of the region of interest in the disc,the derived opacity is within a factor of two of 10 cm2 g1, consistent with the a priori assumedvalue of opacity.
2.3.1.5. Opacity
In all of the models presented in this chapter, disc opacity is assumed to be a constant, κ 10 cm2 g1. In general, disc opacity is a function of pressure and temperature. The adopted
constant value is representative of opacity due to small dust grains. Fig. 2.12 shows an a
posteriori calculation of opacity due to dust grains, and also due to gas atomic and molecular
lines (Zhu et al. 2009), using the disc temperatures and densities inferred from the steady-state
model. In the bulk of the inner disc the calculated value is roughly in agreement with the
adopted value. The disagreement is greatest in the innermost disc, where the temperature is
higher than the sublimation temperature of dust grains, since the opacity adopted in this work
is inaccurate when dust is no longer the contributing species.
2.3.1.6. Validity of the strong-coupling limit
The models presented here assume that ambipolar diffusion suppresses the MRI based on the
criterion given by eq. (2.11). This criterion is based on numerical simulations of the MRI
performed in the strong-coupling limit (referring to the coupling between ions and neutrals in
the gas, and the way both jointly respond to the magnetic field; Bai and Stone 2011). The
strong-coupling limit is valid if ρn " ρi, i.e. if the density of neutrals is much greater than
the density of ions, and if the recombination timescale trcb for ions is much shorter than the
dynamical timescale, i.e. trcb ! tdyn. The first condition is easily fulfilled here, since the only
ionized species is potassium.
To check whether the second condition is fulfilled, we can calculate the recombination
timescale trcb as described in Section 2.2.2.2 and compare it to tdyn. The result is shown
in Fig. 2.13. The region where trcb tdyn is shown in green here, showing that this condition
48

CHAPTER 2. MRI-ACCRETING INNER DISC
Figure 2.13: Comparison of the recombination timescale (trcb) and the dynamical timescale(tdyn) as a function of location in the fiducial disk model. The solid black curve denotes thedisc midplane, and the dashed curve denotes one pressure scale height. The green region showswhere trcb tdyn (and thus where the single-fluid approximation is valid).
is fulfilled only near disc midplane inwards of 0.03 AU. This result indicates that collisional
recombinations are too slow to establish the ionization equilibrium on the orbital timescales (at
which the MRI develops). It thus follows that more realistic (more complex) chemical networks
ought to be considered in order to rely on eq. (2.11) (such as in the work by Bai 2011b).
2.3.2. Varying model parameters
2.3.2.1. Viscosity in the dead zone
In the results presented so far, the viscosity parameter in the dead zone (and the zombie zone)
is assumed to be αDZ 104. However, this is an uncertain parameter, with weak constraints
from numerical simulations. To explore the sensitivity of the inner disc structure to this value,
in Figs. 2.14–2.17 I show the results for two models in which the accretion rate 9M and the
stellar mass M are the same as in the fiducial model, but viscosity parameter in the dead zone
is taken to be αDZ 105 and 103.
Fig. 2.15 shows that, since αDZ is the minimum value of α, its precise value can drastically
change the location of the pressure maximum rPmax (where α falls to αDZ). Larger αDZ implies
a smaller rPmax . In fact, since outwards of 0.05 AU α decreases approximately as a power-law
of radius, there is a simple (approximate) relationship between the two, rPmax9α14DZ (see also
Fig. 2.17).
In terms of other disc features, the models with varying αDZ appear to be qualitatively the
same to the fiducial model. The value of αDZ does affect the magnetic field strength outwards
from 0.09 AU, where larger αDZ requires a smaller B (shown in Fig. 2.15). This corresponds
to the region where a dead zone exists around disc midplane (see Fig. 2.14). In this region, the
dead-zone viscosity contributes significantly to the total vertically-averaged viscosity parameter.
49

CHAPTER 2. MRI-ACCRETING INNER DISC
Figure 2.14: Same as Fig. 2.4, but now for αDZ 103 (left) and 105 (right).
Figure 2.15: Left: Magnetic field strength B as a function of radius. Right: α as a functionof radius. Both figures show results for the fiducial model, αDZ 104 (filled black circles),results for αDZ 103 (empty circles) and αDZ 105 (filled grey circles).
50

CHAPTER 2. MRI-ACCRETING INNER DISC
Figure 2.16: Various disc structure quantities as a function of radius: same as Fig. 2.8, but nowfor αDZ 103 (left) and 105 (right).
Figure 2.17: Radial location of the pressure maximum as a function of αDZ, showing theapproximate power-law dependence rPmax9αDZ
14.
51

CHAPTER 2. MRI-ACCRETING INNER DISC
Figure 2.18: Same as Fig. 2.4, but now for an accretion rate 9M 108 Md yr1 (left) and1010 Md yr1 (right).
2.3.2.2. Accretion rate
Next, I discuss the effects of varying the gas accretion rate 9M while keeping the stellar mass
M and the viscosity parameter in the dead zone αDZ constant. Results for a model with9M 108 Md yr1 and a model with 9M 1010 Md yr1 are shown in Figs. 2.18–2.22.
The main effect of varying 9M is that the viscous dissipation rate changes directly propor-
tionally. Thus, higher 9M makes the disc hotter, and more ionized, increasing the MRI-driven α
at any given radius (where the MRI is active). For the outer regions, this means that for higher9M the pressure maximum moves radially outwards, approximately as a power law rPmax9 9M12
(see Fig. 2.22). In the inner regions, the viscosity parameter saturates at around α 0.1 (shown
in Fig. 2.20). This happens because in the innermost disc (at high enough accretion rate) all of
potassium becomes ionized.
Some qualitative differences also arise in where the disc is MRI-active. Fig. 2.18 shows that
for 9M 1010 Md yr1, the midplane is not turbulent anywhere in the disc. Additionally,
Fig. 2.18 shows for 9M 108 Md yr1 the Hall zone (where the Hall effect might significantly
affect the accretion and the disc structure) extends inwards of the dead zone inner edge, implying
that at high 9M the pressure maximum might not move as outwards as implied by Fig. 2.22.
52

CHAPTER 2. MRI-ACCRETING INNER DISC
Figure 2.19: Same as Fig. 2.3, but for an accretion rate 9M 1010 Md yr1. This is the onlyone of the disc models shown here in which an Ohmic-dominated region arises (red region inbottom right corner of both panels).
Figure 2.20: Left: Magnetic field strength B as a function of radius. Right: α as a function ofradius. Both figures show results for the fiducial model with 9M 109 Md yr1 (filled blackcircles), a model with 9M 1010 Md yr1 (empty circles) and 9M 108 Md yr1 (filled greycircles).
53

CHAPTER 2. MRI-ACCRETING INNER DISC
Figure 2.21: Same as Fig. 2.8, but now for an accretion rate 9M 108 Md yr1 (left) and1010 Md yr1 (right).
Figure 2.22: Radial location of the pressure maximum as a function of the accretion rate 9M ,showing the approximate power law dependence rPmax9 9M12.
54

CHAPTER 2. MRI-ACCRETING INNER DISC
Figure 2.23: Same as Fig. 2.4, but for now for a stellar mass M 0.1 Md.
2.3.2.3. Stellar mass
Figs. 2.23–2.25 show the results for a model with the fiducial 9M and αDZ, but with a stellar
mass of M 0.1 Md (and a stellar radius R 1 Rd). These results show that the structure
of the inner disc around stars of different mass is virtually the same, only shifted radially
inwards. The location of the pressure maximum scales with the stellar mass as a power law,
rPmax9M13 . This follows from the Shakura-Sunyaev equations, in which the stellar mass and
orbital radius can always be combined into Mr3 (neglecting fr, since for r " R, fr 1).
Note that these models do not include heating of the disc by stellar irradiation, and so the
stellar radius R only affects the disc structure through fr, which can be neglected at r larger
than a few R.
2.4. Discussion and conclusions
I used the Shakura-Sunyaev α-disc model coupled with a parametrization of the MRI-driven
α to investigate the structure of the thermally-ionized inner regions of protoplanetary discs in
steady-state. I produced models of discs with various gas accretion rates (1010–108 Md yr1),
stellar masses (0.1–1 Md) and minimum values of α (i.e., value of α in MRI-dead zones; 105–
55

CHAPTER 2. MRI-ACCRETING INNER DISC
Figure 2.24: Left: Magnetic field strength B as a function of radius. Right: α as a function ofradius. Both figures show results for the fiducial model with M 1 Md (filled black circles)and a model with M 0.1 Md (empty circles).
Figure 2.25: Same as Fig. 2.8, but now for a stellar mass M 0.1 Md.
56

CHAPTER 2. MRI-ACCRETING INNER DISC
103).
All of the models feature a local gas pressure maximum at a few tenths of an AU from
the star. Radially outwards from the pressure maximum the MRI is completely suppressed;
just inwards of it the MRI is suppressed around disc midplane, but an MRI-active zone exists
above (and below) the midplane. It is only closer to the star (and not in all models) that the
disc midplane becomes MRI-active. In other words, at the location of the pressure maximum,
the disc midplane is weakly-turbulent. This could have an important impact on the growth
and evolution of pebbles that become trapped at this location. The exact orbital radius of
the pressure maximum scales with model parameters via simple power-laws: rPmax9α14DZ , M
13
and 9M12.
These models include suppression of the MRI by Ohmic and ambipolar diffusion, but not
the Hall effect. To explore how the Hall effect would modify the obtained results, I calculated
which regions of the disc have a Hall Elsasser number χ 1. This Hall zone largely coincides
with the Ohmic dead zone, and partially with the MRI-active zone. Therefore, the Hall effect
could move the pressure maximum radially inwards, if it simply shuts off the MRI within this
Hall zone. The effects are less clear if the Hall effect leads to an increased efficiency of accretion,
in which case the arising disc structure would depend on the physics at the boundary between
the MRI-viscous, turbulent region and Hall-dominated inviscid, laminar region.
Note also that the suppression of the MRI by ambipolar diffusion is considered in the strong-
coupling limit, which is found to be violated over most of the disc due to long recombination
timescales. However, the models presented here consider only a single ionized species, and a
more complex chemical network would have more recombination pathways. In particular, small
dust grains can adsorb free charges, which then recombine on grain surfaces faster than in the
gas phase. Including dust grains in the chemistry would have far-reaching consequences, since
this might effectively reduce the ionization levels compared to the case where grains are absent,
and might lead to a stronger suppression of the MRI (Sano et al. 2000; Ilgner and Nelson
2006; Wardle 2007; Salmeron and Wardle 2008; Bai and Goodman 2009), although dust can
also positively contribute to the disc ionization state at high temperatures (Desch and Turner
2015).
Additionally, the above results show that the location of the pressure maximum does not
correspond to the dead zone inner edge, but rather to the active zone outer edge. However,
there could be no such outer edge in a disc that is also ionized by stellar X-rays and cosmic rays.
As discussed in Section 1.2.3, at short orbital radii the X-rays and the cosmic rays may activate
the MRI in the disc upper layers. The thermally-ionized active zone in the inner disc would
then smoothly connect to the outer disc, see Fig. 1.5. In that case, the exact location of the
pressure maximum, coinciding with the minimum in disc viscosity, would additionally depend
on the relative importance of thermal and non-thermal sources of ionization. In Chapters 5
and 6 I will revisit the inner disc model, and consider both the effects of X-rays and cosmic
rays, and the dust grains.
57

CHAPTER 2. MRI-ACCRETING INNER DISC
Finally, at a given orbital radius, the vertically-averaged viscosity parameter increases with
gas accretion rate so much that the gas surface density decreases, BΣB 9M 0. This implies
that the steady-state inner disc is unstable to perturbations in the gas surface density. This
so-called viscous instability could lead to gas concentrating into rings. However, further study
is required to determine if the disc is stabilized when a more detailed disc chemical and thermal
structure is considered.
58

3 Early stages of planet formation in the
inner disc
3.1. Introduction
In Chapter 2 I discussed a steady-state model of the gas in the inner regions of protoplanetary
discs. In this chapter, I examine the evolution of dust in the obtained gas structure.
The main goal of this chapter is to examine if the evolution of dust leads to enhancement
of solids at short orbital periods, as necessary for the formation of the super-Earths. To create
a dust-rich inner disc, the radial drift of dust particles from the outer disc needs to be stopped
or slowed down. The radial drift of small particles (that are in the Epstein drag regime) slows
down closer to the star in conventional disc models, i.e., in which the gas density and pressure
increase radially inwards (Youdin and Shu 2002; Youdin and Chiang 2004; Birnstiel et al. 2010;
2012; Drazkowska et al. 2016). This can concentrate dust in the inner disc to some extent. On
the other hand, if dust grains are large and thereby only marginally coupled to the gas, the
radial drift can be fully stopped inside an axisymmetric local gas pressure maximum that is
expected to form if the accretion in the inner disc is driven by the MRI (Kretke et al. 2009;
Dzyurkevich et al. 2010; Drazkowska et al. 2013; Chatterjee and Tan 2014). How coupled the
dust grains are to the gas depends on their size (Weidenschilling 1977). Therefore, I consider
both the spatial evolution of the dust, and the evolution of the dust grain size, including growth,
fragmentation and radial drift.
Furthermore, to form the solid core of a planet, accumulated dust grains must grow larger.
As discussed in Chapter 1, collisions and sticking between small dust grains produce millimetre
to centimetre-sized pebbles. These pebbles do not stick as efficiently as small grains, raising
the question of how solids proceed to grow beyond these sizes. One suggestion is that larger
solid bodies, tens of kilometres in size (so-called planetesimals), may grow directly from small
pebbles, by the concentration of pebbles into dense clumps that become gravitationally unstable
(Youdin and Goodman 2005). Following dust evolution calculations in sections 3.2 and 3.3, I
investigate the possibility of planetesimal formation in the inner disc in Section 3.4.
An important caveat to the calculations presented in this chapter is that the dust is evolved
in a gas disc that is fixed in time. Dust grains can act to suppress the MRI by lowering
the coupling between the gas and the magnetic field (e.g. Sano et al. 2000; Ilgner and Nelson
59

CHAPTER 3. EARLY STAGES OF PLANET FORMATION IN THE INNER DISC
2006), and could thus significantly alter the gas disc structure. Moreover, at high dust-to-gas
ratios, which I show can be achieved in the inner disc, dust becomes dynamically important
and the dynamical back-reaction on the gas should be taken into account. In Section 3.5, these
effects, and how they might influence the obtained results, are discussed qualitatively. The
self-consistent feedback of dust enhancement on the gas disc structure should be addressed in
future studies.
3.2. Methods
3.2.1. Gas disc model
The structure of the gas disc (gas surface density, temperature, pressure and viscosity) is
obtained from the steady-state models of the inner protoplanetary gas disc presented in Chapter
2. In these models the viscosity (α parameter1) is determined self-consistently with the disc
structure (Shakura and Sunyaev 1973), thermal ionization and MRI criteria (Bai and Stone
2011; Bai 2011a). The parameters of the model are the stellar mass and radius (M, R),
gas accretion rate ( 9Mg), and assumed viscosity parameter inside the MRI-dead zones (αDZ).
Recall that αDZ is also the minimum viscosity parameter, in the sense that α αDZ even
if the MRI is active, if it implies a lower value. In this work I primarily use M 1 Md,
R 2.33 Rd, 9Mg 108 Md yr1 and αDZ 104. The disc structure for these parameters is
shown in Fig. 3.1. The local gas pressure maximum is at an orbital distance of 0.7 AU, and
temperature and surface density at that location are 1000 K and 5000 g cm2, respectively.
Outwards from the pressure (and the surface density) maximum the MRI is suppressed and
α αDZ.
Consider, briefly, how the disc structure depends on these parameters. For a higher gas
accretion rate 9Mg the radial α profile is roughly an outward-translated version of the one shown
in the top panel of Fig. 3.1, and inward-translated for a smaller 9Mg. The radial location of the
local gas pressure maximum scales with the accretion rate approximately as 9M12g . For a higher
αDZ the α falls to this value closer to the star, and vice versa, but the value of α as a function of
orbital distance remains almost the same otherwise; as a result, the radial location of the local
pressure maximum scales with the minimum dead-zone viscosity as α14DZ . Furthermore, inwards
of the pressure maximum the temperature has to be sufficiently high for thermal ionization of
potassium to support the MRI and so it is always larger than 1000 K, regardless of the exact
choice of 9Mg and αDZ. For a steady-state vertically-isothermal α-disc the accretion rate is9Mg 3πc2
sαΣgΩ (ignoring an additional factor which depends on the boundary condition at
the inner disc edge, and which becomes unimportant far away from the edge). Further assuming
(as is approximately the case) that the temperature at the location of the pressure maximum
1For simplicity, in this chapter I denote the vertically-averaged viscosity parameter α simply as α.
60

CHAPTER 3. EARLY STAGES OF PLANET FORMATION IN THE INNER DISC
is constant regardless of the disc parameters, it follows that the maximum gas surface density
approximately depends on the disc parameters2as 9M14g and α
58DZ .
The dynamical back-reaction of the dust on the gas and the effect of the dust on the MRI
are neglected in this chapter, and the timescale on which the dust evolves is much shorter than
the Myr timescale on which the accretion rate evolves. Thus, the structure of the gas disc is
held fixed, i.e. not evolved in time.
3.2.2. Dust evolution model
The dust particle size distribution is evolved using the two-population model of Birnstiel et al.
(2012). The dust surface density Σd is evolved using the advection-diffusion equation
BΣd
Bt 1
r
BBrr
ΣduDgasΣg
BBr
Σd
Σg
0 , (3.1)
where r is the cylindrical radius, u is the dust advection velocity, Dgas is the gas diffusivity
(assumed to be equal to the MRI-driven gas viscosity) and Σg is the gas surface density.
The dust advection velocity is a sum of the velocities due to advection with the accreting
gas and radial drift. For particles with Stokes number Sti πρsai2Σg (with ρs the internal
density of the dust and ai the particle size), and adopting the terminal velocity approximation
(e.g. Takeuchi and Lin 2002), the dust velocity is given by
ui 1
1 St2i
ugas 2
Sti St1i
udrift , (3.2)
where
udrift c2s
2vK
d lnP
d lnr, (3.3)
with cs the speed of sound, vK the Keplerian velocity and P the midplane gas pressure. Small
particles (St! 1) move with the gas, and larger particles can move faster or slower than the
gas, depending on the sign of the pressure gradient.
In the Birnstiel et al. (2012) model the dust surface density Σd and dust advection velocity
u are the sum and the mass-weighted average, respectively, of the surface density and velocity
of two populations of particles: small monomer-sized particles (a0 1µm) and large particles
(a1). The size of the large particles evolves in time and space. At first, dust grains grow, starting
at the monomer size. Then, at each radius the size of the large particles is set by whichever
process yields the smallest size limit: radial drift (adrift), where grains larger than adrift radially
drift more quickly than they can grow; drift-fragmentation (adf), where grains larger than adf
fragment due to relative radial drift velocities; or turbulent fragmentation (afrag), where grains
2Derivation of the scalings from the Shakura-Sunyaev equations takes into account the small correction dueto the dependence of the temperature on the disc parameters and yields that the maximum surface density
depends on the disc parameters as 9M310g and α
1320DZ . These small corrections are omitted here for simplicity.
61

CHAPTER 3. EARLY STAGES OF PLANET FORMATION IN THE INNER DISC
10 4
10 3
10 2
10 1
102
103
Mid
plan
e pr
essu
re [e
rg c
m3 ]
102
103
Surfa
ce d
ensit
y [g
cm
2 ]
10 1 100
Radius [AU]
1000
2000
3000
4000
Tem
pera
ture
[K]
Figure 3.1: Gas disc structure from the steady-state model for M 1 Md, R 2.34 Rd,9Mg 108 Md yr1 and αDZ 104. From top to bottom: α parameter, midplane pressure,
surface density and temperature, as functions of radius. Location of the local gas pressuremaximum due to the MRI is indicated by the vertical dashed line.
62

CHAPTER 3. EARLY STAGES OF PLANET FORMATION IN THE INNER DISC
larger than afrag fragment due to relative velocities induced by turbulence.
In the innermost protoplanetary disc, inside the water ice line, the main dust species are
silicate grains. Therefore, the bulk density of particles is set to ρs 3 g cm3, and the critical
fragmentation velocity to uf 1 m s1, based on experiments on collisions of silicate grains
(Blum and Munch 1993; Beitz et al. 2011; Schrapler et al. 2012; Bukhari Syed et al. 2017) of
similar size (the regime applicable in the Birnstiel et al. 2012 model used here).3
The viscosity parameter α due to the MRI-turbulence from the gas disc model is determined
as a vertical average at each radius. Here, it is assumed that this vertically-averaged α equals
the strength of turbulence that particles feel, which in turn determines the particle size due
to turbulent fragmentation (afrag) and the radial turbulent mixing (diffusivity Dgas). However,
the viscosity (and the level of turbulence) can be different at the disc midplane compared to
the upper layers of the disc, depending on where the non-ideal magnetohydrodynamic effects
suppress the MRI. Dust tends to settle towards midplane, its scale height being determined
by the balance between gravitational settling and vertical turbulent mixing (e.g. Youdin and
Lithwick 2007). The use of a vertically-averaged α could thus be invalid in regions where the
disc midplane is weakly turbulent. Nevertheless, I proceed with this assumption and check
the robustness of the obtained results by swapping the vertically-averaged α parameter for the
midplane value in one run, and recover qualitatively the same results.
3.2.3. Numerical methods
The advection-diffusion equation (3.1) is integrated using an explicit first order in time and
second order in space finite element method. The advection term is integrated with an upwind
scheme using a van Leer flux limiter. The numerical scheme has been developed and described
in detail by Owen (2014). The modification made for this work, implemented by J. E. Owen,
is the inclusion of the Birnstiel et al. (2012) dust evolution algorithm. The simulations in this
work use 262 cells in the radial direction with a 0.002 AU spacing inwards of 0.4 AU and a
0.01 AU spacing outwards. The inner boundary is set to 0.016 AU, and the outer boundary is
set to 1 AU (i.e. outside the pressure maximum, but inside the water ice line). The time-step is
set with respect to the spatial resolution, the advection speed and the diffusion coefficient, so
that it obeys the Courant-Friedrichs-Lewy condition. Following Birnstiel et al. (2012), at each
time step the size of the large particles is updated to the smallest of the four size limits (agrowth,
adrift, adf or afrag). The outer boundary condition is a constant dust accretion rate. This is not,
3Note that simulations of grain collisions (Meru et al. 2013) indicate that the critical fragmentation velocitycould be significantly higher for porous grains than for compact ones, for a range of porosities that is not robustlycovered by the above experiments. In the fragmentation-limited regime particle size depends quadratically on uf .If porosity is important, and uf is higher by, e.g., a factor of 10, particle sizes (and their Stokes number) wouldbe larger by a factor of 100, strongly affecting how coupled particles are to the gas flow and how susceptible toradial drift. However, there is a variety of processes that lead to particles becoming less porous (compactified)– e.g., collisions that result in coagulation (simulations by Meru et al. 2013, experiments by Kothe et al. 2010),collisions that result in bouncing (Weidling et al. 2009) and collisions of larger grains with monomers (Schraplerand Blum 2011). Therefore, I use the compact grain value of uf 1 m s1.
63

CHAPTER 3. EARLY STAGES OF PLANET FORMATION IN THE INNER DISC
10 1 100
Radius [AU]
10 2
10 1
100
Dust
-to-g
as ra
tio
Md/Mg110 1
10 2
Figure 3.2: Dust-to-gas ratio ΣdΣg as a function of radius after 0.2 Myr, for various dustaccretion rates at the outer boundary, as indicated in plot legend. Location of the local gaspressure maximum due to the MRI is indicated by the vertical dashed line, and location of thedust sublimation line by the vertical dotted line.
in general, a fixed quantity and it can vary with time, determined by the radial drift of dust
from the outer disc (e.g. Birnstiel et al. 2012). Therefore, in this work it is varied in different
simulations. Dust particle size at the outer boundary is calculated self-consistently.
Furthermore, the effects of dust sublimation are neglected. Note that the temperature in
the adopted gas disc model exceeds the dust sublimation temperature (1500 K) only inwards
of 0.1 AU.
3.3. Results
Initially, the dust-to-gas ratio is 0.01 at all radii and all dust grains are monomers (a 1µm).
The dust is evolved for 0.2 Myr, by which time it has reached steady state. The steady-state
dust-to-gas ratio is shown in Fig. 3.2 as a function of radius for three different values of dust
accretion rates 9Md at the outer boundary condition. For any given dust accretion rate, the
steady-state dust-to-gas ratio is roughly constant inwards of the pressure maximum (indicated
by the vertical dashed line), and it decreases outwards from the pressure maximum. There is
only a moderate accumulation of dust at the pressure maximum, compared to the rest of the
inner disc. This implies that the pressure maximum does not efficiently trap dust particles.
Essentially, the particles do not feel significant gas drag, and thus do not significantly feel
the effect of the change in the sign of the pressure gradient inwards of the pressure maximum.
This happens because, as a result of the MRI-induced turbulence and particle fragmentation,
64

CHAPTER 3. EARLY STAGES OF PLANET FORMATION IN THE INNER DISC
the particle size is very small. Fig. 3.3 shows the three dust size limits (due to radial drift,
drift-fragmentation and turbulent fragmentation) as functions of radius, calculated in steady
state. The smallest of the three (afrag), due to turbulent fragmentation, sets the size of the
population of large particles in these simulations, which dictates the evolution of dust overall.
Particle size is thus limited to only a few millimetres near the pressure maximum (indicated by
the vertical dashed line), and the particles are monomer-sized in the innermost disc.
The particle size determines, through the Stokes number, how coupled the dust is to the
gas. Thus, the particle size determines to what extent the particles move with the accreting
gas towards the star and also by how much they are slowed down or sped up by the gas drag.
In this case, inwards of the pressure maximum (and outwards from the pressure minimum at
0.2 AU) the gas drag acts outwards (udrift ¡ 0). However, as dust particles are small inside the
pressure maximum (St 4 104 even for the large particles) and their size further decreases
inwards, the dust advection velocity is outwards only in a very narrow region. Consequently,
after accounting for the diffusivity (i.e., the radial turbulent mixing of dust), the accumulation
of solids inside the pressure maximum is moderate compared to the rest of the inner disc.
The dust advection velocity used here is a mass-weighted average of the velocity of the
monomer-sized particles and the large particles (of size afrag, Fig. 3.3). The monomer-sized
particles are advected by the gas through the pressure maximum, and it can be shown that
an individual large particle will also not be trapped. This is because the dust particles are in
the fragmentation limit, in which the particles are fragmented faster than they drift. The drift
timescale for the large particles inside the pressure trap (the region inwards of the pressure
maximum where their advection velocity is outwards) can be estimated by
tdrift 1
2
dtrap
u1prPmaxq, (3.4)
where dtrap 0.06 AU is the radial width of the trap, and the particle velocity is u1 2 cm s1
(see eq. (3.2)) is evaluated just inwards of the pressure maximum. The velocity u1 decreases
inwards, and so this estimate, tdrift 7400 yr, is a lower limit. The collisional (i.e., fragmen-
tation) timescale for the large particles, tcol pnσ∆vq1, is much shorter in comparison. Here
n fmρdmd is the number density of large particles, fm is the mass fraction of the large
particles (fm 0.75 in the fragmentation limit, Birnstiel et al. 2012), ρd ΣdΩp?2πcsq is the
midplane mass density of particles, md is mass of a single particle, σ is the collisional cross sec-
tion and ∆v ?3αStcs is the typical relative velocity between the particles due to turbulence
65
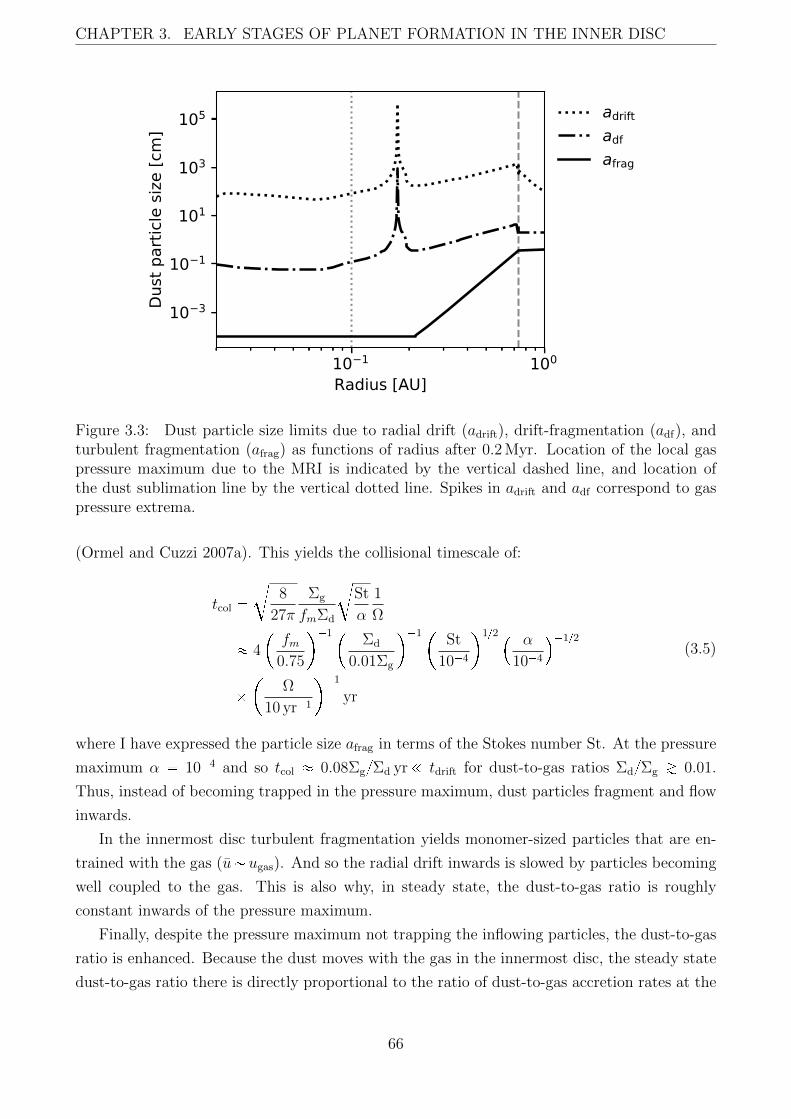
CHAPTER 3. EARLY STAGES OF PLANET FORMATION IN THE INNER DISC
10 1 100
Radius [AU]
10 3
10 1
101
103
105
Dust
par
ticle
size
[cm
]
adriftadfafrag
Figure 3.3: Dust particle size limits due to radial drift (adrift), drift-fragmentation (adf), andturbulent fragmentation (afrag) as functions of radius after 0.2 Myr. Location of the local gaspressure maximum due to the MRI is indicated by the vertical dashed line, and location ofthe dust sublimation line by the vertical dotted line. Spikes in adrift and adf correspond to gaspressure extrema.
(Ormel and Cuzzi 2007a). This yields the collisional timescale of:
tcol c
8
27π
Σg
fmΣd
cSt
α
1
Ω
4
fm
0.75
1Σd
0.01Σg
1St
104
12 α
104
12
Ω
10 yr1
1
yr
(3.5)
where I have expressed the particle size afrag in terms of the Stokes number St. At the pressure
maximum α 104 and so tcol 0.08ΣgΣd yr! tdrift for dust-to-gas ratios ΣdΣg Á 0.01.
Thus, instead of becoming trapped in the pressure maximum, dust particles fragment and flow
inwards.
In the innermost disc turbulent fragmentation yields monomer-sized particles that are en-
trained with the gas (uugas). And so the radial drift inwards is slowed by particles becoming
well coupled to the gas. This is also why, in steady state, the dust-to-gas ratio is roughly
constant inwards of the pressure maximum.
Finally, despite the pressure maximum not trapping the inflowing particles, the dust-to-gas
ratio is enhanced. Because the dust moves with the gas in the innermost disc, the steady state
dust-to-gas ratio there is directly proportional to the ratio of dust-to-gas accretion rates at the
66

CHAPTER 3. EARLY STAGES OF PLANET FORMATION IN THE INNER DISC
outer boundary, 9Md 9Mg. The initial dust-to-gas ratio everywhere is ΣdΣg 102. For this
ratio to be constant over time, the ratio of accretion rates would have to be 9Md 9Mg 102
at the outer boundary. However, the growth of dust grains in the outer disc, and their radial
drift inwards, means that 9Md 9Mg ¡ 102 at the outer boundary of the inner disc (i.e., dust
accretes inwards preferentially compared to gas). Hence, the dust-to-gas ratio in the inner disc
in steady-state is ΣdΣg ¡ 102. In other words, as Fig. 3.2 shows, radial drift of grains from
the outer disc leads to an enrichment of solids in the inner disc.
What level of the enrichment is attainable depends on the ratio of dust and gas accretion
rates 9Md 9Mg, i.e. how quickly the grains drift from the outer disc relative to gas accretion. Since
the grain growth in the outer disc is limited by radial drift rather than fragmentation (Birnstiel
et al. 2012), high grain drift rates are possible. For example, assuming that ΣdΣg 102 in
the outer disc, achieving 9Md 9Mg 1 requires the radial drift velocity of grains ( 2 St udrift)
to reach 102ugas. For the standard α-disc model and α 104 (extrapolation of the disc model
shown in Fig. 3.1) this is satisfied if grains grow to St 102. This corresponds to a particle size
an order of magnitude below the radial drift limit (adrift) throughout the outer disc. Therefore,
the grains easily grow large enough to achieve accretion rates of 9Md 9Mg Á 1. These grains in
the outer disc will contain ices which will evaporate as grains drift across the ice lines, towards
the inner disc. However, even in the outermost disc silicates account for a considerable portion
of the total solid mass (e.g., adopting the abundances of oxygen and carbon in their main
molecular carriers from Oberg et al. 2011, 23% of the total oxygen and carbon mass in the
outer disc is in silicates and other refractories). Hence, Fig. 3.2 features dust accretion rates up
to 9Md 9Mg 1, in which case the dust-to-gas ratio in the inner disc also approaches unity.
3.4. Implications for planetesimal formation
The above results show that the MRI yields a dust-enhanced inner disc, although at the expense
of the dust particle size. Furthermore, as there is no trap for the dust particles, the accumulation
of dust is limited by the dust inflow rate from the outer disc, and does not increase indefinitely.
In this section I explore if further concentration of particles via the streaming instability (SI;
Youdin and Goodman 2005) and subsequent gravitational collapse into planetesimals could be
the next step towards forming the close-in super-Earths and mini-Neptunes.
The SI can greatly concentrate dust particles if the ratio of dust-to-gas bulk densities is
ρdρgÁ 1 (Youdin and Goodman 2005; Johansen and Youdin 2007). This is most likely to be
attained in the disc midplane, as dust particles gravitationally settle. The settling is balanced
by turbulent stirring. One source of turbulence is the MRI. To reach ρdρg ¥ 1 in the midplane
in the presence of such turbulence, the dust-to-gas surface density ratio ΣdΣg needs to be
greater than or equal to Zcr1 aαpSt αq (Carrera et al. 2017).
Even in discs that are weakly turbulent or completely laminar, as dust settles the dust-gas
67

CHAPTER 3. EARLY STAGES OF PLANET FORMATION IN THE INNER DISC
interaction leads to turbulence (self-stirring) which can prevent clumping by the SI. In this case,
SI can only successfully concentrate dust particles if the dust-to-gas ratio ΣdΣg is greater than
a critical value Zcr2 that depends on the particle Stokes number (Johansen et al. 2009; Carrera
et al. 2015). For St 0.1 (relevant to the simulations shown here) this critical value has been
most recently revised by Yang et al. (2017), who find
logZcr2 0.1 log2 St 0.2 log St 1.76 . (3.6)
Small dust grains that are entrained with the gas do not participate in the SI. Hence, to compare
the above results against the SI criteria, I use the dust-to-gas ratio fmΣdΣg of the large grain
population only (where fm 0.75 is the mass fraction of large particles; Birnstiel et al. 2012).
The top panel of Fig. 3.4 compares this dust-to-gas ratio, for the outer boundary condition9Md 9Mg 1, with the above two criteria for the onset of the SI. This plot shows that in the
inner disc, turbulence due to the MRI is generally more prohibitive to dust settling than the
turbulence due to dust-gas interactions. Both conditions are fulfilled only near the pressure
(and density) maximum.
Provided that the SI successfully concentrates dust particles in the disc midplane, the dust
bulk density there may reach up to 100 – 1000 times the local gas density (Johansen and Youdin
2007). Gravitational collapse of such particle concentrations will occur if the dust density
exceeds the local Roche density (below which the star can tidally disrupt the fragment), ρRoche 9M4πr3. Comparison of ρRoche with the midplane gas densities in the steady-state MRI disc
(Fig. 3.4, bottom panel) shows that the condition for gravitational collapse is only satisfied near
the pressure (and density) maximum, or at larger orbital distances. Importantly, the bottom
panel of Fig. 3.4 shows that the possibility of gravitational collapse of solids at short orbital
distances is severely limited by the Roche density.
Overall, given the stellar and disc parameters used here, the SI and the gravitational collapse
pathway to planetesimals is viable in the inner disc only in a very narrow region near the pressure
maximum. For gas accretion rates larger than the one used here ( 9Mg ¡ 108 Md yr1, that
could be expected in the early phase of disc evolution, e.g. Manara et al. 2012) this conclusion
will hold, while for sufficiently smaller accretion rates planetesimals would not form in this way
anywhere near or inwards of the pressure maximum. Firstly, in both cases dust evolution is
expected to yield roughly the same steady-state dust-to-gas ratios given the same ratio of dust
and gas accretion rates at the outer boundary. To confirm this conclusion, I repeat the dust
evolution calculations for the gas accretion rate of 9Mg 109 Md yr1, obtaining results very
similar to those above. In addition to similar steady-state dust-to-gas ratios, the particle Stokes
number sharply drops inwards of the pressure maximum, and the SI is similarly triggered only
around the pressure maximum. This is because the slope of the increase in α inwards of the
pressure maximum is roughly the same for different 9Mg. Hence the SI criteria is expected to
be fulfilled only near the pressure maximum for higher gas accretion rates as well.
68

CHAPTER 3. EARLY STAGES OF PLANET FORMATION IN THE INNER DISC
10 1 100
Radius [AU]
10 1
100
Dust
-to-g
as ra
tio
fm d/ gZcr1Zcr2
10 1 100
Radius [AU]
10 7
10 6
10 5
10 4
10 3
10 2
10 1
Dens
ity [g
cm
3 ]
d( = 100 g)d( = 1000 g)Roche
Figure 3.4: Top panel: Dust-to-gas ratio of large dust grains fmΣdΣg as a function of radius
(when 9Md 9Mg 1 at the outer boundary; fm 0.75), compared to the two criteria for theonset of the streaming instabilities.Bottom panel: Expected peak local dust densities ρd if streaming instabilities successfullyconcentrate particles in the disc midplane as functions of radius, compared to the Roche densityρRoche. In both panels the vertical dashed line indicates location of the local pressure maximum,and the dotted line indicates the location of the dust sublimation line.
69

CHAPTER 3. EARLY STAGES OF PLANET FORMATION IN THE INNER DISC
Secondly, even if SI is successfully triggered, to form planetesimals the peak dust density
needs to be above the Roche density. The peak dust density scales with the midplane gas density
at the pressure maximum, so it scales with the gas accretion rate approximately as 9M12g , and
with the radial location of the pressure (and density) maximum as r1Pmax
. Since the peak dust
density is larger than the Roche density at the pressure maximum for 9Mg 108 Md yr1,
and the Roche density ρRoche9r3, for 9Mg ¡ 108 Md yr1 the gravitational collapse criterion
will also be fulfilled near the pressure maximum, while for a sufficiently smaller accretion rate
(including 9Mg 109 Md yr1) peak dust density will be too low.
Moreover, it is important to note that, in order for the SI to operate, there must be a relative
azimuthal velocity between the dust and gas (e.g. Squire and Hopkins 2018), in addition to
the criteria discussed above. At the pressure maximum itself, however, this relative velocity
vanishes.
However, the calculations presented here do not include the effects of dust on the gas
dynamics and on the MRI. The latter effect in particular may relax some of the constraints on
the SI, and this possibility is discussed in Section 3.5.
3.5. Discussion and conclusions
In this chapter I have investigated the earliest phase of planet formation that is the evolution
of dust grains in the inner disc that is viscously accreting due to the MRI. The MRI-accreting
inner disc features a local gas pressure maximum at the orbital distance of a few tenths of AU.
Taking into account the effect of the MRI-induced turbulence on the dust grain size, I find that
fragmentation of particles due to turbulent relative velocities limits the particle size to below
few millimetres. As a result, the particles are not efficiently accumulated inside the pressure
maximum as hypothesised by Chatterjee and Tan (2014); Hu et al. (2018). Regardless of that,
as the particles become well coupled to the gas, the radial drift is stopped in the inner disc,
and the dust-to-gas ratio is enhanced throughout the inner disc. Thus, the local gas pressure
maximum might play a lesser role in the planet formation in the inner disc than previously
thought.
The pressure maximum is, however, still the location of a local density maximum in both
gas and dust. I explored if the resulting inner disc structure that is enriched in dust could be
susceptible to the onset of the streaming instabilities. This pathway to planetesimals seems to
be viable only in a narrow region near the pressure (and density) maximum, for the chosen disc
parameters.
The gas is not, however, evolved in this work and effects of the growing amounts of dust
onto the MRI have not been taken into account. Dust grains lower the gas ionization levels
by absorbing free charges and enhancing recombination rates, as ions recombine on the grains
(Draine and Sutin 1987; Ilgner and Nelson 2006). Charged grains are not themselves well
70

CHAPTER 3. EARLY STAGES OF PLANET FORMATION IN THE INNER DISC
coupled to the magnetic field as they are too massive, and so their presence promotes the
non-ideal MHD effects which can suppress the MRI (Sano et al. 2000; Ilgner and Nelson 2006;
Wardle 2007; Salmeron and Wardle 2008; Bai and Goodman 2009). The likely result of taking
dust effects into account is thus weakened turbulence, and the change of the disc structure in
the longer term. The consequences can only be investigated by modelling both the gas and
the dust self-consistently. However, one can sketch out a potential scenario by considering the
relevant timescales.
Assuming that the steady-state solution of the gas structure (Fig. 3.1) is reached before
dust starts affecting the MRI, we can expect the dust enhancement of the inner disc to ensue.
At a certain dust-to-gas ratio the dust will suppress the MRI, and we can expect the levels
of turbulence to adapt almost instantly, as the timescale of the magnetic field regeneration
is the orbital timescale torb (e.g. Balbus and Hawley 1991). With the decreasing levels of
turbulence, the dust particle size will rapidly grow due to particle coagulation. The growth due
to coagulation happens on the timescales of ΣgΣdtorb (e.g. Brauer et al. 2008), so faster than
102torb if the inner disc is enriched in dust.
Concurrently, due to larger particle size and lower turbulent stirring the particles would
vertically settle towards the midplane and radially towards the pressure maximum. Such for-
mation of a ring of solids could potentially trigger formation of larger bodies (as hypothesized
by e.g. Chatterjee and Tan 2014). The larger particle size and the settling towards the midplane
would likely trigger the streaming instability (inwards of the pressure maximum; see Fig. 3.4).
However, it is unclear if this could lead to the formation of planetesimals, as a gravitational
collapse is unlikely due to the low bulk dust densities and high Roche density in the inner disc.
The gas surface density will change slowly in comparison to the above processes, on the
long viscous timescale, 103 – 105torb from the pressure minimum to the pressure maximum
in the model considered here. The decrease in viscosity would lead to an increase in the gas
surface density on this timescale. The gas surface density maximum and the pressure maximum
would move inwards. However, if thresholds to form planetesimals are crossed, the small dust
grains suppressing the MRI would be removed from the disc. This would increase the viscosity,
decrease the gas surface density and move the pressure maximum outwards. Whether these
processes are balanced in another kind of a steady state, or the behaviour of the inner disc
is dynamic and quasi-periodic, must be investigated through self-consistent modelling of dust,
gas and the MRI.
At high dust-to-gas ratios the dust also becomes dynamically important, and affects the
gas disc structure through the drag backreaction (Nakagawa et al. 1986). The gas rotation
profile is then driven towards Keplerian, and as a result the radial gas pressure profile flattens.
This, in turn, slows down the radial drift of dust particles. If dust already piles up in the inner
disc due to radial drift being slower than in the outer disc, the dust backreaction amplifies
the effect (Drazkowska et al. 2016). In this work, dust enhancement is driven by the dust
grains already being completely coupled to the gas in the innermost disc, and thus the effect of
71

CHAPTER 3. EARLY STAGES OF PLANET FORMATION IN THE INNER DISC
dust backreaction would be limited. However, the backreaction would become important if the
dust grains grow (e.g. due to the suppression of the MRI-induced turbulence discussed above),
especially near the pressure maximum. If the dust grains grow in the innermost disc where the
pressure gradient is negative, the backreaction would slow down the loss of dust to the star.
However, the backreaction would also limit the concentration of dust that can be achieved at
the pressure maximum, since it acts to flatten the overall gas pressure profile (Taki et al. 2016).
In summary, the results presented here suggest that the inner disc might support formation
of the super-Earths. However, the self-consistent evolution of the dust and the gas needs to be
studied.
72

4 Atmospheres of planets formed in the
inner disc
4.1. Introduction
It was shown in Chapter 3 that planetesimal formation through the streaming instability and
gravitational collapse is challenging despite the dust enhancement in the inner disc. Although
these conclusions could change when the feedback of dust onto gas is taken into account, it is
not presently clear how exactly planetesimals or cores would arise in the inner disc, and it is
not possible to predict properties of solid cores formed in the inner disc. Nevertheless, orbital
distances, radii and masses of many close-in planets have been well determined observationally.
Thus, in this chapter I use observational results to perform a separate test of super-Earth for-
mation in the inner disc by considering accretion of planetary atmospheres and their subsequent
evolution.
Recall, from Chapter 1, that the atmospheres of many of the close-in super-Earths and
mini-Neptunes are H/He dominated (e.g. Jontof-Hutter et al. 2016) and they typically make
up 0.1 – 10% of their total mass (Lopez and Fortney 2014; Wolfgang and Lopez 2015). Thus,
they are considerably more massive than the atmospheres of the planets in the inner Solar
system. Outgassing of hydrogen from a rocky core is not sufficient to explain the majority
of these atmospheres (Rogers et al. 2011). Thus these atmospheres are most likely composed
of gas accreted from the protoplanetary disc after the formation of a solid core. If so, these
atmospheres are presumably formed steadily through core accretion. In core accretion, the
gaseous envelope is connected to the disc. It remains in a quasi-hydrostatic equilibrium and
contracts as it cools, allowing more gas to be accreted (e.g. Rafikov 2006; Lee et al. 2014; Lee
and Chiang 2015).
Lee et al. (2014) (see also Lee and Chiang 2015; 2016; Lee et al. 2017) argue that accretion
onto a super-Earth-sized solid core is an efficient process, and that there is a theoretical problem
of how to stop the super-Earth cores from undergoing runaway accretion and becoming gas
giants (Mizuno 1980). A solution was proposed in Lee and Chiang (2016), where they suggest
that the final assembly of super-Earth cores only occurs towards the end of the protoplanetary
disc lifetime, so that their atmospheres are accreted from the gas-poor “transition discs”, i.e.,
during disc dispersal.
73

CHAPTER 4. ATMOSPHERES OF PLANETS FORMED IN THE INNER DISC
On the other hand, the inner disc models discussed in Chapter 2 predict in a steady state gas
surface densities that are considerably lower than those of the minimum mass solar nebula at
short orbital periods. If the super-Earths had to have formed in a gas-poor inner disc, perhaps
they have formed in the gas-poor inner disc arising due to steady-state MRI accretion, a possible
alternative to the Lee and Chiang (2016) proposal. Therefore, I use the atmospheric accretion
model of Lee and Chiang (2015) to calculate the atmospheres accreted onto super-Earth-sized
cores in the MRI-accreting inner disc.
Additionally, after disc dispersal, super-Earths are subject to atmospheric mass loss due
to photoevaporation by high-energy stellar irradiation. It has been shown theoretically (e.g.
Owen and Wu 2013; Lopez and Fortney 2013) and observationally (e.g. Lundkvist et al. 2016;
Fulton et al. 2017; Fulton and Petigura 2018) that this mass loss can significantly change the
planet properties. Therefore, in this study I take this mass loss into account. Finally, I evolve
the planets in time, to their present day ages, and compare the resulting planet properties to
the observed ones.
4.2. Methods
4.2.1. Accretion of planetary atmospheres
In this work, it is assumed that solid super-Earth-sized planet cores accrete their gaseous
envelopes in a gas-poor inner disc that is viscously accreting due to the MRI. The model of the
disc structure is the same one as in Chapter 3, and it is assumed that the disc structure does
not evolve in time. The gaseous envelope is assumed to be in quasi-hydrostatic equilibrium,
contracting as it cools, allowing more gas to be accreted. Then, the accreted envelope mass
fraction (ratio of envelope mass and core mass) after time t can be estimated by the scaling
relations from Lee and Chiang (2015) (with an additional factor that accounts for varying gas
surface density from Lee et al. 2017; Fung and Lee 2018):
Xptq 0.07
t
1 Myr
0.40.02
Z
0.4 µ
2.37
3.4Mcore
5M`
1.7fΣ
0.1
0.12
(4.1)
for dusty atmospheres, and
Xptq 0.18
t
1 Myr
0.40.02
Z
0.4 µ
2.37
3.3Mcore
5M`
1.61600 K
Trcb
1.9fΣ
0.1
0.12
(4.2)
for dust-free atmospheres. Here Z is the metallicity of the atmosphere; µ 1p0.5W 0.25Y 0.06Zq is the mean molecular weight, with W p1 Zq1.4, Y 0.4p1 Zq1.4; Trcb is the
temperature at the radiative-convective boundary inside the atmosphere; fΣ ΣgΣMMSN is
the ratio of the gas surface density (Σg from the adopted inner disc model, Fig. 3.1) and the gas
74

CHAPTER 4. ATMOSPHERES OF PLANETS FORMED IN THE INNER DISC
surface density profile of the minimum mass solar nebula (ΣMMSN 1700pd1 AUq32 g cm2,
where d is the orbital radius, Hayashi 1981). Furthermore, it is assumed that the gas adia-
batic index is γ 1.2, and that in dusty atmospheres Trcb 2500 K which arises from the
disassociation of Hydrogen (see Lee and Chiang (2015), their section 2.1).
I use the expressions (4.1,4.2) to calculate how much gas a planet accretes in 1 Myr as a
function of core mass, for various metallicities Z and gas surface density factors fΣ in the case
of dusty atmospheres (with Trcb = 2500 K), and various Z, fΣ and Trcb in the case of dust-free
atmospheres.
4.2.2. Photoevaporation of planetary atmospheres
These accreted atmospheres are subject to photoevaporation following disc dispersal. I use a
simplified estimate of how the photoevaporation changes the accreted atmospheres. First, for
a given planet core mass Mcore and (accreted) envelope mass fraction X I find the photospheric
radius of the planet Rp. For this I use a simple model of an atmosphere at hydrostatic equi-
librium (Owen and Wu 2017), in which the solid core is surrounded by an adiabatic convective
envelope, on top of which is an isothermal radiative photosphere.
Next, the mass-loss timescale due to high-energy stellar irradiation is (Owen and Wu 2017)
t9X
4πd2GM2coreXp1XqηπLHE
1
R3p
, (4.3)
where d is the orbital radius of the planet and LHE is the stellar high-energy flux. I consider a
Sun-like star, as in the adopted disc model.
To determine the final envelope mass fractions, I do not explicitly evolve the atmospheres
in time. Instead, one can use the fact that most of the mass loss happens during the first
100 Myr after disc dispersal, since during this period the stellar high-energy flux LHE is
saturated (LHE Lsat 103.5Ld for a Sun-like star) and after this time it quickly decays
(Jackson et al. 2012; Tu et al. 2015).
Thus, one can estimate the final envelope mass fraction as follows. If a planet’s mass-loss
timescale t9X is longer than 100 Myr at the time of disc dispersal, the planet does not suffer
significant mass loss. In this case it can be assumed that such a planet remains unchanged by
the photoevaporation.
On the other hand, a planet with t9X 100 Myr loses mass. For a given core mass Mcore and
orbital distance d, the mass-loss timescale as a function of the envelope mass fraction, t9XpXq,
peaks at X Xpeak of a few percent, decreasing for both smaller and larger X (Owen and Wu
2017). Thus, for a planet with a small accreted envelope mass fraction (X Xpeak), the mass
loss further shortens the loss timescale. If such a planet’s initial mass-loss timescale is less than
100 Myr it is subject to runaway mass loss, and it can be assumed that it is completely stripped
of its atmosphere. For a planet with a large accreted atmosphere (X ¡ Xpeak), the mass-loss
75

CHAPTER 4. ATMOSPHERES OF PLANETS FORMED IN THE INNER DISC
timescale increases towards the peak value t9XpXpeakq as the planet loses mass. If Mcore and d
are such that the t9XpXpeakq ¥100 Myr, one can assume that such a planet will end up with an
envelope mass fraction X corresponding to a mass-loss timescale of t9X = 100 Myr. However,
if t9XpXpeakq 100 Myr, the mass-loss timescale at first increases, and then decreases, entering
the runaway regime. In this case a planet loses its entire atmosphere despite an initially large
accreted X. This simple prescription adequately captures the basic physics of atmospheric
photoevaporation (see far left panel of fig. 6 in Owen and Wu 2017).
4.3. Results
4.3.1. Accretion of planetary atmospheres
Using the scaling relations (4.1,4.2) I calculate the envelope mass fractions that planetary cores
of various masses accrete from the gas disc in 1 Myr. Results are shown in Fig. 4.1 for both
dusty and dust-free atmospheres of various metallicities, ranging from solar (Z 0.02) to the
metallicity of Neptune’s atmosphere (Z 0.2; Karkoschka and Tomasko 2011), gas surface
density factors fΣ 104 – 1.88, and radiative-convective boundary temperatures Trcb 1600 –
2500 K.
The dependence on metallicity Z is non-monotonous, as the accreted envelope mass fraction
depends separately on the metallicity and on the mean molecular weight (which is set by the
metallicity). The smallest accreted atmospheres, with the rest of the parameters fixed, have
Z 0.1.
The radiative-convective boundary temperature Trcb is expected to be roughly constant in
dusty atmospheres, so I only explore the effect of this parameter in dust-free atmospheres. In
the latter, Trcb is related to the temperature of the environment. Additionally, accretion of
both dust-free and dusty atmospheres depends the density of the environment. Here we are
interested in atmospheres that are accreted in the inner disc, near or inwards of the pressure
maximum. The location of the pressure maximum is determined by the extent of thermal
ionization of potassium in the disc model used here, and so this corresponds to disc temperatures
of T Á 1000 K, regardless of the exact disc parameters (e.g. gas accretion rate). For a disc
temperature of T 1000 K, numerical models of the accreting atmospheres give Trcb 1600 K
(Lee and Chiang 2015), which thus sets a lower bound on Trcb for the calculations in this work.
Moreover, the location of the pressure maximum is also where the gas surface density is highest
(see Fig. 3.1). Colder atmospheres in a more dense environment accrete more. So, to show
the maximum accreted atmospheres in an MRI-accreting disc, I plot a set of dusty and dust-
free atmospheres (of various metallicities Z) for the maximum fΣ 1.88, and the minimum
Trcb 1600 K (the latter refers only to the dust-free atmospheres). Conversely, the maximum
temperature at which equation (4.2) is valid (due to the limitations of the opacity tables used
76
CHAPTER 4. ATMOSPHERES OF PLANETS FORMED IN THE INNER DISC
100 101
Core mass [M ]
10 3
10 2
10 1Ac
cret
ed e
nvel
ope
mas
s fra
ctio
n
dust-freedusty
f = 1.88,Trcb = 1600KZ= 0.02Z= 0.1Z= 0.2f = 10 4,Trcb = 2500KZ= 0.1
Figure 4.1: Envelope mass fraction of atmospheres accreted in 1 Myr as a function planet coremass for dusty (black lines) and dust-free (grey lines) atmospheres and a variety of metallicitiesZ, gas surface density factors fΣ and (in the case of dust-free atmospheres) radiative-convectiveboundary temperatures Trcb, as indicated in plot legend. Grey region indicates the total range ofexpected envelope mass fractions (except for those that would reach an envelope mass fractionof X 0.5 within 1 Myr and thereby expected to undergo runaway accretion to form gas giants;these are not shown).
by Lee et al. 2014) is Trcb 2500 K 1 , and the minimum gas surface density in the inner disc
model with respect to the minimum mass solar nebula is fΣ 104 (corresponding to the inner
disc edge in Fig. 3.1). Hotter atmospheres in lower-density environments accrete less, and so
to show the smallest accreted dust-free atmospheres, I plot the fΣ 104 atmospheres, with
Trcb 2500 K for the dust-free atmospheres, and with metallicity Z 0.1 (since, as noted
above, Z 0.1 yields the smallest atmosphere for any given set of other parameters).
Finally, atmospheres that grow above a threshold of X 0.5 undergo runaway accretion
and end up as gas giants (Rafikov 2006). The scaling relations (4.1,4.2) are not applicable in
this case. Therefore, Fig. 4.1 is cut off at X 0.5, and the grey region indicates how small or
large super-Earth/mini-Neptune atmospheres may be at the time of disc dispersal. Overall one
can see that, if the cores are formed 1 Myr before the dispersal, runaway accretion is avoided
for the majority of relevant core masses, but they do accrete significant gaseous envelopes of
up to a few 10% of core mass.
The envelopes shown in Fig. 4.1 have been calculated assuming that the accretion lasts for
1 Myr. Since disc lifetimes can be longer (Mamajek 2009), these envelopes could be conservative
estimates if planets form sooner than 1 Myr before disc dispersal. If, for example, the envelopes
1Note that, assuming Trcb is directly proportional to the disc temperature T , and scaling from the numericalmodels’ result that Trcb 1600 K corresponds to T 1000 K, yields T 1500 K for Trcb 2500 K. The disctemperature in the model used here only exceeds 1500 K at radii 0.1 AU, so a maximum Trcb of 2500 K isindeed roughly valid over most of the inner disc.
77

CHAPTER 4. ATMOSPHERES OF PLANETS FORMED IN THE INNER DISC
are accreted for 5 Myr, the envelope mass will double. It is not expected for the results to
be very sensitive to the exact disc parameters, as long as the cores accrete their atmospheres
in a thermally-ionized MRI-active inner disc. Note, however, that the disc model used here
implies that the extent of such inner disc does not encompass all observed sub-Neptunes for
all relevant accretion rates; e.g. the gas pressure maximum is at an orbital period longer than
100 days only for gas accretion rates of 9MgÁ 3 109 Md yr1. Thus, a planet with a longer
orbital period might spend at least some time in a colder MRI-dead zone, which is not taken
into account in this work.
4.3.2. Photoevaporation of planetary atmospheres
To further check the consistency of core accretion in the MRI-accreting inner disc with obser-
vations, we need to consider whether these accreted atmospheres survive photoevaporation. I
calculate the final (remaining) envelope mass fraction of the minimum and maximum possible
accreted atmospheres (corresponding respectively to dusty atmospheres with fΣ 104 and
Z 0.1, and dust-free atmospheres with Z 0.02, fΣ 1.88 and Trcb 1600 K) for each core
mass and as a function of orbital period. Results are shown in Fig. 4.2. In the case of the maxi-
mum accreted atmospheres (top panel), the atmospheres would undergo runaway accretion for
core masses Á 8 M` (indicated by the hatched region), which are thus excluded here.
The figures show that the orbital period at which the atmosphere can be completely evap-
orated decreases with increasing core mass, and cores that retain their atmospheres generally
evolve towards a 1% envelope mass fraction as expected from theory. At 100 days the atmo-
spheres are unaffected by photoevaporation, and at periods shorter than 1 day all planets are
predicted to end up as bare cores. Massive cores are predicted to keep their 1 – 50% atmospheres
at the majority of orbital periods, and planets with Earth-mass cores are safe from complete
mass loss at periods larger than 50 days.
Note that here the orbital period determines the level of high-energy flux that planet experi-
ences and planet equilibrium temperature (and thus planet radius), but does not directly reflect
variations in temperature and density of the protoplanetary disc inside which the atmospheres
were accreted. As discussed above, the effect of the disc temperature on the accreted envelope
mass fraction is negligible for dusty atmospheres. For dust-free atmospheres the dependence is
monotonous and the extent of the effect is explored by considering the minimum Trcb expected
in the inner disc, and the maximum Trcb for which the scaling relations (4.1,4.2) are valid. Sim-
ilarly, the dependence on the disc density is explored by considering the smallest and largest
values of the ratio of the MRI-disc model and the minimum mass solar nebula surface densi-
ties. Thus, by calculating the effect of photoevaporation on both the minimum and maximum
accreted atmospheres shown in Fig. 4.1 for each core mass, I encompass the possible range of
disc densities and temperatures.
78

CHAPTER 4. ATMOSPHERES OF PLANETS FORMED IN THE INNER DISC
101
Core mass [M ]
100
101
102Pe
riod
[day
s]
0.0000
0.0005
0.0010
0.0050
0.0100
0.0500
0.1000
0.5000
Fina
l env
elop
e m
ass f
ract
ion
101
Core mass [M ]
100
101
102
Perio
d [d
ays]
0.0000
0.0005
0.0010
0.0050
0.0100
0.0500
0.1000
0.5000
Fina
l env
elop
e m
ass f
ract
ion
Figure 4.2: Maximum (top) and minimum (bottom) envelope mass fraction of the atmospheresafter accounting for photoevaporation, as functions of planet core mass and orbital period. Inthe top figure, the hatched region indicates the core masses for which the planets would undergorunaway accretion and are thus excluded from here.
79

CHAPTER 4. ATMOSPHERES OF PLANETS FORMED IN THE INNER DISC
4.4. Comparison to observations
Overall, Fig. 4.2 shows that the envelopes formed in a gas-poor inner disc due to the MRI
survive photoevaporation for a large range of orbital periods, and the low gas surface densities
are not a hindrance to the formation of mini-Neptunes. On the contrary, the final envelope
mass fractions of the planets that do keep their atmospheres are typically overestimated. The
planets with core mass larger than 2 M` are predicted to either have a ¡ 1% atmosphere or to
be completely evaporated. On the other hand, from the observations, the typical envelope mass
fraction of mini-Neptunes that hold onto their atmospheres is 1% (Wolfgang and Lopez 2015).
To look into this further, I compare the predictions of these calculations against the observed
mass-radius relationship for sub-Neptune planets in Fig. 4.3, and against measured masses and
radii of individual sub-Neptune planets in Fig. 4.4.
For the observations in Fig. 4.3, I show the probabilistic best-fitting mass-radius relationship
of Wolfgang et al. (2016): a power law MM` 2.7pRR`q1.3 (indicated by the dashed line)
with a standard deviation of 1.9 M` due to an intrinsic scatter in planet mass (the dark grey
region), and an upper limit constraint on the planet density corresponding to a mass-radius
relationship for solid cores of Earth-like composition MM` pRR`q4 (dotted line; Valencia
et al. 2010). Additionally, the above mass-radius relationship does not capture a significant
feature of the observed radius distribution of sub-Neptunes, a decrease in occurrence rates of
planets with radii of 1.5 – 2 R` (indicated here by the sheer grey region; Fulton et al. 2017).
To show the predictions of the above atmospheric calculations in the mass-radius plane, I
take the calculated envelope mass fraction as a function of core mass and period and re-calculate
the planet radius at the planet age of 5 Gyr as a function of core mass and period, using the
same simple atmospheric evolution model of Owen and Wu (2017). The results are shown
for the minimum and maximum accreted atmospheres (Fig. 4.2, and excluding the completely
evaporated planets) in Fig. 4.3 (the medium grey and the light grey region respectively). Note
that the light grey region has a cut-off at about 8 M` because the massive cores that, given the
parameters of the maximum accreted atmospheres, would be subject to runaway accretion, are
excluded. The solid-line contours show how the planet mass and radii change as a function of
period for the minimum accreted atmospheres. At the orbital period of 100 days the planets are
largely unaffected by the atmospheric loss, and closer to the star the photoevaporation removes
atmospheres of the lower-mass planets entirely. For the planets that keep their atmospheres
at large periods a decrease in period means little to no change in planet mass. Consequently,
for these planets a decrease in period results in an increase in planet radius as atmospheres
are hotter and more expanded closer to the star due to stronger stellar irradiation. At small
periods the atmospheric loss is significant for all planets, and the trend is reversed.
It is clear from Fig. 4.3 that for planets with radii R À 2.3 R` the core accretion of atmo-
spheres in the inner disc predicts larger planet radii than those observed, due to the overesti-
mated envelope mass fractions. The predicted atmospheres fill in the range of planet radii of
80

CHAPTER 4. ATMOSPHERES OF PLANETS FORMED IN THE INNER DISC
1.0 1.5 2.0 2.5 3.0 3.5 4.0Planet radius [R ]
101
Plan
et m
ass [M
]
2d
5d
20d
100d
Figure 4.3: Mass-radius relationship for sub-Neptune planets: Earth-like composition solidcores (dotted line), probabilistic fit to observations mean value (dashed line) and scatter (soliddark grey region) (Wolfgang et al. 2016), region of low planet occurrence rates from the observedradius distribution of planets (sheer grey region) (Fulton et al. 2017), and predictions from theminimum and maximum accreted atmospheres and photoevaporation (medium grey and lightgrey region respectively) with orbital period contours for the minimum accreted atmospheres(solid-line contours).
1.5 – 2 R`, at which there is an observed decrease in planet occurrence rates (sheer grey region).
For planets with R Á 2.3 R` there is a region in which the observed (dark grey) and the pre-
dicted (medium and light grey) mass-radius relationships overlap. This overlap corresponds to
the (minimum accreted) predicted atmospheres for orbital periods between 20 and 100 days,
and a narrow range of short orbital periods (2 – 5 days). Notably, even for the minimum ac-
creted atmospheres, the planet radii, at fixed planet mass, are smaller than those observed
only for significant high-energy fluxes at orbital periods of less than about 2 days. Taking
into account the full range of accreted atmospheres (up to the maximum accreted atmospheres
shown in light grey) further suggests that the predicted atmospheres are typically larger than
the atmospheres of the observed sub-Neptunes.
I further compare the predictions of the above calculations to sub-Neptune planets with
measured masses and radii (taken from Wolfgang et al. 2016, excluding the planets where only
the upper limit on the mass was known). The observed and the predicted radii and masses are
shown in Fig. 4.4 in four panels corresponding to four orbital period bins. As in Fig. 4.3, the
medium and light grey regions correspond to the predictions from the minimum and maximum
atmosphere mass models respectively. To facilitate comparison against the planets that are
bare solid cores in each period bin, Fig. 4.4 also shows the core masses that are predicted to
lose their entire atmospheres in a given period bin (grey lines shown below the dotted lines
that represent the Earth-like composition mass-radius relationship). Fig. 4.4 shows that the
81

CHAPTER 4. ATMOSPHERES OF PLANETS FORMED IN THE INNER DISC
1.0 1.5 2.0 2.5 3.0 3.5 4.0Planet radius [R ]
101
Plan
et m
ass [M
]P < 5d
1.0 1.5 2.0 2.5 3.0 3.5 4.0Planet radius [R ]
101
Plan
et m
ass [M
]
5d < P < 10d
1.0 1.5 2.0 2.5 3.0 3.5 4.0Planet radius [R ]
101
Plan
et m
ass [M
]
10d < P < 20d
1.0 1.5 2.0 2.5 3.0 3.5 4.0Planet radius [R ]
101
Plan
et m
ass [M
]
20d < P < 100d
Figure 4.4: Sub-Neptune planets with measured masses and radii (square markers if the masswas determined using the radial velocity method, and triangles if the mass was determinedusing transit-timing variations), with uncertainties as listed in Wolfgang et al. (2016), Earth-like composition solid cores (dotted line), and predictions from the minimum and maximumatmosphere models (medium and light grey region respectively), in period bins as indicated inplot labels. This figure indicates that while the period range at which planets can be stripped byphotoevaporation is consistent with the data, the planets typically have larger H/He envelopesthat expected.
82

CHAPTER 4. ATMOSPHERES OF PLANETS FORMED IN THE INNER DISC
masses of the predicted bare cores and the period at which photoevaporation can strip them
are largely consistent with those observed. That is, there are no observed planets consistent
with the Earth-like composition that are (significantly) more massive than the largest core that
the photoevaporation can strip (the upper limit of the grey line, the predicted bare cores) in
each period bin. Fig. 4.4 also explicitly demonstrates that for the planets that maintain their
atmospheres against the photoevaporation, the predicted planet radii are consistent with or
larger than the those observed for the majority of the planets. At long orbital periods (20 –
100 days) all planets except one are consistent, within the observational uncertainties, with
the predictions (the minimum accreted atmospheres in medium grey, the maximum accreted
atmospheres in light grey, and the region in between). At intermediate periods (5 – 20 days),
about a third of planets that are not bare cores have radii smaller than the predicted radii at
the same mass. Finally, at short periods of less than 5 days, there are noticeably 5 planets
with radii of 1.8 2 R` that are neither consistent with the mass-radius relationship of rocky
cores, nor with the presence H/He envelopes. This suggests, potentially, that the cores of these
planets could contain significant amounts of ice. Still, the majority of short-period planets
are consistent with the predictions. Additionally, while there might be exceptions, the radius
distribution of sub-Neptunes is consistent with cores being largely rocky (Owen and Wu 2017).
Therefore, these results confirm the inference that typically the planets accrete too much gas
in the calculations.
Overall, the atmospheres accreted in the inner disc are typically in agreement with or larger
than those observed, with the exception of planets with significant high-energy fluxes within a
very narrow range. This is because core accretion is so efficient that considerable atmospheres
can be accreted in the hot and low-density MRI-accreting inner disc and also maintained against
photoevaporation.
4.5. Discussion and conclusions
In this chapter I have examined accretion of planetary atmospheres formed in the inner disc
that is viscously accreting due to the MRI. I have considered both the accretion and subsequent
photoevaporation of close-in super-Earth planets, and compared the results to the observed
properties of these planets.
If super-Earth and mini-Neptune cores indeed form in the inner disc, would the inferred low
gas surface densities due to the MRI allow them to acquire the observed 0.1 10% envelope
mass fractions? It is found that they would. In fact, even after accounting for atmospheric
evaporation, the calculated atmospheres tend to overestimate the observed ones.
Could the atmospheric accretion in the MRI-implied disc and the observations be brought
into agreement, without invoking an assumption that cores form just before the beginning of
disc dispersal (e.g. Ikoma and Hori 2012; Lee and Chiang 2016)? The calculations shown here
83

CHAPTER 4. ATMOSPHERES OF PLANETS FORMED IN THE INNER DISC
do not include several effects which could contribute.
First of all, for core masses smaller than 10 M`, the discrepancy could be explained by the
“boil-off” or core powered mass-loss (Owen and Wu 2016; Ginzburg et al. 2018; see also Ikoma
and Hori 2012), a process in which a planet atmosphere that had not cooled and contracted
before the disc dispersal loses its mass. Upon the dispersal the stellar continuum radiation
illuminates the planet and launches a Parker wind. The mass loss causes rapid contraction of
the atmosphere, and the contraction in turn shuts off the mass loss. Planets that start out with
few 10s of percent atmospheres, may be left with 1% after the boil-off. This process precedes
the mass loss caused by the stellar high-energy flux considered above, and can operate at larger
distances from the star.
Secondly, the scaling relations used to calculate the accreted atmospheres are derived as-
suming no sources of heating due to planetesimal accretion, or due to heat deposited in the
hypothesized final stage of giant mergers of planetary embryos. The latter could be released for
several kyr (e.g. Inamdar and Schlichting 2015), lowering the cooling rate of the atmosphere,
and thus allowing less gas to be accreted. Furthermore, the scaling relations assume that the
gas inside the planet’s Hill sphere is bound and static. Three-dimensional numerical simulations
suggest instead that disc material is recycled between the envelope and the disc (e.g. Ormel
et al. 2015; Fung et al. 2015; Cimerman et al. 2017).
Finally, if the giant mergers happen between planets, after the disc has fully dispersed,
they would likely result in significant atmospheric mass loss. Head-on collisions between
Earth/super-Earth-sized planets with few-percent atmospheres can remove tens of percent of
the total atmospheric mass (Liu et al. 2015; Inamdar and Schlichting 2016).
Nevertheless, to avoid the runaway accretion for more massive cores, the low gas surface
densities the MRI provides are favourable compared to the MMSN environment. Furthermore,
gas-poor conditions in this case are provided in a long-lived state, and not in a transient
phase (e.g. a transition disc, as proposed by Lee and Chiang 2016). Therefore, the results
presented here support the hypothesis that the super-Earths could have formed in the inner
protoplanetary disc.
84
5 Improved model of the MRI-accreting
inner disc
5.1. Introduction
In Chapter 2 I discussed models of the inner disc in which the disc structure and accretion due
to the MRI were considered self-consistently. The obtained structure of the inner disc features
a local gas pressure maximum, in line with theoretical expectations, and the location of the
pressure maximum in these models was found to be consistent with the orbital distances of the
close-in super-Earths. However, these models included a number of simplifications about the
disc physical and chemical structure. The disc vertical structure was considered to be vertically-
isothermal, and heating by stellar irradiation was neglected. However, disc temperature may
vary vertically, and the temperature profile is particularly non-trivial when both accretion
heating and stellar irradiation are considered (e.g. D’Alessio et al. 1998). The opacity of the
disc due to dust grains was also taken to be a constant, whereas in reality it varies with
temperature and the properties and the abundance of dust grains.
Furthermore, in Chapter 2 it was assumed that the only source of ionization in the disc is
thermal (collisional) ionization of potassium, and that the potassium ions and free electrons
may only recombine in the gas-phase. Potassium is a good representative of thermally-ionized
species in the inner disc based on its low ionization potential and its abundance (Desch and
Turner 2015). However, ions and free electrons also collide with dust grains present in the disc.
When they are adsorbed onto grain surfaces, they quickly recombine. The presence of dust
grains is thus known to reduce the ionization levels in discs and suppress the MRI (Sano et al.
2000; Ilgner and Nelson 2006; Wardle 2007; Salmeron and Wardle 2008; Bai and Goodman 2009;
Mohanty et al. 2013). Importantly, dust grains heated to high temperatures (Á 500 K) can also
emit electrons and ions into the gas phase. For electrons, the process is known as thermionic
emission. Such temperatures are easily attainable in the inner disc, and thermionic and ion
emission have been shown to be important sources of ionization there (Desch and Turner 2015).
Additionally, in Chapter 2 we saw that an MRI-accreting inner disc features low gas surface
densities, and so ionization of molecular hydrogen by the stellar X-rays may be comparable to
thermal ionization as a source of free electrons.
In this chapter I present a new model of a steady-state disc that is accreting due to the MRI.
85

CHAPTER 5. IMPROVED MODEL OF THE MRI-ACCRETING INNER DISC
The vertical structure in this model is calculated self-consistently from viscous dissipation (due
to the MRI-induced viscosity), stellar irradiation, and radiative and convective cooling (with
realistic opacities due to dust grains). Ionization in the disc is driven by thermal ionization of
potassium, thermionic and ion emission from dust grains, and ionization of molecular hydrogen
by stellar X-rays, cosmic rays and radionuclides. Section 5.2 details all components of this
model and the methods we can use to find a self-consistent steady-state solution for the disc
structure. Section 5.3 presents the results, and in Section 5.4 I discuss the relative importance
of the considered physical and chemical processes for the structure of the inner protoplanetary
disc. In the next chapter I further investigate how the inner disc structure changes with dust
grain size, dust-to-gas ratio, gas accretion rate and stellar mass, and discuss the implications
for the formation of the super-Earths in the inner disc.
5.2. Methods
The disc is assumed to viscously accrete due to the MRI. The model of the disc structure
is described in Section 5.2.1. The disc structure depends on the disc’s radiative properties,
i.e. opacities, and on the viscosity. The calculation of opacities is given in Section 5.2.2, and
the prescription for the MRI-driven viscosity in Section 5.2.3. The MRI-driven viscosity is a
function of the disc’s ionization state, calculated using a chemical network described in Section
5.2.4. Disc structure, opacities, ionization and viscosity are calculated self-consistently at every
point in the disc, using numerical methods given in Section 5.2.5.
The key parameters of the self-consistent disc model are the steady-state gas accretion rate9M , stellar mass M, stellar radius R, effective temperature T, and value of the viscosity in
the absence of the MRI (the dead-zone viscosity). Additionally, disc opacities and ionization
state, and thus the disc structure, depend on the properties of dust, namely, the dust-to-gas
ratio fdg and the maximum dust grain size amax.
5.2.1. The disc model
The disc model largely follows the work of D’Alessio et al. (1998; 1999). I consider a thin,
axisymmetric, Keplerian, steady-state disc that is viscously accreting, and assume that the
disc is in vertical hydrostatic equilibrium, heated by viscous dissipation and stellar irradiation,
and that energy is transported by radiation and convection. The energy transport in the radial
direction is neglected. Furthermore, at a given orbital radius, viscosity depends only on local
conditions and the vertical mass column (see Section 5.2.3). Then, the structure of the disc
at different radii is only coupled by the stellar irradiation, as it penetrates the disc along the
line-of-sight to the central star.
86

CHAPTER 5. IMPROVED MODEL OF THE MRI-ACCRETING INNER DISC
5.2.1.1. Hydrostatic equilibrium
In a thin Keplerian disc in vertical hydrostatic equilibrium, at any given radius the gas pressure
profile follows fromdP
dz ρΩ2z, (5.1)
where P is the gas pressure, ρ is the gas volume density, Ω is the Keplerian angular velocity
and z is the height above disc midplane. I adopt the ideal gas law.
5.2.1.2. Viscous heating and stellar irradiation
The disc is heated by the viscosity that drives the accretion. The viscosity is parametrized
by ν αc2sΩ, where α is the Shakura and Sunyaev (1973) viscosity parameter and cs is the
isothermal sound speed. Local viscous dissipation rate at any location in the disc is given by
Γacc 9
4αPΩ. (5.2)
The flux generated by viscous dissipation that is radiated through one side of the disc is
Facc 3
8π9MfrΩ
2, (5.3)
where fr 1aRinr comes from the inner disc edge thin-layer boundary condition, r is the
orbital radius and Rin R is the orbital radius of the inner disc edge (e.g. Frank et al. 2002),
where I am assuming a zero-torque inner boundary condition.
I also consider heating due to stellar irradiation. Stellar flux propagates spherically from the
star, and heating due to stellar irradiation at any location in the disc depends on the attenuation
of this flux along the line-of-sight to the star. However, such treatment of the stellar flux in 2D
coupled to a 1+1D disc model considered here, with no radial energy transport or scattering
of stellar light, leads to multiple, or no solutions at all, for the equilibrium disc structure.
Such behaviour does not appear in 2D disc models (e.g. Dullemond 2002). Therefore, it is
necessary to use an assumption that the stellar flux hits the disc surface at an angle φ and then
propagates vertically towards the midplane (Calvet et al. 1992; Chiang and Goldreich 1997).
In this framework, the attenuation, i.e. the optical depth to the stellar flux, is approximated
as τirr τirr,zµ, where τirr,z is the optical depth in the vertical direction, and µ sinφ. Local
heating due to stellar irradiation is then given by
Γirr κPρFirr
µeτirr,zµ, (5.4)
where κP is the disc Planck opacity to stellar irradiation (see Section 5.2.2) and Firr is the total
87

CHAPTER 5. IMPROVED MODEL OF THE MRI-ACCRETING INNER DISC
incident stellar flux at the given orbital radius. In an optically-thick disc, the latter is given by
Firr σSBT4
R
s
2
µ, (5.5)
where s is the distance to the star (spherical radius) from the top of the disc at the given orbital
radius.
The grazing angle φ is given by
φ sin1 4
3π
R
r tan1dlogzirr
dlogr
zirr
r tan1 zirr
r. (5.6)
Here the first term is the value of φ for a flat disc and comes from the finite size of the stellar
disc, and the other two terms are due to disc flaring. Height zirrprq defines the surface in the
disc at which the stellar flux is absorbed; here, zirrprq is the height above disc midplane at
which the optical depth to stellar irradiation is τirr 23. Specifically, in calculating the height
zirr, the optical depth τirr is obtained by integrating along spherical radius s to the star, as
opposed to the approximation used in the local heating term. The height zirr and the angle φ
are determined self-consistently with the disc structure following the procedure by D’Alessio
et al. (1999), as outlined in Section 5.2.5.
5.2.1.3. Radiative energy transport
We can consider the energy transport only in the vertical direction. In a thin disc the optical
depth to disc radiation is much smaller in the vertical than in the radial direction. Thus, it can
be expected that the radiation primarily transports heat vertically.
The frequency-integrated moments of the radiative transfer equation in the Eddington ap-
proximation (i.e. assuming that radiation is isotropic, as is valid in the optically thick regime)
and the energy balance equation are
dF
dz Γacc Γirr, (5.7)
dJ
dz 3ρκR
4πF, (5.8)
4ρκPpσSBT4 πJq Γacc Γirr, (5.9)
where F and J are radiative flux and mean intensity, respectively. I have also assumed here
that the J and F weighted opacities can be approximated by the Planck mean opacity κP and
the Rosseland mean opacity κR, respectively (following e.g. Hubeny 1990, see Section 5.2.2).
Together with the ideal gas law, equations (5.1, 5.7-5.9) form a closed set of equations in P ,
F , J and T . Together with appropriate boundary conditions, they determine the disc vertical
structure. One boundary condition is given at disc midplane, where due to symmetry the flux
F p0q 0. The rest of the boundary conditions are given at the top of the disc, at height zsurf
88

CHAPTER 5. IMPROVED MODEL OF THE MRI-ACCRETING INNER DISC
above disc midplane. The boundary condition for the flux F is obtained by integrating eq. (5.7)
from z 0 to z zsurf , from which it follows that F pzsurfq FaccFirr. The boundary condition
for the mean intensity J is given by Jpzsurfq 12πF pzsurfq. Furthermore, we can assume that
the gas pressure at the top of the disc has a small constant value, P pzsurfq 1010 dyn cm2,
which is another boundary condition. This is arbitrary, but does not affect the results as long
as the value is sufficiently small. Overall, thus, there are 4 boundary conditions for the three
differential equations. Additionally, the temperature T pzsurfq at the top of the disc follows from
the algebraic eq. (5.9) and the boundary conditions for J and P .
Some applications of eq. (5.8) to accretion discs require an additional multiplicative factor on
the right-hand side of the equation, the so-called flux-limiter, to preserve causality (Levermore
and Pomraning 1981). This is not the case in the boundary value problem described above.
The flux-limiter is introduced to ensure that F cER, where ER 4πcJ is the radiation energy
density. Here, this condition is already fulfilled everywhere in the disc, since at the top of the
disc F cER2 and vertically downwards ER (or J) can only increase and F can only decrease
(i.e., from eq. (5.7) and (5.8), dF dz ¡ 0 and dJdz 0).
5.2.1.4. Energy transport by convection
If radiative energy transport yields a thermal structure such that gradient ∇ dlnTdlnP
is greater
than the adiabatic gradient ∇ad pγ 1qγ, the gas is unstable to convection. In disc regions
where this is the case we can assume that energy transport by convection is efficient and that
gas is vertically isentropic, so ∇ ∇ad at such locations (e.g. Shu 1992; Rafikov 2007). I adopt
γ 1.4. Then, the equations (5.8), (5.9) are replaced by
dT
dz ∇ad
T
PρpT, P qΩ2z ∇ad
µmH
kB
Ω2z. (5.10)
5.2.2. Opacities
Radiative transport is controlled by the Rosseland-mean opacity κR in optically-thick regions,
eq. (5.8), and by the Planck-mean opacity κP in optically-thin regions, eq. (5.9). Additionally,
absorption coefficient for the stellar flux is a Planck-mean opacity κP at the stellar effective
temperature. In this work, it is assumed that the only source of these opacities are dust grains.
Gas opacities are important in the very innermost regions of discs, where most dust species
are sublimated. However, these regions are not of particular significance for the early stages of
planet formation that we are interested in, as the dust is required to form solid planet cores.
Beyond the silicate sublimation line, gas opacities may still be important in the hot, optically-
thin regions (Malygin et al. 2014). However, the inner disc is significantly optically-thick and
including gas opacities would only alter the structure of the hot disc atmosphere. Therefore,
we can completely ignore the gas contribution to the opacities.
89

CHAPTER 5. IMPROVED MODEL OF THE MRI-ACCRETING INNER DISC
102 103
Temperature [K]
100
101
Opac
ity [c
m2 /g
]
PR*P
Figure 5.1: Planck-mean opacity κP, Rosseland-mean opacity κR, and Planck-mean opacityat the stellar effective temperature κP, as functions of disc temperature, assuming dust-to-gasratio fdg 102 and a maximum dust grain size amax 1µm.
Furthermore, we can assume that the only dust species present are silicate grains. Other
species that can be comparable in abundance to silicates are water ice and carbonaceous grains
(e.g. organics, Pollack et al. 1994). However, due to their low sublimation temperatures, both
water ice and carbonaceous grains are expected to be sublimated in the hot MRI-active regions.
To calculate the opacities, I use the optical constants of “astronomical silicates” from Draine
(2003), and the miescat module of the python wrapper radmc3dPy for RADMC3D (Dulle-
mond et al. 2012) to obtain dust absorption and scattering coefficients as functions of radiation
wavelength and grain size. For each grain size a the coefficients are averaged within a size
bin of width ∆loga 0.02. Next, I adopt the grain bulk density of ρg 3.3 g cm3, and the
grain size distribution given by dnpaq9 aqda (Mathis et al. 1977), with q 3.5, minimum
grain size amin 0.1µm, and a maximum grain size amax. Then, the size-dependant absorption
and scattering coefficients are weighted by grain mass and averaged over the grain size distri-
bution. Finally, the absorption coefficient is integrated over frequency to obtain Planck-mean
opacity (κPpT q), and the total extinction coefficient yields Rosseland-mean opacity (κRpT q).Following D’Alessio et al. (1998), I calculate the mean absorption coefficient for the stellar flux
as a frequency-integrated absorption coefficient weighted by the Planck function at the stellar
effective temperature (κP κPpTq).Fig. 5.1 shows the opacities per unit mass of gas, assuming a dust-to-gas ratio of fdg
102 and T 4400 K, for a maximum grain size amax 1µm. Planck-mean opacity at the
stellar effective temperature κP is a constant, since the wavelength-dependent dust absorption
coefficient does not depend on the local temperature. The Planck-mean opacity κP is in general
expected to increase with increasing temperature. This is because the wavelength at which the
Planck function peaks is inversely proportional to the temperature, and for grains smaller than
the wavelength of peak emission (and small grains contribute to the opacities most) absorption
is expected to increase with decreasing wavelength. However, due to the silicate absorption
feature at 10µm, κP decreases with temperature in the range 500 K – 1000 K.
90

CHAPTER 5. IMPROVED MODEL OF THE MRI-ACCRETING INNER DISC
5.2.3. Viscosity
The model of the MRI-driven viscosity closely follows that presented in Chapter 2 (see also Bai
2011a). Here only the main points are summarized. A well-ionized circumstellar disc which
behaves according to laws of ideal magnetohydrodynamics is susceptible to the MRI (Balbus
and Hawley 1991). Under such conditions, the MRI leads to turbulence, producing an accretion
stress and acting as a source of viscosity. In terms of the Shakura-Sunyaev parameter α, the
MRI yields
αAZ 1
3β(5.11)
where β P PB is the plasma parameter, and PB B28π is the magnetic field pressure
(Sano et al. 2004).
However, even in the inner regions of protoplanetary discs, non-ideal magnetohydrodynamic
effects quench the MRI, leading to the so-called dead zones. The non-ideal magnetohydrody-
namic effects considered here are Ohmic and ambipolar diffusion. Ohmic diffusion will not
supress the MRI if (Sano and Stone 2002)
Λ v2Az
ηOΩ¡ 1, (5.12)
where Λ is the Ohmic Elsasser number, vAz Bz?
4πρ is the vertical component of the local
Alfven velocity and ηO is the Ohmic magnetic resistivity. Here, we can utilize the relationship
between the vertical component of the magnetic field strength Bz and the r.m.s. field strength
B, B2z B225 (Sano et al. 2004). It is also assumed that B is vertically constant. The method
of determining the value of B is described in Section 5.2.5.
Similarly, the ambipolar Elsasser number is defined by
Am v2A
ηAΩ, (5.13)
where ηA is the ambipolar magnetic resistivity. However, in the strong-coupling limit valid in
protoplanetary discs, the MRI can be active even if Am 1, if the magnetic field is weak (Bai
and Stone 2011). The criterion for the active MRI is then given by
ββmin ¡ 1 (5.14)
where the minimum value of β necessary to sustain the MRI is a function of the ambipolar
Elsasser number,
βminpAmq
50
Am1.2
2
8
Am0.3 1
212
. (5.15)
Thus, whether the MRI will be active or not depends on the magnetic resistivities, ηO and
ηA, as well as the magnetic field strength B. The magnetic resistivities, calculated following
91

CHAPTER 5. IMPROVED MODEL OF THE MRI-ACCRETING INNER DISC
Wardle (2007), express the coupling between the gas and the magnetic field. This is principally
determined by the ionization of the gas.
If any of the two criteria given by eqns. (5.12), (5.14) is not fulfilled, the MRI is not active.
In such MRI-dead zones, I assume there is a small residual viscosity αDZ, driven either by
propagation of turbulence from the MRI-active zone, or by hydrodynamic instabilities. In this
chapter, I also impose a smooth transition between the active and the dead zone, necessary to
ensure numerical stability in the integration of the equations of the disc structure. To cover
both non-ideal effects that lead to dead zones, we can define C minpΛ, ββminq. Then, at any
location in the disc, if |C 1| 0.5,
α αDZ αAZ αDZ
1 expC1
∆
, (5.16)
where ∆ 102. The exact value of ∆ makes very little difference to the results presented
here.
5.2.4. Ionization
5.2.4.1. Chemical network
A simple chemical network is implemented following Desch and Turner (2015). The chemi-
cal network considers number densities of five species: atomic ions (ni), free electrons (ne),
potassium ions (nK), neutral potassium atoms (nK0) and potassium atoms adsorbed onto dust
grains (nK,cond).
In the gas-phase potassium atoms are thermally ionized – collisions of neutral potassium
atoms with hydrogen molecules produce potassium ions and free electrons. Potassium ions and
free electrons recombine radiatively and also in three-body recombinations in collisions with
hydrogen molecules (the latter process dominates at high densities present in the inner disc).
Furthermore, non-thermal sources of ionization (e.g. X-rays) can ionize molecular hydrogen
(Glassgold et al. 1997; Ercolano and Glassgold 2013). The charge is quickly transferred from
the ionized hydrogen to other abundant gas species through collisions, producing molecular and
atomic ions (e.g. HCO, Mg). Notably, in application to the MRI, the exact composition
of the gas that this leads to is unimportant in the presence of dust, and simple chemical
networks reproduce the gas ionization levels well (Ilgner and Nelson 2006). Thus, it is assumed
that ionization of molecular hydrogen directly produces an atomic ion and a free electron at
a rate ζnH2 . The atomic ion species in this chemical network may thus be understood as a
representative of the various chemical species abundant in the gas-phase. Its mass is taken to be
that of magnesium. It is assumed that the number density of molecular hydrogen is constant,
which is valid for low ionization rates. Same as potassium, the atomic ions also recombine
radiatively and in three-body recombinations.
92

CHAPTER 5. IMPROVED MODEL OF THE MRI-ACCRETING INNER DISC
Importantly, all gas-phase species collide with and are adsorbed onto dust grains at a rate
Rj, coll njngrπa2gr
8kBT
πmj
12
JjSj, (5.17)
where nj is the number density of the gas-phase species, ngr is the number density of the grains,
agr is the grain size, mj is the gas-phase species mass, Jj is the modification of the collisional
cross-sections for charged species due to dust grain charge (Draine and Sutin 1987), and Sj is
the sticking coefficient. It is assumed that all grains have the same charge; this is valid since
the dispersion of the distribution of charge states is generally found to be small(Draine and
Sutin 1987). It is further assumed that potassium ions are quickly recombined on the grain
surface to form condensed potassium atoms. The atomic ions are effectively destroyed upon
adsorption.
At high temperatures electrons on the dust grains have a finite probability of leaving the
grain, producing the so-called thermionic emission. The emission depends on the energy re-
quired for the electron to escape the grain. For a neutral grain this is the work function W , a
property of the material out of which the grains are made. The rate at which free electrons are
produced through thermionic emission is
Rtherm ngr4πa2grλR
4πmepkBT q2h3
eWeffkBT , (5.18)
where
Weff W keZe2
agr
(5.19)
is the effective work function due to grain charge Ze, and ke is the Coulomb constant.
Potassium atoms will also evaporate from the grains only at high temperatures. The va-
porization rate of condensed potassium atoms is given by
RK,evap nK,condνe EakBT , (5.20)
where ν is the vibration frequency of potassium atoms on the dust grain surface lattice, and
Ea 3.26 eV is the binding energy, whose value is chosen to reproduce the condensation
temperature of potassium (1006 K, Lodders 2003). These potassium atoms may be emitted
into the gas phase as both neutral atoms and ions, contributing further to the gas’ ionization
state. The ratio of ions to neutrals among the emitted particles is given by
nKnK0
gg0
eWeffIP
kBT , (5.21)
where gg0
is the ratio of statistical weights of the ionized and neutral state of potassium, and
IP the ionization potential of potassium.
Clearly, the contribution of the dust grains to gas ionization levels depends on the work
93

CHAPTER 5. IMPROVED MODEL OF THE MRI-ACCRETING INNER DISC
function W of the grain material. I adopt the fiducial value of Desch and Turner (2015),
W 5 eV, and refer the reader to their work for a discussion of the experimental results
supporting this choice. This value is close to the ionization potential of potassium, IP 4.34 eV,
indicating that thermionic emission is important for the production of free electrons in the same
temperature range as thermal ionization of potassium. Importantly, at this given value of the
work function, grains become negatively charged at high temperatures as a large fraction of
potassium evaporating from the grains is in ionized state. This results in a reduction of the
effective work function Weff , i.e., for negatively charged grains thermionic emission is higher.
In this work, I assume that the abundances of hydrogen and potassium atoms are xH 9.21101 and xK 9.87108, respectively, relative to the total number density of all atomic
particles (Keith and Wardle 2014), and that the mean molecular weight is µ 2.34mH1. The
grain material density is ρgr 3.3 g cm3, the same as in the calculation of the dust opacities.
The input for the chemical network are temperature T , pressure P , hydrogen ionization rate ζ,
dust-to-gas ratio fdg and dust grain size agr. All other kinetic rates, parameters and coefficients
are the same as in Desch and Turner (2015). Note that the chosen value of the sticking coefficient
for the electrons (Se 0.6) is compatible with the detailed calculation by Bai (2011a). The
calculation therein is done for the values of work function of 1 eV and 3 eV. The results suggest
that for the work function of 5 eV, at 1000 K, Se is indeed few times 0.1 for neutral grains, and
increases further for negatively-charged grains.
For a given dust-to-gas ratio fdg and grain size agr, the equilibrium number densities of
electrons and ions, and the average grain charge, are pre-calculated and tabulated as functions
of temperature T , pressure P and hydrogen ionization rate ζ. The equilibrium solution is
found following the same method as Desch and Turner (2015). Time derivatives of all number
densities are set to zero, and so rate equations yield an algebraic system of equations. For
a given average grain charge Z, this system of equations is solved iteratively to find number
densities of all five species. Then, the grain charge is found by solving the equation of charge
neutrality.
5.2.4.2. Effective dust-to-gas ratio
The described chemical network incorporates only one grain size population. Ideally, we would
consider a number of grain size populations, with the same size distribution used in the calcula-
tion of dust opacities. However, this would greatly enhance the computational complexity of the
problem. At the same time, it is clear that dust grains of different size contribute differently to
the equilibrium ionization levels. To the lowest order of approximation, all dust-related reaction
rates are regulated by the total grain surface area. Thus, it can be expected that the ionization
levels are most sensitive to the smallest grains. Bai and Goodman (2009) considered the effects
of dust on the ionization levels in the cold regions of protoplanetary discs, in application to the
1The total number densities of molecular hydrogen and potassium are then related to the gas density asnH2
xHp2 xHqρµ and nK 2xKp2 xHqρµ, respectively.
94

CHAPTER 5. IMPROVED MODEL OF THE MRI-ACCRETING INNER DISC
1036 × 102
Temperature [K]10 23
10 20
10 17
10 14
10 11
10 8
10 5n e
/nH 2
fdg/agr = const
1036 × 102
Temperature [K]10 23
10 20
10 17
10 14
10 11
10 8
10 5
n e/n
H 2
fdg/a1.25gr = const
1036 × 102
Temperature [K]10 23
10 20
10 17
10 14
10 11
10 8
10 5
n e/n
H 2
fdg/a1.5gr = const
Figure 5.2: Ionization fraction (nenH2) as a function of temperature. Different colours corre-spond to different combinations of pressure and hydrogen ionization rates, P 102 dyn cm2
and ζ 1019 s1 (blue), P 102 dyn cm2 and ζ 1019 s1 (orange), P 102 dyn cm2
and ζ 1011 s1 (green). Different linestyles correspond to different grain sizes, agr 105 cm(solid), agr 103 cm (dashed), agr 101 cm (dotted), each with a different dust-to-gas ratiosuch that the ratio fdgapgr remains constant and as evaluated for agr 105 cm, fdg 0.01.Different panels show the calculations for different values of the exponent p, as indicated ineach panel title. Exponent p 1 is equivalent to keeping the total grain surface area constant.Adopting exponent p 1.5 yields approximately the same threshold temperature at whichionization fraction sharply increases irrespective of grain size agr. See Section 5.2.4.2.
onset of the MRI due to non-thermal sources of ionization. They considered chemical networks
with two grain size populations and found that the grain populations behave independently,
as the charge transfer between the grains is negligible. They further found that the ionization
levels are largely controlled by a quantity fdgapgr where the exponent p varies between p 1
(i.e. the total grain surface area) and p 2.
We can repeat a similar exercise for the above chemical network, suited to the hot inner
regions of protoplanetary discs. For a set of values of the exponent p 1, 1.25, 1.5 grain size
agr is varied while keeping fdgapgr constant. The ionization levels are calculated as a function
of temperature, and for different sets of pressure and hydrogen ionization rates, so as to probe
different conditions in different regions of the inner disc. The results are shown in Fig. 5.2.
The grain surface area (p 1) controls the equilibrium ionization levels when the hydrogen
ionization dominates, but does not determine the temperature at which the ionization levels
rise due to thermionic and ion emission. On the other hand, for p 1.5, this temperature
depends very weakly on the grain size. That is, regardless of the actual dust grain size, a
quantity fdga1.5gr regulates the temperature at which dense interior of the disc becomes ionized.
Therefore, we can proceed with a single grain size, agr 105 cm, in the chemical network,
but, use an effective dust-to-gas ratio such that feffapgr ³amax
amindnpaqmpaqρga
p, where npaqis the same grain size distribution used to calculate dust opacities. Since it is found that
thermionic and ion emission are more important than non-thermal sources of ionization in the
inner disc, p 1.5 is adopted. From Fig. 5.2 it appears that this choice will produce a large
error in the ionization levels in the low-density non-thermally ionized disc regions. However,
95

CHAPTER 5. IMPROVED MODEL OF THE MRI-ACCRETING INNER DISC
the discrepancy will be much lower for a size distribution than in Fig. 5.2, since most of the
grains remain small.
5.2.4.3. Hydrogen ionization rate
In the calculation of the MRI-driven viscosity, I consider molecular hydrogen ionization rate
due to radionuclides, cosmic rays and stellar X-rays. The ionization rate of molecular hydrogen
due to short-lived and long-lived radionuclides is
ζR 7.6 1019 s1, (5.22)
which predominantly comes from decay of 26Al (Umebayashi and Nakano 2009). The ionization
rate of molecular hydrogen due to interstellar cosmic rays is (Umebayashi and Nakano 2009)
ζCRpzq ζCR,ISM
2eΣpzqλCR
1
ΣpzqλCR
34
43
, (5.23)
where ζCR,ISM 1017 s1 is the interstellar cosmic-ray ionization rate, Σpzq is the integrated
density column from the top of the disc to the height z above disc midplane, and λCR 96 g cm2 is the attenuation length for cosmic rays (Umebayashi and Nakano 1981).
For the ionization rate of molecular hydrogen due to stellar X-rays I use Bai and Goodman
(2009) fits to Igea and Glassgold (1999) Monte Carlo simulations,
ζXpzq LX
1029 erg s1
r
1 AU
2.2
pζ1epΣpzqλ1qc1 ζ2e
pΣpzqλ2qc2 q, (5.24)
where LX is stellar X-ray luminosity, ζ1 6 1012 s1, λ1 3.4 103 g cm2, and c1 0.4 characterize absorption of X-rays, and ζ2 1015 s1, λ2 1.6 g cm2, and c2 0.65
characterize the contribution from scattered X-rays. Here the attenuation lengths given by
Bai & Goodman in terms of column densities of hydrogen nucleus are re-calculated into the
surface density lengths using the hydrogen abundance given above. I adopt the relationship
LX 103.5Lbol (Wright et al. 2011). For both cosmic rays and X-rays, I ignore the contribution
coming through the other side of the disc. This is valid since in the inner disc the gas surface
densities are mostly larger than the attenuation lengths of the ionizing particles and, even at
low gas surface densities, this can only increase the ionization rates by at most a factor of 2.
5.2.5. Numerical methods
5.2.5.1. Equilibrium vertical disc structure
At a given orbital radius, magnetic field strength and grazing angle φ, the vertical disc structure
is determined as a solution to the boundary value problem given by eqns. (5.1), (5.7)-(5.9) and
96

CHAPTER 5. IMPROVED MODEL OF THE MRI-ACCRETING INNER DISC
the ideal gas law, and, where convectively unstable, by eqns. (5.1), (5.7) and (5.10). This
boundary value problem is solved using the shooting method (Press et al. 2002). The equations
are integrated from the top of the disc (z zsurf) to the disc midplane (z 0). The height of
the disc zsurf is then found, such that F p0q 0. This root-finding problem is solved using the
Ridders’ method, with an exit criterion that |F p0q| 105F pzsurfq.Equations of the vertical disc structure are integrated on a fixed grid with points uniform
in the polar angle. Since eq. (5.9) is an algebraic equation, and for numerical stability, I use
a fully implicit integration method. I use Runge-Kutta method of the second order, i.e. the
trapezoidal method. In the trapezoidal method the equations (5.1), (5.7)-(5.9) are discretized
as a system of nonlinear equations to be solved in every integration step (a system of nonlinear
equations in Pn1, Fn1, Jn1, Tn1 to be solved by a root-finding algorithm),
Pn1 Pn h
2Ω2pρnzn ρn1zn1q, (5.25)
Fn1 Fn h
2pΓn Γn1q, (5.26)
Jn1 Jn h
2p 3
4πqpρnκRpTnqFn ρn1κRpTn1qFn1q, (5.27)
0 4ρn1κP pTn1qpσSBT4n1 πJn1q Γn1, (5.28)
where h is the integration step, ρ ρpT, P q is given by the ideal gas law and Γ Γacc Γirr.
Here, Γirr,n Γirr,npTn, Pn, τirr,z,nq, with the optical depth to stellar irradiation obtained using
τirr,z,n1 τirr,z,n h2κPpρn ρn1q. Furthermore, viscous dissipation is a function of the MRI-
driven viscosity α and thus depends on the local ionization levels. The latter are a function of
the local temperature, pressure and the hydrogen ionization rate which depends on the column
density from the top of the disc. Thus, Γvis,n Γvis,npTn, Pn, Nnq, with the column density
given by Nn1 Nn h2k1
B pPnTn Pn1Tn1q.The equation for pressure Pn1 can be rearranged into an explicit form
Pn1 Pn h
2Ω2ρnzn
1 h2Ω2 µmH
kB
zn1
Tn1
. (5.29)
Then, the above system of equations is equivalent to a single nonlinear equation in Tn1, greatly
simplifying the problem. In every integration step the Ridders’ method is used to solve this
equation for the temperature Tn1 (down to a relative precision of 107) and consequently for
all other quantities. This includes the MRI-driven viscosity α, which is thus calculated self-
consistently at each step of integration.2 At every step and in every iteration of the root-solver
opacities are interpolated from pre-calculated tables using cubic splines, and the ionization
levels (e.g., free electron number density) using tri-linear interpolation.
2This is indeed necessary. An iterative method in which disc thermal structure is decoupled from the densitystructure and the heating terms (e.g. Dullemond 2002) does not converge to a solution in the case of MRI-drivenviscosity.
97

CHAPTER 5. IMPROVED MODEL OF THE MRI-ACCRETING INNER DISC
Additionally, at each integration step it is checked if the resulting temperature gradient is
unstable to convection, and if so, the temperature Tn1 is obtained analytically using
Tn1 Tn h
2∇ad
µmH
kB
Ω2pzn zn1q. (5.30)
With Tn1 known, all other quantities follow same as above. A disc column can, in principle,
become convectively stable again at some height above disc midplane. To calculate the mean
intensity J at a boundary between a convective and a radiative zone, the energy balance
equation (5.9) is used.
For some model parameters there can be a range of orbital radii and values of the magnetic
field strength for which there are multiple solutions for the disc height zsurf (i.e. multiple
solutions for the equilibrium vertical disc structure). This happens when a complex ionization
structure leads to strong variations in the viscosity α as a function of height above disc midplane,
making the total produced viscous dissipation a non-monotonous function of zsurf . When there
are multiple solutions, the solution with smallest zsurf is chosen. It is likely that at least some of
the additional solutions are unphysical, as the strong variations in both the levels of turbulence
and the levels of ionization should be removed by turbulent mixing (see Section 5.3.2.3).
5.2.5.2. Magnetic field strength
At a given orbital radius, grazing angle φ and magnetic field strength B, the above procedure
yields an equilibrium vertical disc structure characterized by a vertically-averaged viscosity
α ³zsurf
0αPdz³zsurf
0Pdz
. (5.31)
As in the vertically-isothermal model (discussed in Chapter 2), for a sufficiently small and a
sufficiently large magnetic field strength B the MRI is suppressed in the entire disc column
and α αDZ. There can be an intermediate range of magnetic fields strength for which the
MRI is active, and the vertically-averaged viscosity α peaks at some value of B. At every
orbital radius, B is chosen such that α is maximized. The underlying assumption here is that
the magnetic fields are strengthened by the MRI-driven turbulence, so that the magnetic field
strength is a monotonously increasing function of α. To maximize αpBq, the Brent method is
used, with a target absolute precision of 103 in logB.
For some model parameters there can be a range of orbital radii where there are multiple
local maxima in α as a function of B. This is essentially for the same reasons that cause multiple
solutions in disc height zsurf at a fixed value of B. In general B is chosen which corresponds
to the global maximum in α. However, in some cases, this is a function of the grazing angle φ
at a fixed orbital radius, and the procedure to determine the grazing angle (described below)
does not converge. There a local maximum with a largest magnetic field strength is chosen.
98

CHAPTER 5. IMPROVED MODEL OF THE MRI-ACCRETING INNER DISC
5.2.5.3. Grazing angle
At any given orbital radius, the angle φ between the incident stellar radiation and the disc
surface is determined self-consistently with the disc structure following D’Alessio et al. (1999).
A self-consistent disc structure is found by iteratively updating the grazing angle φ and re-
calculating the entire disc structure. I use a logarithmic grid for orbital radius. First, I calculate
φ using eq. (5.6) by assuming that zirr 0 and solve for the vertical disc structure and the
magnetic field strength at all radii. I integrate through the obtained disc structure along lines-
of-sight to the star to calculate τirrpr, zq, which yields an updated zirr at each radius.
Critically, to calculate the updated value of the grazing angle φ at each radius, the derivative
dlogzirrdlogr is approximated by assuming that zirr is a power-law, zirr9 rb, within a radius
bin centered at the given radius. So, at each radius I fit for the slope b using zirr at that radius
and at a number of radial grid points interior and exterior to it. Then, the value of the grazing
angle is updated and the vertical disc structure re-calculated at all radii.
This procedure is repeated until the grazing angle has converged at every radius, i.e., until
the relative difference in φ between two consecutive iterations is less than 0.5% at all radii. For
the first radial point I always assume the flat-disc approximation (zirr 0) and do not include
it in the fitting routine. In this work I use a total of 100 radial points between 0.1 AU and
1 AU, and a total of 10 radial points in fits for dlogzirrdlogr.
5.3. Results
I investigate structure of inner regions of protoplanetary discs using a model of a viscous
steady-state accretion disc in which viscosity comes from the MRI. In Chapter 2, I discussed
a vertically-isothermal, constant-opacity disc with a single thermally-ionized chemical species.
In Section 5.3.1 I consider a model in which the vertical structure of the disc is calculated
self-consistently from viscous heating, heating by stellar irradiation, radiative and convective
energy transport, and self-consistent radiative properties of dust, and the disc’s ionization state
is calculated by only considering the thermal (collisional) ionization of potassium, using the
Saha equation. Then, in Section 5.3.2 I present results of the full model that also includes other
relevant chemical species, including dust grains, and non-thermal sources of ionization.
Throughout this chapter I assume the gas accretion rate 9M 108 Md yr1, stellar mass
M 1 Md, stellar radius R 3 Rd, effective stellar temperature T 4400 K, and viscosity in
the MRI-dead zone αDZ 104. The chosen gas accretion rate is the median from observations
(Hartmann et al. 1998; Manara et al. 2016; 2017). The chosen stellar parameters for a solar-
mass star are from the stellar evolution models of Baraffe et al. (2015), for the stellar age of
5 105 yr. At later ages, stellar luminosity decreases, as the star contracts. Maximizing the
stellar luminosity allows us to examine the maximum effect that the stellar irradiation has on
the inner disc. Furthermore, I assume a dust-to-gas ratio fdg 102 and a maximum dust
99

CHAPTER 5. IMPROVED MODEL OF THE MRI-ACCRETING INNER DISC
grain size amax 1µm. In this work the focus is on examining the main physical and chemical
processes that shape the structure of the inner disc, given the above model parameters. How
the disc structure changes as a function of the model parameters is investigated in the next
chapter.
5.3.1. Disc thermal structure and the MRI
In this section I explore how the thermal processes shape the inner disc structure. The chemistry
considered in this section is simple, the disc’s ionization state is set by the thermal ionization
of potassium only, all of which is assumed to be in the gas phase. The effects of dust on the
ionization levels, as well as non-thermal sources of ionization, are explored in Section 5.3.2.
5.3.1.1. Thermal structure of the inner disc
Fig. 5.3 shows the temperature as a function of orbital radius and height above disc midplane
for three models of varying complexity. The left-hand panel shows a disc which has the same
constant opacity (κR κP 10 cm2 g1) as in Chapter 2, but where the disc vertical structure
is calculated self-consistently from viscous heating and cooling by radiation and convection. The
middle panel is a model in which the opacities are also determined self-consistently. Finally,
the right-hand panel is a model which further accounts for the heating by stellar irradiation.
Noticeably, the temperature profiles deviate from vertically-isothermal. Here, the dashed
lines show the disc pressure scale height, and the solid lines show the disc photosphere (where
the Rosseland-mean optical depth is τR 23). In all three models the temperature increases
towards the midplane below the photosphere, as the disc becomes more and more optically-thick
to its own radiation.
The resulting temperature gradient becomes sufficiently high, that the disc becomes con-
vectively unstable, as shown in Fig. 5.4. From the disc midplane to a height of a couple of
pressure scale heights, energy is thus transported by convection, and there we can assume that
the temperature gradient is isentropic. Importantly, the strong temperature gradient that gives
the rise to the convective instability is not specific to the MRI-driven accretion. It is a feature
of any active optically-thick disc where the accretion heat is released near midplane (see also
Garaud and Lin 2007). This is shown analytically in Section 5.4.
The model that also includes heating due to stellar irradiation, shown in the right panels of
Fig. 5.3 and Fig. 5.4, features a temperature inversion in the disc upper layers. This temperature
inversion has been discussed in detail by D’Alessio et al. (1998). The dotted line here indicates
the irradiation surface zirr at which τirr 23. Above this line the disc upper layers are
heated by stellar irradiation. Below, disc becomes optically-thick to incident irradiation and
temperature drops. Then, below the disc photosphere (the solid line), disc is optically-thick to
its own radiation and temperature increases again.
100

CHAPTER 5. IMPROVED MODEL OF THE MRI-ACCRETING INNER DISC
10 1 100
Radius [AU]10 4
10 3
10 2
10 1He
ight
[AU]
100300500700900110013001500
Tem
pera
ture
[K]
10 1 100
Radius [AU]10 4
10 3
10 2
10 1
Heig
ht [A
U]
100300500700900110013001500
Tem
pera
ture
[K]
10 1 100
Radius [AU]10 4
10 3
10 2
10 1
Heig
ht [A
U]
100300500700900110013001500
Tem
pera
ture
[K]
Figure 5.3: Temperature as a function of location in the disc for a viscously-heated constant-opacity model (left), viscously-heated model with realistic opacities (middle), and a viscouslyand irradiation-heated model with realistic opacities (right). In each panel the solid line showsthe disc photosphere (τR 23) and the dashed line shows the pressure scale height (P e12Pmid). The dotted line in the right-hand panel shows the surface at which τirr 23. Notethat the inclusion of heating by stellar irradiation does not strongly affect the disc midplanetemperature. See Section 5.3.1.1.
In the irradiated disc, close to the star the disc midplane is as hot as the disc upper layers,
and further away the midplane is significantly hotter than the upper layers. It would appear that
the accretion heating dominates in the inner disc. However, the total flux of stellar radiation
absorbed by a vertical column in the disc at a given radius, shown in Fig. 5.5, is in fact of the
order of few tens of the total flux generated by viscous dissipation (Firr10Facc) throughout the
inner disc. Nevertheless, the disc temperature near midplane is weakly affected by irradiation.
I discuss this result in Section 5.4.2.
The ratio FirrFacc varies non-monotonically, following the grazing angle, shown in the right
panel of Fig. 5.5. At the inner edge of the calculation domain, the first 10 points (shown
in grey) are affected by the boundary effects. This is a well known problem in disc models
that account for stellar irradiation using the grazing angle prescription (Chiang et al. 2001).
Importantly, far away from the inner edge, the value of the grazing angle and the disc structure
do not depend on the disc structure at the inner edge.
5.3.1.2. Ionization levels and non-ideal MHD effects
The ionization structure of the models with a self-consistent vertical structure is qualitatively
different than in the vertically-isothermal models discussed in Chapter 2. In the vertically-
isothermal models the ionization fraction increases with height above disc midplane, as the
temperature is constant and density decreases (which follows from the Saha equation). Here,
as the temperature decreases with height, so does the ionization fraction, as shown in the
middle three panels of Fig. 5.6. Here, the top three panels show the viscosity α as a function
of height above disc midplane, middle panels show the free electron number density relative
to the number density of molecular hydrogen nenH2 , and bottom panels show the Ohmic and
ambipolar resistivities. Solid lines are for the viscously-heated model with self-consistent dust
101

CHAPTER 5. IMPROVED MODEL OF THE MRI-ACCRETING INNER DISC
10 1 100
Radius [AU]10 4
10 3
10 2
10 1
Heig
ht [A
U]
radiativeconvective
10 1 100
Radius [AU]10 4
10 3
10 2
10 1
Heig
ht [A
U]
10 1 100
Radius [AU]10 4
10 3
10 2
10 1
Heig
ht [A
U]
Figure 5.4: Radiative and convective zones (light and dark red, respectively) for a viscously-heated constant-opacity model (left), viscously-heated model with realistic opacities (middle),and a viscously and irradiation-heated model with realistic opacities (right). In each panel thedashed line shows the pressure scale height (P e12Pmid). In all three models the disc isconvectively unstable within few scale heights. See Section 5.3.1.1.
20
30
40
50
60
70
F irr/F
acc
10 1 100
Radius [AU]
0.025
0.050
0.075
0.100
0.125
0.150
Incid
ent a
ngle
() [
rad]
Figure 5.5: Ratio of the total irradiation heating to the total viscous dissipation (FirrFacc)as a function of radius (top) and the incident angle to stellar irradiation (φ) as a functionof radius (bottom). The total (vertically-integrated) absorbed stellar flux Firr is at least anorder of magnitude larger than the total viscous dissipation Facc at any given radius. Graylines indicate the region affected by the inner boundary condition for the incident angle φ. SeeSection 5.3.1.1.
102

CHAPTER 5. IMPROVED MODEL OF THE MRI-ACCRETING INNER DISC
10 5
10 4
10 3
10 2
10 1
100Lo
cal v
iscou
s 0.10 AU 0.22 AU 0.50 AU
no irradiationwith irradiation
10 16
10 14
10 12
10 10
10 8
10 6
10 4
n e/n
H 2
no irradiationwith irradiation
10 3 10 2 10 11010
1014
1018
1022
1026
1030
1034
Resis
tiviti
es [c
m2 /s
]
10 3 10 2 10 1
Height [AU]10 3 10 2 10 1
O, no irr.A, no irr.O, w. irr.A, w. irr.
Figure 5.6: Local viscous parameter α (top), ionization fraction nenH2 (middle) and magneticresistivities (bottom) at three different orbital radii (as indicated in panel titles) in a modelwith realistic opacities, but no irradiation, and a model that also includes irradiation, as shownin plot legend. Despite the high ionization fraction in the irradiation-heated disc upper layers,ambipolar diffusion quenches the MRI there. See Section 5.3.1.2.
opacities, and dashed lines are for the model that also includes heating by stellar irradiation.
In the latter model, the ionization does increase in the uppermost irradiated layers.
As a consequence of the above, in non-irradiated discs both ambipolar and Ohmic resistivity
increase with height. In other words, in these self-consistent models, both ambipolar and Ohmic
diffusion quench the MRI from above. The Ohmic resistivity decreases in the uppermost layers
of the irradiated disc, however, ambipolar diffusion does not.
5.3.1.3. MRI-active and dead zones
The differences in the ionization structure of the vertically self-consistent models and the
vertically-isothermal models lead to differences in where in the disc the MRI is active. Plot of
the viscosity α as a function of orbital radius and height above disc midplane, Fig. 5.7, shows
that the MRI-active zone (where α ¡ αDZ) remains around midplane. This is qualitatively
different from the vertically-isothermal case, where the MRI-active zone is around midplane
103

CHAPTER 5. IMPROVED MODEL OF THE MRI-ACCRETING INNER DISC
10 1 100
Radius [AU]10 4
10 3
10 2
10 1He
ight
[AU]
10 4
10 3
10 2
10 1
Loca
l visc
ous
10 1 100
Radius [AU]10 4
10 3
10 2
10 1
Heig
ht [A
U]
10 4
10 3
10 2
10 1
Loca
l visc
ous
10 1 100
Radius [AU]10 4
10 3
10 2
10 1
Heig
ht [A
U]
10 4
10 3
10 2
10 1
Loca
l visc
ous
Figure 5.7: Local viscous parameter α as a function of location in the disc for a viscously-heated constant-opacity model (left), viscously-heated model with realistic opacities (middle),and a viscously and irradiation-heated model with realistic opacities (right). In each panel thesolid line shows the disc photosphere (τR 23) and the dashed line shows the pressure scaleheight (P e12Pmid). The dotted line in the right-hand panel shows the surface at whichτirr 23. Note that the heating by stellar irradiation has a very weak effect on the extent ofthe MRI-active region. See Section 5.3.1.3.
in the innermost region, but at a certain orbital distance rises into the upper layers. Such a
configuration in which an MRI-active zone is nested between a dead zone at midplane, and
ambipolar-dead zone above, arises in the vertically-isothermal case because there the ionization
levels increase with height above disc midplane. Furthermore, the three panels correspond to
the same three models as above: viscously-heated constant-opacity model, viscously-heated
model with self-consistent opacities, and a fully self-consistent model which also includes heat-
ing by stellar irradiation. Noticeably, stellar irradiation makes little difference to the extent of
the MRI-active zone, since irradiation affects the midplane temperature weakly, and the hot
uppermost layers are dead due to the ambipolar diffusion.
Finally, Fig. 5.8 compares radial profiles of the vertically-averaged viscosity α and the mag-
netic field strength B from four models of varying complexity. The grey solid lines show the
results of the viscously-heated vertically-isothermal constant-opacity model from Chapter 2.
The black dotted line is for the disc which has the same constant opacities, but where the disc
vertical structure is calculated self-consistently from viscous heating and cooling by radiation
and convection. The black dashed line is for the model in which the opacities are also deter-
mined self-consistently and the black solid line is for the model which further accounts for the
heating by stellar irradiation.
In line with theoretical expectations and the previous study, the vertically-averaged viscosity
α decreases as a function of orbital radius. At some distance from the star the MRI is completely
quenched and the viscosity reaches the minimum value, α αDZ. Remarkably, the α radial
profile is both qualitatively and quantitatively similar in these models. We can expect this
to be the case in general, as long as the disc is optically thick, so that the heating by stellar
irradiation may be neglected. However, the radial profile of the magnetic field strength B
reveals qualitative differences. In the vertically-isothermal model, Bprq features a sharp drop
104

CHAPTER 5. IMPROVED MODEL OF THE MRI-ACCRETING INNER DISC
10 4
10 3
10 2
10 1
Verti
cally
-ave
rage
d vi
scou
s
10 1 100
Radius [AU]
0.5
0.0
0.5
1.0
1.5
2.0
log
B [G
auss
]
real. opac., acc + irrreal. opac., accconst. opac., accconst. opac., acc, vert. isoth.
Figure 5.8: Vertically-averaged viscosity parameter (α) and the magnetic field strength (B) asfunctions of radius in a vertically-isothermal and self-consistent models of varying complexity (aviscously-heated constant-opacity model, viscously-heated model with realistic opacities, and aviscously and irradiation-heated model with realistic opacities), as indicated in plot legend. Thevertically-averaged viscosity parameter profile is similar in all four models, but the magneticfield strength profile is qualitatively different in the vertically-isothermal model. See Section5.3.1.3.
105

CHAPTER 5. IMPROVED MODEL OF THE MRI-ACCRETING INNER DISC
at 0.35 AU, which corresponds to the rise of a dead zone at disc midplane described above
(see also Chapter 2). From that point, until the MRI is completely quenched at 0.7 AU, the
MRI is active in a thin layer high above the midplane, between a dead zone at disc midplane
and a zombie zone above. In the self-consistent models, however, this configuration does not
appear and the magnetic field strength remains high until the MRI is completely quenched.
5.3.2. Disc chemical structure and the MRI
In this section I build upon the model from the previous section. First, I explore the effects of
dust on the disc’s ionization state and on the MRI. Then, I produce the full model of the inner
disc by also considering non-thermal sources of ionization.
5.3.2.1. Effects of dust
Fig. 5.9 shows the radial profiles of the vertically-averaged viscosity α, magnetic field strength,
midplane temperature and the midplane free electron number density for a model with a self-
consistent vertical structure and thermal ionization only (solid lines), and a model in which
the dust effects on the ionization state are included (dashed lines). The latter model includes
gas-phase collisional (thermal) ionization and recombination, adsorption of free charges on the
dust grains, and thermionic and ion emission from the dust grains. Non-thermal ionization is
also included, but at a negligible rate of ζ 1025 s1 to isolate the high-temperature effects.
As Fig. 5.9 shows, the radial profile of α and the radial extent of the MRI-active zone are
overall similar for both models. Interestingly, when the dust effects are included, α is higher
at a given orbital radius, as is the ionization fraction, i.e. nenH2 . Concurrently, the midplane
temperature is lower in the model that includes dust.
Fig. 5.10 shows the vertical structure of the model with dust at three different orbital radii.
Top panels show the viscosity α as a function of height, middle panels show the number densities
of free electrons and ions, and bottom panels show the various contributions to the free electron
production rate (in s1 cm3). As in the thermally-ionized disc (Fig. 5.7), the MRI is active
at the hot disc midplane. The ionization levels decrease with height above the midplane as
temperature decreases, and increase again in the disc atmosphere heated by stellar irradiation;
here, however, ambipolar diffusion quenches the MRI.
The plots of free electron production rates show that thermionic emission is the dominant
ionization source. Thus, Fig. 5.9 is misleading in the sense that, while the differences in the
global structure are very small when dust effects are added, it is not because dust effects are
small. Clearly, dust dominates the chemistry in the inner disc. Rather, for the parameters
assumed here, the ionization levels as a function of temperature and density are similar to the
levels obtained from gas-phase thermal ionization only.
106

CHAPTER 5. IMPROVED MODEL OF THE MRI-ACCRETING INNER DISC
10 4
10 3
10 2
10 1
Verti
cally
-ave
rage
d vi
scou
s
0.5
0.0
0.5
1.0
1.5
2.0
log
B [G
auss
]
800
1000
1200
1400
1600
Mid
plan
e te
mpe
ratu
re [K
]
10 1 100
Radius [AU]10 17
10 15
10 13
10 11
10 9
10 7
Mid
plan
e n e
/nH 2
thermalthermal+dustthermal+dust+H2 ionization
Figure 5.9: Vertically-averaged viscous parameter (α), magnetic field strength (B), midplanetemperature and the midplane free electron fraction (nenH2) as functions of radius for a modelwith thermal ionization only, a model with thermal ionization and dust effects (with ζ 1025 s1), and a model which also includes non-thermal sources of ionization (ζ ζRζCRζX).The disc structure is quantitatively similar in all three models; however, the primary source ofionization in the models that include dust are thermionic and ion emission. See Section 5.3.2.1.
107

CHAPTER 5. IMPROVED MODEL OF THE MRI-ACCRETING INNER DISC
10 5
10 4
10 3
10 2
10 1
100
Loca
l visc
ous
0.11 AU 0.50 AU 0.79 AU
10 16
10 14
10 12
10 10
10 8
10 6
10 4
n/n H
2
ne/nH2
nK + /nH2
ni/nH2
10 3 10 2 10 110 20
10 16
10 12
10 8
10 4
100
104
Ioni
zatio
n ra
te [c
m3 s
1 ]
10 3 10 2 10 1
Height [AU]10 3 10 2 10 1
thermionicthermalionization of H2
Figure 5.10: Local viscous parameter α (top), ionization fraction nenH2 (middle) and ionizationrates (bottom; thermionic Rtherm, thermal k2nH2nK0 and non-thermal ζnH2) at three differentradii (as indicated in panel titles) for the model with thermal ionization and dust effects (withζ 1025 s1). Thermionic emission is the primary source of free electrons in the MRI-activeregions. See Section 5.3.2.1.
108

CHAPTER 5. IMPROVED MODEL OF THE MRI-ACCRETING INNER DISC
5.3.2.2. Non-thermal sources of ionization
In this section I present the full model of the inner disc which, in addition to the above,
also includes non-thermal sources of ionization. Stellar X-rays, cosmic rays and radionuclides
ionize hydrogen, producing atomic ions and free electrons. The resulting radial profiles of
α, magnetic field strength, midplane temperature, density and ionization levels are shown in
Fig. 5.9 as dotted lines. The radial profile of α seems to overlap with the model where the
hydrogen ionization rate was set to a negligibly low value. However, in the region where the
MRI is dead in the previous models, α is slightly higher than αDZ in this model. The magnetic
field strength does not drop to zero in this model, further revealing that the MRI remains active
here.
Fig. 5.11 shows the vertical structure of this disc at three different orbital radii. It reveals
that at large orbital radii where the MRI was quenched in previous models, it remains active
at large heights (see also Fig. 5.12). The plots of ionization levels show that the fraction of
free electrons and atomic ions increase immensely towards disc surface where the non-thermal
ionization dominates. As a result of the high electron fraction in the upper layers, potassium
ions are depleted there, as they can easily recombine with the abundant electrons. Note that
the fraction of free electrons and atomic ions become extremely large near the disc surface,
i.e. higher than the total Mg abundance, and even total C, O abundances. The plots are
cut off at njnH2 ¡ 103. Clearly, above this level the chemical model is not applicable, as
the ionized hydrogen would become an important species and the assumption of a constant
hydrogen number density would be invalid. Nevertheless, this is above the MRI active zone at
all orbital radii, and it is thus not pertaining to the conclusions.
Fig. 5.13 compares the contributions from stellar X-rays and cosmic rays to the hydrogen
ionization rate. As expected, the un-attenuated ionization rate due to X-rays is higher at the
disc surface, but cosmic rays can penetrate deeper in the disc. Nevertheless, the MRI-active
region in the upper disc layers is mostly ionized by X-rays.
Finally, note that in this outer region the gas accretes primarily through the dead zone,
since the density at the dead disc midplane is much higher than in the X-ray-ionized MRI-
active layer. This is why the vertically-averaged viscosity parameter is close to the dead-zone
value, α αDZ outwards from the pressure maximum.
5.3.2.3. Multiple solutions for the vertical disc structure
In the results presented so far, for the fiducial choice of disc and dust parameters, solutions
for the vertical disc structure (i.e., solutions in disc height zsurf) appear to be unique at any
given orbital radius, grazing angle φ and magnetic field strength B. In general, there is also
a single peak in the vertically-averaged viscosity α as a function of magnetic field strength B
(which determines the choice for B). The exception is the vicinity of the orbital radius at which
the MRI becomes quenched at disc midplane (see Fig. 5.12). There, αpBq has two peaks, one
109

CHAPTER 5. IMPROVED MODEL OF THE MRI-ACCRETING INNER DISC
10 5
10 4
10 3
10 2
10 1
100Lo
cal v
iscou
s 0.11 AU 0.50 AU 0.79 AU
10 16
10 14
10 12
10 10
10 8
10 6
10 4
n/n H
2
ne/nH2
nK + /nH2
ni/nH2
10 3 10 2 10 110 20
10 16
10 12
10 8
10 4
100
104
Ioni
zatio
n ra
te [c
m3 s
1 ]
10 3 10 2 10 1
Height [AU]10 3 10 2 10 1
thermionicthermalionization of H2
Figure 5.11: Local viscous parameter α (top), ionization fraction nenH2 (middle) and ionizationrates (bottom; thermionic Rtherm, thermal k2nH2nK0 and non-thermal ζnH2) at three differentradii (as indicated in panel titles) for the model with all sources of thermal and non-thermalionization. Non-thermal ionization produces an MRI-active region high above disc midplane atlarger radii (see the top right panel). See Section 5.3.2.2.
10 1 100
Radius [AU]
10 4
10 3
10 2
10 1
Heig
ht [A
U]
10 4
10 3
10 2
10 1
Loca
l visc
ous
Figure 5.12: Local viscous parameter α as a function of location in the disc for the model withall sources of thermal and non-thermal ionization. In the innermost disc, thermionic and ionemission ionize the dense regions around the disc midplane, producing the high MRI-driven αthere. At larger radii, the MRI is active in a thin layer high above the disc midplane, dominatedby non-thermal sources of ionization. See Section 5.3.2.2.
110

CHAPTER 5. IMPROVED MODEL OF THE MRI-ACCRETING INNER DISC
10 3 10 2 10 110 25
10 22
10 19
10 16
10 13
10 10
10 7
X, CR
[s1 ]
0.11 AU
10 3 10 2 10 1
Height [AU]
0.50 AU
10 3 10 2 10 1
0.79 AUX
CR
Figure 5.13: Ionization rates of molecular hydrogen due to stellar X-rays (ζX) and due to cosmicrays (ζCR) for the model with all sources of thermal and non-thermal ionization. Stellar X-raysare the dominant source of ionization in the disc upper layers. See Section 5.3.2.2.
corresponding to the solution where the MRI is active at disc midplane, and the other to the
solution where the MRI is active in the upper disc layers, mostly ionized by stellar X-rays. As
discussed in Section 5.2.5, B is chosen such that α is maximized in this case as well.
Note that there could be, in principle, a thin MRI-active layer high up in the disc at shorter
orbital radii as well, in addition to the active layer at midplane. Here, this does not appear
due to the assumption that the magnetic field strength B is vertically constant. At the high
B necessary to drive the efficient accretion at midplane, the MRI is quenched in the low-
density disc atmosphere due to ambipolar diffusion. Therefore, it is only when the temperature
drops and the high-temperature ionization cannot drive the accretion efficiently that the model
features the thin active layer high up above the disc midplane.
For a different choice of parameters, e.g. if the maximum dust grain size is amax 100µm,
there may exist an additional range of orbital radii where there are multiple peaks in αpBqand also multiple solutions for the disc vertical structure (for zsurf) at a fixed value of the
magnetic field strength B. Similarly to the above, this issue arises due to competing effects of
high-temperature sources of ionization (thermal ionization, and thermionic and ion emission)
and X-rays. As these sources of free electrons depend quite differently on the disc structure
(density, temperature, column density), their combination leads to non-monotonous variations
in the electron number density as a function of height above disc midplane. Since the viscous
dissipation due to the MRI is sensitive to the ionization levels, the total dissipation can be a
non-monotonous function of zsurf . Since the solution for the vertical disc structure is determined
by an equilibrium between an input and an output total heat, this can lead to multiple solutions
in zsurf .
To illustrate this issue Fig. 5.14 shows an example of three thermally-stable solutions for the
vertical disc structure at a fixed value of magnetic field strength B that appears in the model
for a maximum grain size amax 100µm (we can ignore thermally unstable solutions, which are
not shown here). Note that the dependence of the overall disc structure and the location of the
pressure maximum on the dust grain size are presented and thoroughly discussed in the next
111

CHAPTER 5. IMPROVED MODEL OF THE MRI-ACCRETING INNER DISC
10 4
10 3
10 2
10 1
Loca
l visc
ous
10 4 10 3 10 2
Height [AU]
10 11
10 10
10 9
10 8
n e/n
H 2
Figure 5.14: Degeneracy in the vertical disc structure at a fixed magnetic field strength in amodel where the maximum dust grain size is amax 100µm: local viscous parameter α asa function of height (top), and the fractional electron number density (nenH2 ; bottom) asfunctions of height in three different equilibrium solutions. The different solutions arise fromvertical variations in the viscous α; the lengthscales of these variations are much smaller thanthe disc pressure scale height (shown for each solution by the vertical grey lines). See Section5.3.2.3.
chapter. Here, I only discuss the issue of the multiple solutions. Fig. 5.14 shows the viscosity
α as a function of height in the top panel and the ratio nenH2 in the bottom.
Evidently, small variations in the free electron number density correspond to large variations
in the viscosity α, all at heights below one disc pressure scale height (indicated by grey lines).
This implies that the difference between these solutions is likely unphysical for two reasons.
First, the viscosity α is in reality driven by turbulence, and turbulent motions should not
abruptly change over lengthscales much smaller than a single pressure scale height. Second,
chemical species can also be expected to be spatially mixed by turbulence, and so such vertical
variations in the ionization levels might be smoothed over in reality. Since resolving these issues
is out of the scope of the models, a solution with minimum zsurf is always chosen, which also
appears to always correspond to a maximum α at the given magnetic field strength.
112

CHAPTER 5. IMPROVED MODEL OF THE MRI-ACCRETING INNER DISC
5.4. Discussion
5.4.1. Effects of dust
A key feature of the inner disc is that the MRI drives high viscosity in the innermost regions,
close to the star, but becomes largely suppressed at larger orbital distances (in the so-called
dead zone). This leads to a formation of a local gas pressure maximum that may play a key
role in planet formation at short orbital distances (Chatterjee and Tan 2014). This decrease
in viscosity is expected to arise because the innermost regions are hot enough (¡ 1000 K) to
thermally ionize potassium (coupling the gas to the magnetic field), but further out temperature
and ionization levels decrease substantially (Gammie 1996). In Chapter 2, we have seen that
in a thermally-ionized disc coupled self-consistently to an MRI viscosity, the inner edge of the
dead zone lies at a few tenths of an AU.
One of the key differences of this work to Chapter 2 is that here the effects of dust on disc
ionization levels are also taken into account. Small dust grains present in the disc sweep up
free electrons and ions from the gas, and these recombine quickly on the grain surfaces. In the
bulk of the protoplanetary disc dust grains efficiently lower the ionization levels, decoupling
the magnetic field from the gas and suppressing the MRI (Sano et al. 2000; Ilgner and Nelson
2006; Wardle 2007; Salmeron and Wardle 2008; Bai and Goodman 2009). In the inner regions
of protoplanetary discs dust grains also act to increase the ionization levels, as at high tem-
peratures they can also emit electrons and ions into the gas (Desch and Turner 2015). The
balance between thermal ionization and these processes then determines how well ionized the
inner disc is, and thus, the extent of the high-viscosity region and the location of the dead zone
inner edge.
The top panel of Fig. 5.9 shows that addition of dust only weakly affects the vertically-
averaged viscosity α in the inner disc. At a given orbital radius, α is even slightly higher than
in the model with no dust, implying that thermionic and ion emission are important sources
of ionization. In fact, as Desch and Turner (2015) showed, thermionic emission can become
the main source of free electrons at high temperatures. For the disc model discussed here this
can be seen in the bottom panel of Fig. 5.11, which shows that at hot disc midplane thermionic
emission dominates over other sources of ionization. Clearly then, for the chosen parameters,
the adsorption of charges onto grains is more than counteracted by the expulsion of charges
from hot grain surfaces.
Similarity in the resulting disc structure in the models with and without dust grains can
be explained by the similar dependency on temperature that thermal and thermionic emission
have (and which can also be deduced from the bottom panel of Fig. 5.11). As discussed by
Desch and Turner (2015), thermal ionization of potassium becomes efficient at temperatures
above 1000 K in accordance with its ionization potential IP 4.34 eV. The temperature at
which thermionic emission becomes important is determined by the work function W of the
113

CHAPTER 5. IMPROVED MODEL OF THE MRI-ACCRETING INNER DISC
material out which dust grains are made, and for silicates W 5 eV. This alone would imply
that thermionic emission becomes efficient at temperatures closer to 2000 K. However, above
1000 K potassium-bearing minerals start evaporating from grain surfaces (Lodders 2003), and
a fraction of potassium atoms leaves the grain surface as ions (since W IP). Dust grains
then become negatively charged, which reduces the effective potential that electrons ought to
overcome for thermionic emission (the effective work function Weff).
The above results could change significantly as dust grains grow or as they accumulate
in the inner disc (as needed for the formation of solid planet cores). Dust adsorption of free
charges, for example, becomes much less efficient for larger grains, since the total grain surface
area decreases (Sano et al. 2000; Ilgner and Nelson 2006). I investigate how dust growth and
varying dust-to-gas ratio affect the inner disc structure in the next chapter.
5.4.2. Importance of stellar irradiation
The absorbed flux of stellar irradiation is many times higher than the heat flux generated
by accretion at any given radius, yet irradiation has a very small effect on the disc midplane
temperature. Consequently, the ionization levels and the MRI-driven viscosity are similar in
the models with and without stellar irradiation.
Essentially, this is because the stellar irradiation heats the disc optically-thin regions, from
which heat escapes easily. Accretion heat is generated deep in the disc, where the optical depth
is much higher. In the absence of stellar irradiation, the midplane temperature in the optically
thick disc is σSBT4mid Faccτmid (Hubeny 1990, though in this work the midplane temperature
is somewhat lower due to convection). If on top of a viscously-heated layer of optical thickness
τmid " 1 there is an irradiation-heated layer of optical thickness τupper, from eq. (5.8) it follows
that σSBT4mid Faccτmid Firrτupper (again, neglecting convection). Here τupper is the optical
depth of the disc to its own radiation down to a height at which the disc becomes optically thick
to stellar irradiation. Then, if τmid is sufficiently larger than τupper, the midplane temperature
is determined by viscous dissipation.
The results are consistent with those of D’Alessio et al. (1998), who also found that mod-
els with and without stellar irradiation yield roughly the same midplane temperatures in
the optically-thick inner disc. Similarly, Flock et al. (2019) considered 2D static radiation-
hydrodynamics models of the inner disc heated by stellar irradiation only, but found that the
midplane temperature (and the orbital radius of the dead zone inner edge) would increase ap-
preciably if accretion heat were included, on the condition that the accretion heat is released
near the optically-thick midplane.
5.4.3. Convective instability in the inner disc
In Section 5.3.1 we have seen that a large region of the inner disc is convectively unstable.
This is also the case even when the opacities are constant, i.e., a super-linear growth of the
114

CHAPTER 5. IMPROVED MODEL OF THE MRI-ACCRETING INNER DISC
opacity with temperature (Lin and Papaloizou 1980) is not needed. Here, the high temperature
gradient is established because the heat is deposited deep within the optically-thick disc. In
the presented models most of the viscous dissipation happens near midplane, where the MRI
is active, but the same is also true for a vertically-constant viscosity α. This result can also
be confirmed analytically. We can consider a simplified problem of radiative transfer in the
optically thick limit, where the temperature is given by σT 4 34τF pzsurfq (Hubeny 1990).
Assuming a constant disc opacity, the equation of hydrostatic equilibrium can be re-written asdPdτ Ω2z
κR. The temperature gradient is then given by
∇ dlnT
dlnP κRP
4Ω2zτ.
The appropriate upper boundary condition for this problem is the disc photosphere (τ 23),
where the gas pressure is given by Psurf Ω2zsurfτsurfκ (assuming that the disc is vertically
isothermal above the photosphere, Papaloizou and Terquem 1999). At the photosphere, given
the chosen boundary condition, we have ∇ 14. Near the midplane the optical depth is
τMID 12κΣ, and we may estimate the midplane pressure as
PMID ρMIDcs,MID Σ
2Hcs,MID 1
2Ω2ΣH,
where the disc scale height H is related to the midplane temperature. Substituting τMID and
PMID into the expression for the temperature gradient, we have
∇MID 1
4
H
z,
implying that such a disc should become convectively unstable a bit below one scale height.
However, we can further estimate the gradient ∇ near one scale height, by assuming that there
PH PMIDe12 0.6PMID, and τH 0.3τMID, as follows from vertically isothermal, Gaussian
profiles of pressure and density. Thus, near z H, we have
∇H 1
2
H
z,
showing that the disc should become convectively unstable above one scale height.
Furthermore, in the convectively unstable regions I have used a simple approximation that
convection is efficient and the temperature gradient is isentropic. More detailed calculations
would yield an answer in which the temperature gradient lies between the isentropic one and
the gradient given by the radiative transport. As it turns out, the result would not differ much
from what is obtained here. In the optically-thick limit considered above, the difference in the
temperature profile when the entire flux is transported by radiation and when the entire flux
is transported by convection is a very weak function of optical depth, and remains small for
rather large optical depths (Cassen 1993).
115

CHAPTER 5. IMPROVED MODEL OF THE MRI-ACCRETING INNER DISC
Limiting the temperature gradient is the only role of convection in the simple viscous model
discussed here. In real discs, convection might interact with the MHD turbulence induced
by the MRI. For example, in simulations of ideal MHD Bodo et al. (2013) and Hirose et al.
(2014) find that convection can increase the angular momentum transport driven by the MRI
by increasing the magnetic field strength, although it appears that this is only the case when
convection is particularly strong (Hirose 2015). Concurrently, it is found that the relationship
between the induced stress and the magnetic field strength are not modified. The consequences
for the non-ideal MHD regime, relevant in protoplanetary discs, are not clear. In the solutions
presented in this work the value of the vertically-averaged MRI-driven viscosity would decrease
with both a decrease and an increase in the magnetic field strength due to non-ideal effects.
Convection itself is not expected to drive the angular momentum transport at a level comparable
to the MRI (e.g. Lesur and Papaloizou 2010; Held and Latter 2018), and in any case it is not
self-sustainable, i.e., it requires additional source of heat near disc midplane to establish the
high temperature gradient.
5.4.4. Energy transport by turbulent elements
Ruediger et al. (1988) considered vertical structure models in which the turbulent elements
driving the angular momentum transport may also transport energy. Such turbulent energy
transport flux would be analogous to convection, transporting energy down the entropy gra-
dient, the difference being that turbulent elements may persist at sub-adiabatic temperature
gradients (as they are driven by other instabilities) in which case they transport energy from
cooler to hotter regions (Balbus 2000). We can expect that including this mode of energy trans-
port into these calculations would not change appreciably any of the results presented here.
D’Alessio et al. (1998) found that the turbulent energy transport accounts for less then 20% of
the total energy flux at any given orbital radius. In this work, the convectively stable upper
layers of the disc are MRI-dead, and thus the thermal diffusivity due to turbulence is likely
very low. In the regions of the disc where the radiative flux alone would yield super-adiabatic
temperature gradient, it is already assumed that convection efficiently establishes the adiabat.
The proportion of turbulent energy flux could be higher than the convective energy flux in such
regions, but the temperature would not change significantly.
5.4.5. Ambipolar diffusion in the strong-coupling regime
The criterion for the ambipolar diffusion to quench the MRI that is employed here is valid in
the strong-coupling regime (Bai and Stone 2011). Strong coupling requires that the ionization
equilibrium is achieved on a timescale tchem shorter than the dynamical timescale tdyn 2πΩ.
Previously, in Chapter 2 it was reported that this condition is not fulfilled in most of the inner
disc, as slow radiative recombinations make the chemical equilibrium timescale long. However,
even in the absence of dust, three-body recombinations (recombinations through collisions
116

CHAPTER 5. IMPROVED MODEL OF THE MRI-ACCRETING INNER DISC
10 1 100
Radius [AU]
10 4
10 3
10 2
10 1
Heig
ht [A
U]10 8
10 6
10 4
10 2
100
102
t che
m/t d
yn
Figure 5.15: Ratio of the shortest recombination timescale (tchem) to the dynamical timescale(tdyn) as a function of the location in the disc. The solid line indicates where tchemtdyn 1.Everywhere below this line the chemical equilibrium timescale is shorter than the dynamicaltimescale, justifying the assumption of the strong-coupling regime. See Section 5.4.5.
with the abundant molecular hydrogen) are much faster than radiative recombinations, and
adsorption onto grains is even faster (Desch and Turner 2015).
Since I solve directly for the equilibrium ionization state, I do not have access to the timescale
tchem. However, we can estimate it as tchem neR, where R is the fastest of the above three
recombination rates (in general, but not always, that is adsorption onto dust grains). Fig. 5.15
shows, for the fully self-consistent model with the full chemical network, that tchemtdyn 1
everywhere except in the uppermost, lowest-density layers of the disc. It can thus be concluded
that the use of the ambipolar diffusion criterion in the strong-coupling regime is justified.
5.5. Conclusions
I present a steady-state model of the inner protoplanetary disc which accretes viscously, pri-
marily due to the MRI. In this model, the disc is heated by viscous dissipation and stellar
irradiation, and cools radiatively and convectively. The disc is ionized by thermal ionization,
thermionic and ion emission from dust grains and by stellar X-rays, cosmic rays and radionu-
clides, and I also account for adsorption of charges onto dust grains. The disc structure (density,
temperature), viscosity due to the MRI, disc opacity and ionization state are calculated self-
consistently everywhere in the disc.
I investigate how these various processes affect the structure of the inner disc and the extent
to which the MRI can drive efficient accretion, i.e., the location of the inner edge of the dead
zone. I find that, since the inner disc is optically thick, stellar irradiation weakly affects the
temperature at midplane, and therefore weakly affects the location of the dead zone inner edge.
Furthermore, the inner disc is largely convectively unstable, which is shown to be a property
of any optically-thick disc in which viscous heating is released near the midplane.
117

CHAPTER 5. IMPROVED MODEL OF THE MRI-ACCRETING INNER DISC
Dust controls the ionization state of the inner disc, and thus the onset of the MRI. Thermal
ionization plays a secondary role, as thermionic and ion emission from dust grains ionize the
hot dense regions. High above disc midplane stellar X-rays produce a thin MRI-active layer.
However, this changes very little the overall viscosity at short orbital distances.
While there are some qualitative differences in the shape of the dead zone inner edge as a
function of radius and height above disc midplane compared to the work discussed in Chapter
2, its radial location remains at roughly the same orbital distance of 0.7 AU for the fiducial pa-
rameters. This is a consequence of the similarity between the ionization potential of potassium
and the work function of the dust grains. How these results depend on the model parameters,
including dust grain size and dust-to-gas ratio, is explored in the next chapter.
118
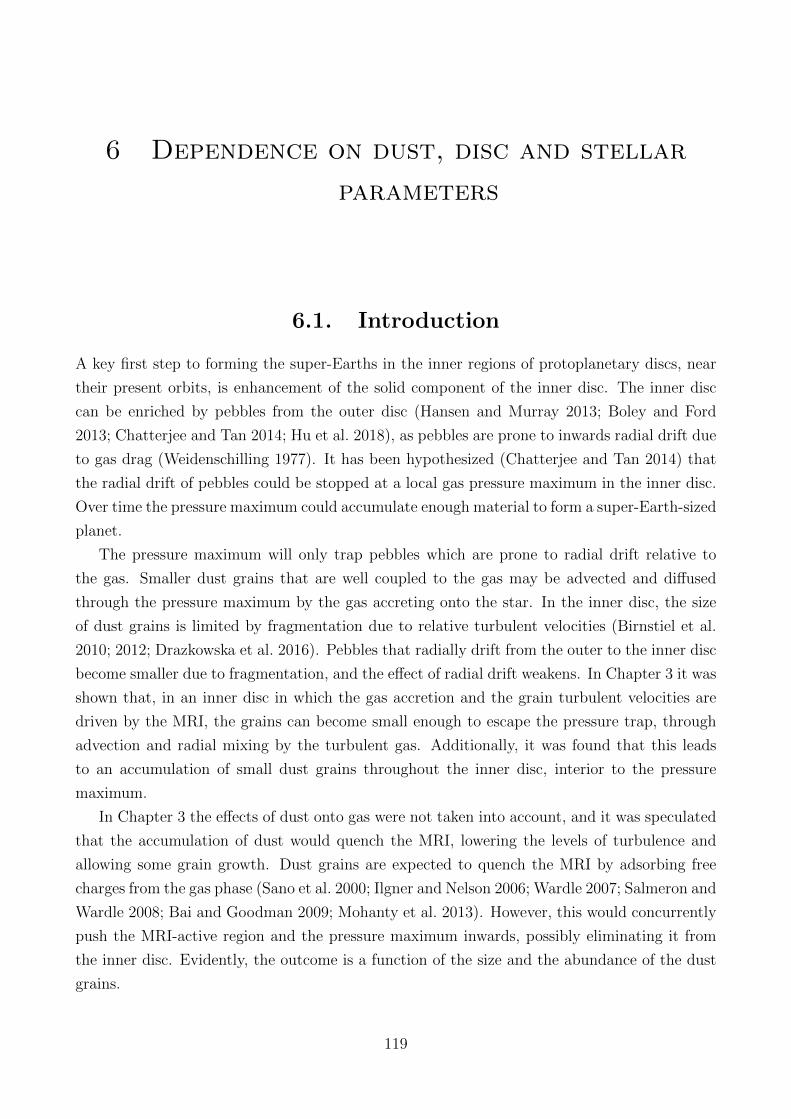
6 Dependence on dust, disc and stellar
parameters
6.1. Introduction
A key first step to forming the super-Earths in the inner regions of protoplanetary discs, near
their present orbits, is enhancement of the solid component of the inner disc. The inner disc
can be enriched by pebbles from the outer disc (Hansen and Murray 2013; Boley and Ford
2013; Chatterjee and Tan 2014; Hu et al. 2018), as pebbles are prone to inwards radial drift due
to gas drag (Weidenschilling 1977). It has been hypothesized (Chatterjee and Tan 2014) that
the radial drift of pebbles could be stopped at a local gas pressure maximum in the inner disc.
Over time the pressure maximum could accumulate enough material to form a super-Earth-sized
planet.
The pressure maximum will only trap pebbles which are prone to radial drift relative to
the gas. Smaller dust grains that are well coupled to the gas may be advected and diffused
through the pressure maximum by the gas accreting onto the star. In the inner disc, the size
of dust grains is limited by fragmentation due to relative turbulent velocities (Birnstiel et al.
2010; 2012; Drazkowska et al. 2016). Pebbles that radially drift from the outer to the inner disc
become smaller due to fragmentation, and the effect of radial drift weakens. In Chapter 3 it was
shown that, in an inner disc in which the gas accretion and the grain turbulent velocities are
driven by the MRI, the grains can become small enough to escape the pressure trap, through
advection and radial mixing by the turbulent gas. Additionally, it was found that this leads
to an accumulation of small dust grains throughout the inner disc, interior to the pressure
maximum.
In Chapter 3 the effects of dust onto gas were not taken into account, and it was speculated
that the accumulation of dust would quench the MRI, lowering the levels of turbulence and
allowing some grain growth. Dust grains are expected to quench the MRI by adsorbing free
charges from the gas phase (Sano et al. 2000; Ilgner and Nelson 2006; Wardle 2007; Salmeron and
Wardle 2008; Bai and Goodman 2009; Mohanty et al. 2013). However, this would concurrently
push the MRI-active region and the pressure maximum inwards, possibly eliminating it from
the inner disc. Evidently, the outcome is a function of the size and the abundance of the dust
grains.
119

CHAPTER 6. DEPENDENCE ON DUST, DISC AND STELLAR PARAMETERS
In Chapter 5 I presented a model of a steady-state viscously accreting disc which includes
both the MRI-driven viscosity and the effects of dust onto gas. This accounts for the adsorp-
tion of free charges onto dust grains, and also for the electron (thermionic) and ion emission
from dust grains into the gas phase. The thermionic and ion emission become important at
temperatures above 1000 K (so at the temperatures present in the inner disc) and act to in-
crease the ionization fraction of the gas (Desch and Turner 2015). It was shown that for 1µm
grains, comprising 1% of the disc mass, these dust effects balance out and result in a pressure
maximum at roughly the same location as predicted from thermal ionization. Additionally,
this model also self-consistently considers the disc opacity due to dust grains, thus taking into
account the effect of dust on the disc thermal structure.
In this chapter I investigate how the inner disc structure changes with dust-to-gas ratio,
dust grain size, and other disc and stellar parameters, in order to narrow down the region of
parameter space where the formation of planetary cores inside the ice line is more likely. I
briefly overview the disc model in Section 6.2 and present the results in Section 6.3. Section
6.4 focuses on the existence and the location of the gas pressure maximum as a function of the
above parameters, exploring the entire parameter space in detail. In Section 6.5 I discuss the
implications of these results for the formation of the super-Earths and Section 6.6 summarizes
the conclusions.
6.2. Methods
The disc model used here is presented in Chapter 5. Here, I only summarize the main points.
It is assumed that the viscously-accreting disc is in steady-state, i.e., that the gas accretion
rate 9M is radially constant, on the basis that the gas accretion rate evolves on a long (Myr)
timescale. The disc structure is calculated self-consistently with disc opacities, ionization state
and the viscosity due to the MRI. The disc is assumed to be in vertical hydrostatic and thermal
equilibrium, heated by viscous dissipation and stellar irradiation, and cooled radiatively and/or
via convection.
I consider disc opacities due to silicate dust grains. The opacities are calculated for a power-
law grain size distribution (Mathis et al. 1977), with a minimum grain size amin 0.1µm and a
maximum grain size amax, using optical constants from Draine (2003, see Chapter 5 for details).
Fig. 6.1 shows the opacities per unit mass of gas for a set of maximum grain sizes amax, assuming
a dust-to-gas ratio fdg 0.01, bulk density of dust grains ρs 3.3 g cm3, and stellar effective
temperature T 4400 K. Additionally, Fig. 6.2 shows the Planck-mean and Rosseland-mean
opacities at a fixed temperature of 500 K, as functions of maximum grain size. The structure
of the disc is considered only beyond the silicate sublimation line, and so the opacities due to
gas molecular and atomic lines are neglected. Additionally, the contribution from the water
ice and carbonaceous grains is neglected, since their sublimation temperatures are much lower
120

CHAPTER 6. DEPENDENCE ON DUST, DISC AND STELLAR PARAMETERS
than the temperatures expected in the hot (¡ 1000 K) MRI-active regions (e.g. Pollack et al.
1994).
Furthermore, the disc ionization state is calculated using a simple chemical network (De-
sch and Turner 2015) that includes thermal (collisional) ionization of potassium; ionization of
molecular hydrogen by stellar X-rays, cosmic rays and radionuclides (producing metal (mag-
nesium) ions by charge transfer); gas-phase recombinations; adsorption onto dust grains and
thermionic and ion emission from dust grains. Only a single dust grain species of size agr 0.1µm is considered in the chemical network, but an effective dust-to-gas ratio feff is chosen to
mimic the full size distribution stated above (see Chapter 5 for details).
Finally, the viscosity due to the MRI, parametrized using the Shakura and Sunyaev (1973)
α parameter, is calculated using a prescription based on the results of magnetohydrodynamic
simulations (see Chapter 5). This accounts for the suppression of the MRI by Ohmic and
ambipolar diffusion. In the MRI-dead zones (where the MRI is suppressed), I assume the gas
can still accrete due to a small constant viscosity parameter αDZ, induced either by the adjacent
MRI-active zone or by purely hydrodynamical instabilities. The dead-zone viscosity parameter
αDZ plays an important role in the results presented here. The viscous α is calculated both as
a function of radius and height, and a vertically-averaged viscosity parameter is defined as
α ³zsurf
0αPdz³zsurf
0Pdz
, (6.1)
where zsurf is the disc height, defined as a height above which the gas pressure falls below some
small constant value.
6.3. Results
As the fiducial model, I consider a disc with a gas accretion rate 9M 108 Md yr1, stellar
mass M 1 Md, stellar radius R 3 Rd, effective stellar temperature T 4400 K1, viscosity
parameter in the MRI-dead zone αDZ 104, dust-to-gas ratio fdg 102, and maximum dust
grain size amax 104 cm. In Chapter 5 I used this fiducial model to discuss the impact of
various physical and chemical processes on the inner disc structure. Here, I explore the effects
of varying these parameters on the inner disc structure. First, Section 6.3.1 details the effects
of varying the dust-to-gas ratio fdg and maximum dust grain size amax. Then, Section 6.3.2
details the effects of varying the gas accretion rate 9M , stellar mass M, and the dead-zone
viscosity αDZ.
1These specific stellar parameters correspond to a solar-mass star at an age of 0.5 Myr in the stellar evolutionmodels of Baraffe et al. (2015). Over the first 5 Myr luminosity of a solar-mass star decreases by a factor of 5in these models, and so the adopted parameters are roughly valid throughout the disc lifetime. Additionally,in Chapter 5 it was shown that the stellar irradiation has a weak effect on the extent of the MRI-active zone,since the inner disc is optically thick, and so this decrease in the luminosity is unimportant.
121

CHAPTER 6. DEPENDENCE ON DUST, DISC AND STELLAR PARAMETERS
10 1
100
101
Plan
ck-m
ean
opac
ity
P [cm
2 /g]
10 1
100
101
Ross
elan
d-m
ean
opac
ity
R [cm
2 /g]
102 103
Temperature [K]
10 1
100
101
Plan
ck-m
ean
opac
ity
* P [c
m2 /g
]
amax = 10 4 cmamax = 10 3 cmamax = 10 2 cmamax = 10 1 cm
Figure 6.1: Planck-mean opacity κP (top), Rosseland-mean opacity κR (middle), and Planck-mean opacity at the stellar effective temperature κP (i.e., the absorption coefficient for thestellar irradiation; bottom), as functions of disc temperature, for different maximum grain sizesamax as indicated in plot legend, assuming a dust-to-gas ratio fdg 0.01 and stellar effectivetemperature T 4400 K. Absorption is dominated by small grains, and so the Planck-meanopacities decrease with increasing maximum grain size. The Rosseland-mean opacity is a non-monotonous function of grain size for amax À 102 cm.
122

CHAPTER 6. DEPENDENCE ON DUST, DISC AND STELLAR PARAMETERS
10 4 10 3 10 2 10 1 100 101 102
amax [cm]
10 1
100
101
Opac
ity [c
m2 g
1 ]
P(T= 500K)R(T= 500K)
Figure 6.2: Planck-mean opacity κP and Rosseland-mean opacity κR at a temperature of500 K, as functions of maximum grain size amax, assuming a dust-to-gas ratio fdg 0.01.The Rosseland-mean opacity peaks around amax 103 cm at this temperature.
6.3.1. Dust-to-gas ratio and dust size
Dust has two effects on the disc structure in this model: it determines opacities in the disc, and
it affects the disc ionization state. To better understand the results of varying dust properties,
I first consider only the dust opacities. That is, in Section 6.3.1.1, I consider a model with a
vastly simplified chemical network, in which the only source of ionization is thermal ionization
of potassium and free charges recombine only in the gas phase. Then, in Section 6.3.1.2 I
present the results of the full model which also accounts for the adsorption of charges onto dust
grains, thermionic and ion emission from dust grains, and ionization of molecular hydrogen by
stellar X-rays, cosmic rays and radionuclides.
6.3.1.1. Thermally-ionized model
In this section I consider a model which includes dust opacities, but does not include dust
effects on the disc chemistry, nor ionization of molecular hydrogen. Ionization levels are set by
thermal ionization of potassium and calculated using the Saha equation. The results of varying
the dust-to-gas ratio fdg in this simplified model are shown in the left column of Fig. 6.3.
The top left panel shows the radial profile of the vertically-averaged viscosity parameter
α, defined in eq. (6.1), for three different values of the dust-to-gas ratio, fdg 104, 102 and
1, for a constant maximum grain size amax 104 cm. In this simplified, thermally-ionized
disc model, the MRI is active only at short radii, around the hot disc midplane. Therefore,
the viscosity is highest in the innermost region where the midplane ionization fraction and the
midplane temperature (shown in the second and third row, respectively) are highest, and it
decreases with distance from the star. At some radius ionization fraction drops below that
needed to sustain the MRI, and the viscosity parameter α falls to the minimum, dead-zone
value αDZ. That determines the location of the local gas pressure maximum, shown in the
bottom panel.
123

CHAPTER 6. DEPENDENCE ON DUST, DISC AND STELLAR PARAMETERS
10 4
10 3
10 2
10 1Ve
rtica
lly-a
vera
ged
visc
ous
amax = 10 4 cmfdg = 10 4
fdg = 10 2
fdg = 1
10 17
10 15
10 13
10 11
10 9
10 7
Mid
plan
e n e
/nH 2
200
400
600
800
1000
1200
1400
1600
Mid
plan
e te
mpe
ratu
re [K
]
10 1 100
Radius [AU]
101
102
103
Mid
plan
e pr
essu
re [d
yn c
m2 ]
10 4
10 3
10 2
10 1
Verti
cally
-ave
rage
d vi
scou
s
fdg = 10 2
amax = 10 4 cmamax = 10 2 cmamax = 1 cm
10 17
10 15
10 13
10 11
10 9
10 7
Mid
plan
e n e
/nH 2
400
600
800
1000
1200
1400
1600
Mid
plan
e te
mpe
ratu
re [K
]
10 1 100
Radius [AU]
102
103
Mid
plan
e pr
essu
re [d
yn c
m2 ]
Figure 6.3: Results for the thermally-ionized disc (where the only source of ionization is thermalionization of potassium, and dust effects on the disc chemistry are not included). The leftcolumn shows models with a constant maximum grain size amax 104 cm and varying dust-to-gas ratio fdg as indicated in plot legend. The right column shows models with a constantdust-to-gas ratio fdg 102 and varying maximum grain size amax as indicated in plot legend.The rows show radial profiles of (from top to bottom) vertically-averaged viscosity parameterα, midplane free electron fraction nenH2 , midplane temperature and midplane pressure. Theinner edge of the fdg 1 model is set to 0.3 AU, since radially inwards temperature increasesabove the sublimation temperature of silicates. The light-coloured lines indicate the regionsaffected by the inner boundary condition (see Chapter 5). See Section 6.3.1.1.
124

CHAPTER 6. DEPENDENCE ON DUST, DISC AND STELLAR PARAMETERS
Fig. 6.3 shows that a higher dust-to-gas ratio results in a larger MRI-active zone (the region
where α ¡ αDZ). This is because the inner disc is optically-thick, so the disc midplane temper-
ature is set by the accretion heat released near midplane and the optical depth of the disc to
its own radiation (with a caveat that the vertical temperature gradient is additionally limited
by convection; see Chapter 5). The disc’s opacity is directly proportional to the dust-to-gas
ratio, and so a disc with more dust is more optically-thick, trapping more heat and making the
disc midplane hotter. This makes the midplane more ionized, leading to a higher MRI-induced
viscosity at a given radius.
Furthermore, the right column of Fig. 6.3 shows models with a constant dust-to-gas ratio
of fdg 102, but varying the maximum dust grain size amax in the range 104 1 cm. The
radial profiles of the viscosity parameter α (the top right panel) show that the MRI-active
region becomes smaller if dust grains are larger, at fixed dust-to-gas ratio. This is because
larger dust grains have lower opacities (see Fig. 6.1), making the inner disc less optically thick.
Same as in a disc with a lower dust-to-gas ratio, this makes the disc midplane cooler and
less ionized. The effect on the disc temperature is clearly seen in the outer regions in which
the MRI is dead and the viscosity parameter is constant, α αDZ (the right-hand side panel
in the third row). Going inwards, the MRI will become active roughly where the midplane
temperature reaches 1000 K, as necessary for the thermal ionization of potassium. Therefore,
in these simplified, thermally-ionized models, dust growth results in the MRI-active zone edge
being pushed inwards. Note that it is the effects of dust opacities alone that lead to these
significant changes in the extent of the MRI-active zone. The effects of including dust grains
in the chemical network are explored next.
6.3.1.2. Full model
In this section, I consider the full model that additionally includes (direct) effects of dust on the
ionization fraction (adsorption of free charges onto dust grains, thermionic and ion emission),
and also ionization of molecular hydrogen. Three sources of ionization are considered for the
latter (stellar X-rays, cosmic rays and radionuclides), the X-rays being the most important
(see Chapter 5). The results of varying the dust-to-gas ratio and maximum dust grain size in
this full model are shown in the left and the right column of Fig. 6.4, respectively. From top
to bottom, the figure shows the radial profiles of the vertically-averaged viscosity parameter,
midplane free electron fraction, midplane temperature and midplane pressure.
As in the simplified, thermally-ionized models discussed above, in the innermost regions
the viscosity parameter decreases with distance from the star. Here, however, the viscosity
parameter reaches a minimum value close to the dead-zone viscosity, and then increases again
radially outwards, due to ionization by stellar X-rays (this is true in all models, even if not
always evident in the plots). Note that in the full model, in the innermost regions the main
sources of ionization are thermionic and ion emission from dust grains, and free charges mostly
125

CHAPTER 6. DEPENDENCE ON DUST, DISC AND STELLAR PARAMETERS
10 4
10 3
10 2
10 1Ve
rtica
lly-a
vera
ged
visc
ous
amax = 10 4 cmfdg = 10 4
fdg = 10 2
fdg = 1
10 17
10 15
10 13
10 11
10 9
10 7
Mid
plan
e n e
/nH 2
200
400
600
800
1000
1200
1400
1600
Mid
plan
e te
mpe
ratu
re [K
]
10 1 100
Radius [AU]
10 1
100
101
102
103
Mid
plan
e pr
essu
re [d
yn c
m2 ]
10 4
10 3
10 2
10 1
Verti
cally
-ave
rage
d vi
scou
s
fdg = 10 2
amax = 10 4 cmamax = 10 2 cmamax = 1 cm
10 17
10 15
10 13
10 11
10 9
10 7
Mid
plan
e n e
/nH 2
400
600
800
1000
1200
1400
1600
Mid
plan
e te
mpe
ratu
re [K
]
10 1 100
Radius [AU]
102
Mid
plan
e pr
essu
re [d
yn c
m2 ]
Figure 6.4: Results for the full model which includes dust effects on disc chemistry and ion-ization of molecular hydrogen. The left column shows models with a constant maximum grainsize amax 104 cm and varying dust-to-gas ratio fdg as indicated in plot legend. The rightcolumn shows models with a constant dust-to-gas ratio fdg 102 and varying maximum grainsize amax as indicated in plot legend. The rows show radial profiles of (from top to bottom)vertically-averaged viscosity parameter α, midplane free electron fraction nenH2 , midplanetemperature and midplane pressure. The light-coloured lines indicate the regions affected bythe inner boundary condition (see Chapter 5). The radius of the pressure maximum is larger fora larger dust-to-gas ratio; it is approximately the same for the maximum grain size of 104 cmand 102 cm, but quite smaller for the maximum grain size of 1 cm. See Section 6.3.1.2.
126

CHAPTER 6. DEPENDENCE ON DUST, DISC AND STELLAR PARAMETERS
recombine by adsorption onto dust grains (see Chapter 5; Desch and Turner 2015). While this
is fundamentally different from the gas-phase thermal ionization, ionization levels as a function
of temperature and density are quantitatively similar. As a result, the viscosity parameter
in these innermost regions (at high temperatures) is similar to the models with no dust. In
Chapter 5 I discussed this for the fiducial maximum grain size amax 104 cm. The results
presented in this work show that this conclusion holds at a wide range of dust-to-gas ratios and
grain sizes (e.g., compare Fig. 6.4 with Fig. 6.3).
An exception to this is the case of high dust-to-gas ratio of fdg 1. In this model, the
midplane free electron fraction decreases substantially already at the distance of 0.4 AU (see
the left-hand panel on the second row in Fig. 6.4). However, the viscous α remains high out
to 2 AU in this model (the top left panel in Fig. 6.4). In this high-α region, the MRI is
indeed active at the disc midplane (as shown in the left-hand panel of Fig. 6.5), despite the
large decrease in the midplane electron number density. What drives the MRI in this case?
The right-hand panel of Fig. 6.5 shows that between 0.4 AU and 2 AU the main ionized
species are the potassium ions and the dust grains. Evidently, the number density of electrons
decreases with increasing dust-to-gas ratio (keeping other parameters fixed), but the opposite
is true for the number density of potassium ions evaporating from dust grains, above 900 K
(see Desch and Turner 2015). In the resulting disc ionization state, due to charge conservation,
the total charge of potassium ions equals the total charge on dust grains. However, since the
dust grains have a much higher inertia than potassium ions, it is the potassium ions that couple
the gas to the magnetic field. Overall, these results show that emission of potassium from dust
grains is sufficient to sustain the MRI out to large radii, at high dust-to-gas ratios. However,
also note that for a dust-to-gas ratio of unity, the dynamical back-reaction of dust on the gas
(which is not considered in this work) would become important.
Furthermore, as noted above, in the full model the viscosity parameter α reaches a minimum
value, outwards from which it increases with radius. The minimum in the viscosity parameter
corresponds to the location of the gas pressure maximum, shown in the bottom panels of
Fig. 6.4. Outwards of the pressure maximum, temperature at the disc midplane is too low
for efficient ionization, and so the MRI is only active in a thin X-ray-ionized layer high above
disc midplane (seen near 2 AU in the left-hand panel of Fig. 6.5). In these outer regions,
the viscosity parameter increases with decreasing dust-to-gas ratio and increasing dust grain
size. This is because the main source of ionization are the stellar X-rays, and dust only acts
as a recombination pathway. For lower dust-to-gas ratios and, equivalently, higher maximum
grain size, the total grain surface area (onto which free charges adsorb) decreases, leading to
higher ionization fraction and higher MRI-driven viscosity (Sano et al. 2000; Ilgner and Nelson
2006). Nevertheless, the contribution from the thin X-ray-ionized layer is low in all cases and
the viscosity parameter α αDZ in this region. In other words, in these outer regions the
gas primarily accretes through the dead zone, and the stellar X-rays do not affect strongly the
location of the pressure maximum.
127

CHAPTER 6. DEPENDENCE ON DUST, DISC AND STELLAR PARAMETERS
5 × 10 1 1 × 100 2 × 100
Radius [AU]
10 4
10 3
10 2
10 1
100He
ight
[AU]
10 4
10 3
10 2
10 1
Loca
l visc
ous
1004 × 10 1 6 × 10 1 2 × 100
Radius [AU]
10 17
10 15
10 13
10 11
10 9
10 7
Mid
plan
e n/n H
2
ne/nH2
nK + /nH2
ni/nH2
ng|Zg|/nH2
Figure 6.5: Local viscosity parameter α as a function of location in the disc (left) and thefractional number densities of various ionized species at the disc midplane as a function ofradius (right), in a model with a dust-to-gas ratio of fdg 1. See Section 6.3.1.2.
Overall, the extent of the high-viscosity inner region and the location of the pressure maxi-
mum seem to be dictated by the dependence of disc opacities on the dust-to-gas ratio and dust
grain size through the effects discussed in the previous section. Note, however, that in the full
model the location of the pressure maximum is approximately the same for amax 104 cm and
amax 102 cm (see the top right panel in Fig. 6.4). This is because a larger grain size results
in a lower effective dust-to-gas ratio in the chemical network. This somewhat decreases the
critical temperature at which the thermionic and ion emission make the gas sufficiently ionized
to start the MRI at disc midplane. In addition, larger grain sizes increase the minimum value
of the viscosity parameter (set by the dead-zone value and the stellar X-rays), which moves
the pressure maximum inwards. Concurrently, a decrease in the disc’s opacity with grain size
is moderate for amax À 102 cm (see Fig. 6.1). The location of the pressure maximum as a
function of dust grain size is considered in more detail in Section 6.4.
6.3.2. Gas accretion rate, stellar mass and dead-zone viscosity
In this section I investigate how the structure of the inner disc changes with varying gas accretion
rate, stellar mass and dead-zone viscosity. Fig. 6.6 shows the results of the fiducial model and
three other models in which these three parameters are varied. The different panels show, from
top to bottom, the vertically-averaged viscosity parameter (α), midplane free electron fraction
(nenH2), midplane temperature and midplane pressure, as functions of radius.
In each panel the dashed line shows a model with a gas accretion rate 9M 109 Md yr1,
lower than in the fiducial model with 9M 108 Md yr1, shown by the solid line. The lower gas
accretion rate results in a smaller high-viscosity inner region, and a gas pressure maximum at
a shorter radius. This is because the gas accretion rate determines the total viscous dissipation
at any given radius. In the optically-thick inner disc, this sets the midplane temperature, the
midplane ionization fraction and the viscosity. From Fig. 6.6, the radius of the gas pressure
128

CHAPTER 6. DEPENDENCE ON DUST, DISC AND STELLAR PARAMETERS
maximum scales with the gas accretion rate approximately as rPmax9 9M12. This is, in fact,
the same scaling previously found in Chapter 2, where heating by stellar irradiation, dust
effects and ionization of molecular hydrogen were neglected. While stellar irradiation and
ionization of molecular hydrogen are indeed unimportant for the model parameters chosen
here, the dust effects are not. However, while the chemistry setting the ionization state of
the disc is qualitatively different in those simple models (thermal ionization of potassium)
and in the models presented here (thermionic and ion emission), in both cases the ionization
fraction increases sharply above roughly the same temperature (1000 K), yielding the same
approximate scaling.
Note also that the ionization of molecular hydrogen (predominantly by the stellar X-rays)
is not entirely negligible. X-rays activate the MRI in a thin layer high above the disc midplane
outwards of the pressure maximum, increasing the viscosity parameter α compared to the dead-
zone value αDZ. The top panel of Fig. 6.6 shows that this X-ray-activated accretion becomes
more important in the case of the lower gas accretion rate, increasing the viscosity parameter
outwards of the pressure maximum by a factor of 2. This is because in these outer regions a
lower gas accretion rate results in lower gas surface densities, increasing the relative contribution
of the accretion through the X-ray-activated layer relative to the accretion through the dead
zone.
Furthermore, the dotted line in Fig. 6.6 shows a model with a dead-zone viscosity αDZ 103
(higher than the fiducial αDZ 104). As in the simple models discussed in Chapter 2, the
exact value of αDZ is unimportant in the innermost, well-ionized region. In the outer regions the
accretion stress is dominated by that in the dead zone, and so αDZ determines the minimum
vertically-averaged viscosity parameter in the disc. Therefore, a larger αDZ results in the
pressure maximum moving radially inwards compared to the fiducial model.
Finally, the dash-dotted line shows a model with a stellar mass of M 0.1 Md. Here I
adopt a stellar radius of R 1 Rd and an effective temperature of T 2925 K 2. Keeping
the other parameters constant, structure of the inner disc surrounding a M 0.1 Md star
is merely shifted radially inwards compared to the fiducial model with M 1 Md. This is
predominantly due to the Keplerian angular velocity being smaller at a given orbital radius
around a less massive star, which reduces the total viscous dissipation at the given radius. The
resulting approximate scaling rPmax9M13 is consistent with the simple models from Chapter 2,
stressing again that (for the chosen 9M , dust parameters etc.) stellar irradiation and ionization
by stellar X-rays are unimportant in setting the location of the pressure maximum.
2These stellar parameters are taken from the stellar evolution models of Baraffe et al. (2015), adopting astellar age of 0.5 Myr. For M 0.1 Md, the stellar luminosity is predicted to decrease only by a factor of 3over the first 5 Myr in these models. It is not expected that this decrease is important, since stellar irradiationplays a minor role in the structure of the inner disc even at the adopted maximum value of the luminosity (seethe discussion in Chapter 5).
129

CHAPTER 6. DEPENDENCE ON DUST, DISC AND STELLAR PARAMETERS
10 4
10 3
10 2
10 1
Verti
cally
-ave
rage
d vi
scou
s
FiducialM= 10 9M yr 1
DZ = 10 3
M * = 0.1M
10 17
10 15
10 13
10 11
10 9
10 7
Mid
plan
e n e
/nH 2
200
400
600
800
1000
1200
1400
1600
Mid
plan
e te
mpe
ratu
re [K
]
10 1 100
Radius [AU]
101
102
Mid
plan
e pr
essu
re [d
yn c
m2 ]
Figure 6.6: Results for the full model which includes dust effects on disc chemistry and ioniza-tion of molecular hydrogen. The different panels show radial profiles of (from top to bottom)vertically-averaged viscosity parameter α, midplane free electron fraction nenH2 , midplanetemperature and midplane pressure. Fiducial model (solid lines) has a gas accretion rate9M 108 Md yr1, stellar mass M 1 Md and dead-zone viscosity αDZ 104. Models with
a lower gas accretion rate (dashed line), a smaller stellar mass (dash-dotted line) or a largerdead-zone viscosity (dotted line) all yield the gas pressure maximum at a smaller radius. Thelight-coloured lines indicate the regions affected by the inner boundary condition (see Chapter5). See Section 6.3.2.
130

CHAPTER 6. DEPENDENCE ON DUST, DISC AND STELLAR PARAMETERS
6.4. Location of the pressure maximum
The above results show that, for a wide range of disc, stellar and dust parameters, the inner disc
features a high-viscosity inner region, a low-viscosity outer region, and a gas pressure maximum
at the transition between the two regions. This gas pressure maximum has been hypothesized
to have a key role in the formation of the super-Earths inside the water ice line (Chatterjee
and Tan 2014). Based on the models discussed so far, increasing dust grain size and dead-zone
viscosity parameter, and decreasing gas accretion rate and stellar mass result in the pressure
maximum moving inwards, towards the star. In this section, I examine in more detail the
dependence of the radius of the pressure maximum (and its existence) on these parameters.
In order to reduce the computational complexity of the problem and to be able to explore the
parameter space in detail, here I neglect heating of the disc by stellar irradiation (but still
consider the ionization of the disc by the stellar X-rays). This has been shown to be a good
approximation if the inner disc is optically thick (see Chapter 5), but also see the discussion at
the end of this section.
Fig. 6.7 shows the radius of the pressure maximum (or pressure bump) as a function of
the maximum dust grain size, for the stellar mass 1 Md (the left-hand panel) and 0.1 Md (the
right-hand panel). In all models shown here, dust-to-gas ratio has the fiducial value of 102.
The solid, dashed and dotted lines correspond to different values of the dead-zone viscosity
parameter (αDZ 105, 104 and 103, respectively). For the different stellar masses different
ranges of the gas accretion rate 9M are explored, as indicated in plot legends next to each panel.
The chosen ranges are motivated by observational studies, which find that for a solar-mass star
typically 9M 108 Md yr1 and for the stellar mass of 0.1 Md, typically 9M 1010 Md yr1
(e.g. Mohanty et al. 2005; Manara et al. 2012; Alcala et al. 2014; 2017; Manara et al. 2017).
There is a significant spread both in the reported mean values in these studies (1 dex for
the stellar mass of 0.1 Md, and somewhat less for a solar-mass star) and within the observed
samples in each study (up to 2 dex). However, the correlation with the stellar mass appears
robust, and so we can adopt the above typical values as mean values and vary the gas accretion
by 1 dex for each stellar mass.
The radius of the pressure maximum as a function of the maximum dust grain size (amax)
shows a similar trend across virtually all values of the stellar mass, accretion rate and dead-
zone viscosity: it weakly increases with increasing amax for small grains, peaks at about amax 102 cm, and steadily decreases for larger dust grains. The factors causing this have already
been briefly discussed in Section 6.3.1. First, recall that a decrease in the disc opacity means
that accretion heat can escape more easily, making the disc midplane colder and pushing the
pressure maximum inwards. For small dust grains, larger dust grain size leads to a moderate
increase in the opacity (here, the relevant opacity is the opacity of the disc to its own radiation in
the optically-thick regions, i.e., the Rosseland-mean opacity, see Fig. 6.1). At the same time, the
increase in dust grain size reduces the critical temperature at which ionization fraction rises due
131

CHAPTER 6. DEPENDENCE ON DUST, DISC AND STELLAR PARAMETERS
10 4 10 3 10 2 10 1 100 101 102
Maximum dust grain size [cm]
10 2
10 1
100
Radi
us o
f pre
ssur
e bu
mp
[AU]
Stellar surface
M * = 1M
M = 10 9 M /yrM = 10 8 M /yrM = 10 7 M /yr
10 4 10 3 10 2 10 1 100 101 102
Maximum dust grain size [cm]
10 3
10 2
10 1
Radi
us o
f pre
ssur
e bu
mp
[AU]
Stellar surface
M * = 0.1M
M = 10 11 M /yrM = 10 10 M /yrM = 10 9 M /yr
Figure 6.7: Radius of the gas pressure bump as a function of maximum dust grain size. Left-hand panel shows the results for a stellar mass M 1 Md, right-hand panel for M 0.1 Md.In all models the dust-to-gas ratio is 102. Solid, dashed and dotted lines show results forthe dead-zone viscosity parameter αDZ 105, 104 and 103, respectively. Blue, green andred lines indicate different gas accretion rates 9M as indicated in plot legends for each panel.Keeping other parameters fixed, the radius of the pressure bump is a non-monotonic functionof the maximum grain size, and peaks at around 102 cm. For M 0.1 Md, there is nopressure maximum for the low accretion rate and αDZ ¡ 105, for the stellar radius adoptedhere (indicated by the orange region). See Section 6.4.
to thermionic and ion emission (as the increase in dust grain size is equivalent to a reduction
in the effective dust-to-gas ratio in the chemical network; see also Desch and Turner 2015),
pushing the pressure maximum outwards. Concurrently, the minimum value of the viscosity
parameter is larger for larger grains, pushing the pressure maximum inwards. When all these
factors are compounded, for small grains, the radius of the pressure maximum increases with
amax. However, if the grains grow beyond amax 102 cm, disc opacities are severely reduced
and the net effect is a decrease in the radius of the pressure maximum. Additionally, note that
the exact value of amax at which the radius of the pressure bump peaks somewhat varies with9M and αDZ; this can be expected, since both determine the gas surface density and thus the
optical depth at disc midplane and the relative importance of the above three effects. It is also
important to note that including heating due to stellar irradiation seems to somewhat modify
this trend, as can be seen from the comparison of the models discussed in the previous section
(specifically, in Fig. 6.4, where for the fiducial disc and stellar parameters, micron-size grains
result in a pressure maximum at a larger radius than 100-micron grains) and Fig. 6.7. The
resulting differences in the radial location of the pressure maximum are, however, small.
For the solar-mass star, within the observationally-motivated range of 9M and a wide range of
αDZ, the pressure maximum is found to exist at rPmax Á 0.04 AU for a wide range of grain sizes.
On the other hand, for M 0.1 Md both the smaller orbital velocity and the observationally-
determined lower gas accretion rates lead to significantly lower rPmax . For the gas accretion rate9M 1011 and αDZ 105 the pressure maximum does not exist if grains grow larger than
few 103 cm. For the same gas accretion rate and higher αDZ, no pressure maximum exists
132

CHAPTER 6. DEPENDENCE ON DUST, DISC AND STELLAR PARAMETERS
at all.
Finally, recall that in the models shown in Fig. 6.7 heating by stellar irradiation has been
neglected. One the one hand, including stellar irradiation could increase the disc midplane tem-
perature by a small amount in these optically-thick solutions, and move the pressure maximum
slightly outwards. This would be a small effect, as can be verified for the sets of parameters
that were also considered in the previous section (e.g., results including stellar irradiation are
shown for the fiducial disc and stellar parameters, and maximum grain sizes up to 1 cm, in
Fig. 6.4). On the other hand, for some parameters, including stellar irradiation could also lead
to additional or modified solutions that are optically thin. Specifically, for lower gas accretion
rates, an equilibrium solution could exist with a low gas surface density if the density was low
enough for the X-rays to ionize the entire disc column and produce a much higher accretion
efficiency. This is especially the case if the dust grains are larger, as this lowers the ion recom-
bination rate and increases the ionization fraction. Since the accretion rate is proportional to
the product of the gas surface density and the viscosity, such a solution also requires the disc
temperature to be high enough to match the required accretion stress. In the viscously-heated
solutions considered in this section such solutions are not found (in the vicinity of the pressure
maximum), since the temperature in a viscously-heated optically-thin disc is low. However, in
an optically thin disc, the temperature would be set by stellar irradiation. If the temperature
due to irradiation is high enough, for some parameters, a disc in steady state would adapt to
this X-ray-ionized solution, and no pressure maximum would exist. Therefore, this issue should
be studied further in the future.
6.5. Discussion
In this work I have investigated how the structure of the inner disc, accreting primarily through
the MRI, changes with various disc, stellar and dust parameters. Of particular interest are the
existence and the location of a local gas pressure maximum and a highly-turbulent region
inwards of it, which could accumulate dust grains radially drifting from the outer disc, possibly
leading to the formation of planetary cores (Chatterjee and Tan 2014; Hu et al. 2018). The
models presented in this work are steady-state models, each with a distribution of dust grains
that is fixed throughout the disc. However, as discussed in the rest of this section, these models
provide us with important insights into how the inner disc could evolve as the dust grains grow,
if and how the dust will accumulate, how this accumulation could feedback on the gas structure,
and the disc parameters that are favourable for the formation of planetary cores.
6.5.1. Dust growth
Dust growth to a few tens of microns increases the extent of the high-viscosity inner region
and the radius of the pressure maximum, as an increase in dust grain size leads to a moderate
133
CHAPTER 6. DEPENDENCE ON DUST, DISC AND STELLAR PARAMETERS
increase in the disc opacity and a decrease in the threshold temperature at which thermionic
and ion emission become efficient. Growth beyond that size has the opposite effect, as it leads
to a significant decrease in the disc opacity, making the disc midplane colder, and thus less
ionized. Therefore, in the inner disc, if dust grows larger than 102 cm sizes, the dead-zone
inner edge expands inwards.
Note that this is the opposite of what happens in the outer regions of protoplanetary discs.
The outer regions are ionized primarily by the stellar X-rays and cosmic rays. These sources
of ionization become more important further away from the star, as the disc column density
decreases and the high-temperature effects become unimportant. These regions are expected
to be optically thin to their own radiation, and the primary source of heat is stellar irradiation.
Therefore, the dust acts primarily to lower the ionization fraction by adsorbing free charges
from the gas. Because of this, in the outer regions the dead zone is expected to shrink as the
dust grains grow (Sano et al. 2000; Ilgner and Nelson 2006).
In the inner disc, dust growth is limited by collisional fragmentation of dust grains due
to relative turbulent velocities (Birnstiel et al. 2010; 2012; Drazkowska et al. 2016). We can
consider the location of the pressure maximum under an assumption that the maximum dust
grain size has reached this limit, with the relative grain velocities induced by the MRI-driven
turbulence. In a turbulent disc, typical collisional relative velocity between dust grains is given
by V 2dd 3V 2
g St (for St 1, Ormel and Cuzzi 2007b), where Vg is the typical turbulent gas
velocity (given by V 2g αc2
s ) and St is the dust particle Stokes number (the ratio between the
particle stopping time and the eddy turnover time, assumed to equal the orbital timescale 1Ω;
i.e., the non-dimensional stopping time). There is a critical velocity ufrag above which a collision
between dust grains results in their fragmentation, rather than sticking/growth. For silicate
grains of similar size, ufrag 1 m s1 (Blum and Munch 1993; Beitz et al. 2011; Schrapler et al.
2012; Bukhari Syed et al. 2017, although note that grains might become more sticky at the
high temperatures present in the inner disc, Demirci et al. (2019)). Since Stokes number St
is directly related to the grain size, and the collision velocity to St, fragmentation imposes an
upper limit on dust growth. At the fragmentation limit (Birnstiel et al. 2009; 2012),
Stfrag u2
frag
3αc2s
. (6.2)
The exact relationship between the Stokes number and the particle size depends on the
relevant drag law (Weidenschilling 1977). Typically, the dust grains in protoplanetary discs are
smaller than the mean free path of gas molecules, and therefore couple to the gas according
to the Epstein drag law. However, due to the high densities in the inner disc, dust grains
may enter the Stokes regime. Importantly, the above approximate expression for the turbulent
relative velocity between dust grains (Vdd) has been derived under an assumption that St does
not depend on the relative velocity between the dust grain and the gas, Vdg. This assumption is
true for grains in the Epstein drag regime. In the Stokes regime, it is true only if the Reynolds
134

CHAPTER 6. DEPENDENCE ON DUST, DISC AND STELLAR PARAMETERS
number Re of the particle is less than unity. Therefore, it is necessary to always check that
this condition is fulfilled for the particles in the Stokes regime, and that we may employ the
above expression for Vdd. The Reynolds number of a particle itself depends on the velocity
Vdg, for which we can adopt another approximate expression, V 2dg V 2
g Stp1 Stq (Cuzzi and
Hogan 2003, note that this expression was derived analytically for St ! 1, but also shown to
be applicable for a wide range of St through a comparison with numerical simulations).
The location of the pressure maximum in a disc in which grain growth is limited by frag-
mentation is calculated as follows. At the location of the pressure maximum for various combi-
nations of stellar mass, accretion rate, dead-zone viscosity parameter and maximum dust grain
size (i.e., for every point in Fig. 6.7), the fragmentation limit for the particle Stokes number,
Stfrag, is calculated (assuming α α), as well as the corresponding grain size, afrag (for an
appropriate drag law). Then, for every combination of the stellar mass, the accretion rate and
the dead-zone viscosity parameter, using linear interpolation, the grain size is found such that
afragpamaxq amax. This yields a corresponding radius of the pressure maximum.
Note that this calculation utilizes models in which the maximum dust grain size is assumed
to be constant everywhere in the disc, and so the obtained solutions also formally correspond
to models in which the maximum dust grain size is radially constant (and equal to the fragmen-
tation limit afrag at the pressure maximum). In a real disc, the fragmentation limit to which
particles can grow would be a function of the turbulence levels and other parameters which
vary as functions of radius. While this calculation does not take this radial variation of dust
size into account, the fragmentation limit at the pressure maximum and the location of the
pressure maximum would remain the same as in the solutions found here. In particular, note
that radially inwards from the pressure maximum, afrag should decrease compared to the value
at the pressure maximum, as the viscosity parameter α increases. As we will find, the solution
for afrag at the pressure maximum is always higher than amax at which the radius of the pressure
maximum peaks (as a function of amax, in Fig. 6.7). That is, at a fixed radius, a decrease in
particle size inwards of the pressure maximum would yield an increase in the viscosity parame-
ter, compared to the value calculated using the fragmentation limit at the pressure maximum.
Accounting for the radial variation in particle size would then make the radial gradient of the
viscosity parameter steeper inwards of the pressure maximum, but it would not change the
location of its minimum, and therefore not the location of the pressure maximum obtained
here.
The results for the radius of the pressure maximum and the grain size are shown in Fig. 6.8,
as functions of the gas accretion rate, for different values of stellar mass and dead-zone viscosity
parameter. The maximum grain size limited by turbulent fragmentation (middle panel) is
sensitive to the dead-zone viscosity (and turbulence) parameter αDZ (results for αDZ 105,
104 and 103 are shown by the solid, dashed and dotted lines, respectively). This is because
the location of the pressure maximum corresponds to the location of the minimum in the
vertically-averaged viscosity (and turbulence) parameter α; since outwards from the pressure
135

CHAPTER 6. DEPENDENCE ON DUST, DISC AND STELLAR PARAMETERS
maximum the disc primarily accretes through the dense MRI-dead region around the midplane,
at the pressure maximum α αDZ.
Remarkably, despite the sensitivity of the grain size to αDZ, the radius of the pressure max-
imum depends very weakly on this parameter. Basically, the fragmentation-limited solution for
the grain size is always larger than the grain size at which the radius of the pressure maximum
peaks as a function of the grain size (see Fig. 6.7). Therefore, in this region of the parameter
space, a larger grain size yields a smaller radius of the pressure bump. Larger (fragmentation-
limited) grain size is obtained for lower values of the dead-zone viscosity parameter, as discussed
above. Concurrently, at a fixed grain size (and other parameters), a lower dead-zone viscosity
parameter yields a larger radius of the pressure bump (see Section 6.3.2). Evidently, com-
pounding these inter-dependencies results in a weakly-varying radius of the pressure bump for
a wide range of values for the dead-zone viscosity parameter.
Furthermore, for the solar-mass star, the pressure maximum is located at radii Á 0.1 AU
in the entire range of the observationally-motivated gas accretion rates considered here. Com-
pounding this with the result that a higher dust-to-gas ratio (resulting from accumulation
of dust, see also the next section) would move the pressure maximum outwards, this places
the potentially planet-forming region within the range of the observed orbital distances of the
super-Earths.
For a lower-mass star, M 0.1 Md, at a fixed gas accretion rate, dust grains may grow
to somewhat larger sizes than for the solar-mass star. Overall, the radius of the pressure
maximum is expected to be smaller, due to the larger grain sizes, but also (mostly) due to the
lower viscous dissipation at a given accretion rate, and the lower observed gas accretion rates
(see the discussions in sections 6.3.2 and 6.4). As the radius of the pressure maximum moves
inwards for lower gas accretion rates, no high-viscosity inner region and no pressure maximum
are found at the low end of the observed accretion rates (i.e., for 9M 1011 Md yr1). This
implies that planet formation around these stars is more likely earlier in the disc lifetime.
6.5.2. Dust accumulation
For dust grains to become trapped within the pressure maximum, the outwards radial drift
velocity of dust grains just inwards of the pressure maximum should be higher than the velocity
with which the accreting gas advects the grains inwards. The ratio of the radial drift and the gas
advection velocities is roughly equal to the ratio of the particle Stokes number and the viscous
α (Jacquet et al. 2012). Therefore, for the particle radial drift to overcome advection with
the gas inwards of the pressure maximum, it is required that Stα ¡ 1. To check whether this
condition is fulfilled, we can consider the ratio between the Stokes number at the fragmentation
limit Stfrag and the viscosity and turbulence parameter α. The results are shown in the bottom
panel of Fig. 6.8.
The ratio Stfragα is most sensitive to the value of the dead-zone viscosity parameter αDZ.
136
CHAPTER 6. DEPENDENCE ON DUST, DISC AND STELLAR PARAMETERS
10 2
10 1
100
Radi
us o
f pre
ssur
e bu
mp
[AU]
M * = 1MM * = 0.1M
DZ = 10 5
DZ = 10 4
DZ = 10 3
10 2
10 1
100
101
Frag
men
tatio
n lim
it [c
m]
10 10 10 9 10 8 10 7
Gas accretion rate [M yr 1]
10 1
100
101
102
103
St /
Figure 6.8: Radius of the pressure bump (top), maximum dust grain size (middle) and ratioof the Stokes number to the viscosity parameter (Stα) at the pressure bump (bottom) asfunctions of the gas accretion rate, for a maximum dust grain size that corresponds to the graingrowth limit due to turbulent fragmentation. Solid, dashed and dotted lines correspond todifferent values of the dead-zone viscosity parameter αDZ as shown in the plot legend. The dustgrain size and Stα are most sensitive to the dead-zone viscosity parameter αDZ. Concurrently,varying αDZ weakly affects the location of the pressure bump. Blue lines show the results for astellar mass M 1 Md, orange lines for M 0.1 Md. There is no solution for M 0.1 Md
at the accretion rate of 9M 1011 Md yr1, which is at the lower end of the observed rates forthis stellar mass. See Sections 6.5.1 and 6.5.2.
137

CHAPTER 6. DEPENDENCE ON DUST, DISC AND STELLAR PARAMETERS
The Stokes number at the fragmentation limit Stfrag is given by eq. (6.2). At a fixed critical
fragmentation velocity ufrag, it is a function only of the viscosity parameter α and the speed
of sound cs (i.e., the temperature) at the pressure maximum. The viscosity parameter α at
this location is determined by the accretion through the dead zone at disc midplane and the
accretion through a thin X-ray ionized layer high above the midplane. The former dominates
due to the density at midplane being much higher, and so α αDZ. Therefore, Stfragα9α2DZ.
Furthermore, the temperature at the pressure maximum is expected to be roughly 1000 K,
as above this temperature thermionic and ion emission from dust grains lead to a sharp increase
in the ionization fraction and the onset of the MRI at the disc midplane. However, the exact
value varies as a function of dust grain properties, gas density at the pressure maximum, as
well as the highly non-linear MRI criteria. The dependence of Stfragα on 9M comes mostly
from the variations in this critical temperature.
Overall, whether the dust grains become trapped in the pressure maximum depends on an
assumed value of αDZ. We may consider how the disc might evolve forward, depending on
this value. First, if the dead-zone viscosity parameter is low, αDZ 105, Stfragα " 1. In
this case, dust grains could readily accumulate at the pressure maximum. This accumulation
might lead to an unstable configuration, as an increase in the dust-to-gas ratio leads to an
increase in α at a given radius (see Fig. 6.4). As the dust-to-gas ratio would increase at the
pressure maximum, and decrease both inwards and outwards, this might lead to an emergence
of an additional minimum in α, and thus to a formation of an additional pressure trap. Time-
dependent simulations are needed to examine further evolution of the disc, and the possibility
of planetesimal formation in this case.
Second, consider a case in which the dead-zone viscosity parameter is closer to the middle of
the plausible range, αDZ 104. For all considered gas accretion rates Stfragα 1. This is the
case considered in Chapter 3, where it was shown that the gas pressure maximum does not trap
large amounts of dust. This is because α increases inwards of the pressure maximum, and Stfrag
decreases. This limits the radial width of the pressure trap, as defined above. Dust advection
with the accreting gas is not sufficient to remove the dust grains from the trap; however,
the grains are also mixed radially by the turbulence. The dust-to-gas ratio at the pressure
maximum is then limited by the corresponding radial diffusion term. Nevertheless, dust would
still accumulate in the entire region interior to the pressure maximum, as in the highly-turbulent
innermost region dust grains become small enough to couple to the gas, reducing the radial
drift relative to the outer disc.
In this chapter, it is also found that a higher dust-to-gas ratio yields a larger extent of the
high-viscosity inner region (see Section 6.3.1.2). This is highly beneficial for planet formation
in the inner disc, as it implies that the accumulation of dust is not only sustainable, but
also leads to a radial expansion of the high-viscosity, high-turbulence region inside of which
the dust accumulates. In particular, this expansion is beneficial for the growth of the small
fragmentation-limited dust grains into larger, more rigid solid bodies, i.e., into planetesimals.
138

CHAPTER 6. DEPENDENCE ON DUST, DISC AND STELLAR PARAMETERS
Specifically, planetesimals may form out of small grains through a combination of the streaming
instabilities (SI) and the gravitational instability (Youdin and Goodman 2005; Johansen and
Youdin 2007; Bai and Stone 2010; Johansen et al. 2012; Simon et al. 2016; 2017; Schafer et al.
2017). Under certain conditions, the SI leads to localized concentrations of dust grains. If
these concentrations are susceptible to gravitational instability, this may lead to the formation
of planetesimals. It was pointed out in Chapter 3 that this process is unlikely in the inner
disc if the pressure (and the density) maximum is located at very short orbital distances, as
too close to the star the tidal effect of the star prevents the gravitational collapse. Therefore,
the shift of the pressure maximum to larger orbital distances due to the accumulation of dust
could potentially help to overcome this barrier and form planetesimals. Note that, for the same
reasons, planetesimal formation near the pressure maximum in the inner disc favours larger gas
accretion rates, and therefore formation at earlier times in the disc lifetime.
Finally, if the dead-zone viscosity parameter is high, αDZ 103, Stfragα ! 1. In this
case, dust grains are so small and well-coupled to the gas that they are advected through the
pressure maximum inwards. Dust may still accumulate interior to the pressure maximum,
as a consequence of fragmentation in the innermost regions, as noted above. However, it is
unlikely that this could lead to the formation of larger solid bodies. While the exact value of
the dead-zone viscosity is unimportant for the location of the pressure maximum (see Fig. 6.8
and Section 6.5.1), in this case the grains would be too small, too well-coupled to the gas to
start the streaming instabilities (Carrera et al. 2015; Yang et al. 2017).
6.6. Conclusions
I have explored how the structure of the MRI-accreting inner regions of protoplanetary discs
changes as a function of the dust-to-gas ratio, dust grain size, and other disc and stellar pa-
rameters. I have especially focused on the location of the gas pressure maximum arising at the
boundary between the highly-viscous innermost region and the low-viscosity outer region. The
existence and the location of the pressure maximum, and the disc structure in its vicinity, are
key to the formation of the super-Earths inside the water ice line.
At fixed dust parameters, the radius of the pressure maximum is directly related to the stellar
mass M and the gas accretion rate 9M . This is because the stellar mass and the accretion rate
determine the total viscous dissipation at a given radius, and thus the temperature and the
ionization fraction at disc midplane. The radius of the pressure maximum is inversely related
to the assumed viscosity parameter in the MRI-dead zone αDZ. The location of the pressure
maximum corresponds to a minimum in the viscosity parameter. Even though in the model
discussed here there is an MRI-active layer at all radii, in the outer regions this is a thin (X-ray
ionized) layer high above the disc midplane, and the disc primarily accretes through the dense
MRI-dead regions around the midplane. Therefore, the minimum viscosity parameter is close
139

CHAPTER 6. DEPENDENCE ON DUST, DISC AND STELLAR PARAMETERS
in value to the dead-zone αDZ.
At fixed stellar and disc parameters, the location of the pressure maximum moves radially
outwards as the dust grains grow to few tens of microns. Grain growth to still larger sizes results
in the pressure maximum moving inwards, towards the star. This behaviour is primarily driven
by the effects of dust opacities on the disc thermal structure.
I calculate the location of the pressure maximum for the case of dust growth being lim-
ited by turbulent fragmentation. For a solar-mass star and gas accretion rates in the range
109 107 Md yr1, this always places the pressure maximum outwards of 0.1 AU. In this
fragmentation-limited regime, the radius of the pressure maximum depends very weakly on the
dead-zone viscosity parameter, and it is most sensitive to the gas accretion rate. For a stellar
mass of 0.1 Md, no pressure maximum exists at the lower end of the observed gas accretion
rates (1011 Md yr1). This suggests that planet formation in the inner disc is more likely early
in the disc lifetime.
The fragmentation-limited dust grain size and its Stokes number are most sensitive to
the value of the viscosity (and turbulence) parameter at the pressure maximum. As noted
above, this roughly equals the assumed value of the viscosity parameter in the MRI-dead zone
(αDZ). Therefore, whether the dust grains can become trapped in the pressure maximum is
determined by this uncertain parameter. Dust trapping is likely for the lower end of plausible
values (αDZ 105) and will not happen for the higher end (αDZ 103).
Importantly, the pressure maximum moves outwards for higher dust-to-gas ratios. This
suggests that accumulation of dust near the pressure maximum and/or inwards of it results in
an expansion of the dust-enriched region. However, time-dependent simulations are needed to
further study the potential outcomes, and the viability of planetesimal formation in the inner
disc.
140

7 Summary and Outlook
In this thesis I have studied the structure of the inner regions of protoplanetary discs, and
whether these regions provide favourable conditions for the formation of the abundant close-in
super-Earths. The key question that I have explored is whether dust can accumulate in the
inner disc, possibly at a local gas pressure maximum that is expected to form if the innermost
regions of the disc are accreting due to the MRI.
7.1. Summary
In Chapter 2 I have discussed a steady-state model of the inner disc in which the gas structure
is governed by viscous accretion, primarily due to the MRI. Here, a simple model of the gas disc
structure is self-consistently coupled to a detailed parametrization of the MRI-driven viscosity.
This parametrization accounts for the suppression of the MRI by Ohmic and ambipolar diffu-
sion. In line with theoretical expectations, the MRI is active in the innermost region due to
thermal ionization of potassium. In the absence of non-thermal sources of ionization, the outer,
colder region is MRI-dead. A local gas pressure maximum forms, as expected, at the transition
between the two regions. It is shown that, for a wide range of disc and stellar parameters, the
pressure maximum indeed occurs at the orbital distances at which the close-in super-Earths
are observed.
Another important result of this study is that the steady-state structure of the inner disc is
viscously unstable. At a given orbital distance the vertically-averaged viscosity increases with
the gas accretion rate so much that, throughout most of the inner disc, the gas surface density
decreases with increasing gas accretion rate. This implies that a small accumulation of gas will
lead to a lower accretion rate, which will lead to a further accumulation of gas. Therefore, this
instability might be important for the evolution of both gas and dust in the inner disc and
deserves further study, as discussed further below.
Next, in Chapter 3, I have investigated the evolution of dust in this steady-state gas disc
model, including dust grain growth, radial drift and fragmentation. In the inner disc the dust
grain size is limited by fragmentation due to relative turbulent velocities (in this case, induced
by the MRI). Grains that radially drift from the outer to the inner disc become smaller due to
fragmentation, and the effects of gas drag weaken. As a result, the pressure maximum is not
an efficient trap for the grains. However, in the innermost, highly-turbulent region, the grains
141

CHAPTER 7. SUMMARY AND OUTLOOK
fragment to such small sizes that they become almost completely coupled to the gas. As this
effectively halts the radial drift, dust accumulates throughout the inner disc, interior to the
pressure maximum.
Using the obtained structure of the dusty disc, I explore if the dust grains can overcome the
fragmentation limit through a combination of streaming instabilities and gravitational collapse.
Previous studies have shown that the combination of these processes is a promising mechanism
to form planetesimals out of dust grains, if certain conditions are met. However, in the inner
disc, these processes appear to be viable in a restricted region of parameter space. There are two
main limitations. First, the streaming instabilities require the dust grains to settle vertically
towards the disc midplane. However, due to their small sizes, grains are efficiently stirred by
the turbulence. Second, even if the criteria to start the streaming instabilities are fulfilled, and
if it is assumed that this leads to localized concentrations of dust, gravitational collapse into
planetesimals is difficult due to the tidal effect of the star. The required critical density of dust
increases steeply radially inwards and presents a major obstacle for planetesimal formation
in the inner disc. Note that, due to the preference for higher densities, the pressure (and
the density) maximum is still the most favourable location, despite the dust being enhanced
everywhere interior to the pressure maximum.
However, even without knowing how exactly solid planet cores form in the inner disc, it is
possible (and fruitful) to study later stages of planet formation. In particular, for the super-
Earths that have an atmosphere, it is known that their masses are dominated their solid cores,
while their radii are largely determined by their atmospheres. This means that, for a given
core mass, one can study formation of the gaseous envelope, and compare the results to the
observations of planet radii. The formation of the envelope depends on the conditions in the
gaseous disc in which the planet is embedded, creating a connection between theoretical disc
models and observations of planet properties. Thus, in Chapter 4, I have studied the size of
the atmospheres that super-Earth-mass cores can accrete, given the densities and temperatures
present in the inner disc, as obtained from the model presented in Chapter 2. Furthermore,
I considered how these atmospheres evolve to their present ages, including the atmospheric
mass-loss due to high-energy stellar flux. I find that the MRI-accreting inner disc structure is
favourable in avoiding runaway gas accretion onto planet cores (for typical super-Earth masses),
while the predicted planetary atmospheres are still at least as large as observed. On the other
hand, the predicted atmospheres are still often larger than the observed ones, suggesting that
additional mass-loss mechanisms may be at work.
The inner disc model discussed in Chapter 2 proved extremely useful in identifying various
benefits and barriers for planet formation at short orbital distances, as discussed in Chapters
3 and 4. However, there are a number of limitations of this model. Most importantly, the
effects of dust grains on the disc ionization state are not accounted for, and the effect of dust
on the disc thermal structure is only considered via a single constant value of the opacity. It
is already pointed out in Chapter 2 that omitting these effects leads to a violation of some of
142

CHAPTER 7. SUMMARY AND OUTLOOK
the underlying assumptions about the criteria for the MRI, and that realistic dust opacities
may deviate from the assumed constant value. Findings presented in Chapter 3 further stress
the importance of considering the effects of dust on the gas structure and on the levels of
turbulence. The model also features other simplifications, such as assuming that the disc is
vertically isothermal, and neglecting heating and ionization of the disc by the stellar flux.
Therefore, in Chapter 5, I build an improved model of the inner disc structure, still coupled
to the same detailed model of MRI-driven accretion. In this improved model, disc thermal
structure is set by viscous heating, heating due to stellar irradiation, radiative and convective
energy transport, and realistic dust opacities. I show that, for the fiducial disc and stellar
parameters (including micron-size grains), stellar irradiation is largely unimportant, due to
the inner disc being optically thick. The vertical temperature profile deviates from vertically
isothermal, even causing the disc to become convectively unstable. Nevertheless, these changes
only weakly affect the radial location of the gas pressure maximum.
Including the effects of dust on the disc ionization state also only weakly affects the location
of the gas pressure maximum. This, on the other hand, is not because the effects of dust are
negligible. On the contrary, thermionic and ion emission from dust grains are the primary
sources of ionization at high temperatures when grains are included. However, similarly to
thermal ionization, there is a threshold temperature at which these processes become efficient,
and this threshold temperature is roughly the same as for thermal ionization of potassium.
Therefore, the MRI-driven viscosity rises at roughly the same radial location in the disc. Ad-
ditionally, in this improved model, ionization of molecular hydrogen by stellar X-rays activates
the MRI at larger radii (where temperatures are too low for the thermal effects). However, in
these outer regions (but still in the vicinity of the pressure maximum), the MRI is active only
in a thin low-density layer high above the disc midplane. Gas accretion is still dominated by
the dense, MRI-dead zone around the disc midplane.
Finally, in Chapter 6, I have used this improved model to investigate how the structure of
the inner disc depends on various disc and stellar parameters. I have found that the dependence
of the radial location of the pressure maximum on stellar mass, gas accretion rate and the dead-
zone viscosity parameter is similar to the scalings identified in the simple model discussed in
Chapter 2. This finding can be attributed to the fact that the basic mechanisms setting the
disc structure remain the same, including there being a critical temperature above which disc
becomes ionized enough to couple to the magnetic field.
Importantly, for fixed values of the above parameters, the inner disc structure changes as
a function of the dust grain size and the dust-to-gas ratio. For maximum dust grain sizes
larger than 100 microns, an increase in grain size results in a decrease in the extent of the
high-viscosity inner region and thus in the radius of the local gas pressure maximum. Still,
if grain growth is limited by turbulent fragmentation, in a disc surrounding a solar-mass star
the gas pressure maximum should exist at few tenths of an AU. For a stellar mass of 0.1 Md,
the allowed region of the parameter space for the existence of the pressure maximum is more
143

CHAPTER 7. SUMMARY AND OUTLOOK
constricted, as no pressure maximum is found for the low end of the observed gas accretion
rates. Overall, these results confirm that the inner disc will feature a high-viscosity region and
a pressure maximum that may accumulate the solids necessary to build super-Earths, except,
perhaps, at later stages of disc evolution around small stars.
However, whether the formation of solid planet cores is likely in the inner disc depends on the
uncertain dead-zone viscosity parameter. Grains are likely to accumulate, either at the pressure
maximum (for lower values of the dead-zone viscosity) or inwards of it (as discussed in Chapter
3). However, for high values of the dead-zone viscosity parameter, turbulent fragmentation
and stirring would inhibit processes necessary to form larger solid bodies. Here, an important
result presented in this thesis is that dust accumulation (i.e., an increase in the dust-to-gas
ratio) acts to increase the MRI-driven viscosity at a given radius (and thus the radial extent of
the high-viscosity inner region). If grains accumulate at the pressure maximum, this behaviour
might lead to non-trivial outcomes, whose further study requires time-dependent simulations,
as discussed below.
7.2. Outlook
Throughout this work it is assumed that the MRI-accreting inner disc is in an equilibrium,
steady state. Concurrently, the obtained results suggest that the disc is likely to evolve out of
this state.
First, in Chapter 2 it was shown that the steady-state MRI-accreting inner disc is unstable
to surface density perturbations. At a fixed radius, the MRI-driven accretion rate decreases
with an increasing surface density (as calculated using the steady-state models). Therefore,
a perturbation in the disc surface density might lead out of the steady-state by creating an
increasing pile-up of mass at certain locations. This so-called viscous instability (Lightman and
Eardley 1974; Pringle 1981) could have important consequences for the inner disc structure
and planet formation. It is likely to produce rings and gaps in the gas structure on the viscous
timescale. Gas rings may further concentrate dust, while also allowing dust growth due to
decreased turbulence levels, creating favourable conditions for planetesimal formation.
Second, joint evolution of gas and dust might not produce a steady state. In particular, it is
unclear how the disc would evolve if dust grains accumulate in the pressure maximum. Higher
dust-to-gas ratio would lead to a local increase of the viscosity. It is unclear whether further
evolution of gas and dust might lead to a modified equilibrium state, or creation of multiple
viscosity minima (and pressure maxima).
Evidently, the inner disc will evolve in time, and the possible outcomes are crucial to de-
termine the degree to which dust grains accumulate in the inner disc, and whether they can
overcome the fragmentation barrier and build solid planet cores. Therefore, further study is
required to understand the time-dependence of the inner disc structure, using simulations that
144

CHAPTER 7. SUMMARY AND OUTLOOK
self-consistently couple the gas and the dust. Such simulations would rely directly on the model
presented in this thesis, which would be used to tabulate the value of the viscosity parameter
as a function of gas surface density, dust grain size, dust-to-gas ratio etc., as an input for the
time-dependent evolution.
This proposed future study should also account for the dynamical effects of dust on the
gas, which have been neglected in this work. If dust grains drift radially through the disc due
to gas drag, there is also a back-reaction on the gas (Nakagawa et al. 1986). This becomes
increasingly important at high dust-to-gas ratios. The drag back-reaction acts to flatten the
radial gas pressure profile, and so it would affect if and how much dust may accumulate in the
pressure maximum (Taki et al. 2016).
These time-dependent semi-analytic models will undoubtedly be useful for future studies of
the early stages of planet formation in the inner disc. However, the semi-analytic parametriza-
tion of gas accretion presented in this thesis should also be examined with magnetohydrody-
namic simulations suited for the conditions in the inner disc, and accounting for both Ohmic
and ambipolar diffusion. For example, the fact that the semi-analytic steady-state solution is
viscously unstable, even in the absence of any dust growth or spatial evolution, deserves more
detailed study. More generally, magnetohydrodynamic simulations are important in order to
check the unverified assumptions of the semi-analytic model, such as the assumption that the
magnetic field always evolves as to maximize the accretion stress in the inner disc. Another
application would be to investigate the effect of convective motions on the evolution of the
MRI, which has been shown to be important in the non-ideal limit (Bodo et al. 2013; Hirose
et al. 2014).
Finally, it must be stressed that the presented picture of the MRI-driven accretion in the
inner disc is incomplete. Out of the three non-ideal MHD effects relevant in protoplanetary
discs, only two have been accounted for. In addition to Ohmic and ambipolar diffusion, Hall
effect may also be important. The Hall effect can drive angular momentum transport in the
dead zone (Lesur et al. 2014), although this is sensitive to the alignment between the vertical
magnetic field and the disc (Simon et al. 2015; Bai 2014). The simple calculation of the Hall
Elsasser number in Chapter 2 shows that a “Hall zone” might also overlap with an MRI-active
region. Although the innermost MRI-active region should still persist when the Hall effect is
included, the Hall effect can significantly affect planet formation in this region simply by pushing
the pressure maximum inwards, and thus increasing the critical density for the gravitational
collapse of grains into planetesimals.
145

Bibliography
Adams, F. C., Lada, C. J., and Shu, F. H. (1987). Spectral Evolution of Young Stellar Objects.ApJ, 312:788.
Agol, E., Steffen, J., Sari, R., and Clarkson, W. (2005). On detecting terrestrial planets withtiming of giant planet transits. MNRAS, 359(2):567–579.
Alcala, J. M., Manara, C. F., Natta, A., Frasca, A., Testi, L., Nisini, B., Stelzer, B., Williams,J. P., Antoniucci, S., Biazzo, K., Covino, E., Esposito, M., Getman, F., and Rigliaco, E.(2017). X-shooter spectroscopy of young stellar objects in Lupus. Accretion properties ofclass II and transitional objects. A&A, 600:A20.
Alcala, J. M., Natta, A., Manara, C. F., Spezzi, L., Stelzer, B., Frasca, A., Biazzo, K., Covino,E., Randich, S., Rigliaco, E., Testi, L., Comeron, F., Cupani, G., and D’Elia, V. (2014). X-shooter spectroscopy of young stellar objects. IV. Accretion in low-mass stars and substellarobjects in Lupus. A&A, 561:A2.
ALMA Partnership, Brogan, C. L., Perez, L. M., Hunter, T. R., Dent, W. R. F., Hales, A. S.,Hills, R. E., Corder, S., Fomalont, E. B., Vlahakis, C., Asaki, Y., Barkats, D., Hirota, A.,Hodge, J. A., Impellizzeri, C. M. V., Kneissl, R., Liuzzo, E., Lucas, R., Marcelino, N., Mat-sushita, S., Nakanishi, K., Phillips, N., Richards, A. M. S., Toledo, I., Aladro, R., Broguiere,D., Cortes, J. R., Cortes, P. C., Espada, D., Galarza, F., Garcia-Appadoo, D., Guzman-Ramirez, L., Humphreys, E. M., Jung, T., Kameno, S., Laing, R. A., Leon, S., Marconi, G.,Mignano, A., Nikolic, B., Nyman, L. A., Radiszcz, M., Remijan, A., Rodon, J. A., Sawada,T., Takahashi, S., Tilanus, R. P. J., Vila Vilaro, B., Watson, L. C., Wiklind, T., Akiyama,E., Chapillon, E., de Gregorio-Monsalvo, I., Di Francesco, J., Gueth, F., Kawamura, A.,Lee, C. F., Nguyen Luong, Q., Mangum, J., Pietu, V., Sanhueza, P., Saigo, K., Takakuwa,S., Ubach, C., van Kempen, T., Wootten, A., Castro-Carrizo, A., Francke, H., Gallardo, J.,Garcia, J., Gonzalez, S., Hill, T., Kaminski, T., Kurono, Y., Liu, H. Y., Lopez, C., Morales,F., Plarre, K., Schieven, G., Testi, L., Videla, L., Villard, E., Andreani, P., Hibbard, J. E.,and Tatematsu, K. (2015). The 2014 ALMA Long Baseline Campaign: First Results fromHigh Angular Resolution Observations toward the HL Tau Region. ApJ, 808(1):L3.
Andrews, S. M., Huang, J., Perez, L. M., Isella, A., Dullemond, C. P., Kurtovic, N. T., Guzman,V. V., Carpenter, J. M., Wilner, D. J., Zhang, S., Zhu, Z., Birnstiel, T., Bai, X.-N., Benisty,M., Hughes, A. M., Oberg, K. I., and Ricci, L. (2018). The Disk Substructures at HighAngular Resolution Project (DSHARP). I. Motivation, Sample, Calibration, and Overview.ApJ, 869(2):L41.
Andrews, S. M. and Williams, J. P. (2005). Circumstellar Dust Disks in Taurus-Auriga: TheSubmillimeter Perspective. ApJ, 631(2):1134–1160.
Andrews, S. M. and Williams, J. P. (2007). A Submillimeter View of Circumstellar Dust Disksin ρ Ophiuchi. ApJ, 671(2):1800–1812.
Andrews, S. M., Wilner, D. J., Hughes, A. M., Qi, C., Rosenfeld, K. A., Oberg, K. I., Birnstiel,T., Espaillat, C., Cieza, L. A., Williams, J. P., Lin, S.-Y., and Ho, P. T. P. (2012). The TWHya Disk at 870 µm: Comparison of CO and Dust Radial Structures. ApJ, 744:162.
146

BIBLIOGRAPHY
Bai, X.-N. (2011a). Magnetorotational-instability-driven Accretion in Protoplanetary Disks.ApJ, 739(1):50.
Bai, X.-N. (2011b). The Role of Tiny Grains on the Accretion Process in Protoplanetary Disks.ApJ, 739(1):51.
Bai, X.-N. (2014). Hall-effect-Controlled Gas Dynamics in Protoplanetary Disks. I. Wind So-lutions at the Inner Disk. ApJ, 791(2):137.
Bai, X.-N. (2017). Global Simulations of the Inner Regions of Protoplanetary Disks withComprehensive Disk Microphysics. ApJ, 845(1):75.
Bai, X.-N. and Goodman, J. (2009). Heat and Dust in Active Layers of Protostellar Disks.ApJ, 701(1):737–755.
Bai, X.-N. and Stone, J. M. (2010). Dynamics of Solids in the Midplane of ProtoplanetaryDisks: Implications for Planetesimal Formation. ApJ, 722(2):1437–1459.
Bai, X.-N. and Stone, J. M. (2011). Effect of Ambipolar Diffusion on the Nonlinear Evolutionof Magnetorotational Instability in Weakly Ionized Disks. ApJ, 736(2):144.
Bai, X.-N. and Stone, J. M. (2013). Local Study of Accretion Disks with a Strong VerticalMagnetic Field: Magnetorotational Instability and Disk Outflow. ApJ, 767(1):30.
Balbus, S. A. (2000). Stability, Instability, and “Backward” Transport in Stratified Fluids.ApJ, 534(1):420–427.
Balbus, S. A. (2011). Magnetohydrodynamics of Protostellar Disks. In Garcia, P. J. V., editor,Physical Processes in Circumstellar Disks around Young Stars, pages 237–282. University ofChicago Press, Chicago, IL.
Balbus, S. A. and Hawley, J. F. (1991). A powerful local shear instability in weakly magnetizeddisks. I - Linear analysis. II - Nonlinear evolution. ApJ, 376:214–233.
Balbus, S. A. and Hawley, J. F. (1998). Instability, turbulence, and enhanced transport inaccretion disks. Reviews of Modern Physics, 70(1):1–53.
Baraffe, I., Chabrier, G., Allard, F., and Hauschildt, P. H. (1998). Evolutionary models for so-lar metallicity low-mass stars: mass-magnitude relationships and color-magnitude diagrams.A&A, 337:403–412.
Baraffe, I., Homeier, D., Allard, F., and Chabrier, G. (2015). New evolutionary models forpre-main sequence and main sequence low-mass stars down to the hydrogen-burning limit.A&A, 577:A42.
Beckwith, S. V. W. and Sargent, A. I. (1991). Particle Emissivity in Circumstellar Disks. ApJ,381:250.
Beckwith, S. V. W., Sargent, A. I., Chini, R. S., and Guesten, R. (1990). A Survey forCircumstellar Disks around Young Stellar Objects. AJ, 99:924.
Beitz, E., Guttler, C., Blum, J., Meisner, T., Teiser, J., and Wurm, G. (2011). Low-velocityCollisions of Centimeter-sized Dust Aggregates. ApJ, 736:34.
Birnstiel, T., Dullemond, C. P., and Brauer, F. (2009). Dust retention in protoplanetary disks.A&A, 503(1):L5–L8.
147

BIBLIOGRAPHY
Birnstiel, T., Dullemond, C. P., and Brauer, F. (2010). Gas- and dust evolution in protoplan-etary disks. A&A, 513:A79.
Birnstiel, T., Klahr, H., and Ercolano, B. (2012). A simple model for the evolution of the dustpopulation in protoplanetary disks. A&A, 539:A148.
Birnstiel, T., Ormel, C. W., and Dullemond, C. P. (2011). Dust size distributions in coagula-tion/fragmentation equilibrium: numerical solutions and analytical fits. A&A, 525:A11.
Blum, J. and Munch, M. (1993). Experimental Investigations on Aggregate-Aggregate Colli-sions in the Early Solar Nebula. Icarus , 106(1):151–167.
Bodo, G., Cattaneo, F., Mignone, A., and Rossi, P. (2013). Fully Convective MagnetorotationalTurbulence in Stratified Shearing Boxes. ApJ, 771(2):L23.
Boley, A. C. and Ford, E. B. (2013). The Formation of Systems with Tightly-packed InnerPlanets (STIPs) via Aerodynamic Drift. arXiv e-prints, page arXiv:1306.0566.
Borucki, W. J., Koch, D., and Kepler Science Team (2010). Kepler Planet Detection Mission:Highlights of the First Results. In AAS/Division for Planetary Sciences Meeting Abstracts#42, AAS/Division for Planetary Sciences Meeting Abstracts, page 47.03.
Borucki, W. J., Koch, D. G., Basri, G., Batalha, N., Brown, T. M., Bryson, S. T., Cald-well, D., Christensen-Dalsgaard, J., Cochran, W. D., DeVore, E., Dunham, E. W., Gautier,Thomas N., I., Geary, J. C., Gilliland, R., Gould, A., Howell, S. B., Jenkins, J. M., Latham,D. W., Lissauer, J. J., Marcy, G. W., Rowe, J., Sasselov, D., Boss, A., Charbonneau, D., Cia-rdi, D., Doyle, L., Dupree, A. K., Ford, E. B., Fortney, J., Holman, M. J., Seager, S., Steffen,J. H., Tarter, J., Welsh, W. F., Allen, C., Buchhave, L. A., Christiansen, J. L., Clarke, B. D.,Das, S., Desert, J.-M., Endl, M., Fabrycky, D., Fressin, F., Haas, M., Horch, E., Howard,A., Isaacson, H., Kjeldsen, H., Kolodziejczak, J., Kulesa, C., Li, J., Lucas, P. W., Machalek,P., McCarthy, D., MacQueen, P., Meibom, S., Miquel, T., Prsa, A., Quinn, S. N., Quintana,E. V., Ragozzine, D., Sherry, W., Shporer, A., Tenenbaum, P., Torres, G., Twicken, J. D.,Van Cleve, J., Walkowicz, L., Witteborn, F. C., and Still, M. (2011). Characteristics ofPlanetary Candidates Observed by Kepler. II. Analysis of the First Four Months of Data.ApJ, 736(1):19.
Bouvier, J., Alencar, S. H. P., Harries, T. J., Johns-Krull, C. M., and Romanova, M. M. (2007).Magnetospheric Accretion in Classical T Tauri Stars. In Reipurth, B., Jewitt, D., and Keil,K., editors, Protostars and Planets V, page 479.
Brandenburg, A., Nordlund, A., Stein, R. F., and Torkelsson, U. (1995). Dynamo-generatedTurbulence and Large-Scale Magnetic Fields in a Keplerian Shear Flow. ApJ, 446:741.
Brauer, F., Dullemond, C. P., and Henning, T. (2008). Coagulation, fragmentation and radialmotion of solid particles in protoplanetary disks. A&A, 480:859–877.
Bukhari Syed, M., Blum, J., Wahlberg Jansson, K., and Johansen, A. (2017). The Role ofPebble Fragmentation in Planetesimal Formation. I. Experimental Study. ApJ, 834:145.
Burke, C. J., Bryson, S. T., Mullally, F., Rowe, J. F., Christiansen, J. L., Thompson, S. E.,Coughlin, J. L., Haas, M. R., Batalha, N. M., Caldwell, D. A., Jenkins, J. M., Still, M.,Barclay, T., Borucki, W. J., Chaplin, W. J., Ciardi, D. R., Clarke, B. D., Cochran, W. D.,Demory, B.-O., Esquerdo, G. A., Gautier, Thomas N., I., Gilliland , R. L., Girouard, F. R.,Havel, M., Henze, C. E., Howell, S. B., Huber, D., Latham, D. W., Li, J., Morehead, R. C.,Morton, T. D., Pepper, J., Quintana, E., Ragozzine, D., Seader, S. E., Shah, Y., Shporer, A.,Tenenbaum, P., Twicken, J. D., and Wolfgang, A. (2014). Planetary Candidates Observedby Kepler IV: Planet Sample from Q1-Q8 (22 Months). ApJS, 210(2):19.
148
BIBLIOGRAPHY
Calvet, N., Magris, G. C., Patino, A., and D’Alessio, P. (1992). Irradiation of Accretion Disksaround Young Objects. II. Continuum Energy Distribution. Rev. Mexicana Astron. Astrofis.,24:27.
Carrera, D., Gorti, U., Johansen, A., and Davies, M. B. (2017). Planetesimal Formation bythe Streaming Instability in a Photoevaporating Disk. ApJ, 839(1):16.
Carrera, D., Johansen, A., and Davies, M. B. (2015). How to form planetesimals from mm-sizedchondrules and chondrule aggregates. A&A, 579:A43.
Cassen, P. (1993). Why Convective Heat Transport in the Solar Nebula was Inefficient. InLunar and Planetary Science Conference, Lunar and Planetary Science Conference, page261.
Chatterjee, S. and Tan, J. C. (2014). Inside-out Planet Formation. ApJ, 780(1):53.
Chatterjee, S. and Tan, J. C. (2015). Vulcan Planets: Inside-out Formation of the InnermostSuper-Earths. ApJ, 798(2):L32.
Chiang, E. and Laughlin, G. (2013). The minimum-mass extrasolar nebula: in situ formationof close-in super-Earths. MNRAS, 431(4):3444–3455.
Chiang, E. I. and Goldreich, P. (1997). Spectral Energy Distributions of T Tauri Stars withPassive Circumstellar Disks. ApJ, 490(1):368–376.
Chiang, E. I., Joung, M. K., Creech-Eakman, M. J., Qi, C., Kessler, J. E., Blake, G. A., andvan Dishoeck, E. F. (2001). Spectral Energy Distributions of Passive T Tauri and HerbigAe Disks: Grain Mineralogy, Parameter Dependences, and Comparison with Infrared SpaceObservatory LWS Observations. ApJ, 547(2):1077–1089.
Cimerman, N. P., Kuiper, R., and Ormel, C. W. (2017). Hydrodynamics of embedded planets’first atmospheres - III. The role of radiation transport for super-Earth planets. MNRAS,471:4662–4676.
Coleman, G. A. L. and Nelson, R. P. (2014). On the formation of planetary systems viaoligarchic growth in thermally evolving viscous discs. MNRAS, 445(1):479–499.
Coleman, G. A. L. and Nelson, R. P. (2016). On the formation of compact planetary systemsvia concurrent core accretion and migration. MNRAS, 457(3):2480–2500.
Cossou, C., Raymond, S. N., Hersant, F., and Pierens, A. (2014). Hot super-Earths and giantplanet cores from different migration histories. A&A, 569:A56.
Cresswell, P. and Nelson, R. P. (2006). On the evolution of multiple protoplanets embedded ina protostellar disc. A&A, 450(2):833–853.
Cuzzi, J. N. and Hogan, R. C. (2003). Blowing in the wind. I. Velocities of chondrule-sizedparticles in a turbulent protoplanetary nebula. Icarus , 164(1):127–138.
D’Alessio, P., Calvet, N., and Hartmann, L. (2001). Accretion Disks around Young Objects.III. Grain Growth. ApJ, 553(1):321–334.
D’Alessio, P., Calvet, N., Hartmann, L., Lizano, S., and Canto, J. (1999). Accretion Disksaround Young Objects. II. Tests of Well-mixed Models with ISM Dust. ApJ, 527(2):893–909.
D’Alessio, P., Canto, J., Calvet, N., and Lizano, S. (1998). Accretion Disks around YoungObjects. I. The Detailed Vertical Structure. ApJ, 500(1):411–427.
149

BIBLIOGRAPHY
Davis, S. W., Stone, J. M., and Pessah, M. E. (2010). Sustained Magnetorotational Turbulencein Local Simulations of Stratified Disks with Zero Net Magnetic Flux. ApJ, 713(1):52–65.
Demirci, T., Krause, C., Teiser, J., and Wurm, G. (2019). Onset of planet formation in thewarm inner disk. Colliding dust aggregates at high temperatures. A&A, 629:A66.
Desch, S. J. and Turner, N. J. (2015). High-temperature Ionization in Protoplanetary Disks.ApJ, 811(2):156.
Draine, B. T. (2003). Scattering by Interstellar Dust Grains. I. Optical and Ultraviolet. ApJ,598(2):1017–1025.
Draine, B. T. and Sutin, B. (1987). Collisional charging of interstellar grains. ApJ, 320:803–817.
Drazkowska, J. and Alibert, Y. (2017). Planetesimal formation starts at the snow line. A&A,608:A92.
Drazkowska, J., Alibert, Y., and Moore, B. (2016). Close-in planetesimal formation by pile-upof drifting pebbles. A&A, 594:A105.
Drazkowska, J., Windmark, F., and Dullemond, C. P. (2013). Planetesimal formation viasweep-up growth at the inner edge of dead zones. A&A, 556:A37.
Dressing, C. D. and Charbonneau, D. (2013). The Occurrence Rate of Small Planets aroundSmall Stars. ApJ, 767(1):95.
Dressing, C. D. and Charbonneau, D. (2015). The Occurrence of Potentially Habitable PlanetsOrbiting M Dwarfs Estimated from the Full Kepler Dataset and an Empirical Measurementof the Detection Sensitivity. ApJ, 807(1):45.
Dressing, C. D., Charbonneau, D., Dumusque, X., Gettel, S., Pepe, F., Collier Cameron,A., Latham, D. W., Molinari, E., Udry, S., Affer, L., Bonomo, A. S., Buchhave, L. A.,Cosentino, R., Figueira, P., Fiorenzano, A. F. M., Harutyunyan, A., Haywood, R. D., John-son, J. A., Lopez-Morales, M., Lovis, C., Malavolta, L., Mayor, M., Micela, G., Motalebi,F., Nascimbeni, V., Phillips, D. F., Piotto, G., Pollacco, D., Queloz, D., Rice, K., Sasselov,D., Segransan, D., Sozzetti, A., Szentgyorgyi, A., and Watson, C. (2015). The Mass ofKepler-93b and The Composition of Terrestrial Planets. ApJ, 800(2):135.
Dubrulle, B., Morfill, G., and Sterzik, M. (1995). The dust subdisk in the protoplanetarynebula. Icarus , 114(2):237–246.
Dullemond, C. P. (2002). The 2-D structure of dusty disks around Herbig Ae/Be stars. I.Models with grey opacities. A&A, 395:853–862.
Dullemond, C. P., Juhasz, A., Pohl, A., Sereshti, F., Shetty, R., Peters, T., Commercon, B.,and Flock, M. (2012). RADMC-3D: A multi-purpose radiative transfer tool. AstrophysicsSource Code Library, page ascl:1202.015.
Dutrey, A., Guilloteau, S., Duvert, G., Prato, L., Simon, M., Schuster, K., and Menard, F.(1996). Dust and gas distribution around T Tauri stars in Taurus-Auriga. I. Interferometric
2.7mm continuum and 13CO J=1-0 observations. A&A, 309:493–504.
Dzyurkevich, N., Flock, M., Turner, N. J., Klahr, H., and Henning, T. (2010). Trapping solidsat the inner edge of the dead zone: 3-D global MHD simulations. A&A, 515:A70.
Ercolano, B. and Glassgold, A. E. (2013). X-ray ionization rates in protoplanetary discs.MNRAS, 436(4):3446–3450.
150

BIBLIOGRAPHY
Fedele, D., van den Ancker, M. E., Henning, T., Jayawardhana, R., and Oliveira, J. M. (2010).Timescale of mass accretion in pre-main-sequence stars. A&A, 510:A72.
Fleming, T. P., Stone, J. M., and Hawley, J. F. (2000). The Effect of Resistivity on the NonlinearStage of the Magnetorotational Instability in Accretion Disks. ApJ, 530(1):464–477.
Flock, M., Fromang, S., Turner, N. J., and Benisty, M. (2017). 3D Radiation Nonideal Magne-tohydrodynamical Simulations of the Inner Rim in Protoplanetary Disks. ApJ, 835(2):230.
Flock, M., Turner, N. J., Mulders, G. D., Hasegawa, Y., Nelson, R. P., and Bitsch, B. (2019).Planet formation and migration near the silicate sublimation front in protoplanetary disks.A&A, 630:A147.
Fortney, J. J., Marley, M. S., and Barnes, J. W. (2007). Planetary Radii across Five Orders ofMagnitude in Mass and Stellar Insolation: Application to Transits. ApJ, 659(2):1661–1672.
Frank, J., King, A., and Raine, D. J. (2002). Accretion Power in Astrophysics: Third Edition.Cambridge University Press, Cambridge, UK.
Fressin, F., Torres, G., Charbonneau, D., Bryson, S. T., Christiansen, J., Dressing, C. D.,Jenkins, J. M., Walkowicz, L. M., and Batalha, N. M. (2013). The False Positive Rate ofKepler and the Occurrence of Planets. ApJ, 766(2):81.
Fromang, S., Latter, H., Lesur, G., and Ogilvie, G. I. (2013). Local outflows from turbulentaccretion disks. A&A, 552:A71.
Fulton, B. J. and Petigura, E. A. (2018). The California Kepler Survey VII. Precise PlanetRadii Leveraging Gaia DR2 Reveal the Stellar Mass Dependence of the Planet Radius Gap.ArXiv e-prints.
Fulton, B. J., Petigura, E. A., Howard, A. W., Isaacson, H., Marcy, G. W., Cargile, P. A.,Hebb, L., Weiss, L. M., Johnson, J. A., Morton, T. D., Sinukoff, E., Crossfield, I. J. M., andHirsch, L. A. (2017). The California-Kepler Survey. III. A Gap in the Radius Distribution ofSmall Planets. AJ, 154(3):109.
Fung, J., Artymowicz, P., and Wu, Y. (2015). The 3D Flow Field Around an Embedded Planet.ApJ, 811:101.
Fung, J. and Lee, E. J. (2018). Inner Super-Earths, Outer Gas Giants: How Pebble Isolationand Migration Feedback Keep Jupiters Cold. ApJ, 859:126.
Gammie, C. F. (1996). Layered Accretion in T Tauri Disks. ApJ, 457:355.
Garaud, P. and Lin, D. N. C. (2007). The Effect of Internal Dissipation and Surface Irradiationon the Structure of Disks and the Location of the Snow Line around Sun-like Stars. ApJ,654(1):606–624.
Garaud, P., Meru, F., Galvagni, M., and Olczak, C. (2013). From Dust to Planetesimals: AnImproved Model for Collisional Growth in Protoplanetary Disks. ApJ, 764(2):146.
Ginzburg, S., Schlichting, H. E., and Sari, R. (2018). Core-powered mass-loss and the radiusdistribution of small exoplanets. MNRAS, 476:759–765.
Glassgold, A. E., Najita, J., and Igea, J. (1997). X-Ray Ionization of Protoplanetary Disks.ApJ, 480(1):344–350.
Goldreich, P. and Tremaine, S. (1979). The excitation of density waves at the Lindblad andcorotation resonances by an external potential. ApJ, 233:857–871.
151

BIBLIOGRAPHY
Goldreich, P. and Tremaine, S. (1980). Disk-satellite interactions. ApJ, 241:425–441.
Grasset, O., Schneider, J., and Sotin, C. (2009). A Study of the Accuracy of Mass-RadiusRelationships for Silicate-Rich and Ice-Rich Planets up to 100 Earth Masses. ApJ, 693(1):722–733.
Gullbring, E., Hartmann, L., Briceno, C., and Calvet, N. (1998). Disk Accretion Rates for TTauri Stars. ApJ, 492(1):323–341.
Haghighipour, N. and Boss, A. P. (2003). On Pressure Gradients and Rapid Migration of Solidsin a Nonuniform Solar Nebula. ApJ, 583(2):996–1003.
Haisch, Karl E., J., Lada, E. A., and Lada, C. J. (2001). Disk Frequencies and Lifetimes inYoung Clusters. ApJ, 553(2):L153–L156.
Hansen, B. M. S. and Murray, N. (2012). Migration Then Assembly: Formation of Neptune-mass Planets inside 1 AU. ApJ, 751(2):158.
Hansen, B. M. S. and Murray, N. (2013). Testing in Situ Assembly with the Kepler PlanetCandidate Sample. ApJ, 775(1):53.
Hartmann, L., Calvet, N., Gullbring, E., and D’Alessio, P. (1998). Accretion and the Evolutionof T Tauri Disks. ApJ, 495(1):385–400.
Hawley, J. F. and Balbus, S. A. (1992). A Powerful Local Shear Instability in Weakly Magne-tized Disks. III. Long-Term Evolution in a Shearing Sheet. ApJ, 400:595.
Hawley, J. F., Gammie, C. F., and Balbus, S. A. (1995). Local Three-dimensional Magnetohy-drodynamic Simulations of Accretion Disks. ApJ, 440:742.
Hawley, J. F., Gammie, C. F., and Balbus, S. A. (1996). Local Three-dimensional Simulationsof an Accretion Disk Hydromagnetic Dynamo. ApJ, 464:690.
Hawley, J. F. and Stone, J. M. (1998). Nonlinear Evolution of the Magnetorotational Instabilityin Ion-Neutral Disks. ApJ, 501(2):758–771.
Hayashi, C. (1981). Structure of the Solar Nebula, Growth and Decay of Magnetic Fields andEffects of Magnetic and Turbulent Viscosities on the Nebula. Progress of Theoretical PhysicsSupplement, 70:35–53.
Held, L. E. and Latter, H. N. (2018). Hydrodynamic convection in accretion discs. MNRAS,480(4):4797–4816.
Hillenbrand, L. A., Strom, S. E., Vrba, F. J., and Keene, J. (1992). Herbig Ae/Be Stars:Intermediate-Mass Stars Surrounded by Massive Circumstellar Accretion Disks. ApJ,397:613.
Hirose, S. (2015). Magnetic turbulence and thermodynamics in the inner region of protoplan-etary discs. MNRAS, 448(4):3105–3120.
Hirose, S., Blaes, O., Krolik, J. H., Coleman, M. S. B., and Sano, T. (2014). Convection CausesEnhanced Magnetic Turbulence in Accretion Disks in Outburst. ApJ, 787(1):1.
Holman, M. J. and Murray, N. W. (2005). The Use of Transit Timing to Detect Terrestrial-MassExtrasolar Planets. Science, 307(5713):1288–1291.
Hsu, D. C., Ford, E. B., Ragozzine, D., and Ashby, K. (2019). Occurrence Rates of PlanetsOrbiting FGK Stars: Combining Kepler DR25, Gaia DR2, and Bayesian Inference. AJ,158(3):109.
152

BIBLIOGRAPHY
Hsu, D. C., Ford, E. B., and Terrien, R. (2020). Occurrence Rates of Planets Orbiting MStars: Applying ABC to Kepler DR25, Gaia DR2, and 2MASS Data. arXiv e-prints, pagearXiv:2002.02573.
Hu, X., Tan, J. C., Zhu, Z., Chatterjee, S., Birnstiel, T., Youdin, A. N., and Mohanty, S. (2018).Inside-out Planet Formation. IV. Pebble Evolution and Planet Formation Timescales. ApJ,857(1):20.
Hu, X., Zhu, Z., Tan, J. C., and Chatterjee, S. (2016). Inside-out Planet Formation. III.Planet-Disk Interaction at the Dead Zone Inner Boundary. ApJ, 816(1):19.
Hubeny, I. (1990). Vertical Structure of Accretion Disks: A Simplified Analytical Model. ApJ,351:632.
Ida, S. and Guillot, T. (2016). Formation of dust-rich planetesimals from sublimated pebblesinside of the snow line. A&A, 596:L3.
Ida, S. and Lin, D. N. C. (2010). Toward a Deterministic Model of Planetary Formation.VI. Dynamical Interaction and Coagulation of Multiple Rocky Embryos and Super-EarthSystems around Solar-type Stars. ApJ, 719(1):810–830.
Igea, J. and Glassgold, A. E. (1999). X-Ray Ionization of the Disks of Young Stellar Objects.ApJ, 518(2):848–858.
Ikoma, M. and Hori, Y. (2012). In Situ Accretion of Hydrogen-rich Atmospheres on Short-period Super-Earths: Implications for the Kepler-11 Planets. ApJ, 753:66.
Ilgner, M. and Nelson, R. P. (2006). On the ionisation fraction in protoplanetary disks. I.Comparing different reaction networks. A&A, 445:205–222.
Inamdar, N. K. and Schlichting, H. E. (2015). The formation of super-Earths and mini-Neptuneswith giant impacts. MNRAS, 448(2):1751–1760.
Inamdar, N. K. and Schlichting, H. E. (2016). Stealing the Gas: Giant Impacts and the LargeDiversity in Exoplanet Densities. ApJ, 817:L13.
Izidoro, A., Bitsch, B., Raymond, S. N., Johansen, A., Morbidelli, A., Lambrechts, M., andJacobson, S. A. (2019). Formation of planetary systems by pebble accretion and migra-tion: Hot super-Earth systems from breaking compact resonant chains. arXiv e-prints, pagearXiv:1902.08772.
Izidoro, A., Ogihara, M., Raymond, S. N., Morbidelli, A., Pierens, A., Bitsch, B., Cossou, C.,and Hersant, F. (2017). Breaking the chains: hot super-Earth systems from migration anddisruption of compact resonant chains. MNRAS, 470(2):1750–1770.
Jackson, A. P., Davis, T. A., and Wheatley, P. J. (2012). The coronal X-ray-age relation andits implications for the evaporation of exoplanets. MNRAS, 422:2024–2043.
Jacquet, E., Gounelle, M., and Fromang, S. (2012). On the aerodynamic redistribution ofchondrite components in protoplanetary disks. Icarus , 220(1):162–173.
Jin, L. (1996). Damping of the Shear Instability in Magnetized Disks by Ohmic Diffusion. ApJ,457:798.
Johansen, A. and Youdin, A. (2007). Protoplanetary Disk Turbulence Driven by the StreamingInstability: Nonlinear Saturation and Particle Concentration. ApJ, 662:627–641.
153

BIBLIOGRAPHY
Johansen, A., Youdin, A., and Mac Low, M.-M. (2009). Particle Clumping and PlanetesimalFormation Depend Strongly on Metallicity. ApJ, 704:L75–L79.
Johansen, A., Youdin, A. N., and Lithwick, Y. (2012). Adding particle collisions to the forma-tion of asteroids and Kuiper belt objects via streaming instabilities. A&A, 537:A125.
Jontof-Hutter, D. (2019). The Compositional Diversity of Low-Mass Exoplanets. Annual Reviewof Earth and Planetary Sciences, 47:141–171.
Jontof-Hutter, D., Ford, E. B., Rowe, J. F., Lissauer, J. J., Fabrycky, D. C., Van Laerhoven,C., Agol, E., Deck, K. M., Holczer, T., and Mazeh, T. (2016). Secure Mass Measurementsfrom Transit Timing: 10 Kepler Exoplanets between 3 and 8 M with Diverse Densities andIncident Fluxes. ApJ, 820:39.
Karkoschka, E. and Tomasko, M. G. (2011). The haze and methane distributions on Neptunefrom HST-STIS spectroscopy. Icarus , 211:780–797.
Keith, S. L. and Wardle, M. (2014). Accretion in giant planet circumplanetary discs. MNRAS,440(1):89–105.
Kley, W. and Nelson, R. P. (2012). Planet-Disk Interaction and Orbital Evolution. ARA&A,50:211–249.
Kothe, S., Guttler, C., and Blum, J. (2010). The Physics of Protoplanetesimal Dust Agglom-erates. V. Multiple Impacts of Dusty Agglomerates at Velocities Above the FragmentationThreshold. ApJ, 725:1242–1251.
Kretke, K. A. and Lin, D. N. C. (2007). Grain Retention and Formation of Planetesimals nearthe Snow Line in MRI-driven Turbulent Protoplanetary Disks. ApJ, 664(1):L55–L58.
Kretke, K. A. and Lin, D. N. C. (2010). Structure of Magnetorotational Instability ActiveProtoplanetary Disks. ApJ, 721(2):1585–1592.
Kretke, K. A., Lin, D. N. C., Garaud, P., and Turner, N. J. (2009). Assembling the BuildingBlocks of Giant Planets Around Intermediate-Mass Stars. ApJ, 690(1):407–415.
Lee, E. J. and Chiang, E. (2015). To Cool is to Accrete: Analytic Scalings for Nebular Accretionof Planetary Atmospheres. ApJ, 811:41.
Lee, E. J. and Chiang, E. (2016). Breeding Super-Earths and Birthing Super-puffs in Transi-tional Disks. ApJ, 817:90.
Lee, E. J., Chiang, E., and Ferguson, J. W. (2017). Optically Thin Core Accretion: HowPlanets Get Their Gas in Nearly Gas-Free Disks. ArXiv e-prints.
Lee, E. J., Chiang, E., and Ormel, C. W. (2014). Make Super-Earths, Not Jupiters: AccretingNebular Gas onto Solid Cores at 0.1 AU and Beyond. ApJ, 797:95.
Lesur, G., Ferreira, J., and Ogilvie, G. I. (2013). The magnetorotational instability as a jetlaunching mechanism. A&A, 550:A61.
Lesur, G., Kunz, M. W., and Fromang, S. (2014). Thanatology in protoplanetary discs. Thecombined influence of Ohmic, Hall, and ambipolar diffusion on dead zones. A&A, 566:A56.
Lesur, G. and Papaloizou, J. C. B. (2010). The subcritical baroclinic instability in local accretiondisc models. A&A, 513:A60.
154

BIBLIOGRAPHY
Levermore, C. D. and Pomraning, G. C. (1981). A flux-limited diffusion theory. ApJ, 248:321–334.
Lightman, A. P. and Eardley, D. M. (1974). Black Holes in Binary Systems: Instability of DiskAccretion. ApJ, 187:L1.
Lin, D. N. C. and Papaloizou, J. (1980). On the structure and evolution of the primordial solarnebula. MNRAS, 191:37–48.
Liu, B., Zhang, X., Lin, D. N. C., and Aarseth, S. J. (2015). Migration and Growth of Proto-planetary Embryos. II. Emergence of Proto-Gas-Giant Cores versus Super Earth Progenitors.ApJ, 798(1):62.
Lodders, K. (2003). Solar System Abundances and Condensation Temperatures of the Elements.ApJ, 591(2):1220–1247.
Long, F., Herczeg, G. J., Harsono, D., Pinilla, P., Tazzari, M., Manara, C. F., Pascucci, I.,Cabrit, S., Nisini, B., Johnstone, D., Edwards, S., Salyk, C., Menard, F., Lodato, G., Boehler,Y., Mace, G. N., Liu, Y., Mulders, G. D., Hendler, N., Ragusa, E., Fischer, W. J., Banzatti,A., Rigliaco, E., van de Plas, G., Dipierro, G., Gully-Santiago, M., and Lopez-Valdivia, R.(2019). Compact Disks in a High-resolution ALMA Survey of Dust Structures in the TaurusMolecular Cloud. ApJ, 882(1):49.
Lopez, E. D. and Fortney, J. J. (2013). The Role of Core Mass in Controlling Evaporation:The Kepler Radius Distribution and the Kepler-36 Density Dichotomy. ApJ, 776:2.
Lopez, E. D. and Fortney, J. J. (2014). Understanding the Mass-Radius Relation for Sub-neptunes: Radius as a Proxy for Composition. ApJ, 792:1.
Lundkvist, M. S., Kjeldsen, H., Albrecht, S., Davies, G. R., Basu, S., Huber, D., Justesen, A. B.,Karoff, C., Silva Aguirre, V., van Eylen, V., Vang, C., Arentoft, T., Barclay, T., Bedding,T. R., Campante, T. L., Chaplin, W. J., Christensen-Dalsgaard, J., Elsworth, Y. P., Gilliland,R. L., Handberg, R., Hekker, S., Kawaler, S. D., Lund, M. N., Metcalfe, T. S., Miglio, A.,Rowe, J. F., Stello, D., Tingley, B., and White, T. R. (2016). Hot super-Earths stripped bytheir host stars. Nature Communications, 7:11201.
Lynden-Bell, D. and Pringle, J. E. (1974). The evolution of viscous discs and the origin of thenebular variables. MNRAS, 168:603–637.
Lyra, W. and Umurhan, O. M. (2019). The Initial Conditions for Planet Formation: Tur-bulence Driven by Hydrodynamical Instabilities in Disks around Young Stars. PASP,131(1001):072001.
Malygin, M. G., Kuiper, R., Klahr, H., Dullemond, C. P., and Henning, T. (2014). Meangas opacity for circumstellar environments and equilibrium temperature degeneracy. A&A,568:A91.
Mamajek, E. E. (2009). Initial Conditions of Planet Formation: Lifetimes of Primordial Disks.In Usuda, T., Tamura, M., and Ishii, M., editors, American Institute of Physics ConferenceSeries, volume 1158, pages 3–10.
Manara, C. F., Robberto, M., Da Rio, N., Lodato, G., Hillenbrand, L. A., Stassun, K. G., andSoderblom, D. R. (2012). Hubble Space Telescope Measures of Mass Accretion Rates in theOrion Nebula Cluster. ApJ, 755:154.
155

BIBLIOGRAPHY
Manara, C. F., Rosotti, G., Testi, L., Natta, A., Alcala, J. M., Williams, J. P., Ansdell, M.,Miotello, A., van der Marel, N., Tazzari, M., Carpenter, J., Guidi, G., Mathews, G. S.,Oliveira, I., Prusti, T., and van Dishoeck, E. F. (2016). Evidence for a correlation betweenmass accretion rates onto young stars and the mass of their protoplanetary disks. A&A,591:L3.
Manara, C. F., Testi, L., Herczeg, G. J., Pascucci, I., Alcala, J. M., Natta, A., Antoniucci, S.,Fedele, D., Mulders, G. D., Henning, T., Mohanty, S., Prusti, T., and Rigliaco, E. (2017).X-shooter study of accretion in Chamaeleon I. II. A steeper increase of accretion with stellarmass for very low-mass stars? A&A, 604:A127.
Marcy, G. W., Isaacson, H., Howard, A. W., Rowe, J. F., Jenkins, J. M., Bryson, S. T.,Latham, D. W., Howell, S. B., Gautier, Thomas N., I., Batalha, N. M., Rogers, L., Ciardi, D.,Fischer, D. A., Gilliland, R. L., Kjeldsen, H., Christensen-Dalsgaard, J., Huber, D., Chaplin,W. J., Basu, S., Buchhave, L. A., Quinn, S. N., Borucki, W. J., Koch, D. G., Hunter, R.,Caldwell, D. A., Van Cleve, J., Kolbl, R., Weiss, L. M., Petigura, E., Seager, S., Morton, T.,Johnson, J. A., Ballard, S., Burke, C., Cochran, W. D., Endl, M., MacQueen, P., Everett,M. E., Lissauer, J. J., Ford, E. B., Torres, G., Fressin, F., Brown, T. M., Steffen, J. H.,Charbonneau, D., Basri, G. S., Sasselov, D. D., Winn, J., Sanchis-Ojeda, R., Christiansen,J., Adams, E., Henze, C., Dupree, A., Fabrycky, D. C., Fortney, J. J., Tarter, J., Holman,M. J., Tenenbaum, P., Shporer, A., Lucas, P. W., Welsh, W. F., Orosz, J. A., Bedding, T. R.,Campante, T. L., Davies, G. R., Elsworth, Y., Handberg, R., Hekker, S., Karoff, C., Kawaler,S. D., Lund, M. N., Lundkvist, M., Metcalfe, T. S., Miglio, A., Silva Aguirre, V., Stello, D.,White, T. R., Boss, A., Devore, E., Gould, A., Prsa, A., Agol, E., Barclay, T., Coughlin,J., Brugamyer, E., Mullally, F., Quintana, E. V., Still, M., Thompson, S. E., Morrison, D.,Twicken, J. D., Desert, J.-M., Carter, J., Crepp, J. R., Hebrard, G., Santerne, A., Moutou,C., Sobeck, C., Hudgins, D., Haas, M. R., Robertson, P., Lillo-Box, J., and Barrado, D.(2014). Masses, Radii, and Orbits of Small Kepler Planets: The Transition from Gaseous toRocky Planets. ApJS, 210(2):20.
Masset, F. S., Morbidelli, A., Crida, A., and Ferreira, J. (2006). Disk Surface Density Transi-tions as Protoplanet Traps. ApJ, 642(1):478–487.
Mathis, J. S., Rumpl, W., and Nordsieck, K. H. (1977). The size distribution of interstellargrains. ApJ, 217:425–433.
Mayor, M., Marmier, M., Lovis, C., Udry, S., Segransan, D., Pepe, F., Benz, W., Bertaux,J. L., Bouchy, F., Dumusque, X., Lo Curto, G., Mordasini, C., Queloz, D., and Santos,N. C. (2011). The HARPS search for southern extra-solar planets XXXIV. Occurrence, massdistribution and orbital properties of super-Earths and Neptune-mass planets. arXiv e-prints,page arXiv:1109.2497.
McNally, C. P., Nelson, R. P., and Paardekooper, S.-J. (2019). Multiplanet systems in invisciddiscs can avoid forming resonant chains. MNRAS, 489(1):L17–L21.
McNeil, D. S. and Nelson, R. P. (2010). On the formation of hot Neptunes and super-Earths.MNRAS, 401(3):1691–1708.
Meru, F., Geretshauser, R. J., Schafer, C., Speith, R., and Kley, W. (2013). Growth andfragmentation of centimetre-sized dust aggregates: the dependence on aggregate size andporosity. MNRAS, 435:2371–2390.
Mizuno, H. (1980). Formation of the Giant Planets. Progress of Theoretical Physics, 64:544–557.
Mohanty, S., Ercolano, B., and Turner, N. J. (2013). Dead, Undead, and Zombie Zones inProtostellar Disks as a Function of Stellar Mass. ApJ, 764:65.
156

BIBLIOGRAPHY
Mohanty, S., Jayawardhana, R., and Basri, G. (2005). The T Tauri Phase Down to NearlyPlanetary Masses: Echelle Spectra of 82 Very Low Mass Stars and Brown Dwarfs. ApJ,626(1):498–522.
Moll, R. (2012). Shearing box simulations of accretion disk winds. A&A, 548:A76.
Morbidelli, A., Chambers, J., Lunine, J. I., Petit, J. M., Robert, F., Valsecchi, G. B., and Cyr,K. E. (2000). Source regions and time scales for the delivery of water to Earth. Meteoriticsand Planetary Science, 35(6):1309–1320.
Morbidelli, A., Lambrechts, M., Jacobson, S., and Bitsch, B. (2015). The great dichotomy of theSolar System: Small terrestrial embryos and massive giant planet cores. Icarus , 258:418–429.
Mulders, G. D., Pascucci, I., Apai, D., and Ciesla, F. J. (2018). The Exoplanet PopulationObservation Simulator. I. The Inner Edges of Planetary Systems. AJ, 156(1):24.
Muzerolle, J., Calvet, N., and Hartmann, L. (1998). Magnetospheric Accretion Models for theHydrogen Emission Lines of T Tauri Stars. ApJ, 492(2):743–753.
Muzerolle, J., Calvet, N., and Hartmann, L. (2001). Emission-Line Diagnostics of T TauriMagnetospheric Accretion. II. Improved Model Tests and Insights into Accretion Physics.ApJ, 550(2):944–961.
Nakagawa, Y., Sekiya, M., and Hayashi, C. (1986). Settling and growth of dust particles in alaminar phase of a low-mass solar nebula. Icarus , 67:375–390.
Natta, A., Prusti, T., Neri, R., Wooden, D., Grinin, V. P., and Mannings, V. (2001). Areconsideration of disk properties in Herbig Ae stars. A&A, 371:186–197.
Nelson, R. P. (2018). Planetary Migration in Protoplanetary Disks. In Handbook of Exoplanets,page 139. Springer International Publishing AG, part of Springer Nature.
Nelson, R. P., Gressel, O., and Umurhan, O. M. (2013). Linear and non-linear evolution of thevertical shear instability in accretion discs. MNRAS, 435(3):2610–2632.
Oberg, K. I., Murray-Clay, R., and Bergin, E. A. (2011). The Effects of Snowlines on C/O inPlanetary Atmospheres. ApJ, 743:L16.
O’dell, C. R. and Wen, Z. (1994). Postrefurbishment Mission Hubble Space Telescope Imagesof the Core of the Orion Nebula: Proplyds, Herbig-Haro Objects, and Measurements of aCircumstellar Disk. ApJ, 436:194.
Ogihara, M. and Ida, S. (2009). N-Body Simulations of Planetary Accretion Around M DwarfStars. ApJ, 699(1):824–838.
Ormel, C. W. and Cuzzi, J. N. (2007a). Closed-form expressions for particle relative velocitiesinduced by turbulence. A&A, 466:413–420.
Ormel, C. W. and Cuzzi, J. N. (2007b). Closed-form expressions for particle relative velocitiesinduced by turbulence. A&A, 466(2):413–420.
Ormel, C. W., Shi, J.-M., and Kuiper, R. (2015). Hydrodynamics of embedded planets’ firstatmospheres - II. A rapid recycling of atmospheric gas. MNRAS, 447:3512–3525.
Owen, J. E. (2014). Accreting Planets as Dust Dams in “Transition” Disks. ApJ, 789:59.
Owen, J. E. and Wu, Y. (2013). Kepler Planets: A Tale of Evaporation. ApJ, 775(2):105.
157

BIBLIOGRAPHY
Owen, J. E. and Wu, Y. (2016). Atmospheres of Low-mass Planets: The “Boil-off”. ApJ,817:107.
Owen, J. E. and Wu, Y. (2017). The Evaporation Valley in the Kepler Planets. ApJ, 847(1):29.
Paardekooper, S. J. and Mellema, G. (2006). Halting type I planet migration in non-isothermaldisks. A&A, 459(1):L17–L20.
Panic, O., Hogerheijde, M. R., Wilner, D., and Qi, C. (2009). A break in the gas and dustsurface density of the disc around the T Tauri star IM Lupi. A&A, 501:269–278.
Papaloizou, J. C. B. and Terquem, C. (1999). Critical Protoplanetary Core Masses in Proto-planetary Disks and the Formation of Short-Period Giant Planets. ApJ, 521(2):823–838.
Pfeil, T. and Klahr, H. (2019). Mapping the Conditions for Hydrodynamic Instability onSteady-State Accretion Models of Protoplanetary Disks. ApJ, 871(2):150.
Pinilla, P., Birnstiel, T., Ricci, L., Dullemond, C. P., Uribe, A. L., Testi, L., and Natta, A.(2012). Trapping dust particles in the outer regions of protoplanetary disks. A&A, 538:A114.
Pollack, J. B., Hollenbach, D., Beckwith, S., Simonelli, D. P., Roush, T., and Fong, W. (1994).Composition and Radiative Properties of Grains in Molecular Clouds and Accretion Disks.ApJ, 421:615.
Poon, S. T. S., Nelson, R. P., Jacobson, S. A., and Morbidelli, A. (2020). Formation of compactsystems of super-Earths via dynamical instabilities and giant impacts. MNRAS, 491(4):5595–5620.
Press, W. H., Teukolsky, S. A., Vetterling, W. T., and Flannery, B. P. (2002). Numerical Recipesin C++ : The Art of Scientific Computing. Cambridge University Press, Cambridge, UK.
Pringle, J. E. (1981). Accretion discs in astrophysics. ARA&A, 19:137–162.
Rafikov, R. R. (2006). Atmospheres of Protoplanetary Cores: Critical Mass for NucleatedInstability. ApJ, 648:666–682.
Rafikov, R. R. (2007). Convective Cooling and Fragmentation of Gravitationally UnstableDisks. ApJ, 662(1):642–650.
Raymond, S. N., Barnes, R., and Mandell, A. M. (2008). Observable consequences of planetformation models in systems with close-in terrestrial planets. MNRAS, 384(2):663–674.
Rogers, L. A. (2015). Most 1.6 Earth-radius Planets are Not Rocky. ApJ, 801(1):41.
Rogers, L. A., Bodenheimer, P., Lissauer, J. J., and Seager, S. (2011). Formation and Structureof Low-density exo-Neptunes. ApJ, 738:59.
Rosenfeld, K. A., Andrews, S. M., Wilner, D. J., Kastner, J. H., and McClure, M. K. (2013).The Structure of the Evolved Circumbinary Disk around V4046 Sgr. ApJ, 775:136.
Rouse, C. A. (1961). Ionization Equilibrium Equation of State. ApJ, 134:435.
Ruediger, G., Elstner, D., and Tschaepe, R. (1988). Vertical structure of thin Keplerian disks.I - The role of the turbulent Prandtl number. Acta Astron., 38(4):299–314.
Salmeron, R. and Wardle, M. (2008). Magnetorotational instability in protoplanetary discs:the effect of dust grains. MNRAS, 388:1223–1238.
158

BIBLIOGRAPHY
Sano, T., Inutsuka, S.-i., Turner, N. J., and Stone, J. M. (2004). Angular Momentum Transportby Magnetohydrodynamic Turbulence in Accretion Disks: Gas Pressure Dependence of theSaturation Level of the Magnetorotational Instability. ApJ, 605(1):321–339.
Sano, T., Miyama, S. M., Umebayashi, T., and Nakano, T. (2000). Magnetorotational Insta-bility in Protoplanetary Disks. II. Ionization State and Unstable Regions. ApJ, 543:486–501.
Sano, T. and Stone, J. M. (2002). The Effect of the Hall Term on the Nonlinear Evolutionof the Magnetorotational Instability. II. Saturation Level and Critical Magnetic ReynoldsNumber. ApJ, 577(1):534–553.
Santerne, A., Moutou, C., Tsantaki, M., Bouchy, F., Hebrard, G., Adibekyan, V., Almenara,J. M., Amard, L., Barros, S. C. C., Boisse, I., Bonomo, A. S., Bruno, G., Courcol, B., Deleuil,M., Demangeon, O., Dıaz, R. F., Guillot, T., Havel, M., Montagnier, G., Rajpurohit, A. S.,Rey, J., and Santos, N. C. (2016). SOPHIE velocimetry of Kepler transit candidates. XVII.The physical properties of giant exoplanets within 400 days of period. A&A, 587:A64.
Sargent, A. I. and Beckwith, S. (1987). Kinematics of the Circumstellar Gas of HL Tauri andR Monocerotis. ApJ, 323:294.
Schafer, U., Yang, C.-C., and Johansen, A. (2017). Initial mass function of planetesimals formedby the streaming instability. A&A, 597:A69.
Schlichting, H. E. (2014). Formation of Close in Super-Earths and Mini-Neptunes: RequiredDisk Masses and their Implications. ApJ, 795(1):L15.
Schoonenberg, D., Liu, B., Ormel, C. W., and Dorn, C. (2019). Pebble-driven planet formationfor TRAPPIST-1 and other compact systems. A&A, 627:A149.
Schoonenberg, D. and Ormel, C. W. (2017). Planetesimal formation near the snowline: in orout? A&A, 602:A21.
Schoonenberg, D., Ormel, C. W., and Krijt, S. (2018). A Lagrangian model for dust evolutionin protoplanetary disks: formation of wet and dry planetesimals at different stellar masses.A&A, 620:A134.
Schrapler, R. and Blum, J. (2011). The Physics of Protoplanetesimal Dust Agglomerates. VI.Erosion of Large Aggregates as a Source of Micrometer-sized Particles. ApJ, 734:108.
Schrapler, R., Blum, J., Seizinger, A., and Kley, W. (2012). The Physics of ProtoplanetesimalDust Agglomerates. VII. The Low- velocity Collision Behavior of Large Dust Agglomerates.ApJ, 758:35.
Shakura, N. I. and Sunyaev, R. A. (1973). Reprint of 1973A&A....24..337S. Black holes inbinary systems. Observational appearance. A&A, 500:33–51.
Shi, J., Krolik, J. H., and Hirose, S. (2010). What is the Numerically Converged Amplitude ofMagnetohydrodynamics Turbulence in Stratified Shearing Boxes? ApJ, 708(2):1716–1727.
Shu, F. H. (1992). The Physics of Astrophysics. Volume II: Gas Dynamics. University ScienceBooks, Mill Valley, CA.
Simon, J. B., Armitage, P. J., Li, R., and Youdin, A. N. (2016). The Mass and Size Distributionof Planetesimals Formed by the Streaming Instability. I. The Role of Self-gravity. ApJ,822(1):55.
Simon, J. B., Armitage, P. J., Youdin, A. N., and Li, R. (2017). Evidence for Universality inthe Initial Planetesimal Mass Function. ApJ, 847(2):L12.
159
BIBLIOGRAPHY
Simon, J. B., Hawley, J. F., and Beckwith, K. (2009). Simulations of MagnetorotationalTurbulence with a Higher-Order Godunov Scheme. ApJ, 690(1):974–997.
Simon, J. B., Lesur, G., Kunz, M. W., and Armitage, P. J. (2015). Magnetically driven accretionin protoplanetary discs. MNRAS, 454(1):1117–1131.
Simon, M., Dutrey, A., and Guilloteau, S. (2000). Dynamical Masses of T Tauri Stars andCalibration of Pre-Main-Sequence Evolution. ApJ, 545(2):1034–1043.
Squire, J. and Hopkins, P. F. (2018). Resonant Drag Instability of Grains Streaming in Fluids.ApJ, 856:L15.
Stoll, M. H. R. and Kley, W. (2014). Vertical shear instability in accretion disc models withradiation transport. A&A, 572:A77.
Stone, J. M., Hawley, J. F., Gammie, C. F., and Balbus, S. A. (1996). Three-dimensionalMagnetohydrodynamical Simulations of Vertically Stratified Accretion Disks. ApJ, 463:656.
Suzuki, T. K. and Inutsuka, S.-i. (2009). Disk Winds Driven by Magnetorotational Instabilityand Dispersal of Protoplanetary Disks. ApJ, 691(1):L49–L54.
Suzuki, T. K., Muto, T., and Inutsuka, S.-i. (2010). Protoplanetary Disk Winds via Magnetoro-tational Instability: Formation of an Inner Hole and a Crucial Assist for Planet Formation.ApJ, 718(2):1289–1304.
Takeuchi, T. and Lin, D. N. C. (2002). Radial Flow of Dust Particles in Accretion Disks. ApJ,581:1344–1355.
Taki, T., Fujimoto, M., and Ida, S. (2016). Dust and gas density evolution at a radial pressurebump in protoplanetary disks. A&A, 591:A86.
Teague, R., Bae, J., Birnstiel, T., and Bergin, E. A. (2018). Evidence for a Vertical Dependenceon the Pressure Structure in AS 209. ApJ, 868(2):113.
Terebey, S., Shu, F. H., and Cassen, P. (1984). The collapse of the cores of slowly rotatingisothermal clouds. ApJ, 286:529–551.
Terquem, C. and Papaloizou, J. C. B. (2007). Migration and the Formation of Systems of HotSuper-Earths and Neptunes. ApJ, 654(2):1110–1120.
Terquem, C. E. J. M. L. J. (2008). New Composite Models of Partially Ionized ProtoplanetaryDisks. ApJ, 689(1):532–538.
Testi, L., Birnstiel, T., Ricci, L., Andrews, S., Blum, J., Carpenter, J., Dominik, C., Isella,A., Natta, A., Williams, J. P., and Wilner, D. J. (2014). Dust Evolution in ProtoplanetaryDisks. In Beuther, H., Klessen, R. S., Dullemond, C. P., and Henning, T., editors, Protostarsand Planets VI, page 339.
Trapman, L., Ansdell, M., Hogerheijde, M. R., Facchini, S., Manara, C. F., Miotello, A.,Williams, J. P., and Bruderer, S. (2020). Constraining the radial drift of millimeter-sizedgrains in the protoplanetary disks in Lupus. arXiv e-prints, page arXiv:2004.07257.
Tu, L., Johnstone, C. P., Gudel, M., and Lammer, H. (2015). The extreme ultraviolet andX-ray Sun in Time: High-energy evolutionary tracks of a solar-like star. A&A, 577:L3.
Turner, N. J., Sano, T., and Dziourkevitch, N. (2007). Turbulent Mixing and the Dead Zonein Protostellar Disks. ApJ, 659(1):729–737.
160

BIBLIOGRAPHY
Umebayashi, T. and Nakano, T. (1981). Fluxes of Energetic Particles and the Ionization Ratein Very Dense Interstellar Clouds. PASJ, 33:617.
Umebayashi, T. and Nakano, T. (1988). Chapter 13. Ionization State and Magnetic Fields inthe Solar Nebula. Progress of Theoretical Physics Supplement, 96:151–160.
Umebayashi, T. and Nakano, T. (2009). Effects of Radionuclides on the Ionization State ofProtoplanetary Disks and Dense Cloud Cores. ApJ, 690(1):69–81.
Valencia, D., Ikoma, M., Guillot, T., and Nettelmann, N. (2010). Composition and fate ofshort-period super-Earths. The case of CoRoT-7b. A&A, 516:A20.
Van Eylen, V., Agentoft, C., Lundkvist, M. S., Kjeldsen, H., Owen, J. E., Fulton, B. J.,Petigura, E., and Snellen, I. (2018). An asteroseismic view of the radius valley: strippedcores, not born rocky. MNRAS, 479(4):4786–4795.
Wardle, M. (1999). The Balbus-Hawley instability in weakly ionized discs. MNRAS, 307(4):849–856.
Wardle, M. (2007). Magnetic fields in protoplanetary disks. Ap&SS, 311:35–45.
Weidenschilling, S. J. (1977). Aerodynamics of solid bodies in the solar nebula. MNRAS,180:57–70.
Weidling, R., Guttler, C., Blum, J., and Brauer, F. (2009). The Physics of ProtoplanetesimalDust Agglomerates. III. Compaction in Multiple Collisions. ApJ, 696:2036–2043.
Weiss, L. M. and Marcy, G. W. (2014). The Mass-Radius Relation for 65 Exoplanets Smallerthan 4 Earth Radii. ApJ, 783(1):L6.
Williams, J. P. and Cieza, L. A. (2011). Protoplanetary Disks and Their Evolution. ARA&A,49(1):67–117.
Windmark, F., Birnstiel, T., Guttler, C., Blum, J., Dullemond, C. P., and Henning, T. (2012a).Planetesimal formation by sweep-up: how the bouncing barrier can be beneficial to growth.A&A, 540:A73.
Windmark, F., Birnstiel, T., Ormel, C. W., and Dullemond, C. P. (2012b). Breaking through:The effects of a velocity distribution on barriers to dust growth. A&A, 544:L16.
Wolfgang, A. and Lopez, E. (2015). How Rocky Are They? The Composition Distribution ofKepler’s Sub-Neptune Planet Candidates within 0.15 AU. ApJ, 806(2):183.
Wolfgang, A., Rogers, L. A., and Ford, E. B. (2016). Probabilistic Mass-Radius Relationshipfor Sub-Neptune-Sized Planets. ApJ, 825:19.
Wood, K., Wolff, M. J., Bjorkman, J. E., and Whitney, B. (2002). The Spectral EnergyDistribution of HH 30 IRS: Constraining the Circumstellar Dust Size Distribution. ApJ,564(2):887–895.
Wright, N. J., Drake, J. J., Mamajek, E. E., and Henry, G. W. (2011). The Stellar-activity-Rotation Relationship and the Evolution of Stellar Dynamos. ApJ, 743(1):48.
Wu, Y. (2019). Mass and Mass Scalings of Super-Earths. ApJ, 874(1):91.
Yang, C.-C., Johansen, A., and Carrera, D. (2017). Concentrating small particles in protoplan-etary disks through the streaming instability. A&A, 606:A80.
161

BIBLIOGRAPHY
Youdin, A. N. and Chiang, E. I. (2004). Particle Pileups and Planetesimal Formation. ApJ,601:1109–1119.
Youdin, A. N. and Goodman, J. (2005). Streaming Instabilities in Protoplanetary Disks. ApJ,620:459–469.
Youdin, A. N. and Lithwick, Y. (2007). Particle stirring in turbulent gas disks: Includingorbital oscillations. Icarus , 192:588–604.
Youdin, A. N. and Shu, F. H. (2002). Planetesimal Formation by Gravitational Instability.ApJ, 580:494–505.
Zeng, L. and Sasselov, D. (2013). A Detailed Model Grid for Solid Planets from 0.1 through100 Earth Masses. PASP, 125(925):227.
Zhu, Z., Hartmann, L., and Gammie, C. (2009). Nonsteady Accretion in Protostars. ApJ,694(2):1045–1055.
Zsom, A., Ormel, C. W., Guttler, C., Blum, J., and Dullemond, C. P. (2010). The outcomeof protoplanetary dust growth: pebbles, boulders, or planetesimals? II. Introducing thebouncing barrier. A&A, 513:A57.
162

BIBLIOGRAPHY
PermissionsP
age
No.
Typ
e
of wor
k:
Nam
eof
wor
k
Sou
rce
ofw
ork
Copyri
ght
hold
eran
dco
n-
tact
per
mis
sion
requ
este
don
Ih
ave
per
-
mis
sion
yes
/n
o
Per
mis
sion
note
13fi
gure
sF
ig.
5
Mas
srad
ius
dia
gram
for
exop
lan
-
ets.
..,
Fig
.
7P
lan
etar
y
mas
srad
ius
dia
gram
...
D.
Jon
tof-
Hu
tter
,T
he
Com
pos
itio
nal
Div
ersi
ty
ofL
ow-M
ass
Exop
lan
ets,
An
nu
alR
evie
wof
Ear
th
and
Pla
net
ary
Sci
ence
s
(201
9),
vol
47,
pag
e15
5
An
nu
al
Rev
iew
s,
Inc.
;m
ark
et-
pla
ce.c
opyri
ght.
com
(Copyri
ght
Cle
ara
nce
Cen
ter)
21.0
5.2
0ye
sL
icen
se
ob
tain
edvia
Copyri
ght
Cle
ara
nce
Cen
ter
14fi
gure
Fig
.7
Top
:
com
ple
ten
ess-
corr
ecte
d
his
togr
am
ofp
lan
et
rad
ii..
.
B.
Fu
lton
etal
.,T
he
Cal
ifor
nia
-Kep
ler
Su
rvey
.
III.
AG
apin
the
Ra-
diu
sD
istr
ibu
tion
ofS
mal
l
Pla
net
s,T
he
Ast
ron
omi-
cal
Jou
rnal
(201
7),
Vol
-
um
e15
4,Is
sue
3,ar
ticl
e
id.
109,
19p
p.
AA
S;
per
mis
-
sion
s@io
pp
ub
lish
ing.o
rg
21.0
5.2
0ye
sR
epro
du
ced
wit
hth
e
per
mis
sion
of
B.
Fu
lton
an
dA
AS
163

BIBLIOGRAPHY
Firefox https://marketplace.copyright.com/rs-ui-web/mp/license/e6c03d4b-698d...
1 of 4 25-May-20, 10:54
164

BIBLIOGRAPHY
Firefox https://marketplace.copyright.com/rs-ui-web/mp/license/e6c03d4b-698d...
2 of 4 25-May-20, 10:54
165

BIBLIOGRAPHY
Firefox https://marketplace.copyright.com/rs-ui-web/mp/license/e6c03d4b-698d...
3 of 4 25-May-20, 10:54
166

BIBLIOGRAPHY
Firefox https://marketplace.copyright.com/rs-ui-web/mp/license/e6c03d4b-698d...
4 of 4 25-May-20, 10:54
167

BIBLIOGRAPHY
Re: Request to re-use a figure in a PhD thesis
Permissions <[email protected]>Thu 28/05/2020 13:18
To: Jankovic, Marija <[email protected]>
Dear Marija,
Thank you for providing confirmation that you have received the consent of the authorsto reproduce content from AAS journals (as below)
I am happy to confirm that permission is granted and you need take no further action.
Please include the following alongside the material:
the source of the material, including author, article title, title of journal, volume number, issuenumber (if relevant), page range (or first page if this is the only information available) and dateof first publication. This material can be contained in a footnote or reference.for material being published electronically, a link back to the ar cle (via DOI)if prac cal and IN ALL CASES for works published under any of the Crea ve Commons licencesthe words "© AAS. Reproduced with permission".
This permission does not apply to any material/figure which is credited to another source in the AASpublication or has been obtained from a third party. Express permission for such materials/figuresmust be obtained from the copyright owner.
Kind regards,
Cameron Wood
Copyright & Permissions TeamSophie Bri ain - Rights & Permissions Assistant Cameron Wood - Legal & Rights AdviserContact DetailsE-mail: [email protected]
For further informa on about copyright and how to request permission:h ps://publishingsupport.iopscience.iop.org/copyright-journals/See also: h ps://publishingsupport.iopscience.iop.org/Please see our Author Rights Policy h ps://publishingsupport.iopscience.iop.org/author-rights-policies/Please note: We do not provide signed permission forms as a separate a achment. Please print thisemail and provide it to your publisher as proof of permission. Please note: Any statements made byIOP Publishing to the effect that authors do not need to get permission to use any content where IOPPublishing is not the publisher is not intended to cons tute any sort of legal advice. Authors mustmake their own decisions as to the suitability of the content they are using and whether they requirepermission for it to be published within their ar cle.
Firefox https://outlook.office.com/mail/inbox/id/AAQkADI0OGFjMTJlLWFiN...
1 of 3 28-May-20, 13:35
168