Planet Earth EAPS 10000-001
73
10/20/2018 1 EAPS 10000-001 – Planet Earth Professor L. Braile 2271 HAMP (CIVL), [email protected] Textbook: Foundations of Earth Science Lutgens and Tarbuck 8 th Edition 2017 8 th Edition, 2017 8 th Edition, 2017 Course information available at: http://web.ics.purdue.edu/~braile/eas100/eas100home.htm 7 th Edition, 2014 EAPS 10000-001 – Planet Earth Professor L. Braile 2271 HAMP (CIVL), [email protected] Textbook: Foundations of Earth Science, Lutgens and Tarbuck, 8 th Edition, 2017 Intro section PPTs (through today) have been updated th PPT (i df f t) li (li k f th on the PPTs (in pdf format) online (link from the course home page) Handouts: Lecture Note Figures 1A , 1 and 2 Hw 1 - due Tu, 9/18, Hw 2 – due 9/27 Lecture Notes/PPTs for Intro section now online Exam I is Tu, 9/25; will discus in class Th, 9/20: Exam I, studying for exam, Study Guide (online) http://www.intellicast.com/Storm/Hurricane/AtlanticAnalysis.aspx http://www.intellicast.com/Storm/Hurricane/AtlanticSatellite.aspx?animate=true September 16, 2015 M8.3 Earthquake off the coast of Chile 7 cm/yr convergence Santiago We discussed the 2010 EQ previously
-
Upload
khangminh22 -
Category
Documents
-
view
3 -
download
0
Transcript of Planet Earth EAPS 10000-001

10/20/2018
1
EAPS 10000-001 – Planet EarthProfessor L. Braile
2271 HAMP (CIVL), [email protected]: Foundations of
Earth ScienceLutgens and Tarbuck
8th Edition 2017
8th Edition, 2017
8th Edition, 2017
Course information available at:http://web.ics.purdue.edu/~braile/eas100/eas100home.htm
7th Edition, 2014
EAPS 10000-001 – Planet EarthProfessor L. Braile
2271 HAMP (CIVL), [email protected]: Foundations of
Earth Science, Lutgens and Tarbuck, 8th Edition, 2017
Intro section PPTs (through today) have been updated th PPT (i df f t) li (li k f thon the PPTs (in pdf format) online (link from the
course home page)
Handouts: Lecture Note Figures 1A , 1 and 2
Hw 1 - due Tu, 9/18, Hw 2 – due 9/27
Lecture Notes/PPTs for Intro section now online
Exam I is Tu, 9/25; will discus in class Th, 9/20: Exam I, studying for exam, Study Guide (online)
http://www.intellicast.com/Storm/Hurricane/AtlanticAnalysis.aspx http://www.intellicast.com/Storm/Hurricane/AtlanticSatellite.aspx?animate=true
September 16, 2015 M8.3 Earthquake off the coast of Chile
7 cm/yr convergence
SantiagoWe discussedthe 2010 EQ previously

10/20/2018
2
M7.1 earthquake, April 24, 2017
Santiago
About one M8 or greater EQ every 8 years along the west coast of South America!
September 16, 2015 M8.3 Earthquake off the coast of Chile
Feb. 27, 2010 M8.8 Eq
Tsunami, September 16, 2015 M8.3 Earthquake off the coast of Chile
Coquimbo tide gage (150km N of epicenter) is a good illustration that the first wave does not have to be the biggest and that tsunami last for hours. (Jascha Polet). Note: more than 6 waves with greater than 2 m height, large waves go on for hours (sometimes many hours), wave period is about 30 minutes. These characteristics are common in large tsunami.
See more at: http://ds.iris.edu/ds/nodes/dmc/specialevents/2015/09/16/illapel-chile/#sthash.jvH85kev.dpuf
The Dynamic Earth (just some facts for illustration of dynamic Earth)
Each year…
- Earth rotates on its axis 365 ¼ times.- Earth travels ~1 billion km in orbit around the Sun.- There are ~8 Atlantic hurricanes.
Th 800 U S t d- There are ~800 U.S. tornadoes.- ~50 volcanoes erupt in the world.- There are ~150 M6 or greater earthquakes.- The US consumes ~8 billion barrels of oil and
gas (~20 million barrels/day, ~22 barrels/person/year).
- ~400 million liters of oil is spilled (~10 times the Exxon Valdez oil spill)
The Dynamic Earth, Each year…The U.S. uses ~600 trillion liters
of water (~5000 liters/person/day).~450 million tons of sediment are deposited
in the Gulf of Mexico by the Mississippi River.~20 billion tons of CO2 are emitted (~5
tons/person/year for the US).E th h 85 illi l (t t l 7 65 billi )- Earth has ~85 million more people (total ~7.65 billion).
- U.S. has ~2.7 million more people (total ~328 million) - The National Science Foundation spends about $6.5
billion on research and education (Proctor and Gamble spends over $10 billion a year on advertising, and cigarette and auto manufacturers spend a few billion dollars a year on advertising; ExxonMobil quarterly profits in 2018 are ~$4 billion).

10/20/2018
3
http://www.nature.com/news/demand-for-water-outstrips-supply-1.11143
The Ogallala (or “high plains”) aquifer is a vast water supply used for drinking water and irrigation for agriculture in the great plains area. It supplies about 30% of all the irrigation water used in the U.S. The aquifer is being depleted at a
http://earthdesk.blogs.pace.edu/tag/ogallala-aquifer/http://www.csmonitor.com/Environment/Latest-News-Wires/2013/0827/Ogallala-aquifer-Could-critical-water-source-run-dry
aquifer is being depleted at a rate of about 8 times the rate of replenishment. A 2013 report by the USGS states that the aquifer is about 30% depleted and could have an additional 39% depletion in the next 50 years.
California Drought Effects, 2011-2014 (USA Today, 9/3/2014; Oroville is in Northern California)
Earth from Apollo 17, 1972.
Southward looking oblique view of Mare Imbrium and Copernicus crater on the Moon. Copernicus crater is seen almost edge-on near the horizon at the center. The crater is 107 km in diameter and is centered at 9.7 N, 20.1 W. In the foreground is Mare Imbrium, peppered with secondary crater chains and elongated craters dueand elongated craters due to the Copernicus impact. The large crater near the center of the image is the 20 km diameter Pytheas, at 20.5 N, 20.6 W. At the upper edge of the Mare Imbrium are the Montes Carpatus. The distance from the lower edge of the frame to the center of Copernicus is about 400 km. This picture was taken by the metric camera on Apollo 17. (Apollo 17, AS-2444)
Global topography, land areashttp://www.ngdc.noaa.gov/mgg/topo/globe.html
10/20/2018
4
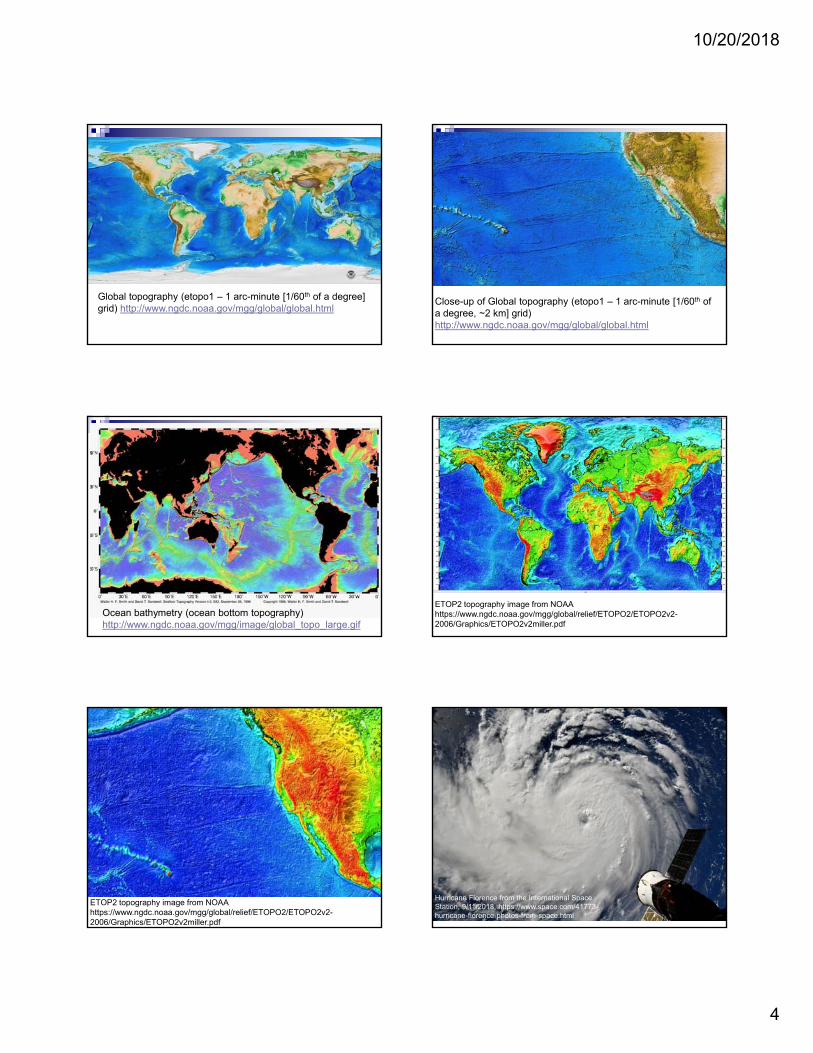
Global topography (etopo1 – 1 arc-minute [1/60th of a degree] grid) http://www.ngdc.noaa.gov/mgg/global/global.html
Close-up of Global topography (etopo1 – 1 arc-minute [1/60th of a degree, ~2 km] grid) http://www.ngdc.noaa.gov/mgg/global/global.html
Ocean bathymetry (ocean bottom topography)http://www.ngdc.noaa.gov/mgg/image/global_topo_large.gif
ETOP2 topography image from NOAA https://www.ngdc.noaa.gov/mgg/global/relief/ETOPO2/ETOPO2v2-2006/Graphics/ETOPO2v2miller.pdf
ETOP2 topography image from NOAA https://www.ngdc.noaa.gov/mgg/global/relief/ETOPO2/ETOPO2v2-2006/Graphics/ETOPO2v2miller.pdf
Hurricane Florence from the International Space Station, 9/11/2018, https://www.space.com/41773-hurricane-florence-photos-from-space.html

10/20/2018
5
Hurricane Florence from the International Space Station, 9/11/2018, https://www.space.com/41773-hurricane-florence-photos-from-space.html http://www.intellicast.com/Storm/Hurricane/AtlanticAnalysis.aspx
http://www.intellicast.com/Storm/Hurricane/AtlanticSatellite.aspx?animate=true
Earth Science (Geology) Section(Important concepts for today)
Rock SamplesThe Dynamic EarthEarth Materials
MineralsRocks (aggregates of minerals)
IgneousSedimentaryMetamorphic
The Rock CycleEarth’s Interior Structure and Composition
Earth Materials:
Mineral:Naturally occurring, inorganic solid, distinct chemical composition, regular crystal structure, characteristic physical properties. Examples: quartz, calcite, mica, feldspar, olivine, diamond, pyritep py
Rock:Aggregate of minerals.
Igneous, sedimentary, metamorphic.

10/20/2018
6
If you have interest in minerals and rocks, you can purchase mineral and rock kits for a reasonable price. They also makeThey also make good gifts for younger brothers and sisters or nieces and nephews. The samples are small but large enough to see the properties of each sample.
Hematite (Fe2O3)
Pyrite (FeS2)Minerals:
Quartz (SiO2)
Olivine ([Mg,Fe]2SiO4)
Giant gypsum (mineral) crystals from the Cave of Crystals, Chihuahua, Mexico (Figure, page 22-23, Text)
Olivine – an important silicate mineral (iron/magnesium silicate) in the )Earth’s mantle (the mantle is 82% of the planet by volume).
Mineral:Characteristic physical properties – hardness, crystal structure, cleavage, color streak, density
(Figure 1 15a text)(Figure 1.15a, text)
Mineral:Characteristic physical properties – hardness, crystal structure, cleavage, color streak, density
(Figure 1.15b, text)
(Figure 1 15b text)(Figure 1.15b, text)

10/20/2018
7
Mineral properties: Regular crystal structure (atomic scale) results in characteristic crystal shape and cleavage (Figure 1.2, text).
Crystal form and cleavage
Density
Streak
Mineral properties: Crystal formand cleavage, streak, density(Figures 1.10, 1.11, 1.14,, text).
September 19, 2017 – Exam I Information:
(Note: Lecture Topics Outlines/PPTs link (on the EAPS 100 home page) includes outlines of the lecture material, information about the most important topics and illustrations in the textbook [assigned reading] and pdf copies of nearly all of the PowerPoint slides shown in class –IntroNotes.pdf (updated) and EarthNotes.pdf (updated through Plate Tectonics).
Also, see the Study Guide to the Textbook available on the Handouts page on the course website and at: http://web.ics.purdue.edu/~braile/eas100/studyguide8th.pdf
EAPS 10000 001, Planet Earth
(Sept. 19, 2017; this information is also on the Announcements link on the EAPS 100 Home Page)
EXAM ITuesday, Sept. 25, 12:00-1:15 p.m., EE 129
1. Material presented in class through Sept. 20 (Intro section, Earth section through discussions of Plate Tectonics – see syllabus for schedule, topics and assigned textbook reading pages).
2. Because we will be covering hurricanes later in the semester, there are PPTs on the IntroNotes.pdf file, but that material will not be on Exam I.
3. You may use one 3”x5” (That’s ONE card!, or equivalent) study card (both sides, hand-written or computer printed).
4. Format: short answer and multiple choice.
Studying for the Exam:1. Study your notes first (assigned reading in the text should provide additional information and explanation; use the study guide to the text and the assigned reading pages from the course syllabus to guide your study of the textbook material and your notes).2. Emphasis is on major concepts (when you see a section in your notes representing a significant portion of a lectureyour notes representing a significant portion of a lecture period, ask yourself, “can I describe this concept or process?”).3. Try to develop understanding and visualization, not memorization (example: transfer of energy – radiation, conduction, convection; see Figure in text or Intro PPTs).4. Read questions carefully; be sure you know what is being asked before starting to answer.5. Prepare your study card thoughtfully.
Energy transfer – radiation (radiating energy), conduction, convection
Fig. 11.17 Text
10/20/2018
8
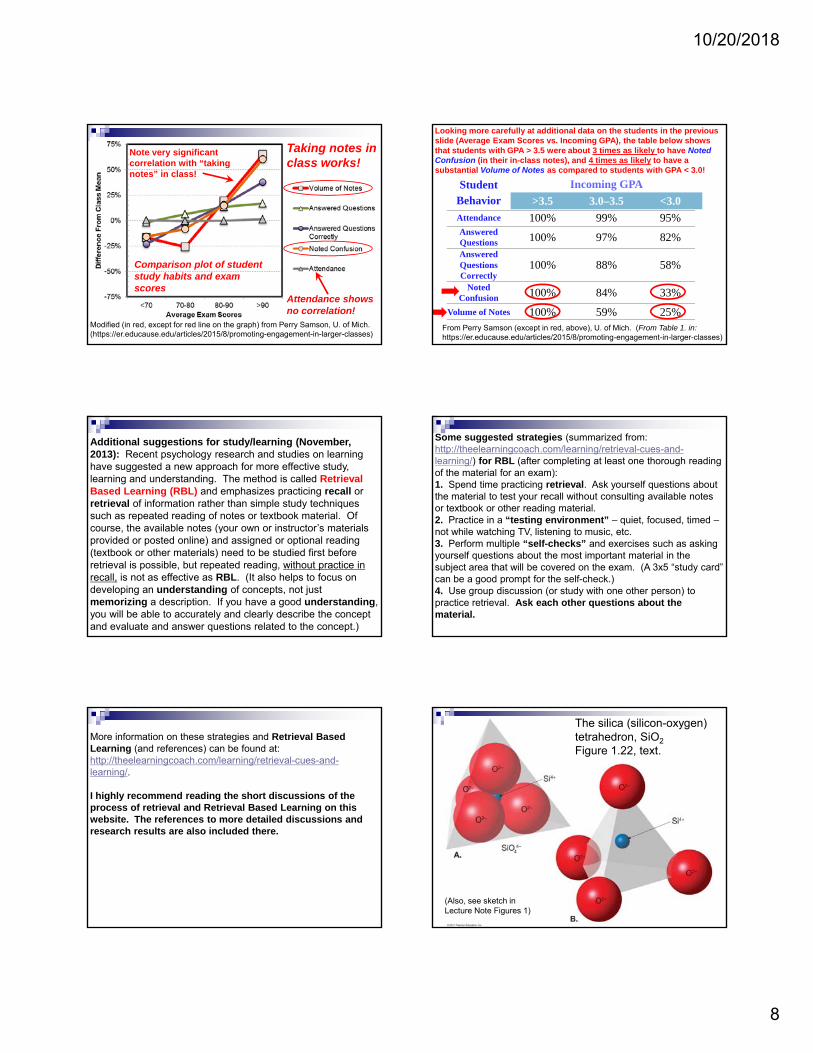
Note very significant correlation with “taking notes” in class!
Taking notes in class works!
Modified (in red, except for red line on the graph) from Perry Samson, U. of Mich. (https://er.educause.edu/articles/2015/8/promoting-engagement-in-larger-classes)
Attendance shows no correlation!
Comparison plot of student study habits and exam scores
Student Behavior
Incoming GPA
>3.5 3.0–3.5 <3.0
Attendance 100% 99% 95%Answered 100% 97% 82%
Looking more carefully at additional data on the students in the previous slide (Average Exam Scores vs. Incoming GPA), the table below shows that students with GPA > 3.5 were about 3 times as likely to have Noted Confusion (in their in-class notes), and 4 times as likely to have a substantial Volume of Notes as compared to students with GPA < 3.0!
From Perry Samson (except in red, above), U. of Mich. (From Table 1. in: https://er.educause.edu/articles/2015/8/promoting-engagement-in-larger-classes)
Answered Questions 100% 97% 82%Answered Questions Correctly
100% 88% 58%
Noted Confusion 100% 84% 33%
Volume of Notes 100% 59% 25%
Additional suggestions for study/learning (November, 2013): Recent psychology research and studies on learning have suggested a new approach for more effective study, learning and understanding. The method is called Retrieval Based Learning (RBL) and emphasizes practicing recall or retrieval of information rather than simple study techniques such as repeated reading of notes or textbook material. Of course the available notes (your own or instructor’s materialscourse, the available notes (your own or instructor’s materials provided or posted online) and assigned or optional reading (textbook or other materials) need to be studied first before retrieval is possible, but repeated reading, without practice in recall, is not as effective as RBL. (It also helps to focus on developing an understanding of concepts, not just memorizing a description. If you have a good understanding, you will be able to accurately and clearly describe the concept and evaluate and answer questions related to the concept.)
Some suggested strategies (summarized from: http://theelearningcoach.com/learning/retrieval-cues-and-learning/) for RBL (after completing at least one thorough reading of the material for an exam):1. Spend time practicing retrieval. Ask yourself questions about the material to test your recall without consulting available notes or textbook or other reading material.2. Practice in a “testing environment” – quiet, focused, timed –not while watching TV, listening to music, etc.3. Perform multiple “self-checks” and exercises such as asking yourself questions about the most important material in the subject area that will be covered on the exam. (A 3x5 “study card” can be a good prompt for the self-check.)4. Use group discussion (or study with one other person) to practice retrieval. Ask each other questions about the material.
More information on these strategies and Retrieval Based Learning (and references) can be found at: http://theelearningcoach.com/learning/retrieval-cues-and-learning/.
I highly recommend reading the short discussions of the process of retrieval and Retrieval Based Learning on this website The references to more detailed discussions andwebsite. The references to more detailed discussions and research results are also included there.
The silica (silicon-oxygen)tetrahedron, SiO2
Figure 1.22, text.
(Also, see sketch in Lecture Note Figures 1)

10/20/2018
9
Most rocks (including most of the Earth’s crust and mantle – over 82% of the volume of the Earth) are silicates
XSiO2 not always 2
where ‘X’ is K Na Al Fe Mg Ca or combinationwhere X is K, Na, Al, Fe, Mg, Ca, or combination.
Another common rock type in the sedimentary layer is Limestone
CaCO3 (no Si)
Silicate minerals,(Figure 1.23, text)
Silicate minerals,(Figure 1.23, text)
Silicate minerals,(Figure 1.23, text)
Non-Silicate minerals, Figure 1.30, text
Rock (granite): an aggregate of minerals(Figure 1.3, text)
10/20/2018
10
1 cm
1 cmquartz
hornblende
feldspar
Polished granite tile
~1 cmquartz
hornblende
feldspar
biotite
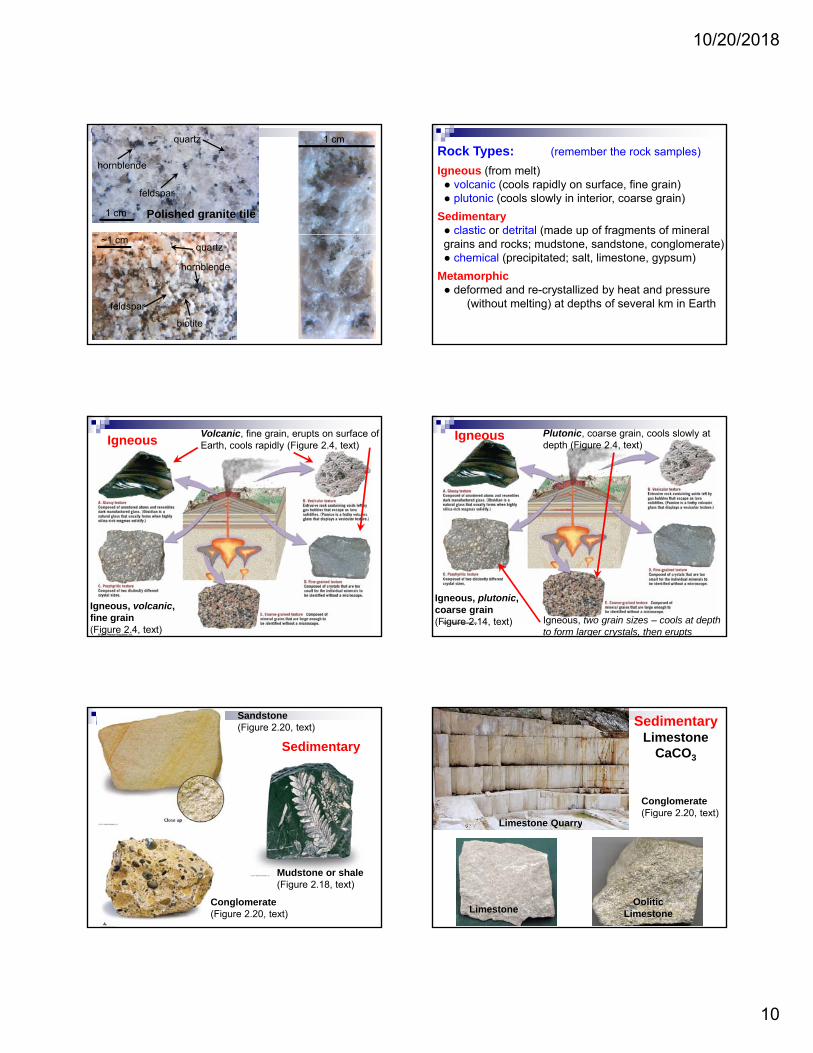
Rock Types: (remember the rock samples)
Igneous (from melt)● volcanic (cools rapidly on surface, fine grain)● plutonic (cools slowly in interior, coarse grain)
Sedimentary ● clastic or detrital (made up of fragments of mineral ( p ggrains and rocks; mudstone, sandstone, conglomerate)● chemical (precipitated; salt, limestone, gypsum)
Metamorphic ● deformed and re-crystallized by heat and pressure
(without melting) at depths of several km in Earth
IgneousVolcanic, fine grain, erupts on surface of Earth, cools rapidly (Figure 2.4, text)
Igneous, volcanic, fine grain(Figure 2.4, text)
Igneous Plutonic, coarse grain, cools slowly at depth (Figure 2.4, text)
Igneous, plutonic, coarse grain(Figure 2.14, text) Igneous, two grain sizes – cools at depth
to form larger crystals, then erupts
Sedimentary
Sandstone(Figure 2.20, text)
Mudstone or shale(Figure 2.18, text)
Conglomerate(Figure 2.20, text)
SedimentaryLimestone
CaCO3
Conglomerate(Figure 2.20, text)( g )
LimestoneOolitic
Limestone
Limestone Quarry

10/20/2018
11
Metamorphic
Gneiss, note banding/alignment, called “foliation”)
SchistMica
Garnet
The Rock Cycle(Figure 2.1, text)
Iron-Nickel Meteorite (representative of the material in the Earth’s core)
Earth’s Interior
StructureThe travel times of seismic waves through the Earth to different distances can only be matched by a model
P wave
matched by a model Earth that has layering as shown here (crust, mantle, outer core, inner core).(Figure 6.33, text)
For example, it takes about 20 minutes for seismic waves to travel straight throughthe Earth, an average velocity of 2*6371 km/20*60 s = 10.6 km/s
PP wave
PKP wave
P wave
(Figure 6.31, text)
PP wave
PKP wave

10/20/2018
12
Refraction of light by water
Similarly, seismic waves in the Earth are refracted and reflected at layer boundaries.Refraction
Reflection
Earth’s interior structure and seismic raypaths that are used to determine the Earth structure.
http://www.iris.edu/hq/files/programs/education_and_outreach/lessons_and_resources/images/ExplorEarthPoster.jpg
Seismograms (from the Jan. 16, 1994 M6.8 Northridge earthquake) for waves traveling through the Earth.
Shadow ZoneShadow Zone
From 3/11/2011 M9.0 N. Japan EQ
e (M
inut
es)
2
0
30
http://www.iris.edu/SpudService/Data/124332
Curved line for two reasons –spherical Earth, and faster seismic
Science for Planet Earth
Distance (Degrees, one degree = 111.19 km on surface)0 40 80 120 160
Tim
e0
1
0
velocity for rocks deeper within the Earth
Seismic Waves Program http://bingweb.binghamton.edu/~ajones/The Seismic Waves program: Uses speeded-up time views of wavefronts to illustrate wave propagation through the Earth. Note reflection, refraction and wave conversion at layer boundaries. Seismograms show arrivals of various phases (wave types and paths). Wave energy/propagation represented by wavefronts. Raypathsshow direction of travel of a specific point on the wavefront.
*Earthquake
Wavefront
Ray Path
Ray Path is perpendicularto wavefront
Seismograph
Cross SectionThrough Earth
Stations forSeismograms

10/20/2018
13
*Earthquake
Wavefront
Ray Path
Ray Path is perpendicularto wavefront
Seismograph
Cross SectionThrough Earth
Stations forSeismograms
Time T1
*Earthquake
Wavefront
Ray Path
Ray Path is perpendicularto wavefront
Seismograph
Cross SectionThrough Earth
Stations forSeismograms
Time T2
Earth’s interior structure and seismic raypaths that are used to determine the Earth structure.
http://www.iris.edu/hq/files/programs/education_and_outreach/lessons_and_resources/images/ExplorEarthPoster.jpg
September 15 http://www.intellicast.com/Storm/Hurricane/AtlanticSatellite.aspx?animate=true
September 16 http://www.intellicast.com/Storm/Hurricane/AtlanticSatellite.aspx?animate=true
September 15, 2018 http://www.intellicast.com/National/Radar/Current.aspx?location=USNC0121&animate=true
September 16, 2018 http://www.intellicast.com/National/Radar/Current.aspx?location=USNC0121&animate=true
10/20/2018
14
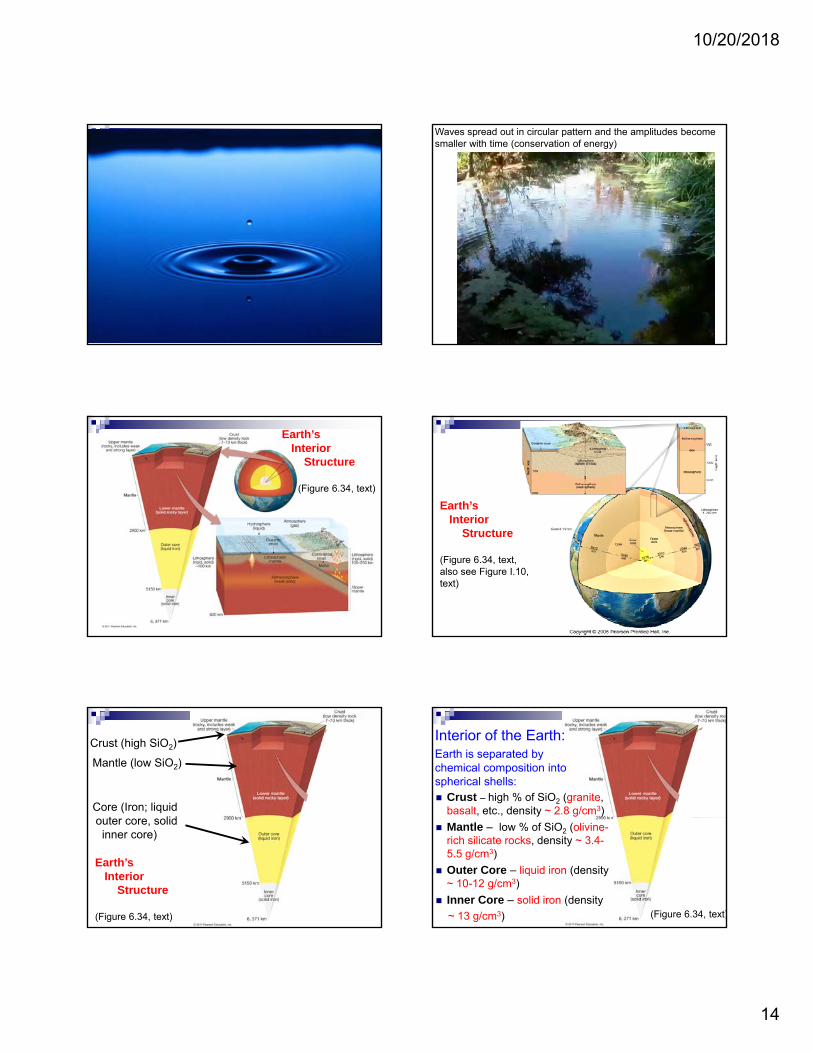
Waves spread out in circular pattern and the amplitudes become smaller with time (conservation of energy)
Earth’s Interior
Structure
(Figure 6.34, text)
Earth’s Interior
Structure
(Figure 6.34, text, also see Figure I.10, text)
Crust (high SiO2)
Mantle (low SiO2)
Core (Iron; liquidt lid
Earth’s Interior
Structure
(Figure 6.34, text)
outer core, solidinner core)
Crust – high % of SiO2 (granite, basalt, etc., density ~ 2.8 g/cm3)
Interior of the Earth:Earth is separated by chemical composition into spherical shells:
Mantle – low % of SiO2 (olivine-rich silicate rocks, density ~ 3.4-5.5 g/cm3)
Outer Core – liquid iron (density ~ 10-12 g/cm3)
Inner Core – solid iron (density
~ 13 g/cm3) (Figure 6.34, text)

10/20/2018
15
Earth’s InteriorStructure
(Figure 6.34, text)
Close-up of upper 600 km of Earth
Lithosphere (about 100 -200 km thick, includes crust and uppermost mantle)
Asthenosphere (beneath lithosphere)
T ~ 12 oC at surface
Lithosphere
Temperature in Earth’s Interior
( p )
T ~ 1300 oC in asthenosphere
T ~ 3700 oC at core/mantle boundary,(~2900 km depth)
T ~ 5000 oC at center of Earth,(6371 km depth)
600 km
p~100 km thick
Close-up of upper 600 km of Earth (Heat from original energy from accretion and radioactivity of Earth)
(Figure 6.34, text)
Olivine – an important silicate mineral (iron/magnesium silicate) in the )Earth’s mantle (the mantle is 82% of the planet by volume).
EAPS 10000-001 – Planet EarthProfessor L. Braile
2271 HAMP (CIVL), [email protected]: Foundations of
Earth Science, Lutgens and Tarbuck, 8th Edition, 2017
Intro section PPTs (through today) have been updated th PPT (i df f t) li (li k f thon the PPTs (in pdf format) online (link from the
course home page)
Handouts: Lecture Note Figures 1A , 1 and 2
Hw 1 - due Tu, 9/18, Hw 2 – due 9/27
Lecture Notes/PPTs for Intro section now online
Exam I is Tu, 9/25; will discus in class Th, 9/20: Exam I, studying for exam, Study Guide (online)
Y Dimensionless Speed versusStride length for walking and running animals
Use these points, on the line, to calculate the slope!
Ill t ti 1
dy2
Slope of a line (or best-fit line), information for Hw 2, etc.
To calculate slope, don’t just “count squares” –that ONLY works when the squares are one unitby one unit on each side slope = dy/dx. X
Illustration of dx and dy
1
dx
Graph from our discussion of how fast dinosaurs ran.
Compass direction: N NNE NE ENE E ESE SE SSE S SSW SW WSW W WNW NW NNWEquivalent Azimuth: 0 22.5 45 67.5 90 112.5 135 157.5 180 202.5 225 247.5 270 292.5 315 337.5
EAPS 10000 Homework 2 Information: Measuring directions with “points of a compass” and azimuth.
45o
Azimuth (similar to compass directions) is the angle in degrees measured clockwise f N th (0 360
315o
A Azimuth = 0o
90o
135o
180o
225o
270o
from North (0 or 360 degrees). For example, for the direction shown (bold arrow; and the angle shown by the dashed lines), the azimuth is 135o and the compass direction is SE.
Angle

10/20/2018
16
Interior of the Earth:
Earth is separated by chemical composition into spherical shells:
Crust – high % of SiO2 (granite, basalt, etc.)
Mantle – low % of SiO2 (olivine-rich silicate rocks)
Outer Core – liquid iron
Inner Core – solid iron (Figure 6.34, text)
Plate TectonicsEarth’s platesLithosphere and asthenospherePlate boundaries, motions and
interaction
Properties of Earth materials (rocks):
PHYSICAL –density, elasticity, mechanical (brittle/ductile)
CHEMICAL –chemical composition (% of different minerals)
CONDITIONS –temperature, pressure, time
Elasticity (spring, rubber band, rocks)
Elastic Materials(straight line)
ng
(D
efo
rmat
ion
) Weak elastic materials (easily deformed)
Weight (force)(if force is removed, material returns to its original shape)
Str
etch
in
Key words: elastic, brittle, ductile
Strong elastic materials, like most rocks (requires large force to deform)
Click on slide to start video
Illustration of elasticity of a rock – in this case two strips of granite tile securely clamped together at one end with a thin metal spacer between the strips at that end (left). The granite tile is very hard and rigid, but can be bent, although bending too much will cause it to break (as most rocks are brittle at low temperatures). Note in the video, that when the granite tile strips are squeezed together and then released, they return to their original position because the granite is elastic, although much stronger (higher coefficient of elasticity) than materials such as rubber bands, springs, plastic, and wood that can be bent or stretched easily. Video File: http://web.ics.purdue.edu/~braile/new/ElasticRebound.AVI
Earth’s Plates (lithosphere) continued:
Plate Boundaries –divergent, convergent, transform
Plate Motions – ~ 1 to 15 cm/yr The lithosphere is the crust and the
uppermost mantle (relatively cool, strong and brittle) – NOT just the crust!

10/20/2018
17
Earth’s Plates (lithosphere):
Dimensions –1000’s of km wide~100 km thick
Mechanical Properties –‘strong’, ‘brittle’ (cool) lithosphereabove ‘soft’, ‘ductile’ (hot) asthenosphere
Lithosphere, Plates (includes both crust and the uppermost part of the mantle):Cool, Elastic, Brittle, Strong, Rigid
Asthenosphere, part of the upper Mantlebeneath the lithosphereHot, Plastic, Ductile, Soft, Flows
This layering (the plates) is caused by temperature increasing with depth in the Earth. The base of the lithosphere (top of the asthenosphere) is about 1300 oC and averages about 100 km depth.
The hard boiled egg analogy to the Earth’s interior
Crust, Mantle and Core (chemical classification) or Lithosphere, Asthenosphere (and deeper
regions; mechanical classification)
The hard boiled egg analogy to Earth’s lithospheric plates
The Lithospheric Plates and Plate Boundaries
(Sliding a piece of the shell causes divergence, convergence or
translation at the boundaries)
Lithosphere
Mantle part
Crust
Crust-Mantle boundary
Earth’s Interior
Structure
(Figures I.10, 5.9, text)
Notice that the Lithosphere consists of the crust and part of the upper mantle. Also, the oceanic crust is different than the continental crust.
Mantle part of Lithosphere Asthenosphere
Lithosphere (about70 -150 km thick, includes crust and uppermost mantle)
Asthenosphere(layer beneath Lithosphere ( ylithosphere)
600 km
p~100 km thick
Close-up of upper 600 km of Earth
(Figure 6.34, text)

10/20/2018
18
Earth’s Tectonic Plates
http://geology.er.usgs.gov/eastern/plates.html
The North American and surrounding plates. Note that the plate boundaries are not always continental boundaries.
Earth’s Plates (lithosphere) & Plate boundariessee Fig. 5.10, text
Earth’s Plates
Figure 5.11, L&T, 2011
C t
The three typesof plate boundaries…
(Figure 5.10, text)
Divergent
Basaltic (generally non-explosive) volcanism (from melting of normal mantle)
Convergent
Transform(horizontal slip)
Silicic (explosive) volcanism (cone-shaped Rhyolite/Andesite volcanoes, from melting of subducted crust and sediments)
Plate Tectonics
Divergent boundaryMid-ocean ridges,Figure 5.11, text

10/20/2018
19
Plate Tectonics
Divergent boundary,Continental rift and separation,Figure 5.13, textFigure 5.13, text
Plate Tectonics
Divergent boundary,Continental rift and separation in
i E tprogress in East Africa and Red Sea,Figure 5.14, text
Plate Tectonics
Convergent boundary,‘subduction’,Figure 5.15,text
Oceanic plate-continental plate collision
Oceanic plate-oceanic plate collision (Island Arc)
Continental plate-continental plate collision
Silicic (explosive) volcanism (cone-shaped Rhyolite/Andesite volcanoes, from melting of subducted crust and sediments)
Trench
Plate Tectonics, Convergent boundary,ocean plate collision with a continental plate; like west coast of South America, Figure 5.15, text
Rocks deformed (folded and faulted [blue lines on photo]) by local compressional forces.
Plate Tectonics
Convergent boundary,Continent-
ti tcontinent collisionFigure 5.18, text
Collision of India plate with Asia over past 70 million years

10/20/2018
20
Plate Tectonics
Transform boundary;offsets of mid-oceanridges,Figure 5.19, textFigure 5.19, text
Plate Tectonics
Transform boundary;(also called a strike-slip fault)San Andreas fault,Figure 5.21, text
Fault
Offset of stream valley by recent movement along fault
Relative motion
Plate Tectonics in the Pacific Northwest
Plate Tectonics in the Pacific Northwest
Three types of plate boundaries;Figure 5.20, text
San Andreas fault – a transform (horizontal slip) plate boundary)
Plate Tectonics
World view of plates; Asia and western Pacific; example of plateexample of plate boundaryFigure 5.10, text
Divergent Boundary
Plate Tectonics
World view of plates; ~westernhemisphere; examples of plateexamples of plate boundariesFigure 5.10, text
Convergent Boundary Transform Boundary
Please view the Pearson animations related to plate tectonicsOpen the link below (you can copy the link from below and paste it into your web browser) and scroll down to the section: ONLINE ANIMATIONS FROM PEARSON. From the links displayed in that section, select the animations below (first 4 are the most important) and view them. To view, open the selected animation, click on the bold white arrow to start animation. The animations have sound (and also closed captioning) that provides explanations of the animations. Most animations are 1- 3 minutes long. The “moving part” of the animation sometimes starts 30-60 s after starting the
i ti U th d bl t th l i ht t t F ll S Othanimation. Use the double arrow at the lower right to get Full Screen. Other animations are also available on the page.
1. Seafloor Spreading and Plate Tectonics, 2. Transform Faults, 3. India Collision with Asia, 4. Pangea Breakup,5. Motions at Plate Boundaries, 6. Plate Boundary Features
Seafloor Spreading and Plate Tectonic animation:
http://subduction.rocks/Animations%20Index.htm

10/20/2018
21
Transform faults
Mid-ocean ridge
African Plate
Fracture zone
Fracture zone
Transform faults in the Atlantic ocean basin. Map image from This Dynamic Planet map (http://pubs.usgs.gov/imap/2800/).
Transform faults. Note that the earthquakes (black dots) are primarily on the active part of the transform fault where the two sides of the fault (in the lithosphere) are sliding past each other and offsetting the mid-ocean ridge (red lines).
g
Cross section through Mid-ocean ridge
Cross sectionlocation
Transform faults in the Atlantic ocean basin. Image from This Dynamic Planet map (http://pubs.usgs.gov/imap/2800/).
Transform fault
Mid-ocean ridge
Fracture zoneFracture zone
Depth in meters
2000
4000
Break up of Pangaea
http://www.odsn.de/odsn/services/paleomap/animation.html Deep sea drilling sites where ocean crust ages are determined are red dots. Also:http://earthguide.ucsd.edu/eoc/teachers/t_tectonics/p_plate_reconstruction_blakey.html
PLATES 2009 Atlas of
Plate Reconstructions(750 Ma to Present Day)
By
Show UTA plate reconstruction ppt
2009, University of Texas Institute for Geophysics, May 4, 2009
By L.A. Lawver, I.W.D. Dalziel,
I.O. Norton and L.M. Gahaganhttp://www-
udc.ig.utexas.edu/external/plates/recons.htm#movies
Please reference as:Lawver, L.A., Dalziel, I.W.D., Norton, I.O., and Gahagan, L.M., 2009, The PLATES2009 Atlas of Plate Reconstructions (750 Ma to Present Day), PLATES Progress ReportNo. 325-0509, University of Texas Technical Report No. 196, 156 pp.
http://www-udc.ig.utexas.edu/external/plates/recons.htm
PDF of last 250 m.y. plate reconstruction available at:http://web.ics.purdue.edu/~braile/eas100/PLATES_Atlas.2009.Last.250.m.y.pdf
EAPS 10000 -001 Planet EarthProf. L. Braile
2271 HAMP, [email protected]
About every 4th or 5th person, please take a sheet of paper being passed out.
Exam I information and suggestions for study
Tuesday, Sept. 25, in class, Noon-1:15 p.m.
Continuation of Plate Tectonics:
Evidence for Plate tectonics
The Driving Mechanism for Plate Tectonics (What makes the plates move?)

10/20/2018
22
Composition of the Earth:
(How do we know what the Earth’s interior consists of?)
Quiz 3 – Cooperative Learning/Teamwork Exercise
1. Form groups of 4-5 students, elect a leader.2. Leader is responsible for:
a. Taking notes on blank paper; b. Be sure that all members of the group participate;g p p pc. Names of all students in group on paper; be sure to
print legibly!d. Hand in Notes (10 points per person) at end of class.
3. Questions for discussion: How do we know what the Earth’s interior consists of? What observations or evidence is there that allows us to infer the composition of the Earth’s interior? Discuss and list 4 observations in your notes.
Composition of the Earth:(How do we know what the Earth’s interior consists of?)
1. Composition (chemistry) of meteorites (iron; ratios of elements).
2. Average density of Earth ~5.2 g/cm3
(http://www.enchantedlearning.com/subjects/astronomy/planets/earth/Mass.shtml, http://www.scientificamerican.com/article.cfm?id=how-do-scientists-measure,
http://www.astronomyforbeginners.com/astronomy/howknow.php#massearth), the density of the crust and of surface rocks is much less, <~2.8 g/cm3, so the interior must be more dense.
3. Seismic wave velocity – compare observations of travel times through the Earth with laboratory measurements of different rock types; shows that rocks at depth have much higher velocities.
4. Mantle rock samples (xenoliths, brought to surface by volcanoes).
5. Exposures at the surface of deep crust and upper mantle rocks produced by geological processes.
6. Surface rocks (representative of Earth’s crust and for comparisonwith composition and properties [velocity, etc.] of deep Earth.
Evidence for Plate Tectonics:
1. Fit of the continents
2. Rock and fossil correlation across plate boundaries
(brief list; see also p. 143- 147; p. 158 – 164, text)
boundaries
3. Ocean age and depth increase away from mid-ocean ridges
4. Deep sea trenches at convergent boundaries
Evidence for Plate Tectonics (continued):
5. Earthquakes and volcanoes along plate boundaries
(brief list; see also p. 143- 147; p. 158 – 164, text)
6. Deep earthquakes in subducted lithospheric slab at convergent boundaries
7. Magnetic stripes parallel to mid-ocean ridges (divergent boundaries)
8. Hotspot tracks
1.Fit of the continents
Figure 5.3, text
1.Fit of the continents;continental drift
Figure 5.2, text

10/20/2018
23
1.Fit of the continents;
continental drift
Fi 5 29Figure 5.29, text
Break up of Pangaea
http://www.odsn.de/odsn/services/paleomap/animation.html Deep sea drilling sites where ocean crust ages are determined are red dots. Also:http://earthguide.ucsd.edu/eoc/teachers/t_tectonics/p_plate_reconstruction_blakey.html
2. Rock and fossil correlation across plate boundaries, Figure 5.4, text
2. Rock and fossil correlation across plate boundaries
Another image - Mesosaurus
2. Rock and fossil correlation across plate boundaries
also see Figure 5.4, text
2. Rock and fossil correlation across plate boundaries
Figure 5.6, text

10/20/2018
24
2. Rock and fossil correlation across plate boundaries
also see Figure 5.6, text
2. Rock and fossil correlation across plate boundaries (early Paleozoic glaciation) Figure 5.7, text
2. Rock and fossil correlation across plate boundaries (early Paleozoic glaciation) Figure 5.7, text
3. Ocean age and depth increase away from mid-ocean ridges
http://gdcinfo.agg.nrcan.gc.ca/app/agemap_e.html
3. Ocean age and depth increase away from mid-ocean ridges, Figure 9.15, text 4. Deep sea trenches at convergent
boundaries, Figure 5.13, text

10/20/2018
25
4. Deep sea trenches at convergent boundaries, (close-ups) and subduction model, Figure 5.13, text
5. Earthquakes and volcanoes along plate boundaries, Figure 6.16, text
5. Earthquakes and volcanoes along plate boundaries
http://www.minerals.si.edu/tdpmap/ (Interactive Map)
5. Earthquakes and volcanoes along plate boundaries
http://www.minerals.si.edu/tdpmap/ (Interactive Map)
5. Earthquakes and volcanoes along plate boundaries
http://www.minerals.si.edu/tdpmap/ (Interactive Map)
5. Earthquakes and volcanoes along plate boundaries, Figure 7.29, text

10/20/2018
26
Basaltic volcanism at mid-ocean ridges (melting of normal mantle)
5. Earthquakes and volcanoes along plate boundaries, Figure 7.30, text
Silicic (explosive, cone-shaped volcanoes) volcanism at convergent boundaries (melting of oceanic lithosphere and continental crust)
5. Earthquakes and volcanoes along plate boundaries, Figure 7.30, text
6. Deep
Figure 7.30
6. Deep earthquakes in subducted lithospheric slab at convergent boundaries (also see Fig. 6.16, text)
Earthquakes - Samoa Islands region 1960-2008 – Cross section diagram
Distance (km)
Dep
th (
km)
7. Magnetic stripes parallel to mid-ocean ridges (divergent b d i )boundaries). Due to reversals of the Earth’s magnetic field.Figure 5.28, text
7. Magnetic stripes parallel to mid-ocean ridges (divergent boundaries). Due to reversals of the Earth’s magnetic field.Figure 5.27, text

10/20/2018
27
7. Magnetic stripes parallel to mid-ocean ridges (divergent boundaries). Due to reversals of the Earth’s magnetic field.Figure 5.26, text
8. Hotspot tracks (like Hawaii)
Figure 5.22, text (age in millions of
years)
(like Hawaii) show direction of motion of the lithosphere over a hotspot (by age of volcanic activity)
http://www.minerals.si.edu/tdpmap/ (Interactive Map)
http://pubs.usgs.gov/imap/2800/
http://www.minerals.si.edu/tdpmap/ (Interactive Map)
Driving Mechanism for PLATE TECTONICS:(What makes the plates move?)
Heat from original heating of Earth and decay of radioactive elements (uranium, thorium, potassium, etc.) in Earth’s interior is ultimate cause; viable theories for the driving mechanism are:
(see also p. 164 – 167, text)
1. “Ridge Push” (seafloor spreading) – rising hot material at ridge crests (new lithosphere) pushesplates apart
2. “Slab Pull” – dense, older oceanic lithosphere in subducted slab sinks
3.Convection currents in hot, solid but soft, partially molten mantle (asthenosphere) convects
“Ridge Push” (sea floor spreading) and “Slab Pull” mechanisms
(also see Figure 5.27, text)

10/20/2018
28
“Convection Current” mechanism(also see Figure 5.28, text)
“Ridge Push” and “Slab Pull” mechanismsFigure 5.31, text
“Convection Current” mechanismsFigure 5.32, text
End of Material covered in Exam I
Continue with Earthquakes(below)( )
M6.3 South Island New Zealand Earthquake, Feb. 21, 2011
Some views of earthquake damage…
M6.3 South Island New Zealand Earthquake, Feb. 21, 2011

10/20/2018
29
M6.3 South Island New Zealand Earthquake, Feb. 21, 2011 M6.3 South Island New Zealand Earthquake, Feb. 21, 2011
M6.3 South Island New Zealand Earthquake, Feb. 21, 2011
More than 5000 people have died after a powerful 7.8 magnitude earthquake hit Nepal less than 50 miles (80 km) from the capital Kathmandu, with aftershocks continuing. (CNN.com, April 24, 2015)
More than 5000 people died after a powerful 7.8 magnitude earthquake hit Nepal less than 50 miles (80 km) from the capital Kathmandu, with aftershocks continuing. (CNN.com, April 24, 2015)
More than 5000 people died after a powerful 7.8 magnitude earthquake hit Nepal less than 50 miles (80 km) from the capital Kathmandu, with aftershocks continuing. (Yahoo.com, April 26, 2015)

10/20/2018
30
More than 5000 people died after a powerful 7.8 magnitude earthquake hit Nepal less than 50 miles (80 km) from the capital Kathmandu, with aftershocks continuing. (Yahoo.com, April 26, 2015)
More than 5000 people died after a powerful 7.8 magnitude earthquake hit Nepal less than 50 miles (80 km) from the capital Kathmandu, with aftershocks continuing. (Yahoo.com, April 26, 2015)
We also observed the importance of location of an earthquake (close or far from cities, etc.) and of quality of construction (related to resistance to earthquake shaking) in the M6.2, August 24, 2016, earthquake in Italy.
Fault scarp from 1915 earthquake in Nevada. Movement was down to the right continuing the formation of valley (“basin”) and ridge (“range”) topography of the Basin and Range
i th t
The fault line (scarp) in Pleasant Valley following its 1915 earthquake, its magnitude of 6.8 was the most power earthquake in Nevada's history (https://www.unr.edu/nevada-today/news/2017/great-nevada-shakeout-2017-x82075).
province that covers much of Utah and Nevada and adjacent areas.
Scarp
Earthquakes:Causes of earthquakes (elastic rebound
d b l i )caused by plate tectonics)Seismic wavesEarthquake locations and statisticsEarthquake hazards, effects, damage
EARTHQUAKES:
Sudden sliding (relative motion on two sides of fault plane) of fault which releases stored elastic energy (strain) and generates seismic waves (vibrations, ground motion) which propagate outward from the fault planepropagate outward from the fault plane
Occur mostly in narrow zones related to plate boundaries. Faults (and, therefore, earthquakes) are caused by plate motions (stored strain)

10/20/2018
31
Why care about earthquakes?
For perspective, food poisoning accounts for about 3000 fatalities per year in the U.S. (2011 estimate; http://www.cdc.gov/Features/dsFoodborneEstimates/); also, overdoses from prescription drugs kill about 45 people per day (CDC.gov).
Fatality statistics/probability of accidental deaths per year for common activities, and comparison with U.S. Earthquake fatalities
(see sources in Sunset magazine, June, 2012)Note mitigation – effect of wearing a helmet – about a factor of 5!
U S E th k : 9 b bilit i b t U.S. Earthquakes: average ~9 per year, so probability is about 1/30,000,000 (of course this is an average and will also depend on whether you live in N. Dakota or near the San Andreas fault!)Other relevant statistics: U.S. deaths from underage alcohol consumption total 4300 per year (http://www.cdc.gov/alcohol/fact-sheets/underage-drinking.htm). 2015 Opioid deaths: 20,101 overdose deaths related to prescription pain relievers, and 12,990 overdose deaths related to heroin. (https://www.asam.org/docs/default-source/advocacy/opioid-addiction-disease-facts-figures.pdf)
10/20/2018
32
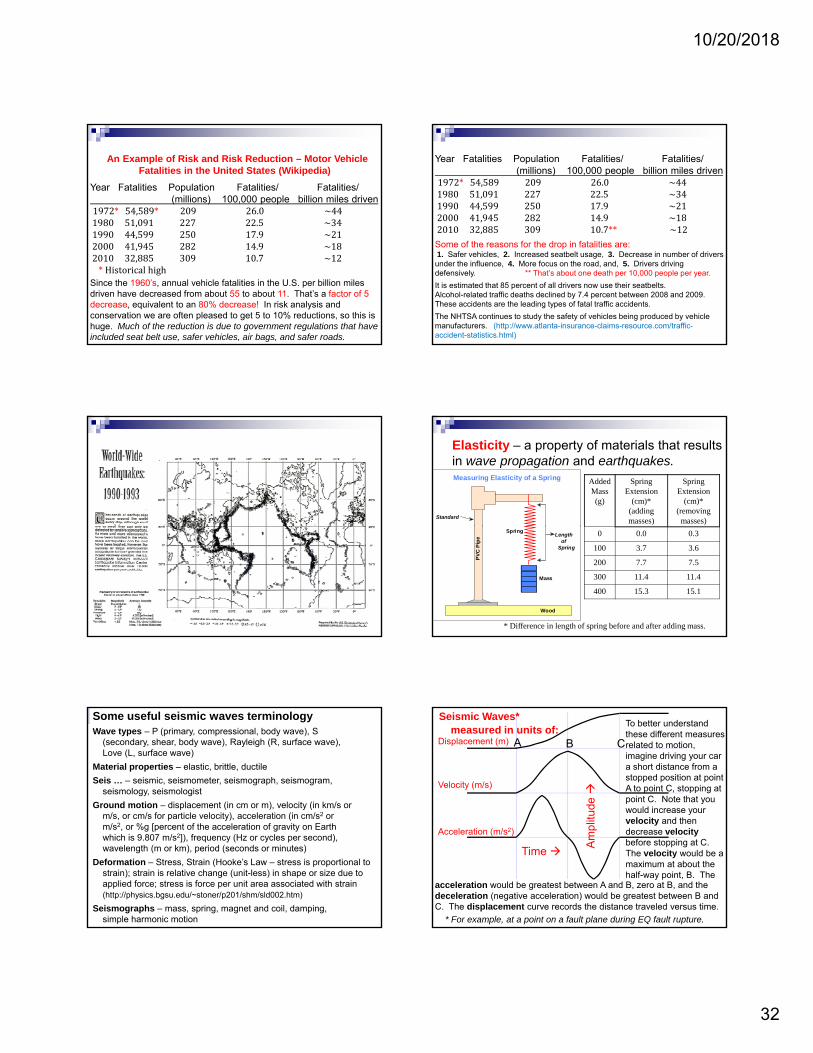
An Example of Risk and Risk Reduction – Motor Vehicle Fatalities in the United States (Wikipedia)
Year Fatalities Population Fatalities/ Fatalities/(millions) 100,000 people billion miles driven
1972* 54,589* 20926.0~44198051,09122722.5~341990 44 599 250 17 9 ~21199044,59925017.9~21200041,94528214.9~18201032,88530910.7~12* Historicalhigh
Since the 1960’s, annual vehicle fatalities in the U.S. per billion miles driven have decreased from about 55 to about 11. That’s a factor of 5 decrease, equivalent to an 80% decrease! In risk analysis and conservation we are often pleased to get 5 to 10% reductions, so this is huge. Much of the reduction is due to government regulations that have included seat belt use, safer vehicles, air bags, and safer roads.
Year Fatalities Population Fatalities/ Fatalities/(millions) 100,000 people billion miles driven
1972* 54,58920926.0 ~44198051,09122722.5~34199044,59925017.9~21200041,94528214.9~18201032,88530910.7** ~12
Some of the reasons for the drop in fatalities are: 1. Safer vehicles, 2. Increased seatbelt usage, 3. Decrease in number of drivers under the influence, 4. More focus on the road, and, 5. Drivers driving defensively. ** That’s about one death per 10,000 people per year.
It is estimated that 85 percent of all drivers now use their seatbelts. Alcohol-related traffic deaths declined by 7.4 percent between 2008 and 2009. These accidents are the leading types of fatal traffic accidents.
The NHTSA continues to study the safety of vehicles being produced by vehicle manufacturers. (http://www.atlanta-insurance-claims-resource.com/traffic-accident-statistics.html)
Standard
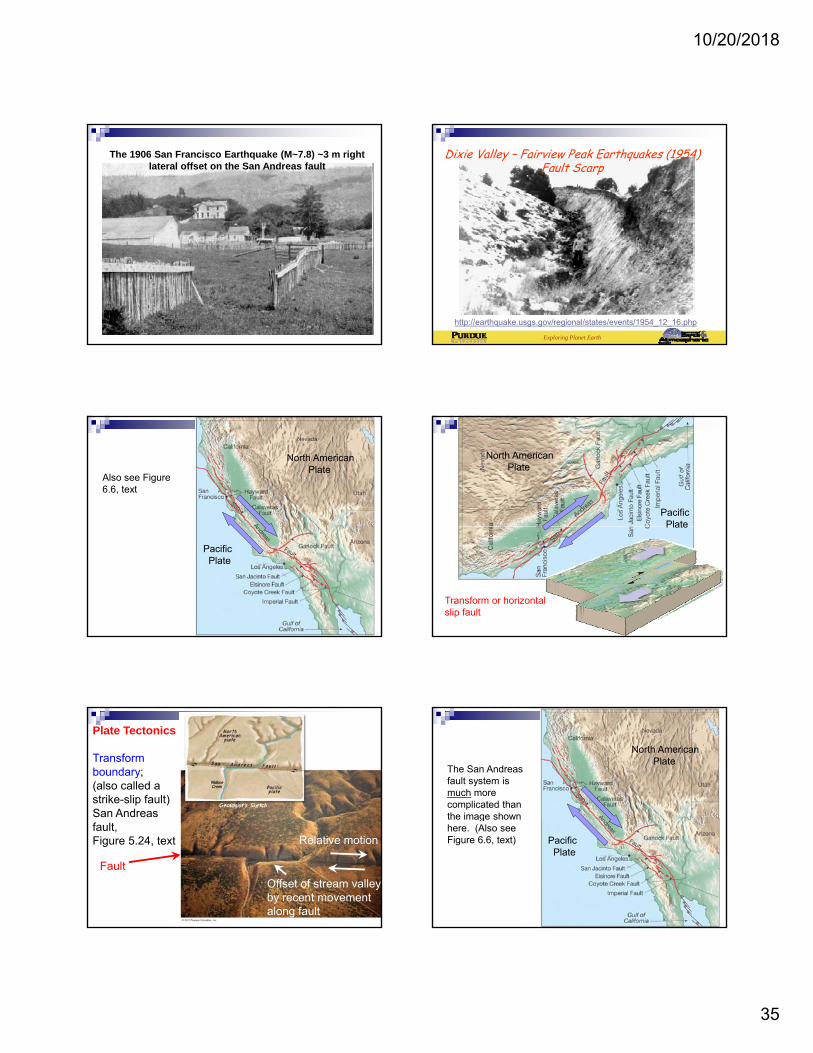
Measuring Elasticity of a Spring Added Mass (g)
Spring Extension
(cm)*(adding masses)
Spring Extension
(cm)*(removing
masses)
Elasticity – a property of materials that resultsin wave propagation and earthquakes.
Wood
PV
C P
ipe
Mass
SpringLength of Spring
0 0.0 0.3
100 3.7 3.6
200 7.7 7.5
300 11.4 11.4
400 15.3 15.1
* Difference in length of spring before and after adding mass.
Some useful seismic waves terminologyWave types – P (primary, compressional, body wave), S
(secondary, shear, body wave), Rayleigh (R, surface wave), Love (L, surface wave)
Material properties – elastic, brittle, ductile
Seis … – seismic, seismometer, seismograph, seismogram, seismology, seismologist
Ground motion – displacement (in cm or m), velocity (in km/s or m/s or cm/s for particle velocity) acceleration (in cm/s2 orm/s, or cm/s for particle velocity), acceleration (in cm/s or m/s2, or %g [percent of the acceleration of gravity on Earth which is 9.807 m/s2]), frequency (Hz or cycles per second), wavelength (m or km), period (seconds or minutes)
Deformation – Stress, Strain (Hooke’s Law – stress is proportional to strain); strain is relative change (unit-less) in shape or size due to applied force; stress is force per unit area associated with strain(http://physics.bgsu.edu/~stoner/p201/shm/sld002.htm)
Seismographs – mass, spring, magnet and coil, damping, simple harmonic motion
Seismic Waves* measured in units of:
Displacement (m)
Velocity (m/s)
A CB
To better understand these different measures related to motion, imagine driving your car a short distance from a stopped position at point A to point C, stopping at point C. Note that you would increase your
l it d thtude
Time
Acceleration (m/s2)
* For example, at a point on a fault plane during EQ fault rupture.
velocity and then decrease velocitybefore stopping at C. The velocity would be a maximum at about the half-way point, B. The
acceleration would be greatest between A and B, zero at B, and the deceleration (negative acceleration) would be greatest between B and C. The displacement curve records the distance traveled versus time.
Am
plit

10/20/2018
33
We may be most familiar with acceleration from riding in a roller coaster. Near the bottom of the hill (below left), we feel an increased downward force (equivalent to increased acceleration of gravity). Near the top of the hill, we may feel weightless or even lift off the seat, being held in the seat by the car’s restraining bar.
The Accelerometer phone app (there are many, this one is Accelerometer Analyzer) shows horizontal (left-right, then up-down) acceleration, then vertical (perpendicular to the screen) acceleration signals. http://web.ics.purdue.edu/~braile/new/Accelerometer.avi
Why care about earthquakes?
10
12
14
16
gin
al l
en
gth
, cm
)
Elasticity of a Spring
Adding mass:
Removing mass:
0 50 100 150 200 250 300 350 4000
2
4
6
8
Added Mass (grams)
Str
etc
hin
g (
len
gth
- o
ri
1. Deformation (stretching) isproportional to applied force (mass).
2. Spring returns to its original shape(length) when force is removed.
Elasticity (spring, rubber band, rocks)
Elastic Materials(straight line)
ng
(D
efo
rmat
ion
) Weak elastic materials (easily deformed)
Weight (force)(if force is removed, material returns to its original shape)
Str
etch
in
Key words: elastic, brittle, ductile
Strong elastic materials, like most rocks (requires large force to deform)
Click on slide to start video
Illustration of elasticity of a rock – in this case two strips of granite tile securely clamped together at one end with a thin metal spacer between the strips at that end (left). The granite tile is very hard and rigid, but can be bent, although bending too much will cause it to break (as most rocks are brittle at low temperatures). Note in the video, that when the granite tile strips are squeezed together and then released, they return to their original position because the granite is elastic, although much stronger (higher coefficient of elasticity) than materials such as rubber bands, springs, plastic, and wood that can be bent or stretched easily. Video File: http://web.ics.purdue.edu/~braile/new/ElasticRebound.avi
Elastic Rebound TheoryDiscovered by analysis of the fault motion and
deformation before and during the 1906 San Francisco earthquake (before plate tectonics theory).
Theory is consistent with plate tectonics, in fact, it explains how the slow motions of the plates can result in the rapid slip along a fault to produce an earthquake.

10/20/2018
34
Elastic Rebound TheoryDiscovered by analysis of the fault motion and
deformation before and during the 1906 San Francisco earthquake (before plate tectonics theory).
Theory is consistent with plate tectonics, in fact, it explains how the slow motions of the plates can result in the rapid slip along a fault to produce an earthquake.
Elastic Rebound(also see Fig. 6.5,text)
Slow build-up of deformation (strain, bending) in thebending) in the rocks by plate motions. Strain (energy) is released (restoring force in elasticity) suddenly as fault slips (ruptures; earthquake!).
Foam model illustrating elastic rebound concept – imagine looking down on the San Andreas fault. Over a long period of time, the plates (Pacific plate on left and N. American plate on right); move at about 4 cm/yr (relative motion). View the left and right edges of the foam as about 100 km away from the fault. Note the deformation of the plate, sudden slip (elastic rebound), and both small and large ruptures (earthquakes).Video File: http://web.ics.purdue.edu/~braile/new/FoamRebound.aviAlso see: http://web.ics.purdue.edu/~braile/edumod/foammod/foammod.htm
Elastic Rebound
Slow build-up of deformation (strain, bending) in the rocks by plate motions. Strainmotions. Strain (energy) is released (restoring force in elasticity) suddenly as fault slips (ruptures; earthquake).
Figure 6.5 text.
Elastic Rebound
Slow build-up of deformation (strain, bending) in the rocks by plate motions Strainmotions. Strain (energy) is released (restoring force in elasticity) suddenly as fault slips (ruptures; earthquake!).
Elastic ReboundSlow build-up of deformation (strain, bending) in the rocks by plate motions. Strain (energy) is(energy) is released (restoring force in elasticity) suddenly as fault slips (ruptures; earthquake!).
10/20/2018
35
The 1906 San Francisco Earthquake (M~7.8) ~3 m right lateral offset on the San Andreas fault
Dixie Valley – Fairview Peak Earthquakes (1954)Fault Scarp
Exploring Planet Earth
http://earthquake.usgs.gov/regional/states/events/1954_12_16.php
North AmericanPlate
Also see Figure 6.6, text
PacificPlate
North AmericanPlate
PacificPlatePlate
Transform or horizontal slip fault
Plate Tectonics
Transform boundary;(also called a strike-slip fault)San Andreas fault,Figure 5.24, text
Fault
Offset of stream valley by recent movement along fault
Relative motion
North AmericanPlate
The San Andreas fault system is much more complicated than the image shown
PacificPlate
the image shown here. (Also see Figure 6.6, text)

10/20/2018
36
The San Andreas fault system is much more complicated than the image shown on the previous slide. Thirty days small magnitude earthquake activity, San Bernardino and Palm Springs area. (from temblor.net Feb. 10, 2017)
10 km
The San Andreas fault system is much more complicated than the image shown on the earlier slide. Thirty days of earthquake activity, Los Angeles area. (from temblor.net Feb. 10, 2017)
20 km
The San Andreas fault system is much more complicated than the image shown on the earlier slide. Thirty days of earthquake activity, San Jose area. (from temblor.net Feb. 16, 2017)
Earthquakes (orange dots) and faults (thin black lines) in the San Francisco Bay area.
EAPS 100 – Planet EarthProf. L. Braile2271 CIVL, [email protected]
Earthquakes:Causes of earthquakes (elastic rebound
d b l i )caused by plate tectonics)Seismic wavesEarthquake locations and statisticsEarthquake hazards, effects, damage

10/20/2018
37
San Andreas faultNotice correlation of
Hayward fault
Notice correlation of faults with topographic features (ridges and valleys). Although the fault motion is primarily horizontal (strike-slip), there is also some vertical displacement.
Hayward fault at the U. C. Berkeley football stadium
Earthquake Focus and Epicenter Figure 6.2, text
Blind Thrust Fault Earthquake Rupture Animation (Northridge, 1994)Brad Aagaard, USGS
http://pasadena.wr.usgs.gov/office/baagaard/research/animations/animations.htmlThe fault rupture will be visible in the animation. Displacements (magnified 3000
times) will be visible by the movement of the mesh from the model. The amplitude of motions and seismic waves is color coded according to ground velocity.
Note the rupture along the fault over time from the deepest extent of the fault.
In the following slide (animation), we see the displacement(exaggerated so it is visible at this
l ) i th t f th
http://web.ics.purdue.edu/~braile/new/AagaardBlindThrustAnimation.ppt , Also: http://web.ics.purdue.edu/~braile/edumod/tsunami/BlindThrustSlice.gif
scale) in the movement of the mesh that was used for the computer program calculations. The color code indicates the particle velocity amplitudes (in m/s) of the seismic waves that are generated by the fault rupture.

10/20/2018
38
Blind Thrust Fault Earthquake Rupture Animation – Brad Aagaard, USGShttp://profile.usgs.gov/baagaard
The fault rupture will be visible in the animation. Displacements (magnified 3000 times) will be visible by the movement of the mesh from the model. The amplitude
of seismic waves is color coded according to ground velocity.
http://pasadena.wr.usgs.gov/office/baagaard/research/animations/animations.html
Note: Maximum ground motion (displacement and velocity) is located in the area above the fault (waves and rupture propagate upwards) and continues to propagate to larger distances.
http://pasadena.wr.usgs.gov/office/baagaard/research/animations/animations.html
Note: Rupture motion along fault – upper surface moves up and to left, lower surface moves down and to the right
Magnitude of earthquake is controlled by fault length that ruptures (data for diagram generated using Seismic/Eruption program)
1000
10000
km
)
Magnitude versus fault length (determined from aftershock zonelength) for various earthquakes (Alaska
Alaska, 1964
Sumatra, 2004
Magnitude versus fault length
10
100
6 7 8 9 10
Magnitude
Fa
ult
Le
ng
th ( earthquakes (Alaska,
1964; Sumatra, 2004; Denali, 2002; Landers, 1992; Loma Prieta, 1989; Northridge, 1994, etc.). Results were quickly obtained using Seismic/Eruption views.
Denali, 2002
Landers, 1992
Northridge, 1994
Loma Prieta, 1989
Earthquakes generate P, S and Surface waves (different velocity of propagation and different vibration pattern for the three wave types).
Seismic waves (P, S, Rayleigh Love) can beRayleigh, Love) can be
demonstrated using the slinky.
Wave animations
Animation courtesy of Dr Dan Russell Kettering UniversityAnimation courtesy of Dr. Dan Russell, Kettering University
http://www.kettering.edu/~drussell/demos.html
Seismic Wave animations(Developed by L. Braile)
http://www.eas.purdue.edu/~braile/edumod/waves/WaveDemo.htm

10/20/2018
39
Dan Russell animations – The people wave
Animation courtesy of Dr. Dan Russell, Kettering University
http://www.kettering.edu/~drussell/demos.html
Dan Russell animations – A wave pulse (P-wave)
Animation courtesy of Dr. Dan Russell, Kettering University
http://www.kettering.edu/~drussell/demos.html
Dan Russell animations –Transverse wave (S-wave)
Animation courtesy of Dr. Dan Russell, Kettering University
http://www.kettering.edu/~drussell/demos.html
Dan Russell animations – Rayleigh wave
Animation courtesy of Dr. Dan Russell, Kettering University
http://www.kettering.edu/~drussell/demos.html
http://www.eas.purdue.edu/~braile/edumod/waves/WaveDemo.htm
Compressional Wave (P-Wave) Animation
Deformation propagates. Particle motion consists of alternatingcompression and dilation. Particle motion is parallel to the direction of propagation (longitudinal). Material returns to its original shape after wave passes.

10/20/2018
40
Shear Wave (S-Wave) Animation
Deformation propagates. Particle motion consists of alternating transverse motion. Particle motion is perpendicular to the direction of propagation (transverse). Transverse particle motion shown here is vertical but can be in any direction. However, Earth’s layers tend to cause mostly vertical (SV; in the vertical plane) or horizontal (SH) shear motions. Material returns to its original shape after wave passes.
Rayleigh Wave (R-Wave) Animation
Deformation propagates. Particle motion consists of elliptical motions (generally retrograde elliptical) in the vertical plane and parallel to the direction of propagation. Amplitude decreases with depth. Material returns to its original shape after wave passes.
Love Wave (L-Wave) Animation
Deformation propagates. Particle motion consists of alternating transverse motions. Particle motion is horizontal and perpendicular to the direction of propagation (transverse). To aid in seeing that the particle motion is purely horizontal, focus on the Y axis (red line) as the wave propagates through it. Amplitude decreases with depth. Material returns to its original shape after wave passes.
Slinky and Elastic Rebound Demos

10/20/2018
41
Waves spread out in circular pattern and the amplitudes become smaller with time (conservation of energy)
Seismogram for a distant earthquake
P-wave S-wave
Surface waves
Time
Firstarrival
WLIN AS-1 Seismograph 24-hr Record Feb. 27-28, 2011 – M4.7 Arkansas Earthquake
WLIN 24-hr Record Updated Every 10 minutes – Online at:http://www.iris.edu/amaseis/schools/as1imgs/WLIN.png
Epicenter
WLIN AS-1 Seismogram – Feb. 28, 2011 M4.7 Arkansas Earthquake
P-waveS-wave
Lg (crustal guided, ~1.5 s period) wave
Earthquake: 35.265°N, 92.344°W, 05:00:50 GMT, Feb. 28, 2011, Epicenter to WLIN Distance = 7.09 degrees (788 km)
Where do earthquakes occur?
We’ll look at the IRIS Seismic Monitor to see an online map of recent earthquakes (updated every 10 minutes; www.iris.edu)
and, the free Windows software Seismic/Eruption to i lti l th k ti it d thview multiple earthquake activity maps and other
diagrams that can be used to study earthquake and volcanic eruption activity globally or locally
http://bingweb.binghamton.edu/~ajones/
Another very useful earthquake plotting and analysis tool is the IRIS Earthquake Browser: http://ds.iris.edu/ieb/

10/20/2018
42
http://ds.iris.edu/seismon/?http://uxblog.idvsolutions.com/2012/06/earthquakes-since-1898.html
WLIN AS-1 Seismograph 24-hour screen display for August 15-16, 2007 Earthquakes and topography. Intermediate and deep focus
earthquakes in subducted slabs along convergent margins. Convergent margins can have “megathrust” earthquakes that produce tsunamis.
Note shallow EQs along mid ocean ridges (MOR), rifts, and transform faults
Note shallow to deep EQs at subduction zones
MOR
Rift

10/20/2018
43
Seismic/Eruption includes up-to-date earthquake and volcanic eruption catalogs and allows the user to display earthquake and volcanic eruption activity in “speeded up real time” on global, regional or local maps that also show the topography of
the area in a shaded relief map image. Seismic/Eruption is an interactive program that
Viewing Earthquake Activity
includes a number of tools that allow the user to analyze earthquake and volcanic eruption data and produce effective displays to illustrate seismicity and volcano patterns.
http://bingweb.binghamton.edu/~ajones/http://web.ics.purdue.edu/~braile/edumod/svintro/svintro.htm
Creating a cross-section view (upper left to lower right in map view to the left) of earthquake locations with Seismic/Eruption – Kuril and Kamchatka area
NW
Map View (dots for shallow EQs are red, deepest EQs yellow)
Cross-sectionView
Shows northwest-dipping, subducted lithospheric slab
NW
The 1906 San Francisco Earthquake (M~7.8) San Andreas fault at Earthquake park near Tomales Bay
(road to Point Reyes)http://www.seed.slb.com/en/scictr/watch/seismology/pt_reyes.htm
1906Today
http://earthquake.usgs.gov/regional/nca/1906/18april/index.php
http://earthquake.usgs.gov/regional/nca/1906/18april/images/sf06.city.html
San AndreasFault
Note offset stream channels

10/20/2018
44
San Andreas Fault – A Right-Lateral Strike-Slip FaultWhat is the relative motion?Why is it called right-lateral?
Orange Grove and San Andreas FaultAlso see Figure 6.4, text
The 1906 San Francisco Earthquake (M~7.8) San Francisco after the Earthquake and fire.
From National Geographic Probability of Earthquakes in California (http://pubs.usgs.gov/fs/2008/3027/fs2008-3027.pdf)
Earthquake Magnitude and Intensity:
MAGNITUDE:
--Measure of the ENERGY released in the earthquake.
--Logarithmic scale -- M = 6 is ten times greater vibration than M = 5 (at the same distance).
-- no longer “Richter” magnitude! (just Magnitude or M)
-- Not a 1 to 10 scale. Microearthquakes may have negative magnitude (but not negative energy); largest observed
it d 9 5 b bl bmagnitude 9.5, probably because of finite strength of rocks.
INTENSITY
-- I to XII (Roman numerals) scale, measure strength of ground vibration at a location.

10/20/2018
45
I. Instrumental Not felt by many people unless in favorable conditions.
II. FeebleFelt only by a few people at best, especially on the upper floors of buildings. Delicately suspended objects may swing.
III. Slight
Felt quite noticeably by people indoors, especially on the upper floors of buildings. Many do not recognize it as an earthquake. Standing motor cars may rock slightly. Vibration similar to the passing of a truck. Duration estimated.Felt indoors by many people, outdoors by few people d i th d At i ht k d Di h
Modified Mercalli Intensity Scale
IV. Moderateduring the day. At night, some awakened. Dishes, windows, doors disturbed; walls make cracking sound. Sensation like heavy truck striking building. Standing motor cars rock noticeably. Dishes and windows rattle alarmingly.
V. Rather Strong
Felt outside by most, may not be felt by some outside in non-favorable conditions. Dishes and windows may break and large bells will ring. Vibrations like large train passing close to house.
VI. Strong
Felt by all; many frightened and run outdoors, walk unsteadily. Windows, dishes, glassware broken; books fall off shelves; some heavy furniture moved or overturned; a few instances of fallen plaster. Damage slight.
VII. Very Strong
Difficult to stand; furniture broken; damage negligible in building of good design and construction; slight to moderate in well-built ordinary structures; considerable damage in poorly built or badly designed structures; some chimneys broken. Noticed by people driving motor cars.
VIII. Destructive
Damage slight in specially designed structures; considerable in ordinary substantial buildings with partial collapse. Damage great in poorly built structures. Fall of chimneys, factory stacks, columns, monuments, walls. Heavy furniture moved.General panic; damage considerable in specially designed structures well designed frame structures thrown out of
IX. Ruinousstructures, well designed frame structures thrown out of plumb. Damage great in substantial buildings, with partial collapse. Buildings shifted off foundations.
X. DisastrousSome well built wooden structures destroyed; most masonry and frame structures destroyed with foundation. Rails bent.
XI. Very DisastrousFew, if any masonry structures remain standing. Bridges destroyed. Rails bent greatly.
XII. Catastrophic
Total damage - Almost everything is destroyed. Lines of sight and level distorted. Objects thrown into the air. The ground moves in waves or ripples. Large amounts of rock may move position.
Effects of Magnitudeand Distance
Data from: http://earthquake.usgs.gov/earthquakes/eqarchives/year/eqstats.php
How many M6+ earthquakes do we expect each year worldwide? How
M8+?many M8+?~150
Because S-waves travel slower than P-waves and the difference between the S- and P-wave arrival times (the S minus P time) is proportional totime) is proportional to distance, the S minus P time for an earthquake can be used to determine the distance from the station to the earthquake. Figure 6.14, text.

10/20/2018
46
S minus P times and calculated distances from 3 stations can be used to “triangulate” and determine the location of the epicenter. Figure 6.15, text.
Seismic wave amplitudes decrease with distance.
Seismogram plotted at same scale
The S and Surface wave arrivals are usually larger than the P waves and are therefore responsible for more damage.
Up Motion
N-S Motion
The horizontal directions of ground shaking are often significantly larger than the verticaln
= 9
80 c
m/s
/s
E-W Motion
than the vertical direction due to the motion of shear and surface waves. Also note duration of strong shaking.
Accelerograms from ~7.3 km from Northridge epicenter
1 g
of a
ccel
erat
ion
Liquefaction (where the solid ground takes on liquid qualities due to high fluid pressure, usually in saturated sand and earthquake vibration) causes distortion of buildings and damage to buried cables, water and sewage pipes. Sand blows are characteristic evidence that liquefaction has occurred.
Liquefaction occurs (and sand blows are formed) when the soft sandy soil
Sand blow created during the M7.0 New Zealand
Earthquake
New Zealand Herald-Photo / Georgia Galloway
when the soft, sandy soil shakes forcing liquefied sand to the surface causing heavy roads or whatever is on the surface to sink
USGS
Bay area shaking amplification (red is greatest amplification) and population density (right, 1000’s of people per sq. km) maps

10/20/2018
47
EAPS 10000-001 – Planet EarthProf. L. Braile2271 HAMP (CIVL), [email protected]
Hw 3 papers, due Oct. 23
Today: Completion of Earthquakes, begin Volcanoes
8th Edition, 2017
Exam I grading is almost finished, I will send an email to all when scores are posted, with info.
Exam II is Thur., Nov. 1, in class
Final Exam Schedule: Sat., 12/15, 1:00 – 3:00 p.m., EE 129 (will also schedule [later] somesessions earlier in finals week, for sign-up only)
NASA and Purdue astronaut, Drew Feustel, landed back on Earth this morning (10/04/2018) at about 7:45 a.m. EDT. NASA video of descent and landing on Soyuz MS-08: https://www.youtube.com/watch?v=pxaX7CtdGAg or https://www.youtube.com/watch?v=GWusG5EW3dU
Purdue Today Article (10/4/2018):https://www purdue edu/newsroom/https://www.purdue.edu/newsroom/releases/2018/Q4/astronaut-feustel-scheduled-to-return-to-earth-on-thursday.html
https://www.purdue.edu/newsroom/releases/2018/Q4/astronaut-feustel-scheduled-to-return-to-earth-on-thursday.html
Evaluating the Earthquake Hazard (two main factors* – how large?; how far away? Also, when will it happen?):
1.Frequency of occurrence-- Earthquake statistics --
a probability estimate
How is it estimated?
*Of course, as we have already seen, the quality of
buildings is also very important
-- Paleoseismology – useful for extending historical record for large magnitude (infrequent) events
-- Earthquake Prediction (currently not reliable)
Search for premonitory effects
Prediction implies accurate time,p ,
location, magnitude and scientific basis
-- Forecasting (from frequency-magnitude graphs is much more reliable but much less precise), such as, “the San Francisco bay area has a 63% chance of a 6.7 or grater earthquake occurring in the next 30 years.”
(http://earthquake.usgs.gov/regional/nca/ucerf/)
2. Location
-- Distance to known or expected seismic sources (fault zones)
-- Expected magnitude and attenuation rate (gives expected intensity at location
3 L l it ff t3. Local site effects
-- Possible amplification of shaking caused by liquefaction or thick layers of low-density sedimentary rocks or sediments
4. Building characteristics
-- Earthquake resistant structures

10/20/2018
48
Timeline of Shaking in the San Francisco Bay area1.7 seconds: Shaking starts on western edge of the city of San Francisco.
http://earthquake.usgs.gov/regional/nca/1906/simulations/
Timeline of Shaking in the San Francisco Bay area1.7 seconds: Shaking starts on western edge of the city of San Francisco.
Santa Rosa
NorthwestSan Andreas Fault
Timeline of Shaking in the San Francisco Bay area2.6 seconds: Strong shaking begins on western edge of San Francisco.
Timeline of Shaking in the San Francisco Bay area3.4 seconds: Strong shaking begins at San Francisco City Hall.
Timeline of Shaking in the San Francisco Bay area4.9 seconds: Shaking begins in the city of Oakland.
Timeline of Shaking in the San Francisco Bay area6.2 seconds: Strong shaking begins in the city of Oakland.
10/20/2018
49
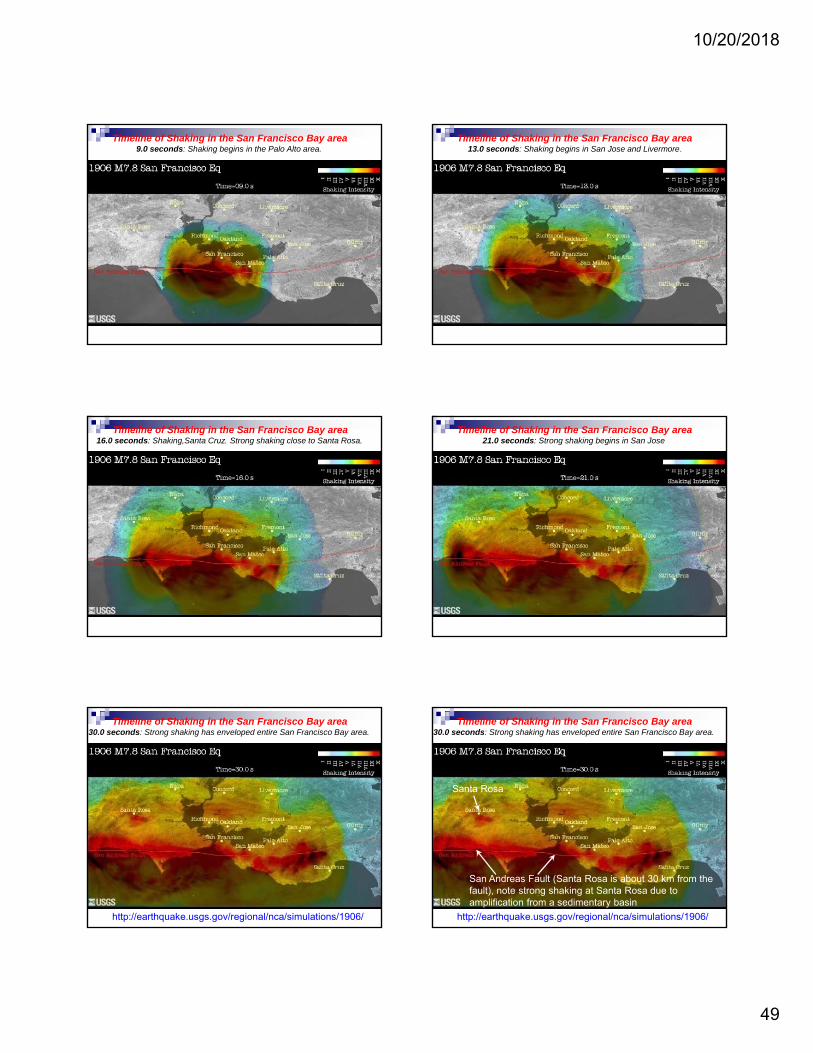
Timeline of Shaking in the San Francisco Bay area9.0 seconds: Shaking begins in the Palo Alto area.
Timeline of Shaking in the San Francisco Bay area13.0 seconds: Shaking begins in San Jose and Livermore.
Timeline of Shaking in the San Francisco Bay area16.0 seconds: Shaking,Santa Cruz. Strong shaking close to Santa Rosa.
Timeline of Shaking in the San Francisco Bay area21.0 seconds: Strong shaking begins in San Jose
Timeline of Shaking in the San Francisco Bay area30.0 seconds: Strong shaking has enveloped entire San Francisco Bay area.
http://earthquake.usgs.gov/regional/nca/simulations/1906/
Timeline of Shaking in the San Francisco Bay area30.0 seconds: Strong shaking has enveloped entire San Francisco Bay area.
Santa Rosa
http://earthquake.usgs.gov/regional/nca/simulations/1906/
San Andreas Fault (Santa Rosa is about 30 km from the fault), note strong shaking at Santa Rosa due to amplification from a sedimentary basin

10/20/2018
50
1906 San Francisco earthquake damage at Santa Rosa, CA; there were about 7000 people living in Santa Rosa in 1906 – today, there are about 172,000. http://geomaps.wr.usgs.gov/sfgeo/quaternary/stories/santarosa_damage.html
San Francisco Bay area major faults and probability of M6.7+ earthquake in the next 30 years
150th Anniversary of the150th Anniversary of the Damaging 1868 Hayward Earthquake:Why It Matters and How We Can Prepare for Its Repeatby Tom Brocher, USGS Research Geophysicist online.wr.usgs.gov/calendar/.
Earthquake Hazards - Modes of Building FailureConnections between failure modes observed in shake table testing of models in building contest and earthquake damage to actual buildings
L. Braile, Purdue University, October 2013 (for additional information and sources see EQ Hazards and Photos links at: http://www.eas.purdue.edu/~braile/indexlinks/educ.htm)
Intensity of shaking decreases with distance from epicenter p(MM Intensity scale).
M6.8, 1994 Northridge, California earthquake
Intensity of shaking decreases with distance from epicenter (Peak horizontal acceleration).
M6.7, 1994 Northridge, California earthquake
Intensity of shaking decreases with distance from epicenter (star; USGS(star; USGS Shake Map).
M6.7, 1994 Northridge, California earthquake

10/20/2018
51
Soft first story failure
The Oct., 1989 Loma Prieta Earthquake (M7.0) Earthquake damage.
Soft first story failure
The Oct., 1989 Loma Prieta Earthquake (M7.0) Earthquake damage.
Soft first story failure
The Jan., 1994 Northridge Earthquake (M6.7) Earthquake damage.
The October, 1989 Loma Prieta Earthquake (M7.0) Earthquake damage.
Olive View Hospital, 1971 San Fernando Earthquake
Olive View Hospital, 1971 San Fernando Earthquake

10/20/2018
52
Weak story failure, Kobe, 19951995
Building shifted off foundation
The Oct., 1989 Loma Prieta Earthquake (M7.0) Earthquake damage.
Column failure
The Oct., 1989 Loma Prieta Earthquake (M7.0) Earthquake damage.
Bending
The Jan., 1994 Northridge Earthquake (M6.7) Earthquake damage.
Bending
Inadequate connection to uprights
The Jan., 1994 Northridge Earthquake (M6.7) Earthquake damage.

10/20/2018
53
High center of mass, resonance Falling objects
The Oct., 1989 Loma Prieta Earthquake (M7.0) Earthquake damage.
Falling objects,partial wall collapse
Falling objects, partial wall collapse
The Jan., 1994 Northridge Earthquake (M6.7) Earthquake damage.
1933 Long Beach Earthquake (~M6.4)
Exploring Planet Earth
Jefferson Jr. HShttp://www.data.scec.org/chrono_index/longbeac.html
Liquefaction, ground failure

10/20/2018
54
Liquefaction, ground failure Liquefaction, ground failure
Un-reinforced masonry
(Bam, Iran earthquake, 2003, photo from USGS)
Dec. 26, 2003M6.6 Earthquake,Bam, m,Iran,~80% of buildingsdestroyed
1985 MEXICO EARTHQUAKE: CRITICAL STRUCTURES--HOSPITALS
1985 MEXICO EARTHQUAKE: CRITICAL STRUCTURES--HOSPITALS
“Pancaking” Intensity (areas of damage) for Landers 1992 (M7.3) and New Madrid 1811 (M7.3) earthquakes
Note the much larger area of strong shaking in the central and eastern U.S. This is the result of very efficient
http://pasadena.wr.usgs.gov/office/hough/page.nm.html
ywave propagation due to older, cooler lithosphere.

10/20/2018
55
Sand Blows (white spots; sand “volcanoes”; liquefaction effects) in the bootheel area of SE Missouri fromSE Missouri from the 1811-1812 New Madrid earthquakes. Photo taken in 1953.
~ 1 km
New Madrid earthquakes (1974-1994) and gravity map. Bright colors are higher than normal gravity and indicate relatively dense rocks beneath the surface (but not rightsurface (but not right below the surface because we know that there are relatively thick Mississippi River sediments at the surface).
Geologic model of the New Madrid seismic zone and buried ancient riftancient rift.
Geologic model of the New Madrid seismic zone and buried ancient rift.
Comparison of Frequency Magnitude Plots
100
1000
10000
hq
ua
ke
s G
reat
er
o M
196
0 -
2003
Japan
Alaska
Pacific NW
N. California
S. California
New Madrid
Research on Earthquake probability
Different areas have different recurrence relationships indicating different probability of
Highest probability
1
10
100
3 3.5 4 4.5 5 5.5 6 6.5 7 7.5 8
Magnitude (M)
Nu
mb
er o
f E
arth
than
or
Eq
ual
to
44 years of EQ data
~1 M5.5+ in 44 yr
~6 M8+ in 44 yr
probability of earthquakes

10/20/2018
56
Reducing the Earthquake Hazard:1. Before
-- Know what to do in case of an earthquake-- Make home/office safer-- Have disaster supplies
2. During-- If indoors stay thereIf indoors, stay there-- Take cover (desk or table)-- If outdoors, stay there, move to open area
3. After-- Check utilities, especially gas lines-- Be prepared for aftershocks
(evacuate weakened structures)
VOLCANIC ROCK SAMPLES*:BASALT - - Hawaii, (dark, fine grain, Fe and Mg rich,
low SiO2, 3.0 g/cm3 density)
BASALT - - “aa”, Craters of the Moon, Idaho
RHYOLITE [or ANDESITE, named for Andes Mountains] - - Mt. St. Helens, (lighter color, fine
3grain, high SiO2 (note quartz crystals) 2.7 g/cm3
density)
PUMICE - - Mt. St. Helens
OBSIDIAN - - Volcanic glass
VOLCANIC ASH - - Mt. St. Helens May 18, 1980 eruption
*Shown in class last Thursday
Rhyolite, Basalt, Craters of theBasalt, Hawaii Mt. St Helens Moon, Idaho
Obsidian, OR Pumice and Volcanic Ash Mt. St Helens
VOLCANOES:
1. Importance in Earth history
-- Building of continental crust and differentiation of the Earthdifferentiation of the Earth
-- Development of the atmosphere
-- Deposition of ore minerals
2. Relationship to Plate Tectonics-- Mid-ocean ridges and rifts – mostly basaltic
volcanism (fluid flows)
-- Island arcs, subduction zones – mostlyrhyolite/andesite volcanism (explosive)
-- OTHER (less important)
-- Hotspots (Hawaii)
-- Plateau basalts

10/20/2018
57
Two major types of volcanism (also see Figure 7.3 in text [Table 7.1 in previous edditions; not correct in 2008 and 2005 editions]):
BASALTIC RHYOLITE - ANDESITE
low SiO2 50%density 3 g/cm3
shield volcanoes
high SiO2 70%density 2.7 g/cm3
composite volcanoesmid-ocean ridgesmelt temp. 1200Clow viscosity
(fluid flows)flow eruptionsExamples: Hawaii,
mid-ocean ridge, Iceland, Cratersof the Moon (ID)
collision zonesmelt temp. 700Chigh viscosity
(sticky lava; also ash)explosive eruptionsExamples: St. Helens,
Andes volc., Vesuvius,Mt. Pele, Pinatubo,Japan volcanoes
Figure 7.3, 8th edition, text, 2017
Andesitic and Rhyolitic Magma are “a little” different but have similar properties and eruptive characteristics, so we group them together
Table 7.1 – 7th edition, text, 2014
Andesitic and Rhyolitic Magma are “a little” different but have similar properties and eruptive characteristics, so we group them together
Vesicular Basalt (low SiO2, fluid flows)
Rhyolite Pumice (high SiO2, viscous flows, explosive)Figure 7.10, text. Types of
volcanoes: Shield (basaltic)and Composite(or stratovolcano;andesite/rhyolite)y )are most important, (Lecture note Figure V).

10/20/2018
58
Active volcanoes, Figure 7.35, text.
Volcano topography – comparing topographic profiles overEarth and Martian volcanoes
Comparison of topographic profiles over a cinder cone, a composite volcano and a shield volcano (no vertical exaggeration)
Figure 7.13, text
Composite volcano, Kamchatka (note steepsides)

10/20/2018
59
Photo Ronald Nelson. Mt. Bromo, Indonesia, Kedaluh, East Java, Indonesia National Geographic photo contest, 2016
Mt. Unzen, Japan, above Shimabara City. Eruption of June 3, 1991; 43 people killed. Landslide triggered by eruption and earthquake in 1792 killed 15,000 people. Landslide scar at lower right.
Mt. Unzen pyrocastic flow, June 3, 1991 (http://holykaw.alltop.com/think-lavas-bad-get-load-pyroclastic-flow-video). YouTube video at:
https://youtu.be/Cvjwt9nnwXY
“As if volcanoes weren’t terrifying enough, this footage of a pyroclastic flow, which occurred in Japan in 1991, will have you looking warily at every supposedly dormant volcano you see.The hot gas and rock explosion sends a wave of deadly debris shooting down the valley, and the scene is made even more dramatic when the TV crew catches footage of a man fleeing from the scene.Wikipedia provides more background on the commentary regarding fatalities due to the eruption:A pyroclastic surge killed volcanologists Katia and Maurice Krafft and 41 other
l M t U i J J 3 1991 Th t t d
http://holykaw.alltop.com/think-lavas-bad-get-load-pyroclastic-flow-video
people on Mount Unzen, in Japan, on June 3, 1991. The surge started as a pyroclastic flow and the more energised surge climbed a spur on which the Kraffts and the others were standing…The French couple spent their careers on the edge of volcanoes, knowing their time could be cut short at any point. Their own Wikipedia entry includes the following eerily prescient anecdote:Maurice famously says in that video that “I am never afraid because I have seen so many eruptions in 23 years that even if I die tomorrow, I don’t care”, coincidentally on the day before his, and his wife’s death at Mt. Unzen.”
Plateau (flood) basalts of the Pacific Northwest
Figure 7.25A, textNote layers of basalt lava, erupted on the surface, so youngest above and oldest below.

10/20/2018
60
VOLCANOES - - Hawaii:(Example of basaltic flow eruptions)
KEY CONCEPTS:
- - Plate tectonic setting: mostly mid-ocean ridge or hotspot
- - Relatively “gentle”, and more predictable, low viscosity (fluid; less SiO2) flow eruptions and lesser hazards
-- Basaltic (less SiO2) lavas from Earth’s “normal” upper mantle about 60 to 100 km deep
Basaltic volcanism occurs along the mid-ocean ridge divergent boundaries (melting of “normal” mantle rocks), Figure 7.36, text.
Anatomy of a Shield Volcano
Figure 7.12, text
Chain of islands and seamounts extending from Hawaii to Aleutian trench – the track of the Hawaiian hotspot (Figure 5.36, text)
8. Hotspot tracks (like Hawaii)
Figure 5.26, text (age in millions of
years)
(like Hawaii) show direction of motion of the lithosphere over a hotspot (by age of volcanic activity) http://www.minerals.si.edu/tdpmap/ (Interactive Map)

10/20/2018
61
http://pubs.usgs.gov/imap/2800/
http://www.minerals.si.edu/tdpmap/ (Interactive Map)
From This Dynamic Planet map and website: http://pubs.usgs.gov/imap/2800/
Volcano National Park, Hawaii Volcano National Park, Hawaii

10/20/2018
62
Divergent Plate Boundary
Iceland: The Mid Atlantic Ridge exposed on the continent
Krafla geothermal power plant
drone footage of the Iceland lava riverhttp://www.barcroft.tv/dji-drone-camera-lava-lake-holuhraun-iceland
flash flooding caused by the volcanoeshttps://www.youtube.com/watch?v=qoGKicdPM7E
Shield (basaltic) volcanoes: a broad, domed volcano with gently sloping sides, characteristic of the eruption of fluid, basaltic lava.
Mauna Kea, Hawaiʻi, a shield volcano on the Big Island of Hawaii
Composite volcanoes: (or stratovolcano; andesite/rhyolite) a conical volcano built up by alternating layers of lava, pumice and ash, a steep profile with a summit crater.The lava flowing from stratovolcanoes typically cools and hardens before spreading far due to high viscosity.
Mt. Fuji is a dormant composite volcano that is the highest mountain in Japan.
Some interesting volcano photos …
Photo and caption by Vladimir Voychuk. “This is how planet’s fiery breathe looks like. When volcano wakes up, lava’s streams and their blazing glow are visible even hundreds of kilometers away. The eruption of Klyuchevskaya sopka. Kamchatka.” http://photography.nationalgeographic.com/nature-photographer-of-the-year-2016/gallery/week-11-landscape/16
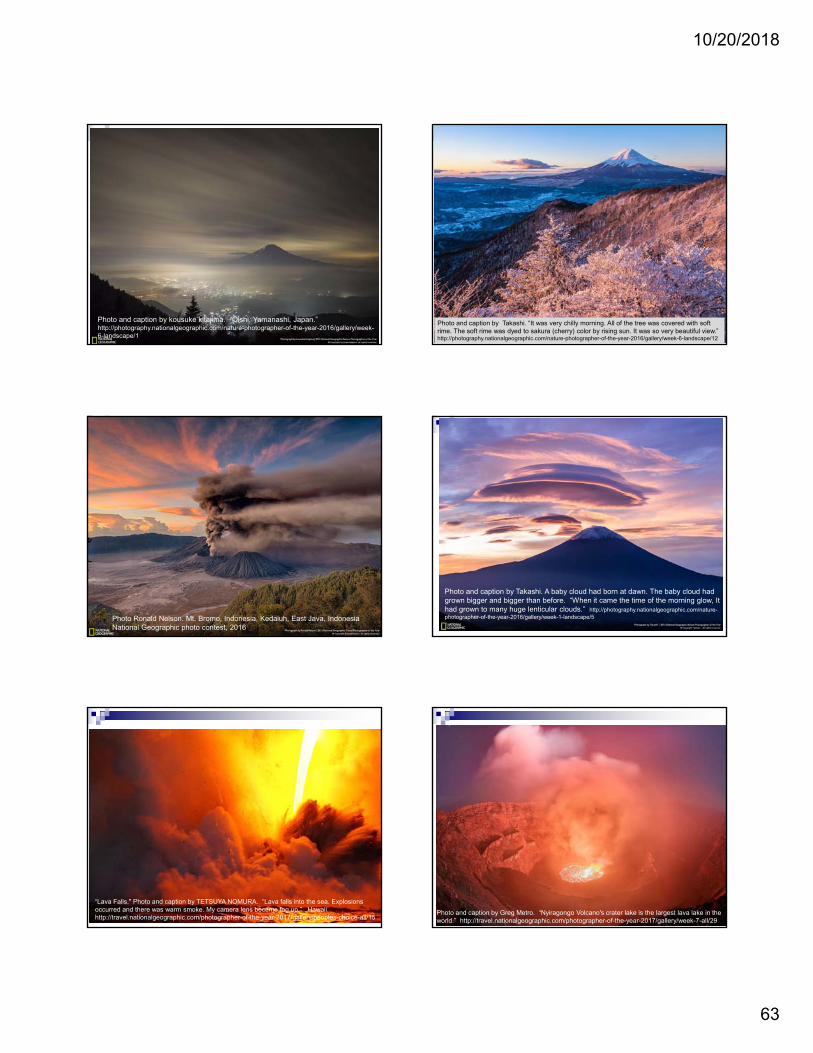
10/20/2018
63
Photo and caption by kousuke kitajima. “Ōishi, Yamanashi, Japan.” http://photography.nationalgeographic.com/nature-photographer-of-the-year-2016/gallery/week-6-landscape/1
Photo and caption by Takashi. “It was very chilly morning. All of the tree was covered with soft rime. The soft rime was dyed to sakura (cherry) color by rising sun. It was so very beautiful view.” http://photography.nationalgeographic.com/nature-photographer-of-the-year-2016/gallery/week-6-landscape/12
Photo Ronald Nelson. Mt. Bromo, Indonesia, Kedaluh, East Java, Indonesia National Geographic photo contest, 2016
Photo and caption by Takashi. A baby cloud had born at dawn. The baby cloud had grown bigger and bigger than before. “When it came the time of the morning glow, It had grown to many huge lenticular clouds.” http://photography.nationalgeographic.com/nature-photographer-of-the-year-2016/gallery/week-1-landscape/5
“Lava Falls." Photo and caption by TETSUYA NOMURA. “Lava falls into the sea. Explosions occurred and there was warm smoke. My camera lens became fog up.” Hawaii. http://travel.nationalgeographic.com/photographer-of-the-year-2017/gallery/peoples-choice-all/15
Photo and caption by Greg Metro. “Nyiragongo Volcano's crater lake is the largest lava lake in the world.” http://travel.nationalgeographic.com/photographer-of-the-year-2017/gallery/week-7-all/29
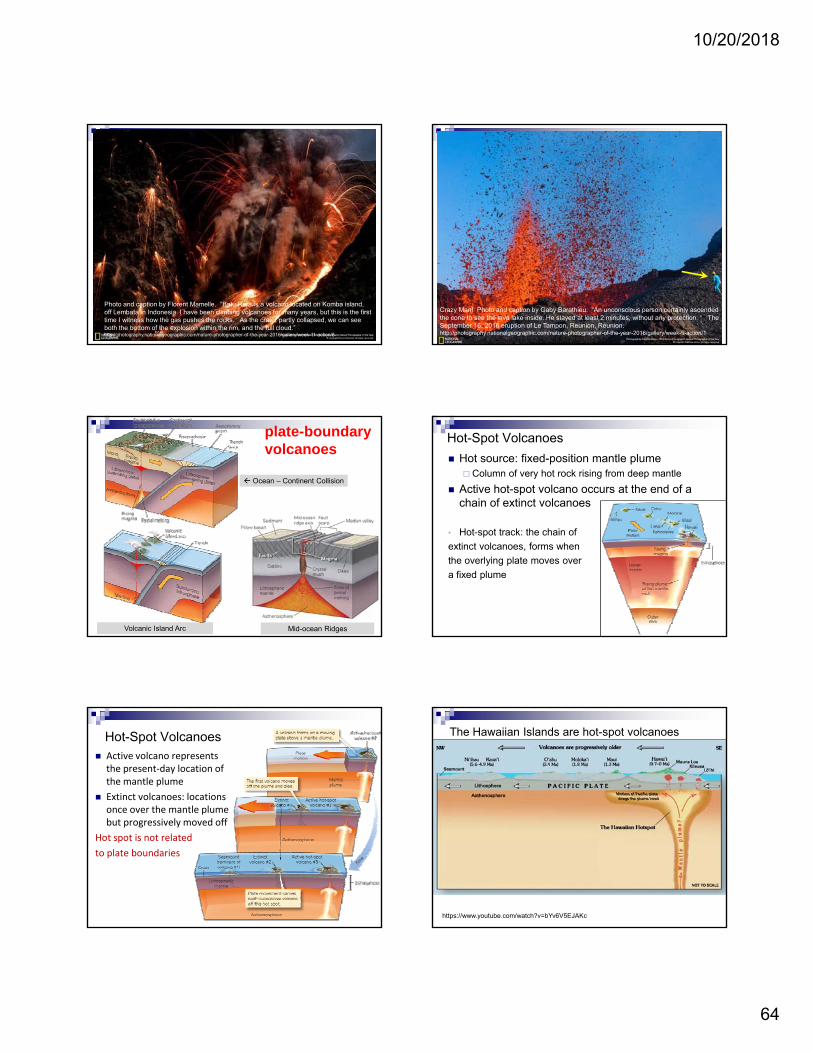
10/20/2018
64
Photo and caption by Florent Mamelle. “Batu Rara is a volcano located on Komba island, off Lembata in Indonesia. I have been climbing volcanoes for many years, but this is the first time I witness how the gas pushes the rocks. As the crater partly collapsed, we can see both the bottom of the explosion within the rim, and the full cloud.” http://photography.nationalgeographic.com/nature-photographer-of-the-year-2016/gallery/week-11-action/8
Crazy Man! Photo and caption by Gaby Barathieu. “An unconscious person certainly ascended the cone to see the lava lake inside. He stayed at least 2 minutes, without any protection. “ The September 16, 2016 eruption of Le Tampon, Reunion, Reunion. http://photography.nationalgeographic.com/nature-photographer-of-the-year-2016/gallery/week-5-action/1
plate-boundary volcanoes
Ocean – Continent Collision
Volcanic Island Arc Mid-ocean Ridges
Hot-Spot Volcanoes
Hot source: fixed-position mantle plume Column of very hot rock rising from deep mantle
Active hot-spot volcano occurs at the end of a chain of extinct volcanoes
• Hot-spot track: the chain of
extinct volcanoes, forms when
the overlying plate moves over
a fixed plume
Hot-Spot Volcanoes Active volcano represents
the present‐day location of the mantle plume
Extinct volcanoes: locations once over the mantle plume but progressively moved off
Hot spot is not related
to plate boundaries
The Hawaiian Islands are hot-spot volcanoes
https://www.youtube.com/watch?v=bYv6V5EJAKc

10/20/2018
65
Hot spots within continents: Africa, Yellowstone.
The tracks provide clues to the direction of plate movement.
Yellowstone hotspot track
From Smith and Siegel, “Windows into the Earth”
EAPS 10000 – Planet EarthProf. L. Braile
2271 HAMP (CIVL), [email protected] and Volcanic Hazards:
Volcanic rocks, types of volcanoes, hazards
Hawaiian (basaltic) and St. Helens (rhyolite/andesite) l l f l i dvolcanoes as examples of non-explosive and
explosive volcanoes
Hw 3 is due on Tuesday, October 23
We will complete the Earth science unit and the Oceanography unit before Exam II
Exam II will be Thursday, November 1
We will discuss Exam II in class in Thursday, Oct. 25
EAPS 10000 – Planet EarthProf. L. Braile
2271 HAMP (CIVL), [email protected] and Volcanic Hazards:
Volcanic rocks, types of volcanoes, hazards
Hawaiian (basaltic) and St. Helens (rhyolite/andesite) volcanoes as examples of non explosive andvolcanoes as examples of non-explosive and explosive volcanoes
Videos of basaltic volcanism
https://www.businessinsider.com/hurricane-michael-approaches-florida-2018-10 - Hurricane Michael - third strongest in last 50 years.
Coastline f
Hurricane Michael -https://www.miamiherald.com/news/weather/hurricane/article219864155.html
Coastline of Florida
of Florida
Gulf of Mexico

10/20/2018
66
Hurricane Michael at landfall, infrared-https://www.washingtonpost.com/weather/2018/10/11/michael-made-history-one-top-four-strongest-hurricanes-strike-united-states/?noredirect=on&utm_term=.2e909e89db4c
https://marine.rutgers.edu/cool/sat_data/?nothumbs=0&product=sst_comp®ion=gulfmexico – Sea surface water temperatures, 10/12/2018, Hurricane Michael
https://www.nytimes.com/2018/10/14/us/hurricane-michael-florida-mexico-beach-house.html - Hurricane Michael damage
VOLCANOES - - Mt. St. Helens:(Example of a composite volcano eruption -- May 18, 1980)
KEY CONCEPTS:
Plate tectonic setting, collision or convergent boundaryL hi t f ti f C d l Long history of eruptions of Cascade volcanoes (example of uniformitarianism - - 1980 eruption of Mt. St. Helens was not unusual, geologically)
Difficulty of predicting geologic hazard events and social/government/economic implications
High volcanic hazard of explosive (high SiO2) volcanoes
Two major types of volcanism (also see Figure 7.3 in text [Table 7.1 in previous edditions; not correct in 2008 and 2005 editions]):
BASALTIC RHYOLITE - ANDESITE
low SiO2 50%density 3 g/cm3
shield volcanoes
high SiO2 70%density 2.7 g/cm3
composite volcanoesmid-ocean ridgesmelt temp. 1200Clow viscosity
(fluid flows)flow eruptionsExamples: Hawaii,
mid-ocean ridge, Iceland, Cratersof the Moon (ID)
collision zonesmelt temp. 700Chigh viscosity
(sticky lava; also ash)explosive eruptionsExamples: St. Helens,
Andes volc., Vesuvius,Mt. Pele, Pinatubo,Japan volcanoes
Rhyolite-Andesite volcanism occurs along convergent boundaries (melting of subducted lithosphere and mantle and crust above the slab; island arc or ocean-continent collision), Figure 7.34, text.

10/20/2018
67
Mt. St. Helens -- Prior to the 1980 Eruption
Figure 7.1, text
07_07
A strato- or composite volcanocomposed of layers of lava and ash (pyroclastic material)Figure 7.11, text.
07_07
A strato- or composite volcano composed of layers of lava and ash (pyroclastic material)Figure 7.21, text.
Volcanic hazards: Explosive eruption, lava flows, pyroclastic flows (glowing avalanche), volcanic bombs, toxic gasses, mud flows, landslides, ash fall, and ash cloud
07_01RMt. St. Helens after May 18, 1980 eruption
Also see Figure 7.1, text
Mt. St. Helens After the 1980 Eruption

10/20/2018
68
Pyroclastic flow (glowing avalanche) on Mt. St. Helens
(also see (Figure 7.5 and
7.18, text)
Pyroclastic flow (glowing avalanche) on Mt. Unzen, Japan
Figure 7.21, text
Figure 7.19, text
~2 km
Digital satellite image of Mt. St. Helens after the 1980 eruption (from Google Earth). In Google Earth one can zoom in and out, rotate the image and “fly in” to this and other locations.
Digital satellite image of Mt. St. Helens after the 1980 eruption (from Google Earth). In Google Earth one can zoom in and out, rotate the image and “fly in” to this and other locations.
http://volcanoes.usgs.gov/volcanoes/st_helens/st_helens_geo_hist_101.html

10/20/2018
69
Lava Dome (since 1980 eruption)
http://volcanoes.usgs.gov/volcanoes/st_helens/st_helens_gallery_28.html
Lava Dome (since 1980 eruption)
http://volcanoes.usgs.gov/volcanoes/st_helens/st_helens_gallery_28.html
http://www.universetoday.com/9939/infrared-view-of-mount-saint-helens/
Infrared satellite image – red is vegetation
http://www.universetoday.com/9939/infrared-view-of-mount-saint-helens/
http://www.universetoday.com/9939/infrared-view-of-mount-saint-helens/
Infrared satellite image, August 29, 1979D
http://www.livescience.com/6452-striking-images-mount-st-helens.html
2 km

10/20/2018
70
Infrared satellite image, September 24, 1980
http://www.livescience.com/6452-striking-images-mount-st-helens.html
2 km
Infrared satellite image, September 10, 2009 (almost 30 years after eruption)
http://www.livescience.com/6452-striking-images-mount-st-helens.html
2 km
20 km
Yellowstone Caldera~65 x 45 km
Calderas
Island ParkIsland Park Caldera
20 km
Yellowstone Caldera~65 x 45 km
Yellowstone NP and Volcano
Island ParkIsland Park Caldera
Grand Prismatic Spring (hot spring). Yellowstone National Park
Note people on walkway for scale
Colors are due to algae that exists at various temperatures in the hot water from the hot spring
Caldera (collapsed volcano) Figure 7.22, text

10/20/2018
71
Caldera (Crater Lake, Oregon) Figure 7.22, text
20 km
Yellowstone Lake
Yellowstone Caldera – Satellite Image. Most recent large eruptions – 2.1 mya (~2450 km3 ejecta) , 1.3 mya (~280 km3), 640,000 years ago (~1000 km3) and eruptions of rhyolite lava in the caldera between 150,000 and 70,000 years ago (~1000 km3).
Yellowstone Caldera – Satellite Image, 3-D Perspective View.
Caldera formation and Crater Lake (Figure 7.22, Text)
Yellowstone Caldera and area of significant ash fall from most recent“super-volcano” eruptions (Figure 7.23, Text)
In the following slides, we illustrate the relative sizes of eruptions and craters produced by the eruption …
2 km
View from Coast
Mt. Vesuvius and Crater (~0.5 km in diameter; ~9 km from Naples, Italy) – Satellite Image. Famous eruption, pyroclastic flows that covered the cities of Pompeii and Herculaneum in 79 A.D. (~4 km3 of ejecta). Most recent eruption was 1944.

10/20/2018
72
10 km
Spirit Lake
Mt. St. Helens and Crater (~2 km in diameter; Washington State) – Satellite Image. Well documented explosive eruption in 1982 (~3 km3 of ejecta) killed 57 people. Previous eruptions (about 3300-3900 years ago) erupted ~10 km3 of ash and lava.
Mt St Helens and Panoramic view of Modern Crater (~2 km in diameter;
Lava dome built since 1980 eruption
Crater Rim (view to N)
Mt. St. Helens and Panoramic view of Modern Crater (~2 km in diameter; Washington State) – Satellite Image.
Before 1980 Eruption After 1980 Eruption
Spirit Lake
Spirit Lake
2 km
Close-up View of Mt. St. Helens Crater – Satellite Image.
2 km Crater
Tambora Volcano (Indonesia) and Crater (~6 km in diameter) – Satellite Image. Explosive eruption in 1815 (~160 km3 of ejecta) was the largest in historic time, lowered the Earth’s atmospheric temperature by 3 oC, and produced the “year without a summer” in North America in 1816.
Figure 7.9, text
4 km
Crater Lake (formerly Mt. Mazama), Oregon (~8 km in diameter) – Satellite Image. Explosive eruption about 6700 years ago (~50 km3 of volcanic ejecta, and about 50 km3 of the 3700 m tall mountain was blasted away)
Aerial View
http://pubs.usgs.gov/fs/2002/fs092-02/
Crater Lake (formerly Mt. Mazama), Oregon(~8 km in diameter) – Lake Bathymetry

10/20/2018
73
20 km
Yellowstone Caldera~65 x 45 km
St. Helens Crater ~2 km
Vesuvius Crater~0.5 km
Tambora Caldera~6 km
Comparison of crater/caldera size – all images at same scale
Crater Lake~8 km
Island ParkCaldera~20 km
0
http://pubs.usgs.gov/fs/2005/3024/fs2005-3024.pdf
How Big Were the Yellowstone Eruptions? About 6,000 times larger than the 1980 eruption of Mt. St. Helens!!!
Others: Long Valley, CA 760,000 yrs ago, ~580 km3; Valles, NM 1.1 mya, ~600 km3; Toba, Indonesia 70,000 yrs ago, ~500 km3.http://pubs.usgs.gov/fs/2005/3024/fs2005-3024.pdf
View these as spheres, not circles, for accurate representations of relative
Comparison of eruption sizes.http://volcanoes.usgs.gov/volcanoes/yellowstone/yellowstone_sub_page_49.html
of relative volumes of eruptions