001 1976 Surfacescience
15
Surface Science 61 (1976) 468-482 0 North-Holland Publishing Company THE REACTIONS OF OXYGEN AND WATER WITH THE RARE-EARTH METALS TERBIUM TO LUTETIUM STUDIED BY X-RAY PHOTOELECTRON SPECTROSCOPY B.D. PADALIA *, J.K. GIMZEWSKI and S. AFFROSSMAN Department of Pure and Applied Chemistry, University of Strathclyde, Glasgow Gl IXL, U.K. W.C. LANG, L.M. WATSON and D.J. FABIAN Departmmt ofMetallurgy. Lfniversity of Strathclvde. Glasgow (;I IXN, Lr.K. Received 10 June 1976; manuscript received in final form 20 September 1976 The X-ray excited oxygen 1s photoelectron spectra of water adsorbed on clean evaporated films of the heavy rareearth metals, terbium to lutetium, is characterised by two peaks: (1) at 531.0 * 0.5 eV binding energy, and (2) at 533.0 * 0.5 eV binding energy, assigned respectively to oxide and hydroxide species. Variation of the relative intensities of these peaks with expo- sure to water leads to the postulate that the oxidation mechanism is island growth with a layer of hydroxide at the surface of the oxide island. At low temperatures, adsorption of water gives two additional peaks: (3) at 534.5 + 0.5 eV, and (4) at 535.7 * 0.2 eV, assigned respectively to chemisorbed and condensed water. On adsorption of small amounts of dry osygen the 0 1s spectra exhibit solely peak (l), whose intensity increases with further oxygen treatment to reach a steady value after -40 L exposure. The kinetics of reaction with oxygen follow a loga- rithmic relation, once correction is made for the effect of escape-depth on peak intensity. However, ytterbium, with a closed 4f shell in the metallic state, exhibits oxidation character- istics different from the other rare-earth metals; its oxygen Is intensity increases linearly with exposure, and the steady plateau level is reached sharply rather than asymptotically. Island growth with a limited number of nucleation sites may explain this behaviour. 1. Introduction Several investigators have used the techniques of electron spectroscopy to study the reaction of oxygen with metal surfaces [l-3]. X-ray photoelectron spectros- copy, in particular, can distinguish between chemisorbed and chemically combined oxide oxygen [4] and, in some cases, between the various oxidation states of the metal [5]. On exposure to oxygen at 300K, most of the metals investigated form 468
-
Upload
independent -
Category
Documents
-
view
0 -
download
0
Transcript of 001 1976 Surfacescience

Surface Science 61 (1976) 468-482
0 North-Holland Publishing Company
THE REACTIONS OF OXYGEN AND WATER WITH THE RARE-EARTH
METALS TERBIUM TO LUTETIUM STUDIED BY X-RAY PHOTOELECTRON
SPECTROSCOPY
B.D. PADALIA *, J.K. GIMZEWSKI and S. AFFROSSMAN Department of Pure and Applied Chemistry, University of Strathclyde, Glasgow Gl IXL, U.K.
W.C. LANG, L.M. WATSON and D.J. FABIAN
Departmmt ofMetallurgy. Lfniversity of Strathclvde. Glasgow (;I IXN, Lr.K.
Received 10 June 1976; manuscript received in final form 20 September 1976
The X-ray excited oxygen 1s photoelectron spectra of water adsorbed on clean evaporated
films of the heavy rareearth metals, terbium to lutetium, is characterised by two peaks: (1) at
531.0 * 0.5 eV binding energy, and (2) at 533.0 * 0.5 eV binding energy, assigned respectively
to oxide and hydroxide species. Variation of the relative intensities of these peaks with expo-
sure to water leads to the postulate that the oxidation mechanism is island growth with a layer
of hydroxide at the surface of the oxide island. At low temperatures, adsorption of water gives
two additional peaks: (3) at 534.5 + 0.5 eV, and (4) at 535.7 * 0.2 eV, assigned respectively to
chemisorbed and condensed water. On adsorption of small amounts of dry osygen the 0 1s
spectra exhibit solely peak (l), whose intensity increases with further oxygen treatment to
reach a steady value after -40 L exposure. The kinetics of reaction with oxygen follow a loga-
rithmic relation, once correction is made for the effect of escape-depth on peak intensity.
However, ytterbium, with a closed 4f shell in the metallic state, exhibits oxidation character-
istics different from the other rare-earth metals; its oxygen Is intensity increases linearly with
exposure, and the steady plateau level is reached sharply rather than asymptotically. Island growth with a limited number of nucleation sites may explain this behaviour.
1. Introduction
Several investigators have used the techniques of electron spectroscopy to study the reaction of oxygen with metal surfaces [l-3]. X-ray photoelectron spectros- copy, in particular, can distinguish between chemisorbed and chemically combined oxide oxygen [4] and, in some cases, between the various oxidation states of the metal [5]. On exposure to oxygen at 300K, most of the metals investigated form
468

B.P. Padalia et al. /Reactions of oxygen and water with rare-earth metals 469
thin protective oxide layers, of thickness much less than the mean escape depth of photoelectrons in the oxide [6]. Even with such thin films the oxide may be formed in the early stages of adsorption [4], though chemisorbed species are also observed and may be the principal species in the case of unreactive metals.
We report here an investigation of the reactions of oxygen and of water with clean evaporated films of the lanthanides terbium to lutetium. There have been sev- eral studies made of thin films of the rare-earth metals [7-91, but few attempts to control surface contamination; although Farber and Braun [lo] have used Auger
electron spectroscopy (AES) to investigate the oxidation of samarium, gadolinium and terbium bulk samples cleaned by argon ion bombardment.
The rare-earth metals are highly reactive to many gases, and with water they extract hydrogen to form the hydride [9]. In the present study the sorbed oxygen species obtained on reaction with oxygen and with water, were monitored to deter- mine whether XPS measurements can provide useful information on the kinetics of formation of relatively thick oxide films.
2. Experimental
The detail of the method is described elsewhere [6]. Spectroscopically pure rare-
earth metals were used (purchased from Johnson Matthey Ltd.). The metals were evaporated on to a polished stainless steel plate mounted on the probe tip. The sample chamber was pretreated with the adsorbate before introduction of the sam- ple for the required exposure.
Mg Ka radiation was principally employed for photoelectron excitation; and base pressure in the analyzer was typically 5 X lo-” Torr.
3. Results
3.1. Reaction with oxygen
3. I. I Metal films At room temperature, the initial uptake of oxygen by clean evaporated films of
the heavy rare-earth metals was characterised in their spectra by a single 0 1s peak at 53 1 .O f 0.5 eV binding energy; peak (l), table 1.
The core-level peaks of the rare-earth metals exhibit a complicated multiplet splitting on oxidation [l 11. In the case of lutetium there is no splitting but the peaks are broad. The extent of overlayer formation cannot therefore be estimated from the unoxidised metal core level attenuation, which is the normal method
]121. It is accepted [13] that core-level metal peaks do not show marked chemical
shifts on oxidation, except at very small take off angles, until the oxide is formed.

Table I XPS binding energies af 0 Is species 1 and 2 for the evaporated heavy rare earth metals + oxy- gen and for the bulk oxides
-_Y.____._ - --.---. -..--_-~l____
Sample BE (eV) of 0 1s species
Evaporated metal surfaces f oxygen gas a Evaporated oxide b
1 2 ~_ ._ . ._---
LU 531.0 * 0.2 533.0 ?. 0.4 531.6 r 0.2 Yb 530.8 2 0.2 533.0 f. 0.4 531.1 IO.2 Tm 531.5 I 0.2 533.5 * 0.4 532.6 +- 0.2 Er 531.1 A 0.2 533.2 + 0.4 531.7 f 0.2 HO 530.8 I: 0.2 532.8 + 0.4 531.7 i: 0.2 DY 530.8 ?-. 0.2 533.0 f- 0.4 531.7 c 0.2 Tb 530.8 f: 0.2 532.9 _c 0.4 531.5 + 0.2 __- _... _________ _ .._ __‘ _-.-_~- a No charging of the samples has been detected. b It is believed that charging of the sample occurs when the metals are evaporated in IOW”‘Torr
02. The reported BE are not corrected for charging.
With ytterbium, which is divalent as the pure metal, but trivalent in the oxide, the multiplet splitting occurs only on oxidation 11 I]. On oxidation, the apparent chemical shift in the metal core level binding energy is greater for ytterbium than for the other metals and is easily discerned. The core level shift is already well
I,,,, 1 ,,I. ___.I ” --,-.. * . .-
180 185 190 19s ev
81. NO1 NG ENERGY
Fig. 1. 4d spectrum of ytterbium, below .- clean; above - exposed to 8 L 02.
B.P. Padalia et al. / Reactions of oxygen and water with rare-earth metals 411
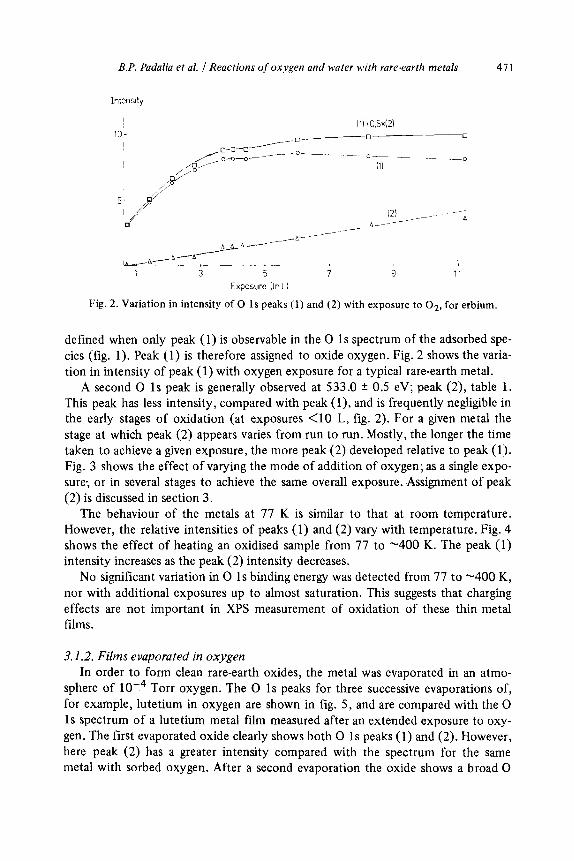
Fig. 2.
Lp----* -
L-A
1 3 5 7 9 11
Exposure IInLl
Variation in intensity of 0 1s peaks (1) and (2) with exposure to O,, for erbium.
defined when only peak (1) is observable in the 0 1 s spectrum of the adsorbed spe- cies (fig. 1). Peak (1) is therefore assigned to oxide oxygen. Fig. 2 shows the varia- tion in intensity of peak (1) with oxygen exposure for a typical rare-earth metal.
A second 0 1s peak is generally observed at 533.0 + 0.5 eV; peak (2), table 1. This peak has less intensity, compared with peak (l), and is frequently negligible in the early stages of oxidation (at exposures <lO L, fig. 2). For a given metal the stage at which peak (2) appears varies from run to run. Mostly, the longer the time taken to achieve a given exposure, the more peak (2) developed relative to peak (1). Fig. 3 shows the effect of varying the mode of addition of oxygen; as a single expo- sure, or in several stages to achieve the same overall exposure. Assignment of peak (2) is discussed in section 3.
The behaviour of the metals at 77 K is similar to that at room temperature. However, the relative intensities of peaks (1) and (2) vary with temperature. Fig. 4 shows the effect of heating an oxidised sample from 77 to -400 K. The peak (1) intensity increases as the peak (2) intensity decreases.
No significant variation in 0 1s binding energy was detected from 77 to -400 K,
nor with additional exposures up to almost saturation. This suggests that charging effects are not important in XPS measurement of oxidation of these thin metal films.
3.1.2. Films evaporated in oxygen
In order to form clean rare-earth oxides, the metal was evaporated in an atmo- sphere of low4 Torr oxygen. The 0 1s peaks for three successive evaporations of, for example, lutetium in oxygen are shown in fig. 5, and are compared with the 0 1s spectrum of a lutetium metal film measured after an extended exposure to oxy- gen. The first evaporated oxide clearly shows both 0 1s peaks (1) and (2). However, here peak (2) has a greater intensity compared with the spectrum for the same metal with sorbed oxygen. After a second evaporation the oxide shows a broad 0

472 B.P. Padalia et al. /Reactions o.f oxygen and water with rare-earth metals
b
a
528 530 532eV 528 5XeV BINDING ENERGY BI ND1 NG ‘;hit RGY
Fig. 3. 0 1s spectra of dysprosium exposed to 1000 L 02, below - single step adsorption, above - multi-step adsorption.
Fig. 4. Effect of temperature on 0 Is spectrum of dysprosium exposed to 150 L 02 at (a) 77 K; (b) a -+ 273 K; (c) b -+ 373 K.
1s region which may be constructed from equal contributions of peaks (I) and (2). After the third evaporation the oxide shows a single narrow peak whose binding energy for the various metals is given in table 1. These values do not correspond to either peak (1) or (2). As successive evaporations produce a thick film of oxide, a charging effect is expected, but the extent of charging of the film cannot be esti- mated as the preparation procedure precludes the use of a reference material.
3.2. ~ea~t~o~ with water
The spectrum of a clean rare-earth metal film exposed to water vapour at room temperature exhibits two 0 1s peaks: (1) and (2), table 2. They correspond precise- ly in binding energy to the peaks (I) and (2) observed in successive oxidation stages with oxygen. With water the intensity of peak (2) increases relative to peak (I) as the exposure increases, up to a ratio of ca 0.5 at ca 20 L, and then remains con- stant, although the total 0 1s peak area continues to increase (fig. 6). The maxi- mum ratio of peak (2) to peak (1) is the same for all the metals, table 2.

BP. Padalia et al. / Reactions of’ oxygen and u*ater with rare-earth metals
4 rm I / I I r b 1 I , I / I
530 535 530 535eV
51 NOING ENERGY
473
Fig. 5. 0 1s spectra of lutetium-oxygen in various forms: (a) evaporated metal then large exposure to oxygen;(b) metal evaporated in oxygen - lst, 2nd and 3rd evaporations.
t
Fig. 6. Variation in total 0 Is intensity, and in ratio of peak (2) to peak Cl), with exposure to Hz0 for holmium.
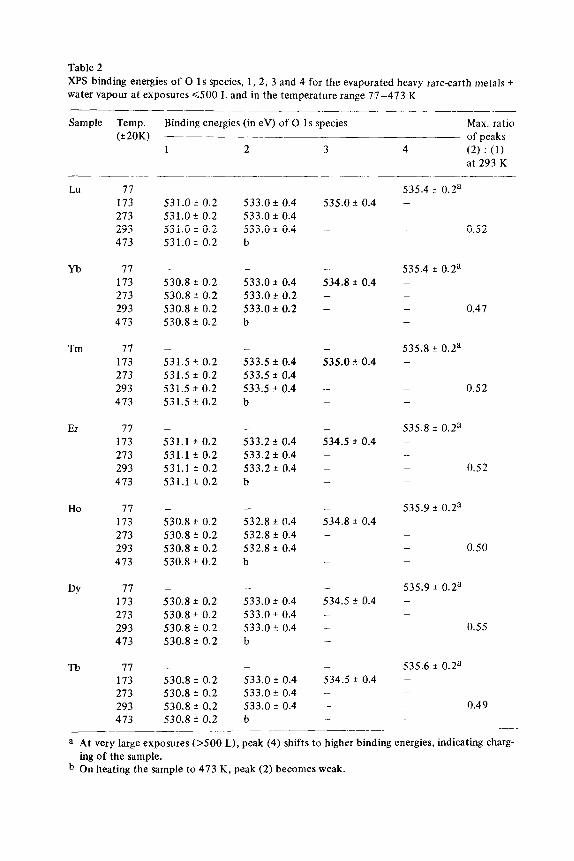
Table 2
XPS binding energies of 0 1s species, 1,2, 3 and 4 for the evaporated heavy rare-earth metals +
water vapour at exposures 6.500 L and in the temperature range 77-473 K
Sample Temp.
(+ 20K)
Binding energies (in eV) of 0 1s species Max. ratio
of peaks
LU
Yb
Tm
Er
Ho
DY
Tb
77
173
273
293
473
531.0 f 0.2 533.0 f 0.4
531.0 f 0.2 533.0 f 0.4
531.0 + 0.2 533.0 + 0.4
531.0 + 0.2 b
77 -
173 530.8 + 0.2
273 530.8 f 0.2
293 530.8 + 0.2
473 530.8 * 0.2
- -
533.0 It 0.4 534.8 f 0.4
533.0 f 0.2 _
533.0 + 0.2 _
b _
71 -
173 531.5 f 0.2
273 531.5 t 0.2
293 531.5 f 0.2
473 531.5 f 0.2
- _
533.5 t 0.4 535.0 * 0.4
533.5 It 0.4 _
533.5 f 0.4 .-
b _
77 _
173 531.1 + 0.2
273 531.1 f 0.2
293 531.1 * 0.2
473 531.1 f 0.2
- _
533.2 f 0.4 534.5 f 0.4
533.2 ?: 0.4 _
533.2 f 0.4 -
b -
77 -
173 530.8 + 0.2
273 530.8 + 0.2
293 530.8 f 0.2
473 530.8 f 0.2
- -
532.8 t 0.4 534.8 * 0.4
532.8 t 0.4 -
532.8 f 0.4 _
b -
77 _ -
173 530.8 f 0.2 533.0 f 0.4
273 530.8 f 0.2 533.0 f 0.4
293 530.8 + 0.2 533.0 f 0.4
473 530.8 + 0.2 b
77 - -
173 530.8 t 0.2 533.0 * 0.4
273 530.8 t 0.2 533.0 f 0.4
293 530.8 f 0.2 533.0 * 0.4
473 530.8 + 0.2 b
1 2
535.0 +_ 0.4 _
_
-
534.5 f 0.4 -
-
-
-
534.5 f 0.4 -
- -
4 (2) : (1) at 293 K
535.4 t 0.2a
_ _ 0.52
535.4 f 0.2a _
_
_ 0.47 _
535.8 f 0.2a _
_ 0.52 _
535.8 _+ 0.2a _
_
_ 0.52
535.9 It 0.2a
_ _ 0.50 _
535.9 + 0.23 _
_ 0.55
535.6 + 0.2a _
_ _ 0.49
a At very large exposures 0500 L), peak (4) shifts to higher binding energies, indicating charg-
ing of the sample. b On heating the sample to 473 K, peak (2) becomes weak.

B.P. Padalia et al. /Reactions of oxygen and water with rare-earth metals 415
Fig.
(b) 1
d
528 5k. V 528 53L ev
BIND1 NG ENERGY
7. Effect of temperature on 0 1s spectrum of Hz0 on terbium; (a) 10 L Hz0 at 77 K;
00 L Hz0 at 77 K;(c) b - 153 K;(d) c-+ 370 K.
When magnesium or aluminium is oxidised with water, two 0 1s peaks are simi-
larly observed [6]. The higher binding energy peak (ca 533.4 eV) has been assigned to hydroxide, and we also assign peak (2) [533.0 + 0.5 eV] to hydroxide.
Sorption of water on clean films at low temperature produces two additional peaks (3) at 534.8 + 0.4 eV, and (4) 535.7 f 0.2 eV (fig. 7 and table 2). Large expo- sures of water vapour at low temperatures produce exclusively peak (4) and, as shown in fig. 7, this peak can be completely eliminated by heating. Peak (4) is therefore assigned to condensed water. Peak (3) is also readily removed by further heating, though not peaks (1) or (2), and we therefore tentatively assign peak (3) to chemisorbed water.
3.3. Assignment of peak (2) for reaction with oxygen
The majority of rare-earth elements have only one observed valency. The higher binding energy peak observed on reaction with oxygen cannot therefore be inter- preted as an alternative oxide.
One possibility for peak (2) is chemisorbed oxygen. However, after the initial stages of reaction with oxygen the amount chemisorbed by the metal should decrease as the free metal surface is depleted with formation of oxide. No such decrease in peak (2) is observed. Generally the oxides are not expected to adsorb large quantities of oxygen [14] and the heavy rare earth oxides do not deviate appreciably from stoichiometry.
It is possible that in spite of the high vacuum, peak (2) is due to hydroxide arising

476 B.P. Padalia ct al. /Reactions of’oxygen and water with rare-earth metals
from water contamination. Water could desorb from those sections of the gas inlet
system that can not be baked; but a high sticking coefficient for water on the rare-
earths is indicated, since no similar problem has been encountered with other metals using the same system. For the oxygen reaction a variation in relative inten- sity of peak (2) to peak (1) with experimental conditions was noted, in contrast to the reproducible behaviour observed with water vapour; this also suggests that con-
tamination is the cause.
4. Discussion
4.1. Kinetics of reaction with oxygen
Fig. 2 illustrates the variation in 0 1s intensity of peak (1) with exposure of erbium to oxygen. The oxidation curve shows two stages; initially there is a rapid oxidation up to -40 L exposure and then the 0 1s intensity increases slowly reach- ing a maximum at -400 L. Immediately following the fast oxidation stage there is evidence of an intermediate plateau, which was also observed for the other metals;
while, later, at very high exposures the intensity of peak (1) decreases. Examination of the oxidation curve can provide information on the kinetics of
oxidation. However the results are only unequivocal for very thin oxide films [6]. For the thick oxide films on the lanthanides it is necessary to assume some distri-
bution of the oxygen. The simplest case is to consider that the oxide forms progres- sively into the bulk. The effect of oxide depth, d, on the signal intensity can then be calculated from the equation
/=I,(1 - eAIA) (1)
where A is the mean escape depth, I is the 0 1s intensity, and I, the limiting I for effectively infinite depth of oxide. A plot of I versus d has a limiting slope of L/A. The intensity corrected for depth is therefore
I* = d/A = -ln( 1 - I/Z-) . (2)
The expression for the corrected intensity may then be combined with a suitable rate equation.
Several studies of the reaction of gases with clean surfaces have shown that a high sticking coefficient is common for up to almost a monolayer adsorption, or for more if the gas can be incorporated into the metal [15]. The sticking coeffi- cient should then fall exponentially as the adsorption process becomes activated, though the temperature dependence is frequently small. At either stage the sticking coefficient is usually not pressure dependent; also thick films may be formed on some metals even at low temperatures.
The activated stage can frequently be described by an equation of the type [ 161
N/Nmax =alnt+b, (3)

B.P. Padalia et al. /Reactions of oxygen and water with rare-earth metals 417
where N is the number of molecules adsorbed at time 1. A similar logarithmic rela-
tion can be deduced from alternative mechanisms for the oxidation [17], and has also been observed experimentally in several cases.
The adsorption we observed for oxygen on the heavy lanthanides, at exposures < -100 L, shows the features described above. A smooth curve of 0 1s intensity versus exposure was obtained using various pressures during a run, and adsorption
also proceeded readily at 77 K. Eq. (3) was therefore combined with eq. (2) to give
Z*=alnL+b, (4)
where I* is the oxide intensity corrected for the depth, and L is the exposure in Langmuirs. Fig. 8 shows, for oxidation of erbium, that reasonable agreement with eq. (3) is observed for the region where oxidation is rapid.
A complication in the oxidation with oxygen is the simultaneous growth of the hydroxide species [peak (2) in fig. 21. The ratio of peak (2) to peak (1) increases continuously but does not exceed the value of -0.5 obtained in the water oxida- tion. The constancy of this ratio for all the rare-earth metals, for water exposures >25 L (table 2, and fig. 6) is important. To explain it we propose the following model.
On oxidation by wafer a double layer is formed consisting of an infinitely thick (in relation to photoelectron escape depth) oxide layer and a thin overlayer of hydroxide. The hydroxide layer has a fixed depth, probably a monolayer. The
.*
I 1 2 3 ‘
ExposurollnLi
Fig. 8. Oxidation kinetics, erbium-oxygen. Plot of peak (l), corrected for depth versus log exposure (cf. fig. 2).

478 B.P. Padalia et al. / Reactions o.f oxygcw and water with rare-earth metals
strong affinity of the oxide for water, demonstrated by the difficulty of suppressing the peak (2) species 011 oxidation with nominally dry oxygen, results in the oxide becoming completely covered by the hydroxide overlayer at high water vapour exposures. The ratio of peak (2) to peak (1) is therefore ultimately constant. Strong evidence for this model was obtained by evaporating the metal in oxygen several times to give a bulk oxide whose 0 Is spectrum exhibited a single peak (fig. S), and then exposing this oxide to water vapour. A second 0 1s peak developed, the spec- trum becoming identical to that of the metal exposed to water vapour, with the ratio peak (2) : peak (1) equal to 0.5.
On oxidation with oxygen, the extent of the hydroxide overlayer increases
with exposure, at a rate dependent on the amount of water impurity up to prob- ably a complete monolayer. The different rate dependences indicated by the
shapes of the peak (1) and peak (2) oxidation curves (fig. 2) gives additional evi- dence for the model. The peak (1) oxide curve is not linear and shows a logarithmic dependence on exposure, due to the effect of escape depth as the oxidation pro- ceeds into the bulk. The peak (2) curve however is linear, indicating the hydroxide to be a surface species resulting in an 0 1s intensity proportional to concentration, and following “Elovich type” kinetics [ 181. The change in slope of the oxidation curve at -40 L, fig. 2, suggests that the oxide is formed to only a limited thickness in the rapid stage of oxidation with oxygen.
The reaction of water with oxide surfaces produces hydroxyls
M,(O) I- Ha0 -+ M,(OH)z >
and if this stoichiometry applies in the hydration of the rare earths, then as a first approximation the intensity of the signal from hydroxide, peak (2), should corre- spond to twice the loss in intensity from the oxide, peak (1). In fig. 2, the top curve is the peak (1) intensity corrected for hydroxide by addition of half the peak (2) intensity. The correction is smaI1 at low exposures. At high exposures, the uncor- rected peak (1) curve decreases. The oxide thickness is either effectively in~nite or increasing very slowly in this region. Further loss of oxide by hydration would therefore give a net decrease in the oxide peak (1) signal. As further evidence we note that the corrected curve appears to compensate for this effect.
The above model also aliows estimation of the escape depth of electrons in the oxide as follows. Severai studies have been made of water adsorption on various metal oxides, though not on clean samples of the heavy rare-earths. A widely used model for the hydration process was proposed initially by Peri [19] for the alumina-water system. The essential features are that the surface consists of a half- packed oxide layer, which on hydration converts to a fully packed hydroxide layer. We note therefore that an oxide sample is not uniform, the surface layer containing
ca. only half the number of normal oxygen atoms. Hydration produces a sample with the same density of oxygen atoms in all layers though the surface layer is now in the form of hydroxide.
Applying this model to our system the hydroxide signal, peak (2), from the

B.P. Padalia et al. / Reactions o.f oxygen and water with rare-earth metals 479
hydrated bulk oxide should correspond to the surface oxygen, Zs. The total oxide and hydroxide signal, peak (1) plus peak (2), corresponds to I,. If the cross sections for electron emission from an oxide ion and a hydroxide ion are comparable, then the hydrated oxide can be considered “uniform” in respect of the XE’S intensity of. peak (1) plus peak (2), allowing for their difference in binding energy, and eq. (1) may be applied. The hydroxide overlayer thickness d, may be estimated from the crystal structure of the oxide [20], and is -2.6 A. From experiment ZJZlr, = OS/ (1 + 0.5) = 0.33. Therefore A = 6.4 A at - 720 eV or 7.4 a at -9.50 eV (kinetic energy), assuming [2 l] A 0: KE”.
There are few reliable values available for electron escape depths. Reported val- ues, calculated perpendicular to the surface, are NiO [ 121 9 8, AlaOs [21] 11 8, FesO, [22] 13 A, WO, [23] 15 8, all at -950 eV. Our calculated escape depth for the rare earths is therefore of the correct order. A detailed analysis of our value is not justified at present, since further work is required on the exact stoichiometry
of hydration of the rare-earths at low pressures, and on the surface condition of the
samples. Surface roughness could produce low values for A.
4.2. Oxidation with water
Fig. 6 is a typical oxidation curve for water as oxidant. A “break” in the curve is evident at -20 L, similar to the behaviour on reaction with dry oxygen. The varia-
20 26eV 61 NDING ENERGY
Fig. 9. 5p spectra of holmium after exposure to various amounts
4 L HzO; (c) 4 L 02; (d) 1000 L 02; (e) 1000 L H20. of 02 or H20: (a) clean, (b)
480 B.P. Padaliu et al. j Reactions of oxygen and water with rare-Earth metals
tion with exposure of the peak (2) to peak (1) ratio is also shown in fig. 6. The limiting value of -0.5 is attained rapidly and remains constant as the overall 0 1s intensity increases. Furthermore, while the total 0 1s intensity is comparable with that for the oxidation with oxygen, the substrate metal peaks are observed for much larger exposures to oxidant, fig. 9. These features suggest that the oxide grows by an island mechanism; i.e. “infinitely” deep oxide islands grow laterally and are covered by a hydroxide overlayer.
Electron microscope studies of the reaction of water with the Ianthanides have shown that the hydride is formed, and that crystals of oxide and hydride can coexist [9]. The “metal” peaks observed may be a contribution from the hydride.
The XPS measurements show that even if the hydride is formed by reaction with water, patches of oxide are present at the surface. The constant peak (2) to peak (1) ratio also shows that a complete overlayer of hydroxide is formed on the oxide islands. No decrease is observed in the peak (1) intensity at very high exposures in
the case of water oxidation, unlike the oxygen oxidation. This is to be expected as the hydroxide overlayer is complete at an early stage in the water reaction. As the oxide islands grow the hydroxide overlayer is extended simultaneously, keeping
the hydroxide-oxide ratio constant.
4.3. Oxidation of ytterbium
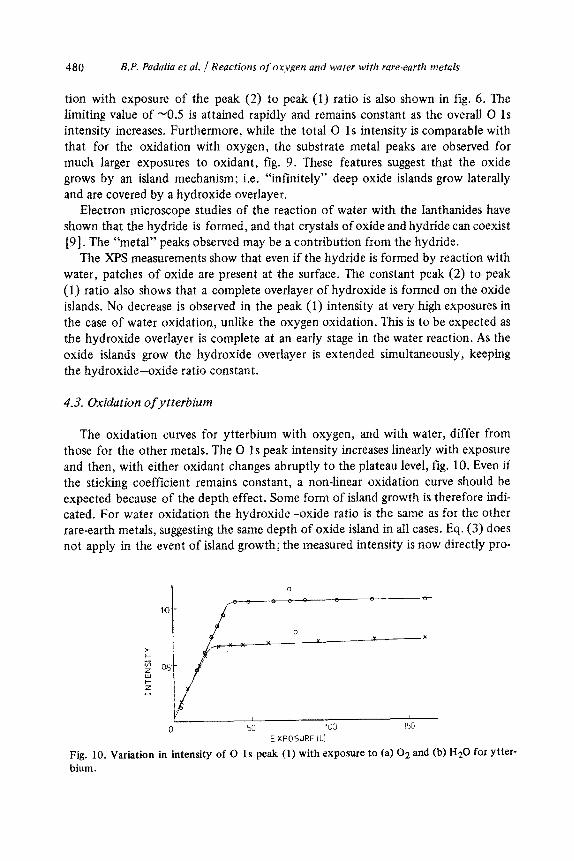
The oxidation curves for ytterbium with oxygen, and with water, differ from
those for the other metals. The 0 1 s peak intensity increases linearly with exposure and then, with either oxidant changes abruptly to the plateau level, fig. 10. Even if the sticking coefficient remains constant, a non-linear oxidation curve should be expected because of the depth effect. Some form of island growth is therefore indi- cated. For water oxidation the hydroxide-oxide ratio is the same as for the other rare-earth metals, suggesting the same depth of oxide island in all cases. Eq. (3) does not apply in the event of island growth; the measured intensity is now directly pro-
0 SC 100 ‘5C
EXPOSURE IL)
Fig. 10. Variation in intensity of 0 1s peak (1) with exposure to (a) 02 and (b) Ha0 for Ytter- bium.
B.P. Padalia et al. /Reactions of oxygen and water with rare-earth metals 481
portional to the amount of oxide. Thus the ytterbium oxidation in both cases apparently follows linear kinetics, as observed (though at higher temperatures) in other metal-oxygen reactions, where island growth mechanisms apply [24].
The similarity of the water oxidation of ytterbium to its oxygen oxidation rather than to the water oxidations of the other metals, probably results from the lack of hydride formation in the reaction of ytterbium with water 193, in contrast to the other metals. Ytterbium is also exceptional in having a valence of two in the metal. It is therefore less dense than the other rare-earth metals and has a larger change in lattice dimensions on oxidation. Thus the oxidation may be initiated at only certain
sites giving the island type growth. Notwithstanding the difference in mechanism, the rate of oxidation of ytterbium is no less than for other metals.
5. Conclusions
(1) Adsorption of water on the heavy lanthanides gives a thick (with respect to electron escape depth) oxide layer which grows laterally by an island mechanism.
The oxide islands are covered by a complete overlayer of hydroxide. (2) Adsorption of oxygen gives a full oxide layer which grows, perpendicular to
the surface, logarithmically with exposure to form a film that is thick with respect
to the electron escape depth. After an exposure of -40 L further oxidation is slow.
(3) The clean bulk oxide readily adsorbs water to form a surface hydroxide which is stable at room temperature and low pressure.
(4) The mean electron escape depth in the oxide is, provisionally, ca. 7.4 A at 960 eV kinetic energy.
(5) The oxidation of ytterbium differs from that of the other metals. Linear
kinetics are observed with both water and with oxygen. The results are interpreted as island growth in both cases. The island growth mechanism differs from that for water oxidation of the other metals, and may be related to the anomalous size of the unionized ytterbium atom.
Acknowledgements
B.D.P. and J.K.G. thank SRC for financial support. We are grateful to Miss Maureen Hanley for assistance with the experiments.
References
[l] S. Evans, E.L. Evans, D.E. Parry, M.J. Tricker, M.J. Walters and J.M. Thomas, J. Chem.
Sot. Faraday Disc. 58 (1974) 97.
482 B.P. Padalia et al. /Reactions of oxygen and water with rare-earth metals
[2] R.W. Joyner and M.W. Roberts, Chem. Phys. Letters 28 (1974) 246. f3] G. Ertl and K. Wandelt, Surface Sci. 50 (1975) 479. [4J CR. Brundle and A.F. Carley, Chem. Phys. Letters 31 (1975) 423. IS] KS. Kim and N. Winograd, Surface Sci. 43 (1974) 625. [6] J.C. Fuggle, L.M. Watson, D.J. Fabian and S. Affrossman, Surface Sci. 49 (1975) 61. [7] A.E. Curzon and H.G. Chlebek, J. LessCommon Metals 27 (1972) 411. [S] L.E. Murr, J. Less-Common Metals 30 (1973) 321. [9] M. Gasgnier, J. Ghys, G. Schiffmacher, Ch.H. la Blanchetais, P.E. Caro, C. Boulesteix, Ch.
Loier and B. Pardo, J. Less-Common Metals, 34 (1974) 13 1; J. Dexpert-Ghys, C. Loier, Ch.H. la Blanchetais and P.E. Care, J. Less-Common Metals 41(1975) 105.
IlO] W. Farber and P. Braun, Surface Sci. 41 (1974) 195.
[ 11) W.C. Lang, B.D. Padalia, L.M. Watson, D.J. Fabian and P.R. Norris, J. Chem. Sot. Faraday Disc. 60 (1975).
1121 P.R. Norton and EL. Tapping, J. Chem. Sot. Faraday Disc. 60 (1975). [13] J.C. Fuggle and D. Menzel, Chem. Phys. Letters 33 (1975) 37; Surface Sci. 53 (1975) 21. [14] J.F. Read,Can. J. Chem. 50 (1972) 490. [15] E. Fromm, Surface Sci. 52 (1975) 401. 1161 V. Ponec, 2. Knor and S. Cerny, Adsorption on Solids (Butterworths, London, 1974)
ch. 12.2. (171 K.R. Lawless, Rept. Progr. Phys. 37 (1974) 231. [IS] W.I. Stuart and T.L. Whateley, Trans. Faraday Sot. 61 (1965) 2763. ]19] J.B. Peri, J. Phys. Chem. 69 (1965) 211,220,231. [ZO] R.W.G. Wyckoff, Crystal Structures (Interscience, New York, 1964) Vol. 2, ch. Va2. [2X] M. Klasson, J. Hedman, A. Berndstsson, R. Nilsson, C. Nordling and P. Melnik, Physica
Scripta 5 (1972) 93. 1221 P.B. Needham and T.J. Driscoll, J. Vacuum Sci. Technol. 11 (1974) 278; see also C.J.
Powell, Surface Sci. 44 (1974) 29. [23J T.A. Carlson and G.E. McGuire, J. Electron Spectrosc. 1 (1972/3) 161. [24] G.E. Rhead, Trans. Faraday Sot. 61 (1965) 797.