1976 By-census Transport Characteristics
89
• t .. 19?6 BU - Census : Transport Characteristics CENSUS AND STATISTICS DEPARTMENT Feb. 1978
-
Upload
khangminh22 -
Category
Documents
-
view
3 -
download
0
Transcript of 1976 By-census Transport Characteristics

• t
..
19?6 BU -Census :
Transport Characteristics
CENSUS AND STATISTICS DEPARTMENT
Feb. 1978

這份刊物的 PDF 版本的文字是從印刷版掃描而成,再利用光學字符識別軟
件轉換成電子格式。由於原印刷版本已印製並保存多年,光學字符識別技
術未必能準確地識別某些文字或數字。因此,搜索或複製此 PDF 檔案內的
文字時應加以注意。 The text of this PDF publication was scanned from its printed version and then converted to electronic text using Optical Character Recognition (OCR) software. Because of the age and condition of the original printed copy, the OCR may not recognise certain characters or figures accurately. Caution should therefore be taken when searching or copying text from this PDF publication.

FOREWORD .. .
The development of Hong Kong and the expansion of its population has ~" resulted over the years inter alia in a corresponding inGreas~d emphasis on transp,?rt ,pl~nnipg"c . This planning 'in t~nrequires a bas)~ ~.or ·iiiformation on who tra.vels~- from v;.her~ · to wh'6re, how and why.' Transport. qdes-Hons wete first incorporated ' in the 1966 By-Census and later.. in the 1971 Census of PopJ1ation and Housing. The first report on transport data was that derived from the 1971 Census and published in 1974.
The 1976 By-Census, taken on a 10% sample of the entire land-based popUlation on 2nd August 1976, provided an opportunity for updating the previous findings. It it? the purpose of this report to" present and analyse the transport data derived' fr_o~ th~ By-Census. '" ,. ,
, .
Transport characteristics discussed in this report include the geographical distribut~on of car availability and its re1atib·~ship with other socio-econori1i:~ vari~bles; purpose a·nil, method of transport; and trip generation and attraction by districts. '.
January 1978
D.S. Whitelegge Commissioner for Census & Statistics
FOREWORD
CHAPl'ER
1
2
3
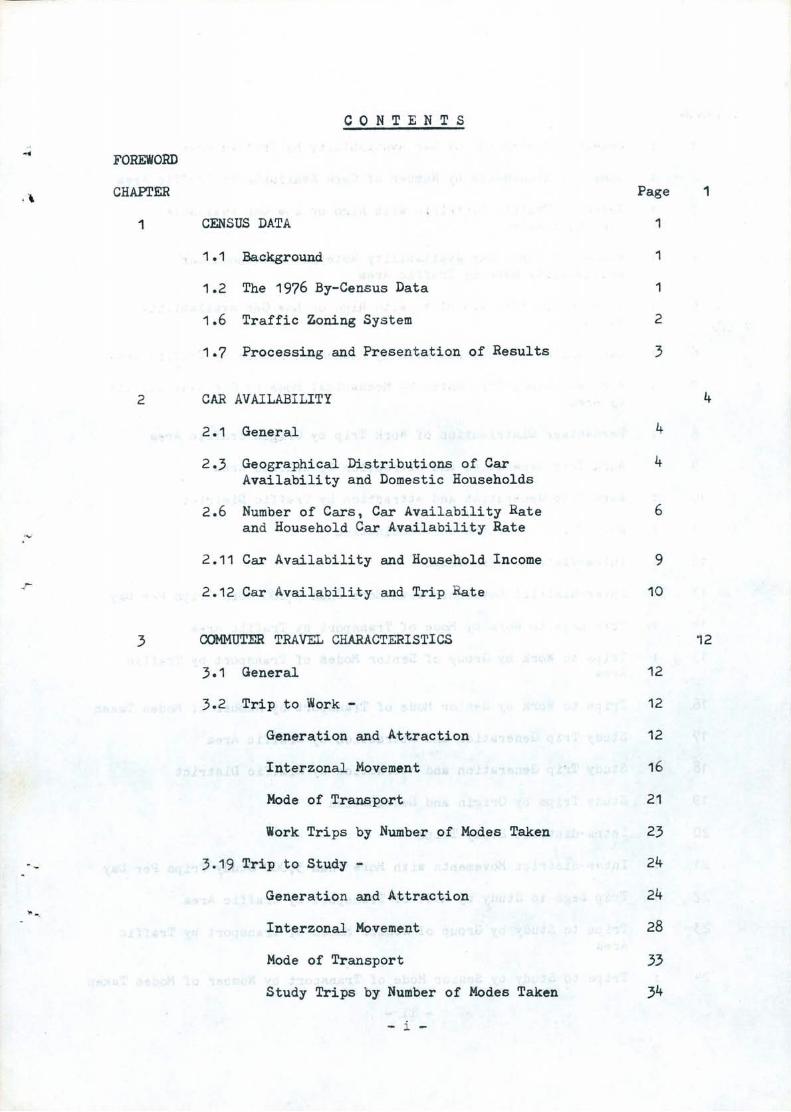
CONTENTS
CENSUS DATA
1.1 Background
1.2 The 1976 By-Census Data
1.6 Traffic Zoning System
1.7 Processing and Presentation of Results
CAR AVAILABILITY
2.1 General
2.3 Geographical Distributions of Car Availability and Domestic Households
2.6 Number of Cars, Car Availability Rate and Household Car Availability Rate
2.11 Car Availability and Household Income
2.12 Car Availability and Trip Rate
COMMUTER TRAVEL CHARACTERISTICS
3.1 General
3.2 Trip to ~ork -
Generation and Attraction
Interzonal . Movement
Mode of Transport
Work Trips by Number of Modes Taken
3.19 Trip to Study -
Generation and Attrac~ion
Interzonal Movement
Mode of Transport
Study Trips by Number of Modes Taken
- i -
Page
1
1
1
2
3
4
4
6
9
10
12
12
12
16
21
23
24
24
28
33
34
1
4
'1 2

TABLE
1
2
3
4
5
6
7
8
9
10
11
· · · · · · · · · · · ·
Domestic Households by Car Availability by Traffic Area
Domestic Households by Number of Cars Available by Traffic Area
Selected Traffic Districts with High or Low Car Available Household Rates
Number of Cars, Car Availability Rate and Household Car Availability Rate by Traffic Area
Selected Traffic Districts with High or Low Car Availability Rates
Car Available Household Rate by Household Income by Traffic Area
Work and Study Trip Rates by Mechanical Mode by Car Availability by Area
Percentage Distribution of Work Trip by Origin Traffic Area
Work Trip Generation and Attraction by Traffic Area
Work Trip Generation and Attraction by Traffic District
Work Trips by Origin and Destination
12 Intra-district Work Trips
13 Inter-district Movements with More Than 5,000 Work Trips Per Day
14 Trip Legs to Work by Mode of Transport by Traffic Area
15 Trips to Work by Group of Senior Modes of Transport by Traffic Area
16 Trips to Work by Senior Mode of Transport by Number of Modes Taken
17 Study Trip Generation and A~traction by Traffic Area
18 Study Trip Generation and Attraction by Traffic District
19 Study Trips by Origin and Destination
20 Intra-district Study Trips
21 Inter-district Movements with More Than 3,000 Study Trips Per Day
22
23
24
. · Trip Legs to Study by Mode of Transport by Traffic Area
Trips to Study by Group of Senior Modes of Transport by Traffic Area
Trips to Study by Senior Mode of Transport by Number of Modes Taken
- ii -

FIGURE
1(a) Number of Cars in Various Traffic Districts -
Urban Area
1(b) Number of Cars in Various Traffic Districts -
New Territories
2(a) Cars/1,OOO Population in Various Traffic Districts -
Urban Area
2(b) Cars/1, Ooo Populati on in Various Traffic Districts
New Territories
3 Scatter Diagram Showing the Positive Relationship between Car Available Household Rate and Household Income
4(a) Work Trip Generation and Attraction in Various Traffic Di stri cts - Urban Area
4(b) Work Trip Generat ion and Attraction in Various Traffic Districts - New Territories
5 Intra-district Work Trip Movements
6 Inter-district Movements with More Than 5,000 Work Trips Per Day
7(a) Study Trip Generation and Attraction in Various Traffic Dis t ricts - Urban Area
7(b) Study Trip Generation and Attraction in Various Traffic Districts - New Territories
8 Intra-district Study Trip Movements
9 Inter-district Movements with More Than 3,000 Study Trips Per Day
- iii -

APPENDIX
MAP
1 Population, Household and Car Availability By Traffic District
2 Number of Land Domestic Households by Household Income by Car Availability and by Traffic District
3 Number of Cars, Car Availability Rate and Household Car Availability' Rate by Traffic District
4 Trip Rates (Number of Trips Per Thousand Workers/Students) by Area by Car Availability and by Household Income
5 Trips" 'to Work 'Cl' ,Home Place ' by Work Place
6 Trip Legs to Work by Mode of Transport by Traffic District
7 TriPs to Work by Senior Mode of Transport by Traffic District
8 Trips to Study by Home Place by Work Place
9 Trip Legs to Study by Mode of Transport by Traffic District
10 Trips to Study :bySenior' Mode of Transport by Traffic District
1 Traffic ,Districts
, 2 Traffic Areas
- iv -

CHAPTER 1
CEHSUS DATA
Background
'1\ 1.1 Transport questio~s were first incorporated in the 1966 By-Census\ I,
and again in the 1971 ~ensus. Basei on the data from the latter, a report entitled "Hong Kong Population and Housing Cenus 1971, TRANSPORT CHARACTERISTICS" was published in 1974. The same data were used as guidelines and provided information for the design of a household interview survey which was carried out in 1973 as part of 'ch-e Hong Kong Comprehensive Transport Study and which was the most extensive ever taken in Hong Kong for transport planning purposes. The results of the survey were presented in an Interim Report No. 3 e\ltitled "Findings of Basic 'I'ravel Survey" of the Study, the final report(2) for which was published in 1976.
The 1976 By-Census Data
1 .2 A population by-census (a 10 per cent sample enquiry) was carried out by the Census and Statistics Department from Friday, 30th July to Sunday, 8th AU6Ust 1976. This offered another opportunity of studying household and personal transport characteristics by the household interview method and a means for updating the findings of the Comprehensive Transport Study and the previous censuses. Under household characteristics, every land domestic household sampled i n the By-Census was asked about car-ownership and cars which, though not owned, were nevertheless available for use by the household for the two weeks prior to the enumeration moment; under personal characteristics , every worker or student of the land popUlation was asked about his/her place of work or study and of his/her transport mode(s) taken on his/her journey to work or stUdy. '
1.3 Two points need to be made. First, every person journey recorded here refers to a home-based trip to work or study. Second, since the 1976 By-Census fell on the school summer holidays, data on journey to study refer to a normal occasion in the last school term, whereas those on journey to work refer to the last occasion.
•
(1) See Commissioner for Census and Statistics "Report of the By-Census 1966" Vol. 1 Appendix 3 and Vol. 2 Tables Nos. 103-106
(2) "Hong Kong Compreb,ensive Transport Study, 1976" by Hessrs. Wilbur Smith & Associates
1

104 Persons, person trips, cars and households are discrete observations and indivisible. The following are the definitions of the standard rates used in this report:
A "car available household rate" measures the integral number of land domestic households with car available per hundred land domestic households for a district or an area.
A "household car availability rate" measures the integral number of cars per hundred car available households.
A"car availability rate" measures the integral number of cars per thousand persons.
A "work trip rate" measures the integral number of work trips involving any mechanical transport mode per thousand workers.
A "study trip rate" measures the integral number of study trips involving any mechanical transport mode . per thousand students '.
1.5 The data on these characteristics were cross-tabulated with other ~ousehold and personal socio-economic variables available from the By-Census. They are presented in this report as a study of the 1976 By-Census transport data.
Traffic Zoning System
1.6 It is impracticable to describe individual person trips. So., apart from the socio-economic classifications used, a geographical classification is also needed. The resultant aggregates can then be systematically analysed. For comparison purposes, the system of traffic zones used in the Hong Kong Comprehensive Transport Study was employed to classify the By-Census data. The demarcation of these zones was based on land-use activities, physical barriers to movement and location of transport facilities. Zonal boundaries were determined to be consistent with Census Street Blocks and Tertiary Planning Units to provide broad comparability with other planning activities(3). There were 383 traffic zones in the Hong Kong Comprehensive Transport Study (4). For the presentation of data in this report, these zones were aggregated into 47 traffic districts as shown in Map 1 for display purpose as in the Hong Kong Comprehensive Transport Study. The traffic districts' were further grouped together to form traffic areas as shown in Map 2.
(3) See "Hong Kong Comprehensive Transport Study, 1976" p. 65 para. 4.12
(4) See Ope Cit. pp. 65-66
2 •
...

Processing and Presentation of Results
1.7 The 1976 By-Census being a 10 per cent sample enquiry, some 172 thousand workers and 124 thousand students in 102 thousand land households were enumerated. These people were asked about their work or study place which were subsequently coded into traffic zones described above. However, workers who happened to work at their own home or abroad (totalling 114,000 persons) were not included in the analysis of this report; nor were students who happened to study abroad last school term (totalling 8,550 persons). Therefore, only resident workers (totalling 1,602,490 persons) who made trips to their work place in Hong Kong and resident students (totalling 1,228,110 persons) who made trips to the study place in Hong Kong were considered in this analysis. Also, the home codes in terms of the Census Street Block code and Tertiary Planning Unit code were converted into the traffic zone codes.
1.8 Also because of the 10 per cent sample feature, an expansion factor of 10, in conformity with the practice of other By-Census publications, was used to gross the enumerated sample results up to the equivalent population size. Because of this, some caution is necessary in interpreting the resuits, especially when comparing them with the 1971 results which were either on a full census basis or on a 25 per cent sampie basis (5) (6). Note should also be tal{en of the separation of Tsuen Wan from the New Territories in this report, as on a traffic area basis it was merged with the New Territories in the 1971 data presentation. No comparison with the data from the Comprehensive Transport Study was made, mainly because of the different methodological basis.
(5) For details, see Census and Statistics Department, "Hong Kong Population and Housing Census 1971, TRANSPORT CHARACTERISTICS".
(6) As an indication of the size of the By-Census sampling errors, it is estimated that the error at 9~ degree of confidence for car availability household rates which are 10 or less households per 100 land domestic households ranges between 1 to 2 per 100, whereas for car availability household rates greater than 10 per 100, the error is 3 per 100.
- 3 -

CHAPTER 2
CAR AVAILABILITY
General
2.1 All land domestic households were asked the following two questions about car-ovmersh~p and car availability :
(i) How many cars are owned and available for use by members of the household?
(ii) In addition to those in (i) above, how many cars, though not owned, are available for the exclusive use of the members of the household during the two weeks prior to the enumeration moment?
2.2 For the purpose of transport analysis, car availability, i.e. the total number of cars in answer to the above two questions, is of main interest and is defined as the availability of cars for use by any members of a household during the two weeks prior to the By-Census enumeration moment, irrespective of whether owned or not. Cars here refer to any private cars or motor cycles including loaned cars, Pak-pai-ches owned by the household, company cars, or a relative's or friend's car left to the care of the household. Taxis, garaged cars and public cars were not included.
Geographical Distributions of Car Availability and Domestic Households
2. 3 Appendix 1 shows the distributions of population, domestic households, households with car available and car available household rates by traffic district, and Appendix 2 presents the distribution of domestic households by car availability, by household income group and by traffic district. Table 1 summarizes the car availabi l ity characteristics on a t r affic area basis, c~pared with figures from the 1971 Census.
2.4 87,960 land domestic households estimated from the 1976 By-Census had one or more cars available for their own use, representing an increase of 43 per cent or an average annual increase of 7 per cent over the 1971 Census figure. Although an increase was recorded for every traff ic area the percentage increase varied from 153 per cent or an average annual r ate of 20 per cent for the New Territories (including Tsuen Wan) to 16 per cent or an average annual r a te of 3 per cent for Kowloon. Table 2 shows further that there was a faster rate of growth in the number of multi-caravailable households than in the single car-available households over all the traffic areas.
4

~ ..
-- ' .
Table 1 Domestic Households by Car Availability by Traffic Area
Traffic area
Hong Kong Island (% of total)
Kowloon (% of total)
New Kowloon (% of total)
Tsuen Wan (% of total)
New Territories (excluding Tsuen Wan)
(% of total)
All areas (% of total )
Number of households
with no car
1976
210,430 (88)
1971
Num,ber of households
with car
1976 '
28 ,270 (12)
1971
23,437 (11)
175,280 , (91)
168 ,748 -, 16,640 '(92)'" ; , ,. (9)
14,362 (8)
329,090 , (93)
88 ,170 ) (93) )
)
99,360 ) ) )
(91 ) )
902,330 (91)
286,587 (94)
26,420 (7)
6 ,390 ) ,( 7) ) ,
) 10,240 )
) )
(9) )
87, 960 (9)
26,955 (6)
6,575 (5)
61,329 (7)
Total number of households
1976
238,700 (100)
1971
222,940 (100)
191,920 183,110 (100) (100)
355,510 (100)
94,56b ) (100) )
) 109,600 )
) )
(100) )
990,290 ( 100)
303,542 (100)
13'1,078 (100)
846,670 (100)
Table 2 Domestic Households by Number of Cars Available by Traffic Area
Traffic area
(home place)
Hong Kong Island (% of total)
Kowloon (% of total)
New Kowloon (% of total)
Tsuen Wan (% of total)
New Territories (excluding Tsuen, Wan)
(% ,of tota 1)
All areas (% of total)
Number of cars available
One 1976 1971
22,140 (78)
14,390 (86 )
23,080 (87)
5,420 ) ( 85 ) )
)
17, 864 (87)
10,893 (91)
12,317 (90)
7 ,680 ' ) ' 4 ,269 ' , ) (91) , )
(75 ) · )
72.710 (83)
- 5 -
Two or more 1976 1971
6,130 (22)
, 2 ,250 (14)
970 ) (15) )
1,391 (10)
) "2,560 ) - 437
) , (9 ) )
,, (25) )
15 ,250 ( 17)
5,425 (11)
Total 1976 1971
28,270 ,( 100)
16,640 (100)
26,420 (100)
6,390 ) (100) )
) 10,240 )
)
)
(100) )
87,966 (100)
20,429 (100)
11 ,925 (100)
13,708 (100)
4,706 (100)
50,768 (100)

2.5 This ' consist,ent increase in household , car availability over all traffic areas resulted in an overall car available househol d rate of 9 cars per hundred households estimated for the 1976 By-Cens~s period, as compared with the 1971 Census figure of 7 cars per hundred households. Variations among the traffic districts are prominent, as evidenced by the wide range of rates indicated below ,in Table 3.
Table 3 Selected Traffic Districts with High or Low Car Available Household Rates
Selected traffic districts with high rate
Peak and Mts. Cameron and Nicholson
King's Park
Kadoorie Hill
Shouson Hill/Deepwater Bay/South Bay/ RepUlse Bay
Kowloon Tong
Mid-levels (West)
Wong Nei Chung/Stubbs Road
Pokfulam
Selected traffic districts with low rate
Kai Tak
Outlying Islands
Cheung Sha Wan
Chai Wan
Sheung Wan
Number of car available land domestic households/
hundred land domestic households
70
67
44
43
41
o
1
3
4
4
Number of Cars, Car Availability Rate and Household Car Availability Rate
2.6 Appendix 3 shows the distributions of cars, car availability rates and household car availability rates by traffic district. Figures lea) and (b) present a picture of the number of cars in various districts, and Figures 2r;) and (b) a similar picture of the car availability rates.
6 -
' . . .
. '.

2.7 The total number of cars estimated from the 1976 By-Census was 110,720, as compared with the 1971 Census figure of 57,179. At the end of August 1976, the total number of private cars and motor cycles registered with the Transport Department was 134,626 (see Table 7.11, Monthly Digest of Statistics, August 1976, Census and Statistics Department). The discrepancy could be explained mainly by
(i) different coverage, e.g. some company cars not count.ed in the By-Census and garaged cars were included in the Transport Department's figure;
(ii) cars owned by collective households and marine households were not included in the 1976 By-Census figure but were included in the Transport Department's figure; and
(iii) sampling variation.
2.8 Whereas there was a consistent increase in the number of cars across the traffic areas, Table 4 shows that the geographical percentage distribution changed, as compared with that of 1971. The biggest change took place in the New Territories (including Tsuen Wan) which had an increase from 9 per cent in 1971 to 20 per cent estimated for 1976. On other hand, both Hong Kong Island and Kowl'oon expeI-i'enced a 'decrease from 41 per cent to 34 per cent and from 23 per cent ·to · 18 per cent 'respectively. New Kowloon remained virtually the same. Table 4 also shows that the car availability rates and household car availability rates increased consistently across the traffic areas between 1971 and 1976.
Table 4 Number of Cars, Car Availability Rate and Household Car Availability Rate by Traffic Area
Traffic area
(home place)
Hong Kong Island C% of all areas)
Kowloon (% of all areas)
New Kowloon (% of all areas)
Total number of cars
available
1976
37,410 (34)
20,010 (18)
31,390 (28)
1971
23,438 (41)
15,351 (27)
Car availability Cars avail~ble
rate (cars per per hundred
thousand persons) car-available domestic households
1976 1971 1976 1971
38 24 132 114
28 19 120 110
20 10 119 , 111
7

Table 4 (Cont'd)
Total number . Car a vailability Cars available
of cars rate (cars per per hundred car-available
Traffic available thousand persons) domestic households
area (home place) 1976 1971 1976 1971 1976 1971
Tsuen Wan 7, 840 ) 18 ) 123 )
(% of all areas) ( 7) ) ) )
) ) )
New Territories 14,070 ) 5,252 30 ) 8 137 ) 111 (excluding Tsuen ) (9)
) )
Wan) ) ) )
(% of all areas) (13) ) ) )
All areas 110,720 57,179 27 15 126 112 (% of all areas) (100) (100)
2.9 Traffic districts with high car availability rate and those with low car availability rate are indicated below in Table 5.
Table 5 Selected Traffic Districts with High or Low Car Availability Rates
Selected traffic districts with high rate
Peak and Mts. Cameron and Nicholson
King's Park
Shouson Hill/ Deepwater Bay/South Bay/ Repulse Bay
Mid-levels (West)
Wong Nei Chung/Stubbs Road
Kowloon Tong
Kadoorie Hill
Pokfulam
Selected traffic districts with low rate
Kai Tak
Outlying Islands
Chai Wan
Kwun Tong (south)
8
Number of Cars per thousand population
344
303
205
157
150
147
142
135
0
5
9
11
--.-
"--
"'\.'-
.. -
< ..
,-
Tabl e 5 (Cont 'd)
Se l ected traffic districts with l ow rate
Cheung Sha Wan 11
Ngau Tau Kok 12
Sheung Wan 13
2.10 Table 2 shows the number and percentage distribution of car-available domestic households by the number of cars available by traffic area. Even though the number of households with one car available increased across the traffic areas, their proportions among the car-available households dropped implying a faster proportional increase in the number of domestic households with two or more cars available, when compared with the 1971 situation.
Car Avai l ability and Household Income
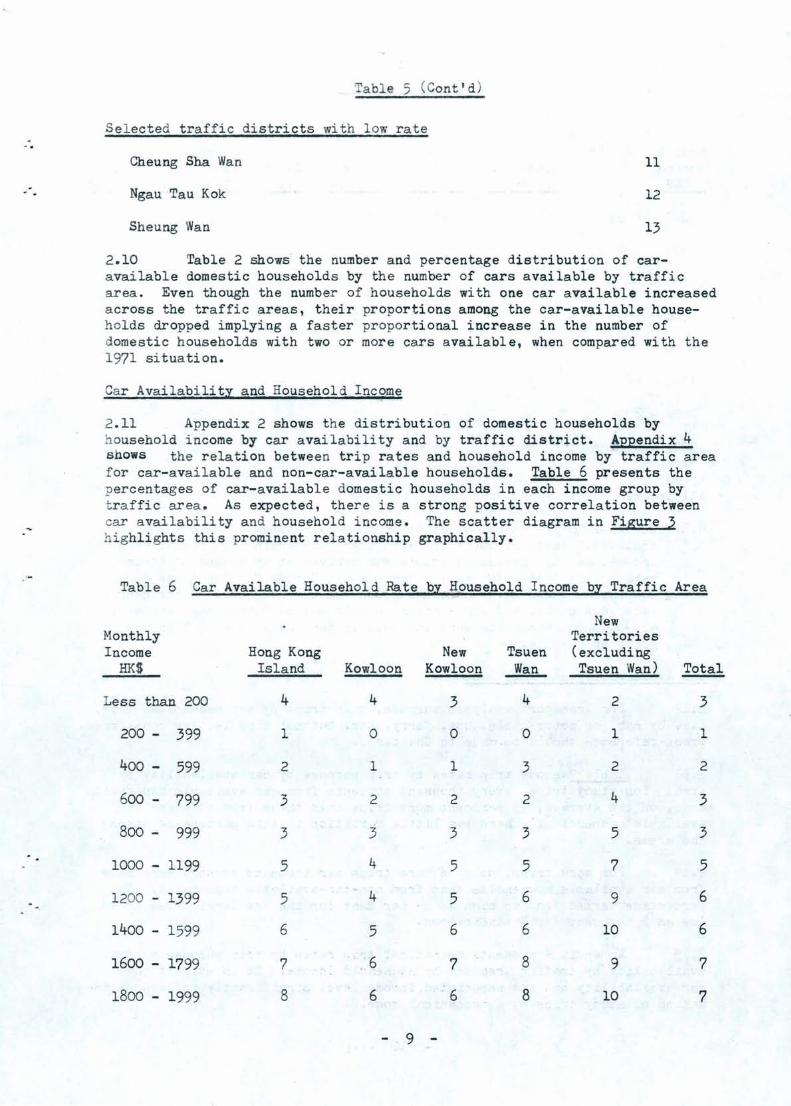
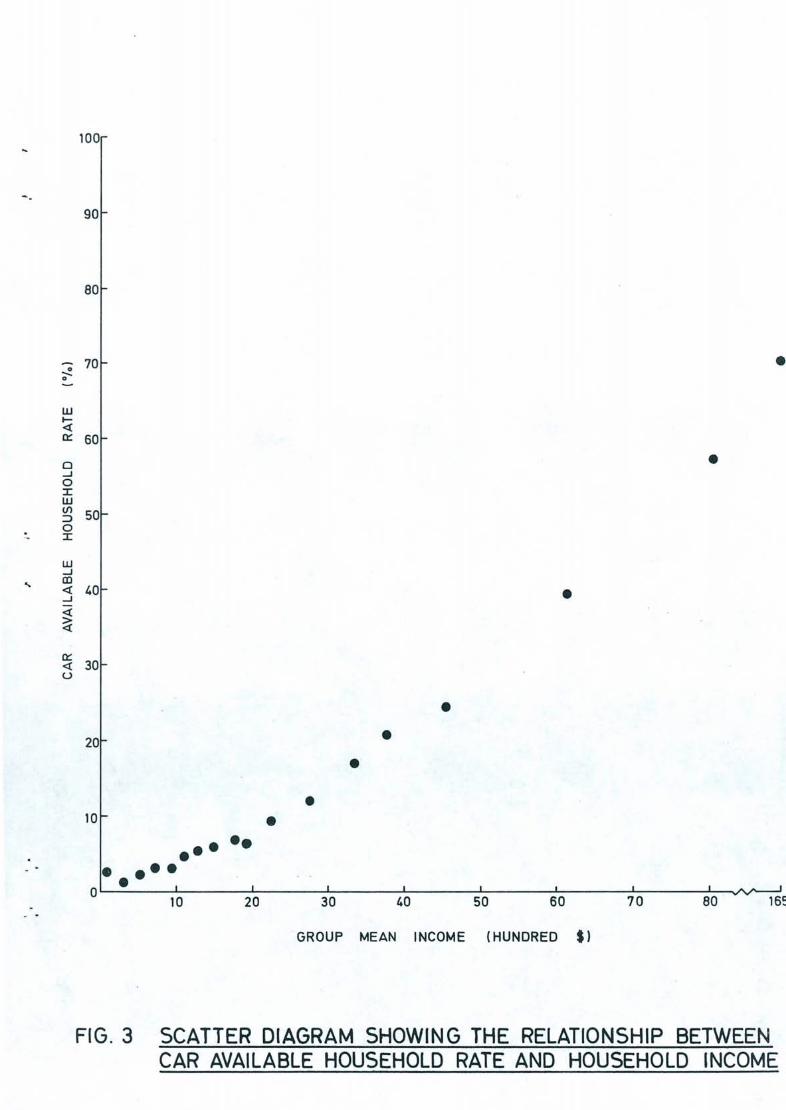
2.11 Appendix 2 shows t he distribution of domestic households by household income by car availability and by traffic district. Appendix 4 shows the relation between trip rates and household income by traffic area f or car-avai lable and non-car-available households. Table 6 presents the percentages of car-available domestic households in each income group by t raffi c area . As expected, there is a strong positive correlation between car availability and househOld income. The scatter diagram in Figure 3 hi ghlights this prominent relationship graphically.
Tabl e 6 Car Available Household Rate by Household Income by Traffic Area
New Monthly Territories Income Hong Kong New Tsuen (excluding
HKS Island Kowloon Kowloon Wan Tsuen Wan) Total
Less than 200 4 4 3 4 2 3
200 - 399 1 0 0 0 1 1
400 - 599 2 1 1 3 2 2
600 - 799 3 2 2 2 4 3
800 999 3 3 3 3 5 3
1000 - 1199 5 4 5 5 7 5
1200 - 1399 5 4 5 6 9 6
1400 - 1599 6 5 6 6 10 6
1600 - 1799 7 , 6 7 8 9 7
1800 - 1999 8 6 6 8 10 7
9

Table 6 (Cont'd )
New Territori es ( excluding
Monthly Income
HK$ Hong Kong Isla nd Kowloon
New Kowloon
Tsuen Wan Tsuen Wan) Total
2000 - 2499
2500 - 2999
3000 - 3499
3500 - 3999
4000 4999
5000 - 6999
7000 - 8999
9000 and over
All income groups
9
9
15
17
22
56
76
12
9
12
13
20
21
34
49
64
9
8
11
16
21
7
9
13
13
19
24
33
7
18
20
27
31
39
57
76
63
9
10
12
16
20
23
39
56
71
9
N.B. In the 1976 By-Census, no question on total household income was included. Instead, questions were asked concerning individual personal income, and the household income was arrived at by adding up these personal incomes. Household income would become "0" for those households whose wage':'earners were 'not in the household at the census reference night, and whose other members had no "other cash income". 46,900 such households were included in the "Less than 200" income group as a whole.
Car Availability and 'Trip Rate-"
2.12 For transport analysis purpose, only trips by any mechanical mode, i.e. by car, or motor cycle, bus, ferry, etc. but not bicycle, are considered. Cross-reference should be made to Chapter 3.
2.13 Table 7 shows trip rates by trip purpose by car availability by area. For study trips, every thousand students from car available households made, on the average, 53 per cent more trips than those from non-caravailable households. There was little variation in this percentage across the areas.
2.14 For work trips, only 4% more trips per thousand workers were made from car available households than from non-car-available households. The percentage varied from as high as 24 per cent for the New Territories to as low as 1 per cent for Urban Kowloon. '
2.15 Appendix 4 presents mechanical trip rates by trip purpose by car availability by traffic area and by household income. It is evi dent that car availability and its associated income level significantly influences the making of study trips by a mechanical mode.
10

Table 7 Work .and Stud:£. TriE ·Rates bl Mechanical Mode b:l Car Availability . by Area . . .
Trips rate per thousand Trip rate per thousand workers of students of .. households househ olds'
households with households with Area with car no car percentage with car no car percentage
(home Elace) available available difference available available difference
Hong Kong 692 642 + 8 641 425 +50 Island
Urban Kowloon 654 647 + 1 503 336 +50 ( including Tsuen Wan)
New Terri- 489 395 +24 465 302 +54 tories
( excluding Tsuen Wan)
All Areas 647 622 + 4 536 351 +53
11

CHAPTER 3
COMMUTER. TRAV~CH~CTERISTICS
General
3.1 For the purpose of commuter travel analysis, a worker was defined as a person who was working 15 hours or more during the seven days preceding the By-Census enumeration moment and who made a trip, whether by mechanical means or not, to work; and a student was defined as a person who was last term att.ending. full time an ,educational, j.nst,i t~Uon and .wtlc) !JI3.d~a t~ip, whether by mechanical means or not, to school. These people were asked the following two questions:
(i) Where was your last place of work or study? (This posed no problem for those with a fixed place of work or study. For those with no fixed place of work or study, they were asked which was the first place they went to on the last occasion. )
(ii) What mode(s) of transport did you take when you went to work last time, or those you normally took when you went to school last term ?
, This chapter presents the results obtained from these questions.
Trip to Work - Generation and Attraction
3.2 A journey or trip must have a starting point, or or~g~n, and a finishing point,or destination,in order to accomplish a purpose. In transport planning, a trip is said to be generated at the origin and attracted to the destination. In this analYSiS, the origin of a trip is invariably the home place of the respondent and the destination his/her work place.
3.3 Appendix 5 shows a trip matrix for trips to work by origin and destination. Some 1,602 thousand workers who made a trip to work daily were estimated from the By-Census data. The percentage distribution by traffic area is summarised and compared with that in 1971 below.
Table 8 Percentage Distribution of Work Trips by Origin Traffic Area
Traffic area (home place)
Hong Kong Island
Kowloon
New Kowloon
Tsuen WaIl
New Territories (excluding Tsuen Wan)
-12 -
m§.
25
18
38
10
9
20
39
15

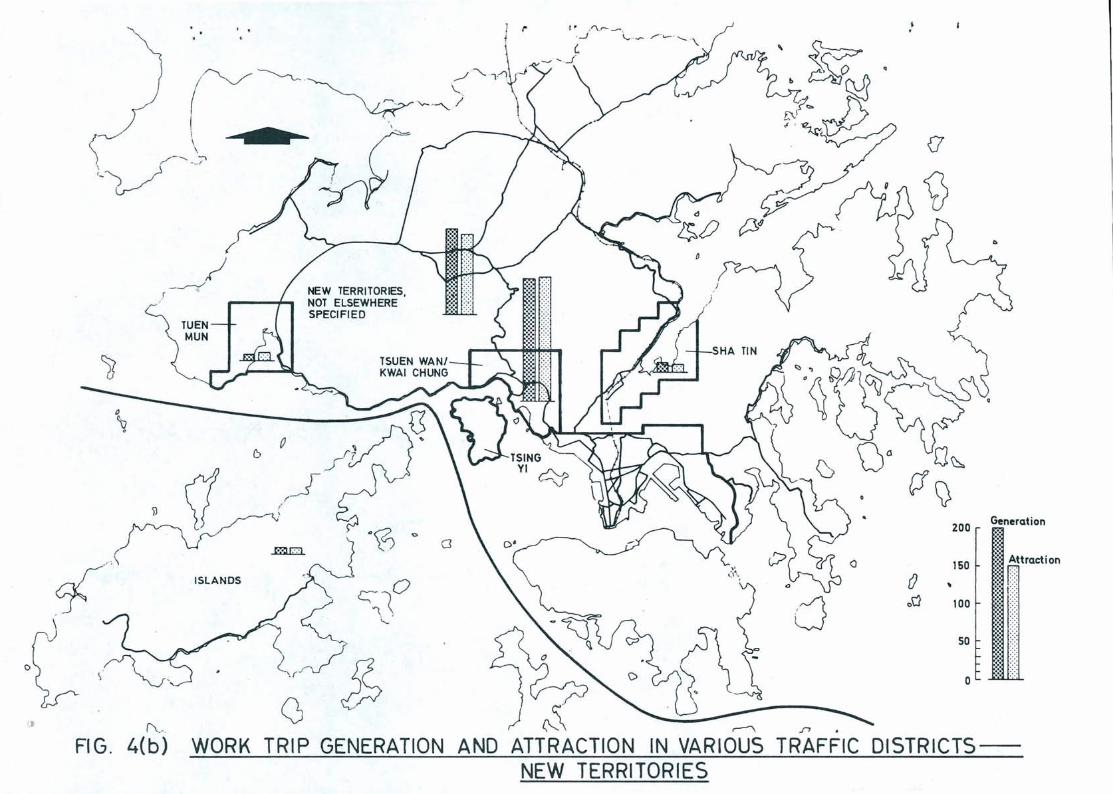
3 . 4 Table 9 shows t he work trip generation and attraction by traffic area. New Kowloon was still both t he l a rges t work trip ge~erator and attrac t or.
Tabl e 9 Work Trip Generation and Attraction, ?y Traff ic Area
Turnover Work trips Work trips Net work trips (generation +
Traffic generated attracted generated attraction) area 1976 1971 1976 1971 1976 ,1971 1976
Hong Kong 392,490 406 ,130 452, 960 422,794 - 60 ,470 -16, 664 845,450 I s land
Kowloon 287,130 306,777 347 ,990 320,910 - 60,860 -14,133 635,120
New Kowloon 615,450 593,734 500 ,900 556 , 659 +114,550 +37,075 1,116,350
Tsuen Wan 161,980) 162, 990 ) 1,010) 324,970) ) ) ) )
New 145 ,440) 137, 650) + 7,790) 283~090) Territori es ) 232,407 ) 238 ,685 ) - 6,278 ) (excluding ) ) ) ) Tsuen Wan ) ) ) ) )
All a reas 1 , 602 ,490 1,539,048 1 , 602,490 1,539,048 3,.:204,980
~ 3.5 Hong Kong Island, Kowloon and Tsuen Wan attracted more trips than t hey generatedo This is consistent with the fact that major commercial and industri al districts with large employment size are concentrated ' on' Hong Kong I sland, Kowloon, New Kowloon and Tsuen Wan. The turnover (generation plus attraction) f igures show the daily total home-based work trips into and Qut of a traffic area. ' , . . ,
3 . 6 Table 10 shows the generation and attraction of work trips by traffic district. From the tabl e, it is evident that commercial districts such as Central, Tsim Sha Tsui, Mong Kok/Tai Kok Tsui and Sheung Wan, and industrial districts like Cheung Sha Wan, Kwun Tong (East) and Kai Tak, being employment centres, were large net a~tractors. '
Table 10 Work Trip Generation and Attraction by Traffic Di~trict
Net work Turnover Work trips Work ,trips trips (generation +
Traffic district generated attracted generated attraction)
Central 9 ,130 125,890 -116,760 135,020
Sheung Wan 19,290 37,290 - 18,000 56,580, '
1971
828,92Lr
627,687
1,150,393
471,092
3,078,096

Table 10 (Cont'd)
Net work Turnover Work trips Work tri ps trips (generation +
Traffic district generated attracted generated attraction) "
Western 56,760 38,060 18,700 94,820
(West) 9 ,630 5 ,600 24,860 "'-Mid-levels 15,230
Wan Chai 50,230 53,980 - 3,750 104,210
Causeway Bay/ 17,590 26,460 - 8,870 44,050 Happy Valley
North Point 51,250 43,430 7,820 94,680
Tai Koo 17,500 20 , 770 - 3,270 38,270
Shau Kei Wan 36,210 17,020 19,190 53,230
Chai Wan 30,320 17,740 12,580 48,060
Tal Hang/Braemar 13,150 4, 550 8,600 17,700
Wong Nei Chung/ 13,220 8,410 4,810 21,630 Stubbs Road
Peak/Mts. Cameron 3,890 3,700 190 7,590 and Nicholson
Pokfulam 4,640 5,170 530 9,810 -~
Aberdeen/Wah Fu 47,770 33,930 13,840 81,700
Shouson Hill/ Deepwater Bay/ 2,430 2,930 500 5,360 South BayjRepulse Bay
Chung Hom Kok/ 3,140 3,160 20 6 ,300 Stanley
Shek OjMt. Parker 740 840 100 1,580
Hong Kong Island 392,490 452,960 - 60,470 845,450
Tsim Sha Tsui 27,730 84,620 - 56,890 112,350
Yau Ma Tei 61,740 60 ,270 1, 470 122,010
Mong Kok,trai 67,680 91,710 - 24,030 159,390 Kok Tsui
King's Park 740 4,360 - 3, 620 5,100
Ho Man Tin 32,290 8,630 23,660 40,920
- 14 -

Table 10 (Cont'd)
Net work Turnover Work trips Work trips trips (generation +
' .' Jj Traffic district generated attracted generated attraction)
Hung Horn 27,490 25,270 2,220 52,760 " . ..
To kwa Wan 60,450 63,930 - 3,480 124,380
Kadoorie Hill 9,010 9,200 190 18,210
Kowloon 287,130 347,990 - 60,860 635,120
Sham Shui Po 108,840 94,860 13,980 203,700
Shek Kip Mei/ 45,680 8,840 36,840 54 ,520 Pak Ttn
Cheung Sha Wan 9,900 55,550 - 45,650 65,450
Kowloon Foothills 830 920 ~ 90 1,750
Lai Chi Kok/Mei Foo 17,900 10,560 7,340 28,460
Kowloon Tong 11. 020 9,060 1,960 20,080
San Po Kong/ Kowloon City/ 112,380 124,090 - 11,710 236,470 Wang Tau Hom/ Wong Tai Sin
---Chuk Yuen/Tai Horn 82,380 19,110 63,270 101,490 Chuen/Tsz Wan Shan
Hammer Hill/Choi 24,940 5,280 19,660 30,220 Hung/Ping Shek
Kai Tak 140 12,230 - 12,090 12,370
Kowloon Bay 2,310 2,540 230 4,850
Ngau Tau Kok 26,500 7,240 19,260 33,740
Kwun Tong (Central) 111,360 30,590 80,770 141,950
Kwun Tong (East) 4,200 107,040 -102,840 111,240
Anderson Road 4,430 300 4,130 4,730
Kwun Tong (South) 52,640 12,690 39,950 65,330
New Kowloon 615,450 500,900 114,550 1 ,116,350
Tsuen Wan/ Tsing Yi/ 161,980 162,990 1,010 324,970 Kwai Chung
- 15- -

'rable 10 (Cont'd)
Net work Turnover Work trips Work trips trips (generation +
Traffic district generated attracted generated attraction)
New Territories not elsewhere 113,860 106,280 7, 580 220,140 specified
Outlying. Islands 9,970 9,570 400 19,540
Tuen Mun 9,760 10,910 -1,150 20,610 Slia Tin 11,850 10,890 960 22,740 New Territories (excluding Tsuen 145,440 137,650 7,790 283,090 Wan
Grand Total 1,602,490 1,602,490 3,204,980
3.7 Figures 4(a) and (b) present a visual display of the distribution of work trips by traffic district.
Trip to Work - Interzonal Movement
3.8 Table 11 summarizes the distribution of work trips by or1g1n and destination by traffic area. Of the 1~602 thousand work trips, about 1,044 thousand or 65 per cent were intra-area trips, i.e. !rips with their origin and destination in the same traffic area. The percentage varied from 82 per cent on Hong Kong Island to 55 per cent in Kowloon. There were 200,150 cross harbour work trips, representing 36 per cent of all inter-area work trips (558 thousand) or 12 per cent of all work trips and they were 74 per cent more than the 1971 Census figure of 115,088, representing an average annual growth rate of 12 per cent since 1971.
Table 11 Work Trips BI Origin and Destination bI Traffic Area Work trip destination
New Territories
Work trip Hong Kong New Tsuen (excluding To all origin Island Kowloon Kowloon Wan Tsuen Wan) destinations
Hong Kong 322,650 31,320 29,990 5,470 ·3,060 392,490 Island (% of total) (82) (8) (8) (1) (1) ( 100)
Kowloon 43,100 156,500 65,260 15,500 6,770 287,130 (% of total) (15) (55) (23) (5) (2) ( 100)
New Ko.loon 68,930 128,710 364,490 38,360 14,960 615,450 (% of total) (11) (21) (59) (6) (2) (100)
Tsuen Wan 11,970 21,110 29,100 93,360 5,440 161,980 (% of total) (7) (13) (18) (58) 0) (100)
- 16 -
.. .
--
---

~I
"-
Table 11 (Cont ' d)
New Territories
Wor k trip Hong Kong New Tsuen (excluding To all origin Island Kowloon Kowl oon Wan Tsuen Wan) destinations
New Terri-tories 6,310 10 ,350 12,060 9,300 107 ,420 145,440 (excludi ng Tsuen Wan ) (% of total ) (4) ( 7) (8) (6) (74) (100)
From all 452 ,960 347,990 500,900 162 ,990 137,650 1,602,490 ori gins (% of total) (28) (22) (31) (10) (9) ( 100)
3. 9 Viewed from t he destinati on end , t he percentage of the intra-area work trips differed from t ha t viewed a t the ori gin end , though the absolute numbers remained the same . 71 per cent of the work t rips attracted to as against 82 per cent generated from Hong Kong I s l and and 45 per cent to as against 55 per cent from Kowl oon were intra-area tri ps.
3.10 Tabl e 12 presents the di s tribution of intra-district work trips by t raffic district. The percent ages r eveal how far the intra-district trips a ccounted for the t otal genera t ion and attraction in a district and also how f ar, as a complement, the outward t r ips generated with i n a district were ba l anced by the i nward t r i ps attracted fro m other distric t s. These facts can be seen more clearly when the per centage points are plotted on Figure 5. Points on or near the 450 line i ndicate distri ct s with bal anced outward and inward trips and those above and to t he left of it i ndi cat e di stricts with l ess inward than outward trips or they are net generators and vice versa for those below and to the right of i t.
Table 12 I nt ra-distri ct Work Trips
I ntra-district Intra-district Number of trips as % of t~ips as % of intra- di strict tot al work total work
Traffic district work trips trips generated trips attracted ;
Centr a l 5 ,530 61 4
Sheung Wan 8,280 43 22
West ern 20,810 37 55
Mid-levels (West ) 3, 850 25 40
Wan Chai 17,660 35 33
Causeway Bay/ 3, 900 22 15 Happy Valley
Nort h Point 13, 160 26 30
- 17 -

Table 12 (Cont'd )
Intra-district Intra-district Number of trips as % of trips as % of intra-district total work total work
Traffic district work triEs triEs generated triEs attracted -
Tai Koo 4,580 26 22
Shau Kei Wan 8, 190 23 48
Chai Wan 9,930 33 56
Tai Hang/Braemar 1,630 12 36
Wong Nei Chung/ 3,540 27 42 Stubbs Road
Peak/Mts. Cameron 1,.650 42 45 and Nicholson
Pokfulam 1,550 33 30
Aberdeen/Wah Fu 21,440 45 63
Shouson Hill/Deep Water Bay/South Bay/ 620 26 21 Repulse Bay
Chung Hom Kok/Stanley 1,570 50 50
Shek O/Mt. Parker 400 54 · 48
Hong Kong Island 322,650 82 71
Tsim Sha Tsui 13,820 50 16
Yau Ma Tei 19,010 31 32
Mong KOk/Tai Kok Tsui 24,550 36 27
King's Park 550 74 13
Ho Man Tin 1,980 6 23
Hung Hom 6,040 22 24
To Kwa Wan 19,690 33 31
Kadoorie Hill 1,650 18 18
Kowloon 156,500 55 45
Sham Shui Po 35,960 33 38
Shek Kip Mei/pak Tin 4,520 10 51
- 18 -

Table 12 (Cont'd)
Intra-district Intra-district Number of trips as % of trips as % of intra-district total work total work
- -Traffic distr"!.g1 work trips trips generated trips attracted
Cheung Sha Wan. 3,910 39 7
Kowloon Foothills 30 4 3
18.i Chi Kokjl1ei Foo 1 ,840 10 17
Kowloon Tong 2,220 20 25
San Po Kong,!K,:)wloon City/Wang Tau Homl 45 ,520 41 37 Wong Tai Sin
Chuk Yuen/Tai Hom 10,530 13 55 Chuen/Tsz Wan Shan
Hammer Hill/Choi 1,640 7 31 Hung/Ping Shek
Kai Tak 120 86 1
Kowloon Bay 100 4 4
Ngau Tau Kok 2,590 10 36
Kwun Tong (Cent"ral) 16,000 14 52
Kwun Tong (East) 1,880 45 2
Anderson Road 60 1 20
Kwun Tong (South) 6,230 12 49
New Kowloon 364,490 59 73
Tsuen Wan/Tsing Yil 93,360 58 57 Kwai Chung
New Territories, not 8},940 74 79 elsewhere specified
Outlying Islands 7,500 75 78
Tuen Hun 5,460 56 50
Sha Tin 4,,440 37 41
New Territories (ex- 107;420 74 78 eluding Tsuen Wan)
- 19 -

3.11 Thus typical traffic districts with balanced inward and outward work trips included Hung Hom, Yau Ma Tei, Wan Chai and Tsuen Wan where mixed development (residential/industrial/commercial) exists. Typical net work trip generators included Chuk Yuen/Tai Horn Chuen/Tsz Wan Shan, Shek Kip Mei/Pak Tin, Shau Kei Wan, Mid-levelR(West) and Tai Hang which are major residenti al areas. Typical net work trip at tractors included Kai Tak, Kwun Tong (East and South), Tsim Sha Tsui and Central which are major commercial or industrial centres.
3.12 Table 13 lists 28 inter-district movements with more than 5,000 work -trips per day in descending order of magnitude; these movements are illustrated in the spider network in Figure 6.
3.13 It can be seen that the heaviest movements were associated with the districts in New Kowloon and Tsuen Wan, the heaviest one being 32,320 work trips per day from Kwun Tong (Central) to Kwun Tong (East). On Hong Kong Island heavy movements were al l associated with Central, the heavi est one being 10,830 work trips per day from Western to Central. In Kowloon, the heaviest movement was from Sham Shui Po to Mong Kok/Tai Kok Tsui with 9, 240 work trips per day.
Table 13 Inter-district Movements with More Than 5,000 Work Trips Per Day
Kwun Tong (Central) - Kwun Tong (East)
Chuk Yuen/Tai Hom Chuen/Tsz Wan ShanSan Po Kong/Kowloon City/Wang Tau Hom/ Wong Tai Sin
Kwun Tong (South) - Kwun Tong (East)
Western - Central
Sham Shui Po - Tsuen Wan/Tsing Yi/Kwai Chung
North Point - Central
Tsuen Wan/Tsing Yi/Kwai Chung - Sham . Shui Po
Wan Chai - Central
Sham Shui Po - Mong Kok/Tai Kok Tsui
Kwun Tong (Central) - San Po Kong/Kowloon City/Wang Tau Hom/Wong Tai Sin
Tsuen Wan/Tsing Yi/Kwai Chung - Cheung Sha Wan
San Po Kong/Kowloon City/Wang Tau Hom/ Wang Tai Sin - Kwun Tong (East)
Shek Kip Mei/Pak Tin - Sham Shui Po
- 20 -
32,320
18,930
14,240
10,830 .
10,500
9,890
9,580
9,450
9,240
9,110
8 550 ,
7,980
7,780

".
Table 13 (Cont'd)
Chuk Yuen/Tai Hom Chuen/Tsz v/an Shan -Kwun Tong (Eas t)
Tsuen Wan/Tsing Yi/Kwai Chung - Mong Kok/Tai Kok Tsui
New Territories, not elsewhere specified -Tsuen Wan/Tsing Yi/ Kwai Chung
Yau Ma Tei - Mong Kok/Tai Kok Tsui
Yau Ma Tei - Tsim Sha Tsui
Mid-levels (West) - Central
San Po Kong/Kowloon City/Wang Tau Hom/ Wong Tai Sin - To Kwa Wan
Mong Kok/Tai Kok Tsui - Sham Shui Po
Sham Shui Po - Tsim Sha Tsui
Aberdeen/Wah Fu - Central
San Po Kong/Kowloon City/Wang Tau Hom/ Wong Tai Sin - Tsuen Wan/Tsing Yi/Kwai Chung
San Po Kong/Kowloon City/Wang Tau Hom/ Wong Tai Sin - Mong KOk/Tai Kok Tsui
Ngau Tau Kok - Kwun Tong (East)
San Po Kong/Kowloon City/Wang Tau Hom/ Wong Tai Sin - Tsim Sha Tsui
Western - Sheung Wan
Trip to Work - Mode of Transport
7,290
7,230
7,150
6,740
6,140
6,110
5,900
5,870
5,720
5,630
5,560
5,440
5,390
5,380
5,300
3.14 The choice of mode of transport is affected by car availability, the availability of public transport, income, value of travel time, perceived cost, the prevailing traffic conditions and, may-be, personal taste as well. A person travelling between two places may take one, two or several modes of transport. For instance, he may take a public light bus first, then a ferry, and finally a public bus. The whole trip is called a multi-modal or linked trip and consists of several trip legs, each of which involves the use of 'a. mode and a modal transfer from the mode of the preceding leg. When one or more mechanical modes of transport are i nvolved, the entire trip is represented by the mechanical modes and the non-mechanical mode, i.e. walk, is disregarded.
3.15 Appendix 6 shows the number of trip legs to work by mode of transport and by home place, whilst Table 14 summarises the distribution of trip legs by group of modes of transport and by work place.
- 21 -

Table 14 Trip Legs to Work by Mode of Transpor t by Traffic Area
Mechni cal mode
Total Public transport
Traffic area Trip legs Personal transport (Public Light
(work place) to work (car, taxi , Pale Pai Bus, bus, tram, motor cycle ) train, ferry)
Hong Kong Island 547,940 23 ,780 393,910
Kowloon 382,380 15,030 255,550
New Kowloon 543,060 14,450 348 ,930
Tsuen Wan 179,030 4,3 10 121,510
New Territories 149, 610 5,740 65,3 10 (excluding Tsuen \tJan)
All Areas 1 , 802,020 63 , 810 1 , 185 , 210
Non-mechanical mode (walk)
130,250
111,800
179 680 ,
52 ,71 0
78 ,560
553 000 ,
3.16 For analysis purpose, it is sometimes necessary to use one mode to refer to a multi-modal trip which as previously explained consists of several trip legs and hence several modes. This needs an ordering of the modes based on some criterion. For the purpose of calibrating the transport models developed in the Comprehensive Transport Study, the following .descending seniority order of modes has been used:-
1 • Public Light Bus
2. Ferry
3. Private bus
4. Tram (including Peak Tram)
5. Train
6. Public bus
7. Private car
8. Motor cycle
9. Taxi
10. Pak Pai
11 • Walk
- 22 -
. .
."

--
For example, if a multi-modal trip involves the use of a Public Light Bus ; then a ferry and finally a t ram, t he whole linked trip will be rererred to by the most senior mode i .e. Publ ic Li gh t Bus .
3.17 Appendix 7 shows t he number of linked work trips by senior , mode or transport and by home place, whil st Table 15 summarizes these work trips by work place by group of senior modes of transport. Relating back to th~ trip legs in Table 14 every thous and l inked mechanical work trips conslst~~ of 1,190 trip l egs on the average, as compared with the corresponding 1971 Census figure of 1 ,048, representing an increase of 35 per cent or 14,2 trip legs pe~ thousand linked work trips.
Table 15 Trips to Work by Group of Senior Modes of Transport by Traffic Area
Mechrtical mod:e Total
Public trans,P9rt linked Traffic work Personal transport (Public Light Non-area (car~ taxi, Pale Pai Bus, pus. tram~ toechanical ( work plac'e) ,tr.tps motor cycle) train. , t~H.y} ~bd~ (W~l,i:j
Hong Kong Island 452,960 19 ,270 303,440 . ~ .. ;'
130~250
Kowloon 347,990 11 , 920 224,270 111- ,806
New Kowloon 500,900 12,160 309,060 179,680
Tsuen Ylan 162,990 4,790 105,490 52,71'0
New T-erritories 137 ,650 5,050 54,040 78,560 (excluding Tsuen Wan)
All areas 1,602 ,490 53,190 996,300 , 553,000
W'O~k Trips .Jt)y Number of Mo'd'e.s ,Takien
3.18 TabJ:'e 16 shows the rtwil'ber of work thps by senior mode of traiU3port :by the number of modes taken. Of the total work trips~ about 35 :per c~:nt 9f the trips involved no mechanical mod.e; 54, per c~nt, on:e me6~anic;al , Dl~<lel 11 Jier cent two m'echanlcal modes; less than 1 percent, three 'lD!ech'~el~~ 'iiioii'Efs; and those involving four mechanical modes or more ~'ere Iiegligible~ . 'hiu'$ ther'e~ere a'bou t 12 per ceht of the work trl.ps , or some 184,29:0 mUl H-~~d~l work t~ips. Of the 111,180 trips with the ferry as the sE!nior #i6d:e. 7'5p~ic~nt were multi-modal, whereas t hat for all others was less than 50 per ceRt.
- 23 -

Senior mode of transport
(ascending order)
'W8.J.k
Pak Pai
Taxi ,
Motor cycle ... ',~ .. ;.. .,
Private car
Public bus
Train I
," Tram '
Private bus
Ferry
,Table 16 Tr ips t o Wor k by Seni or Mode of Transport by 'umber of Modes Taken
Number of mechanica l modes t aken
o
553,000 o
"of ",' t~
o
o
o
1, 500
9,420
4,1 90 ','
o 37 ,650
o 514,140
o .1 ,950
o " 31,680
o 59,860
2
o
o
o
20
410
4,29q
1 ,870
4,990
3
o
o
o
o
o
110
AO
70
50
o 27,250 80,300 13,600
4 or more
o
o
o
o
o
o
o
o
o
30
Public Light Bus o 177,560 73,420 9,710 800
·All modes 553,000 865,200 169,880 13,580 830
Trip to Study - Generation and Attraction
Total
553,000
. 1,500
9,420
4 210 , 38,060
518 , 540
3,860
36,740
64,490
111,180
261,490
1,602,490
3.19 Appendix 8 shows the distribution of study trips by or~g~n (home place) and destination (study place) by traffic district. There were about 1 ,228 thousand study trips from home to an educational instit~tion, as estimated from the 1976 By-Census.
- 24 -
."

."
- .
Table 17 Study Trip Genera tion and Attraction by 'l'raffi c Area
Turnover Study trips Study t rips Net study (generation +
Traffic area generated attr acted tri ps generated attraction)
1216 1211 1216 1211 1216 1211 1216 1211
Hong Kong 269,390 306, 148 28,3,11 0 311,880 -13,720 -5,732 552,500 618,028 Island
Kowloon 181,670 191,949 214,500 191,137 -32,830 + 812 396,170 383,086
New Kowloon 479,030 486,854 457,860 490,199 +21 ,170 -3,345 936,890 977,053
Tsuen Wan 144.320 ~ 127,340 ) +16,980 ) 271,66.0 )
235.448 )
227,183 ) )
462,63 1 New ) 145,300 ~ fS,265
299,000 ~ Territories 153,700 ) + 8,400 (excluding ) ) ) ) Tsuen Wan)
All areas 1,228, 110 1,220,399 1,228,110 1,220,399 ·2,456,220 2,440,798
3.20 Hong Kong Island and Kowloon attracted more study trips than they generated, whilst New Kowloon, Tsuen Wan and t he New Territories (excluding
~ Tsuen Wan) generated more study trips t han they attracted. It can be seen that there was a reversal in net study trip generation for Kowloon and New Kowloon since 1971; the former was transformed from a net trip generator into a net
~ trip attractor whilst the l att er became a net generator.
,.21 Table 18 shows trip generation and attraction by traffic district. Densely populated districts l ike To Kwa Wan, Chuk Yuen/Tai Hom Chuen/Tsz Wan' Shan, Tsuen Wan/Tsing Yi/Kwai Chung, Kwun Tong (Central), Aberdeen/Wah Fu and Kwun Tong (South) were large net generators of study trips. On the other hand,. , districts with a concentration of schools like Kadoorie Hill, Kowloon Tong, Tsim ' Sha Tsui, Mid-level s (West) and Causeway Bay/ Happy Valley w~re large net attractors of study trips.
Table 18 Study Trip Generat i on and Attraction by Traffic Dis trict
Study t rips Study trips Net study Traffic distric t generated attracted' trips generated
Central 5,590 7,660 -2,070
Sheung Wan 11 ,330 ' 11,400 -70 -25 -
Turnover , (generation + , attraction)
13,25'0
22;730

Table 18 {Cont'd2
Turnover Study trips Study trips Net study (generation +
Traffic district ~nerated at t rac t ed t ri12s generat ed attraction 2 J '
Western 39,910 37 ,290 2,620 77 ,200
'Mid-levels (West) 8 ,460 26,440 -17 , 980 34,900 . .
Wan Chai 27 ,810 28,280 .,.470 56,090
'Causeway Ba.Y / 9';850 24,090 :'14,240 3},940 Happy Va.ll~Y
North ;Point 34,100 25,680 8 ,420 59,780
Tai Ko'o 10,780 5,110 5;670 15,890
shau ikei Wan 26,510 24 ,290 2,220 50,800
Chai Vlan 20,760 15,190 5,570 35,950
Tai Han·glB,fae~ 10 ·500 15,690 -5,190 26,190
\!long Ni!i 'Chlmgj Stubb's ROad ~,740 13,570 -4,830 22,310
Peak/Mts. Cameron and 1 ,110 5,440 ~4,330 6,550 Nichol.so1'l
..
Pb~rUl~ 4,010 3,760 ·250 7,770 '-.
Abera'~h/Wd FU. 45 ,560 35,150 10 ,410 80 ;710
Shouson Hili/Deep . W'a tei· ,Bay: / SOu th :Bay / 1 ,270 ·940 330 2,210 RepUl.s~ Bay
chun~ ROIn Kok/St anley 2,580 2,890 -310 5,470
Shek O/Mt. Parker 520 240 280 760
Hcmt_ Kong leil:and 269,390 283,110 -13,720 552,500
Tsim Sl1aTslU. 15,400 33,960 -18,560 49,360
Yau MS. T~i 33,350 29,510 3,840 62,860
Mof1g Kofc/T:i.i tolc 'T~id }8,020 43,480 -5,460 81 ,500
King' S pafk 540 6,050 -5,510 6,590
Ho Man Tin 31,:420 35·,620 -4,200 67,040
.: 26 -

Table 18 (Cont'd2 Turnover
Study trips Study trips Net study (generation + Traffic district generated attracted trips generated attraction )
<".
Hung Hom 16,870 14,250 2,620 31,120
To Kwa Wan 39,390 20,300 19,090 59,690
Kadoorie Hill 6,680 31,330 -24,650 38,010
Kowloon 181,670 214,500 -32,830 396,170
Sham Shui Po 72,340 66,110 6,230 138,450
Shek Kip Mei/Pak Tin 29,350 3),310 -5,960 64,660
Cheung Sha Wan 4,190 5,690 -1,500 9,880
Kowloon Foothills 620 840 -220 1,460
Lai Chi Kok/Mei Foo 10,650 13,260 -2,610 23,910
Kowloon Tong 8,300 31,830 -23,530 40,130
San Po Kong/Kowloon -- City/Wang Tau Hom/ 81,660 85,810 -4,150 167,470 Wong Tai Sin
Chuk Yuen/Tai Hom 72,810 55,110 17,700 127,920 Chuen/Tsz Wan Shan
Hammer Hill/Choi Hung/ 28,530 " 19,840 8,690 48,370 Ping Shek
Kai Tak 10 390 -380 400
Kowloon Bay 910 480 430 1,390
Ngau Tau Kok 22,310 22,560 -250 44,870
Kwun Tong (Central) 92,380 79,360 13,020 171,740
Kwun Tong (East) 2,930 2,860 70 5,790
Anderson Road 3,620 50 3,570 3,670
Kwun Tong (South) 48,400 38,360 10,060 86~780
New Kowloon 479,030 457,860 21,170 936~890
Tsuen Wan/Tsing Yi/ 144,320 127,340 16,980 271,660 Kwu" Chung
- 27--

Table 18 (Cont'd2 .
Turnover Study trips Study trips Net study (generation +
Traffic district generated attracted trips generated attraction)
New Territories, not elsewhere 121 ,180 116,500 4,680 237,680 specified
Outlying Islands 11 ,410 9, 210 2,200 20,620
Tuen Mun 9,980 10,670 -690 20.,650
Sha Tin 11 ,130 8,920 2,210 20,050
New Territories 153,700 145,300 8,400 299.000 (excluding
Tsuen Wan)
Grand Total 1 ,228,110 1,228,110 0 2,456,220
3.22 Figures 7(a2 and (b) depict a visual display of study trip generation 'and attraction.
Trip to Study '- Interzonal Movement
3.23 Table 19 ,shows a study trip matrix by traffic area. Of the 1,228 thousand study trips, 1,048 thousand trips or 85% were intra-area i.e. trips made with their origin and destination within the same traffic area. The percentage varied from 96 per cent on Hong Kong Island to 74 per cent in Kowloon. 32,840 trips, or 3 per cent of all study trips, were harbour-crossing. At the destination end, 92 per cent of all trips attracted to Hong Kong Island and 63 per cent to Kowloon were generated within their own respective traffic area. On the average, intra-area study trips were proportionally higher than those of work trips.
Table 19 Study Trip by Origin and Destination Study trip destination
All Study trip Hong Kong New New destin-
origin Island Kowloon Kowloon Tsuen wan Territories ations
Hong Kong 259,830 3,520 3,790 590 1,660 . 269,390 Island (% of total) (96) (1 ) (1) (0.2) (1 ) ( 100)
Kowloon 6,690 135,190 36,990 1,200 1,600 181,610 (% of total) (4) (74) (20) ( 1 ) (1 ) (100)
- 28 -
...

.-'
Table 19 ( cont'd)
All. Study trip Hong Kong New New destin-
origin Island Kowloon Kow100n Tsuen Wan Territories at ions
New Kowloon 11,270 62,610 397,350 4,140 3,660 479,030 (~ of total) (2) (13) (83) (1) (1) (100)
Tsuen Wan 2,120 6,880 13,720 119,530 2,070 144,320 (% of total) (1) (5) (10) (83) (1) (100)
New Territories 3,200 6,300 6,010 1,880 136,310 153,700 (% of total) (2) ( 4) (4) (1) (89) (100)
All Origins 283,110 214 , 500 457,860 127,340 145,300 1,228,1l0 (% of total) (23) (18) (37) (10) (12) (100)
3.24 Table 20 shows the intra-district movements expressed as per-centage of the total study trips generated and attracted. These percentage points are also shown on the scatter diagram in Figure 8. As in the case of work trips described above, similar interpretations are applicable here: districts with balanced inward and outward study trips should scatter around the 450 line; those above and to the left of it indicate that they were net generators and vice versa for those below and to the right of it. Since the scatter in this fi§ure is less marked than in the case of work trips and higher up around the 45 line, it is evident that intra-district study trips were proportionally more and inward and outward trips were more balanced.
Table 20 Intra-district Study Trips
Intra-district Intra-district N .. ber ot trips as % of trips as ~ ot
intra-district total trips total trips Traffic district study trips generated attracted
Central 700 14 10
Sheung Wan 4,580 40 40
Western 24,750 62 66
Mid-levels (West) 4,570 54 17
Wan Chai 12,240 44 43
Causeway Bay/Happy Valley 4,330 44 18
North Point 14,790 43 58
Tai Koo 2,460 23 48
Shau Kei Wan 15,970 60 66
- 29 -

Table 20 (cont'd)
Intra-district Intra-district Number of trips as ~ of trips as ~ of
intra-district total trips total trips Traffic district study trips generated attracted
Chai Wan 12,870 62 85 .
Tai Hang/Braemar 2,220 21 14
Wong Nei Chung/Stubbs Road 2,600 30 19
Peak/Mts. Cameron and 390 35 ? Nicho1son
Pokfu1am 1 330 33 35 , Aberdeen/Wah Fu 32 930 , 72 94
Shouson Hi1l/Deep Water 260 20 28 Bay/South Bay/Repulse Bay
Chung Hom Kok!Stanley 1,510 59 52
Shek o/Mt. Parker 220 42 92
Hong Kong Island 259,830 96 92 ;.
Tsim Sha Tsni 8,000 52 24
Yau Ma Tei 14,490 43 49
Mong Kok/Tai Kok Tsui 18,340 48 42
King's ~ark 300 56 5
Ho Man Tin 11,110 35 31
HungHOIII 7,340 44 52
To K.a Wan 13 380 34 66 , Kadoorie Hill 1,840 28 6
Ko.1oon 135,190 74 63
Sham Shui Po 41,340 57 63
Shek Kip Me~ak Tin 18,280 62 52
Cheung Sha Wan 1,090 26 19
Ko.1oon Foothills 70 11 8
Lai Chi Kok/Mei Foo 3,800 36 29
- 30 -

... Traffic district
Kowloon Tong
San Po Kong/Kowloon City/ Wang Tau Hc:xD/iong Tai Sin
Chuk Yuen!Tai Hom Chuen! Tsz Wan Shan
Hammer Hill/Choi Hung/ Ping Shek
Kai Tak
Kowloon Bay
Ngau Tau Kok
Kwun Tong (Central)
Kwun Tong (East)
Anderson Road
Kwun Tong (South)
New Kowloon
Tsuen Wan/Tsing Yi! Kwai Chung
New Territories, not elsewhere specified
Outlying Islands
Tuen Mun
Sha Tin
New Territories (excluding Tsuen Wan)
Grand Total
Table 20 (cont'd)
Number of intra-district study trips
2,720
52,670
42,790
13,410
o
370
12,430
60,950
210
30
34 ,010
397,350
119,530
106,710
8,710
7,570
7,630
136,310
1,228,110
Intra-district trips as % of total trips generated
33
64
59
o
41
56
66
7
1
70
83
83
88
76
76
69
89
100
Intra-district trips as % of total trips attracted
9
6l.
78
68
o
77
55
77
7
60
89
87
94
92
95
71
86
94
100
3.25 Figure 9 is a spider network showing inter-district movements with more than 3,000 study trips per day and Table 21 lists all inter-district movements with more than 3,000 trips per day in descending order of magnitude.
- 31 -

Table 21 Inter-district Movements with More Than 3,000 Study Trips per Day
Chuk Yuen/Ta i Horn Chuen/Tsz Wan Shan - San Po Kong/Kowloon City/ Wang Tau Hom/Wong Tai Sin
To Kwa Wan
Kwun Tong (Central)
Sham Shui Po
Tsuen Wan/Tsing Yi/ Kwa i Chung
San Po Kong/Kowloon City/ Wang Tau Hom/Wong Tai Sin
Kwun Tong (South)
Western
Sham Shui Po
To Kwa Wan
San Po Kong/Kowl oon City/ Wang Tau Hom/Nong Tai Sin
Shek Kip Mei/pak Tin
Wan Chai
Aberdeen/Wah Fu
North Point
Yau Ma Tei
North Point
Wan Chai
Kwun Tong (Central)
- Kadoorie Hill
- Ngau Tau Kok
- Mongkok/Ta i Kok Tsui
- Sham Shui Po
- Chuk Yuen/Ta i Hom Chuen/ Tsz Wan Shan
- Kwun Tong (Central)
- Mid-levels (West)
- Shek Ki p Me i /Pak Tin
- Ho Man Tin
- Kowl oon Tong
- Sham Shui Po
- Wong Nei Chung/Stubbs Road
- Wester n
- Causeway Bay/Happy Valley
- Ts im Sha Tsui
- Tai Hang/Braemar
- Causeway Bay/Happy Valley
- San Po Kong/Kowloon City/ Wang Tau Hom/Wong Tai Sin
11 ,520
6,810
5,620
5,470
5,420
5,080
4,720
4,640
4,170
3,770
3,700
3,570
3,570
3,560
3,550
3,540
3 ,450
3,250
3,030
3.26 Among the 19 heaviest movements presented in Table 21 those with more than- 5,000 . study trips daily were all associated with districts in Urban Kowloon. The only heavy study movement on Hong Kong Island was 4,640 study trips daily from Western to Mid-levels (West) where a large- number of schools were in existence. No maj or cross-harbour study movement was observed.
- 32 -
.
. -

Trip to Study - Mode of Transport
3.27 Appendix 9 gives the number of study trip legs by mode of t~ansport by home place whilst Table 22 summarizes the distribution of trip legs by group of modes of transport on a t raffic area basis.
Traffic area (study place)
Table 22 Trip Legs to Study by Mode of Transport by Traffic Area
MeG-hanical mode
Personal transport Public transport
(car, taxi, (Public Light Total study Pa}{ Pai, Bus, bus, tram, trip legs motor cycle) train. ferry)
Hong Kong Island 304,180 16,650 139,790
Kow1oon
New Kow1oon
Tsuen Wan
New Territories (excluding Tsuen Wan)
All Areas
218,800
463,050
128,680
151,440
1,266,150
8,280 103,240
10,240 141,550
1,000 24,700
1,400 45,270
37,570 454,550
Non-mechanical
mode (wa,lk)
147,7!to
107,280
311,260
102,980
104,710
774,030
3.28 Appendix 10 shows the number of study trips by senior mode of transport by home place. Table 23 summarizes the number of study trips by group of senior modes of transport by traffic area.
Table 23 Trips to Study by Group of Senior Modes of Transport by Traffic Area
Mechanical mode
Personal transport Public transport Non...
( car, taxi, (Public Light Mechanical Traffic area Total study Pak Pai, Bus, bus, tram, mocte (study: place) trips motor cycle) train, ferry) (wa-Ik)
Hong Kong Island 283,110 15 ,680 119,690 147,7~
Kowloon 214,500 7,830 99,390 107,280
- 33 -

Traffic area (study place)
New Kowloon
Tsuen Wan
New Territories (exclud:j.ng Tsuen Wan)
All areas
Total study trips
457,860
127,340
145,300
1,228,110
Table 23 (cont'd)
Mechanical mode
Pe rsonal transport Public transport
(car, taxi , (Public Light Non-Pak Pa i , Bus, bus, tram, Mechanical.
motor cycle) train, ferry) mode (walk)
9,880 136,720 311,260
940 23,420 102,980
1,050 39,480 104,770
35,380 418,700 774,030
3.29 - Over 63 per centof the students walked to their school to study. The corresponding area figures were: 52 per cent for Hong Kong Island, 50 per cent for Kowloon, 68 per cent for New Kowloon, 81 per cent for Tsuen Wan and 72 per cent for ' New Territories (excluding Tsuen Wan). Variation down to traffic district level can be found in Appendix 10. Relating back to the trip legs in Table 22 every thousand mechanical study trips had 1,084 trip legs on the average. As compared with the corresponding 1971 Census figure of 1,006, this represents an increase of 8 per cent or 78 trip legs.
Study Trips by Number of Modes Taken
3.30 Table 24 shows the distribution of study trips by senior mode of transport and by number of modes taken. It can be seen that the majority of the trips, slightly more than 63 per cent of the total, involved no mechanical mode; 34 per cent involved just one mechanical mode; about 3 per cent involves two; and those involving three or more were negligible. Thus multi-modal study trips amounted to only 3% or 34,920 person trips. Of the 20,820 trips with the ferry as the senior mode, 82 per cent were multi-modal whilst that for all others was less than 50 per cent as in the case of work trips.
Senior Mode of Transport
Walk
Pak Pai
Table 24 Trips to Study by Senior Mode of Transport by Number of Modes Taken
Number of Modes Taken
0 ]; 2 2 4 or more -774,030 0 0 0 0
0 .19,370 0 0 0
- 34 -
Total
774,030
19,370

Table 24 (cont 'd)
Number of Modes Taken
'. Senior Mode of Transport 0 1 2 2 4 or more Total
Taxi 0 1,810 10 0 0 1,820
Motor Cycle 0 110 0 0 0 no
Private Car 0 14,010 70 0 0 14,080
Public Bus 0 268 , 700 1, 200 10 0 269,910
Train 0 4, 040 2,230 0 0 6,270
Tram 0 17 , 010 2 , 030 30 0 19,0'70
Private Bus 0 73 , 260 1 ,560 50 0 74,870
Ferry 0 3,770 15,200 1,820 30 20,820
Public Light Bus 0 17, 080 9 , 590 1 , 030 60 27,760
All Modes 774,030 419 ,160 31 , 890 2 , 940 90 1,228,1l0
- .
- 35 -


. - -
6000 :.: .' . . ' . . '. :::
~'OOO .:. Cl :::
u ::: - I ° 2000 ci z
'.'
0 ' .'
o
Q
) ' / ~ ... \
< :> ', v I
I
FIG. 1(a) NUMBER OF CARS IN VARIOUS TRAFFIC DISTRICTSURBAN AREA
Y

. . -, , I ' __ 'L~._,
.-1 ,-. _ r- .. ~ .. ,-- .\. .
(J
o
NEW TERRITORIES
SHA TIN
. \) .~ <> G
6000 :;:
11\ :.: .'.
ISLANDS
~O a4000 :::
rJ u :::
~ ... ;:; 0
cJ 00 i 2000 ::: ~~; .:. :-: .' .
0 . '.
~~" p~ a ) FIG, l(b) NUMBER OF CARS IN VARIOUS TRAFFIC DISTRICTS-NEW TERRITORIES

~\ I ') /"
'01 r ')
/" ) .
" ( , J
-. "
e
~
400 '.' :::
'~300 ~11 1 .l:l ~200 . III
::: o .'. o .:. ....... :-: ~100 Cl
(.)
o
, "-
"
---~ , I , '~'
D
FIG. 2(a) CARS/1000 POPULATION IN VARIOUS TRAFFIC DISTRICTS - URBAN AREA
.; ) , v

NEW TERRITORIES
SHA TIN
40 .. :. c: :~:~ 0 .... ~ 30
:.:. "3 :~:;
ISLANDS rJ Cl. ;;;; 0 a..,
~l~l (:J od 0 20 0
~
llll -1/1 10 ;; u
U 0
FIG. 2(b) CARS/1000 POPULATION - NEW TERRITORIES
0 ....... 0 -ill ..... « Il::
0 ~
0 :::c ill (/) ~ 0
~ :::c
ill ~
... ID « ~
« ~
Il:: « u
-- -
100
90
80
70 •
60
• SO
40 •
30
• 20 •
• •
10 • •• • ••
• ••• • 0 10 20 30 40 50 60 70 80 165
GROUP MEAN INCOME (HUNDRED $)
FIG. 3 SCATTER DIAGRAM SHOWING THE RELATIONSHIP BETWEEN CAR AVAILABLE HOUSEHOLD RATE AND HOUSEHOLD INCOME

\
(I")
/~ } , (
\ ... \
"
e
200 Generation
FIG. 4(a) WORK TRIP GENERATION AND ATTRACTION IN VARIOUS TRAFFIC DISTRICTS URBAN AREA
, .
ISLANDS
,
NEW TERRITORIES, NOT ELSEWHERE SPECIFIED
, • ;"\.r- _''"' , . -.J \...., .. ......... .,..-.. t..-- .o
"",- " \.
cJ
I .
() 0\1
Generation 200 jjj
1 SO :~: Attracti on
":: I I o ~j <

100
0 W I-U
90 « a:: I-I-« Cl)
80 a.. a:: I-
~ a:: 0 70 !: ....J « I-0 I- 60 u.. 0
0 ...... 0
Cl) 50 « a.. a:: I-
~ 40
a:: 0 !: I-
,~ u 30 a:: I-Cl)
0 « a:: 20 I-Z
u.. 0
0 z
NEW TERRITORI5 NOT EL5EWHERE 5PEOFIED-'15LAND
.A8ERDEEN/WAH FU
CHUK YUEN/TAI HOM CHUEN/T5Z WAN 5HAN
~ • CH.£!. WAN .WE5TERN
T5UEN WANI T51NG YI/KWAI CHUNG
• TUEN MUN • SHEI< 01 MT. PARKER
• • KWUN TONG (CENTRAL)
~ CHUNG HOM ~~~\I~P MElt • 5HAU KEI WAN
• PEAK/MT5 . CAMERON & NICHOL50N
WONG NEI CHUNG/5TUB65 ROAD. • /
MID- LEVEL (WE5T) • _5H~:A 5T~~1 PO
NG:~K TAU" TAl HANG/BRAEMAR~. .5AN PO KONG/KOWLOON CITY /WANG TAU HOM/WONG TAl 51N
YAU MA TEI, HAMMER HILL/ WAN CHAI
• CHOI HUNG/ .NORTH • TO KWA WAN PING 5HEK POINT POKFULAM
/ • MONG KOK/TAI KOK T5UI ._KOWLOON TONG
• HO MAN T IN.2 HUNG HOM
I TAI Koo .5HEUNG WAN 5H0U50N HILL/DEEP WATER BAY/50UTH BAY/REPUL5E BAY
/"". KADOORIE HILL
LAI CHI KOK/MEI FOO .CAU5EWAY BAY/HAPPY VALLEY • T51M 5HA T5UI
• KWUN TONG (50UTH) • KING'5 PARK
• CHEUNG 5HA WAN
• CENTRAL
AD • KWUN TONG (EA5Tl
10 20 30 40 50 60 70 80 KAI TAK
90
NO . OF INTRADISTRICT WORK TRIP AS Ofo OF TOTAL WORK TRIPS GENERATED
FIG. 5 INTRA-DISTRICT WORK TRIP MOVEMENTS
100

.. \ \
"
NEW TERRITORIES NOT ELSEWHERE SPECIFIED
2
o
4- DIRECTION OF PERSON TRIP MOVEMENT
.~s Thousand Trips
FIG. 6 INTER -DISTRICT MOVEMENTS WITH MORE THAN 5 000 WORK TRIPS PER DAV
\
I
I ~

~\ ,~ \(;
1 r ')
-.
/ ~ ) \ (
o o
•
E 60 1/1 a.
~ 40 -o o z 20
o
FIG. 7(a) STUDY TRIP GENERATION AND ATTRACTION IN VARIOUS TRAFFIC DISTRICTS URBAN AREA

~ FIG. 7(b)
I .
NEW TERRITORIES
.\5 <> G
ISLANDS
cJ
~ f7 •
200 Generation ... .... ::::
\50 lll~ ~~traction
':: li o
STUDY TRIP GENERATION AND ATTRACTION IN VARIOUS TRAFFIC DISTRICTS-NEW TERRITORIES

-.
100
o ~ 90 u « a::: II-
« 80 (/) Cl...
a::: I-
b 70 :::::> l(/)
...J
« I-o 60 I-
u.. o
o ...... o
(/)
« (/) Cl...
a:::
50
I- 40 >-o :::::> l-(/)
(; 30 a::: l(/)
o « := 20 z
u.. o
o 10 z
SHEK O/MT. PARKER e
TSUEN WAN/TSING YI/KWAI CHUNG
OUTLYING ISLANDS e ABERDEEN/WAH FU e
"\ eKWUN TONG
(SOUTH)
e
CHUK YUEN/TAI HOM CHUEN/TSZ WAN SHAN e
eCHAIWAN /
eSHA TIN
NEW e TERRITORIES
NOT ELSEWHERE SPECIFIED
eKOWLOON BAY e KWUN TONG (CENTRAL)
SHAU KEI WAN
"
/
eTUEN MUN
e TO KWA WAN HAMMER HILL/CHOI HUNG/PING SHEKe e eWESTERN
e-SHAM SHUI PO
~SAN PO KONG/KOWLOON CITY/ WANG TAU HOM/WONG TAl SIN
e NORTH POINT e NGAU TAU KOK
e HUNG HOM e CHU,G HOM KOK/ STANLEY
/ SHEK KIP MEI/PAK TIN
e TAl KOO e YAU MA TEI
/wAN CHAI / ... e MONG KOK/TAI KOK TSUI
eSHEUNG WAN
/ e POKFULAM
/
eHO MAN TIN
eLAI CHI KOK/MEI FOO e SHOUSON HILL/DEEP WATER BAY/SOUTH BAY/REPULSE BAY
/ e TSIM SHA TSUI
WONG NEI CHUNG/STUBBS ROAD / ,/'
CHEUNG SHA WAN e e
~ e TAl HANG/BRAEMAR
e CENTRAL KWUN e KOWLOON e KOWLOON TONG
(ETOANSTG) FOOTHILLS e, e PEAK/ MTS. CAMERON & NICHOLSON
/ '- e KING'S PARK
KADooRIE HILL
/CAUSEWAY BAY/ HAPPY VALLEY
e • MID-LEVEL (WEST)
ANDERSON ROAD o KAI TAK
10 20 60 70 90 100 30 40 50 80
NO. OF INTRADISTRICT STUDY TRIPS AS % OF TOTAL STUDY TRIPS GENERATED
FIG. 8 INTRA-DISTRICT STUDY TRIP MOVEMENTS

e
\,
\
t ::::: q20
· · ·.···.·········· · · l~oor ::::: :::::: ::::::::: :::::::::::::: :: ::: :::::2:3 2
Thousand Tri ps
--l !
/'> ')1
)' < ~ ',
v ,
\
l~\
~
FIG. 9 INTER-DISTRICT MOVEMENTS WITH MORE THAN 3 000 STUDY TRIPS PER DAY

..
L
APPENDIX 1 POPULATION, HOUSEHOLD AND CAR AVAILABILITY BY TRAFFIC DISTRICT
Number of All Number of domestic
TRAFFIC DISTRICT (HOME PLACE) land domestic households population households wi th car
available
Central 23,660 6,490 330 Sheung Wan 47,800 11,630 480 Western 144,370 33,940 2,120 Mid-levels (West) 37,590 9,410 4,050 Wan Chai 121,680 33,140 1,690 Causeway Bay/Happy Valley 46,980 13,040 1,340 North Point 129,280 32,510 3,030 Tai Koo 43,900 10,580 1,540 Shau Kei Wan 92,260 20,770 1,170 Chai Wan 72,780 14 ,830 570 Tai Hang/Braemar 35,800 7,960 2,330 W~ng Nei Chung/Stubbs Road 33,150 7,860 3,190 Peak/Mts. Cameron and Nicholson 7,390 2,280 1,600 Pokfulam 14,470 3,140 1,200 Aberdeen/Wah Fu 135,990 26,600 1,860 Shouson Hill/Deep Water Bay/South Bay/ 6,590 1,950 960
Repulse Bay
Chung Horn Ko~Stanley 11,430 2,080 690 Shek O/Mt. Parker 1,830 490 120
HONG KONG ISLAND 1,006,950 238,700 28,270
Tsim Sha Tsui 68,930 19,820 1,570 Yau Ha Tei 151,130 43,100 2,190 Hong Ko~Tai Kok Tsui 166,290 46,650 2,890 King's Park 2,630 210 140
Ho Man Tin 94,870 18,880 3,370 Hung Hom 67,990 18,580 1,330 To KwaWan 151,540 39,610 2,630 Kadoorie Hill 25,620 5,070 2,520
KO',vLOON 729,000 191, 920 16,640
Car available household.
rate (;:; car available
households)
5 4
6
43
5 10
9 15 6 . 4
29 41
70 38
7 49
33 24
12
8
5 6
67 18
7 7
50
9

APPENDIX 1 (Cont'd)
'", "~ ' "' ~' .. Number of Car avai1abHt
All Number of domestic household . TRAFFIC DISTRICT (HOHE PLACE) land domestic households rate (% car
population households with car available available households) -~
- •. 5'" '~""S"'"
Sham Shui Po 269,140 70, 700 3,830 5 Shek Kip Nei/Pak Tin 106,300 23, 750 1,500 6
Cheung Sba Wan 20,630 7,210 210 3 Kowloon Foothills 2,340 620 130 21
Lai Chi Kok/Hei . Foo 46,030 11,270 2,810 25
Kowloon Tong 30,350 7,010 3,110 44
San Po Kong/Kowloon City/Wang Tau Hom/ 279,640 63,050 3,310. 5 Wong Tai Sin
Chuk Yuen/Tai Hom Chuen/Tsz Wan Shaft 223,460 44,680 2,770 6
Hammer Hill/Choi Hung/Ping Shek 72,650 12,990 1,150 9
Kai Tak 170 10 ° Kowloon Bay 5,550 1,680 110 7
Ngau Tau Kok 69,290 13,860 820 6 - .
8 ~
Kwun Tong (Central) "290,900 63,110 4,860
Kwun Tong (East) 10,740 2,430 230 9
Anderson Road 11,960 2,820 170 6
Kwun Tong (South) 148,600 30,320 1,410 5
NEW KOWLOON 1,587,750 355,510 26,420 7
TSUEN WANLTSING YI~WAI CHUNG 442,260 94,560 6,390 ?
New Territories, not elsewhere 379,010 85,440 8,630 10 specified
Outlying Islands 40,430 9,530 140 i
Tuen Hun 31,550 6,470 670 10
Sha Tin 36~710 8,160 800 9
NEN TERRI'roRIES 487,700 109,600 10,240 9
GRAND roTAL 4,253,660 990,290 87,960 9
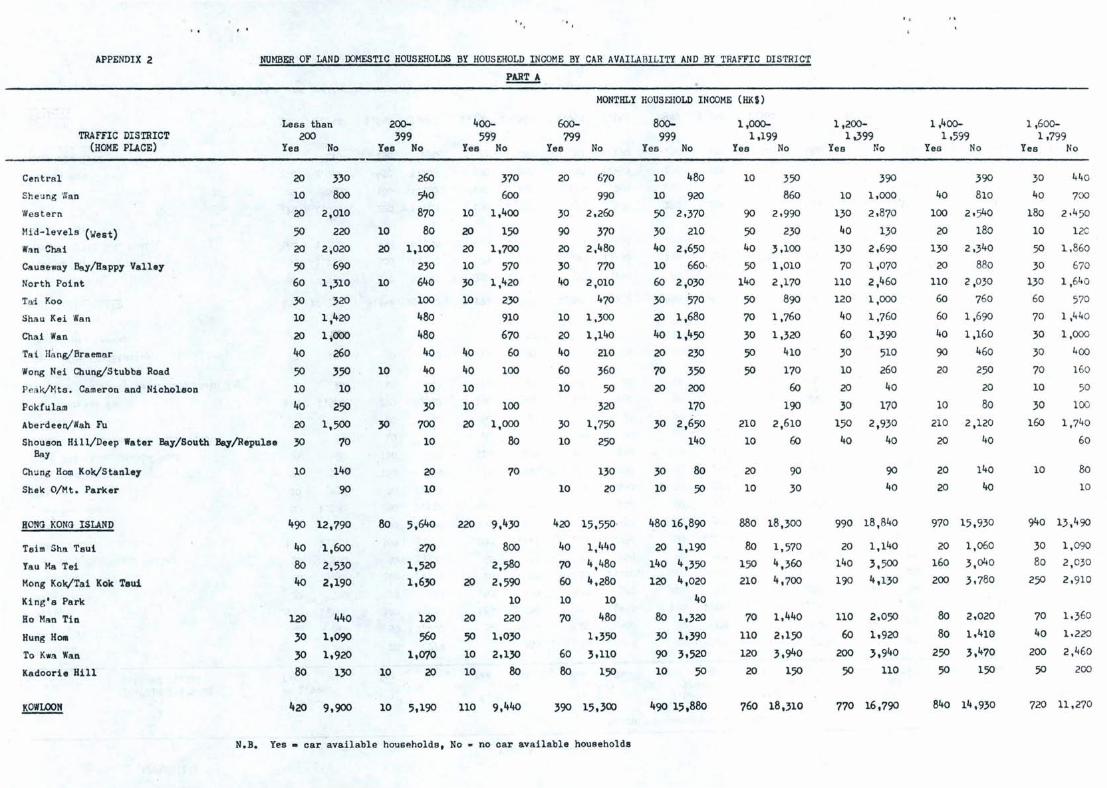
, . 1 i , "
APPENDIX 2 NUMBER OF LAND DOMESTIC HOUSEHOLDS BY HOUSEHOLD INCOME BY CAR AVAILABILITY AND BY TRAFFIC DISTRICT
~
TRAFFIC DISTRICT (HOME PLACE)
Les.s than 200
Yes No
Cntrnl ~
Sheung Wan 10
lYestern ~
Mid-levels (West) 50
W,m Chai ~
Causeway Bay/Happy Valley 50
North Point 60
Tai Koo 30
Shau Kei Wan 10
Cha! Wan ~
Tal. Hang/Braema.r 40
Wong Ne! Chung/Stubbs Road 50
P"ak/~! ts. Cameron and Nichols0D 10
Pok!ulam 40
Aberdeen/Wah Fu ~
Shouson Hi1~Deep Water Bay/South Bay/Repulse 30 Bay
Chung Hom Kok/Stanley
Shek O/Ht. Parker
10
330
800
2,010
2~
2,020
690
1,310
3~
1,420
1;000
260
350
10
250
1,500 70
140
90
HONG KONG ISLAND
Tsim Sha Tsui
Tau Ma Tei
Hong Kok/Ta1 Kok Tau!
King's Park
490 12,790
40 1,600 80 2,530
40 2,190
Ho Man TiD
Hung HOII
To Kwa WilD
Kadoor1e Hill
KOWLOON
1~ 440
30 1,090
30 1,9~
80 130
200-399
Yes No
10
~
10
10
30
260
540
870
80
1,100
230
640
100
480
480
40
40
10
30
700
10
~
10
80 5,640
270
1,5~
1,630
1~
560 1,070
10 ~
10 5,190
400-599
Yes No
10
~
~
10
}O
10
40
40
10
10
~
370
600
1,400
150
1,700
570
1,420
230
910
670
60
100
100
1,000
80
70
~ 9,430
800
2,580
~ 2,590
10
20 220
50 l,O}O
10 2,l}O
10 80
110 9,440
MONTHLY HOUSEHOLD INCOME (HK')
600-799
Yes No
20 670
990
30 2,260
90 370
~ 2,480
}O 770
40 2,010
470
10 1,300
~ 1,140
40 210
60 360
10 50
3~
30 1,750
10 250
10
130
~
420 15,550
40 1,440
70 4,480
60 4,280
10 10
70 480
1,350
60 3,110
80 150
390 15,300
800-999
Yes No
10 480
10 920
50 2,}70
30 210
40 2,650
10 660·
60 2,030
}O 570
20 1,680
40 1,450
~ 230
70 350
20 200
170
30 2,650
140
30
10
80
50
480 16,890
20 1,190
140 4,350
120 4,020
40
80 1,320
30 1,}90
90 },520
10 50
490 15,880
1,000-1,199
Yes No
10 350
860
90 2,990
50 230
40 3,100
50 1,010
140 2,170
50 890
70 1,760
30 1,320
50 410
50 170
60
190
210 2,610
10 60
~
10
90
30
880 18,300
80 1,570
150 4,360
210 4,700
70 1,440
110 2,150
120 } ,940
~ 150
760 18,}10
N.B. Yes - car available households. No - no car available houBeholds
1,200-1.399
Yes No
10
130
40
130
70
110
120
40
60
30
10
20
30
150
40
390
1,000 .
2,870
130
2,690
1,070
2,460
1,000
1,760
1,390
510
260
40
170
2,930
40
90
40
990 18,840
20 1,140
140 3,500
190 4,130
110 2,050
60 l,9~
200 },940
50 110
770 16,790
"
1,400-1,599
Yes No
40
100
20
130
~
110
60
60
40
90
20
10
210
~
390
810
2,540
180
2,340
880
2,030
760
1,690
1,160
460
250
~
80
2,120
40
140
40
970 15,930
20 1,060
160 3,040
200 3,780
80 2,020
80 1,410
250 3,470
50 150
840 14,930
1,600-1,799
Yes No
30
40
180
10
50
30
130
60
70
30
30
70
10
30
160
10
440
700
2,450
12C
1,860
670
1,640
570
1,440
1,000
400
160
50
100
1,740
60
80
10
940 13,490
30 1,090
80 2,030
250 2,910
70 1,360
40 1,220
200 2,460
50 200
720 11,270

Centr al
Sheung ',van
Western
Hi d- l evels
Wan Chai
APPENDIX 2
TRAFFIC DISTRICT (HOME PLACE)
Causeway Bay/Happy Valley
Nor th Point
Tai 1<00
Shau Kei fan
Chai Wall '
Tai Hang/Braemar
Wong Nei Chung/Stubba Road
Peak/Mts. Cameron and Nicholaon
Pokfulall
Aberdeerv"llah Tu
Shouson Hill/Deep Water Bs1/South Bay/ Repulse Bay
Chung Hom Kok/Stan1ey
S~ek O/Mt. Parker
/lONG KONG ISI.AND
Tailll Sha Tsui
Tau Ma Tei
MOIl8 Kok/Tai Kok Teui
King 's Park
Qo tlan Tin
'Hung BOIl
To K.m Wan
ltadoor1e Bi ll
KOWIOON
1;800-1,999
Yes No
30 260
20 510
110 1,560
20 100
90 1,640
50 350
130 1,320
50 460
80 1,020
10 830
70 340
20 160
30
50
140 1,520
20
20 100
10 30
850 10,300
60 790
50 1,720
160 1,820
110 1,020
20 Boo 160 2,070
110
560 8,330
2,000-2,499
Yes No
20 730
90 1,070
320 3,630
70 380
260 3,120
90 1,210
360 3,730
1}0 l,CflO
250 2,310
80 1,750
160 810
160 450
10 40
}O 90
270 2,920
10 60
30 130
20
2,340 23,570
140 1,880
300 4,330
430 4,190
220 1,700
180 1,600
450 },730
I}O 230
1,850 17,660
2,500-2,999
Yes No
350
}O 820
180 2,070
150 370
70 2,090
60 590
200 2,440
100 710
130 1,350
50 970
130 480
110 300
20
50 50
100 1,300
10 20
10 90
}O
1,390 14,030
230 1,190
190 1,960
220 2,690
150 1,050
190 B90
,00 2,060
70 220
1,350 10,060
Cont'd
MONnlLY HOUSEI.IOLD INCOME (HKI)
3,000-3,499
Yes No
10 240
20 460
200 1,450
180 340
180 1,210
80 750
210 1,780
120 650
70 910
50 550
1}0 350
190 330
20 20
40 50
180 750
20 20
20 70
1,720 9,930
70 1,140
150 1,430
240 1,650
170 800
120 700
180 1,230
120 190
1,050 7,140
3,500-3,999
Yes No
10 280
30 240
100 1,020
210 340
160 1,200
70 520
200 1,210
150 370
90 450
90 310
50 260
110 ,210
20 10
30 40
80 580
10
20 70 10
1,440 7,110
Bo 140
240
170
100
120
130
700
930
920
290
340 600
160
4,000-4,999
Yes No
20 270
50 450
250 1,120
250 570
170 1,020
140 690
270 1,420
120 320
100 550
}O 140
200 360
220 340
40 10
80 60
90 440
70 10
50 40
10
2,160 7,810
160 960
180 830
240 1,090
230 430
1}0 360
160 970
200 180
N.B. YeS. car available households, No. no car .. available households
,\ "
5,000-6,999
Yes No
90 230
40 230
170 850
750 740
240 920
230 580
390 1 ,200
200 350
130 '160
20 80
500 320
610 490
180 50
200 80
90 160
100 30
170 20
30
'+,140 6,690
260
210
170 20
690
1}0
180
440
750
850
8}0
450
310
560 260
2,100 '+,020
. '
7,000-8,999
Yes No
20
60
100
640
40
170
340
150
30
260
440
280
220
10
150
70
10
50
60
310
390
290
260
420
130
60
60
170
20
40
20
50
2,990 2,330
140
60
70
30
410
20
90
370
280
240
240
10
220
80
130
40
1,190 1,230
9,000 and over Yes No
40
30
80
1,460
10
180
2'+0
160
20
490
950
950
430
40
480
210
70
90
50 440
120
200
200
70
50
20
70
180
60
70
50
30
30
5.770 1 ,800
180
90
30
80
600
40
30
700
1,750
400
130
100
100
50
70
120

Sham Shui Po
APPENDIX 2
TRAFFIC DISTRICT (HOME PLACE)
Shek Kip Mei/Pak Tin
Cheung Sha 'Nan
Kowloon Foothills
Lai Chi Kok/Mei Foo
Ko.l oon Tong
· ,
San Po Kong/Kowloon City/IVang Tau Hom/Wong Tai Sin
Chuk YueQ/Tai Hom Chueq/Tsz Wan ShaD
Hammer Hil~Chol Hung/Ping Shek
Kal Tak
Ko.loon Ba,.
Ngau tau Kok
Kwun Tong (Central)
Kwull Tong (East)
Anderson Road
Kwun Tong (South)
NE"N KO'NLOON
TSU::;:I WAN/TSWU YI/K'NAI CHUNG
Ne .. Territories, not elsewhere specified
Outlying Islands
Tuen Mun
S~a Tin
NEW 1'ERHI'rORIF.S
GRAlm TOTAL
"
NUMB1N OF LAND DOMESTIC HOUSEHOLDS BY HOUSEHOLD INCOME BY CAR AVAILABILITY AND BY TRAFFIC DISTRICT
Less than 200
Yes No
70 3,580
30 1,590
400
10
60 510
60 310
100 4,420
140
900
150 ',320 '
40
130
10 1.810
570 19.850
170 ',990
260 10,800
2,180
40 660
10 630
310 14,270
1,960 60.800
200-399
Yes No
10 2,570
10 790
630
20
60
90
10 2,290
1,070
120
70
340
1.570
}O
160
20 830
50 10.640
1,960
60 4,430
640
250
10 230
70 5,550
~
400-599
Yes No
60 4,540
40 1.530
10 620
}O
10 140
10 130
3.810
40 2.160
260
90
740
10 ,.340
1}0
140
60 1,710
240 19.370
110 4.210
1}0 6,080
10 780
20 430
10 }60
170 7,650
850 50.100
MONTHLY HOUSEHOLD INCOME (HKS)
600-799
Yes No
100 7,590
100 2,270
1,010
80
10 240
,a 350
170 5,660
80 3,990
10 320
290
}O 1,280
120 5.310
10 2}0
}40
40 3,240
700 32,200
190 7,760
}20 10,790
10 1,260
40 680
20 680
490 1},410
2,190 84.220
800-999
Yes No
170 7,410
}O 1,980
920
60
10 290
20 330
180 5.950
160 4,940
20 840
10 290
50 1,520
250 6,100
20 }}O
}O 420
90 },800
}40 10,4,0
}8o 7,}50
890
20 620
50 600
2,800 87,840
1,000-1,199
Yes No
380 7,140
100 2,400
20 820
10 50
80 390
50 }20
260 6,700
260 5.070
100 1.260
20 210
120 1,540
}DO 6,820
10 410
30 340
190 3.840
1,930 37,310
650 12,O}0
670 8,110
10 910
70 580 80 1,170
830 10,770
5,050 96,720
1,200-1,399
Yes No
220 6,360
120 1,890
20 560
40
20 240
40 320
240 5,920
270 4,340
120 1,390
10 150
80 1,120
350 5.940
160
10 250
170 2,790
1.670 31,470
740 10.960
690 6,260
10 590
40 450
110 820
5.020 86,180
N.B. Yes = car available households. No = no car available households
'.
1,400-1,599
Yes No
290 5,330
130 1,960
20 530
50
70 490
30 160
}50 5.120
10 150
90 1.050
440 5.620
}O 200
10 300
120 2.640
540 8.200
640 5,3}0
10 690
60 400
60 680
770 7,100
5.030 74,460
1,600-1,799
Yes No
320 4,270
100 1,650
10 32J
40
60 280
20 160
270 4,HO
280 3.030
130 1.150
30 80
40 920
260 3. 880
30 140
10 170
110 1,840
1,670 22, 040
550 6,220
460 4,010
10 3·30
50 460
30 520
550 5. 370
4,430 58 ,390
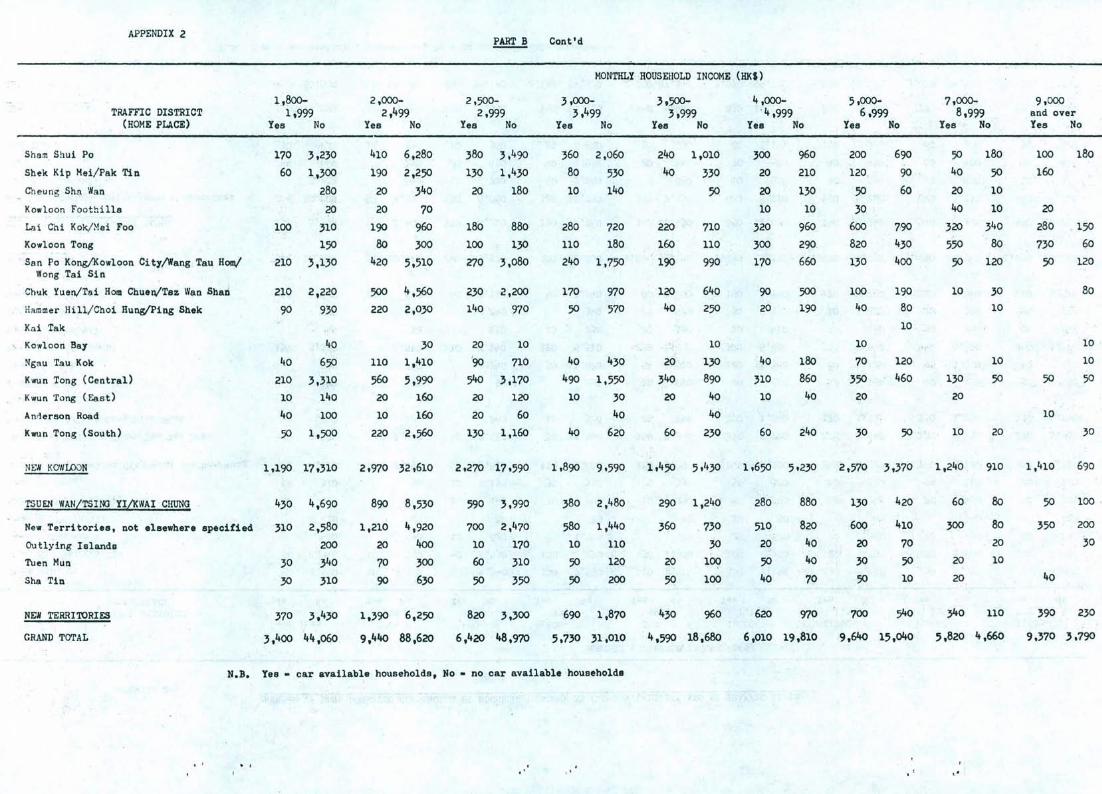
Shem Shui Po
APPENDIX 2
TRAFFIC DISTRICT (HCME PLACE)
Shek Kip Hei/Pak Tin
Che ung Shn Wan
Ko.loon Foothills
Lai Chi Kok/Mei Foa
Kowloon Tong
, San Po Kong/Kowloon City/Wang Tau Hom/ 'IIong Tai Sin
Ch'lk , Yuen/Tai HOrD Chuen/Tsz Wan Shad
Hammer Hill/Cho1 Hung/Ping Shek
Kai Tak
KO 'Rioon Bay
Ngau Tau, Kok
Kwun Tong (Central)
.. KwunTong (East>
Anrlerson Road
Kwun Tong (South)
NEW KCWLoON
TSUEN WAN/TSlOOYI/KWAI CHUNG
New Territories. not elsewhere speoilied
Outlying Islands
Tuen Mun
Sha Tin
NEM TERRITORIES
GRAND TOTAL
1,,800-1,999
Yes No
17.0 3,230
60 1,300
28.0
20
100 , 310
150 210 3,13.0
210 2,22.0
9.0 93.0
4.0
4.0 650
21.0 3,31.0 1.0 14.0
4.0 100
50 1,50.0
1,190 17,31.0
43.0 4,69.0
31.0 2,580 200
3.0 34.0
30 31.0
37.0 3,43.0
3,400 44,060
2,000-2,499
Yes No
41.0 6,28.0
19.0 2,250
2034.0
2.0 7.0
190960
80 300
42.0 5,51.0
500 4,56.0 22.0 2,.03.0
3.0 nc 1,41.0
56.0 5,990 2.0 160
1.0 160
22.0 2,560
2,97.0 32,61.0
890
1,21.0
20
7.0
90
1,390
8,53.0
4,92.0
400
300
63.0
6,250
9,440 88,620
2,500.-2.999
Yes No
38.0 3,490
13.0 1,43.0
2.0 18.0
18.0 88.0
100 130 7/.0 3,.08.0
23.0 2,200 14.0 97.0
2.0 1.0 '90 710
540 3,17.0 20 120 2.0 6.0
130 1,160
2,27.0 17,59.0
59.0
700 1.0
60
50
82.0
3.99.0
2,47.0
17.0
31.0
350
6,420 48,970
Cont'd
MCNTHLY HCUSEHCLD INCOME (HKI)
3,000-3.499
Yes No
36.0 2,060.
80 530.
1.0 140
280. 72.0 nc 18.0
240 1,750
17.0
50
97.0 57.0
4.0 43.0
490. 1,550 10. 30.
4.0
40. 62.0
1,890 9,59.0
380.
580 1.0
50
50
,690
2,480
1,440
11.0 12.0
200
1,87.0
5,73.0 31,.01.0
3,500-'3,999
Yes No
240 1,.010
40 33.0
50
22.0 71.0 160 nc 190 99.0
120 4.0
2.0
340 20
60
290
360
2.0
50
64.0
250
10.
13.0
890 40 40.
230.
1,240.
. 73.0
30 100
100
960.
4.590 18.680
4,000-' 4,999
Yes No
300 2.0
20
1.0
320.
300 17.0
90 20.
40.
310. 10.
60.
280.
51.0 20.
50 4.0
620
960.
210
130
10
960 290. 660
500 190
180 86.0
40.
240.
88.0
820 40. 4.0
7.0
97.0
6.01.0 19.81.0
N.B. Yes - car available households, No - no car available households
. ' "
5,000-6,999
Yes No
200
120.
50 3.0
600
820.
13.0
690
90 60
790 430. 400
100 .. 190 40. 8.0
10
10.
70.
350 20
30.
120. 46.0
50 ' '
2,57.0 3,370.
130.
600
20
30
50
700
420
I+lO '
70
50 10
9.640 15.040
7,000-8,999
Yes No
50 4.0
20
40
320
550
50
1.0
130.
20
10.
1.240.
60.
300
20.
20.
}4c
180
50 , 10.
IQ
340
80
120.
3.0 1.0
10.
50
2.0
910.
80
8.0
2.0 10.
no.
5,820 4,660
9,000 and over Yes No
100
160
20
28.0
730.
50
1.0
1,410.
50
35.0
4.0
39.0
180
150 6.0
12.0
8.0
IQ
10
50
30.
69.0
100
200
3.0
230.
9,37.0 3,790

APPENDIX 3 NtJrlBER OF CARS, CAR AVAILA.BIi.ITY RATE AND HOUSEHOLD CAR AVA ILABI LITY RATE BY TRAFFIC DISTRICT
TRAFFIC DISTRICT (HOHE ' PLACE)
Central
Sheung Wan
Western
Hid-levels (West)
Wan Chai
Causeway Bay/Happy Valley
North 120int
Tai Koo
Shau Kei Wan
Chai Wan
Tai Hang/Braemar
Wong Nei Chung/Stubbs Road
Peak/Mts. Cameron and Nicholson
Pokfularit
Aberdeen/Wah Fu
Shouson Eill/Deep Water Bay/South Bay/ Repulse Bay
Chung Horn Ko~Stanley
Shek O/Mt. Parker
HONG KONG ISLAND
Tsim Sha Tsui
Yau Ha Tei
Mong Kok/Tai Kok Tsui
King's Park
Ho floan Tin
Hung Horn
T6 Kwa Wan
Kadoorie Hill
KOWLOON
Number of cars
400
' 570
2,450
5,710
2,020
1,760
3,490
2,180
1,450
670
3,050
4,850
2,440
1,660
2,260
1,320
970
'160
37,410
1,750
2,550 3,520
200
3,940
1,540
3,210
3,300
20,010
Car availability rate (cars
available per 1000 persons )
18
13
17
157
17
38
27
50 16
99
86
150
344
135
17
205
117
89
38
27
17
22
303
42
23
21
142
28
Household car availability
'rate (cars available per
100 car available households)
121
119
116
141
120
131
115
142
124
118
131
152
153
138
122
138
141
133
132
111
116
122
143
117
116
122
131
120

APPENDIX 3 (Cont'd)
.. Household
Car availability car availability
TRAFFIC DISTRICT (HOME PLACE) Number of rate (cars rate (cars cars available per available per
1000 persons) 100 car available households ) .
Sham Shui Po 4,400 17 115
Shek Kip Mei/pak Tin 1,870 18 125
Cheung Sha Wan 220 11 105
Kowloon Foothills 140 63 108
Lai Chi Kok/Mei Foo 3,330 74 119
Kowloon Tong 4,320 147 139
San Po Kong/Kowloon City/Wang Tau Rom! 3,950 14 119 Wong Tai Sin
Chuk Yuen/Tai Hom Chuen/Tsz Wan Shan · 3,130 14 113
Hammer Hi11/Choi Hung/Ping Shek 1,360 19 118
Kai Tak 0 0 0
Kowloon Bay . 120 22 109 .
Ngau Tau Kok 850 12 104 . Kwun Tong (Central) 5,6'+0 20 116
Kwun Tong (East) 230 22 100
Anderson Road 180 15 106
Kwun Tong (South) 1,650 11 117
NEVI KOWLOCN 31,390 20 119
TSUEN WAN/TSING YI/IF/AI CmING 7,840 18 123
New Territories, not elsewhere 12,060 33 140 specified
Outlying Islands 170 5 121
Tuen Hun 860 30 128
Sha Tin 980 28 123
NEW TERRITORIES 14,070 30 137
GRAND TOTAL 110,720 27 126

112PUlDIX 4
HONTHLY HOUSEHOLD
INCOl1E (HKS )
· ,
Hong Kong Island
Yes No
UNDER 260 133 '
200-399
400-599
600-799
800-999
1,000-1,199
1,200-1,399
1.400-1,599
1.600-1,799
1,800-1,999
2,500-2,999
3,000..3,499
4.000.-4,999
5.000..6,999
7.000..8.999
9.000 AND OVER
OVERALL
375 305
474 428
293 469
527 549-
531 569
679 591
659 611
567 632
628 662
697 671
644 698
769 729
696 712
758 740
757 758
738 746
668 659
692 642
'~
TRIP RATES (NUNBER OF TRIPS PER THOUSAND \'/ORKERS!STUDENTS) BY AREA BY CAR
AVAILABILITY AND BY HOUSl:HOLD INCOl'lE
'.
WORK TRIP RATES STUDY TRIP RATES
Urban Kowloon (including Tsuen Wan)
Yes No
148 193
500 406
500 496
486 566
577 607
568 609
581 625
586 648
669 656
662 676
625 686
668 704
667 715
721 716
674 695
733 691
727 658
627 584
New Territories (excluding Tsuen Wan)
Yes No
167 131
375 221
375 325
246 264
490 382
411 346
432 380
362 384
454 460
449 512
483 468
567 479
488 508
551 440
616 503
587 404
493 333
550 278
1t89 395
All Areas
Yes No
132 167
400 354
468 457
394 499
555 572
533 573
572 594
561 614
621 631
630 660
618 667
651 687
672 705
697 700
693 701
732 711
718 693
649 599
647 622
Hong Kong Island
Yes No
714 382
750 312
692 360
472 347
535 301
352 360
583 377
450 395
522 374
426 412
623 463
711 509
674 522
627 538
670 550
703 568
739 643
700 544
61t1 1t25
Urban Kowloon (including Tsuen Wan)
Yes No
443 320
333 274
436 273
566 260
267 250
369 275
315 295
400 331
418 342
409 372
487 388
518 430
560 449
577 468
585 488
671 546
720 581
610 409
New Territories (excluding Tsuen Wan)
Yes No
451 278
308 191
333 255
426 286
246 298
40? 259
511 287
416 312
384 312
382 370
462 353
475 370
462 330
544 395
613 422
587 524
756 750
511 207
N.B. Yes. car availabl. houeeho14
No • no car available househo14
All Areas
Yes No
505 323
379 261
506 281
507 278
295 264
374 287
397 312
413 341
436 345
410 380
512 403
548 446
578 461
587 488
616 506
676 555
731 618
654 439
536 351

APPENDIX 5
HOME PLACE
Central Sheung \Van Western Kid-levels (West) Wan Chai Cause .... ay BaYI Ha ppy Valley Nor th Po i nt Tai Koo Shau Kei Wan. Cha i Wan Tai Eang/ Braemar Weng Nei Chung/ Stubbs Rd. P~ak/Kts. Cameron & Nicholson Pokt'ularn Aterdeen/ 'Nah Fu Shouson HilljDeep Water Eay/South Bay/Repulse Bay Chung Hom Kok/ Stanley Shek 0/ Mt. Parker
HONG KONG ISLAlfD
Tsim Sha Tsui Yau 114 Tei Mong Kok/ Tai Kok Taui King's Park Ho Man Tin Hung HOIII To Kwa lVan ICadoorie Hill
Central
5,530 ',710
10,830 6,110 9,450
4,020
9,890 ",20 4,570 2,470
',250
,,670
1,500
990 5,6W
600
110
Sheung 'Western Wan
680 8,280 5,300
800 1,790
9W 2,610
650 890 510 560
510
20
110
2,470
20
230 1,660
20,810 260
1,2W
230
740 160 5W 740
180
120
90
10
Hid'levels (West)
100 '270 750
3,850 380
160
350 100 190 190
180
90
90 ,60
410
Wan Chai
410 760
2,610 700
17,660
2,270
3,470 1,,20 2,410 1,830
1,190
980
50 120
1,950
170
50
10
TRIPS '1'0 WORK BY H<»O: PLACE BY l\ORK PLACE
PART A
Causeway BaYI
Happy Valley
190 . 400
1,370 390
2,780
',900 2,240
510 1,230 1,190
1,030
690
120
nO 1.290
70
100
10
North Point
2W 410
1,740 360
3,280
1,240
-",160 2,040 3,220 2,270
1,030
410
80 80
1,m
20
50
30
Tat Koo
90 120 680 170
1,060
320
2,520 4,580 ,,800 2,030
290
120
10
30
380
20
WORK PLACE
Shau Kei Wan
40 80
240 30
650
170
690 330
8",190 2,320
240
130
10
280
20
40
Chai Wan
'0 280
30 340
200
920 ,40
1,670 9,930
160
90
10
,'0
110
20
Wong Tal Net
Ha.ng/ Chung/ Braemar Stubbs
Rd.
20 40
160
260
120
270 110 280 200
1,630
210
10
220
10
10
10
',540
60
40
220
20
50
Peak! Kt.
Cameron & Nicholson
10 10
180 130 120
20
120 40 . 80
150
60
40
Shouson Aber- HilljDeep
:Okl- 'deenl W B I '.1.1 alii ater ay
Wah Fu South Bayl
40 110 670 100 160
40
160 50 90 70
50
60
180 450
1,970 150
1,010
260
980 210 400 390 250
260
Repulse Bay
10 10 70 10
100
50
30 40
100 40
10
10
1,650 10 10
10 1,550 340
180 . 1,200 21,440 710 :
20 620
180 210
76 ,100 26,210 30,920 7,27037.960 17.640 30,950 ' 16,280 n.49O 14.530 3.560 6.730 2.850 4.360 28.860 2,020
2.660 3,'90 3.870
2,870 2,030 3,400 1,000
19,220
. '
300 660
820
480 460 540 150
,.410
330 210 280
10
1,870
60 120
190
780
480 970
860
710 710
1,160 ,60
5.050
'70 500
520
530 410 640 190
,.160
250 660
680
720 590 770 100
',770
40 200
200
270 ,80 '70
10
1,270
80
170
150 70
120 10
600
10 110
120
''0 100 190
840
10 30
50
70 50 60
270
80 70
130
50 120 120
570
20 30
100
20 30 70
270
40 170 30 280
50 240
60 160 90
60 220 20 30
260 1.190
10 120
120
10 30 20 10
320
Chung HOIII
Kok/ Stanley
10 30 40 10 30
20
10 30
120 110
80
180
20
1,570
2,290
10 10
80
200
Shek Hong O!Mt. . Kong
Parker ~
7, 800 16,470
10 47, 980 13,110
20 40 ,990
14,230
10 38, 670 14,060
30 28 ,100 30 24,660
20 ,_ 10,370
50
60
400
10,960
3,600
4,150
41, 560
2,210
2,980
690
630322,650
4,650 10 7,730
20 8,6ell
20 6,930 5.200 8,210 1,720


APP=:NDIX 5
~ Cont'd
WOHK PLACE
New New HOME PLACE ·Tsuen Wan/ Territories, Ko_loon Ngau Kwun Tong Kwun Tong Anderson Kwun Tong New Outlying Territoriea
Bay Tau Kok (Central) (East) Rd. (South) Kowloon Tsing H/ not Islands Tuen Mun Sha Tin (excluding Grand Kwai Chung elsewhere Total
specified Tsuen Wan )
Cpntral 10 11 0 360 80 70 60 130 9,130 Sheung Wan 10 40 180 10 830 300 110 20 10 10 150 19 ,290 Western 20 40 170 880 70 3,640 7'¥J 180 60 10 60 310 56,760 Mi d- levels(West) 10 10 20 140 20 520 220 80 80 15,230 \'Ia n Cha i 20 50 220 1,000 140 3,730 680 170 40 30 60 300 50,230 Cau se 'A'ay Bay/ 10 10 70 420 50 1,300 250 60 20 40 20 140 17.590 HIlPPY Vall ey Nor th Point 20 30 280 3,390 120 6.510 740 330 70 20 30 450 51,250 Tai Koo 40 460 20 1,210 290 50 40 10 100 17,500 Shau Kei Wan 20 90 190 2,330 290 4,620 470 300 30 20 70 420 36,2 10 Cha i Wan 40 140 1,280 60 2,860 370 180 100 20 40 340 30 ,320 Tai Hang/Braemar ' 10 120 350 50 1,090 220 110 10 120 13.150 Wong I;"i Chung/ 30 200 30 680 140 60 10 70 13,220 Stubbs lld. Peak /~t s. Cameron & Nicholson 50 110 20 3,890 Pokfu la m 40 120 50 30 30 4,640 Abe r de<! n/ 10 60 80 360 50 2,170 W"h Fu
830 170 120 60 50 400 47.770
Shollson Hill/Deep-water Bay/ 40 130 20 2,430 50'A th Bay /Repulse Bay Chu!'lg Hem Kok/ 20 10 60 20 20 3,140 5tanle:r 5hek 0/ 20 50 740 Ht. Parker
HONG KOIlG ISLAND 120 340 1,430 11,260 910 29,990 5,470 1,920 580 220 340 3,060 392.490
Tsim Sha Tsu! 20 140 470 30 3,410 990 450 80 530 27.730 'fau Na Tei 40 180 470 2,260 130 12,920 3,690 860 70 120 330 1,380 61.740 Hong Kok/ 60 150 560 2,090 10 140 16,680 4,440 1,050 70 250 370 1,740 67,680 T8i Kok Tsui King's Park 10 60 20 10 10 740 Ho Han Tin 30 60 370 1,630 10 150 8,850 1.690 530 50 90 90 760 32,290 Hung HOII! 40 50 170 1,400 150 5,840 1,220 480 30 50 150 710 27,490 To Kwa Wan 130 150 670 3,710 10 250 15,370 3,140 1,040 100 90 190 1 ,420 60,450 Kadoorie Hill 30 120 380 20 2,130 310 160 10 10 40 220 9.010
~ 300 640 2,510 11,940 870 65,260 15,500 4,580 330 610 1,250 6,710 287,130
. ' .' .'

APPENDIX 5
HOKE PLACE
5h.9m Shui Po 3hek Ki p Hei/ Pak Tin : heung Shll 'Nan Ko wloon Foothills :'91 Ch i Kok/ '1ei Foo <0",100n Tong 'an Po· KongIKowloon : i ty/Wsng Tau Hom/ Nong Td Sin jhuk Yuen/ rn i Ho rn Chuen/ rl5z Wan Shan 'iamme r HiUi :hoi Hung/Ping Shek (ai Tak <o. loon Bay ~gllu Tau Kok <wun Tong (Central) ~wun Tong (East) 'nderson Rd. <\fun Tong (South)
'IEII/ KOWLOON
rSUEN WAN/ rS ING YI/KWAI CHUNG
"ew Territories. not tlBewhere specified >Utly i ng Islands ruen Hun 'ha Tin
w.v TERRITORIES : EXC LU~ING TSUEN WAN)
lRAND TOTAL
• I
Centra l
4.600
1.480
240 50
2.840
1.000
2.850
2,460
1.530
10 40
880 4.250
170 70
1.490
23.960
4.220
1.400
550 100 340
2.390
Sheung Wan
1.130
350
60
240
70
880
800
270
250 1.090
50 90
390
5.670
1,350
290
160 30
170
650
Wes t er n Mid
+evel ll -(Wes t)
800 200
340 110
40 10
80 80
90 10
580 110
440 190
190 20
10 10 180 100 710 260
10 10
420 100
3,890 1.210
860 230
200 100
170 30 50
100 10
520 140
Wan Chai
1 ,340
560
90 10
430
170
1,170
1,250
480
50 290
1,800 50 70
960
8,720
1,480
550 60 30
130
770
TRIPS TO \'IORK BY HOME PLACE BY WORK PLACE
PAHT B
Causeway Bay/
Happy Valley
740
250
40 10
310
120
660
460
260
100 1,010
30
570
740
240
40 20 60
360
North Point
1 .080
360
60
220
130
750
840
310
20 400
1.860 70 60
1.060
7, 220
380
100 10 60
550
WORK PLACE
Tai Koo
Shau Kei Wan
220 160
150 150
30
90 40
20 40
310 190
40 50
20 20 160 60 700 620 50 10 30 4f10
720 1.020
2.850 ' 2.530
260 310
60 60
30 20
20 10
110 90
Chai Wan
160
20
40 10
80
290
230
80
70 590
30 20
450
2.070
240
40
10
10
60
Wong Tai Nei
Hang/ Chung/ Braemar St ubbs
Rd .
100
30
10
10
70
60
10
10
Peak/ Mt. Pok-
Cameron & f 1 Aberdeen/ Wah Fu Nichol- u am
son
50
50
80 430
40 170
40 10
10 100
10 10
60 230 80 50 460
100
20
20 160 10 10
110
640
70
10
10
120
60
240 10 10 90
910
120
50
10
20
80
40
10
10 110 20 10 30
410
100
40
10
20
70
10 110
10 20 10 170 80 610
20 20
40 430
10 110
30 120 10 50 10 10
60 290
125,890 37,290 38,060 9,630 53,980 26,460 43,430 20,770 17.020 17.740 4. 550 8,410 3,700 5. 170 33 . 930
Shouson Hill/Deep Water Bay/ South Bay/
Repulse Bay
90
50
20
70
40
10
30 140
480
70
20
20
40
Chung Horn Kok/
Stanley
60
10
90
70
20
110
40
400
180
30
40
20
90
Shek O/Kt.
Par icer
Hong Kong ~
10 11 .320
10 4. 180
660 90
10 4. 570
1. 69J
10 8.810
20 7. 910
20 3, 490
10 200
2.730 20 14.360
530 410
20 7 . 970
120 68 . 930
10 11. 970
20 3.610
1.380 300
10 1.020

APPENDIX 5
, HOME PLACE
Sham Shui Po Shek Kip Nei/ Pak Tin Cheung Sha 'IIan Kowloon Foothills Lai Chi Kok/ Mei Foo Kowloon Tong Sa~ ~o Konsl~owloon City/
_ Wang Tau Hom/Wong Tai Sin Chuk Yuen/ Tai Horn Chuen/Tsz Wan Shan Hammer i1ill/ Choi Hung/ping Shek Kai Tak Kowloon Bay Ngau Tau Kok Kwun 'rong (Central> Kwun Tong (East) Ander-son Rd. Kwun Tong (South)
NEW KOWLOON
TSU£N WAN/ TSING 'iI/K.VAI CHUNG
New Territories, not elsewhere specified Outlying Islands Tuen Mun Sha 'fi n
NE'N TERIUTORIES (EXCLUDING TSUEN, WAN)
GRAND TOTAL
'Tsim Sha T!!ui
5,720 2,040
190 40
1,740
1,030
5,380
3,940
2,160
100 1,620 4,430
120 110
1,350
29,970
4,820
1,430 100 70
670
2,270
84,620
. '
, Yau Ma Tei '
3,550 1,660
180 20
610 470
3,440
2,580
1,050
80 1,140 2,950
40 170
1,5,0
Mong Kok/ Tai Kok Tsui
9,240
4,780 450
40
1,130
540 5,440
4,270
1,380
110 1,290 4,820
100 140
1,990
King'!! Park
230 100
20
130 110
320
300
70
10 150 140
10 90
Ho Man Hung Tin Ham
410
230 40
150
50 ?DO
520
170
' 50 150 540
40 10
150
1,260
550
50
220
50 2,030
40 550
1.500 50 70
950
~, Cont'd
To Kwa Kadoorie Wan Hill Kowlo.2!l
2,710
1,700
230 10
350 450
5,900
4,790
50 1,210 4,560
140 200
1,780
600 220
40 10
160
170
900
510
230
200 570
10 10
260
23,720 11,280
1,200 120
4.lt90 2.870
24.110
18,490
6,850
440 6.310
19.510 500 720
8-,100
WORK PLACE
Sham Shek Shui Po Kip Mei/
Pak Tin
35,960 7,780
1.540 70
1.400
450 4,720
4,160
930
80 1,270 3,430
120 150
1,630
860
4,520
30
70
70
510
290
120
10 30
380
10 120
19,470 35,720 1,680 3,210 9,280 25,490 3,890 128,710 63.690 7,020
1,570
80 270 360
2,280
2,240
160 140
1,060
3;600
330
50 10 10 70
140
90
120
980 2,440
570
720
60 50
220
1,050
480
230
10 80
320
60,270 91,710 4,,60 8,630 25,270 63,930 9,200
"
21,110
6,690 440 590
2,630
10,350
1,910
100 70
630
2,710
90 10
60
8,840
KowCheung loon Foothills
Lai Chi Kok/ Mei Foo
Sh. Wan
12,180
4,530
3,910 100
1,160 180
3,900
3,350
720
90 610
2,070 40
110 950
220 1,100
80 540 100 100 30 110
20 1,840 10 40
70 580
50 530
,0 160
10 160
30 410
20 20 190
Kowloon Tong
420
230 20 10
160 2,220
860
630
130
70 520
10 30
200
San Po Kong/
Kowloon City/
Wang Tau Ho'm/lilong Tai Sin
4,610
3,380 460
60
750 1,240
45,520
2,0 ',190 9,110
3'0 620
4,540
Chuk Yuen/ Tai Horn
Chuen/ Tsz Wan Shan
430
200
20 20
130 130
2,340
10,530
390
60 ,20
1.130 60
100 630
Hammer Hi 11/ Choi Hung/ Ping Shek
170
50
70
40
520
530
1,640
20 170 590
20 20
270
660 5.790 5.510 97,760 16,'90 4.110
8,550
1,580
70 190 560
2,400
90 1,570
20
20
280
20 60
390
210
10
70
290
1,660
80 130 530
2,400
250
20
230
130
Kai Tak
480
210
30
410
440
1,420
820
560
120
290 1,090
20 50
330
6,270
490
450
10
150
610
55,550 920 ;0,560 9.060 124.090 19,110 5.280 12,230

. ,
APPEN;)IX 5
~ Cont'd
WORK PLACE
New New HOME PLACE Kowloon Ngau Kwun Ton~ Kwun Tong Andltrson Kwun Tong New Tsuen l'Ian/ Terr itories, Outlyi ng Terr i t ories GEH,d
Bay Tau Kok (Central (East) Rd. (South) Kowloon Taing H/ not Islands Tuen Mun Sha Ti n (e xclu:iing Tote.l Kwai Chuns; elsewhe r e Tsuen ',van ) specifi ed
Sham Shll i Po 100 90 720 . 2,960 240 60,540 10,500 1,930 100 240 490 2,760 108 ,840 Shek Kip Mei/ 40 110 660 1,840 10 170 24,350 4,520 840 80 90 340 1,350 45 ,680 Pak Tin Cheung Sh;t Wan 20 20 430 10 6,690 1,180 120 20 30 170 9 ,900 Ko wloon Foothills 10 40 450 140 20 10 30 830 Lai Chi Kok/ 10 20 100 590 20 6,650 1,840 290 10 30 20 350 17,900 Hei Foo Ko wloon Tong 20 80 200 380 60 5,560 550 220 30 10 90 350 11,020 San Po Kong/Kowloon City/ 230 510 1,440 7,980 20 510 71,130 5,560 1,880 60 180 650 2,770 112 ,380 Wang Tau , Hom/Wong Tai Sin Chuk 'luen/ 240 350 1,230 7,290 480 49,460 4,480 1,440 70 160 370 2,040 82 ,380 Tai Hom Chuen/Tsz Wan Shaft , Hammer Hill/ 40 240 510 2,370 20 200 12,800 1,250 390 10 150 550 24.940 Choi Hung/Ping Shek Kai Tal< 120 10 10 140 Kowloon Bay 100 120 110 530 50 1,410 200 30 10 20 60 2,310 Ngau Tau Kok 210 2,590 .1,160 5,390 220 15,680 1,170 490 30 90 610 26 ,500 Kwun Tong (Central) 490 1,230 16,000 32,320 80 1,880 70,760 4,470 1,690 110 160 300 2 ,260 111,360 K.un Tong (East) 30 20 300 1,880 90 2,920 200 40 10 50 4 ,2 GO Anderson Rd. 60 30 380 1,020 60 170 2,830 320 120 30 150 4, 430 Kwun Tong (South) 380 620 2,740 14,240 50 6,230 33,140 1,980 820 110 100 420 1,450 52,640
NEW KOWLOON 1,960 6,030 25,570 79,260 240 10,330 364,490 38,360 10,330 600 1,020 3, 010 14, 960 615,4; 0
T!>UEN WA N/ 100 180 590 2,790 30 320 29,100 93,360 3,470 360 880 730 5.,440 161, 980 TSING YI/KWAI CHUNG
Nltw Territories, 60 40 390 1,320 190 8,560 7,150 83,940 130 2,670 1,110 87, 850 11 3, 860 not elsewhere specified Outlying Islands 20 20 10 350 210 50 7,500 40 7,590 9,970 Tuen Hun ~ 20 90 10 530 1,310 1,500 60 5,460 10 7,030 9, 760 Sha Tin 10 60 360 50 2,620 630 490 10 10 4,440 4,950 11, 850
NE).\' r rnRITORIES 60 50 490 1,790 260 12,060 85,980 8,180 5,560 107,420 145 , 440 (EXCLUDING TSUEN WAN) 9,300 7,700
GRAND TCJrAL 2,540 7,240 30,590 107,040 300 12,690 500,900 162,990 106,280 9,570 10,910 10,890 137, 650 1 .602, 1. <jO

APPENDIX 6
TRJ.HI C DISTRICT (ilOHE PLACE)
Sheung \lian
'Hest ern
Mid-levels (Weat)
'lian Chsi
CAuseway Bay/Happy Valley
North .Point
Ta i Koo
Shau Kai Wan
Chai Wan
Tal .Hang/Braemar
l'Ion g Nei Chung/Stubbs Road
PE'.sk/I-I"ts. Cllll1erOn and Nicho1son
Pokfulalll
'A.berdeen/Viah Fu
Shouson Hill/Deep Water Bay/South B.!ly/Ropulse Bay
Chung ROID Ko!VStan1.y
Shek O/Ht. Parker HONG KO~G ISLAND
Tau She Tsui
Yau Ma Tei
Mong Kok/Tai Kok Taui
King'a Park
Bo Han Tin
Rung HOIII
To Kw. Wan
Kadoorle Hl11
..
Walk
5,990
11,510
20,940
5,420
18,360
5,520
12,330
5,150 9,160
9.870
2 ~30
4,250
1,680
1,550
12,850
910
1,330 410
129,760
13.590 26,200
30,390
550
5,780
7,940
21,480
2,500
108.430
Pak Pai
10
50
180
80
20
320
10
30
10
120
140
40
30
40
1,oBo
30
10
20
40
80
30
210
TRIP LEGS TO WORK BY MODE OF TRANSl'ORT BY TRAFFIC DISTRICT
Taxi
20
70
550 1,160
680
550 930
90
70
10
270
660
190
130
540
;0
40
5,990
970
790
680
10
1,050 320
660
430
4,910
Motor Cycle
}O
20
280
70
80
60
200
50 120
100
70
70 10
50 200
30
}O
30 1.500
20
100
200
10
110
90 200
20
MODE 0,' TRANSPORT
Private car
90 1}0
570
2,600
540
670
1,220
550 620
100
1,190
2,270
1,440
780 740
790
430
90 14,820
560
390 750
110
2,040
390
l,O}O
1,750 7,020
,
Public Bus
1,800
4,930
19,720
5,680
16,320
6,370
18,670
6,560
I} ,240
14.670
7,720
4,510
490
1,770 23,920
560
1,280
210 148,420
9,530
25,080
25,230
50
18,080
13,930
27,130 3,860
123,490
}O
30
10
60
20
90
60
40
70
20
50 110
90
70 90
100
20
530
Tram (including Peak Tram)
370
1,500
7,260
210
11,300
2,680
8,010
2,270
6,160
210
600
1,560
60
30
270
10
20
42,520
120
170
170
70 80
170
780
Private Bus
110
160
'1,170
310
760
320
1,290
270
580
480
390 220
50
290 1,840
10
50
640
1.390
1.960
10
1,360
850
2,840
}OO
9,350
Ferry
990
1,920
4,480
1.000
1.,120
1,160
8,1320
1,730
5,030
3,530
1,220
890
60
350 5,960
40
110
30 41,440
3,980
5,200
5, 330
4,390
4,120
4,700
740
28,460
Public Light Bus
210
1,100
8,640
460
~.280
2,050
7,230
} ,100
1,230
8,220
840
180
190
170
9,880
90
10
10 54,890
1,190
7,240
8,660
6,520
3,360
8,780
410
. 36,160
All Modes
9,610
. 21,380
6} ,690
17,100
57,580
19,420
59,110
19.78?
42,300
37,240
15,020
14,770
4,170
5,160
56,230
2,510
3,300 780
449,150
}O,650
66,700
73 ,470
740 }9,490
31,2l0
67,770
10,060
320,090

· .
APPENDIX 6 (Cont'd )
':RAITIC DISTRICT (HOME PLACE)
Sham Shui Po
Shek Kip Me~Pak Tin
Cheung Sna Wan
Kowloon Foothills
Lai Chi Ko~ei Foo
Kowloon Tong
San Po Kong/Kowloon City/Wang Tau Hom/Wong Tai Sin
Chuk Yuen/Tai HOAl Chuen/Tsz Wan Shan
Hammer Rill/Choi Hung/Ping Shek
Kai Tak
Kowloon Bay
Ngau Tau Kok
Kwun Tong (Central)
Kwn Tong (East)
Anderson Road
Kwun Tong (South)
NEW KOWLOON
TSU EN WAN(TSING YI/KWAI CHUNG
New Territories, not elsewhere specified
Outlying Islands
Tuen Hun
Sha Tin
EXCLUDING
GRAND TOTAL
Walk
44,210
11,340
5,170
160
1,920
3,150
46.920
18,640
5,820 .
120
560
4,930
29,830
1,540
330
6,590 181,230
53,840
6,480
4,560
4,070
79,740
55},OOO
Pak Pai
20
10
90
270
70
10
170 880
420
20
440
2,640
Taxi
460
80
20
60
500
10
20
210
3,860
80
20
10
110
15.270
Motor Cycle
20
20
280
230
110
460
20
110
30
520
4,760
"
MODE OF TRANSPORT
Private Car
1,100
720
50
60
1,920
2,650
920
600
10
260
2,260
100
90
390 l2 .180
2,620
3,670
100
310
420
4,500
41.140
Public Bus
43,080
21,440
3,020
440
10,610
3,950
46,830
52,160
15,070
1,190
15,560
52,<20
2,090
2,970
33,460
304 ,090
62.450
25.200
1.850
2,880
5,120
35,050
673.500
Train
110
100
20
70
140
140
40
40
10
90 860
50
3,010
10
10
740
3.7'70
5,640
Tram (including Peak Tram)
250
'70 10
80
20
150
110
40
10
30
470
50
10
630
~,930
l30
160
40
330
46,170
Private Bus
3,910
2 .920
310
30 610
820
4,800
4.160
980
20
110
1,570
6 150
120
210
3,210
29,930
15,120
5,310
120
720
460
6,610
Ferry
7,050
1.640
320
20
2,680
640
3,650
4, 560
\
1, 180
90
1, 260
10.650
450
350
6, 910
41, 450
11 ,290
2,970
2,610
270
610
6,460
129,100
Public Ligh t Bus
17,780
11,970
2, 050
190
1,590
630
15, 660
11 ,410
3,420
440
4.950
26, 270
350
1.01'0
12.950 110.700
36, 460
18 ,520
40
2, 460
2.260
23 ,280
261,490
All Hodes
118. 350
50. 790
10,970
910
20,0£0
12,280
120 ,o?,O
93.190
27, 410
140
28.750
128, e50
4.730
5.050
64.700 688 ,640
183 ,.330
124 ,300
1 1.410
11.360
13 ,740
160,810
1 .802,020

TRAFFIC DISTRICT (HOI1E PLACE)
Central
Sheung Wan
Weste rn
APPENDIX 7
~id-levels (West)
Wa n Chai
Causeway Bay/Happy Valley
North Point
Tai Keo
Shau Kei Wan
Chai 'lian
Tai Hang/Braemar
\Yong Nei Chung/Stubbs Road
Fea~ts. Cameron and Nicho1son
Fokfulam
Aberdeen/Vlah Fu
S~ euson Hill/Deep Water Bay/ South Bay/R~pu1ee Bay
Cn ung Hom Kok/Stanley
Shek o/Mt. Parker
HONG r ONG ISLAND
Tsim Sha Tsui
Yau Ma Tei
Mong Kok/Tai Kok Teui
King's Park
Ho Man Tin
Heng Hom
To Kwa Wan
Kadoorie Hill
. '
Walk
5,990
11,510
20,9110
5,420
18,360
5,520
12,330
5,150
9,160
9,870
2,530
4,250
1,680
1,550
12,850
910
1,~30
410
129,760
13,590
26,200
30,390
550
5,780
7,940
21,4Bo
2,500
108,430
. .
Pak Pd
10
20
130
BO
20
240
10
10
10
70
130
40
20
40
830
10
10
20
10
50
TRIPS 'IQ WORK BY SENIOR MODE OF TRANSPORT BY TRAFFIC DISTRICT
Taxi
10
20
410
670
490
480
620
60
30
220
470
110
100
260
30
20
4,000
570 480
410
10
670
130
330
310
2,910
Motor Cycle
30
10
260
50
60
50
180
50
100
100
70
50
50
170
30
30
30 1,320
20
100
190
10
70
80
IBo
20
670
MODE OF TRANSPORT IN ASCENDING ORDER or SE~~ORITY
Private Car
90
90
520
2,330
460
530
1,150
550
510
90
1,130
2,100
1,380
720
700
780
420
90 13,640
500
320
740
110
1,880
330
990
1,610
6,480
"
Public Bus
1,410
3,430
15,190
4,710
11,670
5,320
13,290
5,040
9,360
9,060
6.310
3,510
390
1,390
17,290
490
1,160
170 109,190
7,400
20,,960
20,,310
50
12,280
10,770
21,300
3,120
96,190
Traill
20
10
30
10
30
40
10
50 20
220
10
100
80
70
90 100
20
70
Tram (including Peak Tram)
360
1.220
6, 240
200
9.550
2.360
7.120
1,930
4,9Bo
130
510
1,450
30
30
250
10
10
36.400
10
60
70
PriYate BUll
90
110
940
300
680
270
1,050
230 440
380
330
200
50 260
1,5Bo 10
50
6,970
570
1,340
1.830 10
1,140
780
2,770
290
8.730
Ferr'1
940
1,770
3,590
960
3,570
9Bo 8,010
l,3BO
4,350
2.430
1,090
860
60
330
4,770
40
110
30 35,270
3,B80
4,990
5,070
3,860 4,010
4,440
720
26.970
Public Light BUll
210
1,100
8,640
460
5. 2Bo 2,050
7, 230
3,100
7. 230
8,220
840
1Bo
190
170
9,8Bo
90
10
10 54,B90
1,190
7,240
8,660
6,520
3,360
8,780
410
36,160
All Modee
9,130
19. 290
56.760
15. 230
50.230
17.590
51.250
17. 500
36. 210
30.320
13 .150
13, 220
3, B90 4, 640
47,770
2,430
27.730
61.71,0
67,6Bo
740
32, 290
27.490
60.450
9. 0lC
287,130

, .
APPENDIX 7 (Cont'd)
TRAFFIC DISTRICT
(HOME- PLACE)
Sham Shui Po
Shep Kip Me~Pak Tin
Cheung Sha Wan
Kow1oon Foothills
Lai Chi Ko~Mei Foo
Kowloon Tong '
San Po Kong/Kow1oon City/ Wang Tau Hom/Wong Ta! Sin
Chuk Yuen/Tai Hom Chuen/Tez !lan Sh!lJ1
Hammer Hi1l/Choi Hung/Ping ' Shek
Kai Tak
Kowloon Bay
Ngau Tau Kok
Kwun Tong (Central)
Kwun Tong (East)
Anderson Road
Kwun Tong (South)
~ EW KOWLO<ll
rSUEN WAN(TSING YI/KWAI CHUNG
New Territories, not elsewhere specified
Outlying Islands
Tuen Mun
Sha Tin
NEW TERRITORIES
GRAND TOTAL
Walk
44,210
11,340
5,170
160
1,9.20
3,150
46,920
18,640
5,820
120
560
4,930
29,830
1,540
}}o
6,590
181,230
53,840
64,630
6,480
4,560
4,070
79,740
553,000
Pal< Psi Taxi
}O }}O
30 . 200
10
10
10 210
10 280
60 410
130 300
40 60
10
20 30
60 300
10
10 20
30 80
430 2,260
200
170 30
10
20 10
190 50
1,500 9,420
Motor Cycle
240
120
10
10
20
270
220
'110
70
230
20
20
80
1,420
400
310
20
40
30
400
4,210
, .
MODE 'OF TRANSPORT IN ASCENDING ORDER OF SENIORITt
Private Car
1,010
6}0
50
40 1,700
2,430
900
960
560
10
250
2,140
70
go
}60
11,200
2,420
3,540
80
300
400
4,320
38,060
Public Bus
34,880
17,110
2.010
400
9,130
3,080
39 ,,990
42,330
12,830
1,100
1},720
}9,970
1,650
2,440
24,350
244,990
44,930
17,}40
620
1,540
3,740
23,240
518,540
Train
80
30
10
70
110
130
40
}O
110
70
680
30
1,980
10
470
2,460
3,860
Tram (including Peak Tram)
30
10
10
40
30
20
20
20
180
40
30
20
50
36,740
Private BulS
3,810
2,790
310
30
570
790
4,560
4,060
960
20
110
1,500
5,500 120
190
2,850
28,170
14,390
5,020
110
?CO 400
6,230
64,490
Ferr1
6,440
1,450
280
2,680
630
3,460
4,170
1,080
80
1,000
6,930 440
290
5,260
34 ,190
9,270
2,290
2,580
160
450
5,480
111,180
.,
Public Light Bus
l70 780
11,970
2,050
190
1,590
630
15,660
11,410
3,420
440
4,950
26,270
350
1,040
12,950
110,700
36,460
18,520
40
2,460
2,260
23,280
261,490
All Modef
108,840
45,680
9,900
830
17,900
11 ,020
112,380
82,380
24,940
140
2 ,;nO
26,500
111,)60
4. 200
4,430
52, 640
615,450
161,980
11~,860
9,970
9,760
11, 850
145, 440
1, 602, 4,?O

APPENDIX 8 TRIPS ro STUDY BY HOKE PLACE BY STUDY PLACE
PART A
STUDY PLACE
Causeway Wong Shouson Chung HOHE PLACE Mid- Tai Nei Pealv'Mts. Aber- Hill/Deep Shek Hong Sheung Wan Bay/ North Ta! Shau Chai Pok- Hom Central Western levels Hang! Chung! Cameron & deen/ Water Bay/ O/Mt. Kong Wan Chai Happy Point Koo Kei Wan Wan fulam Kok/ (West) Valley Braemar Stubbs Nicholaon Wah Fu South Bay/ Stanley Parker Isl and Rd. Repulse Bay
Central 770 1,260 290 1,990 450 110 80 30 190 90 20 10 60 5,350 Sheung Wan 570 4,580 1,530 1.990 510 370 180 20 60 .CO 410 180 30 200 140 20 10, 840 Western 950 2,040 24,750 4,640 1,730 840 440 80 220 60 910 550 130 870 340 10 30 38,590 Mid-levels (West) 340 330 820 4,570 250 270 170 20 10 250 280 250 130 20 150 130 7, 990 'Nan Chai 450 250 830 1. 540 12,240 3,250 1,290 110 450 250 1,500 3,570 760 160 70 90 26, 310 Causeway Bay/Happy Valley 140 130 270 650 1,250 4,330 400 80 150 70 720 670 500 40 40 10 9,450 North Point 720 290 840 1,370 2,650 3,550 14,790 470 1,220 240 3,450 1,700 1,320 100 70 10 20 32, 810 Tai Koo 180 90 120 450 800 1,150 2,390 2,460. 1;110 180 610 470 220 20 20 10 20 10, 300 Shau Kei Wan 350 170 270 370 1,260 1,650 1,680 920 15,970 780 1,390 5110 120 40 30 50 25,590 Chai Wan 150 100 130 160 950 1,010 780 350 2,690 12,870 740 90 80 20 80 40 20,240 Tai ~ang!Braernar 270 140 370 850 1,050 2,400 770 80 480 90 2,220 720 250 90 20 90 20 9, ')lO 'Nong Nei Chung/Stubbs Rd. 140 80 190 900 1,060 1,740 220 60 20 60 580 2,600 590 30 70 90 8,4';0 Peak/Hta. Carneron Bc 20 30 280 60 60 10 20 90 390 70 10 1. 040
Nicholson Pokfulam 240 110 720 740 90 70 10 30 10 50 40 130 1,330 120 40 10 3,'140 Aberdeen/Wah Fu 890 910 3,560 2.3'70 1,090 490 370 40 170 40 680 460 170 300 32,930 40 80 44,590 Shouaon ~ill/Deep Water 20 20 20 60 40 100 20 20 -l0 30 40. 50 250 260 200 1,140
Bay/Soutb Bay/Repulse Bay
Chung Hor.! Kok/Stanley 30 10 60 350 50 50 40 10 90 50 50 60 140 1,510 10 2,510 She~ O/Mt. Parker 20 30 60 50 80 10 10 20 220 500
HONG KONf] ISLAND 6,250 10,510 34,740 22,990 25,830 21,470 23,660 4,790 22,750 14,120 13,850 12,140 5,CflO 3,310 34 ,300 890 2,330 230 259,830
Tsim Sba Taut 70 10 70 l}0 60 80 50 30 20 30 70 30 10 10 10 680
Yau Ma Tei 110 10 10 310 no 90 60 10 30 60 40 40 10 50 1,000 Mong Kok/Ta! Kok Tsui 30 30 100 160 60 90 20 30 10 100 60 10 40 40 840
King's Park 1 890 Ho ".an Tin 90 10 130 300 250 240 200 30 20 50 170 250 10 60 20
Hung Hom 10 30 80 80 90 150 80 20 20 60 30 30 20 20 '720
To Kwa Wan 90 10 100 250 160 140 150 20 20 10 220 40 20 40 30 1,300 Ksdoorie Hill 10 60 10 50 10 20 60 10 10 20 260
~ 410 160 550 1,290 740 840 570 110 170 100 660 550 150 120 160 10 100 6,690
• , . .'

L •• . '
APPENDIX 8
PART A Cont'd
STUDY PLACE
San Po Chuk Hammer Hong Kow- Lai Kong/ Yuen/ Hill! HOME PLACE Taim K!)k/ Shek Cheung Chi Kow- Ko_loon Tai Yau King's Ho Man Hung To Kw. Kadoorie Sh8JII loon Choi
Sha Ma Tei Tal Park Tin Hom Wan Hill ~ Shui Po Kip Mei/ Sha Foot- Kok/ loon CHy/ Hom Hung/ Kai Tak Taui Kok Pak Tin Wan Mei Tong Wang Tau Chuen/
Taui bills Foo Hom/Wong Tse Wan Ping
Tai Sin Shan Sbek
Ce'ntral 10 10 20 10 50 20 10 50 10 10 Sheung 'Han 60 30 20 }O 20 30 190 40 10 60 40 10 Western ,150 90 }O 80 40 20 60 470 80 70 10 210 70 40 30 Mid-levels (West) 70 10 10 40, 10 140 50 10 120 10 Wan Chai 190 60 20 20 }O 20 60 400 }O 40 150 30 Cause'Nay Bay/Happy Valley 40 }O 60 10 40 180 20 10 10 10 North Point 160 60 }O 10 20 10 100 }90 30 30 20 10 230 70 }O 40 10 Tai Koo 110 10 20' 10 30 30 30 10 250 10 }O 30 10 10 Shau Kei Wan 90 20 10 60 20 20 40 260 60 60 70 20 20 Chai Wan 10 10 30 20 70 20 10 10 180 30 10 40 10 70 10 Tai Hang/Braemar 70 30 40 10 20 10 60 240 40 10 100 40 Wong Nei Chung/Stubbs Rd. 30 10 10 30 30 110 10 40 20 10 40 Peak/Mts. Cameron & 10 10 20 40 10
Nicholson Pokfulam 30 10 40 20 70 10 180 10 10 Aberdeen/'Nah Fu 100 60 50 30 30 70 80 420 40 30 10 50 20 10 10 Shouson Hill/Deep Water 20 20 60
Bay/South Bay/Repulse Bay
Chung Hom Kok/Stanley 10 10 10 20 20 10 Shek O/Mt. Parker 10 10
HONG KONG ISLAND 1.130 360 360 100 560 270 200 540 :3 .520 460 220 40 60 60 1·300 390 110 170 80
Tsilll Sha Tsui 8,000 1,510 290 400 990 130 50 670 12,040 320 190 20 10 170 890 370 110 90 20 Yau l'.a Tei 3,540 14,490 2,530 960 2,300 230 160 1,730 25,940 1,230 1,000 90 20 580 1,660 660 120 1}0 Mong Kok/Tai Kok Taui 1,750 2,320 18,340 310 1,860 90 180 2,050 26,900 2,760 1,850 190 630 2,210 990 130 260 20 King'a Park 20 20 10 300 70 30 450 40 10 Ho Man Tin 2,190 2,500 1,750 1,020 11,110 1,900 710 1,520 22.700 910 740 100 10 240 1.960 1.360 330 290 Hung Hom 1,220 420 440 240 1,560 7,340 1,150 980 13,350 190 270 50 10 160 690 490 170 90 10 To K"a 'IIan 2,000 640 1,000 340 3.770 2.210 13.380 6.810 30 ,150 670 750 50 10 250 1,560 2,620 750 290 30 Kadoori e Hi 11 380 160 270 70 680 40 220 1.840 3,660 150 230 10 30 1.380 610 50 80 20
KCVlLCON 19.100 22.060 24.630 3,640 22,340 11.970 15.850 15.600 135,190 6.230 5,030 510 60 2.060 10,390 7,100 1,660 1,240 l OCI ---

APPENDIX 8
PART A Cant' d
STUDY PLACE
HOME PLACE Ngau Tsuen Wan/ New New Kowloon
Tau Kwun Tong Kwun Tong Anderson Rd. Kwn Tong New
Tsing Yi/ Territories Outlying Tuen Mun Sha Tin Territories Grar.d
Bay Kok (Central) (East) (South) ~ Kwai Chu!1S not elsewhere Islands ( excluding To tal specified Tsuen Wan~
Centrn l 10 110 70 10 80 5, 590 Sheel rig Wa n 160 80 50 10 60 11, 330 Wester n 50 20 20 600 50 130 30 40 200 39, 910 Ihd -hvels ( Nes t ) 20 210 10 90 20 110 8, 460 'II" n Ch"i 30 10 20 310 130 140 20 160 27 ,310 c.~tlS"wJ.y Ba y/Happy Valley 30 10 10 100 10 100 10 110 9/50 No -th Fo i nt 60 20 40 590 60 240 10 250 34,100 Ta i Koo 10 20 40 10 170 10 50 50 10,780 Sr.a u Ke i Wan 50 5<> 40 370 5<> .230 10 240 26, 510 ehai Wa n 10 30 20 230 10 60 20 20 100 20,760 TRi Hang/Braemar 90 10 290 20 40 40 10, 500 Wo n!:. Nei ChunvStubbs Rd. 20 140 30 20 10 60 8,740 re .. k/l1 ts . C!lr:eron & 50 1,110
Ni.chol son Pokfulam 10 20 10 60 10 10 10 20 4,010 A her de en/Wah Fu 20 40 10 30 270 120 130 30 160 45,560 Shouso n Hill/Deep Water 60 30 20 20 1,270
Bay/ South Bay/Repulse B .. y
Chu llg Horn Kok/Stanlel 60 2, 500 Sh ek O/Mt . Parker 10 10 520
HCNG KONG ISLA ND 100 440 170 190 3,790 590 1,370 l.30 120 40 1,660 269,390
Tsim Sha Tsui 140 90 10 20 2,45<> 100 90 10 30 130 15,400 Y"u Ha Tel 60 15<> 30 20 5,750 290 240 40 20 70 370 33.350 Hong Kok/Tai Kok Taui 220 190 20 30 9,500 360 340 30 5<> 420 38, 020 King 's Park 10 60 20 10 10 540 Ho Ma n Tin 260 130 30 70 6,430 140 210 20 30 260 31,420 Hung Hom 130 90 50 140 2,540 100 110 20 10 20 160 16,870 To Kw .. Wan 25<> 200 60 60 7,550 170 210 10 220 39,390 Kadoorie Hill 10 60 20 2,110 20 20 10 30 6,680
~ 1.130 920 200 36:> 36,990 1,200 1,230 120 5<> 200 1,600 181,670
, j ••

< , .
APPENDIX 8
HOM.!; Pl.J\CE . Central
Sham Shui Po Shek Kip Meil
Pak Tin Cheung Sha Wan Kowloon Foothills Lai Chi Kok/
Mei Foo Kowloon Tong San Po Kong/Kow1oon City/
Wang Tau Hom/VIong Tai Sin Chuk Yuen/Tai Hom Chuen!
Tsz Wan Shan Ha.mme r Hill!
Cho! Hung/Ping Shek Ka! Tak Kowloon Bay NgflU Tau Kok Kwun Tong (Central) Kwun Tong (East) Anderson Rd. Kwun Tong (South)
NE)'I KOWLOON
TSUEN WAl'''/ TSING YI/KW"I CHUNG
.New Territories, not elsewhere specified
Outlying I s lands Tuen Hun Sha Tin
NEII TERRITORIES (EXCLUDING TSUEN WAN)
GRAND TOTAL
120
10
10
70
10
30 120
20 60
530
180
30
260
. .
Sheung Wan
30
30
20
40
230
40
220 10
Western
270
50
50
40
120
150
40
20 270 20
100
1,130
330
180
320 20 20
Midlevels (West)
400
90 30
170
70 100
230
80
20 260 10 20 40
230
220
180 10
410
Wan Chai
160
50 20
10
30
100
160
50
250 30
240
220
120
210
60
390
••
,-TRIPS TO STUDY BY HOME PLACE BY STUDY PLACE
~
Causeway , Bay/ " Happy Valley
130
70
30
20
100
70
70
40 550 60
190
190
90
150 20
260
North Point
160
50
30
30
150
70
20 70
300 10 .10
180
1,080
150
120
70
30
220
Tai Koo
30
30
30
30
' 20
180
20
10
11l
STUDY PLACE
Shau Kai Wan
100
20
10
20
20
50 380 20
460
1,140
40
100
60 30
190
Chai Wan
10
10
20
10
10
20 50
10 60
270
50
30
20
50
Wong Tai Nei
Hang! Chung/ Braemar Stubbs
Rd.
80
30
20
50
50
50
30 330 10 10
210
910
80
90
90
10
190
100
40
40
20
10
30
100
10 120
140
150 40
10
200
24,090 25,680 5,110 24,290 15,190 15.69013.570
Peak/ Mts.
Cameron ~ Nicho1-
son
20
10
10
50
10
30
10
10 10
160
10
20
Aber_ Pok- deen/ fulam Wab Fu
30
20
50
30
20
60
20
230
40
50 10
60
80
10
20
50
120
20 70
60
460
140
40
30
20
90
~.440 3.760 35.150
Shouson Hill/Deep Water Bay/ South Bay/
Repulse Bay
10
10
20
Chung Hom Kok/
Stan1ey
50
80
20
40
30
20
60 60
10 40
410
50
2,890
Shek Hong o/Mt. Kong
Parker ~
10
1.790
470
140
630
260
1 .CXlO
1.180
480
20 380
2 .920 160
eo 1.760
10 11.270
2.120
1.280
1.680 90
150
3.200
240 283.110

APP~:iD IX 8
HOP.E PLACE
Sham Shui Po Sr.ek r:ip He il
Fak Tin Cheung Shu Wa n Kowloon Foothills Lal Chi Kok/
Kowl oon Tong San Po Ko ng/Kowl oon Ci ty/
Wang Tau Horn/Hong Tai Sin Chuk Yuen/Tai Hom Chuen/
Tsz Wnn Shan Hnmme r Hill/
Cb oi Hung/Ping Shek Ka i Tak KOlll100n Bay Ng'\u Tau Kok Kwun Tong (Central) Kwun Tong ( Eas t) Anrlerson Rd . KllIlIn Tong (South)
N::~V KCI'/ LOON
TSUECl WAN/ 1'S I NG YI/KWAI CHUNG
Ne w Territories, not elsewhe re specified
Ou tlyi ng I s l ande Tuen ~l un
Sha Tin
NEW TERRITORIES (J::XCLUDI NG TSUEN WAN)
GRAND TOTAL
Ts im Sha Taui
1. 910
620
130 40
430
590
2,100
1,010
20 410
1.760 50 40
610
ll,270
l,l50
830
90 90
300
Yau ' Ma Te i
1,230
400
80
270
70
870
860
300
220 600 30 40
220
Mong Kok/ Tai Kok Tsui
5,470
1,290
90
400
240
2,210
1,620
1,060
10 570
1,720 30 20
410
King's Ho Man Hung Park Tin Hom
530 2,180
40 530
20 120 140
170 550
160 440
320 1,710
200 1,330
120 950
60 580 190 1,490
40 10 50 40 620
80
50
10
80
40
370
260
210
. 120 350 10 10
140
~ Cont'd
STUDY PLACE
To Kwa Kadoorie Wan Hill Kowloon
20 0
100
30
60
950
760
270
220 680 60 20
490
2,170
940
110 30
760
630
2.890
1,300
940
610 1,990
40 30
410
13,770
3,970
550 220
2,690
2,230
11,420
7,880
4,860
30 2,790 8,780
260 220
2,940
Shek Sham Kip Heil
Shui Po Pak Tin
41,340
3,570
1,640 80
960
110
1,450
1,130
510
10 10
320 1,270
30 20
420
4,170
18 ,280
130 60
350
120
1,390
820
410 1,300
50 30
410
5,190 15,140 1,860 10,730 1,730 3,840 12,850 62,610 52 ,870 28 ,350
1,140
520
30
210
760
2,100
890
70 10
280
1,250
240
130
80
800
70
160
210 1,030
140
90
20
140
160
210 ·
10
30
250
990
1,060
30 30
230
1,350
6,880
4.530
320 130
1,320
6,300
5,420
690
80 20
340
1,130
1,220
260
40 20
170
490
:53,960 29,510 43,480 6,050 35,620 14,250 20,300 31,330 214,500 '66.110 35,310
. . » •
,Cheung Sha Wan
2,140
130
1,090 80
160
190
160
60
60
20 60
Kow'.oon Foothills
50
190 70
70
20
30
20
20
10 90
10
Lai Chi Kok/ Mei Foo
Kowloon Tong
2 ,190 2 .380
490 1,010
140 50 40 20
3.800 950
20 2 ,720
440 3,700
320 2 ,310
190 1 ,180
10 230 570 270 2,360 10 30 10 50
530
San Po Kong/
Kow1 00n City/
Wang Tau Hom/W ong Tai Sin
1,340
360
40 10
200
2.300
52.670
11 ,520
2,710
90 850
3,030 80
100 1.360
4,150 580 8.160 17,860 76 ,660
120 20 200
10 10 10 20
10 70
140 30
990
70
280
880
620
50 10
100
780
5,690 840 13,260 31,830 85,810
Chuk Yuen/ Tai Horn
Chu en/ Tae Wan
Shan
Hammer Hill/ Choi Hung/ Ping Shek
380 100
190 30
10 20
110 110
150 100
5 ,080 420
42 .790 1 840
1 .590 13,410
40 300 580
1.160 1.100 70 50 40 30
620 250
52.530 18 .040
370
40 10 50
440
110
240
10
30
280
55,110 19.840
."
Kai Tak
30
10
20
30
40
30
160
20
30
30
390

< 1 <"
APPENDU 8 ~ Cont'd
STUDY PLACE
New New HOHE PLACE Tsuen Wan! Territories. low100D Ngau Kwun Tong Kwun 'Tong Anderson Kwun Tong Ne. Tsing Yil not Outlying Tuen Mun Sha Tin Territories Grand
Bay Tau Kok (Central) (East) Rd. (South) Kowloon Islands (exclud ing Total Kwai Chung elsewhere Tsuen \'ian) specified
Sr,,,,m Shu i Po 10 170 250 30 50 54,630 1,580 500 20 50 570 72,340 Shek Kip Heil 40 80 50 40 24,270 400 160 20 60 240 29,350
Pak '.l i n Cheun g 5ha Wan 10 10 10 3,340 130 30 30 4,190 Kowloo n Foo thills 10 370 10 20 20 620 L~i Ch i Kod 60 20 20 6.820 390 110 10 120 10 ,650 Mei Fao Ko., l oon Tong 100 110 10 10 5,770 40 40 8,300 San Po Kong/Kowloon Ct tyl 20 520 1,660 '70 200 68.160 550"' 450 10 60 10 530 81 .660 W"ng Tau Hom/W ong Tai Sin Chuk Yuerv'Tat Horn Chuen/ 10 ,70 1,160 160 270 6l.910 410 390 20 10 10 430 72.ElO Tsz Wan Shan Hamme r HUl! 10 920 980 no 180 22.740 180 260 10 270 28.530 Choi HunYPing Shek Ka i ral< 10 10 Kow100n Bay 370 250 70 840 10 10 10 910 Nga u rau Kok 20 12.430 2.460 ,,0 320 18.860 70 200 10 210 22.'10 Kw un Tong ( Central) 20 5.620 60,950 590 10 1,880 79.710 280 650 20 20 690 92.~80 KWllll Tong (East) 30 1.490 210 440 2,490 20 20 2.930 A"do rson Rd. 30 2,840 10 JO 30 3,240 40 40 40 3.620 K'Nun Tong (South) 20 350 4,720 420 10 34,010 .. ,,190 90 '90 40 10 440 48.420
NEW KO'.'lLOON 480 20,910 76,800 2,290 50 31.460 '97,350 4.140 ,;nO 100 110 180 3.660 479.030
TSUSN I'IANI 260 660 60 140 13.720 119.530 1.390 100 480 100 2.070 144.320 TS 1:13 YI/KI'IA I CHUNG
New Territories, not 140 340 llto 170 4.300 1,320 106,710 30 2,270 740 109,750 ' 121.180 else· .. here specified' Outlying Islands 40 40 400 110 100 8,710 70 20 8.900 11.410 Tuen ~:un 10 10 160 3,0 1,670 20 1,570 10 9,270 9,9B6 Sha Tin 10 90 1,150 120 760 7,630 8,390 11.1:50
~;::II TERRITORIES 160 51fO 140 210 ~010 (EXCLUDING TSUEN WAN)
1,880 l09.ZitO 8,760 9.910 8,400 136.310 153,700
GRAND TOTAL 480 22.560 79,,60 2,860 38,,60 "57,860 127,3ItO U6,500 9,210 10,670 8.920 145.}OO 1.228.110

APPENDIX 9
TRAFFIC DISTRICT
(HOME PLACE)
Central
Sheung Wan
Western
Mid-levels (West) '
Wan Chai
Causeway Bay/Happy Valley
North Point
Tal Koo '
Shau Kel Wan
' Chal ' Wan
Tal Hang/Braemar
'Wong Ne! Chung/Stubbs Road
Peak/Mts. Cameron_' and Nicholson
Pokfulam
Aberdeen/Wah Fu Shouson Hill/Deep Wat~r B~/South B~/
Repulse Bay
Chung Hom Kok/Stanley
Shek a/Mt. Parker
HONG KONG ISLAND
Tslm Sha-Tsu-i
Yau Ma Tei
Mong Kok/Tai Kok Tsu!
King's Park
Ho Man Tin
Hung Hom -
To Kwa Wan
Kadoorie Hill
\ ,
. ~ .... . .
Walk
4,1 '-0
7,600
" 25,20?
4,280
15,050
4,930
15,030
2,960
15,110
12,840
3,790
2,690
280
1,390
29,680
460
1,530
140
147,070
_ 8,880
20,700
24,820
400
15,080
9,130
24,540
3,640
107,190
TRIP LEGS TO STUDY BY MODE OF TRANSPORT BY TRAFFIC DISTRICT
Pak Pai Taxi Motor Private cycle Car
140
370 60
1,540 100
620 70
1,110 100
450 50
1,510 J80 10
550 60
460, , 60
120 10
650 80
1,090 110
80 20
400 60 20
880 }O
20 10
30
10,080 1,000 30
330 1'00
680 100 10
890 130
10
790 180 10
300 , 30 r -- '
900 170
440 110
4,340 820 20
.-
30
70
280
960
10
200
4,20
120
150
20
490
,1,320
370
430
200
100
80
120
5,370
190
,310
530
20
970
" 350
,660
710 ,
3,740
MODE OF TRANSPOR'r
Public- Bus
820
2,270
7,810
1, 890
. 4,790
1,560
7,230
1,890
4, 590
6,610
3,720
2,120
190
1,-280
, 11,250
300
730 260
59,310
4,320
9,190
8,810
30
10,740
5,690
9,970
1,400
50,150
Train
30
20 , 80
60
90
40
150
30
110
50
20
40
720
40
120
140
. '120
70
120
10
620
Tram (including peak tram)
200
820
2,570
120
2, 950
780
3,960
2,750
4,500
40
310
390
40
io 250
10
19,700
10
10
50
130
40
70
'. ~ .
Private Bus
250
220
2,320
680
3,750
1,780
5,840-,
2,320
1,820
1,010
1,400
1,180
120
470
l,3W '
:no ·2?0
25,080
1,600
2,000
2,200
80
_ 2,770
1,080
2,550
390
12,670
Ferry
70
250
410
150
500
120
680
210
490
150
260
' 40
10
70
1, 290
20
10
4,730
510 520 '
500
1,440_
570 970 120
4,630
Public Light Bus
30
140
860
10
370
170
390
320
510
560
170
40
60
10
2,060
30
5,730
30
360
620
1,220
220
740
70
3,260
,'-
All Modes
5, 680
11, 820
41 , 170
8 , 840
28 , 780
10 , 080
35, 400
11,210
27 , 800
21, 360
10,920
9 , 000
1,1 70
4 ,1 40
47,010
1,3 10
2,590
540
278 , 820
16, 010
34 , 000
38 , 690
540
33,450
17 ,480
40,690
6,890
187,750

· .. .. .,
APPENDIX 9 (Con\'d)
THAFFIC DISTRICT
(HONE PLACE)
Sha.J1l Shut Po
Shek Kip ~!ei/Pak Tin
Cheung Sha Wan
Kowloon Foo thills
La t Chi Kok /Me i Foo
-Kowl oon Tong
San Po Kong/ Ko wloon City/Wang tau Hom/ Wong Tai Sin '
Chuk 'fuen/,ra i Hom Chuen/Tsz Wan Sban
Hammer Hill/Choi Hung/Ping Shek
Kai Tak
Kowl oon Bay
Ngau Tau Kok
Kwun Tong (Central)
Kwun Tong (East)
Anderson Road
Kwun Tong (South)
NUl KOI.JLOON
TSUEN WAN!TSING YI!KWAI CHUNG
New '1'err! tories, not eleewhere speci!1ed
Outlying Islands
Tuen Mun
Sha Tir.
NE. ... T!:: ltiHTOltI~S
GRANDT<YrAL
Walk
46,~00
22,090 '
2,740 ,
280
4,140
3,100
51,360
49,120
15,320
660
14,290
57,930
1,230
2,300
34,320
311 ,200
104,000
63,230
8,190
6,150
7,000
104,510
77",O~
Motor Private Pak Pili Taxi cycle Car
6~0 80 ~50
430 40 140
40
20 50
480 90 460
560 60 1,230
250 90 270
540 20 10 300
160 10 ' 190
40 20 90
950 60 690
60 10 10
40
30 20 90
4,430 500 1O 4,110
410 60 820
640 10 10 ',010
80
80
640 10 10 1,170
19,900 2,"0 1~ 15,210
MODE OF TRANSPORT Tram Pr iva te Public Public Bus Train (including Ferry All Modes
peak tram} Bus Li ght Bus
20,910 220 60 2,760 1,080 1,190 73, 860
5,600 470 210 610 29, 790 1,210 10 150 50 190 4, 390
160 130 20 660
4,210 10 10 1, 270 320 110 11 , 100
2,120 20 20 1,300 150 30 8, 610
20,360 60 2,650 430 920 82, 430
19,450 60 60 ~, 100 630 110 74 ,080
11,030 70 20 1, 580 260 340 29 , 000
10 10
130 60 20 910
7,060 90 580 340 360 22, 870
24,330 100 260 6,630 2 140 2,520 95,830
',140 10 430 160 50 3, 100
1,060 110 60 90 3,740
10,670 30 110 2,460 1,500 1,270 50 , 520
129,120 110 590 23,190 1,'70 8,470 490 , 900
30,650 120 210 5,800 1,110 3,780 141,560
24,450 4,410 130 6,230 120 5,100 126,540
1,230 250 160 2,120 70 12,620
2,150 10 1,440 50 540 10,420
2,610 180 760 80 210 11,540
30,440 , 5,200 380 8,610 ',510 6,520 161,120
}OO,210 7,'7<> 21,190 15,950 22,010 27,760 1,266,150

Central
APPENDIX 10
TltAF'FIC DIS'I'HICT
(HOME PLACE)
Sheung Wan
Weste rn ,
Mi d-levels (Wes t)
Wan Ch ai
Causeway B~y/Happy Valley
North Point
Ta i Koo
Shau Kei Wan
Chai '~an
T;li Hang/Br ae mar
Wong Nei Chung/Stubba Road
Pe ak/l1 ts. Came ron and NicholBon
Pokful am
ALe r deen/Wah Fu
Shous on Hil l/Dee p Water Bay/South Bay/ Repulse Ba y
Chung Hom Kok/Stanley
Shek O/Mt. Parker
HONG KONG I SLAND
Tsim Sha 'rs ui
Yau It,a Tei
Mong Kok/Tsi Kok Tau!
King' B Park
Ho Man Tin
Hung HOD!
To Kwa Wan
Kadoorie Hill
. .. \
.. .. '.
TRIPS TO STUDY BY SENIOR MODE OF TRANSPORT BY TRAFFIC DISTRICT
Walk
4 ;110
7,600
25,200
4,280
15,050
4,930
15,030
2,960
15,110
12,840
~,7 90
2,690
280
1,390
29,680
460
1,530
140
147,070
6,880
20.700
24,820
400
15,080
9,130
24,540
3,640
107,190
Pak Pai Taxi
140
360
1,520
580
1,170
450
1.500
550
450
120
650
1,080
80
400
870
20
9,970
BO
680
680
10
760
,00
890
440
4,290
50
80
60
70
40
140
40
10
80
80
20
60
20
10
760
90
60
120
'40 30
130
110
680
MODE OF TRANSPORT IN ASCENDTh G ORDER OF SENIORITY
Motor Private cycle Car
20
20
10
10
30
70
220
940
10
190
320
120
110
20
480
1,~80
340
400 180
' 80
70
120
4,980
170
~OO
500
20
860
330
600
650
3,430
Public BUB
760
1,860
6,870
1,620
4,130
1,380
6, 360
1,640
3,780
6,060
3,320
1,970
160
1,1 60
10,020
}OO
730 240 ,
52,380
3,780
8,650
8,310
30
9,160
5,180
8,870
1.310
45,290
Train
10
70
20
50
30
20
10
30
40
10
10
300
40
120
130
110
70
120
10
600
Tram (including peak tralo )
200
170
2,400
120
2,750
760
3, 930
2 ,640
4, 280
40
310
370
40 10
240
10
16,870
Private Bus
250
220
2,300
680
3,720
1,780
5,750
2, 320
1,790
980
1,400
1,1 80
120
470
1,260
350
220
24,790
1,580
1,970
2,150
80
2,110
1,050
2,540
340
12,420
Ferry
10
250
390 •
150
490
120
660
180
440 140
260
40
10
70
1,220
.20
10
4,520
500
500
490
1,380
560
960
110
4,500
Public Light BUB
30
140
860
10
370
170
390
320
510
560
170
40
60
10
2,060
30
5,730
~O
360
620
1,220
220
740
70
3,260
. •
5, 590
11,3 30
YJ ,910
8,460
27 ,610
9,850
34, 100
10 ,780
26 ,510
20,nO
10 ,500
8 ,7.10
1,1 10
4,010
45,560
1 , 2'10
2,580
520
15,4 00
3~ . 350
313 ,0?0
5'10
31 ,420
16,870
~9,3 90
6 ,680
181.6'(0

.... . ~
APPD~DIX 10 (Cont'd)
TRAFfI C DIS'fRI CT
(HOME PLACE )
Shrun Shui Po
Shek Kip Me i/Pak Tin
Cheung Sha Wan
Kowl oon Foo t hills
Lai Chi Kok/Me i Foo
Kowloo n Tong
San Po Kong/Kowl oon City/Wang Tau Hom/ ',long 1'ai Sin
Chuk Yuen/ 'l'ai Horn Chuen/Tsz Wan Shan
Hammer Hill/Choi Hung/P i ng Shek
Kai Tal<
Kowl oon Bay
Ngau Tau Kok
Kwun Tong (Central)
Kwun 1'ong (Eas t)
Anderson Road
Kwun Tong (South)
NB'" KOW LQON
1'S UEN WAN!TSING YI!KVIAI CHUNG
New Terri tories, not elsewhere specified
Outlying Islands
Tuen Mun
Sha Tin
NEW TEltRITOHI£S
,GRAND TOTAL
Walk
46,300
22 ; 090
2,740
280
4,140
3,100
51,360
49,120
15,320
680
14,290
57,930
1,230
2,300
34,320
311,200
104,000
83,230
8,190
6,150
1,000
104,510
174,030
Mo tor Pale Pai Taxi cycle
830 10
430 40
40
480 30
580 ' 60
250 80
530 10 10
180
40 20
810 40
60 10
30 10
4,320 370 10
410 60
380 10 10
380 10 10
19,370 1,820 110
,. .
MODE OF TltANSPOHT IN ASClcNDING OJillEH OF SENIOHITY
Private Tram
Private Car Public Bus Train (including Bus peak tram )
350 19,560 210 2,760
140 5,370 470
1,010 10 150
30 160 130
440 },92O 10 10 1, 200
1,110 1,960 20 1,300
270 19,620 80 2,650
260 18,320 70 10 3,090
190 10,570 70 20 1,580
10
130 80
90 6,550 90 560
810 21,810 80 40 6,500
10 990 430
40 940 170
90 9,030 10 10 2;400
3,830 119,940 650 90 23,480
780 27,780 100 30 5,DO
960 20,080 3,900 50 6,160
370 30 90
30 1,760 10 1 ,440
70 2,310 110 760
1 ,060 24,520 4,620 80 8,450
14,080 269,910 6,270 19,010 14,870
Ferry
1,070
200
50
310
140
430
620
260
20
310
1,780
150
80
1,250
6,670
1 ,650
700
2,660
50
70
3,480
20,820
• '"
Public Li gh t Bus
1,1 90
610
190
20
110
30
920
710
340
360
2,520
50
90
1,270
8,470
3,780
5,700
70
540
210
6,520
27,160
All Mod es
72 , 340
29 , 350
4,1 90
620
10,650
8, 300
81,660
72,810
28 ,530
10
910
22,310
92 , 380
2 , 930
3 ,620
48 ,420
479 ,030
144 , 320
121,1 80
11 ,410
9,980
11,130
153,100
',228,110

• ~,
t i
(,
e
\
MAP 1
o
CHUK YUEN! TAl HOM CHUI;:N/ TSZ WAN SHAN
SHOUSON HILL! DEEP WATER BAY! SOUTH BAY! REPULSE BAY
D
HAMMER HILL CHOI HUNG! PING SHEK
/ <
CHUNG HOM KOKjl STANLEY f
J - ~ S't f J ~
l
TRAFFIC DISTRICTS-HONG KONG ISLAND, KOWLOON AND NEW KOWLOON
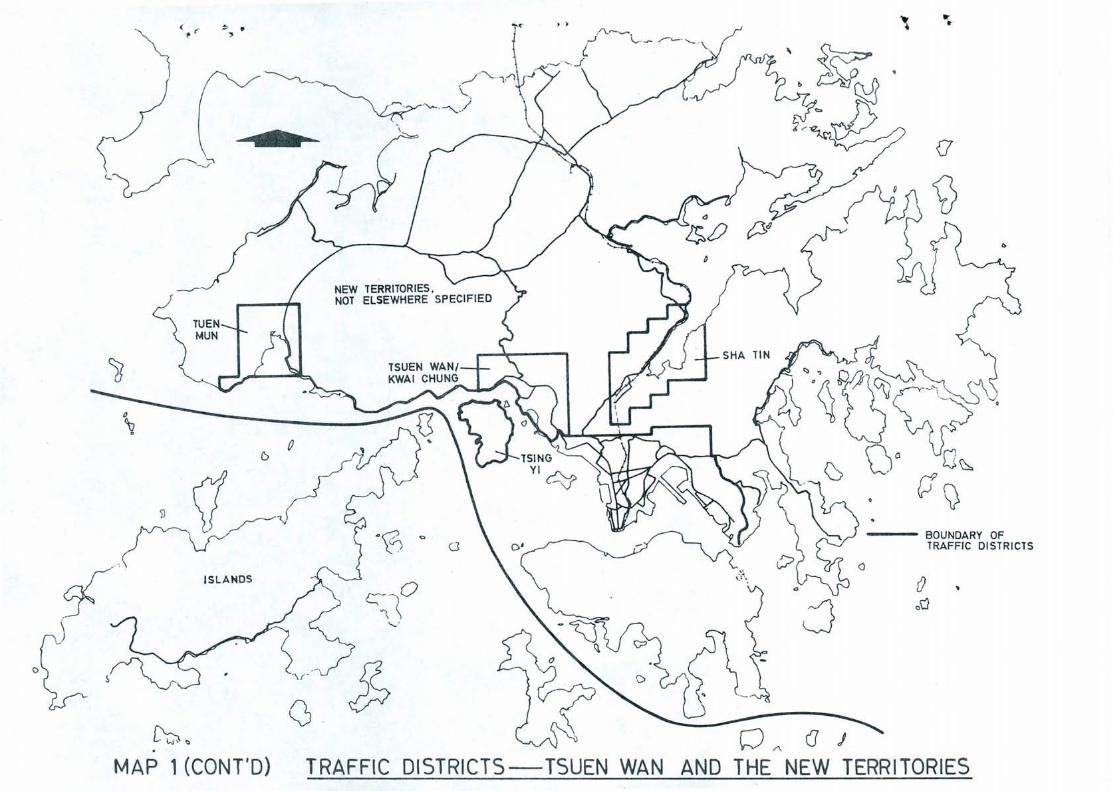
ISLANDS
MAP 1 (CONT'D)
/\.~~, .-1 \" .. _ "'--'~. -""" .. , ..
SHA TI N
P A a j
(J
-- BOUNDARY OF TRAFFIC DISTRICTS
TRAFFIC DISTRICTS-TSUEN WAN AND THE NEW TERRITORIES

"',r '> / ~ )
..J \ ( \ J
-, \
~--.. --. - - ---- _. __ .. _ ....... _ .... __ ... _--
,""'- I
IKo~wLooN //({J
/~ /
. _l----+· ___
MAP 2 TRAFFIC AREAS-HONG KONG ISLAND. KOWLOON AND NEW KOWLOON

"- ISLANDS
(NEW TERRITORIES)
o
"" . G MAP 2(CONT'D)
b
NEW TERRITORIES
.<2 0
~j G .
cJ
P --A. (] j
"\r. ' Jt '7 '
"
TRAFFIC AREAS-TSUEN WAN AND THE NEW TERRITORIES