A new approach to determining environmental flow requirements: Sustaining the natural values of...
10
A new approach to determining environmental flow requirements: Sustaining the natural values of floodplains of the southern Murray-Darling Basin By Paul Peake, James Fitzsimons, Doug Frood, Mel Mitchell, Naomi Withers, Matt White and Rick Webster Paul Peake is Remnant Vegetation Investigation Team Leader at the Victorian Environmental Assess- ment Council (VEAC) (8 Nicholson Street, East Mel- bourne VIC 3002, Australia; Tel: +61 3-9637-9896; Email: [email protected]). James Fitzsi- mons was a Senior Project Officer at VEAC and is currently with The Nature Conservancy (Suite 3-04, 60 Leicester Street, Carlton VIC 3053, Australia) and the School of Life and Environmental Sciences, Dea- kin University (221 Burwood Highway, Burwood VIC 3125, Australia; Email: james.fitzsimons@ deakin.edu.au). Doug Frood is a botanist with Pathways Bushland and Environment (PO Box 360, Greensborough VIC 3088, Australia; Email: [email protected]). Mel Mitchell is a Senior Project Officer at VEAC (8 Nicholson Street, East Mel- bourne VIC 3002, Australia; Email: mel.mitchell@ dse.vic.gov.au). Naomi Withers was Senior GIS Project Officer with VEAC and is now with the Department of Sustainability and Environment (8 Nicholson Street, East Melbourne VIC 3002, Australia; Email: [email protected]). Matt White is an ecologist with the Arthur Rylah Institute for Envi- ronmental Research, Department of Sustainability and Environment (123 Brown Street, Heidelberg VIC 3084, Australia; Email: [email protected]). Rick Webster is a Director ⁄ Ecologist at Ecosurveys Pty Ltd (PO Box 13, Deniliquin NSW 2710, Australia; Email: [email protected]). This paper is a result of work commissioned by the Victorian Envi- ronmental Assessment Council to better identify the environmental watering needs of flood-dependent species and ecosystems in the southern Murray- Darling Basin. Summary Large overbank flood events play an important role in maintaining large- scale ecological processes and connectivity along and across the floodplains and between the rivers and their floodplains in the southern Murray-Darling Basin. However, the regulation of rivers means that extensive overbank flooding can only occur in the rare circumstance of extreme flood events. Recent environmental water allocations have focussed on the largest floodplain blocks (‘icon’ sites) and a small set of specific values (e.g. colonial nesting water- birds), as well as on trialling fine-scale manipulation of infrastructure (e.g. pumping) to water relatively small areas. There has been no comprehensive systematic assessment of the entire floodplain and its wider set of flood-dependent natural assets (such as ecosystems and spe- cies; herein referred to as ‘natural values’) to maximise the effectiveness of environmental water use and to catalogue values likely to be lost. This paper describes an assessment of some 220 000 ha found to support flood-dependent natural values in Victoria. We mapped the geographic distribution and estimated components of the flooding requirements (natural flooding frequency, and maximum period without flooding and minimum duration of each flooding event before significant deterioration) for each natural value. Using an example of one stretch of the River Murray, we show how the resultant spatial data can be used with floodplain inundation modelling to compare the outcomes of real or planned environmental watering events; potentially providing tools for management agencies to conserve a wider range of floodplain values than is currently the case. That is, water managers and the public can see what ecosystems and threatened species are intended to be maintained by environ- mental watering and what values are intended to be abandoned across the whole floodplain, rather than just seeing the small subset of values and ‘icon’ sites that are intended to be maintained. Examples are provided to illustrate how information about the location, water requirements and extent covered by potential floods for specific values can be used to build adaptive watering strategies for areas as large as the whole floodplain. Key words: critical flood intervals, environmental flows, flood requirements, floodplains, threa- tened species. Introduction T he deteriorating state of the Murray- Darling Basin has been a cause of con- siderable concern amongst ecologists, land managers, politicians and the communities living in and relying on the basin. The guide to the Murray-Darling Basin Plan (e.g. MDBA 2010) and two significant investigations into future land and water management in Victoria and New South Wales (VEAC 2008a; NRC 2009) are recent attempts to redress this deterioration. Pulsed flooding is the major factor influ- encing biota in river-floodplain systems (Ballinger & Mac Nally 2006). The flood- plains of northern Victoria support a unique biota in an otherwise semi-arid environment because of overbank riverine flood events resulting from large rain events in the somewhat distant Great Dividing Range to the south and east. These flood events also maintain ecological connectivity along the length of the flood- plains, across the floodplains and between the major rivers and their floodplains, thereby playing a crucial role in the land- scape ecology of the region (Ballinger & Mac Nally 2006). The floodplain forests and woodlands not only provide important habitat for a range of forest- and woodland- adapted plants and animals, but also act as a pathway extending the geographic range MANAGEMENT REPORT 128 ECOLOGICAL MANAGEMENT & RESTORATION VOL 12 NO 2 AUGUST 2011 ª 2011 Ecological Society of Australia doi: 10.1111/j.1442-8903.2011.00581.x Ecological Society of Australia
-
Upload
independent -
Category
Documents
-
view
1 -
download
0
Transcript of A new approach to determining environmental flow requirements: Sustaining the natural values of...
A new approach to determining environmental flowrequirements: Sustaining the natural values offloodplains of the southern Murray-Darling BasinBy Paul Peake, James Fitzsimons, Doug Frood, Mel Mitchell, Naomi Withers, Matt White andRick Webster
Paul Peake is Remnant Vegetation Investigation
Team Leader at the Victorian Environmental Assess-
ment Council (VEAC) (8 Nicholson Street, East Mel-
bourne VIC 3002, Australia; Tel: +61 3-9637-9896;
Email: [email protected]). James Fitzsi-mons was a Senior Project Officer at VEAC and is
currently with The Nature Conservancy (Suite 3-04,
60 Leicester Street, Carlton VIC 3053, Australia) and
the School of Life and Environmental Sciences, Dea-
kin University (221 Burwood Highway, Burwood
VIC 3125, Australia; Email: james.fitzsimons@
deakin.edu.au). Doug Frood is a botanist with
Pathways Bushland and Environment (PO Box 360,
Greensborough VIC 3088, Australia; Email:
[email protected]). Mel Mitchell is a Senior
Project Officer at VEAC (8 Nicholson Street, East Mel-
bourne VIC 3002, Australia; Email: mel.mitchell@
dse.vic.gov.au). Naomi Withers was Senior GIS
Project Officer with VEAC and is now with the
Department of Sustainability and Environment (8
Nicholson Street, East Melbourne VIC 3002, Australia;
Email: [email protected]). Matt White is
an ecologist with the Arthur Rylah Institute for Envi-
ronmental Research, Department of Sustainability
and Environment (123 Brown Street, Heidelberg VIC
3084, Australia; Email: [email protected]).
Rick Webster is a Director ⁄ Ecologist at Ecosurveys
Pty Ltd (PO Box 13, Deniliquin NSW 2710, Australia;
Email: [email protected]). This paper is a
result of work commissioned by the Victorian Envi-
ronmental Assessment Council to better identify the
environmental watering needs of flood-dependent
species and ecosystems in the southern Murray-
Darling Basin.
Summary Large overbank flood events play an important role in maintaining large-scale ecological processes and connectivity along and across the floodplains and betweenthe rivers and their floodplains in the southern Murray-Darling Basin. However, the regulationof rivers means that extensive overbank flooding can only occur in the rare circumstance ofextreme flood events. Recent environmental water allocations have focussed on the largestfloodplain blocks (‘icon’ sites) and a small set of specific values (e.g. colonial nesting water-birds), as well as on trialling fine-scale manipulation of infrastructure (e.g. pumping) to waterrelatively small areas. There has been no comprehensive systematic assessment of the entirefloodplain and its wider set of flood-dependent natural assets (such as ecosystems and spe-cies; herein referred to as ‘natural values’) to maximise the effectiveness of environmentalwater use and to catalogue values likely to be lost. This paper describes an assessment ofsome 220 000 ha found to support flood-dependent natural values in Victoria. We mappedthe geographic distribution and estimated components of the flooding requirements (naturalflooding frequency, and maximum period without flooding and minimum duration of eachflooding event before significant deterioration) for each natural value. Using an example ofone stretch of the River Murray, we show how the resultant spatial data can be used withfloodplain inundation modelling to compare the outcomes of real or planned environmentalwatering events; potentially providing tools for management agencies to conserve a widerrange of floodplain values than is currently the case. That is, water managers and the publiccan see what ecosystems and threatened species are intended to be maintained by environ-mental watering and what values are intended to be abandoned across the whole floodplain,rather than just seeing the small subset of values and ‘icon’ sites that are intended to bemaintained. Examples are provided to illustrate how information about the location, waterrequirements and extent covered by potential floods for specific values can be used to buildadaptive watering strategies for areas as large as the whole floodplain.
Key words: critical flood intervals, environmental flows, flood requirements, floodplains, threa-tened species.
Introduction
The deteriorating state of the Murray-
Darling Basin has been a cause of con-
siderable concern amongst ecologists, land
managers, politicians and the communities
living in and relying on the basin. The
guide to the Murray-Darling Basin Plan
(e.g. MDBA 2010) and two significant
investigations into future land and water
management in Victoria and New South
Wales (VEAC 2008a; NRC 2009) are recent
attempts to redress this deterioration.
Pulsed flooding is the major factor influ-
encing biota in river-floodplain systems
(Ballinger & Mac Nally 2006). The flood-
plains of northern Victoria support a
unique biota in an otherwise semi-arid
environment because of overbank riverine
flood events resulting from large rain
events in the somewhat distant Great
Dividing Range to the south and east.
These flood events also maintain ecological
connectivity along the length of the flood-
plains, across the floodplains and between
the major rivers and their floodplains,
thereby playing a crucial role in the land-
scape ecology of the region (Ballinger &
Mac Nally 2006). The floodplain forests
and woodlands not only provide important
habitat for a range of forest- and woodland-
adapted plants and animals, but also act as
a pathway extending the geographic range
M A N A G E M E N TR E P O R T
128 ECOLOGICAL MANAGEMENT & RESTORATION VOL 12 NO 2 AUGUST 2011 ª 2011 Ecological Society of Australia
doi: 10.1111/j.1442-8903.2011.00581.x
EcologicalSociety of Australia
of a number of species, particularly birds
(e.g. Tzaros 2001).
The rivers of northern Victoria, how-
ever, are now highly regulated, and much
of their flows are diverted for irrigated agri-
culture. They are currently managed so
that extensive overbank flooding occurs
only when water storages are full and spill-
ing at sufficient volumes for the rivers to
break their banks (VEAC 2006). As a result
of this management regime, the frequency
of small and moderate floods has declined
to around a third or less of the natural
frequency of flooding for most of the
floodplain (e.g. DSE 2008a). Consequently,
there are now many indications of wide-
spread substantial decline in the biodiver-
sity of the floodplains including an
increase in the number of dead and dying
River Red Gum (Eucalyptus camaldulen-
sis) and Black Box (E. largiflorens) trees
(MDBC 2003; Cunningham et al. 2007),
reduced River Red Gum growth rates
(VEAC 2008a), and the development of
acid sulfate soils (McCarthy et al. 2006).
Despite a recent flood event, climate
change predictions translate to further
reductions in overbank flood frequency
(DSE 2008a) – and hence loss of biodiver-
sity into the future – if current river man-
agement continues. Reduced precipitation
and increased evapo-transpiration resulting
in reduced runoff are likely to greatly
reduce frequency and extent of floodplain
inundation (e.g. DSE 2008a).
As a result, artificially generated and
manipulated environmental watering has
been increasingly relied upon to sustain
floodplain forests and wetlands along the
Murray Valley in recent years. However,
this watering has been limited to specific
places and values, such as parts of large for-
est ⁄ woodland blocks (i.e. ‘icon’ sites) and
colonial nesting waterbirds (e.g. Cooling
et al. 2002; Leslie & Ward 2002; Stewart &
Harper 2002), and the basis for the selec-
tion of watered sites and specific values
ahead of others is often unclear. Environ-
mental watering requires strategic plan-
ning to ensure the most effective use of
water in sustaining biodiversity assets. A
prerequisite for such planning is a compre-
hensive, systematic, spatially explicit and
publicly transparent inventory of flood-
dependent natural values as a basis for
allocating scarce and expensive water and
for determining priorities for infrastructure
investment to natural assets. However,
consideration of the water requirements of
the full suite of floodplain ecosystems and
taxa has been limited (Ballinger & Mac
Nally 2005).
This situation is not unique to the Mur-
ray-Darling Basin or Australia. Internation-
ally, fish are typically used as an indicator
species for flood requirements (e.g. Richter
et al. 2006; Wang et al. 2009; Beilfuss &
Brown 2010) as they can be relatively
easily monitored. Indeed, Smakhtin (2008)
notes very few countries have set clear
procedures for environmental flow estima-
tion and allocation.
In this paper, we interpret for managers
an approach to environmental watering
that explicitly focuses on the flooding
requirements of species and ecosystems
across the landscape. This approach high-
lights, for the first time, those species and
ecosystems most in need of flooding and
the locations where they occur. The
approach is management focused and can
easily incorporate new ecological and bio-
physical data. The process aims to move
beyond the ‘icon sites’ approach to view
the River Murray floodplains as a dynamic
interconnected system. This is based on an
analysis undertaken as part of the Victorian
Environmental Assessment Council’s final
recommendations for the floodplain forests
and woodlands of northern Victoria (VEAC
2008a,b). During this analysis, we com-
piled data on and mapped the flood
requirements for all flood-dependent vege-
tation types, as a surrogate for ecosystems,
and most flood-dependent threatened spe-
cies along the River Murray and its major
tributaries in Victoria. (The full dataset is
published in a separate paper, Fitzsimons
et al. 2011.)
Using a case study in the Robinvale area
of the River Murray, this paper provides an
example of how the dataset can be used to
quantify the proportion of species habitats
receiving water under different flooding
regimes. The approach provides the basis
for a transparent, flexible and useable eco-
logical dataset to inform decision-making,
auditing and monitoring of environmental
management outcomes in the northern
Victorian floodplains, and beyond.
While vegetation types and threatened
species are typically the foremost natural
values targeted in analyses such as this, we
make a range of suggestions for future
work that would further improve the envi-
ronmental management of the floodplains,
including the incorporation of additional
natural values such as high species rich-
ness, key non-threatened species and eco-
logical connectivity.
How the Analysis of FloodingNeeds was Undertaken
Assessment area
The assessment covered the Victorian
floodplains of the Murray, Goulburn,
Ovens and King Rivers downstream of
Lake Hume, Goulburn Weir, Porepunkah
and Cheshunt respectively – an area of
approximately 507 000 ha, collectively
referred to here as the River Murray flood-
plain. The area is a subset of the Victorian
Environmental Assessment Council’s River
Red Gum Forests Investigation area (see
Fitzsimons 2006; VEAC 2006) (Fig. 1).
Determining the flooding
requirements of natural
values
Full details of how the flooding require-
ments for vegetation types and threatened
flora and fauna were derived are provided
in Fitzsimons et al. (2011, contact the
corresponding author for a copy) and are
summarised as follows.
Publicly accessible geospatial data main-
tained by the Victorian Department of
Sustainability and Environment (DSE) (i.e.
relating to vegetation types and threatened
fauna and flora) were used as the basis of
this analysis. Ecological vegetation classes
(EVCs) are the principal units for native
vegetation classification and mapping for
land-use planning and management in Vic-
toria (Parkes et al. 2003). These are units
in a vegetation classification system that
are differentiated through a combination of
floristic, life form and ecological character-
istics, and through an inferred fidelity to
particular environmental attributes.
The major determinant of vegetation
type in this region is riverine flooding; as
opposed to flooding or watering solely
M A N A G E M E N T R E P O R T
ª 2011 Ecological Society of Australia ECOLOGICAL MANAGEMENT & RESTORATION VOL 12 NO 2 AUGUST 2011 129

from local rainfall. Within flood-prone
areas, the major determinants of occur-
rence for most EVCs are variations in flood
regime, particularly flood frequency and
duration. In the assessment, we built on
this spatial dataset by identifying the flood-
ing requirements for each flood-dependent
EVC, based on the life-history traits, toler-
ances and competitive advantages of its
dominant and characteristic plant taxa.
This new information was appended to
existing EVC polygons. As few of the plant
species have been the subject of detailed
autecological studies, estimates of flooding
regime variables were based on a combina-
tion of searches of the available literature
supplemented by the expert opinion of DF
and MW who were closely involved in the
circumscription and mapping of EVCs in
2006.
To identify flood requirements for EVCs
in the region, we first identified flood-
dependent EVCs, i.e. those that were
(a) likely to significantly decline in condi-
tion across the region in the absence of
overbank flows from adjoining rivers or
(b) depended on geomorphological pro-
cesses such as the deposition of silts, and
the regulation of ground water depth and
chemistry. In the absence of long-term
historical information for the EVCs, the nat-
ural flood frequency for each flood-depen-
dent EVC was estimated based on what is
known or surmised by our expert assessors
of the flooding requirements and toler-
ances of characteristic species and the
physical (including hydrological) condi-
tions at sites of occurrence, particularly in
comparison with these parameters for
adjoining or similar EVCs. The critical inter-
val (the estimated maximum period that an
EVC can persist without flooding and
remain capable of returning to its refer-
ence or benchmark condition) was esti-
mated on the basis of familiarity of the
assessors with field indications of decline,
combined with a knowledge of past flood
intervals. We did not use hydrological mod-
elling to determine a volume for this pro-
cess as there was no hydrological model
for the entire floodplain at the time and
providing a volume was not the intent of
the approach. However, in this paper, we
do provide an example of how hydrologic
modelling could be used based on pre-
existing CSIRO models (see below).
Finally, the minimum flood duration
required to maintain each EVC in a
condition comparable to its reference state
(DSE 2008b) was estimated based on the
requirements of characteristic species and
physical conditions at sites of occurrence.
For flora, point records for listed threa-
tened or rare species that occurred in the
study area were extracted from the DSE’s
Flora Information System (FIS) (as at May
2007). Each taxon on this list was then
classed as flood-dependent or not by apply-
ing the same definition of ‘flood-depen-
dent’ that was used for the identification of
flood-dependent EVCs to what was known
of the taxon’s ecology and occurrence,
including a review of relevant literature
and FIS data. As little specific information
on the flood requirements exists for most
species, the flood requirements of the prin-
cipal EVCs in which these species
occurred was adopted as the flooding
requirements for that taxon. The distribu-
tion of each species was then mapped as
the spatial extent of the coincident EVCs.
Records for threatened fauna (birds,
mammals, reptiles and amphibians) were
extracted from DSE’s Victorian Fauna Data-
base and Birds Australia’s Atlas data (in
May 2008), and flooding requirements
were determined through discussions with
experts (see ‘Acknowledgements’ below),
and through reviewing relevant literature
(see Fitzsimons et al. 2011 for a list of pub-
lished sources used). The habitats of most
fauna taxa were specified as one or more
EVCs, which were then mapped as the
sites for each taxon within its known local
geographic distribution. The natural flood
frequency, critical interval and minimum
flood duration estimates for the EVC(s)
were then assigned to the sites. However,
for some taxa, notably colonially nesting
waterbirds, more specific information
derived from site visits was available and
used to map site locations and specify
watering requirements.
Geospatial data processing
A single digital geospatial layer was created
incorporating all flood-dependent EVC
polygons from the DSE’s Corporate Geo-
spatial Data Library. For threatened flora
and fauna, a separate digital geospatial
layer was created for each taxon using
new polygons where necessary but mostly
using pre-existing polygons – usually EVC
0 40km
Present study area
VEAC (2006) investigation area boundary
Area shown in Figures 2, 3
N
New south wales
Melbourne
River Murray
VictoriaSouth
Australia KiewaRiver
GoulburnRiver King
River
OvensRiver
16080
Figure 1. Location of VEAC River Red Gum Forests Investigation area and floodplain values
mapped in this analysis.
M A N A G E M E N T R E P O R T
130 ECOLOGICAL MANAGEMENT & RESTORATION VOL 12 NO 2 AUGUST 2011 ª 2011 Ecological Society of Australia

polygons but sometimes others according
to details specific to particular taxa or sites
as described above. New polygons were
digitised from hand-drawn polygons on
topographic maps or aerial photos. Natural
flood frequency, critical interval and mini-
mum duration estimates were assigned to
all polygons within a geographic informa-
tion system (ArcGIS).
Identifying flood-dependent
values
A major aim of the analysis was to identify
a broad range of natural values – such as
vegetation units, threatened flora and
fauna – that managers could take into
account when identifying conservation
management goals. To provide a visual rep-
resentation of the relative number of differ-
ent flood-dependent values at any one site,
geospatial layers for EVCs and for each of
the threatened species were overlayed, a
composite layer generated and a new field
for the number of distinct features
attached to each resultant polygon. Over-
laying the composite natural values layers
with the CSIRO River Murray Floodplain
Inundation Model (RiM-FIM) (Overton
2005) was undertaken in the Robinvale
area of northwestern Victoria to show
which values would or would not receive
water under differing flooding scenarios.
Outputs Relevant toManagers
Data for EVCs and
threatened taxa
Some 224 247 ha of extant vegetation on
the River Murray floodplains in Victoria
were determined to be at least partially
flood-dependent including 162 266 ha on
public land. This vegetation comprised
110 EVCs, confirming that a large area of
significant ecological diversity is at risk
from inadequate flooding (see Fitzsimons
et al. 2011 for the full description of the
primary findings).
Examples of natural flood frequency,
critical interval, minimum duration and
location information collected for a subset
of the flood-dependent EVCs are provided
in Table 1a. Natural flooding frequencies
ranged from as many as 3–4 flood events
every 4 years for Aquatic Herbland and a
further 20 EVCs, through to one flood
event in 20–40 years for Riverine Cheno-
pod Woodland. Critical intervals to main-
tain healthy ecosystems ranged from one
flood event every 2 years for around 30
EVCs to one flood every 30–50 years for
some EVCs dominated by Black Box. A
visual representation of the critical inter-
vals for EVCs is presented in Map D of
VEAC (2008a). Minimum durations of
inundation ranged from <1 month to
6–36 months (Table 1).
In terms of threatened species, 124 rare
or threatened plant taxa were classified as
at least partly flood-dependent of which 68
were sufficiently well known for their dis-
tributions to be mapped reliably (see Fitzsi-
mons et al. 2011 for the full list and
Table 1b as an example). Of the 62 threa-
tened vertebrate fauna taxa (excluding
fish) found to be flood-dependent, 51 were
sufficiently well known for their distribu-
tions to be mapped reliably (see Table 1c
as an example). A visual representation of
the critical intervals for threatened species
is presented in Map E of VEAC (2008a).
Mapped outputs – and an
example of how they can be
applied in management
planning
Figure 2 and Table 2 provide examples of
how the digital mapping generated in this
project can be used to compare the extent
to which different modelled inundation
events assist or fail to assist in sustaining
floodplain natural values for a particular
area. Figure 2 shows the predicted extent
of flooding for three different-sized floods
along a sample reach of the River Murray
floodplain east of Robinvale, resulting from
three different flow rates along the river
channel: 20, 81 and 159 GL per day, which
correspond to very small, moderate and
large overbank floods, respectively. To give
some context, prior to 1981 for example,
sustained flows (more than five consecu-
tive days) of 20 GL per day occurred on
average in 8 of every 10 years. Sustained
flows of 81 and 159 GL per day occurred
twice and once (respectively) in every 10
years, on average. In the decade to the end
of 2009, however, there were only 5 years
in which sustained flows of 20 GL per day
occurred and none in which sustained
flows of 81 or 159 GL per day occurred
(MDBA, unpublished data, 2011). While
Figure 2 is a composite of all flood-depen-
dent EVCs and threatened species, maps
can be readily produced for individual
EVCs, species or combinations thereof.
The area of each flood-dependent EVC,
threatened species habitat and the percent-
age of these areas inundated by the three
different flood levels are outlined in
Table 2. For example, <5% of almost all val-
ues are inundated by a very small flood
whereas over three-quarters of Floodplain
Grassy Wetland EVC, half the Regent Par-
rot (Polytelis anthopeplus monarchoides)
breeding habitat and 100% of Silver Salt-
bush (Atriplex rhagodioides) habitat is
inundated in a large flood.
Identifying deficiencies in
current management
The large multifactorial dataset generated
by our original study and analysis can be
readily used to provide insight into many
interesting questions. Perhaps the most
compelling of these would address the
comprehensiveness of the current ‘icon
sites’ approach as illustrated by the follow-
ing simple example.
The eastern subspecies of the Regent
Parrot occurs in the Murray Mallee of New
South Wales, Victoria and South Australia
and is listed as threatened nationally and in
each of these states. It feeds in mallee vege-
tation but breeds in hollows in old flood-
plain eucalypts – typically in loose colonies
in copses of tall, straight, leafy trees. In the
absence of adequate flooding, these trees
would deteriorate in condition, die or not
be recruited in the long term, all of which
would adversely affect the Regent Parrot
population. Because there have been sys-
tematic searches for breeding sites, it is
one of the few species for which specific
sites – the location of all known breeding
sites in the study area – could be mapped,
as opposed to using EVC maps to generate
habitat maps as documented above (Web-
ster 2004).
This process resulted in 26 breeding
sites being mapped, with an estimated
minimum flood frequency of every 5–
7 years. Significantly, ten of these sites are
outside of The Living Murray’s ‘icon’ sites,
M A N A G E M E N T R E P O R T
ª 2011 Ecological Society of Australia ECOLOGICAL MANAGEMENT & RESTORATION VOL 12 NO 2 AUGUST 2011 131
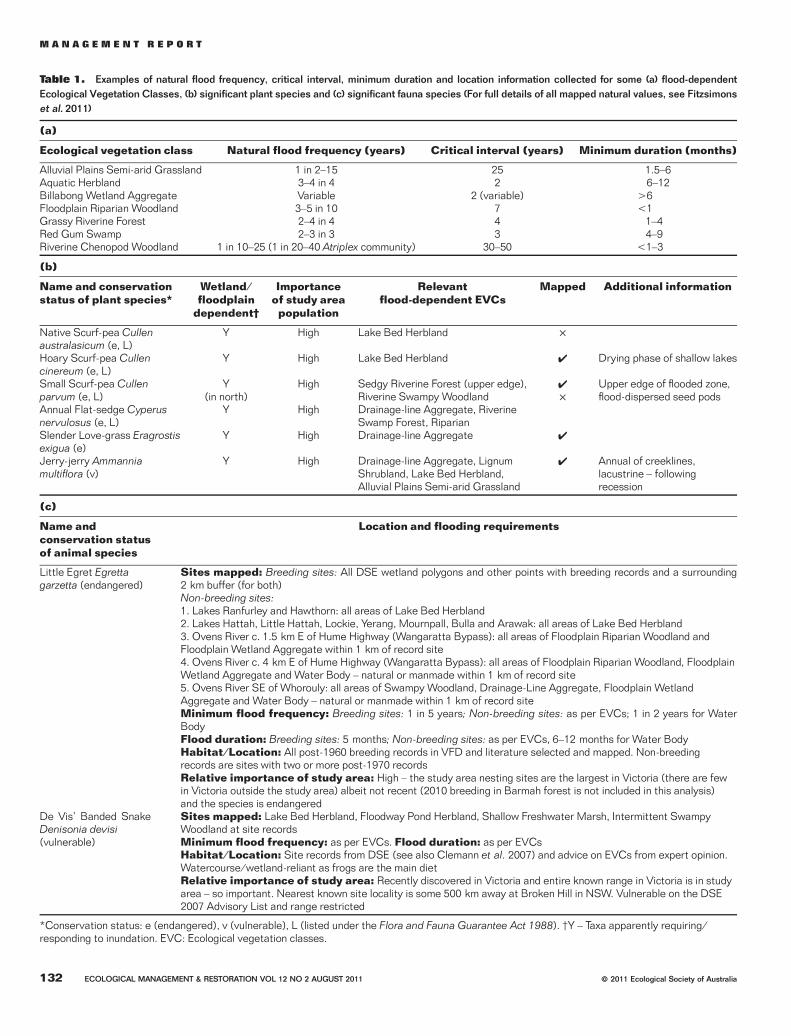
Table 1. Examples of natural flood frequency, critical interval, minimum duration and location information collected for some (a) flood-dependent
Ecological Vegetation Classes, (b) significant plant species and (c) significant fauna species (For full details of all mapped natural values, see Fitzsimons
et al. 2011)
(a)
Ecological vegetation class Natural flood frequency (years) Critical interval (years) Minimum duration (months)
Alluvial Plains Semi-arid Grassland 1 in 2–15 25 1.5–6Aquatic Herbland 3–4 in 4 2 6–12Billabong Wetland Aggregate Variable 2 (variable) >6Floodplain Riparian Woodland 3–5 in 10 7 <1Grassy Riverine Forest 2–4 in 4 4 1–4Red Gum Swamp 2–3 in 3 3 4–9Riverine Chenopod Woodland 1 in 10–25 (1 in 20–40 Atriplex community) 30–50 <1–3
(b)
Name and conservationstatus of plant species*
Wetland ⁄floodplain
dependent†
Importanceof study areapopulation
Relevantflood-dependent EVCs
Mapped Additional information
Native Scurf-pea Cullenaustralasicum (e, L)
Y High Lake Bed Herbland ·
Hoary Scurf-pea Cullencinereum (e, L)
Y High Lake Bed Herbland 4 Drying phase of shallow lakes
Small Scurf-pea Cullenparvum (e, L)
Y(in north)
High Sedgy Riverine Forest (upper edge),Riverine Swampy Woodland
4
·Upper edge of flooded zone,flood-dispersed seed pods
Annual Flat-sedge Cyperusnervulosus (e, L)
Y High Drainage-line Aggregate, RiverineSwamp Forest, Riparian
Slender Love-grass Eragrostisexigua (e)
Y High Drainage-line Aggregate 4
Jerry-jerry Ammanniamultiflora (v)
Y High Drainage-line Aggregate, LignumShrubland, Lake Bed Herbland,Alluvial Plains Semi-arid Grassland
4 Annual of creeklines,lacustrine – followingrecession
(c)
Name andconservation statusof animal species
Location and flooding requirements
Little Egret Egrettagarzetta (endangered)
Sites mapped: Breeding sites: All DSE wetland polygons and other points with breeding records and a surrounding2 km buffer (for both)Non-breeding sites:1. Lakes Ranfurley and Hawthorn: all areas of Lake Bed Herbland2. Lakes Hattah, Little Hattah, Lockie, Yerang, Mournpall, Bulla and Arawak: all areas of Lake Bed Herbland3. Ovens River c. 1.5 km E of Hume Highway (Wangaratta Bypass): all areas of Floodplain Riparian Woodland andFloodplain Wetland Aggregate within 1 km of record site4. Ovens River c. 4 km E of Hume Highway (Wangaratta Bypass): all areas of Floodplain Riparian Woodland, FloodplainWetland Aggregate and Water Body – natural or manmade within 1 km of record site5. Ovens River SE of Whorouly: all areas of Swampy Woodland, Drainage-Line Aggregate, Floodplain WetlandAggregate and Water Body – natural or manmade within 1 km of record siteMinimum flood frequency: Breeding sites: 1 in 5 years; Non-breeding sites: as per EVCs; 1 in 2 years for WaterBodyFlood duration: Breeding sites: 5 months; Non-breeding sites: as per EVCs, 6–12 months for Water BodyHabitat ⁄ Location: All post-1960 breeding records in VFD and literature selected and mapped. Non-breedingrecords are sites with two or more post-1970 recordsRelative importance of study area: High – the study area nesting sites are the largest in Victoria (there are fewin Victoria outside the study area) albeit not recent (2010 breeding in Barmah forest is not included in this analysis)and the species is endangered
De Vis’ Banded SnakeDenisonia devisi(vulnerable)
Sites mapped: Lake Bed Herbland, Floodway Pond Herbland, Shallow Freshwater Marsh, Intermittent SwampyWoodland at site recordsMinimum flood frequency: as per EVCs. Flood duration: as per EVCsHabitat ⁄ Location: Site records from DSE (see also Clemann et al. 2007) and advice on EVCs from expert opinion.Watercourse ⁄ wetland-reliant as frogs are the main dietRelative importance of study area: Recently discovered in Victoria and entire known range in Victoria is in studyarea – so important. Nearest known site locality is some 500 km away at Broken Hill in NSW. Vulnerable on the DSE2007 Advisory List and range restricted
*Conservation status: e (endangered), v (vulnerable), L (listed under the Flora and Fauna Guarantee Act 1988). †Y – Taxa apparently requiring ⁄responding to inundation. EVC: Ecological vegetation classes.
M A N A G E M E N T R E P O R T
132 ECOLOGICAL MANAGEMENT & RESTORATION VOL 12 NO 2 AUGUST 2011 ª 2011 Ecological Society of Australia

for which regular environmental watering
is planned. Other Regent Parrot breeding
areas interstate and along the Wimmera
River in Victoria are at least as unlikely to
receive adequate flooding as those covered
in our analysis. Further analysis of our
mapped dataset is likely to reveal similar
deficiencies for many other taxa and eco-
systems.
Discussion
The primary purpose of this analysis is to
facilitate the development of floodplain
watering strategies that maximise the effec-
tiveness of whatever watering is under-
taken in sustaining natural values. This is
enabled by providing digital mapping that
can be used to transparently predict the
extent to which any given inundation
event assists in sustaining the natural val-
ues of the floodplain. By compiling the
results of these analyses for many such
events, it is possible to develop floodplain
watering strategies covering the entire
River Murray floodplain for periods compa-
rable to the largest estimated flood fre-
quencies (i.e. 20–40 years). The predicted
outcomes of the different strategies for
floodplain natural values could then be
compared and the most favourable practi-
cable strategy adopted for implementation.
The essence of this comprehensive
mapping approach enables the develop-
ment of adaptive watering strategies that
are readily communicated to the general
public and facilitate transparent modifica-
tion in response to new information or
changes to key factors such as water avail-
ability. Importantly, it furthers the debate
about how much water should be allo-
cated to the environment by documenting
the ‘winners’ and ‘losers’ (of species and
ecosystems) in any watering event or ser-
ies of watering events.
Such strategies would be developed by
bringing together the most effective water
regimes for each of the natural values tar-
geted for protection along the entire length
of the floodplain. Many of these regimes
would be developed through their own
adaptive process. For example, if a manage-
ment agency was interested in maintaining
River Red Gums in the Robinvale area
(Fig. 2), they might interrogate our data set
for Grassy Riverine Forest – the predomi-
nant EVC supporting this species. This EVC
requires watering every 4 years to maintain
condition (its critical interval – Table 1)
and is predicted to be barely inundated in a
20 GL ⁄ day flood (2% of extent), 27 and
35% inundated in 81 and 159 GL ⁄ day
floods, respectively (Table 2). Based on this
information, the manager, with consider-
ation of other factors such as the approxi-
mate amount of environmental water
available, might judge that flows of at least
81 GL ⁄ day be generated once every 4 years
unless such flows occur naturally. This
Very small flood(20 gigalitres per day)
Not flooded
Extent of flooding(with flows of 20, 81 or 159 GL/day)Frequency of
flooding required(years)
1 in 2–5
1 in 7
1 in 15–30
Lake Powell
Lake Carpul
Moderate flood (81 gigalitres per day)
Large flood(159 gigalitres per day)
0 2.5km
2015105
Flooded
Figure 2. Examples of coverage of flood-dependent natural values for various flood scenarios in
the Robinvale area. Note: The flooding extents shown in red are based on outputs from the CSIRO
River Murray Floodplain Inundation Model (RiM-FIM) which is derived from satellite imagery of
actual floods. This figure provides an example of how the digital natural values mapping generated
in the present study can be applied. It is not intended that this figure represent actual outcomes of
applying these amounts of environmental water. The maps apply to the Victorian side of the River
Murray only.
M A N A G E M E N T R E P O R T
ª 2011 Ecological Society of Australia ECOLOGICAL MANAGEMENT & RESTORATION VOL 12 NO 2 AUGUST 2011 133

Table 2. Area and percentage of natural values in the Robinvale region inundated by the three flood extents shown in Figure 2
Area of EVCor habitat (ha)
Percent of mapped EVC or habitatcovered by various flood extents
Very small Moderate Large
Ecological Vegetation ClassFloodplain Grassy Wetland 63 3 71 77Floodway Pond Herbland 370 1 37 47Grassy Riverine Forest 678 2 27 35Grassy Riverine Forest ⁄ Floodway Pond Herbland Complex 567 2 22 28Intermittent Swampy Woodland 1433 1 27 38Lake Bed Herbland 130 0 0 0Lignum Shrubland 3550 0 5 12Lignum Swamp 562 0 2 7Lignum Swampy Woodland 5488 0 5 11Riverine Chenopod Woodland 5035 0 5 8Riverine Grassy Woodland 980 0 4 9Shallow Freshwater Marsh 394 0 42 51Shrubby Riverine Woodland 1972 1 24 37Spike-sedge Wetland 17 0 62 71Sub-saline Depression Shrubland 82 0 0 0Tall Marsh 42 0 9 21
Threatened FaunaApostlebird Struthidea cinerea 6746 0 3 7Blue-billed Duck Oxyura australis 434 0 0 0Brown Quail Coturnix ypsilophora 35 0 0 0Inland Carpet Python Morelia spilota metcalfei 16 452 0 12 19Diamond Dove Geopelia cuneata 168 0 0 0Diamond Firetail Stagonopleura guttata 121 0 2 6Freckled Duck Stictonetta naevosa 2700 0 2 3Grey-crowned Babbler Pomatostomus temporalis 215 0 0 0Hardhead Aythya australis 592 0 0 0Musk Duck Biziura lobata 592 0 0 0Nankeen Night-Heron Nycticorax caledonicus 1690 0 4 6White-bellied Sea-Eagle Haliaeetus leucogaster 550 0 0 0Regent Parrot Polytelis anthopeplus monarchoides 321 1 29 49
Rare or Threatened FloraAnnual Spinach Tetragonia moorei 89 0 2 3Bluish Raspwort Haloragis glauca f. glauca 249 0 13 20Common Joyweed Alternanthera nodiflora 259 0 0 0Cotton Sneezeweed Centipeda cunninghamii 88 0 42 65Desert Lantern Abutilon otocarpum 84 0 0 3Desert Spinach Tetragonia eremaea s.s. 43 0 4 11Dwarf Bitter-cress Rorippa eustylis 77 0 0 0Goat Head Malacocera tricornis 559 0 2 4Hoary Scurf-pea Cullen cinereum 81 0 10 15Mealy Saltbush Atriplex pseudocampanulata 42 0 0 0Native Couch Cynodon dactylon var. pulchellus 729 1 22 35Native Peppercress Lepidium pseudohyssopifolium 518 1 9 13Pale Plover-daisy Leiocarpa leptolepis 41 2 5 7Pale Spike-sedge Eleocharis pallens 26 0 0 0Purple Love-grass Eragrostis lacunaria 182 0 0 0Reader’s Daisy Brachysome readeri 380 0 2 7Riverina Bitter-cress Cardamine moirensis 132 1 25 39Riverine Flax-lily Dianella porracea 69 0 0 0Silver Saltbush Atriplex rhagodioides 23 8 79 100Smooth Minuria Minuria integerrima 38 0 0 0Spear-fruit Copperburr Sclerolaena patenticuspis 432 0 6 13Spiny Lignum Muehlenbeckia horrida horrida 71 0 0 0Spotted Emu-bush Eremophila maculata var. maculata 236 0 2 3Spreading Emu-bush Eremophila divaricata divaricata 776 2 14 18Squat Picris Picris squarrosa 509 2 33 55Summer Fringe-sedge Fimbristylis squarrosa 381 0 1 5Sweet Fenugreek Trigonella suavissima 86 0 0 0
M A N A G E M E N T R E P O R T
134 ECOLOGICAL MANAGEMENT & RESTORATION VOL 12 NO 2 AUGUST 2011 ª 2011 Ecological Society of Australia
regime would then be integrated with
numerous regimes for other values to come
up with an overall strategy, which could
then be implemented and refined through
analysis of actual flooding extents and
refinement of critical intervals for particular
values.
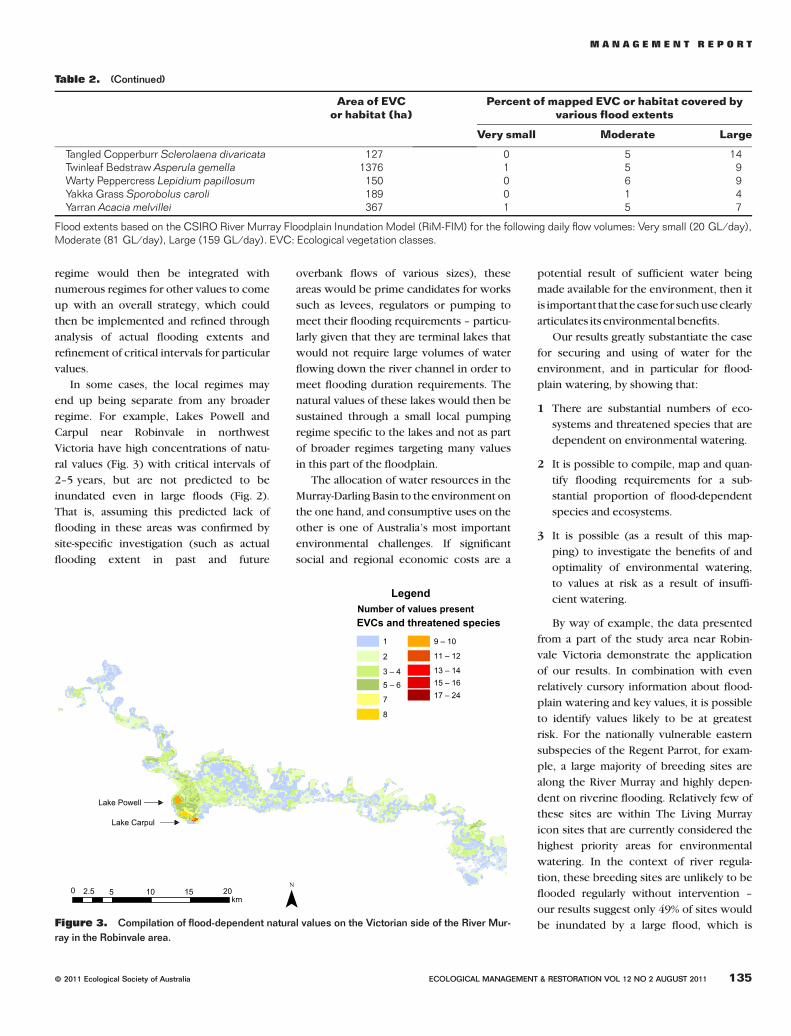
In some cases, the local regimes may
end up being separate from any broader
regime. For example, Lakes Powell and
Carpul near Robinvale in northwest
Victoria have high concentrations of natu-
ral values (Fig. 3) with critical intervals of
2–5 years, but are not predicted to be
inundated even in large floods (Fig. 2).
That is, assuming this predicted lack of
flooding in these areas was confirmed by
site-specific investigation (such as actual
flooding extent in past and future
overbank flows of various sizes), these
areas would be prime candidates for works
such as levees, regulators or pumping to
meet their flooding requirements – particu-
larly given that they are terminal lakes that
would not require large volumes of water
flowing down the river channel in order to
meet flooding duration requirements. The
natural values of these lakes would then be
sustained through a small local pumping
regime specific to the lakes and not as part
of broader regimes targeting many values
in this part of the floodplain.
The allocation of water resources in the
Murray-Darling Basin to the environment on
the one hand, and consumptive uses on the
other is one of Australia’s most important
environmental challenges. If significant
social and regional economic costs are a
potential result of sufficient water being
made available for the environment, then it
is important that the case for such use clearly
articulates its environmental benefits.
Our results greatly substantiate the case
for securing and using of water for the
environment, and in particular for flood-
plain watering, by showing that:
1 There are substantial numbers of eco-
systems and threatened species that are
dependent on environmental watering.
2 It is possible to compile, map and quan-
tify flooding requirements for a sub-
stantial proportion of flood-dependent
species and ecosystems.
3 It is possible (as a result of this map-
ping) to investigate the benefits of and
optimality of environmental watering,
to values at risk as a result of insuffi-
cient watering.
By way of example, the data presented
from a part of the study area near Robin-
vale Victoria demonstrate the application
of our results. In combination with even
relatively cursory information about flood-
plain watering and key values, it is possible
to identify values likely to be at greatest
risk. For the nationally vulnerable eastern
subspecies of the Regent Parrot, for exam-
ple, a large majority of breeding sites are
along the River Murray and highly depen-
dent on riverine flooding. Relatively few of
these sites are within The Living Murray
icon sites that are currently considered the
highest priority areas for environmental
watering. In the context of river regula-
tion, these breeding sites are unlikely to be
flooded regularly without intervention –
our results suggest only 49% of sites would
be inundated by a large flood, which is
Legend
EVCs and threatened speciesNumber of values present
17 – 24
9 – 10
13 – 1415 – 16
11 – 12
1
2
7
8
5 – 6
3 – 4
Lake Powell
Lake Carpul
0 2.5km
2015105
Figure 3. Compilation of flood-dependent natural values on the Victorian side of the River Mur-
ray in the Robinvale area.
Table 2. (Continued)
Area of EVCor habitat (ha)
Percent of mapped EVC or habitat covered byvarious flood extents
Very small Moderate Large
Tangled Copperburr Sclerolaena divaricata 127 0 5 14Twinleaf Bedstraw Asperula gemella 1376 1 5 9Warty Peppercress Lepidium papillosum 150 0 6 9Yakka Grass Sporobolus caroli 189 0 1 4Yarran Acacia melvillei 367 1 5 7
Flood extents based on the CSIRO River Murray Floodplain Inundation Model (RiM-FIM) for the following daily flow volumes: Very small (20 GL ⁄ day),Moderate (81 GL ⁄ day), Large (159 GL ⁄ day). EVC: Ecological vegetation classes.
M A N A G E M E N T R E P O R T
ª 2011 Ecological Society of Australia ECOLOGICAL MANAGEMENT & RESTORATION VOL 12 NO 2 AUGUST 2011 135

predicted to occur once every several dec-
ades (DSE 2008a). These results clearly flag
the need for further investigation of the
watering of Regent Parrot breeding sites.
There are many other such floodplain val-
ues that our results identify that would
otherwise likely go undetected.
Availabil ity of the database
The geospatial dataset has been transferred
by the Victorian Environmental Assess-
ment Council to the Victorian Department
of Sustainability and Environment follow-
ing the Victorian Environmental Assess-
ment Council’s final recommendations for
the River Red Gum Forests Investigation in
2008. As a result, it is now freely accessible
to land, water and threatened species man-
agers. In addition, the methodology and
conceptual framework used in our analysis
could be easily applied to other jurisdic-
tions with different vegetation mapping
units and different species and in many
cases, different flood requirements.
Future work – development
of strategies
The future of water availability and alloca-
tion for the environment in the Murray-
Darling Basin is the subject of considerable
recent financial investment and major insti-
tutional change (e.g. Connell 2007). The
framework of our analysis and the data it
generated provide essential information to
commence the process of formulating,
selecting and refining floodplain watering
strategies. However, substantial and endur-
ing positive outcomes for biodiversity will
require further work in a number of areas,
outlined below. The highest priority is to
use the results of the analysis and inunda-
tion modelling to initiate the formulation,
comparison and implementation of flood-
plain watering strategies. Development of
such strategies could be undertaken by
environmental water planners and, in our
view, would be enhanced by incorporation
of the following:
1 Refining watering requirement esti-
mates and mapping. Given that the
expert estimates of flooding require-
ments in this paper would underpin
expensive watering programs critical to
the persistence of much of the region’s
biota, it is imperative to address the
uncertainties in these initial estimates.
Environmental water planners could do
this by testing our models against actual
flood events, and a short-term priority
could be given to sensitivity analysis and
the initiation of research and monitoring
to inform ongoing refinement of esti-
mates and strategies in the longer term.
2 Overbank flows and ecological connec-
tivity. The approach to floodplain water-
ing taken here focuses on mapping
discrete natural assets with a view to
meeting their watering requirements. To
also provide the environmental benefits
of extensive overbank floods and the
resultant ecological connectivity (e.g.
Jenkins & Boulton 2003; Ballinger & Mac
Nally 2005), further work would be nee-
ded to quantify and incorporate these
benefits into the formulation and evalua-
tion of floodplain watering – that is, a
quantification of the benefits of large-
scale inundation, additional to those from
themaintenanceof site-specific values.
3 Comparing different values and risks.
In a water-constrained future, further
work is needed to develop a conceptual
framework within which to compare
different sets of values and the risks to
them to optimise potential trade-offs
between values and to provide stake-
holders with transparency and there-
fore confidence in the decision-making
process. Such a framework would also
highlight key data gaps so that they can
be filled.
4 Additional flooding requirement vari-
ables. For at least some EVCs and taxa,
estimates of the following variables
additional to those in this paper are
likely to be important in the develop-
ment of floodplain watering strategies:
depth of inundation, season of inunda-
tion, minimum and maximum flood
frequencies, and duration of periods
without inundation. Minimum flood fre-
quency over a sustained period and
flood seasonality are likely to be a signif-
icant factors for many EVCs and taxa
(Robertson et al. 2001; Bren 2005).
5 Comprehensive taxonomic and eco-
logical coverage. Floodplain watering
strategies should be taxonomically com-
prehensive and, in addition to the taxa
presented in this paper and Fitzsimons
et al. (2011), include fish, invertebrates,
non-vascular plants and regionally sig-
nificant taxa. Similarly, the list of eco-
logical characteristics used to identify
natural values should be comprehensive
and include important characteristics
such as: sites that are likely to assist the
recovery of highly threatened taxa, sites
of high species richness, colony sites
for non-threatened colonial breeding
species, and corridors of habitat which
are important for the movement of
biota. This project and new information
on future flooding regimes (e.g. DSE
2008a) suggest that as insufficient
watering is a major threat to floodplain
biodiversity, a review of the conserva-
tion status of floodplain EVCs and taxa
in Victoria is required.
6 Ongoing incorporation of floodplain
inundation modelling, hydrology, sa-
linisation and local climate. Improve-
ments in inundation models and
information on the effects of groundwa-
ter, soil salinity and variations in local
climate (including those resulting from
climate change) have the potential to
impact significantly on the formulation
and selection of watering strategies and
should be pursued and incorporated
into those strategies as the improve-
ments and new information becomes
available.
Our analysis is the first to consider how
flooding requirements for a broad range of
natural values can be incorporated into
environmental watering strategies. As a
result of the paucity of existing empirical
data and relative urgency associated with
better informing environmental watering
policy and strategies, this analysis was pri-
marily based on expert opinion. However,
the framework readily allows for the incor-
poration of new data, particularly data
gained from empirical field experiments on
flooding requirements of vegetation types
and species. When provided to the agencies
responsible for environmental water alloca-
tion, such data would enable further
improvement in the effectiveness of ongo-
ing environmental watering. Thus, our
M A N A G E M E N T R E P O R T
136 ECOLOGICAL MANAGEMENT & RESTORATION VOL 12 NO 2 AUGUST 2011 ª 2011 Ecological Society of Australia

approach is both flexible and adaptable,
which is important given the uncertainties
for future flood events based on climate
change predictions (Aldous et al. 2011).
Conclusion
In conclusion, we contend that large areas
of the Victorian, New South Wales and
South Australian floodplain forests are
(despite a recent, rare flood event) highly
vulnerable to severe stress or mortality
owing to lack of sufficient flooding.
Despite significant investments in purchas-
ing water and the delivery of that water in
the Murray-Darling Basin, there is little
understanding of which natural values are
benefiting from this water and which are
not. Our preliminary work shows that an
efficient and effective watering regime to
sustain flood-dependent natural values is
achievable. Identifying all flood-dependent
natural values and estimating their water
requirements should be a high priority
across the entire Murray-Darling Basin. The
approach also has applicability for other
river basins which rely on floodplain inun-
dation to maintain natural values.
Acknowledgements
This project was overseen by Victorian
Environmental Assessment Council mem-
bers. Information and analysis on the fauna
of the study area was provided by Peter
Robertson, Martin O’Brien, Nick Clemann,
Peter Menkhorst, Chris Tzaros, Lindy Lums-
den, Mark Antos, Andrew Silcocks and Shar
Ramamurthy. Jane Roberts, Terry Hillman
and Keith Ward assisted with information
and analysis on the flora and EVCs. Don
Blackmore, Jane Doolan, Ray Evans, Gary
Jones and Julia Reed made valuable contri-
butions to the study more generally. The
CSIRO RiM-FIM data was provided by Shar
Ramamurthy (DSE). Jong Lee, Pradeep
Sharma and Tony McLeod at the Murray-
Darling Basin Authority provided informa-
tion on the frequency of daily river flows
near Robinvale. We thank Tein McDonald,
Barry Hart, Joan Phillips and two anony-
mous referees for helpful comments on
drafts of this paper.
References
Aldous A., Fitzsimons J., Richter B. and Bach L.(2011) Droughts, floods and freshwater eco-systems: evaluating climate change impactsand developing adaptation strategies. Marineand Freshwater Research 62, 223–231.
Ballinger A. and Mac Nally R. (2005) Floodingin Barmah-Millewa Forest: catastrophe oropportunity for non-aquatic fauna. Proceed-ings of the Royal Society of Victoria 117,111–115.
Ballinger A. and Mac Nally R. (2006) The land-scape context of flooding in the Murray-Dar-ling basin. Advances in Ecological Research39, 85–105.
Beilfuss R. and Brown C. (2010) Assessing theenvironmental flow requirements and trade-offs for the Lower Zambezi River and Delta,Mozambique. International Journal of RiverBasin Management 8, 127–138.
Bren L. J. (2005) The changing hydrology of theBarmah-Millewa Forests and its effects onvegetation. Proceedings of the Royal Societyof Victoria 117, 61–76.
Clemann N., Robertson P., Gibbons D. et al.(2007) An addition to the snake fauna of Vic-toria: De Vis’ Banded Snake Denisonia devisi(Serpentes: Elapidae) Waite and Longman.Victorian Naturalist 124, 33–38.
Connell D. (2007) Water Politics in the Murray-Darling Basin. Federation Press, Sydney.
Cooling M. P., Lloyd L. N., Rudd D. J. and HoganR. P. (2002) Environmental water require-ments and management options in GunbowerForest, Victoria. Australian Journal of WaterResources 5, 75–88.
Cunningham S. C., Mac Nally R., White M. et al.(2007) Mapping the current condition of riverred gum (Eucalyptus camaldulensis Dehnh.)stands along the Victorian Murray River flood-plain. A report to the Northern VictorianCatchment Management Authorities and theDepartment of Sustainability and Environ-ment.
DSE (2008a) Sustainable Water Strategy North-ern Region Discussion Paper, Department ofSustainability and Environment, Melbourne.
DSE (2008b) Ecological Vegetation Class (EVC)Benchmarks for Each Bioregion. Departmentof Sustainability and Environment, Melbourne.Available from: http://www.dse.vic.gov.au/dse/nrence.nsf/LinkView/43FE7DF24A1447D9CA256EE6007EA8788062D358172E420C4A256DEA0012F71C (accessed 5 September2008).
Fitzsimons J. A. (2006) Public land use planningusing bioregions and other attributes: deter-mining the study area of the VEAC RiverRed Gum Forests investigation. Proceedingsof the Royal Society of Victoria 118, 75–85.
Fitzsimons J. A., Peake P., Frood D. et al. (2011)Flooding requirements for biodiversity val-ues along the Victorian floodplain of theMurray Valley. Victorian Naturalist 128, 48–85.
Jenkins K. M. and Boulton A. J. (2003) Connectiv-ity in a dryland river: short-term aquaticmicroinvertebrate recruitment following flood-plain inundation. Ecology 84, 2708–2723.
Leslie D. and Ward K. A. (2002) Murray River envi-ronmental flows 2000–2001. Ecological Man-agement and Restoration 3, 221–223.
McCarthy B., Conallin A., D’Santos P. and BaldwinD. (2006) Acidification, salinization and fishkills at an inland wetland in south-eastern Aus-tralia following partial drying. Ecological Man-agement and Restoration 7, 221–223.
MDBA (2010) Guide to the Proposed Basin Plan,Murray-Darling Basin Authority, Canberra.
MDBC (2003) Preliminary Investigations IntoObserved River Red Gum Decline Along theRiver Murray Below Euston. Technical Report03 ⁄ 03. Murray-Darling Basin Commission,Canberra.
NRC (2009) Riverina Bioregion Regional ForestAssessment: River Red Gums and WoodlandForests Recommendations Report. NaturalResources Commission, Sydney.
Overton I. C. (2005) Modelling floodplain inunda-tion on a regulated river: integrating GIS,remote sensing and hydrological models. RiverResearch and Applications 21, 991–1001.
Parkes D., Newell G. and Cheal D. (2003) Assess-ing the quality of native vegetation: the‘habitat hectares’ approach. Ecological Man-agement and Restoration 4, S29–S38.
Richter B. D., Warner A. T., Meyer J. L. and LutzK. (2006) A collaborative and adaptive pro-cess for developing environmental flow recom-mendations. River Research and Applications22, 297–318.
Robertson A. I., Bacon P. and Heagney G. (2001)The responses of floodplain primary produc-tion to flood frequency and timing. Journal ofApplied Ecology 38, 126–136.
Smakhtin V. (2008) Basin closure and environmen-tal flow requirements. International Journal ofWater Resources Development 24, 227–233.
Stewart G. and Harper B. (2002) Barmah-Millewaforest environmental water allocation. WaterScience and Technology 45(11), 217–223.
Tzaros C. L. (2001) Importance of riparian vegeta-tion to terrestrial avifauna along the MurrayRiver, south-eastern Australia. MSc thesis,Deakin University, Melbourne.
VEAC (2006) River Red Gum Forests InvestigationDiscussion Paper. Victorian EnvironmentalAssessment Council, Melbourne.
VEAC (2008a) River Red Gum Forests Investiga-tion Final Report. Victorian EnvironmentalAssessment Council, Melbourne.
VEAC (2008b) Identifying flood-dependent naturalvalues on the Victorian floodplains of the RiverMurray and its tributaries. Version 1.0. Victo-rian Environmental Assessment Council, Mel-bourne. Available from: http://www.veac.vic.gov.au/reports/352-VEAC_Red_Gum_Flood-dependent_natural_values_Report_V1-0.pdf(accessed 13 September 2009).
Wang X., Zhang Y. and James C. (2009)Approaches to providing and managing envi-ronmental flows in China. International Journalof Water Resources Development 25, 283–300.
Webster R. (2004) Surveys of potential RegentParrot Polytelis anthopeplus monarchoidesnesting habitat in Victoria between PiambieState Forest and Lambert Island. Unpublishedreport to Mallee Catchment ManagementAuthority, Mildura.
M A N A G E M E N T R E P O R T
ª 2011 Ecological Society of Australia ECOLOGICAL MANAGEMENT & RESTORATION VOL 12 NO 2 AUGUST 2011 137