
Facile functionalization by π-stacking of macroscopic substrates made of vertically aligned carbon...
8
Electrochimica Acta 56 (2011) 9269–9276 Contents lists available at ScienceDirect Electrochimica Acta jou rn al hom epa ge: www.elsevier.com/locate/electacta Facile functionalization by -stacking of macroscopic substrates made of vertically aligned carbon nanotubes: Tracing reactive groups by electrochemiluminescence Simone Zanarini a,c,∗ , Michele Vinante b , Laura Pasquardini b , Alessandro Sanginario d , Mauro Giorcelli d , Stefano Bianco e , Claudio Gerbaldi c,e,∗∗ , Jijeesh R. Nair c , Lorenzo Lunelli b , Lia Vanzetti b , Francesco Paolucci a , Massimo Marcaccio a , Luca Prodi a , Alberto Tagliaferro c , Cecilia Pederzolli b , Danilo Demarchi d , Pierluigi Civera d a Dipartimento di Chimica “G. Ciamician”, Universita’ di Bologna, Via Selmi 2, 40126 Bologna, Italy b FBK-Fondazione Bruno Kessler, Materials and Microsystems Center, Via Sommarive 18, 38123 Povo, Trento, Italy c Department of Materials Science and Chemical Engineering, Politecnico di Torino, Corso Duca degli Abruzzi 24, 10129 Torino, Italy d Department of Electronics, Politecnico di Torino, Corso Duca degli Abruzzi 24, 10129 Torino, Italy e Center for Space Human Robotics @Polito, Italian Institute of Technology, Corso Trento 21, 10129 Torino, Italy a r t i c l e i n f o Article history: Received 6 May 2011 Received in revised form 1 August 2011 Accepted 1 August 2011 Available online 9 August 2011 Keywords: Carbon nanotubes (CNTs) -Stacking Electrochemiluminescence (ECL) Fluorescein Ru(bpy)3 2+ a b s t r a c t We report a simple, fast and reliable non-covalent route of functionalization of macroscopic carbon nanotubes (CNTs) surfaces based on the -stacking of CNTs sidewall with fluorescein derivatives (i.e., amino- and isothiocyanate-). The electrochemiluminescent emission of Ru(bpy) 3 2+ labels bearing –COOH and –NH 2 side groups coupled with colorimetric and XPS measurements allowed to estimate the quantity of –NH 2 and –N C S functions obtained. The evaluation of reactivity suggests that functionalized CNTs substrates, in particular those carrying –N C S groups, are suitable to covalently bind probe molecules such as proteins and oligonucleotides, thus opening up the possibility of future application in genomics and proteomics fields. © 2011 Elsevier Ltd. All rights reserved. 1. Introduction The functionalization of multi-walled carbon nanotubes (MWC- NTs) electrodes with biological probes such as proteins and oligonucleotides is a hot topic in molecular diagnostics [1–3]. The ability to measure extremely small amounts of specific biomark- ers is, in fact, a highly desirable feature in bio-assay and CNTs, due to their remarkable electronic properties and high specific surface area, seem to be ideal candidates for this kind of applications [4]. We show here a simple, fast and reliable non-covalent route of functionalization of macroscopic CNTs substrates avoiding ∗ Corresponding author at: Department of Materials Science and Chemical Engi- neering, Politecnico di Torino, Corso Duca degli Abruzzi 24, 10129 Torino, Italy. Tel.: +39 011 564 4641; fax: +39 011 564 4699. ∗∗ Corresponding author. Tel.: +39 011 090 3422/4638; fax: +39 011 090 3401/4699. E-mail addresses: [email protected] (S. Zanarini), [email protected], [email protected] (C. Gerbaldi). compromising their electronic properties. In fact, the covalent func- tionalization requires often drastic conditions, such as chemical oxidation of the nanotubes with concentrated HNO 3 or sulpho- nitric mixture to obtain –COOH and –OH reactive groups on the surface [5]. Our purpose is exploiting -stacking interactions between the CNTs sidewall p orbital and polyaromatic molecules (fluores- cein) [6–9], bearing the necessary reactive group to obtain free –NH 2 and –N C S functions on the substrate. To the best of our knowledge, until now -stacking interactions have been exploited almost exclusively at molecular level to prepare nanohybrids from CNTs bundles especially for drug delivery purposes [6–9]. In the present work, we investigate the feasibility of such a “soft” functionalization method on macroscopic planar CNT substrates, by estimating the amount of reactive groups obtained and their stability by means of electrochemiluminescent Ru(bpy) 3 -based labels [10–14]. The fluorescein compounds were simply selected as models, in order to demonstrate that the -stacking based CNT functionalization could be obtained on macroscopic surfaces, i.e., by planar reaction instead of tridimensional reaction as that of 0013-4686/$ – see front matter © 2011 Elsevier Ltd. All rights reserved. doi:10.1016/j.electacta.2011.08.004
Transcript of Facile functionalization by π-stacking of macroscopic substrates made of vertically aligned carbon...
Foe
SMLCa
b
c
d
e
a
ARRAA
KC�EFR
1
Noaeta
o
nT
f
c
0d
Electrochimica Acta 56 (2011) 9269– 9276
Contents lists available at ScienceDirect
Electrochimica Acta
jou rn al hom epa ge: www.elsev ier .com/ locate /e lec tac ta
acile functionalization by �-stacking of macroscopic substrates madef vertically aligned carbon nanotubes: Tracing reactive groups bylectrochemiluminescence
imone Zanarinia,c,∗, Michele Vinanteb, Laura Pasquardinib, Alessandro Sanginariod,auro Giorcelli d, Stefano Biancoe, Claudio Gerbaldi c,e,∗∗, Jijeesh R. Nairc, Lorenzo Lunelli b,
ia Vanzettib, Francesco Paoluccia, Massimo Marcaccioa, Luca Prodia, Alberto Tagliaferroc,ecilia Pederzolli b, Danilo Demarchid, Pierluigi Civerad
Dipartimento di Chimica “G. Ciamician”, Universita’ di Bologna, Via Selmi 2, 40126 Bologna, ItalyFBK-Fondazione Bruno Kessler, Materials and Microsystems Center, Via Sommarive 18, 38123 Povo, Trento, ItalyDepartment of Materials Science and Chemical Engineering, Politecnico di Torino, Corso Duca degli Abruzzi 24, 10129 Torino, ItalyDepartment of Electronics, Politecnico di Torino, Corso Duca degli Abruzzi 24, 10129 Torino, ItalyCenter for Space Human Robotics @Polito, Italian Institute of Technology, Corso Trento 21, 10129 Torino, Italy
r t i c l e i n f o
rticle history:eceived 6 May 2011eceived in revised form 1 August 2011ccepted 1 August 2011vailable online 9 August 2011
a b s t r a c t
We report a simple, fast and reliable non-covalent route of functionalization of macroscopic carbonnanotubes (CNTs) surfaces based on the �-stacking of CNTs sidewall with fluorescein derivatives (i.e.,amino- and isothiocyanate-). The electrochemiluminescent emission of Ru(bpy)3
2+ labels bearing –COOHand –NH2 side groups coupled with colorimetric and XPS measurements allowed to estimate the quantityof –NH2 and –N C S functions obtained. The evaluation of reactivity suggests that functionalized CNTs
eywords:arbon nanotubes (CNTs)-Stackinglectrochemiluminescence (ECL)luorescein
2+
substrates, in particular those carrying –N C S groups, are suitable to covalently bind probe moleculessuch as proteins and oligonucleotides, thus opening up the possibility of future application in genomicsand proteomics fields.
© 2011 Elsevier Ltd. All rights reserved.
u(bpy)3
. Introduction
The functionalization of multi-walled carbon nanotubes (MWC-Ts) electrodes with biological probes such as proteins andligonucleotides is a hot topic in molecular diagnostics [1–3]. Thebility to measure extremely small amounts of specific biomark-rs is, in fact, a highly desirable feature in bio-assay and CNTs, dueo their remarkable electronic properties and high specific surface
rea, seem to be ideal candidates for this kind of applications [4].We show here a simple, fast and reliable non-covalent routef functionalization of macroscopic CNTs substrates avoiding
∗ Corresponding author at: Department of Materials Science and Chemical Engi-eering, Politecnico di Torino, Corso Duca degli Abruzzi 24, 10129 Torino, Italy.el.: +39 011 564 4641; fax: +39 011 564 4699.∗∗ Corresponding author. Tel.: +39 011 090 3422/4638;ax: +39 011 090 3401/4699.
E-mail addresses: [email protected] (S. Zanarini), [email protected],[email protected] (C. Gerbaldi).
013-4686/$ – see front matter © 2011 Elsevier Ltd. All rights reserved.oi:10.1016/j.electacta.2011.08.004
compromising their electronic properties. In fact, the covalent func-tionalization requires often drastic conditions, such as chemicaloxidation of the nanotubes with concentrated HNO3 or sulpho-nitric mixture to obtain –COOH and –OH reactive groups on thesurface [5].
Our purpose is exploiting �-stacking interactions betweenthe CNTs sidewall p orbital and polyaromatic molecules (fluores-cein) [6–9], bearing the necessary reactive group to obtain free–NH2 and –N C S functions on the substrate. To the best of ourknowledge, until now �-stacking interactions have been exploitedalmost exclusively at molecular level to prepare nanohybridsfrom CNTs bundles especially for drug delivery purposes [6–9].In the present work, we investigate the feasibility of such a “soft”functionalization method on macroscopic planar CNT substrates,by estimating the amount of reactive groups obtained and theirstability by means of electrochemiluminescent Ru(bpy)3-based
labels [10–14]. The fluorescein compounds were simply selectedas models, in order to demonstrate that the �-stacking based CNTfunctionalization could be obtained on macroscopic surfaces, i.e.,by planar reaction instead of tridimensional reaction as that of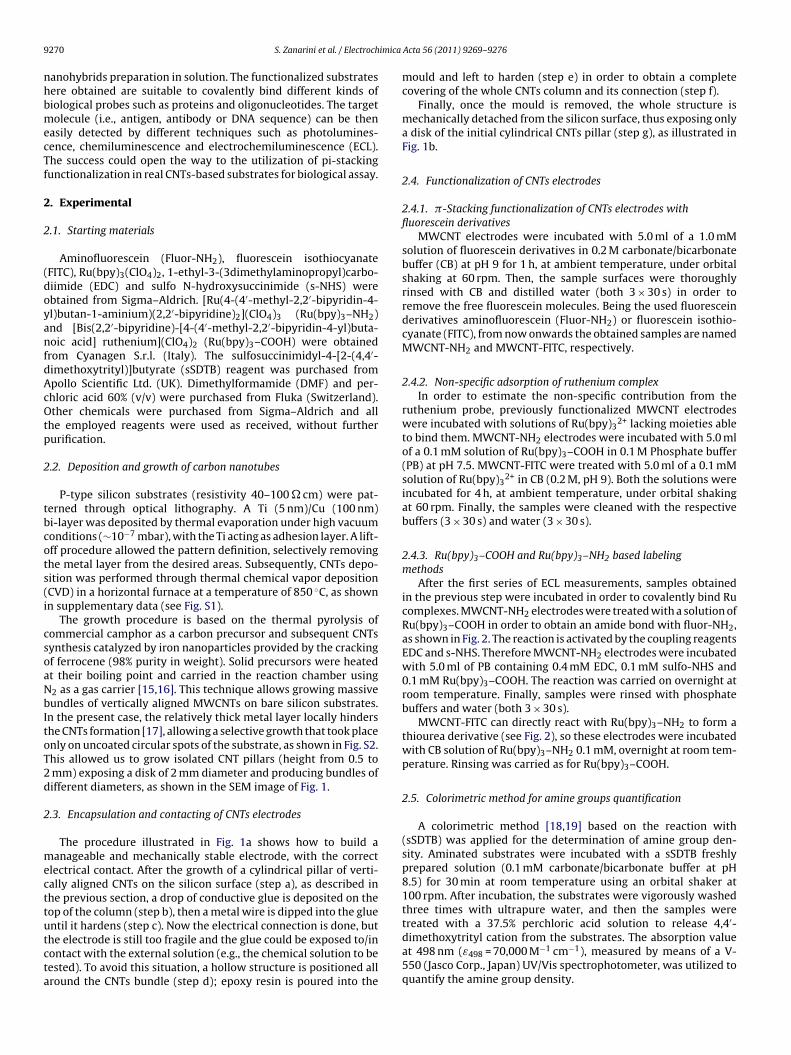
9 imica
nhbmecTf
2
2
(doyanfdAcOtp
2
tbcots(i
csoaNbItoT2d
2
mecttutcta
270 S. Zanarini et al. / Electroch
anohybrids preparation in solution. The functionalized substratesere obtained are suitable to covalently bind different kinds ofiological probes such as proteins and oligonucleotides. The targetolecule (i.e., antigen, antibody or DNA sequence) can be then
asily detected by different techniques such as photolumines-ence, chemiluminescence and electrochemiluminescence (ECL).he success could open the way to the utilization of pi-stackingunctionalization in real CNTs-based substrates for biological assay.
. Experimental
.1. Starting materials
Aminofluorescein (Fluor-NH2), fluorescein isothiocyanateFITC), Ru(bpy)3(ClO4)2, 1-ethyl-3-(3dimethylaminopropyl)carbo-iimide (EDC) and sulfo N-hydroxysuccinimide (s-NHS) werebtained from Sigma–Aldrich. [Ru(4-(4′-methyl-2,2′-bipyridin-4-l)butan-1-aminium)(2,2′-bipyridine)2](ClO4)3 (Ru(bpy)3–NH2)nd [Bis(2,2′-bipyridine)-[4-(4′-methyl-2,2′-bipyridin-4-yl)buta-oic acid] ruthenium](ClO4)2 (Ru(bpy)3–COOH) were obtained
rom Cyanagen S.r.l. (Italy). The sulfosuccinimidyl-4-[2-(4,4′-imethoxytrityl)]butyrate (sSDTB) reagent was purchased frompollo Scientific Ltd. (UK). Dimethylformamide (DMF) and per-hloric acid 60% (v/v) were purchased from Fluka (Switzerland).ther chemicals were purchased from Sigma–Aldrich and all
he employed reagents were used as received, without furtherurification.
.2. Deposition and growth of carbon nanotubes
P-type silicon substrates (resistivity 40–100 � cm) were pat-erned through optical lithography. A Ti (5 nm)/Cu (100 nm)i-layer was deposited by thermal evaporation under high vacuumonditions (∼10−7 mbar), with the Ti acting as adhesion layer. A lift-ff procedure allowed the pattern definition, selectively removinghe metal layer from the desired areas. Subsequently, CNTs depo-ition was performed through thermal chemical vapor depositionCVD) in a horizontal furnace at a temperature of 850 ◦C, as shownn supplementary data (see Fig. S1).
The growth procedure is based on the thermal pyrolysis ofommercial camphor as a carbon precursor and subsequent CNTsynthesis catalyzed by iron nanoparticles provided by the crackingf ferrocene (98% purity in weight). Solid precursors were heatedt their boiling point and carried in the reaction chamber using2 as a gas carrier [15,16]. This technique allows growing massiveundles of vertically aligned MWCNTs on bare silicon substrates.n the present case, the relatively thick metal layer locally hindershe CNTs formation [17], allowing a selective growth that took placenly on uncoated circular spots of the substrate, as shown in Fig. S2.his allowed us to grow isolated CNT pillars (height from 0.5 to
mm) exposing a disk of 2 mm diameter and producing bundles ofifferent diameters, as shown in the SEM image of Fig. 1.
.3. Encapsulation and contacting of CNTs electrodes
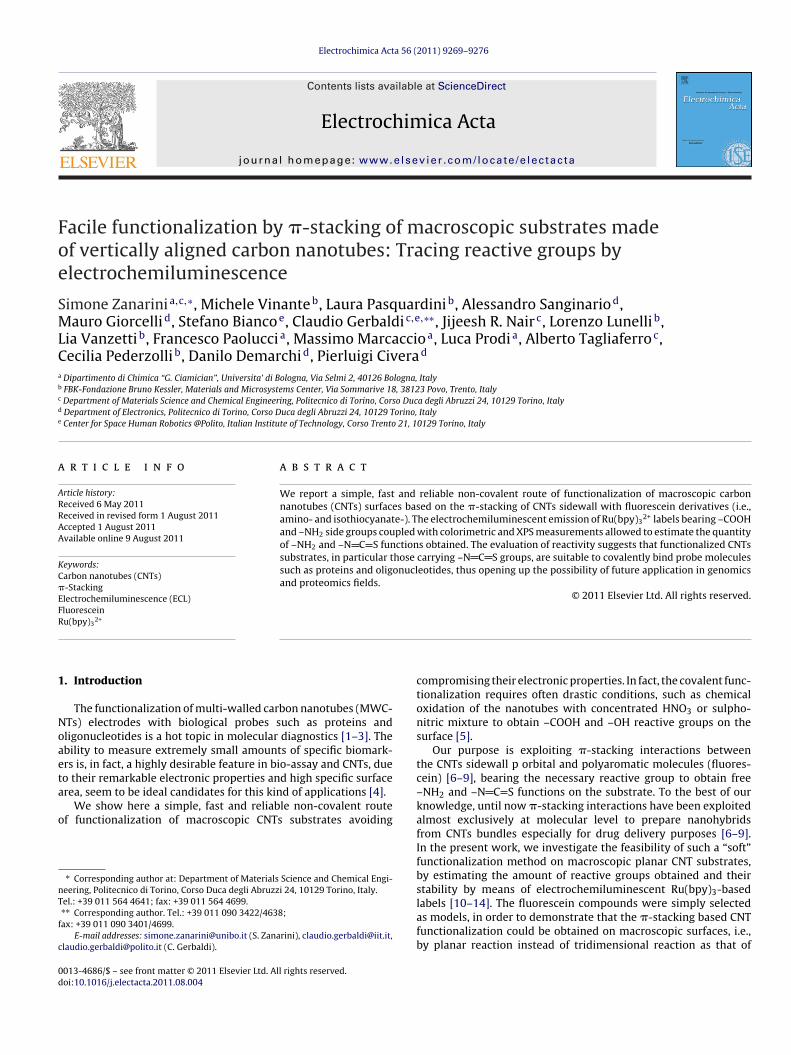
The procedure illustrated in Fig. 1a shows how to build aanageable and mechanically stable electrode, with the correct
lectrical contact. After the growth of a cylindrical pillar of verti-ally aligned CNTs on the silicon surface (step a), as described inhe previous section, a drop of conductive glue is deposited on theop of the column (step b), then a metal wire is dipped into the gluentil it hardens (step c). Now the electrical connection is done, but
he electrode is still too fragile and the glue could be exposed to/inontact with the external solution (e.g., the chemical solution to beested). To avoid this situation, a hollow structure is positioned allround the CNTs bundle (step d); epoxy resin is poured into theActa 56 (2011) 9269– 9276
mould and left to harden (step e) in order to obtain a completecovering of the whole CNTs column and its connection (step f).
Finally, once the mould is removed, the whole structure ismechanically detached from the silicon surface, thus exposing onlya disk of the initial cylindrical CNTs pillar (step g), as illustrated inFig. 1b.
2.4. Functionalization of CNTs electrodes
2.4.1. �-Stacking functionalization of CNTs electrodes withfluorescein derivatives
MWCNT electrodes were incubated with 5.0 ml of a 1.0 mMsolution of fluorescein derivatives in 0.2 M carbonate/bicarbonatebuffer (CB) at pH 9 for 1 h, at ambient temperature, under orbitalshaking at 60 rpm. Then, the sample surfaces were thoroughlyrinsed with CB and distilled water (both 3 × 30 s) in order toremove the free fluorescein molecules. Being the used fluoresceinderivatives aminofluorescein (Fluor-NH2) or fluorescein isothio-cyanate (FITC), from now onwards the obtained samples are namedMWCNT-NH2 and MWCNT-FITC, respectively.
2.4.2. Non-specific adsorption of ruthenium complexIn order to estimate the non-specific contribution from the
ruthenium probe, previously functionalized MWCNT electrodeswere incubated with solutions of Ru(bpy)3
2+ lacking moieties ableto bind them. MWCNT-NH2 electrodes were incubated with 5.0 mlof a 0.1 mM solution of Ru(bpy)3–COOH in 0.1 M Phosphate buffer(PB) at pH 7.5. MWCNT-FITC were treated with 5.0 ml of a 0.1 mMsolution of Ru(bpy)3
2+ in CB (0.2 M, pH 9). Both the solutions wereincubated for 4 h, at ambient temperature, under orbital shakingat 60 rpm. Finally, the samples were cleaned with the respectivebuffers (3 × 30 s) and water (3 × 30 s).
2.4.3. Ru(bpy)3–COOH and Ru(bpy)3–NH2 based labelingmethods
After the first series of ECL measurements, samples obtainedin the previous step were incubated in order to covalently bind Rucomplexes. MWCNT-NH2 electrodes were treated with a solution ofRu(bpy)3–COOH in order to obtain an amide bond with fluor-NH2,as shown in Fig. 2. The reaction is activated by the coupling reagentsEDC and s-NHS. Therefore MWCNT-NH2 electrodes were incubatedwith 5.0 ml of PB containing 0.4 mM EDC, 0.1 mM sulfo-NHS and0.1 mM Ru(bpy)3–COOH. The reaction was carried on overnight atroom temperature. Finally, samples were rinsed with phosphatebuffers and water (both 3 × 30 s).
MWCNT-FITC can directly react with Ru(bpy)3–NH2 to form athiourea derivative (see Fig. 2), so these electrodes were incubatedwith CB solution of Ru(bpy)3–NH2 0.1 mM, overnight at room tem-perature. Rinsing was carried as for Ru(bpy)3–COOH.
2.5. Colorimetric method for amine groups quantification
A colorimetric method [18,19] based on the reaction with(sSDTB) was applied for the determination of amine group den-sity. Aminated substrates were incubated with a sSDTB freshlyprepared solution (0.1 mM carbonate/bicarbonate buffer at pH8.5) for 30 min at room temperature using an orbital shaker at100 rpm. After incubation, the substrates were vigorously washedthree times with ultrapure water, and then the samples weretreated with a 37.5% perchloric acid solution to release 4,4′-
dimethoxytrityl cation from the substrates. The absorption valueat 498 nm (ε498 = 70,000 M−1 cm−1), measured by means of a V-550 (Jasco Corp., Japan) UV/Vis spectrophotometer, was utilized toquantify the amine group density.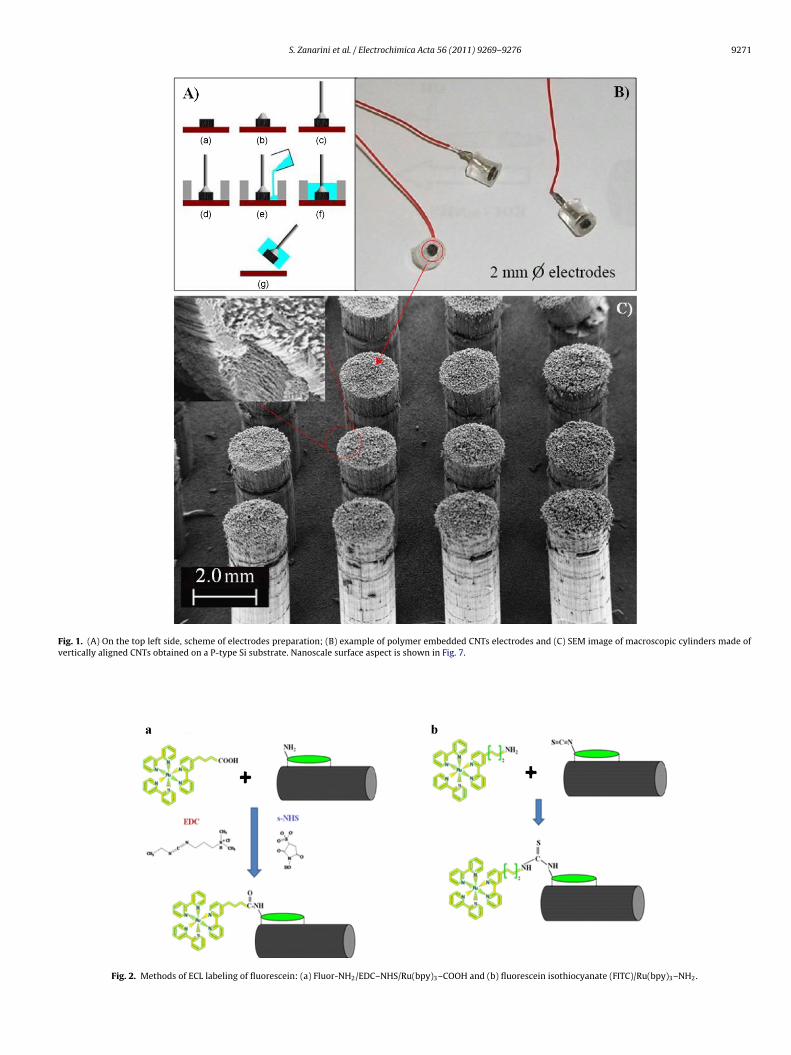
S. Zanarini et al. / Electrochimica Acta 56 (2011) 9269– 9276 9271
Fig. 1. (A) On the top left side, scheme of electrodes preparation; (B) example of polymer embedded CNTs electrodes and (C) SEM image of macroscopic cylinders made ofvertically aligned CNTs obtained on a P-type Si substrate. Nanoscale surface aspect is shown in Fig. 7.
Fig. 2. Methods of ECL labeling of fluorescein: (a) Fluor-NH2/EDC–NHS/Ru(bpy)3–COOH and (b) fluorescein isothiocyanate (FITC)/Ru(bpy)3–NH2.
9272 S. Zanarini et al. / Electrochimica
Spe
2
cmrppmsh
sb5
2
te2susi
FvE0
cheme 1. Sketched view of the whole system: a personal computer controls theotentiostat for the sweep generation and a PMT collects the light generated by thelectrochemical reaction.
.6. XPS and SEM characterization
X-ray photoelectron spectroscopy (XPS) measurements werearried out using a Scienta Esca-200 system equipped with aonochromatized Al K� (1486.6 eV) source. An overall energy
esolution of 0.4 eV was routinely used. All measurements wereerformed at an emission angle of 90◦, corresponding to a sam-ling depth of 10–12 nm. Core-level fitting was performed withixed Gaussian/Lorentzian components, after Shirley background
ubtraction. All core-level energies were referenced to a saturatedydrocarbon C1s peak of 284.6 eV.
SEM images of MWCNTs were acquired with a Jeol JSM7401Fcanning electron microscope (field emission gun; specimen cham-er pressure of about 10−5 Pa; accelerating voltage between 2.5 and
kV; working distance between 2.7 and 8 mm).
.7. Electrochemical and ECL measurements
A single compartment cell was used in air equilibrated condi-ions for electrochemical and ECL measurements. Homemade CNTslectrodes (ϕ = 2 mm), prepared as previously described in Section.2, were used as working electrode. The counter electrode con-
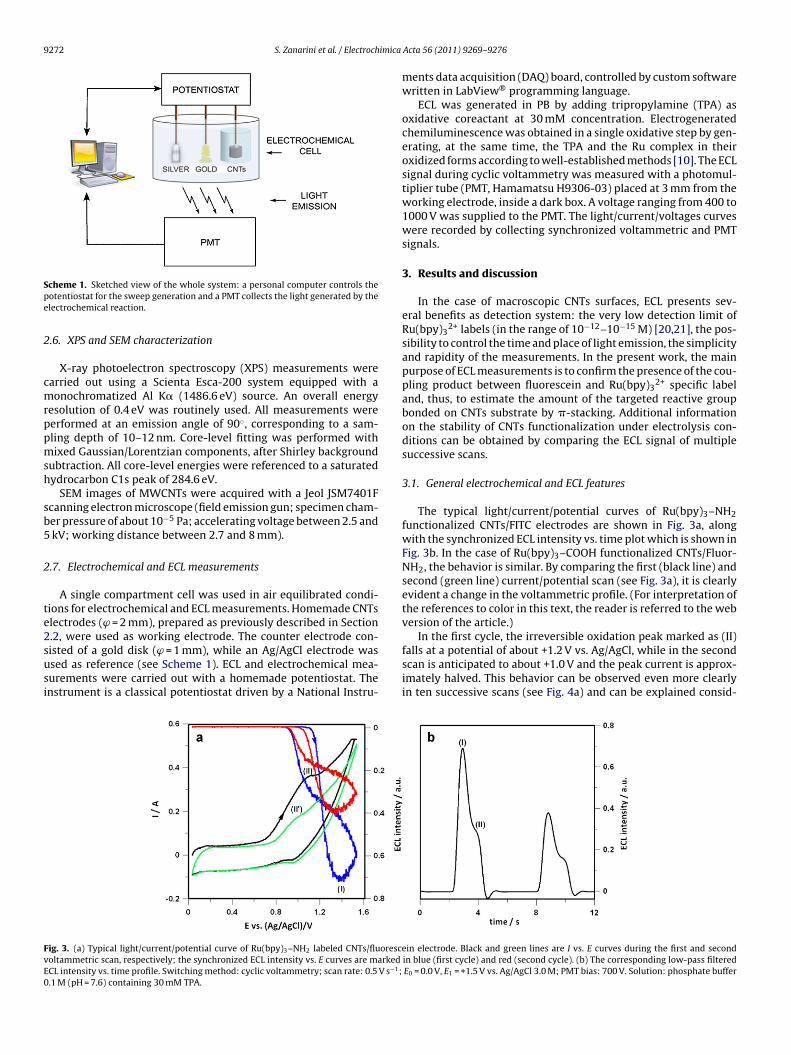
isted of a gold disk (ϕ = 1 mm), while an Ag/AgCl electrode wassed as reference (see Scheme 1). ECL and electrochemical mea-urements were carried out with a homemade potentiostat. Thenstrument is a classical potentiostat driven by a National Instru-ig. 3. (a) Typical light/current/potential curve of Ru(bpy)3–NH2 labeled CNTs/fluorescoltammetric scan, respectively; the synchronized ECL intensity vs. E curves are marked
CL intensity vs. time profile. Switching method: cyclic voltammetry; scan rate: 0.5 V s−1;.1 M (pH = 7.6) containing 30 mM TPA.
Acta 56 (2011) 9269– 9276
ments data acquisition (DAQ) board, controlled by custom softwarewritten in LabView® programming language.
ECL was generated in PB by adding tripropylamine (TPA) asoxidative coreactant at 30 mM concentration. Electrogeneratedchemiluminescence was obtained in a single oxidative step by gen-erating, at the same time, the TPA and the Ru complex in theiroxidized forms according to well-established methods [10]. The ECLsignal during cyclic voltammetry was measured with a photomul-tiplier tube (PMT, Hamamatsu H9306-03) placed at 3 mm from theworking electrode, inside a dark box. A voltage ranging from 400 to1000 V was supplied to the PMT. The light/current/voltages curveswere recorded by collecting synchronized voltammetric and PMTsignals.
3. Results and discussion
In the case of macroscopic CNTs surfaces, ECL presents sev-eral benefits as detection system: the very low detection limit ofRu(bpy)3
2+ labels (in the range of 10−12–10−15 M) [20,21], the pos-sibility to control the time and place of light emission, the simplicityand rapidity of the measurements. In the present work, the mainpurpose of ECL measurements is to confirm the presence of the cou-pling product between fluorescein and Ru(bpy)3
2+ specific labeland, thus, to estimate the amount of the targeted reactive groupbonded on CNTs substrate by �-stacking. Additional informationon the stability of CNTs functionalization under electrolysis con-ditions can be obtained by comparing the ECL signal of multiplesuccessive scans.
3.1. General electrochemical and ECL features
The typical light/current/potential curves of Ru(bpy)3–NH2functionalized CNTs/FITC electrodes are shown in Fig. 3a, alongwith the synchronized ECL intensity vs. time plot which is shown inFig. 3b. In the case of Ru(bpy)3–COOH functionalized CNTs/Fluor-NH2, the behavior is similar. By comparing the first (black line) andsecond (green line) current/potential scan (see Fig. 3a), it is clearlyevident a change in the voltammetric profile. (For interpretation ofthe references to color in this text, the reader is referred to the webversion of the article.)
In the first cycle, the irreversible oxidation peak marked as (II)
falls at a potential of about +1.2 V vs. Ag/AgCl, while in the secondscan is anticipated to about +1.0 V and the peak current is approx-imately halved. This behavior can be observed even more clearlyin ten successive scans (see Fig. 4a) and can be explained consid-ein electrode. Black and green lines are I vs. E curves during the first and secondin blue (first cycle) and red (second cycle). (b) The corresponding low-pass filtered
E0 = 0.0 V, E1 = +1.5 V vs. Ag/AgCl 3.0 M; PMT bias: 700 V. Solution: phosphate buffer
S. Zanarini et al. / Electrochimica Acta 56 (2011) 9269– 9276 9273
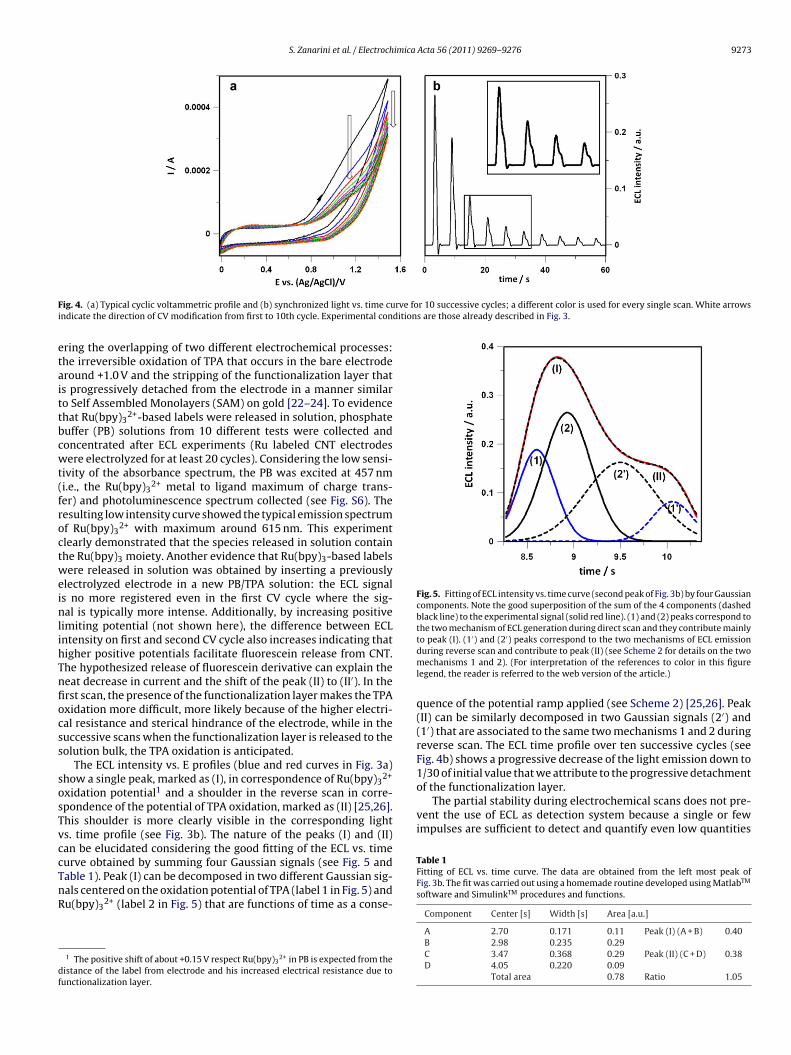
F rve for 10 successive cycles; a different color is used for every single scan. White arrowsi ditions are those already described in Fig. 3.
etaittbcwt(froctweinlihTnfiocss
sosTvccTnR
df
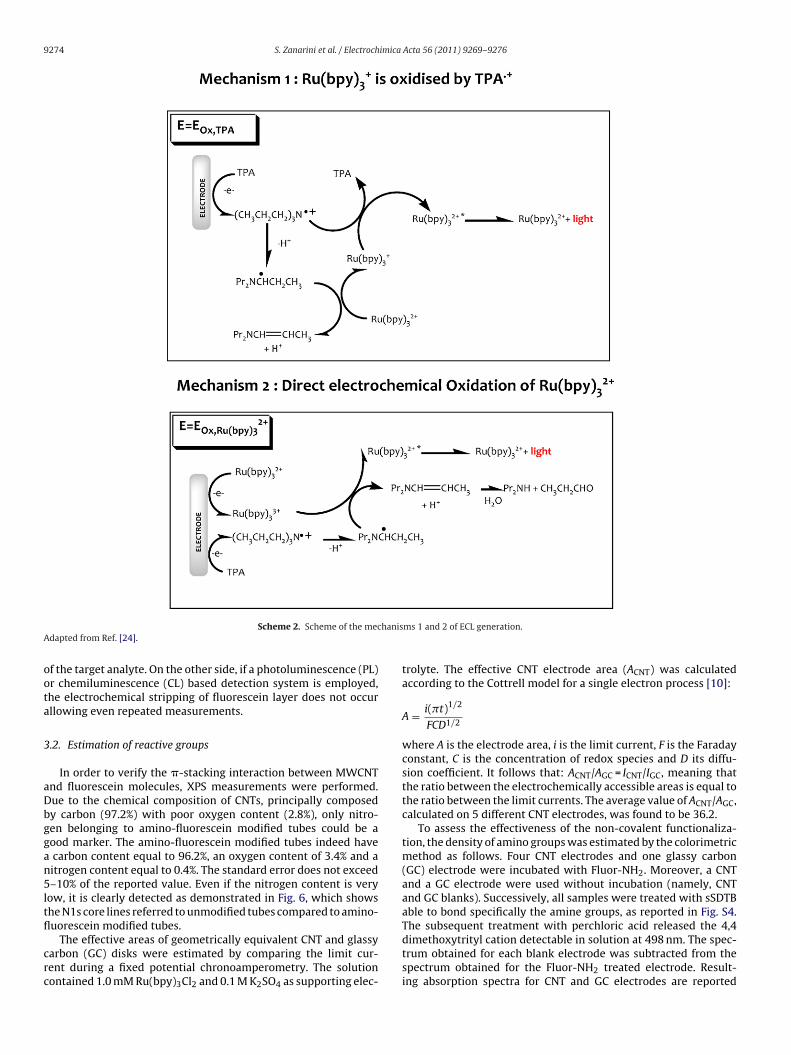
Fig. 5. Fitting of ECL intensity vs. time curve (second peak of Fig. 3b) by four Gaussiancomponents. Note the good superposition of the sum of the 4 components (dashedblack line) to the experimental signal (solid red line). (1) and (2) peaks correspond tothe two mechanism of ECL generation during direct scan and they contribute mainlyto peak (I). (1′) and (2′) peaks correspond to the two mechanisms of ECL emission
of the functionalization layer.The partial stability during electrochemical scans does not pre-
vent the use of ECL as detection system because a single or fewimpulses are sufficient to detect and quantify even low quantities
Table 1
ig. 4. (a) Typical cyclic voltammetric profile and (b) synchronized light vs. time cundicate the direction of CV modification from first to 10th cycle. Experimental con
ring the overlapping of two different electrochemical processes:he irreversible oxidation of TPA that occurs in the bare electroderound +1.0 V and the stripping of the functionalization layer thats progressively detached from the electrode in a manner similaro Self Assembled Monolayers (SAM) on gold [22–24]. To evidencehat Ru(bpy)3
2+-based labels were released in solution, phosphateuffer (PB) solutions from 10 different tests were collected andoncentrated after ECL experiments (Ru labeled CNT electrodesere electrolyzed for at least 20 cycles). Considering the low sensi-
ivity of the absorbance spectrum, the PB was excited at 457 nmi.e., the Ru(bpy)3
2+ metal to ligand maximum of charge trans-er) and photoluminescence spectrum collected (see Fig. S6). Theesulting low intensity curve showed the typical emission spectrumf Ru(bpy)3
2+ with maximum around 615 nm. This experimentlearly demonstrated that the species released in solution containhe Ru(bpy)3 moiety. Another evidence that Ru(bpy)3-based labelsere released in solution was obtained by inserting a previously
lectrolyzed electrode in a new PB/TPA solution: the ECL signals no more registered even in the first CV cycle where the sig-al is typically more intense. Additionally, by increasing positive
imiting potential (not shown here), the difference between ECLntensity on first and second CV cycle also increases indicating thatigher positive potentials facilitate fluorescein release from CNT.he hypothesized release of fluorescein derivative can explain theeat decrease in current and the shift of the peak (II) to (II′). In therst scan, the presence of the functionalization layer makes the TPAxidation more difficult, more likely because of the higher electri-al resistance and sterical hindrance of the electrode, while in theuccessive scans when the functionalization layer is released to theolution bulk, the TPA oxidation is anticipated.
The ECL intensity vs. E profiles (blue and red curves in Fig. 3a)how a single peak, marked as (I), in correspondence of Ru(bpy)3
2+
xidation potential1 and a shoulder in the reverse scan in corre-pondence of the potential of TPA oxidation, marked as (II) [25,26].his shoulder is more clearly visible in the corresponding lights. time profile (see Fig. 3b). The nature of the peaks (I) and (II)an be elucidated considering the good fitting of the ECL vs. timeurve obtained by summing four Gaussian signals (see Fig. 5 and
able 1). Peak (I) can be decomposed in two different Gaussian sig-als centered on the oxidation potential of TPA (label 1 in Fig. 5) andu(bpy)32+ (label 2 in Fig. 5) that are functions of time as a conse-
1 The positive shift of about +0.15 V respect Ru(bpy)32+ in PB is expected from the
istance of the label from electrode and his increased electrical resistance due tounctionalization layer.
during reverse scan and contribute to peak (II) (see Scheme 2 for details on the twomechanisms 1 and 2). (For interpretation of the references to color in this figurelegend, the reader is referred to the web version of the article.)
quence of the potential ramp applied (see Scheme 2) [25,26]. Peak(II) can be similarly decomposed in two Gaussian signals (2′) and(1′) that are associated to the same two mechanisms 1 and 2 duringreverse scan. The ECL time profile over ten successive cycles (seeFig. 4b) shows a progressive decrease of the light emission down to1/30 of initial value that we attribute to the progressive detachment
Fitting of ECL vs. time curve. The data are obtained from the left most peak ofFig. 3b. The fit was carried out using a homemade routine developed using MatlabTM
software and SimulinkTM procedures and functions.
Component Center [s] Width [s] Area [a.u.]
A 2.70 0.171 0.11 Peak (I) (A + B) 0.40B 2.98 0.235 0.29C 3.47 0.368 0.29 Peak (II) (C + D) 0.38D 4.05 0.220 0.09
Total area 0.78 Ratio 1.05
9274 S. Zanarini et al. / Electrochimica Acta 56 (2011) 9269– 9276
hanisA
oota
3
aDbggan5ltfl
crc
Scheme 2. Scheme of the mecdapted from Ref. [24].
f the target analyte. On the other side, if a photoluminescence (PL)r chemiluminescence (CL) based detection system is employed,he electrochemical stripping of fluorescein layer does not occurllowing even repeated measurements.
.2. Estimation of reactive groups
In order to verify the �-stacking interaction between MWCNTnd fluorescein molecules, XPS measurements were performed.ue to the chemical composition of CNTs, principally composedy carbon (97.2%) with poor oxygen content (2.8%), only nitro-en belonging to amino-fluorescein modified tubes could be aood marker. The amino-fluorescein modified tubes indeed have
carbon content equal to 96.2%, an oxygen content of 3.4% and aitrogen content equal to 0.4%. The standard error does not exceed–10% of the reported value. Even if the nitrogen content is very
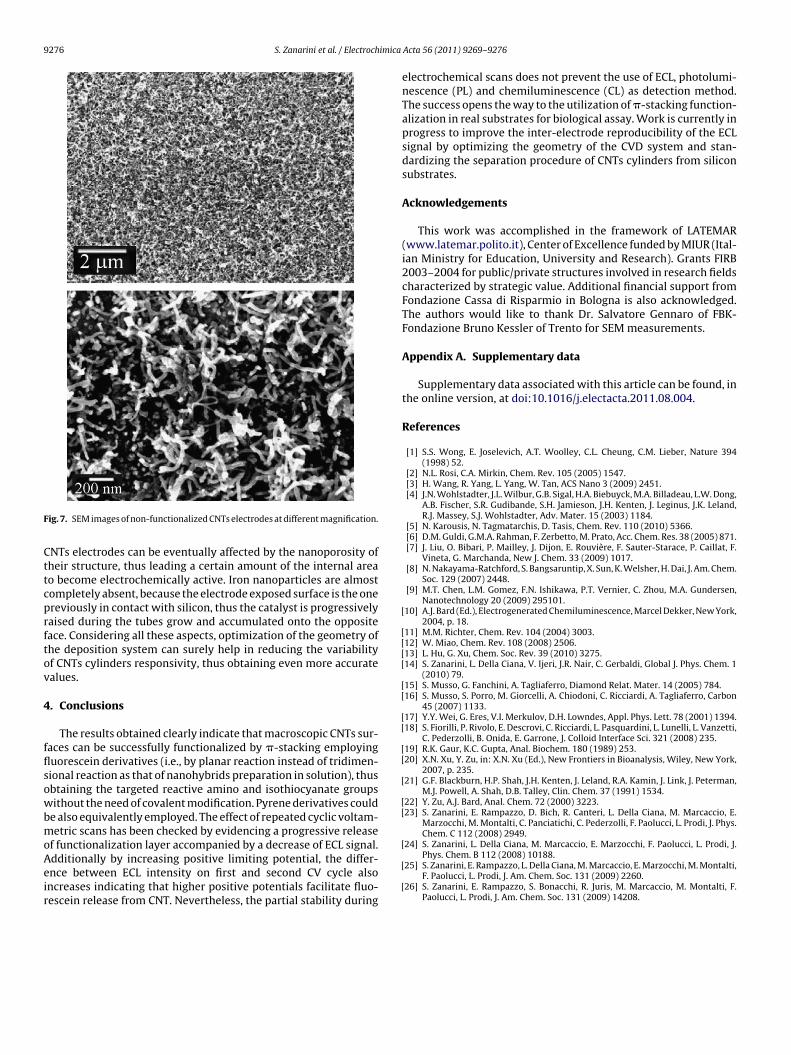
ow, it is clearly detected as demonstrated in Fig. 6, which showshe N1s core lines referred to unmodified tubes compared to amino-uorescein modified tubes.
The effective areas of geometrically equivalent CNT and glassyarbon (GC) disks were estimated by comparing the limit cur-ent during a fixed potential chronoamperometry. The solutionontained 1.0 mM Ru(bpy)3Cl2 and 0.1 M K2SO4 as supporting elec-
ms 1 and 2 of ECL generation.
trolyte. The effective CNT electrode area (ACNT) was calculatedaccording to the Cottrell model for a single electron process [10]:
A = i(�t)1/2
FCD1/2
where A is the electrode area, i is the limit current, F is the Faradayconstant, C is the concentration of redox species and D its diffu-sion coefficient. It follows that: ACNT/AGC = ICNT/IGC, meaning thatthe ratio between the electrochemically accessible areas is equal tothe ratio between the limit currents. The average value of ACNT/AGC,calculated on 5 different CNT electrodes, was found to be 36.2.
To assess the effectiveness of the non-covalent functionaliza-tion, the density of amino groups was estimated by the colorimetricmethod as follows. Four CNT electrodes and one glassy carbon(GC) electrode were incubated with Fluor-NH2. Moreover, a CNTand a GC electrode were used without incubation (namely, CNTand GC blanks). Successively, all samples were treated with sSDTBable to bond specifically the amine groups, as reported in Fig. S4.The subsequent treatment with perchloric acid released the 4,4
dimethoxytrityl cation detectable in solution at 498 nm. The spec-trum obtained for each blank electrode was subtracted from thespectrum obtained for the Fluor-NH2 treated electrode. Result-ing absorption spectra for CNT and GC electrodes are reported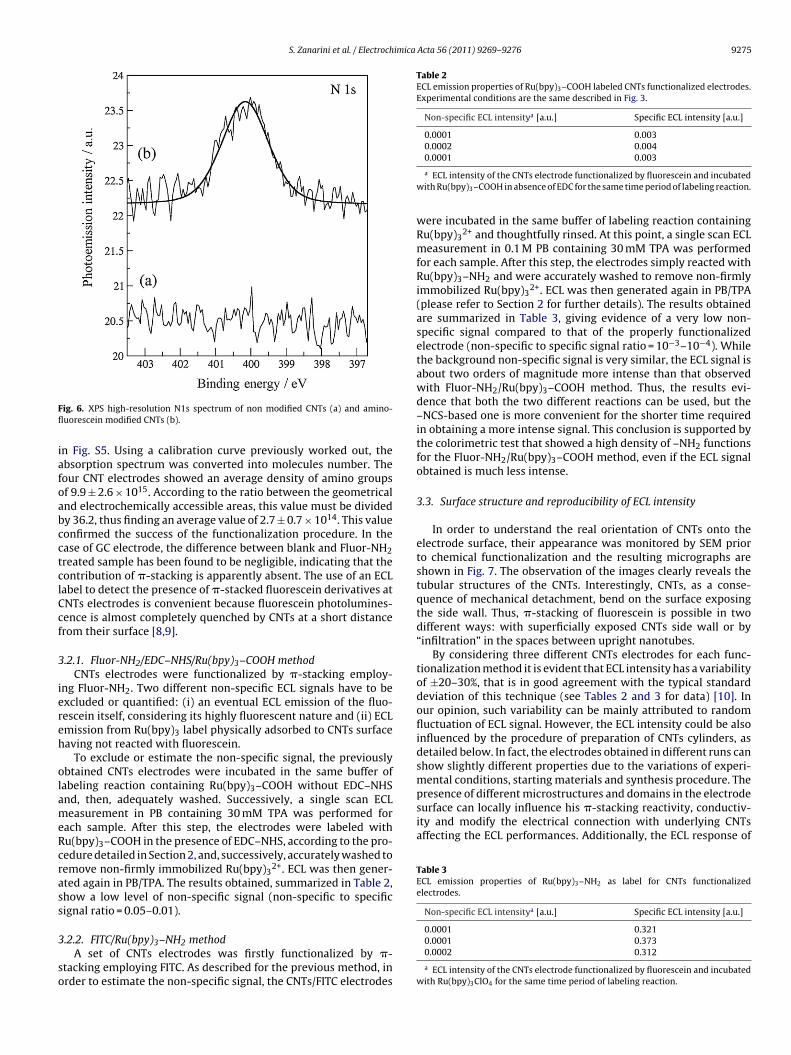
S. Zanarini et al. / Electrochimica Acta 56 (2011) 9269– 9276 9275
Ffl
iafoabcctclCcf
3
iereh
olameRcrass
3
so
Table 2ECL emission properties of Ru(bpy)3–COOH labeled CNTs functionalized electrodes.Experimental conditions are the same described in Fig. 3.
Non-specific ECL intensitya [a.u.] Specific ECL intensity [a.u.]
0.0001 0.0030.0002 0.0040.0001 0.003
presence of different microstructures and domains in the electrodesurface can locally influence his �-stacking reactivity, conductiv-ity and modify the electrical connection with underlying CNTsaffecting the ECL performances. Additionally, the ECL response of
Table 3ECL emission properties of Ru(bpy)3–NH2 as label for CNTs functionalizedelectrodes.
Non-specific ECL intensitya [a.u.] Specific ECL intensity [a.u.]
0.0001 0.321
ig. 6. XPS high-resolution N1s spectrum of non modified CNTs (a) and amino-uorescein modified CNTs (b).
n Fig. S5. Using a calibration curve previously worked out, thebsorption spectrum was converted into molecules number. Theour CNT electrodes showed an average density of amino groupsf 9.9 ± 2.6 × 10¹⁵. According to the ratio between the geometricalnd electrochemically accessible areas, this value must be dividedy 36.2, thus finding an average value of 2.7 ± 0.7 × 10¹⁴. This valueonfirmed the success of the functionalization procedure. In thease of GC electrode, the difference between blank and Fluor-NH2reated sample has been found to be negligible, indicating that theontribution of �-stacking is apparently absent. The use of an ECLabel to detect the presence of �-stacked fluorescein derivatives atNTs electrodes is convenient because fluorescein photolumines-ence is almost completely quenched by CNTs at a short distancerom their surface [8,9].
.2.1. Fluor-NH2/EDC–NHS/Ru(bpy)3–COOH methodCNTs electrodes were functionalized by �-stacking employ-
ng Fluor-NH2. Two different non-specific ECL signals have to bexcluded or quantified: (i) an eventual ECL emission of the fluo-escein itself, considering its highly fluorescent nature and (ii) ECLmission from Ru(bpy)3 label physically adsorbed to CNTs surfaceaving not reacted with fluorescein.
To exclude or estimate the non-specific signal, the previouslybtained CNTs electrodes were incubated in the same buffer ofabeling reaction containing Ru(bpy)3–COOH without EDC–NHSnd, then, adequately washed. Successively, a single scan ECLeasurement in PB containing 30 mM TPA was performed for
ach sample. After this step, the electrodes were labeled withu(bpy)3–COOH in the presence of EDC–NHS, according to the pro-edure detailed in Section 2, and, successively, accurately washed toemove non-firmly immobilized Ru(bpy)3
2+. ECL was then gener-ted again in PB/TPA. The results obtained, summarized in Table 2,how a low level of non-specific signal (non-specific to specificignal ratio = 0.05–0.01).
.2.2. FITC/Ru(bpy)3–NH2 methodA set of CNTs electrodes was firstly functionalized by �-
tacking employing FITC. As described for the previous method, inrder to estimate the non-specific signal, the CNTs/FITC electrodes
a ECL intensity of the CNTs electrode functionalized by fluorescein and incubatedwith Ru(bpy)3–COOH in absence of EDC for the same time period of labeling reaction.
were incubated in the same buffer of labeling reaction containingRu(bpy)3
2+ and thoughtfully rinsed. At this point, a single scan ECLmeasurement in 0.1 M PB containing 30 mM TPA was performedfor each sample. After this step, the electrodes simply reacted withRu(bpy)3–NH2 and were accurately washed to remove non-firmlyimmobilized Ru(bpy)3
2+. ECL was then generated again in PB/TPA(please refer to Section 2 for further details). The results obtainedare summarized in Table 3, giving evidence of a very low non-specific signal compared to that of the properly functionalizedelectrode (non-specific to specific signal ratio = 10−3–10−4). Whilethe background non-specific signal is very similar, the ECL signal isabout two orders of magnitude more intense than that observedwith Fluor-NH2/Ru(bpy)3–COOH method. Thus, the results evi-dence that both the two different reactions can be used, but the–NCS-based one is more convenient for the shorter time requiredin obtaining a more intense signal. This conclusion is supported bythe colorimetric test that showed a high density of –NH2 functionsfor the Fluor-NH2/Ru(bpy)3–COOH method, even if the ECL signalobtained is much less intense.
3.3. Surface structure and reproducibility of ECL intensity
In order to understand the real orientation of CNTs onto theelectrode surface, their appearance was monitored by SEM priorto chemical functionalization and the resulting micrographs areshown in Fig. 7. The observation of the images clearly reveals thetubular structures of the CNTs. Interestingly, CNTs, as a conse-quence of mechanical detachment, bend on the surface exposingthe side wall. Thus, �-stacking of fluorescein is possible in twodifferent ways: with superficially exposed CNTs side wall or by“infiltration” in the spaces between upright nanotubes.
By considering three different CNTs electrodes for each func-tionalization method it is evident that ECL intensity has a variabilityof ±20–30%, that is in good agreement with the typical standarddeviation of this technique (see Tables 2 and 3 for data) [10]. Inour opinion, such variability can be mainly attributed to randomfluctuation of ECL signal. However, the ECL intensity could be alsoinfluenced by the procedure of preparation of CNTs cylinders, asdetailed below. In fact, the electrodes obtained in different runs canshow slightly different properties due to the variations of experi-mental conditions, starting materials and synthesis procedure. The
0.0001 0.3730.0002 0.312
a ECL intensity of the CNTs electrode functionalized by fluorescein and incubatedwith Ru(bpy)3ClO4 for the same time period of labeling reaction.
9276 S. Zanarini et al. / Electrochimica
F
Cttcprftov
4
fflsowbmoAeir
[
[[[[
[[
[[
[[
[
[[
[
ig. 7. SEM images of non-functionalized CNTs electrodes at different magnification.
NTs electrodes can be eventually affected by the nanoporosity ofheir structure, thus leading a certain amount of the internal areao become electrochemically active. Iron nanoparticles are almostompletely absent, because the electrode exposed surface is the onereviously in contact with silicon, thus the catalyst is progressivelyaised during the tubes grow and accumulated onto the oppositeace. Considering all these aspects, optimization of the geometry ofhe deposition system can surely help in reducing the variabilityf CNTs cylinders responsivity, thus obtaining even more accuratealues.
. Conclusions
The results obtained clearly indicate that macroscopic CNTs sur-aces can be successfully functionalized by �-stacking employinguorescein derivatives (i.e., by planar reaction instead of tridimen-ional reaction as that of nanohybrids preparation in solution), thusbtaining the targeted reactive amino and isothiocyanate groupsithout the need of covalent modification. Pyrene derivatives could
e also equivalently employed. The effect of repeated cyclic voltam-etric scans has been checked by evidencing a progressive release
f functionalization layer accompanied by a decrease of ECL signal.
dditionally by increasing positive limiting potential, the differ-nce between ECL intensity on first and second CV cycle alsoncreases indicating that higher positive potentials facilitate fluo-escein release from CNT. Nevertheless, the partial stability during[
[
Acta 56 (2011) 9269– 9276
electrochemical scans does not prevent the use of ECL, photolumi-nescence (PL) and chemiluminescence (CL) as detection method.The success opens the way to the utilization of �-stacking function-alization in real substrates for biological assay. Work is currently inprogress to improve the inter-electrode reproducibility of the ECLsignal by optimizing the geometry of the CVD system and stan-dardizing the separation procedure of CNTs cylinders from siliconsubstrates.
Acknowledgements
This work was accomplished in the framework of LATEMAR(www.latemar.polito.it), Center of Excellence funded by MIUR (Ital-ian Ministry for Education, University and Research). Grants FIRB2003–2004 for public/private structures involved in research fieldscharacterized by strategic value. Additional financial support fromFondazione Cassa di Risparmio in Bologna is also acknowledged.The authors would like to thank Dr. Salvatore Gennaro of FBK-Fondazione Bruno Kessler of Trento for SEM measurements.
Appendix A. Supplementary data
Supplementary data associated with this article can be found, inthe online version, at doi:10.1016/j.electacta.2011.08.004.
References
[1] S.S. Wong, E. Joselevich, A.T. Woolley, C.L. Cheung, C.M. Lieber, Nature 394(1998) 52.
[2] N.L. Rosi, C.A. Mirkin, Chem. Rev. 105 (2005) 1547.[3] H. Wang, R. Yang, L. Yang, W. Tan, ACS Nano 3 (2009) 2451.[4] J.N. Wohlstadter, J.L. Wilbur, G.B. Sigal, H.A. Biebuyck, M.A. Billadeau, L.W. Dong,
A.B. Fischer, S.R. Gudibande, S.H. Jamieson, J.H. Kenten, J. Leginus, J.K. Leland,R.J. Massey, S.J. Wohlstadter, Adv. Mater. 15 (2003) 1184.
[5] N. Karousis, N. Tagmatarchis, D. Tasis, Chem. Rev. 110 (2010) 5366.[6] D.M. Guldi, G.M.A. Rahman, F. Zerbetto, M. Prato, Acc. Chem. Res. 38 (2005) 871.[7] J. Liu, O. Bibari, P. Mailley, J. Dijon, E. Rouvière, F. Sauter-Starace, P. Caillat, F.
Vineta, G. Marchanda, New J. Chem. 33 (2009) 1017.[8] N. Nakayama-Ratchford, S. Bangsaruntip, X. Sun, K. Welsher, H. Dai, J. Am. Chem.
Soc. 129 (2007) 2448.[9] M.T. Chen, L.M. Gomez, F.N. Ishikawa, P.T. Vernier, C. Zhou, M.A. Gundersen,
Nanotechnology 20 (2009) 295101.10] A.J. Bard (Ed.), Electrogenerated Chemiluminescence, Marcel Dekker, New York,
2004, p. 18.11] M.M. Richter, Chem. Rev. 104 (2004) 3003.12] W. Miao, Chem. Rev. 108 (2008) 2506.13] L. Hu, G. Xu, Chem. Soc. Rev. 39 (2010) 3275.14] S. Zanarini, L. Della Ciana, V. Ijeri, J.R. Nair, C. Gerbaldi, Global J. Phys. Chem. 1
(2010) 79.15] S. Musso, G. Fanchini, A. Tagliaferro, Diamond Relat. Mater. 14 (2005) 784.16] S. Musso, S. Porro, M. Giorcelli, A. Chiodoni, C. Ricciardi, A. Tagliaferro, Carbon
45 (2007) 1133.17] Y.Y. Wei, G. Eres, V.I. Merkulov, D.H. Lowndes, Appl. Phys. Lett. 78 (2001) 1394.18] S. Fiorilli, P. Rivolo, E. Descrovi, C. Ricciardi, L. Pasquardini, L. Lunelli, L. Vanzetti,
C. Pederzolli, B. Onida, E. Garrone, J. Colloid Interface Sci. 321 (2008) 235.19] R.K. Gaur, K.C. Gupta, Anal. Biochem. 180 (1989) 253.20] X.N. Xu, Y. Zu, in: X.N. Xu (Ed.), New Frontiers in Bioanalysis, Wiley, New York,
2007, p. 235.21] G.F. Blackburn, H.P. Shah, J.H. Kenten, J. Leland, R.A. Kamin, J. Link, J. Peterman,
M.J. Powell, A. Shah, D.B. Talley, Clin. Chem. 37 (1991) 1534.22] Y. Zu, A.J. Bard, Anal. Chem. 72 (2000) 3223.23] S. Zanarini, E. Rampazzo, D. Bich, R. Canteri, L. Della Ciana, M. Marcaccio, E.
Marzocchi, M. Montalti, C. Panciatichi, C. Pederzolli, F. Paolucci, L. Prodi, J. Phys.Chem. C 112 (2008) 2949.
24] S. Zanarini, L. Della Ciana, M. Marcaccio, E. Marzocchi, F. Paolucci, L. Prodi, J.
Phys. Chem. B 112 (2008) 10188.25] S. Zanarini, E. Rampazzo, L. Della Ciana, M. Marcaccio, E. Marzocchi, M. Montalti,F. Paolucci, L. Prodi, J. Am. Chem. Soc. 131 (2009) 2260.
26] S. Zanarini, E. Rampazzo, S. Bonacchi, R. Juris, M. Marcaccio, M. Montalti, F.Paolucci, L. Prodi, J. Am. Chem. Soc. 131 (2009) 14208.