F O L I A V E T E R I N A R I A 54, 1, 2010
56
The scientific journal of the UNIVERSITY OF VETERINARY MEDICINE AND PHARMACY IN KOšICE — The Slovak Republic 1 LIV 2010 ISSN 0015-5748 VETERINARIA FOLIA
Transcript of F O L I A V E T E R I N A R I A 54, 1, 2010

The scientific journal of theUniversiTy of veTerinary medicine and pharmacy in Košice — The slovak republic
1LIV 2010
issn 0015-5748
VETERINARIA
FOLIA

FOLIA VETERINARIA is issued by the University of Vet-
erinary Medicine in Košice (UVL); address: Komenského 73,
041 81 K o š i c e, The Slovak Republic (tel.: +421 55 633 51 03,
fax: +421 55 633 51 03, E-mail: [email protected]).
The journal is published quarterly in English (numbers 1—4)
and distributed worldwide.
Subscription rate for 1 year is 120 €. Orders are accepted
by The Department of The Scienti fic Information — The Library
of The University of Vete ri nary Medicine and Pharmacy in Košice
(UVIK), E-mail: [email protected]; the subscription is ac-
cepted by the State treasure.
Bank contact: State treasure, Radlinského 32, Bratislava 15,
The Slovak Republic; account number: 7000072225/8180.
FOLIA VETERINARIA, vydáva Univerzita veterinárskeho
lekárstva a farmácie v Košiciach (UVL), Komenského 73,
041 81 K o š i c e, Slovenská republika (tel.: 055/633 51 03,
fax: 055/633 51 03, E-mail: [email protected]).
Časopis vychádza kvartálne (č. 1—4) a je distribuovaný
celosvetove.
Ročné predplatné 120 €. Objednávky prijíma Ústav vedeckých
infor mácií a knižnice Univerzity veterinárskeho lekárstva a farmácie
v Ko ši ciach (UVIK), E-mail: [email protected]; predplatné
Štátna pokladnica (na nižšie uvedené číslo účtu).
Bankové spojenie: Štátna pokladnica, Radlinského 32, Bra-
tislava 15; číslo účtu: 7000072225/8180.
Tlač: EMILENA, Čermeľská 3, 040 01 Košice
Sadzba: Sapfo publishers, Szakkayho 1, 040 01 Košice
EV 3485/09
E D I T O R I A L B O A R D
Editor in Chief : Emil P i l i p č i n e cExecutive Editor : Jaroslav L e g á t hMembers : Baumgartner, W. (Vienna), Bíreš, J. (Košice), Breza, M. (Košice), Buczek, J. (Lublin), Campo, M. S. (Glas-
gow), Cigánková, V. (Košice), Cudlín, J. (Prague), Dianovský, J. (Košice), Huszenicza, Gy. (Budapest), Korim, P. (Košice), Kottferová, J. (Košice), Kováč, G. (Košice), Levkut, M. (Košice), Máté, D. (Košice), Mojžišová, J. (Košice), Pistl, J. (Košice), Pliešovský J. (Bratislava), Pogačnik, M. (Ljubljana), Šucman, E. (Brno), Totolian, A. A. (Saint Petersburg), Vajda, V. (Košice), Valocký, I. (Košice), Vargová, M. (Košice), Večerek, V. (Brno), Vilček, Š. (Košice)
For basic information about the journal seeInternet home pages: www.uvm.sk
Indexed and abstractedin AGRIS, CAB EBSCO

F O L I A V E T E R I N A R I A, 54, 1, 2010
C O N T E N T S
SOETAN, K. O., AzEEz, O. I., FAFuNSO, M. A.: Investigations on Sorghum bicolor saponins-inducedchanbes in osmotic fragility of human and bovine erythrocytes .......................................................................................................3
AMEEN, S. A., JOShuA, R. A., OKEwOLE, E. A., FATOKuN, B. O.: The microminerals in serum of West African Dwarf (WAD) goats infected with Trypanosoma congolense ......................................................................................9
AMEEN, S. A., JOShuA, R. A., OKEwOLE, E. A., ADEDEJI, O. S., RAhEEM, A. K., OJEDApO, L. O., AMAO, S. R.: The influence of three different levels of dietary energy on the susceptibility of West African Dwarf (WAD) goats to experimental Trypanosoma congolense infection ................................................................ 14
LAwAL, F. M., ADETuNJI, A.: Comparison of epidural anaesthesia with bupivacaine xylazine and bupivacaine-xylazine mixture in cats ..................................................................................................................................................19
NOVOTNý, J., pETROVIč, V., LINK, R., hISIRA, V., KOVáč, G.: Concentration of Fe, Cu, and Zn inblood serum, milk, urine and faeces of lactationg sow .....................................................................................................................23
STRApáč, I., SOKOL, J., ŽATKO, D., BARANOVá, M.: Mercury and selenium concentrations in muscle tissue of different species of nonpredatory freshwater fish .................................................................................................26
VLčKOVá, R., VOJTEKOVá, N., SOpKOVá, D., ONDRAšOVIčOVá, S.: Changes of the canine endometrium during proliferative and secretory phases of the oestrous cycle ......................................................................................................32
LORINčáK, Ľ., DANCAKOVá, Ľ., DuDRíKOVá, E., GáL, p., LENhARDT, Ľ.: Reduced alkaline phosphatase activiny in jejunal enterocytes of piglets with retarded growth ........................................................................................................42
pETROVOVá, E., LupTáKOVá, L., VDOVIAKOVá, K., MAŽENSKý, D.: Bendiocarb embryotoxicityon the chick development from stage 20 ..........................................................................................................................................46
GUIDE FOR AUTHORS .................................................................................................................................................................... 51

FOLIA VETERINARIA
F o l i a v e t e r i n a r i aV o l . 54, 2010
VYDALA
UNIVERZITA VETERINÁRSKEHO LEKÁRSTVA A fARmÁcIE V KOšIcIAcH
2010
pUbLISHED bYTHE UNIVERSITY Of VETERINARY mEDIcINE AND pHARmAcY IN KOšIcE
THE SLOVAK REpUbLIc

3
fOLIA VETERINARIA, 54, 1: 3—8, 2010
ABSTRACT
The in-vitro osmotic fragility of human and cow erythrocytes in-duced by Sorghum bicolor saponins was investigated. The Sorghum bicolor saponin caused osmotic fragilities in human and cow eryth-rocytes. The osmotic fragilities were found to be dose dependent and decreased with increasing concentrations. Erythrocyte osmotic fragil-ity was higher in the sample exposed to 0.8 mg.ml-1 of the standard saponin than in the sample exposed to 1.6 mg.ml-1 of the standard saponin especially at NaCl concentrations of 0.1, 0.2, 0.3, 0.4, 0.5, 0.6, 0.7, 0.75, 0.8, and 0.85 %. In the sample treated with 1.6mg.ml-1 of the sorghum saponin however, the erythrocytes were more resistant to osmotic lysis than those treated with either 0.8 or 1.6 mg.ml-1 of standard saponin especially at NaCl concentrations of 0.7, 0.75, 0.8, 0.85 and 0.9 %. The bovine erythrocytes exposed to 1.6 mg.ml-1 of standard saponin were more stable in hypotonic solution than those treated with 0.8 mg.ml-1 of the standard saponin at 0.1, 0.2, 0.3, 0.4, 0.5, 0.6, 0.7, 0.75, 0.8 and 0.85 % NaCl concentrations. When sor-ghum saponin was however introduced to the bovine erythrocytes, the erythrocyte osmotic fragility decreased considerably, in a manner that is similar to that of the human erythrocytes, especially at 0.5, 0.6, 0.7, 0.75, 0.8, 0.85 and 0.9 % NaCl. Saponin increased the erythro-cytes osmotic fragility of both human and bovine erythrocytes at 0.6, 0.7, 0.75, 0.8, 0.85 and 0.9 % NaCl concentrations. However, bovine erythrocytes were more stable in hypotonic solution in the presence of saponin than were the human erythrocytes especially at sodium chlo-ride concentration of 0.4, 0.5, 0.6, 0.7, 0.75 and 0.8 %.
Key words: cow; erythrocytes; human; osmotic fragility; saponins; Sorghum bicolor
INTRODUCTION
Saponins represent a group of natural compounds, widely dis-tributed in the plant kingdom, which display a number of biological properties (2).
Saponins (as triterpene or steroid glycosides) are naturally oc-curring products of high pharmaceutical importance characterized by producing foaming activity with water and haemolysed red blood cells (31). Saponins have the ability to cause lysis of erythrocytes, a property that have been employed by several authors to detect the presence of saponins in drugs. by measuring the haemolytic activi-ty, their concentrations can be estimated (5). In general, the change in absorbance of the supernatant of an erythrocyte suspension is measured after haemolysis by a saponin or a saponin-containing drug (5).
Saponins are amphiphilic in nature. The chemical structure of saponins from different species of medicago has especially be-ing studied. They generally consist of a mixture of triterpene gly-cosides with medicagenic acid, hederagenin, Zhanic acid or soya saponenols as the main aglycones (2).
Saponins from medicago species are reported to have various biological and physiological effects like antimicrobial, fungistatic, allelopathic, cholesterol binding, cytotoxic, insecticidal, membrane depolarizing and haemolytic properties (32). Until recently, haemo-lytic structure-activity relationships of saponins have been based on the nature of the aglycone (35). V o u t q u e n n e et al. (34) reported on the influence of the sugar moiety on haemolytic activity and the synthesis of a-Hederin and related triterpene saponins. Some of the biological effects of Sorghum bicolor saponins have been reported by L a s i s i et al. (15) and S o e t a n et al. (30). In continuation of
INVESTIGATIONS ON SORGHUM BICOLOR SAPONINS-INDUCED CHANGES IN OSMOTIC FRAGILITY OF HUMAN AND BOVINE ERYTHROCYTES
Soetan, K. O.1, Azeez, O. I.1, Fafunso, M. A.2
1Department of Veterinary Physiology, Biochemistry and Pharmacology2Department of Biochemistry, University of Ibadan
Nigeria

4
the studies on the biological effects of saponins in plants used as human foods and animal feeds, this paper examines the in vitro os-motic fragility of human and cow erythrocytes induced by Sorghum bicolor saponins.
MATERIALS AND METHODS
The Sorghum bicolor (Guinea corn) used for this study was ob-tained from the bodija market, Ibadan in Nigeria.
Preparation of crude saponin extractsThe sorghum seeds were sun dried. The dried seeds were ground
once using an electronic grinder. Nine hundred grams of sorghum seeds were exhaustively separated for 10 hours in a Soxhlet extrac-tor using hexane (boiling range 68—69 °c). This removed the lipids and other pigments. The solvent was then changed to methanol (boiling range 64—65.5 °c) and the extraction was continued for the next 12 hours. This removed the saponins, together with low mo-lecular weight substances or compounds such as sugars, phenolic compounds, oligosaccharides and flavonoids (10). The resulting so-lutions were evaporated to dryness to yield 32 g methanolic extracts. The presence of saponins in these methanolic extracts was detected by the characteristic frothing tests and thin layer chromatography.
In order to obtain partially purified saponins, the methanolic extracts were loaded on to a column of Rp powder (Octadecyl slane bonded to silica gel particle size 15—25 Ym JT baker, Germany). The column was washed with water to remove the sugars and oligo-saccharides while further elution with 30 % methanol (v/v) removed the flavonoid and other phenolic compounds. Subsequent elution with 100% methanol removed the saponins (10, 12). This yielded 24 g of crude saponins. The saponin extracts were dispensed into clean sterile bottles and stored in the refrigerator at -4 °c.
Confirmation of the presence of saponins in the purified fractionThe saponin extracts were subjected to thin layer chromatogra-
phy (TLc) on silica gel plates (0.25 mm silica gel) using the solvent system methanol/distilled water (4 : 1). The developed plates were dried at room temperature. The visualization of saponin on the de-veloped plates was done by spraying with 50 % (v/v) sulphuric acid. The sprayed chromatographs were allowed to dry for 15 minutes at room temperature and then heated at 105 °c for 3 minutes in an oven until the colour developed reached its maximum. The frothing test was done on the basis that the aqueous solutions of saponins form very stable foams. One ml of the concentrated methanolic solution of the extract was shaken with 5 ml of distilled water in a test tube. formation of stable foams confirmed the presence of saponins.
Collection of blood samplesfresh blood samples (10 mls) were obtained from the jugular
vein of a one year old cow (white fulani breed) and 6 ml blood sam-ples were also obtained from a healthy adult human female through the ulna veins. The genotype of the human blood was haemoglobin HbAA and the blood group was O+.
The blood samples were put into sample bottles containing 2 mg.ml-1 ethylene diamine tetra acetic acid (EDTA) as the anti-
coagulant. The red blood cell (Rbc) count was determined by the haemocytometer method; the packed cell volume (pcV) by the mi-crohaematocrit method; and the haemoglobin (Hb) concentration by the cyanmethaemoglobin method. from the values obtained, the mean corpuscular volume (mcV), mean corpuscular haemo-globin (mcH) and mean corpuscular haemoglobin concentration (mcHc) were calculated (28).
The erythrocyte osmotic fragility test was performed in the hu-man and bovine blood samples as described previously (8, 23) using the following procedures. five ml each of different concentrations of 1% phosphate buffered sodium dihydrogen phosphate dihydrate (NaH
2pO
4 . 2H
2O 0.14 mg.ml-1) and sodium dihydrogen phosphate
monohydrate (NaH2pO
4 . H
2O 0.23 mg.ml-1), 1.6 mg.ml-1 standard
saponins and 1.6 mg.ml-1 Sorghum bicolor saponins solution were prepared in 12 centrifuge tubes. The standard saponin was of ana-lytical grade (Sigma chemical co, Ltd).
The pH of the buffered solution (7.4) was determined using a pH meter (mettler Toledo mp 220). To each of the 1.6 mg.ml-1 stan-dard saponin and the 1.6 mg.ml-1 Sorghum bicolor saponin solutions, 50 µl of a fresh blood sample was added. The contents were mixed gently and kept at 37 °c for 30 minutes and then centrifuged at 2, 500 revolutions/minute for five minutes. The supernatants were removed and the haemoglobin content determined spectrophoto-metrically using a spectrophotometer (Spectro sc Labomed, Inc.) at wavelength of 540 nm. The osmotic fragility curve was obtained by plotting the percentage haemolysis against the concentration of the phosphate buffered Nacl solution, using the tube with the highest fragility (0.0 % Nacl) as 100 % lysis.
RESULTS
fig. 1 shows the osmotic fragility of human erythrocytes exposed to the standard saponin and the sorghum saponin. The erythrocyte osmotic fragility was higher in the sample exposed to 0.8 mg.ml-1 of the standard saponin than in the sample exposed to 1.6 mg.ml-1 of the standard saponin espe-cially at Nacl concentrations of 0.1 %, 0.2 %, 0.3 %, 0.4 %, 0.5 %, 0.6 %, 0.7 % and 0.75 % Nacl concentration. In the sample treated with 1.6 mg.ml-1 of the sorghum saponin ho-wever, the erythrocytes were more resistant to osmotic lysis than those treated with either 0.8 or 1.6 mg.ml-1 of standard saponin especially at Nacl concentrations of 0.7 %, 0.75 %, 0.8 %, 0.85 % and 0.9 % Nacl concentration.
Similarly, as shown in (fig. 2), the bovine erythrocyte exposed to 1.6 mg.ml-1 of standard saponin were more sta-ble in hypotonic solution than those treated with 0.8 mg.ml-1 of the standard at 0.1 %, 0.2 %, 0.3 %, 0.4 %, 0.5 %, 0.6 %, 0.7 %, 0.75 %, 0.8 % and 0.85 % Nacl concentrations. When sorghum saponin was however introduced to the bovine erythrocytes, the erythrocyte osmotic fragility decreased con-siderably, in a manner that was similar to that of the human erythrocytes, especially at 0.6 %, 0.7 %, 0.75 %, 0.8 %, 0.85 % and 0.9 % Nacl concentrations.
As shown in fig. 3, sorghum saponin increased the erythrocyte osmotic fragility of both human and bovine erythrocytes at 0.5 %, 0.6 %, 0.7 %, 0.75 %, 0.8 %, 0.85 % and 0.9 % Nacl concentrations. However, the bovine erythrocytes
5
Fig. 1. Osmotic fragility of human erythrocytes exposed to 0.8 mg.ml-1 and 1.6 mg.ml-1 of standard saponin and 1.6 mg.ml-1 of saponin extracted from sorghum (Sorghum bicolor)
Fig. 2. Osmotic fragility of the bovine erythrocytes exposed to 0.8 mg.ml-1 and 1.6 mg.ml-1 ofstandard saponin and 0.8 mg.ml-1 of saponin extracted from sorghum (Sorghum bicolor)

6
were more stable in hypotonic solution in the presence of sor-ghum saponin than were the human erythrocytes especially at the sodium chloride concentrations of 0.4 %, 0.5 %, 0.6 %, 0.7 %, 0.75 % and 0.8 % Nacl concentration.
DISCUSSION
The present study has demonstrated that sorghum sapo-nins caused the increased haemolysis of human and cattle red blood cells in hypotonic solutions. This is expected because of the previous reports of the alterations in the membrane in-tegrity and its effects on cholesterol in the plasma membrane of erythrocytes. L i n d a h l et al. (18) reported that the injec-tion of saponins in large amounts elicited various responses in different animals, some of which were erythrocyte haemo-lysis and growth retardation, whilst some others elicited the inhibition of smooth muscle activity (6), cholesterol deple-tion (29), increased enzyme activity (17) and alterations in cell membrane integrity (21). G e e and J o h n s o n (11) have also reported pronounced haemolytic properties elicited by saponins present in some other plants.
The (osmotic fragility) haemolytic activity of the sorghum saponins was found to be dose dependent. The osmotic fra-gility decreased with increasing concentration of both the standard and the sorghum saponins. The osmotic resistance of erythrocytes of several mammalian species has been found
to change when the temperature or pH of the surrounding hypotonic environment is altered (25).
In this study, bovine erythrocytes were observed to be more stable in hypotonic solution than were those of human erythrocytes despite exposure to similar concentration of saponin. This clearly demonstrates that species differences occur in the behavior of erythrocytes to haemolytic agents such as saponin (13, 25). Several authors have also reported different values even for the same animal species (28). This could be due to differences in the factors that are known to influence osmotic fragility such as volume, size and age of erythrocytes, temperature and pH of the medium (28). The species differences in the osmotic fragility of mammalian erythrocytes observed by c o l d m a n et al. (7) were con-firmed in a study by O y e w a l e (24). He reported that the species differences are apparently attributable to factors that vary between species such as the nature of the erythrocyte membrane or the physical and chemical constitution of the cell. It has been shown by J a i n (13) that the resistance of erythrocytes to osmotic lysis may increase or decrease in some haematological disorders.
It has been reported that the osmotic fragility of human erythrocytes (1) and rat, rabbit, cattle and pig erythrocytes (23) as well as sheep and goat erythrocytes (22) decreases when the temperature or pH of the surrounding hypotonic solution is increased. A l o n i et al. (1) reported that in con-trast to the above findings, the erythrocyte osmotic fragility
Fig. 3. Comparison of the osmotic fragility of the human and bovine erythrocytes exposed to 1.6 mg.ml-1 ofsorghum saponin with those exposed to buffered saline only

7
increases with an increase in temperature in the camel. This effect of temperature on erythrocyte fragility is on the mem-brane lipids and proteins. The pH of animal blood, especially cattle (26), pig (33), dog (3) and horse (4) blood has been reported to decrease during storage for 24 hours and this is attributable to the accumulation of lactate, an end-product of glycolysis. It has also been reported that the fragility of erythrocytes in rat, rabbit, cattle and pig erythrocytes (23) as well as sheep and goat erythrocytes (22) increases as the pH or temperature of the surrounding hypotonic solution decre-ases. O y e w a l e (24) reported the effect of storage of blood on the osmotic fragility of mammalian erythrocytes. He ob-served significant changes in the fragility of goat, cattle, pig, mouse, rat and rabbit erythrocytes, but not in sheep erythro-cytes during the storage of blood for 24 hours at 10 °c.
It has been shown that oestrogen increases the resistance of erythrocytes to osmotic haemolysis and that testosterone has no effect on erythrocyte fragility (20). The presence of oestrogens in the adult human female and the cow used in this study could affect the degree of the osmotic haemolysis of their erythrocytes by the sorghum saponins.
The curve of the osmotic fragility of human and cattle haemoglobin against the concentration of saponins is sig-moid in shape and it is similar to that of the standard osmo-tic fragility curve. The sigmoid shape of the osmotic fragility curve indicates that normal red cells vary in their resistance to hypotonic solutions. This resistance varies osmotically and gradually as a function of red cell age, with the youngest red cells being the most resistant and the oldest red cells the most fragile and susceptible. The old erythrocytes are more fragile than the young ones (27). The reason for this is that old red cells have higher sodium content and a decreased capacity to pump out sodium (9).
The ability of normal red blood cells to withstand low or high hypotonicity arise from its biconcave shape, which allows the cell to increase its volume by about 70 % before the surface membrane is stretched and once this limit is reached, lysis occurs.
The mechanisms by which saponins cause red cell haemo-lysis were also investigated by J o n e s and E l l i o t (14). They reported that a reaction of the saponin with cholesterol in the erythrocyte wall, resulting in permeability changes, might be responsible for the haemolytic activity although a number of haemolytic saponins do not form cholesyeroids. L o w e r (19) reported that not all saponins are haemolytically active. for example, the soy saponins have little haemolytic activity. Different saponins have different haemolytic activities and there is a wide variation among different animal species in the susceptibility of their erythrocytes to haemolysis by sapo-nins as demonstrated by the human and bovine erythrocytes in our study. This might explain why anaemia is not observed in people consuming foods containing highly haemolytic sa-ponins. However, it should be noted that no general corre-lation was found between haemolytic activity and saponin toxicity (16).
It is hoped that the data presented in this study would be useful in assessing the significance of the values that may be obtained in the tropical environment in disease conditions
at least with respect to the effect of saponins on human and bovine erythrocytes.
ACKNOWLEDGEMENT
The authors appreciate the technical assistance of Mr. O. Anwo of Haematology Department, University College Hospital (UCH), Iba-dan, Nigeria.
REFERENCES
1. Aloni, B., Eitan, A., Livine, A., 1977: The erythrocyte mem-brane site for the effect of temperature on osmotic fragility. bio-chim. Biophys. Acta, 465, 46—53.
2. Avato, P., Tava, A., Bialy, Z., Jurzysta, M., 2004: bioac-tive saponins from medicago sp. In Book of Abstracts, International Conference on Saponins, Phytochemistry and Application of Plant Sa-ponins, pulawy, poland, 8—10th September, 53.
3. Assal, A. N., Arnbjerb, J., Poulsen, J. S. D., 1978: Acid-base status of canine blood during storage. Nord. Vet. Med., 30, 345—353.
4. Assal, A. N., Poulsen, J. S. D., 1978: Acid-base status of equine blood during storage. Nord. Vet. Med., 30, 354—360.
5. Bruneton, J., 1999: Pharmacognosy Phytochemistry Medici-nal Plants, 2nd edn., Lavoiser publishing/Intercept, London,1119 pp.
6. Cheeke, P. R., 1971: Nutritional and physiological implica-tions of saponins. A Review. Canadian Journal of Animal Science, 51, 621—632.
7. Coldman, M. F., Gent, M., Good, W., 1969: The osmotic fragility of mammalian erythrocytes in hypotonic solution of so-dium chloride. Comp. Biochem. Physiol., 31, 329—331.
8. Dacie, J. V., 1954: The haemolytic anaemias. Congenital and acquired. churchill, London, 476 pp.
9. Dacie, J. V., Lewis, S. M., 1991: Practical Haematology, 7th edn., churchill Livingstone, London, 90 pp.
10. Fenwick, G. R., Price, K. R., Tsukamoto, C., Okubo, K., 1992: Institute of Food Research. Norwich Laboratory. publication No. 03249N, 285—326.
11. Gee, J. M., Johnson, I. T., 1988: Interaction between hae-molytic saponins, bile salts and small intestinal mucosa in the rat. Journal of Nutrition, 118, 1391—1397.
12. Igile, G. O., 1995: Phytochemical and Biological Studies on Some Constituents of Vernonia amygdalina (compositae) Leaves. phD thesis, University of Ibadan, Nigeria, 326 pp.
13. Jain, N. C., 1973: Osmotic fragility of erythrocytes of dogs and cats in health and in certain haematologic disorders. Cornell Veterinarian, 63, 411—423.
14. Jones, J., Elliot, P., 1969: Two rapid assays for saponin in individual alfalfa plants. Crop Science, 9, 688.
15. Lasisi, O. T., Soetan, K. O., Fafunso, M. A., Aiyelaagbe, O. O., 2003: Effects of condensed saponins on hatching of eggs of bovine gastrointestinal nematodes in vitro. Nigerian Veterinary Jour-nal, 24, 30—34.
16. Laszity, R., Hidvegi, M., Bata, A., 1998: Saponins in food. Food Review International, 14, 371—390.

8
17. Lee, S. W., Lee, J. S., Kim, Y. H., Jim, K. D., 1986: Effect of ginseng saponin on the Na+/K+ ATpase of dog cardiac sarcolem-ma. Arch. Pharm. Res., 9, 29.
18. Lindahl, I. L., Davies, R. E. and Tertel, R. T., 1957: Alfalfa Saponins: Studies on their chemical, pharmacological and physi-ological properties in Relation to Ruminant bloat. U. S. Dept. Agric. Tech. Bull., 116 pp.
19. Lower, E. S., 1985: Activity of the saponins. East Pharm., 28, 55.
20. March, B. E., Coates, V., Dielly, J., 1966: The effects of oestrogen and androgen on osmotic fragility and fatty acid com-position of erythrocytes in the chicken. Can. J. Physiol. Pharm., 44, 379—387.
21. Nishikawa, M., Nojim, S., Akiyama, T., Sankawa, U., Inove, K., 1984: Interaction of digitonin and its analogues with membrane cholesterol. J. Biochem., 96, 1231.
22. Oyewale, J. O., 1991: Osmotic fragility of erythrocytes of West African Dwarf sheep and goats: Effects of temperature and pH. Br. Vet. J., 147, 163—170.
23. Oyewale, J. O., 1992: changes in osmotic resistance of erythrocytes of cattle, pigs, rats and rabbits during variation in tem-perature and pH. J. Vet. Med. A, 39, 98—104.
24. Oyewale, J. O., 1993: Effect of storage of blood on the os-motic fragility of mammalian Erythrocytes. J. Vet. Med. Assoc., 40, 258—264.
25. Oyewale, J. O., 1994: further Studies on Osmotic Resis-tance of Nucleated Erythrocytes: Observations with pigeon, pea-fowl, Lizard and Toad Erythrocytes During changes in Tempera-ture and pH. J. Vet. Med. Assoc., 41, 62—71.
26. Poulsen, J. S., Surynek, D., 1977: Acid-base status of cattle blood. Sampling and storing. Nord. Vet. Med,. 29, 271—277.
27. Prankerd, T. A. J., 1961: The Red Cell. blackwell publica-tions. Oxford, England, 120 pp.
28. Schalm, O. W., Jain, N. C., Carroll, E. J., 1975: Veterinary Haematology. 3rd edn., philadelphia, Lea and febiger, 66—78.
29. Segal, R., Milo-Goldzwerg, I., Schupper, H., 1978: The susceptibility of cholesterol depleted erythrocytes to saponin and sapogenin haemolysis. Biochem. Biophys. Acta., 512, 223.
30. Soetan, K. O., Oyekunle, M. A., Aiyelaagbe, O. O., Fafunso, M. A., 2006: Evaluation of the antimicrobial activity of saponins extract of Sorghum bicolor L. Moench. African Journal of Biotechnol-ogy, 5, 2405—2407.
31. Srivastava, S. K., Srivastava, S. D., Srivastava, S., 2004: New terpenoidal saponins from Terminalia alata of biological sig-nificance. In Book of Abstracts, International Conference on Saponins, Phytochemistry and Application of Plant Saponins, pulawy, poland, 8—10 September, 117.
32. Tava, A., De Benedetto, M. G., Mella, M., Argentieri, M., Avato, P., Bialy Z., Jurzysta, M., 2004: chemical Investigation of saponins from medicago arborea. In Book of Abstracts International Conference on Saponins, Phytochemistry and Application of Plant Sa-ponins, pulawy, poland, 8—10 September, 122.
33. Van Der Wal, P. G., Hulshoe, H. G., van Essen G., 1981: changes in the acid-base parameters of venous porcine blood caused by the period of storage and the method of sampling. Vet. Quart., 3, 200—205.
34. Voutquenne, L., Chwalek, M., Ple, K., 2004: Synthesis of α-Hederin and related triterpenoid saponins: Influence of the sugar moiety on haemolytic activity. In Book of Abstracts International Conference on Saponins, Phytochemistry and Application of Plant Sa-ponins, pulawy, poland, 8—10 September, 124.
35. Voutquenne, L., Lavaud, C., Massiot, G., Le Men-Olivier, L., 2002: Structure-Activity Relationships of Haemolytic saponins. Pharmaceutical Biology, 40, 253—262.
Received October 17, 2009
9
ABSTRACT
Sixteen (16) West African Dwarf (WAD) goats, ages between 12—18 months, were used for this study. Animals were grouped into two groups: group A was infected with a fresh stock of Trypanoso-ma congolense (Gboko strain) intravenously at the rate of 1.0 × 10⁶; while group B served as an uninfected control. Samples between the infected and the uninfected controls showed very highly significant levels of sodium (Na), calcium (Ca), phosphate (PO4), and blood urea nitrogen (BUN) (P < 0.001) and lower levels of potassium (K), and bicarbonate (HCO3) (P < 0.001). Therefore, the alterations in the concentrations of these microminerals in the serum of goats may suggest that they may have played a possible role in the pathogenesis of caprine trypanosomosis due to T. congolense.
Key words: microminerals; pathogenesis; T. congolense; WAD goats
INTRODUCTION
African animal trypanosomosis constitutes a serious threat to the livestock production in Africa, especially in countries where Glossina (tsetse flies) are predominantly found (12, 17, 28 29). In Nigeria, as well as other countries in Africa, it is caused by Try-panosoma brucei brucei, T. congolense, T. simae and T. vivax, which infect cattle, sheep, goats, dogs, horses, camels and donkeys (18, 24). Sheep and goats, however, are seldom found infected with
THE MICROMINERALS IN SERUM OF WEST AFRICAN DWARF (WAD) GOATS INFECTED WITH TRypanOSOMa COnGOLenSe
Ameen, S. A.1, Joshua, R. A.2
Okewole, E. A.2, Fatokun, B. O.3
1Department of Animal Production and Health, LAUTECH, Ogbomoso, Oyo State 2Faculty of Veterinary Medicine, University of Ibadan, Ibadan
Nigeria3Department of Animal Production Technology, Federal College of Wildlife Management
New Bussa
trypanosomes under natural conditions. L o s o s and I k e d e (18) estimated that of all the diseases due to trypanosomoses in Africa, sheep and goats accounted for only 2 %. The low incidence rate may be due to their resistance to trypanosomes. However, over time, the prevalence rates have changed to 8.6 % for sheep and 8.1 % for goats (24) in Nigeria. In the Ogbomoso area of Oyo State, the prevalence rate in sheep, goats and cattle was 4.7 %, 3.5 % and 3.9 %, respec-tively (1).
It has been estimated that Nigeria has 22.1 million sheep and 35 million goats and the majority of the sheep and goats are found in the Northern rural areas, reared alongside cattle or with seden-tary farmers. These small ruminants may therefore serve as alterna-tives to tsetse flies during feeding in an infested area.
clinical manifestations of trypanosomosis in small ruminants are mainly the acute and chronic forms of the disease where anae-mia is the cardinal sign (18). Numerous physiological factors can be affected from diseases like trypanosomosis and can produce variation in micromineral concentrations in the blood of previously healthy sheep and cattle (20, 30). W e l l e d e et al. (32) showed that the serum iron and serum-iron binding capacity for cattle de-creased when infected with T. congolense. cattle infected with T. congolense showed an increase in the levels of serum iron (SI), total iron binding capacity (TIbc), plasma iron turnover rates (pITR) and plasma iron clearance (pIc). In treated animals, the SI and TIbc falls, with the level of SI returning to preinfection level faster than TIbc. G o d w i n (7) reported that, in trypanosomosis due to T. congolense in cattle, there was a loss of 40—45 % of the iron in cir-culation. However, S a r r o r (27) found that neither iron nor copper
fOLIA VETERINARIA, 54, 1: 9—13, 2010

10
deficiency played any important role in the pathogenesis of anae-mia in cattle infected with T. vivax and found no change in the levels of these microminerals in the serum of the cattle. copper levels may fluctuate but within the normal limits (2, 3, 14).
K a l u et al. (16) reported that the level of calcium in the serum of goats increased significantly during the acute stages of trypanoso-mosis. After chemotherapy, there were constant decrease levels of calcium, which was similar with the increase in total protein levels (15). A n o s a (2) reported a decrease in phosphate levels in cattle infected with T. congolense. The depression of calcium observed was thought to be due to thyroid gland damage. This study was carried out to determine the serum concentration of sodium, potassium, calcium, bicarbonate, phosphate and blood urea nitrogen of goats infected with T. congolense.
MATERIALS AND METHODS
Experimental DesignSixteen (16) WAD goats were used for this study. The dental
eruptions were used for the estimation of their ages. The goats were housed in a fly proof pen and fed with a variety of freshly cut grass supplemented with spent grains daily. T. congolense was obtained from the Nigerian Institute of Trypanosomiasis Research (NITR), Vom, Jos and was screened and passed in mice as de-scribed by L o s o s and I k e d e (18). The parasites were continually maintained in the mice until the donor animals were infected. Goats were inoculated with T. congolense as follows:
Group A There were eight animals in this group and each animal was
inoculated with 1.0 × 10⁶ parasites via the external jugular vein. The animals were treated with berenil® at the end of the 5th week post infection after the first wave of parasitaemia. The drug was given intramuscularly.
Group B This group of eight served as uninfected controls.
Blood samplingparasitological examinations were carried out with 2 ml of blood
collected via the external jugular vein in a bijou bottle with EDTA as the anticoagulant. The bleeding was done twice a week.
Serum collectionfive ml of blood was collected via the external jugular vein
from each animal in the different groups. Samples were collected on the same day with that for parasitological examinations. Serum was harvested in a sterilized bijou bottle and stored at -20 °c until required.
Micromineral concentrationsSerum sodium, calcium and potassium concentrations were
determined by flame photometry using Gallenkamp flame Analy-ser (fGA-330). Serum phosphate and bicarbonate were estimated according to T o r o and A c k e r m a n n (31). blood urea nitrogen concentrations were measured by continuous flow analysis using an autoanalyser (Technicon, UK).
Statistical analysisThe mean values are expressed as the mean ± standard devia-
tion for serum microminerals from the two groups of the experimen-tal animals as represented in the figures. Data obtained from the animals in the two experimental groups were compared statistically using Student t-test.
RESULTS
In this study there were changes in the serum micro nu-trients as a result of experimental T. congolense infection in the WAD goats. The mean period to detection of trypanoso-mes in the peripheral blood of goats following experimental infection was 7 days with initial value of 102.7 trypanosomes per ml. Thereafter, the goats exhibited fluctuating parasitae-mia with peaks of 107.8 trypanosomes ml-1 at 28 and 35 days, respectively (Table 1).
The mean serum sodium concentration of infected animals increased by 10.72 % (from pre-infective value of 138.00 ± 0.41 to 152.80 ± 0.52 mmol.l-1) (fig. 1), while that of potassium decreased by 32.14 % (from pre-infective value of 3.64 ± 0.02 to 2.47 ± 0.01 mmol.l-1) (fig. 2).
The mean serum calcium concentrations increased by 18.11 % (from pre-infective values of 9.00 ± 0.30 mmol.l-1 to 10.63 ± 0.03 mmol.l-1) (fig. 4). The mean serum bicarbonate concentration declined by 32.95 % (from pre-infective values of 24.43 ± 0.08 to 16.38 ± 0.05 mmol.l-1) (fig. 3), while the serum phosphate concentration increased by 38.27 % (from pre-infec-tive value of 3.58 ± 0.05 to 4.95 ± 0.03 mmol.l-1) (fig. 2) and the serum blood urea nitrogen increased by 6.37 % (from pre-infec-tive values of 20.73 ± 0.14 to 22.05 ± 0.03 mg.dl-1) (fig. 3).
Table 1. Mean Parasitaemia of
WAD goats infected with T. congolense
Days post-infectionParasitaemia
(log10 trypanosomes per ml of blood)
0 0
3 0
7 2.7
14 3.3
21 4.5
28 7.8
35 7.8
DISCUSSION
The serum microminerals have been studied by various workers in animals infected with T. congolense: in sheep infec-ted with T. congolense by J o s h u a et al. (14) and in Yanka-sa sheep infected with T. congolense by O g u n s a n m i et al. (22). In this study there were statistically significant increa-

11
ses (p < 0.001) in serum sodium, calcium, blood urea nitro-gen and phosphate concentrations up to 5th week between infected and their control groups and they correlated with the high peak of parasitaemia. This investigation has shown that goats are susceptible to experimentally induced T. congo-lense infections. The infectivity could have been enhanced by the passage in mice, as observed by J o s h u a (13). f i n n e s (8) and L o s o s et al. (18) associated trypanosomoses in cat-tle, sheep and goats with heavy parasitaemia, though it was not a constant finding. These studies have shown that anae-mia produced from trypanosome infection in goats may be related to the level of parasitaemia. However, parasitaemia fluctuated at intervals as described by J o s h u a (13). The in-creased serum sodium concentration may therefore, be due to failure of the Zona glomerulosa of the adrenal cortex to produce aldosterone hormone that regulates sodium in the extracellular fluid (23, 33).
The concentration of calcium in the infected animals was found to increase and it correlated with the high peak of parasitaemia. This agrees with earlier observations made by G o o d w i n and G u y (10), K a l u et al. (15) and O g u n s a n m i et al. (22). It is obvious that calcium in-creases in the serum but the source remains unclear; it could
be that, calcium ions from the extra cellular fluid that binds cell membranes together, along with ions in the serum which are partly mobile, elevated the concentration (9). This needs further investigation.
The phosphate (pO4) level was also found to fluctuate in
a similar pattern to that of calcium, but the increase in value was significant (p < 0.001) between infected and the controls. phosphate is found distributed in almost all organs of the body and plays a role in the production of ATp especially in muscles. During the course of the infection, there is a reduc-tion in the production of ATp, thus the probable increase of phosphate in the serum. A n o s a (2) suggested that calcium in conjunction with phosphorus depressed thyroid cells, but the actual roles of calcium and phosphorus during trypano-somosis are not yet known.
In this study there was an increase in the blood urea ni-trogen (bUN) in all infected groups but there were no signi-ficant differences with their corresponding controls. bUN is a by-product of protein catabolism. Increased bUN levels are consistent with the results from the infection of monkeys in-fected with T. b. rhodesiense (26) and humans infected with T. b. gambiense (28). bUN is a product cleared from the body through the kidneys and as such, its measurement du-
Fig. 1. Mean values of Na+ mmol.l-1 concentrations in WAD goats infected with T. congolense
Fig. 2. Mean values of K+ and PO4 concentrations in WAD goats infected with T. congolense
Fig. 3. Mean values of BUN mg.dl-1 and HCO3- mmol.l-1 concentrations
in WAD goats infected with T. congolenseFig. 4. Mean values of calcium concentrations (mmol.l-1)
in WAD goats infected with T. congolense

12
ring disease are good indicators of renal function (25). The causes of the elevated bUN levels include kidney diseases such as glomerulonephritis and excessive protein cataboli-sm and febrile conditions. fever and glomerulonephritis are common features of trypanosomosis and presumably act to-gether to elevate the bUN. Similar defects in renal function during trypanosomosis have been observed in man (5). In-deed, gross and histological changes affecting kidneys have been demonstrated in trypanosome-infected dogs (21) and humans (2, 3), which could explain the observed changes in kidney function in the present study.
A progressive decrease in serum potassium levels (hypo-kalemia) was observed in the infected animals. This may sug-gest a depletion of the body’s potassium stores or a redistribu-tion of potassium from the Ecf into the Icf space (6). Also, it may be due to excessive renal loss of potassium which re-sults from the action of mineralocorticoid excess and as the result of altered renal tubular function in infected animals with renal tubular acidosis or post obstructive states.
The mean serum bicarbonate levels in all infected goats were observed to have a sharp drop during the post infection period. This observation agreed with the report of b r o b s t (6) who reported a decreased in serum bicarbonate in T. brucei infected rabbits. However, our results disagree with G o d w i n (11) and O n y i a ( 23) who observed an ele-vated bicarbonate, but then a sharp drop on day 56 in T. bru-cei infected sheep. The sharp drop in the serum bicarbonate levels might be due to acidosis associated with anaemia, re-nal malfunction and the release of toxic metabolites such as free acids by Trypanosomes (2, 3).
In conclusion, T. congolense was found to be pathogenic to goats. The increase or decrease in micronutrients concen-trations fluctuated with peaks of parasitaemia. fever and glomerulonephritis are common features of trypanosomosis and presumably act together to elevate bUN and therefore, to some extent, an increase in the levels of bUN in this stu-dy may suggest or serve as a marker in clinical diagnosis of trypanosomosis although the actual roles played by these mi-crominerals in the pathogenesis of trypanosomosis due to T. congolense are not clear and therefore may need further investigation.
REFERENCES
1. Ameen, S. A., Joshua, R. A., Adedeji, O. S., Raheem, A. K., Akingbade, A. A., Leigh, O. O., 2008: preliminary studies on preva-lence of ruminant Trypanosomosis in Gbomoso area of Oyo state, Nigeria. Middle East Journal of Scientific Research, 3, 214—218.
2. Anosa, V. O, 1988a: Haematological and biochemical chang-es in human and animal trypanosomosis. part 1. Rev. Elev. Hed. Vet. Pays Trop., 41, 651—780.
3. Anosa, V. O., 1988b: Haematological and biochemical chang-es in humans and animals trypanosomiasis part II. Rev. Elev. Med. Vet. Pays Trop., 41, 151—164.
4. Awobode, H. O., 2006: The biochemical changes induced by natural human African trypanosome infections. Afric. J. Biotech., 5, 738—742.
5. Basson, W., Page, M. L., Myburgh, D. P., 1977: Human trypanosomiasis in Southern Africa. S. Afric. Med. J., 51, 453—457.
6. Brobst, D., 1986: Review of the pathophysiology of alterations in potassium homeostasis. J. Am. Vet. Med. Assoc., 188, 1019—1025.
7. Dargie, J. D., Murray, P. K., Grinshaw, W. R. T., McIntyre, W. I. M., 1979: The red cell kinetic of N’dama and Zebu cattle in-fected with T. congolense. parasitol., 78, 271—286.
8. Finnes, R. N. T. W., 1954: Haematological studies in try-panosomosis of cattle. Vet. Rec., 66, 423—434.
9. Georgievskii, V. I., Annenkov, B. N., Samokhin, V. T., 1982: The physiological roles of macro and microelements. In Mineral Nu-trition of Animals. butterworths, London, 91—215.
10. Goodwin, L. G., Guy, M. W., 1973: Tissue fluid in rabbits infected with Trypanosoma (Trypanozoon) brucei. Parasitol., 66, 499—513.
11. Godwin, L. G, 1974: The African Scene: trypanosomosis and Leishmaniasis. cIbA foundation, Associated Scientific pub., Am-sterdam, 107—119.
12. Irungu, P., Nyamwaro, S. O., Masiga, D. K., 2002: finan-cial implications of rearing sheep and goat under natural trypanoso-mosis challenge at Galana ranch, Kenya. Trop. Anim. Hlth. Prod., 34, 503—513.
13. Joshua, R. A, 1990: Association of infectivity, parasitaemia and virulence in a serodeme of T. congolense. Vet. Parasitol. 36, 303—309.
14. Joshua, R. A., Neils, J. S., Oladosu, L. A., 1994: Haemato-logic and serum mineral changes in sheep infected with T. congol-ense. In Proceedings of the 6th Congress of the ISACB. August 1994. Guelph, canada.
15. Kalu, A. U., Ikwuegbu, O. A., Edeghere, H. U., Ogbonnah, G. A., 1987: T. vivax in Nigerian goats: Effects of chemotherapy on serum constituents of Red Sokoto bucks. Nig. J. Anim. Prod., 14, 33—39.
16. Kalu, A. U., Ikwuegbu, O. A., Ogbonnah, G. A., 1989: Se-rum protein and electrolyte levels during trypanosome infection and following treatment in the West African dwarf goats. Bull. Anim. Health Prod. Afr., 37, 41—45.
17. Kristjanson, P. M., Swallow, B. M., Roulands, G. J., Krus-ka, R. L., de Leeuw, P. N., 1999 : measuring the cost of African ani-mal trypanosomosis, the potential benefits of control and returns to research. Agricult. Syst., 59, 79—98.
18. Losos, G. J., Ikede, B. O., 1972: Review of pathology of dis-ease in domestic and laboratory animals infected by T. congolense; T. vivax; T. brucei; T. rhodiesiense and T. gambiense. Vet. Pathol. (suppl.), 9,1—71.
19. Lumsden, W. H. R., Herbert, W. J., McNeillage, G. J. C., 1973: Techniques with Trypanosomes. churchill Livingstone. Edin-burgh, 183 pp.
20. Moodie, E. W., 1975: mineral metabolism. In The blood of sheep; composition and function. Ed.by blunt Springer-Verlag publi-cation, pp63—99.
21. Murray, M., Lambert, P. H., Morrison, W. I., 1975: Renal lesions in experimental trypanosomiasis. Med. Malad. Infect., 5, 638—641.
22. Neils, J. S., Joshua, R. A., Oladosu, L. A., 2006: Response of micronutrients in serum of sheep infected with T. congolense. Af-ric. J. Biotech., 5, 1259—1262.
23. Ogunsanmi, A. O., Akpavie, S. O., Anosa, V. O., 1994: Serum biochemical changes in West African dwarf sheep experi-
13
mentally infected with Trypanosoma brucei. Rev. Elev. Med. Vet. Pays Trop., 47, 195—200.
24. Onyia, J. A., 1997: African animal trypanosomosis: an overview of the current status in Nigeria. Trop. Vet., 15, 111—116.
25. Ramakrishnan, S., Prasannam, K. G., Rajan, R., 1995: bio-chemical evaluation and function test. In The Textbook of Medical Biochemistry. 495—509.
26. Sadun, E., Johnson, A., Nagle, R., Duxbury, R., 1973: Ex-perimental infection with African trypanosomiasis. V. pleminary parasitological, clinical, haematological, serological and pathologi-cal observations in rhesus monkeys infected with T. rhodesiense. Am. J. Trop. Med. Hyg., 22, 323—330.
27. Sarror, D. I., 1976: plasma copper levels in bovine trypano-somosis. Vet. Rec., 98, 196.
28. Shamaki, B. U., Yanan, E. G., Omotainse, S. O., Kalejaiye, J. O., Balak, G. G., Halid, I., 2002:. prevalence of ruminant try-panosomiasis and other blood parasites in some parts of plateau State of Nigeria. In Proceedings of the 39th Annual Congress of Nige-rian Veterinary Medical Association, Sokoto, October 2002, 87—89.
29. Swallow, B. M., 2002: Impact of trypanosomiasis on Agri-culture. PAAT Technical and Scientific Series, 2, 35—38.
30. Tartour, G., 1975: The variation with age of serum iron concentration and iron binding capacity in Zebu cattle. Res. Vet. Sci., 15, 389—391.
31. Toro, G., Ackermann, P. G., 1975: Practical Clinical Chemis-try. 1st ed., Little brown and co, Inc., boston, USA, 171—178.
32. Wellede, B. T., Preston, J. M., Kovatch, R. M., Higgs, J., Chumo, D. A., 1989: T. congolense: Erythrocytic indices, plasma iron turn-out and effects of treatment in infected cattle. Ann. Trop. Med. Parasitol., 83, 201—206.
33. Zilva, J. F., Pannall, P. N. P., 1954: Clinical Chemistry in Di-agnosis and Treatment, 4th ed., Lloyd-luke medical book Ltd, Lon-don, 185 pp.
Received October 20, 2009

14
fOLIA VETERINARIA, 54, 1: 14—18, 2010
ABSTRACT
West African Dwarf (WAD) goats were placed on three differ-ent levels of dietary energy (A = low; B = medium; C = high) and sub-sequently infected with a virulent strain of Trypanosoma congolense. The influence of these three different levels of dietary energy on para-sitaemia, body weight changes and haematological parameters were evaluated up to 5 weeks post infection (p. i). The respective high levels of parasitaemia and retarded growth rates were significant (P < 0.05) and more pronounced in group A than B or C. There were very highly significant reductions (P < 0.001) in the erythrocyte values (PCV, Hb and RBC) of infected goats in groups A, B and C than in the cor-responding uninfected controls, while the infected groups A, B and C were significantly different (P < 0.05) from one another in these erythrocyte values. The declines in the erythrocyte values were wors-ened with the decreasing levels of dietary energy and this indicated that the dietary energy influenced the susceptibility of WAD goats to experimental trypanosomosis.
Key words: erythrocyte values; dietary energy; susceptibility; Try-panosoma congolense; WAD goats
INTRODUCTION
Trypanosomosis which is transmitted by the tsetse fly (Glos-sina) is an important disease of man and other animals (23). It has
long been recognized as a major constraint to livestock production in tropical Africa. It is endemic in many parts of tropical Africa in-cluding Nigeria. Ruminant animals show considerable variation in their susceptibility to parasitic infections and the nutritional status of the host has been suggested as one of the possible causes of this variation (19).
Studies in cattle experimentally infected with T. congolense have demonstrated that the rate of the development of anaemia in cattle given ground nut cake supplementation was slower than in those that were not supplemented (8, 16). Similar observations were made by H e c k e r et al. (12) in Djallonke sheep exposed to high tsetse fly challenges. However, these results are at variance with those of A g y e m a n g et al. (2) on N’Dama cattle infected with trypanosomes. The blood-stream forms of some trypanosomes scavenge blood glucose as a source of energy (5). This may partly contribute to the development of hypoglycemia observed in some trypanosome-infected animals. Indeed, f a y e et al. (10) reported that the high energy demands of trypanosomes, infections may lead to severe energy shortage and this might be reflected in the changes in the energy and protein metabolism.
The stunting, debilitation and even death of the infected ani-mals results in great economic losses (19). It is well documented that patho-physiological alterations occur in the cellular and plasma components of blood during infections (18). African trypanosomo-sis are generally characterized by haematological and serum bio-chemical alterations, the severity of which are often determined by the strain of the infecting trypanosomes and the overall health of
THE INFLUENCE OF THREE DIFFERENT LEVELS OF DIETARY ENERGY ON THE SUSCEPTIBILITY OF WEST AFRICAN DWARF (WAD)
GOATS TO ExPERIMENTAL TRypanOSOMa COnGOLenSe INFECTION
Ameen, S. A.1, Joshua, R. A.2, Okewole, E. A.2, Adedeji, O. S.1
Raheem, A. K.3, Ojedapo, L. O.1, Amao, S. R.1
1Department of Animal Production and Health, Ladoke Akintola University of Technology, Ogbomoso Oyo State
2Department of Vet. Med. U. I., Ibadan3Department of Reproduction and Theriogeneology, Michael Okpara University of Agriculture, Umudike
Nigeria

15
the host animals (3). Dietary energy is known to modulate the se-verity of trypanosomal infections in animals, (9, 21) but this has not been fully substantiated in West African Dwarf goats. The present study investigated the influence of different levels of dietary energy on the susceptibility of West African Dwarf (WAD) goats to experi-mental T. congolense infection.
MATERIALS AND METHODS
Experimental Site The experiment was carried out at the large animal ward II,
Veterinary Teaching Hospital, faculty of Veterinary medicine, Uni-versity of Ibadan.
Experimental AnimalsA total of thirty six (36) adult male West African Dwarf (WAD)
goats were used. They were acclimatized for several weeks at the experimental site. They were treated against worm infestation, hae-moprotozoan diseases, such as babesiosis and trypanosomosis, as clinically indicated. pestes des petit ruminantum (ppR) vaccine was administered to all goats.
Grouping of AnimalsAfter the adaptation period, the goats were divided into three
experimental groups (A, b and c ) based on feed ration energy lev-els. Each group contained twelve goats. The animals were on these rations for 4 weeks before experimen tal infections were carried out. This was to create the desired differences in the nutritional sta-tus of the animals before the experimental infection. In each group, eight goats were infected with trypanosomes while the remaining four goats served as uninfected controls.
Animals in group A, b, and c were placed on low, medium, and high plane rations respectively based on different levels of dietary energy but isonitrogenous (the crude protein levels were the same). The composition of the rations and the proximate analyses of the feeds are given in Tables 1 and 2, respectively. feed was given based on 4.0 % of their body weight (maintenance ration) and water was provided ad libitum.
Infection with TrypanosomesThe Trypanosoma congolense parasites used in this experiment
were obtained from the National Institute for Trypanosomosis Research (NITR), Vom, Nigeria. Trypanosoma congolense (binchi bassa Strain) was obtained and subjected to six passages in albino mice, prior to use. The infected animals were inoculated intraperito-neally with equal numbers of Trypanosoma congolense at the rate of 1.0 × 10⁶ ml-1 in sterile saline. These experiments lasted 6 weeks.
HaematologyApproximately 5 ml blood samples were collected from the
jugular vein of the animals at pre and post parasite inoculations and evaluated for parasitaemia and haematological parameters. parasi-taemia was determined by haemocytometry described by H e r b e r t and L u m s d e n (13) and scored by p a r i s et al. (22). packed cell volume (pcV) was determined by the micro-haematocrit method; the haemoglobin concentration was measured by the cyanomethae-moglobin method; and the red blood cells (Rbc) were determined
with an electronic cell counter (counter coulter model Zf, coulter Electronic, Gr. britain) as described by J a i n (15).
Determination of body weightEach animal was put in a light bag and weighed on a hanging
weighing balance (Salter suspended model 285, made in England). prior to that, the weight of the light bag was determined. The weight of the animal was then obtained by the difference.
Statistical analysis and experimental designThe parasitaemia, body weight and haematological changes
were observed at pre and post infection. The data were statistically compared with the respective control groups by a one way analysis of variance (ANOVA) using software SpSS Vs 10. Duncan’s mul-tiple range tests were applied to compare the significance of differ-ences of groups (p < 0.05 and p < 0.001 were considered significant and very highly significant differences, respectively).
RESULTS
Parasitaemiaparasitaemia was first detected at day 7 post infection (p. i.) in all
the groups with log parasitaemia of 4.0 ± 0.13, 3.6 ± 0.05 and 3.2 ± 0.02 in all infected animals on low (A), medium (b) and high (c) levels of dietary energy respectively. The lowest parasitaemia level was found in the goats placed on a high (c) level of diet, while the highest level was observed in goats on the low (A) level of dietary energy as revealed by examination of the buffy coat. The parasitaemia persisted with the peak parasitaemia occurring on day 35 post infection (Table 3).
Body weight assessmentIn group A, the difference in the percentage of mean weekly
live weight gain of the infected animals and their corresponding controls was 48 %, while in group b it was 61 % and in group c it was 90 %. The difference of the body weight gain of the infected and their uninfected controls in A, b and c were significantly different (p < 0.05) (Table 4).
HaematologyAfter the appearance of the parasites in the peripheral blood
there was a decline in the group mean pcV values of the infected goats in all of the three groups. At post infection phase (week 0—5 p. i ), the percentage group mean fall in pcV values in group A was 50.65 % (from pre-infection value of 27.13 ± 0.08 to 13.39 ± 0.10 %). In group b, the percentage group mean pcV values fall was 37.79 % (from pre-infection value of 28.13 ± 0.025 to 17.50 ± 0.14 %). In group c, the percentage group mean pcV declined by 34.08 % (from pre-infection value of 27.38 ± 0.16 to18.05 ± 0.09 %).
The percentage group mean haemoglobin concentration of infected animals dropped by 45.50 % (from pre-infection value of 9.45 ± 0.02 to 5.15 ± 1.00) and by 36.65 % (from pre-infection value of 9.55 ± 0.20 to 6.05 ± 0.03) in groups A and b, respectively, while in group c, the percentage group mean haemoglobin concentration of infected animals dropped by 32.82 % (from pre-infection value of 9.08 ± 0.02 to 6.10 ± 0.05).
There was a fall in group mean Rbc counts of all infected goats in all of the three groups. In group A, the percentage group

16
mean Rbc counts dropped by 43.46 % (from pre-infective value of 12.38 ± 0.20 to 7.00 ± 0.20). In group b, the percentage group mean Rbc counts dropped by 47.79 % (from pre-infective value of 12.45 ± 0.31 to 7.30 ± 0.12) while in group c, the percentage group mean Rbc counts dropped by 38.89 % (from pre-infective value of 12.60 ± 0.02 to 7.70 ± 0.06 ).
When the group mean pcV, the group mean Hb concentration and the group mean Rbc values respectively in group A, b and c were compared with their corresponding control groups, there were very highly significant differences (p < 0.001). When the infected groups A, b and c were compared with one another in their respec-tive group mean pcV, Hb and Rbc values, there were significant difference (p < 0.05) (Tables 5, 6 and 7).
DISCUSSION
The present study showed that dietary energy had a mar-ked influence on parasitaemia, body weight changes and haematology during infections. The trypanosomal infections in these studies were characterised by an undulating parasi-taemia and the host goats did not reveal parasites in their peripheral blood until the 7th day post infection.
following the establishment of infection, infected ani-mals fed different levels of dietary energy experienced gre-ater retardation of growth than their control groups. These findings were in agreement with those of H e c k e r et al. (12) on Djallonke sheep and A g y e m a n g et al. (2) on N’Dama cattle exposed to natural fly challenges. The observation of more pronounced retardation of growth in the infected ani-mals on a low dietary energy level in the ration cannot be attributed to a decrease in the feed intake alone, but are due to the infection, as the growth rate of these infected animals were significantly lower than that of the control animals. It is of interest to note that by the 5th week post infection, goats
Table 1. Proximate analysis of diet offered to the WAD Goats
ComponentsRation
A B C
Dry matter % 72.95 75.25 77.57
crude protein % 13.17 13.26 13.35
Aether extract % 24.64 26.92 29.20
crude fibre % 16.82 16.82 16.81
Nitrogen free extract % 62.40 54.50 45.80
Total Ash % 3.60 11.60 15.20
calculated gross energy (kcal.kg-1)
2426.74 2548.57 2670.4
Table 2. Composition of rations offered to WAD Goats
Feed ingredientsPercentage of rations
A B C
panicuum maximum 20.00 15.00 10.00
Sun dried cassava 50.00 55.00 60.00
GNc 10.00 10.00 10.00
pKc 4.00 4.00 4.00
fish meal 65 % 4.25 4.25 4.25
Wheat offals 10.00 10.00 10.00
Oyster shells 1.00 1.00 1.00
Vitamin premix 0.50 0.50 0.50
Salt 0.25 0.25 0.25
Total 100.00 100.00 100.00
Table 3. Trypanosoma congolense parasitaemia (mean ± standard deviation)
in WAD goats kept on diets with different levels of dietary energy
LOGIOpARASITAEmIA Of DAYS p.I.
Planes of nutrition 0 7 14 21 28 35
Low (A) 04.0 ± 0.13
2.9 ± 0.02
6.8 ± 0.02
8.0 ± 0.05
8.5 ± 0.03
medium (b) 03.6 ± 0.05
3.0 ± 0.04
6.2 ± 0.03
7.0 ± 0.02
8.1 ± 0.03
High (c) 03.2 ± 0.02
2.7 ± 0.05
6.0 ± 0.03
6.8 ± 0.03
7.6 ± 0.02
The values are expressed as the mean ± standard deviation.
All uninfected control WAD goats were aparasitaemic through-out the period of study.
Table 4. The effect of experimental T. congolense infection on
WAD goats fed three different planes of nutrition: body weight change
Group Status No.
Body weight (kg)
Wk 1 Wk 5Weakly mean
weight gain
Overall weight gain
A
Inf. 88.0 ± 0.07
9.2 ± 0.07
0.24 ± 0.04a
1.2 ± 0.07
Non-inf. 47.5 ± 0.04
10.0 ±0.07
0.50 ± 0.03b
2.5 ± 0.08
b
Inf. 88.0 ± 0.06
10.2 ± 0.04
0.44 ± 0.04a
2.2 ± 0.04
Non-inf. 47.5 ± 0.04
10.5 ± 0.04
0.72 ± 0.05b
3.0 ± 0.08
c
Inf. 88.0 ± 0.05
12.0 ± 0.05
0.90 ± 0.06a
4.5 ± 0.06
Non-inf. 47.5 ± 0.04
12.5 ± 0.07
1.00 ± 0.06b
5.0 ± 0.08
The values are expressed as the mean ± standard deviation.a, b, c — the means in the same column followed by different superscripts differed significantly (p < 0.05) in infected and
control in group A, b and c

17
on low and medium energy rations had started to lose body weight, indicating that the feed consumed was no longer suf-ficient to meet the maintenance requirement in the state of infection with the parasites. This observation was similar to f a g b e m i et al. (9) in boars placed on different dietary ener-gy and infected with T. brucei. I l e m o b a d e and b a l o g u n (14) made a similar observation on pigs infected with a chro-nic disease-inducing strain of Trypanosoma simiae and ascri-
bed it to a combination of lowered voluntary feed intake and worsened feed conversion efficiency.
There were declines in the pcV, Rbc count and Hb con-centration in this study. It is obvious from the results that the reduction of these erythrocytic values were more pronounced in the group of goats on a low level of dietary energy and this agrees with the observations of f a g b e m i et al. (9) in boars placed on different dietary energy and infected with T. brucei. It is a well known fact that trypanosomosis causes anaemia (3, 4) and that the impairment of the re-utilisation of iron from degraded erythrocytes, as a result of blockage of reticuloendo-thelial iron release, results in decreased Rbc values (6, 7). It is therefore possible that (adequate) dietary energy is a require-ment for the re-utilisation of iron in trypanosomosis.
Another reason why the infected goats on low dietary levels resulted in a pronounced reduction in erythrocyte va-lues was that the kinetics of erythroid cells were affected due to changes in biochemical and metabolic pathways during erythropoiesis. The low levels of dietary energy causes inef-fective erythropoiesis with a prominent disorder of haeme, a pigment component of haemoglobin in the developing erythroid cells in the marrow.
Haeme is a planar molecule composed of the tetrapyrro-le protoporphyrin IX, containing a central ferrous molecule. The initial rate controlling step in the heme synthesis, the delta aminolevulinic acid (ALA) synthase (5-amino levulina-te synthase) reaction occurs within mitochondria. Glycine and the Krebs cycle intermediate succinyl-coA are utilized as substrates and vitamin b6 as pyridoxin phosphate is required as a cofactor. The ALA formed is transported to the cyto-plasm where a series of reactions results in the formation of coproporphyrinogen III, which must enter the mitochondria for the final steps in the haeme synthesis (11).
following synthesis, haeme must be transferred from the mitochondria to the cytoplasm for combination with the glo-bin chains to complete the synthesis of haemoglobin. Hae-me, therefore affects erythroid cell metabolism in different ways depending on the stage of the maturation process. The
Table 5. The effect of experimental T. congolense infection on WAD goats at different levels of dietary energy: changes in PCV
WkInfected
AControl
AInfected
BControl
BInfected
CControl
C
pre- infection
0 27.13 ± 0.08
27.45 ± 0.08
28.13 ± 0.25
27.42 ± 0.04
27.38 ± 0.16
27.87 ± 0.13
post-infection
125.86 ± 0.38
27.50 ± 0.13
25.78 ± 0.41
27.50 ± 0.10
26.13 ± 0.54
28.50 ± 0.72
221.23 ± 0.02
27.00 ± 1.20
21.95 ± 0.05
28.50 ± 1.80
23.15 ± 0.09
28.50 ± 1.88
318.63± 0.24
27.00 ± 0.02
20.05 ± 0.29
28.50 ± 0.02
22.25 ± 0.14
28.50 ± 1.50
416.20 ± 8.17
27.00 ± 0.04
19.13 ± 0.13
28.25 ± 0.87
19.75 ± 0.25
28.50 ± 0.30
513.39 ± 0.10b
27.00 ± 0.04
17.50 ± 0.14a
29.00 ± 0.30
18.05 ± 0.09a
28.50 ± 1.50
The values are expressed as the mean ± standard deviationa, b, c — the means in the same row followed by different superscript
differ significantly (p < 0.05) in infected A, b and c
Table 6. The effect of experimental T. congolense infection on WAD goats at different levels of dietary energy: changes in
haemoglobin concentration
WkInfected
AControl
AInfected
BControl
BInfected
CControl
C
pre-infec-tion
09.45 ± 0.02
9.5 ± 0.15
9.55 ± 0.20
9.55 ± 0.20
9.08 ± 0.08
9.20 ± 0.20
post-infection
18.13 ± 0.02
9.45 ± 0.20
8.25 ± 0.06
9.60 ± 0.03
8.45 ± 0.06
9.20 ± 0.01
27.50 ±
0.29.40 ± 0.01
7.40 ± 0.04
9.75 ± 0.06
7.48 ± 2.5
9.50 ± 0.05
36.25 ± 2.90
9.20 ± 0.02
7.25 ± 0.05
9.80 ± 0.10
7.15 ± 0.06
9.20 ± 0.02
45.70 ± 2.50
9.25 ± 0.05
6.25 ± 0.05
9.70 ± 0.88
6.48 ± 0.05
9.20 ± 0.04
55.15 ± 1.00b
9.00 ± 0.08
6.05 ± 0.03a
9.80 ± .005
6.10 ± 0.05a
9.20 ± 0.10
The values are expressed as the mean ± standard deviationa, b, c — the means in the same row followed by different superscript
differ significantly (p < 0.05) in infected A, b and c groups
Table 7. The effect of experimental T. congolense infection on WAD goats at different levels of dietary: changes in the RBC counts
WkInfected
AControl
AInfected
BControl
BInfected
CControl
C
pre-in-fection
012.38 ±
0.2012.65 ±
0.1512.45 ±
0.3112.60 ±
0.2012.60 ±
0.0212.65 ±
0.25
post-in-fection
111.15 ±
0.1712.00 ±
0.0011.50 ±
0.1012.90 ±
0.018.25 ± 2.50
12.70 ± 0.00
210.68 ±
0.0212.20 ±
0.0210.35 ±
0.0913.00 ±
0.008.25 ± 0.05
12.60 ± 0.00
39.35 ± 0.10
12.35 ± 0.05
7.35 ± 0.08
13.00 ± 0.00
8.05 ± 2.89
12.90 ± 0.00
48.23 ± 0.08
12.00 ± 0.00
6.80 ± 0.15
13.00 ± 0.00
7.85 ± 2.89
12.85 ± 0.05
57.00 ± 0.20
12.00 ± 0.00
6.50 ± 0.12
13.00 ± 0.00
7.70 ± 0.06
12.85 ± 0.05

18
higher the levels of succinyl.coA produced from the Krebs cycle, the higher the levels of haeme formed. Therefore, if the levels of dietary energy is low, the succinyl.coA produced from the Krebs cycle will be low and hence the haeme syn-thesis is affected and the production of haemoglobin in the erythroid cell will be affected and the levels of red blood cell production will be deminished.
The present study has shown that a high energy diet ame-liorates the effects of trypanosome infection on the growth rate. following patency, infected animals on different dietary levels developed different degrees of anaemia. This agrees with D w i n g e r et al. (8) who observed that the rate of the development of anaemia in N’Dama cattle inoculated with T. congolense and supplemented with extra groundnuts was slower than in unsupplemented cattle. However, their results disagree with the observation of similar degrees of anaemia in the low and high plane infected groups by the findings of A g y e m a n g et al. (2) in N’Dama cattle. In agreement with these reports, the present study showed that trypano-some establishment and the rate of development of anae-mia in trypanosome infected WAD goats is influenced by different dietary energy. This agrees with the observations of f a g b e m i et al. (9) in boars placed on different dietary energy and infected with T. brucei. from this study it was observed that the higher the level of dietary energy, the lower the level of susceptibility in caprine experimental trypanoso-mosis.
REFERENCES
1. Adah, M. I., Otesile, E. B., Joshua, R. A., 1993: Susceptibil-ity of Nigerian West African dwarf and Red Sokoto goats to a strain of Trypanosoma congolense. Vet. Parasitol., 47, 177—188.
2. Agyemang, K., Dwinger, R. H., Touray, B. N., Jeannin, P., Fofana, D., Grieve, A. S., 1990: Effects of nutrition on degree of anaemia and liveweight changes in N’Dama cattle infected with try-panosomes. Livest. Prod. Sci., 26, 39—51.
3. Anosa, V. O., 1988a: Haematological and biochemical chang-es in humans and animals trypanosomiasis part II. Rev. Elev. Med. Vet. Pays Trop., 41, 151—154.
4. Anosa, V. O., 1988b: Haematological and b iochemical changes in humans and animal trypanosomiasis part I. Rev. Elev. Med. Vet. Pays Trop., 41, 65—78.
5. Chaudhuri, M., Ott, R. D., Hill, G. C., 2006: Trypanosome alternative oxidase: from molecule to function. Trends Parasitol., 22, 484—491.
6. Dargie, J. D., Murray, P. K., Murray, M., Grimshaw, W. R. T., McIntyre, W. I. M., 1979a: bovine trypanosomiasis: the red cell kinetics of N’dama and Zebu cattle infected with Trypano-soma congolense. Parasitol., 78, 271—286.
7. Dargie, J. D., Murray, P. K., Murray, M., McIntyre, W. I. M., 1979b: The blood volumes and erythrokinetics of N’dama and Zebu cattle experimentally infected with Trypanosoma brucei. Res. Vet. Sci., 26, 245—247.
8. Dwinger, R. H., Clifford, D. J., Grieve, A. S., Kora, S., Bo-jang, M., 1990: Effect of nutritional level and body condition on
susceptibility of N’Dama cattle to Trypanosoma congolense infec-tion in the Gambia. Proc. of the Nutrition Society, 49, 209A.
9. Fagbemi, B. O., Otesile, G. B., Makinde, M. O., Akinboade, O. A., 1990: The relationship between dietary energy level and se-verity of Trypanosoma brucei infection in growing pigs. Vet. Parasi-tol., 35, 29—42.
10. Faye, D., Fall, A., Leak, S., Losson, B., Geerts, S., 2005: Influence of an experimental Trypanosoma congolense infection and plane of nutrition on milk production and some biochemical param-eters in West African Dwarf goats. Acta Trop., 93, 247—257.
11. Harvey, J. W., 2008: The Erythrocytes, physiology, metab-olism, and biochemical Disorder. In Vet. Clin. Biochem. of Domestic Animal, 6th edn,, Kaneko, 2008, pdf Adobe Reader.
12. Hecker, P. A., Coulibaly, L., Rowlands, G. S., Nagda, S. M., d’Leteren, G. D. M., 1991: Effect of plane of nutrition on trypano-some prevalence and mortality of Djallonke sheep exposed to high tsetse challenge. In Proceedings of the 21st Meeting of the Interna-tional Scientific Council for Trypanosomiasis Research and Control (ISCTRC), Yamoussoukro, cote d’Ivoire, October 1991, 177—184.
13. Herbert, W. J., Lumsdem, W. H. R., 1976: Trypanosoma brucei. A rapid “matching” method for estimating the hosts parasi-taemia. Exp. Parasitol., 40, 427—431.
14. Ilemobade, A. A., Balogun, T. F., 1981: pig trypanosomia-sis: effect of infection on feed intake, liveweight gain and carcass traits. Trop. Anim. Health Prod., 13, 128—136.
15. Jain, N. C, 1986: Schalm Veterinary Haematology, 4th edn., Lea and febiger, philadelphia, USA, 1221 pp.
16. Khaukha, G. W., Rasamany, R., 1981: Haemolytic activity of trypanosomes. East Afr. Med. J., 58, 907—911.
17. Luckins, A. G., 1992:Trypanosomosis in small ruminants: A major constraint to livestock production? Guest editorial. Br. Vet. J., 148, 471—473.
18. Makinde, M. O., Otesile, E. B., Fagbemi, B. O., 1991: Stud-ies on the relationship between dietary energy levels and the sever-ity of Trypanosoma brucei infection: the effects of diet and infection on blood and plasma volumes and erythrocyte osmotic fragility of growing pigs. Bull. Anim. Health Prod. Afr., 39, 161—166.
19. Murray, M., Dexter, T. M., 1988: Anaemia in bovine Afri-can trypanosomiasis. A review. Acta Trop., 45, 389—432.
20. Ogunsanmi, A. O., Akpavie, S. O., Anosa, V. O., 1994: Serum biochemical changes in West African dwarf sheep experi-mentally infected with Trypanosoma brucei. Rev. Elev. Med.Vet. Pays Trop., 47, 195—200.
21. Otesile, E. B., Fagbemi, B. O, Adeyemo, O., 1991: The ef-fect of Trypanosoma brucei infection in serum biochemical param-eter in boars on different planes of dietary energy. Vet. Parasitol., 40, 207—216.
22. Paris, J., Murray, M., McOdimba, F.A., 1982: A compara-tive evaluation of the parasitological techniques currently available for the diagnosis of African trypanosomiasis in cattle. Acta Trop., 39, 307—316.
23. Radostits, O. M., Gay, C. C., Hinchcliff, K. W., Constable, P., 2007: Veterinary Medicine, a Textbook of the Disease of Cattle, Horses, Sheep, Pigs and Goats. 10th edn., Sauder Elsevier, 1215—1216.
Received October 20, 2009
19
ABSTRACT
The effects of the lumbosacral epidural administration of 0.5 % bupivacaine (BUP), 2 % xylazine (xYL), and a mixture of 0.5 % BUP and 2 % xYL (BUP-xYL) were compared in five cats premedicated with an intramuscular injection of a mixture of atropine (0.04 mg.kg-1) and ketamine (10 mg.kg-1). Each cat was administered with each of 1 mg.kg-1 BUP, 3 mg.kg-1 xYL and 0.5 mg.kg-1 BUP — 1.5 mg.kg-1
xYL at one-week intervals. Selected anaesthetic indices were deter-mined. The associated changes in heart rate (HR), respiratory fre-quency (fR) and rectal temperature (RT) were also recorded over a 100 min period.
The time to onset of analgesia obtained with BUP (5.0 ± 1.0 min) and xYL (4.8 ± 0.4 min) were similar but significantly (P < 0.05) lon-ger than with BUP-xYL (3.9 ± 0.4 min). The duration of analgesia with BUP (79.4 ± 6.3 min) was significantly longer than with BUP-xYL (72.1 ± 3.5 min) but shorter than with xYL (92.7 ± 5.9 min). The duration of recumbency with BUP-xYL (110.6 ± 4.0 min) was significantly longer than with BUP (101.8 ± 6.8 min) but shorter than with xYL (147.4 ± 15.8 min). The time to walking with BUP-xYL (12.6 ± 2.5 min), xYL (9.6 ± 2.8 min) and BUP (14.4 ± 9.3 min) were similar. The mean values of HR, f
R and RT were significantly lower with BUP-xYL and xYL than with BUP over the observation period.
It was concluded that the epidurally administered BUP appears to be better than either xYL or BUP-xYL in critically ill animals consid-ering its long duration of analgesia, shorter duration of recumbency and rapid recovery period as well as stable rectal temperature and cardiopulmonary function.
Key words: bupivacaine; cats; epidural anaesthesia; mixture; xy-lazine
COMPARISON OF EPIDURAL ANAESTHESIA WITH BUPIVACAINE, xYLAZINE AND BUPIVACAINE-xYLAZINE MIxTURE IN CATS
Lawal, F. M., Adetunji, A.
Department of Veterinary Surgery and Reproduction, Faculty of Veterinary Medicine University of Ibadan, Ibadan
Nigeria
INTRODUCTION
The epidural nerve block is sometimes used as an alternative to general anaesthesia in well sedated or critically ill cats (14). How-ever, the search is ongoing for an ideal epidural drug or drug combi-nation that provide rapid onset and long lasting analgesia as well as rapid reversal of neural blockade at the end of the procedure with-out the development of adverse side effects in animals. The epidural administration of lignocaine (LIG) produces a rapid onset of action but it is of insufficient duration for performing major surgery in cats (1, 4, 7). Although similarly injected xylazine (XYL) produces long duration of analgesia, it is associated with a delayed onset of action and a depression of cardiorespiratory and thermoregulatory functions in the cat (1). furthermore, the epidural administration of bupivacaine (bUp) also reportedly produces slow onset but pro-longed duration of analgesia in dogs (2, 5, 10). In goats, A d e t u n j i et al. (3) have reported that the epidural administration of bUp combined with XYL (bUp-XYL) produced rapid onset and pro-longed duration of analgesia. To our knowledge, there are no similar reports on the use of the latter drug combination in cats.
The aim of this study was to evaluate and compare the effects of the epidural administration of bUp-XYL with bUp and XYL in cats, in terms of: time to onset; duration of analgesia; duration of re-cumbency; and time to walking. The associated changes in the heart rate (HR), respiratory frequency (f
R) and rectal temperature (RT)
were also recorded in the absence of any surgical procedure.
MATERIALS AND METHODS
Animals The protocol for this study was approved by the Animal care
and Use committee of the faculty of Veterinary medicine, Uni-
fOLIA VETERINARIA, 54, 1: 19—22, 2010
20
versity of Ibadan. five adult Nigerian local cats (three intact toms and two non-pregnant, non-lactating queens) weighing 1.9 ± 0.2 kg (mean ± SEm, range 1.6—2.7 kg) were used for the study. The animals were acquired from a cat market and only those with American So-ciety of Anesthesiology (ASA) physical status 1, based on the physi-cal examination findings, were selected for the study. The cats were housed singly in the catteries and were fed twice daily on cereal-based concentrate supplemented with fish meal ad libitum. fresh drinkable water was made available free choice. The animals were allowed a period of four weeks to get them familiar with their new environment, new feeding regime and constant human handling in readiness for the trials. Just before the start of the experiments, the cats were judged to be in good general health based upon the findings at; a complete physical examination, haemogram and serum chemical profile.
Study Design The cats were assigned to receive one of the following drug
treatments at one-week intervals. The first drug treatment involved the lumbosacral epidural administration of bUp; the second treat-ment involved similar administration of XYL, both at recommended doses. The third treatment involved similar administration of bUp-XYL at half the recommended doses of the component drugs. Se-lected anaesthetic indices were calculated for each treatment group. physiological variables were also measured immediately before the epidural administration of the drugs, and subsequently at 10-min intervals over a time period of 100 min as indicators of safety.
Experimental Protocol prior to each trial, food but not water was withheld from the cat
for 12 h. Each cat was weighed on the day of the trial, using a weigh-ing balance with a reading range of 0.0 kg to 20.0 kg. premedication of the cats consisted of an intramuscular injection of 10 mg.kg-1 of 5 percent ketamine hydrochloride (Ketamin, Laborate pharmaceuti-cal, India) and 0.04 mg.kg-1 of 0.1 percent atropine sulphate (Amopin, Ningbo chemicals International Trade corporation, china) mixed together in the same hypodermic syringe. After the loss of the right-ing reflex, a treated cat was positioned in sternal recumbency with the hindlimbs directed cranially. The lumbosacral space was located and aseptically prepared for epidural puncture. The anaesthetic solu-tion of choice was injected epidurally as previously described for cats (14). bupivacaine 1 mg.kg-1 (marcain Heavy 5 mg.kg-1; Astrazeneca, UK), XYL 3 mg.kg-1 (Xylax 20 mg.kg-1; farvet Laboratories, Holland) or bUp-XYL (0.5 mg.kg-1—1.5 mg.kg-1) was epidurally administered to each cat at one-week intervals. The treated cat remained in sternal recumbency throughout the duration of each trial. Analgesia was as-sessed with the aid of haemostatic forceps clamped to the first ratchet position on the cat’s hind toe-web immediately after the epidural in-jection and subsequently at two–min intervals until the return of the pain response.
Calculations for each treated cat, the following anaesthetic indices were re-
corded: 1. Time to onset of analgesia: time interval (in min) between the epi-
dural injection of the drug and the loss of pedal withdrawal reflex. 2. Duration of analgesia: time interval (in min) between the loss
and the reappearance of the pedal withdrawal reflex. 3. Duration of recumbency: time interval (in min) between the
ketamine-induced recumbency and the cat standing on its hindlimbs.
4. Time to walking: time interval (in min) between the cat’s ability to stand and walk on its hindlimbs.
Measurements In the course of each trial, HR, f
R and RT were measured im-
mediately before the epidural injection of the drug(s) (time 0 min) and subsequently at 10-min intervals over a time period of 100 min. Heart rate in beats/min was determined with the aid of a precordial stethoscope. Respiratory frequency in breaths/min was determined by visual observation of thoracic excursions and RT was measured in degrees celsius (0c) with the aid of a digital clinical thermometer.
Statistical AnalysisThe data are expressed as means ± SEm. Anaesthetic indices of
the epidurally administered bUp-XYL, bUp and XYL were com-pared using one way ANOVA followed by the bonferroni t procedure when a significant difference was indicated. physiological variables were compared using the analysis of variance (ANOVA) for repeated measures in each group to assess changes from control with time. Dunnett’s test was used as a post test (6). for all analyses, a value of p < 0.05 was considered statistically significant. The statistical pack-age NcSS 2004 (Lange/mcGraw-Hill, New York) was used (6).
RESULTS
Anaesthetic Indices The time to onset of analgesia obtained with bUp
(5.0 ± 1.0 min) and XYL (4.8 ± 0.4 min) were similar but signifi-cantly (p < 0.05) longer than with bUp-XYL (3.9 ± 0.4 min). Du-ration of analgesia with bUp (79.4 ± 6.3 min) was significantly longer than with bUp-XYL (72.1 ± 3.5 min) but shorter than with XYL (92.7 ± 5.9 min). The duration of recumbency with bUp-XYL (110.6 ± 4.0 min) was significantly longer than with bUp (101.8 ± 6.8 min) but shorter than with XYL (147.4 ± 15.8 min). The time to walking with bUp-XYL (12.6 ± 2.5 min), XYL (9.6 ± 2.8 min) and bUp (14.4 ± 9.3 min) were similar.
Physiological Variables The mean HR, f
R and RT for each of the three treatment
groups are shown in Tables 1 to 3. mean HR with bUp-XYL ranged from 114.8 ± 11.1 to 223.2 ± 21.1 beats/min, with bUp from 203.2 ± 14.9 to 227.2 ± 6.4 beats/min and with XYL from 90.4 ± 8.5 to 201.6 ± 18.7 beats/min. The ranges of the mean fR were from 20.0 ± 2.6 to 52.1 ± 7.4 breaths/min (bUp-XYL),
from 34.8 ± 6.3 to 61.6 ± 12.2 breaths/min (bUp) and from 21.6 ± 1.9 to 30.4 ± 2.0 breaths/min (XYL). The mean RT with bUp-XYL ranged between 37.4 ± 0.3 and 38.9 ± 0.3 °c, with bUp between 38.0 ± 0.1 and 38.4 ± 0.2 °c, and with XYL between 36.3 ± 0.4 and 38.3 ± 0.2 °c.
DISCUSSION
In general, cats tend to resist handling and thus require some form of chemical restraint (9). In this trial, to ensure
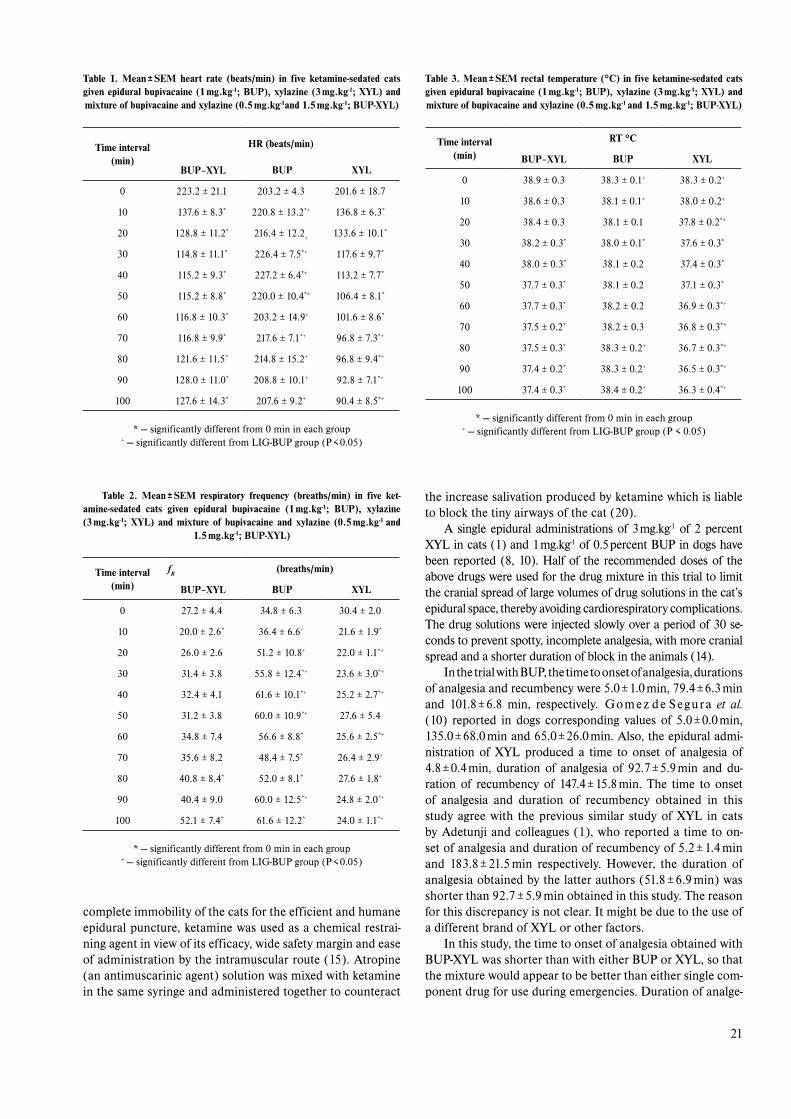
21
the increase salivation produced by ketamine which is liable to block the tiny airways of the cat (20).
A single epidural administrations of 3 mg.kg-1 of 2 percent XYL in cats (1) and 1 mg.kg-1 of 0.5 percent bUp in dogs have been reported (8, 10). Half of the recommended doses of the above drugs were used for the drug mixture in this trial to limit the cranial spread of large volumes of drug solutions in the cat’s epidural space, thereby avoiding cardiorespiratory complications. The drug solutions were injected slowly over a period of 30 se-conds to prevent spotty, incomplete analgesia, with more cranial spread and a shorter duration of block in the animals (14).
In the trial with bUp, the time to onset of analgesia, durations of analgesia and recumbency were 5.0 ± 1.0 min, 79.4 ± 6.3 min and 101.8 ± 6.8 min, respectively. G o m e z d e S e g u r a et al. (10) reported in dogs corresponding values of 5.0 ± 0.0 min, 135.0 ± 68.0 min and 65.0 ± 26.0 min. Also, the epidural admi-nistration of XYL produced a time to onset of analgesia of 4.8 ± 0.4 min, duration of analgesia of 92.7 ± 5.9 min and du-ration of recumbency of 147.4 ± 15.8 min. The time to onset of analgesia and duration of recumbency obtained in this study agree with the previous similar study of XYL in cats by Adetunji and colleagues (1), who reported a time to on-set of analgesia and duration of recumbency of 5.2 ± 1.4 min and 183.8 ± 21.5 min respectively. However, the duration of analgesia obtained by the latter authors (51.8 ± 6.9 min) was shorter than 92.7 ± 5.9 min obtained in this study. The reason for this discrepancy is not clear. It might be due to the use of a different brand of XYL or other factors.
In this study, the time to onset of analgesia obtained with bUp-XYL was shorter than with either bUp or XYL, so that the mixture would appear to be better than either single com-ponent drug for use during emergencies. Duration of analge-
Table 1. Mean ± SEM heart rate (beats/min) in five ketamine-sedated cats given epidural bupivacaine (1 mg.kg-1; BUP), xylazine (3 mg.kg-1; xYL) and mixture of bupivacaine and xylazine (0.5 mg.kg-1and 1.5 mg.kg-1; BUP-xYL)
Time interval (min)
HR (beats/min)
BUP–xYL BUP xYL
0 223.2 ± 21.1 203.2 ± 4.3 201.6 ± 18.7
10 137.6 ± 8.3* 220.8 ± 13.2*+ 136.8 ± 6.3*
20 128.8 ± 11.2* 216.4 ± 12.2+
133.6 ± 10.1*
30 114.8 ± 11.1* 226.4 ± 7.5*+ 117.6 ± 9.7*
40 115.2 ± 9.3* 227.2 ± 6.4*+ 113.2 ± 7.7*
50 115.2 ± 8.8* 220.0 ± 10.4*+ 106.4 ± 8.1*
60 116.8 ± 10.3* 203.2 ± 14.9+ 101.6 ± 8.6*
70 116.8 ± 9.9* 217.6 ± 7.1*+ 96.8 ± 7.3*+
80 121.6 ± 11.5* 214.8 ± 15.2+ 96.8 ± 9.4*+
90 128.0 ± 11.0* 208.8 ± 10.1+ 92.8 ± 7.1*+
100 127.6 ± 14.3* 207.6 ± 9.2+ 90.4 ± 8.5*+
* — significantly different from 0 min in each group + — significantly different from LIG-bUp group (p < 0.05)
Table 2. Mean ± SEM respiratory frequency (breaths/min) in five ket-amine-sedated cats given epidural bupivacaine (1 mg.kg-1; BUP), xylazine (3 mg.kg-1; xYL) and mixture of bupivacaine and xylazine (0.5 mg.kg-1 and
1.5 mg.kg-1; BUP-xYL)
Time interval (min)
fR (breaths/min)
BUP–xYL BUP xYL
0 27.2 ± 4.4 34.8 ± 6.3 30.4 ± 2.0
10 20.0 ± 2.6* 36.4 ± 6.6+ 21.6 ± 1.9*
20 26.0 ± 2.6 51.2 ± 10.8+ 22.0 ± 1.1*+
30 31.4 ± 3.8 55.8 ± 12.4*+ 23.6 ± 3.0*+
40 32.4 ± 4.1 61.6 ± 10.1*+ 25.2 ± 2.7*+
50 31.2 ± 3.8 60.0 ± 10.9*+ 27.6 ± 5.4
60 34.8 ± 7.4 56.6 ± 8.8* 25.6 ± 2.5*+
70 35.6 ± 8.2 48.4 ± 7.5* 26.4 ± 2.9+
80 40.8 ± 8.4* 52.0 ± 8.1* 27.6 ± 1.8+
90 40.4 ± 9.0 60.0 ± 12.5*+ 24.8 ± 2.0*+
100 52.1 ± 7.4* 61.6 ± 12.2* 24.0 ± 1.1*+
* — significantly different from 0 min in each group + — significantly different from LIG-bUp group (p < 0.05)
Table 3. Mean ± SEM rectal temperature (°C) in five ketamine-sedated cats given epidural bupivacaine (1 mg.kg-1; BUP), xylazine (3 mg.kg-1; xYL) and mixture of bupivacaine and xylazine (0.5 mg.kg-1 and 1.5 mg.kg-1; BUP-xYL)
Time interval (min)
RT °C
BUP–xYL BUP xYL
0 38.9 ± 0.3 38.3 ± 0.1+ 38.3 ± 0.2+
10 38.6 ± 0.3 38.1 ± 0.1+ 38.0 ± 0.2+
20 38.4 ± 0.3 38.1 ± 0.1 37.8 ± 0.2*+
30 38.2 ± 0.3* 38.0 ± 0.1* 37.6 ± 0.3*
40 38.0 ± 0.3* 38.1 ± 0.2 37.4 ± 0.3*
50 37.7 ± 0.3* 38.1 ± 0.2 37.1 ± 0.3*
60 37.7 ± 0.3* 38.2 ± 0.2 36.9 ± 0.3*+
70 37.5 ± 0.2* 38.2 ± 0.3 36.8 ± 0.3*+
80 37.5 ± 0.3* 38.3 ± 0.2+ 36.7 ± 0.3*+
90 37.4 ± 0.2* 38.3 ± 0.2+ 36.5 ± 0.3*+
100 37.4 ± 0.3* 38.4 ± 0.2+ 36.3 ± 0.4*+
* — significantly different from 0 min in each group
+ — significantly different from LIG-bUp group (p < 0.05)
complete immobility of the cats for the efficient and humane epidural puncture, ketamine was used as a chemical restrai-ning agent in view of its efficacy, wide safety margin and ease of administration by the intramuscular route (15). Atropine (an antimuscarinic agent) solution was mixed with ketamine in the same syringe and administered together to counteract

22
sia with the single component drugs were higher than with the mixture and this makes the single component drugs bet-ter in animals undergoing long duration procedures. Apart from the need for extended nursing care, the prolonged re-cumbency obtained with bUp-XYL and XYL is generally un-desirable in veterinary practices which handle day cases for reasons of limited in-patient facilities, financial constraints or inconveniences. prolonged recumbency could also lead to hypostatic congestion in an anaesthetised cat undergoing surgery; thus bUp would be preferable to either bUp-XYL or XYL in this regard.
both XYL and bUp-XYL produced reduced HR, fR and
RT more than with bUp (Tables 1—3). This agrees with the typical response of cats to the parenteral injection of alpha
2
agonists (1, 4, 19). A significant decrease in HR with XYL and bUp-XYL from 10-min to 100-min period observed in this trial (Table 1), agrees with the reports following both the intramuscular and intravenous administration of XYL. This is likely to be due to central absorption of XYL from the epidural space via the cerebrospinal fluid (14). A significant decrease in f
R obtained with XYL and bUp-XYL could also
be similarly explained. It has been reported that a reduction in f
R following the administration of clinically recommended
doses of XYL does not change the values of arterial pH, paO2
and pacO2 in dogs (16) and in cats (13). This suggests that
the decreased fR might be accompanied by an increased tidal
volume to maintain alveolar ventilation (12, 17). following the epidural administration of XYL and bUp-XYL, signifi-cant decreases in RT were observed from the 20-min and 30-min time intervals respectively till the end of the trials. This finding may relate to the depressant effect of alpha
2 agonist
on thermoregulation as previously reported in cats (19). The epidural administration of bUp produced increases
in the mean values of HR and fR
in this trial (Tables 1 and 2). This may relate to both the sympathomimetic effect of keta-mine and vagolytic effect of atropine which were left unop-posed or even exacerbated by the hypotensive effect of bUp (11). This supposition is supported by the finding of a recent study that low doses of ketamine were associated with signi-ficant increases in HR, mean and systolic blood pressure, paO
2 and temperature in cats (18).
In conclusion, bUp-XYL produced a shorter onset of analgesia than either bUp or XYL. Xylazine produced longer duration of analgesia than either bUp of bUp-XYL. However, prolonged recumbency, delayed recovery, hypothermia and cardiopulmonary depression make XYL and bUp-XYL unsu-itable for use in critically ill cats. The epidural administration of bUp appears to be better than either XYL or bUp-XYL in this regard considering its long duration of analgesia, shorter duration of recumbency and rapid recovery period as well as stable rectal temperature and cardiopulmonary function.
REFERENCES
1. Adetunji, A., Adewoye, C. O., Ajadi, R. A., 2002: compari-son of epidural anaesthesia with lignocaine or xylazine in cats. Vet. J., 163, 335—336.
2. Adetunji, A., Ajadi, R. A., Aladesawe, T. A., 2001: A com-parison of epidural anaesthesia with lignocaine, bupivacaine and li-gnocaine/bupivacaine mixture in dogs. Isr. J. Vet. Med., 56, 85—89.
3. Adetunji, A., Ajadi, R. A., Opia, R. E., 2002: A comparison of epidural anaesthesia with xylazine, bupivacaine and bupivacaine/xylazine mixture in West African dwarf goats. Isr. J. Vet. Med., 57, 75—81.
4. Adetunji, A., Nweke, R. I., Akinade, S. A., Ajao, O. A., 2003: comparison of epidural lignocaine and medetomidine in ketamine-sedated cats. Nig. Vet. J., 24, 111—116.
5. Cruz, M. L., Luna, S. P. L., Clark, R. M. O., Massone, F., Castro, G. B. 1997: Epidural anaesthesia using lignocaine, bupiva-caine or a mixture of lignocaine and bupivacaine in dogs. J. Vet. An-aesth., 24, 30—32.
6. Dawson, B., Trapp, R. G. 2004: Basic and Clinical Biostatis-tics, 4th ed., Lange medical publication/mcGraw Hill, New York.
7. Duce, B. R., Zelechowski, K., Camougis, G., Smith, E. R., 1969: Experimentalepidural anaesthesia in the cat with lignocaine and amethocaine. Brit. J. Anaesth., 41, 579—587.
8. Duke, T., Caulkett, N. A., Ball, S. D., Remedios, A. M., 2000: comparative analgesic and cardiopulmonary effects of bupi-vacaine and ropivacaine in the epidural space of the conscious dogs. Vet. Anaesth. Analg., 27, 13—21.
9. Dyson, D. H., Pascoe, P. J., Honeyman, V., Rahn, J. E. 1992: comparison of the efficacy of three premedicants to cats. Can. Vet. J., 33, 462—464.
10. Gomez de Segura, I. A., Menafro, A., Garcia-Fernandez, P., Murillo, S., Parodi, E. M., 2009: Analagesic and motor-blocking action of epidurally administered levobupivacaine or bupivacaine in the conscious dog. Vet. Anaesth. Analg., 36, 485—494.
11. Hall, L. W., Clarke, K. W., Trim, C. M., 2001: Veterinary An-aesthesia, 10th ed., Saunders W. b., London.
12. Haskin, S. C., Patz, J. D., Farver, T. B., 1986: Xylazine and xylazine/ketamine in dogs. Am. J. Vet. Res., 47, 636—641.
13. Haskin, S. C., Peiffer, R. L. Jr., Stowe, R. M., 1975: A clini-cal comparison of cT 1341, ketamine and xylazine in cats. Am. J. Vet. Res., 36, 1537—1543.
14. Jones, R. S. 2001: Epidural analgesia in the dog and cat: a review. Vet. J., 161, 123—131.
15. Jones, R. S., 1979: Injectable anaesthetic agents in the cat: a review. J. Sm. Anim. Pract., 20, 345—352.
16. Klide, A. M., Claderwood, H. W., Soma, L. R., 1975: cardio-pulmonary effects of xylazine in dogs. Am. J. Vet. Res., 36, 931—935.
17. Lavoie J. P., Pascoe, J. P., Kurpershock, C. J., 1992: Effects of xylazine on ventilation in horses. Am. J. Vet. Res., 53, 916—920.
18. Pascoe, P. J., Ilkiw, J. E., Craig, C., Kollias-Baker, C., 2007: The effects of ketamine on the minimum alveolar concentration of isoflurane in cats. Vet. Anaesth. Analg., 34, 31—38.
19. Ponder, S. W., Clarke, W. G., 1980: prolonged depression of thermoregulation after xylazine administration in cats. J. Vet. Pharmacol. Ther. 3, 203—207.
20. Wright, M., 1982: pharmacologic effects of ketamine and its use in veterinary medicine J. Am. Vet. Med. Assoc., 180, 1462—1471.
Received December 9, 2009

23
ABSTRACT
The aim of this experiment was to evaluate the concentration of micro-elements (Fe, Cu, and Zn) in blood serum and their excretion via milk, urine and faeces during the lactation of sows. Ten clinically healthy sows (crossbreed Large White x Landrace) were fed with the concentrated feed mixture (OŠ-09) during the entire lactation period. The blood serum, milk, urine and faeces samples were collected on the 7th, 14th, 21st, and 28th day after farrowing. During four weeks of lactation, we recorded the relatively stable concentrations of Fe, Cu and Zn in the blood serum, however the concentration of all these elements were determined to be marginally deficient. Similarly, the amounts of the studied micro-elements excreted via milk, urine and faeces (except the Zn in faeces) were also relatively stable. On the oth-er hand, the amount of Zn in the faeces was significantly decreased in the 3rd and 4th sampling in comparison to 1st and 2nd sampling. In conclusion, the supplementation of Fe, Cu and Zn into the diet for this category of animal is recommended because the dietary levels of Fe, Cu and Zn are not sufficient to maintain the appropriate micro-element levels of sows during the lactation phase.
Key words: blood serum; faeces; lactating sows; micro-minerals; milk; urine
INTRODUCTION
The critical stages in the mineral nutrition of the sow are during the late gestation and lactation (7). The main problem is that meta-bolic disturbances (which often manifest no clinical symptoms), induced by the inadequate feeding of mineral nutrients, may cause
CONCENTRATION OF Fe, Cu, AND Zn IN BLOOD SERUM, MILK, URINE AND FAECES OF LACTATING SOW
Novotný, J.1, Petrovič, V.2, Link, R.1, Hisira, V.2, Kováč, G.2
1Clinic of swine, University of Veterinary Medicine and Pharmacy, 041 81 Košice, Komenského 732Clinic of ruminants, University of Veterinary Medicine and Pharmacy, 041 81 Košice, Komenského 73
The Slovak Republic
the insufficient development of breeding sows and may impair their breeding performance (10).
The micro-elements (fe, cu, Zn) fulfil important structural, physiological, catalytic, and regulatory functions in animal bodies (14). They act particularly as components or activators of enzymes, co-enzymes, and hormonal mechanisms of animal bodies, affecting in this way the function of the cardiovascular, central nervous, im-mune, and reproductive systems (9).
The amount of micro-elements in the animal tissues, body fluids and excreta depends mostly on their: content in animal feed; their absorption; and the homeostatic control mechanisms of the body. Whereas, the mineral composition of sow’s milk is largely under genetic control, it is also influenced by the stage of lactation and litter size as well (7).
The aim of this study was to evaluate the concentration of fe, cu and Zn in the blood serum, milk, urine and faeces of lactating sows during four weeks after parturition.
MATERIAL AND METHODS
We used in our experiments, ten lactating sows (crossbreed Large White x Landrace) in the age 2.5—3.0 years (average count of suckling piglets — 12) with an average body weight of 220 kg. We studied them from the 7th day to the 28th day after farrowing. During four weeks, the sows were fed with the concentrated feed mixture (Oš-09) for the lactating pigs (Tajba a. s., SR). The diet was based on corn, soybean extracted ground meal, barley and wheat. In addition, Oš-09 contained per 1 kg of Dm: vitamin A 6000 U; vitamin D3 600 U; Nc 155 g; Df 70 g; lysine 7.5 g; treonine 4.5 g; methionine and cysteine 4.0 g; ca 7.0 g; p 5.0 g; Na 2.0 g; vitamin E
fOLIA VETERINARIA, 54, 1: 23—25, 2010
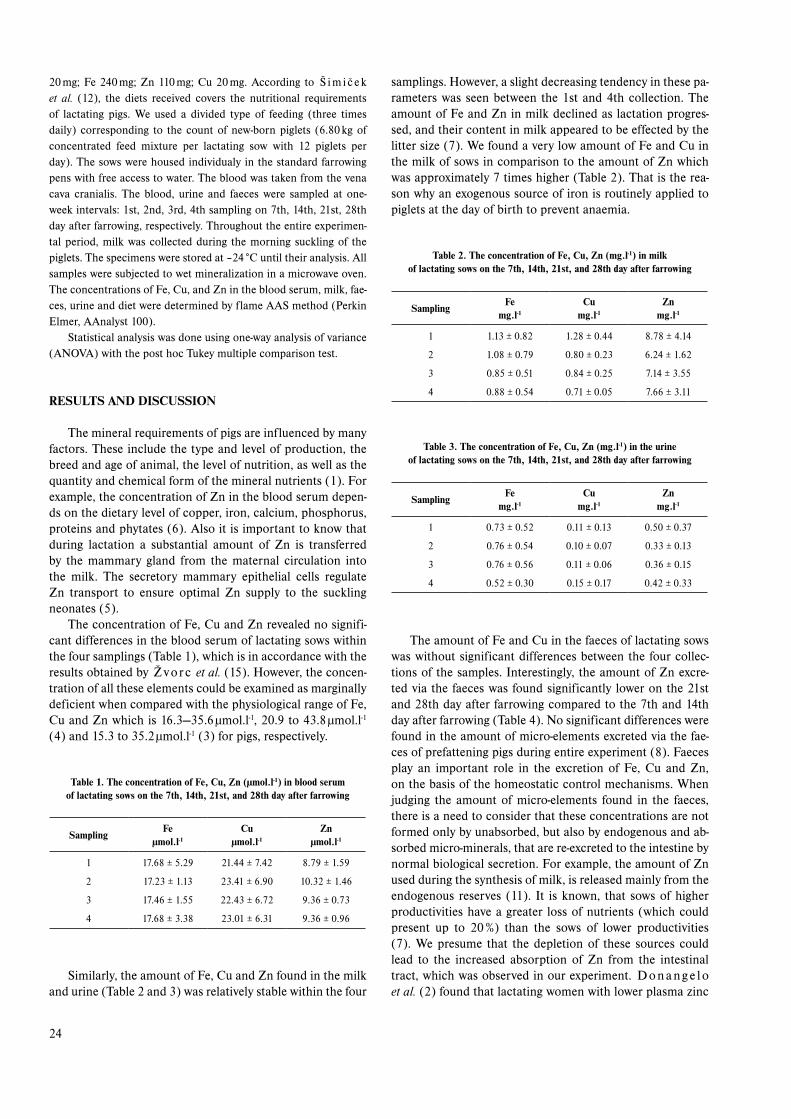
24
20 mg; fe 240 mg; Zn 110 mg; cu 20 mg. According to š i m i č e k et al. (12), the diets received covers the nutritional requirements of lactating pigs. We used a divided type of feeding (three times daily) corresponding to the count of new-born piglets (6.80 kg of concentrated feed mixture per lactating sow with 12 piglets per day). The sows were housed individualy in the standard farrowing pens with free access to water. The blood was taken from the vena cava cranialis. The blood, urine and faeces were sampled at one-week intervals: 1st, 2nd, 3rd, 4th sampling on 7th, 14th, 21st, 28th day after farrowing, respectively. Throughout the entire experimen-tal period, milk was collected during the morning suckling of the piglets. The specimens were stored at –24 °c until their analysis. All samples were subjected to wet mineralization in a microwave oven. The concentrations of fe, cu, and Zn in the blood serum, milk, fae-ces, urine and diet were determined by flame AAS method (perkin Elmer, AAnalyst 100).
Statistical analysis was done using one-way analysis of variance (ANOVA) with the post hoc Tukey multiple comparison test.
RESULTS AND DISCUSSION
The mineral requirements of pigs are influenced by many factors. These include the type and level of production, the breed and age of animal, the level of nutrition, as well as the quantity and chemical form of the mineral nutrients (1). for example, the concentration of Zn in the blood serum depen-ds on the dietary level of copper, iron, calcium, phosphorus, proteins and phytates (6). Also it is important to know that during lactation a substantial amount of Zn is transferred by the mammary gland from the maternal circulation into the milk. The secretory mammary epithelial cells regulate Zn transport to ensure optimal Zn supply to the suckling neonates (5).
The concentration of fe, cu and Zn revealed no signifi-cant differences in the blood serum of lactating sows within the four samplings (Table 1), which is in accordance with the results obtained by Ž v o r c et al. (15). However, the concen-tration of all these elements could be examined as marginally deficient when compared with the physiological range of fe, cu and Zn which is 16.3—35.6 µmol.l-1, 20.9 to 43.8 µmol.l-1 (4) and 15.3 to 35.2 µmol.l-1 (3) for pigs, respectively.
Table 1. The concentration of Fe, Cu, Zn (μmol.l-1) in blood serum of lactating sows on the 7th, 14th, 21st, and 28th day after farrowing
SamplingFe
μmol.l-1
Cuμmol.l-1
Znμmol.l-1
1
2
3
4
17.68 ± 5.29
17.23 ± 1.13
17.46 ± 1.55
17.68 ± 3.38
21.44 ± 7.42
23.41 ± 6.90
22.43 ± 6.72
23.01 ± 6.31
8.79 ± 1.59
10.32 ± 1.46
9.36 ± 0.73
9.36 ± 0.96
Similarly, the amount of fe, cu and Zn found in the milk
and urine (Table 2 and 3) was relatively stable within the four
samplings. However, a slight decreasing tendency in these pa-rameters was seen between the 1st and 4th collection. The amount of fe and Zn in milk declined as lactation progres-sed, and their content in milk appeared to be effected by the litter size (7). We found a very low amount of fe and cu in the milk of sows in comparison to the amount of Zn which was approximately 7 times higher (Table 2). That is the rea-son why an exogenous source of iron is routinely applied to piglets at the day of birth to prevent anaemia.
Table 2. The concentration of Fe, Cu, Zn (mg.l-1) in milk of lactating sows on the 7th, 14th, 21st, and 28th day after farrowing
SamplingFe
mg.l-1
Cumg.l-1
Znmg.l-1
1
2
3
4
1.13 ± 0.82
1.08 ± 0.79
0.85 ± 0.51
0.88 ± 0.54
1.28 ± 0.44
0.80 ± 0.23
0.84 ± 0.25
0.71 ± 0.05
8.78 ± 4.14
6.24 ± 1.62
7.14 ± 3.55
7.66 ± 3.11
Table 3. The concentration of Fe, Cu, Zn (mg.l-1) in the urine of lactating sows on the 7th, 14th, 21st, and 28th day after farrowing
SamplingFe
mg.l-1
Cumg.l-1
Znmg.l-1
1
2
3
4
0.73 ± 0.52
0.76 ± 0.54
0.76 ± 0.56
0.52 ± 0.30
0.11 ± 0.13
0.10 ± 0.07
0.11 ± 0.06
0.15 ± 0.17
0.50 ± 0.37
0.33 ± 0.13
0.36 ± 0.15
0.42 ± 0.33
The amount of fe and cu in the faeces of lactating sows was without significant differences between the four collec-tions of the samples. Interestingly, the amount of Zn excre-ted via the faeces was found significantly lower on the 21st and 28th day after farrowing compared to the 7th and 14th day after farrowing (Table 4). No significant differences were found in the amount of micro-elements excreted via the fae-ces of prefattening pigs during entire experiment (8). faeces play an important role in the excretion of fe, cu and Zn, on the basis of the homeostatic control mechanisms. When judging the amount of micro-elements found in the faeces, there is a need to consider that these concentrations are not formed only by unabsorbed, but also by endogenous and ab-sorbed micro-minerals, that are re-excreted to the intestine by normal biological secretion. for example, the amount of Zn used during the synthesis of milk, is released mainly from the endogenous reserves (11). It is known, that sows of higher productivities have a greater loss of nutrients (which could present up to 20 %) than the sows of lower productivities (7). We presume that the depletion of these sources could lead to the increased absorption of Zn from the intestinal tract, which was observed in our experiment. D o n a n g e l o et al. (2) found that lactating women with lower plasma zinc

25
concentrations had higher efficiencies of zinc absorption. moreover, the analyses of correlations between the blood serum, milk, urine and faeces did not reveal any significant relationships within the samplings and the combination of all these indexes should be used for the diagnostic purpose in the lactating sow.
Table 5. The concentration of Fe, Cu, Zn (mg.kg-1) in faeces of lactating sows on the 7th, 14th, 21st, and 28th day after farrowing
SamplingFe
mg.l-1
Cumg.l-1
Znmg.l-1
1
2
3
4
441.47 ± 95.85
377.08 ± 73.66
362. 53 ± 99.83
345.91 ± 116.75
31.80 ± 10.26
29.83 ± 9.27
20.96 ± 7.39
21.11 ± 15.72
148.57 ± 27.26a
150.75 ± 10.92a
100.84 ± 27.24b
106.04 ± 41.09b
In conclusion, based on the findings of the marginal de-ficient concentration of fe, cu and Zn in blood serum of lactating sow, the supplementation of these micro-elements into the diet for this category of animals is recommended. The significant decreased amount of zinc excreted via faeces, which was found during the last 2 weeks of lactation, could indicate its increased absorption in the intestine during this phase of lactation.
ACKNOWLEDGEMENT
The study was supported by Grant Agency for Science, VEGA of the Slovak Republic, Grant No. 1/0727/09.
REFERENCES
1. Close, W. H., Cole, D. J. A., 2000: minerals. In Nutrition of Sows and Boars. Nottingham University press, 97—123.
2. Donangelo, C. M., Zapata, C. L. V., Woodhouse, L. R., Shames, D. M., Mukherjea, R., King, J. C., 2005: Zinc absorption and kinetics during pregnancy and lactation in brazilian women. Am. J. Clin. Nutr., 82, 118—124.
3. Jagoš, P., Vrzgula, L., Illek, J., 1990: Interpretation of mineral profile (In Slovak). In Vrzgula et al.: Metabolic Disorders and Their Prevention in Farm Animals, bratislav, príroda, 473—476.
4. Kaneko, J., Harvey, J. W., Brus, M. L., 1997: Clinical Bio-chemistry of Domestic Animals, 5th edn., Academic press, califor-nia, USA, 890—893.
5. Kelleher, S. L., Lonnerdal, B., 2005: Zip 3 plays a major role in zinc uptake into mammary epithel cells and is regulated by prolactin. Am. J. Physiol. Cell. Physiol., 288, 1042—1047.
6. Mahan, D. C., 1990: mineral nutrition of the sow: A review. J. Anim. Sci., 68, 573—582.
7. Mahan, D. C., 2006: The changing mineral status of high producing sows. Proceedings Swine Nutrition Conf., Indianapolis, USA, 17—27.
8. Novotný, J., Seidel, H., Kováč, G., Bobček, R., 2005: bio-availability of trace elements in pigs. Medycyna weterynaryjna (polish Veterinary medicine), 61, 38—41.
9. Power, R., Horgan, K., 2000: biological chemistry and absorption of inorganic and organic trace metals. Proceedings Bio-technology and Feed Industry, 16th Annual Symposium, Nottingham University press, UK, 277—291.
10. Radostits, O. M., Gay, C. C., Blood, D. C., Hinchcliff, K. W., 2000: Diseases caused by nutritional deficiencies. In Veteri-nary Medicine, 9th edn, Saunders, London, 1477—1559.
11. Sian, L., Krebs, N. F., Westcott, J. E., Fengliang, L., Tong, L., Miller, L. et al., 2002: Zinc homeostasis during lactation in a population with a low zinc intake. Am. J. Clin. Nutr., 75, 99—103.
12. Šimeček, K., Zeman, L., Heger, J., 1994: Requirement of nutrients and nutritious value of feed for pigs (In Slovak). In Brest-enský et al.: Guide of Breeder, VÚŽV Nitra, SR,112—113.
13. Tumbleson, M. E., Scholl, E., 1981: Haematology and clini-cal chemistry. In Leman at al.: Diseases of Swine, Iowa State Univer-sity press, USA, 27—40.
14. Underwood, E. J., Suttle, N. F., 1999: The Mineral Nutrition of Livestock. commonwealth Agricultural bureaux, 3rd edn., mid-lothian, UK, 4—41.
15. Žvorc, Z., Mrljak, M., Sušić, V., Gotal, J. P., 2006: Hae-matological and biochemical parameters during pregnancy and lac-tation in sows. Vet. Arh., 76, 245—253.
Received December 11, 2009

26
fOLIA VETERINARIA, 54, 1: 26—31, 2010
ABSTRACT
Concentrations of the total mercury and selenium were determined in muscle tissue in the collection of 69 individuals of five species of non-predatory freshwater fish, common carp (Cyprinus carpio), crucian carp (Carassius carassius), bream (abramis brama), vimba (Vimba vimba) and barbel (Barbus barbus). The mean concentrations of the total mercu-ry were as follows: barbel (0.277 mg.kg-1) > crucian carp (0.063 mg.kg-1) > vimba (0.038 mg.kg-1) = bream (0.038 mg.kg-1) > carp (0.035 mg.kg-1) of the fresh weight of the muscle. The mean concentrations of the total selenium were as follows: vimba (0.335 mg.kg-1) > barbel (0.254 mg.kg-1) > carp (0.199 mg.kg-1) > crucian carp (0.122 mg.kg-1) > bream (0.119 mg.kg-1) of the fresh weight of the muscle. The muscle selenium concentration did not correlate with the corresponding total mercury concentration in four of the five fish species. There was a linear correlation (R2 = 0.647) between the Se content and the total mercury content in muscle tissue of Vimba vimba. All of the samples of Barbus barbus showed the total mercury concentrations exceeding the hygienic limit of Hg for nonpredatory fish.
Key words: abramis brama; Barbus barbus; Carassius carassius; Cyprinus carpio; fish; mercury; muscle; selenium; Vimba vimba
INTRODUCTION
for an assessment of the toxic effects of different pollutants in the aquatic environment, fish can be very important indicator organisms (19). A number of wide-ranging monitoring studies have been performed in order to estimate the degree of mercury contami-nation in freshwater ecosystems (12, 15, 31). fish have the ability
MERCURY AND SELENIUM CONCENTRATIONS IN MUSCLE TISSUE OF DIFFERENT SPECIES OF NONPREDATORY FRESHWATER FISH
Strapáč, I., Sokol, J., Žatko, D., Baranová, M.
University of Veterinary Medicine and Pharmacy, Komenského 73, 041 81 Košice The Slovak Republic
to accumulate mercury in relatively high concentrations in their tis-sues. The edible fish tissues are a major dietary source of this ele-ment. for most species, 60 to 90 % of the total mercury content is present as methylmercury (cH3Hg), the most toxic chemical form of this element (6). The human health hazard due to consumption of mercury contaminated fish is well known. methylmercury is known to cause neurotoxic effects in humans and animals via the food chain. The human Reference Dose (RfD) for methylmercury is estimated to be 1 × 10⁻⁴ mg.kg-1 body weight.day-1 (27). The toxicity of mercury is known to be highly dependent on its chemical form. Organomercury is generally more toxic than inorganic mercury salts. Studies have shown that a daily methylmercury intake of 0.48 µg.kg-1 body weight will not result in any detectable adverse effects. Ele-mentary mercury and insoluble HgS (cynnabar ore) are the least toxic. There are major mercury species in the environmental and biological samples as follows: elementary mercury (Hg°), mercuric ion (Hg2+), mercury ion (Hg+), mercury sulphide (HgS), organic mercury species as follows: methylmercury (cH
3Hg+), ethyl mercury
(cH3cH
2Hg+), phenylmercury (c
6H
5Hg+) and dimethyl mercury
(cH3HgcH
3). In the past organic mercury compounds were syn-
thesized commercially and applied as biocides (5). The monitoring of Hg in the tissues of edible fish is extremely important because consumption of contaminated fish has caused serious neurological damage to newborn babies and adults (5, 27).
Selenium is an essential micronutrient for humans and other animals, but may be toxic to organisms when present in the diet at concentrations slightly higher than levels required for nutrition. Se-lenium is a naturally occurring element, commonly found in rocks and soil. Natural sources of selenium include cretaceous marine sedimentary rocks, coal and other fossil fuel deposits. Selenium pol-lution in the environment is associated with a broad spectrum of

27
human activities (21). There is considerable evidence that selenium counteracts mercury toxicity in several animal species (13, 26). fish also accumulate significant amounts of selenium and, therefore, are an important dietary source of this element. Selenium uptake by fish occurs both directly from the water across the gills and all body surfaces and across the gut from their diet (11). for all species, 15 to 35 % of the total selenium content is in the form of selenate (Se6+). Occurrence of other water-soluble forms, such as selenite (Se4+), selenide (Se2-) or (Se°) is lower (6). The organic forms of Se, such as seleno-amino-acids, selenoproteins, enzymes, e.g. glutathione peroxidase (Gpx) are present in most of the living organisms (1, 9). Laboratory studies have shown that the organic forms of selenium, such as seleno-methionine have a higher bioaccumulation factor than the inorganic forms such as selenite and selenate (4). The data on the selenium content of freshwater fish from Eastern Slovakia rivers are not as extensive as they are for mercury.
The aim of this study was to determine the content of mercury and selenium in five species of nonpredatory freshwater fish living in the natural conditions of rivers and ponds in Eastern Slovakia and to follow up the correlation between these two elements in the muscle tissues of examined freshwater fish.
MATERIAL AND METHODS
Samples of Cyprinus carpio, Carassius carassius, Abramis brama, Vimba vimba and Barbus barbus were randomly obtained from vari-ous rivers (Laborec, Latorica, Hornád, Ondava, Torysa) and lakes (Domaša, Ružín, šírava). before analysis the samples of fish tis-sues (2 g of fresh tissue) were mineralized in nitric acid by micro-wave digestion. The concentration of the sample was 2 g per 25 ml 0.1 mol.dm-3 nitric acid. The best quality chemicals were used for the analysis (suprapure nitric acid, merck, Germany, and deionised wa-ter). The spectrometer was calibrated by metal standard solutions from merck (merck, Germany). The content of selenium was de-termined spectrometrically employing QZ UNIcAm 939 AA spec-trometer with Zeeman background correction from ATI UNIcAm (Ltd. cambridge, England) by the official methods used at the State Veterinary and food Institute in Košice cH-1.6 (22). The certified reference materials (bcR No 60 Trace elements in an aquatic plant Lagarosiphon major, community bureau of reference — bcR, brus-sels; and GbW07603, Institute of Geophysical and Geochemical Ex-ploration Langfang china) were used for the control of the analysis. The selenium detection limit was 0.003 mg.kg-1. The content of total mercury was determined by Advanced mercury Analyzer AmA 254 (ALTEc Ltd., cZ) directly in 100 mg portions of fresh fish tissues. The limit of detection for mercury was 0.002 mg.kg-1. The results are reported in mg.kg-1 fresh weight of fish muscle tissue.
RESULTS AND DISCUSION
The set of 69 samples of nonpredatory freshwater fish was analysed for the content of total mercury and selenium. The results are presented in Table 1.
Table 1. Total mercury and selenium content and Se/Hg ratio in nonpredatory freshwater fish muscle tissues
SpeciesHg
(mg.kg-1)Se
(mg.kg-1)Se/Hg
Common Carp min 0.001 0.001
Cyprinus carpio max 0.128 0.487
mean 0.035 0.199 5.69
SD 0.033 0.154
N 29 29
Crucian Carp min 0.001 0.014
Carassius max 0.239 0.354
carassius mean 0.063 0.122 1.94
SD 0.063 0.114
N 17 17
Bream min 0.007 0.015
Abramis brama max 0.117 0.242
mean 0.038 0.119 3.13
SD 0.042 0.071
N 12 10
Vimba min 0.014 0.088
Vimba vimba max 0.094 0.563
mean 0.038 0.335 8.82
SD 0.034 0.21
N 5 5
Barbel min 0.15 0.109
Barbus barbus max 0.376 0.474
mean 0.277 0.254 0.92
SD 0.107 0.124
N 6 6
Hyg. Limit 0.1 ND
The content of metals is expressed as mg.kg-1 fresh weight
SD — standard deviation; n — number of pieces; ND — not defined
The correlations between the concentrations of Hg and Se are illustrated in figures 1 to 5 and the relationship betwe-en the ratio Se/Hg and concentrations of Hg are illustrated in figures 6 to 10.
The content of the total mercury and selenium in the mu-scle tissues of the examined freshwater fish was not constant, but varied between the levels below the limit of detection (LOD) to the maximum levels, as shown in Table 1. The wide variation in muscle tissues in mercury and selenium content, reflect different levels of environmental mercury and selenium pollution (3, 6, 17, 28). Our results confirmed that mercury and selenium concentrations in samples of fish muscle tissues were very low, which correlated with other authors (6, 7, 14, 29). Č e l e c h o v s k á et al. (7) determined the mercury in the muscular tissue of Cyprinus carpio L. with a mean concentra-

28
tion 0.031 mg.kg-1 which is in good agreement with our results. Likewise, S p u r n ý et al. (29) and p e n a z et al. (24) publi-shed concentrations of mercury in muscular tissues of chub (Leuciscus cephalus) ranging between 0.078—0.139 mg.kg-1
and 0.14—0.22 mg.kg-1, respectively. J u r a d a (14) detec-
ted a concentration of mercury ranging between 0.08 and 0.195 mg.kg-1 in the muscle tissues of the chub in seven lo-calities of the morava River. Higher concentrations of total mercury and selenium were published for marine fish (6, 18, 28). Twelve of 69 analyzed samples exceeded the hygienic
Fig. 1. Correlation between contents of total mercury and selenium in Cypri-nus carpio muscle tissue
Fig. 2. Correlation between contents of total mercury and selenium in Caras-sius carassius muscle tissue
Fig. 3. Correlation between contents of total mercury and selenium in Abra-mis brama muscle tissue
Fig. 4. Correlation between contents of total mercury and selenium in Vimba vimba muscle tissue
Fig. 5. Correlation between contents of total mercury and selenium in Bar-bus barbus muscle tissue
Fig. 6. Relationship between concentrations of total mercury and Se/Hg ra-tio in non predatory fish muscle Cyprinus carpio

29
limit (0.1 mg.kg-1) for mercury in muscle tissue. There is no hygienic limit for selenium in fish tissues in the codex Ali-mentarius of the Slovak Republic (8). The concentration of Hg was below LOD in five samples (7.25 %) and concentra-tion of Se was below LOD only in two samples of Cyprinus carpio. fifteen (22.39 %) analyzed samples exhibited higher concentrations of Hg in comparison with concentrations of Se. The ratios of Se/Hg in these samples were below level one. Similar observation for freshwater species was noted by c a p p o n and S m i t h (6). fifteen (22.39 %) samples sho-wed concentrations of Se higher that 0.3 mg.kg-1. The mean concentration of Se was higher in samples of Cyprinus carpio, Carassius carassius, Abramis brama and Vimba vimba. The mean concentration of Hg was higher in samples of Barbus barbus. No correlations between the concentrations of total mercury and selenium in the examined fish species were observed (figure 1, 2, 3 and 5) but the sample from Vimba vimba showed some linear correlation between these para-meters (figure 4). R o b i n s o n and S h r o f f (28) did not find a significant correlation between the total Hg and Se concentrations in marine fish but we observed a correlation between the Se/Hg ratio and the concentration of total mer-
cury in muscle tissues of the examined fish species (figure 6, 7, 8, 9 and 10). These results were in good agreement with the results of other authors (16, 32). The fish living in the rivers and ponds highly contaminated with selenium (> 10 µg Se.l-1), and also marine fish, exhibited clear and strong an-tagonistic effect between Se and Hg in various tissues (20, 25, 28). The mercury exposure that might otherwise produce toxic effects is counteracted by selenium, particularly when the Se/Hg molar ratios approach or exceed 1 (25). The anta-gonistic interrelationship between selenium and mercury has been established in many studies (2, 10, 23, 30). The mecha-nisms of the antagonistic interactions between selenium and mercury have not been fully understood.
CONCLUSION
The mercury level in 12 of 69 examined samples exce-eded the hygiene limit for Hg. The content of selenium in the muscle tissue of nonpredatory freshwater fish from rivers and lakes of Eastern Slovakia was relatively low. No corre-lation between the concentration of the total mercury and
Fig. 7. Relationship between concentrations of total mercury and Se/Hg ratio in nonpredatory fish muscle Carassius carassius
Fig. 8. Realtionship between concentrations of total mercury and Se/Hg ra-tio in nonpredatory freshwater fish muscle Abramis brama
Fig. 9. Relationship between concentrations of total mercury and Se/Hg ra-tio in nonpredatory freshwater fish muscle Vimba vimba
Fig. 10. Relationship between concentrations of total mercury and Se/Hg ratio in nonpredatory freshwater fish muscle Barbus barbus

30
selenium in the examined fish species was observed. Only the Vimba vimba species showed some linear correlation. There was a logarithmic relationship between the Se/Hg ra-tio and the total Hg concentration. Approximately 77.6 % of the analysed fish samples contained more Se that Hg (ratio Se/Hg > 1). This parameter exhibited high heterogeneity as it ranged from 0.15 in the samples of Abramis brama to 163 in the samples of Carassius carassius. Our results suggested that 77.6 % of freshwater fish were protected by selenium against Hg toxicity, but this is only an assumption.
ACKNOWLEDGEMENTS
This study was funded by grant VEGA No. 1/0472/09.
REFERENCES 1. Arteel, G. E., Sies, H., 2001: The biochemistry of selenium
and the glutathione system. Environ. Toxicol. Pharmacol., 10, 153—158. 2. Beijer, K., Jernelöv, A., 1978: Ecological Aspects of mercu-
ry-Selenium Interactions in the marine Environment. Environmen-tal Health Perspectives, 25, 43—45.
3. Belzile, N., Chen, Y. W., Gunn, J. M., Tong, J., Alarie, Y., Delonchamp, T., Lang, C. Y., 2006: The effect of selenium on mer-cury assimilation by freshwater organisms. Can. J. Fish. Aquat. Sci., 63, 1—10.
4. Besser, J. M., Canfield, T. J., LaPoint, T. W., 1993: bioac-cumulation of organic and inorganic selenium in a laboratory food chain. Environ. Toxicol. Chem., 12, 57—72.
5. Burger, J., Gochfeld, M., Shucla, T., Jeitner, C., Burke, S., Donio, M., Shukla, S., Snigaroff, R., Snigaroff, D., Stamm, T., Volz, C., 2007: Heavy metals in pacific cod (Gadus macrocephalus) from the Aleutians: Location age, size and risk. J. Toxicol. Environ. Health A, 70, 1897—1911.
6. Cappon, C. J., Smith, J. C., 1981: mercury and Selenium content and chemical form in fish muscle. Arch. Environm. Con-tam. Toxicol., 10, 305—319.
7. Čelechovská, O., Svobodová, Z., Žlábek, V., Macharáčková, B., 2007: Distribution of metals in Tissues of the common carp (Cyprinus carpio L.). Acta Veterinaria Brno, 76, S93—S100.
8. Codex Alimentarius of the Slovak Republic: part two chapter 10, contaminants in foods, part A, chemical elements, Directive of the ministryof Agriculture SR and ministry of Health SR from 15th march, 2004 No. 608/3/2004-100, notified under document chap-ter 10 of codex Alimentarius SR having regard to contaminants in foods directive No. 3372/2004-100 from 17th January, 2005, en-closed in directive No. 18558/2006-SL part A, chemical elements, from 11th September, 2006 (In Slovak).
9. Fournier, E., Adam, C., Massabuau, J. C., Garnier-Laplace, J., 2005: Effect of selenium exposure on the freshwater bivalve cor-bicula fluminea. Radioprotection, Suppl., 1, 40, S3—S9.
10. Ganther, H. E. and Sunde, M. L., 1974: Effect of tuna fish and selenium on the toxicity of methylmercury: A progress report. J. Food Sci., 39, 1—7.
11. Hodson, P. V. and Hilton, J. W., 1983: The nutritional re-quirements and toxicity to fish of dietary and waterborne selenium.
In Environmental Biogeochemistry, Hallberg, R. ed., Ecological bul-letin, 35, 335—340.
12. Ikigura, J. R., Akagi, H., Majumba, J., and Messo, C., 2006: Environmental assessment Of mercury dispersion, transfor-mation and bioavailability in the Lake Victoria Goldfields, Tanza-nia. J. Environ. Manag., 81, 167—173.
13. Iwata, H., Okamoto, H., Ohsawa, Y., 1973: Effect of se-lenium on methylmercury poisoning. Res. Commun. Chem. Pathol. Pharmacol., 5, 673—681.
14. Jurada, P., 1999: Pollutants in Fish of the Morava and Dyje Rivers (In czech). Technical report of the Institute of Vertebrate biology, Academy of Sciences of the czech Republic, brno, 13 pp.
15. Jwett, S. C. and Duffy, L. K., 2007: mercury in fishes of Alaska, with emphasis on subsistence species. Sci. Total Environ., 387, 3—27.
16. Kai, N., Ueda, T., Takeda, M., Kataoka, A., 1983: On mer-cury and Selenium in Tuna fish Tissues — VIII The Levels of mer-cury and Selenium in Albacore from the Indian Ocean. The Journal of Shimonoseki University of Fisheries, 31, 69—73.
17. Kari, T. and Kauranen, P., 1978: mercury and selenium contents of seals from fresh and brackish waters in finland. Bull. Environ. Contam. Toxicol., 19, 273—278.
18. Kimáková, T., Bernasovská, K., 2007: On fish consumption (In Slovak). HYGIENA, Journal for protection and support of health., 52, 78—79.
19. Kime, D. E., Ebrahimi, M., Nysten, K., Roelants, I., Moore, H. D. M., Ollevier, F., 1996: Use of computer assisted spremanaly-sis (cASA) for monitoring the effects of pollution on sperm quality of fish; application to effects of heavy metals. Aquat. Toxicol., 36, 223—237.
20. Kojadinovic, J., Potier, M., LeCore, M., Cosson, R. P., Busta-mante, P., 2007: bioaccumulation of trace elements in pelagic fish from the Western Indian Ocean. Environ. Pollut., 146, 548—566.
21. Lemly, A. D., 2004: Aquatic selenium pollution is a global environmental safety issue. Ecotoxicol. Environ. Safety, 59, 44—56.
22. Official standard methods used by ŠVaPU Košice, 2004: cH—1. 6. Bulletin of the Ministry of Agriculture of SR (In Slovak), Vol. XXXVI, part 1, 9th January.
23. Parizek, J., Ostadalova, J., 1967: The protective effect of small amounts of selenite on sublimate intoxication. Experientia, 23, 142—149.
24. Penaz, M., Svobodova, Z., Hejtmanek, M., Trnkova, J., Wohlgemuth, E., 1980: mercury content in the basic components of the ecosystem of the Jihlava River. Bull. of the Research Institute of Fishery and Hydrobiology, Vodňany, 24—30.
25. Peterson, S. A., Ralston, N. V. C., Peck, D. V., Van Sickle, J., Robertson, J. D., Spate, V. L., Morris, J. S., 2009: How might selenium moderate the toxic effects of mercury in stream fish of the Western U. S. Environ. Sci. Technol., 43, 3919—3925.
26. Potter, S., Mattrone, G., 1974: Effect of selenite on the toxic-ity of dietary methylmercury and mercuric chloride in the rat. J. Nutr., 101, 638—647.
27. Ramirez-Perez, T., Sarma, S. S., and Nandini, S., 2004: Ef-fect of mercury on the life table demography of the rotifer Brachio-nus calyciflorus Pallas (Rotifera). Ecotoxicology, 13, 535—544.
28. Robinson, J., Shroff, J., 2004: Observations on the levels of total mercury (Hg) and selenium (Se) in species common to the artisanal fisheries of Seychelles. SMDJ Seychelles Medical and Den-tal Journal, Special issue, 7, 56—60.

31
29. Spurný, P., Mareš, J., Hedbávný, J., Sukop, I., 2002: Heavy metal distribution in the ecosystems of the upper course of the Ji-hlava River. Czech J. Anim. Sci., 47, 160—167.
30. Stoewsad, G. S., Bache, C. A., Lisk, D. J., 1974: Dietary se-lenium protection of methylmercuryintoxication of Japanese Quail. Bull. Environ. Contam. Toxicol., 11, 152—159.
31. Taherianfard, M., Ebrahimi, M., Soodbakhsh, S., 2008: bioaccumulation of mercury in fishes of Kor River. Aust. J. Basic & Appl. Sci., 2, 904—908.
32. Ueda, T., Takeda, M., 1983: mercury and Selenium Level in Two Species of Sharks. Bulletin of the Japanese Society of Scien-tific Fisheries, 49, 1731—1735.
Received December 16, 2009

32
ABSTRACT
The endometrium in bitches undergoes marked micro-morphologi-cal changes during individual phases of the oestrous cycle. The sections of the uterine bodies of Beagle bitches were histologically observed in the proliferative (n = 5) and the secretory (n = 5) phases of the canine uterine cycle by the image analysis system LUCIA G 4.71. The endo-metrium in the proliferative phase is significantly thinner than in the secretory phase (669.9 ± 62.6 μm vs. 888.8 ± 9.4 μm; P < 0.05). The endometrium is covered by a relatively low simple columnar epithelium. The individual cells of this surface epithelium have a larger centrally placed nucleus and darker cytoplasm during the proliferative phase when compared with the secretory phase. In the secretory phase, the surface columnar epithelium is significantly higher (25.0 ± 1.0 μm vs. 9.5 ± 0.7 μm; P < 0.05). Its cells are markedly larger with lighter cyto-plasm and a small eccentrically situated nucleus with pycnotic bodies. These do not exfoliate into the uterine lumen. In the proliferative phase there are few straight tubular glands exhibiting patent lumens and they are situated mainly in the deeper portion of the tissue. The number of tubular glands is significantly lower than that during secretory phase (P < 0.05). The length and diameter of the tubular glands are nearly the same in both phases of the uterine cycle.
Key words: bitch; endometrium; oestrus cycle; proliferative phase; secretory phase
INTRODUCTION
The canine uterus, as in other domestic animals, undergoes marked micro-morphological changes during the individual phases
of the oestrous cycle. The endometrium consists of a simple colum-nar epithelium, resting on a layer of connective tissue (the stroma), which varies in thickness according to hormonal influences. The simple tubular uterine glands extend from the endometrial surface to the base of the stroma, which also demonstrates a rich blood sup-ply of spiral arteries.
In the follicular phase of the ovaries, when the follicles grow and produce estrogens, a proliferative phase of the uterine cycle oc-curs. The endometrium proliferates; both the number and length of the uterine glands increase (18, 2). Numerous mitoses of fibrocytes and epithelial cells of the uterine glands can be seen in the lamina propria mucosae (16, 15). The surface epithelial cells are of a convex shape and have irregular microvilli (6).
Immediately after ovulation of the Graafian follicles, the secre-tory phase of the uterine cycle begins. It is typical for the presence of a corpus luteum (cL) on the ovarian surface (luteal phase) and specific changes in the endometrium which are under the action of progesterone produced by the cL. At the beginning of this phase, a larger amount of glycogen is produced in the basal part of the epi-thelial cells. This results in forcing the cellular nuclei closer to the epithelial surface. before that, the glycogen is found in the apical part of the cytoplasm in the epithelium of the uterus and the uter-ine glands. The endometrium enlarges markedly as a result of the hypertrophy of the uterine glands and the secretions that accumu-late inside. This secretion consists mostly of glycogen, lipids, and mucus. The glands get wider and their shapes change so that they ramify in a spiral nature near their opening. In carnivores, these changes are not so marked. In addition to the uterine glands, in the mucous membrane there are also the uterine crypts (0.1—0.2 mm deep), which are of the same constitution as the uterine glands, but smaller (18, 2).
CHANGES OF THE CANINE ENDOMETRIUM DURING PROLIFERATIVE AND SECRETORY PHASES OF THE OESTROUS CYCLE
Vlčková, R., Vojteková, N., Sopková, D., Ondrašovičová, S.
Institute of Physiology of Department of Anatomy, Histology, and Physiology University of Veterinary Medicine and Pharmacy, Komenského 73, 041 81 Košice
The Slovak Republic
fOLIA VETERINARIA, 54, 1: 32—36, 2010

33
In the secretory phase, the surface epithelial cells appear more flat. At the beginning of metoestrus, the microvilli begin to abbrevi-ate progressively and at the end of this period their numbers de-crease. microvilli are lacking completely by the end of metoestrus. The length of the metoestrous phase is influenced by the function of the cL. The production of progesterone lasts for a period of 40–90 days (3, 12, 13).
Only in carnivores there is a stromal layer (stratum subglan-dulare) between the glands and myometrium (which is without glands). The uterine glands are oriented obliquely to the surface of the mucous membrane (8, 18, 2).
If fertilization of the released egg does not occur, then the re-gressive phase begins. The preparation of the endometrium does not occur. The secretion of the uterine glands slowly subsides and gly-cogen disappears from the epithelial cells. The lumen of the glands gets smaller, the length shortens and the thickness of the endome-trium decreases back to the level at the beginning of the proliferative phase (18, 2). In non-fertilized bitches the mucous membrane is re-generated sooner than in pregnant bitches (about day 120–150 after ovulation) (9, 10, 6, 16). metoestrus changes over to anoestrus, i.e. the quiescent phase. The microvilli are rarely noted (6, 16).
Our work is aimed at evaluating and comparing the changes occurring in the endometrium during the proliferative and the se-cretory phases of the uterine cycle of beagle bitches under normal physiological conditions.
MATERIAL AND METHODS
The excisions of the uterine bodies from 10 bitches of the beagle breed in proliferative (n = 5) and secretory phases (n = 5) of the uterine cycle were used. After fixation of the excisions in 10 %
formalin, they were processed by standard histological methods. The 5—7 µm paraffin embedded sections were stained by haema-toxylin-eosin (H-E). We evaluated the prepared sections under the light microscope ZEISS Axiolab connected to pc by the analogue pAL GKb ccD camera cc-8603 with image analyser LUcIA G ver. 4.71 (muTech corp., U. S. A). The thickness (in µm) of the endometrial bodies was determined from the surface epithelium to the myometrium. The numbers of tubular glands and their diameter were assessed by examining 1 mm2 squares. We also measured the length of the counted tubular glands; height of the surface simple columnar epithelium and indicated its diameter in µm. We observed the changes of the cell shape of the surface simple columnar epithe-lium and shape of the tubular glands in the lamina propria mucosae. The micro-photographs were obtained by canon power Shot A95 fixed on the light microscopic eyepiece. The values obtained for each parameter were compared by Student’s t-test (4, 11). All data are expressed as mean ± S. E. m (standard error of the mean). The level of significance was set at p < 0.05.
RESULTS
The endometrium of the uterine bodies in the prolife-rative phase (fig. 1) illustrates the status of the ovaries wi-thout the corpus luteum. The endometrium is significantly thinner than in the secretory phase (669.9 ± 62.6 µm vs. 888.8 ± 9.4 µm; p < 0.05). A comparison of the thickness of the endometrium in both phases is shown in fig. 2.
In the proliferative phase, the lamina propria mucosae has the cells relatively sparsely arranged (the stroma appears light) and there are only a few straight tubular glands with pat-ent lumens (fig. 6). These glands are situated mainly in the deeper portion and their number is significantly lower than that during the secretory phase (fig. 7; 36.3 ± 4.8 vs. 65.5 ± 3.5; p < 0.05), respectively. During the secretory phase, these cells appear in copious numbers also under surface epithelium. The lumen of the tubular glands is filled with acidophilic secretions and the stroma appears dark and thick (fig. 5). The length of tubular glands is nearly the same on average in both phases of the uterine cycle (48.9 ± 4.7 µm vs. 48.5 ± 2.5 µm; ns).
Fig. 1. Transverse section of the uterine body in the proliferative phase of the uterine cycle
In the picture there are depicted individual layers of the uterine — perime-trium (p) with blood vessels (V), myometrium (m), and endometrium with following labels: surface columnar epithelium (ScE), lamina propria muco-sae (Lpm) with scattered uterine tubular glands (TG) under the surface and also in the deep stroma (S). between the lamina propria mucosae (Lpm) and myometrium there is only a slender band of stratum subglandulare
(SSG) where the glands are lacking. L — lumen of the uterus. (beagle bitch in late oestrus, H-E, × 100)
Fig. 2. Comparison of endometrium thickness in proliferative and secretory phases of the canine uterine cycle
** — P < 0.05
The endometrium is covered by a single layer of relatively low columnar epi-thelium (fig. 1 and 3). cells of this surface epithelium have mainly centrally
placed nuclei and darker cytoplasm during the proliferative phase.

34
DISCUSSION
The Endometrium of the uterine body, in the proliferative phase corresponds to the situation on the ovaries when the corpus luteum is present. The endometrium is enlarged several fold (roughened) in consequence of the proliferation and the increase in the number and length of the uterine glands (18, 2). We have ascertained that the endometrium in this phase is 669.9 ± 62.6 µm thick, but significantly thinner (p < 0.05)
Fig. 5. Transverse section of the uterine bodyin the secretory phase of the uterine cycle
Uterine gland wall is formed by enlarged columnar epithelium similar to surface of endometrium (ScE). In the gland lumen the secretion is seen. Tubular glands (TG) are surrounded by stroma (S). L — lumen of the uterus.
(beagle bitch in metoestrus, H-E, × 400)
Fig. 6. Uterine tubular gland in proliferative phase of uterine cycle
The Uterine gland wall is formed by columnar epithelium (cE) similar to that of the surface epithelium. In the gland lumen (GL) secretions may be
seen. The glands are surrounded by stroma (S). (beagle bitch in late oestrus, H-E, × 400)
Fig. 3. Comparison of thickness of the simple columnar epithelium in proliferative and secretory phase of the canine uterine cycle
** — P < 0.05
In the secretory phase, the simple columnar epithelium is significantly high-er than in the proliferative phase (25.0 ± 1.0 µm vs. 9.5 ± 0.7 µm; p < 0.05), re-spectively. cells of this epithelium are markedly larger with light cytoplasm and a small eccentrically situated nucleus with pycnotic bodies. These do not exfoliate into the uterine lumen (fig. 4 and 5). Histological image of the endometrium in the uterine bodies is typical for the presence of the active
corpus luteum on the ovary surface during this phase (fig. 4).
Fig. 4. Transverse section of the uterine body in the secretory phase of the uterine cycle
The endometrium of the uterine horn during the secretory phase is thicker as a result of hypertrophy of uterine tubular glands (TG) under the sur-face and deeper in the stroma (S). The surface simple columnar epithelium (ScE) appears lighter as a result of the enlarged cells. At the lumen of the uterus (L), these cells appear darker because of the eccentrically placed cell nuclei of the columnar epithelium. between the lamina propria mucosae (Lpm) and myometrium (m) is found very slender band of stratum subglan-
dulare (SSG) where the glands are lacking. (beagle bitch in metoestrus, H-E, × 100)
when compared to the secretory phase 888.8 ± 9.4 µm. A dif-ference in the length of the uterine glands was not observed. The endometrium is covered by relatively low simple colum-nar epithelium (15). The cells of this surface epithelium have larger centrally located nuclei and darker cytoplasm during the proliferative phase.
In the secretory phase, the surface simple columnar epi-thelium is significantly higher (p < 0.05). The cells of this epi-thelium are larger with light cytoplasm and small eccentrical-

35
ly located nuclei, in which the pycnotic bodies can be seen. These pycnotic bodies are not extruded into the lumen. At the beginning of the secretory phase, higher amounts of gly-cogen is synthesized in the basal part of the epithelial cells. This has the effect of pushing the nuclei closer to the surface (18, 2). As cited in the literature (15), the light colour of the cytoplasm and the deformed nuclei are obviously caused by the accumulation of fat. Similarly, also the columnar epithe-lium of the uterine crypts undergoes fat degeneration (5). According to V a n c r u c h t e n et al. (17, 16), the cells of the surface epithelium of the endometrium in proestrus and oe-strus are slightly convex and they change to a flat appearance at the end of metoestrus.
The histological picture of the endometrial body is de-pendent upon the presence of the active corpus luteum on the ovary during the secretory phase. The endometrium gets thick in consequence of the stromal oedema and hypertro-phy of the uterine glands (18, 2). The uterus is prepared to receive the fertilized egg and at the beginning of this phase the uterine glands arise to elaborate the secretions under the influence of the elevated concentrations of progesterone (3, 12, 13). Receptors for sexual hormones have been shown to occur on most cellular types of the endometrium, especially on the cells of the endometrial glands (1). After the secretion of progesterone has finished, the surface layer is reduced and the mucous membrane renews itself, but without exfoliation (6, 7, 16, 15, 14).
We observed that in the proliferative phase the lamina propria mucosae have a relatively sparse number of cells in the stroma (it appears light) and few straight tubular glands with patent lumens. In contrast, during the secretory phase, the straight tubules sporadically ramify (we observed rami-fied glands only in one bitch). The secretion of the glands consists mainly of glycogen, lipids, and mucus. The glands get wider with the increased amount of secretion and there-fore their shape changes as they spiral toward the surface of the uterine lumen. However, in carnivores their decantation is very rare (18, 2). The glands are located mainly in the deep portion and their number is significantly lower in the proli-ferative phase (p < 0.05). At the same time, V a n c r u c h t e n
et al. (16) observed that the number of uterine glands showed small variability during the oestrous cycle. During the secre-tory phase, the glands appear in higher numbers near the surface of the uterine lumen.
CONCLUSIONS
The status of the endometrium in the proliferative phase conforms to the situation on the ovaries where a corpus lu-teum is not present. The surface simple columnar epithelium is relatively low. The cells of this epithelium have the nucleus in a central position and the cytoplasm appears darker. The lamina propria mucosae have relatively fewer cells and the tis-sue appears light. There are fewer straight tubular glandules with discernible lumens, some of which occasionally demon-strate sporadic bifurcations. These latter types of glandules are mainly localized deeper in the endometrium and their number is not very high. In the secretory phase, the surface simple columnar epithelium is higher. Its cells are evidently bigger with light cytoplasm and a small nucleus in an exocen-tric position where pycnotic bodies can be seen. These are not exfoliated into endometrial lumen. Tubular glandules are found in high numbers near the lumen surface of the uterus and their lumen is fulfilled with acidophilic fluid. Also under the uterine surface epithelium, tissue cells are compacted and appear dark. The histological picture of the endometrium is characteristic for the presence of an active corpus luteum on the ovary.
The results and conclusions that we came to, offer some new information about structural changes on the bitch en-dometrium in the proliferative and secretory phases of the beagle bitch oestrous cycle.
REFERENCES
1. Bosschere, H. de, Ducatelle, R., Tshamala, M., Coryn, M., 2002: changes in sex hormone receptors during administration of progesterone to prevent estrus in the bitch. Theriogenology, 58, 1209—1217.
2. Cigánková, V., 2004: Histology and embryology for cynolo-gists (In Slovak). UVL Košice, 77—83.
3. Concannon, P. W., McCann, J. P., Temple, M., 1989: biol-ogy and endocrinology of ovulation, pregnancy and parturition in the dog. J. Reprod. Fert. Suppl., 39, 3—25.
4. Červenka, J., 1975: Basic Statistics (In Slovak). Osveta, 1—161.
5. Galabova, G., Egerbacher, M., Aurich, J. E., Leitner, M., Walter, I., 2003: morphological changes of the endometrial epithe-lium in the bitch during metoestrus and anoestrus. Reprod. Domest. Anim., 38, 415—420.
6. Gamčík, P., 1988: Veterinary-breeding aspects of control of dog and cat reproduction. In Veterinary-breeding control of reproduc-tive animals. príroda, bratislava, 295—328.
7. Gonciarov, M., Moldovan, R., Cornila, N., Dojana, N., Georgescu, B., 2003: morphophysiological particularities of uterus in bitch during the estral cycle. Revista Romana de Medicina Veteri-
Fig. 7. Comparison of the number of endometrial glands in proliferative and secretory phases of the canine uterine cycle
** — p < 0.05
36
nara. The General Association of Romanian Veterinarians, bucur-esti, Romania, 13, 21—31.
8. Holman, J., 1966: female reproductive organs (In czech). In Veterinary histology. SZN, prague, 423—452.
9. Jöchle, W., 1976: New knowledge about reproductive biol-ogy of dog and cat, consequences for oestrus control, contracep-tion, abortion and treatment initiation. Dsch. Tierärztl. Wschr., 83, 564—569.
10. Jöchle, W., Andersen, A. C., 1977: The estrous cycle in the dog: A review. Theriogenology, 7, 113—140.
11. Kába, B., 1987: Testing of statistical hypothesis (In czech). In Statistics (In czech). Eds. Grofík et al., príroda, 152—156.
12. Schaefers-Okkens, A. C., 1996: Ovaries. In Clinical Endocri-nology of dogs and cats. Ed. A. Rijnberk. Kluwer Academic publish-ers, 131—156.
13. Schaefers-Okkens, A. C., 2000: Estrus cycle and breeding management in the healthy bitch. In Textbook of Veterinary Internal Medicine. 5th Edition. Eds. S. J. Ettinger, E. C. Feldman. Wb Saun-ders co., 151—1519.
14. Van Cruchten, S., Simoens, P., Van den Broeck, W., 2005: canine endothelial remodelling during the estrus cycle: an Over-view. Anat. Histol. Embryol., 34 (s1), 52.
15. Van Cruchten, S., Van den Broeck, W., D’Haeseleer, M., Si-moens, P., 2004: proliferation patterns in the canine endometrium during the estrous cycle. Theriogenology, 62, 631—641.
16. Van Cruchten, S., Van den Broeck, W., Roels, F., Simoens, P., 2003: cyclic changes of the canine endometrial surface: An elec-tronmicroscopic study. Cells Tissues Organs, 173, 46—53.
17. Van Cruchten, S., Van den Broeck, W., Simoens, P., Lauw-ers, H., 2002: Scanning electron microscopic changes of the canine uterine luminal surface during oestrus and late metoestrus. Reprod. Domest. Anim., 37, 121—26.
18. Zibrín, M., 1990: female reproductive organs (In Slovak). In Veterinary histology. príroda, bratislava, 369—394.
Received January 20, 2010

37
fOLIA VETERINARIA, 54, 1: 37—41, 2010
ABSTRACT
To investigate the health conditions of the wild red deer (Cervus elaphus) in Sondrio Province (Central Italian Alps) 43 blood sam-ples, 48 lung samples, 37 pulmonary lymph nodes, 34 fragments of di-aphragms, 13 samples of small intestines and 30 faecal samples were collected from 61 red deer culled during the 2006 hunting season (1st September — 15th December). This study revealed the presence of respiratory syncytial virus, Leptospira interrogans serovar grippoty-phosa, Mycobacterium avium complex and gastrointestinal parasites, and confirmed the absence of Trichinella sp., bovine pestivirus, bo-vine herpesvirus type 1, parainfluenza virus type 3, Mycobacterium bovis and M. avium subsp. paratuberculosis. More investigations are required to confirm the presence of Brucella spp.
Key words: domestic animals; Italian Alps; L. interrogans serovar grippotyphosa; sanitary conditions; wildlife diseases; zoonoses
INTRODUCTION
monitoring disease conditions of wild animals is the first step to investigate the link between wildlife pathogens, environment, live-stock and human activities. many diseases (e. g.: tuberculosis, lept-ospirosis, brucellosis, …) can infect multiple host species and these are primarily responsible for emerging (or re-emerging) infectious
disease outbreaks in humans, livestock and wildlife (33, reported by 19). The data collected from wild animal disease surveys can be used to verify disease status and contribute to the maintenance of sanitary qualifications of zootechnical settlements of a territory (e.g.: repeated negative results for the presence of Trichinella spp. in wild carnivores, deer and wild boar, as well as in domestic species, can certify a province/region as officially clear from the disease (Reg. cE 2075/2005).
In Italy, periodic sanitary control of wildlife has been made com-pulsory under the DpR 607/96, art. 10, derived from the Council Directive 92/45/EEC (11), in order to allow the commercialization of meat from hunted animals. The control of culled wild ungulates during the hunting season is a strategic opportunity to collect sam-ples from carcasses in order to monitor wildlife sanitary conditions in a specific area (3).
This study was conducted to investigate the disease conditions of wild red deer (Cervus elaphus, Linnaeus, 1758) in Sondrio prov-ince in order to verify the presence (or absence) of diseases that can be transmitted among wild ungulates, domestic animals and humans.
MATERIALS AND METHODS
STUDY AREASondrio province (surface area 3,212 km2, E 9°14’ — 10°37’;
N 45°47’ — 46°22’) is situated in the central Italian Alps and it is divided into five Hunting management Districts, where wild ungu-late species and domestic species may share the same areas during the summer period.
Wild species densities vary between districts (Table 1). Wild
SANITARY SURVEY OF WILD RED DEER CeRVUS eLapHUS HUNTED IN SONDRIO PROVINCE (ITALY)
Andreoli, E.1, Bertoletti, I.2, Bianchi, A.2, Mattiello, S.1
1Department of Animal Science, University of Milan, Via Celoria 10, 20133 Milan2IZSLER “Bruno Ubertini”, Diagnostic Section of Sondrio, Via Bormio 30, 23100 Sondrio
Italy
1 Università degli Studi di milano, Dipartimento di Scienze Animali, Via celoria 10, 20133 milano, Italy2 IZSLER “bruno Ubertini”, Sezione Diagnostica di Sondrio, Via bormio 30, 23100 Sondrio, Italy

38
boars (Sus scrofa, Linnaeus, 1758) were illegally introduced to some areas in 2006, but no information is available about their density. In addition to wild ungulates, 10 975 cattle (Bos Taurus, Linnaeus, 1758), 17 216 sheep (Ovis sp., Linnaeus, 1758) and goats (Capra spp., Linnaeus, 1758), and 612 horses (Equus caballus, Linnaeus, 1758) and donkeys (E. asinus, Linnaeus, 1758) were present in the mountain ranges during summer.
Table 1. Pre-reproductive densities (heads.km-2) of wild ungulates in Sondrio Province
Species
DISTRICT
CHIA-VENNA
MOR-BEGNO
SOND-RIO
TIRA-NO
ALTA VALLE
Red deer (Cervus elaphus, Linnaeus, 1758)
1.78 2.13 1.69 1.63 3.36
Roe deer (Capreolus capreolus, Linnaeus, 1758)
2.45 2.23 3.15 1.21 3.36
Chamois (Rupicapra rupicapra, Linnaeus, 1758)
2.42 5.31 5.14 1.72 1.85
Mouflon (Ovis musimon, Linnaeus, 1758)
3.05 (only in a Game Reserve, 22 km² of the province surface area)
Ibex(Capra ibex, Linnaeus, 1758)
3 (on 493.76 km² of the province surface area)
from 61 carcasses of red deer (13 % of total red deer culled) shot during the hunting season in 2006 (1st September —15th De-cember), it was possible to collect 30 faecal samples, 37 pulmo-nary lymph nodes, 48 tissue samples of lungs, 13 small intestines, 34 fragments of diaphragms and 43 blood samples. The blood sam-ples were centrifuged and the sera were stored at –20 °c until ana-lyzed. for 19 deer, only the samples were delivered to the control centre, therefore gender and age classes could not be recorded. The remaining 42 animals could be assigned to the following gender and age classes: 19 females (5 calves, 5 yearlings and 9 adults) and 23 males (6 calves, 6 yearlings and 11 adults).
The microagglutination test (mAT) (24) was used to verify the presence of antibodies against eight Leptospira interrogans serovars: canicola, pomona, ballum, Sejroe/Hardjo, copenagheni, Australis/bratislava, Tarassovi, Grippotyphosa. The rose bengal agglutination test (RbT) (13, 14) was used to detect antibodies against Brucella abortus/melitensis since it was impossible to perform the comple-ment fixation test (cfT; 10) because of the low quality of the sera. Sera were tested for antibodies to respiratory syncytial virus (RSV) and to parainfluenza virus type 3 (pI-3) by blocking ELISA (12). for pestivirus antibody testing, blocking ELISA was performed us-ing anti-p80 monoclonal antibodies (9). A commercial blocking ELISA (HERDcHEcK IbR Gb, IDEXX laboratories, Westbrook,
maine, USA) was used to test the presence of antibodies to bovine herpevirus type 1 (bHV-1).
The lung samples were checked by immunohistochemistry (IHc), for all viruses of the RSV-family in tissue samples (D. Gel-metti, unpublished data). Diaphragms were tested by pooled sample digestion (pSD) (25) for the presence of Trichinella spp. larvae. pul-monary lymph nodes were submitted for bacteriology including cul-ture for different species of Mycobacterium on selective culture me-dia and their subsequent identification by spoligotyping techniques (24). The small intestines were processed by pcR (QIAamp DNA Kit - Qiagen, for extraction of DNA; ADIAVET pARATb Kit - Adia-gene, for amplification of DNA) to test for DNA of Mycobacterium avium subsp. paratuberculosis. The faecal samples were analysed by flotation (31) to look for eggs of worms, oocysts and tapeworm seg-ments. The different parasite genera and/or helminthic groups were identified by comparison with pictures and drawings (7, 31). The frequency of presence/absence of gastrointestinal parasites between “young” (calves and yearlings) and “adult” (adults) animals was compared by chi square test. for this test we could use data about 23 animals: 14 “young” and 9 “adult”.
All analysis were performed by Diagnostic Sections of IZSLER. for each pathogen we calculated the percentage of infected hosts against the total number of hosts examined (prevalence).
RESULTS
Results are shown in Table 2.Twenty-two positive RbT reactions to brucella abortus/
melitensis were found, but these results were omitted from the Table 2 because it was not possible to perform further analysis confirming this finding as truly positive or false re-actions.
No differences were found in the presence of gastrointe-stinal parasites between the “young” and “adult” animals.
DISCUSSION
Leptospira interrogans serovar grippotyphosa has been found in red deer of Sondrio province in previous years (2). Its reservoir host is the common vole (Microtus arvalis, pal-las, 1778) that is present in this area. Leptospira interrogans serovar grippotyphosa has been reported in cattle, sheep, dogs, horses and wild boar. It has also been isolated in the white-tail deer (Odocoileus virginianus, Zimmermann, 1780) (4, 22, 25, 28, 29, 30). In our study area, the infection in red deer appears to be occasional, possibly occurring when other infected species, such as cattle, sheep, dogs and horses, con-taminate the area. Leptospira spp. have never been reported in roe deer or chamois living in the Sondrio area (3) and no information is available about this organism in domestic animals or in other wild species in Sondrio province or about a possible association with deer migration.
positive RbT reactions to Brucella abortus/melitensis could be due to cross-reactivity with other pathogens such as Yersinia enterocolitica, as is known to occur (17, 32). It was not possible to do the cfT in this study. for future studies

39
it would be essential to perform more appropriate tests in order to confirm or exclude the presence of this pathogen since it may have serious sanitary and economical implica-tions. However, the possibility that brucellosis could be de-rived from local domestic animals is unlikely, as the study area has been considered clear of this infection for more than 30 years and the public Veterinary Service carries out RbT tests on domestic animals annually to monitor the presence of this disease.
There was a positive test for RSV in one animal by ELI-SA. However, it turned out to be negative to the IHc test. In six other animals it was possible to detect the virus by IHc in the lung tissue, but the ELISA tests were negative. This could be due either to an early phase of the infection, during which the virus was already present in the lungs, but the antibodies had not been developed yet, or due to latency of the virus in the host. The presence of RSV in red deer does not seem to represent a sanitary risk, but it may mean that there is a circulation of the virus amongst different wild populations. for example, RSV is present in chamois and roe deer popula-tions of the study area (3).
No positive reactions were found to bovine pestivirus, bHV-1 and pI-3 tests, despite the presence of positive reac-tions to those infections in roe deer, chamois and cattle in the study area (20).
No positive results were found to Trichinella spp.: this parasite has never been found in foxes or in the domestic animals of the study area (I. bertoletti, pers. comm.).
No positive test was found for Mycobacterium bovis: the province of Sondrio has been considered clear of this infec-tion for more than 30 years, until 2006, when just a focus of the disease was found in a cattle herd in the study area (23).
With the pcR test on the small intestine, no positive animal for paratuberculosis was found, although this disease is widespread in deer populations in the neighbouring areas (parco Nazionale dello Stelvio) (8) and in domestic animals in the study area (21). but bacteriology tests showed that one deer, culled near the boundary of the park, had a positive reaction to Mycobacterium avium complex, which comprises also M. avium subsp. paratuberculosis.
parasitic genera/species found in wild deer are common also in domestic animals (31). Their occurrence in deer may be a consequence of the spatial overlap with domestic ru-minants during the summer grazing period. Although some parasitic species could be more frequent in young animals than in adults (e.g. Ostertagia spp., 31), we found no dif-ferences in the presence of parasites between “young” and “adult” animals, in agreement with the results reported by other Authors (16, 27).
Despite the small sample size, the present results provi-de valuable data on the health status of red deer in Sondrio province. As the results of other studies conducted in the pre-vious years in the localized areas of the province show (1, 3, 5, 6), the study affirms the existence of sanitary interactions between other species, both wild and domestic.
It is important to collect samples annually to obtain more accurate information about the health status of wild animals in order to understand the real risks of transmission of those
Table 2. Number of red deer tested and positive, and prevalence (%) for each pathogen in 2006 in Sondrio Province
No. of animals
Pathogen Test Tested PositivePrevalence
(%)
L. interrogans serovars
Australis/Bratislava mAT 43 0 0
Tarassovi mAT 43 0 0
Canicola mAT 43 0 0
Pomona mAT 43 0 0
Sejreo/Hardjo mAT 43 0 0
Copenhageni mAT 43 0 0
Grippotyphosa mAT 431
(titre 1:1,600)2.3
Ballum mAT 43 0 0
RSV ELISA 43 1 2.3
Bovine pestiviruses ELISA 43 0 0
BHV-1 ELISA 43 0 0
PI-3 ELISA 43 0 0
RVS IHc 48 6 12.5
Mycobacterium spp.
Spoligotyping techniques
37 1 2.7
M. avium subsp. paratuberculosis
pcR 13 0 0
Trichinella sp. pSD 34 0 0
Ostertagia sp. flotation 30 17 56.7
Cooperia sp. flotation 30 7 23.3
Moniezia benedeni flotation 30 1 3.3
Haemonchus contortus
flotation 301
3.3
Trichuris ovis flotation 30 1 3.3
Bunostomun sp. flotation 30 1 3.3
eimeria sp. flotation 30 1 3.3
40
pathogens that can have an impact on human health and/or a management and economics of livestock. Intensive collabora-tion between scientific institutions and hunting associations is needed in the future to increase the knowledge about wildlife diseases and to improve wildlife management strategies.
ACKNOWLEDGEMENTS
The authors wish to thank all the hunters and the students who were actively involved in the collection of samples. We would like to thank the laboratories of the different sections of IZSLER for the analysis (especially Dr. Daniela Gelmetti of the Diagnos-tic Section of Milan and Dr. Norma Arrigoni of the Diagnostic Section of Piacenza), Sondrio Province (especially Dr. Maria Ferloni), and the Public Veterinary Service of Sondrio Province (especially Dr. Fabio Orsi), for their collaboration. Many thanks to Dr. Peter Wilson for his precious suggestions. Thanks to Mrs. Patricia Bennett for her assistance with the English language. This research was partly funded by Lumbardy Region.
REFERENCES
1. Andreoli, E., Corradini Batoli, G., Scanziani, E., Bellico, S., Manfredi, M. T., Mattiello, S., 2005: Sanitary control in an alpine hunting sector: parasitological results (In Italian). Hystrix, Italian Journal of Mammalogy (n.s.), Supp. 2005, 156.
2. Andreoli, E., Bertoletti, I., Bianchi, A., Heinzl, E., Scan-ziani, E., Mattiello, S., 2006: Investigation of the sanitary status of red deer (Cervus elaphus) culled in the Italian Alps between 2001 and 2005. In Proceedings Advances in Deer Biology, 6th Interna-tional Deer biology congress, L. Bartoš, A. Dušek, R. Kotrba, J. Bartošová-Víchová (eds.), prague, 81.
3. Andreoli, E., 2008: Monitoring Sanitary Status and Evalua-tion of Body Conditions as Tools for the Alpine Wild Ungulates Man-agement (In Italian). phD. Thesis, Università degli Studi di milano, milan, 218 pp.
4. Barr, S. C., McDonough, P. L., Scipioni-Ball, R. L., Starr, J. K., 2005: Serologic responses of dogs given a commercial vac-cine against Leptospira interrogans serovar pomona and Leptospira kirschneri serovar grippotyphosa. Am. J. Vet. Res., 66, 1780—1784.
5. Bertoletti, I., Bianchi, A., Andreoli, E., Galli, A,. Bignazzi, R., Mattiello, S., 2003: Serological survey of wild ungulates hunted in alpine area used by domestic ungulates. In Proceedings 4th Euro-pean Congress of Mammology, Symposium 9: Interspecific competi-tion among native and introduced ungulates, 65.
6. Bertoletti, I., Bianchi, A., Gaffuri, A., Andreoli, E., Mat-tiello, S., 2005: positive serological response to bovine Respiratory Syncytial Virus (paramyxoviridae) in wild ungulates from central Italian Alps. In Proceedings XXVII Congress of the International Un-ion of Game Biologists, Hannover, Germany, 284.
7. Boch, J., Schneidawind, H., 1988: Krankheiten des Jagd-baren Wildes. Verlag paul parey. Hamburg und berlin, 398 pp.
8. Bregoli, M., Fraquelli, C., Pasolli, C., 2007. Sanitary status of cervids in Trentino (In Italian). Available via DIALOG. http://www.izsvenezie.it/dnn/portals/0/fauna%20selvatica/divulgativi/
STATO%20SANITARIO%20DEI%20cERVIDI%20IN%20TREN-TINO.pdf. Accessed 5th Sept., 2007.
9. Brocchi, E., Cordioli, P., Berlinzani, A., Gamba, D., De Simone, F., 1993: Development of a panel of antipestivirus mo-noclonal antibodies useful for virus identification and antibody as-sessment. In Proceedings 2nd symposium on Pestiviruses, European Society for Veterinary Virology, Annecy, france, 1992, S. Edwards (ed.). foundation marcel mérieux, Lyon, france, 215—218.
10. Ciuchini, F., Farina, R., 1991: first project of standardi-zation of serological techniques for diagnosis of animal brucello-sis: Rapid serum agglutination test with rose bengal antigen in the SAR-Ag: Rb, serum agglutination slow micrometodo SAL-I, com-plement fixation miniaturized fdc-I (In Italian). Instituto Superi-ore di Sanità, Roma, Italy, 91/16, 71.
11. Council Directive 92/45/CEE. On public health and animal health problems relating to the killing of game and of marketing of meat (In Italian).
12. De Simone, F., Brocchi, E., Archetti, Y. L., Gamba, D., Foni, E., 1986: Serological and direct diagnosis of the disease of Respiratory syncytial virus in cattle using monoclonal antibodies. In Proceedings Atti Sisvet XL, 903—906.
13. D. M. 2 Luglio 1992 No. 453: Regulation concerning the national plan for the eradication of brucellosis in sheep and goats (In Italian).
14. D. M. 27 Agosto 1994 No. 651: Regulation concerning the national plan for the eradication of brucellosis in cattle herds (In Italian).
15. D. P. R. 607/96. Rules for the realization of the council Di-rective 92/45/cEE (In Italian).
16. Dròzdz, J., Demiaszkiewicz, A. W., Lachowicz, J., 1993. Seasonal changes in the helminth fauna of Cervus elaphus (L.) from Slowinski National park (poland). Acta Parasitologica, 37, 83—88.
17. Ferroni, C., 2004: Reactions serological nonspecific in cat-tle to diagnostic tests to Brucella (In Italian). Available via DIA-LOG http://www.oevr.org/or4/or?uid=oevr.edit.deploy&oid=5554. Access ed September 5th, 2007.
18. Ferloni, M., 2007. Wild Fauna Management and Hunting Plan of Sondrio Province (In Italian). publ. Sondrio province, Son-drio, 413 pp.
19. Gortázar, C., Ferroglio, E., Höfle, U., Frölich, K., Vicente, J., 2007: Diseases shared between wildlife and livestock: a Europe-an perspective. European Journal of Wildlife Research, 53, 241–256.
20. IZSLER, 2007: plan for health monitoring of wildlife Al-pine Lombard and presence of zoonotic agents conferred on car-casses Sections Diagnostics IZSLER the provinces of bergamo, brescia, como-Varese and Sondrio-Lecco, funded by Lumbardy Region. project Report (In Italian).
21. Lumbardy Region, 2005: Survey on the presence of infec-tion with Mycobacterium avium subsp. paratuberculosis (mAp) in herds of dairy cattle and and risk analysis on the presence of the infectious agent in raw milk at the level of primary production. proj-ect Report (In Italian).
22. Michigan DNR, 2007: Leptospirosis. Available via DIALOG http://www.michigan.gov/dnr/0,1607,7-153-10370_12150_12220-26943--,00.html. Accessed 5th Sept., 2007.
23. O. E. V. R., 2008: Available via DIALOG (In Italian). http://www.oevr.org/files/ElencofocolaiTb2007-2006.pdf. Accessed 27th march, 2008.

41
24. O. I. E. MANUAL, 2004: manual of Diagnostic Tests and Vaccines for Terrestrial Animals, 5th Edition. Office International des Epizooties, paris, france. Available via DIALOG http://www.oie.int/eng/normes/mmanual/A_00043.htm. Accessed 27th march, 2008.
25. Özdemir, V., Erol, E., 2002: Leptospirosis in Turkey. Vet. Rec., 150, 248—249.
26. Regolamento (CE) No. 2075/2005. Specific rules on offi-cial controls for Trichinella in meat (In Italian).
27. Santín-Durán, M., Alunda, J. M., Hoberg, E. P., De La Fuente, C., 2008: Age distribution and seasonal dynamics of abo-masal helminths in wild red deer from central Spain. J. Parasitol., 94, 1031—1037.
28. Slavica, A., Cvetnić, Ž., Milas, Z., Janicki, Z., Turk, N., Konjević, D. et al., 2008: Incidence of leptospiral antibodies in dif-ferent game species over a 10-year period (1996—2005) in croatia. European Journal of Wildlife Research, 54, 305—311.
29. Tagliabue, S., Farina, R., 1995: Seroepidemiologic investi-gation on the prevalence of leptospirosis among domestic animals and some wildlife (In Italian). Selezione Veterinaria, 36, 941—952.
30. Tengelsen, L. A., Yamini, B., Mullaney, T. P., Bell, T. G., Render, J. A., Patterson et al., 1997: A 12-year retrospective study of equine abortion in michigan. J. Vet. Diagnost. Invest., 9, 303—306.
31. Urquhart, G. M., Armour, J., Duncan, J. L., Dunn, A. M., Jennings, F. W., 1996: Veterinary Parasitology, 2nd ed., blackwell Science, London, 307 pp.
32. Vecchi, G., Bardasi, L., Renzi, N., Tamba, M., Dottori, M., Leonelli, R., Natalizi, S., 2006. preliminary study on non-specific reactivity to Yersinia enterocolitica O:9 in the serological diagnosis for bovine brucellosis, in area control plans of Emilia-Romagna (In Italian). In Proceedings Atti del II Workshop Nazionale di Epidemiolo-gia Veterinaria, perugia, 108.
33. Woolhouse, M. E., 2002: population biology of emerging and remerging pathogens. Trends Microbiol., 10, 3—7.
Received February 2, 2010

42
fOLIA VETERINARIA, 54, 1: 42—45, 2010
ABSTRACT
The activity of alkaline phosphatase (AP) (EC 3.1.3.1) in the jejunum enterocytes was determined in 1 month old clinically healthy piglets with normal (12 animals, average body weight 12.5 kg) and re-tarded growth (12 animals, average body weight 7.5 kg). A microden-zitometric analysis was used to evaluate the differences in AP activity. When compared to normal control animals (5.3 ± 0.25), a significant decrease (P < 0.001) was observed in the mean density of alkaline phosphatase in the animals with retarded growth (4.4 ± 0.29). The results obtained point to a relationship between the level of the inves-tigated enzyme in the microvillous zone of enterocytes and the func-tional state of enterocytes. Thus, the measurement of AP activity in the small intestine might be used as a diagnostic marker of the growth disturbances in weaned piglets
Key words: alkaline phosphatase; enterocyte; microdenzitometry; piglet
INTRODUCTION
failure of nutrient absorption from the intestinal tract leads to the malabsorption syndrome. The clinical manifestations, which are most evident in humans and animals, may consist of: persistent gas-trointestinal upset (vomiting, diarrhoea); changes in eating habits; loss in weight, and in a few cases steatorrhoea. moreover, villous atrophy may be pronounced in the lesions located in the small in-
REDUCED ALKALINE PHOSPHATASE ACTIVITY IN JEJUNAL ENTEROCYTES OF PIGLETS WITH RETARDED GROWTH
Lorinčák, Ľ.1, Dancaková, Ľ.2, Dudríková, E.2
Gál, P.2, Lenhardt, Ľ.2
1District Veterinary and Food Administration, Trnava2University of Veterinary Medicine and Pharmacy, Košice
The Slovak Republic
testine. Accordingly, the intestinal villi are shortened due to the loss of epithelium. In addition, the villi are broadened due to the infiltra-tion of leukocytes into the lamina propria.
The brush border of the enterocytes contains many hydrolytic enzymes (disaccharidases, peptidases, and phosphatases) as well as nonenzymatic proteins, etc. (3). Among these enzymes, alka-line phosphatase is primarily found in the cell membrane where active transport takes place in the brush border of the enterocytes (12). phosphatase’s significance is indicated by its presence in the digestive tract during the embryonal development and/or during the postnatal period (5, 6). The importance in the overall metabolism of alkaline phosphatase is related to its role in the absorption of lipids (10).
MATERIAL AND METHODS
Twenty four 1 month old Slovak White x Landrace crossbred weaned piglets reared on a large-capacity farm in Košická polianka were used in this study. The animals showed no clinical symptoms of sickness and had negative bacteriological findings. The animals were divided (dependent on their body weight) into two groups (12 animals in each). The first group (control) consisted of clinical-ly healthy, weaned piglets with normal growth (mean body weight 12.5 ± 0.73 kg), whereas weaned piglets with retarded growth (mean body weight 7.5 ± 0.94 kg) formed the second group.
After the piglets were killed, 1 cm long samples of the small intestine were removed from the jejunum (250 cm orally from the

43
ostium ileocoecale). Specimens were immediately frozen in cold pe-troleum ether at –20 °c. frozen sections (7 µm thick) were cut on a cryostat (SHANDON cRYOTOmE E, cheshire, UK) at a cabinet temperature of –21 °c. Sections were picked up onto clean glass slides (0.96 to 1.06 mm thick) and stored in the cryostat cabinet un-til used. The cryostat sections were allowed to dry for 5 min at 37 °c and incubated for alkaline phosphatase (Ap) activity.
The incubation for Ap activity was performed as previously de-scribed by L o j d a et al. (15) and m o z e š et al. (17). The medium consisted of veronal acetate buffer (pH 9.2) and naphtol — AS-bI-phosphate (Sigma-Aldrich, Deisenhofen, Germany), and stable di-azonium salt fast blue bb (Sigma-Aldrich). The incubation lasted for less than 10 min at 37 °c. control incubations were performed in the presence of an inhibitor (L- cystein).
Fig. 2. Alkaline phosphatase activity along the villus axis in a 30-days-old retarded growth piglet. The incuba-tion medium contained naphthol AS-BI phosphate and Fast blue BB. Incubation was performed at 37 °C for 10 min, using a substrate concentration of 2.0 mM and pH 9.2. The final reaction product is localized in the
brush border of jejunal epithelial cells
Fig. 1. Alkaline phosphatase activity along the villus axis in a 30-days-old control piglet. The incubation medium contained naphthol AS-BI phosphate and Fast blue BB. Incubation was performed at 37 °C for 10 min, using a substrate concentration of 2.0 mM and pH 9.2. The final reaction product is localized in the brush border of
jejunal epithelial cells
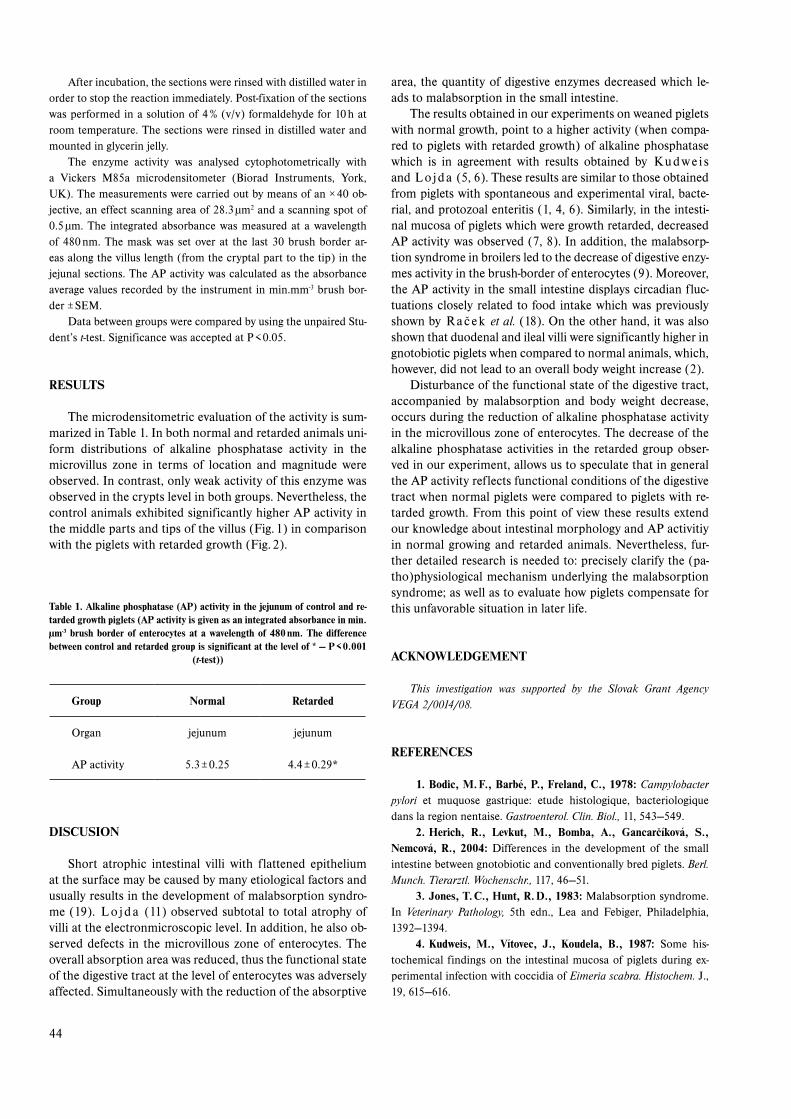
44
After incubation, the sections were rinsed with distilled water in order to stop the reaction immediately. post-fixation of the sections was performed in a solution of 4 % (v/v) formaldehyde for 10 h at room temperature. The sections were rinsed in distilled water and mounted in glycerin jelly.
The enzyme activity was analysed cytophotometrically with a Vickers m85a microdensitometer (biorad Instruments, York, UK). The measurements were carried out by means of an × 40 ob-jective, an effect scanning area of 28.3 µm2 and a scanning spot of 0.5 µm. The integrated absorbance was measured at a wavelength of 480 nm. The mask was set over at the last 30 brush border ar-eas along the villus length (from the cryptal part to the tip) in the jejunal sections. The Ap activity was calculated as the absorbance average values recorded by the instrument in min.mm-3 brush bor-der ± SEm.
Data between groups were compared by using the unpaired Stu-dent’s t-test. Significance was accepted at p < 0.05.
RESULTS
The microdensitometric evaluation of the activity is sum-marized in Table 1. In both normal and retarded animals uni-form distributions of alkaline phosphatase activity in the microvillus zone in terms of location and magnitude were observed. In contrast, only weak activity of this enzyme was observed in the crypts level in both groups. Nevertheless, the control animals exhibited significantly higher Ap activity in the middle parts and tips of the villus (fig. 1) in comparison with the piglets with retarded growth (fig. 2).
Table 1. Alkaline phosphatase (AP) activity in the jejunum of control and re-tarded growth piglets (AP activity is given as an integrated absorbance in min.μm-3 brush border of enterocytes at a wavelength of 480 nm. The difference between control and retarded group is significant at the level of * — P < 0.001
(t-test))
Group Normal Retarded
Organ jejunum jejunum
Ap activity 5.3 ± 0.25 4.4 ± 0.29*
DISCUSION
Short atrophic intestinal villi with flattened epithelium at the surface may be caused by many etiological factors and usually results in the development of malabsorption syndro-me (19). L o j d a (11) observed subtotal to total atrophy of villi at the electronmicroscopic level. In addition, he also ob-served defects in the microvillous zone of enterocytes. The overall absorption area was reduced, thus the functional state of the digestive tract at the level of enterocytes was adversely affected. Simultaneously with the reduction of the absorptive
area, the quantity of digestive enzymes decreased which le-ads to malabsorption in the small intestine.
The results obtained in our experiments on weaned piglets with normal growth, point to a higher activity (when compa-red to piglets with retarded growth) of alkaline phosphatase which is in agreement with results obtained by K u d w e i s and L o j d a (5, 6). These results are similar to those obtained from piglets with spontaneous and experimental viral, bacte-rial, and protozoal enteritis (1, 4, 6). Similarly, in the intesti-nal mucosa of piglets which were growth retarded, decreased Ap activity was observed (7, 8). In addition, the malabsorp-tion syndrome in broilers led to the decrease of digestive enzy-mes activity in the brush-border of enterocytes (9). moreover, the Ap activity in the small intestine displays circadian fluc-tuations closely related to food intake which was previously shown by R a č e k et al. (18). On the other hand, it was also shown that duodenal and ileal villi were significantly higher in gnotobiotic piglets when compared to normal animals, which, however, did not lead to an overall body weight increase (2).
Disturbance of the functional state of the digestive tract, accompanied by malabsorption and body weight decrease, occurs during the reduction of alkaline phosphatase activity in the microvillous zone of enterocytes. The decrease of the alkaline phosphatase activities in the retarded group obser-ved in our experiment, allows us to speculate that in general the Ap activity reflects functional conditions of the digestive tract when normal piglets were compared to piglets with re-tarded growth. from this point of view these results extend our knowledge about intestinal morphology and Ap activitiy in normal growing and retarded animals. Nevertheless, fur-ther detailed research is needed to: precisely clarify the (pa-tho)physiological mechanism underlying the malabsorption syndrome; as well as to evaluate how piglets compensate for this unfavorable situation in later life.
ACKNOWLEDGEMENT
This investigation was supported by the Slovak Grant Agency VEGA 2/0014/08.
REFERENCES
1. Bodic, M. F., Barbé, P., Freland, C., 1978: Campylobacter pylori et muquose gastrique: etude histologique, bacteriologique dans la region nentaise. Gastroenterol. Clin. Biol., 11, 543—549.
2. Herich, R., Levkut, M., Bomba, A., Gancarčíková, S., Nemcová, R., 2004: Differences in the development of the small intestine between gnotobiotic and conventionally bred piglets. Berl. Munch. Tierarztl. Wochenschr., 117, 46—51.
3. Jones, T. C., Hunt, R. D., 1983: malabsorption syndrome. In Veterinary Pathology, 5th edn., Lea and febiger, philadelphia, 1392—1394.
4. Kudweis, M., Vítovec, J., Koudela, B., 1987: Some his-tochemical findings on the intestinal mucosa of piglets during ex-perimental infection with coccidia of Eimeria scabra. Histochem. J., 19, 615—616.

45
5. Kudweis, M., Lojda, Z., 1989a: The small intestines his-tochemistry of suckling piglets. Physiol. Bohemoslov., 38, 546.
6. Kudweis, M., Lojda, Z., 1989b: The small intestines his-tochemistry of suckling piglets in the early postnatal development. Folia Facult. Med., 66, 60.
7. Lenhardt, Ľ., Švický, E., 1996: A denzitometric analysis of alkaline phosphatase in jejunum enterocytes of piglets with retarded growth. Folia Veterinaria, 40, 29—31.
8. Lenhardt, Ľ., Dudríková, E., 1998: A denzitometric analy-sis of alkaline phosphatase and aminopeptidase m in the jejunum enterocytes of the piglets with retarded growth. Vet. Med. Czech, 43, 75—79.
9. Lenhardt, Ľ., Mozeš, Š., 2003: morphological and func-tional changes of the small intestine in Growth-Stunted broilers. Acta Veterinaria Brno, 73, 353—358.
10. Linsheer, W. G., Melagelada, J. R., Fichman, W. H., 1971: Diminished oleic acid absorption by L-phenylalanine inhibition of an intestinal phosphohydrolase. Nature New. Biol., 231, 116—117.
11. Lojda, Z., 1969: The histochemistry and electron microsco-py of the small intestine with malabsorption syndrome. In Frič, P. et al.: Malabsorption Syndrome (In czech), SZN, prague, 108—115.
12. Lojda, Z., 1974: cytochemistry of enterocytes and other cells in the mucous membrane of the small intestine. In Smyth, D. H.: Intestinal Absorption. plenum press, London, New York, 43—122.
13. Lojda, Z., 1983: malabsorption. In Filipe, M., Luke, B. D.: Histochemistry in Pathology. Edinburgh, churchill Livingstone, 136—144.
14. Lojda, Z., Frič, P., 1964: Histoenzymatic study of jejunal biopsies in malabsorption syndromes. In Schiebler, T. H., Pearce, A. G. E., Wolf, H. H.: Second International Congres of Histo- and Cy-tochemistry, Springer Verlag, 204 pp.
15. Lojda, Z., Gossrau, R., Schliebler, T. N., 1979: Enzyme His-tochemistry. A Laboratory manual. berlin, Springer Verlag, 339 pp.
16. Marcaník, J., 1980: Enzyme histochemistry in some alterna-tive processes in the veterinary pathology (In Slovak). phD. Thesis, Košice, University of Veterinary medicine, 70—86.
17. Mozes, S, Bujnáková, D., Sefcíková, Z., Kmet, V., 2008: Developmental changes of gut microflora and enzyme activity in rat pups exposed to fat-rich diet. Obesity, 16, 2610 —2615.
18. Raček, Ľ, Lenhardt, Ľ,, Mozeš, Š., 2001: Effect of fasting and refeeding on duodenal alkaline phosphatase activity in monoso-dium glutamate obese rats. Physiol. Res. 50, 365—372.
19. Thompson, R. G., 1984: Atrophy. In General Veterinary Pa-thology, 2nd edn., philadelphia, W. b. Saunders, 283—287.
Received March 29, 2010
46
fOLIA VETERINARIA, 54, 1: 46—50, 2010
ABSTRACT
Carbamate pesticides generally possess low toxicity for warm-blooded vertebrates, but developmental data are scarce. We have therefore evaluated the embryotoxicity of the cholinesterase inhibitor bendiocarb in the chick embryo. The pesticide (8—1600 μg/egg) was dissolved in 10 % acetone in distilled water and a volume of 200 μl from each dilution was administered over the embryo through the membrana papyracea at embryonic days (ED) 2 and sampling was performed on ED 9. The toxicity of bendiocarb was fairly low, al-though the mortality increased with advancing bendiocarb doses ex-cept for the experimental dose of 800 μg/egg. The body weight was higher at bendiocarb doses of 8—200 μg/egg and lower at doses of 400—1600 μg/egg in comparison with the control group. There was a mild but statistically significant dose-dependent reduction in the body weight; most pronounced in the treatment with a dose of 800 μg/egg (12 %) in comparison with the control group. The malformations in the surviving embryos were observed rarely (< 3 %) and occurred in both control and experimental groups. The lethal dose of bendiocarb on ED 2 was found to be 973 μg/egg.
Key words: bendiocarb; chick embryo; toxicity; xenobiotics
INTRODUCTION
Agrochemicals, as chemicals used in agriculture, include a broad range of products used for the nutrition of plants, as well as the protection and nutrition of animals. The pesticides currently used in agriculture include a wide variety of compounds belonging to different chemical classes (7). There are pesticides, substances
BENDIOCARB EMBRYOTOxICITY ON THE CHICK DEVELOPMENT FROM STAGE 20
Petrovová, E.1, Luptáková, L.2, Vdoviaková, K.1, Maženský, D.1
1Department of Anatomy, Histology and Physiology, University of Veterinary Medicineand Pharmacy, Komenského 73, 041 81 Košice
2Department of Biology and Genetics, University of Veterinary Medicineand Pharmacy, Komenského 73, 041 81 Košice
The Slovak Republic
used as repellents or destroyers of all sorts of plant and animal pests (10). bendiocarb (bc) is a pesticide acting upon invertebrates by irreversibly blocking the activity of the enzyme cholinesterase, which is critical in allowing muscle relaxation by removing the neu-romuscular mediator acetylcholine (9). Like other carbamate insec-ticides, bc is a reversible inhibitor of acetylcholinesterase (AchE). The blockage of AchE caused by bc persists for approximately 24 hours and, subsequently, the situation returns to normal because the insecticide does not accumulate in mammalian tissues (16). In agriculture it is used against a variety of insects, especially those in the soil (17) and to control disease vectors (mosquitoes, flies, and other household and agricultural pests; 4).
The chick embryo is a popular model for developmental phar-macological and toxicological studies. chicks are readily available, cost-efficient, and presents an alternative approach to the treatment of pregnant mammals. The concordance of data from cHEST (The cHick Embryotoxicity Screening Test) and mammals is excellent, and it avoids the potentially confounding effects of different mater-nal metabolism between species by allowing for the separate testing of human-relevant metabolites (8). Acute oral toxicity (LD
50) was
investigated in different adult mammals: rat 34—156 mg.kg-1, guinea pig 35 mg.kg-1, rabbit 35—40 mg.kg-1 (18), and also in non-mamma-lian species like birds: mallard duck 3.1 mg.kg-1, bob white quail 16 mg.kg-1, hen 137 mg.kg-1 (18), fish 0.7—1.8 mg.kg-1 (Lc
50, 5), and
bee 0.1 µg/bee (19). Up to this day, no detailed studies have been conducted regarding the embryotoxic effects of bendiocarb on birds which are more sensitive to the action of toxic substances. because of that, the aim of the present study was to observe the effect of bc on chicken embryos. chicken embryos are more sensitive than embryonic mammals to toxic substances because their action is not influenced by maternal metabolism (14).

47
MATERIAL AND METHODS
fertile chicken eggs of Leghorn hybrid, variant spotted, were obtained from the animal farm Koleč, Institute of molecular genet-ics AS cR, praha, czech republic (144 eggs). They were incubated in a thermostat with forced circulation of air and temperature main-tained at 37.5 ± 0.5 °c and a relative humidity of 60 %. The blunt end of the eggs was cleaned with 70 % alcohol and covered by transpar-ent adhesive tape. The eggs were opened by the modified “window technique” (8). Embryotoxicity was observed by the application of bc on ED 2. According to Hamburger and Hamilton (1951), the ED 2 represents the 20th stage of development (5). Subsequently, using serrated scissors (fST 14071-12); an opening was cut for the application of the respective solutions. After cutting out the opening in the eggshell, doses of bendiocarb (8—1600 µg/egg) were applied to the surface (on membrana papyracea) of all chicken embryos.
bendiocarb was dissolved in acetone and diluted with sterile water for tissue cultures to obtain the required concentrations. The application dose per one egg was 200 µl, with acetone concentration equal to 10 µl/200 µl of the application dose. Identical volumes of acetone solution were applied to control embryos: sterile water for tissue cultures (1 : 10), with an acetone concentration 10 µl/200 µl application dose. After application of the solutions, the eggshell openings were covered with an electrical insulation adhesive tape (15) and the chicken embryos were transferred to a thermostat and incubated under standard incubation conditions (temperature 37.5 ± 0.5 °c, 60 % relative humidity, without turning or adding cO
2). The embryos were observed during incubation and those
which died were eliminated from the experiment.The chicken embryos were dissected out of the membranes on
ED 9, following bendiocarb administration on ED 2. The chick em-bryo’s weight, malformations and mortality were recorded. A statis-tical comparison (Student t-test) of mortality, body weight and mal-formations was performed using Graphpad prism. The LD
50 was
calculated from the regression equation, which is No. 2 in the chart, where after substituting the value of 50 (50 % mortality observed in
the group) instead of an unknown y, we obtain the resulting value of the LD
50 for ED 2.
Tested solutions with varied concentration of bendiocarb were applied directly over the embryo on the top of inner shell membrane (membrana papyracea), because the vascular diffusion of monitor-ing substance occurs and the monitoring substance is more evenly applied in comparison with the intra-amnial application. further-more, application on the membrana papyracea decreases the non-specific effects of the applied substance.
RESULTS
Bendiocarb effect on the body weight of the chick embryoThe average body weight of the control group was
1355 ± 270 mg. Up to the bendiocarb dose of 200 µg/egg, the average body weight of the chick embryo was higher than the control group. The lowest bendiocarb dose of 8 µg/egg resulted in an average body weight of the chick embryos of 1546 ± 220 mg. The body weight at this dose was the highest in comparison with both the control group (higher by 14 %) and the other experimental groups after bendiocarb admini-stration on the ED 2. At the bendiocarb dose of 80 µg/egg, the average body weight was higher by 3 % (1399 ± 380 mg) and at the bendiocarb dose of 200 µg/egg was higher by 0.6 % (1363 ± 120 mg). The body weight at the higher bendiocarb doses (400, 800 and 1600 µg/egg) was lower in comparison with the control group and the lower doses of bendiocarb. At the dose of 400 µg/egg, the body weight was lower by 4 % in comparison with the control group (1305 ± 80 mg). The average body weight at the bendiocarb dose 800 µg/egg was lower by 12 % in comparison with the control group (1196 ± 250 mg). This is the lowest body weight in compari-son with control group and other experimental groups. At the highest bendiocarb dose of 1600 µg/egg, the body weight of the chick embryos was lower by 4 % in comparison with the
Table 1. Embryotoxicity of the chick embryo after
bendiocarbamate administration on 2 ED
Dose(μg)
N Dead embryos Dead embryos(%)
M Average weight (g)
SD c p-value LD50
(μg/egg)
0 35 5 14 3 1.355 0.272 973
8 20 0 0 0 1.546 0.219 0.011 *
80 22 1 5 1 1.399 0.378 0.627
200 13 5 38 0 1.363 0.119 0.938
400 11 5 46 0 1.305 0.081 0.659
800 21 7 33 0 1.196 0.245 0.259 *
1600 22 16 73 0 1.304 0.267 0.675

48
control group (1304 ± 270 mg). This body weight of the chick embryos was higher than we expected (Table 1, fig 1).
Lethal dose — LD50
The chick embryos inoculated on ED 2 showed increasing mortality depending upon the bendiocarb dose; except for the dose of 800 µg/egg, which demonstrated a lower morta-lity than at lower doses of bendiocarb (200 and 400 µg/egg). The results of the mortality aspect (including the control group) are shown in the Table 1 and fig. 2. The lethal dose of the chick embryos (LD
50) after bendiocarb administration
on 2 ED was 973 µg/egg.
MalformationsWe observed only 4 malformations (2.6 %) out of the
total number of the chick embryos (144 individuals) who survived and were sampled on ED 9. These malformations were observed both in the control group and experimental groups. We observed monophthalmia, cleft beak, opening of the body cavity and growth retardation of the chick embryo (Table 1, fig. 1 and 2).
DISCUSSION
Up to this time, the embryotoxic effects of bendiocarb on the chick embryo has not been studied, despite the fact that the embryotoxic effect of the carbamate pesticides (carba-ryl and aldicarb) on the hatching of the chick embryos has been observed. carbaryl was injected on ED 5 and ED 15 at 45 mg.kg-1 egg weight and was found to be extremely toxic to the embryos on ED 5 of incubation, in comparison with treat-ment on ED 15. carbaryl injected on 5 ED caused locomotion alterations and reduced hatchability of the chick embryos. Al-dicarb injected on ED 5 and ED 15 at 1.5 mg.kg-1 egg weight did not affect the hatchability of the chicks. However, the loco-motion of chicks was affected in both treatment groups until 47 days after hatching (2). Reduced survival rates or lowered birth weights were observed in female rats at bendiocarb doses of 40 mg.kg-1 from days 6—15 of gestation (6).
In our study we used white Leghorn chicken eggs. Howe-ver it may not be excluded that other breeds might be just as sensitive to the bendiocarb effect. Similarly, the results of our study concluded that different commercial strains of White Leghorn chick embryos (Dekalb Delta, Hy-Vac Spf type L and Hy-Vac Spf type V) showed different susceptibilities to the induction of ventricular septal defect by 50 % ethanol (1). It is possible that the feed of hens could also play a role in the susceptibility to the effect of bc. Embryos born to vitamin-A deficient females had many congenital defects, including abnormalities of the central nervous system and the neural crest derivatives. conversely, it was subsequently shown that too much vitamin A is equally harmful to the embryo and that a similar spectrum of defects arises in the central ner-vous system and neural crest derivatives (12). Deficiency or abundance of vitamin A could cause fatal consequences to the development of the chick embryo together with the ben-diocarb.
In mammals, f l e s a r o v a et al. (4) noted fairly low toxic bendiocarb effects in rabbits after oral administration. Re-sults of their study suggested negative effects of bendiocarb on the formation of thymus structures (4).
Our study involving administration of bendiocarb on ED 2 showed considerably lower proportion of malformations (2.6 %) compared to mortality (25 %).
The effect of carbamate pesticides on the morphogene-sis and development of the chick embryo was observed after injection of carbaryl in the allantoic sac on ED 5 and ED 6. In comparison with a control group, some morphological alterations have been found in the embryos treated, at the expense of the skeleton apparatus, particularly in the most distal portions, as tibial and metatarsal angulations with their curtailment (10).
persistent locomotion alterations were observed only at the higher doses of both carbaryl and aldicarb when the spe-cific neurotransmitters measured returned to normal levels (3).
The average mortality in the control group was 14 % (35/5). The morality in the experimental groups was higher depending on the dose (except for the mortality at the dose
Fig. 1. Body weight of the chick embryo after bendiocarb administration Fig. 2. Embryotoxic effect of bendiocarb on the chick embryo

49
of 800 µg/egg). When an embryotoxic dose of a substance is administered into the immediate vicinity of the chick em-bryo, one should realize that the number of malformed em-bryos alone may not be an adequate indication of its terato-genic potential, especially if only a few dose levels are used (13). The first possible explanation may be that embryos suffering from a potential inborn defect, die simply because the malformation is incompatible with further life and deve-
Fig. 4. Opening of the body cavity of the chick embryo
Figure 3: Growth retardation of the chick embryo
lopment. This is called prenatal selection, such as a result of early spontaneous human abortions. prenatal selection may also appear in the chicken embryos, whereas only 70 % of individuals hatch from unopened eggs. The next possible reason of progressive embryonic mortality on increasing the dose, could be the interference of some classes of substances and/or doses with basic vital functions. In mammals a third possibility must be considered — the frequent rejection of fe-

50
tuses as a result of intoxication, stress or some other change in the maternal organism and/or placental function (13).
CONCLUSIONS
In our study we observed fairly low embryotoxic effects to the bendiocarb dose administered on ED 2. The weight of the chicken embryos was lower depending on the dose. The chick embryos surviving the highest dose (1600 µg/egg) were only the strongest individuals (27 %). This indicated the tendency of chicken embryos to succumb to the toxic effect of bendiocarb.
ACKNOWLEDGEMENT
Supported by project VEGA of the Ministry of Education of the Slovak Republic No. 1/0696/08, MSM 0021620806, and AS CR AV0Z50450515.
REFERENCES
1. Bruyere, H. J., Jr., 1993: Strain-dependent effect of ethanol on ventricular septal defect frequency in White Leghorn chick em-bryos. Teratology, 48, 299—303.
2. Farage-Elawar, M., 1990: Effects of in ovo injection of car-bamates on chick embryo hatchability, esterase enzyme activity and locomotion of chicks. J. Appl. Toxicol., 10, 197—201.
3. Farage-Elawar, M., Blaker, W. D., 1992: chick embryo ex-posure to carbamates alters neurochemical parameters and behav-ior. J. Appl. Toxicol., 12, 421—426.
4. Flešárová, S., Lukáč, N., Danko, J., Massanyi, P., 2007: bendiocarbamate induced structural alterations in rabbit thymus after experimental peroral administration. J. Environ. Sci. Health B., 3, 329—334.
5. Hamburger, V., Hamilton, H. L., 1951: A series of normal stages in the development of chick embryos. J. Morphol., 88, 49—92.
6. Hayes, W. J., Laws, E. R., 1990: Handbook of Pesticide Toxi-cology. Academic press, New York, 1576 pp.
7. Holečková, B., Dianovský, J.,. Šiviková, K., 2009: cytoge-netic effect of pesticides on cultivated peripheral lymphocytes of cattle. Folia Veterinaria, 53, 83—86.
8. Jelínek, R., 1977: The chick embryotoxicity screening test (cHEST). In Methods in Prenatal Toxicology, Eds. Neubert, D., Merker, J., Kwasigroch, T. E., Thieme, G., Stuttgart, 381—386.
9. Kristoff, G., Guerrero, N. V., Pechén de D’Angelo, A. M., Cochón, A. C., 2006: Inhibition of cholinesterase activity by azin-phos-methyl in two freshwater invertebrates: biomphalaria glabrata and Lumbriculus variegatus. Toxicology, 3, 185—194.
10. L’Abbate, N., Virgintino, D., Ribatti, D., Roncali, L., Mic-coli, M. G., Ambrosi, L., 1986: Effects of carbaryl on the morpho-genesis of the extremities in chick embryos. G. Ital. Med. Lev., 8, 123—126.
11. Lešník, F., 2005: A medical view of agrochemicals. Folia Veterinaria, 49, 4—6.
12. Maden, M., Gale, E., Zile, M., 1998: The role of vitamin A in the development of the central nervous system. J. Nutr., 128, 471—475.
13. Peterka, M., Havránek, T., Jelínek, R., 1986: Dose-response relationships in chick embryos exposed to embryotoxic agents. Folia Morphologica, 34, 69—77.
14. Petrovová, E., Sedmera, D., Lešník, F., Luptáková, L., 2009: bendiocarb effect on liver and central nervous system in the chick embryo. J. Environ. Sci. Health, part b, 44, 383—388.
15. Sedmera, D., Hu, N., Weiss, K. M., Keller, B. B., Denslow, S., Thompson, R. P., 2002: cellular changes in experimental left heart hypoplasia. Anat. Rec., 267, 137—145.
16. Siroťáková, M., Schmidtová, K., Ucekaj, N., 2005: micro-scopical pictures of adrenergic and buchE-positive innervation of spleen in rabbits after application of bendiocarbamate (In Slovak). In Xenobiotics in Relation to Health, Danko, J., Lešník, F., Eds., Seminar, St. Karol boromejský, Košice, 75—81.
17. Sobeková, A., Holovská, K., Lenártová, V., Flešárová, S., Javorský, P., 2009: The another toxic effect of carbamate insecti-cides. Acta Biol. Hung., 60, 45—54.
18. WHO, 2007: bendiocarb. cited 14th June, 2007. Available: http://www.intox.org/databank/documents/chemical/bendiocb/pest52_e.htm
19. Wright, C. G., Leidy, R. B., Dupree, H. E. Jr., 1981: Insec-ticides in the ambient air of rooms following their application for control of pests. Bull. Environ. Cintam. Toxicol., 26, 548—553.
Received May 19, 2010-06-29

51
Folia Veterinaria is journal published by the University of Vet-erinary medicine and pharmacy in Košice, the Slovak Republic, and is issued quarterly and distributed worldwide. Original research papers on all aspects of veterinary science together with clinical case studies, notes and short communications, review articles, and correspondence are welcomed on the understanding that the manu-script, in part or in whole, has not been published or submitted for publication elsewhere. Each author is responsible for the originality of the work and the correctness of its content. In the case of joint authorship, it will be assumed that all the authors agree to the sub-mission. manuscripts are considered on the proviso that consent to publication has been given by the head(s) of department(s) where this is required. Authors should submit the manuscripts in electronic format using Word-processing software. papers will be reviewed by at least two anonymous reviewers chosen by the Editors to evaluate them for originality, relevance to veterinary medicine, clear state-ment of a hypothesis, appropriate experimental design, complete-ness of methods, logical and comprehensive discussion and data-supported conclusions. If accepted for publication, they become the copyright property of folia Veterinaria. The corresponding author will be provided with a pDf file of the article via e-mail and will have no restriction placed on his/her personal freedom to use the information in the article in publications elsewhere. manuscripts not recommended for publication will be returned.
MANUSCRIPT
papers should be written in good English (American or british usage is accepted, but not a mixture of these). Use decimal points (not decimal commas); use a space for thousands (10 000 and above).
The complete set of the manuscript, including photographs and illustrations, tables or graphs should be sent in the digital form to the following e-mail address: [email protected]. The Editorial board maintains the option of returning, before evaluation, manuscripts to authors who do not comply with these recommendations.
please state clearly which category of paper is being submitted. With the exception of review articles the papers should not exceed 12 pages including tables, graphs, illustrations, photographs, and references.
The manuscript should be typed in Times New Roman font, 1.5 spacing, with margins of at least 25 mm, paragraphs indented, ob-serving the structure specified below.
Authorship. Each author must have (a) participated substantial-ly in the conception and execution of the work, (b) contributed sig-nificantly to the drafting and/ or revision of the manuscript, and (c) agreed with the final version, in order to accept public responsibility for the article. The order of authorship should be a joint decision of the co-authors. Authors should be prepared to explain this order.
GUIDE FOR AUTHORS
Conflict of Interest. If a study evaluates a pharmaceutical prod-uct, a medical or scientific device, or any other commercial manu-facture, the authors must disclose, in a confidential covering letter to the editor, any and every financial interest (e. g. employment, consultancy, share-holding, board membership, etc.) they may have in the company that manufactures the product discussed or in a rival firm and/or commodity.
REFERENCES
Only the work used should be mentioned. In the reference list, the references should appear in alphabetical order by the first au-thor’s surname, preceded by an Arabic numeral. List the first six authors followed by et al. References should be set out thus. All entries in the reference list must correspond to the references in the text and vice versa. The style and punctuation of the references should follow the format described and illustrated below:
Journals: Surname(s) and initial(s) of the author(s), year of publication (in bold), full title of the paper, title of the journal (in italics), volume, and relevant pages (See examples below). The issue number should be quoted in parentheses only if the pagination of the journal is by issue rather than by volume.
Books: Surname(s) and initial(s) of the author(s) and/ or editor(s), year of publication, full title of the book (in italics) and edition (if not the first), editors, publisher and place of publication, pages.
Examples: 1. Ahlborg, B., Ekelund, L. C, Nilsson, C. G., 1968: Effect of
potassium-magnesium aspartate on the capacity of prolonged exer-cise in man. Acta Physiol. Scand., 74, 238—245.
2. Black, H., Duganzich, D., 1995: A field evaluation of two vaccines against ovine pneumonic pasteurellosis. New Zeal. Vet. J., 43, 60—63.
3. Brown, L. W., Johnson, E. M., 1989: Enzymatic evidence of alkaline phosphatase. In Caster, A. R.: Enzymology. plenum press, New York, 99—101.
4. Ikuta, K., Shibata, N., Blake, J. S., Dahl, M. V., Nelson, R. D., Hisamichi, K. et al., 1997: NmR study of the galac-toman-naus of Trichophyton mentagrophytes and Trichophyton rubrum. Bio-chem. J., 323, 297—305.
In the text, the number of respective reference is used instead of names and dates for citations, e.g. “All space-flight embryos…showed normal embryogenesis (3, 6) and post-hatch development (5).” Only if the writer’s name is a necessary part of the sentence should it be used, e. g. “ J o n e s et al. (7) discovered that…”. If the date is essential, it too should form part of the text, e. g. “Then in 1997 J o n e s et al. (7) made a breakthrough.”

52
citation of a reference as “in press” implies that the item has been accepted for publication
LANGUAGE STYLE
be prepared to use the first person (“I” or “We”, e. g. “We stud-ied 24 Slovak merino ewes.”), but do not overuse it. The excessive use of the passive voice is a principal cause of dullness in scientific writing. Use it sparingly, and prefer the active voice.
Use the past tense for reporting observations, completed ac-tions, and specific results (“We observed no significant changes.”)
Use the present tense or the present perfect for generalizations and generalized discussion. (“This suggests that…”)
Employ the specialist vocabulary of your discipline(s), but do not allow this technical jargon to turn into gobbledegook. “The dynamic development of biological sciences has… had a positive influence on the current knowledge of the activated mechanisms…in the case of human and animal organisms” can be rendered suc-cinctly as “The rapid growth of biological science has enabled us to understand the functions of human and animal bodies better.” convoluted and roundabout expression does not impress and may well irritate the reader.
be simple and concise; where possible use verbs instead of ab-stract nouns. break up long noun clusters and “stacked modifiers” (strings of adjectives before nouns without clues about which modi-fies which).
Avoid “dictionary” and “computer English” — transverbation based upon an incorrect choice of words in a dictionary or word bank. (One computer produced this: “Natural immunity is not bound on antecedent individual skill by your leave pathogen and him close non-pathogenic microorganism”).
Units of Measurement. follow internationally accepted rules and conventions: use the international system of units (SI).
All haematological and clinical chemistry measurements should be recorded in the metric system or in SI units in the following form: g.l-1, mmol.l-1.
Abbreviations and Symbols. Use only standard abbreviations. Avoid abbreviations in the title and abstract. Abbreviations and ac-ronyms should be used only if they are repeated frequently. The full term for which an abbreviation stands should precede its first use in the text unless it is a standard unit of measurement, e. g. positron emission tomography (pET).
Numerals and Dates. Whole numbers from one to ten should be written as words in the text, not as numerals, e. g. “Experiments were carried out on four male Rhine geese…” Numerals should be used for numbers above ten, except in the titles of papers and at the beginning of sentences, where they must appear as words. Dates in the text should be written as follows: 29 September 2000.
Nomenclature and Terminology. medicines must be shown by their generic name followed by the proprietary name and manufac-turer in parentheses when they are first mentioned, e. g. Apramycin (Apralan 200; Elanco, Austria).
Authors should respect international rules of nomenclature.
for animal species and organisms, the recommendations of the In-ternational code of Zoological Nomenclature, London 1999 (4th ed.), should be observed. Linnaean names should be used for plant species. Anatomical terminology should agree with the nomencla-ture published in the Nomina Anatomica Veterinaria 4th edn. (1994) ed. Habel, R. E., frewein, J., and Sack, W. O., World Association of Veterinary Anatomists, Zurich and Ithaca, New York.
Latin terms and other non-English words should be italicised in the manuscript. Use the british Standard 2979 : 1958 for the translit-erations of cyrillic characters in the references as well as the text.
Photographs, Illustrations and Figures. As this part is electroni-cally subject to change and mishaps, figures and tables demand ex-tra care and safety. We recommend sending illustrations also in sep-arate files. black-and-white photographs should be clear and sharp. because of technical complications which can arise by converting color figures to “gray scale” please submit your figures and illustra-tions in version suitable for black and white print. In the journal, figures and illustrations will have an overall width of no more than 8.5 cm and be drawn on pages 17.5 cm wide. The size of the letters in legends should suit these dimensions. Ensure that figures and illustrations are numbered consecutively and each figure or illustra-tion has a caption. Supply captions separately, not attached to the figures. Each caption should comprise a brief title and description and should be placed below the figure or illustration/photograph. photomicrographs must state the magnification and stain tech-nique. The main objects, changes, and findings should be shown by an arrow or some other symbol explained in the legend. permission should be obtained for use of copyright material from other sources (including the Web).
Tables should contain essential data not given in the text. Statis-tics must be enclosed. Number tables consecutively in accordance with their appearance in the text. place titles above the tables and footnotes below the table body and indicate them with superscript lowercase letters. Within each table, lines should separate only the headings from the body of the table, and the body of the table from any totals, averages, etc. No vertical lines should be used.
Ethical Considerations. When reporting experiments on animals indicate whether the respective legislative provisions on the care and use of laboratory animals were observed. manuscripts should describe the measures taken to minimize or eliminate pain and dis-tress in animals during experiments and procedures. If the Editors deem that animals have been subjected to suffering unjustified by the scientific value of the information sought, they will reject the paper on ethical grounds.
The journal encourages integrity in science. Questionable and fraudulent claims will not be entertained.
Experimental Hazards. Authors should draw attention to any dangers involved in carrying out their experiments, and should de-tail the precautions taken to guard against such hazards.
Statistics. Describe statistical methods with enough detail to en-able a knowledgeable reader with access to the original data to verify the results reported. When possible, quantify findings and present them with appropriate indicators of measurement error or uncertain-

53
ty. Discuss the eligibility of experimental subjects. Give details about randomisation. (cf. the statistical guidelines for authors in The Aus-tralian Veterinary Journal Vol.76, No. 12, December 1998, p. 828.)
MANUSCRIPT STRUCTURE — full paper
Each manuscript should be thematically complete: serialization is discouraged.
Divide your article into the subsections with the following head-ings: AbSTRAcT, INTRODUcTION, mATERIALS AND mETH-ODS, RESULTS, DIScUSSION, cONcLUSIONS (AcKNOWL-EDGEmENT), REfERENcES. Each heading should appear on its own separate line, with one blank line above and below each heading.
The Title Page. Leave two blank lines.The paper should be headed with the full title, (BOLD, UPPER-
CASE letters, size 14, centered) which should accurately and con-cisely describe the topic in no more than two lines. The surname(s) and initials of the author(s) and the name and place(s) of their employment should follow this. (If the work was carried out in an institution other than the place of employment, this should be noted in the body of the text.)
One blank line. e-mail address of the corresponding authorTwo blank lines
ABSTRACT
(Bold, lower-case letters) The second page should carry an ab-stract, which should be self-contained and not exceed 250 words. It should briefly incorporate the purpose and relevance to veterinary science of the study, basic procedures, the main findings, and prin-cipal conclusions. It should emphasize new and important aspects of the study or observations.
One blank line
Key words: Key words should be listed below the abstract, from which they are separated by a one-line space. They should consist of three to ten words in alphabetical order, written in lower-case, bold, and separated by semi-colons.
INTRODUCTION
State the objective of the study and provide adequate back-ground, avoiding a detailed literature survey. Give only strictly per-tinent references and do not include data or conclusions from the study being reported.
MATERIAL AND METHODS
Describe’ your selection of observational or experimental subjects (including controls) clearly. Identify the age, sex, state of health, and other important characteristics of the subjects.
Identify the methods, apparatus (with the manufacturer’s name and address in parentheses), and procedures in sufficient detail for other workers to reproduce the experiment. Quote established methods, including statistical methods; provide references and brief descriptions for methods that have been published but are not well known; describe new or substantially modified methods in full; give reasons for using them, and evaluate their limitations. precisely identify all drugs and chemicals used, including generic name, dose, and route of administration.
RESULTS
These should be as succinct as possible and presented in a logi-cal sequence in the text, with figures and tables. Emphasize or sum-marize only the important observations in the text. Do not dupli-cate in the text all the data in the figures and tables.
DISCUSSION
Emphasize the new and important aspects of the study and the conclusions that follow from them. Do not repeat in detail data or other material given in the Introduction or the Results sections. In-clude in the Discussion section the implications of the findings and the limitations, together with their significance for future research. Relate the observations to other relevant studies.
CONCLUSIONS
Link the conclusions with the aims of the study, but avoid un-qualified statements and conclusions not completely supported by the data. Avoid claiming priority and alluding to work that has not been completed. Recommendations, when appropriate, may be in-cluded.
ACKNOWLEDGEMENT(in italics) Those who have given technical assistance, or moral
or financial support, or supplied equipment or materials, or engaged in translation or general supervision, etc., should be recognized in the Acknowledgements.
REFERENCES
As described above.
Notes and Short Communications. Such manuscripts should have the same form as full papers, but are much shorter. Separate headings are needed only for the Abstract, Key words, main Text, Acknowledgements and References. These scripts fall under the above main headings and should be marked accordingly.
Technical Notes. Such notes should record a new method, tech-nique, or procedure of interest to veterinary scientists. They should include the reason(s) for the new procedure, a comparison of re-

54
sults obtained by the new method with those from other methods, together with a discussion of the advantages and disadvantages of the new technique. A technical note should not exceed six pages, including figures and tables.
Research Communications. These are short articles, no more than four pages, which should introduce novel and significant find-ings to the commonwealth of veterinarians.
Review Articles. These should provide a substantial survey, with an appropriate historical perspective, of the literature on some aspect of veterinary medicine. Alternatively, such articles may re-view a topic of veterinary interest, which may not come within the normal purview of many veterinarians. Authors submitting review manuscripts should include a section describing the methods used for locating, selecting, extracting, and synthesizing data. These methods should be summarized in the abstract.
Observations. Research of this kind contributes to knowledge, but not to the advancement of ideas or the development of con-cepts. In some cases, these papers underpin what may seem obvi-ous, with statistical data. Such communications should not exceed four pages.
Current Issues. papers that deal with issues of topical interest to veterinary scientists will be considered. Issues may include items on environmental concerns, legislative proposals, etc.
Book reviews. book reviews may be submitted. They should bring a new text to the readership and evaluate it.
Letters to the Editor. These are items of scientific corre-spon-dence, designed to offer readers the chance to discuss or comment on published material and for authors to advance new ideas. Should a letter be polemical, a reply or replies for simultaneous publication may be sought from interested parties.
Editorial Board