P R O B A B L E E V I D E N C E FOR P E R I O D I C I T I E S IN
16
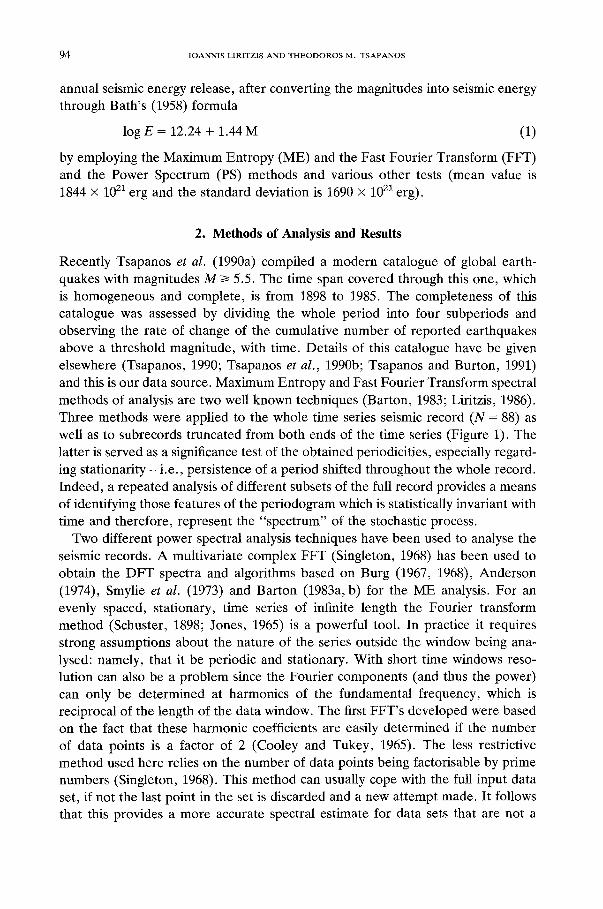
PROBABLE EVIDENCE FOR PERIODICITIES IN GLOBAL SEISMIC ENERGY RELEASE IOANNIS LIRITZIS Research Center for Astronomy and Applied Mathematics, Academy of Athens, Athens, Greece and THEODOROS M. TSAPANOS Geophysical Laboratory, University of Thessaloniki, Macedonia, Thessaloniki, Greece (Received 12 June, 1992) Abstract. A complete data set of globally distributed shallow (h ~<60 Km) earthquakes have been used for first time to test the possible existence of periodicities in the seismic energy release. Only main shocks of magnitude, M >/7.0 were considered, which occurred in the whole Earth during 1898- 1985. These magnitudes are converted in seismic energy, which is released during the occurrence of earthquakes, through Bath's formula. The detection of such kind of periodicities is important in seismology, because these patterns may lead to the prediction of large earthquakes. Statistical tech- niques, such as Maximum Entropy (ME), and two Fourier approaches, the Fast Fourier Transform (FFT) and Power Spectrum (PS) of truncated subrecords of the whole time series have been applied to examine the possible existence of such periodicities in seismic energy release. Furthermore, the even-spacing technique is used to validate our results and a type-curve has been constructed for the data set. The results exhibit a network of periodicities with predominant periods at 3(+0.5), 4.5, 6.5, 8-9, 14-20, and 31-34 years. Some periods were occasionally interrupted. The latter implies that our time- series is not stationary, in that, the spectral peaks drift when the data are viewed through different time windows. The fact that the signal is weak and embedded in less accurate older data could contribute to this effect. The question of stability/vahdity of the apparently cyclic behaviour of the annual global seismic energy release, is one which requires further investigation. 1. Introduction Several efforts have been made for earthquake prediction using different statistical methods or parameters (Sadovsky and Nersesov, 1974; Rikitake, 1976; Dmowska, 1977; Papazachos, 1977, McCann et al., 1979; Wyss and Habermann, 1979; Papa- zachos, 1980; Johnston et al., 1981, Wyss and Baer, 1981, Davis and Johnston, 1983; Varotsos and Alexopoulos, 1984; Makropoulos and Burton, 1985b; Meyer and Pirjola, 1986). One way to prediction is based on the recurrence of past earthquake occur- rences. The recurrence period is investigated through different statistical proce- dures. Such a periodicity or periodicities is usually correlated with other phenom- ena mainly of terrestrial origin (Morgan et al., 1961; Simpson, 1967a, b; Shimshoni, 1971; Sadeh and Meidav, 1973; Kovach, 1975; Shirley, 1988). In the present work a complete data set of globally distributed earthquakes for the period 1898-1985 (M i> 7.0 and h ~< 60 Kin) has been spectrally analysed as Earth, Moon, and Planets 60: 93-108, 1993. © 1993 Kluwer Academic Publishers. Printed in the Netherlands.
Transcript of P R O B A B L E E V I D E N C E FOR P E R I O D I C I T I E S IN
P R O B A B L E E V I D E N C E FOR P E R I O D I C I T I E S IN
G L O B A L S E I S M I C E N E R G Y R E L E A S E
IOANNIS L I R I T Z I S
Research Center for Astronomy and Applied Mathematics, Academy of Athens, Athens, Greece
and
T H E O D O R O S M. TSAPANOS
Geophysical Laboratory, University of Thessaloniki, Macedonia, Thessaloniki, Greece
(Received 12 June, 1992)
Abstract. A complete data set of globally distributed shallow (h ~< 60 Km) earthquakes have been used for first time to test the possible existence of periodicities in the seismic energy release. Only main shocks of magnitude, M >/7.0 were considered, which occurred in the whole Earth during 1898- 1985. These magnitudes are converted in seismic energy, which is released during the occurrence of earthquakes, through Bath's formula. The detection of such kind of periodicities is important in seismology, because these patterns may lead to the prediction of large earthquakes. Statistical tech- niques, such as Maximum Entropy (ME), and two Fourier approaches, the Fast Fourier Transform (FFT) and Power Spectrum (PS) of truncated subrecords of the whole time series have been applied to examine the possible existence of such periodicities in seismic energy release. Furthermore, the even-spacing technique is used to validate our results and a type-curve has been constructed for the data set.
The results exhibit a network of periodicities with predominant periods at 3(+0.5), 4.5, 6.5, 8-9, 14-20, and 31-34 years. Some periods were occasionally interrupted. The latter implies that our time- series is not stationary, in that, the spectral peaks drift when the data are viewed through different time windows. The fact that the signal is weak and embedded in less accurate older data could contribute to this effect. The question of stability/vahdity of the apparently cyclic behaviour of the annual global seismic energy release, is one which requires further investigation.
1. Introduction
Severa l effor ts have b e e n m a d e for e a r t h q u a k e p r e d i c t i o n using d i f fe ren t s ta t is t ica l
m e t h o d s or p a r a m e t e r s (Sadovsky and Ner sesov , 1974; R i k i t a k e , 1976; D m o w s k a ,
1977; P a p a z a c h o s , 1977, M c C a n n et al., 1979; Wyss and H a b e r m a n n , 1979; Papa -
zachos , 1980; J o h n s t o n et al. , 1981, Wyss and B a e r , 1981, Davis and Johns ton ,
1983; V a r o t s o s and A l e x o p o u l o s , 1984; M a k r o p o u l o s and Bur ton , 1985b; M e y e r
and P i r jo la , 1986).
O n e way to p r e d i c t i o n is b a s e d on the r ecu r r ence of pas t e a r t h q u a k e occur-
rences . The r ecu r r ence p e r i o d is i nves t iga t ed t h r o u g h d i f fe ren t s ta t is t ica l p roce -
dures . Such a pe r iod i c i t y o r pe r iod ic i t i e s is usua l ly c o r r e l a t e d with o t h e r p h e n o m -
ena ma in ly o f t e r r e s t r i a l or ig in ( M o r g a n et al., 1961; S impson , 1967a, b; Sh imshoni ,
1971; S a d e h and M e i d a v , 1973; K o v a c h , 1975; Shir ley , 1988).
In the p r e sen t w o r k a c o m p l e t e d a t a set of g loba l ly d i s t r i bu t ed e a r t h q u a k e s for
the p e r i o d 1898-1985 ( M i> 7.0 and h ~< 60 Kin) has b e e n spec t ra l ly ana lysed as
Earth, Moon, and Planets 60: 93-108, 1993. © 1993 Kluwer Academic Publishers. Printed in the Netherlands.
94 IOANNIS LIRITZIS A N D THIEODOROS M. TSAPANOS
annual seismic energy release, after converting the magnitudes into seismic energy through Bath's (1958) formula
log E = 12.24 + 1.44 M (1)
by employing the Maximum Entropy (ME) and the Fast Fourier Transform (FFT) and the Power Spectrum (PS) methods and various other tests (mean value is 1844 x 1021 erg and the standard deviation is 1690 x 1021 erg).
2. Methods of Analysis and Results
Recently Tsapanos et al. (1990a) compiled a modern catalogue of global earth- quakes with magnitudes M/> 5.5. The time span covered through this one, which is homogeneous and complete, is from 1898 to 1985. The completeness of this catalogue was assessed by dividing the whole period into four subperiods and observing the rate of change of the cumulative number of reported earthquakes above a threshold magnitude, with time. Details of this catalogue have be given elsewhere (Tsapanos, 1990; Tsapanos et a l . , 1990b; Tsapanos and Burton, 1991) and this is our data source. Maximum Entropy and Fast Fourier Transform spectral methods of analysis are two well known techniques (Barton, 1983; Liritzis, 1986). Three methods were applied to the whole time series seismic record (N = 88) as well as to subrecords truncated from both ends of the time series (Figure 1). The latter is served as a significance test of the obtained periodicities, especially regard- ing stationarity - i.e., persistence of a period shifted throughout the whole record. Indeed, a repeated analysis of different subsets of the full record provides a means of identifying those features of the periodogram which is statistically invariant with time and therefore, represent the "spectrum" of the stochastic process.
Two different power spectral analysis techniques have been used to analyse the seismic records. A multivariate complex FFT (Singleton, 1968) has been used to obtain the DFT spectra and algorithms based on Burg (1967, 1968), Anderson (1974), Smylie et al. (1973) and Barton (1983a, b) for the ME analysis. For an evenly spaced, stationary, time series of infinite length the Fourier transform method (Schuster, 1898; Jones, 1965) is a powerful tool. In practice it requires strong assumptions about the nature of the series outside the window being ana- lysed: namely, that it be periodic and stationary. With short time windows reso- lution can also be a problem since the Fourier components (and thus the power) can only be determined at harmonics of the fundamental frequency, which is reciprocal of the length of the data window. The first FFT's developed were based on the fact that these harmonic coefficients are easily determined if the number of data points is a factor of 2 (Cooley and Tukey, 1965). The less restrictive method used here relies on the number of data points being factorisable by prime numbers (Singleton, 1968). This method can usually cope with the full input data set, if not the last point in the set is discarded and a new attempt made. It follows that this provides a more accurate spectral estimate for data sets that are not a

PERIODICITIES IN G L O B A L SEISMIC E N E R G Y R E L E A S E 9 5
t ;>* ¢Do C52~ LtA,- Z L_U
(-3
Fig. 1.
i1900 I I I I
1910 1920 1930 1940 1950 1960 1970
TIME (YEARS) - - 1980 1985
Annual seismic energy release (x 1021 erg) of main global shallow shocks (M/> 7.0, h ~< 60 km), for the period 1898-1985.
factor of two, than by padding with zeros or reducing the number of the data points to the next factor of two. Before the FFT is performed the data is detrended by the removal of a first order polynomial. It can then optionally be tapered by multiplying the first and last 10% of the data by a half cosine bell. More sophisti- cated tapers are not used since the likely errors introduced by leakage will be less than the likely measurement and recording errors of the geomagnetic field from the sediment.
Maximum entropy method analysis is a parametric modelling approach to the estimation of the power spectrum of a time series. The method is data adaptive being based upon an autoregressive (AR) modelling process. An A R process is predictive; any point (after the first) can be calculated by a linear combination of a previous number, m, of the values of the data points with the addition of some "innovat ion" factory (Yule, 1927). The order of the process, in this case rn, is the number of immediately previous points that have been used in the calculation of the new point. The mean of both the process and the innovation are made to be zero. The power spectrum of such a process can then be easily calculated (e.g. Ulrych and Bishop, 1975).
96 IOANNIS LIRITZIS AND THEODOROS M. TSAPANOS
Burg (1967, 1968) introduced the idea of the ME. This essentially involves fitting an AR model to the data with the constraint that the resultant estimate of the spectra should be based upon information totally contained within the data and make no assumptions about the data outside the window analysed. This constraint is satisfied by an AR process of order m. The coefficients of this process are called the prediction error filter (per) because the convolution of this filter with the data will result in the model error (the "innovation" above). The spectra for such a model can thus easilly be estimated with a single additional condition; the mean of the prediction error powers (obtained by running the per along the data, but not off, in a forward and reverse direction) should be a minimum. The power spectral estimate is then based purely upon the data available and makes no assumptions about data outside the window. For this reason this method is (and such data adaptive methods in general are) particularly suitable for short series.
There remains a problem: the section of the length of the per. If m is chosen to be too small, the model smooths the data excessively and the resulting estimate of the power spectra is poorly resolved. If m is choosen to be too large, frequency shifting and spontaneous splitting of peaks can occur resulting in a poorly defined estimate of the spectrum (Fougubre et al., 1976). Objective methods do exist, although the lack of agreement on which is best shows how the choice is very dependent on the data being analysed.
The program ME uses the suggestions made by: (a) Ulrych and Bishop (1975) and (b) Berryman (1978).These are:
(a) that m is between N/3 and N/2 (b) that m -~ 2N/ln 2N
where N is the number of data points. Modelling of the secular variation has shown that m = N/3 is too short and excessively smooths the data and that m = N/2 is too long, producing spurious peaks. For this work the optimum order for all the models is found to be close to that suggested by Berryman. Interestingly this method works better with noisier data especially with short data sets. Even a per length of N/3 is too long for the noise free data.
a ) T I M E S E R I E S A N A L Y S I S
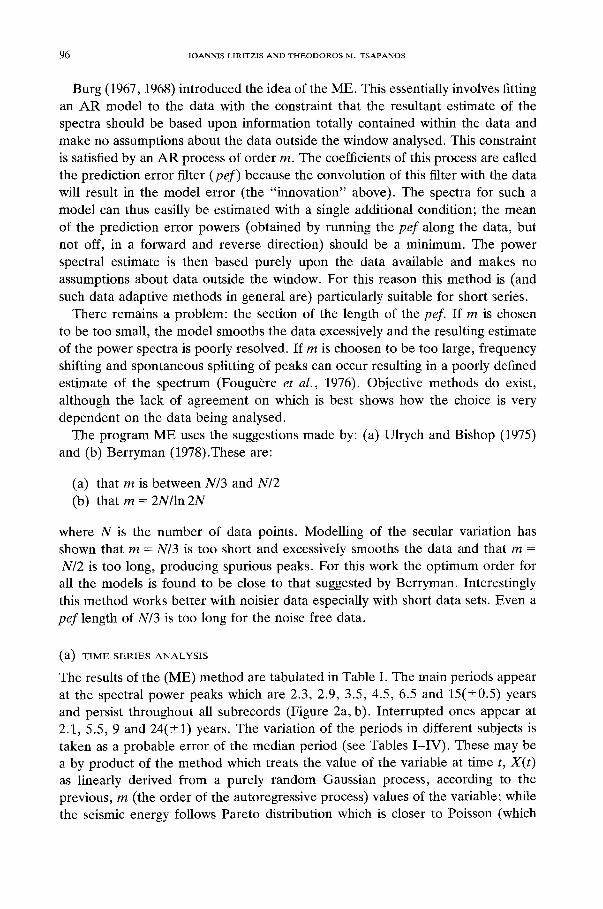
The results of the (ME) method are tabulated in Table I. The main periods appear at the spectral power peaks which are 2.3, 2.9, 3.5, 4.5, 6.5 and 15(-+0.5) years and persist throughout all subrecords (Figure 2a, b). Interrupted ones appear at 2.1, 5.5, 9 and 24(-+1) years. The variation of the periods in different subjects is taken as a probable error of the median period (see Tables I-IV). These may be a by product of the method which treats the value of the variable at time t, X(t) as linearly derived from a purely random Gaussian process, according to the previous, m (the order of the autoregressive process) values of the variable; while the seismic energy follows Pareto distribution which is closer to Poisson (which
PERIODICITIES IN G L O B A L SEISMIC E N E R G Y R E L E A S E 97
o 15.3
28
°6.0 FREQ (C/KY}
Fig. 2.
C:, 2.3
6.4 4.5
15,3 15.51 3.6
0.0 FREQ (C/KY)
341
5.0
Maximum entropy spectrum: (a) for m = 28 and (b) m = 34, indicating periodicities in years.
TABLE I
Maximum Entropy method used to obtain the following periods for truncated records
Truncated time records in intervals Periods in years
1898-1940 1941-1985 1908-1985 1918-1985 1928-1985 1938-1985 1898-1985 (m = 3144) 1898-1968 1898-1958 1898-1948 1898-1938
15.3 6.7 5.6 24.8 9.0 6.4 23.4 15 .3 8.84 6.4 5.4 26.5 14.7 9.04 6.4 26.5 15.9 8.65 6.2 ~ . 9 9.47 6.3 36.3 15 .3 8.85 6.42 5.52
44.2 15 .3 9.04 6.4 5.6 44.2 15.3 6.12
14.7 5.76 ]_4.2 6.75 5.6
4.97 4.4 3.6
3.7 4.47 3.72 4.5 3.68
3.68 4.68 3.75 4.52 3.59
2.9 2.7 2.9 2.7
2.65 2.7 2.73
2.9 2.72
2.3 2.3 2.3 2.34 2.37 2.37 2.31
4.47 3.55 2.9 4.37 3.59 2.8 4.42 3.55 2.86 4.33 3.52 2.84
2.73 2.3 2.31 2.28 2.29
2.2 2.1 2.08 2.08 2.08 2.09
(__): Significant pronounced spectral power S(f). ( - - - ) : Less significant.

98 IOANNIS LIRITZIS AND THEODOROS M. TSAPANOS
TABLE IIa
Periods obtained by using the Fast Fourier Transform method for three subsets of data
Subsets Periods in years
1898-1985 4.4 17.6 8.8 6.3 4.6 3.7 2,84 2.3 2.09 1898-1940 4.2 14.0 7.0 5.25 3.5 2.33 1940-1985 2.3 9._~2 6.__6_6 _3_.83. 2.7 2._33
TABLE IIb
Power spectrum periods and significance levels
Period (yrs) 20 ± 10" 5.7 -+ 0.7 3.6 + 0.4 2.8 ± 0.2 2.3 --- 0.2 significance 90-95% 99% 95% 90% 95-99%
*Errors taken as -+ one point around the peak in spectral shape which is almost equal to ±FWHM.
TABLE III
Periods obtained by using the Maximum Entropy method covering the time period 1898-1985 and for different (m). Notice the persistence and split of some periodic terms indicated by arrows
m Periods in years
7 5.3____8 2.47
14 19.9 5.76 3.S_33 2 . 8 _ . 8 8 / 2 . t 3 I /
_ ~ . 2.9 2.3 24 372/ -- 159 62/" 442 8 _ l 4 i / ' ~ l
34 39.8 15.3 8.85 6.42 5.53 4.5 3.__.6 2,9 2._..77 2.___3.3 2,09
44 3~.2 15..__3 ~ ci.2 5.4 3 ~.lkll .7=7.. 2 ~ 2.22
54 3 9 . 8 ~ 3 .6 1 7 3 / ~4.2 ,f"~' ] I " i / , l ~ ~9 3.6 3 2.88 2.7 2.44 . II 8.8 ,i 6.4 5,7 5.3r/ 5 . . . . ~ ~ t 2 , 25 /
54 9.9/5 X6 1 "-,l .'" "~ l l ~i "~-- I l -]-" I ;!-6 -i'f"""~-17 2~3 2.09 23.~ 16,5 14.....~2 II 8....88 7.1 6...~4 5.7 5.4 4.5 ..:_ 2.9 2, 2.03
( - - ) : Significant. ( - - - ) : Less significant.
TABLE IV
Evenspaced time series and periods obtained from Maximum Entropy method
Evenspacing (yrs) Periods in years
2 39.8 17.3" 13.5 8.7 6.4 3 30.6 8.9 6.8 4 33,9 16.4 12.9 8.9 8 72.4 31.5" 19.9
11 61.7 33.0 1 39.8 15.3 8.8 6.4 5.5 4.5 3.6 2.9 2.3
*The evenspacing smooths out the data and provides a clearer periodic term. This seems to be the case for the principal perturbation of the Moon's orbit around the ecliptic of 18.6 years, which appears as 17-20 years.
PERIODICITIES IN GLOBAL SEISMIC ENERGY RELEASE 99
q 2.3
6.3 u~ 46 3.6
(3.0 FREQ (C/KY)
!.09
4.8
Fig. 3.
00
80
6¢
#C
C
2C
LAGS
5 . 7
if 3 6 2 8 2 3
Vo:t,\::: " " oooooo
10 20 o-~.
30 b
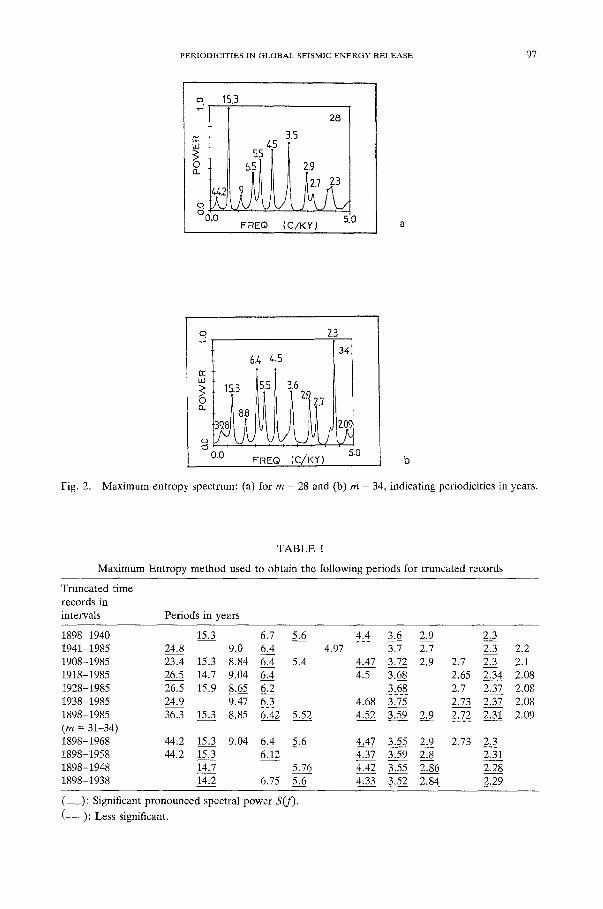
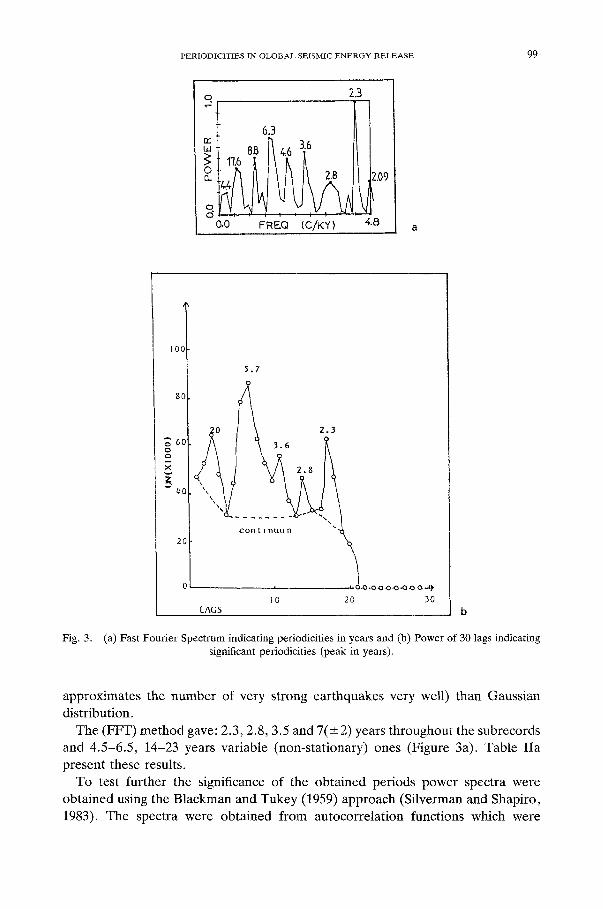
(a) Fast Fourier Spectrum indicating periodicities in years and (b) Power of 30 lags indicating significant periodicities (peak in years).
approximates the number of very strong earthquakes very well) than Gaussian distribution.
The (FFT) method gave: 2.3, 2.8, 3.5 and 7( + _ 2) years throughout the subrecords and 4.5-6.5, 14-23 years variable (non-stationary) ones (Figure 3a). Table IIa present these results.
To test further the significance of the obtained periods power spectra were obtained using the Blackman and Tukey (1959) approach (Silverman and Shapiro, 1983). The spectra were obtained from autocorrelation functions which were
100 IOANNIS LIR1TZIS AND THEODOROS M. TSAPANOS
truncated at 20 lags. In Figure 3b the ordinates are the fraction of the total variance (power) of the time series contained in a narrow band centered on each frequency (normalized frequencies, UN). The abscissa is the lags (or frequency) on a linear scale. The underlying continuum appears to be a red noise spectum. The significance of the peaks appearing in the spectrum is given according to the distribution of Chi-square divided by the number of equivalent degrees of freedom. In fact, the significance is the ratio of the peak to the continuum. The period is given by T = mult ipl ier , 2 , lag/freq. = 40/freq. (where freq. is the frequency) and the degrees of freedom is df = (2 * number of data points - lag/2)/lag = 8. For significance level 1% the above ratio is 2.51 for 5% it is 1.938 and for 10% it is 1.67. From an inspection of Figure 3b, the obtained periods and their signifi- cance is given in Table IIb. The higher significance is then attached to 5.7 -+ 0.7, 2.3-+ 0.2 followed by 3.6 ± 0.4, 20 ± 10 and 2.8 ± 0.2 year periods. All these periods were also found by ME and FFT methods of analysis either as fixed or variable ones in the whole series and its subsets. But their significance in these two methods was indirectly examined by other tests - i.e., analysis of truncated records and effect of variation of (m) on shift/split of respective peaks (see below). In all above cases the instability of some periods imply non-stationarity of the series, which may be due to either inexact recording of earlier earthquakes or it may be an effect of the way the data were produced. We recognise, however, that such behavior may be indicative of a weak signal embedded in noise or of a false signal generated merely by methodological assumptions. In either cases, the periodic nature of the series is a complex phenomenon. The time-series was also evenspaced at 2, 3, 4, 8, and 11 year intervals, in order to identify any longer period. The periods here are: 31-34, 14-21, 8-9, and 46.5 years.
The choice of the order (m) of the autoregressive process (or filter length) was also checked for. For m = 7-64 the shift/split effect of some periods is shown in Table III. Such diagrams clearly delineate the zones of instability and line spliting, thus demonstrating how the region of stability varies with (rn) and are also served as a significance test of a period.
Applying Berryman's criterion where rn = 2N/ln 2N, it was found that the best stable region, where periods were persistent was for rn = 20-40. For this region of (rn) the obtained periods for the whole record were: 2.3, 2.9, 3.6(+-0.5), 4.5, 6.2(+-0.5) and 15.3(-+1) years, which are almost similar to those found by ME, FFT and PS methods. This is another test to ascertain a degree of significance to the obtained periodicities.
(b) C O N S T R U C T I O N O F A T Y P E - C U R V E
An attempt was made to smooth the present data using an increasing number of cubic splines. The fortran program used, removes a percentage of the data points before each smoothing and then calculates what is the residual between the smoothed curve and the central points. The root mean square residual error of all the removed points (called the cross validation mean square error CVMSE) is
3,~
3.0
2.5
2.0
E
1.5
40/ 3.5
PERIODICITIES IN G L O B A L SEISMIC E N E R G Y R E L E A S E 1 0 1
1907 1927 1947 1967- 1987
Time
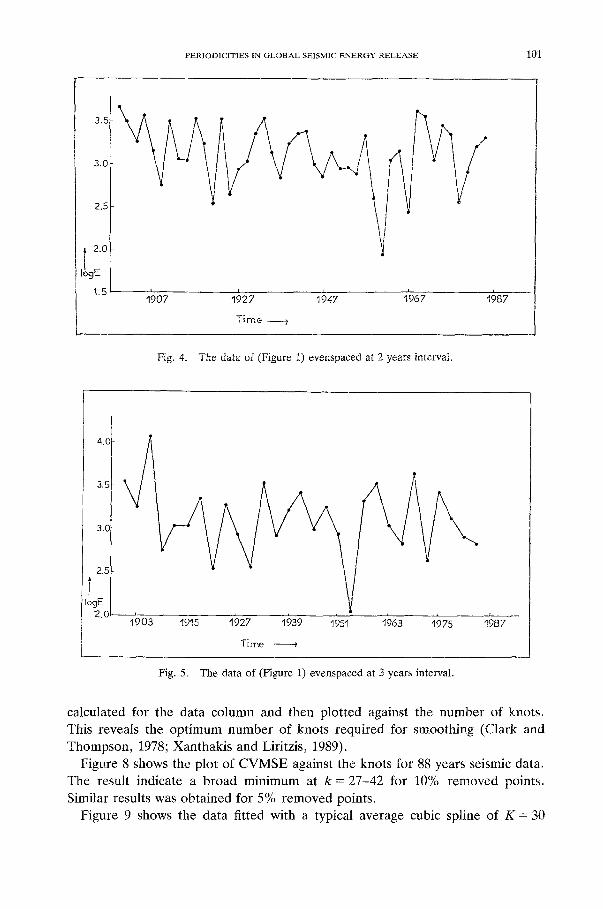
Fig. 4. The data of (Figure 1) evenspaced at 2 years intervaI.
3.0
~. 2,5
!f0 i tb0a l ~ s 1027 19a9 19si 1~)63 1~)zs l~)~z
Ti me
Fig. 5. The data of (Figure 1) evenspaced at 3 years interval.
calculated for the data column and then plotted against the number of knots. This reveals the optimum number of knots required for smoothing (Clark and Thompson, 1978; Xanthakis and Liritzis, 1989).
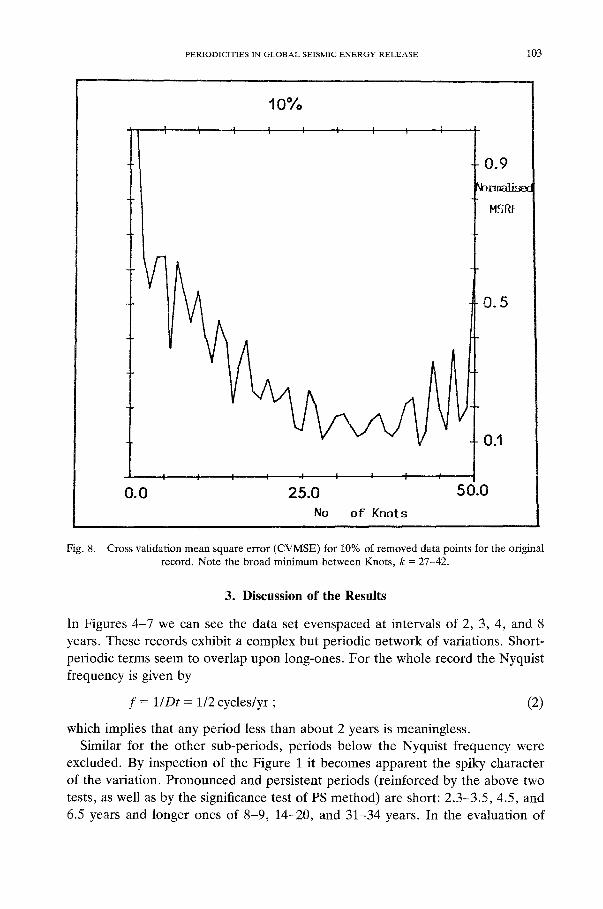
Figure 8 shows the plot of CVMSE against the knots for 88 years seismic data. The result indicate a broad minimum at k = 27-42 for 10% removed points. Similar results was obtained for 5% removed points.
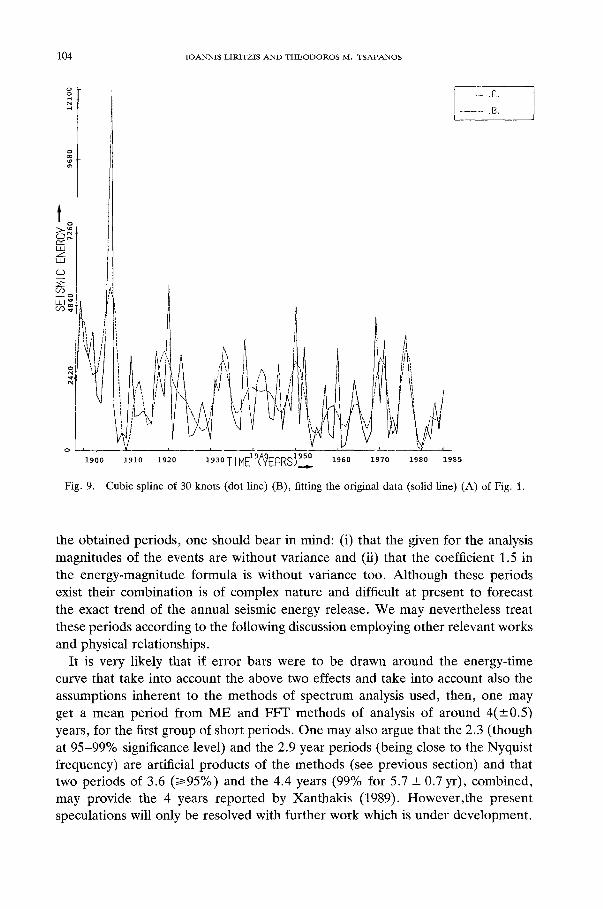
Figure 9 shows the data fitted with a typical average cubic spline of K = 30

102 IOANN1S LIRITZIS A N D T H E O D O R O S M. TSAPANOS
i 3.5~
3.0
2.5i
2.C
I
1'901 1917 1933 1449 T i m e .
Fig. 6. The data of (Figure 1) evenspaced at 4 years interval.
3.5
3.0
~..5
~-.0
19 05 1921 1937
Time
1953 1969 1985
Fig. 7. The data of (Figure 1) evenspaced at 8 years interval.
knots, with a satisfactory resemblance to the original data. Such spectral smoothing removes uncertain data (outliers) and following the significant periodic nature of the variation may be considered as a type-curve, which represents the annual seismic energy release variations. Spectrum analysis of this curve gave almost similar periods to the obtained above, exept for the two very small ones, a result of the smoothing.
10%
0.0 I I I I I I I I I
25.0
I I | I I I i I
PERIODICITIES IN G L O B A L SEISMIC E N E R G Y R E L E A S E 103
0.9
bnr~ i .~
NSRE
0.5
0.1
50.0 No o f Knots
Fig. 8. Cross validation mean square error (CVMSE) for 10% of removed data points for the original record. Note the broad minimum between Knots, k = 27-42.
3. Discussion of the Results
In Figures 4 -7 we can see the data set evenspaced at intervals of 2, 3, 4, and 8 years. These records exhibit a complex but periodic network of variations. Short- periodic terms seem to overlap upon long-ones. For the whole record the Nyquist frequency is given by
f = 1 / D t = 1/2 cycles/yr ; (2)
which implies that any period less than about 2 years is meaningless. Similar for the other sub-periods, periods below the Nyquist frequency were
excluded. By inspection of the Figure 1 it becomes apparent the spiky character of the variation. Pronounced and persistent periods (reinforced by the above two tests, as well as by the significance test of PS method) are short: 2.3-3.5, 4.5, and 6.5 years and longer ones of 8-9, 14-20, and 31-34 years. In the evaluation of
104 IOANNIS LIRITZIS AND THt~ODOROS M. TSAPANOS
i LU Z 1.12
C_~
0%
1900
Fig. 9.
.A.
. . . . . . .B. [
~ t _ _ i _ _ ~91o 1920 ~ga0TIME~9~#EARS~95_~ a 1960 1970 1980 1982
Cubic spline of 30 knots (dot line) (B), fitting the original data (solid line) (A) of Fig. 1.
the obtained periods, one should bear in mind: (i) that the given for the analysis magnitudes of the events are without variance and (ii) that the coefficient 1.5 in the energy-magnitude formula is without variance too. Although these periods exist their combination is of complex nature and difficult at present to forecast the exact trend of the annual seismic energy release. We may nevertheless treat these periods according to the following discussion employing other relevant works and physical relationships.
It is very likely that if error bars were to be drawn around the energy-time curve that take into account the above two effects and take into account also the assumptions inherent to the methods of spectrum analysis used, then, one may get a mean period from ME and FFT methods of analysis of around 4(+-0.5) years, for the first group of short periods. One may also argue that the 2.3 (though at 95-99% significance level) and the 2.9 year periods (being close to the Nyquist frequency) are artificial products of the methods (see previous section) and that two periods of 3.6 (>195%) and the 4.4 years (99% for 5.7 -- 0.7 yr), combined, may provide the 4 years reported by Xanthakis (1989). However,the present speculations will only be resolved with further work which is under development.

P E R I O D I C I T I E S IN G L O B A L S E I S M I C E N E R G Y R E L E A S E [ 0 5
The triggering mechanisms for earthquake prediction are not sufficiently known, through several speculations there exist. Earthquakes can not yet be predicted with complete certainty because we do not fully comprehend the mechanism that produces them.
General zones or belts where earthquakes occur can be defined and viewed in the broader context of sea floor spreading and plate tectonics. However, earth- quakes are abrupt and sporadic in occurrence and this seems to be a basic difficulty for prediction. Moreover the seismic energy release cannot, at present, be corre- lated with some specific influencing factor. Perhaps the revealed synthesized pic- ture of global seismic energy variations, which is consisted from a network of different periods superposed one upon each other, may arise from specific periodic triggering forces and may be a manifestation of the chaotic motion in the magne- tohydrodynamical process in the Earth's core (Xanthakis and Liritzis, 1991). A physical reason remains to be found for the obtained periods, probably by reanalys- ing shallow earthquakes of focal depths <30 Km i.e., in the crust, or different data set.
In our endeavour to assess the obtained periodicities it was thought to refer to periodicities in earthquake occurrences in other analyses. The 3.9 years periodicity has been reported on analysis of earthquake occurrencies by using 7039 aftershocks (1964-1972) apart from the solar and sidereal periods (Sadeh and Meidav, 1973).
Preliminary attribution of this period is given to a triggering source within the solar system possibly due to changes in the direction of the mass distribution in the solar system with a similar period. Xanthakis (1989) reported periodicities of 4 and 22 years for large earthquake occurrences (M ~> 6.8) for the period 1901- 1981. Xanthakis (1982) also claimed the existence of possible periodicities of annually global seismic energy release (M 1> 7.9) for the period 1898-1971; these are 4, 25, and 180 years (Shimshoni, 1984; Xanthakis, 1984). In particular, the 4 years period was of high significance (99%). The two periodic terms appeared sporadically overlapping either in the same or in opposite phase forming a kind of "network" of sinusoidal waves with constant period and different amplitude.
It is also remarkable that a period of 34.5 years was found with ME analysis of the length-of-day variation at Zo-se, China, a parameter which is the result of Earth's rotation (Wang et al., 1982). The latter may well apply to periodic torques which cause strain release in plate tectonics. Coincidentally a 35.2 years period was also found for the geomagnetic index Ap (Fraser-Smith, 1972). Furthermore, the luni-solar tidal forces of 18.6 years should be mentioned as a small but contributing triggering factor, while the longest period of 30-35 years may be related also, to the period of approximately 30 years elapsed before the librations of the Moon (results of geometry of the Moon's orbit) have brought all possible areas of the Moon's surface of 59% into view. Following the results of the spectral analysis, an inspection in Figures 1-5 implies increased global seismic energy release for the coming years (1985 onwards), with particular excesses probably at regular intervals of 2.3-3.5 or 3(-0 .5) , 6.5 + 0.7, and 20 -+ 10 (90-95%) years.
106 IOANNIS LIRITZIS A N D T H E O D O R O S M. TSAPANOS
4. Conclusions
Maximum Entropy and Fast Fourier Transform methods of analysis as well as the evenspacing technique revealed the possible existence of various fixed or variable periodicities of 2.3-4, 5.5-6.5, 8-9, 14-20, and 31-34 years (their significance being assessed by various preliminary tests). This indicates that the spectrum does seem to represent a random sample from a normal distribution. The seismic energy time-series (1898-1985) was analysed as a whole and in subrecords, while the choice of the order of autoregressive process and its effect on the obtained period- icities was checked for and the rn = 20-40 was the stable region. The seismic data were smoothed with appropriate cubic splines. Some artificial products of the methods were identified (e.g., due to Pareto instead of Gaussian distribution, assumptions regarding stochastic processes inside and outside the analysed record) as possible sources of error.
The analysis indicates increased global seismic energy release from 1985 and onwards and for, at least, 10 years later. The present work is of preliminary nature. The consideration of the complex periodic nature of seismic energy release, which appears as a network of fixed/variable periods, is an interesting problem which warrants further investigation.
Greater attention, therefore, must be paid to temporal changes in studies of the variability of seismic energy release as has been indicated by the present work.
Acknowledgements
We are grateful to Prof. K. Creer for accepting us in the Geophysics Depar tment , University of Edinburgh, U.K. and for fruitful discussions. TMT expresses his thanks to Prof. B. C. Papazachos for his continuing encouragement and for allowing leave of absence from the University of Thessaloniki. IL thanks Prof. S. Silverman for loan of his power-spectrum program, and Mr. P. Telonis for help with computing. This work was carried out when both authors were visiting research fellows in the Geophysics Depar tment , University of Edinburgh, U.K.
References
Anderson, N.: 1974, 'On the Calculation of Filter Coefficients for Maximum Entropy Spectral Analy- sis', Geophysics 39, 69-72.
Barton, C. E.: 1983a, 'Analysis of Palaeomagnetic Time Series Techniques and Applications', Geophys. Surveys 5, 335-368.
Barton, C. E.: 1983b, Spectrum Analysis in Archaeomagnetism of Baked Clays and Recent Sediments, in K. M. Creer, P. Tucholka, and C. E. Barton (eds.), Elsevier, pp. 262-266.
Bath, M.: 1958, 'The Energies of Seismic Body-Waves and Surface-Waves', in H. Benioff, M. Ewing, B. F. Howell, Jr., and F. Press (eds.), Contribution in Geophysics, Pergamon, London, pp. 1-16.
Blackman, R. G. and Tukey, J. W.: 1959, The Measurement of Power Spectra from the Point of View of Communications and Engineering, Dover, New York.
Burg, J. P.: 1967, 'Maximum Entropy Spectral Analysis', 37th Ann. International Meeting Soc. Explor. Geophys., Oklahoma City.
P E R I O D I C I T I E S IN G L O B A L S E I S M I C E N E R G Y R E L E A S E 1 0 7
Burg, J. P.: 1968, 'A New Analysis for Time Series Data', Adv. Study Inst. on Signal Processing, NATO, Enschede.
Clark, R. M. and Thompson, R. A.: 1978, 'An Objective Method for Smoothing Palaeomagnetic Data', Geophys. J. R. Astr. Soc. 52, 205-213.
Cooley, J. W. and Tukey, J. W.: 1965, 'An Algorithm for the Machine Calculation of Complex Fourier Series', Math. Comp. 19, 297-301.
Davies, P. M. and Johnston, M. J. S.: 1983, 'Localized Geomagnetic Field Changes Near Active Faults in California 1974-1980', J. Geophys. Res. 88, 9452-9460.
Dmowska, R.: 1977, 'Electromechanical Phenomena Associated with Earthquakes', Geophys. Surveys 3, 157-174.
Fraser-Smith, A. C.: 1972, 'Spectrum of the Geomagnetic Activity Index Ap', J. Geophys. Res. 77, 4209-4215.
Fougu~re, P. F., Zawalick, E. J., and Radoski, H. R.: 1976, 'Spontaneous Line-Splitting in Maximum Entropy Power-Spectrum Analysis', Phys. Earth Plan. Int. 2, 201-207.
Johnston, M. J. S., Mueller, R. J., and Keller, V.: 1981, 'Pre-Seismic and Co-Seismic Magnetic Field Measurements Near the Coyote Lake, Earthquake of August 6, 1979', J. Geophys. Res. 86, 921- 926.
Jones, R. H.: 1965, 'A Reappraisal of the Periodogram in Spectral Analysis', Technometrics 7, 531- 542.
Kovach, R. L.: 1975, 'Earthquake Prediction and Modifications', in Understanding the Earth, Artemis Press, U.K., pp. 333-342.
Liritzis, Y.: 1986, 'Maximum Entropy and Power Spectum Analyses of Geomagnetic Intensity Varia- tions from Archaeomagnetic Data: Emphasis on the 200 Years Period', Earth Moon and Planets 34, 235-249
Makropoulos, K. C. and Burton, P. W.: 1985, 'Seismic Hazard in Greece. I: Magnitude Recurrence', Tectonophysics 117, 205-257.
McCann, W. R., Nishenko, S. P., Sykes, L. R., and Krause, J.: 1979, 'Seismic Gaps and Plate Tectonics: Seismic Potential for Major Boundaries', Pure Appl. Geophys. 117, 1082-1147.
Meyer, K. and Pirjola, R.: 1986, 'Anomalous Electrotelluric Residuals Prior to a Large Imminent Earthquake in Greece', Tectonophysics 125, 371-378.
Morgan, W. J., Stoner, J. O., and Dicke, R. H.: 1961, 'Periodicities of Earthquakes and the Invariances of the Gravitational Constant', J. Geophys. Res. 66, 3831-843.
Papazachos, B. C.: 1977, 'A Lithospheric Model to Interprete Focal Properties of Intermediate and Shallow Shocks in Central Greece', Pure Appl. Geophys. 115, 655-666.
Papazachos, B. C.: 1980, 'Seisrnicity Rates and Long-Term Prediction in the Aegean Area', Quatern. Geod. 3, 171-190.
Rikitake, T.: 1976, Earthquake Prediction. Elsevier, Amsterdam, 357 pp. Sadeh, D. S. and Meidav, M.: 1973, 'Search for Sidereal Periodicity in Earthquake Occurrences', J.
Geophys. Res. 78, 7709-7716. Sadovsky, M. A. and Nersesov, I. L.: 1974, 'Forecasts of Earthquakes on the Basis of Complex
Geophysical Features', Tectonophysics 23, 247-255. Schuster, A.: 1898, 'On the Investigation of Hidden Periodicities with Application to a Supposed 26
Days Period of Meteorological Phenomena', Terr. Magn. 3, 13-41. Shimshoni, M.: 1971, 'Evidence for Higher Seismic Activity During the Night', Geophys. J. R. Astr.
Soe. 29, 97-101. Shimshoni, M.: 1984, 'Discussion on "Possible Periodicities of the Annual Released Global Seismic
Energy (M I> 7.9) During the Period 1898-1971" by J. Xanthakis', Tectonophysics 107, 173-174. Shirley, J. H.: 1988, 'Lunar Periodicities of Large Earthquakes', Geophys. Journ. 92, 403-420. Silverman, S. M. and Shapiro, R.: 1983, 'Power Spectrum Analysis of Auroral Occurrence Frequency',
J. Geophys. Res. 88, 6310-6316. Simpson, J. F.: 1967a, 'Earth Tides as a Triggering Mechanism for Earthquakes', Earth Plan. Sci.
Lett. 2, 473-483. Simpson, J. F.: 1967b, 'Solar Activity as a Triggering Mechanism for Earthquakes', Earth Plan. Sci.
Lett. 3,417-430. Singleton, R. C.: 1968, 'Algorithm 339. "An ALGOL Procedure for the Fast Fourier Transform with
Arbitrary Factors (26)". Communications of the ACM11', 776-782.

1 0 8 1OANN1S L I R I T Z I S A N D T H E O D O R O S M. T S A P A N O S
Smylie, D. E., Clark, G. K. C. and Ulrych, T. J.: 1973, 'Analysis of Irregularities in the Earth's Rotation', In Methods in Computational Physics 13,391-430.
Tsapanos, T. M.: 1990, 'b-Values of Two Tectonic Parts in the Circum-Pacific Belt', Pageoph. 134, 229-242.
Tsapanos, T. M., Scordilis, E. M. and Papazachos, B. C.: 1990a, 'A Global Catalogue of Strong (M ~> 5.5) Earthquakes for the Period 1966-1985', Publication of University of Thessaloniki, Geo- physical Laboratory, No. 10, 90 pp.
Tsapanos, T. M., Scordilis, E. M., and Papazachos, B. C.: 1990b, 'Global Seismicity During the Time Period 1966-1985. Proc. of the XXII General Assembly of E.S.C., Barcelona 17-22 September 1990, (in press).
Tsapanos, T. M. and Burton, P. W.: 1991, 'Seismic Hazard Evaluation for Specific Seismic Regions of the World', Tectonophysics 194, 153-169.
Ulrych, T. J. and Bishop, T. N.: 1975, 'Maximum Entropy Spectral Analysis and Autoregressive Decomposition', Rev. Geophys. Space Phys. 13, 183-200.
Varotsos, P. and Alexopoulos, K.: 1984, 'Physical Properties of the Variations of the Electric Field of the Earth Preceding Earthquakes', Tectonophysics 110, 73-98.
Wang, Ding-Yi, Sun, Wei and Tschu-Kang, Knn: 1982, 'A Note on MESA and Spectral Analysis of the Hundred Year Geomagnetic Data at Zo-se', Geophys. J. R. Astr. Soc. 71, 275-283.
Wyss, M. and Habermann, R. E.: 1979, 'Seismic Quiescence Precursory to a Past and a Future Kuril Island Earthquake', Pure Appl. Geophys. 117: 1195-1211.
Wyss, M. and Baer, M.: 1981, 'Seismic Quiescence in the Western Hellenic Arc May Foreshadow Large Earthquakes', Nature 289: 785-787.
Xanthakis, J.: 1982, 'Possible Periodicities of the Annual Released Global Seismic Energy (M ~> 7.9) During the Period 1898-1971', Tectonophysics 81, T7-T14.
Xanthakis, J.: 1984, 'Reply on Shimshoni's (1984) Discussion', in Tectonophysics. Xanthakis, J.: 1989, 'Statistical Analysis of the Large Earthquakes of the Past Century', Prakt. of the
Academy of Athens 63, 1-9. Xanthakis, J. and Liritzis, Y.: 1989, 'Spectral Analysis of Archaeomagnefic Inclinations for the Last
2000 Years', Earth Moon and Planets 45, 139-151. Xanthakis, J. and Liritzis, Y.: 1990, 'Geomagnetic Field Variations as Inferred from Archaeomagnetism
in Greece and Palaeomagnetism in British Lake Sediments Since 7000 B.C.', Academy of Athens Publ., Vol. 53, pp. 222.
Yule, G. U.: 1927, 'On a Method of Investigating Periodicities in Disturbed Series, with Special Reference to Wolf's Sunspot Numbers', Phil. Trans. Roy. Soc. London, Ser. A226, 267-298.