
Involvement of extracellular matrix proteins in the course of experimental paracoccidioidomycosis

Extracellular Matrix Induced Gene Expression in Human BreastCancer Cells
Nandor Garamszegi1,2,§, Susanna P. Garamszegi1, Lina A. Shehadeh3, and Sean P.Scully1,2,3
1 Sarcoma Biology Laboratory of Sylvester Comprehensive Cancer Center, University of Miami Miller Schoolof Medicine 1550 NW 10th Ave Miami FL 33136
2 Departments of Orthopaedics, University of Miami Miller School of Medicine 1550 NW 10th Ave MiamiFL 33136
3 Molecular and Cellular Pharmacology, University of Miami Miller School of Medicine 1550 NW 10th AveMiami FL 33136
AbstractExtracellular matrix (ECM) molecules modify gene expression through attachment-dependent (i.e.,focal adhesion related) integrin receptor signalling. It was previously unknown whether the samemolecules acting as soluble peptides could generate signal cascades without the associatedmechanical anchoring, a condition that may be encountered during matrix remodelling, degradationand relevant to invasion and metastatic processes. In the current study the role of ECM ligandregulated gene expression through this attachment independent process was examined.
It was observed that fibronectin, laminin, collagens type I and II induce Smad2 activation inMCF-10A and MCF-7 cells. This activation is not caused by TGFβ ligand contamination or autocrineTGF involvement and is 3–5 fold less robust than the TGFβ1 ligand. The resulting nucleartranslocation of Smad4 in response to ECM ligand indicates downstream transcriptional responsesoccurring. Co-immunoprecipitation experiments determined that type II collagen and laminin actthrough interaction with integrin α2β1 receptor complex. The ECM ligand induced Smad activation(termed signalling crosstalk) resulted cell type and ligand specific transcriptional changes which aredistinct from the TGFβ ligand induced responses.
These findings demonstrate that cell-matrix communication is more complex than previouslythought. Soluble ECM peptides drive transcriptional regulation through corresponding adhesion andnon-attachment related processes. The resultant gene expressional patterns correlate with pathwayactivity and not by the extent of Smad activation. These results extend the complexity and the existingparadigms of ECM-cell communication to ECM ligand regulation without the necessity ofmechanical coupling.
KeywordsExtracellular matrix; TGFβ signalling; Breast Cancer; Gene expression
§Corresponding author: Nandor Garamszegi University of Miami Miller School of Medicine M877 Papanicolau Building Room 218,1550 N.W. 10th Avenue Miami FL 33136. Tel: 305-243-9859; Fax: 305-243-9445; E-mail: E-mail: [email protected] addresses: NG: [email protected], SG: [email protected], LAS: [email protected], SPS:[email protected]
NIH Public AccessAuthor ManuscriptMol Cancer Res. Author manuscript; available in PMC 2010 March 1.
Published in final edited form as:Mol Cancer Res. 2009 March ; 7(3): 319–329. doi:10.1158/1541-7786.MCR-08-0227.
NIH
-PA Author Manuscript
NIH
-PA Author Manuscript
NIH
-PA Author Manuscript
IntroductionIn breast cancer development ECM regulates gene expression and phenotype through adhesionmediated signalling (1,2). A strong body of evidence indicates the importance of this processin many aspects of tissue homeostasis regulation from stromal fibroblast activation (3) toepithelial to mesenchymal transformation in tumorigenesis (4). Previous studies have focusedon the role of ECM as a signal initiator in the context of an adhesion-related process. Tissueremodelling and protease degradation generates neoepitopes from ECM components thatpotentially act as “soluble” peptides in the peri-cellular microenvironment (5–8). Theseneoepitopes have been reported to induce changes in migration and cell behaviour in someexperimental systems (9–16). While matrix effects are recognized, the contribution thesepeptides make to cellular phenotype in breast cancer is unknown. This potentially complementscytokines which are liberated and activated during tissue remodelling such as TransformingGrowth Factor β (TGFβ) which is involved in epithelial mesenchymal transformation (17).
Transforming Growth Factor β isoforms are produced and deposited into the ECM as inactivecomplexes by many cell types (18). Ligand activation can be achieved by several mechanisms,including through integrin αvβ6 and αvβ8 receptor interactions that liberate them for receptorbinding (19,20). Signalling occurs when TGFβ isoforms bind and activates the TGFβ receptorcomplex (type I and II) which is subsequently endocytosed and phosphorylate Smad2 and 3proteins at their C-terminal SSXS amino acid sequence (21–25). Only ALK4, 5, 7 receptorspropagate signalling through Smad2 and 3 recognizing inputs from Activin A, GDF1, GDF11,Nodal, and TGFβ’s ligands (26–28). These kinases are sensitive to SB431542 inhibition withIC50 values 140, 94 nM (ALK4, 5), and ~1 μM (ALK7) respectively (29). All previouslyreported Smad dependent TGFβ signalling events are require TGFβ ligands for receptoractivation. Novel type II collagen and angiotensin II related Smad activation mechanisms havebeen reported (30,31). It remains unknown whether the collagen mediated process i) is activein epithelial cells; ii) exists for other ECM molecules; iii) is independent of TGFβ ligand; iv)has specific transcriptional consequences. The current manuscript reports the consequences ofsoluble ECM induced Smad2 activation. It characterizes type II collagen (CII) and laminin(LAM) effects on the TGFβ/BMP signalling, and pathway specific transcriptional responsesin MCF-10A “normal” and MCF-7 (ER+) invasive human breast cancer cell lines. The resultsindicate that (a) soluble fibronectin, laminin, and collagens type I and II induce Smad2phosphorylation, which is limited in magnitude if compared to native signalling, (b) thisactivation induces Smad4 nuclear translocation, (c) resultant Smad activation modulates geneexpression in a ligand and cell type specific manner, which is distinct from TGFβ1 inducedresponses, and (d) this activity cannot be attributed to TGFβ contamination of ECMpreparations.
ResultsSmad2 is activated by ECM treatments
Laminin is a major component of basal membrane surrounding the acinus and breast epithelialcells. To mimic the effect of matrix degradation and cellular remodelling, we investigated howprotease digested laminin (LAM), fibronectin (FN), type I and II collagen (CI, CII), peptidescan effect Smad2 phosphorylation (Fig. 1A–B). While FN does not induce Smad2phosphorylation in MCF-7 cells, MCF-10A cells display a 38% increase in Smad2 activationwhen compared to untreated cells (Fig. 1A). Both cell lines respond to type I collagen (CI)with Smad activation, which is 33% greater in MCF-7 than in MCF-10A. The CI, CII, andLAM peptides induced responses in MCF-7 are 76%, 50%, 72%, and in MCF-10A are 15%,34%, and 24.5% increased respectively from the un-stimulated controls. In comparison,TGFβ1 results in a 400% Smad2 activation in both cell types. We chose to investigate CII andLAM effects further because α2β1 integrin receptors are the major binding complex for both
Garamszegi et al. Page 2
Mol Cancer Res. Author manuscript; available in PMC 2010 March 1.
NIH
-PA Author Manuscript
NIH
-PA Author Manuscript
NIH
-PA Author Manuscript
peptides. Smad activation kinetics was compared at time periods between 0–120 minutesfollowing CII and LAM exposure (Fig. 1B). MCF-10A responses to soluble ECM peptides aregreater in magnitude (LAM=347% and CII=350%) than MCF-7 (LAM=207% and CII=29.3%compare densitometry at 120 minutes, right). Phospho-Smad2 levels gradually increased as aresult of exposure, with the exception of MCF-7 CII, which peaks earlier at 45 minutes. AllECM Smad2 activations are significantly lower in magnitude than in TGFβ1 initiatedresponses. Similar responses were documented with JJ012, 105KC chondrosarcoma, C28chondrocyte, Mv1Lu mink lung epithelial, and WM35 melanoma cell lines with Smad2 andSmad3 activation kinetics (data not shown). To confirm further that Smad2 activation isdependent of ALK4, 5, and/or 7 kinase, sensitivity to TGFβ type I receptor inhibitor SB-431542was determined (Fig. 1C). As shown, the inhibitor completely abolishes the ECM inducedSmad2 phosphorylation while significantly down-regulates the native TGFβ1 ligand inducedresponses, indicating that both pathways require this kinase activity.
Crosstalk signalling is independent from TGFβ peptides, mobilizes full pathway activationand involves integrin α 2β 1 complex
The Smad2 activation by ECM samples raised the question whether the result was caused eitherby TGFβ contamination, or/with the contribution of endogenously produced cellular inactiveTGFβ. To address this concern the Smad activation dynamics were re-examined with CIItreatment in the presence of pan-specific TGFβ neutralizing antibody (Fig. 2A, ND50 againsthTGFβ1, pTGFβ1.2, pTGFβ2, rcTGFβ3 and raTGFβ5 as 5.0, 1.0, 15.0, 4.0, 1.0 μg/mlrespectively). Only TGFβ1 induction was down-regulated by the antibody (compare pSmad2bands in AB-100-NA/TGFβ1 with TGFβ1 exposure). Contrary to this, the ECM treatmentinduced activation was not affected (AB-100-NA/CII vs. CII), indicating that endogenouslyproduced TGFβ isoforms did not contribute to the ECM induced Smad activation. The possibleTGFβ contamination of ECM peptides was analyzed by MALDI-TOF Mass Spectrometry. NoTGFβ1 contamination was detectable in the ECM peptide samples (4.0–14.0 μM ECM sampleloaded, 0.4 μM TGFβ1 was the reference control, with instrumental sensitivity in femto/atto-M range, data not shown).
The ECM peptide induced Smad activation capacity prompted the analysis of Smad4 nucleartranslocation (Fig. 2B) in order to verify that the peptide induced Smad activation is capableof initiating downstream events. As shown, in untreated cells Smad4 is not present in the nuclei,while ECM ligand and TGFβ1 exposure cause nuclear translocation of the signal.
The binding of collagen type II and laminin to the α2β1 integrin receptor complex wasconfirmed by co-immunoprecipitation experiments in MCF cells (Fig. 2C). Integrin β1(INTβ1) antibody precipitates integrin α2 (INTα2) receptor independently from ligandexposure (bottom lane, related densitometry right). Its presence increased with combinedpeptides by 53.84% (CII/LAM response IP bands 2 far right) indicating that additional α2 β1receptor populations were accessible for complex formation and binding. This result iscomplemented by ligand competition, in which the detected CII and LAM decreased 27.1 and27.79% respectively (CII/LAM upper, middle lanes band 2). These results indicate that CIIand LAM are in competition for α2β1 integrin receptor binding. The lysis (bands=1) showsthe controls of appropriate targets in the total cell lysate. Immunoprecipitation experiments inMCF-10A cells duplicated the results observed in MCF-7 cells (data not shown).
Comparison of gene regulation differences in MCF-10A and MCF-7 cellsSince Smad2 activation was documented with the phospho-specific antibody recognizing onlythe double phosphorylated (S465/S467) molecule and this induced Smad4 nucleartranslocation, there was an expectation that the pathway activity will cause Smad related geneexpressional changes, which can be analyzed by the TGFβ/BMP pathway specific expressional
Garamszegi et al. Page 3
Mol Cancer Res. Author manuscript; available in PMC 2010 March 1.
NIH
-PA Author Manuscript
NIH
-PA Author Manuscript
NIH
-PA Author Manuscript
QPCR array. It is also equally important, how these pathway specific genes are regulateddifferentially between MCF-10A normal and MCF-7 (ER+) invasive untreated human breastcancer cells. Specific TGFβ/BMP signalling arrays were used to characterize cellularresponsiveness to each of the ECM peptides. A 4-hour time point was chosen to include stillthe stable early gene activation events together with the lasting mid-time and late regulationsbut exclude the transient fluctuations. The cellular expression of 84 genes in MCF-7 wascompared to MCF-10A cells (Fig. 3). The MCF-7 expressional profile changes showfundamental up-regulation in 5 genes (BMP7, >CDKN2B, >PDGFB, >GSC), and major down-regulation in 6 genes (INHA, >TGFBR3, >TGFBI, >PLAU, >NOGGIN, >ENG, details areprovided in the Supplemental Figure and Table 1). The comparison shows that 63% of genes(53 out of 84) regulated differentially in MCF-7. From these, 13 genes (25%) are up-, and 40genes (75.5%) are down regulated. Particularly, the Adhesion and Extracellular Moleculesgroup are affected strongly, where 83% of genes are down-regulated from the affected 18,suggesting that MCF-7 is less dependent on adhesion related functions than MCF-10A.
ECM treatments generate distinct expressional responsesThe heat-maps display absolute transcript levels of untreated controls (CTRL), CII, LAM, andTGFβ1 (TGFβ) treated plates (Fig. 4). The results demonstrate that CII, LAM, and TGFβ,regulate different sets of genes, depending on ligand exposure and cell types. The LAM inducesmore dynamic alternation in gene expression than CII or even TGFβ1 (CTRL vs. LAM, CII,and TGFβ columns in MCF-10A/MCF-7 cells). Specifically, the BMP7, CDC25A, andCOL3A1 genes show fundamental up-regulation in MCF-7 and remain responsive to LAMtreatment only. The 84 genes are functionally grouped into five major areas (right) accordingto the assay description (PAHS-035, SA Bioscience Frederick MD). The comparison indicatesthat overall responsiveness to TGFβ signalling is down-regulated in MCF-7 cells, TGFβisoforms 1, 2, 3, ACVR1, 2A, receptors, as well as Smad3, 4 transmitters are all down-regulated, and the pathway inhibitor BAMBI is up-regulated.
While the TGFβ/BMP Signalling specific pathway array focuses on expressional changesrelated only to Smad signalling activity, and CII, LAM engagement with their integrin receptorsare also inducing parallel signalling pathways. How the ECM peptides affected overallsignalling activity in MCF-10A and MCF-7 cells was determined with a Signal TransductionPathway finder array (PAHS-014, Fig. 5). Overall, in normal MCF10A cells, CII, LAM,TGFβ1 response patterns are minimally overlapping (comparison of 10A columns) indicatingthat the treatments differentially effects specific signalling pathways in these cells.Interestingly, the invasive MCF-7 cell line responds to CII and TGFβ1 in similar but notidentical ways (note that there is no contamination or endogenous TGFβ ligand involvementin the ECM induced Smad activation). The LAM affects different pathways and to a differentextent (comparison of MCF-7 columns). All three treatments activated the CREB pathwaysimilarly.
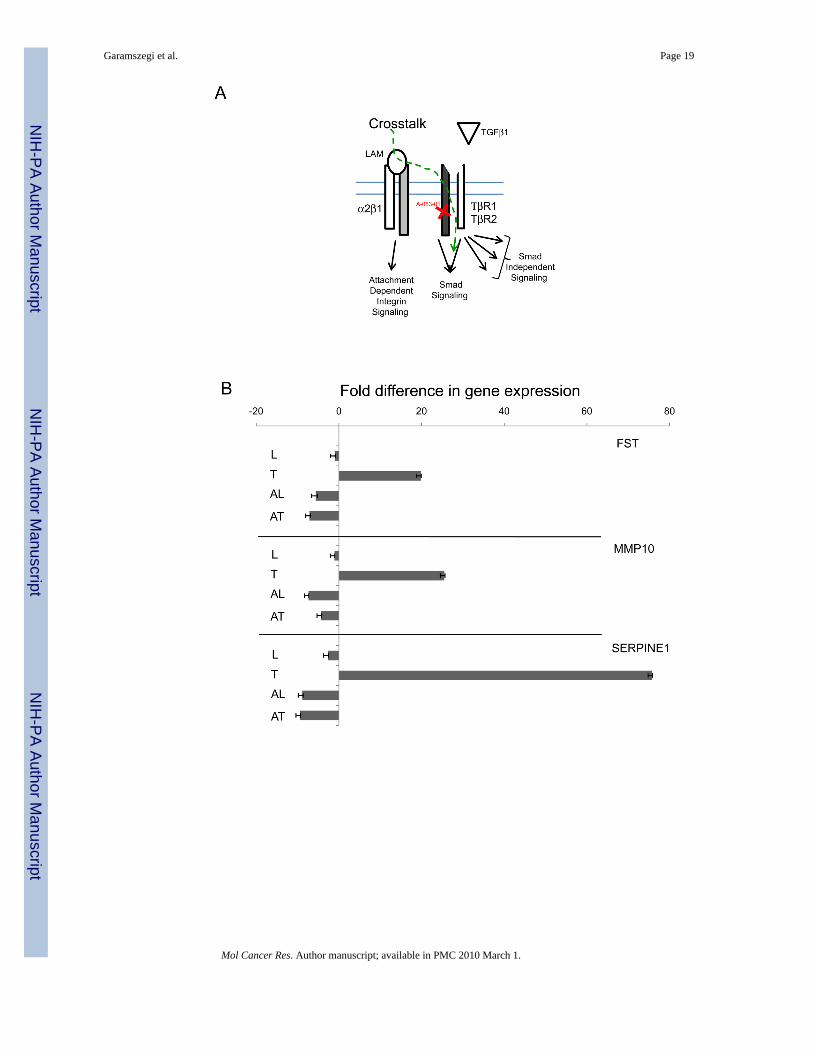
Validation of crosstalk sensitive genesTo demonstrate that individual gene expression change depends on crosstalk and/or TGFβ1ligand induction and pathway activity, selected genes from the TGF/BMP Signalling specificand Signal Transduction Pathway Finder arrays were chosen for further expressional analysisin present of TGFβ type I receptor inhibitor (A-083-01, Fig. 6). ECM induced and inhibitorsensitive genes (Fig. 6A) represent the crosstalk modulated segment of expressional patterns.The classical examples of TGFβ1 regulation is shown on FST(+19.810), MMP10(+25.503)and SERPINE1(+75.790, Fig. 6B). They are not sensitive to laminin (L), up-regulated byTGFβ1 (T) and the inhibitor TGFβ1 + A-083-01 (AT) reverses the effect. The LAM + A-083-01(AL) combination shows down-regulation similar to AT demonstrating that LAM indeed doesnot affect these genes. Selected genes responding to LAM (L) induction (Fig. 6C) are CCND1
Garamszegi et al. Page 4
Mol Cancer Res. Author manuscript; available in PMC 2010 March 1.
NIH
-PA Author Manuscript
NIH
-PA Author Manuscript
NIH
-PA Author Manuscript
(−7.17), FASN(−6.51), FN1(+8.895), IGBP3(+5.848), MYC(−15.63), NOG(−28.797) whichthen reversed by the inhibitor pre-treatment (AL), while neither TGFβ1 and its combinationwith A-083-01does not affect them. The exception is NOG where LAM (L) induced down-regulation reversed by inhibitor (AL) but still negative (−8.717) while TGFβ1 (T) does notaffect NOG(1.149) and the inhibitor combination (AT) down-regulates it (−18.65).
Supplemental materialThe functional comparison of untreated MCF-10A normal and MCF-7 cells was generated byVenn diagram (4 groups) presenting fold up- and down-regulation of genes in MCF-7 relativeto MCF-10A normal control (Supplemental Fig. 1). The Venn groups, the fold differences, andrelated Student’s T-test, p values are listed in the Supplemental Table 1. The results presentedin Figures 3, 4, 5 and 6 were validated with independent TaqMan QPCR assays designed againstselected targets (Supplemental Table 2). Overall 31 genes were validated in independentassays. The differences between the TaqMan and SuperArray assays (SA) are greater whenthe transcript levels change dramatically (for example in BMP7 and CDKN2B), because theTaqMan assays are more target sensitive than the SYBR Green detection. Some of the genesare present in both arrays as CDKN2B, CDKN2A, JUN, IL2, FOS, and others. The validationproves that the array gene expression data are legitimate and accurate.
DiscussionThe progression of breast cancer is associated with an epithelial to mesenchymal transition andinvolves components of TGFβ signalling (32,33) and signalling from the extracellular matrix(34–37). MCF-10A and MCF-7 (ER+) cell lines are well established model systems for thestudy of tumor microenvironment in breast cancer progression (38). In addition to the influenceof the ECM, the capacity of neoepitopes created by protease digestion of matrix molecules tomodulate cell migration has also been reported (15). The signalling induced by proteolyticfragments of ECM proteins is largely unknown. Using this model system we demonstrate thatsoluble ECM peptides induce Smad2 activation in human breast cancer cells. The role ofintegrin mediated signalling is well recognized (39) and in conjunction with this study suggeststhat a signalling outcome depends on the modulation of a signalling network rather thaneffecting a single pathway. The perceived complexity of cell-extracellular matrixcommunication and matrix originated signal transduction was previously based on theassumption that these processes are all related to adhesion with an immobile matrix (40). Toextend these original paradigms, this study demonstrates that soluble ECM molecules activateSmad signalling by binding to their representative integrin receptors and parallel, indirectlyactivating the TGFβ signalling pathway.
The pSmad2 specific antibody that was utilized recognizes the dual phosphorylation of C-terminal SSXS motif. This activation of Smad2 and 3 is described only by the ALK4, 5, 7receptors (22,27,41). The demonstrated TGFβ type I (TβRI receptor) receptor inhibitorSB-431542 sensitivity of both pathways verifies ALK5 involvement without excluding thepossible participation of ALK4 and 7. The detailed molecular mechanisms by which the ECMand native TGFβ ligands induced Smad activation overlaps and differ is beyond the scope andfocus of this current manuscript. The fact that this ECM induced signalling can be observedwithin 15 minutes after ligand exposure is in good agreement with the known kinetics for Smadactivation by TGFβ ligand (21,42).
The α2β1 integrin complex is a major receptor for both LAM and CII ligand (43). It is alsoimplicated in mediating the malignant transformation in pancreatic cancer cell lines (44).Moreover, the laminin is particularly important in MCF cells for acinus development as ascaffolding matrix (matrigel) as well as media component (45). The co-immunoprecipitationexperiments clarified that CII and LAM are competing ligands for the α2β1 integrin and binding
Garamszegi et al. Page 5
Mol Cancer Res. Author manuscript; available in PMC 2010 March 1.
NIH
-PA Author Manuscript
NIH
-PA Author Manuscript
NIH
-PA Author Manuscript
increases the association of the heteromeric receptor complex. The soluble ECM induced Smadactivation (termed as crosstalk signalling) verified in multiple cell lines, indicating that thisprocess can represents a general mechanism for ECM molecules when acting as solublepeptides.
The TGFβ signalling is tightly controlled by the extracellular matrix through regulating theavailability of free peptides for TGFβ receptor activation (46). It can be hypothesized that cellbinding to ECM could synergistically enhance the binding of latent TGFβ binding protein(LTBP) and latency associated protein (LAP) complexes to their integrin αvβ6 and αvβ8receptors and release the peptides by the extra ECM stimuli to initiate Smad signalling. Thisscenario can be excluded for three reasons: 1) The observed ECM-Smad activation kineticsmakes it unlikely, would require an interaction between the α2β1, αvβ6, αvβ8, TβR1 andTβR2 receptors plus LAP and LTBP complexes, and the ECM induced Smad signals can bedetected within 15 minutes. 2) We show that the AB-100-NA neutralizing antibody blocksonly the TGFβ1 induced signalling but not affecting the crosstalk itself, indicating that the twoprocess are separate. 3) No TGFβ isoforms contamination was found by MALDI-TOF-MS.Moreover, if Smad activation by ECM is a result of TGFβ1 ligand participation, it would beexpected that ECM exposure activate the same genes with perhaps lower amplitude dependingon the signalling thresholds as TGFβ1 does.
Contrary to this, each ECM ligand elicits a different set of expressional responses whencompared with each other and to TGFβ1. MCF cells are regulated by type IV collagen andlaminin but normally do not encounter type II collagen in their in vivo environment (38).Therefore the CII is an ideal control to show that just because it binds to the same α2β1 integrincomplex, activating the same crosstalk and integrin signalling pathways, the expressionalresponses are still separated and selective for the representative treatments. For example: theCII induced Smad signalling in the MCF-7 cells peaks at 45 minutes (Fig. 1, 2), and with greatermagnitude than the corresponding LAM signal. However, this is not capable of generating anysignificant expressional responses (Fig. 4, MCF7 panel CTRL vs. CII) whereas in MCF-10A,the same level and time the CII related Smad signal regulates ~11% of genes from the total of84 (MCF-10A panel CTRL vs. CII). This suggest that gene expressional responses are ligandand cell type dependent, therefore are unlikely to be the result of TGFβ ligand i.e., both LAMand CII induce similar pSmad2 levels but elicits different separate transcriptional responses.
The data indicate that the MCF-7 cells are also less responsive to TGFβ signalling thanMCF-10A. The comparison of untreated MCF-10A and MCF-7 cell lines shows that 63% ofgenes (53 out of 84) differentially regulated in MCF-7. From these 13 genes (25%) are up- and40 genes (75.5%) are down-regulated. Notably, the adhesion and extracellular moleculescluster are affected strongly, where 83% of genes are down-regulated from the affected 18,indicating that MCF-7 is less dependent on adhesion related functions than MCF-10A(Supplemental Figure). The regulation of this selective target gene population reflects theincrease of invasive capacity of MCF-7 cells when compared to MCF-10A line.
The laminin induced expressional changes were validated on selected genes displayingcrosstalk sensitivity (Fig. 6, i.e. genes respond to LAM induction which then reversed byA-083-01 TGFβ type I receptor inhibitor), by ABI TaqMan probes. As shown, the inhibitorselectively blocks TGFβ1 induced FST, MMP10, and SERPINE1. These are the classicalresponsive genes of TGFβ pathway activity. Furthermore, the inhibitor also reverses genesregulated by LAM, (not TGFβ1) verifying that the fold expressional change of these genes wasindeed induced by laminin (crosstalk) throughout the TGFβ pathway, and not by alternativebranch of attachment dependent integrin signalling.
Garamszegi et al. Page 6
Mol Cancer Res. Author manuscript; available in PMC 2010 March 1.
NIH
-PA Author Manuscript
NIH
-PA Author Manuscript
NIH
-PA Author Manuscript

This manuscript demonstrates that ECM molecules induce transcriptional responses througha non-attachment related signalling process that parallels classical integrin signalling. Thisprocess affects cellular pathways on a ligand and cell type dependent manner in human breastcancer and other cells that were investigated. The invasive MCF-7 cells show similar but notidentical responses to type II collagen as to TGFβ1, while the laminin response patterns aredistinct from both. Crosstalk process modulate signalling capacity of the invasive MCF-7 cellswhich has been shown be fundamental in epithelial to mesenchymal transition and breast cancerprogression (17,47,48).
Consequently the ECM-cell communication affects transcriptional regulation in a way what ismore complex than previously thought. Furthermore, when matrix components acting onattachment independent way (during matrix remodelling and degradation) this process canaffect gene expression, and contribute to ECM originated signalling controlling cellular activityand phenotype.
Materials and MethodsCell Culture
MCF-10A cells (human normal mammary epithelial cells) were propagated in MEGM media(Clonetics CC-3150 with supplied SingleQuots growth factors CC-4136) with 100 ng/mlCholera toxin (Calbiochem 227035). MCF-7 cells were cultured in IMEM media (Gibco10373-017, + gentamycine) containing 10% FBS, 10 mg/L Phenol Red (Sigma P02990) + 10μg/mL insulin (Sigma I-0516).
ChemicalsFibronectin (Sigma, Saint Louis MO., F4759), type I Collagen (Sigma C9301), type II collagen(Chondrex 20022) was dissolved in 0.05 M CH3COOH as 1.0, 2.0, and 2.0 mg/ml stocksolutions respectively. The laminin (Sigma L2020) was supplied as 1.0 mg/ml stock in 50 mMTris-HCl, pH 7.5, with 150 mM NaCl. TGFβ1 (R&D 240-B) stock was 10 ng/μl in 4.0 mMHCl with 1.0 mg/ml BSA carrier protein. The SB-431542 and A-083-01 were purchased fromTocris Bioscience (Ellisville MO).
AntibodiesThe primary antibodies were purchased from Cell Signaling, Beverly, MA (anti-phospho-Smad2 #3101, and anti-Smad2 #3122), and Santa Cruz Biotechnology Inc., Santa Cruz CA(anti-Smad4 sc-7966 collagen type II sc-7764, laminin β1 sc-5583, Integrin α2 sc-9089).Secondary HRP conjugated antibodies are from Santa Cruz (sc-2020) and Amersham/GEPiscataway NJ (#NA93AV) and anti-mouse Alexa-488 is from Molecular Probes/Invitrogen(A21202).
ECM TreatmentsCells were plated in p100 plates at density of 6.0×10⁶ (MCF-10A) to 8.0×10⁶ (MCF-7) cell/p100 to give a confluent culture after overnight incubation. The cultures were synchronizedby serum free DMEM:F12 for 24 hours to maximize the signal to noise ratio. ECM peptideswere applied at 50 μg/ml concentration in 4 ml serum free DMEM:F12 for the specified time.TGFβ1 positive control was used at 10 ng/ml concentration. To harvest, cells were washedtwice on ice with ice cold PBS, scraped in 1 ml PBS, pelleted at 8000 rpm for 2 minutes, andthe pellet was snap frozen in liquid nitrogen and stored at −80°C until processing.
Garamszegi et al. Page 7
Mol Cancer Res. Author manuscript; available in PMC 2010 March 1.
NIH
-PA Author Manuscript
NIH
-PA Author Manuscript
NIH
-PA Author Manuscript
Western Blotting and Image AcquisitionCells were lysed in buffer containing 50 mM Tris-HCl pH 7.4, 1% NP-40, 0.25% Na-deoxycholate, 150 mM NaCl, 1 mM EDTA, 1 mM Na-vanadate, and 1 mMPhenylmethylsulfonyl fluoride, completed with protease inhibitor cocktail from Roche. Thesamples were normalized for protein with ND-1000 (NanoDrop Technologies Inc.,Wilmington DE). For western blotting, 125 μg protein per lane were analyzed with primaryantibodies incubated overnight at 4°C, followed by secondary HRP conjugated antibodies for2 hours at room temperature. Bands were detected with SuperSignal West Pico ECL detectionkit (Pierce, Rockford IL) on UVP Biospectrum Digital Imaging system (UVP Inc. Upland CA).The raw images were quantized by optical density through the supplied densitometry analysissoftware and normalized to total Smad levels.
Co-ImmunoprecipitationConfluent synchronized p100 plates were pre-treated for two hours at 4°C with collagen typeII and laminin and in combinations. Then the cells were harvested, samples stored as describedabove. Samples were processed in 800 μl lysis buffer for 30 minutes on ice. Supernatants wereseparated, and the residual pellets were processed again with a fresh aliquot (200 μl) andsonicated (converter V2391, Virsonic 100 unit VirTis (SP industries Co. Gardiner NY). Thecombined supernatants were quantized and 2.0 mg total protein samples were incubated withmouse anti-human VLA-2 (α2β1 Chemicon, MAB1998) against functional collagen receptor,or by the mouse anti-human Integrinβ1 (Santa Cruz sc-9970) for 2 hours then precipitated with45 μl protein A agarose (Sigma P-7786), anti-mouse IgG (Sigma A-6531), or Protein G agarosefor overnight at 4°C. Samples were washed extensively, then solubilized in 80 μl 2x Laemlibuffer, and analyzed on 8% SDS-PAGE.
Gene Expression AnalysisHuman TGFβ/BMP Signalling (PAHS-035) and Signal Transduction Pathway Finder(PAHS-014) specific RT2 profiler PCR arrays were obtained from SA Bioscience Co.(Frederick MD US). Cells were plated in triplicates, exposed to peptides, then harvested at fourhours later and stored as described above. The RNA was purified with RNeasy Mini Kit withon column DNase treatment (Quiagen Corp. US 74104) according to the manufacturerprotocol. For the cDNA synthesis, 5 μg total RNA was used with High Capacity cDNA ReverseTranscription Kit (Applied Biosystems 4322171) as described by the kit manual. The arrayanalysis was carried out following the manufacturer protocol with SYBR Green PCR (ROX)Master Mix (Applied Biosystems Foster City CA # 4309155) and 1.0–5.0 μg cDNA/plate onABI 7900HT Fast QPCR system. Gene expression differences were determined using the2−ΔΔCt method according to AB and SA Biosciences protocols. The expressional patterndifferences between the MCF-10A and MCF-7 cells and the heat maps were generated inMATLAB 7.5.0 software using the expressional fold differences analyzed through the SABiosciences web page, and with absolute values of the transcripts measured by QPCR.
Statistical AnalysisThe one-way ANOVA subroutine of MATLAB 7.5.0 was used to verify the significance ofwestern blotting results (quantized through the UVP Bio-Imager densitometry software intriplicates). The array analysis related p values were generated through the representative webpage links supported software. Values presented in the supplemental materials.
Supplementary MaterialRefer to Web version on PubMed Central for supplementary material.
Garamszegi et al. Page 8
Mol Cancer Res. Author manuscript; available in PMC 2010 March 1.
NIH
-PA Author Manuscript
NIH
-PA Author Manuscript
NIH
-PA Author Manuscript
AcknowledgmentsWe thank to Drs Karoline Briegel for the MCF cell lines, Victor Asirvatham for help with the MALDI-TOF MS, andDr. Muhammad Umar Jawad and Ms Sara Garamszegi for their helpful comments. This work was supported by grantsfrom National Institutes of Health CA096796-01 (SPS), a Ruth L. Kirschstein National Research Service Award NIH1 F32 HL083673-01 (LAS), Woman’s Cancer Association Madelon Ravlin Memorial Award WCA 66461Y (NG andSPS), American Cancer Society ACS 66105 to (NG). Other supports were provided by the University of Miami,Department of Orthopaedics, and the Sylvester Comprehensive Cancer Center.
References1. Bissell MJ, Radisky DC, Rizki A, Weaver VM, Petersen OW. The organizing principle:
microenvironmental influences in the normal and malignant breast. Differentiation 2002;70(9–10):537–46. [PubMed: 12492495]
2. Fata JE, Werb Z, Bissell MJ. Regulation of mammary gland branching morphogenesis by theextracellular matrix and its remodeling enzymes. Breast Cancer Res 2004;6(1):1–11. [PubMed:14680479]
3. Kalluri R, Zeisberg M. Fibroblasts in cancer. Nat Rev Cancer 2006;6(5):392–401. [PubMed:16572188]
4. Thiery JP. Epithelial-mesenchymal transitions in tumour progression. Nat Rev Cancer 2002;2(6):442–54. [PubMed: 12189386]
5. Atley LM, Mort JS, Lalumiere M, Eyre DR. Proteolysis of human bone collagen by cathepsin K:characterization of the cleavage sites generating by cross-linked N-telopeptide neoepitope. Bone2000;26(3):241–7. [PubMed: 10709996]
6. Downs JT, Lane CL, Nestor NB, et al. Analysis of collagenase-cleavage of type II collagen using aneoepitope ELISA. J Immunol Methods 2001;247(1–2):25–34. [PubMed: 11150534]
7. Li WW, Nemirovskiy O, Fountain S, Rodney Mathews W, Szekely-Klepser G. Clinical validation ofan immunoaffinity LC-MS/MS assay for the quantification of a collagen type II neoepitope peptide:A biomarker of matrix metalloproteinase activity and osteoarthritis in human urine. Anal Biochem2007;369(1):41–53. [PubMed: 17570334]
8. Otterness IG, Downs JT, Lane C, et al. Detection of collagenase-induced damage of collagen by 9A4,a monoclonal C-terminal neoepitope antibody. Matrix Biol 1999;18(4):331–41. [PubMed: 10517180]
9. Buzza MS, Zamurs L, Sun J, et al. Extracellular matrix remodeling by human granzyme B via cleavageof vitronectin, fibronectin, and laminin. J Biol Chem 2005;280(25):23549–58. [PubMed: 15843372]
10. Chang C, Lauffenburger DA, Morales TI. Motile chondrocytes from newborn calf: migrationproperties and synthesis of collagen II. Osteoarthritis Cartilage 2003;11(8):603–12. [PubMed:12880583]
11. Kenny HA, Kaur S, Coussens LM, Lengyel E. The initial steps of ovarian cancer cell metastasis aremediated by MMP-2 cleavage of vitronectin and fibronectin. J Clin Invest 2008;118(4):1367–79.[PubMed: 18340378]
12. Koshikawa N, Schenk S, Moeckel G, et al. Proteolytic processing of laminin-5 by MT1-MMP intissues and its effects on epithelial cell morphology. FASEB J 2004;18(2):364–6. [PubMed:14688206]
13. Midwood KS, Mao Y, Hsia HC, Valenick LV, Schwarzbauer JE. Modulation of cell-fibronectinmatrix interactions during tissue repair. J Investig Dermatol Symp Proc 2006;11(1):73–8.
14. Pilcher BK, Dumin JA, Sudbeck BD, Krane SM, Welgus HG, Parks WC. The activity of collagenase-1is required for keratinocyte migration on a type I collagen matrix. J Cell Biol 1997;137(6):1445–57.[PubMed: 9182674]
15. Remy L, Trespeuch C, Bachy S, Scoazec JY, Rousselle P. Matrilysin 1 influences colon carcinomacell migration by cleavage of the laminin-5 beta3 chain. Cancer Res 2006;66(23):11228–37.[PubMed: 17145868]
16. Steadman R, Irwin MH, St John PL, Blackburn WD, Heck LW, Abrahamson DR. Laminin cleavageby activated human neutrophils yields proteolytic fragments with selective migratory properties. JLeukoc Biol 1993;53(4):354–65. [PubMed: 8482915]
Garamszegi et al. Page 9
Mol Cancer Res. Author manuscript; available in PMC 2010 March 1.
NIH
-PA Author Manuscript
NIH
-PA Author Manuscript
NIH
-PA Author Manuscript
17. Lamouille S, Derynck R. Cell size and invasion in TGF-beta-induced epithelial to mesenchymaltransition is regulated by activation of the mTOR pathway. J Cell Biol 2007;178(3):437–51.[PubMed: 17646396]
18. Munger JS, Harpel JG, Giancotti FG, Rifkin DB. Interactions between growth factors and integrins:latent forms of transforming growth factor-beta are ligands for the integrin alphavbeta1. Mol BiolCell 1998;9(9):2627–38. [PubMed: 9725916]
19. Munger JS, Huang X, Kawakatsu H, et al. The integrin alpha v beta 6 binds and activates latent TGFbeta 1: a mechanism for regulating pulmonary inflammation and fibrosis. Cell 1999;96(3):319–28.[PubMed: 10025398]
20. Sheppard D. Integrin-mediated activation of transforming growth factor-beta(1) in pulmonaryfibrosis. Chest 2001;120(1 Suppl):49S–53S. [PubMed: 11451914]
21. Di Guglielmo GM, Le Roy C, Goodfellow AF, Wrana JL. Distinct endocytic pathways regulate TGF-beta receptor signalling and turnover. Nat Cell Biol 2003;5(5):410–21. [PubMed: 12717440]
22. Attisano L, Wrana JL. Signal transduction by the TGF-beta superfamily. Science 2002;296(5573):1646–7. [PubMed: 12040180]
23. Dore JJ Jr, Yao D, Edens M, Garamszegi N, Sholl EL, Leof EB. Mechanisms of transforming growthfactor-beta receptor endocytosis and intracellular sorting differ between fibroblasts and epithelialcells. Mol Biol Cell 2001;12(3):675–84. [PubMed: 11251079]
24. Garamszegi N, Dore JJ Jr, Penheiter SG, Edens M, Yao D, Leof EB. Transforming growth factor betareceptor signaling and endocytosis are linked through a COOH terminal activation motif in the typeI receptor. Mol Biol Cell 2001;12(9):2881–93. [PubMed: 11553725]
25. Penheiter SG, Mitchell H, Garamszegi N, Edens M, Dore JJ Jr, Leof EB. Internalization-dependentand -independent requirements for transforming growth factor beta receptor signaling via the Smadpathway. Mol Cell Biol 2002;22(13):4750–9. [PubMed: 12052882]
26. Massague J. TGFbeta in Cancer. Cell 2008;134(2):215–30. [PubMed: 18662538]27. Derynck R, Zhang YE. Smad-dependent and Smad-independent pathways in TGF-beta family
signalling. Nature 2003;425(6958):577–84. [PubMed: 14534577]28. Massague J, Chen YG. Controlling TGF-beta signaling. Genes & Development 2000;14(6):627–44.
[PubMed: 10733523]29. Inman GJ, Nicolas FJ, Callahan JF, et al. SB-431542 is a potent and specific inhibitor of transforming
growth factor-beta superfamily type I activin receptor-like kinase (ALK) receptors ALK4, ALK5,and ALK7. Molecular Pharmacology 2002;62(1):65–74. [PubMed: 12065756]
30. Schneiderbauer MM, Dutton CM, Scully SP. Signaling “cross-talk” between TGF-beta1 and ECMsignals in chondrocytic cells. Cell Signal 2004;16(10):1133–40. [PubMed: 15240008]
31. Wang W, Huang XR, Canlas E, et al. Essential role of Smad3 in angiotensin II-induced vascularfibrosis. Circulation Research 2006;98(8):1032–9. [PubMed: 16556868][see comment]
32. Moustakas A, Pardali K, Gaal A, Heldin CH. Mechanisms of TGF-beta signaling in regulation of cellgrowth and differentiation. Immunol Lett 2002;82(1–2):85–91. [PubMed: 12008039]
33. Muraoka RS, Dumont N, Ritter CA, et al. Blockade of TGF-beta inhibits mammary tumor cellviability, migration, and metastases. J Clin Invest 2002;109(12):1551–9. [PubMed: 12070302]
34. Bissell MJ, Kenny PA, Radisky DC. Microenvironmental regulators of tissue structure and functionalso regulate tumor induction and progression: the role of extracellular matrix and its degradingenzymes. Cold Spring Harb Symp Quant Biol 2005;70:343–56. [PubMed: 16869771]
35. Kenny PA, Lee GY, Bissell MJ. Targeting the tumor microenvironment. Front Biosci 2007;12:3468–74. [PubMed: 17485314]
36. LaBarge MA, Petersen OW, Bissell MJ. Of microenvironments and mammary stem cells. Stem CellRev 2007;3(2):137–46. [PubMed: 17873346]
37. Lee GY, Kenny PA, Lee EH, Bissell MJ. Three-dimensional culture models of normal and malignantbreast epithelial cells. Nat Methods 2007;4(4):359–65. [PubMed: 17396127]
38. Debnath J, Muthuswamy SK, Brugge JS. Morphogenesis and oncogenesis of MCF-10A mammaryepithelial acini grown in three-dimensional basement membrane cultures. Methods 2003;30(3):256–68. [PubMed: 12798140]
Garamszegi et al. Page 10
Mol Cancer Res. Author manuscript; available in PMC 2010 March 1.
NIH
-PA Author Manuscript
NIH
-PA Author Manuscript
NIH
-PA Author Manuscript
39. Comoglio PM, Boccaccio C, Trusolino L. Interactions between growth factor receptors and adhesionmolecules: breaking the rules. Curr Opin Cell Biol 2003;15(5):565–71. [PubMed: 14519391]
40. Geiger B, Bershadsky A. Assembly and mechanosensory function of focal contacts. Curr Opin CellBiol 2001;13(5):584–92. [PubMed: 11544027]
41. Shi Y, Massague J. Mechanisms of TGF-beta signaling from cell membrane to the nucleus. Cell2003;113(6):685–700. [PubMed: 12809600]
42. Vilar JM, Jansen R, Sander C. Signal processing in the TGF-beta superfamily ligand-receptornetwork. PLoS Comput Biol 2006;2(1):e3. [PubMed: 16446785]
43. Plow EF, Haas TA, Zhang L, Loftus J, Smith JW. Ligand binding to integrins. J Biol Chem 2000;275(29):21785–8. [PubMed: 10801897]
44. Grzesiak JJ, Bouvet M. The alpha2beta1 integrin mediates the malignant phenotype on type I collagenin pancreatic cancer cell lines. Br J Cancer 2006;94(9):1311–9. [PubMed: 16622460]
45. Debnath J, Brugge JS. Modelling glandular epithelial cancers in three-dimensional cultures. Nat RevCancer 2005;5(9):675–88. [PubMed: 16148884]
46. ten Dijke P, Arthur HM. Extracellular control of TGFbeta signalling in vascular development anddisease. Nat Rev Mol Cell Biol 2007;8(11):857–69. [PubMed: 17895899]
47. Alcorn JF, Guala AS, van der Velden J, et al. Jun N-terminal kinase 1 regulates epithelial-to-mesenchymal transition induced by TGF-{beta}1. J Cell Sci 2008;121(Pt 7):1036–45. [PubMed:18334556]
48. Song J. EMT or apoptosis: a decision for TGF-beta. Cell Res 2007;17(4):289–90. [PubMed:17426696]
Garamszegi et al. Page 11
Mol Cancer Res. Author manuscript; available in PMC 2010 March 1.
NIH
-PA Author Manuscript
NIH
-PA Author Manuscript
NIH
-PA Author Manuscript
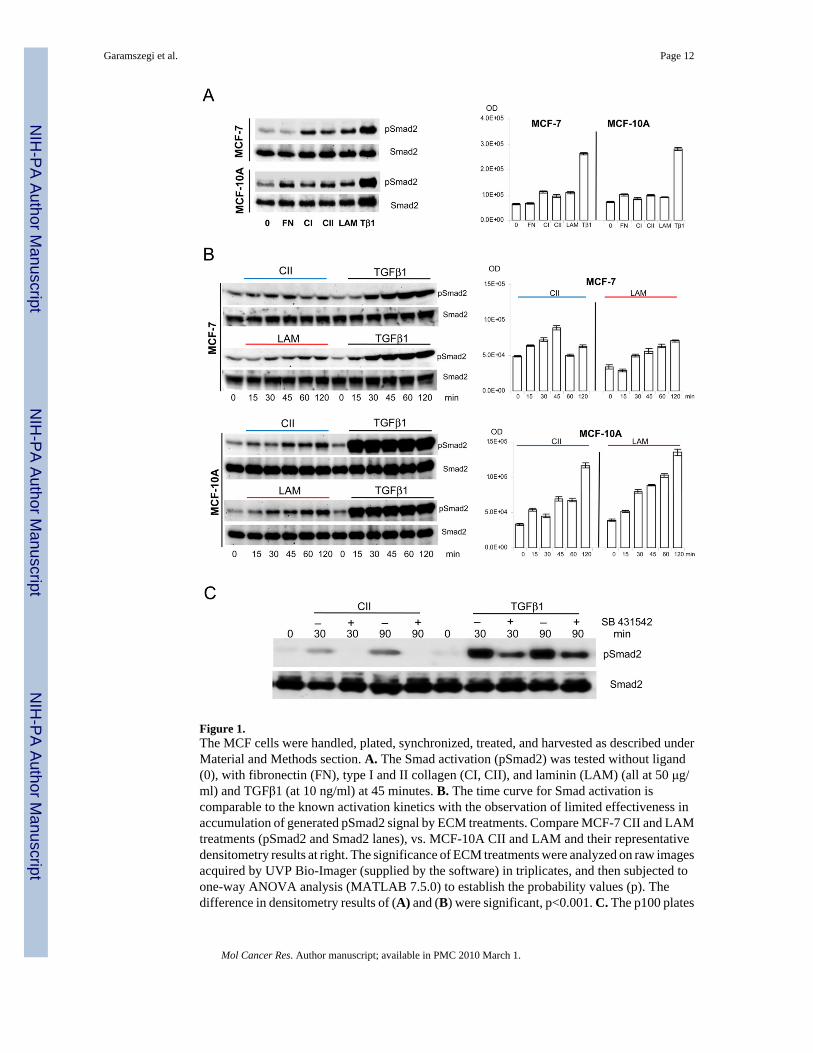
Figure 1.The MCF cells were handled, plated, synchronized, treated, and harvested as described underMaterial and Methods section. A. The Smad activation (pSmad2) was tested without ligand(0), with fibronectin (FN), type I and II collagen (CI, CII), and laminin (LAM) (all at 50 μg/ml) and TGFβ1 (at 10 ng/ml) at 45 minutes. B. The time curve for Smad activation iscomparable to the known activation kinetics with the observation of limited effectiveness inaccumulation of generated pSmad2 signal by ECM treatments. Compare MCF-7 CII and LAMtreatments (pSmad2 and Smad2 lanes), vs. MCF-10A CII and LAM and their representativedensitometry results at right. The significance of ECM treatments were analyzed on raw imagesacquired by UVP Bio-Imager (supplied by the software) in triplicates, and then subjected toone-way ANOVA analysis (MATLAB 7.5.0) to establish the probability values (p). Thedifference in densitometry results of (A) and (B) were significant, p<0.001. C. The p100 plates
Garamszegi et al. Page 12
Mol Cancer Res. Author manuscript; available in PMC 2010 March 1.
NIH
-PA Author Manuscript
NIH
-PA Author Manuscript
NIH
-PA Author Manuscript

were pre-incubated with SB-431542 for 30 minutes at 5.0 μM final concentration at 37°C inpresence of 5% CO2 before pathway induction with CII and TGFβ1 exposures as above. Theparallel samples were then harvested at indicated time points, pelleted, snap frozen in liquidnitrogen, and stored at −80°C until use. 125.0 μg standardized total protein was subjected toSDS-PAGE analysis and western blotting.
Garamszegi et al. Page 13
Mol Cancer Res. Author manuscript; available in PMC 2010 March 1.
NIH
-PA Author Manuscript
NIH
-PA Author Manuscript
NIH
-PA Author Manuscript
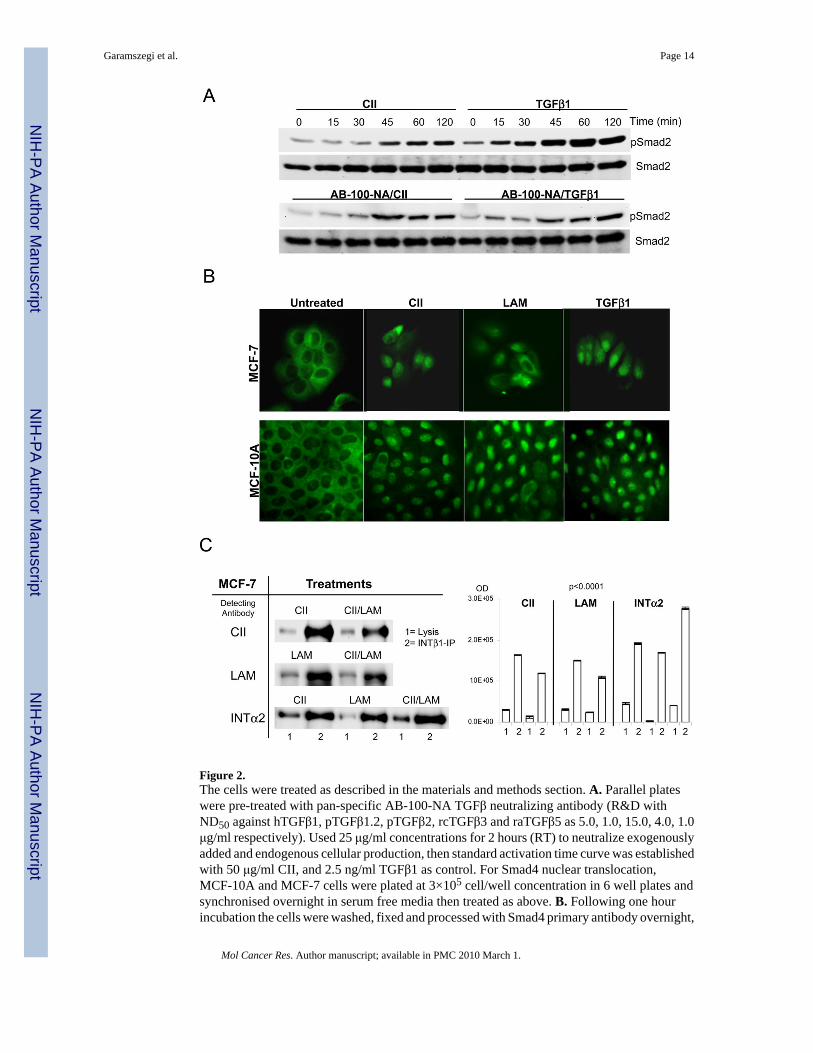
Figure 2.The cells were treated as described in the materials and methods section. A. Parallel plateswere pre-treated with pan-specific AB-100-NA TGFβ neutralizing antibody (R&D withND50 against hTGFβ1, pTGFβ1.2, pTGFβ2, rcTGFβ3 and raTGFβ5 as 5.0, 1.0, 15.0, 4.0, 1.0μg/ml respectively). Used 25 μg/ml concentrations for 2 hours (RT) to neutralize exogenouslyadded and endogenous cellular production, then standard activation time curve was establishedwith 50 μg/ml CII, and 2.5 ng/ml TGFβ1 as control. For Smad4 nuclear translocation,MCF-10A and MCF-7 cells were plated at 3×10⁵ cell/well concentration in 6 well plates andsynchronised overnight in serum free media then treated as above. B. Following one hourincubation the cells were washed, fixed and processed with Smad4 primary antibody overnight,
Garamszegi et al. Page 14
Mol Cancer Res. Author manuscript; available in PMC 2010 March 1.
NIH
-PA Author Manuscript
NIH
-PA Author Manuscript
NIH
-PA Author Manuscript

followed with Alexa-488 secondary antibody for two hours. The images were acquired on ZeissAxioII microscope with GFP/FITC filter set. C. The CII and LAM are the major peptides forintegrin α2β1 receptor complex. After lysis and quantization, 2.0 mg total protein weresubjected to integrinβ1 (INTβ1-IP bands 2) for 2 hours then precipitated overnight at 4°C. TheECM treatments are competing (signal down-regulation is less than 50%) for the same receptorpopulation by combined CII/LAM treatments (detecting antibodies [left] pre-treatments [right]with CII detection upper, and LAM detection lanes at centre. Corresponding densitometry, left,and centre). For validation of the right receptor complex pull-down, integrinα2 detection wasused (INTα2 lane at bottom, IP bands 2, treatments CII, LAM, CII/LAM, and INTα2densitometry right). The respective Smad2 bands are generated by stripping and re-probingthe membranes. Western blots were repeated in duplicates and corresponding densitometry(right panels) analysis of raw acquired images (UVP imager software) was normalized toSmad2 signals. Statistical analysis was performed as under Figure 1, p=0.0001 was consideredhighly significant.
Garamszegi et al. Page 15
Mol Cancer Res. Author manuscript; available in PMC 2010 March 1.
NIH
-PA Author Manuscript
NIH
-PA Author Manuscript
NIH
-PA Author Manuscript
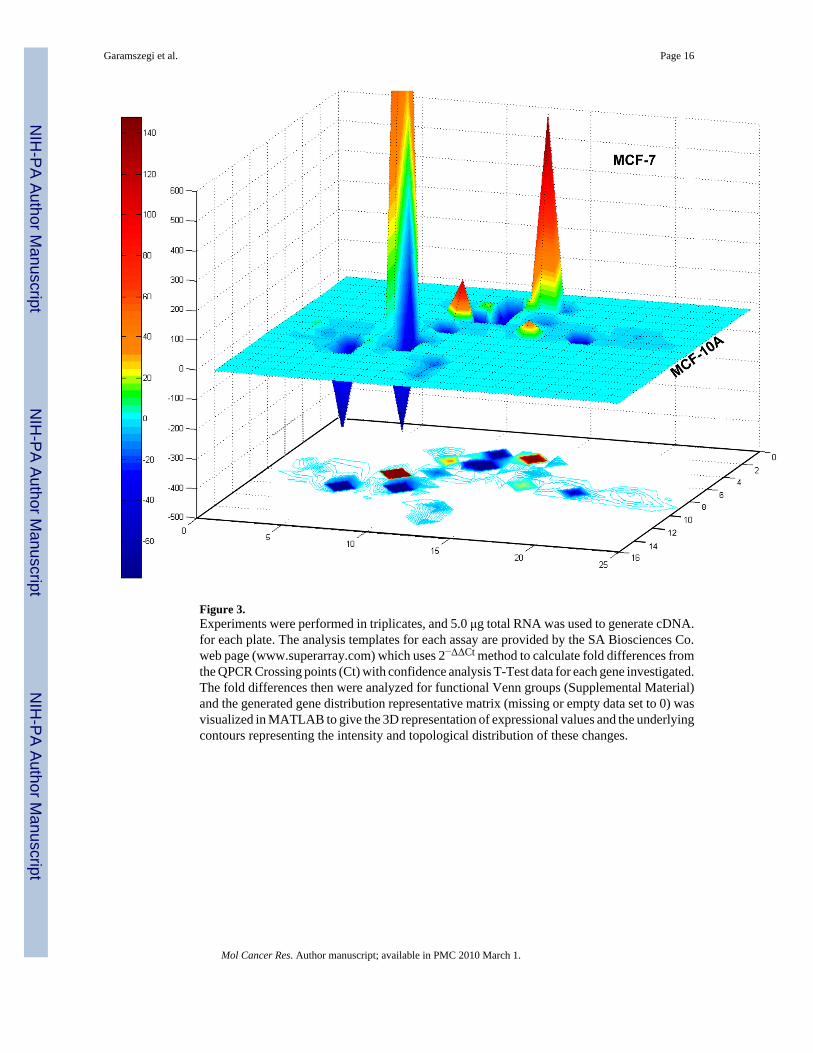
Figure 3.Experiments were performed in triplicates, and 5.0 μg total RNA was used to generate cDNA.for each plate. The analysis templates for each assay are provided by the SA Biosciences Co.web page (www.superarray.com) which uses 2−ΔΔCt method to calculate fold differences fromthe QPCR Crossing points (Ct) with confidence analysis T-Test data for each gene investigated.The fold differences then were analyzed for functional Venn groups (Supplemental Material)and the generated gene distribution representative matrix (missing or empty data set to 0) wasvisualized in MATLAB to give the 3D representation of expressional values and the underlyingcontours representing the intensity and topological distribution of these changes.
Garamszegi et al. Page 16
Mol Cancer Res. Author manuscript; available in PMC 2010 March 1.
NIH
-PA Author Manuscript
NIH
-PA Author Manuscript
NIH
-PA Author Manuscript
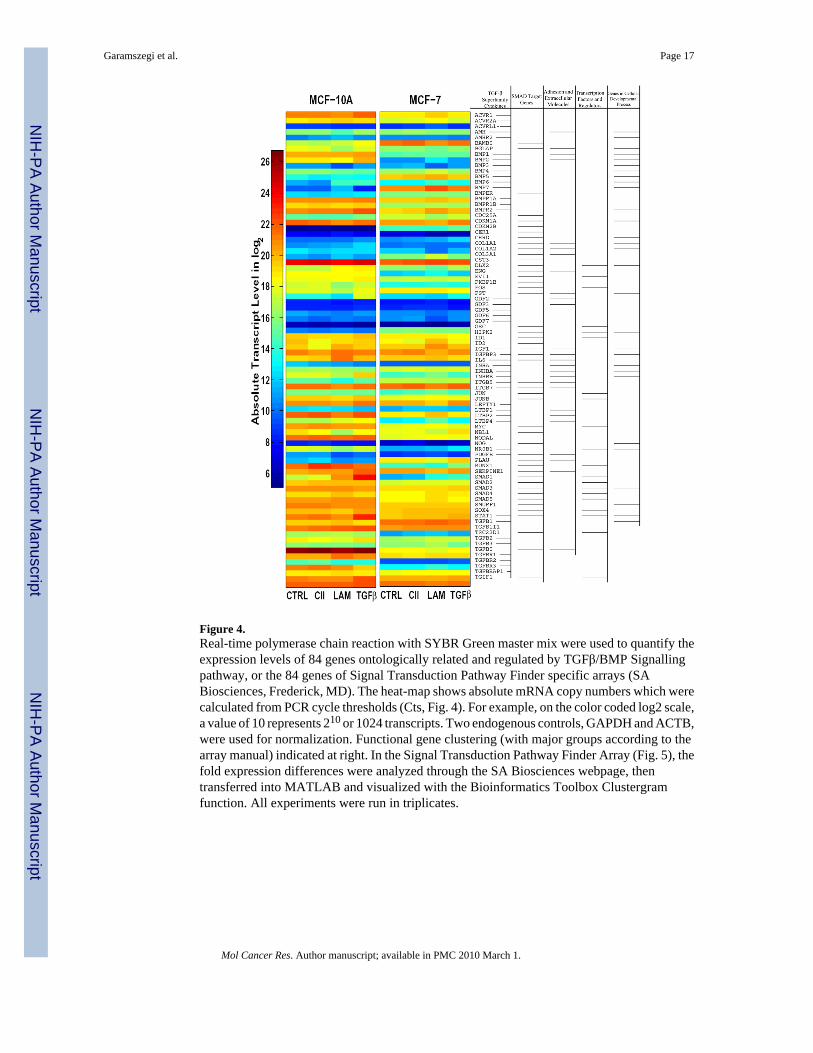
Figure 4.Real-time polymerase chain reaction with SYBR Green master mix were used to quantify theexpression levels of 84 genes ontologically related and regulated by TGFβ/BMP Signallingpathway, or the 84 genes of Signal Transduction Pathway Finder specific arrays (SABiosciences, Frederick, MD). The heat-map shows absolute mRNA copy numbers which werecalculated from PCR cycle thresholds (Cts, Fig. 4). For example, on the color coded log2 scale,a value of 10 represents 210 or 1024 transcripts. Two endogenous controls, GAPDH and ACTB,were used for normalization. Functional gene clustering (with major groups according to thearray manual) indicated at right. In the Signal Transduction Pathway Finder Array (Fig. 5), thefold expression differences were analyzed through the SA Biosciences webpage, thentransferred into MATLAB and visualized with the Bioinformatics Toolbox Clustergramfunction. All experiments were run in triplicates.
Garamszegi et al. Page 17
Mol Cancer Res. Author manuscript; available in PMC 2010 March 1.
NIH
-PA Author Manuscript
NIH
-PA Author Manuscript
NIH
-PA Author Manuscript
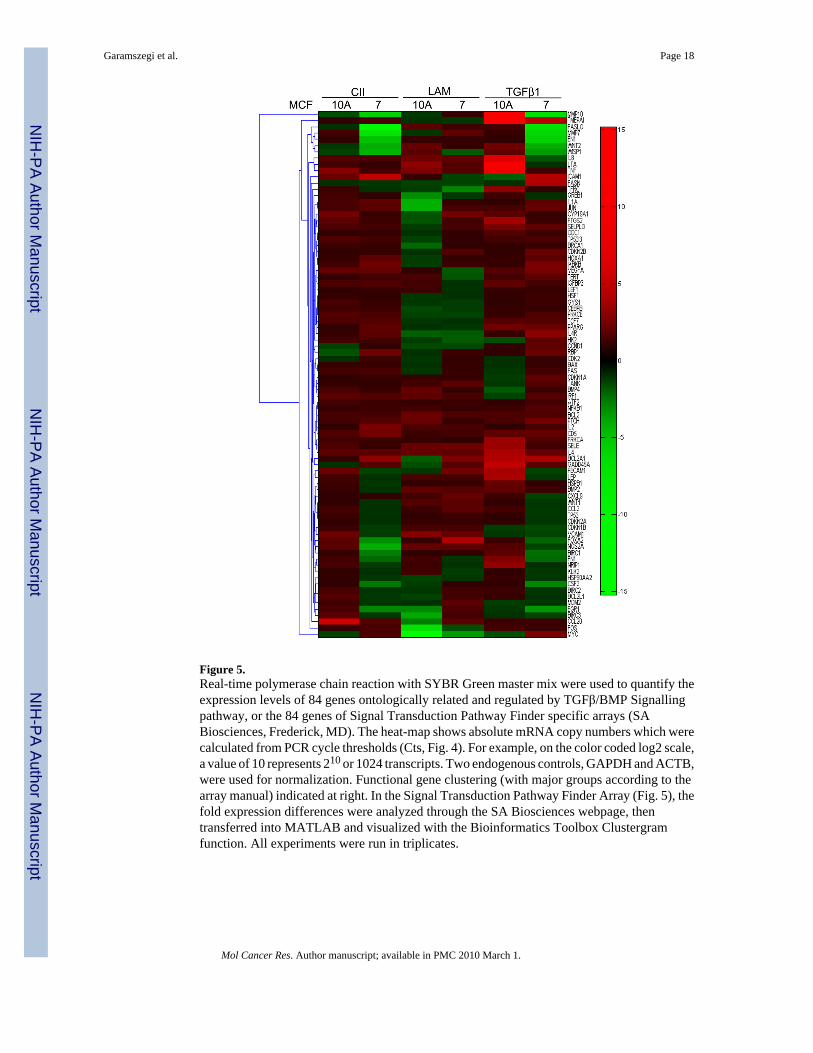
Figure 5.Real-time polymerase chain reaction with SYBR Green master mix were used to quantify theexpression levels of 84 genes ontologically related and regulated by TGFβ/BMP Signallingpathway, or the 84 genes of Signal Transduction Pathway Finder specific arrays (SABiosciences, Frederick, MD). The heat-map shows absolute mRNA copy numbers which werecalculated from PCR cycle thresholds (Cts, Fig. 4). For example, on the color coded log2 scale,a value of 10 represents 210 or 1024 transcripts. Two endogenous controls, GAPDH and ACTB,were used for normalization. Functional gene clustering (with major groups according to thearray manual) indicated at right. In the Signal Transduction Pathway Finder Array (Fig. 5), thefold expression differences were analyzed through the SA Biosciences webpage, thentransferred into MATLAB and visualized with the Bioinformatics Toolbox Clustergramfunction. All experiments were run in triplicates.
Garamszegi et al. Page 18
Mol Cancer Res. Author manuscript; available in PMC 2010 March 1.
NIH
-PA Author Manuscript
NIH
-PA Author Manuscript
NIH
-PA Author Manuscript
Garamszegi et al. Page 19
Mol Cancer Res. Author manuscript; available in PMC 2010 March 1.
NIH
-PA Author Manuscript
NIH
-PA Author Manuscript
NIH
-PA Author Manuscript
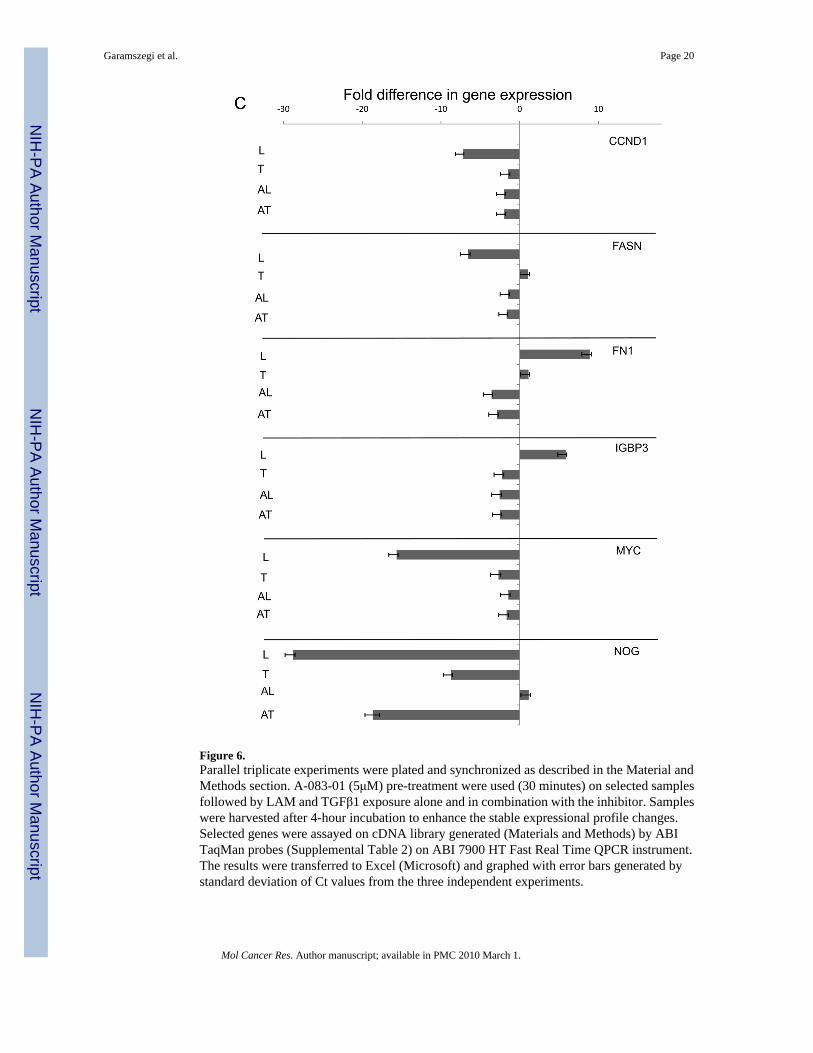
Figure 6.Parallel triplicate experiments were plated and synchronized as described in the Material andMethods section. A-083-01 (5μM) pre-treatment were used (30 minutes) on selected samplesfollowed by LAM and TGFβ1 exposure alone and in combination with the inhibitor. Sampleswere harvested after 4-hour incubation to enhance the stable expressional profile changes.Selected genes were assayed on cDNA library generated (Materials and Methods) by ABITaqMan probes (Supplemental Table 2) on ABI 7900 HT Fast Real Time QPCR instrument.The results were transferred to Excel (Microsoft) and graphed with error bars generated bystandard deviation of Ct values from the three independent experiments.
Garamszegi et al. Page 20
Mol Cancer Res. Author manuscript; available in PMC 2010 March 1.
NIH
-PA Author Manuscript
NIH
-PA Author Manuscript
NIH
-PA Author Manuscript
Copyright © 2022 FDOKUMEN