Cytotoxic and apoptotic potential of Myristica fragrans Houtt ...

Expression, purification and use of recombinantannexin V for the detection of apoptotic cellsSusan E Logue, Mohamed Elgendy & Seamus J Martin
Molecular Cell Biology Laboratory, Department of Genetics, The Smurfit Institute, Trinity College, Dublin, Ireland. Correspondence should be addressed to S.J.M.([email protected]).
Published online 3 September 2009; doi:10.1038/nprot.2009.143
Apoptosis is a mode of programmed cell death that is widely used to eliminate cells during development, tissue homeostasis,
infection or in response to injury. Alterations to the plasma membranes of apoptotic cells trigger recognition and engulfment of such
cells by phagocytes. Measurement of plasma membrane phosphatidylserine externalization, using fluorescently labeled annexin V,
is widely used for the detection of apoptotic cells. Here we describe protocols for bacterial expression, purification and FITC labeling
of recombinant annexin V. By following the method outlined in this protocol, it is possible to produce milligram amounts of
recombinant annexin V within 3 d. We also describe a method for the assessment of annexin V binding to cell populations by flow
cytometry or fluorescence microscopy.
INTRODUCTIONMulticellular organisms balance the rates of ongoing cell divisionand cell death to maintain homeostasis. Homeostatic cell deathtypically occurs in a precisely coordinated manner, known asapoptosis. Apoptosis is the preferred mode of death in multicellularorganisms, as this mode of cell death permits removal of dying cellswithout releasing cell contents, thereby minimizing the impact onsurrounding cells1. By comparison, necrosis is an uncoordinatedcell death process during which cells swell and rupture, releasingtheir contents onto surrounding cells and provoking activation ofthe immune system1.
Initial studies by Kerr et al.2 in the 1970s identified apoptotic cellsbased on their distinctive morphology. Cells undergoing apoptosisshow characteristic features including cell rounding and retraction,nuclear condensation, nuclear fragmentation and plasma mem-brane blebbing, while maintaining plasma membrane integrityuntil late in the process. These characteristic features of apoptoticcells are a consequence of the activation of a family of proteasescalled caspases1. Upon activation during apoptosis, caspases targethundreds of protein substrates for proteolysis, a specific subset ofwhich results in the characteristic apoptotic phenotype1,3. Ulti-mately, apoptotic cell death results in the controlled dismantling ofthe cell and formation of apoptotic bodies. Crucially, phagocytescan discriminate between healthy and apoptotic cells, rapidlyengulfing the latter to ensure their swift removal and precludingthe possibility of inadvertent leakage of cellular contents4.
Phosphatidylserine exposureThe mechanism by which phagocytes selectively recognize apopto-tic cells is not fully understood. However, plasma membranechanges are fundamental to this process. Several studies haveshown that phosphatidylserine (PS), a phospholipid normallyretained in the inner leaflet of the plasma membrane, is importantfor the recognition of apoptotic cells by phagocytes4–6. Typically, PSis actively sequestered in the inner leaflet of the plasma membranethrough the action of an aminophospholipid translocase and acalcium-dependent scramblase7. Upon receipt of pro-apoptoticsignals, PS is transported from the inner to the outer leaflet ofthe plasma membrane, in which it signals as an early marker
of apoptosis4–6. The exact mechanism of PS translocationduring apoptosis is unclear; however, the ATP-binding cassettetransporter, ABC1, has been implicated in mammals8, and theaminophospholipid translocase TAT-1 has been implicated asa PS-transporting molecule during programmed cell death inCaenorhabditis elegans9,10.
Annexin V binding assayAnnexin V, a member of the phosholipid-binding annexinfamily, binds efficiently to PS and, to a lesser extent, phosphati-dylcholine and sphingomyelin in a reversible and Ca2+-dependentmanner11,12. As annexin V can specifically bind to PS, this proteinrepresents a selective probe for identifying and quantifying apop-totic cells. Annexin V was first reported as a method to detectapoptotic cells by Koopman et al. in 1994 (ref. 5). In this study,B cells undergoing serum starvation-induced apoptosis were foundto exhibit a dramatic increase in the binding of annexin V, stronglysuggesting that PS externalization occurred during apoptosis5.Subsequent studies demonstrated that the annexin V stainingmethod could be used to detect apoptotic cells, in numeroussettings, irrespective of the stimulus used to trigger apoptosis orthe lineage of the cells under study6,7. Furthermore, it was alsodemonstrated that PS exposure preceded other features of apop-tosis, such as membrane permeabilization and nuclear condensa-tion, confirming that annexin V-mediated detection of PS is aviable technique for the early detection of apoptotic cells6. Impor-tantly, this study and subsequent studies also established a role forcaspases in PS externalization. Inhibition of caspase activation,through Bcl-2 overexpression, or addition of a poly-caspase inhi-bitor such as z-VAD-fmk reduced PS exposure and consequentlyannexin V binding6,13. However, the identity of the caspase sub-strates associated with the triggering of PS exposure duringapoptosis remains unknown. Although the complexities of PSexternalization and recognition are still being teased out, PSexposure is widely used as a signature of apoptotic cell death5–7,13.
On the basis of these initial studies, the annexin V binding assayhas become an established technique for the identification andquantification of apoptotic cells. Currently, a multitude of
p
uor
G g
n ih si l
bu
P eru ta
N 900 2©
nat
ure
pro
toco
ls/
moc.er
ut an.
ww
w//:ptt
h
NATURE PROTOCOLS | VOL.4 NO.9 | 2009 | 1383
PROTOCOL

techniques are available for the identification of apoptotic cellsincluding, among others, assessment based on morphologicalcriteria, analysis of DNA fragmentation through the TUNEL(terminal deoxynucleotidyltransferase-mediated dUTP nick endlabeling) method and determination of caspase activation eitherby western blot or by fluorimetry-based assays14. Each of theseassays is time-consuming, and in some cases, such as morpholo-gical assessment of cells for features of apoptosis, they are subjectiveand prone to operator bias. The annexin V binding assay hasnumerous advantages over these techniques. It is a rapid, precise,unbiased and reliable method that requires minimal sample pre-paration. Annexin V binding to cell populations can be evaluatedby microscopy or flow cytometry analysis. Assessment of annexin Vbinding by microscopy also permits the identification of othercharacteristics of apoptotic cells, such as nuclear fragmentation andplasma membrane blebbing. Although flow cytometry analysisdoes not allow such direct assessment of cell morphology, it doesafford a rapid and highly quantitative method for assessing apop-tosis and—in conjunction with vital dyes such as propidium iodide(PI)—can rapidly distinguish between apoptotic and necroticcells6.
Annexin V has been widely used for the detection of apoptoticcells in vivo as well as in vitro15,16. Imaging of cell death in vivo,using annexin V labeled with radiotracer or positron emissiontomography (PET) probes, has shown promising results and couldbecome a useful tool for the assessment of cell death in solid tumorsafter radiotherapy or chemotherapy17–19. Annexin V has also beenused to detect membrane PS externalization in other organisms,such as intracellular parasites20. Although PS externalizationappears to be a highly conserved feature of apoptosis, it has beenreported that some cell types do not appear to undergo increasedbinding of annexin V during apoptosis, for reasons that remainunclear21. However, this is very much the exception rather than therule, and the annexin V binding assay has been used to detectapoptosis in various cell types. A selection of cell types whereapoptosis can be readily detected using the annexin V binding assayis listed in Table 1.
The annexin V binding assay is a powerful tool for the quanti-fication of apoptosis and for distinguishing between apoptotic andnecrotic cells and is used by many laboratories. However, purchase
of significant quantities of fluorescein isothiocyanate (FITC)-conjugated annexin V can be expensive (100 mg of annexinV–FITC conjugate can cost h500 from commercial suppliers).Furthermore, in vivo imaging studies using annexin V require verylarge amounts of material, which makes the cost of sourcing thisprotein from commercial suppliers prohibitive in these circum-stances. For these reasons, we describe a method that can be usedto express and purify milligram amounts of annexin V within 3 d.
Overview of the procedureA flow chart depicting the steps involved in the expression andpurification of annexin V is shown in Figure 1. Recombinantannexin V can be expressed in bacteria and purified within 3 d. Thefirst two stages of the protocol involve minimal work but do requireovernight incubations at 37 1C. Purification of annexin V (day 3)represents the most intensive portion of the protocol and takesB8 h to complete. Purified annexin V can be stored at this pointfor several months. Conjugation of annexin V to FITC takes 3 d intotal with overnight dialysis required. To determine the optimalconcentration of annexin V–FITC that should be used tostain apoptotic cells, annexin V should be titrated on a cellpopulation containing a mixture of viable and apoptotic cells.Titration of FITC-conjugated annexin V requires flow cytometryanalysis of the stained cell population. The time required to induceapoptosis is dependent on the cell type and stimulus chosen. Tostain cells with annexin V, cells require a 5-min incubation withannexin V–FITC in a buffer containing 1.8 mM calcium ions. Flowcytometry analysis takes B10 min, depending on the number ofsamples, with a further 10 min required for analysis.
Experimental designpProEx.Htb.annexin V plasmid. Human annexin V cDNA(accession no. NM_001154) was amplified from a Jurkat cDNAlibrary through PCR and cloned into the bacterial expression vectorpProEx.Htb using the restriction sites BamHI and EcoRI. ThepProEx.Htb vector contains an ampicillin resistance cassette andencodes an N-terminal poly-histidine tag to facilitate purificationof proteins expressed with this epitope tag. The ampicillin resis-tance gene enables selection and growth of colonies expressing thepProEx.Htb.annexin V plasmid. The Trc promoter within thepProEx.Htb.annexin V plasmid is under the control of the lacIrepressor and can be activated by the addition of isopropyl-b-D-thiogalactopyranoside (IPTG) (a lactose analog) to the bacterialgrowth medium, thereby inducing expression of recombinantannexin V protein with an N-terminal poly-histidine tag. Poly-histidine-tagged proteins bind with high affinity to nickel or cobaltions. Ni–nitrilotriacetic acid (NTA) agarose can then be used tocapture and purify the recombinant annexin V from bacteriallysates.
Transformation of competent DH5a Eschericha coli bacteriawith the pProEx.Htb.annexin V plasmid. When transformingcompetent DH5a E. coli bacteria with the pProEx.Htb.annexin Vplasmid, it is important to include a control transformation wherecompetent DH5a bacteria are mock-transformed with sterile water.The next morning, many individual bacterial colonies should bepresent on the pProEx.Htb.annexin V-transformed plate (Fig. 1).The control plate should be completely devoid of any bacterialgrowth. The presence of colonies on the control plate suggests
p
uor
G g
n ih si l
bu
P eru ta
N 900 2©
nat
ure
pro
toco
ls/
moc.er
ut an.
ww
w//:ptt
h
TABLE 1 | Selection of cell types where apoptosis can be readilydetected using the annexin V binding assay.
Cell type Reference
B cell lines 5T lymphoblastoid cell lines, e.g., Jurkat 6Myeloid lineage cells, e.g., THP-1, U937 25 and 26Ovarian carcinoma lines, e.g., HeLa, SK-OV-3 27 and 28Human embryonic kidney cells (HEK-293) 29Human and murine primary cell lines (MRC-5, MEF) 30 and 31Human non-small cell lung cancer (MR65) 32Human melanoma line (SKMel 1) 33Human and murine hepatocytes 34 and 35Murine thymocytes 36Murine and simian fibroblasts, e.g., NIH-3T3 and COS,respectively
37 and 38
Chinese hamster ovary cells (CHO) 39Rat glomerular mesangial cells 40
1384 | VOL.4 NO.9 | 2009 | NATURE PROTOCOLS
PROTOCOL

nonspecific transformation (e.g., due to contamination with someother plasmid) in which colonies that do not contain the plasmid ofinterest are present. For this to occur, the pProEx.Htb.annexinV-transformed plate should not be used and the transformationshould be repeated using fresh bacteria and reagents.
Analysis of recombinant annexin V production and purifica-tion. To monitor the production and purification of recombinantannexin V in this protocol, we highlight specific steps at whichsamples should be collected for subsequent SDS-PAGE gel analysis.Samples taken before and after the addition of IPTG to bacterialcultures can be used to confirm successful expression of annexin V.In Figure 2, annexin V protein is not evident in lane 1 (T0), butafter a 3-h incubation of pProEx.Htb.annexin V-transformedbacteria in the presence of IPTG, annexin V protein is now present,as shown in lane 2 (T3). The expression of annexin V proteinconfirms a successful induction.
During the purification phase of the protocol, samples arecollected to monitor the purification process and to identify stepsin the procedure at which problems may have arisen. The bacteriallysate sample (lane 3) confirms the presence of annexin V in thelysate following sonication to rupture bacterial cell walls and releasethe proteins inside. It is important to take bacterial supernatant(lane 4) and pellet samples (lane 5) to verify that the protein ofinterest is present in the soluble fraction of the bacterial lysate andis not retained exclusively in the insoluble pellet fraction aftercentrifugation. Inclusion of a pre-elution Ni–NTA resin sample(lane 6) allows us to confirm that the recombinant annexin V hasbeen successfully captured on the Ni–NTA resin. The E1, E2 and E3eluate samples (lanes 7–9) verify that the imidazole present in theelution buffer has displaced the poly-histidine-tagged annexin Vfrom the Ni–NTA resin. Three elutions are carried out in total.Normally this is sufficient to liberate all bound annexin V from theNi–NTA agarose. The post-elution Ni–NTA sample (lane 10) isused to confirm that the majority of recombinant annexin Vprotein has been eluted from the Ni–NTA resin.
Determining the yield of annexin V. The yield of annexin V inthe eluate fractions can be roughly estimated by directly comparingthe intensity of the protein bands in the E1, E2 and E3 samples onan SDS-PAGE gel, with known amounts of bovine serum albumin(BSA) ran on the same gel. As described in Table 2, 25 ml of samples1–10 are loaded onto the gel. For the BSA standards, 100 ml of 2�SDS-PAGE sample buffer is added to 100 ml of 1 mg ml�1 BSA,giving 200 ml of 0.5 mg ml�1 BSA in 1� SDS-PAGE sample buffer.To load 4 mg of BSA standard, 8 ml of 0.5 mg ml�1 BSA in 1� SDS-PAGE sample buffer is loaded. It is important to determine the yieldof annexin V so that the protein concentration can be adjusted to1 mg ml�1 for subsequent conjugation to fluorochromes.
Conjugation of recombinant annexin V with a fluorochrome.In this protocol, we describe the chemical coupling of annexin V tothe fluorochrome FITC, although other fluorochromes such asTRITC can be substituted for FITC depending on the particularneed. This is especially useful if the use of FITC will interfere withthe analysis of another fluorescent marker (e.g., green fluorescentprotein). After conjugation of the fluorochrome to annexin V, it isimportant to estimate the yield of conjugated protein. This isachieved by running varying amounts of conjugated annexin V onan SDS-PAGE gel, alongside known amounts of BSA. The yield ofconjugated protein can be estimated by directly comparing theannexin V–FITC bands to the BSA standards.
Considerations for a successful binding assay. For the annexin Vbinding assay to work successfully, several important factors needto be considered.
Cell treatments. Cells to be stained with annexin V should not befixed or permeabilized with agents such as paraformaldehyde ormethanol, as this may generate false positives. Indeed, the sameconsideration applies when harvesting adherent cells, as aggressivetrypsinization or manipulation of cells (e.g., scraping to detach cells
p
uor
G g
n ih si l
bu
P eru ta
N 900 2©
nat
ure
pro
toco
ls/
moc.er
ut an.
ww
w//:ptt
h
Day 0 Day 1 Day 2 Day 3
Transform pProExHtb.annexin V plasmid
into DH5α competentbacteria
Select colonies andgrow 3-ml startercultures overnight
Induce expression ofannexin V in a large-scaleculture for 3 h, pellet and
freeze bacteria
CaptureHis-taggedannexin V
on Ni2+ NTAbeads
Determine yield andpurity of recombinantannexin V by SDS-
PAGE
Figure 1 | Process flow scheme. Day 0,
transformation of pProExHtb.annexin V plasmid;
day 1, inoculation of an overnight 3-ml starter
culture; day 2, dilution of overnight starter cultures
into 250 ml of LB and induction of annexin V
expression by the addition of IPTG; day 3, capture of
His-tagged annexin V on Ni2+ NTA beads, elution of
protein and SDS-PAGE analysis to estimate the
annexin V yield and to determine the protein purity.
kDa
175
8362
47.5
32.5
25
16.56.5
1 2 3 4 5 6 7 8 9 10 11 12 13
T 0 T 3 Lysa
te
Super
nata
nt
Pellet
Ni–NTA
pre
-elut
ion
Ni–NTA
pos
t-elut
ion
Elution
#1
Elution
#2
Elution
#3
BSA (μg)
4 2 1Figure 2 | SDS-PAGE analysis of expression and purification of annexin V.
Bacterial lysate samples taken before (T0) (lane 1) and after ITPG treatment
(T3) (lane 2) were analyzed by SDS-PAGE. Clear induction of annexin V
(B34 kDa) is visible after IPTG treatment (lane 2). Equivalent volumes of
bacterial lysate after sonication (lysate) (lane 3), removal of insoluble
material (pellet) (lane 5) and the clarified bacterial (supernatant) (lane 4)
were also run on the gel. A 5-ml sample of Ni-NTA beads after protein capture
(Ni-NTA pre-elution) (lane 6) was run alongside 5 ml of elution 1 (lane 7),
elution 2 (lane 8), elution 3 (lane 9) and beads post elution (Ni-NTA post-
elution) (lane 10). Known amounts of BSA were included to allow the
estimation of annexin V concentration (lanes 11–13). The numbers present at
the bottom of the gel correspond to the sample preparation outlined in
Table 2. Molecular weight markers are shown (kDa).
NATURE PROTOCOLS | VOL.4 NO.9 | 2009 | 1385
PROTOCOL

from the plate) may damage plasma membranes, again leading tofalse positives.
Calcium concentration. For annexin V to bind PS efficiently,calcium is required at a concentration of 1–3 mM. Annexin Vbinding buffer should therefore contain calcium. For most celltypes, a concentration of 1.8 mM calcium is ideal, as higherconcentrations can result in nonspecific binding of annexin V toother phospholipids.
Buffer pH. The pH of the annexin V binding buffer should beabove pH 5, but ideally pH 7.2; a pH below 5 leads to the loss of thePS binding properties of annexin V.
Titration of annexin V–FITC. Each batch of annexin V–FITCmust be carefully titrated to determine the optimum concentrationfor use in annexin V–FITC binding assays. Cells shouldbe treated with a known apoptotic stimulus and binding assayscarried out using varying concentrations of annexin V–FITC (0.1,0.5, 1 and 2 mg ml�1). This step is particularly important,as too much or too little annexin V–FITC may give sub-optimalseparation between healthy and apoptotic cell populations in thebinding assays.
PI staining. When carrying out annexin V binding assays, weroutinely incorporate a vital dye, such as PI, to distinguish between
apoptotic and necrotic cells. PI can enter necrotic cells withdisrupted plasma membrane, but is excluded from apoptotic cellswhere the plasma membrane remains intact. It is added to the cells,from a 10� stock (100 mg ml�1) of dye, just before acquiringsamples on the flow cytometer. It is important to add the PI justbefore sample acquisition, as prolonged incubation with PI can leadto false-positive results.
Considerations for flow cytometry. Negative control. Untreatedcells must be included to enable the setup of the flow cytometer22.Forward and side scatter settings are set on control cells, as are theFL1 and FL2 channel settings. Refer to a flow cytometer manual forspecific instructions on set up.
Positive control. For FITC–annexin V binding assays, it is impor-tant to incorporate a positive control sample. This is usually asample of the particular cell type treated with a known apoptoticstimulus (e.g., Jurkat cells treated with 250 ng ml�1 of anti-Fas, 10mM of actinomycin D (Act D) or 2.5 mM of staurosporine6).
Compensation. When using multicolor flow cytometry, e.g.,FITC–annexin V and PI staining, it is important to compensatefor spectral overlap between the different fluorochromes used22.Please refer to flow cytometer manual for specific instructionsregarding compensation settings.
MATERIALSREAGENTS.pProEx.Htb.annexin V (this plasmid is
freely available upon request to investigators working in non-profitorganizations) (see REAGENT SETUP).
.Competent DH5a Eschericha coli bacteria
.Acrylamide (Sigma, cat. no. A8887) ! CAUTION Neurotoxic; wear gloveswhen handling and weigh out in a fume hood.
.Ammonium persulphate (Sigma, cat. no. A3678)
.Bis-acrylamide (Fluka, cat. no. 66669) ! CAUTION Neurotoxic;wear gloves when handling and weigh out in a fume hood.
.Bacto-tryptone (Becton Dickinson, cat. no. 211705)
.Bacto-yeast extract (Becton Dickinson, cat. no. 212750)
.Bacto-agar (Becton Dickinson, cat. no. 214010)
.Sodium chloride (Sigma, cat. no. 57653)
.Trizma Base (Sigma, cat. no. T1503)
.2-Mercaptoethanol (Sigma, cat. no. M7154) ! CAUTION Toxic; avoidexposure and use in a fume hood.
.Potassium chloride (Sigma, cat. no. P9333)
.Glycerol (Sigma, cat. no. G6279)
.SDS (Sigma, cat. no. L5750)
.Glycine (Sigma, cat. no. G8898)
.Bromophenol blue (Sigma, cat. no. B8026)
.Methanol ! CAUTION Flammable should be handled awayfrom any sources of ignition.
.PI (Sigma, cat. no. P4170) (see REAGENT SETUP)
.Acetic acid (Fluka, cat. no. 45731) ! CAUTION Corrosive; wear gloves andeye protection when handling.
.Calcium chloride (Sigma, cat. no. C3306)
.HEPES (Sigma, cat. no. H7523)
.Magnesium chloride (Sigma, cat. no. M8266)
.Sodium phosphate dibasic (Sigma, cat. no. S7907)
.Potassium phosphate monobasic (Sigma, cat. no. P5655)
.TEMED (Sigma, cat. no. T9281)
.Brilliant blue (Sigma, cat. no. 57653)
.Protein marker (NEB, cat. no. P77085)
.30% (wt/vol) Acrylamide solution (see REAGENT SETUP) ! CAUTIONNeurotoxic; wear gloves when handling.
.LB medium (see REAGENT SETUP)
p
uor
G g
n ih si l
bu
P eru ta
N 900 2©
nat
ure
pro
toco
ls/
moc.er
ut an.
ww
w//:ptt
h
TABLE 2 | Outline of sample preparation for SDS-PAGE gel.
Lane Sample2� SDS-PAGEbuffer (ll)
1� SDS-PAGEbuffer (ll)
Amountloaded (ll)
1 T0 — 50 252 T3 — 50 253 Lysate 20 10 254 Supernatant 20 10 255 Pellet 20 10 256 Pre-elution beads 5 15 257 Elution 1 5 15 258 Elution 2 5 15 259 Elution 3 5 15 2510 Post-elution beads 5 15 2511 20 ml of BSA (1 mg ml�1) 20 — 8 (4 mg)12 BSA (1 mg ml�1) as prepared in sample 11 — — 4 (2 mg)13 BSA (1 mg ml�1) as prepared in sample 11 — — 2 (1 mg)
1386 | VOL.4 NO.9 | 2009 | NATURE PROTOCOLS
PROTOCOL

.LB agar plates (see REAGENT SETUP)
.Ampicillin (Sigma, cat. no. 9518) (see REAGENT SETUP)
.IPTG (Melford, cat. no. MB1008) (see REAGENT SETUP)
.Tris mercaptoethanol (Tm) lysis buffer (see REAGENT SETUP)
.Imidazole (Sigma, cat. no. I5573)
.Imidazole wash buffer (see REAGENT SETUP)
.Imidazole elution buffer (see REAGENT SETUP)
.PMSF (Sigma, cat. no. 7626)
.Leupeptin (Sigma, cat. no. 62070)
.Aprotinin (Sigma, cat. no. 10820)
.BSA (Sigma, cat. no. A2153)
.12% (vol/vol) SDS-PAGE gel (see REAGENT SETUP)
.SDS-PAGE gel running buffer (see REAGENT SETUP)
.2� SDS PAGE sample buffer (see REAGENT SETUP)
.Sodium carbonate (see REAGENT SETUP)
.Phosphate buffered saline (PBS) pH 7.2 (see REAGENT SETUP)
.Coomassie stain (see REAGENT SETUP)
.Destain solution (see REAGENT SETUP)
.Fluorescein isothiocyanate (Sigma, cat. no. F1010)(see REAGENT SETUP)
.Ni–NTA agarose (Qiagen, cat. no. 3020)
.Annexin V binding buffer (see REAGENT SETUP)
.DMSO (Sigma, cat. no. D-8779)EQUIPMENT.Sorvall centrifuge or equivalent.Branson sonifier/cell disruptor or similar.Rotator.0.2 mm Filters.Syringe (1 ml).Slide-E-Lyzer 3.5 kDa cutoff (Pierce, cat no. 66330) or similar dialysis
membrane.Stirrer plate.Microcentrifuge.SDS-PAGE system.Flow cytometer
REAGENT SETUPpProEx.Htb.annexin V Human annexin V cDNA (accession no. NM_001154)was amplified from a Jurkat cDNA library through PCR and cloned into thebacterial expression vector pProEx.Htb vector using the restriction sites BamHIand EcoRI. The pProEx.Htb vector encodes ampicillin resistance and incorpo-rates a N-terminal poly-histidine tag.LB medium Add 5 g of bacto-tryptone, 2.5 g of bacto-yeast extract and 5 g ofsodium chloride to 500 ml of H2O and sterilize by autoclaving. If required, addampicillin to a final concentration of 100 mg ml�1 following sterilization. LB mediumwithout ampicillin can be stored at room temperature (B22 1C) for up 1 year,providing no bacterial growth occurs. m CRITICAL Allow the LB medium to coolbefore the addition of ampicillin, as ampicillin degrades at temperatures above 56 1C.LB Agar Add 5 g of bacto-tryptone, 2.5 g of yeast extract, 5 g of sodiumchloride and 7.5 g of bacto-agar to 500 ml of H2O and sterilize by autoclaving.Allow to cool to 56 1C or until the bottle can be comfortably held in the hand.Then, add ampicillin to a final concentration of 100 mg ml�1. Mix by gentleswirling and pour B20 ml into each sterile Petri dish (100 mm diameter). Allowthe plates to set on the bench and then store at 4 1C for up to 1 month.m CRITICAL Allow the LB agar to cool to below 56 1C before the addition ofampicillin, as ampicillin degrades at temperatures above 56 1C.Ampicillin Prepare a stock solution of 100 mg ml�1 in H2O and filter-sterilizeusing a 0.2-mm filter. Store at �20 1C in 1 ml aliquots for up to 1 year.IPTG Prepare a stock solution of 500 mg ml�1 in H2O and filter-sterilize usinga 0.2-mm filter. Store at �20 1C in 1 ml aliquots for up to 1 year.Tm lysis buffer 50 mM Tris-HCl (pH 8.5). Immediately before use,add 10 of mM 2-mercaptoethanol, 1 mM of PMSF, 2 mg ml�1 of aprotinin, 10 mgml�1 of leupeptin. When the protease inhibitors have been added, the Tm lysisbuffer should be stored on ice. Discard Tm lysis buffer after use.Imidazole wash buffer 20 mM Tris-HCl (pH 8.5), 100 mM of KCl, 10%glycerol (vol/vol). Add 10 mM of 2-mercaptoethanol and 20 mM of imidazoleimmediately before use. Discard buffer after use.
Imidazole elution buffer Add 100 mM of imidazole, 1 mM of PMSF,2 mg ml�1 of aprotinin, 10 mg ml�1 of leupeptin to PBS immediately before use.Discard buffer after use.23 SDS-PAGE sample buffer 100 mM of Tris-HCl, pH 6.8, 4% SDS(wt/vol), 0.2% bromophenol blue (wt/vol), 20% glycerol (vol/vol), 715 mM2-mercaptoethanol. It (minus 2-mercaptoethanol) can be stored at roomtemperature for up to 1 year. Before use, add 715 mM of 2-mercaptoethanol.Once 2-mercaptoethanol has been added, the buffer should be stored for nolonger than 1 week at room temperature.53 SDS-PAGE running buffer Add 15.14 g of Tris, 93.8 g of glycine and 5 g ofSDS to 1 liter of H2O. Adjust the pH to 8.3 and store at room temperature for upto 1 year.30% (wt/vol) Acrylamide (29:1) solution Dissolve 29 g of acrylamide and 1 gof bis-acrylamide in H2O to a final volume of 100 ml. The solution can be storedat 4 1C for up to 1 year. ! CAUTION Acrylamide and bis-acrylamide areneurotoxic, wear gloves when handling and weigh in a fume hood.12% SDS-PAGE separating gel
Separating gel(10 ml sufficient for 1 gel)
H2O (ml) 3.330% Acrylamide (wt/vol) (29:1) (ml) 4.01 M Tris-Cl (pH 8.8) (ml) 2.510% SDS (wt/vol) (ml) 0.110% APS (wt/vol) (ml) 0.1TEMED (ml) 0.004
Stacking gel(5 ml sufficient for 1 gel)
H2O (ml) 3.430% Acrylamide (wt/vol) (29:1) (ml) 0.831 M Tris-Cl (pH 8.8) (ml) 0.6310% SDS (wt/vol) (ml) 0.0510% APS (wt/vol) (ml) 0.05TEMED (ml) 0.005
Coomassie stain 225 ml of methanol, 225 ml of H2O, 50 ml of acetic acid and1 g of Coomassie brilliant blue. It can be stored for up to 1 year at roomtemperature. ! CAUTION Acetic acid is corrosive and should be handled withcare. Wear gloves when handling.Destain solution 225 ml of methanol, 225 ml of H2O, 50 ml of acetic acid. Itcan be stored at room temperature for up to 1 year.Sodium carbonate 100 mM pH 9. It can be stored at room temperature for upto 1 year.PBS, pH 7.2 Dissolve 8 g of NaCl, 0.2 g of KCl, 1.44 g of Na2HPO4, 0.24 g ofKH2PO4 in 1 l of H2O, adjust to pH 7.2. It can be stored at room temperature forup to 1 year.FITC 1 mg ml�1 stock in DMSO. Prepare 100 ml aliquots and store protectedfrom light at�20 1C for up to 1 year. m CRITICAL It is light-sensitive and mustbe stored protected from light.Annexin V binding buffer 10 mM of HEPES-NaOH (pH 7.4), 150 mMof NaCl, 5 mM of KCl, 1 mM of MgCl2, 1.8 mM of CaCl2. Store at 4 1C forup to 1 year.PI Prepare 1 mg ml�1 stock in PBS. Store at 4 1C protected from lightfor up to 1 year.EQUIPMENT SETUPEquilibrated Ni–NTA Gently re-suspend 250 ml of Ni–NTA agarose(50 ml of Ni–NTA agarose per ml of bacterial lysate) and place in amicrocentrifuge tube, centrifuge for 1 min at 1,000g, room temperature.Remove the supernatant and equilibrate the Ni-NTA agarose by adding0.5� volume (125 ml) of imidazole wash buffer (REAGENT SETUP). Resuspendthe matrix and centrifuge again for 1 min at 1,000g, room temperature.Remove the supernatant and resuspend the Ni-NTA with 0.5� volume(125 ml) of imidazole wash buffer. In total, there is 250 ml of equilibratedNi-NTA. m CRITICAL Equilibrate Ni-NTA immediately before use; this is besttimed during Step 20.
p
uor
G g
n ih si l
bu
P eru ta
N 900 2©
nat
ure
pro
toco
ls/
moc.er
ut an.
ww
w//:ptt
h
NATURE PROTOCOLS | VOL.4 NO.9 | 2009 | 1387
PROTOCOL
PROCEDUREDay 0: transformation of chemically competent DH5a strain E. coli bacteria with annexin V expression plasmid
� TIMING B2 h + overnight1| Thaw 100 ml of competent DH5a E. coli bacteria on ice.
2| Dispense 50 ml of competent DH5a E. coli bacteria into a 13-ml pre-chilled round-bottomed tube.
3| Add 2 ml (B1 mg) of pProEx.Htb.annexin V bacterial expression plasmid. As a control, add 2 ml of sterile H2O to 50 ml ofcompetent DH5a bacteria.
4| Incubate on ice for 30 min.
5| Heat shock for 40 s at 42 1C to allow the uptake of the plasmid.
6| Place on ice for 2 min.
7| Add 450 ml of liquid LB medium to each transformation mixture and incubate for 1 h at 37 1C in a shaking incubator(220 r.p.m.).
8| Spread 50 ml aliquots of the transformed bacteria from Step 7 onto agar plates containing 100 mg ml�1 ampicillin(REAGENT SETUP). Incubate the plates overnight at 37 1C to allow bacterial colonies to grow.
9| The next morning, remove the plates from the incubator and store at 4 1C.’ PAUSE POINT Plates can be stored at 4 1C for 1 month.? TROUBLESHOOTING
Day 1: prepare overnight seed culture � TIMING B5 min + overnight10| Inoculate 3 ml of liquid LB medium containing 100 mg ml�1 ampicillin, with a single bacterial colony picked fromthe pProEx.Htb.annexin V-transformed plate (Step 9). Grow the colony overnight in a 37 1C shaker incubator shaking at280 r.p.m. (Fig. 1).
Day 2: expression of annexin V � TIMING B6 h11| Dilute 2.5 ml of the overnight culture 1:100 in 250 ml of liquid LB culture medium supplemented with 100 mg ml�1 ofampicillin to a starting OD600 of B0.1.
12| Grow the diluted culture at 37 1C with shaking (280 r.p.m.) to mid-log phase (OD600 of 0.4–0.6). This step takes B2 h.
13| Remove a 1-ml sample of the culture, place in a microcentrifuge tube and label as the 0 h sample (T0). Centrifuge theT0 sample for 1 min at 20,000g, room temperature, remove the supernatant and freeze the bacterial pellet at �20 1C for lateranalysis at Step 34 (Fig. 2).’ PAUSE POINT The bacterial pellets can be stored at �20 1C for several months.
14| To the remaining culture, add IPTG to a final concentration of 500 mM and continue incubation for an additional 3 hshaking at 280 r.p.m., 37 1C.? TROUBLESHOOTING
15| After incubation with IPTG, remove a 1-ml sample of the culture and centrifuge for 1 min at 20,000g, room temperature,remove the supernatant and freeze the bacterial pellet at �20 1C for later analysis at Step 34 (Fig. 2). Label this as the 3 hinduction sample (T3).
16| Pellet the remaining culture for 10 min at 7,500g, 4 1C. Discard the supernatant and either continue with the protocol oralternatively freeze the bacterial pellet at �20 1C. Better lysis of the bacterial cell pellet is usually achieved after freezing for aminimum of 1 h, although this step can be omitted if time is limited.’ PAUSE POINT Bacterial cell pellets can be stored at �20 1C overnight, or for several months at this point.
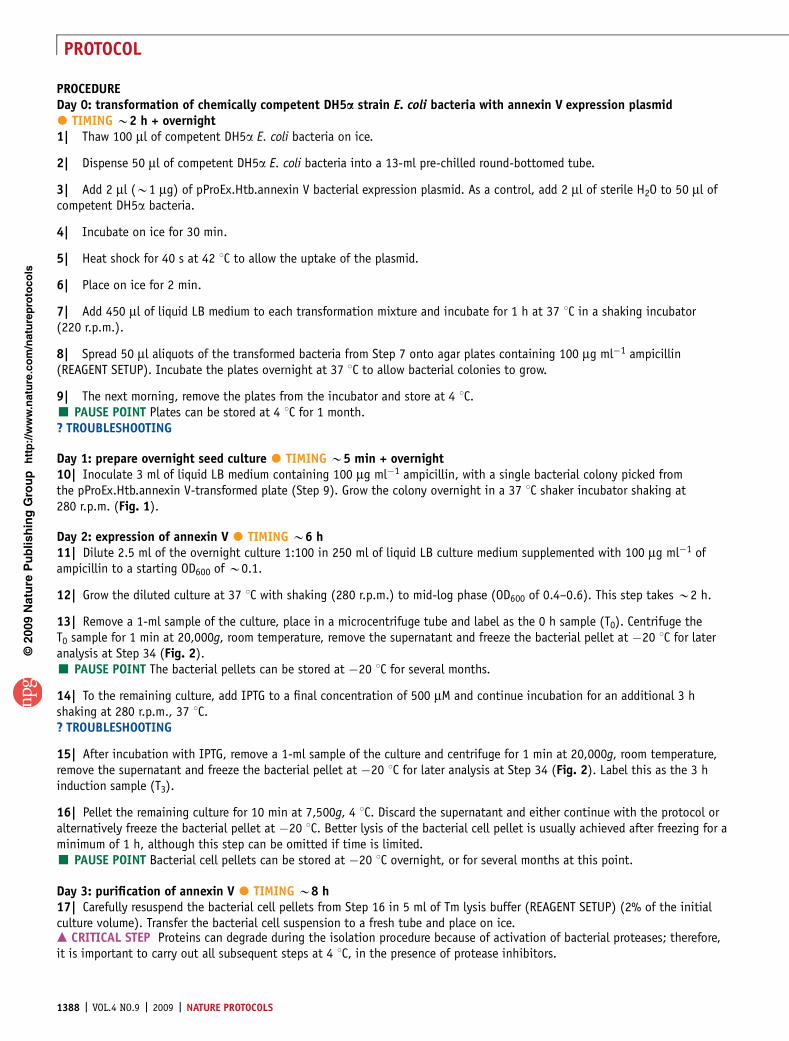
Day 3: purification of annexin V � TIMING B8 h17| Carefully resuspend the bacterial cell pellets from Step 16 in 5 ml of Tm lysis buffer (REAGENT SETUP) (2% of the initialculture volume). Transfer the bacterial cell suspension to a fresh tube and place on ice.m CRITICAL STEP Proteins can degrade during the isolation procedure because of activation of bacterial proteases; therefore,it is important to carry out all subsequent steps at 4 1C, in the presence of protease inhibitors.
p
uor
G g
n ih si l
bu
P eru ta
N 900 2©
nat
ure
pro
toco
ls/
moc.er
ut an.
ww
w//:ptt
h
1388 | VOL.4 NO.9 | 2009 | NATURE PROTOCOLS
PROTOCOL

18| Using a Branson sonicator, or similar, disrupt the bacteria on ice with 5 � 30 s pulses of 5 W (with 40 s pauses betweeneach pulse to minimize buildup of heat within the sample that could denature the protein of interest). After sonication, thelysate should be less viscous and lighter in color. Remove a 20-ml sample of the bacterial lysate after the sonication(lysate sample) and freeze at �20 1C for later analysis (Step 34) (Fig. 2).m CRITICAL STEP It is important not to over-sonicate or allow excessive frothing of the sample, as this can result in proteindenaturation because of the generation of excessive heat.
19| Divide the bacterial lysate into 5 � 1 ml microcentrifuge tubes and spin for 15 min at 15,000g, 4 1C to pellet insolublematerial and bacteria that have failed to lyse.
20| During the above 15 min spin, equilibrate the Ni-NTA agarose (REAGENT SETUP), which will be used to capture thepolyhistidine-tagged annexin V.
21| Remove the clear bacterial supernatant from each microcentrifuge tube (from Step 20 above) and combine in a clean tube(B5 ml of supernatant in total). Take a 20-ml sample of the supernatant (supernatant sample) and freeze at �20 1C for lateranalysis (Step 34) (Fig. 2). Resuspend one of the bacterial pellets in 1 ml of H2O, take a 20-ml sample (pellet sample) and freezeat �20 1C for later analysis (Step 34). The remaining bacteria pellets should be discarded.? TROUBLESHOOTING
22| Add 250 ml of equilibrated Ni-NTA (REAGENT SETUP) to the combined supernatants, seal the tube and incubate underconstant rotation for 3 h at 4 1C to allow the capture of the polyhistidine-tagged annexin V.m CRITICAL STEP Protein capture should always be carried out at 4 1C to minimize protein degradation.
23| After proteins have been captured on the Ni-NTA agarose, gently centrifuge the agarose (for 1 min at 1,000g, 4 1C) andremove the supernatant (B5 ml), which should now be depleted of annexin V.
24| Add 1 ml of imidazole wash buffer to the Ni-NTA agarose and incubate for 5 min under constant rotation at 4 1C to washoff nonspecifically bound bacterial proteins. Centrifuge the Ni-NTA agarose as in Step 23 and discard the supernatant.
25| Repeat Step 24 twice for a total of three washes.m CRITICAL STEP Washing of the Ni-NTA matrix (Steps 24–25) after protein capture is important to ensure high purity ofrecombinant annexin V, free from contaminating bacterial proteins.
26| Following the final wash and after removal of the supernatant, resuspend the Ni-NTA agarose in 125 ml of imidazole washbuffer. Take a 5-ml sample of the Ni-NTA (pre-elution beads sample) and freeze at �20 1C for later analysis (Step 34) (Fig. 2).
27| Centrifuge the remaining Ni-NTA (for 1 min at 1,000g, 4 1C), remove the supernatant and resuspend in 250 ml of ice-coldimidazole elution buffer.
28| Elute the captured annexin V under constant rotation for 30 min at 4 1C.? TROUBLESHOOTING
29| Centrifuge the Ni-NTA (for 1 min at 1,000g, 4 1C) and remove the supernatant (elution 1), which should contain purifiedrecombinant annexin V, and store at 4 1C.m CRITICAL STEP Do not discard the supernatants from this step as these contain the purified annexin V.
30| Add 250 ml of ice-cold imidazole elution buffer to the beads and repeat Steps 28 and 29. Add a further 250 ml ofice-cold imidazole elution buffer and repeat Steps 28 and 29. Keep the elution fractions (elutions 2 and 3) at 4 1C. In total,three elutions should be carried out. Normally this is sufficient to liberate all bound annexin V.’ PAUSE POINT The eluted protein can be stored at 4 1C for up to 1 year.? TROUBLESHOOTING
31| Resuspend the post-elution beads in 125 ml of imidazole wash buffer. Take a 5-ml sample (post-elution beads) and freeze at�20 1C for later analysis (Step 34).? TROUBLESHOOTING
32| Thaw the collected samples (Steps 13, 15, 18, 21, 26, 29–31) on ice and prepare samples for gel electrophoresis by theaddition of SDS-PAGE loading buffer (as outlined in Table 2). Also prepare the BSA standards as described in Table 2.
33| Boil the samples at 100 1C for 7 min, place on ice for 2 min and spin for 1 min at 20,000g, room temperature.
p
uor
G g
n ih si l
bu
P eru ta
N 900 2©
nat
ure
pro
toco
ls/
moc.er
ut an.
ww
w//:ptt
h
NATURE PROTOCOLS | VOL.4 NO.9 | 2009 | 1389
PROTOCOL

34| Load the samples onto a 12% SDS-PAGE gel (REAGENT SETUP) as outlined in Table 2. Run the gel for B3 h at 75 V or untilthe dye front reaches the bottom of the gel.
35| Stain the gel by addition of 100 ml of Coomassie blue stain (REAGENT SETUP). Incubate overnight at room temperaturewith gentle shaking (50 r.p.m.).
Day 4: quantification of annexin V yield � TIMING B5 h36| Remove the Coomassie stain, briefly rinse the gel with 100 ml of dH2O, and add 100 ml of destain solution(REAGENT SETUP).
37| Incubate the gel with gentle shaking (50 r.p.m.) at room temperature with several changes of destain solution until theprotein becomes visible (at least 4 h destaining is required to visualize protein bands).
38| Quantify the amount of annexin V in each elution fraction, either by comparison with the BSA standards on the gel or byusing the Bradford protein assay23.
39| Combine all elution fractions containing annexin V solution and adjust the protein concentration to B1 mg ml�1 with PBSbuffer (REAGENT SETUP).’ PAUSE POINT Purified annexin V can be stored for several months at 4 1C, if desired, before FITC conjugation.
Day 5: FITC conjugation of annexin V � TIMING B3 d40| Using a 1-ml syringe, inject annexin V solution (B1 mg ml�1) into a 3.5-kDa molecular weight cutoff Slide-E-Lyzer dialysiscassette (or similar).
41| Dialyze the annexin V solution overnight at 4 1C with gentle agitation against 1 liter of 100 mM sodium carbonate (pH 9)to remove any residual imidazole and provide optimum buffer conditions for FITC conjugation.
42| Using a 1-ml syringe, carefully remove all of the annexin V solution from the dialysis cassette and place in a freshmicrocentrifuge tube.
43| Wrap the tube in aluminum foil (FITC is light-sensitive) and add 50 ml of FITC solution (1 mg ml�1) in 5 ml increments.Flick the tube gently between each 5 ml addition.m CRITICAL STEP FITC is light-sensitive; therefore, the tube must be wrapped in aluminum foil.
44| Incubate under constant rotation at 4 1C for 4 h.
45| Dialyze the annexin V–FITC solution using a 3.5-kDa molecular weight cutoff Slide-E-Lyzer dialysis cassette (or similar)against 1 liter of PBS (pH 7.2) overnight at 4 1C with gentle agitation (40 r.p.m.) to remove excess unconjugated FITC.
46| Run 0.5, 1 and 2 mg of the FITC–annexin V (assuming it is at a concentration of B1 mg ml�1) and 0.5, 1 and 2 mg of BSAon a 12% SDS-PAGE gel. Visualize the gel as described in Steps 34–37. Estimate the concentration of FITC–annexin V by directcomparison with the BSA standards on the gel (see Fig. 2).
47| If required, dilute the stock samples of annexin V in PBS buffer to a final concentration of 1 mg ml�1. Divide annexinV–FITC stock solution into 50 ml aliquots and store at 4 1C. It is convenient to store annexin V solution at 1 mg ml�1, which isB1,000� the final concentration required for staining of apoptotic cells (Fig. 3).m CRITICAL STEP FITC-labeled annexin V stock solution should not be stored frozen, as this can result in a loss of activity due todimerization24.’ PAUSE POINT FITC-conjugated annexin V solution is stable for several years when stored at 4 1C protected from light.
Day 6: titration of annexin V–FITC to obtain optimum concentration for flow cytometry assays � TIMING B4 h48| Apoptosis should be induced in the chosen cell type (density 1 � 106 ml�1) with an appropriate stimulus (e.g., UVirradiation, 5 mM Act D and 200 ng ml�1 anti-Fas IgM antibody)6. Untreated cells at the same density should be included as anegative control.
49| Remove 200 ml of the cell suspension or trypsinized adherent cells (B2 � 105 cells) per treatment (four treatments intotal) and pellet by centrifugation (for 5 min at 300g, room temperature).
50| Resuspend the cells in 300 ml of annexin V binding buffer containing 0.1, 0.5, 1 and 2 mg ml�1 annexin V–FITC solutionand incubate for 5 min at room temperature.
p
uor
G g
n ih si l
bu
P eru ta
N 900 2©
nat
ure
pro
toco
ls/
moc.er
ut an.
ww
w//:ptt
h
1390 | VOL.4 NO.9 | 2009 | NATURE PROTOCOLS
PROTOCOL
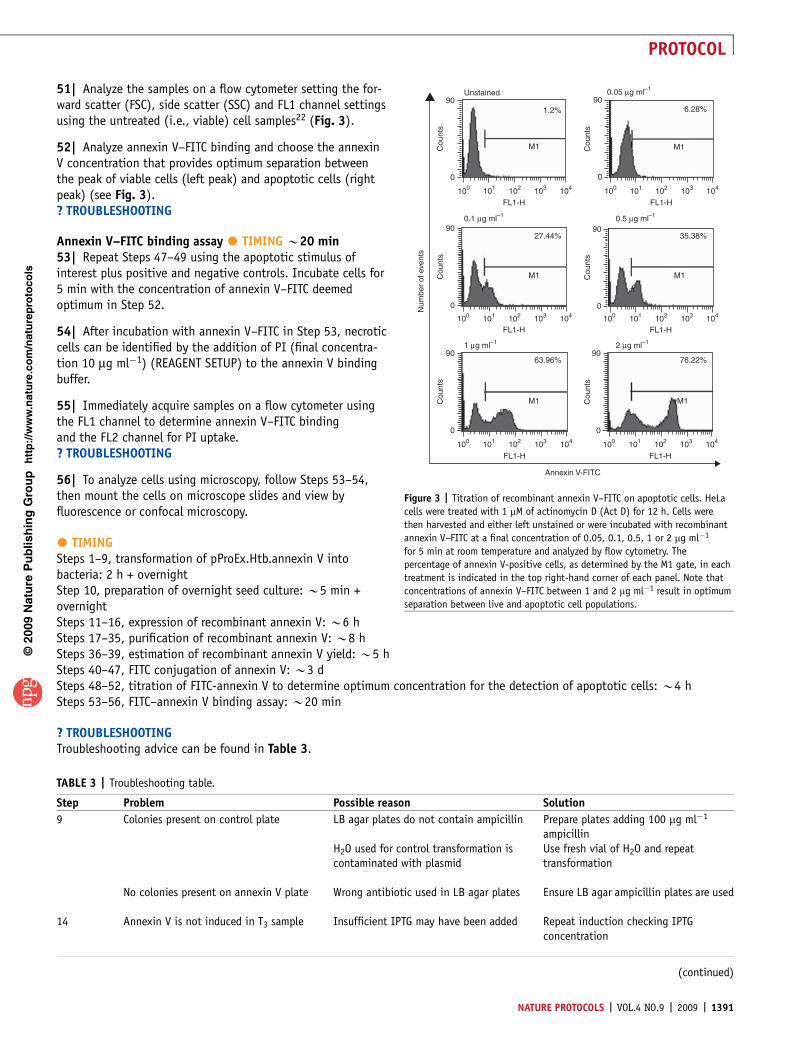
51| Analyze the samples on a flow cytometer setting the for-ward scatter (FSC), side scatter (SSC) and FL1 channel settingsusing the untreated (i.e., viable) cell samples22 (Fig. 3).
52| Analyze annexin V–FITC binding and choose the annexinV concentration that provides optimum separation betweenthe peak of viable cells (left peak) and apoptotic cells (rightpeak) (see Fig. 3).? TROUBLESHOOTING
Annexin V–FITC binding assay � TIMING B20 min53| Repeat Steps 47–49 using the apoptotic stimulus ofinterest plus positive and negative controls. Incubate cells for5 min with the concentration of annexin V–FITC deemedoptimum in Step 52.
54| After incubation with annexin V–FITC in Step 53, necroticcells can be identified by the addition of PI (final concentra-tion 10 mg ml�1) (REAGENT SETUP) to the annexin V bindingbuffer.
55| Immediately acquire samples on a flow cytometer usingthe FL1 channel to determine annexin V–FITC bindingand the FL2 channel for PI uptake.? TROUBLESHOOTING
56| To analyze cells using microscopy, follow Steps 53–54,then mount the cells on microscope slides and view byfluorescence or confocal microscopy.
� TIMINGSteps 1–9, transformation of pProEx.Htb.annexin V intobacteria: 2 h + overnightStep 10, preparation of overnight seed culture: B5 min +overnightSteps 11–16, expression of recombinant annexin V: B6 hSteps 17–35, purification of recombinant annexin V: B8 hSteps 36–39, estimation of recombinant annexin V yield: B5 hSteps 40–47, FITC conjugation of annexin V: B3 dSteps 48–52, titration of FITC-annexin V to determine optimum concentration for the detection of apoptotic cells: B4 hSteps 53–56, FITC–annexin V binding assay: B20 min
? TROUBLESHOOTINGTroubleshooting advice can be found in Table 3.
p
uor
G g
n ih si l
bu
P eru ta
N 900 2©
nat
ure
pro
toco
ls/
moc.er
ut an.
ww
w//:ptt
h
Unstained
1.2%
M1
90
0
100 101
FL1-H
0.1 μg ml–1
102 103 104
Cou
nts
27.44%
M1
90
0
100 101
FL1-H102 103 104
Cou
nts
63.96%
M1
90
0
100 101
FL1-H
Annexin V-FITC
Num
ber
of e
vent
s
102 103 104C
ount
s
76.22%
M1
90
0
100 101
FL1-H102 103 104
Cou
nts
35.38%
M1
90
0
100 101
FL1-H102 103 104
Cou
nts
6.28%
M1
90
0
100 101
FL1-H
0.5 μg ml–1
1 μg ml–1 2 μg ml–1
0.05 μg ml–1
102 103 104
Cou
nts
Figure 3 | Titration of recombinant annexin V–FITC on apoptotic cells. HeLa
cells were treated with 1 mM of actinomycin D (Act D) for 12 h. Cells were
then harvested and either left unstained or were incubated with recombinant
annexin V–FITC at a final concentration of 0.05, 0.1, 0.5, 1 or 2 mg ml�1
for 5 min at room temperature and analyzed by flow cytometry. The
percentage of annexin V-positive cells, as determined by the M1 gate, in each
treatment is indicated in the top right-hand corner of each panel. Note that
concentrations of annexin V–FITC between 1 and 2 mg ml�1 result in optimum
separation between live and apoptotic cell populations.
TABLE 3 | Troubleshooting table.
Step Problem Possible reason Solution
9 Colonies present on control plate LB agar plates do not contain ampicillin Prepare plates adding 100 mg ml�1
ampicillinH2O used for control transformation iscontaminated with plasmid
Use fresh vial of H2O and repeattransformation
No colonies present on annexin V plate Wrong antibiotic used in LB agar plates Ensure LB agar ampicillin plates are used
14 Annexin V is not induced in T3 sample Insufficient IPTG may have been added Repeat induction checking IPTGconcentration
(continued)
NATURE PROTOCOLS | VOL.4 NO.9 | 2009 | 1391
PROTOCOL

ANTICIPATED RESULTSHere, we have described methods for bacterial expression, purification and FITC conjugation of recombinant polyhistidine-tagged annexin V (Fig. 1). We have specified points at which samples should be taken to monitor the efficiency of annexin Vexpression and purification (see Table 2 and Fig. 2). This is important, as it permits monitoring of the expression andpurification process to identify points at which problems may have occurred. As shown in Figure 2, after induction ofrecombinant annexin V for 3 h at 37 1C, robust expression of this protein is observed (lane 2). After sonication of bacteria andsubsequent removal of insoluble material by centrifugation, annexin V is released into the soluble supernatant fraction (lane 4),although some protein is retained in the bacterial pellet (lane 5). Soluble annexin V is captured by Ni-NTA agarose (lane 6) andefficiently eluted from the agarose beads by addition of elution buffer containing 100 mM of imidazole (lanes 7–9). The analysisof Ni-NTA agarose beads post elution confirmed displacement of His-tagged annexin V by imidazole (lane 10). By comparisonwith known amounts of BSA that are run simultaneously on the gel (lanes 11–13), the concentration of annexin V can beestimated. We find that a 250-ml annexin V bacterial expression culture routinely yields milligram amounts of the protein,which is highly stable and retains its specificity for PS for several years upon storage at 4 1C. The protocol can be scaled up ordown as required.
p
uor
G g
n ih si l
bu
P eru ta
N 900 2©
nat
ure
pro
toco
ls/
moc.er
ut an.
ww
w//:ptt
h
TABLE 3 | Troubleshooting table (continued).
Step Problem Possible reason Solution
21 Annexin V is retained in the pelletfraction
Sample may have been insufficientlysonicated
Repeat procedure from the startensuring 5 � 30 s pulses of 5 W forsonication step
Excess annexin V is produced Induction time may be reduced. If suffi-cient annexin V is present in the super-natant, the presence of a portion ofannexin V in the pellet is not detrimentalto the procedure
28,30 Annexin V is not present in theelution fraction
Low imidazole concentration If beads are still available, repeat elutionstep ensuring imidazole concentration tobe 100 mM in the elution buffer
Annexin V is degraded Protease degradation Ensure protease inhibitors whereindicated are added to buffers justprior to use
Ensure all steps where indicated arecarried out on ice
Contaminating bacterial protein bandsare present
Insufficient washes with imidazole washbuffer
Increase number of washes at Step 25 ofprotocol
31 Annexin V remains bound topost-elution Ni-NTA beads
Insufficient elution Increase the number of elutions orincrease the concentration of imidazoleused to displace all annexin V from thebeads
52, 55 No annexin V–FITC binding Cells are not apoptotic; therefore PS isnot externalized
Verify apoptotic morphology visually bymicroscopy
pH of annexin V binding buffer is too low Check pH of the binding buffer,ensuring it is above pH 5 but preferablypH 7.2
Nonspecific annexin V binding Calcium levels in annexin V bindingbuffer are too high giving rise tononspecific binding
Ensure calcium levels in annexin V bind-ing buffer are between 1 and 3 mM,preferentially 1.8 mM
1392 | VOL.4 NO.9 | 2009 | NATURE PROTOCOLS
PROTOCOL

We have also described a method for annexin V conjugationto FITC; however, other fluorochromes may be used for theconjugation step (such TRITC or phycoerythrin) offering morepossibilities for flow cytometry if FITC is not suitable for theparticular application.
It is important to titrate each batch of annexin V–FITC todetermine the optimum concentration for use in flow cytome-try, as too little annexin V–FITC may not give the desiredseparation between viable and apoptotic cells. As shown inFigure 3, 0.05, 0.1 and 0.5 mg ml�1 of annexin V–FITC fail toadequately distinguish between the viable (peak on the left)and apoptotic cells (peak on the right) in the population.Analysis with 1 mg ml�1 of annexin V–FITC provided the bestseparation between viable and apoptotic cells. Normally, wefind a final concentration of B1 mg ml�1 provides optimumresults.
The annexin V-binding assay can be used to detect apopto-tic cells irrespective of the stimulus used. As illustrated inFigure 4, induction of apoptosis with a range of stimuli wasfound to induce apoptosis leading to annexin V–FITC bindingin all cases, as shown by a shift of the cell population fromthe left (annexin V–FITC-negative) to the right (annexinV–FITC-positive) (Fig. 4). Annexin V binding can also bedetected early in apoptosis (Fig. 5). As early as 6 h after treat-ment with Act D, a peak of apoptotic annexin V-positive cells is evident in Figure 5 and as time progresses more cells shift fromthe viable to apoptotic population.
When carrying out annexin V binding assays, we routinely include a vital dye, such as PI, to distinguish between apoptoticand secondary necrotic cells (Fig. 6). As shown in the dot plots presented in Figure 6, in the untreated sample 94.4% of cellsare located in the lower left quadrant. Cells that are both annexin V- and PI-negative represent the viable cells in the popula-tion. In the lower panels (TNF- and Act D-treated), some cells are in the lower right quadrant. These cells are positive forannexin V and negative for PI staining, and are cells in the early stages of apoptosis that have externalized PS but have not yetbegun to take up vital dyes. Cells located in the upper-right quandrant of the same panel are positive both for annexin V and forPI, and are cells in the late stages of apoptosis that have lost plasma membrane integrity (secondary necrosis). Double stainingof cells with annexin V and PI providesinformation concerning the stage ofapoptosis and therefore is more informa-tive than staining with annexin V alone.This is illustrated by comparison of thedot plots with the histograms of annexinV–FITC staining shown on the right ofFigure 6. On the basis of these histo-grams, we can see in the case of Act Dtreatment that 55% of cells are annexinV–FITC-positive. However, analysiswith both annexin V and PI showedthat of the 55% annexin V-positivecells, 20% are in the early stages
p
uor
G g
n ih si l
bu
P eru ta
N 900 2©
nat
ure
pro
toco
ls/
moc.er
ut an.
ww
w//:ptt
h
90
0
100 101 102
FL1-H
M1
0.68%
Untreated
103 104
Cou
nts
90
0
100 101 102
FL1-H
M1
46.94%
TNF
103 104
Cou
nts
90
0
100 101 102
FL1-H
M1
33.54%
Cisplatin
103 104
Cou
nts
90
0
100 101 102
FL1-H
M1
26.36%
DCI
103 104
Cou
nts
90
0
100 101 102
FL1-H
M1
32.3%
CHX
103 104
Cou
nts
Cou
nts
Num
ber
of e
vent
s
90
0100 101 102
FL1-H
M1
70.46%
Act D
103 104
Cou
nts
90
0
100 101 102
FL1-H
M1
40%
MG 132
103 104
Annexin V-FITC
90
0
100 101 102
FL1-H
M1
18.62%
Etoposide
103 104
Cou
nts
Figure 4 | Quantification of apoptosis induced by various cytotoxic agents
using recombinant annexin V–FITC. HeLa cells were treated for 12 h with
20 ng ml�1 of TNF in combination with 1 mM of cycloheximide (TNF), 75 mM
of cisplatin, 75 mM of 3,4-dichloroisocoumarin (DCI), 200 mM of
cycloheximide (CHX), 1 mM actinomycin D (Act D), 75 mM of MG132, 100 mM
of etoposide, or left untreated. Cells were then harvested and incubated with
recombinant annexin V–FITC at a final concentration of 1 mg ml�1 for 5 min at
room temperature and analyzed by flow cytometry. The percentage of annexin
V-positive cells in each treatment is indicated in the top right-hand corner of
each panel.
0 h90
0
100
Cou
nts
Num
ber
of e
vent
s
101 102
M1
0.86%
FL1-H
Annexin V-FITC
103 104
6 h90
0
100
Cou
nts
101 102
M1
24.26%
FL1-H
103 104
12 h90
0
100
Cou
nts
101 102
M1
71.04%
FL1-H
103 104
Figure 5 | Time course of actinomycin D-induced apoptosis. HeLa cells were treated with 1 mM of
actinomycin D (Act D) and samples were taken for the assessment of annexin V–FITC binding at 0, 6 and
12 h. The percentage of annexin V-positive cells in each treatment is indicated in the top right-hand
corner of each panel.
NATURE PROTOCOLS | VOL.4 NO.9 | 2009 | 1393
PROTOCOL

(only annexin V positive), whereas 32% are in the late stagesof apoptosis moving toward secondary necrosis. Cells thatenter necrosis directly become double positive for annexin Vand PI simultaneously6.
Analysis of annexin V binding can also be assessed byimmunofluorescence or confocal microscopy. In Figure 7, cellsin the early stages of apoptosis, that are only annexin V–FITC-positive, display green fluorescence. Cells in the late stage ofapoptosis also stain positive for PI as well as for annexinV–FITC (red and green cells). We can also see morphologicalfeatures indicative of apoptosis, such as membrane blebbing.
ACKNOWLEDGMENTS We thank Science Foundation Ireland for support of work inour laboratory. The work in the Martin laboratory is supported by grants from theEuropean Union Marie Curie Research Training Network (Apoptrain), ScienceFoundation Ireland (SRCG20336 and 08/IN.1/B2031) and The Wellcome Trust(082749).
AUTHOR CONTRIBUTIONS M.E. provided Figures 3–7. S.E.L. provided Figures 1and 2. S.E.L. and S.J.M. wrote the manuscript. S.J.M. conceived andsupervised the study.
Published online at http://www.natureprotocols.com.Reprints and permissions information is available online at http://npg.nature.com/reprintsandpermissions.
1. Taylor, R.C., Cullen, S.P. & Martin, S.J. Apoptosis: controlled demolition at thecellular level. Nat. Rev. Mol. Cell Biol. 9, 231–241 (2008).
2. Kerr, J.F., Wyllie, A.H. & Currie, A.R. Apoptosis: a basic biological phenomenonwith wide-ranging implications in tissue kinetics. Br. J. Cancer 26, 239–257(1972).
3. Luthi, A.U. & Martin, S.J. The CASBAH: a searchable database of caspasesubstrates. Cell Death Differ. 4, 641–650 (2007).
4. Fadok, V.A. et al. Different populations of macrophages use either the vitronectinreceptor or the phosphatidylserine receptor to recognize and remove apoptoticcells. J. Immunol. 148, 2207–2216 (1992).
5. Koopman, G. et al. Annexin V for flow cytometric detection of phosphatidylserineexpression on B cells undergoing apoptosis. Blood 84, 1415–1420 (1994).
6. Martin, S.J. et al. Early redistribution of plasma membrane phosphatidylserineis a general feature of apoptosis regardless of the initiating stimulus:
inhibition by overexpression of Bcl-2 and Abl. J. Exp. Med. 182, 1545–1556(1995).
7. Fadok, V.A., Bratton, D.L., Frasch, S.C., Warner, M.L. & Henson, P.M. The role ofphosphatidylserine in recognition of apoptotic cells by phagocytes. Cell DeathDiffer. 5, 551–562 (1998).
8. Hamon, Y. et al. ABC1 promotes engulfment of apoptotic cells and transbilayerredistribution of phosphatidylserine. Nat. Cell Biol. 2, 399–406 (2000).
9. Zullig, S. et al. Aminophospholipid translocase TAT-1 promotes phosphatidylserineexposure during C. elegans apoptosis. Curr. Biol. 17, 994–999 (2007).
10. Darland-Ransom, M. et al. Role of C. elegans TAT-1 protein in maintaining plasmamembrane phosphatidylserine asymmetry. Science 320, 528–531 (2008).
11. Gerke, V. Annexins and membrane organisation in the endocytic pathway. Cell Mol.Biol. Lett. 6, 204 (2001).
12. Gerke, V. & Moss, S.E. Annexins: from structure to function. Physiol. Rev. 82,331–371 (2002).
13. Martin, S.J., Finucane, D.M., Amarante-Mendes, G.P., O’Brien, G.A. & Green, D.R.Phosphatidylserine externalization during CD95-induced apoptosis of cells andcytoplasts requires ICE/CED-3 protease activity. J. Biol. Chem. 271, 28753–28756(1996).
14. Krysko, D.V., Vanden Berghe, T., D’Herde, K. & Vandenabeele, P. Apoptosis andnecrosis: detection, discrimination and phagocytosis. Methods 44, 205–221 (2008).
15. Blankenberg, F.G. et al. In vivo detection and imaging of phosphatidylserineexpression during programmed cell death. Proc. Natl. Acad. Sci. USA 95,6349–6354 (1998).
16. Brumatti, G., Sheridan, C. & Martin, S.J. Expression and purification ofrecombinant annexin V for the detection of membrane alterations on apoptoticcells. Methods 44, 235–240 (2008).
p
uor
G g
n ih si l
bu
P eru ta
N 900 2©
nat
ure
pro
toco
ls/
moc.er
ut an.
ww
w//:ptt
h
Untreated104
104
103
103
0.2% 1.2%
4.2%94.4%102
102
FL2
-H
Cou
nts
FL1-H
101
101100
100104103102
FL1-H101100
104
104
103
103
1.2% 30.6%
17.5%50.7%102
102
FL2
-H
Pro
pidu
m io
dide
FL1-H
101
101100
100
104
104
103
103
1.1% 32.7%
Act D
TNF
70 6.6%
M1
0
Cou
nts
104103102
FL1-H101100
70 50.22%
M1
0
Cou
nts
104103102
FL1-H101100
70 55.52%
M1
0
20.4%45.8%102
102
FL2
-H
FL1-H
Annexin V-FITC Annexin V-FITC
101
101
100
100
Figure 6 | Annexin V/propidium iodide (PI) double staining assay. HeLa cells
were treated for 12 h with 20 ng ml�1 of TNF in combination with 1 mM of
cycloheximide (TNF), 1 mM of actinomycin D (Act D) or left untreated. Cells
were then harvested and incubated with recombinant annexin V–FITC at
a final concentration of 1 mg ml�1 for 5 min at room temperature. Just
before analysis by flow cytometry, PI was added to all samples to a final
concentration of 10 mg ml�1. In the left-hand panels, cells have been
analyzed for annexin V binding as well as for PI uptake. In the right-hand
panels, only annexin V binding data for the same samples is shown. The
percentage of cells annexin V positive, PI positive or double positive for both
annexin V and PI is indicated.
Bright phasea
b AnnexinV AnnexinV/PI Bright phase
AnnexinV-FITC
Figure 7 | Annexin V/PI staining of apoptotic cells. HeLa cells were treated
for 12 h with 20 ng ml�1 of TNF in combination with cycloheximide (1 mM).
Cells were stained with recombinant annexin V–FITC at final concentration of
1 mg ml�1 for 15 min at 37 1C (a), or in combination with PI at final
concentration of 10 mg ml�1 (b). Annexin V–FITC-positive cells are stained
green and PI-positive cells are stained red.
1394 | VOL.4 NO.9 | 2009 | NATURE PROTOCOLS
PROTOCOL

17. Belhocine, T. et al. Increased uptake of the apoptosis-imaging agent (99m)Tcrecombinant human Annexin V in human tumors after one course ofchemotherapy as a predictor of tumor response and patient prognosis. Clin. CancerRes. 8, 2766–2774 (2002).
18. Haas, R.L. et al. In vivo imaging of radiation-induced apoptosis in follicularlymphoma patients. Int. J. Radiat. Oncol. Biol. Phys. 59, 782–787 (2004).
19. Kartachova, M. et al. In vivo imaging of apoptosis by 99mTc-Annexin Vscintigraphy: visual analysis in relation to treatment response. Radiother. Oncol.72, 333–339 (2004).
20. de Freitas Balanco, J.M. et al. Apoptotic mimicry by an obligate intracellularparasite downregulates macrophage microbicidal activity. Curr. Biol. 11,1870–1873 (2001).
21. Fadeel, B. et al. Phosphatidylserine exposure during apoptosis is a cell-type-specific event and does not correlate with plasma membrane phospholipidscramblase expression. Biochem. Biophys. Res. Commun. 226, 504–511 (1999).
22. Maecker, H.T. & Trotter, J. Flow cytometry controls, instrument setup, and thedetermination of positivity. Cytometry A 69, 1037–1042 (2006).
23. Bradford, M.M. A rapid and sensitive for the quantitation of microgram quantititesof protein utilizing the principle of protein-dye binding. Anal. Biochem. 72,248–254 (1976).
24. van Genderen, H. et al. In vitro measurement of cell death with the annexin A5affinity assay. Nat. Protoc. 1, 363–367 (2006).
25. Hatse, S., Schols, D., De Clercq, E. & Balzarini, J. 9-(2-Phosphonylmethoxyethyl)adenine induces tumor cell differentiation or cell death by blocking cell cycleprogression through the S phase. Cell Growth Differ. 10, 435–446 (1999).
26. Vanags, D.M., Porn-Ares, M.I., Coppola, S., Burgess, D.H. & Orrenius, S. Proteaseinvolvement in fodrin cleavage and phosphatidylserine exposure in apoptosis. J.Biol. Chem. 271, 31075–31085 (1996).
27. Casciola-Rosen, L., Rosen, A., Petri, M. & Schlissel, M. Surface blebs on apoptoticcells are sites of enhanced procoagulant activity: implications for coagulationevents and antigenic spread in systemic lupus erythematosus. Proc. Natl. Acad.Sci. USA 93, 1624–1629 (1996).
28. Concin, N. et al. Role of p53 in G2/M cell cycle arrest and apoptosis in response togamma-irradiation in ovarian carcinoma cell lines. Int. J. Oncol. 22, 51–57 (2003).
29. Brassard, D.L. et al. Integrin alpha(v)beta(3)-mediated activation of apoptosis.Exp. Cell Res. 251, 33–45 (1999).
30. Karlseder, J., Broccoli, D., Dai, Y., Hardy, S. & de Lange, T. p53- and ATM-dependent apoptosis induced by telomeres lacking TRF2. Science 283, 1321–1325 (1999).
31. Albanese, C. et al. Activation of the cyclin D1 gene by the E1A-associated proteinp300 through AP-1 inhibits cellular apoptosis. J. Biol. Chem. 274, 34186–34195(1999).
32. van Engeland, M., Ramaekers, F.C., Schutte, B. & Reutelingsperger, C.P. A novelassay to measure loss of plasma membrane asymmetry during apoptosis ofadherent cells in culture. Cytometry 24, 131–139 (1996).
33. Stockwin, L.H. et al. Proteomic analysis of plasma membrane from hypoxia-adapted malignant melanoma. J. Proteome Res. 5, 2996–3007 (2003).
34. Repp, A.C., Mayhew, E.S., Howard, K., Alizadeh, H. & Niederkorn, J.Y. Role of fasligand in uveal melanoma-induced liver damage. Graefes Arch. Clin. Exp.Ophthalmol. 239, 752–758 (2001).
35. Guicciardi, M.E., Miyoshi, H., Bronk, S.F. & Gores, G.J. Cathepsin B knockoutmice are resistant to tumor necrosis factor-alpha-mediated hepatocyte apoptosisand liver injury: implications for therapeutic applications. Am. J. Pathol. 159,2045–2054 (2001).
36. Zhou, A. et al. Interferon action and apoptosis are defective in micedevoid of 2¢,5¢-oligoadenylate-dependent RNase L. EMBO J. 16, 6355–6363(1997).
37. Gatti, R. et al. Comparison of annexin V and calcein-AM as early vital markers ofapoptosis in adherent cells by confocal laser microscopy. J. Histochem. Cytochem.46, 895–900 (1998).
38. Hiddinga, H.J. & Eberhardt, N.L. Intracellular amyloidogenesis by human isletamyloid polypeptide induces apoptosis in COS-1 cells. Am. J. Pathol. 154, 1077–1088 (1999).
39. Boersma, A.W., Nooter, K., Oostrum, R.G. & Stoter, G. Quantification of apoptoticcells with fluorescein isothiocyanate-labeled annexin V in Chinese hamster ovarycell cultures treated with cisplatin. Cytometry 24, 123–130 (1996).
40. Sato, T. et al. Apoptosis of cultured rat glomerular mesangial cells induced byIgG2a monoclonal anti-Thy-1 antibodies. Kidney Int. 49, 403–412 (1996).
p
uor
G g
n ih si l
bu
P eru ta
N 900 2©
nat
ure
pro
toco
ls/
moc.er
ut an.
ww
w//:ptt
h
NATURE PROTOCOLS | VOL.4 NO.9 | 2009 | 1395
PROTOCOL
Copyright © 2022 FDOKUMEN