
Spanish melons (Cucumis melo L.) of the Madrid provenance: a unique germplasm reservoir
Upload
independentCategory
view
0download
0
Expression Profiling of Cucumis sativus in Response toInfection by Pseudoperonospora cubensisBishwo N. Adhikari1", Elizabeth A. Savory2", Brieanne Vaillancourt1, Kevin L. Childs1, John P. Hamilton1,
Brad Day2, C. Robin Buell1*
1 Department of Plant Biology, Michigan State University, East Lansing, Michigan, United States of America, 2 Department of Plant Pathology, Michigan State University,
East Lansing, Michigan, United States of America
Abstract
The oomycete pathogen, Pseudoperonospora cubensis, is the causal agent of downy mildew on cucurbits, and at present, noeffective resistance to this pathogen is available in cultivated cucumber (Cucumis sativus). To better understand the hostresponse to a virulent pathogen, we performed expression profiling throughout a time course of a compatible interactionusing whole transcriptome sequencing. As described herein, we were able to detect the expression of 15,286 cucumbergenes, of which 14,476 were expressed throughout the infection process from 1 day post-inoculation (dpi) to 8 dpi. A largenumber of genes, 1,612 to 3,286, were differentially expressed in pair-wise comparisons between time points. We observedthe rapid induction of key defense related genes, including catalases, chitinases, lipoxygenases, peroxidases, and proteaseinhibitors within 1 dpi, suggesting detection of the pathogen by the host. Co-expression network analyses revealedtranscriptional networks with distinct patterns of expression including down-regulation at 2 dpi of known defense responsegenes suggesting coordinated suppression of host responses by the pathogen. Comparative analyses of cucumber geneexpression patterns with that of orthologous Arabidopsis thaliana genes following challenge with Hyaloperonosporaarabidopsidis revealed correlated expression patterns of single copy orthologs suggesting that these two dicot hosts havesimilar transcriptional responses to related pathogens. In total, the work described herein presents an in-depth analysis ofthe interplay between host susceptibility and pathogen virulence in an agriculturally important pathosystem.
Citation: Adhikari BN, Savory EA, Vaillancourt B, Childs KL, Hamilton JP, et al. (2012) Expression Profiling of Cucumis sativus in Response to Infection byPseudoperonospora cubensis. PLoS ONE 7(4): e34954. doi:10.1371/journal.pone.0034954
Editor: Mikael Rørdam Andersen, Technical University of Denmark, Denmark
Received December 15, 2011; Accepted March 8, 2012; Published April 24, 2012
Copyright: � 2012 Adhikari et al. This is an open-access article distributed under the terms of the Creative Commons Attribution License, which permitsunrestricted use, distribution, and reproduction in any medium, provided the original author and source are credited.
Funding: Phytopathogen work in the laboratory of CRB was supported by a grant from the United States Department of Agriculture National Institute for Foodand Agriculture (2009-65109-05719). Work in the laboratory of BD was supported by a grant from the United States Department of Agriculture National Institutefor Food and Agriculture (2011-67011-30758) and in part by a National Science Foundation Faculty Early Career Development Award (IOS-0641319). No additionalexternal funding received for this study. The funders had no role in study design, data collection and analysis, decision to publish, or preparation of themanuscript.
Competing Interests: The authors have declared that no competing interests exist.
* E-mail: [email protected]
" These authors contributed equally to this work.
Introduction
Cucumber (Cucumis sativus L.) is an economically important
vegetable crop cultivated in over 80 countries, with more than
66 million tons produced annually for both fresh use and
processing (http://faostats.fao.org). Cucumber has been utilized
extensively as a model system to study sex determination [1],
vascular biology [2], and induced defense responses [3,4]. Despite
its extensive use as a model system in research, as well as its
obvious economic importance, genetic and genomic resources
remain limited. In recent years, the publication of both a genetic
map [5] and genome sequences [6,7] of cucumber, as well as
generation of large-scale expression data sets [8,9], have provided
the first comprehensive resources for genetic and genomic based
inquiries into cucumber biology. Cucumber has limited genetic
diversity, few wild relatives, and only 7 pairs of chromosomes
(2n = 14), whereas other Cucumis spp., such as melon (Cucumis melo),
have 12 chromosomes, making interspecific breeding difficult, if
not impossible. As such, advances in breeding for important
agronomic traits such as increased yield, fruit quality, and disease
resistance are slow.
Cucumber production is hindered by diseases caused by
bacterial (e.g., Pseudomonas syringae pv. lachrymans), viral (e.g.,
Cucumber mosaic virus), fungal (e.g., Sphaerotheca fulginea and Erysiphe
cichoracearum), and oomycete (e.g., Phytophthora capsici and Pseudoper-
onospora cubensis) pathogens [10,11]. Of these, the most destructive
is Ps. cubensis, the causal agent of cucurbit downy mildew, which
threatens cucumber production in nearly 80 countries and causes
severe economic losses [11,12,13]. Ps. cubensis is an obligate,
biotrophic oomycete pathogen with a host range limited to the
Cucurbitaceae [11]. In recent years, a foundation has been
established to support advances in this area, including studies on
epidemiology [14], host specificity [15,16,17,18], pathogenic
variation [19,20,21], and more recently, generation of a draft
genome sequence of Ps. cubensis [22,23].
The molecular and biochemical mechanisms associated with
host resistance have been investigated to a limited extent in
cucumber and other cucurbits. In large part, signaling of resistance
is primarily associated with systemic acquired resistance (SAR)
[24], for which cucumber has historically been a model system
[25,26]. In addition to SAR, structural modifications (e.g., callose
deposition), as well as the induction of defense-related genes (e.g.,
PLoS ONE | www.plosone.org 1 April 2012 | Volume 7 | Issue 4 | e34954

peroxidases, chitinases, and glucanases) are often associated with
the onset of resistance signaling following pathogen infection.
Moreover, like other well-characterized plant-pathogen systems,
the presence of nucleotide-binding site (NBS) containing genes
encoding protein products that recognize cognate pathogen
effector proteins or their perturbations [27] have been postulated
to play a role in disease resistance in cucumber. To this end,
analysis of the cucumber genome sequence has identified 61 NBS
resistance genes, considerably less than have been identified in
other plant genomes, such as Arabidopsis (200) or rice (600) [6].
However, of the 15 genes known to control disease resistance in
cucumber, none have been cloned, nor have they been associated
through linkage maps with the 61 predicted NBS resistance genes
[28]. It is hypothesized that cucumber has an expanded
lipoxygenase pathway which may provide an additional mecha-
nism(s) to facilitate responses to biotic stress [6].
While genetically conferred host resistance is the ideal means of
disease control in crop species, it has become ineffective in
controlling cucurbit downy mildew, particularly in the U.S., where
introduction of a new, more virulent pathotype of Ps. cubensis is
responsible for economic losses in recent years [12,29]. To this
end, control methods for cucurbit downy mildew in both Europe
and the U.S. require the use of fungicides, coupled with a single
host resistance locus, the recessive dm1 gene, which has been
incorporated into most commercial cucumber germplasm [11].
However, the identification of the dm1 locus, as well as its
functional role in resistance signaling remains undefined. In
addition to widespread incorporation of dm1, breeding of Ps.
cubensis resistance has focused mainly on genes from melon [30], as
limited diversity for resistance is available in cucumber or its wild
relative, Cucumis hardwickii. Large-scale screening trials to identify
tolerant germplasm are in progress, but have yet to identify a
source of complete resistance to Ps. cubensis [16,31]. As such, new
resources must be explored to support development of improved
cultivars and identify new sources of resistance for breeding
programs.
Next generation sequencing of the transcriptome (mRNA-Seq)
permits deep, robust assessments of transcript abundances and
transcript structure [32]. When gene expression profiling is applied
to host-pathogen interactions of economically important crops,
insights into the mechanisms these pathogens use to suppress and
subvert the host defense response can be made [33,34,35]. In the
current study, we performed expression profiling, using the
susceptible cucumber cultivar ‘Vlaspik’, over a time course of
infection with the downy mildew pathogen Ps. cubensis to identify
genes, pathways, and systems that are altered during a compatible
interaction. Using this technology, deep profiling of both the host
and pathogen transcriptome (see accompanying manuscript [36])
was achieved, providing the first in-depth analysis of this
important plant-pathogen interaction. In this study, we cataloged
the expression of 14,476 genes from cucumber through an 8-day
time course of infection with a virulent Ps. cubensis isolate. In total,
this work identified major changes in gene expression in cucumber
at 1 day post-inoculation (dpi) continuing through 8 dpi, with up
to 3,286 genes differentially expressed between time points.
Comparative analyses revealed correlated gene expression patterns
in cucumber and Arabidopsis thaliana leaves infected with downy
mildew, suggesting orthologous host responses in these two
dicotyledonous hosts. Through co-expression network analyses,
modules of temporal-specific transcriptional networks were
constructed that provide a framework to connect transcription
factors with defense response genes.
Results and Discussion
Response of C. sativus leaves to pathogen infectionTo correlate gene expression and host responses with observable
disease symptoms and pathogen invasion, the progression of
infection in susceptible C. sativus cv. ‘Vlaspik’ was monitored at 1,
2, 3, 4, 6, and 8 dpi. As shown in Figure 1, the first visible
symptoms of Ps. cubensis infection were apparent at 1 dpi, in the
form of water soaking on the abaxial leaf surface at the inoculation
site (Figure 1A). These symptoms correspond to zoospore
encystment and initial penetration through the stomata into the
host [36]. In similar pathosystems, systems such as Hyaloperonospora
arabidopsidis, the causal agent of downy mildew on A. thaliana,
analogous processes occur in the early stages of infection. One
exception is that H. arabidopsidis penetrates between anticlinal walls
of epidermal cells rather than utilizing natural openings like
stomata [37]. While no symptoms are visible on the upper leaf
surface in cucumber, water soaking on the lower leaf surface can
be seen as early as 1 dpi, and remains present through 4 dpi,
during which time hyphal growth through the mesophyll of the
host tissue occurs and haustoria formation begins [36]. Yellow
angular lesions bound by leaf veins characteristic of cucurbit
downy mildew were first visible on the upper leaf surface at 4 dpi
(Figure 1D), and became more chlorotic and slightly necrotic at
the centers by 8 dpi. These symptoms are associated with
extensive growth of hyphae through the plant mesophyll [36].
Figure 1. Symptoms of Pseudoperonospora cubensis infection onsusceptible Cucumis sativus cv. ‘Vlaspik’. Images were collected ofthe adaxial (left column) and abaxial (right column) leaf surfaces at 1, 2,3, 4, 6, and 8 days post-inoculation (dpi). A., 1 dpi, B., 2 dpi, C., 3 dpi,D., 4 dpi, E., 6 dpi, F., 8 dpi.doi:10.1371/journal.pone.0034954.g001
Expression Profiling in Cucumber
PLoS ONE | www.plosone.org 2 April 2012 | Volume 7 | Issue 4 | e34954

Gene expression profiling in C. sativusWe performed mRNA-Seq profiling of C. sativus leaves following
infection with Ps. cubensis over an 8-day period. Leaf disc samples
were collected using a cork borer to maximize the amount of
infected tissue in each sample (Figure 2, black circles), pooled
within a given time point, and RNA was isolated. Two biological
replicates of each time point were sequenced, yielding 55 to
59 million reads from both replicates at each time point.
Additionally, a mock-inoculated C. sativus sample was collected
and sequenced, yielding 5.8 million reads. The number of reads
that mapped to the C. sativus genome ranged from 48 to 53 million
(Figure 3A, 84–93% of the total reads) per time point while the
number of genes expressed at different time points ranged from
12,257 to 13,048 (Figure 3A).
The libraries were constructed from inoculated leaves and
therefore, the reads represent transcripts from the host (C. sativus)
and the pathogen (Ps. cubensis). At the early time points, nearly all
of the reads obtained were of host origin, which is consistent with
our microscopy analysis revealing limited pathogen biomass.
However, as we are surveying a susceptible interaction, pathogen
biomass increases throughout the time course and consequentially,
pathogen transcripts increase in the total read pool in the later
time points [36]. However, even with the increased percentage of
pathogen reads in the later time points, we have saturated
sampling of the C. sativus transcriptome with our deep read
coverage of the libraries. Randomly selected subsets of reads, 5 to
30 million, from the total read pool were used to evaluate the
effect of sampling depth on gene expression detection. The
simulation demonstrates a positive relationship between sampling
depth and numbers of expressed genes at lower sequencing depths
(5 to 20 million reads) (Figure 3B). The number of expressed
genes, however, begins to plateau at approximately 20 million
Figure 2. Experimental design and sample collection. Cucumber cv. ‘Vlaspik’ leaves were inoculated on the abaxial leaf surface with 10–3010 ml droplets of a 16105 sporangia/ml solution. Samples were collected at 1, 2, 3, 4, 6, and 8 days post-inoculation (dpi) using a #3 cork borer toisolate tissue immediately around the infection point (black circles). Samples from cucumber leaves mock-inoculated with 10 ml droplets of dH2Owere collected in the same manner at 1 dpi. Leaf disks from each time point were pooled for RNA extraction. mRNA-Seq libraries were made for eachtime point from two separate biological replicates. Within a biological replicate, libraries were barcoded and sequenced in multiple lanes with theexception of the mock-inoculated library, which was not barcoded.doi:10.1371/journal.pone.0034954.g002
Expression Profiling in Cucumber
PLoS ONE | www.plosone.org 3 April 2012 | Volume 7 | Issue 4 | e34954
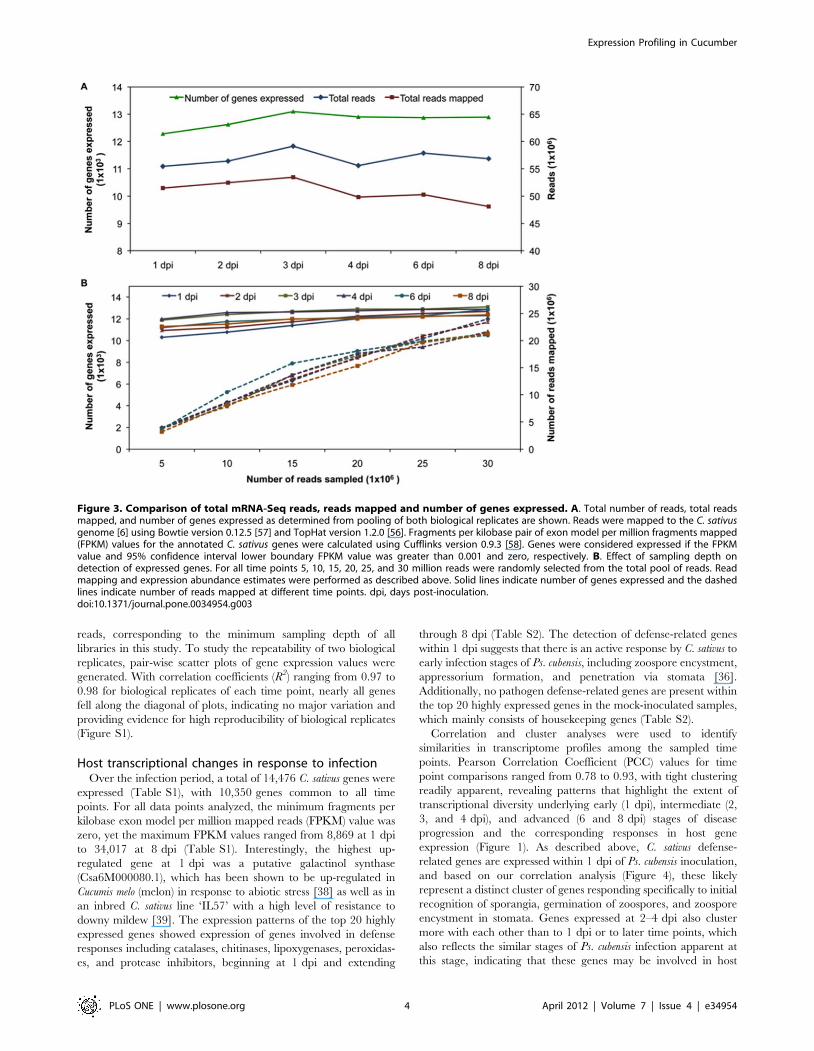
reads, corresponding to the minimum sampling depth of all
libraries in this study. To study the repeatability of two biological
replicates, pair-wise scatter plots of gene expression values were
generated. With correlation coefficients (R2) ranging from 0.97 to
0.98 for biological replicates of each time point, nearly all genes
fell along the diagonal of plots, indicating no major variation and
providing evidence for high reproducibility of biological replicates
(Figure S1).
Host transcriptional changes in response to infectionOver the infection period, a total of 14,476 C. sativus genes were
expressed (Table S1), with 10,350 genes common to all time
points. For all data points analyzed, the minimum fragments per
kilobase exon model per million mapped reads (FPKM) value was
zero, yet the maximum FPKM values ranged from 8,869 at 1 dpi
to 34,017 at 8 dpi (Table S1). Interestingly, the highest up-
regulated gene at 1 dpi was a putative galactinol synthase
(Csa6M000080.1), which has been shown to be up-regulated in
Cucumis melo (melon) in response to abiotic stress [38] as well as in
an inbred C. sativus line ‘IL57’ with a high level of resistance to
downy mildew [39]. The expression patterns of the top 20 highly
expressed genes showed expression of genes involved in defense
responses including catalases, chitinases, lipoxygenases, peroxidas-
es, and protease inhibitors, beginning at 1 dpi and extending
through 8 dpi (Table S2). The detection of defense-related genes
within 1 dpi suggests that there is an active response by C. sativus to
early infection stages of Ps. cubensis, including zoospore encystment,
appressorium formation, and penetration via stomata [36].
Additionally, no pathogen defense-related genes are present within
the top 20 highly expressed genes in the mock-inoculated samples,
which mainly consists of housekeeping genes (Table S2).
Correlation and cluster analyses were used to identify
similarities in transcriptome profiles among the sampled time
points. Pearson Correlation Coefficient (PCC) values for time
point comparisons ranged from 0.78 to 0.93, with tight clustering
readily apparent, revealing patterns that highlight the extent of
transcriptional diversity underlying early (1 dpi), intermediate (2,
3, and 4 dpi), and advanced (6 and 8 dpi) stages of disease
progression and the corresponding responses in host gene
expression (Figure 1). As described above, C. sativus defense-
related genes are expressed within 1 dpi of Ps. cubensis inoculation,
and based on our correlation analysis (Figure 4), these likely
represent a distinct cluster of genes responding specifically to initial
recognition of sporangia, germination of zoospores, and zoospore
encystment in stomata. Genes expressed at 2–4 dpi also cluster
more with each other than to 1 dpi or to later time points, which
also reflects the similar stages of Ps. cubensis infection apparent at
this stage, indicating that these genes may be involved in host
Figure 3. Comparison of total mRNA-Seq reads, reads mapped and number of genes expressed. A. Total number of reads, total readsmapped, and number of genes expressed as determined from pooling of both biological replicates are shown. Reads were mapped to the C. sativusgenome [6] using Bowtie version 0.12.5 [57] and TopHat version 1.2.0 [56]. Fragments per kilobase pair of exon model per million fragments mapped(FPKM) values for the annotated C. sativus genes were calculated using Cufflinks version 0.9.3 [58]. Genes were considered expressed if the FPKMvalue and 95% confidence interval lower boundary FPKM value was greater than 0.001 and zero, respectively. B. Effect of sampling depth ondetection of expressed genes. For all time points 5, 10, 15, 20, 25, and 30 million reads were randomly selected from the total pool of reads. Readmapping and expression abundance estimates were performed as described above. Solid lines indicate number of genes expressed and the dashedlines indicate number of reads mapped at different time points. dpi, days post-inoculation.doi:10.1371/journal.pone.0034954.g003
Expression Profiling in Cucumber
PLoS ONE | www.plosone.org 4 April 2012 | Volume 7 | Issue 4 | e34954

responses to hyphal penetration, hyphal growth and haustorium
formation. The clustering of gene expression at later time points (6
and 8 dpi) likely corresponds to similar symptoms observed
(Figure 1) as well as plant responses to extensive Ps. cubensis
hyphal growth that is occurring at those time points [36].
Conserved host responses in C. sativus and A. thaliana incompatible interactions as measured through expressionprofiling
Host responses to pathogen challenge have been well docu-
mented in the model species A. thaliana [40], including those to the
downy mildew pathogen H. arabidopsidis [34,37]. To identify genes
induced in a compatible interaction with a downy mildew
pathogen common to both C. sativus and A. thaliana, we identified
single copy orthologous genes in both plant genomes and analyzed
their expression patterns. A total of 7,396 clusters of single copy
genes from both species were identified by clustering 23,248 and
27,416 representative protein coding genes from C. sativus and A.
thaliana, respectively. Data from a previous microarray-based
expression profiling [41] experiment of a compatible A. thaliana-H.
arabidopsidis interaction was compared with our mRNA-Seq-based
expression data. The H. arabidopsidis infection time points were 0,
0.5, 2, 4, and 6 dpi, similar to the 1–8 dpi time points assayed in
this study. Spearman rank correlation coefficients (SCCs) of log2
expression values were calculated between the single copy
orthologs at all time points in the two datasets; between 2,136
and 3,446 gene pairs were included in the pair-wise comparisons.
Among the six comparisons between similar time points, the SCC
values ranged from 0.10 to 0.72 (Table S3). The correlations
between early time points were the lowest between the two
interactions, possibly due to the differences in penetration
strategies between the two pathogens. The highest correlations
were observed between 6 dpi (SCC = 0.72) followed by 2 dpi
(SCC = 0.66) for both host-pathogen interactions (Figure 5).
Overall, correlation coefficients between analogous time points
(0.65 to 0.72) were greater than comparisons between dissimilar
time points (0.10 to 0.33) indicating similar expression patterns for
single copy orthologous genes in C. sativus and A. thaliana.
Differential gene expression throughout the infectionprocess
Differences in gene expression patterns between time points can
provide insight into the host response following pathogen
perception and subsequent infection; thus, the mechanism(s)
through which pathogenicity occurs may be inferred
[42,43,44,45]. For example, a recent publication by Gaulin et al.
[46] used a comparative approach analyzing the transcriptomes of
Aphanomyces euteiches and Phytophthora spp. to identify novel
pathogenicity factors and expanded repertoires for virulence.
Through comparison of gene expression patterns across time
points, we identified genes differentially expressed between all time
points and the control sample, 1 dpi mock inoculation; between
1,170 and 3,286 genes were differentially expressed in pair-wise
comparison between the mock inoculated and/or the inoculated
time points (Table 1, Table S4). In general, 12 to 31% of the genes
tested under different conditions were differentially expressed in
the pair-wise comparisons. In infected samples, comparisons of the
three early to intermediate time points (i.e., 1, 2, and 3 dpi)
showed a higher number of differentially expressed genes (2,214 to
3,286) than those between three intermediate to later (4, 6 and,
8 dpi) time points (1,612 to 2,074), suggesting more correlated
gene expression in later stages of infection.
Gene co-expression pattern analysesUsing Weighted Gene Correlation Network Analysis (WGCNA)
[47], we identified sets of highly correlated genes and constructed
modules where all members are more highly correlated with each
other than they are to genes outside the module [48]. Out of
15,286 genes expressed in the mock control or throughout the
infection time course, 4,410 genes passed the Coefficient of
Variance (CV) filter (0.4) and were retained for downstream
analyses. Of the 4,410 genes, a total of 2,169 were assigned to 11
gene modules that contained between 50 and 428 genes
(Table S5); 2,241 genes were not assigned to any module. To
visualize the relationship of the modules to each other with respect
to the progression of infection, eigengenes for each module were
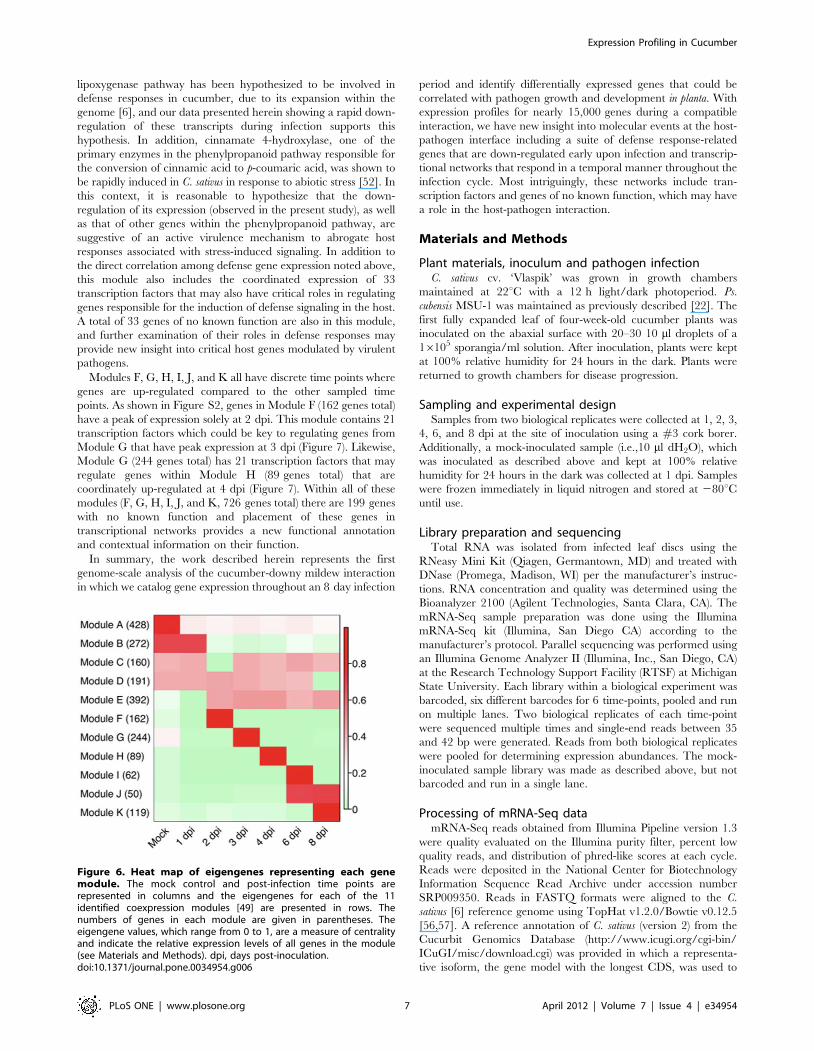
calculated and displayed in a heat map [49]. As shown in Figure 6,
some modules are representative of genes with correlated co-
expression at primarily a single or two time points (Modules F, G,
H, I, J, and K) whereas other modules represent genes that share
broader co-expression patterns across multiple time points
(Modules A, B, C, D, E). Examination of trend plots for the
modules (Figure 7, Figure S2) reveals the direction and magnitude
Figure 4. Correlation matrix of Cucumis sativus expressionprofiles during infection by Pseudoperonospora cubensis. Tissuesamples were collected from C. sativus at different time points ofinfection with Ps. cubensis. Normalized transcript abundances for14,476 genes were calculated as fragments per kilobase pair of exonmodel per million fragments mapped (FPKM) with Cufflinks version0.9.3 [58]. Pearson correlation coefficient of log2 FPKM values werecalculated for all pair-wise comparisons using R (http://cran.r-project.org/). Hierarchical clustering was performed using Pearson correlationdistance metric and average linkage with the Multiple ExperimentViewer Software version 4.5 [60]. The bootstrap support values shownon tree nodes were obtained from 1000 bootstrap replicates. dpi, dayspost-inoculation.doi:10.1371/journal.pone.0034954.g004
Expression Profiling in Cucumber
PLoS ONE | www.plosone.org 5 April 2012 | Volume 7 | Issue 4 | e34954

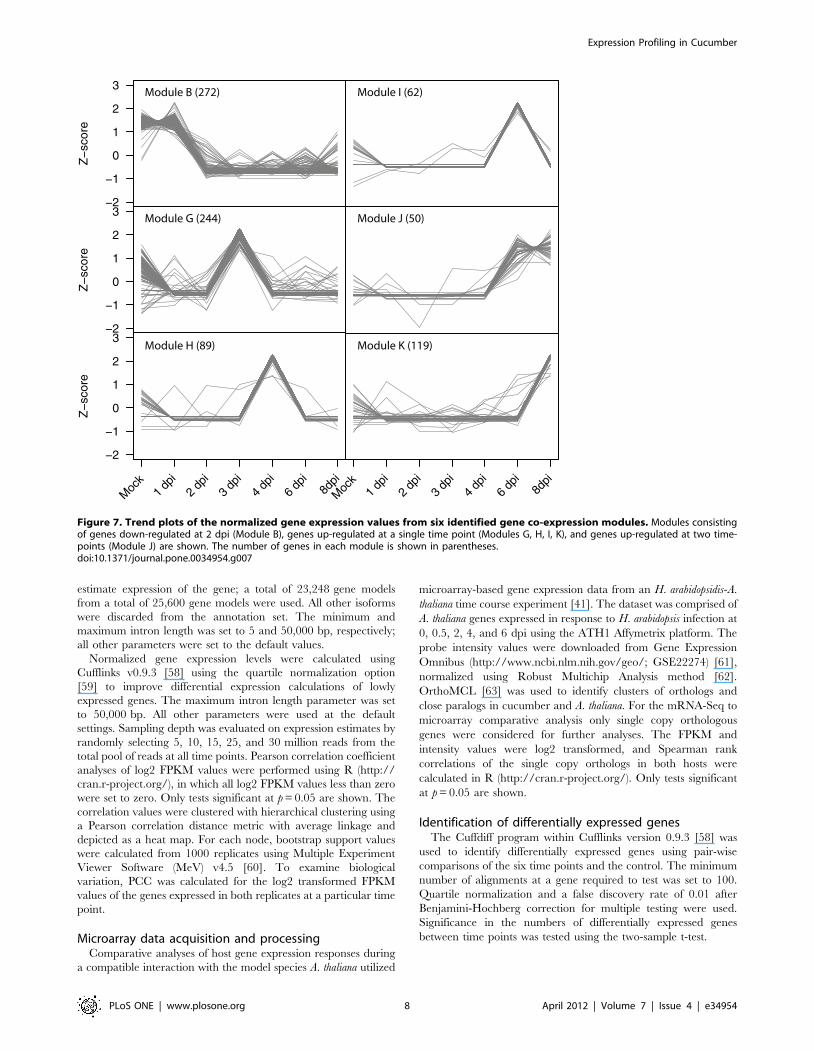
of gene expression patterns. Genes within Module B are expressed
in the mock control and at 1 dpi, but are coordinately down-
regulated at 2 dpi, remaining less abundant through 8 dpi
(Figure 7). This set of 272 genes includes a large suite of genes
implicated in resistance including six lipoxygenase genes, four
cationic peroxidases, two cinnamate 4-hydroxylases, an anthocya-
nidin 3-glucosyltransferase, an anthocyanin 5-aromatic acyltrans-
ferase, a cysteine protease, and the elicitor-inducible protein EIG-
J7. All of these genes have been implicated in defense responses in
other plants [50,51,52,53,54,55], and in total, their coordinate
down-regulation at 2 dpi is suggestive of an active mechanism by
the pathogen to alter host defense responses. For example, the
Figure 5. Comparison of orthologous gene expression in Cucumis sativus and Arabidopsis thaliana in a compatible interaction.Microarray expression profiles were obtained from time-course analyses of genes expressed in A. thaliana (Arth) during infection by H. arabidopsidis[41]. Single copy orthologous genes between C. sativus (Cusa) and A. thaliana were identified using OrthoMCL [63]. Log2 transformed expressionvalues of single copy orthologous genes expressed in the C. sativus mRNA-Seq dataset (log2 fragments per kilobase pair of exon model per millionfragments mapped [FPKM]) and A. thaliana microarray dataset (log2 intensity) are shown as scatter plots. SCC, Spearman correlation coefficient; dpi,days post-inoculation.doi:10.1371/journal.pone.0034954.g005
Table 1. Number of genes differentially expressed between different time points.
1 dpi¥ 2 dpi 3 dpi 4 dpi 6 dpi 8 dpi
Mock-Control 1,170 (12%)1 1,906(19%)
2,596 (26%) 2,509 (25%) 1,713 (17%) 2,556 (26%)
1 dpi 3,286 (31%) 2,948 (30%) 2,849 (27%) 2,010 (20%) 3,014 (30%)
2 dpi 2,214 (23%) 1,736 (18%) 2,718 (27%) 3,006 (29%)
3 dpi 1,590 (16%) 1,840 (18%) 2,218 (23%)
4 dpi 1,842 (18%) 2,074 (21%)
6 dpi 1,612 (16%)
Differential expression analysis was conducted using the cuffdiff program in Cufflinks version 0.9.3 [58], Cucumis sativus v2 annotation, and false discovery rate of 0.01.¥dpi, days post-inoculation.1Numbers in parenthesis indicate the percent of significantly different tests out of the total number of tests that could be performed for each pair-wise comparison.doi:10.1371/journal.pone.0034954.t001
Expression Profiling in Cucumber
PLoS ONE | www.plosone.org 6 April 2012 | Volume 7 | Issue 4 | e34954
lipoxygenase pathway has been hypothesized to be involved in
defense responses in cucumber, due to its expansion within the
genome [6], and our data presented herein showing a rapid down-
regulation of these transcripts during infection supports this
hypothesis. In addition, cinnamate 4-hydroxylase, one of the
primary enzymes in the phenylpropanoid pathway responsible for
the conversion of cinnamic acid to p-coumaric acid, was shown to
be rapidly induced in C. sativus in response to abiotic stress [52]. In
this context, it is reasonable to hypothesize that the down-
regulation of its expression (observed in the present study), as well
as that of other genes within the phenylpropanoid pathway, are
suggestive of an active virulence mechanism to abrogate host
responses associated with stress-induced signaling. In addition to
the direct correlation among defense gene expression noted above,
this module also includes the coordinated expression of 33
transcription factors that may also have critical roles in regulating
genes responsible for the induction of defense signaling in the host.
A total of 33 genes of no known function are also in this module,
and further examination of their roles in defense responses may
provide new insight into critical host genes modulated by virulent
pathogens.
Modules F, G, H, I, J, and K all have discrete time points where
genes are up-regulated compared to the other sampled time
points. As shown in Figure S2, genes in Module F (162 genes total)
have a peak of expression solely at 2 dpi. This module contains 21
transcription factors which could be key to regulating genes from
Module G that have peak expression at 3 dpi (Figure 7). Likewise,
Module G (244 genes total) has 21 transcription factors that may
regulate genes within Module H (89 genes total) that are
coordinately up-regulated at 4 dpi (Figure 7). Within all of these
modules (F, G, H, I, J, and K, 726 genes total) there are 199 genes
with no known function and placement of these genes in
transcriptional networks provides a new functional annotation
and contextual information on their function.
In summary, the work described herein represents the first
genome-scale analysis of the cucumber-downy mildew interaction
in which we catalog gene expression throughout an 8 day infection
period and identify differentially expressed genes that could be
correlated with pathogen growth and development in planta. With
expression profiles for nearly 15,000 genes during a compatible
interaction, we have new insight into molecular events at the host-
pathogen interface including a suite of defense response-related
genes that are down-regulated early upon infection and transcrip-
tional networks that respond in a temporal manner throughout the
infection cycle. Most intriguingly, these networks include tran-
scription factors and genes of no known function, which may have
a role in the host-pathogen interaction.
Materials and Methods
Plant materials, inoculum and pathogen infectionC. sativus cv. ‘Vlaspik’ was grown in growth chambers
maintained at 22uC with a 12 h light/dark photoperiod. Ps.
cubensis MSU-1 was maintained as previously described [22]. The
first fully expanded leaf of four-week-old cucumber plants was
inoculated on the abaxial surface with 20–30 10 ml droplets of a
16105 sporangia/ml solution. After inoculation, plants were kept
at 100% relative humidity for 24 hours in the dark. Plants were
returned to growth chambers for disease progression.
Sampling and experimental designSamples from two biological replicates were collected at 1, 2, 3,
4, 6, and 8 dpi at the site of inoculation using a #3 cork borer.
Additionally, a mock-inoculated sample (i.e.,10 ml dH2O), which
was inoculated as described above and kept at 100% relative
humidity for 24 hours in the dark was collected at 1 dpi. Samples
were frozen immediately in liquid nitrogen and stored at 280uCuntil use.
Library preparation and sequencingTotal RNA was isolated from infected leaf discs using the
RNeasy Mini Kit (Qiagen, Germantown, MD) and treated with
DNase (Promega, Madison, WI) per the manufacturer’s instruc-
tions. RNA concentration and quality was determined using the
Bioanalyzer 2100 (Agilent Technologies, Santa Clara, CA). The
mRNA-Seq sample preparation was done using the Illumina
mRNA-Seq kit (Illumina, San Diego CA) according to the
manufacturer’s protocol. Parallel sequencing was performed using
an Illumina Genome Analyzer II (Illumina, Inc., San Diego, CA)
at the Research Technology Support Facility (RTSF) at Michigan
State University. Each library within a biological experiment was
barcoded, six different barcodes for 6 time-points, pooled and run
on multiple lanes. Two biological replicates of each time-point
were sequenced multiple times and single-end reads between 35
and 42 bp were generated. Reads from both biological replicates
were pooled for determining expression abundances. The mock-
inoculated sample library was made as described above, but not
barcoded and run in a single lane.
Processing of mRNA-Seq datamRNA-Seq reads obtained from Illumina Pipeline version 1.3
were quality evaluated on the Illumina purity filter, percent low
quality reads, and distribution of phred-like scores at each cycle.
Reads were deposited in the National Center for Biotechnology
Information Sequence Read Archive under accession number
SRP009350. Reads in FASTQ formats were aligned to the C.
sativus [6] reference genome using TopHat v1.2.0/Bowtie v0.12.5
[56,57]. A reference annotation of C. sativus (version 2) from the
Cucurbit Genomics Database (http://www.icugi.org/cgi-bin/
ICuGI/misc/download.cgi) was provided in which a representa-
tive isoform, the gene model with the longest CDS, was used to
Figure 6. Heat map of eigengenes representing each genemodule. The mock control and post-infection time points arerepresented in columns and the eigengenes for each of the 11identified coexpression modules [49] are presented in rows. Thenumbers of genes in each module are given in parentheses. Theeigengene values, which range from 0 to 1, are a measure of centralityand indicate the relative expression levels of all genes in the module(see Materials and Methods). dpi, days post-inoculation.doi:10.1371/journal.pone.0034954.g006
Expression Profiling in Cucumber
PLoS ONE | www.plosone.org 7 April 2012 | Volume 7 | Issue 4 | e34954
estimate expression of the gene; a total of 23,248 gene models
from a total of 25,600 gene models were used. All other isoforms
were discarded from the annotation set. The minimum and
maximum intron length was set to 5 and 50,000 bp, respectively;
all other parameters were set to the default values.
Normalized gene expression levels were calculated using
Cufflinks v0.9.3 [58] using the quartile normalization option
[59] to improve differential expression calculations of lowly
expressed genes. The maximum intron length parameter was set
to 50,000 bp. All other parameters were used at the default
settings. Sampling depth was evaluated on expression estimates by
randomly selecting 5, 10, 15, 25, and 30 million reads from the
total pool of reads at all time points. Pearson correlation coefficient
analyses of log2 FPKM values were performed using R (http://
cran.r-project.org/), in which all log2 FPKM values less than zero
were set to zero. Only tests significant at p = 0.05 are shown. The
correlation values were clustered with hierarchical clustering using
a Pearson correlation distance metric with average linkage and
depicted as a heat map. For each node, bootstrap support values
were calculated from 1000 replicates using Multiple Experiment
Viewer Software (MeV) v4.5 [60]. To examine biological
variation, PCC was calculated for the log2 transformed FPKM
values of the genes expressed in both replicates at a particular time
point.
Microarray data acquisition and processingComparative analyses of host gene expression responses during
a compatible interaction with the model species A. thaliana utilized
microarray-based gene expression data from an H. arabidopsidis-A.
thaliana time course experiment [41]. The dataset was comprised of
A. thaliana genes expressed in response to H. arabidopsis infection at
0, 0.5, 2, 4, and 6 dpi using the ATH1 Affymetrix platform. The
probe intensity values were downloaded from Gene Expression
Omnibus (http://www.ncbi.nlm.nih.gov/geo/; GSE22274) [61],
normalized using Robust Multichip Analysis method [62].
OrthoMCL [63] was used to identify clusters of orthologs and
close paralogs in cucumber and A. thaliana. For the mRNA-Seq to
microarray comparative analysis only single copy orthologous
genes were considered for further analyses. The FPKM and
intensity values were log2 transformed, and Spearman rank
correlations of the single copy orthologs in both hosts were
calculated in R (http://cran.r-project.org/). Only tests significant
at p = 0.05 are shown.
Identification of differentially expressed genesThe Cuffdiff program within Cufflinks version 0.9.3 [58] was
used to identify differentially expressed genes using pair-wise
comparisons of the six time points and the control. The minimum
number of alignments at a gene required to test was set to 100.
Quartile normalization and a false discovery rate of 0.01 after
Benjamini-Hochberg correction for multiple testing were used.
Significance in the numbers of differentially expressed genes
between time points was tested using the two-sample t-test.
Z−
scor
e
−2
−1
0
1
2
3 Module B (272)Z
−sc
ore
−2
−1
0
1
2
3 Module G (244)
Module I (62)
Module J (50)
Module K (119)
Moc
k1
dpi
2 dp
i3
dpi
4 dp
i6
dpi
8dpi
Z−
scor
e
Moc
k1
dpi
2 dp
i3
dpi
4 dp
i6
dpi
8dpi
−2
−1
0
1
2
3Module H (89)
Figure 7. Trend plots of the normalized gene expression values from six identified gene co-expression modules. Modules consistingof genes down-regulated at 2 dpi (Module B), genes up-regulated at a single time point (Modules G, H, I, K), and genes up-regulated at two time-points (Module J) are shown. The number of genes in each module is shown in parentheses.doi:10.1371/journal.pone.0034954.g007
Expression Profiling in Cucumber
PLoS ONE | www.plosone.org 8 April 2012 | Volume 7 | Issue 4 | e34954

Functional analyses of differentially expressed genesFunctional annotation for all C. sativus genes were generated
from BLAST searches of the UniProt databases (Uniref100) [64]
and combined with Pfam (version 24.0, [65]) protein families
assignment using PfamScan (ftp://ftp.sanger.ac.uk/pub/
databases/Pfam/Tools/) C. sativus sequences were functionally
annotated based on the best possible UniRef sequence match
using a minimum E value cutoff of 1E-5. If there was no UniRef
sequence match, functional annotations were assigned using Pfam
domains. Transcription factors were annotated based on PFAM
domain assignment.
Gene co-expression network analysisGene modules of highly correlated genes were identified using
the WGCNA method [48] implemented in R (http://cran.r-
project.org/). All gene FPKM expression values were log2
transformed and any transformed FPKM value less than 1 was
converted to zero. Genes without variation across the mock
sample and 6 time points were filtered out using a Coefficient of
Variance (CV =s/m) cutoff of 0.4. The b and treecut parameters
for WGCNA were 13 and 0.9, respectively. All other parameters
were used with their default values. Eigengenes for each gene
module [49] were calculated and presented as a heat map.
Supporting Information
Figure S1 Concordance of expression values in twobiological replicates of Cucumis sativus during infectionby Pseudoperonospora cubensis. Reads from different time
points were mapped to the C. sativus genome using Bowtie version
0.12.5 [57] and TopHat version 1.2.0 [56]. Fragments per
kilobase pair of exon model per million fragments mapped
(FPKM) values were calculated using Cufflinks version 0.9.3 [58]
and the C. sativus genome annotations. For each time point, log2
transformed FPKM values of equal number of genes from both
replicates are plotted. R2, correlation coefficient; dpi, days post-
inoculation.
(PDF)
Figure S2 Trend plots for all 11 modules. All 11 modules
generated using WGCNA are shown (Modules A through K). The
number of genes in each module is shown in parentheses.
(PDF)
Table S1 List of Cucumis sativus genes expressedfollowing infection with Pseudoperonospora cubensis.
Gene ID, expression values (fragments per kilobase pair of exon
model per million fragments mapped, FPKM) at different time
points, and their functional annotation are shown.
(XLS)
Table S2 List of the top 20 genes highly expressed atdifferent time points and control, their FPKM (fragments
per kilobase pair of exon model per million fragments mapped)
values and putative function as determined by BLASTXsearches against UniRef100 (E-value cutoff 1e-5), andPfam protein family and domain search.(XLS)
Table S3 Spearman rank correlations of expressionvalues between single copy orthologous genes in Cucu-mis sativus and Arabidopsis thaliana following infectionwith a compatible oomycete pathogen.
(XLS)
Table S4 List of genes differentially expressed atdifferent time points along with their expression values(FPKM) and functional annotation. Differential expression
analysis was conducted using the cuffdiff program in Cufflinks
version 0.9.3 [58]. FPKM, fragments per kilobase pair of exon
model per million fragments mapped.
(XLS)
Table S5 List of modules (Module A through K) withtheir corresponding module name, gene ID, and puta-tive function as determined by BLASTX searches againstUniRef100 (E-value cutoff 1e-5) and transcription factor-related Pfam domains. Transcription factor-related Pfam
domains were identified using Pfam domain assignment. Expres-
sion values as represented by fragments per kilobase pair of exon
model per million fragments mapped (FPKM) were calculated
using Cufflinks [58].
(XLS)
Acknowledgments
We thank members of the Day lab for critical reading of the manuscript.
Author Contributions
Conceived and designed the experiments: ES BD CRB. Performed the
experiments: BA ES. Analyzed the data: BV KLC JH. Contributed
reagents/materials/analysis tools: BD CRB. Wrote the paper: BA ES BD
CRB.
References
1. Tanurdzic M, Banks JA (2004) Sex-determining mechanisms in land plants.
Plant Cell 16 Suppl. pp S61–71.
2. Lough TJ, Lucas WJ (2006) Integrative plant biology: role of phloem long-
distance macromolecular trafficking. Ann Rev Plant Biol 57: 203–232.
3. Hammerschmidt R (1999) PHYTOALEXINS: What have we learned after 60
years? Ann Rev Phytopathol 37: 285–306.
4. Hammerschmidt R (1999) Induced disease resistance: how do induced plants
stop pathogens? Physiol and Mol Plant Pathol 55: 77–84.
5. Ren Y, Zhang Z, Liu J, Staub JE, Han Y, et al. (2009) An integrated genetic and
cytogenetic map of the cucumber genome. PLoS ONE 4: e5795.
6. Huang S, Li R, Zhang Z, Li L, Gu X, et al. (2009) The genome of the cucumber,
Cucumis sativus L. Nat Genet 41: 1275–1281.
7. Woycicki R, Witkowicz J, Gawronski P, Dabrowska J, Lomsadze A, et al. (2011)
The genome sequence of the North-European cucumber (Cucumis sativus L.)
unravels evolutionary adaptation mechanisms in plants. PLoS ONE 6: e22728.
8. Guo S, Zheng Y, Joung JG, Liu S, Zhang Z, et al. (2010) Transcriptome
sequencing and comparative analysis of cucumber flowers with different sex
types. BMC Gen 11: 384.
9. Ando K, Grumet R (2010) Transcriptional profiling of rapidly growing
cucumber fruit by 454-pyrosequencing analysis. J Amer Soc Hort Sci 135:
291–302.
10. Olczak-Woltman H, Schollenberger M, Niemirowicz-Szczytt K (2009) Genetic
background of host-pathogen interaction between Cucumis sativus L. and
Pseudomonas syringae pv. lachrymans. J Appl Genet 50: 1–7.
11. Savory EA, Granke LL, Quesada-Ocampo LM, Varbanova M, Hausbeck MK,
et al. (2011) The cucurbit downy mildew pathogen Pseudoperonospora cubensis. Mol
Plant Pathol 12: 217–226.
12. Colucci SJ, Wehner TC, Holmes GJ (2006) The downy mildew epidemic of
2004 and 2005 in the Eastern United States. In: Holmes G, ed. Proc Cucurbitaceae
2006. Raleigh, NC: Universal Press.
13. Lebeda A, Pavelkova J, Urban J, Sedlakova B (2011) Distribution, host range
and disease severity of Pseudoperonospora cubensis on cucurbits in the Czech
Republic. J Phytopathol 159: 589–596.
14. Arauz LF, Neufeld KN, Lloyd AL, Ojiambo PS (2010) Quantitative models for
germination and infection of Pseudoperonospora cubensis in response to temperature
and duration of leaf wetness. Phytopathol 100: 959–367.
15. Thomas C, Inaba T, Cohen Y (1987) Physiological Specialization in
Pseudoperonospora cubensis. Phytopathol 77: 1621–1624.
16. Shetty NV, Wehner TC, Thomas CE, Doruchowski RW, Vasanth Shetty KP
(2002) Evidence for downy mildew races in cucumber tested in Asia, Europe,
and North America. Scientia Hort 94: 231–239.
Expression Profiling in Cucumber
PLoS ONE | www.plosone.org 9 April 2012 | Volume 7 | Issue 4 | e34954

17. Lebeda A, Widrlechner MP (2003) A set of Cucurbitaceae taxa for
differentiation of Pseudoperonespora cubensis pathotypes. J Plant Dis Prot 110:
337–349.
18. Cohen Y, Meron I, Mor N, Zuriel S (2003) A new pathotype of Pseudoperonospora
cubensis causing downy mildew in cucurbits in Israel. Phytoparasitica 31:
458–466.
19. Lebeda A (2002) Pathogenic variation of Pseudoperonospora cubensis in the Czech
Republic and some other European countries. II International Symposium on
Cucurbits 588. pp 137–141.
20. Lebeda A, Urban J (2004) Distribution, harmfulness and pathogenic variability
of cucurbit downy mildew in the Czech Republic. Acta Fytotech Zootech 7:
170–173.
21. Sarris P, Abdelhalim M, Kitner M, Skandalis N, Panopoulos N, et al. (2009)
Molecular polymorphisms between populations of Pseudoperonospora cubensis from
Greece and the Czech Republic and the phytopathological and phylogenetic
implications. Plant Pathol 58: 933–943.
22. Tian M, Win J, Savory E, Burkhardt A, Held M, et al. (2011) 454 Genome
sequencing of Pseudoperonospora cubensis reveals effector proteins with a QXLR
translocation motif. Mol Plant Microbe Interact 24: 543–553.
23. Savory E, Zou C, Adhikari B, Hamilton JP, Buell CR, et al. (2012) Alternative
splicing of a multi-drug transporter from Pseudoperonospora cubensis generates an
RXLR effector protein that elicits a rapid cell death. PLoS ONE. In press.
24. Durrant WE, Dong X (2004) Systemic acquired resistance. Ann Rev
Phytopathol 42: 185–209.
25. Phuntumart V, Marro P, Metraux J-P, Sticher L (2006) A novel cucumber gene
associated with systemic acquired resistance. Plant Sci 171: 555–564.
26. Sticher L, Mauch-Mani B, Metraux JP (1997) Systemic acquired resistance. Ann
Rev Phytopathol 35: 235–270.
27. Bent AF, Mackey D (2007) Elicitors, effectors, and R genes: The new paradigm
and a lifetime supply of questions. Ann Rev Phytopathol 45: 399–436.
28. Call AD, Wehner T (2010) Gene list 2010 for cucumber. Cucurbi Genet Coop
Rep 28-29: 105–141.
29. Runge F, Choi Y-J, Thines M (2011) Phylogenetic investigations in the genus
Pseudoperonospora reveal overlooked species and cryptic diversity in the P. cubensis
species cluster. Eur J Plant Pathol 129: 135–146.
30. Taler D, Galperin M, Benjamin I, Cohen Y, Kenigsbuch D (2004) Plant eR
genes that encode photorespiratory enzymes confer resistance against disease.
Plant Cell 16: 172–184.
31. Criswell A (2008) Screening cucumber (Cucumis sativus) for resistance to downy
mildew (Pseudoperonospora cubensis). NCSU Thesis.
32. Wang ET, Sandberg R, Luo S, Khrebtukova I, Zhang L, et al. (2008)
Alternative isoform regulation in human tissue transcriptomes. Nature 456:
470–476.
33. Boddu J, Cho S, Muehlbauer GJ (2007) Transcriptome analysis of trichothe-
cene-induced gene expression in barley. Mol Plant Microbe Interact 20:
1364–1375.
34. Huibers RP, de Jong M, Dekter RW, Van den Ackerveken G (2009) Disease-
specific expression of host genes during downy mildew infection of Arabidopsis.
Mol Plant Microbe Interact 22: 1104–1115.
35. Gupta S, Chakraborti D, Sengupta A, Basu D, Das S (2010) Primary
metabolism of chickpea is the initial target of wound inducing early sensed
Fusarium oxysporum f. sp. ciceri race I. PLoS ONE 5: e9030.
36. Savory EA, Adhikari BN, Hamilton JP, Vaillancourt B, Buell CR, et al. (2012)
RNA-Seq Analysis of the Pseudoperonospora cubensis transcriptome during
cucumber (Cucumis sativus L.) infection. PLoS One. In press.
37. Coates ME, Beynon JL (2010) Hyaloperonospora arabidopsidis as a pathogen model.
Ann Rev Phytopathol 48: 329–345.
38. Volk GM, Haritatos EE, Turgeon R (2003) Galactinol synthase gene expression
in melon. J Am Soc Hort Sci 128: 8–15.
39. Li JW, Liu J, Zhang H, Xie CH (2011) Identification and transcriptional
profiling of differentially expressed genes associated with resistance to
Pseudoperonospora cubensis in cucumber. Plant Cell Rep 30: 345–357.
40. Knepper C, Day B (2010) From perception to activation: The molecular-genetic
and biochemical landscape of disease resistance signaling in plants. The
Arabidopsis Book. e012.
41. Wang W, Barnaby JY, Tada Y, Li H, Tor M, et al. (2011) Timing of plant
immune responses by a central circadian regulator. Nature 470: 110–114.
42. Huibers RP, de Jong M, Dekter RW, Van den Ackerveken G (2009) Disease-
specific expression of host genes during downy mildew infection of Arabidopsis.Mol Plant Microbe Interact 22: 1104–1115.
43. Miranda M, Ralph SG, Mellway R, White R, Heath MC, et al. (2007) The
transcriptional response of hybrid poplar (Populus trichocarpa x P. deltoides) toinfection by Melampsora medusae leaf rust involves induction of flavonoid
pathway genes leading to the accumulation of proanthocyanidins. Mol PlantMicrobe Interact 20: 816–831.
44. Polesani M, Bortesi L, Ferrarini A, Zamboni A, Fasoli M, et al. (2010) General
and species-specific transcriptional responses to downy mildew infection in asusceptible (Vitis vinifera) and a resistant (V. riparia) grapevine species. BMC Gen
11: 117.45. Polesani M, Desario F, Ferrarini A, Zamboni A, Pezzotti M, et al. (2008) cDNA-
AFLP analysis of plant and pathogen genes expressed in grapevine infected withPlasmopara viticola. BMC Genomics 9: 142.
46. Gaulin E, Madoui MA, Bottin A, Jacquet C, Mathe C, et al. (2008)
Transcriptome of Aphanomyces euteiches: new oomycete putative pathogenicityfactors and metabolic pathways. PLoS ONE 3: e1723.
47. Langfelder P, Zhang B, Horvath S (2008) Defining clusters from a hierarchicalcluster tree: the Dynamic Tree Cut package for R. Bioinformatics 24: 719–720.
48. Zhang B, Horvath S (2005) A general framework for weighted gene co-
expression network analysis. Stat App Gen Mol Biol 4: Article 17.49. Langfelder P, Horvath S (2007) Eigengene networks for studying the
relationships between co-expression modules. BMC Sys Biol 1: 54.50. Takemoto D, Demirdoven A (2007) Lipoxygenase in fruits and vegetables: A
review. Enz Micro Tech 40: 491–496.51. Hilaire E, Young SA, Willard LH, McGee JD, Sweat T, et al. (2001) Vascular
defense responses in rice: peroxidase accumulation in xylem parenchyma cells
and xylem wall thickening. Mol Plant Microbe Interact 14: 1411–1419.52. Varbanova M, Porter K, Lu F, Ralph J, Hammerschmidt R, et al. (2011)
Molecular and biochemical basis for stress-induced accumulation of free andbound p-coumaraldehyde in cucumber. Plant Physiol 157: 1056–1066.
53. Brader G, Djamei A, Teige M, Palva ET, Hirt H (2007) The MAP kinase kinase
MKK2 affects disease resistance in Arabidopsis. Mol Plant Microbe Interact 20:589–596.
54. Bernoux M, Timmers T, Jauneau A, Briere C, de Wit PJGM, et al. (2008)RD19, an Arabidopsis cysteine protease required for RRS1-R-mediated
resistance, Is relocalized to the nucleus by the Ralstonia solanacearum PopP2effector. Plant Cell 20: 2252–2264.
55. Takemoto D, Doke N, Kawakita K (2001) Characterization of elicitor-inducible
tobacco genes isolated by differential hybridization. J Gen Plant Pathol 67:89–96.
56. Trapnell C, Pachter L, Salzberg SL (2009) TopHat: discovering splice junctionswith RNA-Seq. Bioinformatics 25: 1105–1111.
57. Langmead B, Trapnell C, Pop M, Salzberg S (2009) Ultrafast and memory-
efficient alignment of short DNA sequences to the human genome. GenomeBiology 10: R25.
58. Trapnell C, Williams BA, Pertea G, Mortazavi A, Kwan G, et al. (2010)Transcript assembly and quantification by RNA-Seq reveals unannotated
transcripts and isoform switching during cell differentiation. Nat Biotechnol 28:511–515.
59. Bullard J, Purdom E, Hansen K, Dudoit S (2010) Evaluation of statistical
methods for normalization and differential expression in mRNA-Seq experi-ments. BMC Bioinformatics 11: 94.
60. Saeed AI, Bhagabati NK, Braisted JC, Liang W, Sharov V, et al. (2006) TM4microarray software suite. Methods Enzymol 411: 134–193.
61. Edgar R, Domrachev M, Lash AE (2002) Gene Expression Omnibus: NCBI
gene expression and hybridization array data repository. Nucleic Acids Res 30:207–210.
62. Irizarry RA, Hobbs B, Collin F, Beazer-Barclay YD, Antonellis KJ, et al. (2003)Exploration, normalization, and summaries of high density oligonucleotide array
probe level data. Biostat 4: 249–264.
63. Li L, Stoeckert CJ Jr., Roos DS (2003) OrthoMCL: identification of orthologgroups for eukaryotic genomes. Genome Res 13: 2178–2189.
64. Suzek BE, Huang H, McGarvey P, Mazumder R, Wu CH (2007) UniRef:comprehensive and non-redundant UniProt reference clusters. Bioinformatics
23: 1282–1288.65. Bateman A, Birney E, Durbin R, Eddy SR, Howe KL, et al. (2000) The Pfam
Protein Families Database. Nucleic Acids Res 28: 263–266.
Expression Profiling in Cucumber
PLoS ONE | www.plosone.org 10 April 2012 | Volume 7 | Issue 4 | e34954
Copyright © 2022 FDOKUMEN