In Vitro Antifungal Efficacy of White Radish (Raphanus sativus ...
18
processes Article In Vitro Antifungal Efficacy of White Radish (Raphanus sativus L.) Root Extract and Application as a Natural Preservative in Sponge Cake Huynh Hoang Duy 1, *, Pham Thi Kim Ngoc 1 , Le Thi Hong Anh 2 , Dong Thi Anh Dao 1, *, Duy Chinh Nguyen 3 and Van Thai Than 4 1 Faculty of Chemical Engineering, HCMC University of Technology, Vietnam National University System Hochiminhcity, 268 Ly Thuong Kiet St., District 10, Ho Chi Minh City 700000, Vietnam 2 Faculty of Food Science and Technology, Ho Chi Minh City University of Food Industry, 140 Le Trong Tan St. Ho Chi Minh City 700000, Vietnam 3 NTT Hi-Tech Institute, Nguyen Tat Thanh University, Ho Chi Minh City 70000, Vietnam 4 Center of Excellence for Biochemistry and Natural Products, Nguyen Tat Thanh University, Ho Chi Minh City 700000, Vietnam * Correspondence: [email protected] (H.H.D.); [email protected] (D.T.A.D.) Received: 10 July 2019; Accepted: 6 August 2019; Published: 21 August 2019 Abstract: The study attempts the optimization of the total flavonoid content (TFC) and the 2,2 0 -azino-bis(3-ethylbenzothiazoline-6-sulphonic acid) (ABTS) antioxidant activity of the white radish (Raphanus sativus L.) root ethanolic extract (WRE) with regard to several parameters including ethanol concentration, the ratio of solvent/material, temperature and extraction time. Then antifungal analysis of WRE was performed against four fungal species including Aspergillus flavus NBRC 33021, Aspergillus niger NBRC 4066, Aspergillus clavatus NBRC 33020, and Fusarium solani NBRC 31094. At the WRE concentration of 75 mg/mL, diameters of inhibition zone were 9.11 ± 1.5, 19.55 ± 1.68, 17.72 ± 0.25, and 17.50 ± 0.73 mm respectively against the four examined species. Minimum fungal concentration (MFC) values of WRE against the four species were 30, 10, 20 and 30 mg/mL respectively. Evaluation of the sponge cake added with white radish root extract suggested that shelf-life of the sponge cake is 8 weeks in air-cooled condition (20 ◦ C) and two weeks in warm condition (37 ◦ C). Keywords: Raphanus sativus L.; antifungal activity; shelf-life study; sponge cake 1. Introduction Raphanus sativus L., commonly referred to as radish or daikon, is a cruciferous vegetable that belongs to the Brassicaceae family and finds a myriad of applications in the daily diet and traditional medicine of Eastern societies. The radish is one of the most consumed vegetables in Asian countries, including Vietnam, China and Japan, and is regarded as an important ingredient in the treatment of liver and respiratory diseases [1,2]. Biological activities of radish are diverse and have been ascertained in many investigations, which were well summarized in a past review [3]. In brief, the radish extract was shown to exhibit inhibitory effect on growth of G+, G” bacteria, antifungal, immunological, antioxidant, anticancer and antiviral properties. The antibacterial activity is mostly due to the presence of cysteine-rich peptides (Rs-AFP1 and Rs-AFP2), RAP-1 and RAP-2 protein, cafeic, ferulic and phydroxybenzoic acid. In addition, it was found that four types of the glucosinolate compound, including glucoraphenin, dehydroerucin, glucobrassicin, and glucoerucin are responsible for the pungency of Raphanus sativus, predominate in roots of radish [4]. Glucosinolate has been shown to take part in promoting enzymatic activities involving removal of carcinogens and preventing aging in the human body. Processes 2019, 7, 549; doi:10.3390/pr7090549 www.mdpi.com/journal/processes
-
Upload
khangminh22 -
Category
Documents
-
view
1 -
download
0
Transcript of In Vitro Antifungal Efficacy of White Radish (Raphanus sativus ...

processes
Article
In Vitro Antifungal Efficacy of White Radish(Raphanus sativus L.) Root Extract and Applicationas a Natural Preservative in Sponge Cake
Huynh Hoang Duy 1,*, Pham Thi Kim Ngoc 1, Le Thi Hong Anh 2, Dong Thi Anh Dao 1,*,Duy Chinh Nguyen 3 and Van Thai Than 4
1 Faculty of Chemical Engineering, HCMC University of Technology, Vietnam National University SystemHochiminhcity, 268 Ly Thuong Kiet St., District 10, Ho Chi Minh City 700000, Vietnam
2 Faculty of Food Science and Technology, Ho Chi Minh City University of Food Industry,140 Le Trong Tan St. Ho Chi Minh City 700000, Vietnam
3 NTT Hi-Tech Institute, Nguyen Tat Thanh University, Ho Chi Minh City 70000, Vietnam4 Center of Excellence for Biochemistry and Natural Products, Nguyen Tat Thanh University,
Ho Chi Minh City 700000, Vietnam* Correspondence: [email protected] (H.H.D.); [email protected] (D.T.A.D.)
Received: 10 July 2019; Accepted: 6 August 2019; Published: 21 August 2019�����������������
Abstract: The study attempts the optimization of the total flavonoid content (TFC) and the2,2′-azino-bis(3-ethylbenzothiazoline-6-sulphonic acid) (ABTS) antioxidant activity of the whiteradish (Raphanus sativus L.) root ethanolic extract (WRE) with regard to several parameters includingethanol concentration, the ratio of solvent/material, temperature and extraction time. Then antifungalanalysis of WRE was performed against four fungal species including Aspergillus flavus NBRC 33021,Aspergillus niger NBRC 4066, Aspergillus clavatus NBRC 33020, and Fusarium solani NBRC 31094.At the WRE concentration of 75 mg/mL, diameters of inhibition zone were 9.11 ± 1.5, 19.55 ± 1.68,17.72 ± 0.25, and 17.50 ± 0.73 mm respectively against the four examined species. Minimum fungalconcentration (MFC) values of WRE against the four species were 30, 10, 20 and 30 mg/mL respectively.Evaluation of the sponge cake added with white radish root extract suggested that shelf-life of thesponge cake is 8 weeks in air-cooled condition (20 ◦C) and two weeks in warm condition (37 ◦C).
Keywords: Raphanus sativus L.; antifungal activity; shelf-life study; sponge cake
1. Introduction
Raphanus sativus L., commonly referred to as radish or daikon, is a cruciferous vegetable thatbelongs to the Brassicaceae family and finds a myriad of applications in the daily diet and traditionalmedicine of Eastern societies. The radish is one of the most consumed vegetables in Asian countries,including Vietnam, China and Japan, and is regarded as an important ingredient in the treatment ofliver and respiratory diseases [1,2]. Biological activities of radish are diverse and have been ascertainedin many investigations, which were well summarized in a past review [3]. In brief, the radish extractwas shown to exhibit inhibitory effect on growth of G+, G” bacteria, antifungal, immunological,antioxidant, anticancer and antiviral properties. The antibacterial activity is mostly due to the presenceof cysteine-rich peptides (Rs-AFP1 and Rs-AFP2), RAP-1 and RAP-2 protein, cafeic, ferulic andphydroxybenzoic acid. In addition, it was found that four types of the glucosinolate compound,including glucoraphenin, dehydroerucin, glucobrassicin, and glucoerucin are responsible for thepungency of Raphanus sativus, predominate in roots of radish [4]. Glucosinolate has been shown totake part in promoting enzymatic activities involving removal of carcinogens and preventing aging inthe human body.
Processes 2019, 7, 549; doi:10.3390/pr7090549 www.mdpi.com/journal/processes
Processes 2019, 7, 549 2 of 18
Different parts of the radish plant show varying degrees of biological activities [5,6]. While seedsand aerial parts of Raphanus sativus have been long known for strong antifungal and antibacterial activitydue to the presence of the raphanin compound, to date, current evidence has only documented moderateinhibitory effects of the Raphanus sativus root against various bacteria species only and thus, makingdata with regard to antifungal activities of Raphanus sativus uncomprehensive [7–10]. For example,in a previous in vitro study involving 52 selected food-borne bacteria species, methanol extractsfrom white skin Raphanus sativus roots were shown to inhibit the growth of 11 species (Arthrobacteratrocyaneus, Corynebacterium ammoniagenes, Enterobacter hormaechei, Kocuria rosea, Neisseria subflava,Pantoea agglomerans, Proteus vulgaris, Psychrobacter immobilis, Shigella dysenteriae, Bacillus sphaericusand Corynebacterium flavescens) [11]. This result was further extended in another similar study wheregrowth-inhibitory effect of radish root juice was determined against five other microbial speciesincluding Klebsiella pneumoniae, Staphylococcus aureus, Pseudomonas aeruginosa, Enterococcus faecalis andEscherichia coli with minimum inhibitory concentrations (MIC) ranging from 0.078 to 0.625 mg/mL [12].However, those reported antibacterial effects were not as high as those exhibited by standard drugs,which are respectively maxipime and ampicillin in the two studies.
Apart from the cysteine-rich peptides, the antibacterial activity of the taproot of Raphanus sativusmight be attributed specifically to its content of flavonoids, which figure for various health-beneficialeffects and strong antimicrobial properties [3]. The inhibition mechanism of flavonoids againstmicrobial growth was implied in a review proposing that highly polar phenolic compounds, includingflavonoids, tannins, and quinones, could bind to and thus interfering with the conformation of ABCtransporter proteins in pathogenic fungi and microbes [13,14]. In Indian Raphanus sativus roots, the totalflavonoid content reached 43.5 mg CE/100 g fresh mass, which was comparable to those found inIndian apples and ladyfinger fruits, respectively at 48.5 and 48.2 mg CE/100 g fresh mass [15]. This wassupported by results of another study where flavonoids and alkaloids were consistently found inRaphanus sativus root peel extracts regardless of employed solvent and extraction method [16]. In termsof flavonoid composition in Raphanus sativus root, it was revealed that radish root contains four majortypes of flavonoids including kaempferol, luteolin, quercetin and apigenin respectively at 32.3, 19.5,5.2 and 2.2 mg/kg fresh weight [17].
It is a common extrapolation in previous antimicrobial and antioxidant assays that Raphanus sativustaproots could act as a promising ingredient for manufacture of bio-preservatives used in foods.However, to our knowledge, it is difficult to comprehend this justification in absence of relevant resultson antifungal activity. In addition, to permit feasible production of health-safe additives, optimizationof flavonoid content accruing from the extraction process of the radish root as well as preservabilityand palatability evaluation of food supplemented with radish-derived preservatives should be carriedout. Therefore, the objective of in this study is three-fold. First, we optimize the total flavonoidcontent in the extracts of the Raphanus sativus roots with respect to different experimental parameters.Second, the antifungal activity against Aspergillus flavus NBRC 33021, Aspergillus niger NBRC 4066,Aspergillus clavatus NBRC 33020, and Fusarium solani NBRC 31094 fungi of the obtained Raphanussativus taproot extracts will be determined via well diffusion assays. Third, to assess the suitabilityof the extracts in food applications, we evaluate preservability, sensory characteristics and severalimportant microbial indicators of a sponge cake formula incorporated with the dried extract of theRaphanus sativus root. The results are expected to aid further development of natural preservativesderived from abundant and inexpensive plant materials.
2. Materials and Methods
2.1. Materials
2.1.1. Plant Materials
White radish roots were collected from the farming field of Tran Gia Company, a major vegetableprovider situating in Dalat city, Lam Dong province, Vietnam. Obtained roots were of the first

Processes 2019, 7, 549 3 of 18
generation (F1) weighing around 200–300 g/root, having the diameter of 3.5 ± 0.5 mm and length of17.5 ± 2.5 cm. Materials were pretreated by washing under tap water and then sliced and dried at50 ◦C to reach the final moisture level of 6–7% (w/w). Subsequently, the dried slices of white radishwere ground to a powder and sieved through a sifter (40 mesh). Finally, they were stored in sealed bagand kept in a freezer at −20 ◦C.
2.1.2. Ingredients for Sponge Cake
Ingredients include fresh whole eggs (Ba Huan Joint-Stock Company, Ho Chi Minh City, Vietnam),medium flour (Interflour Group Pte Ltd., Ho Chi Minh City, Vietnam), powdered refined white sugarfine (Ninh Hoa Sugar Joint Stock Company, Khanh Hoa province, Vietnam), vegetable oil (Cargill Inc.,Kuala Lumpur, Malaysia), sorbitol liquid (Roquette, Lestrem, France), cake-gel emulsifier (Rikevita,Johor, Malaysia), whole milk powder (Fonterra, Auckland, New Zealand), salt (Tan Thanh, Ho ChiMinh City, Vietnam), xanthan gum (ADM, Chicago, IL, USA).
2.1.3. Culture Media and Microorganisms
Sabouraud dextrose agar (SDA) was purchased from Himedia Laboratories, Mumbai India.Commercial antifungal agent of Natamycin was purchased from Handary (Uccle, Belgium).
The mold isolates of Aspergillus flavus NBRC 33021, Aspergillus niger NBRC 4066, Aspergillus clavatusNBRC 33020 and Fusarium solani NBRC 31094 were obtained from stock cultures of the Institute ofMicrobiology & Biotechnology, Vietnam National University, Hanoi, Vietnam.
2.1.4. Photocatalytic Degradation of Rhodamine B
All chemicals and solvents were of analytical grade. The reagents used were Trolox(Sigma-Aldrich 23,881-3, St. Louis, MO, USA), (6-hydroxy-2,5,7,8-tetramethylchromane-2-carboxylicacid), was used as anti-oxidant. ABTS (Sigma-Aldrich, A1888, St. Louis, MO, USA)–2,2′-Azino-bis(3-Ethylbenzthiazoline-6-sulfonic acid) and potassium persulfate K2S2O8 (Sigma-Aldrich, P5592,St. Louis, MO, USA) were used to prepare a solution containing the radical cation ABTS•+. Gallic acid(3, 4, 5, trihydroxybenzoic acid, C6H2(OH)3-COOH, MW = 170/12), quercetin (C15H10O7), sodiumbisulfite (NaHSO3), and acetate (CH3COOK) were purchased from Sigma-Aldrich, St. Louis, MO, USA.
2.2. Method
2.2.1. Preparation of White Radish Extract (WRE)
Figure 1 illustrated the preparation process of WRE. The root powder was extracted via solventextraction method with ethanol 70% (v/v), ratio of substrate and ethanol: 1/20 g/mL for 4 h at 60 ◦C.After extraction, the mixture was filtered thrice through Whatman No.1 paper. The filtrate wasevaporated under vacuum to a constant weight to obtain a crude, flavonoid-rich paste. Prior tospray drying, this crude paste was mixed with maltodextrin 4% (based on the dry matter). To obtainwhite radish root extract (WRE) with a moisture of lower than 6.0% (w/w), the temperature for spraydrying was maintained at 160 ◦C. Finally, WRE were packed tightly in a thermoplastic low-densitypolyethylene bag and avoid direct light until further use.
2.2.2. Preparation of Sponge Cake
The sponge cake formula was produced by a standard all-in procedure, as illustrated in Figure 2 [18].All ingredients were mixed in a mixer (Kenwood KM250, Kenwood Ltd., Woking, UK). For the controlsample, 1300 ppm of potassium sorbate was added. For the testing sample, this preservative wasreplaced by 30 mg/mL of WRE. After mixing, the dough was transferred to aeration machine to createa foam structured dough. The specific gravity of the obtained dough was approximately 0.47–0.49and the temperature was around 28–30 ◦C. Prior to baking, the dough was transferred into tanks andwas pumped into molds through forming nozzles. An automatic oven (Dong Yang Dynamics) with

Processes 2019, 7, 549 4 of 18
baking functionality was employed with setting profiles: 170 ◦C for 16 min for oven zone 1, 190 ◦C for5 min for oven zone 2; 220 ◦C for 3 min for oven zone 3, 1 min for damper, total baking time of 23 min.The cake after cooling is injected with a custard cream with a weight of 8.0–8.5 g/piece. To preserve theproduct, each cake was sprayed with 0.3 ± 0.05 mg of alcohol solution 30% (v/v) onto their surfaces.Finally, the products were packed under tight conditions and prevented from exposure to air.Processes 2019, 24, x FOR PEER REVIEW 4 of 21
Figure 1. The procedure for the preparation of White Radish Extract (WRE).
2.2.2. Preparation of Sponge Cake
The sponge cake formula was produced by a standard all-in procedure, as illustrated in Figure 2 [18]. All ingredients were mixed in a mixer (Kenwood KM250, Kenwood Ltd., Woking, UK). For the control sample, 1300 ppm of potassium sorbate was added. For the testing sample, this preservative was replaced by 30 mg/mL of WRE. After mixing, the dough was transferred to aeration machine to create a foam structured dough. The specific gravity of the obtained dough was approximately 0.47–0.49 and the temperature was around 28–30 °C. Prior to baking, the dough was transferred into tanks and was pumped into molds through forming nozzles. An automatic oven (Dong Yang Dynamics) with baking functionality was employed with setting profiles: 170 °C for 16 min for oven zone 1, 190 °C for 5 min for oven zone 2; 220 °C for 3 min for oven zone 3, 1 min for damper, total baking time of 23 min. The cake after cooling is injected with a custard cream with a weight of 8.0–8.5 g/piece. To preserve the product, each cake was sprayed with 0.3 ± 0.05 mg of alcohol solution 30% (v/v) onto their surfaces. Finally, the products were packed under tight conditions and prevented from exposure to air.
Figure 1. The procedure for the preparation of White Radish Extract (WRE).Processes 2019, 24, x FOR PEER REVIEW 5 of 21
Figure 2. The procedure for preparation of sponge cake.
2.2.3. Determination of the Nutritional Components in White Radish Materials
Moisture content, protein content, lipid total and ash total in the roots were determined respectively in accordance with TCVN 4326:2011, TCVN 4328:2007 (Kjeldahl), TCVN 4331:2001 and TCVN4327:2007.
Figure 2. The procedure for preparation of sponge cake.

Processes 2019, 7, 549 5 of 18
2.2.3. Determination of the Nutritional Components in White Radish Materials
Moisture content, protein content, lipid total and ash total in the roots were determined respectivelyin accordance with TCVN 4326:2011, TCVN 4328:2007 (Kjeldahl), TCVN 4331:2001 and TCVN4327:2007.
2.2.4. Determination of the Total Flavonoids
The total flavonoids were determined by the aluminum chloride calorimetric method usingquercetin as a standard [19]. The stock quercetin solution was prepared by dissolving 5.0 mg ofquercetin in 1.0 mL of methanol. The stock solution was serially diluted produce standard solutions withvarying concentrations of quercetin (5–200 µg/mL). An amount of 0.6 mL of diluted standard quercetinsolutions or 0.6 mL of WRE was separately mixed with 0.1 mL of 10% aluminum chloride. After mixing,the mixture was incubated for 60 min at room temperature. The contents of flavonoids were calculatedfrom an absorbance of the reaction mixtures at 415 nm with a Varian UV-Vis spectrophotometer as inan equation below:
TFC =a×V× n× 10−3
m(1)
where total flavonoid content (TFC), a, V, m and n are total flavonoid content (mg QE/g), quercetincontent derived from the standard curve (ppm), total volume of solution (mL), sample weight (g) anddilution factor, respectively.
2.2.5. Determination of the Antioxidant ABTS
Radical scavenging activity (ABTS) was determined based on a reduction of ABTS radical cationsby antioxidants in extracts [20]. The mixture of WRE and distilled water directly reacted with K2S8O2
2.45 Nm (ratio 1:1) in the dark for 12–16 h at ambient temperature. Afterwards, 3 mL of ethanolsolution was added and the mixture was allowed to stand for 6 min. The absorbance was measured ata wavelength 734 nm. Changes in optical density (OD) were calculated as follows.
%OD =Asample
Acontrol× 100 (2)
Asample: absorbance of test sample, AControl: absorbance of blank.ABTS radical scavenging activity was calculated as:
ABTS(mgTEAC/g) =a×V× n× 250.29× 10⁻⁶
M(3)
a: Trolox content (µM) calculated from the calibration curve. V: Total volume from solution extract(mL), M: Dry matter mass (g), n: Dilution factor, 250.29: Trolox molecular weight.
2.2.6. Preparation of Inoculum
Stock inoculum suspensions were prepared as described in the NCCLS M38-P document [21].Suspensions were collected from 7-day-old cultures grown on potato dextrose agar slants andadjusted spectrophotometrically to optical densities ranging from 0.09 to 0.3 (82 to 60% transmittance).The stock suspensions consisted of mostly conidia and were diluted at the ratio of 1:50 in the moldmedium. The final conidium counts in tested stock inoculum suspensions ranged from 0.5 × 10⁶ to4.5 × 106 CFU/mL (1000 to 9000 CFU per the inoculated well) [22].
2.2.7. Antifungal Susceptibility Testing by Disk Diffusion Method
The employed microdilution methods were adapted from a described method [21]. In brief,the stock suspension of each fungal species was inoculated onto a petri disc with six wells withvarying concentrations of fungi. The result was record after 48 h in incubator at 35 ◦C as diameter

Processes 2019, 7, 549 6 of 18
of the inhibition zone corresponding to Aspergillus flavus, Aspergillus clavatus, Aspergillus niger, andFusarium solani.
2.2.8. Determination of Minimal Fungicidal Concentration (MFC)
The in vitro minimum fungicidal concentration (MFC) was defined as the lowest drug concentrationat which colonies were completely inhibited (approximately 99 to 99.5% killing activity) [22]. For eachfungal species, a 7-well petri disc filled with WRE at varying concentrations from 2.5–50 mg/mL wascompared with a similarly inoculated control disc filled with natamycin with concentration rangingfrom 0.025–0.8 mg/mL. The plates were incubated at 35 ◦C and the results were recorded after fungalgrowth was seen in the disc.
2.2.9. Water Activity Method
Absolute humidity is the measured amount of water in grams per cubic meter of air. Relativehumidity is the amount of moisture in the air compared to the maximum amount of moisture the aircontains at a given temperature. It is measured as a percentage of saturation. Theoretically foods canhave a water activity between 0 (bone dry) to 1 (dry water). In this study, using the water activity meterof Aqua Lab Pre at 20 ◦C. Water activity is defined in the following formula: aw = p/p0 = ERH/100where ERH stands for equilibrium relative humidity (%).
2.2.10. Sensory Evaluation Method
The employed sensory evaluation was in accordance with difference from control (DFC)method [23]. To be specific, 18 panelists were recruited and each panelist is presented with thecontrol sponge cake product and several other batches coded with three-digit numbers. The panelistassessed the control product first and was then asked to determine how different each individualsample was when comparing with the control on a numerical scale from 1 to 6. Of which, the scale of 1indicated no difference and 6 was a marked difference observed between the control cake and treatedcake [24].
Accepted:
6–Identical to the reference cake5–Slight difference was observed4–Moderately different3–Distinctly different, but acceptable.
Rejected:
2–Distinctly different (partial or complete loss of aroma of the cake)1–Extremely different, not consumable and considered spoiled.
2.2.11. Texture Analysis Method
Measurement of the firmness of sponge cake by Stable Micro Systems with texture analysis settingis pre-test speed: 2.0 mm/s, test speed: 1.0 mm/s, post-test speed: 10.0 mm/s and distance: 8mm, time:30 s, trigger type: auto 5 g. Accessory: AACC 36 mm cylinder probe with radius (P/36R) using 5 kgload cell.
2.2.12. Statistical Analysis
All experiments were performed in triplicate. The results were presented as mean ± S.D. andsubject to Duncan test. P-values of less than 0.05 were considered statistically significant. The analysiswas performed using SPSS statistics 22.

Processes 2019, 7, 549 7 of 18
3. Results and Discussion
3.1. Proximate Composition of Fresh White Radish (Raphanus sativus L.) Roots
Proximate composition of fresh white radish roots is summarized in Table 1. The moisture contentof white radish roots collected reached 96.1% and total dry mass content was 3.1% including 0.73% ofprotein and 2.67% of carbohydrate. Based on those results, the protein content and carbohydrate perdry matter in the material are calculated at 25.54% and 86.12%, respectively.
Table 1. Composition of the fresh white radish.
Composition Moisture Protein Lipid Carbohydrate Total Ash
Content (%) 96.1 ± 1.35 0.73 ± 0.12 <0.1 2.67 ± 0.16 0.46 ± 0.27
3.2. Single Factor Analysis for the Extraction of WRE Using Ethanol as the Solvent
Figure 3 visualized total flavonoid content and Trolox equivalent antioxidant capacity (TEAC) ofWRE with relation to different experimental parameters. It was indicated in the Figure 3 that bothTEAC and TFC content peaked at the ethanol concentration of 75% and decreased thereafter. In theethanol concentration range from 0 to 75%, the increasing trend of TFC could be attributed to theimproved mass diffusivity of the materials to the media. To be specific, due to the higher polarity of theethanol in comparison to the water, hydrogen-bonding of flavonoids with ethanol is better promotedby ethanol molecules [25]. This leads to improved dragging of flavonoids into media. On the otherhands, excessively high ethanol concentration causes the solution to evaporate rapidly over time,overturning the said diffusivity improvement and in turn lowering the TFC.
Processes 2019, 24, x FOR PEER REVIEW 8 of 21
Table 1. Composition of the fresh white radish.
Composition Moisture Protein Lipid Carbohydrate Total Ash Content (%) 96.1 ± 1.35 0.73 ± 0.12 <0.1 2.67 ± 0.16 0.46 ± 0.27
3.2. Single Factor Analysis for the Extraction of WRE Using Ethanol as the Solvent
Figure 3 visualized total flavonoid content and Trolox equivalent antioxidant capacity (TEAC) of WRE with relation to different experimental parameters. It was indicated in the Figure 3 that both TEAC and TFC content peaked at the ethanol concentration of 75% and decreased thereafter. In the ethanol concentration range from 0 to 75%, the increasing trend of TFC could be attributed to the improved mass diffusivity of the materials to the media. To be specific, due to the higher polarity of the ethanol in comparison to the water, hydrogen-bonding of flavonoids with ethanol is better promoted by ethanol molecules [25]. This leads to improved dragging of flavonoids into media. On the other hands, excessively high ethanol concentration causes the solution to evaporate rapidly over time, overturning the said diffusivity improvement and in turn lowering the TFC.
Figure 3. The effect of ethanol concentration on the total flavonoid content (TFC) and Trolox equivalent antioxidant capacity (TEAC) on WRE.
In the results of the next experiment (Figure 4), conducted at ethanol concentration 75%, it was found that at the material/solvent ratio of 1:50, the TEAC and TFC peaked at 25.1 and 5.2 mg/g, respectively. However, closer examinations of test statistics and the data revealed that these peak figures were statistically indifferent to those observed at the ratio of 1:30. In addition, the process performed at the high material/solvent ratio showed no economic advantages. The explanation for the relationship could be three-fold. First, the phenomenon could be due to the enlarged contact area between the materials and the extraction solvent, leading to increased extraction efficiency. Second, the gradient in concentration between solid and the solvent might have accelerated the mass transfer, improving the flavonoid yield [26]. Third, the material/solvent ratio could alter the equilibrium constant of the reaction and the recovery efficiency, however only to a certain threshold where the rate of yield starts to diminish with increasing ratio [27].
Figure 3. The effect of ethanol concentration on the total flavonoid content (TFC) and Trolox equivalentantioxidant capacity (TEAC) on WRE.
In the results of the next experiment (Figure 4), conducted at ethanol concentration 75%, it wasfound that at the material/solvent ratio of 1:50, the TEAC and TFC peaked at 25.1 and 5.2 mg/g,respectively. However, closer examinations of test statistics and the data revealed that these peakfigures were statistically indifferent to those observed at the ratio of 1:30. In addition, the processperformed at the high material/solvent ratio showed no economic advantages. The explanation forthe relationship could be three-fold. First, the phenomenon could be due to the enlarged contact areabetween the materials and the extraction solvent, leading to increased extraction efficiency. Second,

Processes 2019, 7, 549 8 of 18
the gradient in concentration between solid and the solvent might have accelerated the mass transfer,improving the flavonoid yield [26]. Third, the material/solvent ratio could alter the equilibriumconstant of the reaction and the recovery efficiency, however only to a certain threshold where the rateof yield starts to diminish with increasing ratio [27].Processes 2019, 24, x FOR PEER REVIEW 9 of 21
Figure 4. The effect of ratio substrate/solvent to extraction process.
The effect of temperature on the flavonoid yield and antioxidant activity of the WRE was described in the Figure 5. Experiments were performed at ethanol concentration of 75% and material/solvent ratio of 1:30. As the temperature rose from 45 to 50 °C, both TEAC and TFC witnessed a sharp rise to highest levels, at 28.26 and 6.25 mg/g, respectively. Afterwards, elevating the temperature seemed to gradually reduce both indicators. Since the high temperature could reduce viscosity of the solution, physical processes that involve diffusive and convective transport of nutrients could be facilitated. Furthermore, elevated temperature of the solution may play an important part in breaking down plant cell walls and linkages inside the material such as protein–phenol or phenol–polysaccharide links. Both explanations lead to increased TEAC and flavonoid content. However, excessively high temperature could adversely affect the flavonoid and other nutrients through decomposition or combination with others component, partially contributing to their change in oxidation properties.
Figure 5. The effect of temperature to extraction process.
Figure 4. The effect of ratio substrate/solvent to extraction process.
The effect of temperature on the flavonoid yield and antioxidant activity of the WRE was describedin the Figure 5. Experiments were performed at ethanol concentration of 75% and material/solvent ratioof 1:30. As the temperature rose from 45 to 50 ◦C, both TEAC and TFC witnessed a sharp rise to highestlevels, at 28.26 and 6.25 mg/g, respectively. Afterwards, elevating the temperature seemed to graduallyreduce both indicators. Since the high temperature could reduce viscosity of the solution, physicalprocesses that involve diffusive and convective transport of nutrients could be facilitated. Furthermore,elevated temperature of the solution may play an important part in breaking down plant cell walls andlinkages inside the material such as protein–phenol or phenol–polysaccharide links. Both explanationslead to increased TEAC and flavonoid content. However, excessively high temperature could adverselyaffect the flavonoid and other nutrients through decomposition or combination with others component,partially contributing to their change in oxidation properties.
Extraction time and its corresponding flavonoid yield and TEAC is shown in the Figure 6.At duration of 3 and 3.5 h, the highest level in TFC and TEAC was achieved. However, 3 h was selectedas this duration is economical. In addition, yields obtained at prolonged periods, such as 3.5 and 4 h,showed no clear difference in comparison to yield at 3 h. The threshold could be explained by the Fick’ssecond law of diffusion asserting that the equilibrium concentration of solute can be only achievedafter a short period of time and short extraction time will not guarantee the extraction efficiency ofantioxidant compounds [28]. Therefore, the final set of experimental parameters consisted of extractiontemperature of 50 ◦C, the time of 3 h, the ratio 1:30 and ethanol concentration of 75%. These conditionscorrespond to the TFC content of 6.25 ± 0.1 (mg/g) and TEAC of 28.95 ± 0.43 (mg/g).

Processes 2019, 7, 549 9 of 18
Processes 2019, 24, x FOR PEER REVIEW 9 of 21
Figure 4. The effect of ratio substrate/solvent to extraction process.
The effect of temperature on the flavonoid yield and antioxidant activity of the WRE was described in the Figure 5. Experiments were performed at ethanol concentration of 75% and material/solvent ratio of 1:30. As the temperature rose from 45 to 50 °C, both TEAC and TFC witnessed a sharp rise to highest levels, at 28.26 and 6.25 mg/g, respectively. Afterwards, elevating the temperature seemed to gradually reduce both indicators. Since the high temperature could reduce viscosity of the solution, physical processes that involve diffusive and convective transport of nutrients could be facilitated. Furthermore, elevated temperature of the solution may play an important part in breaking down plant cell walls and linkages inside the material such as protein–phenol or phenol–polysaccharide links. Both explanations lead to increased TEAC and flavonoid content. However, excessively high temperature could adversely affect the flavonoid and other nutrients through decomposition or combination with others component, partially contributing to their change in oxidation properties.
Figure 5. The effect of temperature to extraction process. Figure 5. The effect of temperature to extraction process.
Processes 2019, 24, x FOR PEER REVIEW 10 of 21
Extraction time and its corresponding flavonoid yield and TEAC is shown in the Figure 6. At duration of 3 and 3.5 h, the highest level in TFC and TEAC was achieved. However, 3 h was selected as this duration is economical. In addition, yields obtained at prolonged periods, such as 3.5 and 4 h, showed no clear difference in comparison to yield at 3 h. The threshold could be explained by the Fick’s second law of diffusion asserting that the equilibrium concentration of solute can be only achieved after a short period of time and short extraction time will not guarantee the extraction efficiency of antioxidant compounds [28]. Therefore, the final set of experimental parameters consisted of extraction temperature of 50 °C, the time of 3 h, the ratio 1:30 and ethanol concentration of 75%. These conditions correspond to the TFC content of 6.25 ± 0.1 (mg/g) and TEAC of 28.95 ± 0.43 (mg/g).
Figure 6. The effect of extraction time to extraction process.
3.3. Antifungal Susceptibility Testing by Disk Diffusion
Figure 7 shows the inhibition zones of various wells filled with WRE at different concentrations and with the positive control of 0.2 mg/mL natamycin. It was shown that the antifungal capacity of WRE against the four fungus species was negligible at the low concentration of 25 mg/mL. At this concentration, among four species, the largest diameter was observed in the disc inoculated with Aspergillus niger, at d = 10.22 ± 1.17 mm. Among four selected WRE concentrations, the concentration of 75 mg/mL showed the highest inhibitory effect against four species, of which the largest zone is observed against Aspergillus niger with d = 19.55 ± 1.68 mm. Apparently, the WRE ineffectively inhibited the growth of Aspergillus flavus, as demonstrated by very low diameters of well 1 to 5 in the Aspergillus flavus disc. In summary, we found that WRE exhibited fungicidal activities against most of the fungal species, especially Aspergillus niger, and that the WRE concentration of 75 mg/mL showed superior inhibitory effects to other concentrations and even to the positive control.
Figure 6. The effect of extraction time to extraction process.
3.3. Antifungal Susceptibility Testing by Disk Diffusion
Figure 7 shows the inhibition zones of various wells filled with WRE at different concentrationsand with the positive control of 0.2 mg/mL natamycin. It was shown that the antifungal capacity ofWRE against the four fungus species was negligible at the low concentration of 25 mg/mL. At thisconcentration, among four species, the largest diameter was observed in the disc inoculated withAspergillus niger, at d = 10.22 ± 1.17 mm. Among four selected WRE concentrations, the concentrationof 75 mg/mL showed the highest inhibitory effect against four species, of which the largest zoneis observed against Aspergillus niger with d = 19.55 ± 1.68 mm. Apparently, the WRE ineffectivelyinhibited the growth of Aspergillus flavus, as demonstrated by very low diameters of well 1 to 5 in theAspergillus flavus disc. In summary, we found that WRE exhibited fungicidal activities against most ofthe fungal species, especially Aspergillus niger, and that the WRE concentration of 75 mg/mL showedsuperior inhibitory effects to other concentrations and even to the positive control.

Processes 2019, 7, 549 10 of 18
Processes 2019, 24, x FOR PEER REVIEW 11 of 21
Figure 7. Antifungal susceptibility testing against (a) Aspergillus flavus NBRC 33021; (b) Aspergillus niger NBRC 4066; (c) Aspergillus clavatus NBRC 33020; (d) Fusarium solani NBRC 31094; (1): Negative control—DMSO 5%; (2): WRE 25 mg/mL; (3): WRE 50 mg/mL; (4): WRE concentrate 75 mg/mL; (5): WRE 100 mg/mL; (6): Positive control—natamycin 0.2 mg/mL.
3.4. Minimal Fungicidal Concentration (MFC)
Minimal fungicidal concentration (MFC) is defined as the lowest concentration of an antimicrobial agent that causes a specified reduction the visible growth of a microorganism in an agar or broth dilution susceptibility test. To determine MFC, various WRE concentrations of lower than 75 mg/mL were investigated against four fungal species and the results were compared with those of the natamycin in separate discs. The comparison is shown in Figure 8, showing a positively proportional correlation between concentration and inhibition. Table 2 details the growth of fungal colonies with respect to WRE and natamycin concentration. It was observed that at the WRE concentration of 30 mg/mL, all four species were inhibited and Aspergillus niger was the most susceptible species to antifungal agents, followed by Aspergillus clavatus. The minimum MFC value of natamycin was recorded at 0.2 mg/mL for Aspergillus niger (Table 3). In general, the lowest natamycin concentration where no growth was observed after 72 h of incubation was lower than that of WRE concentration. Our result was similar to the recent findings of Salvosa et al. who reported that Aspergillus flavus showed no growth when treated with natamycin with concentrations ranging from 150–40000 μg/mL, which was higher than MFC for Fusarium solani (10 μg/mL) [29].
Figure 7. Antifungal susceptibility testing against (a) Aspergillus flavus NBRC 33021; (b) Aspergillusniger NBRC 4066; (c) Aspergillus clavatus NBRC 33020; (d) Fusarium solani NBRC 31094; (1): Negativecontrol—DMSO 5%; (2): WRE 25 mg/mL; (3): WRE 50 mg/mL; (4): WRE concentrate 75 mg/mL;(5): WRE 100 mg/mL; (6): Positive control—natamycin 0.2 mg/mL.
3.4. Minimal Fungicidal Concentration (MFC)
Minimal fungicidal concentration (MFC) is defined as the lowest concentration of an antimicrobialagent that causes a specified reduction the visible growth of a microorganism in an agar or broth dilutionsusceptibility test. To determine MFC, various WRE concentrations of lower than 75 mg/mL wereinvestigated against four fungal species and the results were compared with those of the natamycin inseparate discs. The comparison is shown in Figure 8, showing a positively proportional correlationbetween concentration and inhibition. Table 2 details the growth of fungal colonies with respect toWRE and natamycin concentration. It was observed that at the WRE concentration of 30 mg/mL,all four species were inhibited and Aspergillus niger was the most susceptible species to antifungalagents, followed by Aspergillus clavatus. The minimum MFC value of natamycin was recorded at0.2 mg/mL for Aspergillus niger (Table 3). In general, the lowest natamycin concentration where nogrowth was observed after 72 h of incubation was lower than that of WRE concentration. Our resultwas similar to the recent findings of Salvosa et al. who reported that Aspergillus flavus showed nogrowth when treated with natamycin with concentrations ranging from 150–40000 µg/mL, which washigher than MFC for Fusarium solani (10 µg/mL) [29].

Processes 2019, 7, 549 11 of 18
Processes 2019, 24, x FOR PEER REVIEW 13 of 21
Figure 8. Minimum fungal concentration (MFC) of (a,b): Aspergillus flavus NBRC 33021; (c+d): Aspergillus niger NBRC 4066; (e+f): Aspergillus clavatus NBRC 33020; (g+h): Fusarium solani NBRC 31094; disk (a,c,e,g): Natamycin and disk (b,d,f,h): WRE.
Figure 8. Minimum fungal concentration (MFC) of (a,b): Aspergillus flavus NBRC 33021; (c+d):Aspergillus niger NBRC 4066; (e+f): Aspergillus clavatus NBRC 33020; (g+h): Fusarium solani NBRC31094; disk (a,c,e,g): Natamycin and disk (b,d,f,h): WRE.

Processes 2019, 7, 549 12 of 18
Table 2. Inhibition zone diameter (mm) for molds of white radish extract (WRE) (*).
Concentration
Inhibition Zone Diameter (mm)
Aspergillus flavusNBRC 33021
Aspergillus nigerNBRC 4066
Aspergillus clavatusNBRC 33020
Fusarium solaniNBRC 31094
DMSO 5% (v/v) NI NI NI NIWRE 25 mg/mL NI 10.22 b
± 1.17 8.22 b± 0.39 6.00 a
± 0.00WRE 50 mg/mL 6.22 a
± 0.39 17.89 bc± 1.39 15.34 c
± 0.58 6.61 a± 0.25
WRE 75 mg/mL 9.11 b± 1.5 19.55 c
± 1.68 17.72 c± 0.25 17.50 b
± 0.73WRE 100 mg/mL 7.00 a
± 0.67 19.11 c± 0.77 17.66 c
± 0.58 14.83 b± 0.60
Natamycin 0.2 mg/mL 6.33 a± 0.58 11.5 b
± 1.02 6.22 a± 0.39 6.00 a
± 0.00
(*) mean value ± SD of triplicate experiments, n = 3 (the zone of inhibition mm including a disk of 6 mm in diameter).NI = no inhibition.
Table 3. MFC values of WRE and natamycin against the four species.
Species Concentration of WRE (mg/mL) Concentration of Natamycin (mg/mL)
50 40 30 20 10 5 2.5 0.8 0.6 0.4 0.2 0.1 0.05 0.025
Aspergillus flavus NBRC 33021 + + + - - - - + + + - - - -
Aspergillus niger NBRC 4066 + + + + + - - + + + + - - -
Aspergillus clavatus NBRC 33020 + + + + - - - + + + - - - -
Fusarium solani NBRC 31094 + + + - - - - + + + - - - -
(+) No growth, (-) Growth.
3.5. Shelf-Life Study of Sponge Cake in Air-Cooled Condition 20 ◦C
3.5.1. Water Activity
Water activity, unlike water content, can determine shelf stability of foods since the developmentpotential of spoilage-causing microorganisms could be predicted based on the water activity. The wateractivity of a food is also instrumental in maintaining its chemical stability [30]. Therefore, food productscan be safely produced and preserved by lowering water activity to the point that microorganismscannot grow. Figure 9 illustrates water activity measurements (Aw) of sponge cake added with WREand sponge cake added with potassium sorbate with relation to different storage periods at 20 ◦C.Overall, both cake samples exhibited similar water activity ranging from 0.65–0.71 and the trend wasgradually increasing over the examined course.
Processes 2019, 24, x FOR PEER REVIEW 14 of 21
Table 3. MFC values of WRE and natamycin against the four species.
Species Concentration of WRE (mg/mL) Concentration of Natamycin (mg/mL) 50 40 30 20 10 5 2.5 0.8 0.6 0.4 0.2 0.1 0.05 0.025
Aspergillus flavus NBRC 33021 + + + - - - - + + + - - - - Aspergillus niger NBRC 4066 + + + + + - - + + + + - - -
Aspergillus clavatus NBRC 33020 + + + + - - - + + + - - - - Fusarium solani NBRC 31094 + + + - - - - + + + - - - -
(+) No growth, (-) Growth.
3.5. Shelf-Life Study of Sponge Cake in Air-Cooled Condition 20 °C
3.5.1. Water Activity
Water activity, unlike water content, can determine shelf stability of foods since the development potential of spoilage-causing microorganisms could be predicted based on the water activity. The water activity of a food is also instrumental in maintaining its chemical stability [30]. Therefore, food products can be safely produced and preserved by lowering water activity to the point that microorganisms cannot grow. Figure 9 illustrates water activity measurements (Aw) of sponge cake added with WRE and sponge cake added with potassium sorbate with relation to different storage periods at 20 °C. Overall, both cake samples exhibited similar water activity ranging from 0.65–0.71 and the trend was gradually increasing over the examined course.
Figure 9. Water activity at 20 °C after various storage periods.
3.5.2. Sensory Evaluation
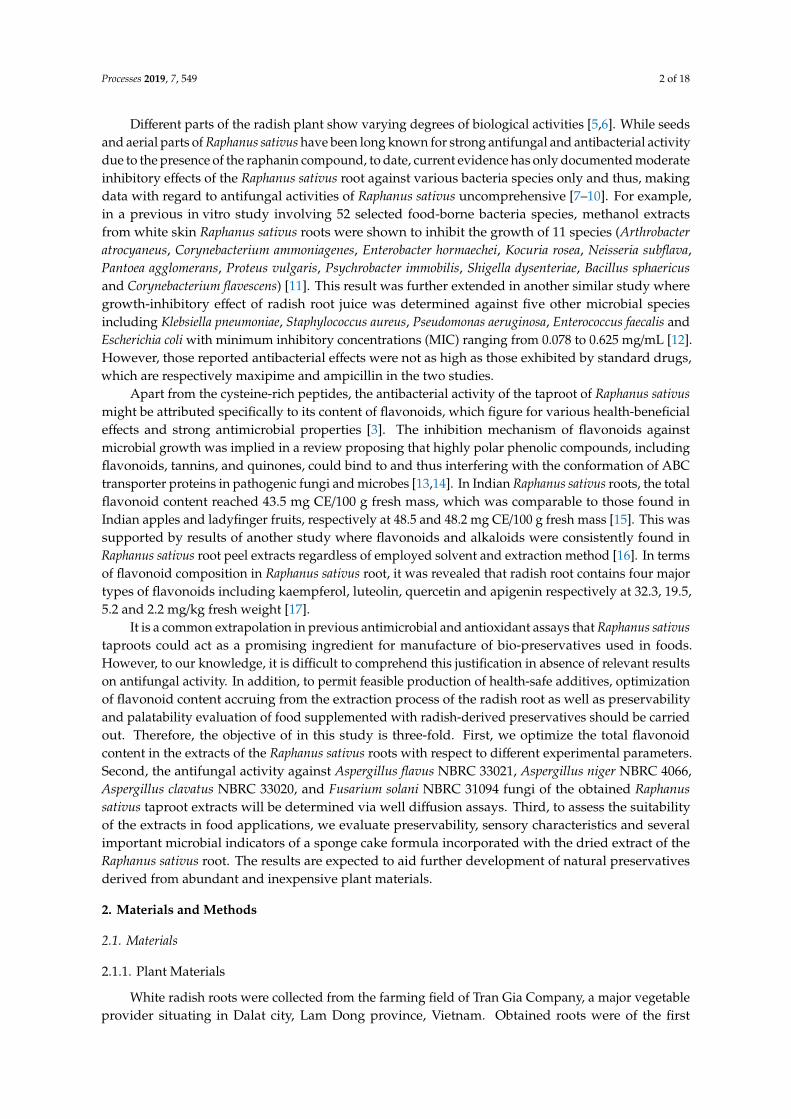
Overall, the sensory evaluation (SE) score of panelists gradually decreased from 6, evaluated with initial cakes, to 3.08, evaluated at cakes after 12 weeks of storage (Figure 10). These figures indicated that the quality of sponge cake added with WRE was acceptable even after 12 weeks of storage under 20 °C.
Figure 9. Water activity at 20 ◦C after various storage periods.
Processes 2019, 7, 549 13 of 18
3.5.2. Sensory Evaluation
Overall, the sensory evaluation (SE) score of panelists gradually decreased from 6, evaluatedwith initial cakes, to 3.08, evaluated at cakes after 12 weeks of storage (Figure 10). These figuresindicated that the quality of sponge cake added with WRE was acceptable even after 12 weeks ofstorage under 20 ◦C.Processes 2019, 24, x FOR PEER REVIEW 15 of 21
Figure 10. Sensory evaluation score in air-cooled condition 20 °C after various storage times.
3.5.3. Texture Analysis
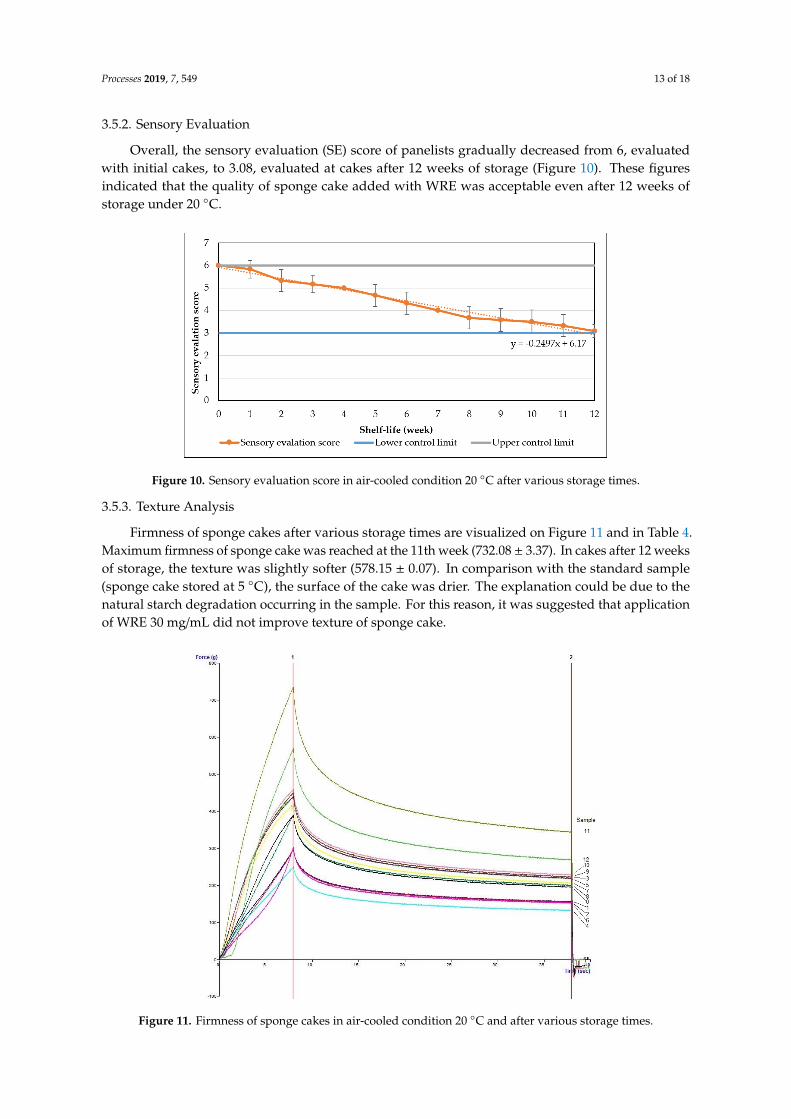
Firmness of sponge cakes after various storage times are visualized on Figure 11 and in Table 4. Maximum firmness of sponge cake was reached at the 11th week (732.08 ± 3.37). In cakes after 12 weeks of storage, the texture was slightly softer (578.15 ± 0.07). In comparison with the standard sample (sponge cake stored at 5 °C), the surface of the cake was drier. The explanation could be due to the natural starch degradation occurring in the sample. For this reason, it was suggested that application of WRE 30 mg/mL did not improve texture of sponge cake.
Table 4. Firmness of sponge cakes in air-cooled condition.
Time (Week) 0 1 2 3 4 5 6 Average
Firmness (F) 370.23a ±
15.03 450.06b ±
30.74 419.96b ±
19.49 355.64a ±
10.80 312.23c ±
19.49 445.19b ±
4.24 295.36c ±
26.79 Time (Week) 7 8 9 10 11 12
Average Firmness (F)
335.39a ± 8.72
394.70a ± 33.42
455.97b ± 19.34
462.47b ± 2.14
732.08d ± 3.37
578.15e ± 0.07
Means with different superscripts in the same column are significantly different at p < 0.05 by Duncan’s multiple range test.
Figure 10. Sensory evaluation score in air-cooled condition 20 ◦C after various storage times.
3.5.3. Texture Analysis
Firmness of sponge cakes after various storage times are visualized on Figure 11 and in Table 4.Maximum firmness of sponge cake was reached at the 11th week (732.08 ± 3.37). In cakes after 12 weeksof storage, the texture was slightly softer (578.15 ± 0.07). In comparison with the standard sample(sponge cake stored at 5 ◦C), the surface of the cake was drier. The explanation could be due to thenatural starch degradation occurring in the sample. For this reason, it was suggested that applicationof WRE 30 mg/mL did not improve texture of sponge cake.
Processes 2019, 24, x FOR PEER REVIEW 16 of 21
Figure 11. Firmness of sponge cakes in air-cooled condition 20 °C and after various storage times.
3.5.4. Microbiological Indication
Sponge cake added WRE was evaluated for various microbiological indicators after various storage periods. The results are presented in the Table 5.
Table 5. Microbiological testing results of sponge cake after storage time.
Microorganisms Unit Permissible Range (*) 4th
Week 8th Week
12nd
Week
12nd
Week (Control)
Method (**)
Bacillus cereus Cfu/g <10 ND ND ND ND AOAC 980.31
Clostridium perfringens Cfu/g <10 ND ND ND ND ISO
7937:2004
Coliforms Cfu/g <10 ND ND ND ND ISO
4832:2006
E. coli Cfu/g 3 ND ND ND ND ISO
16649-2:2001
Staphylococcus aureus Cfu/g <10 ND ND ND ND ISO 6888-
1:2003
Molds and yeasts Cfu/g 102 102 103 2×10³ 10 ISO
21527-2:2008
Total aerobic microbial count Cfu/g 104 104 2×10⁴ 3×10⁴ 102 ISO 4833-
1:1013
(*) In accordance to the decision No.46/2007/QD-BYT of the Ministry of Health, Vietnam on promulgation regulation of maximum level of biological and chemical pollution in food. (**) LOD of method = 10 cfu/g. ND—Not detected. The control was sponge cake that added with potassium sorbate and stored at 20 °C for 11 weeks.
After 8 weeks stored at air-cooled condition 20 °C, the sponge cake added with WRE showed higher total aerobic microbial count, molds and yeasts than the standard requirement. Based on the
Figure 11. Firmness of sponge cakes in air-cooled condition 20 ◦C and after various storage times.

Processes 2019, 7, 549 14 of 18
Table 4. Firmness of sponge cakes in air-cooled condition.
Time (Week) 0 1 2 3 4 5 6
Average Firmness(F)
370.23 a±
15.03450.06 b
±
30.74419.96 b
±
19.49355.64 a
±
10.80312.23 c
±
19.49445.19 b
±
4.24295.36 c
±
26.79
Time (Week) 7 8 9 10 11 12
Average Firmness(F)
335.39 a±
8.72394.70 a
±
33.42455.97 b
±
19.34462.47 b
±
2.14732.08 d
±
3.37578.15 e
±
0.07
Means with different superscripts in the same column are significantly different at p < 0.05 by Duncan’s multiplerange test.
3.5.4. Microbiological Indication
Sponge cake added WRE was evaluated for various microbiological indicators after variousstorage periods. The results are presented in the Table 5.
Table 5. Microbiological testing results of sponge cake after storage time.
Microorganisms Unit PermissibleRange (*)
4thWeek
8thWeek
12ndWeek
12nd Week(Control) Method (**)
Bacillus cereus Cfu/g <10 ND ND ND ND AOAC 980.31Clostridium perfringens Cfu/g <10 ND ND ND ND ISO 7937:2004
Coliforms Cfu/g <10 ND ND ND ND ISO 4832:2006E. coli Cfu/g 3 ND ND ND ND ISO 16649-2:2001
Staphylococcus aureus Cfu/g <10 ND ND ND ND ISO 6888-1:2003Molds and yeasts Cfu/g 102 102 103 2 × 10³ 10 ISO 21527-2:2008
Total aerobicmicrobial count Cfu/g 104 104 2 × 10⁴ 3 × 10⁴ 102 ISO 4833-1:1013
(*) In accordance to the decision No.46/2007/QD-BYT of the Ministry of Health, Vietnam on promulgation regulationof maximum level of biological and chemical pollution in food. (**) LOD of method = 10 cfu/g. ND—Not detected.The control was sponge cake that added with potassium sorbate and stored at 20 ◦C for 11 weeks.
After 8 weeks stored at air-cooled condition 20 ◦C, the sponge cake added with WRE showedhigher total aerobic microbial count, molds and yeasts than the standard requirement. Based on theresults, the storage time of sponge cake added with WRE is approximately 8 weeks at air-cooledcondition of 20 ◦C.
3.6. Shelf-Life Study of Sponge Cake in Accelerated Condition 37 ◦C
3.6.1. Water Activity
Figure 12 shows the range of water activity of sponge cake at different storage periods. Overall,water activity ranged from 0.65 to 0.71, demonstrating that sponge cake added with WRE can inhibitthe activity of most bacteria and yeasts. In this temperature condition, one additional week of storagerises the water activity of the sponge cake by approximately 0.016.
3.6.2. Sensory Evaluation
Under 37 ◦C, it was indicated that the sensory score fell rapidly and approximated the lowercontrol limit of 3.00 for cake samples after 4 weeks of storage (Figure 13). This number is lower incomparison with the previous sensory results where the lower limit was reached at cake samplesstored after 12 weeks. After four weeks, SE score was 3.25 ± 0.45 (>3, lower control limit), suggestingacceptable quality of the cake.

Processes 2019, 7, 549 15 of 18
Processes 2019, 24, x FOR PEER REVIEW 17 of 21
results, the storage time of sponge cake added with WRE is approximately 8 weeks at air-cooled condition of 20 °C.
3.6. Shelf-Life Study of Sponge Cake in Accelerated Condition 37 °C
3.6.1. Water Activity
Figure 12 shows the range of water activity of sponge cake at different storage periods. Overall, water activity ranged from 0.65 to 0.71, demonstrating that sponge cake added with WRE can inhibit the activity of most bacteria and yeasts. In this temperature condition, one additional week of storage rises the water activity of the sponge cake by approximately 0.016.
Figure 12. Water activity of sponge cake in accelerated condition 20 °C after various storage times.
3.6.2. Sensory Evaluation
Under 37 °C, it was indicated that the sensory score fell rapidly and approximated the lower control limit of 3.00 for cake samples after 4 weeks of storage (Figure 13). This number is lower in comparison with the previous sensory results where the lower limit was reached at cake samples stored after 12 weeks. After four weeks, SE score was 3.25 ± 0.45 (>3, lower control limit), suggesting acceptable quality of the cake.
Figure 12. Water activity of sponge cake in accelerated condition 20 ◦C after various storage times.Processes 2019, 24, x FOR PEER REVIEW 18 of 21
Figure 13. Sensory evaluation score in accelerated condition 37 °C.
3.6.3. Texture Analysis
The results for the firmness of sponge cake stored under 37 °C are shown in the Table 6 and Figure 14. The firmness of sponge cake increased rapidly and reached the highest value at the third week (792.53 F) which is equivalent to the values of cakes stored in air-cooled condition after 11 weeks in the previous experiment. The accelerated texture degradation could be partially attribute to the elevated temperature [31].
Table 6. Firmness of sponge cakes in accelerated condition 37 °C.
Time (week) 0 1 2 3 4 Average Firmness (F) 371.89a ± 13.67 578.34b ± 1.73 525.37b ± 1.98 792.53c ± 1.30 667.56d ± 1.05 Means with different superscripts in the same column are significantly different at p < 0.05 by Duncan’s multiple range test.
Figure 14. Firmness of sponge cakes in accelerated condition 37 °C.
Figure 13. Sensory evaluation score in accelerated condition 37 ◦C.
3.6.3. Texture Analysis
The results for the firmness of sponge cake stored under 37 ◦C are shown in the Table 6 andFigure 14. The firmness of sponge cake increased rapidly and reached the highest value at the thirdweek (792.53 F) which is equivalent to the values of cakes stored in air-cooled condition after 11 weeksin the previous experiment. The accelerated texture degradation could be partially attribute to theelevated temperature [31].
Table 6. Firmness of sponge cakes in accelerated condition 37 ◦C.
Time (week) 0 1 2 3 4
Average Firmness (F) 371.89 a± 13.67 578.34 b
± 1.73 525.37 b± 1.98 792.53 c
± 1.30 667.56 d± 1.05
Means with different superscripts in the same column are significantly different at p < 0.05 by Duncan’s multiplerange test.

Processes 2019, 7, 549 16 of 18
Processes 2019, 24, x FOR PEER REVIEW 18 of 21
Figure 13. Sensory evaluation score in accelerated condition 37 °C.
3.6.3. Texture Analysis
The results for the firmness of sponge cake stored under 37 °C are shown in the Table 6 and Figure 14. The firmness of sponge cake increased rapidly and reached the highest value at the third week (792.53 F) which is equivalent to the values of cakes stored in air-cooled condition after 11 weeks in the previous experiment. The accelerated texture degradation could be partially attribute to the elevated temperature [31].
Table 6. Firmness of sponge cakes in accelerated condition 37 °C.
Time (week) 0 1 2 3 4 Average Firmness (F) 371.89a ± 13.67 578.34b ± 1.73 525.37b ± 1.98 792.53c ± 1.30 667.56d ± 1.05 Means with different superscripts in the same column are significantly different at p < 0.05 by Duncan’s multiple range test.
Figure 14. Firmness of sponge cakes in accelerated condition 37 °C.
Figure 14. Firmness of sponge cakes in accelerated condition 37 ◦C.
3.6.4. Microbial Testing
Sponge cake added with WRE and stored in at 37 ◦C was tested for microbial indicators. The resultsare shown in Table 7.
Table 7. Microbial testing results of sponge cake after different storage periods at 37 ◦C.
Microorganisms Unit PermissibleRange (*)
4thWeek
8thWeek
12ndWeek
12nd Week(Control) Method (**)
Bacillus cereus Cfu/g <10 ND ND ND ND AOAC 980.31Clostridium perfringens Cfu/g <10 ND ND ND ND ISO 7937:2004
Coliforms Cfu/g <10 ND ND ND ND ISO 4832:2006E. coli Cfu/g 3 ND ND ND ND ISO 16649-2:2001
Staphylococcus aureus Cfu/g <10 ND ND ND ND ISO 6888-1:2003Molds and yeasts Cfu/g 102 ND 2 × 10³ 104 10 ISO 21527-2:2008
Total aerobicmicrobial count Cfu/g 104 103 3 × 10⁴ 4 × 10⁴ 102 ISO 4833-1:1013
(*) In accordance with decision No.46/2007/QD-BYT of the Ministry of Health, Vietnam on promulgation regulationof maximum level of biological and chemical pollution in food. (**) LOD of method = 10 cfu/g. ND—Not detected.The control was sponge cake that added with potassium sorbate and stored at 37 ◦C for 11 weeks.
After three weeks of storage at 37 ◦C, the WRE-added sponge cake still maintained most ofmicroorganism indicators below the permissible range. However, at the 8th week, sponge cake addedwith WRE exceeded the permissible upper limit in terms of total number of yeasts and molds as wellas the total number of aerobic microorganisms. For comparison, the control cake, which was addedwith potassium sorbate, exhibited excellent anti-microorganism activity with all indicators below thepermissible range even after 11 weeks. Therefore, it is suggested that the WRE could only act as aanti-microorganism agent of moderate activity and sponge cake added with WRE should have theshelf-life of under 4 weeks, most preferably 2 weeks, when stored at 37 ◦C.
4. Conclusions
The study has optimized the total flavonoid content and antioxidant activity of the white radishroot extract with regard to four extraction parameters including concentration of ethanol, ratio ofsolvent/material, temperature and time. Optimized parameters consisted of extraction temperature of50 ◦C, the time of 3 h, ratio of 1:30 and ethanol concentration of 75%. These conditions correspond tothe TFC content of 6.25 ± 0.1 mg/g and TEAC of 28.95 ± 0.43 mg/g. In vitro disk diffusion assay showed

Processes 2019, 7, 549 17 of 18
that WRE could inhibit four fungal species of Aspergillus flavus, Aspergillus niger, Aspergillus clavatus,and Fusarim solani with concentration of 75 mg/mL. For Aspergillus flavus and Fusarim solani, the MIC ofWRE was 30 mg/mL. The figures were 20 and 10 mg/mL for Aspergillus clavatus and Aspergillus niger,respectively. To maintain acceptable physical, sensory and microbial parameters, sponge cakes addedwith WRE are suggested to have the shelf-life of 8 weeks at storage temperature of 20 ◦C or 2 weeksat 37 ◦C. These results suggest the use of white radish as a potential material for manufacture ofnatural preservatives.
Author Contributions: Investigation, H.H.D., P.T.K.N., L.T.H.A. and V.T.T., Supervision, D.T.A.D.; Writing—original draft, H.H.D.; Writing—review & editing, D.C.N.
Funding: This research received no external funding.
Acknowledgments: We are thankful to the researchers from Technology Laboratory of Faculty of ChemicalEngineering, HCMC University of Technology, Vietnam National University, for their support and for providingvaluable advice during this work.
Conflicts of Interest: The authors declare no conflict of interest.
References
1. Figuié, M. Vegetable Consumption Behaviour in Hanoi; CIRAD-AMIS: Hanoi, Vietnam, 2003; p. 25. Availableonline: http://agritrop.cirad.fr/577491/ (accessed on 1 July 2019).
2. Paredes, S.D. Etnobotánica Mexicana: Plantas popularmente empleadas en el Estado de Michocán en eltratamiento de enfermedades hepaticas y vesiculares. UNAM Pedobiol. 1984, 47, 846–856.
3. Gutiérrez, R.M.P.; Perez, R.L. Raphanus sativus (Radish): Their Chemistry and Biology. Sci. World J. 2004, 4,811–837. [CrossRef] [PubMed]
4. Salah-Abbesa, J.B.; Abbesa, S.; Haous, Z.; Oueslati, R. Raphanus Sativus Extract Prevents and AmelioratesZearalenone-Induced Peroxidative Hepatic Damage in Balb/c Mice. J. Pharm. Pharmacol. 2009, 61, 1545–1554.[CrossRef]
5. Beevi, S.S.; Mangamoori, L.N.; Dhand, V.; Ramakrishna, D.S. Isothiocyanate profile and selective antibacterialactivity of root, stem, and leaf extracts derived from Raphanus sativus L. Foodborne Pathog. Dis. 2009, 6,129–136. [CrossRef]
6. Beevi, S.S.; Mangamoori, L.N.; Anabrolu, N. Comparative activity against pathogenic bacteria of the root,stem, and leaf of Raphanus sativus grown in India. World J. Microb. Biot. 2009, 25, 465. [CrossRef]
7. Singh, P.; Singh, J. Medicinal and therapeutic utilities of raphanus sativus. Int. J. Plant Anim. Environ. Sci.2013, 3, 103–105.
8. Rani, I.; Akhund, S.; Abro, H. Antimicrobial potential of seed extract of Raphanus sativus. Pak. J. Bot. 2008,40, 1793–1798.
9. Abdou, I.A.; Abou-Zeid, A.A.; El-Sherbeeny, M.R.; Abou-El-Gheat, Z.H. Antimicrobial activities ofAllium sativum, Allium cepa, Raphanus sativus, Capsicum frutescens, Eruca sativa, Allium kurrat on bacteria.Plant Food Hum. Nutr. 1972, 22, 29–35. [CrossRef]
10. Ivánovics, G.; Horváth, S. Raphanin, an Antibacterial Principle of the Radish (Raphanus sativus). Nature 1947,160, 297–298. [CrossRef] [PubMed]
11. Kaymak, H.C.; Ozturk, S.; Ercisli, S.; Guvenc, I. In Vitro antibacterial activities of black and white radishes(Raphanus Sativus L.). Comptes Rendus de l’Académie Bulgare des Sciences Sciences Mathématiques et Naturelles2015, 68, 201–208.
12. Shukla, S.; Chatterji, S.; Yadav, D.K.; Watal, G. Antimicrobial efficacy of raphanus sativus root juice. Int. J.Pharm. Pharm. Sci. 2011, 3, 89–92.
13. Lourenço, R.M.D.C.; Melo, P.D.S.; Almeida, A.B.A.D. Flavonoids as Antifungal Agents; Antifungal Metabolitesfrom Plants; Springer: Berlin/Heidelberg, Germany, 2013; pp. 283–300.
14. Wink, M.; Ashour, M.L.; El-Readi, M.Z. Secondary metabolites from plants inhibiting ABC transporters andreversing resistance of cancer cells and microbes to cytotoxic and antimicrobial agents. Front. Microbiol. 2012,3, 130–145. [CrossRef]
15. Srivastava, M.P.; Tiwari, R.; Sharma, N. Assessment of phenol and flavonoid content in the plant materials.JNBR 2013, 2, 163–166.

Processes 2019, 7, 549 18 of 18
16. Janjua, S. Phytochemical analysis and in vitro antibacterial activity of root peel extract of Raphanus sativus L.var niger. Adv. Med. Plant Res. 2013, 1, 1–7.
17. Cao, J.; Chen, W.; Zhang, Y.; Zhang, Y.; Zhao, X. Content of Selected Flavonoids in 100 Edible Vegetables andFruits. Food Sci. Technol. Res. 2010, 16, 395–402. [CrossRef]
18. Rodríguez-García, J.; Sahi, S.S.; Hernando, I. Optimizing mixing during the sponge cake manufacturingprocess. Cereal Foods World 2014, 59, 287–292. [CrossRef]
19. Kim, J.K.; Baskar, T.B.; Park, S.U. Total Phenolic and Flavonoid Contents and Antioxidant Activities ofTwo Raphanus sativus L. cultivars (Cherry Belle and Valentine). Biosci. Biotechnol. Res. Asia 2016, 13, 31–36.[CrossRef]
20. Alexandru, V.; Balan, M.; Gaspar, A.; Coroiu, V. Antioxidant activity, phenolics and flavonoid content ofsome selected Romanian medicinal plants. Planta Med. 2007, 73, 261. [CrossRef]
21. Pfaller, M.A.; Haturvedi, V.; Espinel-Ingroff, A.; Ghannoum, M.A.; Gosey, L.L.; Odds, F.C.; Warnock, D.W.Reference Method for Broth Dilution Antifungal Susceptibility Testing of Yeasts; Approved Standard Second EditionServing the World’s Medical Science Community Through Voluntary Consensus; Clinical and LaboratoryStandards Institute: Wayne, PA, USA, 2002; Volume 22.
22. Espinel-Ingroff, A. In Vitro Fungicidal Activities of Voriconazole, Itraconazole, and Amphotericin B againstOpportunistic Moniliaceous and Dematiaceous Fungi. J. Clin. Microbiol. 2001, 39, 954–958. [CrossRef][PubMed]
23. Rogers, L.L. Sensory methods for quality control. In Sensory Analysis for Food and Beverage Quality Control;Kilcast, D., Ed.; Woodhead Publishing Series in Food Science, Technology and Nutrition; WoodheadPublishing: Sawston/Cambridge, UK, 2010; pp. 51–74. ISBN 9781845694760.
24. Sozer, N.; Kokini, J.L.; Bruins, R.; Dietzel, C.; Franke, W.; Trottier, B.; Harrington, S. Quality ImprovementProject for Shelf Stable Bakery Products. The Center for Advanced Food Technology. Available online:https://apps.dtic.mil/dtic/tr/fulltext/u2/a528594.pdf (accessed on 1 July 2019).
25. Brouillard, R.; Dangles, O. Anthocyanin molecular interactions: The first step in the formation of newpigments during wine aging? Food Chem. 1994, 51, 365–371. [CrossRef]
26. Cacace, J.E.; Mazza, G. Mass transfer process during extraction of phenolic compounds from milled berries.J. Food Eng. 2003, 59, 379–389. [CrossRef]
27. Hamdan, S.; Daood, H.G.; Toth-Markus, M.; Illés, V. Extraction of cardamom oil by supercritical carbondioxide and sub-critical propane. J. Supercrit. Fluids 2008, 44, 25–30. [CrossRef]
28. Fick, A. Ueber Diffusion. Ann. Der Phys. 1855, 170, 59–86. [CrossRef]29. Salvosa, F.A.M.; Cubillan, L.P.; Nievera, L.F. In Vitro evaluation of natamycin 5% suspension against
Aspergillus flavus, Fusarium solani, and Candida parasilopsis. Philipp. J. Ophthalmol. 2004, 29, 26–28.30. Sandulachi, E. Water Activity Concept and its Role in Food Preservation. Available online: http://81.180.74.
21/handle/5014/780 (accessed on 1 July 2019).31. Jahan, M.G.S.; Pervin, M.S.; Rana, A.M.; Shovon, M.S.; Sharma, S.C.D.; Karim, M.R.; Rahman, M.H.
Correlation between β-amylase activity and starch content in different cultivars of radish (Raphanus sativusL.). Bio Technol. Indian J. 2014, 9, 298–302.
© 2019 by the authors. Licensee MDPI, Basel, Switzerland. This article is an open accessarticle distributed under the terms and conditions of the Creative Commons Attribution(CC BY) license (http://creativecommons.org/licenses/by/4.0/).