The Genome Sequence of the North-European Cucumber (Cucumis sativus L.) Unravels Evolutionary...
19
The Genome Sequence of the North-European Cucumber (Cucumis sativus L.) Unravels Evolutionary Adaptation Mechanisms in Plants Rafal Wo ´ ycicki 1 *, Justyna Witkowicz 1 , Piotr Gawron ´ ski 1 , Joanna Da ˛ browska 1 , Alexandre Lomsadze 2 , Magdalena Pawelkowicz 1 , Ewa Siedlecka 1 , Kohei Yagi 1 , Wojciech Pla ˛ der 1 , Anna Seroczyn ´ ska 1 , Mieczyslaw S ´ miech 1 , Wojciech Gutman 1 , Katarzyna Niemirowicz-Szczytt 1 , Grzegorz Bartoszewski 1 , Norikazu Tagashira 3 , Yoshikazu Hoshi 4 , Mark Borodovsky 2 , Stanislaw Karpin ´ ski 1 *, Stefan Malepszy 1 , Zbigniew Przybecki 1 * 1 Department of Plant Genetics, Breeding and Biotechnology, Faculty of Horticulture and Landscape Architecture, Warsaw University of Life Sciences - SGGW, Nowoursynowska, Warsaw, Poland, 2 Center for Bioinformatics and Computational Genomics, Joint Wallace H. Coulter Georgia Tech and Emory Department of Biomedical Engineering, School of Computational Science and Engineering, Georgia Institute of Technology, Atlanta, Georgia, United States of America, 3 Department of Living Design and Information Science, Faculty of Human Development, Hiroshima Jogakuin University, Higashi-ku, Japan, 4 Department of Plant Science, Tokai University, Minamiaso-mura, Kumamoto, Japan Abstract Cucumber (Cucumis sativus L.), a widely cultivated crop, has originated from Eastern Himalayas and secondary domestication regions includes highly divergent climate conditions e.g. temperate and subtropical. We wanted to uncover adaptive genome differences between the cucumber cultivars and what sort of evolutionary molecular mechanisms regulate genetic adaptation of plants to different ecosystems and organism biodiversity. Here we present the draft genome sequence of the Cucumis sativus genome of the North-European Borszczagowski cultivar (line B10) and comparative genomics studies with the known genomes of: C. sativus (Chinese cultivar – Chinese Long (line 9930)), Arabidopsis thaliana, Populus trichocarpa and Oryza sativa. Cucumber genomes show extensive chromosomal rearrangements, distinct differences in quantity of the particular genes (e.g. involved in photosynthesis, respiration, sugar metabolism, chlorophyll degradation, regulation of gene expression, photooxidative stress tolerance, higher non-optimal temperatures tolerance and ammonium ion assimilation) as well as in distributions of abscisic acid-, dehydration- and ethylene-responsive cis- regulatory elements (CREs) in promoters of orthologous group of genes, which lead to the specific adaptation features. Abscisic acid treatment of non-acclimated Arabidopsis and C. sativus seedlings induced moderate freezing tolerance in Arabidopsis but not in C. sativus. This experiment together with analysis of abscisic acid-specific CRE distributions give a clue why C. sativus is much more susceptible to moderate freezing stresses than A. thaliana. Comparative analysis of all the five genomes showed that, each species and/or cultivars has a specific profile of CRE content in promoters of orthologous genes. Our results constitute the substantial and original resource for the basic and applied research on environmental adaptations of plants, which could facilitate creation of new crops with improved growth and yield in divergent conditions. Citation: Wo ´ ycicki R, Witkowicz J, Gawron ´ ski P, Da ˛browska J, Lomsadze A, et al. (2011) The Genome Sequence of the North-European Cucumber (Cucumis sativus L.) Unravels Evolutionary Adaptation Mechanisms in Plants. PLoS ONE 6(7): e22728. doi:10.1371/journal.pone.0022728 Editor: Miguel A. Blazquez, Instituto de Biologı ´a Molecular y Celular de Plantas, Spain Received November 18, 2010; Accepted July 5, 2011; Published July 28, 2011 Copyright: ß 2011 Wo ´ ycicki et al. This is an open-access article distributed under the terms of the Creative Commons Attribution License, which permits unrestricted use, distribution, and reproduction in any medium, provided the original author and source are credited. Funding: This work has been funded by grants from the Polish Ministry of Science and Higher Education: PZB-MNiSW-2/3/2006/36 (representing part of grant PZB-MNiSW-2/3/2006), NN302429734, NN302363333, Welcome 2008/1 - a project operated within the Foundation for Polish Science Welcome Program and co- financed by the European Regional Development Fund, and U.S. National Institutes of Health grant GM47853. The funders had no role in study design, data collection and analysis, decision to publish, or preparation of the manuscript. Competing Interests: The authors have declared that no competing interests exist. * E-mail: [email protected] (ZP); [email protected] (SK); [email protected] (RW) Introduction The cultivated cucumber (Cucumis sativus L.), an important species for the global food market (http://faostat.fao.org), represents a model organism for investigations of organellar genetics [1–3], flower sex determination [4], mechanisms of somatic embryogenesis [5–7] epigenetics of various stresses in tissue culture [8,9] and various aspects of chloroplast gene regulation (e.g. editing, tilling macroarray) [10,11]. Genetic and cultivation research of that species is conducted by many international groups including the International Cucurbit Geno- mics Initiative (ICuGI) – (http://www.icugi.org/cgi-bin/ICuGI/ misc/project.cgi); and the USDA-ARS at the University of Wisconsin, Madison. Cucumber is cultivated in habitats ranging from the Northern regions of the temperate climate zone to the tropics. Spatial isolation and the need to adapt to diverse environmental conditions have induced a requirement for various adaptation mechanisms based upon polymorphisms within the 367 Mbp cucumber genome [12]. These factors have inspired us to undertake the de novo sequencing of genome of the Northern European cucumber. While this work was in progress the genomic sequence of the Chinese Long cultivar of cucumber which is PLoS ONE | www.plosone.org 1 July 2011 | Volume 6 | Issue 7 | e22728
-
Upload
independent -
Category
Documents
-
view
0 -
download
0
Transcript of The Genome Sequence of the North-European Cucumber (Cucumis sativus L.) Unravels Evolutionary...

The Genome Sequence of the North-European Cucumber(Cucumis sativus L.) Unravels Evolutionary AdaptationMechanisms in PlantsRafał Woycicki1*, Justyna Witkowicz1, Piotr Gawronski1, Joanna Dabrowska1, Alexandre Lomsadze2,
Magdalena Pawełkowicz1, Ewa Siedlecka1, Kohei Yagi1, Wojciech Plader1, Anna Seroczynska1,
Mieczysław Smiech1, Wojciech Gutman1, Katarzyna Niemirowicz-Szczytt1, Grzegorz Bartoszewski1,
Norikazu Tagashira3, Yoshikazu Hoshi4, Mark Borodovsky2, Stanisław Karpinski1*, Stefan Malepszy1,
Zbigniew Przybecki1*
1 Department of Plant Genetics, Breeding and Biotechnology, Faculty of Horticulture and Landscape Architecture, Warsaw University of Life Sciences - SGGW,
Nowoursynowska, Warsaw, Poland, 2 Center for Bioinformatics and Computational Genomics, Joint Wallace H. Coulter Georgia Tech and Emory Department of Biomedical
Engineering, School of Computational Science and Engineering, Georgia Institute of Technology, Atlanta, Georgia, United States of America, 3 Department of Living
Design and Information Science, Faculty of Human Development, Hiroshima Jogakuin University, Higashi-ku, Japan, 4 Department of Plant Science, Tokai University,
Minamiaso-mura, Kumamoto, Japan
Abstract
Cucumber (Cucumis sativus L.), a widely cultivated crop, has originated from Eastern Himalayas and secondarydomestication regions includes highly divergent climate conditions e.g. temperate and subtropical. We wanted to uncoveradaptive genome differences between the cucumber cultivars and what sort of evolutionary molecular mechanismsregulate genetic adaptation of plants to different ecosystems and organism biodiversity. Here we present the draft genomesequence of the Cucumis sativus genome of the North-European Borszczagowski cultivar (line B10) and comparativegenomics studies with the known genomes of: C. sativus (Chinese cultivar – Chinese Long (line 9930)), Arabidopsis thaliana,Populus trichocarpa and Oryza sativa. Cucumber genomes show extensive chromosomal rearrangements, distinctdifferences in quantity of the particular genes (e.g. involved in photosynthesis, respiration, sugar metabolism, chlorophylldegradation, regulation of gene expression, photooxidative stress tolerance, higher non-optimal temperatures toleranceand ammonium ion assimilation) as well as in distributions of abscisic acid-, dehydration- and ethylene-responsive cis-regulatory elements (CREs) in promoters of orthologous group of genes, which lead to the specific adaptation features.Abscisic acid treatment of non-acclimated Arabidopsis and C. sativus seedlings induced moderate freezing tolerance inArabidopsis but not in C. sativus. This experiment together with analysis of abscisic acid-specific CRE distributions give a cluewhy C. sativus is much more susceptible to moderate freezing stresses than A. thaliana. Comparative analysis of all the fivegenomes showed that, each species and/or cultivars has a specific profile of CRE content in promoters of orthologousgenes. Our results constitute the substantial and original resource for the basic and applied research on environmentaladaptations of plants, which could facilitate creation of new crops with improved growth and yield in divergent conditions.
Citation: Woycicki R, Witkowicz J, Gawronski P, Dabrowska J, Lomsadze A, et al. (2011) The Genome Sequence of the North-European Cucumber (Cucumis sativusL.) Unravels Evolutionary Adaptation Mechanisms in Plants. PLoS ONE 6(7): e22728. doi:10.1371/journal.pone.0022728
Editor: Miguel A. Blazquez, Instituto de Biologıa Molecular y Celular de Plantas, Spain
Received November 18, 2010; Accepted July 5, 2011; Published July 28, 2011
Copyright: � 2011 Woycicki et al. This is an open-access article distributed under the terms of the Creative Commons Attribution License, which permitsunrestricted use, distribution, and reproduction in any medium, provided the original author and source are credited.
Funding: This work has been funded by grants from the Polish Ministry of Science and Higher Education: PZB-MNiSW-2/3/2006/36 (representing part of grantPZB-MNiSW-2/3/2006), NN302429734, NN302363333, Welcome 2008/1 - a project operated within the Foundation for Polish Science Welcome Program and co-financed by the European Regional Development Fund, and U.S. National Institutes of Health grant GM47853. The funders had no role in study design, datacollection and analysis, decision to publish, or preparation of the manuscript.
Competing Interests: The authors have declared that no competing interests exist.
* E-mail: [email protected] (ZP); [email protected] (SK); [email protected] (RW)
Introduction
The cultivated cucumber (Cucumis sativus L.), an important
species for the global food market (http://faostat.fao.org),
represents a model organism for investigations of organellar
genetics [1–3], flower sex determination [4], mechanisms of
somatic embryogenesis [5–7] epigenetics of various stresses in
tissue culture [8,9] and various aspects of chloroplast gene
regulation (e.g. editing, tilling macroarray) [10,11]. Genetic and
cultivation research of that species is conducted by many
international groups including the International Cucurbit Geno-
mics Initiative (ICuGI) – (http://www.icugi.org/cgi-bin/ICuGI/
misc/project.cgi); and the USDA-ARS at the University of
Wisconsin, Madison. Cucumber is cultivated in habitats ranging
from the Northern regions of the temperate climate zone to the
tropics. Spatial isolation and the need to adapt to diverse
environmental conditions have induced a requirement for various
adaptation mechanisms based upon polymorphisms within the
367 Mbp cucumber genome [12]. These factors have inspired us
to undertake the de novo sequencing of genome of the Northern
European cucumber. While this work was in progress the genomic
sequence of the Chinese Long cultivar of cucumber which is
PLoS ONE | www.plosone.org 1 July 2011 | Volume 6 | Issue 7 | e22728

known as line 9930 became available [13]. This has made original
comparative studies between the two cultivars possible.
The evolution of organisms is driven by their need to reproduce
as efficiently as possible in a given habituate. The optimization of
that Darwinian fitness is known to include mechanisms of, for
example, point mutations and chromosomal rearrangements
leading to changes in gene quality and quantity as well as cis-
regulatory element shuffling, which facilitate formation of new
species and varieties. The speed of evolution is dependent on the
stringency of abiotic and biotic stresses and on the organism ability
to respond to the given stringency. Highly divergent environmen-
tal conditions of species domestication, which are different from its
place of origin, speed up this process. It is known that, abiotic
stresses caused by starvation, high or low temperatures, UV
radiation or treatment with hydrogen peroxide cause chromo-
somal rearrangements in the form of translocations, deletions,
inversions, amplifications and chromosome fusions, as well as
aneuploidy. These chromosomal rearrangements are stabilized
over the generations and through changes in gene content lead to
acquisition of resistance, as it was shown in e.g. yeast and plants
[14–20]. Changes in regulation of gene expression due to
regulatory networks rewiring could constitute other and faster
mechanism of adaptations. Plants and animals have homologous
and analogous regulatory mechanisms of stress responses, which
include the selective activation/deactivation of appropriate trans-
regulatory factors (TRFs) that specifically interact with cis-
regulatory elements (CREs), in order to induce or suppress gene
expression. This leads to the establishment of a new optimal
adaptation status [21–24].
CREs are short DNA sequences generally composed of several
nucleotides in the promoter region of a gene, for which TRFs have
specific affinity. CREs and TRFs provide the molecular basis for
transcriptional regulation both in plants and in animals. Induction
or suppression of genes expression may depend upon the presence
of single CRE or combinations of CREs as well as the orientation
of CREs with respect to the gene [25,26]. The best characterized
CREs in plants include abscisic acid responsive element (ABRE
(sequence – ACGTGTC)) which, as implied by its name, is linked
to the response to abscisic acid (ABA), dehydration responsive
element (DRE (also known as CRT), sequence - A/GCCGAC), an
element induced by drought, salinity and frost, and ethylene
responsive element (ERE (also known as GCC-box), sequence –
AGCCGCC), an element linked to the response to ethylene.
Abscisic acid is a hormone which plays an important role in the
integrated response of plants to stresses caused by drought, cold,
excessive light, pathogen attack and salinity [27,28]. Ethylene
plays an important role in regulation of many aspects of plant life
including flowering, fruit ripening, root hypoxia responses, and
other programmed cell death-dependent processes [21,29].
Here we present the draft genome sequence of northern
European cucumber cultivar Borszczagowski line B10 assembled
by a hybrid method, structural and functional annotations and its
comparisons with the highly divergent [30] Asian cucumber
cultivar Chinese Long line 9930 [13] and the genomes of three
other species (Arabidopsis thaliana, Populus trichocarpa, Oryza sativa).
Shotgun sequencing was performed using the 454 Titanium
technique at 126 genome coverage (86 genome coverage with
single reads and 46 genome coverage with paired reads (3 Kbp
insert size fragments). Additionally, the ends of inserts of a
genomic BAC library were sequenced using the Sanger method.
We analyzed SNP/INDEL polymorphism, genome rearrange-
ments, compared functional groups of genes between the two
cucumbers and also performed comparative analysis of the above
CREs content for all the above five species.
Presented here comparative genomic studies of five plant
genomes provide a strong support for the previous suggestions
[31,32] that optimization of the Darwinian fitness of a given
species or variety is determined by the evolution of the content of
the genome (expressed as changes in number and quality of genes)
and mutations in some CRE. However, our results suggests that
species- or even cultivar-specific evolution of ABRE, DRE and
ERE regulons, due to extensive CRE shuffling is faster than the
evolution of the gene introns and exons. Such comparative
genomic studies that also include CRE content analysis in groups
of orthologous gene promoters supported by experiments will help
in finding of new biotechnological solutions for a specific
improvement of crops performance.
Results
Sequencing of the cucumber genomeBacterial artificial chromosome (BAC) library. The
number of clones of long genomic cucumber fragments derived
from two libraries (MboI/BamHI and HindIII) was 33,792. The
average length of the library inserts was 130 Kbp and the coverage
of the genome with library BAC clones was 11.976.
The basic characteristics of the BAC genomic library of line
B10, such as average insert length and genome coverage, are
comparable with the upper values of libraries previously described
for plant species with similar genome sizes [33–36]. Three other
cucumber BAC libraries contained shorter inserts with an average
length of 105 Kbp in line S94 [37], 107 Kbp and 100.8 Kbp in
the Suiseifushinari 2-go variety [38] and also had lower (2–2.5
fold) coverage of the genome and a smaller number of clones
(10,000 to 15,000).
BAC end sequences (BESs). Among the 33,792 inserts of
the BAC library obtained after sequencing with the Sanger
method, 66,776 sequences of clone ends were obtained (98.80% of
the number of ends) (Table S1). Analysis of these sequences
indicated the presence of 64,610 (96.76%) good quality fragments,
without foreign DNA contamination. The percentage of
chloroplast and mitochondrial genome sequences was 3.24%,
and 0.46%, respectively. The remaining 62,217 (93.17%) ends of
library clones were defined as sequences of nuclear origin
(accession numbers: FI132140–FI136208, GS765762–GS766880,
GS815969–GS874855). The average read length was 737 bp, and
the total number of nucleotides in sequences of nuclear BESs was
45,853,929 bp, which corresponds to 12.49% of the genome. The
average distance between sequences of BAC ends, which
constitute unique genomic markers, was found to be 5500 bp.
The participation of the obtained BAC end sequences and
specifically of the paired ones was greater than 90% in each case
and respectively 11% and 8% greater than the percentages
described in previous publications [39,40]. The number of
organelle sequences present in the BESs was found to be similar
to the numbers of sequences described in previous reports [41–43].
Two different libraries of the cucumber variety Suiseifushinari 2-
go [38] contained 0.47% chloroplast sequences in BamHI clones
and 0.26% chloroplast sequences in EcoRI clones. These libraries
also had 0.40% mitochondrial sequences in BamHI clones and
0.20% mitochondrial sequences in EcoRI clones.
Sequence reads after pyrosequencing. The total number
of fragments after paired (PA) and unpaired (UN) library ends
sequencing was over 15 million with a total length of almost 4.5
billion bp. This represents 126 coverage of the genome. Purified
sequences had an average length of 290 bp. The longest sequences
(374 bp) were from the library of unpaired fragments and the
shortest sequences (171 bp) were from the library of paired ends.
Comparative Genomics of Five Plant Genomes
PLoS ONE | www.plosone.org 2 July 2011 | Volume 6 | Issue 7 | e22728

Lengths and statistics of reads after pyrosequencing are presented
in Figures S1A and S1B and Table S2. The reads obtained after
sequencing the library of paired fragments were divided into
sequences which were treated as: (a) unpaired because of: the
absence of a linker, the occurrence of only a part of it, or the
presence of many linker sequences, as well as (b) paired reads
which gave the lowest coverage (1.506).
The coverage generated by sequence reads was the lowest of
those used so far in de novo sequencing of higher organisms using
next generation sequencing technologies [44–46], but similar to
156 coverage recommended for as the minimal by 454 Life
Sciences (Bradford, CT, USA) (http://454.com/downloads/
DeNovoComplexGenomes_Flyer.pdf). A similar or lower cover-
age has only been used in sequencing of transcriptomes [47,48],
selected BAC clones [49,50] and when using pyrosequencing as a
supplement in capillary sequencing [51]. The average lengths of
unpaired reads were close to those obtained during sequencing of
the rice genome [49]. In turn, the paired Titanium reads were
approximately two times longer than those described for GS FLX
paired end libraries [45,52]. The share of paired fragments was
similar to the share described in the earlier reports [45].
Genome assembly. The results of both versions of genome
assembly are presented in Table 1 and Table S3. In Table S4, the
characteristics are given for utilization of sequence reads by the
indicated programs. The results obtained during assembly of the
genome according to version A (Celera) and version B (Celera and
Arachne) in obtaining the first version of the line B10 genome are
described in more detail below:
N Version A – assembling the 86 UN and 46 PA reads with
sequences of BAC ends using the Celera 5.4 program
The assembled pyrosequenced and BES reads provided 15,667
contigs with a combined length of 197 Mbp, average length of
12,972 bp and N50 of 27,086 bp. The number of supercontigs was
4,173 with a total coverage of 224 Mbp, average length 54,070 bp
and N50 2,324,038 bp. Another result of the genome assembly was
the identification of contigs of repetitive sequences. These
degenerate contigs contain partly assembled repetitive sequences,
which could not be uniquely assigned by the Celera program to the
remaining sequences. There were 148,607 degenerate contigs with
a joint length of over 72 Mbp and average size of 490 bp. In
average they were made in 60% of the repetitive sequences.
N Version B stage 1 – Celera – assembling the 86UN and 46PA reads after 454 Titanium sequencing using the Celera 5.4
program
The result of the assembly of the reads after pyrosequencing was
15,514 contigs of 195.6 Mbp, with an average length of
12,839 bp, and N50 of 24,714 bp. The number of supercontigs
was 4,976 with a total coverage of 197.6 Mbp, average length of
39,799 bp, and N50 of 158,310 bp. The number of degenerate
contigs was 160,714 with an average length of 476 bp, jointly
encompassing 76.5 Mbp from which, in average, over 61% were
recognized as repetitive sequences.
N Version B stage 2 – Arachne – hybrid assembly of results from
stage 1 with sequences of BAC ends and 1,781 additional
cucumber sequences (see: Material & Methods) using the
Arachne program.
As a result of hybrid assembly,16,547 contigs were obtained
with a total length of 193.2 Mbp, an average of 12,214 bp and an
N50 equal to 23,280 bp. The number of supercontigs was 13,129
with a total length of 323 Mbp, average coverage of 25,865 bp
and N50 of 323,092 bp.
The sequence of the genome of the Borszczagowski cultivar (line
B10) with the characteristics given in the second row of Table 1
(Celera+Arachne, version B step 2) was deposited in GenBank
under No. ACYN01000000 on September 21, 2009. It is also
available, together with additional data (i.e. gene predictions,
proteins, functional annotation) under the web address http://
csgenome.sggw.pl of the Polish Consortium of Cucumber Genome
Sequencing.
For genome assembly, a hybrid method was selected which is
often used for combining fragments generated by the classical
Sanger technique and by next generation sequencing technologies
[50,53]. The detailed characteristics of reads used in genome
assembly are provided in, Tables S1 and S2 and Figures S1 A, B.
The sequence unique contigs of B10 line genome assembled in
each version (A (Celera) 197,5 Mbp and B (Celera/Arachne)
193 Mbp), is similar (Table S3) to both the result of the Chinese
9930 line assembly (185 Mbp) [13] and American Gy14 line
(200 Mbp) (Miller et al. Shotgun Assembly of a Repetitive Plant
Genome. Sequencing, Finishing & Analysis in the Future. Meeting
27th–29th May 2009 Santa Fe, NM, USA 14 (2009)) [54]. In the
work of Huang et al., 2009 [13], the assembly was done using the
SOAPdenovo software from mostly Illumina reads (68,36coverage) together with ‘‘Sanger’’ generated genomic library end
sequences (3,96 coverage). The American Gy14 line genome was
assembled from 454 Titanium pyrosequenced reads: unpaired
(246 coverage) and paired (126 coverage) (3 Kbp and 20 Kbp)
using the Celera (Miller et al. Shotgun Assembly of a Repetitive
Plant Genome. Sequencing, Finishing & Analysis in the Future.
Meeting 27th–29th May 2009 Santa Fe, NM, USA 14
(2009); http://sourceforge.net/apps/mediawiki/wgs-assembler/
index.php?title=Cucumber_Poster) and the Newbler software
[54] (http://www.phytozome.net/cucumber.php). As seen in
Table S3, the assembly of the B10 line genome using the Celera
Table 1. Cucumber genome assembly statistics.
Assembly versionNumber ofcontigs
Averagecontiglength (bp)
ContigN50a (bp)
Total contigslength (Mbp)
Number ofscaffolds
Averagescaffoldlength (bp)
ScaffoldN50a (bp)
Total scaffoldlength (Mbp)
454+Sanger –Celera (version A)
15,667 12,972 27,086 197 4,173 54,070 2,324,038 224
454+Sanger –Celera/Arachne(version B step 2)
16,547 12,214 23,280 193 13,129 25,865 323,092 323
aN50 refers to the size above which half of the total length of the sequence set can be found.doi:10.1371/journal.pone.0022728.t001
Comparative Genomics of Five Plant Genomes
PLoS ONE | www.plosone.org 3 July 2011 | Volume 6 | Issue 7 | e22728

Assembler alone with the Titanium reads and BESs (version A),
only slightly increased the coverage of supercontigs with respect to
that obtained using solely pyrosequenced reads (version B step 1).
The coverage was increased by 27 Mbp (224 Mbp obtained for
the combination of reads vs. 198 Mbp using second generation
reads alone). This may be due to the fact that the Celera assembler
mapped only 66.54% of BAC ends on the sequence contigs (Table
S4) and assigned the rest to ‘‘degenerate’’ repetitive sequences.
The percentage of BESs contained in contigs made by the
Arachne program (version B step 2) were 82.04%, from which
81.12% were placed on contigs resulted from next generation
reads assembly alone (version B step 1). Comparison of both final
assembly versions (A – Celera and B – Celera/Arachne), presented
in Table 1, indicated that 190 Mbp of sequence showed a
similarity $98% between assembled versions of the genome,
whereas the share of sequences distinguishing them was 10 Mbp
(5.12%). The difference is caused mainly by diverse repetitive
sequences recognizing algorithms implemented in both assemblers
[52,55]. Those dissimilar number of used BESs together with the
specific algorithms, could also be the reason of: a) differences in
unique assembled contigs size (Celera: 197,5 Mbp vs. Celera/
Arachne: 193 Mbp), b) the mentioned 10 Mbp of sequences
dissimilar between both assemblies versions, c) significant
differences of genome size in supercontigs (Celera: 224 Mbp vs.
Celera/Arachne: 322 Mbp).
Significantly diverse supercontigs’ total length resulted mainly
from differences of scafolded and nonscafolded contigs length as
well as in length of supercontigs’ gaps. Total length of real
supercontigs (consisting of at least 2 contigs) in each assembly
version is similar (Celera: 218 Mbp vs. Celera/Arachne:
228 Mbp), but Celera scaffolds have about 4.5-times less gaps
(12%) and about 2-times more genomic sequences (88%). The
Celera real supercontigs contain 97% of total contigs length while
supercontigs after Celera/Arachne only 52%. Cross mapping of
the chromosome anchored sequences of B (Celera/Arachne) and
A (Celera) genomic sequences, demonstrated that about 79% of
Celera/Arachne single scaffolds (containing only one contig) (ca.
73 Mbp), were located in gaps of its own real supercontigs (not
shown). The above mentioned information suggest that the
Celera/Arachne scafolded genome size, should probably sum up
to 247 Mbp. It become clear that, in compare to the Arachne,
Celera assembler made more compressed assembly by finding
more connections between contigs, which resulted in less and
longer supercontigs.
In order to assemble the sequences more precisely it appears
necessary to first combine the results of the two assembled versions
by creating a so-called ‘‘reconciliation assembly’’ [56]. Of the two
versions we have chosen the Celera/Arachne assembly (version B
step 2) to provide the basic outline of the genome because of the
larger (by about 15%) number of BAC ends mapped on sequence
contigs (Table S4). Because of containing 2-times longer super-
contigs, build (in average) from 2-times more contigs, the genome
sequence of version A (Celera) was used to anchor more Arachne
contigs (version B) (163 Mbp vs. 80 Mbp) to seven cucumber
chromosomes. The proper assembly of the cucumber line B10
genome was confirmed by the assignment of 96.56% of 63035
purified Unigene ESTs (International Cucurbit Genomics Initia-
tive (ICuGI), http://www.icugi.org/cgi-bin/ICuGI/EST/home.
cgi?organism=cucumber) and of 6 cucumber genomic sequence
clones (BAC/Fosmid) of 372,277 bp with an average similarity of
98%. These values are comparable to those given for the assembly
of the genome of line 9930. The genome coverage values do not
differ from those reported for other species [57,58]. Mapping of
reads after pyrosequencing on assembled sequence contigs
indicated that their average coverage is 14.206, of which over
98% of the genome sequence length has a coverage of over 36,
and 95% is greater than 56 (Fig. S2). The resulted assembled
genome coverage is sufficient to correctly recognize SNP and In/
Del polymorphism [50,57,59–61].
It is worth to note, that despite the use of all ranges of paired
end libraries (2 Kbp–10 Kbp, 20 Kbp, 40 Kbp, 140 Kbp) in each
of mentioned three cucumber genome projects (B10, 9930 and
Gy14), the resulted scaffolds total lengths (Table S3) were only
about 200 Mbp, what states for 54% of the flow cytometry
estimated cucumber genome size of 367 Mbp [12]. The only
aberrance is the Celera/Arachne B10 line assembly supercontigs
length (322 Mbp – 88%), though, like it was concluded, it should
probably sum up to 247 Mbp (67%). The assembled genome
length of the other species’ recently published sequencing projects
using next generation sequencing (NGS) reads, were close to the
flow cytometry’s estimated genome sizes i.e. 95% wild strawberry
(454, Illumina, Solid) [62], 76% cocoa (454, Illumina) [63], 85%
turkey (454, Illumina) [64]. We suppose, that the reasons why the
draft cucumber nuclear genome sequences, in all the three
mentioned world-wide projects (Polish, Chinese, American), sum
up to only ca. 200 Mbp, could be: a) specific distribution of
repeated sequences and/or b) underrepresentation of genome in
sequencing reads. Though the underrepresentation of genome
sequence reads from both capillary and second generation
sequencing technologies is well known [65], any confirmation of
the proposed specific repeat content distribution would need
additional in-deep studies. A this moment, we believe that the use
of the long direct 3rd sequencing technologies’ reads as well as
sequencing of ends coming from very long (about 40 Kbp) paired
end libraries (needed to jump through the long rRNA stretches
[66]) could facilitate the ongoing work to the finished cucumber
genome sequence.
Characterization of the genome on the basis of BESs and
assembled contigs sequences. The preliminary characterization
of the genome performed on BESs and genome contigs gave three
values: the percentage content of GC pairs (36.60%), the occurrence of
microsatellite repeats and plant repetitive elements.
The participation of the total length of microsatellite sequences
(Table S5) was found to be 0.73% in BESs and 0.94% in contigs.
Though for the comparison proposes the Table S5 contains
different measurements, like microsatellites’ length, count, density
and mean repeat number, to be the most objective we will report
here on % of relative length of SSRs. The most abundant SSRs in
BESs were single nucleotide repeats (25.91%), dinucleo-
tides(20.15%), tertanucleotides (19.28%) and trinucleotide repeats
(18.62%). The penta- to octa-nucleotide repeats constituted
16.04% of all SSRs. Contigs contained mostly, dinucleotides
(24.97%), tetranucleotides (23.36%) and trinucleotides (22.15%).
The penta- to octa-nucleotide repeats constituted 19.69% of all
SSRs.
When comparing the B10 line genome assembly contigs’
microsatellite content and distribution (count, density and mean
repeat length (Table S5)) with the previous report by Cavagnaro et
al. [54] done on Gy14 cucumber line genome, the results are
almost identical. The slight difference in reporting content of di- to
tetranucleotides is because of the analysis of mononucleotides in
our results. When the mononucleotides were not taken into
account the results were practically identical (not shown). The
content of plant repetitive elements (Table S6) was evaluated as
48.13% in BESs and 17.82% in contigs. 23.42% of BESs repeats
were similar to previously classified plant sequences whereas
23.81% were specific for cucumber (mainly satellite DNA type I,
II, III, IV) [67]. Known versus specific repeat portions in contigs
Comparative Genomics of Five Plant Genomes
PLoS ONE | www.plosone.org 4 July 2011 | Volume 6 | Issue 7 | e22728

were 7.73% and 10.09%, respectively. The most abundant group
of known repetitive sequences were mobile elements (9.70% in
BESs and 6.35% in contigs), ribosomal RNA genes (8.96% and
0.20%), retrotransposons (8.65% in BESs) and small RNA
sequences (4.63% and 0.11%).
The comparison of microsatellite content between BESs and
contigs’ sequences indicates more than 2.5-fold lower participation
of mononucleotide repeats in contigs, whereas the share of other
multinucleotide repeats is higher in assembled contigs. The
content of plant repetitive elements in sequence contigs is on the
average 3-fold lower than in BESs. The greatest differentiation of
the participation of these elements concerns ribosomal RNA genes
(45S and 5S) and small RNA sequences, of which there are
respectively 48-, 14- and 42-fold fewer in sequence contigs.
Genomic contigs mostly contain unique sequences. This is due to
the specifics of automatic assembly algorithms of sequencing reads
[68]. Therefore, when the finished genome sequence is not
available, the comparisons and characterization of the content of
repetitive elements is more appropriate on the basis of long, not
assembled reads, like the sequences of genomic libraries e.g. BESs
The share of repetitive plant elements in the assembled line B10
genome is approx. 1.34 lower than their content in line 9930
contigs as described by Huang S. et al. 2009 [13]. This may be due
to the additional number of contigs which constitute repetitive
sequences in the public genome sequence of line 9930. The
number of repetitive plant elements in unique sequences
(183 Mbp) of the line 9930 genome determined using the database
of repetitive cucumber elements created in this work for B10 line
was 16.09% and did not differ from the repetitive element content
of assembled B10 line genome.
Assignment of contigs to chromosomes. From the set of
2051 markers of the cucumber genetic map (http://cucumber.
genomics.org.cn) [69] including 995 SSRs, 1,027 DArTs, and 29
SCARs/RAPDs, the available sequences of 1,883 markers (964
SSR and 919 DArT sequences) enabled the assignment of the
assembled genome to specific chromosomes. The unique locations
were obtained for 1,665 markers on the genome sequence after
version B step 2 (Celera/Arachne) (Table S7), through which
80 Mbp of contigs sequences and 160 Mbp of pseudo-molecule
scaffolds were assigned to chromosomes. The genome sequence in
version A (Celera) allowed the assignment of 173 correctly placed
and oriented pseudo-molecule scaffolds of 207 Mbp length
(containing 182 Mbp in sequence contigs), through 1,700
uniquely mapped markers. It is worth to note, that because of
the manual anchoring of the Celera scaffolds to the chromosomes
using BLAST (instead of Arachne module for Celera/Arachne
assembly), and the use of long sequence markers it was possible to
choose only the Celera pseudo-molecule scaffolds which were not
only placed but also oriented correctly.
The genome sequence obtained in version A, due to the
presence of 2-fold longer scaffolds containing 2-fold additional
contigs, was used to facilitate the assignment of a larger number of
Celera/Arachne sequences (Table S7) to seven cucumber
chromosomes. Subsequently as a result of the unique cross-
alignment of sequences of both final assembly versions (Table 2), a
total length of 163 Mbp of Celera/Arachne contigs as well as
167 Mbp of Celera contigs were finally assigned to chromosomes.
That cross alignment with the correctly placed and oriented
Celera pseudo-molecule scaffolds enabled also the correct placing
and orientation of Arachne/Celera sequences. The above
mentioned contigs were assigned through 9358 Celera/Arachne
pseudo-molecule scaffolds (300 Mbp) and 169 Celera pseudo-
molecule scaffolds (207 Mbp).
Genomic contigs of the line B10 were finally assigned to
chromosomes on the basis of 1,701 markers, which represents
3.6% fewer markers than used for line 9930 [13]. This difference
may be due to the genetic distance between B10 line (European
cucumber) and the individuals from the population used for
mapping line 9930 (Asian cucumber) [13]. In spite of this
difference, 2% and 4.5% more sequences of, respectively,
Celera/Arachne and Celera contigs were assigned and the
length of pseudo-molecule scaffolds mapped to seven chromo-
somes was 70% (version B step 2) and 17% (version A) greater
than that of line 9930 [13]. The participation of a larger part of
the line B10 genome placed on chromosomes, relative to line
9930, both with respect to contigs as well as pseudo-molecule
scaffolds, is probably due to B10 having 2-fold longer scaffolds
with a greater number of longer contigs and/or the use of other
methods of sequencing and other algorithms of sequence
assembly.
Table 2. The final result of joint anchoring of genome sequences to chromosomesa.
Chromosomenumberb
Number ofArachnecontigs
TotalArachnecontigslength (Mbp)
Number ofArachnepseudo-moleculescaffolds
TotalArachnescaffoldslength (Mbp)
Number ofCelera contigs
TotalCeleracontigslength (Mbp)
Number ofCelerapseudo-moleculescaffolds
Total Celerascaffoldslength (Mbp)
1 (4) 1519 20.30 1209 34.91 1208 20.87 24 28.60
2 (2) 1480 20.24 1198 34.86 1185 20.81 22 25.16
3 (3) 2411 33.96 1918 60.83 1927 34.89 30 39.09
4 (6) 1974 26.13 1565 47.75 1583 26.81 24 33.16
5 (1) 1633 22.59 1243 45.04 1286 23.18 20 29.98
6 (5) 1736 23.50 1368 45.98 1388 24.05 31 30.31
7 (7) 1125 15.97 857 31.14 879 16.47 18 20.44
Sum 11878 162.73 9358 300.53 9456 167.11 169 206.73
% of assembledsequences
71.78 84.23 71.28 93.04 60.36 84.83 4.05 92.29
aThese are the final results of anchoring the genome sequences on chromosomes after cross mapping both of the final versions of the assembly (version A - Celeraversus version B step 2 – Celera+Arachne) onto themselves and onto the genetic markers.
bBorszczagovski kariotype numbering (brackets contain Chinese Long kariotype numbering).doi:10.1371/journal.pone.0022728.t002
Comparative Genomics of Five Plant Genomes
PLoS ONE | www.plosone.org 5 July 2011 | Volume 6 | Issue 7 | e22728

Gene prediction. As a result of ab initio gene prediction using
GeneMark-ES software [70] on 15,678 genomic contigs with
masked repetitive sequences, we obtained 26,587 gene models
encoding proteins longer than 50 amino acids. The predicted gene
structures (Table S8) contain an average of 5.49 exons each with
an average length of 201 bp and introns with an average length of
436 bp. Intergenic sequences have an average length of 3,009 bp.
The average length of the coding region is 1103 bp and the
average length of the transcribed region is 3,058 bp. The average
gene length (including introns) is 4,563 bp.
The sensitivity (Sn) and specificity (Sp) of the gene prediction
method was determined on a test set (Table S9).
We also used the GeneMark-ES models to predict genes in the
genomic contigs of the Chinese Long cultivar (Table S8). For
12,195 contigs, we obtained 26,442 gene models encoding proteins
longer than 50 amino acid residues. The predicted gene structures
contain an average of 5.56 exons with an average length of 216 bp
and introns with an average length of 434 bp. We observed the
following average lengths for intergenic sequences (2,668 bp),
coding regions (1,200 bp), transcribed regions (3,178 bp), and the
entire genes including introns (4,512 bp).
The average lengths of introns, exons and their numbers are
similar for the line B10 and 9930 genomes when comparing gene
predictions done in this project and as by Huang et al. 2009 [13]
(Table S8), however slight differences can be also observed.
Differences are with respect to the number of exons and introns
per gene, the length of the intergenic region, and the average
length of the translated and transcribed regions. These slight
differences between predictions made in this work for genomes of
lines 9930 and B10 and the results of Huang S. et al. 2009 [13]
could be caused by the different methodologies used for structural
annotation and/or genome assembly, as well as the presence of
considerable bacterial DNA impurities in line 9930 (Table S8, and
Fig. S3 and S4).
In an analysis using the test-set, high values were obtained for
sensitivity and specificity of the prediction model (Table S9). These
values were similar to those obtained for other eukaryotic
organisms, both using demanding programs (for generating a
model) and the training set with a large number of cDNA/EST
[71,72] coding sequences as well as using the GeneMark.hmm ES
program [70,73].
Functional annotation. Among the 23,190 proposed
proteins of line B10 which are longer than 100 amino acid
residues, similarities in the GenBank database identified 19,562 of
them and 16,944 had informative names (Table S10). A total of
12,463 of the proteins could be assigned to functional groups. In
the main Gene Ontology Consortium [74] classification, the
following numbers of functional subgroups were identified: 923 BP
(Biological Process), 1244 MF (Molecular Function), and 247 CC
(Cellular Compoment). In line 9930, out of 23,480 proteins longer
than 100 amino acid residues, similarities were identified for
20,361 predictions. Among these there were 17,937 described
proteins, and 13,485 of these were assigned to functional groups
(Table S10). In the detailed Gene Ontology Consortium [74]
classification, the following numbers of functional subgroups were
distinguished: 1,023 BP, 1,412 MF, and 266 CC.
The analysis of functional groups indicated that 1,500 proteins
from line 9930 (in contrast to only 5 from line B10) had functions
specific for bacterial proteins such as: chemotaxis, ciliary or
flagellar mobility, enterobacterial common antigen biosynthetic
process, flagellum assembly, flagellum organization, gram-nega-
tive-bacterium-type cell wall and pilus, spore germination. After
careful analysis of the sequences of contigs containing these
proteins, 554 contigs (average GC pair content 55.54%) with a
high similarity (approx. 85%) to bacterial genome sequences (Fig.
S3) were isolated and removed from subsequent analyses. The
characteristics of genome sequences before and after removal of
sequences representing bacterial contamination are presented in
Table S8 and the updated functional statistics of proteins for the
purified set of contigs of line 9930 are shown in Table S10. Figure
S4 indicates the participation of individual bacterial genera to
which the sequences of the assembled contigs of line 9930
(GenBank database under No. ACHR01000000) show similarity.
Whole genome comparisons between European andAsian cucumber cultivars
Analysis of SNPs and INDELs. The alignment of genomic
contigs of the cucumber cultivars is presented in Figure S5.
Comparative analysis of unique mapped contigs longer than
1000 bp of the European and Chinese lines, 13,428 (187.8 Mbp)
and 11,219 (181.8 Mbp), respectively, showed 97.40% similarity
of the assembled sequences.
The characteristics of SNP and INDEL polymorphism between
compared cucumber genomes are presented in Table S11. SNP
polymorphism was generally 2 times higher than INDELs.
Uncategorized whole genomic sequences polymorphism frequency
was 1/237 bp for SNPs and 1/395 bp for INDELs. It was found
that frequency of SNPs and INDELs in exons (1/626 bp (SNP)
and 1/1724 bp (INDEL)) is in average 2-times lower than in genes
(introns and exons together) (1/403 bp and 1/729 bp) and more
than 4-times lower than found in whole genomic contigs
sequences. Regions of gene’s promoters (21000 bp upstream
translation start), showed polymorphism level (1/260 bp and 1/
417 bp) similar to that of uncategorized whole genomic sequences.
Beside exons, where the ratio of insertions and deletions is equal,
all other parts of the genome sequences have 2-times lower
frequency of insertions then deletions in B10 line.
Analysis of INDELs’ length distribution (1–2 bp (ultra), 1–10 bp
(micro), 11–50 bp (mini), 51–100 bp (midi) – Table S12), showed
that in uncategorized whole genome sequences as well as in
noncoding promoter regions of B10 line, almost 60% of all
insertions and 85% of all deletions are ultrashort (1–2 bp) (INDEL
polymorphism will be counted according to the B10 line).
Insertions and deletions of micro regions (3–10 bp) taken 25%
and 10%, and of mini regions (11–50 bp) taken 15% and 3%,
respectively. The longest (midi regions: .51 bp) insertions and
deletions, taken 1% and 0.1%, respectively. Unlike above
mentioned sequences, exons have almost equal amounts of
insertions and deletions (average share of 51% ultra-, 27% micro
and 16% mini- INDELs). The slight difference of share were
found only for the midi- INDELs. There were 5% of insertions
and 8% of deletions. It was also found that exons have 12-times
higher frequency of midi-deletions (.51 bp), more than 8-times
lower frequency of ultra-deletions and 4-times lower frequency of
ultra-insertions than in the rest of the genome sequences.
SNP polymorphism frequency found between two cucumber
lines (4.22/1 Kbp), is slightly lower than the one of Arabidopsis
thaliana ecotypes (4.68/1 Kbp) [60,75] and almost 3-times lower
than of Oryza sativa indica and japonica varieties (31.74/1 Kpz)
[76]. The SNP polymorphism frequency in cucumber coding
sequences (exons) (1.60/1 Kbp), is almost 2-times lower than in
Arabidopsis (2,79/1 Kbp) and rice (3/1 Kbp). The cucumber
promotor regions are also slightly less polymorphic (3.85/1 Kbp)
than in rice (4.61/1 Kbp). The cucumber INDEL polymorphism
frequency (,100 bp) found in uncategorized whole genome
sequences (2.53/1 Kbp) was almost identical to that of rice
(2.66/1 Kbp), but almost 4-times higher than in Arabidopsis (0.65/
1 Kbp). The differences found in exons are more significant.
Comparative Genomics of Five Plant Genomes
PLoS ONE | www.plosone.org 6 July 2011 | Volume 6 | Issue 7 | e22728
There were above 2.5-times more insertions and deletions found in
cucumber (0.58/1 Kbp) than in rice (0.22/1 Kbp) and 29-times
more than in Arabidopsis. The INDELs polymorphism frequency
found in cucumber promotor regions was almost 2-times higher
(2.4/1 Kbp) than in rice (1.28/1 Kbp). The rates of polymorphism
found in those three species, seems to mirror the geographical and
climate diversity between compared genotypes, their genetic
background as well as the share of repeated sequences in the
genomes – which are the most variable genome regions.
The most frequent type of sequencing error generated by
pyrosequencing introduce artificial insertions or deletions of single
nucleotides. This type of error arise when sequencer reads the
genome region containing single nucleotides repeats (homopolymer
runs) [50,61,77]. Those artificial INDELs could cause open reading
frame shifts which then affect gene predictions and effect in functional
annotation’s artifacts [78,79]. The assembled genome’s pyrosequenc-
ing reads coverage of 146is considered to be sufficient for automatic
(made during genome assembly) corrections of mentioned above
homopolymer errors [50,61]. The more direct evidence of assembled
sequence correctness is that ultra short (1–2 bp) INDELs (those which
cause open reading frames shift) frequency was 6-times lower in exons
than in other parts of the genome.
Analysis of genomic rearrangements. Besides of the single
nucleotide polymorphism, another element of genetic differentiation
of lines B10 and 9930 is represented by genomic rearrangements of
smaller or larger DNA fragments. Such changes include inversions
and translocations, as well as deletions/insertions and duplications,
which have accumulated over many generations and enabled the
plants for better adaptation to new growth conditions. This has been
demonstrated for primitive organisms as well as higher plants [16–
19]. Most rearrangements observed between genotypes of two
cucumber cultivars are of the inversion/translocation type (Fig. 1
(schema) and Fig. S6 (detailed comparison)). The translocations and
inversions affect all chromosome and involve segments even as large
as 5 Mbp. Translocations are mostly between the inner chromosome
regions and the ends of the chromosome arms, so it was probably the
way to make some ‘‘desired’’ genes more transcriptionaly active than
other ‘‘not needed’’ genes. These rearrangements may contribute to
the differentiation of the two cucumber lines and thus could be a
novel aspect of the evolutionary adaptation mechanism.
Analysis of functional groups differences. The above
structural differences can lead to changes in gene quantity between
analyzed cucumber cultivars. To check if it is true, the functional
annotation results were compared between cultivars. As shown in
Figure S7A–C and in Dataset S3, the intra-species differences
between both lines as well as between species are minimal. In deep
comparative functional analysis were done for 38 functional
groups (16 BP, 18 MF, 4 CC), which show at least 2-fold higher
number of genes in one of the two genotypes. Those functional
groups in B10 and 9930 lines, contained 126 (ca. 1% of GO genes)
and 96 genes (0.78% GO genes), respectively. The analysis
indicates (Table 3 and Table S13) that in line B10, there is a larger
number of genes involved in photosynthesis, sugar metabolism,
respiration, regulation of gene expression and chlorophyll
degradation, as well as more genes involved in assimilation of
nitrogen in the form of ammonium ions. The Asian cucumber
variety, on the other hand, is characterized by having more genes
involved in regulation of tolerance to photo-oxidative stress and
high temperatures.
Comparative analysis of gene promoters betweenspecies
Distribution of ABREs, DREs and EREs in promoters of
genes of C. sativus line B10. A total of 20,745 promoter
sequences (21,000 bp from the ATG start codon) of genes of
Figure 1. Schematic representation of chromosomal rearrangements between cucumber varieties. Figure shows chromosomallocalization of inversions and translocations between genomic sequences anchored on chromosomes I–VII and a comparison between the B10 and9930 lines (chromosome numbering is according to the Borszczagowski karyotype [80] (brackets contain Chinese Long [67] karyotype numbering)).a - Chromosome 1 (4), b - Chromosome 2, c – Chromosome 3, d – Chromosome 4 (6), e – Chromosome 5 (1), f – Chromosome 6 (5), g – Chromosome7. The top panel bar represents B10 chromosome with scaffolds, the bottom bar represents 9930 chromosome with. The lines show chromosomalrearrangements between sequences of two genomes.doi:10.1371/journal.pone.0022728.g001
Comparative Genomics of Five Plant Genomes
PLoS ONE | www.plosone.org 7 July 2011 | Volume 6 | Issue 7 | e22728

C. sativus line B10 were analyzed with respect to the occurrence
and distribution of ABREs, DREs and EREs. It was found that
1,294 ABREs, 4,118 DREs and 449 EREs occur in 1158, 3500
and 438 gene promoters, respectively. Statistical analysis indicated
an enriched content of the analyzed CREs in gene promoters of C.
sativus line B10 (Table S14). The enrichment factors for ABRE,
DRE and ERE are 1.27, 0.95 and 2.09, respectively. Promoter
sequences of the analyzed genes were divided into 50 nucleotide
fragments. In each fragment, the content of the analyzed CREs
was calculated. An increased density of the analyzed fragments
was identified at a distance of about 300 bp from the start codon
ATG (Fig. S8).
Relative content of ABREs, DREs and EREs in promoters
of genes of A. thaliana, P. trichocarpa, O. sativa and two C.
sativus lines: B10, 9930. The occurrence of specific CREs and
combinations thereof in gene promoters may explain the putative
correlation between these elements and the specific plant responses
to biotic and abiotic stress and as such, will determine the
Darwinian fitness of a plant under chilling or freezing or drought
conditions. For this reason we identified all genes in A. thaliana, P.
trichocarpa, O. sativa and in two C. sativus lines: B10 and 9930, whose
promoter sequences contain specific CREs (for detailed analysis of
CREs in C. sativus line B10 promoters see Table S14 and Fig. S8).
We calculated the relative numbers of ABREs, DREs and EREs
per genome (Table 4). The relative percent content of each
of the analyzed CREs was calculated according to the
formula = ((ABRE+DRE+ERE)/CRE)6100. In the promoters of
all identified genes of the analyzed plant species, the occurrence of
the DRE element is approximately 70%. The content of the
ABRE element in the promoters of genes from A. thaliana, C. sativus
and P. trichocarpa is similar and is approximately 22%, whereas in
O. sativa it is only 8%. The number of ERE elements in the
promoters of A. thaliana, C. sativus and P. trichocarpa genes is approx.
8%, whereas in O. sativa the content of this CRE is 18% (Table 4).
The above results indicate that A. thaliana plants which are
capable of overwintering in the vegetative form (as a green rosette),
have the highest relative number of ABREs in their promoters and
the lowest numbers of DREs and EREs relative to the remaining
analyzed species and lines. The situation is different in C. sativus
and P. trichocarpa. These plants do not overwinter like cucumbers,
nor do they overwinter without leaves, like poplar trees. In the
genome of O. sativa, a subtropical plant, which is not adapted for
growth in ecosystem with chilling or freezing temperatures relative
ABRE elements content is the lowest among all analyzed species.
O. sativa is however adapted to others stresses such as root hypoxia
and associated with it water uptake problems. Ethylene and ROS
homeostasis in plant cells is controlled by a number of genes that
regulate formation of lysigenous aerenchyma, light acclimatization
and defense responses [21], probably therefore has the highest
number of ERE and DRE and the lowest ABRE elements in its
genome. However orthologous groups of genes encoding trans-
elements that interact with these CRE are highly conserved [81]
(Fig. S11, S12, S13, S14). The comparison of the occurrences of
the three analyzed CREs in the promoters of two cucumber lines
Table 3. Functional differences between cucumber lines B10 (European) and 9930 (Chinese).
Process B10 linea 9930 linea Environmental conditions
Photosynthesis + 2 Temperate climate zone of northeast Europe: chilling temperatures, lowersunlight intensity
Sugar metabolism + 2
Respiratory complex + 2
Regulation of gene expression + 2
Chlorophyll degradation + 2
Nitrogen fixation in the form ofammonium ions
+ 2 Continuous higher CO2 emission in Europe from the beginning of the industrialera and the 90’s of 20th century – reduced fixation ability of nitrate ions
Response to oxidative stress 2 + Subtropical climate zone of southeast China: higher seasonal average sunlightintensity, UV-B irradiation and temperature
Response to high temperature 2 +
a+ or 2 indicate which line has respectively significantly higher or lower number of genes involved in each process.doi:10.1371/journal.pone.0022728.t003
Table 4. Relative content of ABREs, DREs and EREs in promoters with CREs in A. thaliana, O. sativa, P. trichocarpa, and C. sativuslines B10 and 9930.
ABRE DRE ERE
% P-value Average % P-value Average % P-value Average
A. thaliana 24.8% 2.86E-05 1.1763 67.7% 1.33E-04 1.2098 7.4% 7.42E-06 1.037
C. sativus line B10 22.1% 2.47E-05 1.1174 70.3% 1.08E-04 1.1766 7.7% 5.42E-06 1.0251
C. sativus line 9930 22.4% 2.47E-05 1.1385 69.4% 1.09E-04 1.1885 8.2% 5.46E-06 1.0509
O. sativa 8.0% 5.30E-05 1.1121 73.7% 3.45E-04 1.6561 18.3% 3.48E-05 1.2503
P. trichocarpa 19.1% 2.80E-05 1.1234 70.8% 1.27E-04 1.3172 10.1% 7.01E-06 1.1154
The relative percent content of each element is calculated from the formula ((ABRE+DRE+ERE)/CRE)6100%.doi:10.1371/journal.pone.0022728.t004
Comparative Genomics of Five Plant Genomes
PLoS ONE | www.plosone.org 8 July 2011 | Volume 6 | Issue 7 | e22728

also showed significant differences. Promoters of genes in line 9930
are characterized by increased ABRE and ERE content and
decreased DRE content, relative to the B10 cucumber line.
Functional classification of A. thaliana, P. trichocarpa, O.
sativa, and C. sativus line B10 genes containing ABREs,
DREs and EREs in their promoters. Genes of the analyzed
species were classified according to function and cellular
localization, into appropriate gene ontology (GO) groups: GO
Cellular Component, GO Molecular Function and GO Biological
Process. In the promoter sequences of the genes of each group, the
occurrences of ABREs, DREs, EREs and the combinations
ABRE+DRE, ABRE+ERE, DRE+ERE, and ABRE+DRE+ERE
were determined for A. thaliana, O. sativa, P. trichocarpa, and C. sativus
line B10. The analysis indicated differences in the number of
chloroplast genes among the analyzed species (Fig. S9C). Genes
belonging to this group are the most numerous in A. thaliana and P.
trichocarpa and constitute approximately 10% of the pool of all
analyzed genes for these species. Among the A. thaliana chloroplast
genes, a significant increase was observed for the combinations
ABRE+ERE (14%) and ABRE+DRE+ERE (16%) in their
promoter sequences. The number of genes encoding proteins
linked to the cell wall is decreased in C. sativus (0.5%), relative to
genes of this class in the other species investigated (2–2.8%). In all
analyzed species a preponderance of genes encoding proteins
with hydrolase activity, which contain the combinations
ABRE+ERE+DRE, DRE+ERE and ABRE+ERE in their
promoters was observed (Fig. S9B). In C. sativus, on the other
hand, we identified an increase in the number of genes encoding
proteins with kinase activity, which contain the combinations
ABRE+DRE+ERE and ABRE+DRE in their promoters.
The analysis of C. sativus line B10 genes linked to signal
transduction indicated a distinct preponderance of genes contain-
ing the combination ABRE+DRE+ERE (7.6%) in their promoter
sequences with respect to genes represented in this category in the
remaining species (Fig. S9A). On the other hand, considerably
fewer genes (approximately 2%) were identified as being linked to
stress responses in line B10. Genes belonging to this class are the
most highly represented in the three remaining species. P.
trichocarpa contains EREs in 11.8% of its promoters, and the
combination ABRE+ERE in 11.7% of its promoters. O. sativa
contains ABREs in 8.7% of its promoters, the combination
ABRE+DRE in 7.9% of its promoters, and the combination
ABRE+ERE in 8.6% of its promoters. A. thaliana contains the
combination ABRE+ERE in 8.3% of its promoters, and the
combination ABRE+DRE+ERE in 8.5% of its promoters.
Among the genes involved in plant responses to biotic and
abiotic factors, the most common combinations of elements in the
promoters were ABRE+ERE in A. thaliana (8.6%) and in O. sativa
(6.9%), ABRE+DRE+ERE (7.6%) in C. sativus, and ABRE+DRE
(5,1%) in P. trichocarpa.
Functional analysis of genes containing ABREs, DREs and
EREs in their promoters. In order to determine which groups
of genes in different species and lineages are regulated by the same
CREs, and the same combinations of CREs and to analyze
evolutionary changes in promoter sequences, we identified 5971
groups of orthologous genes from A. thaliana, P. trichocarpa, O. sativa
and C. sativus line B10 and 9930 (Dataset S1) and we compared the
genes which contain ABRE, DRE, ERE elements, the following
combinations of two elements: ABRE+DRE; ABRE+ERE; and
DRE+ERE in above mentioned species and lineages (Fig. 2A and
Dataset S1). The functional classification of genes with above
mentioned combinations of CREs is provided in Fig. S9.
We identified 429, 420, 511, 361 and 738 groups of orthologous
genes with promoters containing ABREs in C. sativus line B10,
C. sativus line 9930, A. thaliana, P. trichocarpa and O. sativa,
respectively. For DREs, we identified 1,164; 1,172; 1,835; 1,528
and 3,104 groups of orthologous genes with promoters containing
these CREs in C. sativus line B10, C. sativus line 9930, A. thaliana, P.
trichocarpa and O. sativa, respectively. For EREs, we identified 153,
148, 240, 242 and 1,214 groups of orthologous genes with
promoters containing these CREs in C. sativus line B10, C. sativus
line 9930, A. thaliana, P. trichocarpa and O. sativa, respectively. For
the combination of elements ABRE+DRE, we identified 106, 98,
267, 141 and 398 groups of orthologous genes with promoters
containing these CREs in C. sativus line B10, C. sativus line 9930, A.
thaliana, P. trichocarpa and O. sativa, respectively. For the DRE+ERE
combination, we identified 39, 37, 80, 48 and 699 groups of
orthologous genes with promoters containing these CREs in C.
sativus line B10, C. sativus line 9930, A. thaliana, P. trichocarpa and O.
sativa, respectively. For the combination of elements ABRE+ERE,
we identified 14, 16, 28, 19 and 136 groups of orthologous genes
with promoters containing these CREs in C. sativus line B10, C.
sativus line 9930, A. thaliana, P. trichocarpa and O. sativa, respectively.
Among the analyzed promoters of groups of orthologous genes
containing ABREs in A. thaliana, P. trichocarpa O. sativa and two lines
of C. sativus: B10 and 9930, only 13 were found to be common in
these plant species (Fig. 2A). 95 groups of orthologous genes with
promoters containing DREs were conserved in all analyzed species
and lineages. In A. thaliana, P. trichocarpa O. sativa and two lines of C.
sativus: B10 and 9930, among groups of orthologous genes
containing ABRE+DRE combination in their promoters, 2 were
common for the analyzed species (Fig. 2A, Dataset S1). These
genes encode the following proteins: putative late embryogenesis
abundant (LEA) and putative protein phosphatase 2C We have
not identified any conserved groups of orthologous genes with
promoters containing EREs and the following combinations of two
elements: ABRE+ERE; and DRE+ERE in above mentioned
species and lineages (Fig. 2A, Dataset S1).
The analysis of the frequency of occurrence of mutations
between genes (introns and exons) and their promoters within the
two analyzed cucumber lines has indicated that both SNPs, as well
as INDELs occur approximately 3 times more frequently in
promoter regions than in gene sequences (Table 5). Promoters of
selected orthologous genes of two C. sativus lines were compared
using PlantCARE program [82] and significant changes were
observed in promoter sequences, which changed CRE combina-
tions (Fig. S10).
In order to confirm in silico prediction of different regulatory
responses in different plant species to the same hormone we
perform experiments with abcisic acid (Fig. 2B). Non-acclimated
Arabidopsis and cucumber seedlings growing in ambient laboratory
conditions were treated with 200 mM abscisic acid solution for 3
days and tested for freezing tolerance. Ion leakage after freezing to
22 or 24uC was significantly lower in Arabidopsis than in
cucumber seedlings (Fig. 2B).
Characterization of C. sativus proteins linked to abiotic
stress response. We analyzed genes encoding proteins from the
LEA group (Late Embryogenesis Abundant). In C. sativus line B10, only 26
genes of this type are present. For comparison there are 51 genes of this
class in A. thaliana [83] and 28 in P. trichocarpa. In C. sativus line B10, 9 of
the LEA genes (34.6%) had ABREs and 8 had DREs (30.8%) in their
promoter sequences. In A. thaliana, 32 genes of this class had ABREs
(56.1%) and 34 had DREs (59.6%) in their promoter sequences. In P.
trichocarpa 12 genes of this class had ABREs (42.9%) and 10 had DREs
(35.7%) in their promoter sequences. These results may suggest that the
decreased tolerance of cucumber to unfavorable environmental
conditions (e.g. cold temperatures and water deficiency) is linked not
only to the low number of LEA genes but also has a statistical effect on
Comparative Genomics of Five Plant Genomes
PLoS ONE | www.plosone.org 9 July 2011 | Volume 6 | Issue 7 | e22728

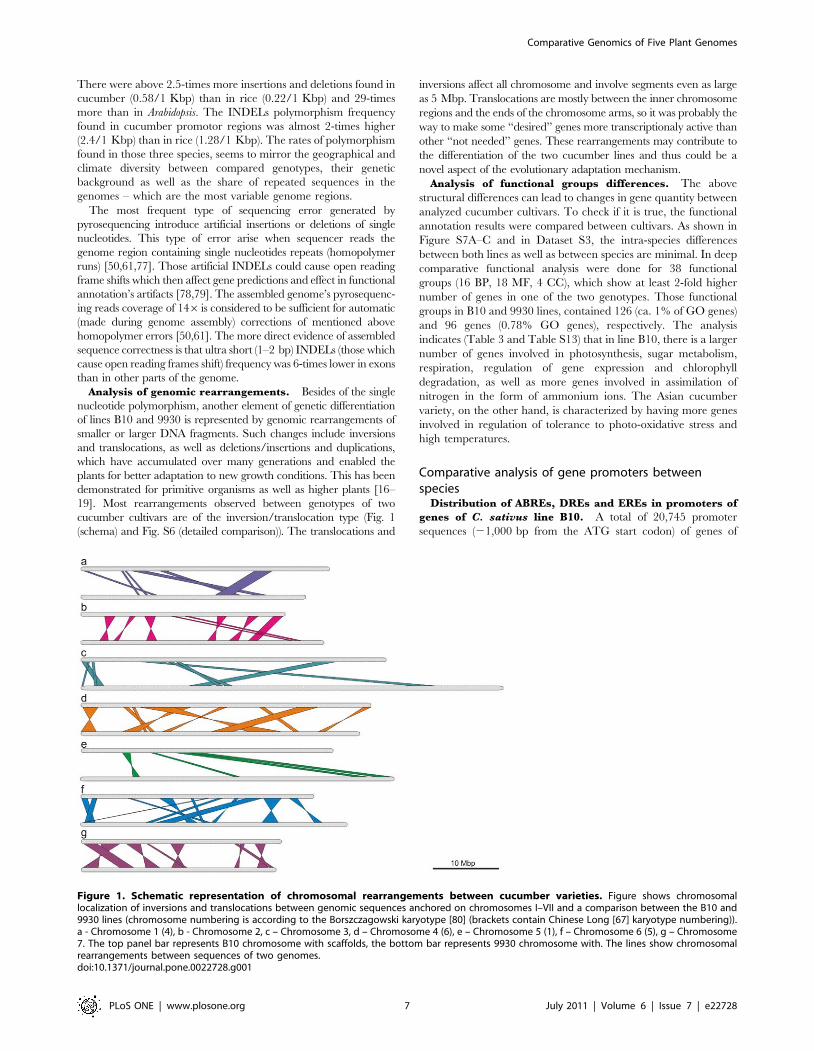
Figure 2. Comparison of CRE content in orthologous genes and freezing tolerance tests of non-acclimated A. thaliana and C. sativusseedlings after abscisic acid (ABA) treatment. (A) Venn diagrams presenting the number of common and different orthologous genes’ groups(5,971) with respect to the occurrences of ABREs, DREs, EREs and their combinations in promoters in A. thaliana, P. trichocarpa, O. sativa and lines B10and 9930 of northern European and Chinese C. sativus varieties. Total number of orthologous groups with specific CRE or combination of CREs isgiven in brackets. (B) Freezing tolerance tests of non-acclimated A. thaliana and C. sativus plants after ABA treatment. Leaves were frozen in different
Comparative Genomics of Five Plant Genomes
PLoS ONE | www.plosone.org 10 July 2011 | Volume 6 | Issue 7 | e22728

the relatively reduced presence of ABREs and DREs in their
promoters. Cucumber sensitivity to stress probably also causes a
reduction in the number of genes encoding scavengers or reactive
oxygen species. In line B10 there are 116 such genes, whereas A.
thaliana has 148. Only 3 groups of genes were present in similar
numbers in C. sativus line B10 and A. thaliana. Among these genes are
the monodehydroascorbate reductase genes, glutathione reductases,
and catalases. The remaining groups (superoxide dismutases, ascorbate
peroxidases, dehydroascorbate reductases, glutathione peroxidases,
NADPH oxidases, peroxiredoxins, thioredoxins and glutaredoxins,
were represented by a smaller number of genes in cucumber than in A.
thaliana. We also described putative transcription factors representing
AP2_EREBP and bZIP families from C. sativus line B10 and C. sativus
line 9930, respectively (Dataset S2). We identified putative
representatives of AREBs (Abscisic Acid–Responsive Element
Binding Protein), ERFs (Ethylene-responsive Element-binding
Factor) and DREBs/CBFs (Dehydration-responsive Element-binding
proteins) (Fig. S11, S12, S13, S14).
Discussion
The draft genomic sequence of the North-European Borszcza-
gowski cultivar of the cucumber C. sativus (line B10), provided
herein, and the comparative genomics studies presented, has
brought not only applied genomic research of cucumber but
mainly basic research on plants to a new level. A quality draft of a
highly repetitive plant eukaryotic genome was obtained by using a
hybrid method of assembly utilizing the ends of clones of a BAC
library combined with paired and unpaired 454 Titanium
pyrosequencing fragments summing up to 126 coverage.
The assembled portion (53%) of the cucumber nuclear genome
sequence (without gaps), has more than 146 coverage with 454
Titanium reads. As it became clear from the ultralength (1–2 bp)
INDELs polymorphism analysis made in this work, and according
to the other researchers [50,61], such a coverage rate, is sufficient
to eliminate pyrosequencing specific errors. Because the presented
result of cucumber B10 line genome assembly is practically
identical to those of American Gy14 line (366 coverage) [54]
http://www.phytozome.net/cucumber.php) and Chinese 9930
line (706 coverage) [13], it seems that chosen whole genome
sequencing method was the most effective one to get the first
quality draft sequence of cucumber genome. By cross mapping
each other assembly versions (Celera vs. Celera/Arachne), it was
possible to anchor more Celera/Arachne contigs (the most
genome representative) to the chromosomes. The assembled
genome served also for de-novo gene prediction, functional
annotations of genes and comparative genomics studies. The
average contig size of 12 Kbp and especially almost 95% of
genome contained in contigs longer than average gene length of
4 Kbp, gives the possibility to discover almost all protein coding
genes.
The Darwinian fitness of individual species and/or lines could
be determined by a species-specific set of genes and also by the
whole regulatory network formed by the specific activation/
deactivation of TRFs, which in turn interact with specific CREs
residing within gene promoters.
We observed that the European cultivar in comparison to
Chinese Long cultivar (Table 3 and Table S13a) has increased
number of genes involved in photosynthesis, respiration, sugar
metabolism, chlorophyll degradation and regulation of gene
expression. This might indicate for adaptation to the temperate
European climate conditions (lower average light intensity and
grow temperatures). On the other hand Chinese Long cultivar has
more genes related to photooxidative stress tolerance (UV and
high light irradiation), higher non-optimal temperatures tolerance
(e.g. heat shock proteins) and pathogen attack resistance (e.g.
peroxidases and glycoproteins), therefore is better adapted to the
subtropical climate conditions. We have also found that in line
B10 of the European cucumber cultivar, a much larger number of
genes take part in ammonium ion assimilation. This is expected to
compensate for the limited ability to assimilate nitrate ions [84,85],
probably as a result of higher levels of continuous CO2 emission in
Europe till the 90’s of the 20th century. Industrial era in Europe
started at the end of 18th century, but taking into consideration
that significantly higher carbon dioxide atmospheric emission
started together with wide availability of internal combustion
engine at the end of 19th, it could be concluded that mentioned
adaptive genomic changes arose in about 100 generations.
Unicellular yeast, needs only about 2–3-times less generations to
acquire new genomic adaptations [19]. It seems like the time
needed by multicellular cucumber plants to adapt to new
environmental conditions is extremely short and constitute the
new evidence of ‘‘evolution in action’’. Recently the similarly fast
environmental adaptation was reported for Atlantic tomcod
(Microgadus tomcod) living in Hudson River, NY, USA [86].
Rearrangements of inversions and translocations type which
differ two cucumber genotypes, growing in extremely diverse
environmental conditions, could have arose as a result of
evolutionary adaptation to specific conditions. Functional com-
parative analysis between cucumber genotypes, showed that 9930
line genome contains 4-times more copies of peroxidase genes and
3-times more copies of two dehydrogenase genes, which are
crucial for oxidative stress resistance in plants [17]. Like it was
reported in pathogen Cryptococcus neoformansand and in yeast,
oxidative abiotic stress caused by high temperature, UV light or
Table 5. Analysis of the frequency of occurrence of mutations in exons and introns and their promoters with differentcombinations of CRE in C. sativus lines B10 and 9930.
SNPs INDELs
Promoter Exons+Introns Promoter Exons+Introns
No. of Mutationsa 14.89*** 4.60 3.87*** 1.34
aValues indicate number of mutations per 1000 bp only in genes containing ABRE, DRE and ERE. Statistically significant difference was assessed by Student’s t-test -*** p-Value,0.001.
doi:10.1371/journal.pone.0022728.t005
temperatures and cellular damage was assessed by measuring electrolyte leakage. Statistically significant difference was assessed by Student’s t-test– n = 5, * p-Value,0.05; ** p-Value,0.005. Error bars indicate standard deviations. C – control non-treated plants; ABA – abscisic acid treated plants.doi:10.1371/journal.pone.0022728.g002
Comparative Genomics of Five Plant Genomes
PLoS ONE | www.plosone.org 11 July 2011 | Volume 6 | Issue 7 | e22728

hydrogen peroxide result in wide range of chromosomal
rearrangements (translocations, deletions, inversions, amplifica-
tions, chromosome fusions or aneuploidy), which are stabilized
over generations and lead to resistance’s acquisition [18,87]. It was
shown in cucumber, that UV-B radiation leads to higher ploidy
and bigger size of cells surrounding leaves’ trichomes. Additionally
the higher expression of peroxidase and dehydrogenase genes
required for UV radiation’s protection, was noted [17]. In turn,
the B10 line increased number of genes responsible for effective
energy management, under relatively low temperature and low
sunlight intensity conditions, may be the result of chromosomal
rearrangements and amplifications of specific genome regions,
caused by the necessity to adapt to a given environment. This has
been demonstrated in yeast maintained for many generations
under conditions of lower availability of nutrients, in particular
glucose [14,19,88]), and in flax in response to low temperatures
[20].
The structural differences leading to changes in gene copy
numbers were showed recently in corn between 33 genotypes [89].
The rearrangements (CNVs – copy number variations and PAVs -
presence absence variations) were related to the acclimations of the
genotypes to different environmental conditions. Recently, large
(1 Mbp) chromosomal rearrangements (mostly inversions and
translocations) between 17 human genomes sequences were
reported. Detection of those extensive rearrangements was
enabled by sequencing of 14 million fosmid (40 Kbp insert)
library ends [90]. The other work, reported occurrence of large
chromosomal duplications in genomes of breast cancer cells. That
finding was achievable because of the use of new methodology
named array painting [91]. Like it was noted by Swanson-Wagner
et al., 2010 [89], till now it was believed, that the same species’
organisms should have similar genomes. On the other hand,
authors of the recent findings of extensive structural genome
differences between whole human genomes or in breast cancer
cells, remark that discovery of such genomic changes was not
earlier possible, because the broad used methods like FISH
(fluorescent in-situ hybridization), CGH (comparative genomic
hybridization), SNP microarrays or genome resequencing, do not
give such a possibility [90,91]. It is important to note that in the
other cucumber genome project (Gy14 line) the rearrangements
were not reported till now. As it is written at the web address
http://www.phytozome.net/cucumber.php, the ‘‘comparison
with the genetic map of cucumber supports the long-range
accuracy of the assembly’’. We believe that the main reason why
they had not found any rearrangements was the use of genetic map
containing the markers and their locations common for both
Chinese and American background as it cames out from paper of
Ren et al. [69]. Such a methodology assumed that the
rearrangements are not possible between different genotypes of
the same species. This assumption is not only conflicting with our
results but also with the very recent paper by Zhao et al. [66]
where a large rearrangements of satellite and rRNA genes were
reported between Cucumis sativus var. sativus and Cucumis sativus
var. hardwickii.
Regarding to the above comment, it seems that the discovery of
global genomic changes (rearrangements) between two cucumber
genomes, were possible only because of availability of two
genomes sequences generated de-novo together with the use of
diverse genome background genetic map.
The differences, we identified by comparing the genomes of two
cucumber cultivars at the levels of chromosomes and genes,
suggest that specific environmental and evolutionary adaptations
of line B10 and line 9930 have occurred in response to the
temperate Northern Europe and subtropical southeast Asia
climate conditions, respectively, which are different then the
Himalayan climate of its origin [92].
Reported in this work, extensive and numerous interchromo-
somal rearrangements between two cultivars of the same crop
species is the novel evidence. It should also be noted, that beside
such rearrangements, all of the genotypes are fertile. Though the
observed genome rearrangements need further and deeper
analysis, it could be concluded that those whole chromosomes
shifts could represent adaptive changes, because are accepted and
heritable. It could be also supposed that the view of evolutionary
genomic adaptations emerging from the previous comparative
genomics studies based on i.e. resequencing or hybridization data,
is at least only partial and could lead to erroneous conclusions
about the real mechanisms of organisms adaptive changes.
Differences in expression of orthologous genes in the two closely
related species D. melanogaster and D. simulans can be explained in
most cases by the loss or gain of CREs in promoter sequences [93].
Furthermore, Kasowski with colleagues (2010) [94] showed that
binding sides of RNA polymerase II and nuclear factor kB differed
significantly between human individuals. Binding differences were
linked to SNPs and were often correlated with altered gene
expression in humans [94]. Zhang with colleagues (2004) [95]
reported that freezing-sensitive tomato plants posses a functional
CBF/DREB response pathway, but CBF regulon differs consid-
erably from that of freezing-tolerant A. thaliana. Observed
differences can be explained by species-specific distribution of
functional DRE/CRT elements within promoters of orthologous
genes, or by mutations in proteins required for CBF/DREB
activity. Moreover, transcriptional variation of auxin responses in
seven natural accessions of A. thaliana was observed recently by
Delkler with colleagues (2010) [96].
It was shown that CRE turnover and shuffling [97], and
transcriptional rewiring [98] often occurs in genomes of animals
and yeasts over evolutionary time. However, in some cases these
alterations do not affect gene expression [97]. In our work we also
observed substantial differences in CRE content between all
analyzed species and varieties. For example we found significant
change in ABRE and ERE content between the genes of O. sativa
and the other species. This may be partly explained by the higher
GC content in O. sativa [99] and/or the role of ethylene in
adaptation to root hypoxia conditions [21]. We also identified
significant differences in CRE distributions (Fig. 2A, Fig. S10 and
Dataset S1) between the two lines of C. sativus (B10 and 9930).
Moreover, we also examined the genes with ABRE, DRE and
ERE in their promoters to determine if they belong to the same
functional groupings in the analyzed species, we found that only a
small fraction of the groups of orthologous genes with the highest
sequence similarity in A. thaliana, O. sativa, C. sativus (B10 and 9930)
and P. trichocarpa have the same CRE profiles in their promoters
(Fig. 2A, Dataset S1). These results suggest that, each species and/
or varieties has a specific profile of CRE content in gene promoters
which actually determines specific changes in gene expression
profiles (regulons) selected in response to the similar changes in
environmental conditions (e.g. not optimal temperatures or water
uptake limitations). We showed that non-acclimated Arabidopsis
seedlings displayed better freezing tolerance after ABA treatment,
while cucumber did not. This could be due to species-specific set of
genes controlled by both ABRE and DRE and ABA specific
response in the above species (Fig. 2A). Our ABA-treatment
experiments (Fig. 2B) together with in silico analysis of CRE
shuffling (Fig. 2A) explains why C. sativus is much more susceptible
for cold and chilling stresses than A. thaliana. The large changes in
sequences of promoters of orthologous genes in C. sativus are due to
approximately a 3-fold greater number of SNPs and INDELs in
Comparative Genomics of Five Plant Genomes
PLoS ONE | www.plosone.org 12 July 2011 | Volume 6 | Issue 7 | e22728

promoters relative to exons and introns of the same gene and
genotype (Table 5). In P. trichocarpa the number of polymorphisms
was also found to be about 2-fold higher in non-coding sequences
than in exons [100]. This indicate flexibility of gene’ promoter
sequences [101,102]. Though our results still need to be confirmed
in future experiments, these could indicate that rapid adaptation of
a line or variety to new environmental conditions may take place
at the level of the regulation of gene expression by changing
interactions in a transcriptional network without loss of function-
ality of particular genes. It is possible that due to the large
variability in promoter sequences (CRE shuffling) new lines/
varieties may be formed to adapt to new ecological niches.
In conclusion, adaptation of plants to new environmental
conditions may occur on the level of changes in gene dosage and
gene quality, but the rapid adjustment probably occurs by rewiring
of gene regulatory networks driven by CRE shuffling. We suggest
that through evolution, eukaryotic organisms have been equipped
with a high degree of freedom with respect to the variability of
promoters, in terms of regulatory elements, and chromosomal
rearrangements that allow for formation of new lines/varieties and
species adapted to new ecological niches.
Materials and Methods
Plant materialThe plant material was the highly inbred (20 generations)
monoecious B10 line of the Borszczagowski cucumber, an old field
cultivar. The plants were cultivated in a greenhouse during the
summer. Material for analysis was obtained from plants cultivated
in a greenhouse under controlled photoperiod conditions 16 h/
8 h day/night, at a temperature of 25uC–27uC during the day and
18uC–20uC at night. The intensity of the light was 1500 mmol
(quantum) m22?s21. Young leaves with a surface area of 2–3 cm2
were collected early in the morning directly after 24 hours of
darkness, frozen in liquid nitrogen and stored at 274uC. DNA for
genomic sequencing was isolated using the GenElute Plant
Genomic DNA Purification Kit as recommended by the producer
(Sigma Aldrich, St. Louis, MO, USA).
BAC libraryThe clones of long cucumber genome fragments used in this
work were derived from two BAC libraries, both prepared in the
pCC1BAC vector. Among 33,792 available clones 3,072 were
amplified in E. coli EPI300 cells [103] and the remaining clones
were amplified in E. coli DH10B cells (Amplicon Express, Pullman,
WA, USA). Genomic DNA of clones in EPI300 was previously
treated with the HindIII restriction endonuclease. The remaining
inserts were derived from cleavage with MboI and were ligated into
the vector cleaved with BamHI.
BES sequencesA total of 33,792 BAC clones were used for analysis giving in
effect 67,584 BES sequences which were sequenced by the Sanger
method using an ABI 3730xl capillary sequencer (Beckman
Coulter Genomics, formerly Agencourt Bioscience Corporation,
Danvers, MA, USA) and standard M13 Forward and M13
Reverse primers.
Purification of 67,584 BESs to filter out the low quality
sequences and the vector and bacterial sequences was performed
using Lucy v1.20 [104] and BLAST [105] software. To remove
non-nuclear sequences from further analysis, the BES sequences
were aligned (using BLAST) to the cucumber chloroplast genome
sequences (AJ970307 [106]) and to the set of plant mitochondrial
sequences available in GenBank.
Genome sequencingSequencing of BAC library end sequences (BES) were done by
the Sanger method using an ABI 3730xl capillary sequencer
(Beckman Coulter Genomics, Danvers, MA, USA) and standard
M13 Forward and M13 Reverse primers. The whole genome
shotgun sequencing was performed by the pyrosequencing method
using XLR Titanium reagents (454 Life Sciences, a Roche
company, Branford, CT, USA). Sequencing of random fragments
described as UNpaired (UN) given 86 genome coverage and of
fragments described as PAired ends (PA) produced 46 genome
coverage with an average distance of a pair of genomic sequences
of 3 Kbp. Paired fragments were connected to each other by a so-
called FLX type linker (44 bases) with the sequence
59-GTTGGAACCGAAAGGGTTTGAATTCAAACCCTTTC-
GGTTCCAAC-39. Preparation of the fragment libraries was
performed according to the procedures of 454 Life Sciences.
Titanium read lengths were characterized after processing by the
sffinfo script from the Newbler ver. 2.0.00.20 package (454 Life
Sciences) and, for paired libraries, rejecting the linker sequences
using the script sff_extract 0.2.3 (http://bioinf.comav.upv.es/
sff_extract/index.html).
Additional cucumber sequencesIn addition to all of the above mentioned sequences, we used 1,781
paired and unpaired Sanger generated (Beckman Coulter Genomics,
Danvers, MA, USA) (accession numbers: ET203886–ET203889,
FH937590–FH937636, FI136294–FI136299, FI160638–FI160866,
ES882265–ES883262) sequences which found to be polymorphic
among near isogenic lines of cucumber differing in sex phenotype
[107–109].
Genome assemblyThe genome sequence was obtained after hybrid assembly by a
combination of the Celera Assembler ver. 5.4 [52] and Arachne
ver. 3.0 [110] programs. The version A assembly was done with
Titanium and Sanger reads using the Celera program. The
version B hybrid assembly was done by Arachne program using
the sequence contigs obtained from assembly of solely pyrose-
quenced reads by the Celera program (version B step 1) together
with BES sequences. Prior to the Arachne assembly (version B step
2), the version B step 1 sequence contigs were cut into fragments of
an average length of 800 bp overlapping by 100 bp.. Moreover,
information about the Celera scaffolds was maintained in the form
of ‘‘artificial’’ paired ends (forward and reverse) with an average
length of 800 bp.
Characterization of the genome on the basis of BESs andgenomic sequences
To identify and classify microsatellite sequences, MISA software
(http:// http://pgrc.ipk-gatersleben.de/misa/misa.html) was used
taking into consideration sequences of mono- to octanucleotides
with a minimal length of 12 nt and the minimal number of 3
repeats units. Repetitive plant elements were identified and
classified on the basis of aligning BES sequences to the Michigan
State University database of Repetitive Plant Sequences [111].
Similarities were analyzed by the tBlastx algorithm with the
threshold value 1e-05. The database of repetitive sequences in the
cucumber genome was created de novo using the RepeatModeler
program (http://www.repeatmasker.org/RepeatModeler.html) on
the basis of nuclear BES sequences and the repeat database
Repbase Update [112]. Masking of repetitive sequences was
performed using the RepeatMasker program (http://repeatmas-
ker.org). The above-mentioned method of analyzing microsatel-
Comparative Genomics of Five Plant Genomes
PLoS ONE | www.plosone.org 13 July 2011 | Volume 6 | Issue 7 | e22728

lites and repetitive plant elements was also used for genomic
contigs.
Mapping genome on chromosomesIn order to map the line B10 genomic sequences on seven
cucumber chromosomes 1,883 available sequences of markers
together with the information about their positions on the genetic
map (http://cucumber.genomics.org.cn), [69] were used. The
mapping was performed using the BLAST (blastn, 1610220,
.30% marker coverage, .90% similarity) and specific Arachne
modules on sequences obtained after assembly versions A and B.
The cross-aligment of sequences from version A and B, done with
the MUMmer 3.22 [113] program, facilitated proper assigment
(correct position and orientation) of both assembly version contigs
to chromosomes.
Gene predictionThe small number of available full transcripts (mRNA) which,
as of February 2010, was only about 450 or even ESTs
(approximately 6500), does not enable us to perform a supervised
training for conventional ab initio gene finders [71]. Therefore, in
this work, we used a novel unsupervised training approach
implemented in the GeneMark-ES software. In this method, the
un-annotated assembled genome is used as the program input to
generate in iterations the algorithm final parameters that are used
to obtain gene predictions [70,73]. The cucumber coding
sequences available in databases were used only to check the
correctness of the proposed gene structures.
Parameters of the ab inito gene finder were determined by
unsupervised training on the assembled C. sativus contigs by the
GeneMark-ES [70,73] program. We used 3,008 contig sequences
longer than 20,000 bp with a joint length of 109 Mbp; repetitive
and TE sequences in these contigs were masked. Ab initio
predictions made by GeneMark-ES were verified using 63,035
cucumber Unigene EST sequences (http://www.icugi.org/) and
422 cDNAs (http://www.ncbi.nlm.nih.gov), which were purified
from vector contaminations by the SeqClean program (http://
compbio.dfci.harvard.edu/tgi/software/). To create a test set we
aligned Unigene and cDNA sequences to the genome by the
BLAT program [114]. We thus identified the sequences of
transcripts containing complete genes with introns. After excising
introns, the above transcript sequences were used to generate
a model for predicting intronless genes using the GeneMark.
hmm-P program (http://opal.biology.gatech.edu/GeneMark/).
This model was then used in GeneMark.hmm-P to identify the
start and stop codons of the genes and to evaluate the gene
structures, thereby completing the generation of the test set.
The species specific model used to predict cucumber genes was
assessed based on the sensitivity and specificity of gene detection; it
was modified (on the basis of alignment analyses performed by the
BLAT program) and used for de novo prediction of gene structures
on all contigs longer than 1000 bp masked for repetitive and TE
sequences. To adjust for the specifics of the cucumber genome we
modified the default parameters of the model with respect to the
minimum and maximum intron lengths and maximum length of
intergenic regions. These values were changed, respectively, from
20 nt to 60 nt and from 10,000 to 40,000 nt, for the two last
variables.
Functional annotationPolypeptides proposed as the result of structural annotation
were aligned to the GenBank protein database with the blastp
algorithm [105] and the e-value threshold of 1610210 using the
BRAGoMap [115,116] program. From the ten obtained results,
similarities to undescribed or unknown proteins, i.e. putative
proteins, unknown proteins, expressed proteins, and hypothetical
proteins, were removed. Among the remaining results one protein
each with the greatest similarity was left. The identifiers of these
proteins were mapped to Uniprot identifiers from the iProClass
[117] database and subsequently using the GORetriver [118]
program onto the Gene Ontology Consortium [74] classification.
A more general GOSlim classification was obtained after using the
GOSlimViewer [118] program. The conversion to the GOSlim
TAIR classification (http://www.arabidopsis.org) was also per-
formed.
Comparative analysis of genome sequences of line B10and 9930
Alignment of the genome sequence contigs of two genetically
distant cucumber varieties as well as the analysis of SNP
differences between them were performed using the MUMmer
3.22 program for contigs of a minimal length of 1,000 bp.
Comparison of the placement of scaffolds of both cucumber lines
on chromosomes and visualization of rearrangements were
performed using the Mauve ver. 2.3.1 program [119].
Identification of genes containing ABRE, DRE and EREelements in their promoters
In order to identify genes which contained in their promoter
sequences elements of the ABRE (ACGTGTC), DRE (RCCGAC,
where R = A,G) and ERE (AGCCGCC) types, fragments 1,000 bp
upstream the start codon (ATG) were taken from databases: http://
www.popgenie.org/popgenie1/ - P. trichocarpa, ftp://ftp.plantbiology.
msu.edu/pub/data/Eukaryotic_Projects/o_sativa/annotation_dbs/
- O. sativa. Promoter sequences of the B10 and 9930 lines were
isolated from genome sequences on the basis of information on the
location of genes assigned to contigs after structural annotation. The
cis regulatory ABRE, DRE and ERE elements and their combina-
tions were localized in gene promoters of the above species using Perl
scripts. Regulatory elements and their combinations in A. thaliana
gene promoters were sought by the Patmatch program (http://www.
arabidopsis.org/cgi-bin/patmatch/nph-patmatch.pl).
Comparison of protein sequences of A. thaliana, P.trichocarpa, O. sativa, C. sativus lines B10 and 9930
Amino acid sequences of gene products of the analyzed species
were downloaded from available databases: http://www.
popgenie.org/popgenie1/ - P. trichocarpa; ftp://ftp.arabidopsis.
org/home/tair/Sequences/blast_datasets/TAIR9_blastsets/ – A.
thaliana, ftp://ftp.plantbiology.msu.edu/pub/data/Eukaryotic_-
Projects/o_sativa/annotation_dbs/ - O. sativa. The cucumber
lines B10 and 9930 amino acid sequences of gene products were
obtained after the gene prediction. In order to identify groups of
orthologous genes, all amino acid sequences of gene products of
analyzed species were aligned to each other, we used the BLAST
program and the blastp [105] algorithm. Hits with an e-value
higher than 1025 were rejected. For the prediction of groups of
orthologous genes we used OrthoMCL program [120]. Altogether
we identified 27,674 groups of orthologous proteins. For further
analysis we selected groups which contained at least one gene of
each analyzed species or lineages, and complete promoter
sequences for all genes. Altogether we described 5,971 groups of
orthologous proteins for the A. thaliana, O. sativa, P. trichocarpa and
C. sativus: lines B10 and 9930 (Dataset S1). Subsequently, on the
basis of analysis of promoter sequences of these genes we described
common and different groups of orthologous genes in these species
Comparative Genomics of Five Plant Genomes
PLoS ONE | www.plosone.org 14 July 2011 | Volume 6 | Issue 7 | e22728

and lineages with respect to the occurrence of regulatory elements
ABRE, DRE and ERE and combinations thereof.
Functional classification of genes containing ABRE, DREand ERE elements in their promoters
The division of A. thaliana, P. trichocarpa, and O. sativa genes
into appropriate structural and functional groups was
performed on the basis of information obtained from the ftp
server: http://www.popgenie.rg/popgenie1/ for analysis of P.
trichocarpa; ftp://ftp.plantbiology.msu.edu/pub/data/Eukar-
yotic_Projects/o_sativa/annotation_dbs/ for analysis of O.
sativa; and ftp://ftp.arabidopsis.org/home/tair/Ontologies/
Gene_Ontology/ for A. thaliana. The assignment of functional
groups for C. sativus line B10 proteins was performed by the
functional annotation described in the online methods. This
division was then unified by manual mapping of numerical
identifiers of Generic GO Annotations to the GO Slim TAIR
category (www.arabidopsis.org). Genes of the analyzed species
were divided, according to function and cellular localization,
into appropriate groups: GO Cellular Component, GO
Molecular Function and GO Biological Process. In gene
promoter sequences for each group we have described the
occurrence of cis regulatory elements ABRE, DRE, ERE and
their combinations ABRE-DRE, ABRE-ERE, DRE-ERE, and
ABRE-DRE-ERE in A. thaliana, C. sativus line B10, O. sativa
and P. trichocarpa.
Identification of putative transcription factors from C.sativus line B10 and 9930
In order to identify putative transcription factors of C. sativus line
B10 and line 9930, amino acid sequences of gene products were
scanned using PFAM [121]. Hits with an e-value higher than 1025
were rejected. Hits with the highest similarity to known
Arabidopsis AREBs (Abscisic Acid–Responsive Element Binding
Protein), ERFs (Ethylene-responsive Element-binding Factor) and
DREBs/CBFs (DRE binding proteins) were aligned by ClustalW
and phylogenetic trees using Neighbour-Joining method were
prepared using MEGA 4 program [122].
ABA treatment and electrolyte leakageArabidopsis and cucumber seedlings were subjected to 200 mM
Abscisic acid (ABA) (Sigma Aldrich, St. Louis, MO, USA) for 3
days. The last ABA treatment was made 3 hours before freezing
treatment. Electrolyte leakage experiments were performed as
previously described [123] with the following modifications.
Detached Arabidopsis and cucumber leaves leaf were placed in test
tube and submerged for one hour in 22uC bath containing water
and propylene glycol, after which ice crystals were added to
initialize crystallization. After one hour of incubation in 22uCsamples were cooled to 24uC and kept for additional hour.
Samples (at least five replicates for each data point) were thawed
overnight in 4uC in 1.5 ml of distilled water. Electrolyte leakage
was measured after addition to each sample of 18.5 ml of distilled
water. To obtain total electrolyte leakage samples were frozen for
at least one hour in 280uC and tested as above.
Supporting Information
Dataset S1 CRE distributions among two cucumber (Cucumis
sativus) genotypes.
(XLS)
Dataset S2 Putative transcription factors representing AP2_ER-
EBP and bZIP families from two cucumber (Cucumis sativus) genotypes.
(XLS)
Dataset S3 Comparison of the composition of the genes
belonging to the different (BP, MF, CC) Gene Ontology functional
groups (GOAN) of the two cucumber varieties.
(XLS)
Figure S1 Diagram of cumulative read lengths obtained after
unpaired and paired 454 XLR Titanium sequencing of the B10
line. (A) Length of reads after sequencing (blue) UNpaired (UN
86) and (red) PAired (PA 46) libraries, before linker trimming. (B)
Length of reads after sequencing (purple)UNpaired (UN 86)
library and paired (46) library, obtained after linker searching and
trimming, which resulted in sequences: (red) paired with full linker,
(blue) unpaired because of having partial or multi linker and
(green) unpaired because of no linker sequences found. 454 XLR
Titanium reads were obtained after sequencing of unpaired
fragments of 86 genome coverage and sequencing of paired
fragments (3 Kbp insert size) with 46 genome coverage. Both
types of reads were processed for adapters and linkers trimming
with scripts: sff_extract v0.2.3 and sffinfo from Newbler package
v2.0.00.20.
(TIF)
Figure S2 Read depth distributionsa of the 454 XLR Titanium
reads on the cucumber B10 line genome assembly. aThe 454 XLR
Titanium reads sequencing depth was derived after the Celera
assembly step.
(TIF)
Figure S3 Homology of 554 contigs of the 9930 line genome
with bacterial genomes. A total of 554 contigs of line 9930 were
suspected of representing bacterial genome contigs encoded
bacterial proteins. These contigs were aligned to the whole
nucleotide GenBank database using the blastn algorithm.
(TIF)
Figure S4 Composition and percentage of bacterial genera
represented by suspected contaminating contigs of the 9930 line
genome. Cumulative percentage of homologies to the bacterial
genera after BLAST alignment of 554 genome contigs of 9930 line
suspected of representing bacterial contamination to the GenBank
nucleotide database using the blastn algorithm.
(TIF)
Figure S5 Dot-plot of B10 vs. 9930 lines genomes. The Dot-plot
figure shows the homology and possible rearrangements between
genomic contigs of the two cucumber genotypes. It was made
using the MUMmer 3.20 software on repeat-masked contigs
longer than 1 Kbp. Red dots represent the same orientation and
the blue dots represent the reverse orientation of homolog
sequences. Horizontal and vertical axes contain 9930 and B10
genome contigs respectively.
(TIF)
Figure S6 Chromosomal rearrangements between cucumber
varieties. Figure shows chromosomal localization of genetic
markers and genomic sequences anchored on chromosomes I–
VII and a comparison between the B10 and 9930 lines
(chromosome numbering is according to the Borszczagowski
karyotype [80] (brackets contain Chinese Long [67] karyotype
numbering)). a - Chromosome 1 (4), b - Chromosome 2, c –
Chromosome 3, d – Chromosome 4 (6), e – Chromosome 5 (1), f –
Chromosome 6 (5), g – Chromosome 7. The B10 and 9930
genome scaffolds are shown on the top and middle panels,
respectively. The lower panel presents localization of markers on
the genetic map. The numbers above top panel represent the
relative genomic length of the chromosome. The top lines show
chromosomal rearrangements between sequences of two genomes
Comparative Genomics of Five Plant Genomes
PLoS ONE | www.plosone.org 15 July 2011 | Volume 6 | Issue 7 | e22728

and the bottom lines connect genetic map markers with the
sequences of the 9930 line. The 9930 line genotype is set as the
reference genome because of the genetic markers originating from
this genotype. Boxes of the same color represent scaffolds with
high homology between the two cucumber genotypes (or the same
scaffolds) and the gradient plot shows the relative homology
between them. The B10 genotype boxes above the horizontal line
represent scaffold sequences in the same orientation as in the 9930
line, and the boxes below the line indicate scaffold sequences in
reverse orientation relative to the 9930 genotype.
(TIF)
Figure S7 Comparison of GOSlim functional groups between
two cucumber genomes (B10 and 9930 lines) and Arabidopsis
thaliana. (A) Biological Process functional groups. (B) Molecular
Function functional groups. (C) Cellular Component functional
groups.
(TIF)
Figure S8 Distribution of CREs in C. sativus line B10 promoters.
Promoters from C. sativus were divided into 50 bp fragments and
the content of each CRE was determined. Increased density of
ABRE, DRE and ERE in sequences less than 300 bp may indicate a
major regulatory role of this elements in C. sativus. gene expression.
(TIF)
Figure S9 Structural and functional analysis of A. thaliana, P.
trichocarpa, O. sativa, and C. sativus genes, whose promoter sequences
contain the cis regulatory elements ABRE, DRE, ERE and
combinations thereof. Analysis was performed on the basis of
Gene Ontology annotations (GO). (A) Percentage of A. thaliana, P.
trichocarpa, O. sativa, C. sativus genes which encode proteins of
distinct cellular localization. (B) Percentage of A. thaliana, P.
trichocarpa, O. sativa, C. sativus genes which encode proteins of
distinct molecular function. (C) Percentage of A. thaliana, P.
trichocarpa, O. sativa, C. sativus genes which encode proteins involved
in distinct biological processes.
(TIF)
Figure S10 Structural analysis of promoters of orthologic genes
of interest between the two C. sativus lines. Sequence alignments
were performed using ClustalW software. (A) Mutation analysis in
promoter sequences. Dotted lines show low homology regions. (B)
CRE analysis between promoter sequences of the two C. sativus
lines. The CRE searches were done using the PlantCARE
software.
(TIF)
Figure S11 Sequence alignment of selected putative AREBs
from A. thaliana, C. sativus B10 and 9930, P. trichocarpa and O. sativa.
Conserved domains (C1–C3) and bZIP are shown (top). Sequences
were aligned using ClustalW and edited in Jalview program.
(TIF)
Figure S12 An unrooted phylogenetic tree of selected putative
AREBs from A. thaliana (dark blue triangle (m)), C. sativus B10
(green circle (N)) and 9930 (khaki circle (N)), P. trichocarpa (purple
rhombus (¤)) and O. sativa (light grey square (&)). The amino acid
sequences from selected putative AREBs were aligned by
ClustalW and phylogenetic tree was constructed using MEGA
4.0 and Neighbor-Joining method (bootstrap = 1000).
(TIF)
Figure S13 Sequence alignment of selected putative AP2/ERF-
domain containing proteins from A. thaliana, C. sativus B10 and
9930 and P. trichocarpa. Sequences were aligned using ClustalW
and edited in Jalview program.
(TIF)
Figure S14 An unrooted phylogenetic tree of selected putative
AP2/ERF-domain containing proteins A. thaliana (dark blue
triangle (m)), C. sativus B10 (green circle (N) and 9930 (khaki
circle (N)), P. trichocarpa (purple rhombus (¤)) and O. sativa (light
grey square (&)). The amino acid sequences from selected putative
AP2/ERF-domain containing proteins were aligned by ClustalW
and phylogenetic tree was constructed using MEGA 4.0 and
Neighbor-Joining method (bootstrap = 1000).
(TIF)
Table S1 Characteristics of BAC end sequences (BESs).
Characteristics of BESs obtained from two BAC libraries of B10
line of cucumber. BESs were trimmed and screened for
contamination with vector and bacterial genomes using Lucy
v1.20 and BLAST. BLAST was also used to find chloroplast and
mitochondrion genome sequences.
(XLS)
Table S2 Length characteristics of 454 XLR Titanium unpaired
(86) and paired (46) reads after trimming of adaptors and linkers.
Processing of 454 XLR Titanium 46 paired library fragments,
recovered paired reads and also unpaired reads. Fragments from
this library which had no linker at all and fragments with partial or
multiple linkers were treated as unpaired reads (the same as all of
the reads from the 86 unpaired library). The only paired reads
were recovered from fragments containing full linker sequences.
(XLS)
Table S3 Results of the B10 line genome assembly steps and
comparison with two other cucumber genome assemblies. aN50
refers to the size above which half of the total length of the
sequence set can be found.
(XLS)
Table S4 Summary of sequencing reads used by the assembly
programs.
(XLS)
Table S5 Characteristics of microsatellite sequences (SSRs)
coming from BESs and genome contigs of the B10 line. SSRs
(mono- to octanucleotides) longer than 12 nt, with at least 3 repeat
unitswere searched in BES and genome contigs of the B10 line
using the MISA software. The table shows the minimum of four
most frequent motifs for each motif group. The SSR density were
calculated as count per Mbp.
(XLS)
Table S6 Characteristics of plant repeat elements found in BESs
and genome contigs of the B10 line. Plant repeat elements were
classified after BLAST alignment of the B10 line BESs and genome
contigs to the database of those elements at Michigan State University.
(XLS)
Table S7 Detailed results of anchoring the sequences from both
assembly versions on chromosomes using different methodologies.aThe Arachne (version B) assembly was anchored on chromo-
somes using both the Arachne package specific scripts and BLAST
aligning. The Celera (version A) genome sequence was anchored
on chromosomes only with the use of BLAST. bCross-mapping
results of Celera vs Arachne genome sequence on chromosomes.
The first number represents the Arachne (version B) assembly and
the second number represents the Celera (version A) assembly.
(XLS)
Table S8 Results of gene predictions on B10 and 9930 genomes.
All gene predictions were done using the GeneMark.hmm ES 3.0
on contigs longer than 1 Kbp. aContigs assumed to represent
bacterial contamination were identified using the BLAST
Comparative Genomics of Five Plant Genomes
PLoS ONE | www.plosone.org 16 July 2011 | Volume 6 | Issue 7 | e22728

alignments of predicted genes, proteins and contigs containing
them in the GenBank submission of 9930 line of Chinese Long
variety of cucumber (Huang S., et al., 2009). bAs reported in
publication by Huang S., et al., 2009. cMean gene length
calculated as mean transcription region length plus half of the
mean intergenic region length.
(XLS)
Table S9 Specificity (Sp) and sensitivity (Sn) of GeneMark.hmm
ES 3.0 gene prediction model.
(XLS)
Table S10 Basic characterization of functional annotation
results for B10 and 9930 genomes. All gene predictions were
performed using the GeneMark.hmm ES 3.0 on contigs longer
than 1 Kbp. Predicted polypeptides were aligned to the protein
GenBank database using BLAST and blastx algorithm. aContigs
assumed to represent bacterial contamination were found using
the BLAST alignments of predicted genes, proteins and contigs
containing them in the GenBank submission of 9930 line of
Chinese Long variety of cucumber (Huang S., et al., 2009).bGeneBank annotated homologies without putative protein,
unknown protein, expressed protein, hypothetical protein anno-
tations. cGene Ontology annotation of proteins was performed by
mapping GenBank accession numbers to UniProt identifiers using
the iProClass database and then by mapping the identifiers to
GOAN using GoRetriver software.
(XLS)
Table S11 SNP and In/Del polymorphism differences between
B10 and 9930 line genotypes. SNP polymorphisms were identified
using the MUMmer 3.20 software between genomic contigs of
B10 line and 9930 line genomes of minimum 1 Kbp length.
(XLS)
Table S12 Table S11_5 - Deteiled characteristics of different
length In/Del polimorphism: 1–2 bp (ultra), 3–10 bp (mikro), 11–
50 bp (mini), 51–100 bp (midi).
(XLS)
Table S13 Functional differences between cucumber varieties.
Table shows characteristics of 38 functional groups of genes, which
number significantly differ (minimum 2-fold) between the two
cucumber genotypes (B10 and 9930 line). Green and red colors
indicate the fold-value of differentiation of genes in functional
groups important for Darwinian fitness. BP – Biological Process,
MF – Molecular Function, CC – Cellular Component.
(XLS)
Table S14 Statistical analysis of ABREs, DREs and EREs in
promoter sequences in C. sativus Line B10. aThe probability of the
element occurring once in N base pairs (N = size of element), based
on nucleotide frequency in C. sativus line B10 promoter regions.bRarity factor is the total number of genes in the C. sativus line
B10 genome with this CRE in the proximal 1000 bp promoter, as
a fraction of all C. sativus genes. cEnrichment factor is the number
of genes with CREs in the proximal 1000 bp promoter divided by
the number of genes expected to have this CRE by chance
occurrence-based element probability. daverage is the number of
CREs in promoters with at least one CRE.
(XLS)
Acknowledgments
This article is in memory of Prof. Bogusław Kubicki. We would like to
thank the Applied Omics – science for better life, nauka dla rozwoju
(Warsaw, Poland) for providing additional bioinformatics resources.
Author Contributions
Conceived and designed the experiments: RW NT YH MB SK SM ZP.
Performed the experiments: RW JW PG JD AL MP ES WG KY WP AS
MS KN-S GB. Analyzed the data: RW PG JD AL. Contributed reagents/
materials/analysis tools: RW PG AL. Wrote the paper: RW PG JD MB SK
SM ZP. Genome assembly, chromosome anchoring, functional annotation,
sequence analysis, comparative genome analysis: RW. Gene predictions:
RW AL. Comparative analysis of promoters: PG RW JD.
References
1. Havey MJ (1997) Predominant Paternal Transmission of the Mitochondrial
Genome in Cucumber. J Hered 88: 232–235.
2. Ward BL, Anderson RS, Bendich AJ (1981) The mitochondrial genome is large
and variable in a family of plants (cucurbitaceae). Cell 25: 793–803.
3. Bartoszewski G, Havey MJ, Ziołkowska A, Długosz M, Malepszy S (2007) The
selection of mosaic (MSC) phenotype after passage of cucumber (Cucumis sativus
L.) through cell culture - a method to obtain plant mitochondrial mutants.
J Appl Genet 48: 1–9.
4. Malepszy S, Niemirowicz-Szczytt K (1991) Sex determination in cucumber
(Cucumis sativus) as a model system for molecular biology. Plant Sci 80: 39–47.
5. Ziołkowska A, Bartoszewski G, Burza W, Kuras M, Plader W, et al. (2005)
Mitochondrial mutant MSC cucumber shows impaired somatic embryogenesis.
Plant Cell Tissue Organ Cult 80: 329–338.
6. Grabowska A, Wisniewska A, Tagashira N, Malepszy S, Filipecki M (2009)
Characterization of CsSEF1 gene encoding putative CCCH-type zinc finger
protein expressed during cucumber somatic embryogenesis. J Plant Physiol
166: 310–323.
7. Malinowski R, Filipecki M, Tagashira N, Wisniewska A, Gaj P, et al. (2004)
Xyloglucan endotransglucosylase/hydrolase genes in cucumber (Cucumis sativus)
- differential expression during somatic embryogenesis. Physiol Plant 120:
678–685.
8. Ładyz_ynski M, Burza W, Malepszy S (2002) Relationship between somaclonal
variation and type of culture in cucumber. Euphytica 125: 349–356.
9. Filipecki M, Wisniewska A, Yin Z, Malepszy S (2005) The heritable changes in
metabolic profiles of plants regenerated in different types of in vitro culture.
Plant Cell Tissue Organ Cult 82: 349–356.
10. Plader W, Guzowska-Nowowiejska M (2009) Cucumber chloroplast genome
tiling microarray for light stress response analyses. N Biotechnol 25: Supl. 1.
11. Guzowska-Nowowiejska M, Fiedorowicz E, Plader W (2009) Cucumber,
melon, pumpkin, and squash: Are rules of editing in flowering plants
chloroplast genes so well known indeed? Gene 434: 1–8.
12. Arumuganathan K, Earle ED (1991) Nuclear DNA content of some important
plant species. Plant Mol Biol Rep 9: 208–218.
13. Huang S, Li R, Zhang Z, Li L, Gu X, et al. (2009) The genome of the
cucumber, Cucumis sativus L. Nat Genet 41: 1275–1281.
14. Coyle S, Kroll E (2008) Starvation induces genomic rearrangements and
starvation-resilient phenotypes in yeast. Mol Biol Evol 25: 310–318.
15. Wu F, Tanksley SD (2010) Chromosomal evolution in the plant family
Solanaceae. BMC Genomics 11: 182.
16. Yogeeswaran K, Frary A, York TL, Amenta A, Lesser AH, et al. (2005)
Comparative genome analyses of Arabidopsis spp.: inferring chromosomal rearrange-
ment events in the evolutionary history of A. thaliana. Genome Res 15: 505–515.
17. Yamasaki S, Shimada E, Kuwano T, Kawano T, Noguchi N (2010)
Continuous UV-B Irradiation Induces Endoreduplication and Peroxidase
Activity in Epidermal Cells Surrounding Trichomes on Cucumber Cotyledons.
J Radiat Res 51: 187–196.
18. Ragu S, Faye G, Iraqui I, Masurel-Heneman A, Kolodner RD, et al. (2007)
Oxygen metabolism and reactive oxygen species cause chromosomal
rearrangements and cell death. Proc Natl Acad Sci U S A 104: 9747–9752.
19. Colson I, Delneri D, Oliver SG (2004) Effects of reciprocal chromosomal
translocations on the fitness of Saccharomyces cerevisiae. EMBO Rep 5: 392–398.
20. Cullis CA (1987) The Generation of Somatic and Heritable Variation in
Response to Stress. Am Nat 130: S62–S73.
21. Muhlenbock P, Plaszczyca M, Plaszczyca M, Mellerowicz E, Karpinski S
(2007) Lysigenous Aerenchyma Formation in Arabidopsis Is Controlled by
LESION SIMULATING DISEASE1. Plant Cell 19: 3819–3830.
22. Szechynska-Hebda M, Kruk J, Gorecka M, Karpinska B, Karpinski S (2010)
Evidence for Light Wavelength-Specific Photoelectrophysiological Signaling
and Memory of Excess Light Episodes in Arabidopsis. Plant Cell 22: 2201–2218.
23. Rossel JB, Wilson PB, Hussain D, Woo NS, Gordon MJ, et al. (2007) Systemic
and Intracellular Responses to Photooxidative Stress in Arabidopsis. Plant Cell
19: 4091–4110.
Comparative Genomics of Five Plant Genomes
PLoS ONE | www.plosone.org 17 July 2011 | Volume 6 | Issue 7 | e22728

24. Koussevitzky S, Nott A, Mockler TC, Hong F, Sachetto-Martins G, et al.
(2007) Signals from Chloroplasts Converge to Regulate Nuclear GeneExpression. Science 316: 715–719.
25. Yamaguchi-Shinozaki K, Shinozaki K (1994) A Novel cis-Acting Element in an
Arabidopsis Gene Is lnvolved in Responsiveness to Drought, Low-temperature,
or High-Salt Stress. Plant Cell 6: 251–264.
26. Geisler M, Kleczkowski LA, Karpinski S (2006) A universal algorithm forgenome-wide in silicio identification of biologically significant gene promoter
putative cis-regulatory-elements; identification of new elements for reactiveoxygen species and sucrose signaling in Arabidopsis. Plant J 45: 384–398.
27. McCourt P, Creelman R (2008) The ABA receptors – we report you decide.Curr Opin Plant Biol 11: 474–478.
28. Yasuda M, Ishikawa A, Jikumaru Y, Seki M, Umezawa T, et al. (2008)
Antagonistic Interaction between Systemic Acquired Resistance and the
Abscisic Acid–Mediated Abiotic Stress Response in Arabidopsis. Plant Cell 20:1678–1692.
29. Muhlenbock P, Szechynska-Hebda M, Płaszczyca M, Baudo M, Mateo A,
et al. (2008) Chloroplast Signaling and LESION SIMULATING DISEASE1Regulate Crosstalk between Light Acclimation and Immunity in Arabidopsis.
Plant Cell 20: 2339–2356.
30. Staub JE, Serquen FC, Horejsi T, Chen J-Feng (1999) Genetic diversity in
cucumber (Cucumis sativus L.): I. A reevaluation of the U.S. germplasmcollection. Genet Resour Crop Evol 46: 297–310.
31. Hanikenne M, Talke IN, Haydon MJ, Lanz C, Nolte A, et al. (2008) Evolutionof metal hyperaccumulation required cis-regulatory changes and triplication of
HMA4. Nature 453: 391–395.
32. Seliverstov AV, Lysenko EA, Lyubetsky VA (2009) Rapid evolution ofpromoters for the plastome gene ndhF in flowering plants. Russ J Plant Physiol
56: 926–934.
33. Kasprzak A, Safar J, Janda J, Dolezel J, Wolko B, et al. (2006) The bacterial
artificial chromosome (BAC) library of the narrow-leafed lupin (Lupinus
angustifolius L.). Cell Mol Biol Lett 11: 396–407.
34. Liang H, Fang EG, Tomkins JP, Luo M, Kudrna D, et al. (2006) Developmentof a BAC library for yellow-poplar (Liriodendron tulipifera) and the identification
of genes associated with flower development and lignin biosynthesis. TreeGenet Genomes 3: 215–225.
35. Jacobs G, Dechyeva D, Wenke T, Weber B, Schmidt T (2009) A BAC library
of Beta vulgaris L. for the targeted isolation of centromeric DNA and molecular
cytogenetics of Beta species. Genetica 135: 157–167.
36. Winters A, Heywood S, Farrar K, Donnison I, Thomas A, et al. (2009)Identification of an extensive gene cluster among a family of PPOs in Trifolium
pratense L. (red clover) using a large insert BAC library. BMC Plant Biol 9: 94.
37. Guan Y, Chen Q, Pan J, Li Z, He H, et al. (2008) Construction of a BAC
library from cucumber (Cucumis sativus L.) and identification of linkage groupspecific clones. Prog Nat Sci 18: 143–147.
38. Nam Y-W, Lee J-R, Song K-H, Lee M-K, Robbins MD, et al. (2005)
Construction of two BAC libraries from cucumber (Cucumis sativus L.) and
identification of clones linked to yield component quantitative trait loci. TheorAppl Genet 111: 150–161.
39. Tomkins JP, Luo M, Fang GC, Main D, Goicoechea JL, et al. (2002) New
genomic resources for the honey bee (Apis mellifera L.): development of a deep-
coverage BAC library and a preliminary STC database. Genet Mol Res 1:306–316.
40. Hong YS, Hogan JR, Wang X, Sarkar A, Sim C, et al. (2003) Construction of a
BAC library and generation of BAC end sequence-tagged connectors forgenome sequencing of the African malaria mosquito Anopheles gambiae. Mol
Genet Genomics 268: 720–728.
41. Lacombe E, Cossegal M, Mirouze M, Adam T, Varoquaux F, et al. (2008)
Construction and characterisation of a BAC library from Arabidopsis halleri:Evaluation of physical mapping based on conserved synteny with Arabidopsis
thaliana. Plant Sci 174: 634–640.
42. Shi B-J, Gustafson JP, Button J, Miyazaki J, Pallotta M, et al. (2009) Physical
analysis of the complex rye (Secale cereale L.) Alt4 aluminium (aluminum)tolerance locus using a whole-genome BAC library of rye cv. Blanco. Theor
Appl Genet 119: 695–704.
43. Ammiraju JSS, Luo M, Goicoechea JL, Wang W, Kudrna D, et al. (2006) The
Oryza bacterial artificial chromosome library resource: construction andanalysis of 12 deep-coverage large-insert BAC libraries that represent the 10
genome types of the genus Oryza. Genome Res 16: 140–147.
44. Diguistini S, Liao NY, Platt D, Robertson G, Seidel M, et al. (2009) De novo
genome sequence assembly of a filamentous fungus using Sanger, 454 andIllumina sequence data. Genome Biol 10: R94.
45. Quinn NL, Levenkova N, Chow W, Bouffard P, Boroevich KA, et al. (2008)
Assessing the feasibility of GS FLX Pyrosequencing for sequencing the Atlantic
salmon genome. BMC Genomics 9: 404.
46. Reinhardt JA, Baltrus DA, Nishimura MT, Jeck WR, Jones CD, et al. (2009)De novo assembly using low-coverage short read sequence data from the rice
pathogen Pseudomonas syringae pv. oryzae. Genome Res 19: 294–305.
47. Meyer E, Aglyamova GV, Wang S, Buchanan-Carter J, Abrego D, et al. (2009)
Sequencing and de novo analysis of a coral larval transcriptome using 454 GSFLX. BMC Genomics 10: 219.
48. Vera JC, Wheat CW, Fescemyer HW, Frilander MJ, Crawford DL, et al.
(2008) Rapid transcriptome characterization for a nonmodel organism using
454 pyrosequencing. Mol Ecol 17: 1636–1647.
49. Rounsley S, Marri PR, Yu Y, He R, Sisneros N, et al. (2009) De Novo NextGeneration Sequencing of Plant Genomes. Rice 2: 35–43.
50. Wicker T, Schlagenhauf E, Graner A, Close TJ, Keller B, et al. (2006) 454sequencing put to the test using the complex genome of barley. BMC Genomics
7: 275.
51. Velasco R, Zharkikh A, Troggio M, Cartwright DA, Cestaro A, et al. (2007) A
high quality draft consensus sequence of the genome of a heterozygous
grapevine variety. PloS One 2: e1326.
52. Miller JR, Delcher AL, Koren S, Venter E, Walenz BP, et al. (2008) Aggressive
assembly of pyrosequencing reads with mates. Bioinformatics 24: 2818–2824.
53. Goldberg SMD, Johnson J, Busam D, Feldblyum T, Ferriera S, et al. (2006) A
Sanger/pyrosequencing hybrid approach for the generation of high-qualitydraft assemblies of marine microbial genomes. Proc Natl Acad Sci U S A 103:
11240–11245.
54. Cavagnaro PF, Senalik D, Yang L, Simon PW, Harkins TT, et al. (2010)
Genome-wide characterization of simple sequence repeats in cucumber(Cucumis sativus L.). BMC Genomics 11: 569.
55. Batzoglou S, Jaffe DB, Stanley K, Butler J, Gnerre S, et al. (2002) ARACHNE:A Whole-Genome Shotgun Assembler. Genome Res 12: 177–189.
56. Zimin AV, Smith DR, Sutton G, Yorke JA (2007) Assembly reconciliation.Bioinformatics 24: 42–45.
57. Eck SH, Benet-Pages A, Flisikowski K, Meitinger T, Fries R, et al. (2009)
Whole genome sequencing of a single Bos taurus animal for single nucleotidepolymorphism discovery. Genome Biol 10: R82.
58. Zharkikh A, Troggio M, Pruss D, Cestaro A, Eldrdge G, et al. (2008)Sequencing and assembly of highly heterozygous genome of Vitis vinifera L. cv
Pinot Noir: problems and solutions. J Biotechnol 136: 38–43.
59. Walter NA, Bottomly D, Laderas T, Mooney MA, Darakjian P, et al. (2009)
High throughput sequencing in mice: a platform comparison identifies apreponderance of cryptic SNPs. BMC Genomics 10: 379.
60. Ossowski S, Schneeberger K, Clark RM, Lanz C, Warthmann N, et al. (2008)Sequencing of natural strains of Arabidopsis thaliana with short reads. Genome
Res 18: 2024–2033.
61. Wheat CW (2010) Rapidly developing functional genomics in ecological model
systems via 454 transcriptome sequencing. Genetica 138: 433–451.
62. Shulaev V, Sargent DJ, Crowhurst RN, Mockler TC, Folkerts O, et al. (2010)
The genome of woodland strawberry (Fragaria vesca). Nat Genet 43: 109–116.
63. Argout X, Salse J, Aury JM, Guiltinan MJ, Droc G, et al. (2010) The genome ofTheobroma cacao. Nat Genet 43: 101–108.
64. Dalloul RA, Long JA, Zimin AV, Aslam L, Beal K, et al. (2010) Multi-platformnext-generation sequencing of the domestic turkey (Meleagris gallopavo): genome
assembly and analysis. PLoS Biol 8: e1000475.
65. Schatz MC, Delcher AL, Salzberg SL (2010) Assembly of large genomes using
second-generation sequencing. Genome Res 20: 1165–1173.
66. Zhao X, Lu J, Zhang Z, Hu J, Huang S (2011) Comparison of the distribution
of the repetetive DNA sequences in Tyree variants of Cucumis sativus revealstheir phylogenetic reletionships. J Genet Genomics 38: 39–45.
67. Han YH, Zhang ZH, Liu JH, Lu JY, Huang SW, et al. (2008) Distribution ofthe tandem repeat sequences and karyotyping in cucumber (Cucumis sativus L.)
by fluorescence in situ hybridization. Cytogenet. Genome Res 122: 80–88.
68. Farrer RA, Kemen E, Jones JDG, Studholme DJ (2009) De novo assembly of
the Pseudomonas syringae pv. syringae B728a genome using Illumina/Solexa short
sequence reads. FEMS Microbiol Lett 291: 103–111.
69. Ren Y, Zhang Z, Liu J, Staub JE, Han Y, et al. (2009) An Integrated Genetic
and Gytogenetic Map of the Cucumber Genome. PloS One 4: e5795.
70. Lomsadze A, Ter-Hovhannisyan V, Chernoff YO, Borodovsky M (2005) Gene
identification in novel eukaryotic genomes by self-training algorithm. NucleicAcids Res 33: 6494–6506.
71. Haas BJ, Salzberg SL, Zhu W, Pertea M, Allen JE, et al. (2008) Automatedeukaryotic gene structure annotation using EVidenceModeler and the Program
to Assemble Spliced Alignments. Genome Biol 9: R7.
72. Wei C, Brent MR (2006) Using ESTs to improve the accuracy of de novo gene
prediction. BMC Bioinformatics 7: 327.
73. Ter-Hovhannisyan V, Lomsadze A, Chernoff YO, Borodovsky M (2008) Gene
prediction in novel fungal genomes using an ab initio algorithm with
unsupervised training. Genome Res 18: 1979–1990.
74. Ashburner M, Ball CA, Blake JA, Botstein D, Butler H, et al. (2000) Gene
ontology: tool for the unification of biology. The Gene Ontology Consortium.Nat Genet 25: 25–29.
75. Schmid KJ, Sorensen TR, Stracke R, Torjek O, Altmann T, et al. (2003)Large-scale identification and analysis of genome-wide single-nucleotide
polymorphisms for mapping in Arabidopsis thaliana. Genome Res 13:1250–1257.
76. Yu J, Wang J, Lin W, Li S, Li H, et al. (2005) The Genomes of Oryza sativa: ahistory of duplications. PLoS Biol 3: e38.
77. Margulies M, Egholm M, Altman WE, Attiya S, Bader JS, et al. (2005)
Genome sequencing in microfabricated high-density picolitre reactors. Nature437: 376–380.
78. Antonov I, Borodovsky M (2010) Genetack: frameshift identification in protein-coding sequences by the Viterbi algorithm. J Bioinform Comput Biol 8:
535–551.
79. Kislyuk A, Lomsadze A, Lapidus AL, Borodovsky M (2009) Frameshift
detection in prokaryotic genomic sequences. Int J Bioinform Res Appl 5:458–77.
Comparative Genomics of Five Plant Genomes
PLoS ONE | www.plosone.org 18 July 2011 | Volume 6 | Issue 7 | e22728

80. Hoshi Y, Plader W, Malepszy S (1998) New C-banding pattern for
chromosome identification in cucumber (Cucumis sativus L.). Plant Breed 117:77–82.
81. Perez-Rodrıguez P, Riano-Pachon DM, Correa LGG, Rensing SA, Kersten B,
et al. (2010) PlnTFDB: updated content and new features of the planttranscription factor database. Nucleic Acids Res 38: D822–D827.
82. Lescot M, Dehais P, Thijs G, Marchal K, Moreau Y, et al. (2002) PlantCARE,a database of plant cis-acting regulatory elements and a portal to tools for in
silico analysis of promoter sequences. Nucleic Acids Res 30: 325–327.
83. Hundertmark M, Hincha DK (2008) LEA (Late Embryogenesis Abundant)proteins and their encoding genes in Arabidopsis thaliana. BMC Genomics 9:
118.84. Bloom AJ, Smart DR, Nguyen DT, Searles PS (2002) Nitrogen assimilation
and growth of wheat under elevated carbon dioxide. Proc Natl Acad Sci U S A99: 1730–1735.
85. Bloom AJ, Burger M, Rubio Asensio JS, Cousins AB (2010) Carbon dioxide
enrichment inhibits nitrate assimilation in wheat and Arabidopsis. Science 328:899–903.
86. Wirgin I, Roy NK, Loftus M, Chambers RC, Franks DG, et al. (2011)Mechanistic Basis of Resistance to PCBs in Atlantic Tomcod from the Hudson
River. Science 331: 1322–1325.
87. Sun S, Xu J (2009) Chromosomal rearrangements between serotype A and Dstrains in Cryptococcus neoformans. PloS One 4: e5524.
88. Dunham MJ, Badrane H, Ferea T, Adams J, Brown PO, et al. (2002)Characteristic genome rearrangements in experimental evolution of Saccharo-
myces cerevisiae. Proc Natl Acad Sci U S A 99: 16144–16149.89. Swanson-Wagner RA, Eichten SR, Kumari S, Tiffin P, Stein JC, et al. (2010)
Pervasive gene content variation and copy number variation in maize and its
undomesticated progenitor. Genome Res 20: 1689–1699.90. Kidd JM, Graves T, Newman TL, Fulton R, Hayden HS, Malig M, et al.
(2010) A Human Genome Structural Variation Sequencing Resource RevealsInsights into Mutational Mechanisms. Cell 143: 837–847.
91. Howarth KD, Pole JC, Beavis JC, Batty EM, Newman S, et al. (2011) Large
duplications at reciprocal translocation breakpoints that might be thecounterpart of large deletions and could arise from stalled replication bubbles.
Genome Res 21: 525–534.92. Sebastian P, Schaefer H, Telford IRH, Renner SS (2010) Cucumber (Cucumis
sativus) and melon (C. melo) have numerous wild relatives in Asia and Australia,and the sister species of melon is from Australia. Proc Natl Acad Sci U S A 107:
14269–14273.
93. Wittkopp PJ, Haerum BK, Clark AG (2004) Evolutionary changes in cis andtrans gene regulation. Nature 430: 85–88.
94. Kasowski M, Grubert F, Heffelfinger C, Hariharan M, Asabere A, et al. (2010)Variation in transcription factor binding among humans. Science 328:
232–235.
95. Zhang X, Fowler SG, Cheng H, Lou Y, Rhee SY, et al. (2004) Freezing-sensitive tomato has a functional CBF cold response pathway, but a CBF
regulon that differs from that of freezing-tolerant Arabidopsis. Plant J 39:905–919.
96. Delker C, Poschl Y, Raschke A, Ullrich K, Ettingshausen S, et al. (2010)Natural Variation of Transcriptional Auxin Response Networks in Arabidopsis
thaliana. Plant Cell 22: 2184–2200.
97. Weirauch MT, Hughes TR (2010) Conserved expression without conservedregulatory sequence: the more things change, the more they stay the same.
Trends Genet 26: 66–74.98. Schmidt D, Wilson MD, Ballester B, Schwalie PC, Brown GD, et al. (2010)
Five-Vertebrate ChIP-seq Reveals the Evolutionary Dynamics of Transcription
Factor Binding. Science 328: 1036–1040.99. Yu J, Hu S, Wang J, Wong GK-S, Li S, et al. (2002) A draft sequence of the
rice genome (Oryza sativa L. ssp. indica). Science 296: 79–92.100. Tuskan GA, Difazio S, Jansson S, Bohlmann J, Grigoriev I, et al. (2006) The
genome of black cottonwood, Populus trichocarpa (Torr. & Gray). Science 313:
1596–1604.
101. Tirosh I, Weinberger A, Bezalel D, Kaganovich M, Barkai N (2008) On the
relation between promoter divergence and gene expression evolution. Mol Syst
Biol 4: 1–11.
102. Tuch BB, Galgoczy DJ, Hernday AD, Li H, Johnson AD (2008) The evolution
of combinatorial gene regulation in fungi. PLoS Biol 6: e38.
103. Gutman W, Pawełkowicz M, Woycicki R, Piszczek E, Przybecki Z (2008) Theconstruction and characteristics of a BAC library for Cucumis sativus L. ‘‘B10.’’
Cell Mol Biol Lett 13: 74–91.
104. Chou H-H, Holmes MH (2001) DNA sequence quality trimming and vectorremoval. Bioinformatics 17: 1093–1104.
105. Altschul SF, Madden TL, Schaffer AA, Zhang J, Zhang Z, et al. (1997) Gapped
BLAST and PSI-BLAST: a new generation of protein database searchprograms. Nucleic Acids Res 25: 3389–3402.
106. Plader W, Yukawa Y, Sugiura M, Malepszy S (2007) The complete structure of
the cucumber (Cucumis sativus L.) chloroplast genome: its composition andcomparative analysis. Cell Mol Biol Lett 12: 584–594.
107. Witkowicz J, Urbanczyk-Wochniak E, Przybecki Z (2003) AFLP marker
polymorphism in cucumber (Cucumis sativus L.) near isogenic lines differing insex expression. Cell Mol Biol Lett 8: 375–381.
108. Przybecki Z, Kowalczyk ME, Siedlecka E, Urbanczyk-Wochniak E, Malepszy S
(2003) The isolation of cDNA clones from cucumber (Cucumis sativus L.) floralbuds coming from plants differing in sex. Cell Mol Biol Lett 8: 421–438.
109. Przybecki Z, Kowalczyk ME, Witkowicz J, Filipecki M, Siedlecka E (2004)
Polymorphom of sexually different cucumber (Cucumis sativus L.) NIL lines. CellMol Biol Lett 9: 919–933.
110. Jaffe DB, Butler J, Gnerre S, Mauceli E, Lindblad-Toh K, et al. (2003) Whole-
genome sequence assembly for mammalian genomes: Arachne 2. Genome Res13: 91–96.
111. Ouyang S, Buell CR (2004) The TIGR Plant Repeat Databases: a collective
resource for the identification of repetitive sequences in plants. Nucleic AcidsRes 32: D360–D363.
112. Jurka J, Kapitonov VV, Pavlicek A, Klonowski P, Kohany O, et al. (2005)
Repbase Update, a database of eukaryotic repetitive elements. Cytogenet.Genome Res 110: 462–467.
113. Kurtz S, Phillippy A, Delcher AL, Smoot M, Shumway M, et al. (2004)
Versatile and open software for comparing large genomes. Genome Biol 5:R12.
114. Kent WJ (2002) BLAT—The BLAST-Like Alignment Tool. Genome Res 12:
656–664.
115. Stajich JE, Block D, Boulez K, Brenner SE, Chervitz SA, et al. (2002) TheBioperl toolkit: Perl modules for the life sciences. Genome Res 12: 1611–1618.
116. Woycicki R, Gutman W, Przybecki Z (2009) BRAGOMAP – a new Perl script
for high throughoutput blast results analysis including GO and MapManautomatic annotations. Nature, Precedings at http://dx.doi.org/10.1038/npre.
2009.3900.1.
117. Wu CH, Yeh L-SL, Huang H, Arminski L, Castro-Alvear J, et al. (2003) TheProtein Information Resource. Nucleic Acids Res 31: 345–347.
118. McCarthy FM, Wang N, Magee GB, Nanduri B, Lawrence ML, et al. (2006)
AgBase: a functional genomics resource for agriculture. BMC Genomics 7: 229.
119. Darling ACE, Mau B, Blattner FR, Perna NT (2004) Mauve: multiple
alignment of conserved genomic sequence with rearrangements. Genome Res
14: 1394–1403.
120. Li L, Stoeckert CJ, Roos DS (2003) OrthoMCL: identification of ortholog
groups for eukaryotic genomes. Genome Res 13: 2178–2189.
121. Finn RD, Mistry J, Tate J, Coggill P, Heger A, et al. (2010) The Pfam proteinfamilies database. Nucleic Acids Res 38: D211–D222.
122. Kumar S, Nei M, Dudley J, Tamura K (2008) MEGA: a biologist-centric
software for evolutionary analysis of DNA and protein sequences. BriefBioinform 9: 299–306.
123. Jaglo-Ottosen KR, Gilmour SJ, Zarka DG, Schabenberger O, Thomashow MF
(1998) Arabidopsis CBF1 Overexpression Induces COR Genes and EnhancesFreezing Tolerance. Science 280: 104–106.
Comparative Genomics of Five Plant Genomes
PLoS ONE | www.plosone.org 19 July 2011 | Volume 6 | Issue 7 | e22728