biogeographical patterns of variation, and taxonomy. - WUR ...
Upload
independentCategory
view
0download
0
Molecular Ecology (2011) doi: 10.1111/j.1365-294X.2011.05223.x
A combined genetic-morphometric analysis unravels thecomplex biogeographical history of Polyommatus icarusand Polyommatus celina Common Blue butterflies
VLAD DINCA,*† LEONARDO DAPPORTO‡ and ROGER VILA*
*Institut de Biologia Evolutiva (CSIC-UPF), Passeig Marıtim de la Barceloneta 37-49, 08003 Barcelona, Spain, †Departament de
Genetica i Microbiologia, Universitat Autonoma de Barcelona, 08193 Bellaterra (Barcelona), Spain, ‡Istituto Comprensivo
Materna Elementere Media Convenevole da Prato via 1� Maggio 40, 59100 Prato, Italy
Corresponde
E-mail: roger
� 2011 Black
Abstract
Widespread species have the potential to reveal large-scale biogeographical patterns, as
well as responses to environmental changes possibly unique to habitat generalists. This
study presents a continental-scale phylogeographical analysis of Polyommatus icarus,
one of the most common Palaearctic butterflies, and the morphologically and ecologically
similar Polyommatus celina, a recently discovered cryptic species. By combining data
from mitochondrial [cytochrome c oxidase subunit I (COI)] and nuclear [internal
transcribed spacer (ITS2)] molecular markers with geometric morphometrics, we
document a complex phylogeographical history for the two species. Despite morpho-
logical similarities, the genetic divergence between these two species is high (more than
5% at COI) and they are not sister species. For the first time, we show that P. celinaoccurs not only in North Africa but also in Europe, where it inhabits several west
Mediterranean islands, as well as large parts of Iberia, where it occurs in parapatry with
P. icarus. The two species appear to completely exclude each other on islands, but we
provide morphological and molecular evidence that introgression occurred in the Iberian
Peninsula. We discovered strongly diverged lineages that seem to represent relict
populations produced by past range expansions and contractions: Crete and Iberian
isolates for P. icarus, Balearics–Sardinia and Sicily–Lipari for P. celina. This study
shows that a combined genetic-morphometric approach can shed light on cryptic
diversity while providing the necessary resolution to reconstruct a fine-scale phylogeo-
graphical history of species at both spatial and temporal levels.
Keywords: cryptic species, geometric morphometrics, molecular markers, phylogeography,
Polyommatus celina, Polyommatus icarus
Received 31 March 2011; revision received 19 June 2011; accepted 27 June 2011
Introduction
Endemics and habitat specialists can reveal particular
evolutionary pathways and the occurrence of important
areas of endemism (Dennis et al. 1998; Garcıa-Barros
et al. 2002; Girardello et al. 2009; Morrone 2009; Grant
& Grant 2010), but their restricted distribution makes
them unsuitable for studying phylogeographical pat-
nce: Roger Vila, Fax: +34 932211011;
well Publishing Ltd
terns over large continental areas. Phylogeographical
assessments of widely distributed taxa allow the identi-
fication of broad distributional patterns (Hewitt 1999,
2000; Schmitt 2007). Moreover, habitat generalists are
likely to respond differently to environmental changes
compared with localized species with strict habitat pref-
erences. Because ca. 16% of butterfly species are known
to hybridize in Europe (Descimon & Mallet 2009), any
phylogeographical assessment should take into account
the effects of introgression and the evidence that taxa,
especially butterflies, can rapidly change their distributions

2 V. DIN CA , L . D APPORTO and R. VILA
in response to climatic variation (Parmesan et al. 1999;
Hill et al. 2002; Fisher et al. 2010). It is thus important
to use molecular techniques involving multiple markers
and refined morphometrical approaches, and to com-
pare populations from mainland and island
sites, because island populations often reflect unique
historical range shits (Avise 2009; Nazari et al. 2010;
Dapporto et al. 2011; Desamore et al. 2011; Dinca et al.
2011).
Several widespread butterfly species have been sub-
ject to biogeographical studies (Lohman et al. 2008;
Yago et al. 2008; Wu et al. 2010). The lycaenid Poly-
ommatus icarus is among the most common European
butterflies and has been recently shown to harbour
cryptic diversity. Recent phylogenetic studies revealed
that a different species, Polyommatus celina, replaces
P. icarus in North Africa (Wiemers 2003; Wiemers &
Fiedler 2007; Vodolazhsky & Stradomsky 2008; Wie-
mers et al. 2010). This taxon was previously recog-
nized as a subspecies of P. icarus and distinguished
on the basis of minor morphological differences in
wing pattern. However, the precise distribution of the
two species is poorly known, and none of the previ-
ous molecular studies analysed populations from
possible contact areas such as southern Italy or south-
ern Spain. Moreover, occurrence of the two species
on islands has never been assessed, although it
may be of great importance in reconstructing distribu-
tional patterns in the Mediterranean region (Dapporto
et al. 2009, 2011; Dapporto 2010). From this perspec-
tive, island populations of P. icarus ⁄ celina are likely to
retain important information explaining their
phylogeography and colonization routes. As an
example, Verity (1940–1953) classified the specimens
from Sicily as celina type and attributed the popula-
tions from Sardinia to the endemic taxon P. icarus
sardoa.
In this study, we combined molecular data from
mitochondrial [cytochrome c oxidase subunit I (COI)]
and nuclear [internal transcribed spacer (ITS2)] DNA
with geometric morphometrics of wing pattern and
male genitalia. Our goals are the following: (i) Assess
the precise distribution of the two species (including
the Mediterranean islands) with a special focus
on the areas where they are expected to be in contact
(Spain ⁄ Morocco and Italy ⁄ Sicily ⁄ Tunisia). (ii) Analyse
the characteristics of individuals from the contact
zone based on mitochondrial DNA, nuclear DNA and
geometric morphometrics. (iii) Assess the degree of
congruence between molecular and morphological
patterns. (iv) Reconstruct vicariance phenomena
and the colonization routes that could have produced
the observed pattern of distribution of the two
species.
Methods
We analysed 208 P. icarus and P. celina specimens
belonging to a large continental area of the West Palae-
arctic (Mediterranean, Central Europe, Turkey) and sev-
eral islands (Mallorca, Menorca, Elba, Corsica, Sardinia,
Sicily, Capri, Lipari, Crete, Fuerteventura) (Table S1,
Supporting information). For the molecular analyses,
several other Polyommatus taxa, which were sequenced
or had sequences extracted from GenBank, were used
as outgroup (Table S1, Supporting information). Agro-
diaetus damon was used to root the phylogenetic trees.
DNA extraction
Total genomic DNA was extracted using Chelex 100
resin, 100–200 mesh, sodium form (Biorad), under the
following protocol: one leg was removed and intro-
duced into 100 lL of Chelex 10% and 5 lL of Protein-
ase K (20 mg ⁄ mL) were added. The samples were
incubated overnight at 55 �C and were subsequently
incubated at 100 �C for 15 min. Samples were then cen-
trifuged for 10 s at 845 RCF (relative centrifugal force).
COI amplification
A 676-bp fragment at the 5¢ end of the mitochondrial
gene (COI) was amplified by polymerase chain reaction
using the primers LCO 1490 (5¢-GGTCAACAAATCAT
AAAGATATTGG-3¢) (Folmer et al. 1994) and Nancy
(5¢-CCCGGTAAAATTAAAATATAAACTTC-3¢) (Simo-
ns et al. 1994). When these primers failed, we used the
primers LepF1 (5¢-ATTCAACCAATCATAAAGATA
TTGG-3¢) and LepR1 (5¢-TAAACTTCTGGATGTCCAAA
AAATCA-3¢) (Hebert et al. 2004), which amplified a
658-bp fragment of COI. Double-stranded DNA was
amplified in 25-lL volume reactions: 13.22 lL auto-
claved Milli-Q water, 2.5 lL 10· buffer, 4.5 lL 25 mM
MgCl2, 0.25 lL 100 mM dNTP, 1.2 lL of each primer
(10 mM), 0.13 lL Taq DNA Gold Polymerase (Qiagen)
and 2 lL of extracted DNA. The typical thermal cycling
profile was: 95 �C for 60 s, 44 �C for 60 s and 72 �C for
90 s, for 40 cycles.
ITS2 amplification
A 640–646-bp fragment at the 5¢ end of the nuclear ITS2
was amplified by polymerase chain reaction using the
primers ITS3 (5¢-GCATCGATGAAGAACGCAGC-3¢)and ITS4 (5¢-TCCTCCGCTTATTGATATGC-3¢) (White
et al. 1990). Double-stranded DNA was amplified in
25-lL volume reactions: 14.4 lL autoclaved Milli-Q
water, 5 lL 5· buffer, 2 lL 25 mM MgCl2, 0.5 lL 10 mM
dNTP, 0.5 lL of each primer (10 mM), 0.1 lL Taq DNA
� 2011 Blackwell Publishing Ltd

B IOG EOG RAPHY IN C OMMON B L UE B UT TE RFLI ES 3
Polymerase (Promega) and 2 lL of extracted DNA. The
typical thermal cycling profile was: 95 �C for 45 s, 51 �C
for 60 s and 72 �C for 60 s, for 40 cycles.
Sequence alignment and phylogenetic inference
Cytochrome c oxidase subunit I and ITS2 sequences
were edited and aligned using GENEIOUS PRO 4.7.5 (Drum-
mond et al. 2009). These resulted in alignments of
676 bp of COI from 230 specimens, and 677 bp of ITS2
from 118 specimens. In the case of ITS2, we left substi-
tution heterozygotes as ambiguities. When encountering
heterozygotes for insertions or deletions, we determined
the phase of the sequences and edited them accord-
ingly.
All sequences have been deposited in GenBank
(accession nos JN084662–JN084791) (Table S1, Support-
ing information).
Maximum Likelihood (ML) phylogenetic trees were
obtained for COI, ITS2 and the combined data set using
PHYML 2.4.4 (Guindon & Gascuel 2003) implemented in
GENEIOUS. The nucleotide substitution models employed
were GTR + I + G for COI, HKY for ITS2 and TrN + G
for the combined data set, as suggested by JMODELTEST
0.1 (Posada 2008). Node supports were assessed using
100 bootstrap replicates for ML. For the combined data
set (114 specimens), Bayesian Inference (BI) and Maxi-
mum Parsimony analyses were run in addition to ML.
A BI multi-locus phylogenetic tree was also obtained
using MRBAYES v3.1.2 (Huelsenbeck & Ronquist 2001;
Ronquist & Huelsenbeck 2003). In this case, the substi-
tution models applied were GTR + G for COI and HKY
for ITS2 taking into account the suggestions of JMODEL-
TEST 0.1. For BI, MCMC convergence was checked after
two independent runs of one million generations each
(with a pre-run burn in of 1000 generations). The Maxi-
mum Parsimony analysis was run using MEGA version 5
(Tamura et al. 2011) under the Close-Neighbor-Inter-
change on Random Trees search method and 100 boot-
strap replicates for assessing node supports.
Dating divergence events
Node ages were estimated with BEAST v.1.6.1 (Drum-
mond & Rambaut 2007) separately for P. icarus and
P. celina COI haplotype data sets (Table S1, Supporting
information). Haplotypes were inferred with TCS 1.21
(Clement et al. 2000). The final data sets were 649 bp
long, contained no ambiguities, and included 25 haplo-
types of P. icarus and 26 of P. celina. We used Bayes
Factors to test for the molecular clock model and tree
prior assumptions. BEAST was run separately for P. ica-
rus and P. celina using a strict and a relaxed molecular
clock model (Drummond et al. 2006), each combined
� 2011 Blackwell Publishing Ltd
with the following tree prior assumptions: coalescent
constant size; coalescent Bayesian Skyline (Drummond
et al. 2005); speciation Yule process. The Bayesian Sky-
line assumption was assessed with five groups and a
piecewise-constant Skyline model. Molecular clocks
were calibrated based on slow and fast published inver-
tebrate mitochondrial rates of 1.5% and 2.3% uncor-
rected pairwise distance per million years (Brower 1994;
Quek et al. 2004). The P. icarus data set was analysed
using the HKY + I model and the P. celina data set
using the HKY + I + G model, according to the sugges-
tions of JMODELTEST 0.1. Base frequencies were estimated,
six gamma rate categories were selected and a ran-
domly generated initial tree was used for all runs.
Parameters were estimated using two independent runs
of 50 million generations each. Convergence was
checked with the program TRACER v.1.5. Bayes Factors
for all runs were calculated in TRACER v.1.5. A relaxed
molecular clock model combined with a Bayesian Sky-
line tree prior assumption had the best likelihood for
both P. icarus and P. celina and was further used in the
study.
Haplotype networks
To examine relationships among haplotypes, we con-
structed haplotype networks for P. icarus and P. celina
by using the median-joining network method (Bandelt
et al. 1999) implemented in the program NETWORK 4.6.0.0
(http://www.fluxus-engineering.com). Haplotype net-
works were inferred from subsets consisting exclusively
of sequences of equal length and without ambiguities.
Each alignment was 649 bp-long and comprised 81 COI
sequences for P. icarus and 47 sequences for P. celina.
25 COI haplotypes were identified for P. icarus and 26
for P. celina (Table S1, Supporting information).
Ancestral area reconstruction
We used the software LAGRANGE v.20110117 (Ree et al.
2005; Ree & Smith 2008) to estimate ancestral areas and
dispersal within P. icarus and P. celina. Lagrange is a
biogeographical ML inference method that takes into
account branch lengths. The areas of occurrence for
each of the two species were coded based on haplotype
distribution. The biogeographical model permitted bidi-
rectional dispersal between all regions. All possible area
combinations with a maximum of three simultaneous
areas were permitted, and eight areas were included in
the analysis of each species. Areas were coded as NA,
North Africa (including Canary Islands); IB, Iberia
(including Provence), CE, Central Europe; IT, Italy; BE,
Balkans and East; BA, Balearics; CO, Corsica; SA,
Sardinia; SI, Sicily and Lipari; CR, Crete. For each

4 V. DIN CA , L . D APPORTO and R. VILA
species, analyses were performed on a Bayesian ultra-
metric tree estimated from the COI haplotype data set.
For P. celina, the root node was set in Africa, based on
the high haplotype diversity in this area. As the area of
origin of P. icarus is not clear, the root node was con-
servatively set in three areas (Iberia, Central Europe,
and Balkans-East) in order to cover a wide geographical
range.
Geometric morphometrics
Polyommatinae lycaenids are often identified at the spe-
cific level by the characteristic disposition of the ocelli
and by the shape of their genitalia (Higgins 1975; Tol-
man & Lewington 2008). For this reason, we included
wing patterns and genitalia shape in geometric morpho-
metrics analysis. We analysed the following elements
separately: (i) forewings, (ii) hindwings, (iii) genitalia
valva (chitinized paired lateral appendages of the male
genitalia), (iv) falces (chitinized paired and slender
curved appendages of the male genitalia) and (v)
aedeagus (the intromittent male organ with a tubular
structure and firmly chitinized). In forewings and
hindwings, we identified 10 and 13 landmarks, respec-
tively, in the centre of the spots as indicated in Fig. S1
(Supporting information). For valva and falces, a combi-
nation of fixed landmarks and sliding semi-landmarks
was used (Fig. S1, Supporting information). We also
measured the length of the aedeagus. Genitalia were
dissected using standard procedures (Dapporto 2008).
The genitalia and wings were photographed using a Ni-
kon Coolpix 4500 camera mounted on a stereomicro-
scope. The TPS (thin-plate spline) series of programs
(available at http://life.bio.sunysb.edu/morph/) was
used for these analyses. The ventral sections of the fal-
ces and the lateral section of the valvae were analysed
separately. Points on the outlines that could be precisely
identified were considered as landmarks (type II and
type III landmarks, Bookstein 1997), whereas other
points (sliding semi-landmarks) were allowed to slide
along the outline trajectory (Fig. S1, Supporting infor-
mation).
Digital data for landmarks on genital photographs
were processed using TPSDIG 2.10 (Rohlf 2006a), and the
definition of sliders was carried out using TPSUTIL 1.38
(Rohlf 2006b). Generalized procrustes analysis (GPA)
was applied to the landmark data of both wings and
genitalia in order to remove non-shape variation in
location, scale and orientation and to superimpose the
objects in a common coordinate system. We calculated
the partial warps using the shape residuals from GPA.
Applying principal components analyses to partial
warps, we obtained relative warps (principal compo-
nents – PCs) that can be used as variables in discrimi-
nant analysis (Bookstein 1997). Moreover, PCs can be
visualized by thin-plate spline deformation grids, which
permit a visual comparison of shape differences. GPA,
partial and relative warp calculations, and thin-plate
spline visualization were carried out using TPSRELW 1.45
(Rohlf 2007). The PC scores were analysed by discrimi-
nant analysis on the groups of specimens from different
islands and continental areas (North Africa, Iberia, Ital-
ian Peninsula, Greece, Turkey and Central and North-
ern Europe). Because the number of PCs is often high,
we included in the discriminant analysis only the PCs
explaining more than 1% of variance (Dapporto et al.
2009). Wilks’ lambda was used to evaluate the signifi-
cance and validity of each discriminant function. Discri-
minant analysis has been shown to be a suitable
method for extracting the best combination of PCs and
for distinguishing among specimens belonging to differ-
ent genetic lineages (Dapporto 2010). Indeed, the PCs
that distinguish populations are not always the PCs that
explain the most variance (PC1 and PC2) (Dapporto
2010). The first discriminant function (DF1) identifies
the best combination of variables (PCs) to distinguish
specimens belonging to different areas (Dapporto 2010).
Gradual variation along the first discriminant axis
between two extremes also reflects the degree of
hybridization among populations (compare to results
from Dapporto et al. 2009 and Thomson 2011). By using
the DF1 scores, the shape, which is a multivariate fea-
ture, is reduced to a single variable which is neverthe-
less constructed from the best combination of shape
variables (PCs). Differences among populations can be
also due to differences in size (allometry). GPA removes
size from the PC scores but does not remove the effects
of allometry. However, GPA allows computation of a
measure which is related to the overall size (centroid
size) and which can be used as a variable. We there-
fore analysed the correlation between PCs having dis-
criminant importance and the wing centroid size
(taken as the best predictor for overall size). To verify
whether the possible correlation between shape and
size (allometry) is different between P. icarus and
P. celina, we performed a General Linear Model where
the PC(s) included in significant discriminant functions
were the dependent variables, the forewing centroid
size was the independent covariate and the species
membership was a factorial independent variable. We
computed both the effects of centroid size and species
membership and the interaction term. The interaction
between centroid size and species membership was
used to test for different developmental trajectories
between the two taxa.
We also verified whether specimens showing high
genetic similarity also show high morphological simi-
larity. For this purpose, we computed COI genetic
� 2011 Blackwell Publishing Ltd
B IOG EOG RAPHY IN C OMMON B L UE B UT TE RFLI ES 5
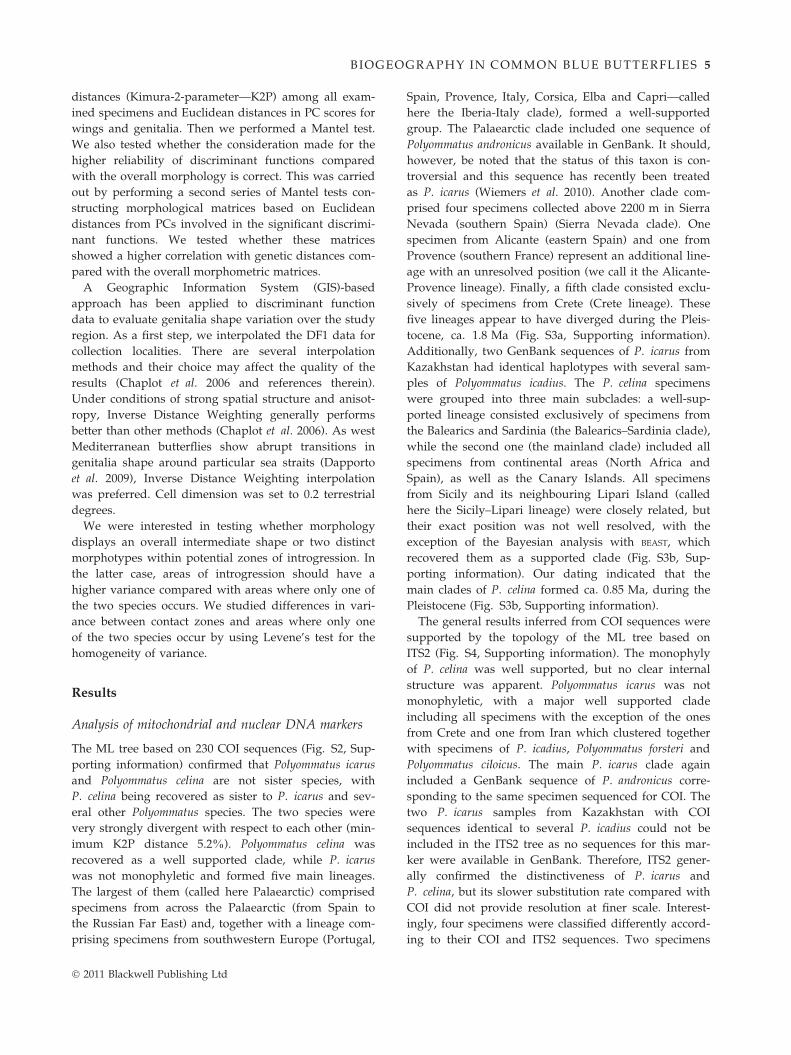
distances (Kimura-2-parameter—K2P) among all exam-
ined specimens and Euclidean distances in PC scores for
wings and genitalia. Then we performed a Mantel test.
We also tested whether the consideration made for the
higher reliability of discriminant functions compared
with the overall morphology is correct. This was carried
out by performing a second series of Mantel tests con-
structing morphological matrices based on Euclidean
distances from PCs involved in the significant discrimi-
nant functions. We tested whether these matrices
showed a higher correlation with genetic distances com-
pared with the overall morphometric matrices.
A Geographic Information System (GIS)-based
approach has been applied to discriminant function
data to evaluate genitalia shape variation over the study
region. As a first step, we interpolated the DF1 data for
collection localities. There are several interpolation
methods and their choice may affect the quality of the
results (Chaplot et al. 2006 and references therein).
Under conditions of strong spatial structure and anisot-
ropy, Inverse Distance Weighting generally performs
better than other methods (Chaplot et al. 2006). As west
Mediterranean butterflies show abrupt transitions in
genitalia shape around particular sea straits (Dapporto
et al. 2009), Inverse Distance Weighting interpolation
was preferred. Cell dimension was set to 0.2 terrestrial
degrees.
We were interested in testing whether morphology
displays an overall intermediate shape or two distinct
morphotypes within potential zones of introgression. In
the latter case, areas of introgression should have a
higher variance compared with areas where only one of
the two species occurs. We studied differences in vari-
ance between contact zones and areas where only one
of the two species occur by using Levene’s test for the
homogeneity of variance.
Results
Analysis of mitochondrial and nuclear DNA markers
The ML tree based on 230 COI sequences (Fig. S2, Sup-
porting information) confirmed that Polyommatus icarus
and Polyommatus celina are not sister species, with
P. celina being recovered as sister to P. icarus and sev-
eral other Polyommatus species. The two species were
very strongly divergent with respect to each other (min-
imum K2P distance 5.2%). Polyommatus celina was
recovered as a well supported clade, while P. icarus
was not monophyletic and formed five main lineages.
The largest of them (called here Palaearctic) comprised
specimens from across the Palaearctic (from Spain to
the Russian Far East) and, together with a lineage com-
prising specimens from southwestern Europe (Portugal,
� 2011 Blackwell Publishing Ltd
Spain, Provence, Italy, Corsica, Elba and Capri—called
here the Iberia-Italy clade), formed a well-supported
group. The Palaearctic clade included one sequence of
Polyommatus andronicus available in GenBank. It should,
however, be noted that the status of this taxon is con-
troversial and this sequence has recently been treated
as P. icarus (Wiemers et al. 2010). Another clade com-
prised four specimens collected above 2200 m in Sierra
Nevada (southern Spain) (Sierra Nevada clade). One
specimen from Alicante (eastern Spain) and one from
Provence (southern France) represent an additional line-
age with an unresolved position (we call it the Alicante-
Provence lineage). Finally, a fifth clade consisted exclu-
sively of specimens from Crete (Crete lineage). These
five lineages appear to have diverged during the Pleis-
tocene, ca. 1.8 Ma (Fig. S3a, Supporting information).
Additionally, two GenBank sequences of P. icarus from
Kazakhstan had identical haplotypes with several sam-
ples of Polyommatus icadius. The P. celina specimens
were grouped into three main subclades: a well-sup-
ported lineage consisted exclusively of specimens from
the Balearics and Sardinia (the Balearics–Sardinia clade),
while the second one (the mainland clade) included all
specimens from continental areas (North Africa and
Spain), as well as the Canary Islands. All specimens
from Sicily and its neighbouring Lipari Island (called
here the Sicily–Lipari lineage) were closely related, but
their exact position was not well resolved, with the
exception of the Bayesian analysis with BEAST, which
recovered them as a supported clade (Fig. S3b, Sup-
porting information). Our dating indicated that the
main clades of P. celina formed ca. 0.85 Ma, during the
Pleistocene (Fig. S3b, Supporting information).
The general results inferred from COI sequences were
supported by the topology of the ML tree based on
ITS2 (Fig. S4, Supporting information). The monophyly
of P. celina was well supported, but no clear internal
structure was apparent. Polyommatus icarus was not
monophyletic, with a major well supported clade
including all specimens with the exception of the ones
from Crete and one from Iran which clustered together
with specimens of P. icadius, Polyommatus forsteri and
Polyommatus ciloicus. The main P. icarus clade again
included a GenBank sequence of P. andronicus corre-
sponding to the same specimen sequenced for COI. The
two P. icarus samples from Kazakhstan with COI
sequences identical to several P. icadius could not be
included in the ITS2 tree as no sequences for this mar-
ker were available in GenBank. Therefore, ITS2 gener-
ally confirmed the distinctiveness of P. icarus and
P. celina, but its slower substitution rate compared with
COI did not provide resolution at finer scale. Interest-
ingly, four specimens were classified differently accord-
ing to their COI and ITS2 sequences. Two specimens

6 V. DIN CA , L . D APPORTO and R. VILA
from Spain (provinces of Madrid and Leon) and one
from southwestern France (on the northern side of the
Pyrenees, close to the Spanish border) had COI
sequences of P. icarus and ITS2 sequences of P. celina,
while one specimen from Spain (Sierra de la Sagra, Gra-
nada) displayed the opposite pattern.
The combined COI and ITS2 data set (Fig. 1, Fig. S5,
Supporting information) recovered phylogenetic rela-
R
ILL066 P
JC00
R
ILL057 P. aria
ILL017
RVcoll.09
RV
RVcoll.0
RVco
ILL025 P
ILL065 P. e
JC00
ILL063ILL0
MW99613 Agrodiaetus damon
JC00042
R
ILL058 P. venusILL077 P. stoliczkanus
5684/92/85
99/100
68/-/54
88/86/90
100/100/99
89/100/9487/9
50/-/-
100/100/100
96 /10
65/100/87
95/100/7399/100/77
88/100/78
-/62
-/69/-
-/97/-
-/86/93
-/-/57
Fig. 1 Maximum likelihood (ML) tree based on the combined analys
probabilities and maximum parsimony bootstrap supports (>50%) are
tionships largely consistent to the ones based exclu-
sively on COI. It was well supported that P. icarus and
P. celina are not sister species, with P. celina being sister
to P. icarus plus several other Polyommatus taxa (P. ica-
dius, P. ciloicus, P. forsteri, P. eros, P. amorata). Polyomm-
atus icarus was not monophyletic, displaying the five
subclades recovered with COI (Palaearctic, Iberia-Italy,
Sierra Nevada, Alicante-Provence and Crete). The
0.01
U02003 P. eros kamtshadalis
RVcoll.08-J962 P. icarus Spain Sierra Nevada
RVcoll.09-X222 P. icarus France Provence
. hunza
051 P. menelaos
RVcoll.08-L281 P. icarus Spain Alicante
Vcoll.07-D815 P. eros Italy
na
ILL050 P. amorata tsvetajevi
RVcoll.150308PP67 P. icarus Crete
P. eros
RVcoll.150308PP22 P. icarus Crete
ILL039 P. ciloicusILL022 P. icadius
RVcoll.08-J968 P. icarus Spain Sierra Nevada
RVcoll.150308PP62 P. icarus Crete
RVcoll.150308PP10 P. icarus Crete
-V961 P. eroides Bulgaria
ILL071 P. icadius
coll.09-X293 P. eros Switzerland
7-D671 P. eroides Bulgaria
ll.09-X075 P. menelaos Greece
. eroides
rigone
ILL076 P. amorata tartarusILL051 P. amorata
029 P. menelaos
P. eros orientalis
RVcoll.08-J960 P. icarus Spain Sierra Nevada
68 P. erotides
P. eroides
Vcoll.07-W163 P. eros Spain
ILL026 P. forsteri
ILL040 P. boisduvalii
MW00530 P. forsteri
ILL067 P. amor
RVcoll.09-V446 P. icarus Spain Sierra Nevada
93/100/83
98/100/9769/65/-
/93/61100/100/99
/100
9/84
0/99
P. icarus(Spain, France, Corsica, Italy, Capri Island, Greece, Bulgaria, Germany, Denmark, Finland,Russia,Turkey, Israel, Iran) andP. icarus [andronicus] Greece
P. celina (Menorca, Mallorca, Sardinia)
P. celina(Morocco, Tunisia, Spain)
RVcoll.183 P. celina Sicily
RVcoll.186 P. celina SicilyRVcoll.Lip2 P. celina Lipari Island
RVcoll.Lip1 P. celina Lipari Island
67/64/54
Palaearctic+
Iberia - Italy
Crete
SierraNevada
Alicante -Provence
Mainland
Balearics - Sardinia
Sicily - Lipari
is of COI and ITS2. ML bootstrap supports, Bayesian posterior
shown above recovered branches.
� 2011 Blackwell Publishing Ltd

B IOG EOG RAPHY IN C OMMON B L UE B UT TE RFLI ES 7
GenBank sample of P. andronicus mentioned earlier
clustered again within the main clade of P. icarus. Poly-
ommatus celina was recovered as monophyletic, with the
same three subclades inferred by COI (mainland, Balea-
rics–Sardinia and Sicily–Lipari).
Geometric morphometrics
A total of 13 PCs for forewings, 15 PCs for hindwings,
11 PCs for falces, and 15 PCs for valvae each explained
more than 1% of variance (explaining respectively a
cumulative variance of 97.7%, 95.2%, 99.0% and
95.2%). In agreement with genetic results, discriminant
analysis including all wing and genitalia PCs plus aede-
agus length showed a cline concordant with a west-to-
east gradient (Fig. S6a, Supporting information). At one
extreme, North African specimens group with the
Balearics; in the middle of the graph, Sicily, Sardinia,
and Spanish P. icarus and P. celina are grouped; at the
other extreme, specimens from the rest of Europe are
clustered (Function 1, explained variance = 37.2%;
Wilks’ lambda = 0.003, P < 0.001; Function 2, expl.
var. = 11.2%, Wilks’ lambda = 0.012, P < 0.001). Falces
PC2 and valvae PC5 showed highest correlations with
Function 1, while valvae PC4 and hindwings PC5
showed highest correlations with Function 2. When
genitalia and wing pattern are included separately into
the discriminant analysis a very similar trend is high-
lighted (genitalia, Function 1, explained variance =
47.5%, Wilks’ lambda = 0.034, P < 0.001; Function 2,
expl. var. = 12.7%, Wilks’ lambda = 0.112, P < 0.001,
Fig. S6b, Supporting information; wings, Function 1,
explained variance = 23.2%, Wilks’ lambda = 0.079,
P < 0.001; Function 2, expl. var. = 16.7%, Wilks’
lambda = 0.133, P < 0.001, Fig. S6c, Supporting infor-
mation). Forewing PC4 showed the highest correlation
with Function 1 and hindwings PC3 showed highest
correlation with Function 2; falces PC2 and valvae PC4
showed the highest correlation with Function 1 and 2,
respectively. It is worth noting that Spanish specimens
of P. icarus and P. celina identified with COI were very
similar in all the analyses and showed intermediate
Function 1 values.
When genetic distances were compared with Euclid-
ean distances based on all PCs for wings and genitalia
shape, no significant correlation was obtained (Mantel
tests, wings r = 0.026, P = 0.187; genitalia r = 0.041,
P = 0.061). Conversely, when Euclidean distances were
based on the PCs involved in the significant discrimi-
nant function (forewing PC4 and PC6, hindwings PC3
for wings and falces PC2 and PC7 and valvae PC4 for
genitalia), a strong correlation was found in both wings
and genitalia (Mantel tests, wings r = 0.051, P = 0.030;
genitalia r = 0.136, P < 0.001). When the analysis was
� 2011 Blackwell Publishing Ltd
restricted to the Spanish specimens, differences were
non-significant in the overall analysis and the restricted
Mantel tests (P > 0.05 in all cases).
The analysis of allometry showed that valvae PC4
and forewings PC4 are affected by species membership
(F = 15.578, P < 0.001; F = 22.821, P < 0.001), but not by
size (F = 0.007, P = 0.934; F = 1.361, P = 0.245). Con-
versely, falces PC7 is influenced by size (species,
F = 5.641, P = 0.018, size F = 7.085, P = 0.008). A partic-
ularly interesting pattern is showed by falces PC2,
responsible for most of the morphometrical variation
that correlates with genetic results. In General Linear
Model this PC showed a strong effect between species
(F = 100.201, P < 0.001) and no direct effect for size
(F = 0.087, P = 0.769), but it showed a strongly signifi-
cant interaction between species and size (F = 7.136,
P = 0.008). By examining the relationship between falces
PC2 and size in our samples it is clear that PC2 values
decrease with size in P. celina and increase in P. icarus
(Fig. S6d, Supporting information). A similar effect was
shown by forewing PC6 (species, F = 8.661, P = 0.004;
size F = 0.337, P = 0.562; species x size F = 7.740,
P = 0.006), while a reversed effect (larger specimens
being less similar) was found for hindwings PC3 (spe-
cies, F = 14.395, P < 0.001; size F = 0.338, P = 0.534; spe-
cies x size F = 6.302, P = 0.013).
Inverse Distance Weighting interpolation showed that
North Africa and the Balearics share very similar popu-
lations. Moreover, a general cline from these areas
spreads to Europe. Remarkably, the fourth isopleth per-
fectly defines the area where P. celina haplotypes have
been found (Fig. 2).
No significant difference was observed when vari-
ances for the six significant PCs among specimens from
mainland areas showing both P. icarus and P. celina
genes (Iberia), pure P. celina (North Africa), and pure
P. icarus (rest of the Palaearctic) were compared (fore-
wing PC4 and PC6, Levene Stat. = 0.741 and 0.503,
P = 0.478 and 0.606, respectively; hindwing PC3, Levene
Stat. = 0.622, P = 0.538; falces PC2 and PC7, Levene
Stat. = 0.831 and 0.777, P = 0.438 and 0.462, respec-
tively; valvae PC4, Levene Stat. = 2.137, P = 0.122).
Ancestral area reconstruction and haplotype networkanalyses
For P. icarus (Fig. 3a), ancestral area reconstruction
with Lagrange suggested that an ancestral lineage
occurred in southern regions (Spain, Balkans and areas
in south-west Asia), while another lineage occurred
in Central Europe (and possibly also in other areas in
the North Palaearctic that could not be exhaustively
sampled). The southern lineage seems to have only sur-
vived in relictual populations in the Iberian Peninsula-

Fig. 2 Inverse distance weighting interpolation of Discriminant Function 1 (DF1). Grey scale represents DF1 values for genitalia
mainly linked to the continuous deformation of falces highlighted by thin-plate spline in the left. Black triangles indicate sites where
specimens with discordant mitochondrial and nuclear alleles have been found. The dashed line indicates the isopleth that coincides
with the distribution limits of Polyommatus icarus and Polyommatus celina. It should be noted that in the Iberian Peninsula this isopleth
seems to coincide with the northernmost ancestral distribution limit of P. celina (as defined by P. celina haplotypes introgressed in
P. icarus).
8 V. DIN CA , L . D APPORTO and R. VILA
Provence (Sierra Nevada and Alicante-Provence lin-
eages) and in Crete, which was colonized early on. The
Palaearctic lineage appears to have subsequently
expanded over large parts of southern Europe and, pos-
sibly during cold periods of glaciation, it split into a
southwestern European group (Ibero-Italian) and a Cen-
tral and Eastern European one. Later, yet another colo-
nization of Iberia took place from the Central and
Eastern European stock. Haplotype diversity appears to
be highest in southwestern Europe (Iberia and Italy)
(Fig. S7, Supporting information). Given the wide
extra-Mediterranean distribution of P. icarus, it is possi-
ble that high genetic diversity could also exist in other
parts of the Palaearctic. The relict Iberian and Crete lin-
eages were shown to be strongly diverged and to
include very low haplotype diversity in the haplotype
network (Fig. S7, Supporting information).
In the case of P. celina (Fig. 4a), Lagrange estimated
that the ancestral North African lineage (including the
Canary islands) split and colonized both Sicily and the
Balearics, followed by the more recent colonization of
Sardinia from the Balearics. The other major North-Afri-
can lineage remained in North Africa for a long time
and only recently appears to have colonized Iberia. The
haplotype network (Fig. S8, Supporting information)
supported the old connection between North Africa and
the Sicily–Lipari, and Balearics–Sardinia haplotypes. It
also showed that the recent colonization of Iberia from
North Africa has been followed by incipient diversifica-
tion producing a number of haplotypes differentiated
between them by few changes apparently unique to this
region.
Discussion
Molecular and morphological data
DNA analyses confirmed the deep genetic divergence
between Polyommatus icarus and Polyommatus celina
reported by previous studies and the fact that they are
not sister species (Wiemers 2003; Wiemers & Fiedler
2007; Vodolazhsky & Stradomsky 2008; Wiemers et al.
2010). Unlike previous studies, we focused on analysing
islands and possible contact areas between P. icarus
and P. celina such as Morocco–Spain and Tunisia–Sic-
ily–Italy in order to reconstruct the colonization routes
and vicariance events responsible for the observed dis-
tributional pattern. Based on our sampling, each island
showed mitochondrial and nuclear genes belonging
exclusively to one species: P. icarus on Corsica, Elba,
Capri, Crete and P. celina on Sardinia, Sicily, Lipari,
Balearics and Fuerteventura (Fig. 5). Therefore,
� 2011 Blackwell Publishing Ltd

IberianPeninsula
+Balkans
Palaearctic
Crete
Palaearctic
SierraNevada
Crete
IberianPeninsula
+Balkans
SierraNevada
Crete
Corsica
UpperPleistocene
Palaearctic
Palaearctic
Pleistoceneca. 1.8 Ma
Pleistoceneca. 0.5 Ma
hi 11 (CE, BE)
hi 9 (IT)
hi 12 (CE)
hi 13 (CE)
hi 16 (CE, BE)
hi 14 (CE)
hi 7 (IB)
hi 6 (IB)
hi 22 (CR)
hi 19 (CE, BE)
hi 20 (IB)
hi 15 (CE)
hi 2 (IT)
hi 23 (CR)
hi 1 (IB, IT, CO)
hi 18 (BE)
hi 25 (IB)
hi 21 (IB)
hi 4 (IB)
hi 5 (IT)
hi 17 (BE)
hi 24 (IB)
hi 8 (IB)hi 10 (IT)
hi 3 (IT)
IB-BE
IB-IT
CECE
CEIB
BE-CEBE
BE-CEBE
BEBE-CE
IBIB
CECE
CECE
CECE
CECE
IB-ITIT
IB-ITIB
IB-ITIB
ITIB-IT
ITIT
ITIT
ITIB
IBIB
ITIT
CRIB
CRCR
IBIB
IberianPeninsula
Alica
nte-
Prov
ence
Iberia-Italy
Iberia-Italy
Iberia-Italy
Iberia-Italy
Alica
nte-
Prov
ence
CE
CE
Pleistoceneca. 1.2 Ma
(a)
(b)
(c)
(d)
(e)
Fig. 3 Ancestral area reconstruction and main biogeographical
events for Polyommatus icarus. (a) Ancestral area reconstruction
with Lagrange on a Bayesian ultrametric tree inferred from
cytochrome c oxidase subunit I haplotypes. Ancestral ranges
recovered with the highest probability are shown at internal
nodes. IB, Iberia; CE, Central Europe; BE, Balkans and East; IT,
Italy; CO, Corsica; CR, Crete. A male adult of P. icarus (left-
dorsal, right-ventral) is illustrated in the upper left corner. (b–
e) Main biogeographical events for P. icarus producing five lin-
eages in <2 million years.
B IOG EOG RAPHY IN C OMMON B L UE B UT TE RFLI ES 9
� 2011 Blackwell Publishing Ltd
although P. icarus and P. celina were able to colonize
most islands, they seem to completely exclude each
other. On the mainland they are parapatric in the Ibe-
rian Peninsula, and we detected a low frequency of
individuals with discordant mitochondrial and nuclear
alleles (Fig. 2, Table S1, Supporting information). Inter-
estingly, one of the potential contact zones lies in Sierra
de la Sagra in southern Spain, an area from which the
controversial taxon Polyommatus abdon has been
reported (Aistleitner & Aistleitner 1994; Sariot 2008). In
light of our findings, several possibilities arise: (i) P. ab-
don is not a good species and available records may
actually refer to P. icarus or P. celina; (ii) Putative P. ab-
don specimens may actually be hybrids between P. ica-
rus and P. celina; (iii) P. abdon may represent a species
of hybrid origin that we did not sample (iv) or it may
represent a distinct species that we did not sample.
The four cases of introgression found in our data set
are dispersed over a large area ranging from Sierra de la
Sagra in southern Spain to the French slopes of the Pyre-
nees (Fig. 2). This, together with the observed pattern of
parapatry on the mainland and exclusion on islands,
points towards the lack of a prezygotic barrier coupled
with substantial reduction in viability or fertility in the
hybrids. Polyommatus icarus is known to hybridize with
several other species (e.g., Agrodiaetus damon, Lysandra
coridon, Polyommatus eros, Plebejus argus), some of which
are phylogenetically more distant than P. celina (Desci-
mon & Mallet 2009). Actually, the two samples of
P. icarus that shared COI haplotypes with several speci-
mens of P. icadius were also suspected to represent cases
of introgression between the two species in Central Asia
(Lukhtanov et al. 2009). The existence of cases of intro-
gression should not be regarded as evidence of conspeci-
ficity between P. icarus and P. celina, as Descimon &
Mallet (2009) noted that about 16% of all European but-
terfly species are known to hybridize in the wild. A simi-
lar case was recently documented in the closely related
and morphologically similar Aricia agestis and A. art-
axerxes, which display a hybridization zone in northern
England and North Wales (Mallet et al. 2011).
We showed that P. icarus and P. celina have similar
morphology and there is overlap in both external and
internal characters. Besides DNA-based evidence, the
main morphological features that have been proposed
as diagnostic are the presence of a broad marginal dark-
ening on the upperside of the male forewing and the
tendency to display a series of black marginal spots on
male hindwing upperside in P. celina (Tarrier & Delacre
2008; Vodolazhsky & Stradomsky 2008), which usually,
but not always, is absent in P. icarus. Minor differences
between species were found in the position of the black
spots of the wing underside and, especially, in male
genitalia. Indeed, the falces show a good degree of

North Africa
Balearics
Sicily
North Africa
Balearics Sardinia
Sicily
IberianPeninsula
hc 7 (IB, NA)
hc 14 (NA)
hc 9 (IB)
hc 6 (NA)
hc 16 (NA)
hc 24 (BA)
hc 23 (BA)
hc 20 (SI)hc 19 (SI)
hc 8 (IB)hc 11 (IB)
hc 15 (IB)
hc 3 (IB)
hc 2 (NA)
hc 26 (SA)
hc 12 (NA)
hc 17 (SI)
hc 10 (NA)hc 13 (NA)
hc 5 (NA)
hc 1 (NA)
hc 22 (SA, BA)
hc 21 (SI)
hc 25 (BA)
hc 4 (IB)
hc 18 (SI)
NANA
NANA
NANA
NANA
NANA
IBIB-NA
IBIB
IBIB
NAIB
IBNANANA
NANA
NANA
IBNA
NANA
IBNA
NABA
SISI
SISI
SISISISI
BABA
BABA
BABA
SA
BA-SA
Pleistoceneca. 0.85 Ma
UpperPleistocene
(a)
(b)
(c)
Fig. 4 Ancestral area reconstruction
and main biogeographical events for
Polyommatus celina. (a) Ancestral area
reconstruction with Lagrange on a
Bayesian ultrametric tree inferred from
cytochrome c oxidase subunit I haplo-
types. Ancestral ranges recovered with
the highest probability are shown at
internal nodes. NA, North Africa; IB,
Iberia; SI, Sicily; SA, Sardinia; BA,
Balearics. A male adult of P. celina (left-
dorsal, right-ventral) is illustrated in the
upper left corner. (b–c) Main coloniza-
tion events for P. celina during the last
million years.
10 V. DIN CA , L . D APPORTO and R. VILA
diversification, and the PCs involved in the significant
discriminant functions displayed a spatial distribution
concordant with the pattern of mitochondrial and
nuclear genes (Fig. 2).
An allometric relationship was found in some PCs
involved in the discriminant function and in the main
falces PC. The particular relationships between size and
shape in the two species result in small specimens
being more different between taxa than larger ones.
Consequently, the populations of P. celina that included
larger individuals (Spain, Sardinia and Sicily) were
more similar in shape to P. icarus than populations
with smaller specimens from North Africa and Balea-
rics. These allometric patterns between size and shape
showed that differences in genitalia shape are not likely
due to differences in size, but that they may stem from
particularities in their developmental pathways. This
phenomenon reinforces the existing evidence that
P. icarus and P. celina are two different species.
Although there are isopleths separating regions in
Spain in accordance with molecular results (Fig. 2),
some degree of morphological homogenization between
the two species in the Iberian Peninsula was observed,
as demonstrated by the absence of a larger variance in
� 2011 Blackwell Publishing Ltd

25
35
45
55
65
75°
140°1300 10 20 30 40 50 60 70 80 90 100 110 12015 5
1000 kmN
Fig. 5 Distribution of Polyommatus icarus and Polyommatus celina based on sequenced specimens. Black dots represent P. icarus; black
circles, P. celina; black and white dots, sympatric occurrence of P. icarus and P. celina.
B IOGEOGRAPHY IN COMMON BLUE B UTTE RFLI ES 11
this area of contact compared with the other mainland
areas. Although deeper studies centred on the contact
zone are needed, the results suggest that genitalic dif-
ferences between P. icarus and P. celina might serve as
a partial reproductive barrier, but are not strong
enough to completely prevent hybridization; otherwise
differences in the contact zone would be under strong
positive selection by reinforcement and homogenization
would be unlikely.
Distribution patterns
The existence of five P. icarus clades (Palaearctic, Iberia-
Italy, Sierra Nevada, Alicante-Provence and Crete) and
three of P. celina (mainland, Balearics–Sardinia and
Sicily–Lipari) (Fig. 1, Fig. S5, Supporting information)
suggests the complex outcome of several cycles of vicar-
iance, expansion and contraction. The succession of the
Quaternary glacial-post glacial cycles seems to be the
cause of many range shifts in Mediterranean taxa
(Hewitt 1999, 2000; Schmitt 2007; Dapporto 2010; Habel
et al. 2010). More precisely, three main refugia have
been identified in Europe (Iberian, Italian and Balkan
Peninsulas), but North Africa, Anatolia and large Medi-
terranean islands seem to have also served as refugia
(Habel et al. 2008; Medail & Diadema 2009; Dapporto
2010). Taxa that survived in these areas during cold
periods are expected to have evolved into different
genetic lineages and to have subsequently spread north-
wards until they met in some well-known suture zones
(Alps, southern France, Pyrenees and southern Spain).
Several studies proposed that after a relatively rapid
postglacial expansion, the lineages and their suture
zones tended to remain geographically stable (Hewitt
� 2011 Blackwell Publishing Ltd
2001). However, observations of rapid changes in but-
terfly distributions (and other taxa) following even
minor climate changes suggest that distributions might
have largely changed since the initial phase of postgla-
cial re-colonization (Dapporto 2010; Fisher et al. 2010).
Taxa are predicted to spread faster on mainland than
across the sea, allowing the persistence on islands of
lineages once also occupying the nearest mainland
(Masini et al. 2008; Dapporto et al. 2011). For example,
most Satyrinae butterflies have different lineages on the
Italian mainland compared with neighbouring islands
(Dapporto 2010), and it has been hypothesized that
island lineages would have been formerly distributed in
the whole western Mediterranean and subsequently
replaced on mainland by lineages expanding from the
Balkans, Turkey, and Russia (Dapporto et al. 2009;
Dapporto 2010). According to our COI data, specimens
from Sicily are P. celina, while specimens in nearby
Calabria, separated by the 3 km wide Messina channel,
are P. icarus. A similar pattern was found when com-
paring Sardinia (P. celina) with neighbouring Corsica
(P. icarus). Despite geographical proximity between the
two species in these areas, we did not find any evi-
dence of past or present hybridization. By contrast, we
found morphological and genetic evidence for intro-
gression between the Palaearctic P. icarus lineage and
P. celina on the Iberian Peninsula (Fig. 2).
The biogeographical history of P. icarus based on our
molecular data, age estimates, and ancestral area recon-
struction shows that this species produced five lineages
in <2 million years (Fig. 3b–e). Approximately 1.8 Ma,
P. icarus diverged into a northern (Palaearctic) and a
southern lineage (Iberia-Balkans) (Fig. 3b). About
1.2 Ma, the southern lineage split into a lineage con-

12 V. DIN CA , L . D APPORTO and R. VILA
fined to the Iberian Peninsula and another endemic to
Crete (Fig. 3c). About 0.5 Ma, the Iberian lineage fur-
ther diverged into a lineage apparently restricted to the
high parts of the Sierra Nevada Mountains (southern
Spain) and the Alicante-Provence lineage (Fig. 3d), of
which only two specimens have been detected. Almost
at the same time (ca. 0.7 Ma), from the northern stock
split a western Mediterranean lineage represented by
Iberia and Italy connected through the South of France
(Fig. 3d). Recently, during the upper Pleistocene, the
western Mediterranean lineage colonized Corsica and
several Tuscan islands (Elba, Capri), while the Palaearc-
tic lineage has been expanding into the Mediterranean
region by entering the Iberian Peninsula and the Bal-
kans (Fig. 3e).
In the case of P. celina, ca. 0.85 Ma the North-African
lineage (including the Canary islands) spread North,
generating two distinct lineages, one occurring in the
Balearics and the other in Sicily plus neighbouring
Lipari (Fig. 4b). It is plausible that at that time the
species may have similarly expanded in the southern
European mainland (e.g., Iberian Peninsula, Italy). If
true, it seems that all traces of that event have been
erased. Recently, during the upper Pleistocene, Sardinia
was colonized from the Balearics, and the North-
African lineage colonized the Iberian Peninsula, likely
in several dispersal events (Fig. 4c). The finding of
P. celina alleles as far North as the Pyrenees, suggests
that this species may have inhabited the entire Iberian
Peninsula. However, it is currently limited to the south-
ern regions of Iberia, and it may have been displaced in
the rest of Iberia through introgressive hybridization
with invading European lineages of P. icarus. Our
study exemplifies the importance of examining the bio-
geographical history of widespread species, which can
reveal large-scale and complex patterns possibly appli-
cable to other taxa in the West Mediterranean. These
processes sometimes involve several extinction, coloni-
zation, vicariance and hybridization events that can be
detected by combining genetic and morphological traits.
Isolated and ⁄ or large islands (Sardinia, Balearics, Sicily,
Crete) and particular southern mountain massifs such
as Sierra Nevada, act as important refugia that protect
ancestral populations from introgressive dispersal
events, which seem to be common on the mainland. In
this respect, the inclusion of populations from these
highly stable areas is a key for accurately reconstructing
phylogeography.
Acknowledgements
We thank D. Carreras, C. Corduneanu, J. Dantart, S. Estrade,
J. Flinck, O. Garcia, E. Garcıa-Barros, F. Gil-T., F. Gonzalez,
J. Hernandez-Roldan, Z. Kolev, E. Maravalhas, M. Mølgaard,
S. Montagud, J. Requejo, M. Munguira, J. Perez-Lopez and S.
Viader for their help in obtaining samples used in this study.
We also thank the Catalan Butterfly Monitoring Scheme and
TAGIS (Centro de Conservacao das Borboletas de Portugal).
We are grateful to Luca Bartolozzi for allowing examination of
the Roger Verity collection. Special thanks to G. Talavera and
V. Soria-Carrasco for advice on phylogenetic analyses. The
field work by L.D. has been partially funded by the project
‘‘Definizione dello status di conservazione delle falene e della
malacofauna terrestre dell’Arcipelago Toscano’’. Support for
this research was provided by the Spanish Ministerio de Cien-
cia e Innovacion (projects CGL2007-60516 ⁄ BOS and CGL2010-
21226 ⁄ BOS to R.V., V.D. and L.D.), and by a predoctoral
fellowship from Universitat Autonoma de Barcelona to V.D.
References
Aistleitner E, Aistleitner U (1994) Polyommatus abdon spec. nov.,
eine fur die Wissenschaft neue Blaulingsart aus Sudost-
spanien (Lepidoptera, Lycaenidae). Atalanta, 25, 215–223.
Avise JC (2009) Phylogeography: retrospect and prospect.
Journal of Biogeography, 36, 3–15.
Bandelt HJ, Forster P, Rohl A (1999) Median-joining networks
for inferring intraspecific phylogenies. Molecular Biology and
Evolution, 16, 37–48.
Bookstein FL (1997) Landmark methods for forms without
landmarks: localizing group differences in outline shape.
Medical Image Analysis, 1, 225–243.
Brower AVZ (1994) Rapid morphological radiation and conver-
gence among races of the butterfly Heliconius erato inferred
from patterns of mitochondrial-DNA evolution. Proceedings
of the National Academy of Sciences, USA, 91, 6491–6495.
Chaplot V, Darboux F, Bourennane H, Leguedois S, Silvera N,
Phachomphon K (2006) Accuracy of interpolation techniques
for the derivation of digital elevation models in relation to
landform types and data density. Geomorphology, 77, 126–141.
Clement M, Posada D, Crandall K (2000) TCS: a computer
program to estimate gene genealogies. Molecular Ecology, 9,
1657–1660.
Dapporto L (2008) Geometric morphometrics reveal male
genitalia differences in the Lasiommata megera ⁄ paramegaera
complex (Lepidoptera, Nymphalidae) and the lack of a
predicted hybridization area in the Tuscan Archipelago.
Journal of Zoological Systematics and Evolutionary Research, 46,
224–230.
Dapporto L (2010) Satyrinae butterflies from Sardinia and
Corsica show a kaleidoscopic intraspecific biogeography
(Lepidoptera, Nymphlidae). Biological Journal of the Linnean
Society, 100, 195–212.
Dapporto L, Bruschini C, Baracchi D et al. (2009)
Phylogeography and counter-intuitive inferences in island
biogeography: evidence from morphometric markers in the
mobile butterfly Maniola jurtina (Linnaeus) (Lepidoptera,
Nymphalidae). Biological Journal of the Linnean Society, 98,
677–692.
Dapporto L, Schmitt T, Vila R et al. (2011) Phylogenetic island
disequilibrium: evidence for ongoing long-term population
dynamics in two Mediterranean butterflies. Journal of
Biogeography, 38, 854–867.
Dennis RLH, Williams WR, Shreeve TG (1998) Faunal
structures among European butterflies: evolutionary
� 2011 Blackwell Publishing Ltd
BIOGEOGRAPHY IN COMMON BLUE B UTTE RFLI ES 13
implications of bias for geography, endemism and
taxonomic affiliations. Ecography, 21, 181–203.
Desamore A, Laenen B, Devos N et al. (2011) Out of Africa:
north-westwards Pleistocene expansions of the heather Erica
arborea. Journal of Biogeography, 38, 164–176.
Descimon H, Mallet J (2009) Bad species. In: Ecology of
Butterflies in Europe (eds Settele J, Shreeve TG, Konvicka M,
Van Dyck H), pp. 526. Cambridge University Press,
Cambridge.
Dinca V, Zakharov EV, Hebert PDN, Vila R (2011) Complete
DNA barcode reference library for a country’s butterfly
fauna reveals high performance for temperate Europe.
Proceedings of the Royal Society B: Biological Sciences, 278, 347–
355.
Drummond AJ, Rambaut A (2007) BEAST: bayesian
evolutionary analysis by sampling trees. BMC Evolutionary
Biology, 7, 214.
Drummond AJ, Rambaut A, Shapiro B, Pybus OG (2005)
Bayesian coalescent inference of past population dynamics
from molecular sequences. Molecular Biology and Evolution,
22, 1185–1192.
Drummond AJ, Ho SYW, Phillips MJ, Rambaut A (2006)
Relaxed phylogenetics and dating with confidence. PLoS
Biology, 4, e88.
Drummond AJ, Ashton B, Cheung M et al. (2009) Geneious
v4.7. Available from http://www.geneious.com/.
Fisher JAD, Frank KT, Leggett WC (2010) Dynamic
macroecology on ecological time scales. Global Ecology and
Biogeography, 19, 1–15.
Folmer O, Black M, Hoeh W, Lutz R, Vrijenhoek R (1994) DNA
primers for amplification of mitochondrial cytochrome C
oxidase subunit I from diverse metazoan invertebrates.
Molecular Marine Biology and Biotechnology, 3, 294–299.
Garcıa-Barros E, Gurrea P, Lucianez MJ et al. (2002) Parsimony
analysis of endemicity and its application to animal and
plant geographical distributions in the Ibero-Balearic region
(western Mediterranean). Journal of Biogeography, 29, 109–
124.
Girardello M, Griggio M, Whittingham MJ, Rushton SP (2009)
Identifying important areas for butterfly conservation in
Italy. Animal Conservation, 12, 20–28.
Grant PR, Grant BR (2010) Sympatric speciation, immigration
and hybridization in island birds. In: The Theory of Island
Biogeography Revisited (eds Losos JB, Ricklefs RE), pp. 494.
Princeton University Press, Princeton.
Guindon S, Gascuel O (2003) A simple, fast, and accurate
algorithm to estimate large phylogenies by maximum
likelihood. Systematic Biology, 52, 696–704.
Habel JC, Meyer M, El Mousadik A, Schmitt T (2008) Africa
goes Europe: the complete phylogeography of the marbled
white butterfly species complex Melanargia galathea ⁄ lachesis.
Organisms, Diversity & Evolution, 8, 121–129.
Habel JC, Rodder D, Scalercio S, Meyer M, Schmitt T (2010)
Strong genetic cohesiveness between Italy and North Africa
in four butterfly species. Biological Journal of the Linnean
Society, 99, 818–830.
Hebert PDN, Penton EH, Burns JM, Janzen DH, Hallwachs W
(2004) Ten species in one: DNA barcoding reveals cryptic
species in the neotropical skipper butterfly Astraptes
fulgerator. Proceedings of the National Academy of Sciences, USA,
101, 14812–14817.
� 2011 Blackwell Publishing Ltd
Hewitt GM (1999) Post-glacial re-colonization of European
biota. Biological Journal of the Linnean Society, 68, 87–112.
Hewitt GM (2000) The genetic legacy of the quaternary ice
ages. Nature, 405, 907–913.
Hewitt GM (2001) Speciation, hybrid zones and phylogeogra-
phy—or seeing genes in space and time. Molecular Ecology,
10, 537–549.
Higgins LG (1975) The Classification of European Butterflies.
Collins, London, pp. 320.
Hill JK, Thomas CD, Fox R et al. (2002) Responses of butterflies
to twentieth century climate warming: implications for future
ranges. Proceedings of the Royal Society B: Biological Sciences,
269, 2163–2171.
Huelsenbeck JP, Ronquist F (2001) MRBAYES: bayesian
inference of phylogeny. Bioinformatics, 17, 754–755.
Lohman DJ, Peggie D, Pierce NE, Meier R (2008)
Phylogeography and genetic diversity of a widespread old
world butterfly, Lampides boeticus (Lepidoptera: Lycaenidae).
BMC Evolutionary Biology, 8, 301.
Lukhtanov VA, Sourakov A, Zakharov EV, Hebert PDN (2009)
DNA barcoding central Asian butterflies: increasing geo-
graphical dimension does not significantly reduce the
success of species identification. Molecular Ecology Resources,
9, 1302–1310.
Mallet J, Wynne IR, Thomas CD (2011) Hybridisation and
climate change: brown argus butterflies in Britain (Poly-
ommatus subgenus Aricia). Insect Conservation and Diversity, 4,
192–199.
Masini F, Petruso D, Bonfiglio L, Mangano G (2008)
Origination and extinction patterns of mammals in three
central Western Mediterranean islands from the Late
Miocene to Quaternary. Quaternary International, 182, 63–79.
Medail F, Diadema K (2009) Glacial refugia influence plant
diversity patterns in the Mediterranean Basin. Journal of
Biogeography, 36, 1333–1345.
Morrone JJ (ed.) (2009) Evolutionary Biogeography: An Integrative
Approach. Columbia University Press, New York, pp. 304.
Nazari V, ten Hagen W, Bozano GC (2010) Molecular
systematics and phylogeny of the ‘Marbled Whites’
(Lepidoptera: Nymphalidae, Satyrinae, Melanargia Meigen).
Systematic Entomology, 35, 132–147.
Parmesan C, Ryrholm N, Stefanescu C et al. (1999) Poleward
shifts in geographical ranges of butterfly species associated
with regional warming. Nature, 399, 579–583.
Posada D (2008) jModelTest: phylogenetic model averaging.
Molecular Biology and Evolution, 25, 1253–1256.
Quek S-P, Davies SJ, Itino T, Pierce NE (2004) Codiversification
in an ant-plant mutualism: stem texture and the evolution of
host use in Crematogaster (Formicidae: Myrmicinae)
inhabitants of Macaranga (Euphorbiaceae). Evolution, 58, 554–
570.
Ree RH, Smith SA (2008) Maximum likelihood inference of
geographic range evolution by dispersal, local extinction,
and cladogenesis. Systematic Biology, 57, 4–14.
Ree RH, Moore BR, Webb CO, Donoghue MJ (2005) A
likelihood framework for inferring the evolution of
geographic range on phylogenetic trees. Evolution, 59, 2299–
2311.
Rohlf FJ (2006a) TPSDIG, Version 2.10. Department of Ecology
and Evolution, State University of New York, Stony Brook.
Available from http://life.bio.sunysb.edu/morph/.

14 V. DIN CA , L . D APPORTO and R. VILA
Rohlf FJ (2006b) TPSUTIL, Version 1.38. Department of Ecology
and Evolution, State University of New York, Stony Brook.
Available from http://life.bio.sunysb.edu/morph/.
Rohlf FJ (2007) TPSRELW, Version 1.45. Department of Ecology
and Evolution, State University of New York, Stony Brook.
Available from http://life.bio.sunysb.edu/morph/.
Ronquist F, Huelsenbeck JP (2003) MRBAYES 3: bayesian
phylogenetic inference under mixed models. Bioinformatics,
19, 1572–1574.
Sariot MJM (2008) Polyommatus abdon (Aistleitner & Aist-
leitner 1994): confirmacion de su estatus taxonomico como
buena especie y comparacion de sus estadios preimaginales
con Polyommatus icarus (Lepidoptera, Lycaenidae). Boletın
de la Sociedad Andaluza de Entomologıa, 15, 56–71.
Schmitt T (2007) Molecular biogeography of Europe:
pleistocene cycles and postglacial trends. Frontiers in Zoology,
4, 11.
Simons C, Frati R, Beckenbach A, Crespi B, Liu H, Floors P
(1994) Evolution, weighting, and phylogenetic utility of
mitochondrial gene sequences and a compilation of
conserved polymerase chain reaction primers. Annals of the
Entomological Society of America, 87, 651–701.
Tamura K, Peterson D, Peterson N, Stecher G, Nei M, Kumar S
(2011) MEGA5: molecular evolutionary genetics analysis
using maximum likelihood, evolutionary distance, and
maximum parsimony methods. Molecular Biology and
Evolution, doi: 10.1093/molbev/msr121, published online
May 4.
Tarrier MR, Delacre J (2008) Les Papillons de jour du Maroc.
Guide d’identification et de bio-indication. Biotope, Meze,
Museum national d’Histoire naturelle, Paris, pp. 480.
Thomson G (2011) The Meadow Brown Butterflies. A Study In
Genetics, Morphology and Evolution. Privately published by
George Thomson, Waterbeck, Scotland.
Tolman T, Lewington R (2008) Collins Butterfly Guide.
HarperCollins, London, pp. 384.
Verity R (1940–1953) Le farfalle diurne d’Italia. Marzocco,
Firenze.
Vodolazhsky DI, Stradomsky BV (2008) Phylogenetic analysis
of subgenus Polyommatus (s. str) Latreille, 1804 (Lepidoptera:
Lycaenidae) based on mtDNA markers. Part II. Caucasian
Entomological Bulletin, 4, 237–242.
White TJ, Bruns T, Lee S, Taylor J (1990) Amplification and
direct sequencing of fungal ribosomal RNA genes for
phylogenetics. In: PCR Protocols: A Guide to Methods and
Applications (eds Innis MA, Gelfand DH, Sninsky JJ, White
TJ), pp. 482. Academic Press, San Diego.
Wiemers M (2003) Chromosome differentiation and the
radiation of the butterfly subgenus Agrodiaetus
(Lepidoptera: Lycaenidae: Polyommatus)—a molecular
phylogenetic approach. Doctorate Thesis, Rheinischen
Friedrich-Wilhelms-Universitat, Bonn, pp. 144.
Wiemers M, Fiedler K (2007) Does the DNA barcoding gap
exist?—a case study in blue butterflies (Lepidoptera:
Lycaenidae). Frontiers in Zoology, 4, 8.
Wiemers M, Stradomsky BV, Vodolazhsky DI (2010) A
molecular phylogeny of Polyommatus s. str. and Plebicula
based on mitochondrial COI and nuclear ITS2 sequences.
European Journal of Entomology, 107, 325–336.
Wu L-W, Yen S-H, Lees D, Hsu Y-F (2010) Elucidating genetic
signatures of native and introduced populations of the
Cycad Blue, Chilades pandava to Taiwan: a threat both to
Sago Palm and to native Cycas populations worldwide.
Biological Invasions, 12, 2649–2669.
Yago M, Hirai N, Kondo M et al. (2008) Molecular systematics
and biogeography of the genus Zizina (Lepidoptera:
Lycaenidae). Zootaxa, 1746, 15–38.
R.V. and V.D. focus on Palaearctic butterflies and use various
approaches (DNA sequencing, morphology, chromosome num-
ber, pheromones, etc.) to study aspects related to butterfly
systematics, evolution, biogeography and biodiversity. L.D. is
carrying out extensive research on butterfly biogeography at
the contact zones in the Mediterranean areas.
Data accessibility
DNA sequences: GenBank accession nos JN084662–JN084791.
Individual sample data: Table S1 (Supporting information).
Sample storage: Butterfly Diversity and Evolution Lab, Institut
de Biologia Evolutiva (CSIC-UPF), Barcelona, Spain.
Supporting information
Additional supporting information may be found in the online
version of this article.
Fig. S1 Representation of fixed landmarks (yellow circles) and
sliding semilandmarks (red circles) used for geometric mor-
phometry analyses of (a) wings underside, (b) falces and (c)
valvae (lateral view).
Fig. S2 Maximum likelihood tree based on COI sequences of
Polyommatus icarus, Polyommatus celina and several other Poly-
ommatus s. str. taxa. Bootstrap supports (>50%) are shown
above recovered branches. Grey cases indicate the position of
P. icarus and P. celina in the tree. Specimens in bold were dif-
ferently identified based on COI and ITS2 respectively.
Fig. S3 Bayesian trees based on the analysis of COI haplotypes
of Polyommatus icarus and Polyommatus celina. (a) Bayesian tree
based on COI haplotypes of P. icarus. (b) Bayesian tree based
on COI haplotypes of P. celina. Numbers at nodes indicate
Bayesian posterior probabilities (shown if higher than 50%).
Fig. S4 Maximum likelihood tree based on ITS2 sequences of
Polyommatus icarus, Polyommatus celina and several other Poly-
ommatus s. str. taxa. Bootstrap supports (>50%) are shown
above recovered branches. Grey cases indicate the position of
P. icarus and P. celina in the tree. Specimens in bold were dif-
ferently identified based on COI and ITS2 respectively.
Fig. S5 Maximum likelihood tree based on the combined data
set of COI and ITS2. Bootstrap supports and Bayesian posterior
probabilities (>50%) are shown above recovered branches. Grey
cases indicate the position of P. icarus and P. celina in the tree.
Fig. S6 Discriminant analyses displaying relative positions of
specimens belonging to the 16 different areas for (a) all traits,
(b) for genitalia PCs and aedeagus length, (c) for wing PCs.
� 2011 Blackwell Publishing Ltd

BIOGEOGRAPHY IN COMMON BLUE B UTTE RFLI ES 15
Numbered black squares represent group centroids. (d) Rela-
tionship between values for falces PCw and forewing centroid
size (wing size) in P. celina (white squares) and P. icarus (black
squares); symbols represent mean values for each of the 16
areas.
Fig. S7 Median-joining haplotype network inferred for Poly-
ommatus icarus using the program NETWORK 4.6.0.0.
Fig. S8 Median-joining haplotype network inferred for Poly-
ommatus celina using the program NETWORK 4.6.0.0.
� 2011 Blackwell Publishing Ltd
Table S1 Specimens of Polyommatus icarus, Polyommatus celina
and other Polyommatus s. str. taxa that were analysed in this
study. Specimens of P. icarus and P. celina with GenBank
sequences used in the analyses are also included in the list.
Samples marked in bold represent specimens with discordant
mitochondrial and nuclear DNA-based identification.
Please note: Wiley-Blackwell are not responsible for the content
or functionality of any supporting information supplied by the
authors. Any queries (other than missing material) should be
directed to the corresponding author for the article.
Copyright © 2022 FDOKUMEN