Testing the genetic predictions of a biogeographical model in a dominant endemic Eastern Pacific...
22
Testing the genetic predictions of a biogeographical model in a dominant endemic Eastern Pacific coral (Porites panamensis) using a genetic seascape approach Nancy C. Saavedra-Sotelo 1 , Luis E. Calderon-Aguilera 2 ,H ector Reyes-Bonilla 3 , David A. Paz-Garc ıa 4 , Ram on A. L opez-P erez 5 , Amilcar Cupul-Maga ~ na 6 , Jos e A. Cruz-Barraza 7 & Axay acatl Rocha-Olivares 1 1 Laboratorio de Ecolog ıa Molecular, Departamento de Oceanograf ıa Biol ogica, CICESE, Carretera Ensenada-Tijuana No. 3918, Ensenada, Baja California 22860, M exico 2 Laboratorio de Ecolog ıa y Pesquer ıas de la Zona Costera, Departamento de Ecolog ıa Marina, CICESE, Carretera Ensenada-Tijuana No. 3918, Ensenada, Baja California 22860, M exico 3 Departamento de Biolog ıa Marina, Universidad Aut onoma de Baja California Sur, A. P. 19, La Paz, Baja California Sur 23080, M exico 4 Laboratorio de Gen etica para la Conservaci on, Centro de Investigaciones Biol ogicas del Noroeste, Instituto Polit ecnico Nacional No. 195, Col. Playa Palo de Santa Rita Sur, La Paz, Baja California Sur 23096, M exico 5 Laboratorio de Ecosistemas Costeros, Departamento de Hidrobiolog ıa, UAM-Iztapalapa, Av. San Rafael Atlixco No. 186, Col. Vicentina, Distrito Federal 09340, M exico 6 Departamento de Ciencias Biol ogicas, Centro Universitario de la Costa, Universidad de Guadalajara, Av. Universidad de Guadalajara, No. 203, Puerto Vallarta, Jalisco 48280, M exico 7 Instituto de Ciencias del Mar y Limnolog ıa, Universidad Nacional Aut onoma de M exico (Unidad Acad emica Mazatl an), Avenida Joel Montes Camarena s/n, Mazatl an, Sinaloa 82040, M exico Keywords Ecological niche modeling, genetic diversity, genetic structure, hermatypic coral, MaxEnt, relaxed Abundant Center Hypothesis, seascape genetics. Correspondence Axay acatl Rocha-Olivares, Biological Oceanography Department, CICESE, Carretera Ensenada-Tijuana 3918, Ensenada, Baja California, C.P. 22860, M exico. Tel: + 646-1750544; Fax: + 646-1750545; E-mail: [email protected] Funding Information This research was supported by CONACYT- SEMARNAT grant no. 23390, CICESE internal grant 625112, CONACYT-SEMARNAT grant no. 108302, CONACYT grant no. 80228 and by a CONACYT grant no. 157993 (awarded to Eduardo F. Balart, CIBNOR). The first author received a postgraduate fellowship from CONACYT to support her PhD program in Marine Ecology at CICESE. Received: 18 June 2013; Revised: 23 July 2013; Accepted: 24 July 2013 Ecology and Evolution 2013; 3(12): 4070– 4091 doi: 10.1002/ece3.734 Abstract The coral fauna of the Eastern Tropical Pacific (ETP) is depauperate and peripheral; hence, it has drawn attention to the factors allowing its survival. Here, we use a genetic seascape approach and ecological niche modeling to unravel the environmental factors correlating with the genetic variation of Porites panamensis, a hermatypic coral endemic to the ETP. Specifically, we test if levels of diversity and connectivity are higher among abundant than among depauperate populations, as expected by a geographically relaxed version of the Abundant Center Hypothesis (rel-ACH). Unlike the original ACH, referring to a geographical center of distribution of maximal abundance, the rel-ACH refers only to a center of maximum abundance, irrespective of its geographic position. The patterns of relative abundance of P. panamensis in the Mexican Pacific revealed that northern populations from Baja California represent its center of abundance; and southern depauperate populations along the continental margin are peripheral relative to it. Genetic patterns of diversity and structure of nuclear DNA sequences (ribosomal DNA and a single copy open reading frame) and five alloenzymatic loci partially agreed with rel-ACH predictions. We found higher diversity levels in peninsular populations and significant differentiation between peninsular and continental colonies. In addition, conti- nental populations showed higher levels of differentiation and lower connectiv- ity than peninsular populations in the absence of isolation by distance in each region. Some discrepancies with model expectations may relate to the influence of significant habitat discontinuities in the face of limited dispersal potential. Environmental data analyses and niche modeling allowed us to identify temper- ature, water clarity, and substrate availability as the main factors correlating with patterns of abundance, genetic diversity, and structure, which may hold the key to the survival of P. panamensis in the face of widespread environmen- tal degradation. 4070 ª 2013 The Authors. Ecology and Evolution published by John Wiley & Sons Ltd. This is an open access article under the terms of the Creative Commons Attribution License, which permits use, distribution and reproduction in any medium, provided the original work is properly cited.
Transcript of Testing the genetic predictions of a biogeographical model in a dominant endemic Eastern Pacific...

Testing the genetic predictions of a biogeographical modelin a dominant endemic Eastern Pacific coral (Poritespanamensis) using a genetic seascape approachNancy C. Saavedra-Sotelo1, Luis E. Calderon-Aguilera2, H�ector Reyes-Bonilla3, David A. Paz-Garc�ıa4,Ram�on A. L�opez-P�erez5, Amilcar Cupul-Maga~na6, Jos�e A. Cruz-Barraza7 & Axay�acatl Rocha-Olivares1
1Laboratorio de Ecolog�ıa Molecular, Departamento de Oceanograf�ıa Biol�ogica, CICESE, Carretera Ensenada-Tijuana No. 3918, Ensenada, Baja
California 22860, M�exico2Laboratorio de Ecolog�ıa y Pesquer�ıas de la Zona Costera, Departamento de Ecolog�ıa Marina, CICESE, Carretera Ensenada-Tijuana No. 3918,
Ensenada, Baja California 22860, M�exico3Departamento de Biolog�ıa Marina, Universidad Aut�onoma de Baja California Sur, A. P. 19, La Paz, Baja California Sur 23080, M�exico4Laboratorio de Gen�etica para la Conservaci�on, Centro de Investigaciones Biol�ogicas del Noroeste, Instituto Polit�ecnico Nacional No. 195, Col.
Playa Palo de Santa Rita Sur, La Paz, Baja California Sur 23096, M�exico5Laboratorio de Ecosistemas Costeros, Departamento de Hidrobiolog�ıa, UAM-Iztapalapa, Av. San Rafael Atlixco No. 186, Col. Vicentina, Distrito
Federal 09340, M�exico6Departamento de Ciencias Biol�ogicas, Centro Universitario de la Costa, Universidad de Guadalajara, Av. Universidad de Guadalajara, No. 203,
Puerto Vallarta, Jalisco 48280, M�exico7Instituto de Ciencias del Mar y Limnolog�ıa, Universidad Nacional Aut�onoma de M�exico (Unidad Acad�emica Mazatl�an), Avenida Joel Montes
Camarena s/n, Mazatl�an, Sinaloa 82040, M�exico
Keywords
Ecological niche modeling, genetic diversity,
genetic structure, hermatypic coral, MaxEnt,
relaxed Abundant Center Hypothesis,
seascape genetics.
Correspondence
Axay�acatl Rocha-Olivares, Biological
Oceanography Department, CICESE,
Carretera Ensenada-Tijuana 3918, Ensenada,
Baja California, C.P. 22860, M�exico.
Tel: + 646-1750544; Fax: + 646-1750545;
E-mail: [email protected]
Funding Information
This research was supported by CONACYT-
SEMARNAT grant no. 23390, CICESE internal
grant 625112, CONACYT-SEMARNAT grant
no. 108302, CONACYT grant no. 80228 and
by a CONACYT grant no. 157993 (awarded
to Eduardo F. Balart, CIBNOR). The first
author received a postgraduate fellowship
from CONACYT to support her PhD program
in Marine Ecology at CICESE.
Received: 18 June 2013; Revised: 23 July
2013; Accepted: 24 July 2013
Ecology and Evolution 2013; 3(12): 4070–
4091
doi: 10.1002/ece3.734
Abstract
The coral fauna of the Eastern Tropical Pacific (ETP) is depauperate and
peripheral; hence, it has drawn attention to the factors allowing its survival.
Here, we use a genetic seascape approach and ecological niche modeling to
unravel the environmental factors correlating with the genetic variation of
Porites panamensis, a hermatypic coral endemic to the ETP. Specifically, we test
if levels of diversity and connectivity are higher among abundant than among
depauperate populations, as expected by a geographically relaxed version of the
Abundant Center Hypothesis (rel-ACH). Unlike the original ACH, referring to
a geographical center of distribution of maximal abundance, the rel-ACH refers
only to a center of maximum abundance, irrespective of its geographic position.
The patterns of relative abundance of P. panamensis in the Mexican Pacific
revealed that northern populations from Baja California represent its center of
abundance; and southern depauperate populations along the continental margin
are peripheral relative to it. Genetic patterns of diversity and structure of
nuclear DNA sequences (ribosomal DNA and a single copy open reading
frame) and five alloenzymatic loci partially agreed with rel-ACH predictions.
We found higher diversity levels in peninsular populations and significant
differentiation between peninsular and continental colonies. In addition, conti-
nental populations showed higher levels of differentiation and lower connectiv-
ity than peninsular populations in the absence of isolation by distance in each
region. Some discrepancies with model expectations may relate to the influence
of significant habitat discontinuities in the face of limited dispersal potential.
Environmental data analyses and niche modeling allowed us to identify temper-
ature, water clarity, and substrate availability as the main factors correlating
with patterns of abundance, genetic diversity, and structure, which may hold
the key to the survival of P. panamensis in the face of widespread environmen-
tal degradation.
4070 ª 2013 The Authors. Ecology and Evolution published by John Wiley & Sons Ltd.
This is an open access article under the terms of the Creative Commons Attribution License, which permits use,
distribution and reproduction in any medium, provided the original work is properly cited.

Introduction
Viable populations persist where reproduction and
survival balance or exceed mortality and emigration. The
highest abundance will generally occur in a region where
conditions are close to the physiological optima of the
species and biotic interactions allow the highest popula-
tion growth rates (Hoffmann and Blows 1994). This
region, called the center of abundance, is akin to the cen-
ter of mass of the entire species distribution. As ecological
conditions deteriorate away from this center, abundance
decreases until a limit is reached where viable populations
can no longer persist. In peripheral regions, scarcity of
viable habitat and resources limits population size and
increases population isolation (Brussard 1984). Peripheral
populations often have high turnover rates as their persis-
tence depends on the influx from central areas (Brown
1984; Vucetich and Waite 2003). Brown (1984) proposed
a generalized pattern of abundance in which the center of
abundance occurs at the geographical center of distribu-
tion of a species. This biogeographic pattern, known as
the Abundant Center Hypothesis (ACH, Hengeveld and
Haeck 1982; Pfenninger et al. 2011; Sagarin and Gaines
2002) or Central[Core]-Marginal[Peripheral] Hypothesis
(Hutchison 2003; Gapare et al. 2005; Eckert et al. 2008),
has drawn considerable theoretical and empirical atten-
tion in ecological and evolutionary research (reviewed by
Eckert et al. 2008; Sagarin and Gaines 2002; Sagarin et al.
2006). On the other hand, identifying the geographical
center and edges of a distribution may prove challenging
for some organisms whose ranges do not conform to reg-
ular geometric shapes (Brown et al. 1996). In addition,
for organisms with strong latitudinal components, such as
the linear distributions of coastal species in the eastern
Pacific, the effect of latitudinal gradients may be con-
founded with those hypothesized by the ACH (Guo
2012). Finally, given the increasing number of species in
which the ACH has not been found, the hypothesis has
been recently questioned as a general biogeographical pat-
tern, drawing considerable detraction from some ecolo-
gists who consider it an over simplified assumption
(Sagarin and Gaines 2002; Sagarin et al. 2006).
Here, we posit that the relevant “ecological centricity
and marginality” of populations transcends the geo-
graphic position and can be referred to the geographic
pattern of habitat quality across the ecological land- or
seascape (Pfenninger et al. 2011; Wagner et al. 2011).
Hence, we explicitly replace the center of geographic dis-
tribution by the center of abundance, to test for the
genetic consequences of the underlying ecological and
microevolutionary forces controlling abundance (e.g.,
favorable conditions at the center of abundance and
unfavorable away from it, high turnover, and lower
connectivity at the periphery, among others), even though
the center of abundance and the geographical center of
the distribution may not coincide (i.e., in the absence of
ACH sensu stricto). To prevent unproductive semantic
arguments, we define this model allowing for “geographi-
cally excentric” centers of abundance, functionally analo-
gous to the abundant geographic center of distribution of
the ACH, as the “relaxed ACH (rel-ACH)”, in which
periphery is defined relative to the center of abundance,
thus the adjectives “central” and “abundant” are used
interchangeably. In this model, the potential confounding
factor stemming from latitudinal gradients becomes moot,
as the driving ecological or evolutionary forces behind the
gradients become an integral part of those driving the
center of abundance, wherever it may be.
The mechanisms leading to geographically uncon-
strained centers of abundance provide a valuable null
model to address fundamental questions about the pat-
tern and degree of genetic structuring among populations
and to understand the processes involved in the evolution
of stable geographical limits (Hoffmann and Blows 1994;
Eckert et al. 2008). A basic prediction of the rel-ACH is
the presence of distinct genetic architectures in abundant
and depauperate populations. Because of their demo-
graphic surplus (i.e., higher natality than mortality rates),
abundant populations are more likely to share high levels
of connectivity, whereas those at the periphery, experienc-
ing higher turnover, will be more isolated. This results in
a gradient of decreasing genetic diversity away from the
center, reaching a minimum in peripheral populations
due to increased geographic isolation, genetic drift, and
directional selection, which will produce higher levels of
genetic differentiation (Hoffmann and Blows 1994; Vuce-
tich and Waite 2003). Natural populations do not always
conform to this pattern (reviewed by Eckert et al. 2008;
Sagarin and Gaines 2002). For instance, instead of acting
as sinks, marginal regions may experience diversification
and speciation in the presence of local adaptation favored
by low levels of maladaptive gene flow from central popu-
lations (Sagarin and Gaines 2002; Vucetich and Waite
2003; Eckert et al. 2008; Budd and Pandolfi 2010). These
issues are at the core of the debate regarding whether
marginal populations are worthy of conservation efforts
(Hunter and Hutchinson 1994; Lesica and Allendorf
1995; Budd and Pandolfi 2010).
Embedded in the question of what shapes the spatial dis-
tribution of a species lies the influence of environmental
and ecological factors determining its presence or absence
in the geographic land- or seascape. Once identified, these
factors may correlate with genetic patterns of discontinuity
and diversity. These so called land- or seascape genetic
analyses provide a mechanistic means to advance our
understanding on how the environmental landscape
ª 2013 The Authors. Ecology and Evolution published by John Wiley & Sons Ltd. 4071
N. C. Saavedra-Sotelo et al. Seascape Genetics of Porites panamensis

influences the processes and patterns of gene flow and local
adaptation (Manel et al. 2003). A powerful approach to
identify which environmental factors control the distribu-
tion of a species is the ecological niche-modeling (ENM)
framework. Several ENM approaches have been developed
such as the Genetic Algorithm for Rule-Set Prediction
(GARP, Stockwell and Peters 1999) and the Maximum
Entropy (MaxEnt, Phillips et al. 2006). These methods aim
to derive a predictive model of the conditional probability
of finding a species across the geographic space given the
range of values of environmental covariates that define its
niche. The MaxEnt approach uses sophisticated machine-
learning methods and has been increasingly used to iden-
tify the factors shaping the distribution of a species and to
predict potential distributions given environmental change
(Moreno et al. 2011; Kumar 2012; Yang et al. 2013). Thus,
the urgency in revisiting fundamental questions about spe-
cies distributional patterns relates to the need to assess
present and future impacts on natural ecosystems (Parme-
san et al. 2005). For instance, understanding the demo-
graphic and genetic processes controlling the genetic
structure of marginal populations is fundamental to
address the impacts of global climate and environmental
changes, given that these populations are the most vulnera-
ble and most likely to mediate the ensuing range shifts pro-
duced by those changes (Parmesan 2006; Sagarin et al.
2006).
Tropical coral reefs have been the focus of conservation
efforts for decades as they are the most diverse marine eco-
systems and provide goods and services worth billions of
dollars yearly (Moberg and Folke 1999). Yet, a significant
percentage of reef cover has been lost and more is threa-
tened by significant habitat deterioration and fragmenta-
tion at local and global scales (Barber et al. 2001; Knowlton
2001; Selig et al. 2010; Wild et al. 2011). Coral communi-
ties in the Eastern Tropical Pacific (ETP) are recognized as
the most peripheral and isolated at a global scale, which has
drawn attention to the factors allowing their survival in the
region (Guzman and Cort�es 1993; Cort�es 1997; Combosch
and Vollmer 2011; Baums et al. 2012). However, genetic
patterns of ETP hermatypic coral populations have only
recently begun to be understood (Paz-Garc�ıa et al. 2008a,
2012; Combosch and Vollmer 2011; Pinzon and LaJeunesse
2011; Saavedra-Sotelo et al. 2011; Aranceta-Garza et al.
2012; Baums et al. 2012; Pinzon et al. 2012).
Here, we address hypotheses regarding the patterns of
geographic variation of genetic diversity and structure of a
dominant and endemic ETP hermatypic coral in the Mexi-
can Pacific. Porites panamensis (Fig. 1) is distributed from
the Gulf of California (31°N) to Colombia (3°N) and
maybe particularly threatened by global change due to
increased vulnerability to warming (Veron 2000). Popula-
tions in Central America were severely impacted during
the early 80s and late 90s El Ni~no-Southern Oscillation
(ENSO) events (Glynn et al. 1994; Glynn 2000). Sea sur-
face temperature rise as a result of climate change may
severely challenge the future of this species, as its repro-
ductive strategy, involving brooding short-lived lecitho-
trophic planulae that settle near the parental colony, may
limit its long-distance dispersal potential (Reyes-Bonilla
1993; Glynn et al. 1994). In light of the above, we use a
combination of field surveys, ENM using MaxEnt, and
genetic analyses based on nuclear DNA sequences and
allozyme electrophoresis, to test the following hypotheses:
(1) levels of genetic diversity within populations of P. pan-
amensis will correlate with relative abundance, and will
decrease away from the center of abundance; (2) popula-
tions located near the center of abundance will show
higher levels of connectivity and less genetic structure than
marginal populations; (3) patterns of diversity and genetic
structure predicted by the rel-ACH will be strongly influ-
enced by the presence of significant habitat discontinuities
acting as barriers to dispersal; and (4) temperature will be
among the most influential environmental variables char-
acterizing the habitat of the species. We found partial
agreement with the rel-ACH predictions in the patterns of
genetic diversity and structure of colonies of P. panamensis
sampled from nine populations along the Mexican Pacific.
We argue that these patterns are the result of the limited
dispersal potential and discontinuity in habitat availability,
the latter being strongly influenced by temperature, water
clarity, and hard substrate availability.
Material and Methods
Patterns of coral abundance
To assess the geographical patterns of abundance of
P. panamensis and other zooxanthellate corals in the
Figure 1. Massive morphotype of the hermatypic coral Porites
panamensis from La Paz, Baja California Sur, Mexico (Photo: David A.
Paz-Garc�ıa).
4072 ª 2013 The Authors. Ecology and Evolution published by John Wiley & Sons Ltd.
Seascape Genetics of Porites panamensis N. C. Saavedra-Sotelo et al.

Mexican Pacific, we conducted surveys between July
2008 and July 2011 at nine localities known to possess
live coral colonies of P. panamensis: Bahıa de los Ange-
les (BLA), Bah�ıa Concepci�on (BC), Loreto (LO), Bahıa
de La Paz (LP), Cabo Pulmo (CP), Mazatlan (MZ), Is-
las Marietas (IM), Carrizales (CA), and Bahıas de Hua-
tulco (BH) (Fig. 2). Except for Mazatl�an, where only
one shallow transect was sampled, we surveyed herma-
typic coral communities along at least three 25 m-long
transects parallel to the coastline at depths 0–6 m, 7–12 m, and >13 m. We estimated percent live coral
cover and substratum type in 0.5 9 0.5 m in 10 quad-
rats placed evenly along transects. Surveying effort was
variable and coral cover correlated with effort for all
(P = 0.004) but not for P. panamensis (P = 0.926),
hence no standardization was necessary for the latter
(Table S1; Fig. S1).
Ecological niche model
To identify the environmental variables that characterize
the habitat of P. panamensis, we used the MaxEnt
approach of ENM to map its probability of potential
occurrence in the tropical Mexican Pacific and the Gulf
of California (GC). MaxEnt is a machine-learning method
particularly suited to model species distributions based on
presence-only data (Phillips et al. 2006), which is particu-
larly relevant given the significant challenges in producing
Figure 2. Sampling localities (white circles) and the estimated probability of habitat suitability for Porites panamensis using the maximum entropy
(MaxEnt) model. Values of estimated probability ranged from 0 (blue color) to 1 (red color). Histograms indicate total live coral cover (black bars)
and live coral cover of P. panamensis (white bars). Percentages are indicated above each bar; broken black columns represent values out of scale
(i.e., >10%). Rocky shorelines are indicated by bold lines.
ª 2013 The Authors. Ecology and Evolution published by John Wiley & Sons Ltd. 4073
N. C. Saavedra-Sotelo et al. Seascape Genetics of Porites panamensis

reliable “absence” data (see Elith et al. 2011 for a
discussion of this issue). The procedure uses environmen-
tal data (i.e., covariates) from occurrence records (i.e.,
presence sites) and from a random sample from the geo-
graphic area being modeled (i.e., background landscape
data) to estimate the ratio of the conditional probability
density of the covariates at the presence sites to the
unconditional (i.e., marginal) probability density of the
covariates across the studied landscape. The model then
estimates the conditional probability that the species is
present given the environment (see Dudik et al. 2007 for
machine learning and; Elith et al. 2011 for statistical
explanations of MaxEnt). Values >0.5 are considered ade-
quate for the establishment of reproductive populations
(Franklin 2009; Peterson et al. 2011). We compiled the
distributional data of P. panamensis from the scientific
literature (Reyes-Bonilla et al. 2005) and field surveys
from the authors.
Fifteen environmental variables were obtained from
public databases at 1° (lat-long) resolution (Table 1).
Alkalinity was estimated as a function of sea surface salin-
ity and temperature (Lee et al. 2006); pH and aragonite
concentration were estimated using the CO2SYS program
(Lewis and Wallace 1998). The model was run with the
software MaxEnt v.3.3.3k (Phillips et al. 2004), using a
maximum iteration value of 1000, default parameters
(convergence threshold of 10�5 and automatic regulariza-
tion of 10�4) and logistic output. The geographic output
presents the probability of occurrence of the species. The
discriminatory power of the model was evaluated on the
basis of the area under the curve (AUC) of the threshold
independent receiving operating characteristic (ROC)
analysis (Phillips et al. 2006), using 75% of the occur-
rence locations for model training and 25% for testing
(Franklin 2009). Jackknife resampling over variables was
used to assess their importance for the presence of the
species (Elith et al. 2011).
Tissue sampling and genetic analyses
Tissue samples (5 9 5 cm) were collected from live colonies
from August 2008 to November 2011 (Table S1) at the
surveyed localities, and included an additional small sample
(n = 2) from Isla Mar�ıa Madre (Islas Mar�ıas, Nayarit).
Sampled colonies were separated by at least 2–3 m to avoid
inadvertently resampling the same clone. Coral fragments
were suspended in preservation buffer (20% dimethyl sulf-
oxide, saturated NaCl, ethylenediaminetetraacetic acid
250 mmol/L pH 8) (Seutin et al. 1991). DNA was extracted
using standard proteinase K digestion and purified with a
salting-out protocol, followed by organic extraction, and sub-
sequent ethanol precipitation (Aljanabi and Mart�ınez 1997).
In order to integrate all genetic data available on this
species from the Mexican Pacific consisting of multiple
genetic markers with different mutation rates, we ampli-
fied and sequenced two nuclear DNA loci and reanalyzed
five alloenzymatic loci. The ITS1-5.8S-ITS2 region of
nuclear ribosomal DNA (rDNA) and an anonymous sin-
gle copy Open Reading Frame (ORF) were PCR amplified
using primers ITS4 and ITS5 (White et al. 1990) and
MM32f2 and MM32r2 (C. Prada and M. E. Hellberg,
pers. comm.), respectively. The rDNA was analyzed in all
available samples from each locality and the ORF in 50%
of the organisms (n = 12 per locality), owing to its lower
level of polymorphism (see Table S2 for PCR conditions
and thermal cycling profiles). We reanalyzed data from
five alloenzymatic loci (ME-1, GDH-1, GDH-2, EST-1,
and LGG-1) from a previous study of P. panamensis in
this region. These samples were collected from August
2004 to December 2006 from five localities sampled in
Table 1. Environmental variables obtained from public databases used to run Ecological Niche Model with the software MaxEnt v.3.3.3k (Phillips
et al., 2004).
Environmental variables Source Database
Temperature (°C) (yearly mean, maximum and minimum) MODIS-Aqua satellite available at ftp.cdc.noaa.gov/datasets/noaa.
oisst.v2/sst.mmean.mc
Chlorophyll-a concentration (mg/m3)
Yearly average of Photosynthetically Active Radiation (PAR, Einstein/m2/d)
Light attenuation coefficient (1/m)
Nutrient concentrations (Phosphate, Silicate and Nitrates; mM), World Ocean Atlas available at www.nodc.noaa.gov
Dissolved oxygen (mL/L)
Salinity (PSU)
Bathymetry (m) General Bathymetric Chart of the Oceans available at www.gebco.net
Atmospheric CO2 Scripps Institution of Oceanography, La Jolla, CA (http://scrippsco2.
ucsd.edu/data/ljo.html)
Alkalinity estimated as a function of sea surface salinity and temperature Equations described by Lee et al., 2006
pH and aragonite concentration were estimated from salinity,
temperature, alkalinity, silicate, phosphate, and atmospheric CO2
Estimates using the CO2SYS program (Lewis & Wallace 1998)
4074 ª 2013 The Authors. Ecology and Evolution published by John Wiley & Sons Ltd.
Seascape Genetics of Porites panamensis N. C. Saavedra-Sotelo et al.

this study (Bah�ıa de Los Angeles, Bah�ıa Concepci�on, La
Paz, Islas Marietas–Isla Redonda–, and Bah�ıas de Hua-
tulco –Playa La Entrega–), and an additional site in the
southern GC (Punta Arenas –PA–). See Paz-Garc�ıa et al.
(2012) for methodological details.
Genetic and environmental data analyses
DNA sequences were aligned using MEGA v.5 (Tamura
et al. 2011) and individual haplotypes identified using
DnaSP v.4.0 (Rozas et al. 2003). In organisms showing
intragenomic polymorphisms, haplotype reconstruction
was conducted by careful examination of chromatograms
and with the help of algorithms available in PHASE
(Stephens et al. 2001; Stephens and Donnelly 2003), fast-
PHASE (Scheet and Stephens 2006), and HAPAR (Wang
and Xu 2003) (Figs. S2 and S3; Table S3).
To examine the geographic patterns of genetic diversity,
we estimated haplotype (h) and nucleotide (p) diversities
using Arlequin v.3.1 (Excoffier et al. 2005). Given the het-
erogeneity in sample sizes, diversity was standardized to a
common sample size using resampling procedures. Hap-
lotype richness (A) and the number of private haplotypes
(pA) were standardized to n = 12 and n = 21 using the
program ADZE v. 1.0 (Szpiech et al. 2008); and haplotype
diversity (h) to n = 12 using a manual resampling proce-
dure in combination with Arlequin v.3.1 (Excoffier et al.
2005). To test patterns of genetic heterogeneity, we used
hierarchical Analyses of Variance (ANOVA, F-statistics)
and of Molecular Variance (AMOVA, Φ-statistics) as
implemented in Arlequin v.3.1 (Excoffier et al. 2005). For
the latter we used a matrix of interhaplotypic distances
based on the optimal model of nucleotide evolution
(JC+I+G both loci) obtained with MODELTEST v.3.7.
(Posada and Crandall 1998). With the aim of testing for
barriers to dispersal between central and peripheral popu-
lations, we estimated levels of genetic differentiation
among localities (Φst), between central/peninsular (BLA,
BC, LO, LP, PA, and CP: peninsular henceforth) and con-
tinental/peripheral (MZ, IM, CA, and BH: continental
henceforth) regions (Φct), and among localities within
regions (Φsc). In addition, we tested for differences
between pairs of localities. ANOVA and AMOVA signifi-
cance was evaluated through permutation tests and
adjusted for multiple testing using the sequential Bonfer-
roni correction (Rice 1989).
One of the basic genetic predictions of the rel-ACH is
that the central populations are more likely to share high
levels of connectivity than peripheral populations; hence,
we estimated mutation-scaled levels of effective popula-
tion size (h = 2Nel) and gene flow (M = m/l) using a
model-based approach involving maximum likelihood
Markov Chain Monte Carlo (MCMC), as implemented in
MIGRATE v.2.1.3 (Beerli 2004). MIGRATE uses a coales-
cence-based approach to estimate h and M (magnitude
and direction) among populations, assuming a constant
per-locus mutation rate (l). We used 10 short-chain
searches (5000 genealogies) and three long-chain searches
(50,000 genealogies) and a burn-in of 10,000 trees to
ensure independence from initial conditions.
To address the influence of habitat characteristics on
the genetic patterns of the species, we tested for correla-
tions between genetic diversity and differentiation with
environmental covariates. For this analysis, we used the
fifteen environmental variables mentioned above and four
additional: dissolved inorganic carbon (mol/m3), euphotic
zone depth (m) (source: MODIS-Aqua satellite, website
cited above), total particulate organic carbon (mol/kg)
(source: World Ocean Atlas, website cited above), and pri-
mary productivity (gC/m2/year) (source: http://www.scie
nce.oregonstate.edu/ocean.productivity/). First, we reduced
the dimensionality of the 19 variables into a new set that
accounted for most of the observed variance with a princi-
pal component analysis (PCA) of their standardized
(mean = 0, SD = 1) values. These principal components
(PC) were then correlated with levels of sample size-
standardized genetic diversity from each location. As envi-
ronmental gradients from central to peripheral populations
may generate a stepping stone pattern of dispersal in spe-
cies with limited dispersal capability, we tested the exis-
tence of isolation by distance (IBD). In addition, we
assessed whether genetic differentiation between pairs of
sites correlated with environmental distance, and if the lat-
ter correlated with geographic distance, as expected in the
presence of an environmental gradient. For this, we con-
structed matrices of geographical (km), environmental
(Euclidean distances from the 19 standardized variables),
and genetic (pairwise molecular Φst) distances between
pairs of sites and performed all pairwise correlations,
uncorrected and corrected for the third matrix, with par-
tial Mantel test as implemented in IBD v.1.52 (Bohonak
2002).
The two sequenced (rDNA and ORF) and the five allo-
zyme loci (ME-1, GDH-1, GDH-2, EST-1, and LGG-1)
were used in parallel analyses to test the same fundamen-
tal hypotheses regarding the patterns of genetic diversity
and structure predicted by the rel-ACH.
Results
Patterns of coral abundance in the MexicanPacific and ecological niche model
The general pattern of abundance of hermatypic corals in
the Mexican Pacific features higher coral cover in southern
localities decreasing northward with latitude (Fig. 2 black
ª 2013 The Authors. Ecology and Evolution published by John Wiley & Sons Ltd. 4075
N. C. Saavedra-Sotelo et al. Seascape Genetics of Porites panamensis

bars). In contrast, the abundance of P. panamensis is
higher in northern (peninsular) than in southern (conti-
nental) localities (Fig. 2 white bars). The highest cover of
this species was found in CP (5.3%), LP (4.8%), and BLA
(3.5%), all in Baja California; whereas the lowest were
found in the continent (BH = 0.25% and MZ = 0.1%).
To test for a latitudinal gradient in abundance, we corre-
lated the percent of live coral cover of P. panamensis, a
measure of absolute abundance, and the ratio of live coral
cover of P. panamensis to total cover, a measure of relative
abundance, with latitude. Even though the trend of P. pan-
amensis cover was to increase with latitude, it was not
significant (r = 0.30 P = 0.43, Fig. S4A). In contrast, the
relative abundance of P. panamensis showed a significant
latitudinal gradient (r = 0.84 P = 0.004; Fig. S4B). This is
consistent with the covariance of P. panamensis abundance
with its level of dominance in coral communities. In
northern localities, this species was the dominant zooxan-
thellate coral contributing with over 68% of total cover in
BLA, BC, and LO. In LP and CP, the dominance was less
dramatic but the species contributed nearly 50% of total
cover. In contrast, the contribution of P. panamensis in
continental localities was considerably smaller and
declined toward the south (IM 17%, CA 14%, and BH
0.6%). These patterns reveal that in the Mexican Pacific,
northern peninsular populations represent the center of
abundance of the species whereas southern continental
localities harbor peripheral depauperate populations.
Admittedly, our sampling does not cover the entire range
of the species, which extends south to Colombia. However,
we expect this pattern of southern depauperate popula-
tions to hold based on published abundance patterns
(Glynn et al. 1994; Glynn 2000).
The ecological niche model of P. panamensis was very
robust (AUC = 0.969) and four environmental variables
explained ~77% of the variance: PAR (35.7%), nitrate
concentration (16.5%), minimum temperature (15.4%),
and bathymetry (9.6%); the remaining were of lesser
importance. The results showed the most likely habitat
for the species is found in the GC and a few hotspots
along the continental Mexican Pacific, such as in the
islands close to the entrance of the GC and in the Gulf of
Tehuantepec (Fig. 2). Inside the GC, the model maps the
presence of suitable rocky habitat on both coasts fairly
well (Fig. 2). Even though the probability of occurrence
was not correlated with the abundance of P. panamensis,
as measured by percent live coral cover (P = 0.13) or rel-
ative abundance (P = 0.53), there were some notable
parallels. For instance, BLA with the highest probability
of occurrence (0.849) had one of the highest coral covers
and MZ with a smaller probability of occurrence (0.544)
showed consistently the lowest coral cover (Table 2).
Among peninsular localities, the sites with a lower coral
cover agree with the lowest probability of occurrence (BC
0.698 and LO 0.583). In contrast, the high probability of
occurrence (0.704) and the low coral cover observed in
BH were contradictory (Table 2).
Intraindividual rDNA polymorphisms
A few (15.3%) rDNA sequences revealed the presence of
intragenomic polymorphisms: all instances involved the
combination of only two sequence variants. Individual
haplotypes from these organisms were completely resolved
(Figs. S2 and S3; Table S3). To test the influence of in-
tragenomic polymorphisms on molecular diversity esti-
mates, we compared genetic diversity using two coding
strategies. In the first, individuals were considered diploid
(i.e., homoplasmic colonies were coded as homozygous
and heteroplasmic as heterozygous); in the second, homo-
plasmic colonies were treated as haploid and heteroplas-
mic were treated as two haploid individuals, hence,
effectively increasing sample sizes in the affected popula-
tions (Table S3). We found no significant differences in
estimates of h between approaches (t480(0.05) = 1.17,
P = 0.24), hence we opted to treat heteroplasmic colonies
as independent haploid organisms.
Geographic patterns of genetic diversity
The three types of genetic marker analyzed in this study
showed contrasting levels of polymorphisms, in which the
rDNA sequences were the most diverse and the allozymes
the least. The nuclear rDNA sequences (n = 215 seqs.
555 bp) contained 18 variable sites, 13 parsimony-infor-
mative sites, and eight indels. A total of 35 haplotypes
were found, only eight of which were shared among some
localities (Table S4). Baja California locations shared five
haplotypes and only two were shared with continental
locations. Localities along the coast of southwestern Mex-
ico shared three haplotypes and possessed fewer unique
haplotypes compared to those in the peninsula (Fig. 3).
The two colonies sampled from Isla Mar�ıa Madre shared
a haplotype also found in Islas Marietas. Due to the lim-
ited sample size, this location was not included in further
analyses.
The ORF sequences (n = 108; 363 bp) contained seven
segregating sites, six of them parsimony informative.
Fourteen ORF haplotypes were found in total, four of
which were shared among some localities. The most wide-
spread and prevalent occurred in 58% of the individuals
(Table S5). Two haplotypes were shared between regions
and one was characteristic to each region (ORF-2 green
and ORF-6 yellow, Fig. 3). In contrast, two allozyme loci
(ME-1 and GDH-1) were di-allelic, two (GDH-2 and
EST-1) were tri-allelic, and one (LGG-1) was penta-allelic
4076 ª 2013 The Authors. Ecology and Evolution published by John Wiley & Sons Ltd.
Seascape Genetics of Porites panamensis N. C. Saavedra-Sotelo et al.

(Figs S5 and S6) in the 139 additional organisms geno-
typed using protein electrophoresis. All but two alleles
were shared among localities; however, some revealed
significant frequency shifts among regions (e.g., relative
abundance of yellow EST-1 allele, Fig. 3; gray and blue
ME-1 and GDH-1 alleles inside and outside of the Gulf,
Fig. S5) and two of them were private (white EST-1 pre-
dominant in BH and white LGG-1 in BLA, Fig. 3). The
patterns of genotype distribution paralleled that of the
alleles with the presence of frequency shifts among
regions and private genotypes (Fig. S6). These results
reveal that, in consistence with rel-ACH predictions, cen-
tral localities in Baja California have a similar genetic
architecture, whereas peripheral continental corals are
more heterogeneous among themselves and distinct from
the abundant northern populations.
The geographic patterns of diversity among genetic
markers were largely congruent but not identical, and
revealed a trend of higher diversity levels in peninsular
abundant coral populations. Even though mean levels of
genetic diversity in continental localities did not signifi-
cantly differ from those in the peninsula (rDNA t162
(0.05) = 0.51, P = 0.61; ORF t95(0.05) = 1.40, P = 0.16; allo-
zyme t102(0.05) = 0.52, P = 0.60), the most diverse locali-
ties were located in Baja California (rDNA: BLA, LO, LP,
and CP h(12) ≥ 0.63; ORF: BLA, LO, and CP h ≥ 0.62;
allozymes: BLA, BC, and LP He > 0.553; Table 2) and a
larger fraction of the most diverse localities per genetic
marker were found there (five of six in rDNA with
h(12) ≥ 0.63, three of four in ORF with h ≥ 0.62, and
three of four in allozymes with He ≥ 0.553). Nucleotide
diversity behaved similarly to haplotype diversity. Similar
trends to h were found in haplotype richness of rDNA as
LO, LP, and CP (A(12) = 4.65, 5.48 and 6.94) were the
most diverse in Baja California, and IM (A(12) = 5.52) in
the continent. Likewise, the highest haplotype richness of
ORF were found in peninsular localities (BLA = 5 and
CP = 7). In contrast, the total number of alloenzymatic
alleles for all loci varied very little among localities
(14 ≥ A ≥ 12) (Table 2).
To test diversity patterns according to rel-ACH predic-
tions, we correlated the percent live coral cover with
levels of genetic diversity (h and A for rDNA and ORF
and He and A for allozymes). Even though the trends
suggest a positive relationship of DNA sequence diversity
with coral abundance (Fig. S7A–D), consistent with rel-
Table 2. Sample size (n), number of haplotypes or alleles (A), private haplotypes or alleles (pA), haplotype diversity (h � SD), nucleotide diversity
(p � SD), observed heterozygosity (Ho), expected heterozygosity (He), Porites panamensis percent live coral cover (% LCC), and MaxEnt derived
probability of occurrence (PO).
rDNA (ITS)
Region Localities n A pA A(12) pA(12) A(21) pA(21) h h(12) p (%) % LCC (�SD) PO
Peninsula BLA 29 6 3 3.90 1.51 5.10 2.38 0.63 � 0.07 0.65 � 0.11 0.28 � 0.19 3.50 (�0.81) 0.849
BC 24 3 0 2.71 0.19 2.99 0.02 0.42 � 0.11 0.44 � 0.14 0.08 � 0.08 1.10 (�0.03) 0.698
LO 21 6 2 4.65 1.47 6 2.08 0.75 � 0.06 0.75 � 0.09 0.45 � 0.28 2.10 (�0.62) 0.583
LP 28 9 5 5.48 2.55 7.67 3.99 0.70 � 0.09 0.71 � 0.13 0.25 � 0.18 4.80 (�2.58) 0.746
CP 30 11 5 6.94 2.74 9.31 4.01 0.88 � 0.04 0.87 � 0.07 0.41 � 0.25 5.30 (�3.96) 0.716
Continent MZ 21 3 2 2.14 1.14 3 2 0.19 � 0.11 0.20 � 0.13 0.03 � 0.05 0.10 (�0.00) 0.544
IM 34 10 7 5.52 3.84 7.75 6.06 0.71 � 0.08 0.70 � 0.12 0.41 � 0.26 2.62 (�1.63) 0.745
CA 12 2 0 2 1.65 n.d. n.d. 0.17 � 0.13 0.17 � 0.13 0.12 � 0.11 2.83 (�1.56) 0.733
BH 14 3 2 2.97 1.99 n.d. n.d. 0.48 � 0.14 0.48 � 0.15 0.27 � 0.19 0.25 (�0.33) 0.704
Region Localities
ORF Allozymes (five enzyme systems)
n A pA h p (%) n A pA Ho He
Peninsula BLA 12 5 2 0.73 � 0.11 0.35 � 0.26 20 14 1 0.260 0.583
BC 12 2 0 0.17 � 0.13 0.09 � 0.11 20 13 0 0.180 0.564
LO 12 3 0 0.62 � 0.09 0.30 � 0.23 – – – – –
LP 12 3 1 0.44 � 0.16 0.13 � 0.14 20 13 0 0.190 0.553
PA – – – – – 34 13 0 0.106 0.479
CP 12 7 4 0.86 � 0.08 0.52 � 0.36 – – – – –
Continent MZ 11 4 2 0.69 � 0.13 0.31 � 0.25 – – – – –
IM 14 2 0 0.14 � 0.12 0.04 � 0.07 20 12 0 0.141 0.430
CA 12 3 1 0.32 � 0.16 0.09 � 0.11 – – – – –
BH 11 1 0 0 0 25 13 1 0.160 0.533
Locations are categorized as peninsular (BLA, BC, LO, LP, PA, CP) and continental (MZ, IM, CA, BH). Allozyme data are from Paz-Garc�ıa et al.
(2012). Subscript in brackets indicates standardized values at minimum sample size (n = 12 and n = 21). n.d., Not defined and –, no data.
ª 2013 The Authors. Ecology and Evolution published by John Wiley & Sons Ltd. 4077
N. C. Saavedra-Sotelo et al. Seascape Genetics of Porites panamensis
(A)
(B)
(C)
Figure 3. Sampling localities (red circles) and
haplotype and allele frequencies from (A)
rDNA, (B) a nuclear ORF, and (C) three
representative alloenzymatic loci (of five
analyzed). Shared haplotypes or alleles are
color coded, the rest are private (n = sample
size).
4078 ª 2013 The Authors. Ecology and Evolution published by John Wiley & Sons Ltd.
Seascape Genetics of Porites panamensis N. C. Saavedra-Sotelo et al.
ACH predictions, the only significant correlation was
found in rDNA diversity as measured by A(12) (r = 0.76,
P = 0.02) (Fig. S7B). Mean levels of diversity of the five
allozyme loci did not reveal any relationship with live
coral cover (Fig. S7E–F). Careful analyses of the scatter
plots revealed that the inconsistencies with rel-ACH were
attributable to two samples. Carrizales (CA) had high
coral cover but low diversity in rDNA and Mazatlan
(MZ) had a very low coral cover but relatively high
genetic diversity in ORF (Table 2; Fig. S7A–D). Notably,these outlying observations are responsible for the lack of
significance in the above correlations (exclusion of CA
yields for hrDNA r = 0.84 P = 0.009 and increases ArDNA
r = 0.88 P = 0.004; exclusion of MZ yields for hORFr = 0.75 P = 0.03 and AORF r = 0.80 P = 0.02).
Geographic patterns of genetic structureand gene flow
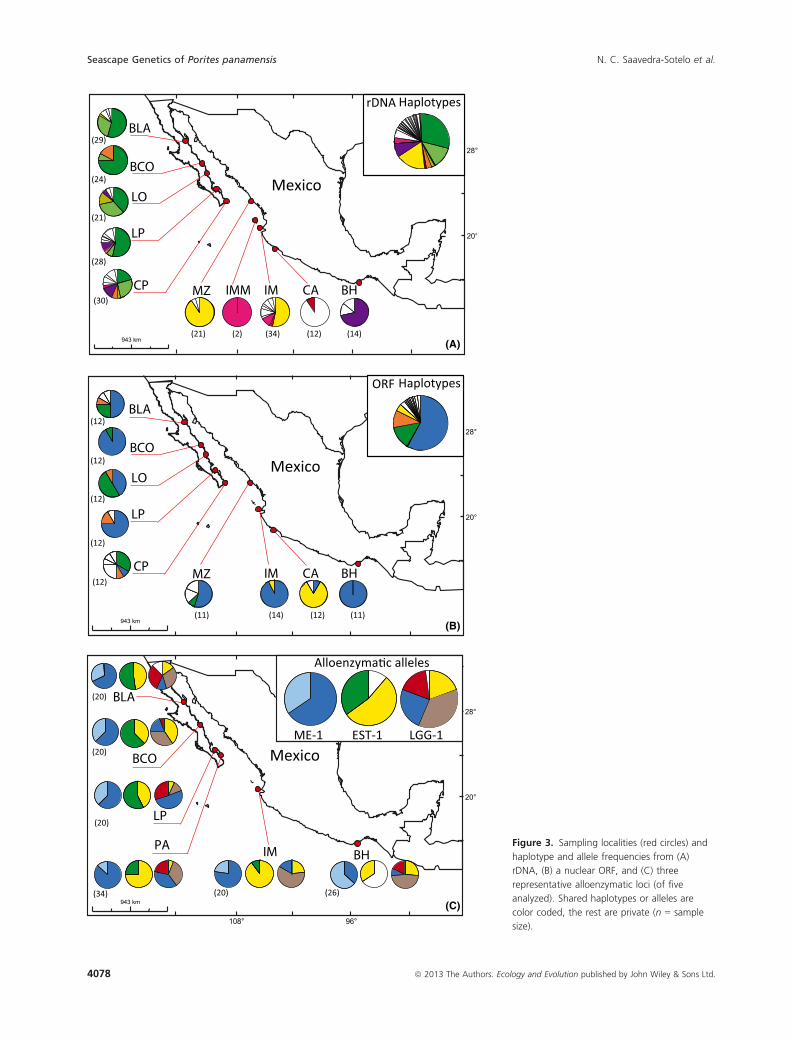
Porites panamensis exhibited significant population struc-
ture across the Mexican Pacific (Table 3A). Significant
heterogeneity was observed among populations in all
molecular markers and the degree of structure correlated
with their level of polymorphism (rDNA Φst = 0.726 >ORF Φst = 0.385 > allozymes Fst = 0.138, all P < 0.01).
Significant structure was also found between peninsular
and continental regions in rDNA (Φct = 0.437 P < 0.001)
and allozymes (Fct = 0.050 P = 0.02), ORF being margin-
ally nonsignificant (Φct = 0.116 P = 0.058); and finally
among populations within regions (rDNA Φsc = 0.512;
ORF Φsc = 0.304; allozymes Fsc = 0.093, all P < 0.001).
Differentiation among localities in each region revealed a
higher degree of genetic structuring among continental
(rDNA Φst = 0.795; ORF Φst = 0.550; allozymes
Fst = 0.181, all P < 0.001) than among peninsular (rDNA
Φst = 0.136; allozymes Fst = 0.062, both P < 0.001; and
ORF Φst = 0.169 P < 0.01) populations (Table 3B, C).
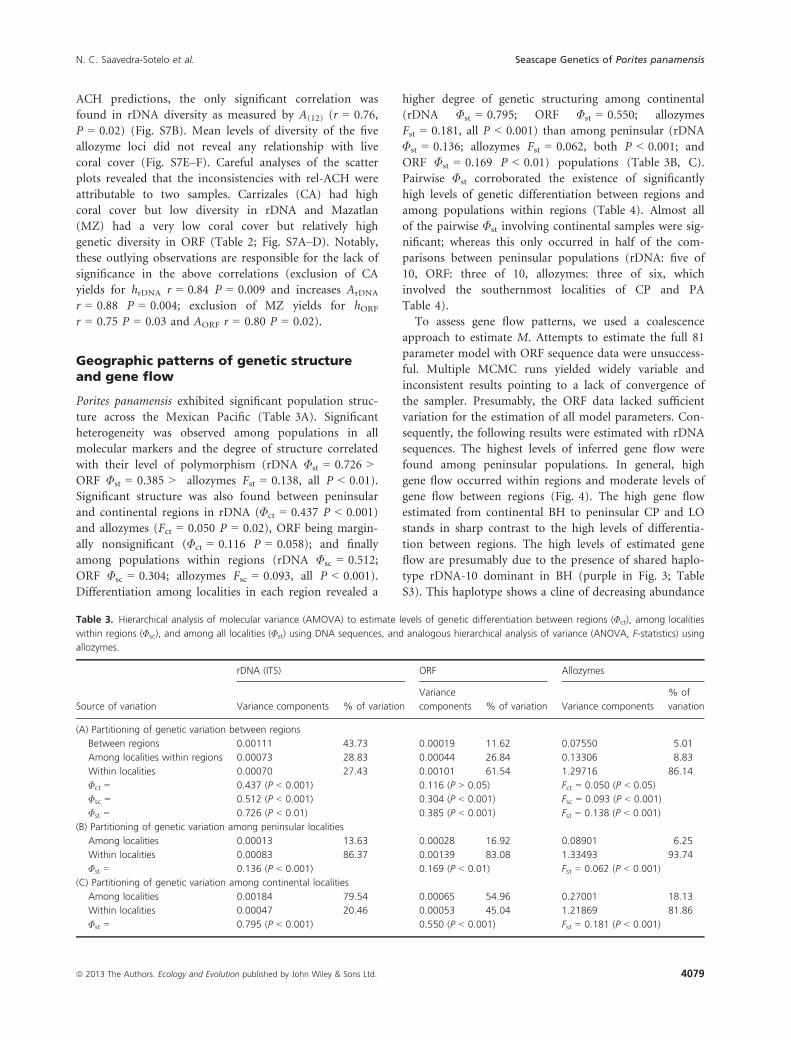
Pairwise Φst corroborated the existence of significantly
high levels of genetic differentiation between regions and
among populations within regions (Table 4). Almost all
of the pairwise Φst involving continental samples were sig-
nificant; whereas this only occurred in half of the com-
parisons between peninsular populations (rDNA: five of
10, ORF: three of 10, allozymes: three of six, which
involved the southernmost localities of CP and PA
Table 4).
To assess gene flow patterns, we used a coalescence
approach to estimate M. Attempts to estimate the full 81
parameter model with ORF sequence data were unsuccess-
ful. Multiple MCMC runs yielded widely variable and
inconsistent results pointing to a lack of convergence of
the sampler. Presumably, the ORF data lacked sufficient
variation for the estimation of all model parameters. Con-
sequently, the following results were estimated with rDNA
sequences. The highest levels of inferred gene flow were
found among peninsular populations. In general, high
gene flow occurred within regions and moderate levels of
gene flow between regions (Fig. 4). The high gene flow
estimated from continental BH to peninsular CP and LO
stands in sharp contrast to the high levels of differentia-
tion between regions. The high levels of estimated gene
flow are presumably due to the presence of shared haplo-
type rDNA-10 dominant in BH (purple in Fig. 3; Table
S3). This haplotype shows a cline of decreasing abundance
Table 3. Hierarchical analysis of molecular variance (AMOVA) to estimate levels of genetic differentiation between regions (Φct), among localities
within regions (Φsc), and among all localities (Φst) using DNA sequences, and analogous hierarchical analysis of variance (ANOVA, F-statistics) using
allozymes.
Source of variation
rDNA (ITS) ORF Allozymes
Variance components % of variation
Variance
components % of variation Variance components
% of
variation
(A) Partitioning of genetic variation between regions
Between regions 0.00111 43.73 0.00019 11.62 0.07550 5.01
Among localities within regions 0.00073 28.83 0.00044 26.84 0.13306 8.83
Within localities 0.00070 27.43 0.00101 61.54 1.29716 86.14
Φct = 0.437 (P < 0.001) 0.116 (P > 0.05) Fct = 0.050 (P < 0.05)
Φsc = 0.512 (P < 0.001) 0.304 (P < 0.001) Fsc = 0.093 (P < 0.001)
Φst = 0.726 (P < 0.01) 0.385 (P < 0.001) Fst = 0.138 (P < 0.001)
(B) Partitioning of genetic variation among peninsular localities
Among localities 0.00013 13.63 0.00028 16.92 0.08901 6.25
Within localities 0.00083 86.37 0.00139 83.08 1.33493 93.74
Φst = 0.136 (P < 0.001) 0.169 (P < 0.01) Fst = 0.062 (P < 0.001)
(C) Partitioning of genetic variation among continental localities
Among localities 0.00184 79.54 0.00065 54.96 0.27001 18.13
Within localities 0.00047 20.46 0.00053 45.04 1.21869 81.86
Φst = 0.795 (P < 0.001) 0.550 (P < 0.001) Fst = 0.181 (P < 0.001)
ª 2013 The Authors. Ecology and Evolution published by John Wiley & Sons Ltd. 4079
N. C. Saavedra-Sotelo et al. Seascape Genetics of Porites panamensis
toward the north in localities where it is present. Notably,
there is a 1800 km gap between BH, where it dominates,
and the peninsular localities (CP, LP, LO), where it
becomes increasingly rare. Most gene flow values between
localities were less than one or zero (Table S6). Three of
nine simulated models were consistent among them in the
general patterns and magnitude of gene flow, of which we
present only one. The other six models were inconsistent
in the estimated magnitudes but recovered the general
patterns predicted by the rel-ACH. Gene flow patterns for
allozymes, derived from Fst values under Wright’s island
model (Nem = (1/Fst–1)/4) (Wright 1969), revealed that
gene flow was moderate to high among peninsular popu-
lations and low among continental populations. Also, lev-
els of gene flow between peninsular and continental
samples were limited (Paz-Garc�ıa et al. 2008a).
Environmental variables related to geneticpatterns
The PCA applied to the 19 environmental variables pro-
duced three PCs that captured most (85.92%) of the envi-
Table 4. Pairwise Φst and Fst between populations of Porites panamensis obtained from rDNA, ORF and allozyme analyses and linear geographic
distance between localities in kilometers used in IBD analyses.
Pairwise Φst rDNA Pairwise Φst ORF Pairwise Fst alloenzymes Distance, km
BLA vs. BC 0.138 0.096 0.001 305
BLA vs. LO 0.029 0.017 – 409
BLA vs. LP 0.045 0.049 0.001 621
BLA vs. PA – – 0.038 695
BLA vs. CP 0.142 0.114 – 736
BLA vs. MZ 0.815 0.088 – 953
BLA vs. IM 0.723 0.235 0.081 1216
BLA vs. CA 0.858 0.548 – 1438
BLA vs. BH 0.688 0.223 0.124 2406
BC vs. LO 0.304 0.341 – 102
BC vs. LP 0.018 0 0.014 314
BC vs. PA – – 0.072 388
BC vs. CP 0.289 0.331 – 428
BC vs. MZ 0.895 0.130 – 660
BC vs. IM 0.786 0.005 0.086 912
BC vs. CA 0.921 0.712 – 1133
BC vs. BH 0.782 0 0.129 2119
LO vs. LP 0.102 0.267 – 217
LO vs. CP 0.049 0.052 – 327
LO vs. MZ 0.845 0.213 – 559
LO vs. IM 0.721 0.490 – 808
LO vs. CA 0.888 0.646 – 1028
LO vs. BH 0.678 0.489 – 2000
LP vs. PA – – 0.070 75
LP vs. CP 0.156 0.276 – 119
LP vs. MZ 0.779 0.087 – 410
LP vs. IM 0.704 0.055 0.141 616
LP vs. CA 0.806 0.669 – 823
LP vs. BH 0.594 0.053 0.167 1798
PA vs. IM – – 0.018 600
PA vs. BH – – 0.159 1720
CP vs. MZ 0.665 0.203 – 307
CP vs. IM 0.596 0.440 – 498
CP vs. CA 0.682 0.566 – 706
CP vs. BH 0.360 0.422 – 1675
MZ vs. IM 0.113 0.232 – 119
MZ vs. CA 0.969 0.573 – 528
MZ vs. BH 0.913 0.224 – 1495
IM vs. CA 0.809 0.753 – 244
IM vs. BH 0.763 0 0.154 1215
CA vs. BH 0.897 0.826 – 978
Bold values are significant (P < 0.05) after sequential Bonferroni correction and (–) no data.
4080 ª 2013 The Authors. Ecology and Evolution published by John Wiley & Sons Ltd.
Seascape Genetics of Porites panamensis N. C. Saavedra-Sotelo et al.

ronmental variance (PC1 = 56.84%, PC2 = 20.36%, and
PC3 = 8.72%). To test the influence of environmental
characteristics on standardized genetic diversity, we corre-
lated the three principal components with A and h of rDNA
and ORF, and with He and A of allozymes. Of the three
PCs, only PC2 significantly correlated with A and h of
rDNA (Fig. 5) and none with measures of ORF and allo-
zyme diversity. PC2 had major factor loadings (FL) on
chlorophyll a concentration (FL = �0.84), PAR (FL =0.80), and light attenuation coefficient (FL = �0.87).
To test the influence of geographic and environmental
distances on genetic patterns, we conducted partial Man-
tel tests among matrices of pairwise Φst, geographic and
environmental distances that revealed significant correla-
tions between genetic differentiation and the geographical
distance with rDNA (P = 0.03), but not between the for-
mer and environmental distance (Table 5). Moreover, the
significant correlation between geographical and environ-
mental distances (P = 0.02) revealed the presence of an
environmental gradient. However, a detailed analysis of
the scatter plot of Φst versus geographic distance shows
that there is no significant correlation among peninsular
(r = �0.28, P = 0.78, black points in Fig. 6A), among
continental (r = 0.45, P = 0.27, red points in Fig. 6A), or
between peninsular versus continental localities
(r2 = 0.18, P = 0.49, blue points in Fig. 6A). Hence, the
IBD signal over all data is driven by two clusters of com-
parisons showing markedly different patterns of genetic
structure. On the one hand is a cluster of poorly differen-
tiated peninsular populations (except for one continental
comparison) and on the other a cluster of extremely dif-
ferentiated populations encompassing both among-conti-
nental and peninsular-continental comparisons. We posit
that this pattern reveals not stepping-stone dispersal con-
sistent with IBD, but the influence of the GC acting as a
major geographic barrier separating peninsular and conti-
nental populations. Partial Mantel test using allozyme
data showed significant correlations between genetic
PacificOcean
Gulf of California
Gulf ofMéxico
28°
96°
20°
108°
943 km
U S A
PacificOcean
471.5 km
28°
24°
114°
M = 0 – 105
M = 105 – 106 6M> 15
1
23
4
5
6
78
9
Figure 4. Direction and magnitude of gene flow between population pairs (black circles) of Porites panamensis estimated from rDNA sequences.
Arrows represent directional gene flow and their relative magnitude is coded by line thickness. 1- BLA, 2- BC, 3- LO, 4- LP, 5- CP, 6- MZ, 7- IM,
8- CA, and 9- BH.
ª 2013 The Authors. Ecology and Evolution published by John Wiley & Sons Ltd. 4081
N. C. Saavedra-Sotelo et al. Seascape Genetics of Porites panamensis

differentiation and the geographical distance controlling
for environmental Euclidean distance (P = 0.001; Table 5,
Fig. 6B). These scatter plots of genetic versus geographic
distance allozyme data are largely congruent with those
obtained with rDNA (Fig. 6), hence they reflect the same
processes described above. Remarkably, both patterns
were obtained from independent loci and independent
samples separated in time.
Discussion
The geographic patterns of abundance, genetic diversity,
differentiation, and gene flow among populations of P.
panamensis are partially consistent with the rel-ACH, in
which northern peninsular populations represent the
center of abundance and southern populations along the
Mexican continental margin are peripheral. On the other
hand, some expected patterns, such as isolation by dis-
tance along a latitudinal gradient, are equivocal. We
argue that this partial concordance with the biogeograph-
ic model results from the combined effects of the biologi-
cal features of the species, such as a limited dispersal
potential, habitat discontinuity, and evolutionary pro-
cesses.
Patterns of abundance and environmentalvariation
P. panamensis showed maximum levels of abundance in
northern localities along the eastern rocky coast of the
peninsula of Baja California, which represents its center
of abundance. Consequently, the continental populations
r = 0.80 P = 0.01
r = 0.77 P = 0.009
–1.6 –1.4 –1.2 –1.0 –0.8 –0.6 –0.4 –0.2 0.0 0.2 0.4 0.6 0.8 1.0 1.2 1.4
Factor 2 (PCA)
1
2
3
4
5
6
7
8
–1.6 –1.4 –1.2 –1.0 –0.8 –0.6 –0.4 –0.2 0.0 0.2 0.4 0.6 0.8 1.0 1.2 1.40.1
0.2
0.3
0.4
0.5
0.6
0.7
0.8
0.9
A (1
2)
Factor 2 (PCA)
h (1
2)
(A)
(B)
Figure 5. Correlation between genetic
diversity of Porites panamensis using rDNA and
Factor 2 of PCA. (A) Standardized haplotype
richness (A(12)) versus Factor 2 and (B)
standardized haplotype diversity index (h(12))
versus Factor 2.
4082 ª 2013 The Authors. Ecology and Evolution published by John Wiley & Sons Ltd.
Seascape Genetics of Porites panamensis N. C. Saavedra-Sotelo et al.

along the western continental coast of Mexico represent
peripheral populations relative to the center of abun-
dance, following the rel-ACH model.
The ENM revealed that the highest probability of wide-
spread occurrence of P. panamensis is found in the GC,
largely along the peninsular coast and at the entrance of
the Gulf. Even though the model only predicts probability
of occurrence, not abundance, high probability of occur-
rence coincided with coral cover (i.e., abundance) in sev-
eral regions, with notable exceptions. Two of the sampled
continental localities stand out as less suitable for P. pan-
amensis, as per the MaxEnt model predictions. One is
Mazatlan, Sinaloa, representing the northernmost limit of
distribution of the species on the Pacific continental mar-
gin. The coast of the state of Sinaloa is mostly sedimentary
and is subject to strong fluctuations in sediment deposi-
tion and resuspension due to wind-wave action and con-
siderable runoff. Near Mazatlan, these unstable and
unfavorable conditions for corals are mainly responsible
for their rarity. Coral forms are mainly incrusting (such as
Porites) and coral reef structures are conspicuously absent.
The second is Carrizales, Colima, which has the lowest
probability of occurrence of all sampled locations yet has a
coral cover comparable to the much more environmentally
friendly Islas Marietas in Bah�ıa de Banderas, Jalisco
(Fig. 2). Carrizales is a small bay that may have limited
connectivity with the rest of localities constituting a singu-
lar locality for hermatypic corals, and populations in this
area may be self-recruiting, promoting inbreeding and loss
of genetic diversity. In the case of Pavona gigantea, this
locality was also strongly differentiated (Saavedra-Sotelo
et al. 2011). A probability of occurrence hotspot off the
coast of Guerrero (16° 48′ 22″ N, 99° 51′ 7″ W) was not
sampled in this study, whereas in the southernmost sam-
pled locality (BH) the high probability of occurrence con-
tradicted the extremely low abundance of P. panamensis in
an otherwise healthy and abundant coral reef system
(Fig. 2). The low abundance of P. panamensis in these
southern localities with suitable environmental conditions,
as per the model predictions, suggests that biological and
ecological factors, not included in the model, may be limit-
ing the abundance of P. panamensis in the area (Elith et al.
2011). Interspecific competition may be a likely factor, as
deduced from the increasing dominance of P. panamensis
in the coral communities from the peripheral (i.e., south-
ern) to the abundant central region to the north, where
this species becomes increasingly dominant (Fig. 2).
Temperature, water clarity, and hard substrate avail-
ability show contrasting patterns in central and peripheral
populations, which relate to the major variables determin-
ing the presence of P. panamensis according to the ENM.
Abundance patterns of tropical hermatypic corals gener-
ally follow a latitudinal gradient, with higher abundances
at low latitudes decreasing toward their distributional
limits at higher latitudes (Hughes et al. 1999), as seen in
our total coral cover data along the Mexican Pacific
(black columns in Fig. 2). However, the pattern for
P. panamensis is inverted. This is may be explained by the
apparently singular thermal physiology of this species.
Low temperature is a major limiting environmental vari-
able for the development of corals (Harriott 1999; Kleypas
et al. 1999). Even though there is no experimental evi-
dence on the thermal tolerance of P. panamensis, its natu-
ral history suggests it is a more cold adapted than other
stony corals in the ETP (Reyes-Bonilla 1993; Glynn and
Ault 2000). The Mexican Pacific is characterized by sea-
sonal latitudinal thermal gradients. In the GC, SST ranges
from 17°C in the upper Gulf to 25°C at the mouth of the
Gulf in winter; this gradient is lost in summer (Lav�ın and
Marinone 2003; Lav�ın et al. 2003). In contrast, the tropi-
cal Mexican Pacific is characterized by a warm pool with
an average SST of 28°C, reaching the mouth of the GC in
September–October and retracting in April due to the
increased intensity of California Current (Argote et al.
1995; Fiedler and Talley 2006). Accordingly, P. panamen-
sis populations inhabiting the ETP have suffered signifi-
cant mortalities during ENSO events. Subsequent to the
1992–1993 ENSO, the species nearly disappeared from
some reefs in the Gulf of Chiriqu�ı in Panam�a and suf-
fered moderate mortalities in the tropical Mexican Pacific
(Glynn et al. 1994; Glynn 2000). After the 1997–1998ENSO, the least affected coral communities in Mexico
were in the GC, dominated by P. panamensis, where
localized upwelling zones may have protected some popu-
lations from sea surface warming (Glynn 2000; Carriquiry
et al. 2001; Reyes-Bonilla et al. 2002).
Water clarity is another essential feature for the mainte-
nance of the symbiotic association between zooxanthellate
endosymbionts and their cnidarian hosts. Water clarity
decreases with the amount of particulate and dissolved
Table 5. Results of partial Mantel tests between matrices of genetic
differentiation (Φst rDNA and Fst allozymes), linear geographic distance
(km), and environmental distance (Euclidean distances).
rDNA Allozyme
r P value r P value
1. Correlation of Φst and
Euclidean distance
0.21 0.21 �0.07 0.53
2. Partial correlation of Φst
and km, controlling
for Euclidean distance matrix
0.40 0.07 0.84 0.001
3. Partial correlation of Φst and
Euclidean distance matrix,
controlling for km.
�0.05 0.51 �0.67 0.98
4. Correlation of Φst and km 0.44 0.03 0.68 0.059
ª 2013 The Authors. Ecology and Evolution published by John Wiley & Sons Ltd. 4083
N. C. Saavedra-Sotelo et al. Seascape Genetics of Porites panamensis

matter in the water column. The Baja California peninsu-
lar coast is subject to semi-desertic weather conditions and
features little or no input of particulate matter by riverine
or pluvial runoff. In contrast, the continental coast is char-
acterized by a tropical climate with marked rainy seasons
and large expanses of coastal lagoons and freshwater
runoff, bringing higher sediment and particulate organic
matter loads to coastal waters decreasing water clarity
(Guti�errez-Estrada and Ortiz-Perez 2010). Different Sym-
biodinium clades differ in photosynthetically optimal irra-
diance; hence, differential use of light by symbionts is
highly relevant for the diversification, abundance, and dis-
tribution of zooxanthellate corals (Iglesias-Prieto et al.
2004). In the GC, P. panamensis colonies have shown
changes in composition of Symbiodinium clades with water
depth (LaJeunesse et al. 2008; Paz-Garc�ıa et al. 2008b),
however, the geographic pattern of variation of the endo-
symbiotic community of P. panamensis remains unknown.
Finally, geographical differences in hard substrate availabil-
ity, critical for coral settlement and recruitment, are con-
tributing to the differentiation of central peninsular coasts,
featuring mostly rocky shores that have allowed the success
of the massive P. panamensis, and the peripheral continen-
tal coast featuring large expanses of soft sediments unsuit-
able as coral habitat (Fig. 2) (Riginos and Nachman 2001;
Guti�errez-Estrada and Ortiz-Perez 2010).
rel-ACH predictions: genetic diversitypatterns
The patterns of genetic diversity of P. panamensis partially
agree with the predictions of the rel-ACH. Even though
0.00
0.10
0.20
0.30
0.40
0.50
0.60
0.70
0.80
0.90
1.00
0 500 1000 1500 2000 2500 3000
Pairw
ise Фst
(rD
NA
) Pa
irwis
e F st (
Allo
zym
es)
y = 0.10 + 0.0005xr2 = 0.19 P = 0.03
Geographic distance (km)
0
0.02
0.04
0.06
0.08
0.1
0.12
0.14
0.16
0.18
0 500 1000 1500 2000 2500 3000
y = 0.02 + 0.00006xr2 = 0.47 P = 0.001
P vs PC vs C
P vs C
(A)
(B)
Figure 6. Isolation by distance of Porites
panamensis in the Mexican Pacific. (A) Φst
rDNA and (B) Fst allozyme is plotted as a
function of geographic distance. P, peninsular
localities, C, continental localities.
4084 ª 2013 The Authors. Ecology and Evolution published by John Wiley & Sons Ltd.
Seascape Genetics of Porites panamensis N. C. Saavedra-Sotelo et al.

the three genetic markers show different levels of poly-
morphism, the patterns are largely congruent, which
points to their validity as real and marker-independent
features of sampled populations. High genetic diversity is
found in regions with high coral abundance along the
peninsular coast (Table 2), which is consistent with the
large effective population size (Ne) expected in central
populations. This holds true in the case of P. panamensis,
as peninsular populations manifested both large model-
based estimations of h (mutation-scaled Ne) and high val-
ues of genetic diversity (Table S6). However, the high
correlation between diversity and abundance breaks down
with the inclusion of atypical localities such as MZ and
CA, with the former bearing excess and the latter a deficit
of diversity (Table 2; Fig. S7). These localities may reflect
the presence of unfavorable conditions for the survival of
P. panamensis along the continental coast (MZ) or high
levels of inbreeding (CA), as discussed earlier.
The genetic diversity patterns predicted by the rel-ACH
have been found in reefs from Australia and the Carib-
bean. Some corals species on the Great Barrier Reef have
shown a markedly low genetic diversity in peripheral and
isolated populations (Lord Howe Island) away from their
center of abundance (Ayre and Hughes 2000, 2004; Miller
and Ayre 2004; Noreen et al. 2009). Something similar
was found in the Caribbean, northern populations of
Acropora palmata tended to have lower levels of genotypic
diversity mostly due to asexual reproduction (Baums
et al. 2006). On large scale in the Atlantic Ocean, south-
ern populations of Montastraea cavernosa showed low
genetic diversity due a combined effect of small Ne and
genetic drift or inbreeding depression (Nunes et al. 2009).
In the ETP, the genetic patterns of hermatypic corals have
only recently begun to be understood, however, there is
evidence of decreased genetic diversity in peripheral pop-
ulations of Pavona gigantea in the Mexican Pacific (Saave-
dra-Sotelo et al. 2011) and of Porites lobata in some
localities of Costa Rica and Ecuador (Baums et al. 2012).
A significant association of environmental factors with
levels of genetic diversity suggests an indirect effect
through abundance and genetic drift, assuming neutral
dynamics, or a direct adaptive effect, under selective con-
ditions. In our study, genetic diversity using rDNA of the
host correlates with environmental variables not only
favoring the survival of the holobiont, such as tempera-
ture and substrate availability, but also impinging on
water clarity: chlorophyll a concentration (negative
covariation), PAR (positive covariation), and light attenu-
ation coefficient (negative covariation). This suggests that
increased water clarity favoring photosynthetic output by
the symbionts is playing a role in favoring coral survivor-
ship and reproduction leading to increased genetic diver-
sification. Admittedly, determining the taxonomic/
evolutionary identity and ecological attributes of P. pan-
amensis endosymbionts across the Mexican Pacific is
essential to understanding the mechanisms behind the
patterns unveiled in the genetic architecture of the cnidar-
ian host of this study. Collaborative efforts are currently
being directed toward that goal.
rel-ACH predictions: patterns of geneticstructure and gene flow
Patterns of genetic subdivision within P. panamensis par-
tially agree with predictions of the rel-ACH. Genetic dif-
ferentiation was pervasive throughout the studied area
and most patterns were consistent not only among the
three molecular markers but also between two temporal
samples (allozymes: 2004–2006; DNA: 2008–2011), sug-
gesting that they are not marker dependent and stable in
recent time. Genetic architecture among abundant penin-
sular populations contrasted with those at the periphery
(Fig. 3; Table 3), both in terms of genetic differentiation
between peninsular and continental populations
(Table 3A) and patterns within each region (Fig. 4;
Table 4). Similar results were found in populations of
Acropora palmata and Montastraea cavernosa, which
showed significant geographical subdivision due to the
presence of peripheral populations with different genetic
architecture (Baums et al. 2005, 2006; Nunes et al. 2009).
Peninsular populations experienced high rates of gene
flow, whereas genetic differentiation was mostly
accounted for by one southern locality (CP, Fig. 4,
Table 4). In contrast, most pairwise comparisons of con-
tinental populations were significant and consequently
gene flow levels were very small (Table 4; Fig. 4). These
results agree with reproduction studies in both regions;
peninsular populations have several reproductive peaks
throughout the year (Glynn et al. 1994; Mora-P�erez
2005); hence, the likelihood for long-distance dispersal is
higher than in continental populations, where only one
reproductive peak has been documented in summer
(Carpizo-Ituarte et al. 2011; Rodriguez-Troncoso et al.
2011).
Our results suggest that continental populations are
not only isolated from peninsular populations, but also
among themselves. Although geographic distance seemed
to be responsible for population divergence at a large spa-
tial scale (Fig. 6), there was no evidence of IBD at smaller
spatial scales. This suggests that genetic isolation results
more from the differentiation of two geographic clusters
(central and peripheral) separated by a significant habitat
discontinuity (i.e., the GC acting as a dispersal barrier)
than from the cumulative effects of geographic distance
per se. Several phylogeographic studies across marine
populations in the region suggest not only that the
ª 2013 The Authors. Ecology and Evolution published by John Wiley & Sons Ltd. 4085
N. C. Saavedra-Sotelo et al. Seascape Genetics of Porites panamensis

southern GC has acted as a barrier to gene flow and
migration since the end of the Pleistocene, which is
reflected in significant genetic divergence between popula-
tions in the Pacific coast of the Baja California peninsula
and inside the Sea of Cortez (Terry et al. 2000; Stepien
et al. 2001; Bernardi et al. 2003; Sandoval-Castillo et al.
2004; Mu~niz-Salazar et al. 2005; Sandoval-Castillo and
Rocha-Olivares 2011; Castillo-P�aez et al. 2013), but also
that ecological and evolutionary diversifying forces have
acted on GC populations to promote genetic differentia-
tion (Riginos and Nachman 2001; Riginos 2005; Segura
et al. 2006). Thus, the biological and ecological factors
leading to the observed patterns of genetic structure and
gene flow can be summarized as follows. First, P. panam-
ensis produces short-lived lecithotrophic planulae that set-
tle near the parental colony, limiting the long-distance
dispersal potential (Glynn et al. 1994). Second, continen-
tal populations are separated from peninsular populations
by the GC, acting as a barrier for this poorly dispersing
coral and promoting their genetic distinctiveness of the
two regions (Fig. 3). Isolation is mediated by mesoscale
oceanographic features inside the GC and at the entrance
acting as barriers to dispersal of planktonic larvae. Circu-
lation inside the gulf shifts seasonally from cyclonic to
anticyclonic promoting the generation of mesoscale eddies
entrapping larvae and favoring their retention (Brogan
1994; Peguero-Icaza et al. 2008; Contreras-Catala et al.
2012). At the entrance, convergence of surface water from
the equator and the California Current flowing southward
(Castro et al. 2000) promotes oceanic fronts blocking the
dispersal of propagules. Third, within regions, the rocky
shores of the western the GC provide a potentially contin-
uous habitat for larval settlement within a permissive
environment (Fig. 2), whereas barriers to dispersal such
as stretches of unsuitable turbid habitat along the conti-
nental coast significantly limit connectivity. This results in
higher isolation and genetic differentiation among conti-
nental than peninsular populations.
Although the pattern of genetic structure matches with
the overall predictions of the rel-ACH, the high levels of
inferred gene flow from BH to peninsular CP and LO is
not only contradictory but also improbable, given the
limited dispersal of this species. Reconciliation of this
result requires considering the ghosts of dispersal past
(Hellberg 1995; Benzie 1999). Given that our analytical
approach involved coalescent modeling of gene trees it is
sensitive to the influence of historical demography and
connectivity patterns. Careful examination of haplotype
geographic distribution reveals that this connectivity is
mediated by haplotype rDNA-10 (purple Fig. 3, Table
S4). rDNA-10 is the dominant and only shared haplotype
present in BH; it reappears 1800 km away as a rare hap-
lotype in the three southernmost localities of Baja Califor-
nia (CP, LP, and LO). This is consistent with a scenario
in which a formerly widespread polymorphism has sur-
vived in only a few peripheral populations where it has
drifted to a high frequency (in BH) and disappeared in
the rest. In central populations, owing to their larger Ne,
this polymorphism has endured at much lower frequen-
cies. This hypothetical scenario is also supported by the
locus LGG-1, in which the allele D present throughout
the gulf, is absent from IM to be found again in BH (Fig.
S5). Similar patterns of structure and connectivity have
been observed in sympatric populations of Pavona gigan-
tea (Saavedra-Sotelo et al. 2011).
Finally, the large heterozygote deficit found in allozyme
loci warrants caution in the interpretation of the numeri-
cal Fst values. This could be the result of inbreeding, clo-
nality or null alleles. However, we think that this does
not interfere with their power to corroborate the genetic
structure patterns observed in the other loci. Indeed, in
the worst-case scenario of the presence of null alleles, it is
extremely unlikely that their random effect across loci
and populations would be responsible for the geographic
patterns observed, which largely coincides with an inde-
pendent sample and loci unaffected by this problem.
Coda
We set out to test the predictions of the rel-ACH in a
dominant hermatypic coral inhabiting the reef communi-
ties of the ETP. Our genetic seascape analyses, integrating
niche modeling, environmental, and genetic patterns from
three molecular markers with complementary evolution-
ary rates, allowed us to unveil that the genetic architec-
ture of P. panamensis conforms to a large extent to the
expectations of the relaxed biogeographical model. In
addition, our results clearly revealed added complexity
stemming from significant habitat discontinuities in the
face of a limited dispersal and outlier localities, but also,
and perhaps more importantly, they allowed us to iden-
tify the key habitat covariates, such as temperature and
photosynthetically relevant variables, that are influencing
the genetic patterns of diversification and structure, and
may hold the key to the survival of the species in the face
of widespread environmental degradation.
Acknowledgments
We gratefully acknowledge the team of collaborators along
the Gulf of California and the tropical Mexican Pacific for
their assistance in surveys and sample collections (UABCS,
CIBNOR, ICMyL-UNAM Mazatl�an, CUC-U de G, and
UMAR), a special thanks to Rafael Cabral, Eduardo F. Bal-
art, and Constanza Moreno. This work was supported by
CONACYT-SEMARNAT grant no. 23390 (awarded to
4086 ª 2013 The Authors. Ecology and Evolution published by John Wiley & Sons Ltd.
Seascape Genetics of Porites panamensis N. C. Saavedra-Sotelo et al.

L. E. C. A.), internal grant 625112 (awarded to A. R. O.),
CONACYT-SEMARNAT grant no. 108302 (awarded to
HRB), CONACYT grant no. 80228 (awarded to A.L.P),
and by CONACYT grant no. 157993 (awarded to Eduardo
F. Balart, CIBNOR). The first author received a postgradu-
ate fellowship from CONACYT to support her PhD pro-
gram in Marine Ecology at CICESE. We are grateful to
Ruth Gingold (sweepandmore.com) for a critical assess-
ment of an earlier version of the manuscript. We also
thank Kristen Francis, Andrea Li�evana, and Melba de Jes�us
for their suggestions and Jos�e Ma. Dom�ınguez Olachea for
help with figure composition. We gratefully acknowledge
Mike Hellberg for sharing primer sequences and advise to
amplify single copy loci in Porites and for his critical
appraisal of the final version of the manuscript. Construc-
tive remarks from four anonymous reviewers helped to
significantly improve the clarity of the paper. Sample
collection was carried out under collecting permits
DGOPA.04973.190508.1232, DGOPA.11803.271109.4096,
and DGOPA.04552.040711.1798.
Author Contributions
N. C. S. S. designed the study, produced and analyzed the
data, and wrote the paper. L. E. C. A. obtained funding
and analyzed the data. H. R. B. performed MaxEnt eco-
logical modeling and obtained funding. R. A. L. P., A. L.
C. M., and J. A. C. B. contributed materials, fieldwork,
and funding. D. A. P. G. contributed alloenzyme data and
analyzed the data. A. R. O. obtained funding, designed
and supervised the study, and wrote the paper. All
authors collected samples, discussed, edited and approved
the manuscript.
Data Accessibility
DNA sequences: from GenBank (Accession: KC178837-71
& KC866302-15). Environmental covariates, coral cover
data and input files to Migrate software: all have been
deposited in Dryad (http://datadryad.org) (DOI: 10.5061/
dryad.67jg4).
Conflict of Interest
None declared.
References
Aljanabi, S. M., and I. Mart�ınez. 1997. Universal and rapid
salt-extraction of high quality genomic DNA for PCR-based
techniques. Nucleic Acids Res. 22:4692–4693.
Aranceta-Garza, F., E. Balart, H. Reyes-Bonilla, and P.
Cruz-Hern�andez. 2012. Effect of tropical storms on sexual
and asexual reproduction in coral Pocillopora verrucosa
subpopulations in the Gulf of California. Coral Reefs 1157–
1167: doi:10.1007/s00338-012-0941-9.
Argote, M. L., A. Amador, M. F. Lavin, and J. Hunter. 1995.
Tidal dissipation and stratification in the Gulf of
California. J. Geophys. Res. 100(103–116):118. doi:10.1029/
95JC01500.
Ayre, D. J., and T. P. Hughes. 2000. Genotypic diversity and
gene flow in brooding and spawning corals along the Great
Barrier Reef, Australia. Evolution 54:1590–1605.
Ayre, D. J., and T. P. Hughes. 2004. Climate change, genotypic
diversity and gene flow in reef-building corals. Ecol. Lett.
7:273–278.
Barber, R. T., A. K. Hilting, and M. L. Hayes. 2001. The
changing health of coral reefs. Hum. Ecol. Risk Assess.
7:1255–1270.
Baums, I. B., M. W. Miller, and M. E. Hellberg. 2005.
Regionally isolated populations of an imperiled Caribbean
coral, Acropora palmata. Mol. Ecol. 14:1377–1390. doi:10.
1111/j.1365-294X.2005.02489.x.
Baums, I. L., M. W. Miller, and M. E. Hellberg. 2006.
Geographic variation in clonal structure in a reef-building
Caribbean coral, Acropora palmata. Ecol. Monogr.
76:503–519.
Baums, I. B., J. N. Boulay, N. R. Polato, and M. E. Hellberg.
2012. No gene flow across the Eastern Pacific Barrier in the
reef-building coral Porites lobata. Mol. Ecol. 21:5418–5433.
doi:10.1111/j.1365-294X.2012.05733.x.
Beerli, P. 2004. Migrate documentation. Florida State
Universidad, Tallahassee, FL.
Benzie, J. A. H. 1999. Genetic structure of coral reef
organisms: ghosts of dispersal past. Am. Zool. 39:131–145.
Bernardi, G., L. Findley, and A. Rocha-Olivares. 2003.
Vicariance and dispersal across Baja California in disjunct
marine fish populations. Evolution 57:1599–1609.
Bohonak, A. J. 2002. IBD (Isolation By Distance): a program
for analyses of isolation by distance. J. Hered. 93:153–154.
Brogan, M. W. 1994. Distribution and retention of larval fishes
near reefs in the Gulf of California. Mar. Ecol. Prog. Ser.
115:1–13.
Brown, J. H. 1984. On the relationship between abundance
and distribution of species. Am. Nat. 124:255–279.
Brown, J. H., G. C. Stevens, and D. M. Kaufman. 1996. The
geographic range: size, shape, boundaries, and internal
structure. Annu. Rev. Ecol. Syst. 27:597–623.
Brussard, P. F. 1984. Geographic patterns and environmental
gradients: the central-marginal model in Drosophila
revisited. Annu. Rev. Ecol. Syst. 15:25–64.
Budd, A. F., and J. M. Pandolfi. 2010. Evolutionary novelty is
concentrated at the edge of coral species distributions.
Science 328:1558–1561. doi:10.1126/Science.1188947.
Carpizo-Ituarte, E., V. Vizca�ıno-Ochoa, G. Chi Barrag�an,
O. Tapia-V�azquez, A. Cupul-Maga~na, and P.
ª 2013 The Authors. Ecology and Evolution published by John Wiley & Sons Ltd. 4087
N. C. Saavedra-Sotelo et al. Seascape Genetics of Porites panamensis

Medina-Rosas.2011. Evidence of Sexual reproduction in the
hermatypic corals Pocillopora damicornis, Porites panamensis
and Pavona gigantea in Banderas Bay, Mexican Pacific.
Cienc. Mar. 37:97–112.
Carriquiry, J. D., A. L. Cupul-Maga~na, F. Rodr�ıguez-Zaragoza,
and P. Medina-Rosas. 2001. Coral bleaching and mortality
in the Mexican Pacific during the 1997-98 El Ni~no and
prediction from a remote sensing approach. Bull. Mar. Sci.
69:237–249.
Castillo-P�aez, A., O. Sosa-Nishizaki, J. Sandoval-Castillo,
F. Galv�an-Maga~na, M. P. Blanco-Parra, and A.
Rocha-Olivares. 2013. Strong population structure and
shallow mitochondrial phylogeny in the banded guitarfish,
Zapteryx exasperata (Jordan y Gilbert, 1880) from the
northern Mexican Pacific. J. Hered. (in press). doi:10.1093/
jhered/est067.
Castro, R., A. S. Mascarenhas, R. Durazo, and C. A. Collins.
2000. Seasonal variation of the temperature and salinity at
the entrance to the Gulf of California, Mexico. Cienc. Mar.
26:561–583.
Combosch, D. J., and S. V. Vollmer. 2011. Population genetics
of an ecosystem-defining reef coral Pocillopora damicornis in
the tropical Eastern Pacific. PLoS ONE 6:e21200. doi:10.
1371/journal.pone.0021200.
Contreras-Catala, F., L. Sanchez-Velasco, M. F. Lavin, and V. M.
Godinez. 2012. Three-dimensional distribution of larval fish
assemblages in an anticyclonic eddy in a semi-enclosed sea
(Gulf of California). J. Plankton Res. 34:548–562.
Cort�es, J. 1997. Biology and geology of eastern Pacific coral
reefs. Coral Reefs 16:S39–S46.
Dudik, M., S. J. Phillips, and R. E. Schapire. 2007. Maximum
entropy density estimation with generalized regularization
and an application to species distribution modeling. J.
Mach. Learn. Res. 8:1217–1260.
Eckert, C. G., K. E. Samis, and S. C. Lougheed. 2008. Genetic
variation across species’ geographical ranges: the
central-marginal hypothesis and beyond. Mol. Ecol.
17:1170–1188. doi:10.1111/j.1365-294X.2007.03659.x.
Elith, J., S. J. Phillips, T. Hastie, M. Dudik, Y. E. Chee, and
C. J. Yates. 2011. A statistical explanation of MaxEnt for
ecologists. Divers. Distrib. 17:43–57. doi:10.1111/J.
1472-4642.2010.00725.X.
Excoffier, L., G. Laval, and S. Schneider. 2005. Arlequin ver.
3.0: an integrated software package for population genetics
data analysis. Evol. Bioinform. Online 1:47–50.
Fiedler, P. C., and L. D. Talley. 2006. Hydrography of the
eastern tropical Pacific: a review. Prog. Oceanogr.
69:143–180. doi:10.1016/J.Pocean.2006.03.008.
Franklin, J. 2009. Mapping species distributions: spatial
inference and prediction. Cambridge Univ. Press,
Cambridge, UK.
Gapare, W. J., S. N. Aitken, and C. E. Ritland. 2005. Genetic
diversity of core and peripheral Sitka spruce (Picea sitchensis
(Bong.) Carr) populations: implications for conservation of
widespread species. Biol. Conserv. 123:113–123. doi:10.1016/
j.biocon.2004.11.002.
Glynn, P. W. 2000. Effects of the 1997-98 El Nino-Southern
Oscillation on Eastern Pacific corals and coral reefs: an
overview. Proc. 9th Int. Coral Reef Symp. 2:1169–1174.
Glynn, P. W., and J. S. Ault. 2000. A biogeographic analysis
review of the far eastern Pacific coral reef region. Coral
Reefs 19:1–23.
Glynn, P. W., S. B. Colley, C. M. Eakin, D. B. Smith, J. Cortes,
N. J. Gassman, et al. 1994. Reef coral reproduction in the
eastern Pacific: Costa-Rica, Panama, and Galapagos-Islands
(Ecuador). II. Poritidae. Mar. Biol. 118:191–208.
Guo, Q. 2012. Incorporating latitudinal and central– marginal
trends in assessing genetic variation across species ranges.
Mol. Ecol. 21:5396–5403.
Guti�errez-Estrada, M., and M. A. Ortiz-Perez. 2010. 3.1
Mexico, Pacific Coast. Pp. 185–186 in E. C. F. Bird, ed.
Encyclopedia of the world’s coastal landforms. Springer,
New York.
Guzman, H. M., and J. Cort�es. 1993. Coral-reefs of the
tropical Eastern Pacific – review and perspectives. Rev. Biol.
Trop. 41:535–557.
Harriott, V. J. 1999. Coral growth in subtropical eastern
Australia. Coral Reefs 18:281–291.
Hellberg, M. E. 1995. Stepping-stone gene flow in the solitary
coral Balanophyllia elegans: equilibrium and nonequilibrium
at different spatial scales. Mar. Biol. 123:573–581.
Hengeveld, R., and J. Haeck. 1982. The distribution of
abundance. 1. Measurements. J. Biogeogr. 9:303–
316.
Hoffmann, A. A., and M. W. Blows. 1994. Species borders:
ecological and evolutionary perspectives. Trends Ecol. Evol.
9:223–227.
Hughes, T. P., A. H. Baird, E. A. Dinsdale, N. A.
Moltschaniwskyj, M. S. Pratchett, J. E. Tanner, et al. 1999.
Patterns of recruitment and abundance of corals along the
Great Barrier Reef. Nature 395:59–63.
Hunter, M. L., and A. Hutchinson. 1994. The virtues and
shortcomings of parochialism – conserving species that are
locally rare, but globally common. Conserv. Biol.
8:1163–1165.
Hutchison, D. W. 2003. Testing the central/peripheral model:
analyses of microsatellite variability in the Eastern collared
lizard (Crotaphytus collaris collaris). Am. Midl. Nat.
149:148–162. doi:10.1674/0003-0031(2003) 149[0148:
TTCPMA]2.0.CO;2.
Iglesias-Prieto, R., V. H. Beltran, T. C. LaJeunesse, H.
Reyes-Bonilla, and P. E. Thome. 2004. Different algal
symbionts explain the vertical distribution of dominant reef
corals in the eastern Pacific. Proc. Biol. Sci. 271:1757–1763.
doi:10.1098/rspb.2004.2757.
Kleypas, J. A., J. W. McManus, and L. A. B. Menez. 1999.
Environmental limits to coral reef development: where do
we draw the line? Am. Zool. 39:146–159.
4088 ª 2013 The Authors. Ecology and Evolution published by John Wiley & Sons Ltd.
Seascape Genetics of Porites panamensis N. C. Saavedra-Sotelo et al.

Knowlton, N. 2001. The future of coral reefs. Proc. Natl. Acad.
Sci. USA 98:5419–5425.
Kumar, P. 2012. Assessment of impact of climate change on
rhododendrons in Sikkim Himalayas using Maxent
modelling: limitations and challenges. Biodivers. Conserv.
21:1251–1266. doi:10.1007/S10531-012-0279-1.
LaJeunesse, T. C., H. Reyes-Bonilla, M. E. Warner, M. Wills,
G. W. Schmidt, and W. K. Fitt. 2008. Specificity and
stability in high latitude eastern Pacific coral-algal
symbioses. Limnol. Oceanogr. 53:719–727. doi:10.4319/Lo.
2008.53.2.0719.
Lav�ın, M. F., and S. G. Marinone. 2003. An overview of the
physical oceanography of the Gulf of California. Pp.
173–204 in O. U. Velasco-Fuentes, J. Sheinbaum, and J.
Ochoa, eds. Nonlinear processes in geophysical fluid
dynamics. Kluwer Academic Publishers, Netherlands.
Lav�ın, M. F., E. Palacios-Hern�andez, and C. Cabrera. 2003. Sea
surface temperature anomalies in the Gulf of California.
Geofisica Internacional 42:363–375.
Lee, K., L. T. Tong, F. J. Millero, C. L. Sabine, A. G. Dickson,
C. Goyet, et al. 2006. Global relationships of total alkalinity
with salinity and temperature in surface waters of the
world’s oceans. Geophys. Res. Lett. 33: doi:10.1029/
2006gl027207.
Lesica, P., and F. W. Allendorf. 1995. When are
peripheral-populations valuable for conservation. Conserv.
Biol. 9:753–760.
Lewis, E., and D. W. R. Wallace. 1998. Program developed for
CO2 system calculations. Pp. 12–25 in U. S. Department of
Energy, ed. OR ORNL/CDIA-105. Carbon Dioxide
Information Analysis Center Oak Ridge National
Laboratory, TN.
Manel, S., M. K. Schwartz, G. Luikart, and P. Taberlet. 2003.
Landscape genetics: combining landscape ecology and
population genetics. Trends Ecol. Evol. 18:189–197.
Miller, K. J., and D. J. Ayre. 2004. The role of sexual and
asexual reproduction in structuring high latitude
populations of the reef coral Pocillopora damicornis.
Heredity 92:557–568.
Moberg, F., and C. Folke. 1999. Ecological goods and services
of coral reef ecosystems. Ecol. Econ. 29:215–233.
Mora-P�erez, M. G. 2005. Biolog�ıa reproductiva del coral
Porites panamensis Verrill 1866 (Anthozoa: Scleractinia), en
Bah�ıa de la Paz, Baja California Sur, M�exico. Master
Thesis, Centro Interdisciplinario de Ciencias Marinas,
La Paz.
Moreno, R., R. Zamora, J. R. Molina, A. Vasquez, and
M. A. Herrera. 2011. Predictive modeling of microhabitats
for endemic birds in South Chilean temperate forests
using Maximum entropy (MaxEnt). Ecol. Inform.
6:364–370. doi:10.1016/J.Ecoinf.2011.07.003.
Mu~niz-Salazar, R., S. L. Talbot, G. K. Sage, D. H. Ward, and
A. Cabello-Pasini. 2005. Population genetic structure of
annual and perennial populations of Zostera marina L. along
the Pacific coast of Baja California and the Gulf of
California. Mol. Ecol. 14:711–722. doi:10.1111/j.1365-294X.
2005.02454.x.
Noreen, A. E., P. L. Harrison, and M. J. H. Van Oppen.
2009. Genetic diversity and connectivity in a brooding reef
coral at the limit of its distribution. Proc. Biol. Sci.
276:3927–3935.
Nunes, F., R. D. Norris, and N. Knowlton. 2009. Implications
of isolation and low genetic diversity in peripheral
populations of an amphi-Atlantic coral. Mol. Ecol.
18:4283–4297.
Parmesan, C. 2006. Ecological and evolutionary responses to
recent climate change. Annu. Rev. Ecol. Evol. Syst.
37:637–669. doi:10.1146/annurev.ecolsys.37.091305.
110100.
Parmesan, C., S. Gaines, L. Gonzalez, D. M. Kaufman, J.
Kingsolver, A. T. Peterson, et al. 2005. Empirical
perspectives on species borders: from traditional
biogeography to global change. Oikos 108:58–75. doi:10.
1111/j.0030-1299.2005.13150.x.
Paz-Garc�ıa, D. A., F. Correa Sandoval, H. E. Ch�avez-Romo,
H. Reyes-Bonilla, R. A. L�opez-P�erez, P. Medina-Rosas, et al.
2008a. Genetic structure of the massive coral Porites
panamensis (Anthozoa: Scleractinia) from the Mexican
Pacific. Pp. 449–453 in Proceedings of the 11th
International Coral Reef Symposium. Nova Southeastern
University, Lauderdale.
Paz-Garc�ıa, D. A., T. C. LaJeunesse, H. E. Chavez-Romo,
F. Correa Sandoval, and H. Reyes-Bonilla. 2008b.
Differences in the distribution of Symbiodinium spp. among
morphotypes and genotypes of Porites panamensis from the
Gulf of California, Mexico. Pp. 164–167 in Proceedings of
the 11th International Coral Reef Symposium. Nova
Southeastern University, Lauderdale.
Paz-Garc�ıa, D. A., H. E. Ch�avez-Romo, F. Correa-Sandoval,
H. Reyes-Bonilla, A. L�opez-P�erez, P. Medina-Rosas, et al.
2012. Genetic connectivity patterns of corals Pocillopora
damicornis and Porites panamensis (Anthozoa: Scleractinia)
along the west coast of Mexico. Pac. Sci. 66:43–61.
Peguero-Icaza, M., L. Sanchez-Velasco, M. F. Lavin, and
S. G. Marinone. 2008. Larval fish assemblages, environment
and circulation in a semienclosed sea (Gulf of California,
Mexico). Estuar. Coast. Shelf Sci. 79:277–288. doi:10.1016/j.
ecss.2008.04.008.
Peterson, A. T., J. Soberon, R. G. Pearson, R. P. Anderson, E.
Mart�ınez-Meyer, M. Nakamura, et al. 2011. Ecological
niches and geographic distributions. Princeton Univ. Press,
Princeton, NJ.
Pfenninger, M., M. Salinger, T. Haun, and B. Feldmeyer. 2011.
Factors and processes shaping the population structure and
distribution of genetic variation across the species range of
the freshwater snail Radix balthica (Pulmonata,
Basommatophora). BMC Evol. Biol. 11:135. doi:10.1186/
1471-2148-11-135.
ª 2013 The Authors. Ecology and Evolution published by John Wiley & Sons Ltd. 4089
N. C. Saavedra-Sotelo et al. Seascape Genetics of Porites panamensis

Phillips, S. J., M. Dudik, and R. E. Schapire. 2004. A
maximum entropy approach to species distribution
modeling. Proc. 21st Int. Conf. Mach. Learn. 21:655–662.
Phillips, S. J., R. P. Anderson, and R. E. Schapire. 2006.
Maximum entropy modeling of species geographic
distributions. Ecol. Model. 190:231–259. doi:10.1016/J.
Ecolmodel.2005.03.026.
Pinzon, J. H., and T. C. LaJeunesse. 2011. Species delimitation
of common reef corals in the genus Pocillopora using
nucleotide sequence phylogenies, population genetics and
symbiosis ecology. Mol. Ecol. 20:311–325. doi:10.1111/J.
1365-294x.2010.04939.X.
Pinzon, J. H., H. Reyes-Bonilla, I. B. Baums, and T. C. LaJeunesse.
2012. Contrasting clonal structure among Pocillopora
(Scleractinia) communities at two environmentally distinct
sites in the Gulf of California. Coral Reefs 31:765–777. doi:10.
1007/S00338-012-0887-Y.
Posada, D., and K. A. Crandall. 1998. MODELTEST: testing
the model of DNA substitution. Bioinformatics 14:
817–818.
Reyes-Bonilla, H. 1993. Biogeograf�ıa y ecolog�ıa de los corales
hermat�ıpicos (Anthozoa: Scleractinia) del Pac�ıfico de
M�exico. Pp. 207–222 in S. I. Salazar-Vallejo and N. E.
Gonz�alez, eds. Biodiversidad marina y costera de M�exico.
CONABIO/CIQRO, Chetumal, Mexico.
Reyes-Bonilla, H., J. D. Carriquiry, G. E. Leyte-Morales, and
A. L. Cupul-Maga~na. 2002. Effects of the El
Ni~no-Southern Oscillation and the anti-El Ni~no event
(1997-1999) on coral reefs of the western coast of
Mexico. Coral Reefs 21:368–372. doi:10.1007/
s00338-002-0255-4.
Reyes-Bonilla, H., L. E. Calder�on-Aguilera, G. Cruz, P.
Medina-Rosas, R. A. L�opez-P�erez, M. D. Herrero, et al.
2005. Atlas de Corales P�etreos (Anthozoa: Scleractinia) del
Pac�ıfico Mexciano. CICESE, CONABIO, CONACYT,
UABCS, U de G y UMar, Mexico.
Rice, W. R. 1989. Analyzing tables of statistical tests. Evolution
43:223–225.
Riginos, C. 2005. Cryptic vicariance in Gulf of California fishes
parallels vicariant patterns found in Baja California
mammals and reptiles. Evolution 59:2678–2690.
Riginos, C., and M. W. Nachman. 2001. Population
subdivision in marine environments: the contributions of
biogeography, geographical distance and discontinuous
habitat to genetic differentiation in a blennioid fish,
Axoclinus nigricaudus. Mol. Ecol. 10:1439–1453.
Rodriguez-Troncoso, P., E. Carpizo-Ituarte, Leyte-Morales
G. E., Chi-Barragan G., and O. Tapia-Vazquez. 2011. Sexual
reproduction of three coral species from the Mexican South
Pacific. Mar. Biol., 158:2673–2683.
Rozas, J., J. C. Sanchez-DelBarrio, X. Messeguer, and R. Rozas.
2003. DnaSP, DNA polymorphism analyses by the
coalescent and other methods. Bioinformatics 19:2496–2497.
doi:10.1093/bioinformatics/btg359.
Saavedra-Sotelo, N. C., L. E. Calder�on-Aguilera, H.
Reyes-Bonilla, R. A. L�opez-P�erez, P. Medina-Rosas, and A.
Rocha-Olivares. 2011. Limited genetic connectivity of
Pavona gigantea in the Mexican Pacific. Coral Reefs 30:677–
686. doi:10.1007/s00338-011-0742-6.
Sagarin, R. D., and S. D. Gaines. 2002. The ‘abundant centre’
distribution: to what extent is it a biogeographical rule?
Ecol. Lett. 5:137–147.
Sagarin, R. D., S. D. Gaines, and B. Gaylord. 2006. Moving
beyond assumptions to understand abundance distributions
across the ranges of species. Trends Ecol. Evol. 21:524–530.
doi:10.1016/j.tree.2006.06.008.
Sandoval-Castillo, J., and A. Rocha-Olivares. 2011. Deep
mitochondrial divergence in Baja California populations of
an aquilopelagic elasmobranch: the golden cownose ray.
J. Hered. 102:269–274. doi:10.1093/jhered/esr004.
Sandoval-Castillo, J. R., A. Rocha-Olivares, C. Villavicencio
Garayzar, and E. Balart. 2004. Cryptic isolation of Gulf of
California shovelnose guitarfish evidenced by mitochondrial
DNA. Mar. Biol. 145:983–988. doi:10.1007/
s00227-004-1378-7.
Scheet, P., and M. Stephens. 2006. A fast and flexible statistical
model for large-scale population genotype data: applications
to inferring missing genotypes and haplotypic phase. Am. J.
Hum. Genet. 78:629–644.
Segura, I., A. Rocha-Olivares, S. Flores-Ramirez, and L.
Rojas-Bracho. 2006. Conservation implications of the
genetic and ecological distinction of Tursiops truncatus
ecotypes in the Gulf of California. Biol. Conserv. 133:336–
346.
Selig, E. R., K. S. Casey, and J. F. Bruno. 2010. New insights
into global patterns of ocean temperature anomalies:
implications for coral reef health and management. Glob.
Ecol. Biogeogr. 19:397–411. doi:10.1111/j.1466-8238.2009.
00522.x.
Seutin, G., B. N. White, and P. T. Boag. 1991. Preservation of
avian blood and tissue samples for DNA analyses. Can. J.
Zool. 69:82–90.
Stephens, M., and P. Donnelly. 2003. A comparison of Bayesian
methods for haplotype reconstruction from population
genotype data. Am. J. Hum. Genet. 73:1162–1169. doi:10.
1086/379378.
Stephens, M., N. J. Smith, and P. Donnelly. 2001. A new
statistical method for haplotype reconstruction from
population data. Am. J. Hum. Genet. 68:978–989.
Stepien, C. A., R. H. Rosenblatt, and B. A. Bargmeyer. 2001.
Phylogeography of the spotted sand bass, Paralabrax
maculatofasciatus: divergence of Gulf of California and
Pacific Coast populations. Evolution 55:1852–1862.
Stockwell, D. R. B., and D. Peters. 1999. The GARP modeling
system: problems and solutions to automated spatial
prediction. Int. J. Geogr. Inf. Sci. 13:143–158.
Szpiech, Z. A., M. Jakobsson, and N. A. Rosenberg. 2008.
ADZE: a rarefaction approach for counting alleles private to
4090 ª 2013 The Authors. Ecology and Evolution published by John Wiley & Sons Ltd.
Seascape Genetics of Porites panamensis N. C. Saavedra-Sotelo et al.

combinations of populations. Bioinformatics 24:2498–2504.
doi:10.1093/Bioinformatics/Btn478.
Tamura, K., D. Peterson, N. Peterson, G. Stecher, M. Nei,
S. Kumar. 2011. MEGA5: molecular evolutionary genetics
analysis using maximum likelihood, evolutionary distance,
and maximum parsimony methods. Mol. Biol. Evol.
28:2731–2739. doi:10.1093/Molbev/Msr121.
Terry, A., G. Bucciarelli, and G. Bernardi. 2000. Restricted
gene flow and incipient speciation in disjunct Pacific Ocean
and Sea of Cortez populations of a reef fish species, Girella
nigricans. Evolution 54:652–659.
Veron, J. 2000. Corals of the World. Australian Institute of
Marine Science, Townsville, Queensland.
Vucetich, J. A., and T. A. Waite. 2003. Spatial patterns of
demography and genetic processes across the species’ range:
null hypotheses for landscape conservation genetics.
Conserv. Genet. 4:639–645.
Wagner, V., W. Durka, and I. Hensen. 2011. Increased genetic
differentiation but no reduced genetic diversity in peripheral
vs. central populations of a steppe grass. Am. J. Bot.
98:1173–1179. doi:10.3732/Ajb.1000385.
Wang, L. S., and Y. Xu. 2003. Haplotype inference by
maximum parsimony. Bioinformatics 19:1773–1780. doi:10.
1093/Bioinformatics/Btg239.
White, T. J., T. Bruns, S. Lee, and W. J. Taylor. 1990.
Amplification and direct sequencing of fungal ribosomal
RNA genes for phylogenetics. Pp. 315–322 in M. A. Innis,
D. H. Gelfand, J. J. Snninsky and T. J. White, eds. PCR
protocols: a guide to methods and applications. Academic
Press, San Diego, CA.
Wild, C., O. Hoegh-Guldberg, M. S. Naumann, M. F.
Colombo-Pallotta, M. Ateweberthan, W. K. Fitt, et al. 2011.
Climate change impedes scleractinian corals as primary reef
ecosystem engineers. Mar. Freshw. Res. 62:205–215. doi:10.
1071/Mf10254.
Wright, S. 1969. The evolution and genetics of populations:
the theory of gene frequencies. University of Chicago Press,
Chicago.
Yang, X. Q., S. P. S. Kushwaha, S. Saran, J. C. Xu, and P. S.
Roy. 2013. Maxent modeling for predicting the potential
distribution of medicinal plant, Justicia adhatoda L. in
Lesser Himalayan foothills. Ecol. Eng. 51:83–87. doi:10.1016/
J.Ecoleng.2012.12.004.
Supporting Information
Additional Supporting Information may be found in the
online version of this article:
Table S1. Localities, sampling dates and total number (n)
of 25 m-long transects conducted at each site.
Table S2. PCR conditions and thermal profiles (TP) for
rDNA and ORF.
Table S3. List of colonies with intragenomic polymor-
phisms and results of haplotype reconstructions using
PHASE, fastPHASE and HAPAR (see M&M).
Table S4. Distribution of 35 rDNA haplotypes of Porites
panamensis in populations in the tropical Mexican Paci-
fic.
Table S5. Distribution of 14 ORF haplotypes of Porites
panamensis in populations in the tropical Mexican Paci-
fic.
Table S6. Estimates of effective population size (h = 2 Ne
µ) and migration rates between populations (M = m/µ).The migration rates include 95% confidence intervals.
The arrows indicate the direction of gene flow and data is
marked with a rectangle representing the highest values.
Figure S1. Scatter plots and regression lines of percent
live coral cover against surveying effort (number of tran-
sects). ANOVA of linear regressions: total live cover
F = 18.29 P = 0.004, Porites panamensis live cover
F = 0.009 P = 0.926.
Figure S2. Intragenomic polymorphism due to a four
base-pair indel. Variation is readily detected by observa-
tion of double peaks in some traces. (A) trace represent-
ing haplotype 1, (B) trace representing haplotype 4 and
(C) trace with double signal (haplotypes 1 and 4) show-
ing polymorphic base calls (arrows point to the “second-
ary” sequence).
Figure S3. Single nucleotide polymorphic position show-
ing a double peak. (A) sequence with only one base call,
and (B) sequence with double peak.
Figure S4. Correlation between percentage of live coral
cover of Porites panamensis and degree latitude.
Figure S5. Frequency of alloenzymatic alleles. Five
enzymatic systems (ME-1, GDH-1, GDH-2, EST-1 and
LGG-1). Localities: Bah�ıa de los �Angeles (BLA), Bah�ıa
Concepci�on (BC), Bah�ıa de la Paz (LP), Punta Arenas
(PA), Islas Marietas (IM) and Bah�ıas de Huatulco (BH).
Figure S6. Frequency of alloenzymatic genotypes. Five
enzymatic systems (ME-1, GDH-1, GDH-2, EST-1 and
LGG-1). Localities: Bah�ıa de los �Angeles (BLA), Bah�ıa
Concepci�on (BC), Bah�ıa de la Paz (LP), Punta Arenas
(PA), Islas Marietas (IM) and Bah�ıas de Huatulco (BH).
Figure S7. Correlations between genetic diversity (Haplo-
type diversity – h – and standardized h(12) ; Haplotype or
allelic richness – A – and standardized A(12); and expected
heterozygosity – He –) and percentage live coral cover of
Porites panamensis. (A, B) rDNA, (C, D) ORF and (E, F)
allozymes.
ª 2013 The Authors. Ecology and Evolution published by John Wiley & Sons Ltd. 4091
N. C. Saavedra-Sotelo et al. Seascape Genetics of Porites panamensis