Populus trichocarpa cell wall chemistry and ultrastructure trait variation, genetic control and...
14
Populus trichocarpa cell wall chemistry and ultrastructure trait variation, genetic control and genetic correlations Ilga Porth 1 *, Jaroslav Kla ´ps ˇte ˇ 2 *, Oleksandr Skyba 1 , Ben S. K. Lai 1 , Armando Geraldes 3 , Wellington Muchero 4 , Gerald A. Tuskan 4 , Carl J. Douglas 3 , Yousry A. El-Kassaby 2 and Shawn D. Mansfield 1 1 Department of Wood Science, Faculty of Forestry, University of British Columbia, Vancouver, BC, V6T 1Z4, Canada; 2 Department of Forest Sciences, Faculty of Forestry, University of British Columbia, Vancouver, BC, V6T 1Z4, Canada; 3 Department of Botany, University of British Columbia, Vancouver, BC, V6T 1Z4, Canada; 4 BioSciences Division, Oak Ridge National Laboratory, Oak Ridge, TN, 37831, USA Authors for correspondence: Shawn D. Mansfield Tel: +1 604 822 0196 Email: shawn.mansfi[email protected] Yousry A. El-Kassaby Tel: +1 604 822 1821 Email: [email protected] Received: 25 July 2012 Accepted: 18 September 2012 New Phytologist (2013) 197: 777–790 doi: 10.1111/nph.12014 Key words: biofuel traits, genetic correlation, narrow-sense heritability, Populus trichocarpa, wood chemistry, wood composition, wood physical properties. Summary The increasing ecological and economical importance of Populus species and hybrids has stimulated research into the investigation of the natural variation of the species and the esti- mation of the extent of genetic control over its wood quality traits for traditional forestry activities as well as the emerging bioenergy sector. A realized kinship matrix based on infor- mative, high-density, biallelic single nucleotide polymorphism (SNP) genetic markers was con- structed to estimate trait variance components, heritabilities, and genetic and phenotypic correlations. Seventeen traits related to wood chemistry and ultrastructure were examined in 334 9-yr-old Populus trichocarpa grown in a common-garden plot representing populations spanning the latitudinal range 44° to 58.6°. In these individuals, 9342 SNPs that conformed to Hardy– Weinberg expectations were employed to assess the genomic pair-wise kinship to estimate narrow-sense heritabilities and genetic correlations among traits. The range-wide phenotypic variation in all traits was substantial and several trait heritabili- ties were > 0.6. In total, 61 significant genetic and phenotypic correlations and a network of highly interrelated traits were identified. The high trait variation, the evidence for moderate to high heritabilities and the identifica- tion of advantageous trait combinations of industrially important characteristics should aid in providing the foundation for the enhancement of poplar tree breeding strategies for modern industrial use. Introduction Populus species (poplars, aspens and cottonwoods; referred to as poplar throughout) are ecologically and economically important tree species that span a substantial geographic area in temperate and boreal regions across the Northern Hemisphere (Burns & Honkala, 1990; Mansfield & Weineisen, 2007). Although gymnosperms are predominantly employed for conversion to commodity products, poplars are becoming increasingly impor- tant to the forest products industry and in the new green econ- omy, particularly as a short-rotation species for the provision of fiber for pulp and paper production, oriented strand-board (OSB), moldings and trim, and furniture components (Semple et al., 2007). More recently, these species have emerged as pro- spective bioenergy crops because of their inherent rapid growth rates and favorable cell wall chemistry (Dinus, 2000). Lignocellu- losic feedstocks are considered to be more sustainable than starch- and sugar-based feedstocks for bioenergy production in terms of ecological benefits, energy and carbon dioxide balance (Yuan et al., 2008). Although poplar can generate relatively high yields and significant energy output (Yuan et al., 2008; Carroll & Somerville, 2009), its innate cell wall composition requires costly pretreatment methods to access the complex cell wall carbohy- drates (Hendriks & Zeeman, 2009; Mansfield, 2009). Many fac- tors have been proposed to contribute to this natural recalcitrance of plant cell walls to deconstruction (Chang & Holtzapple, 2000; Dinus, 2000; Mosier et al., 2005; Studer et al., 2011) and, at present, several research strategies are underway to attempt to optimize and enhance saccharification efficiency (Mansfield et al., 1999, 2012; Yuan et al., 2008; Carroll & Somerville, 2009; Shen et al., 2011). Biomass accumulation, wood composition and ultrastructural traits are known to be highly complex (Dinus, 2000; Novaes et al., 2009). It is also known that poplars show substantial vari- ation in many important wood properties, such as lignin con- tent and syringyl to guaiacyl (S : G) lignin monomer ratio *These authors contributed equally to this work. Ó 2012 The Authors New Phytologist Ó 2012 New Phytologist Trust New Phytologist (2013) 197: 777–790 777 www.newphytologist.com Research
Transcript of Populus trichocarpa cell wall chemistry and ultrastructure trait variation, genetic control and...
Populus trichocarpa cell wall chemistry and ultrastructure traitvariation, genetic control and genetic correlations
Ilga Porth1*, Jaroslav Klapste2*, Oleksandr Skyba1, Ben S. K. Lai1, Armando Geraldes3, Wellington Muchero4,
Gerald A. Tuskan4, Carl J. Douglas3, Yousry A. El-Kassaby2 and Shawn D. Mansfield1
1Department of Wood Science, Faculty of Forestry, University of British Columbia, Vancouver, BC, V6T 1Z4, Canada; 2Department of Forest Sciences, Faculty of Forestry, University of
British Columbia, Vancouver, BC, V6T 1Z4, Canada; 3Department of Botany, University of British Columbia, Vancouver, BC, V6T 1Z4, Canada; 4BioSciences Division, Oak Ridge National
Laboratory, Oak Ridge, TN, 37831, USA
Authors for correspondence:Shawn D. Mansfield
Tel: +1 604 822 0196Email: [email protected]
Yousry A. El-KassabyTel: +1 604 822 1821
Email: [email protected]
Received: 25 July 2012
Accepted: 18 September 2012
New Phytologist (2013) 197: 777–790doi: 10.1111/nph.12014
Key words: biofuel traits, genetic correlation,narrow-sense heritability, Populustrichocarpa, wood chemistry, woodcomposition, wood physical properties.
Summary
� The increasing ecological and economical importance of Populus species and hybrids has
stimulated research into the investigation of the natural variation of the species and the esti-
mation of the extent of genetic control over its wood quality traits for traditional forestry
activities as well as the emerging bioenergy sector. A realized kinship matrix based on infor-
mative, high-density, biallelic single nucleotide polymorphism (SNP) genetic markers was con-
structed to estimate trait variance components, heritabilities, and genetic and phenotypic
correlations.� Seventeen traits related to wood chemistry and ultrastructure were examined in 334 9-yr-old
Populus trichocarpa grown in a common-garden plot representing populations spanning the
latitudinal range 44° to 58.6°. In these individuals, 9342 SNPs that conformed to Hardy–
Weinberg expectations were employed to assess the genomic pair-wise kinship to estimate
narrow-sense heritabilities and genetic correlations among traits.� The range-wide phenotypic variation in all traits was substantial and several trait heritabili-
ties were > 0.6. In total, 61 significant genetic and phenotypic correlations and a network of
highly interrelated traits were identified.� The high trait variation, the evidence for moderate to high heritabilities and the identifica-
tion of advantageous trait combinations of industrially important characteristics should aid in
providing the foundation for the enhancement of poplar tree breeding strategies for modern
industrial use.
Introduction
Populus species (poplars, aspens and cottonwoods; referred to aspoplar throughout) are ecologically and economically importanttree species that span a substantial geographic area in temperateand boreal regions across the Northern Hemisphere (Burns &Honkala, 1990; Mansfield & Weineisen, 2007). Althoughgymnosperms are predominantly employed for conversion tocommodity products, poplars are becoming increasingly impor-tant to the forest products industry and in the new green econ-omy, particularly as a short-rotation species for the provision offiber for pulp and paper production, oriented strand-board(OSB), moldings and trim, and furniture components (Sempleet al., 2007). More recently, these species have emerged as pro-spective bioenergy crops because of their inherent rapid growthrates and favorable cell wall chemistry (Dinus, 2000). Lignocellu-losic feedstocks are considered to be more sustainable than starch-
and sugar-based feedstocks for bioenergy production in terms ofecological benefits, energy and carbon dioxide balance (Yuanet al., 2008). Although poplar can generate relatively high yieldsand significant energy output (Yuan et al., 2008; Carroll &Somerville, 2009), its innate cell wall composition requires costlypretreatment methods to access the complex cell wall carbohy-drates (Hendriks & Zeeman, 2009; Mansfield, 2009). Many fac-tors have been proposed to contribute to this naturalrecalcitrance of plant cell walls to deconstruction (Chang &Holtzapple, 2000; Dinus, 2000; Mosier et al., 2005; Studer et al.,2011) and, at present, several research strategies are underway toattempt to optimize and enhance saccharification efficiency(Mansfield et al., 1999, 2012; Yuan et al., 2008; Carroll &Somerville, 2009; Shen et al., 2011).
Biomass accumulation, wood composition and ultrastructuraltraits are known to be highly complex (Dinus, 2000; Novaeset al., 2009). It is also known that poplars show substantial vari-ation in many important wood properties, such as lignin con-tent and syringyl to guaiacyl (S : G) lignin monomer ratio*These authors contributed equally to this work.
� 2012 The Authors
New Phytologist� 2012 New Phytologist TrustNew Phytologist (2013) 197: 777–790 777
www.newphytologist.com
Research
(Wegrzyn et al., 2010; Studer et al., 2011), cellulose and hemi-cellulose composition (Sannigrahi et al., 2010), cellulose crystal-linity (Kumar et al., 2009) and wood density (Zhang et al.,2012). Poplar tree improvement programs can capitalize onboth the existing natural variation in wood traits as well as thevast genomic resources that have become available for this spe-cies in recent years (Tuskan et al., 2006; Jansson & Douglas,2007; Ralph et al., 2008; Geraldes et al., 2011; Geraldes et al.,in press; Slavov et al., 2012) to accelerate breeding strategies forimproved cell wall and growth traits. Quantitative trait locus(QTL) identification and other traditional quantitative geneticsapproaches have been implemented to study the complexgenetic architecture underlying wood formation (Pot et al.,2002; Kirst et al., 2004; Novaes et al., 2009; Thumma et al.,2010; Wegrzyn et al., 2010; Beaulieu et al., 2011). However,knowledge on the mode of genetic control (heritability) of thewood traits and their genetic relationships is essential for effec-tive selective breeding programs. The aim of breeding programsis to maximize the genetic gain in industrially important woodtraits and, concurrently, to effectively manage undesirable traitcorrelations whilst sustaining genetic variability for future selec-tion and adaptation. For this, a better understanding of theinheritance and relationships among traits of interest is needed.With the exception of wood density, which is commonly stud-ied and generally shows moderate to high heritability (Yanchuket al., 1984; Pliura et al., 2007; El-Kassaby et al., 2011), little isknown about the genetic parameters for other wood-relatedtraits in poplar. This article provides a comprehensive assess-ment of wood traits considered to be key to improve the utilityof Populus spp. for industrial applications.
The availability of informative molecular markers providesthe opportunity to estimate variance components and geneticparameters, such as heritability and genetic merit, in wild popu-lations (Ritland, 1996; Frentiu et al., 2008; Blonk et al., 2010).In the past, simple sequence repeats (microsatellites) have beenused to construct marker-based relationship matrices (i.e.co-ancestry) to infer effective population size in conservationprograms (Oliehock et al., 2006; Nomura, 2008), as well as toestimate heritability in wild populations (Van de Casteele et al.,2001; Frentiu et al., 2008; Blonk et al., 2010), with mixedresults. The main drawbacks of employing microsatellite mark-ers to estimate reliable genetic parameters is their limited num-ber, and thus limited information, for the construction ofreliable relationship matrices (Frentiu et al., 2008). Generally,hundreds of polymorphic markers are needed to precisely esti-mate relatedness (Visscher et al., 2008). In addition, factors suchas sample size, complexity of the population structure, level ofrelatedness in the population, nonrandom mating and theimplementation of phenotypic selection (i.e. truncation selec-tion), individually or in concert, can affect the precision of therelatedness coefficient and, consequently, all ensuing geneticparameters, including heritability estimates (Van de Casteeleet al., 2001). However, regardless of the accuracy of geneticparameters, breeding value estimates based on a molecular-basedrelationship matrix can still provide useful information for selec-tion (Blonk et al., 2010). The development of high-throughput
single nucleotide polymorphism (SNP) genotyping platformspromises drastic improvements in the estimates of geneticparameters generated from relationship-based methods. Theconstantly increasing number of available SNPs is expected toyield more accurate genetic parameters, thus increasing theexpected selection efficiency of breeding programs in either wildor artificial populations with completely unknown or partiallyknown pedigrees.
Furthermore, once a reasonable number of SNPs are avail-able, the resulting, more accurate, genomic relationship matricescan, in turn, substitute the conventional pedigree matrices inbest linear unbiased prediction (BLUP) analyses. Hence, thegenetic parameters, such as additive genetic variance, heritabilityand genetic correlations, can be estimated with greater accuracy.This is known as the genomic best linear unbiased prediction(GBLUP) estimation method (VanRaden, 2008; Nadaf &Pong-Wong, 2011). However, it should be stated that the effi-ciency of selection programs that are focused on multiple traitsis not only dependent on the extent of genetic control of thesetraits individually (i.e. heritability estimates), but also on thegenetic correlations among them (Falconer & Mackay, 1996),which are driven by the relative fitness of the traits (Lande &Arnold, 1983). This study employs a dense SNP marker arrayto genotype 9342 SNPs to construct a genomic relationshipmatrix among 334 P. trichocarpa individuals with unknowngenealogy, and to simultaneously estimate the narrow-sense her-itabilities and genetic correlations among 17 cell wall chemistryand ultrastructural attributes that are important to the use ofpoplar as an industrial feedstock. Our results clearly demon-strate the substantial variation in these diverse traits in naturalpopulations, and provide the underpinnings for breeding strate-gies to capitalize on genetic and phenotypic correlations amongtraits.
Materials and Methods
Black cottonwood population and wood core sampling
Complete details of the studied black cottonwood (Populustrichocarpa Torr. & Gray) population are described in Xie et al.(2009). In 2008, a 10-mm increment core was taken at breastheight from each of 334 9-yr-old trees (originating from 105 sub-populations) in a north–south direction. The northern half of thecore was used for ultrastructure determinations, as well as forwood chemistry, whereas the southern half of the core was usedfor fiber quality assessments. The geographical distribution of thesubpopulations spanned 15° in latitude (range, 44.0–58.6°).
Phenotypic trait data
Wood chemical composition Holocellulose, alpha cellulose andhemicellulose amounts were determined according to Browning(1967), with minor modifications. In brief, the woody materialwas ground using a Wiley mill to pass a 40-mesh screen, and thenextracted overnight in hot acetone and allowed to dry overnightat 50°C. Aliquots of 3.5 ml of solution A (60 ml glacial acetic
New Phytologist (2013) 197: 777–790 � 2012 The Authors
New Phytologist� 2012 New Phytologist Trustwww.newphytologist.com
Research
NewPhytologist778
acid + 1.3 g l�1 NaOH) and 1.5 ml of 20% sodium chlorite solu-tion (20 g NaClO2 in 80 ml distilled water) were added to exactamounts (150 mg) of extract-free wood meal to initiate the chlo-rite delignification. The reaction tube was tightly sealed and thengently shaken at 50°C for 16 h. The reaction was quenched byplacing the tubes in an ice bath, and the reaction solution wasthen thoroughly removed by pipetting whilst not disturbing thesettled reacted wood meal. This procedure was repeated. Finally,the reacted wood meal was transferred to a preweighed coarse sin-tered crucible, and washed twice with 50 ml of 1% glacial aceticacid (under vacuum suction), followed by a wash with 10 ml ofacetone under applied vacuum, and then dried at 50°C overnightto obtain the holocellulose yield. To obtain the alpha cellulosecontent of the woody material, alkaline extractions using two dif-ferent sodium hydroxide extractions were performed sequentiallyto remove the hemicelluloses. Exact weights of 100 mg of holo-cellulose were transferred to a small beaker and left at room tem-perature for 30 min to allow moisture equilibration. To this,8 ml of 17.5% NaOH (from sodium hydroxide 50% w/w) wasadded and the material was left to react for 30 min. Then, 8 mlof distilled water were added and the material was stirred for1 min, and left to react for 29 min. The reaction solution wascarefully removed, and the process was repeated with fresh reac-tants. After the second reaction, all retentate was filtered througha preweighed coarse sintered crucible by washing with distilledwater (39 50 ml). Subsequently, the reaction was neutralized bysoaking in 1.0M acetic acid for 5 min. After washing with dis-tilled water (39 50 ml), the material was dried at 50°C overnightto obtain the alpha cellulose content. Subtracting the alpha cellu-lose fraction recovered from the holocellulose provided the hemi-cellulose yield.
Cell wall carbohydrates and total lignin were determinedaccording to Huntley et al. (2003), with the concentrations ofneutral cell wall-associated carbohydrates (glucose, xylose, man-nose, galactose, rhamnose and arabinose) being quantified byhigh-performance anion exchange liquid chromatography using aDionex (DX-600; Sunnyvale, CA, USA) high-performanceliquid chromatography system equipped with a PA1 (Dionex)column, a pulsed amperometric detector with a gold electrodeand a SpectraAS3500 auto injector (Spectra-Physics, Santa Clara,CA, USA). The column was equilibrated with 250 mM NaOHand eluted with deionized water at a flow rate of 1 ml min�1.The total lignin content was calculated as the sum of the Klasonlignin and soluble lignin fractions. Lignin and cell wall sugar con-tents were determined as a percentage of dry wood, based on theinitial weight of the wood sample analyzed.
The lignin monomer composition (S : G ratio) was determinedaccording to Robinson & Mansfield (2009), and was analyzed bygas chromatography on a Hewlett Packard 5890 series II instru-ment (Agilent Technologies, Santa Clara, CA, USA), equippedwith an autosampler, splitless injector, flame ionizing detectorand a 30-m 5% diphenyl–95% dimethyl polysiloxane-coatedRTX-5MS capillary column (inner diameter, 0.25 mm).
Wood physical properties Fiber length was analyzed using thewoody material isolated from the southern half of the increment
core. In brief, each sample was macerated in a solution consistingof 30% hydrogen peroxide and glacial acetic acid in a 1 : 1 ratio(Franklin solution) at 70°C for 48 h. Following the reaction, theremaining fibrous material was washed with deionized water untilthe samples had been neutralized. Subsamples were resuspendedin 10 ml of deionized, distilled water and analyzed on a fiberquality analyzer (FQA; Optest Equipment, Inc., Hawkesbury,Ontario, Canada). The fiber length was recorded in millimeters.
Wood density was analyzed using the northern half of theincrement core. A 1.67-mm-thick section was precision cutfrom each increment core using a custom-built twin-bladepneumatic saw. After extraction with acetone, the wood sec-tions were acclimated to 7% moisture content before densityanalysis. The samples were then scanned from pith to the barkby X-ray densitometry (QTRS-01X; Quintek MeasurementSystems Inc., Knoxville, TN, USA). Wood density wasobtained by averaging the density measures across all growthrings. Ten randomly selected P. trichocarpa samples from thesame site, that were not part of the study, were sectioned asdescribed above, their density determined directly by accuratelyrecording the weight over volume and then scanned by X-raydensitometry to establish an extinction coefficient empirically,which was used to estimate the wood density for all samplesfrom the population.
The microfibril angle (MFA) was measured on two growthrings, the first growth ring adjacent to the pith and the mostrecent growth ring immediately adjacent to the bark, on theprecision-cut samples employed for density determination.MFA was determined using a Bruker D8 Discover (Bruker AXSInc., Madison, WI, USA) wide-angle X-ray diffraction instru-ment equipped with an area detector (GADDS) to collect thediffraction patterns of the 002 crystal planes of cellulose. Thesestrong 002 diffraction arcs of the cellulose I reflections containinformation on all the orientations of microfibrils in the woodsample. The measurements were collected in transmission modeusing a CuKa radiation source emitting at a wavelength of0.154 nm, with X-ray optics h1 = h2 = 0° (h1 = source,h2 = detector). The diffraction intensities were collected at Braggangles 2h = 20–24°. The X-ray diffraction profile was integratedat Chi between �180° and +180°. We used the poplar-specificstandard curve (MFA = 0.9583T� 3.8364, R2 = 0.9686) thatrelated the empirically assessed MFA (as described in Ukrainetzet al., 2008) to that quantified by the X-ray diffraction pattern.The mean T value of the two 002 diffraction peaks was used inthe equation to determine the MFA.
The specifications of the crystallinity measurements usingX-ray diffraction were the same as for MFA measurements, exceptthat h1 = 17°. Diffraction intensities were collected at Braggangles 2h = 4–40°. The X-ray diffraction profile was integrated atChi between �180° and 0° using GADDS software (BrukerAXS Inc., Madison, WI, USA). The data were normalized andresolved using the crystallinity calculation method of Vonk(1973). First, the background diffraction signal was subtracted,and then the amorphous curve was fitted to the diffractionpattern; finally, linear regression analysis was conducted to obtainthe cell wall crystallinity.
� 2012 The Authors
New Phytologist� 2012 New Phytologist TrustNew Phytologist (2013) 197: 777–790
www.newphytologist.com
NewPhytologist Research 779
SNP genotyping
The SNP genotyping of 334 individuals from the P. trichocarpapopulation was carried out using an Illumina Infinium® genotyp-ing array with a set of 34 131 SNPs in 3543 candidate genes, asdescribed by Geraldes et al. (in press). We eliminated SNPswithin candidate genes with a minor allele frequency below 0.05,> 10% missing values and an Illumina GeneTrain score below0.5. These three selection criteria reduced the number of SNPs to29 233 for the 334 trees genotyped, 9342 of which were used toestimate the genomic pair-wise kinship. These 9342 SNPs werealso selected because of their conformity to Hardy–Weinbergexpectations. The genotypes of the 334 individuals for 9342SNPs on the genotyping array are given in Supporting Informa-tion Table S1. Details regarding each locus and the genotypingmethods can be found in Geraldes et al. (in press).
Estimation of heritabilities and genetic correlations betweenwood traits
The analysis of variance and trait heritability estimation followedthe animal model in Henderson (1984) following:
y ¼ X bþ Z uþ e Eqn 1
(y, vector of observations; X and Z, incidence matrices relatingfixed effects in vector b and random effects in vector u (breedingvalues) assuming U �N ð0; r2aÞ and VarðuÞ ¼ 2K r2a ; e, vectorof residual effects assuming E �N ð0; r2eÞ). K is the kinshipmatrix computed on the basis of marker information followingLoiselle et al. (1995), which substituted the commonly used aver-age numerator relationship matrix A based on pedigree informa-tion (Henderson, 1976) after substituting the negative valueswith zeros (Yu et al., 2006).
Genetic correlation between pairs of traits was estimated as:
r ¼ covABffiffiffiffiffiffiffiffiffiffiffiffiffir2a1r
2a2
p Eqn 2
where covAB, r2a1 and r2a2 are the genetic covariance between traitsand the additive genetic variance of both traits estimated in thebivariate model (Falconer & Mackay, 1996). Assuming
Y i ¼ Y1i
Y2i
� �as the response vector for the individual i and that
the bivariate model is performed as follows:
Y i ¼ X ibþ Z iui þ ei Eqn 3
where f ui �N ð0;G Þei �N ð0;RÞ , the covariate matrix of measurements
errors is defined by R =∑⊗ I, whereP¼ r2e1 re1e2
re2e1 r2e2
� �and
symbol ⊗ represents the Kronecker product. The covariance
matrix of random effects is G ¼ r2a1 ra1a2ra2a1 r2a2
� �� 2K , where
K is the kinship matrix. With the assumption of mutual indepen-dence between u and e, VarðY iÞ ¼ Z iG iZ
Ti þ R . Analyses were
performed in ASReml (Gilmour et al., 2002). The test of rela-tionship between matrices of genetic and phenotypic correlationswas performed using the ‘mantel.test’ function in R package ‘ncf’computing (Bjornstad, 2009).
Results
Variation in wood chemistry and ultrastructural traits
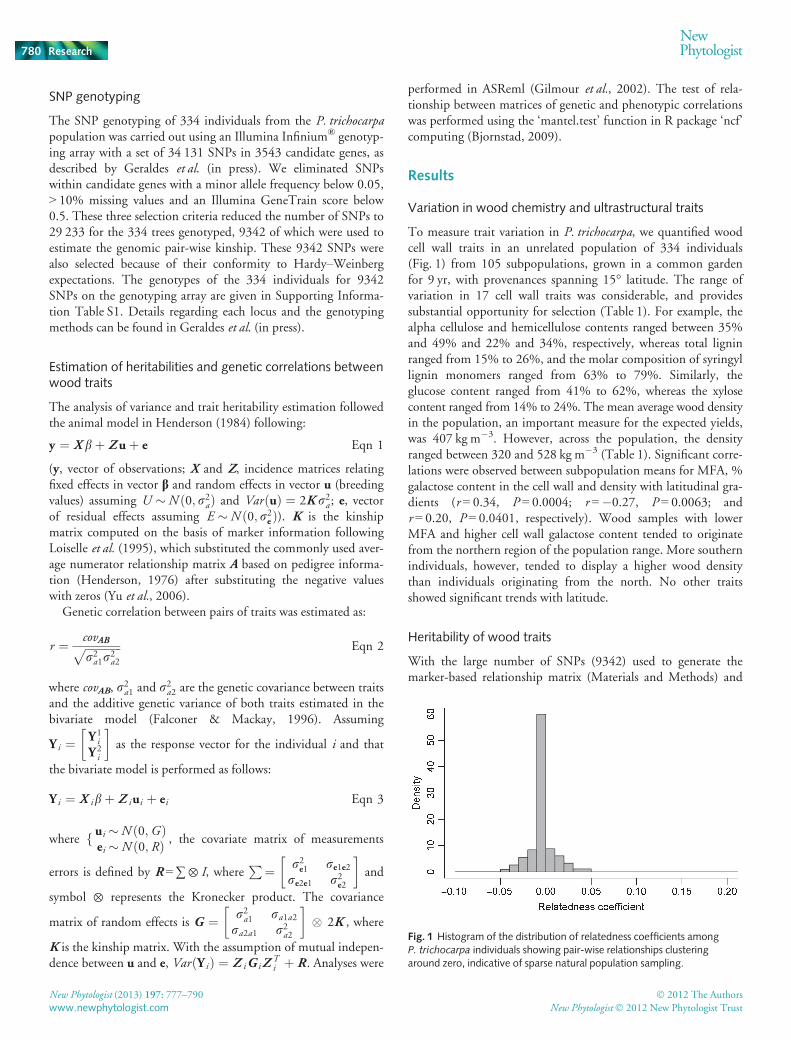
To measure trait variation in P. trichocarpa, we quantified woodcell wall traits in an unrelated population of 334 individuals(Fig. 1) from 105 subpopulations, grown in a common gardenfor 9 yr, with provenances spanning 15° latitude. The range ofvariation in 17 cell wall traits was considerable, and providessubstantial opportunity for selection (Table 1). For example, thealpha cellulose and hemicellulose contents ranged between 35%and 49% and 22% and 34%, respectively, whereas total ligninranged from 15% to 26%, and the molar composition of syringyllignin monomers ranged from 63% to 79%. Similarly, theglucose content ranged from 41% to 62%, whereas the xylosecontent ranged from 14% to 24%. The mean average wood densityin the population, an important measure for the expected yields,was 407 kg m�3. However, across the population, the densityranged between 320 and 528 kg m�3 (Table 1). Significant corre-lations were observed between subpopulation means for MFA, %galactose content in the cell wall and density with latitudinal gra-dients (r = 0.34, P = 0.0004; r =�0.27, P = 0.0063; andr = 0.20, P = 0.0401, respectively). Wood samples with lowerMFA and higher cell wall galactose content tended to originatefrom the northern region of the population range. More southernindividuals, however, tended to display a higher wood densitythan individuals originating from the north. No other traitsshowed significant trends with latitude.
Heritability of wood traits
With the large number of SNPs (9342) used to generate themarker-based relationship matrix (Materials and Methods) and
Fig. 1 Histogram of the distribution of relatedness coefficients amongP. trichocarpa individuals showing pair-wise relationships clusteringaround zero, indicative of sparse natural population sampling.
New Phytologist (2013) 197: 777–790 � 2012 The Authors
New Phytologist� 2012 New Phytologist Trustwww.newphytologist.com
Research
NewPhytologist780
the sample size (n = 334) studied, we were able to estimate signifi-cant narrow-sense heritability (h2) for 16 of the 17 traits exam-ined (Table 2). The significance of h2 estimates was determinedby the magnitude of their standard errors (SEs). In addition, nosex effect was considered, as it was assumed that this effect didnot appreciably contribute to the variance in the traits understudy (as the trees were only 9 yr of age, not all individuals weresexually reproductive and, hence, their genders were unknown;Q. Cronk, University of British Columbia, pers. comm.). Withthe exception of the holocellulose (combination of alpha celluloseand hemicellulose) content, which showed a low h2 (0.11;SE = 0.135), the remaining h2 estimates (Table 2) ranged from0.24 (fiber length) to 0.97 (soluble lignin). High h2 estimates(> 0.6) were detected for many of the cell wall chemistry traits,including arabinose, galactose, xylose, insoluble lignin and totallignin, whereas the wood average density showed the highest h2
estimate among the ultrastructural traits (0.56).
Phenotypic and genetic correlations
We next determined the extent of trait–trait genetic (rg) and phen-otypic (rp) correlations. These analyses showed that 78 (57%)and 61 (45%) of 136 possible phenotypic or genetic trait pairs,respectively, were significant (Tables 3–6). We identified 50 traitpairs for which both phenotypic and genetic correlations weresignificant; in addition, 11 trait pairs showed significant geneticcorrelations, but no significant phenotypic correlations, and 28showed significant phenotypic correlations, but no significantgenetic correlations (Tables 3–6). Matrix similarities betweengenetic and phenotypic correlations were determined using the
Mantel test with 1000 replications to uncover the patterns of cor-relation for 12 wood chemistry (r = 0.82) and five ultrastructural(r = 0.80) traits, and all tests were significant, indicating similarmagnitude and trajectory between genetic and phenotypic corre-lations. To compare the correlation pattern between wood chem-istry and ultrastructural traits, we conducted an overall Manteltest for the entire correlation matrix (i.e. 17 traits), whichincluded both phenotypic and genetic correlations, and obtaineda similar correlation pattern (r = 0.76). This was required as thewood chemistry and ultrastructural trait matrices are not sym-metrical; hence, the overall matrix test was performed.
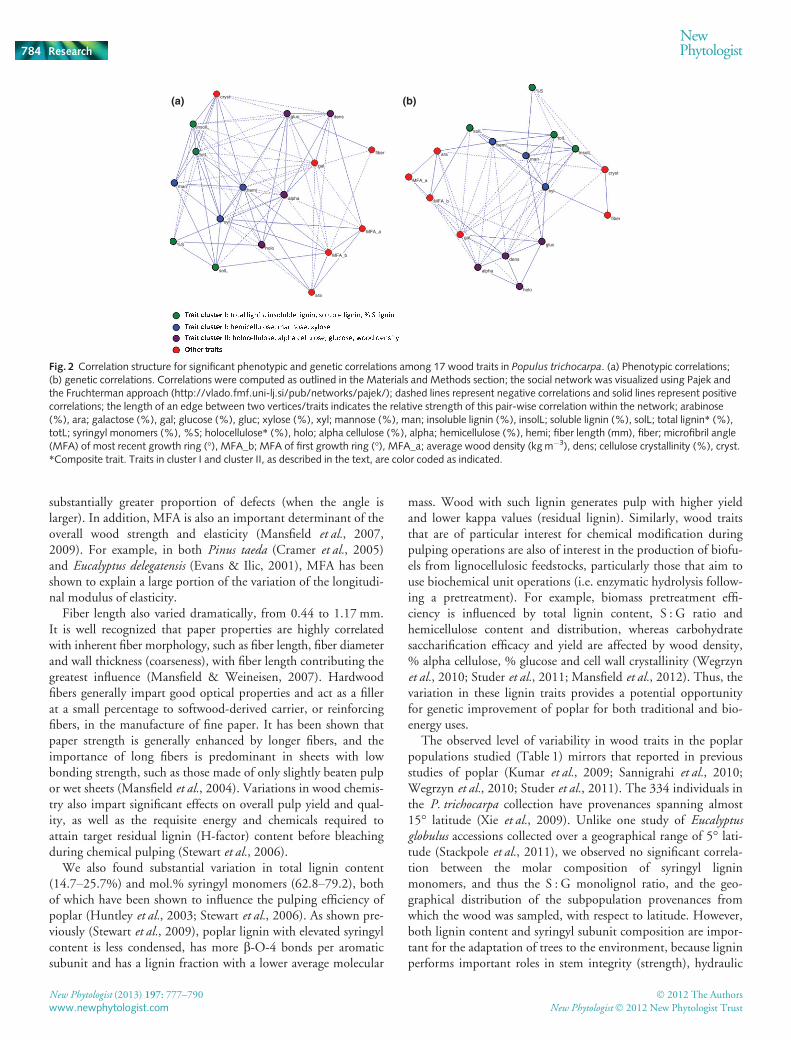
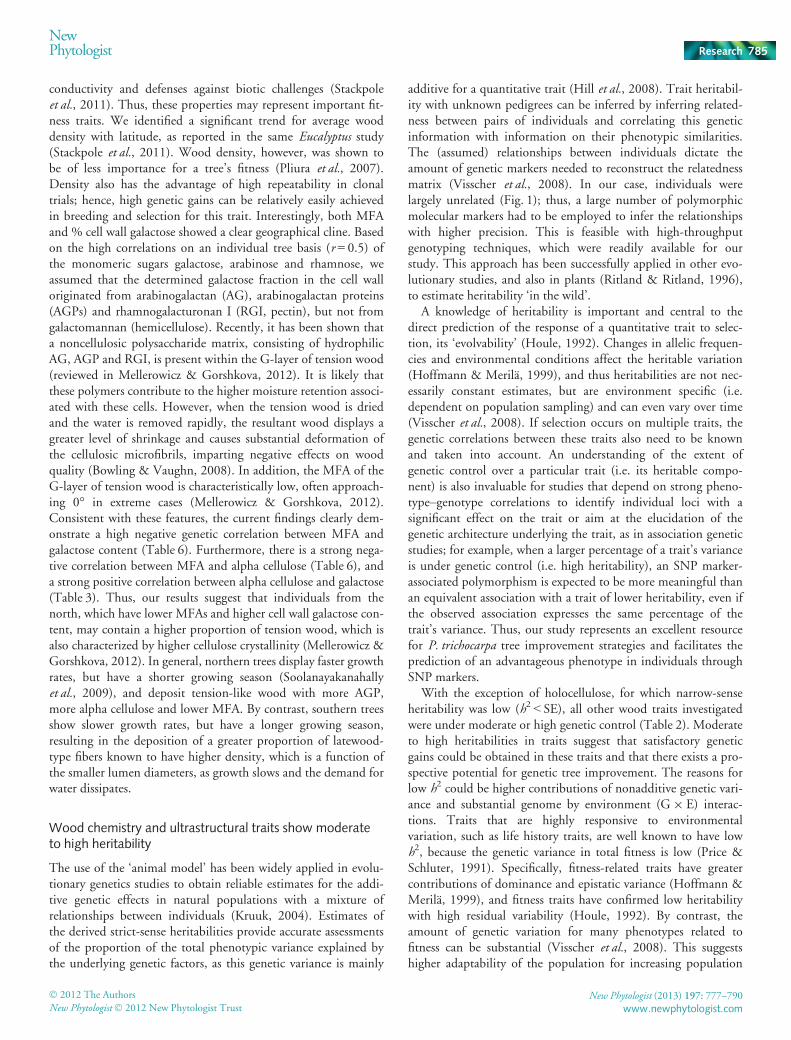
We then used network analysis (Waitt & Levin, 1998) to visu-ally represent the structures of phenotypic and genetic correla-tions (Fig. 2a,b). Strong and positive phenotypic and geneticcorrelations existed between clusters of lignin chemistry traits(insoluble lignin, soluble lignin, total lignin) and hemicellulosetraits (xylose, mannose, hemicellulose) (cluster I, Fig. 2). A clus-ter of positive correlations involving glucose, density, alpha cellu-lose and holocellulose contents was also observed (cluster II), andthe genetic correlations for this cluster (Fig. 2b) were much stron-ger than their respective phenotypic correlations (Fig. 2a).
Although glucose and xylose traits were (weakly) positivelycorrelated, both phenotypically and genetically (rp = 0.119,rg = 0.295), alpha cellulose and density were negatively correlatedwith xylose, and total and insoluble lignin traits (Fig. 2a,b). Bycontrast, strong positive genetic correlations were found betweenalpha cellulose and wood density. The strongest correlationsobserved among wood chemistry traits were the negative correla-tion between alpha cellulose and hemicellulose content(rg =�0.809; rp =�0.374) and the positive correlation betweenxylose and mannose content (rg = 0.699; rp = 0.484). Strong
Table 1 The mean, standard deviation (SD), minimum (MIN) andmaximum (MAX) values for 12 xylem chemistry and five ultrastructuraltraits in 9-yr-old Populus trichocarpa grown in a common-garden plot
Traits Mean SD MIN MAX n
Arabinose (%) 0.593 0.118 0.369 1.211 334Galactose (%) 0.298 0.212 0.001 1.114 333Glucose (%) 50.753 3.327 40.662 61.661 334Xylose (%) 18.527 1.553 13.879 24.220 334Mannose (%) 2.974 0.454 1.612 4.602 334Insoluble lignin (%) 18.300 1.533 10.204 23.138 334Soluble lignin (%) 2.528 0.407 1.532 3.524 333Total lignin (%)1 20.852 1.489 14.659 25.724 333Syringyl monomers (%) 71.495 2.349 62.784 79.231 332Holocellulose (%)1 69.159 2.165 62.825 75.203 334Alpha cellulose (%) 40.828 2.069 35.087 48.522 334Hemicellulose (%) 28.331 1.777 22.008 33.652 334Fiber length (mm) 0.895 0.114 0.443 1.168 310MFA bark (°) 17.775 2.121 10.418 24.553 330MFA pith (°) 19.618 1.918 13.653 25.512 330Average wooddensity (kgm�3)
406.805 33.569 320.420 528.230 330
Cellulose crystallinity (%) 49.357 3.363 42.017 61.728 319
1Composite trait (total lignin = soluble + insoluble lignin;holocellulose = alpha cellulose + hemicelluloses).MFA bark, microfibrilangle at most recent growth ring; MFA pith, microfibril angle at firstgrowth ring; n, sample size; %, dry wood-based percentage of wood com-ponents.
Table 2 Estimated narrow-sense heritability (h2) with standard error (SE)for 12 xylem chemistry and five ultrastructural traits in 9-yr-old Populus
trichocarpa grown in a common-garden plot
Traits h2 SE
Arabinose (%) 0.685 0.149Galactose (%) 0.643 0.139Glucose (%) 0.456 0.161Xylose (%) 0.689 0.156Mannose (%) 0.385 0.166Insoluble lignin (%) 0.657 0.163Soluble lignin (%) 0.965 0.142Total lignin (%)1 0.652 0.163Syringyl monomers (%) 0.388 0.153Holocellulose (%)1 0.110 0.135Alpha cellulose (%) 0.416 0.157Hemicellulose (%) 0.347 0.149Fiber length (mm) 0.240 0.177MFA bark (°) 0.441 0.167MFA pith (°) 0.407 0.164Average wood density (kg m�3) 0.558 0.166Cellulose crystallinity (%) 0.399 0.174
1Composite trait (total lignin = soluble + insoluble lignin;holocellulose = alpha cellulose + hemicelluloses). MFA bark, microfibrilangle at recent growth ring; MFA pith, microfibril angle at first growthring; %, dry wood-based percentage of wood components.
� 2012 The Authors
New Phytologist� 2012 New Phytologist TrustNew Phytologist (2013) 197: 777–790
www.newphytologist.com
NewPhytologist Research 781

genetic correlations were also found between MFA (most recentgrowth ring) and holocellulose (negative; rg =�0.532), betweenMFA (both growth rings) and arabinose (positive; rg = 0.561 and0.671), and between cellulose crystallinity and fiber length(positive; rg = 0.588). In addition, cellulose crystallinity showedstrong positive correlations with insoluble and total lignin (bothphenotypically and genetically; Fig. 2a,b). MFA (most recentgrowth ring) again showed a positive genetic correlation withdensity (rg = 0.260), and a negative genetic correlation with glu-cose (rg =�0.479), whereas density and glucose were positivelycorrelated (rg = 0.527; Fig. 2b), suggesting a trade-off betweenincreased MFA and glucose content.
Discussion
To our knowledge, this is the first forest tree study to comprehen-sively analyze hundreds of natural accessions of Populus spp.(poplar) for xylem chemistry and ultrastructural traits simulta-neously. Previous studies evaluating wood trait variation in largepoplar populations have employed other analytical techniques toassess some of the wood chemistry traits evaluated in this study.These include near-infrared reflectance (NIR) and pyrolysismolecular beam mass spectrometry (PyrMBMS) (Wegrzyn et al.,2010; Studer et al., 2011). Although such techniques have theadvantage of being rapid and amenable to high-throughput anal-ysis, a drawback of both is that they provide only a limited num-ber of trait estimates, and are based on training sets derived fromwet chemistry analyses similar to the techniques used in the cur-rent study. For example, PyrMBMS requires precalibrationsusing wet chemistry and quantifies wood chemistry traits indi-rectly, and, although rapid and accurate, does not disclose themake-up of five- and six-carbon sugars, and only offers totalamounts of each (e.g. glucose derived from hemicellulose andalpha cellulose). Although commonly applied, neither offers com-prehensive insights into the chemistry of cell wall traits (Novaeset al., 2009). By contrast, we applied the direct measurements ofwood chemistry traits using wet laboratory approaches and directmeasures of ultrastructure. Although laborious, these approachesprovide the most direct and accurate phenotypic estimates ofquantitative wood chemistry and ultrastructural traits and traitvariation, making them highly amenable to the study ofwood phenotype–genotype correlations in the P. trichocarpapopulations studied.
Wood chemistry and ultrastructural traits showconsiderable variability
Wood quality is defined by the intrinsic morphological andchemical components of wood and, as such, plays a critical rolein determining the overall economic value of a woody stem. Inaddition to growth rate, properties such as wood density, fiberlength, MFA and cell wall chemistry are all industrially importanttraits, and ultimately can be used to select superior clonal mate-rial. However, trait selection is ultimately dependent on the enduse of woody biomass. In this study, we present a comprehensiveassessment of 334 P. trichocarpa genotypes spanning much of theT
able3Phen
otypic(below
diagonal)an
dgen
etic(above
diagonal)correlations(rpan
dr g,respective
ly)forxy
lem
chem
istrytraits
Traits
Arabinose
(%)
Galactose
(%)
Glucose
(%)
Xylose
(%)
Man
nose
(%)
Insoluble
lignin
(%)
Soluble
lignin
(%)
Total
lignin
1(%
)Sy
ringyl
(%)
Holocellulose
1
(%)
Alpha
cellulose
(%)
Hem
icellulose
(%)
Arabinose
(%)
1�0
.570
0.017ns
�0.074ns
0.093ns
0.149ns
0.032ns
0.146ns
0.017ns
0.248ns
�0.297
0.587
Galactose
(%)
�0.475
10.271
�0.420
�0.554
�0.198
�0.271
�0.301
�0.019ns
0.211ns
0.554
�0.512
Glucose
(%)
0.016ns
0.299
10.295
0.403
�0.006ns
�0.073ns
�0.072ns
0.170ns
0.495
0.214ns
0.189ns
Xylose
(%)
�0.188
�0.250
0.119
10.699
0.286
0.316
0.436
�0.132ns
�0.207ns
�0.443
0.403
Man
nose
(%)
�0.038ns
�0.242
�0.025ns
0.484
10.360
0.331
0.480
0.307
0.586ns
�0.253ns
0.636
Insolublelignin
(%)
0.078ns
�0.210
�0.241
0.141
0.289
1�0
.116ns
0.955
�0.289
�0.388ns
�0.466
0.295
Solublelignin
(%)
0.038ns
�0.220
�0.019ns
0.419
0.206
�0.090ns
10.235
�0.021ns
0.289ns
DNC
0.216
Totallignin
1(%
)0.044ns
�0.276
�0.259
0.250
0.316
0.962
0.184
1�0
.299
�0.298ns
�0.448
0.337
Syringyl(%
)0.054ns
0.046ns
0.067ns
�0.010ns
�0.014ns
�0.254
0.273
�0.176
10.408ns
0.192ns
0.056ns
Holocellulose
1(%
)0.160
0.072ns
0.114
�0.117
�0.067ns
�0.181
0.041ns
�0.212
0.219
10.597
�0.011ns
Alphacellulose
(%)
0.063ns
0.313
0.281
�0.370
�0.273
�0.309
�0.108ns
�0.398
0.167
0.648
1�0
.809
Hem
icellulose
(%)
0.122
�0.277
�0.189
0.288
0.235
0.140
0.174
0.202
0.074ns
0.463
�0.374
1
1Composite
trait(totallignin=soluble+insolublelignin;holocellulose
=alphacellulose
+hem
icelluloses).Bold,significant;DNC,did
notconve
rge;
ns,notsignificantat
5%
leve
l(forr p)ornotsignifi-
cantifr g<SE
.
New Phytologist (2013) 197: 777–790 � 2012 The Authors
New Phytologist� 2012 New Phytologist Trustwww.newphytologist.com
Research
NewPhytologist782
native range of the species and, based on extensive phenotypicand genotypic diversity, conclusively demonstrate the potentialfor the selection of superior genotypes for targeted breeding forboth bioenergy applications and traditional industrial uses.
Traditionally important wood quality characteristics showedsubstantial variation, with wood density ranging from 320 to528 kg m�3 and MFA from 10.4 to 25.5°. Wood density has aconsiderable influence on the strength, machinability and rates of
conversion of solid wood products, and affects both the yield andfiber properties of the pulp produced (Mansfield et al., 2007).Moreover, wood density influences significantly the overall bio-mass yield of trees (when growth parameters, such as volume,remain constant), which can affect the bioenergy applications ofthe total harvested material from a given stand. The S2 MFA hasbeen shown to influence the longitudinal and transverse shrink-age in sawn lumber during drying operations, resulting in a
Table 4 Phenotypic (below diagonal) and genetic (above diagonal) (rp and rg, respectively) correlations for ultrastructural traits
Traits Fiber length (mm) MFA bark (°) MFA pith (°)Average wood density(kgm�3)
Cellulose crystallinity(%)
Fiber length (mm) 1 �0.261ns �0.177ns �0.385ns 0.588MFA bark (°) �0.138 1 0.999 0.260 �0.097nsMFA pith (°) �0.004ns 0.620 1 0.189ns �0.347nsAverage wood density (kg m�3) �0.015ns 0.100ns 0.140 1 �0.472Cellulose crystallinity (%) �0.019ns 0.066ns 0.029ns �0.272 1
Bold, significant; MFA bark, microfibril angle at recent growth ring; MFA pith, microfibril angle at first growth ring; ns, not significant at 5% level (for rp) ornot significant if rg < SE.
Table 5 Phenotypic correlations (rp) for xylem chemistry and ultrastructural traits
Traits Fiber length (mm) MFA bark (°) MFA pith (°)Average wood density(kgm�3)
Cellulose crystallinity(%)
Arabinose (%) 0.087ns 0.137 0.120 �0.120 �0.066nsGalactose (%) �0.096ns �0.194 �0.185 0.143 �0.088nsGlucose (%) 0.161 �0.108 �0.014ns 0.122 �0.238Xylose (%) �0.052ns 0.178 0.149 �0.014ns 0.125Mannose (%) �0.001ns �0.002ns �0.041ns �0.065ns 0.222Insoluble lignin (%) �0.094ns �0.001ns 0.002ns �0.215 0.187Soluble lignin (%) 0.054ns 0.170 0.102ns �0.083ns 0.076nsTotal lignin1 (%) �0.077ns 0.053ns 0.029ns �0.247 0.205Syringyl (%) �0.064ns 0.035ns �0.051ns 0.087ns �0.178Holocellulose1 (%) �0.034ns �0.015ns �0.049ns 0.088ns �0.043nsAlpha cellulose (%) 0.085ns �0.122 �0.113 0.173 �0.149Hemicellulose (%) �0.139 0.124 0.072ns �0.093ns 0.120
1Composite trait (total lignin = soluble + insoluble lignin; holocellulose = alpha cellulose + hemicelluloses). Bold, significant; MFA bark, microfibril angle atrecent growth ring; MFA pith, microfibril angle at first growth ring; ns, not significant at 5% level.
Table 6 Genetic correlations (rg) for xylem chemistry and ultrastructural traits
Traits Fiber length (mm) MFA bark (°) MFA pith (°)Average wood density(kgm�3)
Cellulose crystallinity(%)
Arabinose (%) 0.137ns 0.561 0.671 0.010ns �0.279Galactose (%) �0.233ns �0.788 �0.441 0.232 0.176nsGlucose (%) 0.161ns �0.479 �0.094ns 0.527 �0.146nsXylose (%) 0.335 0.016ns 0.092ns �0.227 0.068nsMannose (%) 0.389ns �0.070ns �0.015ns �0.121ns �0.115nsInsoluble lignin (%) �0.279ns �0.034ns �0.144ns �0.430 0.381Soluble lignin (%) DNC 0.368 0.134ns �0.089ns 0.158nsTotal lignin1 (%) �0.231ns 0.191ns �0.012ns �0.418 0.447Syringyl (%) �0.228ns 0.166ns 0.056ns 0.228ns �0.655Holocellulose1 (%) 0.450ns �0.532 �0.149ns 0.668 �0.301nsAlpha cellulose (%) 0.142ns �0.449 �0.127ns 0.735 �0.180nsHemicellulose (%) 0.120ns 0.112ns 0.079ns �0.337 0.082ns
1Composite trait (total lignin = soluble + insoluble lignin; holocellulose = alpha cellulose + hemicelluloses). Bold, significant; DNC, did not converge; MFAbark, microfibril angle at recent growth ring; MFA pith, microfibril angle at first growth ring; ns, not significant if rg < SE.
� 2012 The Authors
New Phytologist� 2012 New Phytologist TrustNew Phytologist (2013) 197: 777–790
www.newphytologist.com
NewPhytologist Research 783
substantially greater proportion of defects (when the angle islarger). In addition, MFA is also an important determinant of theoverall wood strength and elasticity (Mansfield et al., 2007,2009). For example, in both Pinus taeda (Cramer et al., 2005)and Eucalyptus delegatensis (Evans & Ilic, 2001), MFA has beenshown to explain a large portion of the variation of the longitudi-nal modulus of elasticity.
Fiber length also varied dramatically, from 0.44 to 1.17 mm.It is well recognized that paper properties are highly correlatedwith inherent fiber morphology, such as fiber length, fiber diameterand wall thickness (coarseness), with fiber length contributing thegreatest influence (Mansfield & Weineisen, 2007). Hardwoodfibers generally impart good optical properties and act as a fillerat a small percentage to softwood-derived carrier, or reinforcingfibers, in the manufacture of fine paper. It has been shown thatpaper strength is generally enhanced by longer fibers, and theimportance of long fibers is predominant in sheets with lowbonding strength, such as those made of only slightly beaten pulpor wet sheets (Mansfield et al., 2004). Variations in wood chemis-try also impart significant effects on overall pulp yield and qual-ity, as well as the requisite energy and chemicals required toattain target residual lignin (H-factor) content before bleachingduring chemical pulping (Stewart et al., 2006).
We also found substantial variation in total lignin content(14.7–25.7%) and mol.% syringyl monomers (62.8–79.2), bothof which have been shown to influence the pulping efficiency ofpoplar (Huntley et al., 2003; Stewart et al., 2006). As shown pre-viously (Stewart et al., 2009), poplar lignin with elevated syringylcontent is less condensed, has more b-O-4 bonds per aromaticsubunit and has a lignin fraction with a lower average molecular
mass. Wood with such lignin generates pulp with higher yieldand lower kappa values (residual lignin). Similarly, wood traitsthat are of particular interest for chemical modification duringpulping operations are also of interest in the production of biofu-els from lignocellulosic feedstocks, particularly those that aim touse biochemical unit operations (i.e. enzymatic hydrolysis follow-ing a pretreatment). For example, biomass pretreatment effi-ciency is influenced by total lignin content, S : G ratio andhemicellulose content and distribution, whereas carbohydratesaccharification efficacy and yield are affected by wood density,% alpha cellulose, % glucose and cell wall crystallinity (Wegrzynet al., 2010; Studer et al., 2011; Mansfield et al., 2012). Thus, thevariation in these lignin traits provides a potential opportunityfor genetic improvement of poplar for both traditional and bio-energy uses.
The observed level of variability in wood traits in the poplarpopulations studied (Table 1) mirrors that reported in previousstudies of poplar (Kumar et al., 2009; Sannigrahi et al., 2010;Wegrzyn et al., 2010; Studer et al., 2011). The 334 individuals inthe P. trichocarpa collection have provenances spanning almost15° latitude (Xie et al., 2009). Unlike one study of Eucalyptusglobulus accessions collected over a geographical range of 5° lati-tude (Stackpole et al., 2011), we observed no significant correla-tion between the molar composition of syringyl ligninmonomers, and thus the S : G monolignol ratio, and the geo-graphical distribution of the subpopulation provenances fromwhich the wood was sampled, with respect to latitude. However,both lignin content and syringyl subunit composition are impor-tant for the adaptation of trees to the environment, because ligninperforms important roles in stem integrity (strength), hydraulic
(a) cryst
insoIL
totL
man
%S
solL
holo
xyl
hemi
ara
MFA_b
MFA_a
alpha
gal
fiber
MFA_a
MFA_b
ara
solL
hemi
man
xyl
gluc
dens
gal
alpha
holo
fiber
cryst
insolL
totL
%S
densgluc
(b)
Fig. 2 Correlation structure for significant phenotypic and genetic correlations among 17 wood traits in Populus trichocarpa. (a) Phenotypic correlations;(b) genetic correlations. Correlations were computed as outlined in the Materials and Methods section; the social network was visualized using Pajek andthe Fruchterman approach (http://vlado.fmf.uni-lj.si/pub/networks/pajek/); dashed lines represent negative correlations and solid lines represent positivecorrelations; the length of an edge between two vertices/traits indicates the relative strength of this pair-wise correlation within the network; arabinose(%), ara; galactose (%), gal; glucose (%), gluc; xylose (%), xyl; mannose (%), man; insoluble lignin (%), insolL; soluble lignin (%), solL; total lignin* (%),totL; syringyl monomers (%), %S; holocellulose* (%), holo; alpha cellulose (%), alpha; hemicellulose (%), hemi; fiber length (mm), fiber; microfibril angle(MFA) of most recent growth ring (°), MFA_b; MFA of first growth ring (°), MFA_a; average wood density (kgm�3), dens; cellulose crystallinity (%), cryst.*Composite trait. Traits in cluster I and cluster II, as described in the text, are color coded as indicated.
New Phytologist (2013) 197: 777–790 � 2012 The Authors
New Phytologist� 2012 New Phytologist Trustwww.newphytologist.com
Research
NewPhytologist784
conductivity and defenses against biotic challenges (Stackpoleet al., 2011). Thus, these properties may represent important fit-ness traits. We identified a significant trend for average wooddensity with latitude, as reported in the same Eucalyptus study(Stackpole et al., 2011). Wood density, however, was shown tobe of less importance for a tree’s fitness (Pliura et al., 2007).Density also has the advantage of high repeatability in clonaltrials; hence, high genetic gains can be relatively easily achievedin breeding and selection for this trait. Interestingly, both MFAand % cell wall galactose showed a clear geographical cline. Basedon the high correlations on an individual tree basis (r = 0.5) ofthe monomeric sugars galactose, arabinose and rhamnose, weassumed that the determined galactose fraction in the cell walloriginated from arabinogalactan (AG), arabinogalactan proteins(AGPs) and rhamnogalacturonan I (RGI, pectin), but not fromgalactomannan (hemicellulose). Recently, it has been shown thata noncellulosic polysaccharide matrix, consisting of hydrophilicAG, AGP and RGI, is present within the G-layer of tension wood(reviewed in Mellerowicz & Gorshkova, 2012). It is likely thatthese polymers contribute to the higher moisture retention associ-ated with these cells. However, when the tension wood is driedand the water is removed rapidly, the resultant wood displays agreater level of shrinkage and causes substantial deformation ofthe cellulosic microfibrils, imparting negative effects on woodquality (Bowling & Vaughn, 2008). In addition, the MFA of theG-layer of tension wood is characteristically low, often approach-ing 0° in extreme cases (Mellerowicz & Gorshkova, 2012).Consistent with these features, the current findings clearly dem-onstrate a high negative genetic correlation between MFA andgalactose content (Table 6). Furthermore, there is a strong nega-tive correlation between MFA and alpha cellulose (Table 6), anda strong positive correlation between alpha cellulose and galactose(Table 3). Thus, our results suggest that individuals from thenorth, which have lower MFAs and higher cell wall galactose con-tent, may contain a higher proportion of tension wood, which isalso characterized by higher cellulose crystallinity (Mellerowicz &Gorshkova, 2012). In general, northern trees display faster growthrates, but have a shorter growing season (Soolanayakanahallyet al., 2009), and deposit tension-like wood with more AGP,more alpha cellulose and lower MFA. By contrast, southern treesshow slower growth rates, but have a longer growing season,resulting in the deposition of a greater proportion of latewood-type fibers known to have higher density, which is a function ofthe smaller lumen diameters, as growth slows and the demand forwater dissipates.
Wood chemistry and ultrastructural traits show moderateto high heritability
The use of the ‘animal model’ has been widely applied in evolu-tionary genetics studies to obtain reliable estimates for the addi-tive genetic effects in natural populations with a mixture ofrelationships between individuals (Kruuk, 2004). Estimates ofthe derived strict-sense heritabilities provide accurate assessmentsof the proportion of the total phenotypic variance explained bythe underlying genetic factors, as this genetic variance is mainly
additive for a quantitative trait (Hill et al., 2008). Trait heritabil-ity with unknown pedigrees can be inferred by inferring related-ness between pairs of individuals and correlating this geneticinformation with information on their phenotypic similarities.The (assumed) relationships between individuals dictate theamount of genetic markers needed to reconstruct the relatednessmatrix (Visscher et al., 2008). In our case, individuals werelargely unrelated (Fig. 1); thus, a large number of polymorphicmolecular markers had to be employed to infer the relationshipswith higher precision. This is feasible with high-throughputgenotyping techniques, which were readily available for ourstudy. This approach has been successfully applied in other evo-lutionary studies, and also in plants (Ritland & Ritland, 1996),to estimate heritability ‘in the wild’.
A knowledge of heritability is important and central to thedirect prediction of the response of a quantitative trait to selec-tion, its ‘evolvability’ (Houle, 1992). Changes in allelic frequen-cies and environmental conditions affect the heritable variation(Hoffmann & Merila, 1999), and thus heritabilities are not nec-essarily constant estimates, but are environment specific (i.e.dependent on population sampling) and can even vary over time(Visscher et al., 2008). If selection occurs on multiple traits, thegenetic correlations between these traits also need to be knownand taken into account. An understanding of the extent ofgenetic control over a particular trait (i.e. its heritable compo-nent) is also invaluable for studies that depend on strong pheno-type–genotype correlations to identify individual loci with asignificant effect on the trait or aim at the elucidation of thegenetic architecture underlying the trait, as in association geneticstudies; for example, when a larger percentage of a trait’s varianceis under genetic control (i.e. high heritability), an SNP marker-associated polymorphism is expected to be more meaningful thanan equivalent association with a trait of lower heritability, even ifthe observed association expresses the same percentage of thetrait’s variance. Thus, our study represents an excellent resourcefor P. trichocarpa tree improvement strategies and facilitates theprediction of an advantageous phenotype in individuals throughSNP markers.
With the exception of holocellulose, for which narrow-senseheritability was low (h2 < SE), all other wood traits investigatedwere under moderate or high genetic control (Table 2). Moderateto high heritabilities in traits suggest that satisfactory geneticgains could be obtained in these traits and that there exists a pro-spective potential for genetic tree improvement. The reasons forlow h2 could be higher contributions of nonadditive genetic vari-ance and substantial genome by environment (G9 E) interac-tions. Traits that are highly responsive to environmentalvariation, such as life history traits, are well known to have lowh2, because the genetic variance in total fitness is low (Price &Schluter, 1991). Specifically, fitness-related traits have greatercontributions of dominance and epistatic variance (Hoffmann &Merila, 1999), and fitness traits have confirmed low heritabilitywith high residual variability (Houle, 1992). By contrast, theamount of genetic variation for many phenotypes related tofitness can be substantial (Visscher et al., 2008). This suggestshigher adaptability of the population for increasing population
� 2012 The Authors
New Phytologist� 2012 New Phytologist TrustNew Phytologist (2013) 197: 777–790
www.newphytologist.com
NewPhytologist Research 785

fitness, as genetic variation is related to environmental variation(Dobzhansky, 1951). However, the response of every trait todirectional selection depends on both estimates: the heritabilityand the genetic variation. We found that c. 60% of the xylemchemistry traits showed high heritability (h2 > 0.5). By contrast,only one of five measured ultrastructural traits had h2 > 0.5 (den-sity), but moderate levels of narrow-sense heritability wereobserved for all other ultrastructural traits. Previous studies onE. globulus found heritability estimates for density, cellulose andlignin that were comparable with our P. trichocarpa results(Stackpole et al., 2011). As with our results, very high heritabilityfor acid-soluble lignin was reported previously in E. globulus(Poke et al., 2006). These findings suggest that heritabilities, atleast for certain wood traits, allow meaningful comparisons acrosshardwood species.
Different patterns of correlations among wood traits inP. trichocarpa
Genetic correlations between traits can arise from pleiotropiceffects or from strong linkage disequilibrium of causative genes.Generally, genetic correlations are expected to be higher thanphenotypic correlations because G9 E interactions can beprevalent in the latter. However, low trait heritabilities can mani-fest extreme genetic correlations relative to their phenotypiccounterparts (Cheverud, 1988). The average matrix correlationsbetween genetic and phenotypic correlations observed here weresimilar to those reported previously for plants (Waitt & Levin,1998). Comparisons between chemical and ultrastructural traits,as opposed to comparisons within chemical and ultrastructuraltraits, indicated the presence of stronger correlations within eachtrait set, as expected, as they tend to be more biologically related.Similarly, a lack of strong correlations between certain traitscould be an indication of traits that are functionally or develop-mentally less related, and are therefore genetically and phenotypi-cally less integrated, but functionally or developmentally lessrelated traits can yield higher degrees of phenotypic correlation(Waitt & Levin, 1998). In any case, information on genetic cor-relations is invaluable for understanding the correlated responseof traits to selection, that is trait co-evolution (Cheverud, 1988).From a practical perspective, this knowledge can be applied toindirectly select for and predict genetic gain for an advantageousphenotype that is difficult or costly to assess otherwise. It can alsobe applied to select for multiple traits simultaneously. However,the influence of environment on the expression of genetic covari-ation has also been highlighted (Sgro & Hoffmann, 2004), andneeds to be considered when breeding strategies are developed.
Advantageous trait combinations
Genetic correlations provide insights into the evolutionary con-straints of a species, and are best studied in the natural environ-ment of the species (Lynch, 1999). However, tree improvementtrials are widely established as common gardens to facilitate thetesting of genotypes under comparable environmental condi-tions. Thus, it is possible to model the environmental effects and
distinguish these from the true genetic differences between theindividuals. Here, we studied phenotypic traits important for cellwall characteristics in a P. trichocarpa common garden. To iden-tify potential advantageous traits that may be combined in singleindividuals, we focus the following discussion on correlations thatinvolve trait pairs for which both genetic and phenotypic correla-tions were significant.
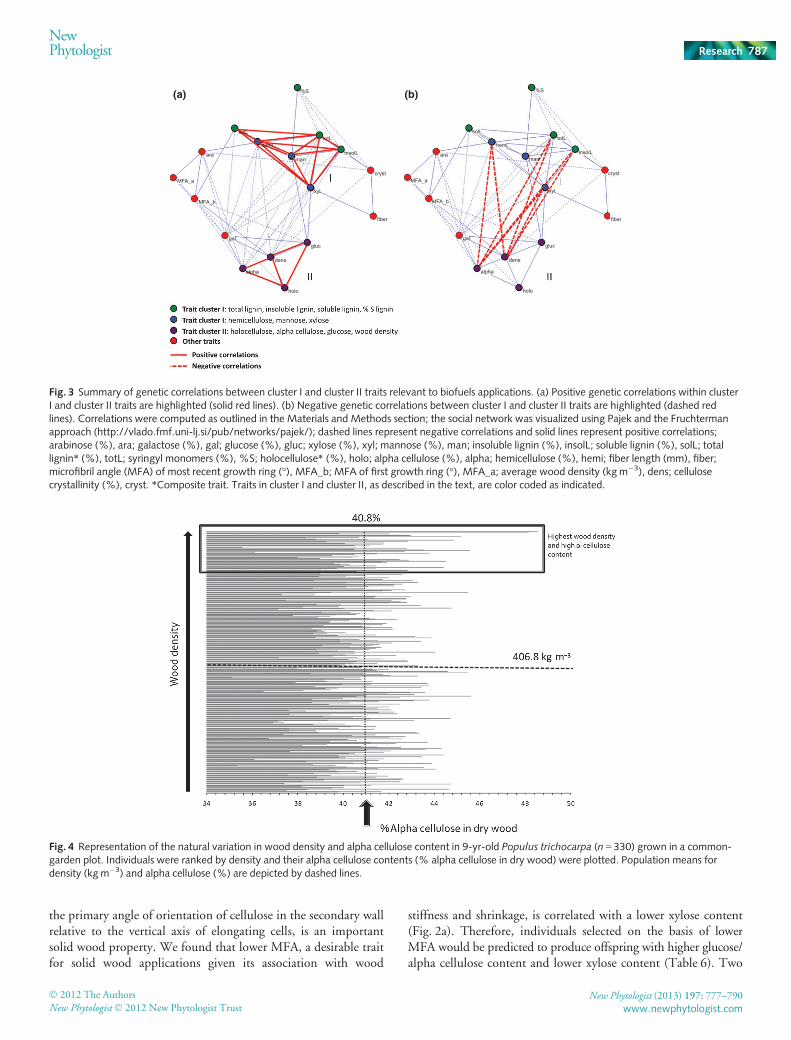
We identified two important trait clusters, each involvingmultiple traits: cluster I, a set of hemicellulose- and lignin-relatedtraits; and cluster II, consisting of cellulose and density traits(Fig. 2, Tables 3, 6). Genetic correlations within each of theseclusters were strong and positive (Fig. 3a), but many genetic cor-relations between traits in the two clusters were negative, particu-larly between alpha cellulose and wood density (cluster I) andlignin and hemicellulose traits (cluster II; Fig. 3b).
These correlations are important considerations when selectingfor desired phenotypic combinations in breeding (e.g. forimproved biofuel traits). In this case, an important target forgenetic improvement is the recalcitrance of plant cell walls todeconstruction. The natural resistance of wood cell walls to bio-logical conversion (enzymatic hydrolysis) is attributed to the het-erogeneity of the biomass components and the occlusion ofcellulose microfibrils by lignin and hemicelluloses, and the result-ing inaccessibility of hydrolytic enzymes to the cellulose surfacearea (Mansfield et al., 1999; Mosier et al., 2005). Although xylanand lignin can alternatively serve as resources for biomaterials,increased bioethanol yield generally requires feedstocks with low-ered lignin and xylan content, fewer or modified hemicellulose–lignin interactions and above average syringyl lignin fraction(S : G � 2.0) (Studer et al., 2011; Mansfield et al., 2012). Thus,the identification of a concerted negative genetic correlation oflignin and hemicellulose content with density and alpha cellulosecontent (Fig. 3, Tables 3, 6) appears to be highly advantageousfor breeding strategies directed at optimizing poplar as a lignocel-lulosic feedstock for bioethanol production. The data suggest thatbreeding for lower lignin or hemicellulose content could simulta-neously select for higher density and alpha cellulose content, andvice versa.
We also found that lignin with a higher mol.% syringyl subun-its is negatively correlated with the amount of insoluble and totallignin in the cell wall. These findings are consistent with thoseobserved in Eucalyptus (Stackpole et al., 2011), and suggest thatsimultaneous breeding for high mol.% syringyl lignin and lowtotal lignin is feasible.
The properties of cellulose are also important factors to beconsidered in feedstock development (Mosier et al., 2005).Extensive intra- and intermolecular hydrogen bonds promote theformation of crystalline structures. The intrinsic cellulosic ultra-structure has long been recognized as an important parameter inthe efficiency of enzymatic hydrolysis (Mansfield et al., 1999;Chang & Holtzapple, 2000). We found that low cell wall crystal-linity, which is advantageous for biofuel, chemical cellulose andchemical pulping applications, is correlated with lower lignin,higher mol.% syringyl lignin and higher density, suggesting thatit should be possible to simultaneously select for these traits inbreeding for improved feedstocks. Alternatively, MFA, which is
New Phytologist (2013) 197: 777–790 � 2012 The Authors
New Phytologist� 2012 New Phytologist Trustwww.newphytologist.com
Research
NewPhytologist786
the primary angle of orientation of cellulose in the secondary wallrelative to the vertical axis of elongating cells, is an importantsolid wood property. We found that lower MFA, a desirable traitfor solid wood applications given its association with wood
stiffness and shrinkage, is correlated with a lower xylose content(Fig. 2a). Therefore, individuals selected on the basis of lowerMFA would be predicted to produce offspring with higher glucose/alpha cellulose content and lower xylose content (Table 6). Two
MFA_a MFA_a
MFA_b MFA_b
ara ara
gal gal
dens dens
alpha alpha
holo holo
gluc gluc
xyl xyl
fiber fiber
man maninsolL insolL
cryst cryst
totL totL
%S %S
solL solL
hemi hemi
(a) (b)
Fig. 3 Summary of genetic correlations between cluster I and cluster II traits relevant to biofuels applications. (a) Positive genetic correlations within clusterI and cluster II traits are highlighted (solid red lines). (b) Negative genetic correlations between cluster I and cluster II traits are highlighted (dashed redlines). Correlations were computed as outlined in the Materials and Methods section; the social network was visualized using Pajek and the Fruchtermanapproach (http://vlado.fmf.uni-lj.si/pub/networks/pajek/); dashed lines represent negative correlations and solid lines represent positive correlations;arabinose (%), ara; galactose (%), gal; glucose (%), gluc; xylose (%), xyl; mannose (%), man; insoluble lignin (%), insolL; soluble lignin (%), solL; totallignin* (%), totL; syringyl monomers (%), %S; holocellulose* (%), holo; alpha cellulose (%), alpha; hemicellulose (%), hemi; fiber length (mm), fiber;microfibril angle (MFA) of most recent growth ring (°), MFA_b; MFA of first growth ring (°), MFA_a; average wood density (kgm�3), dens; cellulosecrystallinity (%), cryst. *Composite trait. Traits in cluster I and cluster II, as described in the text, are color coded as indicated.
Fig. 4 Representation of the natural variation in wood density and alpha cellulose content in 9-yr-old Populus trichocarpa (n = 330) grown in a common-garden plot. Individuals were ranked by density and their alpha cellulose contents (% alpha cellulose in dry wood) were plotted. Population means fordensity (kgm�3) and alpha cellulose (%) are depicted by dashed lines.
� 2012 The Authors
New Phytologist� 2012 New Phytologist TrustNew Phytologist (2013) 197: 777–790
www.newphytologist.com
NewPhytologist Research 787
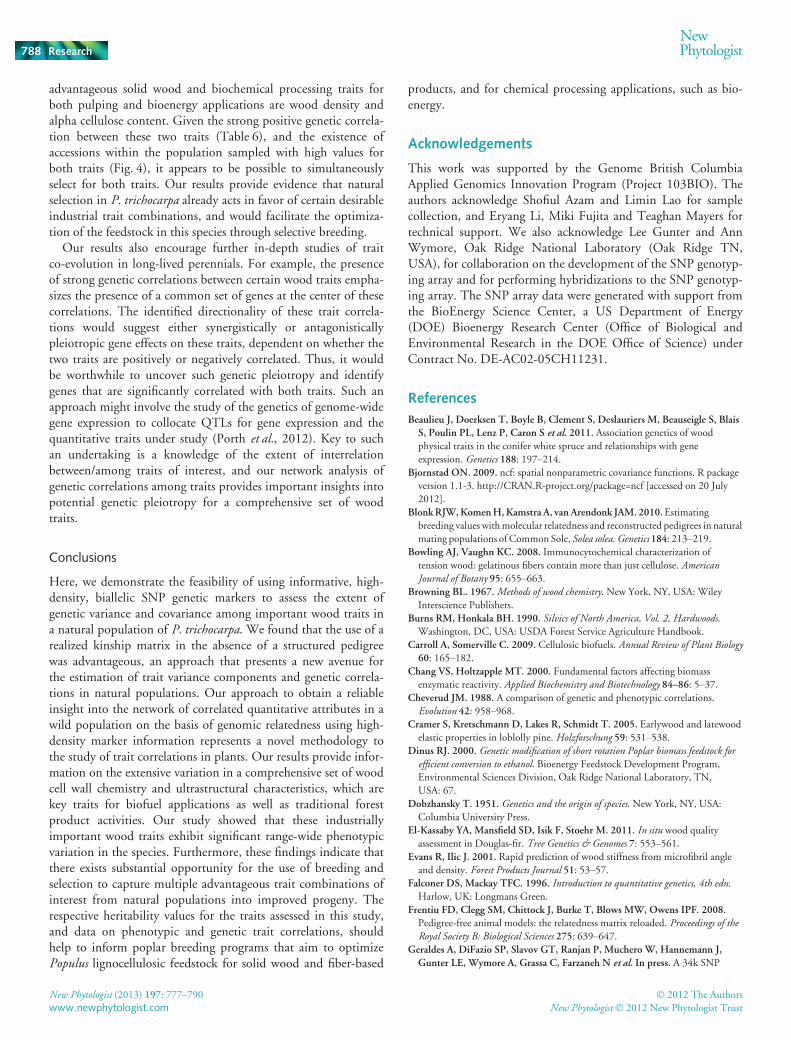
advantageous solid wood and biochemical processing traits forboth pulping and bioenergy applications are wood density andalpha cellulose content. Given the strong positive genetic correla-tion between these two traits (Table 6), and the existence ofaccessions within the population sampled with high values forboth traits (Fig. 4), it appears to be possible to simultaneouslyselect for both traits. Our results provide evidence that naturalselection in P. trichocarpa already acts in favor of certain desirableindustrial trait combinations, and would facilitate the optimiza-tion of the feedstock in this species through selective breeding.
Our results also encourage further in-depth studies of traitco-evolution in long-lived perennials. For example, the presenceof strong genetic correlations between certain wood traits empha-sizes the presence of a common set of genes at the center of thesecorrelations. The identified directionality of these trait correla-tions would suggest either synergistically or antagonisticallypleiotropic gene effects on these traits, dependent on whether thetwo traits are positively or negatively correlated. Thus, it wouldbe worthwhile to uncover such genetic pleiotropy and identifygenes that are significantly correlated with both traits. Such anapproach might involve the study of the genetics of genome-widegene expression to collocate QTLs for gene expression and thequantitative traits under study (Porth et al., 2012). Key to suchan undertaking is a knowledge of the extent of interrelationbetween/among traits of interest, and our network analysis ofgenetic correlations among traits provides important insights intopotential genetic pleiotropy for a comprehensive set of woodtraits.
Conclusions
Here, we demonstrate the feasibility of using informative, high-density, biallelic SNP genetic markers to assess the extent ofgenetic variance and covariance among important wood traits ina natural population of P. trichocarpa. We found that the use of arealized kinship matrix in the absence of a structured pedigreewas advantageous, an approach that presents a new avenue forthe estimation of trait variance components and genetic correla-tions in natural populations. Our approach to obtain a reliableinsight into the network of correlated quantitative attributes in awild population on the basis of genomic relatedness using high-density marker information represents a novel methodology tothe study of trait correlations in plants. Our results provide infor-mation on the extensive variation in a comprehensive set of woodcell wall chemistry and ultrastructural characteristics, which arekey traits for biofuel applications as well as traditional forestproduct activities. Our study showed that these industriallyimportant wood traits exhibit significant range-wide phenotypicvariation in the species. Furthermore, these findings indicate thatthere exists substantial opportunity for the use of breeding andselection to capture multiple advantageous trait combinations ofinterest from natural populations into improved progeny. Therespective heritability values for the traits assessed in this study,and data on phenotypic and genetic trait correlations, shouldhelp to inform poplar breeding programs that aim to optimizePopulus lignocellulosic feedstock for solid wood and fiber-based
products, and for chemical processing applications, such as bio-energy.
Acknowledgements
This work was supported by the Genome British ColumbiaApplied Genomics Innovation Program (Project 103BIO). Theauthors acknowledge Shofiul Azam and Limin Lao for samplecollection, and Eryang Li, Miki Fujita and Teaghan Mayers fortechnical support. We also acknowledge Lee Gunter and AnnWymore, Oak Ridge National Laboratory (Oak Ridge TN,USA), for collaboration on the development of the SNP genotyp-ing array and for performing hybridizations to the SNP genotyp-ing array. The SNP array data were generated with support fromthe BioEnergy Science Center, a US Department of Energy(DOE) Bioenergy Research Center (Office of Biological andEnvironmental Research in the DOE Office of Science) underContract No. DE-AC02-05CH11231.
References
Beaulieu J, Doerksen T, Boyle B, Clement S, Deslauriers M, Beauseigle S, Blais
S, Poulin PL, Lenz P, Caron S et al. 2011. Association genetics of woodphysical traits in the conifer white spruce and relationships with gene
expression. Genetics 188: 197–214.Bjornstad ON. 2009. ncf: spatial nonparametric covariance functions. R package
version 1.1-3. http://CRAN.R-project.org/package=ncf [accessed on 20 July
2012].
BlonkRJW,KomenH,Kamstra A, van Arendonk JAM. 2010.Estimating
breeding values withmolecular relatedness and reconstructed pedigrees in natural
mating populations of Common Sole, Solea solea.Genetics 184: 213–219.Bowling AJ, Vaughn KC. 2008. Immunocytochemical characterization of
tension wood: gelatinous fibers contain more than just cellulose. AmericanJournal of Botany 95: 655–663.
Browning BL. 1967.Methods of wood chemistry. New York, NY, USA: Wiley
Interscience Publishers.
Burns RM, Honkala BH. 1990. Silvics of North America, Vol. 2, Hardwoods.Washington, DC, USA: USDA Forest Service Agriculture Handbook.
Carroll A, Somerville C. 2009. Cellulosic biofuels. Annual Review of Plant Biology60: 165–182.
Chang VS, Holtzapple MT. 2000. Fundamental factors affecting biomass
enzymatic reactivity. Applied Biochemistry and Biotechnology 84–86: 5–37.Cheverud JM. 1988. A comparison of genetic and phenotypic correlations.
Evolution 42: 958–968.Cramer S, Kretschmann D, Lakes R, Schmidt T. 2005. Earlywood and latewood
elastic properties in loblolly pine. Holzforschung 59: 531–538.Dinus RJ. 2000. Genetic modification of short rotation Poplar biomass feedstock forefficient conversion to ethanol. Bioenergy Feedstock Development Program,
Environmental Sciences Division, Oak Ridge National Laboratory, TN,
USA: 67.
Dobzhansky T. 1951. Genetics and the origin of species. New York, NY, USA:
Columbia University Press.
El-Kassaby YA, Mansfield SD, Isik F, Stoehr M. 2011. In situ wood qualityassessment in Douglas-fir. Tree Genetics & Genomes 7: 553–561.
Evans R, Ilic J. 2001. Rapid prediction of wood stiffness from microfibril angle
and density. Forest Products Journal 51: 53–57.Falconer DS, Mackay TFC. 1996. Introduction to quantitative genetics, 4th edn.Harlow, UK: Longmans Green.
Frentiu FD, Clegg SM, Chittock J, Burke T, Blows MW, Owens IPF. 2008.
Pedigree-free animal models: the relatedness matrix reloaded. Proceedings of theRoyal Society B: Biological Sciences 275: 639–647.
Geraldes A, DiFazio SP, Slavov GT, Ranjan P, Muchero W, Hannemann J,
Gunter LE, Wymore A, Grassa C, Farzaneh N et al. In press. A 34k SNP
New Phytologist (2013) 197: 777–790 � 2012 The Authors
New Phytologist� 2012 New Phytologist Trustwww.newphytologist.com
Research
NewPhytologist788
genotyping array for Populus trichocarpa: design, application to the study of
natural populations and transferability to other Populus species.MolecularEcology Resources, in press.
Geraldes A, Pang J, Thiessen N, Cezard T, Moore R, Zhao Y, Tam A, Wang S,
Friedmann M, Birol I et al. 2011. SNP discovery in black cottonwood
(Populus trichocarpa) by population transcriptome resequencing.MolecularEcology Resources 11: 81–92.
Gilmour AR, Gogel BJ, Cullis BR, Welham SJ, Thompson R. 2002. ASRemluser guide release 1.0. Hemel Hempstead, UK: VSN International Ltd.
Henderson CR. 1976. Simple method for computing inverse of a numerator
relationship matrix used in prediction of breeding values. Biometrics 32:69–83.
Henderson CR. 1984. Applications of linear models in animal breeding. Guelph,
ON, Canada: University of Guelph.
Hendriks ATWM, Zeeman G. 2009. Pretreatments to enhance the digestibility
of lignocellulosic biomass. Bioresource Technology 100: 10–18.Hill WG, Goddard ME, Visscher PM. 2008. Data and theory point to mainly
additive genetic variance for complex traits. PLoS Genetics 4: e1000008.Hoffmann AA, Merila J. 1999.Heritable variation and evolution under
favourable and unfavourable conditions. Trends in Ecology and Evolution 14:96–101.
Houle D. 1992. Comparing evolvability and variability of quantitative traits.
Genetics 130: 195–204.Huntley SK, Ellis D, Gilbert M, Chapple C, Mansfield SD. 2003. Improved
pulping efficiency in C4H–F5H transformed poplar. Journal of Agriculturaland Food Chemistry 51: 6178–6183.
Jansson S, Douglas CJ. 2007. Populus: a model system for plant biology. AnnualReview of Plant Biology 58: 435–458.
Kirst M, Myburg AA, De Leon JPG, Kirst ME, Scott J, Sederoff R. 2004.
Coordinated genetic regulation of growth and lignin revealed by quantitative
trait locus analysis of cDNA microarray data in an interspecific backcross of
eucalyptus. Plant Physiology 135: 2368–2378.Kruuk LE. 2004. Estimating genetic parameters in natural populations using the
‘animal model’. Philosophical Transactions of the Royal Society London, B:Biological Sciences 359: 873–890.
Kumar R, Mago G, Balan V, Wyman CE. 2009. Physical and chemical
characterizations of corn stover and poplar solids resulting from leading
pretreatment technologies. Bioresource Technology 100: 3948–3962.Lande R, Arnold SJ. 1983. The measurement of selection on correlated
characters. Evolution 37: 1210–1226.Loiselle BA, Sork VL, Nason J, Graham C. 1995. Spatial genetic-structure of a
tropical understory shrub, Psychotria officinalis (Rubiaceae). American Journal ofBotany 82: 1420–1425.
Lynch M. 1999. Estimating genetic correlations in natural populations. GeneticalResearch 74: 255–264.
Mansfield SD. 2009. Solutions for dissolution – engineering cell walls fordeconstruction. Current Opinion in Biotechnology 20: 286–294.
Mansfield SD, Kang KY, Chapple C. 2012. Designed for deconstruction –Poplar trees altered in cell wall lignification improve the efficacy of bioethanol
production. New Phytologist 194: 91–101.Mansfield SD, Kibblewhite RP, Riddell MJC. 2004. Characterisation of the
reinforcement potential of different softwood Kraft fibres in softwood/
hardwood pulp mixtures.Wood and Fiber Science 36: 344–358.Mansfield SD, Mooney C, Saddler JN. 1999. Substrate and enzyme
characteristics that limit cellulose hydrolysis. Biotechnology Progress 15:804–816.
Mansfield SD, Parish R, Di Lucca CM, Goudie J, Kang KY, Ott P. 2009.
Revisiting the transition between juvenile and mature wood: a comparison of
fibre length, microfibril angle and relative wood density in lodgepole pine.
Holzforschung 63: 449–456.Mansfield SD, Parish R, Goudie JW, Kang KY, Ott P. 2007. The effects of
crown ratio on the transition from juvenile to mature wood production in
lodgepole pine in western Canada. Canadian Journal of Forest Research 37:1450–1459.
Mansfield SD, Weineisen H. 2007.Wood fibre quality and kraft pulping
efficiencies of trembling aspen (Populus tremuloidesMichx) clones. Journal ofWood Chemistry and Technology 27: 135–151.
Mellerowicz EJ, Gorshkova TA. 2012. Tensional stress generation in gelatinous
fibres: a review and possible mechanism based on cell-wall structure and
composition. Journal of Experimental Botany 63: 551–565.Mosier N, Wyman C, Dale B, Elander R, Lee YY, Holtzapple M, Ladisch M.
2005. Features of promising technologies for pretreatment of lignocellulosic
biomass. Bioresource Technology 96: 673–686.Nadaf J, Pong-Wong R. 2011. Applying different genomic evaluation approaches
on QTLMAS2010 dataset. BMC Proceedings 5(Suppl 3): S9.Nomura T. 2008. Estimation of effective number of breeders from molecular
coancestry of single cohort sample. Evolutionary Applications 1: 462–474.Novaes E, Osorio L, Drost DR, Miles BL, Boaventura-Novaes CRD, Benedict
C, Dervinis C, Yu Q, Sykes R, Davis M et al. 2009.Quantitative genetic
analysis of biomass and wood chemistry of Populus under different nitrogenlevels. New Phytologist 182: 878–890.
Oliehock PA, Windig JJ, van Arendonk JAM, Bijma P. 2006. Estimating
relatedness between individuals in general populations with a focus on their use
in conservation programs. Genetics 173: 483–496.Pliura A, Zhang SY, MacKay J, Bousquet J. 2007. Genotypic variation in wood
density and growth traits of poplar hybrids at four clonal trials. Forest Ecologyand Management 238: 92–106.
Poke FS, Potts BM, Vaillancourt RE, Raymond CA. 2006. Genetic parameters
for lignin, extractives and decay in Eucalyptus globulus. Annals of Forest Science63: 813–821.
Porth I, White R, Jaquish B, Alfaro R, Ritland C, Ritland K. 2012. Genetical
genomics identifies the genetic architecture for growth and weevil resistance in
spruce. PLoS ONE 7: e44397.
Pot D, Chantre G, Rozenberg P, Rodrigues JC, Jones GL, Pereira H, Hannrup
B, Cahalan C, Plomion C. 2002.Genetic control of pulp and timber properties
in maritime pine (Pinus pinaster Ait.). Annals of Forest Science 59: 563–575.Price T, Schluter D. 1991.On the low heritability of life-history traits. Evolution45: 853–861.
Ralph SG, Chun HJE, Cooper D, Kirkpatrick R, Kolosova N, Gunter L,
Tuskan GA, Douglas CJ, Holt RA, Jones SJM et al. 2008. Analysis of 4,664high-quality sequence-finished poplar full-length cDNA clones and their utility
for the discovery of genes responding to insect feeding. BMC Genomics 9: 57.Ritland K. 1996. Estimators for pairwise relatedness and individual inbreeding
coefficients. Genetical Research 67: 175–185.Ritland K, Ritland C. 1996. Inferences about contrast quantitative inheritance
based on natural population structure in the yellow monkeyflower,Mimulusguttatus. Evolution 50: 1074–1082.
Robinson AR, Mansfield SD. 2009. Rapid analysis of poplar lignin monomer
composition by a streamlined thioacidolysis procedure and near-infrared
reflectance-based prediction modeling. Plant Journal 58: 706–714.Sannigrahi P, Ragauskas AJ, Tuskan GA. 2010. Poplar as a feedstock for
biofuels: a review of compositional characteristics. Biofuels, Bioproducts &Biorefining-Biofpr 4: 209–226.
Semple DE, Vaillant MH, Kang KY, Oh SW, Smith GD, Mansfield SD. 2007.
Evaluating the suitability of hybrid poplar clones for the manufacture of
oriented strand boards. Holzforschung 61: 430–438.Sgro CM, Hoffmann AA. 2004. Genetic correlations, tradeoffs and
environmental variation. Heredity 93: 241–248.Shen H, He X, Poovaiah CR, Wuddineh WA, Ma J, Mann DGJ, Wang H,
Jackson L, Tang Y, Stewart CN et al. 2011. Functional characterization of the
switchgrass (Panicum virgatum) R2R3-MYB transcription factor PvMYB4 for
improvement of lignocellulosic feedstocks. New Phytologist 193: 121–136.Slavov GT, DiFazio SP, Martin J, Schackwitz W, Muchero W, Rodgers-
Melnick E, Lipphardt MF, Pennacchio CP, Hellsten U, Pennacchio L et al.2012. Genome resequencing reveals multiscale geographic structure and
extensive linkage disequilibrium in the forest tree Populus trichocarpa. NewPhytologist 196: 713–725.
Soolanayakanahally RY, Guy RD, Silim SN, Drewes EC, Schroeder WR. 2009.
Enhanced assimilation rate and water use efficiency with latitude through
increased photosynthetic capacity and internal conductance in balsam poplar
(Populus balsamifera L.). Plant, Cell & Environment 32: 1821–1832.Stackpole DJ, Vaillancourt RE, Alves A, Rodrigues J, Potts BM. 2011. Genetic
variation in the chemical components of Eucalyptus globulus wood. G3: Genes,Genomes, Genetics 1: 151–159.
� 2012 The Authors
New Phytologist� 2012 New Phytologist TrustNew Phytologist (2013) 197: 777–790
www.newphytologist.com
NewPhytologist Research 789
Stewart JJ, Akiyama T, Chapple CC, Ralph J, Mansfield SD. 2009. The effects
on lignin structure of over-expression of ferulate 5-hydroxylase in hybrid
poplar. Plant Physiology 150: 621–635.Stewart JJ, Kadla JF, Mansfield SD. 2006. The influence of lignin chemistry and
ultrastructure on the pulping efficiency of clonal aspen (Populus tremuloidesMichx.). Holzforschung 60: 111–122.
Studer MH, DeMartini JD, Davis MF, Sykes RW, Davison B, Keller M,
Tuskan GA, Wyman CE. 2011. Lignin content in natural Populus variantsaffects sugar release. Proceedings of the National Academy of Sciences, USA 108:
6300–6305.Thumma BR, Southerton SG, Bell JC, Owen JV, Henery ML, Moran GF.
2010.Quantitative trait locus (QTL) analysis of wood quality traits in
Eucalyptus nitens. Tree Genetics & Genomes 6: 305–317.Tuskan GA, DiFazio S, Jansson S, Bohlmann J, Grigoriev I, Hellsten U,
Putnam N, Ralph S, Rombauts S, Salamov A et al. 2006. The genome of
black cottonwood, Populus trichocarpa (Torr. & Gray). Science 313: 1596–1604.
Ukrainetz NK, Kang KY, Aitken SN, Stoehr M, Mansfield SD. 2008.
Heritability, phenotypic and genetic correlations of coastal Douglas-fir
(Pseudotsuga menziesii) wood quality traits. Canadian Journal of Forest Research38: 1536–1546.
Van de Casteele T, Galbusera P, Matthysen E. 2001. A comparison of
microsatellite-based pairwise relatedness estimators.Molecular Ecology 10:1539–1549.
VanRaden PM. 2008. Efficient methods to compute genomic predictions.
Journal of Dairy Science 91: 4414–4423.Visscher PM, Hill WG, Wray NR. 2008.Heritability in the genomics era –concepts and misconceptions. Nature Reviews Genetics 9: 255–266.
Vonk CG. 1973. Computerization of Rulands X-ray method for
determinationof crystallinity in polymers. Journal of Applied Crystallography6: 148–152.
Waitt DE, Levin DA. 1998. Genetic and phenotypic correlations in plants: a
botanical test of Cheverud’s conjecture. Heredity 80: 310–319.Wegrzyn JL, Eckert AJ, Choi M, Lee JM, Stanton BJ, Sykes R, Davis MF, Tsai
CJ, Neale DB. 2010. Association genetics of traits controlling lignin and
cellulose biosynthesis in black cottonwood (Populus trichocarpa, Salicaceae)secondary xylem. New Phytologist 188: 515–532.
Xie CY, Ying CC, Yanchuk AD, Holowachuk DL. 2009. Ecotypic mode of
regional differentiation caused by restricted gene migration: a case in black
cottonwood (Populus trichocarpa) along the Pacific Northwest coast. CanadianJournal of Forest Research 39: 519–526.
Yanchuk AD, Dancik BP, Micko MM. 1984. Variation and heritability of wood
density and fiber length of trembling aspen in Alberta, Canada. Silvae Genetica33: 11–16.
Yu JM, Pressoir G, Briggs WH, Bi IV, Yamasaki M, Doebley JF, McMullen
MD, Gaut BS, Nielsen DM, Holland JB et al. 2006. A unified mixed-model
method for association mapping that accounts for multiple levels of relatedness.
Nature Genetics 38: 203–208.Yuan JS, Tiller KH, Al-Ahmad H, Stewart NR, Stewart CN Jr. 2008. Plants to
power: bioenergy to fuel the future. Trends in Plant Science 13: 421–429.Zhang P, Wu F, Kan X. 2012. Genotypic variation in wood properties and
growth traits of triploid hybrid clones of Populus tomentosa at three clonal trials.Tree Genetics & Genomes 8: 1041–1050.
Supporting Information
Additional supporting information may be found in the onlineversion of this article.
Table S1. Genotypes for 9342 single nucleotide polymorphism(SNP) loci in 334 Populus trichocarpa accessions used to constructa kinship matrix
Please note: Wiley-Blackwell are not responsible for the contentor functionality of any supporting information supplied by theauthors. Any queries (other than missing material) should bedirected to the New Phytologist Central Office.
New Phytologist is an electronic (online-only) journal owned by the New Phytologist Trust, a not-for-profit organization dedicatedto the promotion of plant science, facilitating projects from symposia to free access for our Tansley reviews.
Regular papers, Letters, Research reviews, Rapid reports and both Modelling/Theory and Methods papers are encouraged. We are committed to rapid processing, from online submission through to publication ‘as ready’ via Early View – our average timeto decision is <25 days. There are no page or colour charges and a PDF version will be provided for each article.
The journal is available online at Wiley Online Library. Visit www.newphytologist.com to search the articles and register for tableof contents email alerts.
If you have any questions, do get in touch with Central Office ([email protected]) or, if it is more convenient,our USA Office ([email protected])
For submission instructions, subscription and all the latest information visit www.newphytologist.com
New Phytologist (2013) 197: 777–790 � 2012 The Authors
New Phytologist� 2012 New Phytologist Trustwww.newphytologist.com
Research
NewPhytologist790