A physical map of the highly heterozygous Populus genome: integration with the genome sequence and...
16
A physical map of the highly heterozygous Populus genome: integration with the genome sequence and genetic map and analysis of haplotype variation Colin T. Kelleher 1 , Readman Chiu 2 , Heesun Shin 2 , Ian E. Bosdet 2 , Martin I. Krzywinski 2 , Chris D. Fjell 2 , Jennifer Wilkin 1 , TongMing Yin 3 , Stephen P. DiFazio 3,† , Johar Ali 2 , Jennifer K. Asano 2 , Susanna Chan 2 , Alison Cloutier 2 , Noreen Girn 2 , Stephen Leach 2 , Darlene Lee 2 , Carrie A. Mathewson 2 , Teika Olson 2 , Katie O’Connor 2 , Anna-Liisa Prabhu 2 , Duane E. Smailus 2 , Jeffery M. Stott 2 , Miranda Tsai 2 , Natasja H. Wye 2 , George S. Yang 2 , Jun Zhuang 1 , Robert A. Holt 2 , Nicholas H. Putnam 4 , Julia Vrebalov 5 , James J. Giovannoni 5 , Jane Grimwood 6 , Jeremy Schmutz 6 , Daniel Rokhsar 4 , Steven J.M. Jones 2 , Marco A. Marra 2 , Gerald A. Tuskan 3 , Jo ¨ rg Bohlmann 1,7,8 , Brian E. Ellis 1 , Kermit Ritland 7 , Carl J. Douglas 8,* and Jacqueline E. Schein 2 1 Michael Smith Laboratories, University of British Columbia, Vancouver, BC V6T 1Z3, Canada, 2 Genome Sciences Centre, 100-570 West 7th Avenue, Vancouver, BC V5Z 4S6, Canada, 3 Environmental Sciences Division, Oak Ridge National Laboratory, Oak Ridge, TN 37831-6422, USA, 4 US Department of Energy Joint Genome Institute, 2800 Mitchell Drive, Walnut Creek, CA 94598, USA, 5 Boyce Thompson Institute for Plant Research, Cornell University, Ithaca, NY 14853, USA, 6 Department of Developmental Biology, Stanford University School of Medicine, Stanford, CA 94305-5329, USA, 7 Department of Forest Sciences, University of British Columbia, Vancouver, BC, V6T 1Z4, Canada, and 8 Department of Botany, University of British Columbia, Vancouver, BC V6T 1Z4, Canada Received 1 October 2006; revised 9 February 2007; accepted 23 February 2007. * For correspondence (fax +1 604 822 6089; e-mail [email protected]). † Present address: Department of Biology, West Virginia University, Morgantown, WV 26506, USA. Summary As part of a larger project to sequence the Populus genome and generate genomic resources for this emerging model tree, we constructed a physical map of the Populus genome, representing one of the few such maps of an undomesticated, highly heterozygous plant species. The physical map, consisting of 2802 contigs, was constructed from fingerprinted bacterial artificial chromosome (BAC) clones. The map represents approxi- mately 9.4-fold coverage of the Populus genome, which has been estimated from the genome sequence assembly to be 485 10 Mb in size. BAC ends were sequenced to assist long-range assembly of whole- genome shotgun sequence scaffolds and to anchor the physical map to the genome sequence. Simple sequence repeat-based markers were derived from the end sequences and used to initiate integration of the BAC and genetic maps. A total of 2411 physical map contigs, representing 97% of all clones assigned to contigs, were aligned to the sequence assembly (JGI Populus trichocarpa, version 1.0). These alignments represent a total coverage of 384 Mb (79%) of the entire poplar sequence assembly and 295 Mb (96%) of linkage group sequence assemblies. A striking result of the physical map contig alignments to the sequence assembly was the co-localization of multiple contigs across numerous regions of the 19 linkage groups. Targeted sequencing of BAC clones and genetic analysis in a small number of representative regions showed that these co-aligning contigs represent distinct haplotypes in the heterozygous individual sequenced, and revealed the nature of these haplotype sequence differences. Keywords: Populus trichocarpa, physical map, genome integration, BAC end sequences, poplar genomics, haplotype diversity. Introduction Black cottonwood (Populus trichocarpa Torr. & Gray) is a genetically highly variable outbreeding tree species that primarily inhabits floodplains and river margins. It is wind- pollinated and propagates sexually through minute wind- borne seeds, often dispersed long distances along river corridors (Braatne et al., 1996; Farmer, 1996). The species ª 2007 The Authors 1063 Journal compilation ª 2007 Blackwell Publishing Ltd The Plant Journal (2007) 50, 1063–1078 doi: 10.1111/j.1365-313X.2007.03112.x
-
Upload
independent -
Category
Documents
-
view
0 -
download
0
Transcript of A physical map of the highly heterozygous Populus genome: integration with the genome sequence and...

A physical map of the highly heterozygous Populus genome:integration with the genome sequence and genetic map andanalysis of haplotype variation
Colin T. Kelleher1, Readman Chiu2, Heesun Shin2, Ian E. Bosdet2, Martin I. Krzywinski2, Chris D. Fjell2, Jennifer Wilkin1,
TongMing Yin3, Stephen P. DiFazio3,†, Johar Ali2, Jennifer K. Asano2, Susanna Chan2, Alison Cloutier2, Noreen Girn2, Stephen
Leach2, Darlene Lee2, Carrie A. Mathewson2, Teika Olson2, Katie O’Connor2, Anna-Liisa Prabhu2, Duane E. Smailus2, Jeffery M.
Stott2, Miranda Tsai2, Natasja H. Wye2, George S. Yang2, Jun Zhuang1, Robert A. Holt2, Nicholas H. Putnam4, Julia Vrebalov5,
James J. Giovannoni5, Jane Grimwood6, Jeremy Schmutz6, Daniel Rokhsar4, Steven J.M. Jones2, Marco A. Marra2, Gerald A.
Tuskan3, Jorg Bohlmann1,7,8, Brian E. Ellis1, Kermit Ritland7, Carl J. Douglas8,* and Jacqueline E. Schein2
1Michael Smith Laboratories, University of British Columbia, Vancouver, BC V6T 1Z3, Canada,2Genome Sciences Centre, 100-570 West 7th Avenue, Vancouver, BC V5Z 4S6, Canada,3Environmental Sciences Division, Oak Ridge National Laboratory, Oak Ridge, TN 37831-6422, USA,4US Department of Energy Joint Genome Institute, 2800 Mitchell Drive, Walnut Creek, CA 94598, USA,5Boyce Thompson Institute for Plant Research, Cornell University, Ithaca, NY 14853, USA,6Department of Developmental Biology, Stanford University School of Medicine, Stanford, CA 94305-5329, USA,7Department of Forest Sciences, University of British Columbia, Vancouver, BC, V6T 1Z4, Canada, and8Department of Botany, University of British Columbia, Vancouver, BC V6T 1Z4, Canada
Received 1 October 2006; revised 9 February 2007; accepted 23 February 2007.*For correspondence (fax +1 604 822 6089; e-mail [email protected]).†Present address: Department of Biology, West Virginia University, Morgantown, WV 26506, USA.
Summary
As part of a larger project to sequence the Populus genome and generate genomic resources for this emerging
model tree, we constructed a physical map of the Populus genome, representing one of the few such maps of
an undomesticated, highly heterozygous plant species. The physical map, consisting of 2802 contigs, was
constructed from fingerprinted bacterial artificial chromosome (BAC) clones. The map represents approxi-
mately 9.4-fold coverage of the Populus genome, which has been estimated from the genome sequence
assembly to be 485 � 10 Mb in size. BAC ends were sequenced to assist long-range assembly of whole-
genome shotgun sequence scaffolds and to anchor the physical map to the genome sequence. Simple
sequence repeat-based markers were derived from the end sequences and used to initiate integration of the
BAC and genetic maps. A total of 2411 physical map contigs, representing 97% of all clones assigned to contigs,
were aligned to the sequence assembly (JGI Populus trichocarpa, version 1.0). These alignments represent a
total coverage of 384 Mb (79%) of the entire poplar sequence assembly and 295 Mb (96%) of linkage group
sequence assemblies. A striking result of the physical map contig alignments to the sequence assembly was
the co-localization of multiple contigs across numerous regions of the 19 linkage groups. Targeted sequencing
of BAC clones and genetic analysis in a small number of representative regions showed that these co-aligning
contigs represent distinct haplotypes in the heterozygous individual sequenced, and revealed the nature of
these haplotype sequence differences.
Keywords: Populus trichocarpa, physical map, genome integration, BAC end sequences, poplar genomics,
haplotype diversity.
Introduction
Black cottonwood (Populus trichocarpa Torr. & Gray) is a
genetically highly variable outbreeding tree species that
primarily inhabits floodplains and river margins. It is wind-
pollinated and propagates sexually through minute wind-
borne seeds, often dispersed long distances along river
corridors (Braatne et al., 1996; Farmer, 1996). The species
ª 2007 The Authors 1063Journal compilation ª 2007 Blackwell Publishing Ltd
The Plant Journal (2007) 50, 1063–1078 doi: 10.1111/j.1365-313X.2007.03112.x

extends through approximately 30 degrees of latitude along
western North America, and ranges inland to the Rocky
Mountains (Burns and Honkala, 1990). Populus (poplar)
species are economically important crops in temperate cli-
mates throughout the world for a variety of purposes,
including wood pulp, paper and biomass, and for use in
phyto-remediation and waste water treatment.
Because of its relatively small genome size (485 Mb), the
availability of genetic and genomic resources, and ease of
propagation and genetic manipulation, Populus provides a
useful model system to study a number of biological
processes of importance to woody perennial plants, such
as dormancy, secondary xylem (wood) development, meta-
bolism and responses to environmental stress (Strauss and
Martin, 2004; Taylor, 2002). As commercial species, poplars
are of most interest with respect to wood production, and
Populus has thus been the focus of numerous studies
examining the molecular biology of wood and secondary
wall formation (Plomion et al., 2001; Schrader et al., 2004;
Sterky et al., 1998, 2004). Poplar hybrids, such as P. tricho-
carpa · P. deltoides L., grow much faster than either paren-
tal species alone, and are widely used in plantations as a
fast-growing source of wood and fiber. In terms of its
ecological adaptation, poplar is also a valuable study
subject. For example, due to its size and longevity, poplar
provides an ideal system to study spatial and temporal
patterns of local and systemic defenses against herbivores
(Arimura et al., 2004). A large number of genetic adaptations
are likely to explain its ecological success over broad
geographical and climatic ranges (Cronk, 2005). It forms
hybrid zones with multiple sympatric species from the
Tacamahaca and Aigeiros sections of the genus (Eckenwal-
der, 1996), making it useful for studying factors involved in
species distinction and the biological species concept
(Rieseberg et al., 1999).
To further expand the use of Populus as a model woody
perennial species, the development of genomic tools and
resources is essential. Primary among those recently made
available is the full Populus genome sequence, derived from
a wild P. trichocarpa individual (named Nisqually-1), and the
accompanying genome annotation (Tuskan et al., 2006). A
multitude of additional resources, including controlled cross
populations, cross-species molecular markers, EST collec-
tions and full-length cDNAs, have been developed and
employed to further poplar genomics (Ralph et al., 2006;
Strauss and Martin, 2004; Tuskan et al., 2006). Populus has
been used extensively in experimental and population
biology studies, and dense genetic maps are available for
a number of species within the genus (Cervera et al., 2001;
Yin et al., 2004). With the growth in available resources,
Populus is becoming increasingly attractive as a model
organism for tree biology (Tuskan et al., 2004a).
Clone-based physical maps have been shown to be useful
in providing a framework to aid in the generation and
validation of genome sequence assemblies and as a valu-
able resource for map-based cloning (Chen et al., 2002;
Gregory et al., 2002; Krzywinski et al., 2004; McPherson
et al., 2001; Mozo et al., 1999; Nelson et al., 2005; Wallis
et al., 2004). To enhance the resources available for poplar
genomics and to assist assembly of the poplar whole-
genome shotgun sequence and its integration with the
genetic map, we undertook the generation of a poplar
physical map by large-scale fingerprinting of a bacterial
artificial chromosome (BAC) library. The library was con-
structed using DNA from the P. trichocarpa Nisqually-1
individual and so has exact correspondence with the DNA
used for the genome sequence assembly. In physical map
construction, similarities in large insert clone fingerprint
patterns are used to identify clones derived from overlap-
ping regions of the genome, and this information is used to
create a series of ordered, overlapping clones representing
contiguous genomic regions (contigs). End sequence reads
from physical map clones [e.g. BAC end sequence (BES)
reads] can be used to align physical map contigs to
sequence assemblies, thereby integrating physical maps to
the genome sequence. The integration of genetic and
physical maps has also been shown to be a useful genomic
resource for map-based cloning (Chen et al., 2002).
Poplar presents a particular challenge for physical map-
ping and genome sequencing efforts due to its high level of
heterozygosity and its gene and genome duplications
(Sterck et al., 2005; Tuskan et al., 2006). These two phenom-
ena (heterozygosity and duplication) could confound both
sequence and fingerprint contig assembly. A high level of
heterozygosity could lead to independent assembly of
haplotypes in hyper-variable genomic regions. Likewise,
duplicated regions could lead to mis-assembly due to the
presence of genomic regions of high sequence similarity at
multiple locations within the genome. Other plant species
subject to physical mapping efforts to date include Arabid-
opsis (Mozo et al., 1999), maize (Fang et al., 2003; Nelson
et al., 2005), rice (Chen et al., 2002) and soybean (Wu et al.,
2004). Maize, rice and soybean have undergone consider-
able domestication and inbreeding, which has led to a more
homogenized genetic complement (Buckler et al., 2001;
Wang et al., 1999), and Arabidopsis is an inbreeding species
with consequent low heterozygosity (Abbott and Gomes,
1989; Bustamante et al., 2002). In contrast, Populus is an
obligate dioecious outcrosser, with high levels of gene flow
due its wind-pollinated habit. Analysis of 4.2 million
phred 20 shotgun sequence end reads used for the P. tricho-
carpa Nisqually-1 genome assembly supports the high level
of heterozygosity and haplotype diversity in the Nisqually-1
individual, with an overall rate of approximately 2.6 poly-
morphisms (SNPs and insertion/deletions) per kb (Tuskan
et al., 2006).
In this paper, we report generation of the poplar BAC
fingerprint physical map, tanchoring of the physical map to
1064 Colin T. Kelleher et al.
ª 2007 The AuthorsJournal compilation ª 2007 Blackwell Publishing Ltd, The Plant Journal, (2007), 50, 1063–1078

the sequence assembly through BES alignments, and
integration of the genetic and physical maps using markers
common to both. Unexpectedly, alignment of physical map
contigs onto the poplar genome sequence assembly
revealed a consistent pattern of co-aligning BAC contigs.
These were presumed to represent haplotypes, a finding
confirmed by genetic analysis of representative examples.
Targeted sequencing of representative BAC clones uncov-
ered the details of extensive indel and SNP haplotype
polymorphisms within this P. trichocarpa individual, but
the haplotypes sequences were otherwise co-linear, and we
found no evidence of haplotype-specific gene complements,
as has been found in maize. The physical map and its
integration with the poplar genome and genetic map are
core resources important in establishing poplar as a model
system for tree biology.
Results
BAC library and fingerprint map assembly
A BAC library of 48 384 clones created from the Nisqually-1
individual was used to construct the physical map. The BACs
were fingerprinted with HindIII, and successful fingerprints
were obtained for 46 025 (95%) of the clones. On average,
fingerprints contained 31 restriction fragments within the
range of 600–30 000 bp. The average insert size of the
clones, based on the fingerprint data, was 100 kb, thus the
fingerprinted clones represented approximately 9.4-fold
coverage of the 485 � 10 Mb Populus genome, as estimated
from the genome sequence (Tuskan et al., 2006).
An initial automated assembly of the clone fingerprints
was performed using FPC (fingerprinted contigs) software
(Soderlund et al., 1997, 2000). This assembly was performed
at relatively high stringency to avoid binning together clones
from unrelated regions of the genome. All contigs contain-
ing >10 clones (representing approximately 40% of all clones
in contigs) were manually edited to refine the clone order
derived by FPC, using clone and contig editing tools
available within the FPC software. During this process, a
total of 515 clones were identified as having fingerprints
resulting from either cross-well contamination or partial
enzyme digestion, and these were removed from the
available clone set. Contig merges were performed manu-
ally where supported by the fingerprint data. Contigs with
£10 clones had their clone order refined using our automa-
ted contig ordering application, CORAL (Flibotte et al., 2004),
which became available after manual editing had been
partially completed. During the manual review phase, we
identified small subsets of overlapping clones internal to
some contigs that, while otherwise highly similar in their
restriction fragment patterns to their closest neighbors in the
contig, contained restriction fragment pattern irregularities
in the form of missing and extra fragments. These irregular
fragments were commonly shared within the small subset of
clones but not with the larger group of clones in the contig,
suggesting underlying, biologically relevant DNA differ-
ences. These clones potentially represented restriction frag-
ment differences resulting from sequence polymorphisms
between the two parental haplotypes (i.e. the same genomic
region), or clones containing duplicated or repetitive ge-
nomic sequences (i.e. similar sequence but from different
regions of the genome). In the absence of any orthogonal
evidence suggesting the underlying nature of the observed
differences, and wishing to avoid potentially collapsing
independent regions of the genome into the same map
contig, we removed these clone subsets from the larger
contigs and placed them into independent contigs.
Following completion of manual editing of the largest
contigs and automated clone ordering for the remaining
contigs, automated scripts were employed to compare
clones at contig ends to identify additional contig merges.
This was performed at a reduced stringency from that of the
initial fingerprint assembly. Seven rounds of automated
merging were performed with varying parameters for
required fingerprint similarity at the merge point (see
Experimental procedures). This included two rounds in
which singleton clones (those that did not assemble into
contigs with the parameters used for the initial automated
assembly) were assessed for their potential to bridge contigs
that otherwise would have insufficient similarity between
their end clones to permit a merge, and one round in which
contigs with £3 clones were inserted internally into larger
contigs where supported by fingerprint similarity. Following
each round of merging, a subset of the merges was
manually reviewed to ensure the parameters were suffi-
ciently stringent to prevent incorrect merges being per-
formed. At the end of this process, the map consisted of 3471
contigs. On average, contigs contained 11 clones, ranging
from 2 to 128 clones per contig (excluding a single excep-
tional contig containing >1000 clones, described below).
When the sequence assembly became available (September
2004, JGI Populus trichocarpa, version 1.0), additional con-
tig merges were performed based on supporting evidence
from the BES alignments to the sequence scaffolds (see
below and Experimental procedures).
BAC end sequencing
To facilitate integration of the BAC map with both the Pop-
ulus sequence assembly and genetic maps, end reads were
obtained from the clones in the BAC library. A total of 81 904
BES reads passed quality filters (see Experimental proce-
dures), with an average phred 20 (Ewing and Green, 1998;
Ewing et al., 1998) read length of 504 bp, corresponding to
more than 41 Mb of poplar genomic DNA sequence, nearly
10% of the total genome size. These reads represented
44 422 BAC clones, 37 482 (84%) of which had reads from
Physical mapping of the Populus genome 1065
ª 2007 The AuthorsJournal compilation ª 2007 Blackwell Publishing Ltd, The Plant Journal, (2007), 50, 1063–1078

both ends. The BESs provided a clone-linked sequence re-
source for use in aligning BACs to the genomic sequence
and for identification of simple sequence repeats (SSRs) to
be used in genetic mapping experiments. In addition, the
BESs were employed during assembly of the Populus gen-
ome sequence, providing a powerful aid to long-range
contiguity of the assembled scaffolds (Tuskan et al., 2006).
The availability of the BESs also allowed us to decipher
the nature of one unusual contig in the physical map. This
contig contains 1271 clones, approximately 10 times more
than the 128 clones in the next-most populated contig, and
well above the map average of 11 clones per contig. The vast
majority of these clones are entirely redundant, suggesting
that they potentially represent a duplicated sequence within
the genome or cloning bias resulting in the over-represen-
tation of a small genomic region. Analysis of BESs derived
from clones in this contig showed that they had high
similarity to Arabidopsis and poplar chloroplast DNA, sug-
gesting that the genomic DNA used in the construction of
the BAC library was contaminated with chloroplast DNA,
and that BAC clones derived from the chloroplast DNA had
assembled into a deeply redundant contig in the map. This
phenomenon was also encountered during genome sequen-
cing efforts, where it was revealed that, in some of the DNA
libraries used, the poplar total genomic DNA was contam-
inated with chloroplast genome DNA, leading to separate
assembly of the poplar chloroplast genome at a very high
level of sequence depth (Tuskan et al., 2006).
Integration of genetic and physical maps
To anchor the physical map to poplar genetic maps, we used
a P. trichocarpa Nisqually-1 genetic map based on simple
sequence repeat (SSR) and AFLP (amplified fragment length
polymorphisms) markers in a pedigree (family 545) in which
Nisqually-1 was the female parent. The SSR markers were
primarily developed from the BES reads. The remaining ten
SSRs have been used in other poplar genetic map studies
(Cervera et al., 2001; van der Schoot et al., 2000; Tuskan
et al., 2004b; Yin et al., 2004) or were designed from
assembled shotgun sequence. In total, 122 BES-derived
SSRs were used for construction of the Nisqually-1 genetic
map. In addition, 123 dominant AFLP markers (Vos et al.,
1995) were added to the genetic mapping analysis. This
map, and a consensus Populus map derived from merges
with maps derived from other Populus pedigrees, including
P. trichocarpa family 13 (Yin et al., 2004) will be described in
detail elsewhere (T. Yin et al., unpublished).
We evaluated use of the in silico identified SSRs derived
from the BESs as genetic markers for the purpose of
integrating the physical map contigs onto the family 545
genetic map. This evaluation was based solely on markers
from the Nisqually-1 pedigree. SSRs were selected based on
contig size to map large physical map contigs to the genetic
map. From the 122 BES-derived SSRs on the genetic map,
119 of the corresponding contigs were mapped to the
Nisqually-1 pedigree (family 545). An example of this
physical–genetic map integration is shown in Figure 1 for
LG X. Table 1 summarizes the total number of contigs
mapped onto family 545 using BES-derived SSRs and the
percentage of each LG covered by the contigs. The average
contig coverage of the LGs using these SSRs alone was 22%,
a significant percentage given the relatively small number of
SSRs tested. Given the success of this approach, we next
evaluated a much larger pool of 3506 potential SSR markers,
derived from in silico analysis of BESs. Of these, 1769 passed
the BLAST criteria, based on primer sequence alignment to
the LG sequence assembly, and 352 were mapped in family
13 while 392 failed mapping. These data will be presented in
detail elsewhere (T. Yin et al., unpublished). Given the
success of mapping physical map contigs to LGs using the
BES-derived SSRs (Figure 1 and Table 1), and the 50%
success rate of mapping additional BES-derived SSRs, it
would be possible to anchor a substantial fraction of
physical map contigs to the genetic map using the larger
set of BES-derived SSR markers. However, due to parallel
work on aligning the physical map and the genome
sequence assembly, we decided to concentrate on a more
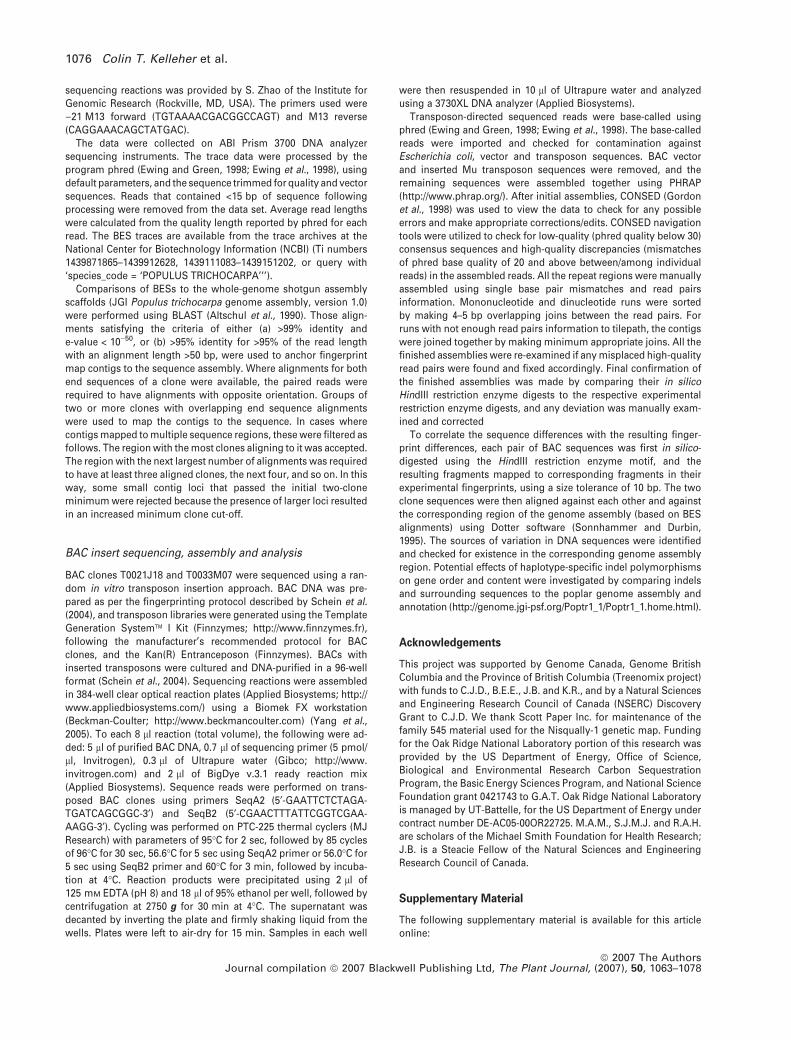
Figure 1. The position of physical map contigs on the LG X genetic map.
Individual contigs are represented as different colored sections along the
linkage group. Contigs were mapped to the LGs using BES-derived SSRs
(markers beginning with G). Approximately 29% of the LG is covered by the
contigs.
1066 Colin T. Kelleher et al.
ª 2007 The AuthorsJournal compilation ª 2007 Blackwell Publishing Ltd, The Plant Journal, (2007), 50, 1063–1078

high-throughput and automated approach to linking the
physical map and the genome assembly – namely, align-
ment through BESs.
Alignment of the BAC map to the genome sequence
assembly
Alignment of the BESs to version 1.0 of the JGI Populus
trichocarpa assembly (http://genome.jgi-psf.org/Poptr1/
Poptr1.home.html) enabled large-scale integration of the
physical map with the genome sequence. A total of 73 374
end sequence reads derived from 42 809 unique clones
passed the alignment filters (see Experimental procedures).
A total of 34 770 clones (76% of all map clones) had
informative BES alignments, of which 22 526 (65% of clones
with informative reads) had paired-end alignments. Using
these clone alignments, we positioned the contigs on the
genome sequence assembly. Examination of the order and
orientation of the map contigs with respect to the sequence
assembly identified adjacent map contigs with closely jux-
taposed assembly coordinates, indicating candidate contig
merges that had not met the stringency requirements for
automated merges based on fingerprint similarities alone
(probably due to insufficient overlap between the contig
ends). With the supporting sequence coordinate evidence,
and where substantiated by the fingerprint data, these
merges were performed, producing a final map with 2802
contigs and 5746 singletons. The average contig size is
466 kb, with some contigs larger than 1 Mb. The distribution
of fingerprint contig sizes is shown in Figure 2.
A total of 2226 of the 2802 contigs aligned to unique
regions in the genome assembly. An additional 185 contigs
mapped to multiple sequence regions, with the majority of
these (87%) mapping to two regions. The remaining 391
contigs could not be positioned on the sequence assembly
using our criteria. Thus, 86% of the physical map contigs
were aligned to the genome sequence assembly, and these
contigs contained 97% of all clones assigned to map contigs.
The scaffolds in the version 1.0 Populus genome assem-
bly (Tuskan et al., 2006; Yin et al., unpublished) contain in
total 485 Mb of genomic DNA, of which 308 Mb are
anchored to the 19 Populus LG assemblies. BAC contigs
aligned to the genome sequence represent 384 Mb (79%) of
the entire assembled poplar sequence and 295 Mb (96%) of
the LG assemblies. As shown in Table 2, all LG assemblies
with the exception of LG XIX have >90% coverage in the BAC
map, based on the contig alignments. A graphical display of
the contig alignment results for all 19 LGs is provided in
Figure S1. An example of this display, showing LG X, is
provided in Figure 3. In a small number of cases, contigs
were mapped to two genomic regions within a linkage group
(represented by internal arcs linking contigs in Figure 3 and
Figure S1). These could potentially indicate regions of
repetitive DNA or genome duplication. They may also arise
from fingerprints derived from mixed DNAs, resulting from
cross-well contamination in the library plates, which may
cause a mis-assembly in the fingerprint map (contigs joined
in error).
Of obvious note in Figure 3 are the complex contig
alignment patterns in many regions, with multiple contigs
aligning to the same sequence region. These alignment
patterns are also observed in the other LG alignments
Table 1 Summary of the integration of the genetic and physicalmaps through BAC end sequence derived SSR markers
Linkagegroup
No. contigs mappedto the Nisqually-1 pedigree
Estimated %coverage of LG1
LG_I 11 16LG_II 9 23LG_III 10 26LG_IV 4 12LG_V 8 29LG_VI 7 18LG_VII 4 14LG_VIII 7 36LG_IX 5 25LG_X 10 28LG_XI 6 28LG_XII 4 13LG_XIII 7 29LG_XIV 8 19LG_XV 5 26LG_XVI 5 13LG_XVII 3 30LG_XVIII 5 19LG_XIX 1 6Totals 119 Average 22 %
The data presented is for those markers mapped in the Nisqually-1pedigree and used to evaluate the integration of the BAC physicalmap and the genetic map.1The % LG cover values given are only for those physical map contigsmapped in Nisqually-1. The percentage coverage of the LG by contigswas calculated a posteriori of the poplar sequence assembly and isbased on the contig size estimates.
Figure 2. A summary of contig size distribution within the physical map.
The number of clones per contig varied from 2 to 189, with an average of 14.
Physical mapping of the Populus genome 1067
ª 2007 The AuthorsJournal compilation ª 2007 Blackwell Publishing Ltd, The Plant Journal, (2007), 50, 1063–1078

(Figure S1). These patterns suggest two theoretical possi-
bilities. First, the genome sequence may be mis-assembled
in these locations, for example by artifactual collapse of
duplicated but physically distinct regions during the gen-
ome assembly process. However, the large-scale co-linearity
of the genetic map and sequence assembly (Tuskan et al.,
Table 2 Summary of integration of thesequence assembly linkage groups (LGs)with the physical map
Linkagegroup
No. alignedmap contigs
No. alignedBACs in contigs
No. alignedsingletons
Estimated %coverage of LG1
LG_I 219 2443 344 95.2LG_II 170 1840 266 97.0LG_III 103 1290 145 92.8LG_IV 106 1125 170 95.5LG_V 104 1291 182 97.0LG_VI 121 1425 186 96.3LG_VII 84 950 107 97.0LG_VIII 84 1388 161 99.0LG_IX 66 1010 128 99.9LG_X 98 1708 175 96.0LG_XI 93 996 112 95.6LG_XII 81 953 152 96.8LG_XIII 70 904 106 92.3LG_XIV 86 1211 115 97.8LG_XV 64 830 92 96.7LG_XVI 81 918 140 97.7LG_XVII 35 390 42 94.4LG_XVIII 83 901 135 95.7LG_XIX 76 615 105 87.1Totals 1831 22188 2863 95.8
1The % coverage was calculated using the distances between aligned clones, obtained from thesequence assembly.
LGX
Figure 3. Fingerprinted BAC clone and contig
layout on the LG X sequence assembly.
Clone placement is based on BES alignments to
the genome sequence. The ideogram of LG X is
composed circularly (outermost ring), with 1 Mb
spans colored in alternating black and white
strips. The innermost histogram track (black)
illustrates the depth of aligned BAC clone cover-
age, with each concentric circle representing a
fivefold clone depth. The next outer histogram
track (red) shows the coverage provided by
aligned BAC map clones not assigned to contigs
(singletons). The next track shows the extent of
anchored contigs, coded with an alternating
color scheme. The final track inside the ideogram
circle shows the sequence alignment position of
individual aligned clones in each contig, colored
by map contig assignment. Fingerprint contigs
aligning to two different regions of the sequence
assembly are linked by arcs. Genetic markers
(SSRs) derived from BESs are indicated by
triangles on the sequence track. Green triangles
indicate SSRs mapped in the Nisqually-1 pedi-
gree, blue triangles indicate those mapped in
another P. trichocarpa pedigree (family 13), pink
triangles indicate those for which mapping
failed, and gray triangles indicate SSRs that have
not yet been tested, illustrating that a large
number of well-spaced SSRs remain for use in
future use in integration of the genetic and
physical maps. The outer track of triangles shows
those SSRs used for preliminary mapping of
contigs to LGs. The diagram was prepared using
Circos (http://mkweb.bcgsc.ca/circos/).
1068 Colin T. Kelleher et al.
ª 2007 The AuthorsJournal compilation ª 2007 Blackwell Publishing Ltd, The Plant Journal, (2007), 50, 1063–1078

2006) suggests that mis-assembly at such a large scale is
unlikely. A second possibility is that the clones in overlap-
ping BAC contigs represent individual Nisqually-1 haplo-
types that were assembled independently into distinct
haplotype-specific contigs in the physical map due to
haplotype-specific sequence diversity. This hypothesis was
investigated further, as described below.
Haplotype sequence diversity
To assess the possibility that distinct physical map contigs
aligning to the same locations in the sequence assembly
represented the two Nisqually-1 haplotypes, we selected
and sequenced eight BAC clones representing four exam-
ples of putative haplotype differences, based on fingerprint
pattern discrepancies and presence in contigs co-aligning to
the genome. The BAC clones represent genomic regions on
LGs I and XIV. We compared the sequences of the BACs in
detail to ascertain the nature of the differences and to iden-
tify nucleotide variations that could be genetically mapped
to test for allelism. We describe below representative results
for two of the four examples. Table S1 contains a summary
of the polymorphisms found in all four pairs of sequenced
BAC clones.
On LG I, contig 846, a small contig consisting of seven
clones, has sequence assembly coordinates spanning
105 kb of this LG (http://genome.jgi-psf.org/Poptr1/Poptr1.-
home.html). These coordinates are contained entirely within
the LG I alignment coordinates of contig 8, a larger contig
containing 127 clones and spanning 1263 kb (Figure 4a). The
contig 8 clones that lie within the region of co-alignment
share consistent HindIII fingerprint patterns, suggesting that
they represent a single haplotype. The corresponding BAC
clones in contig 846 have HindIII restriction patterns highly
similar to, but distinct from, those in contig 8, suggesting
that the clones in contig 846 potentially represent the
alternative haplotype for this region. The LG I sequence
assembly alignment coordinates for clone T0048O04 from
contig 846 overlap by 89 kb with the LG I alignment coordi-
nates for clone T0068B19 from contig 8 (Figure 4a), which is
98% of the alignment length for T0068B19. However, the two
clones differ in >20 restriction fingerprint fragments (Fig-
ure 4b). Comparison of the clone sequences revealed they
were substantially co-linear, sharing a high degree of
identity (84%) in the overlap region, consisting of segments
of complete identity interspersed with localized differences
in the form of indels and nucleotide substitutions, some of
which affect HindIII recognition sites. Figure 5 illustrates the
differences between the sequences relative to the resulting
restriction fingerprint patterns of the two BAC clones. One
large (11 kb) and two small (1244 bp and 189 bp) indels were
identified, in addition to five nucleotide differences, that
impact HindIII recognition sequences such that these recog-
nition sites are present in one clone but absent in the other.
As shown in Figure 5, these five SNPs, together with the
three indels noted above, account for the anomalous HindIII
fingerprint patterns that resulted in these BAC clones
assembling into distinct contigs. Additional analysis of the
sequences revealed a further 888 single nucleotide differ-
ences between the clones, and 217 smaller indels, ranging
Figure 4. Illustration of two of the four putative
haplotype-specific contigs analyzed.
(a) Schematic representation of the relationship
between contigs 8 and 846 on LG I and contigs
160 and 162 on LGX IV. Sequence assembly
coordinates are from version 1.0 of the P. tricho-
carpa genome assembly (Tuskan et al., 2006).
The approximate locations of BAC clones
T0068B19 (contig 8), T0048O04 (contig 846),
T0021 J18 (contig 160) and T0033M07 (contig
162) are shown.
(b) HindIII fingerprint images of the BAC clone
pairs aligning to LGs I and XIV. Thin lines drawn
through the DNA bands indicate restriction frag-
ments identified by BandLeader software; red
lines indicate fragments that are unique to each
potential haplotype.
Physical mapping of the Populus genome 1069
ª 2007 The AuthorsJournal compilation ª 2007 Blackwell Publishing Ltd, The Plant Journal, (2007), 50, 1063–1078

from 1 to 275 bp. In total, 14.8% of the clone overlap region
contains alignment gaps. Sequence analysis of two addi-
tional BAC clone pairs identified within contig 8, and
displaying restriction fragment differences also suggestive
of haplotype differences, revealed a similar pattern of large
regions of sequence identity interrupted by several indels
ranging in size from 10–1000 bp and SNPs at HindIII
recognition sites.
A similar analysis was carried out on representative BAC
clones T0021J18 and T0033M07 from contigs 160 and 162,
respectively, two small contigs that have overlapping align-
ments on LG XIV (Figure 4a). Sequence comparison of these
two BAC clones revealed that they were co-linear, but
differed by 440 single nucleotide changes and 83 indels,
ranging in size from 1 to 129 bp. However, only 0.5% of the
clone overlap region contains alignment gaps. Two of the
SNPs and one 20 bp indel affect HindIII recognition sites.
The observed HindIII fingerprint pattern differences in the
clones correlated with the fragment sizes predicted by the
BAC sequences (data not shown).
The results of these BAC sequence comparisons were
compatible with haplotypic variation as the cause of the
observed restriction fingerprint pattern variation. To test the
hypothesis that LG I clones T0068B19 and T0048O04 repre-
sent two Nisqually-1 haplotypes, and thus that the contigs
into which they were placed are haplotype-specific, one SNP
site in a HindIII recognition sequence in T0068B19 was
mapped in parallel with the corresponding alternative SNP
from T0048O04 in family 545. As shown in Figure 6, the
alternative SNPs mapped to the same location on LG I, but in
reverse phase. This illustrates that they are alleles of the
same locus, consistent with the interpretation that BAC
clones T0068B19 and T0048O04 are derived from distinct
Nisqually-1 haplotypes. Similarly, genetic mapping in family
545 of putative alternative alleles at a HindIII SNP in clones
T0021J18 and T0033M07 showed that they map to the same
location on LG XIV. These results indicate that considerable
haplotype sequence variation exists in the Nisqually-1
genome, including numerous small to large indels and
SNPs, and that in regions where the variation sufficiently
perturbs the fingerprint patterns, this resulted in the creation
of haplotype-specific contigs during the map assembly
process, as indicated in Figure 3 and Figure S1.
To examine the manner in which these haplotype-specific
sequences were assembled into the genome sequence,
which is derived from reads generated from both haplo-
types, we compared the sequences of the BAC clones to
those of the corresponding region from the version 1.1
poplar genome assembly (http://genome.jgi-psf.org/
Poptr1_1/Poptr1_1.home.html). An example of this analysis
is shown in Table 3, which illustrates the sequence align-
ment of BAC T0068B19 (contig 8) to the corresponding
region of the assembly. The genome assembly in this region
is a mosaic of the sequences of T0068B19 and the corres-
ponding alternative haplotype BAC T0048O04, as recognized
by diagnostic indels specific to each clone sequence.
Notably, the 11 kb region deleted in T0048O04 relative to
T0068B19 is also absent in the genome assembly. Analysis
of this haplotype-specific 11 kb sequence revealed numer-
ous short open reading frames (ORFs), and two large ORFS
of 229 and 154 amino acids. However, no matches of the
ORFs to poplar ESTs were found, and none had significant
Figure 5. Depiction of the sequence differences between clone T0068B19 (contig 8) and clone T0048O04 (contig 846) affecting the HindIII fragment patterns.
Individual restriction fragments for each clone are represented by colored boxes, and numbered underneath from left to right using the sequence of clone T0068B19
as the reference. Matching fragments are represented in light green, and are assigned a consensus fragment number in black text. Unmatched fragments in
T0048O04 are assigned alphabetical identifiers and colored differentially based on the nature of the sequence difference. The various types of sequence differences
are classified in the key on the lower left. The region from fragments 10 to 15 of T0068B19 is expanded in the center for a more detailed depiction of the alignment
result.
1070 Colin T. Kelleher et al.
ª 2007 The AuthorsJournal compilation ª 2007 Blackwell Publishing Ltd, The Plant Journal, (2007), 50, 1063–1078

similarity to predicted proteins in the non-redundant
sequence database.
Sequence analysis of all four pairs of haplotype-specific
BAC clones showed that, in each case, the haplotype-specific
sequences in regions of clone overlap were co-linear, but
contained extensive indel polymorphisms (Figures 4 and 5,
Table 3 and Table S1). This led to alignment gaps affecting
between 0.5 and 14.8% of the overlapping sequences
(Table S1). Despite large-scale haplotype sequence co-lin-
earity, these results raised the possibility that, in addition to
ORFs in the large 11 kb haplotype-specific sequence des-
cribed above, gene content and/or order could be distinct in
the two haplotypes, as has been described for several
regions of the maize genome (Brunner et al., 2005; Song and
Messing, 2003; Wang and Dooner, 2006).
To determine whether indel polymorphisms could affect
gene content and/or order in a haplotype-specific manner,
we examined in detail the locations and potential effects of
31 haplotype-specific indels ranging in size from 19 to
1244 bp, across a total of >320 kb of sequence from each
haplotype, as summarized in Table 4. We first examined the
genome assembly within the regions represented by the
sequenced BAC clones (http://genome.jgi-psf.org/Poptr1_1/
Poptr1_1.home.html), and found a total of 25 annotated
genes (Table 4). When the locations of the selected indels
were mapped relative to the genome assembly and anno-
tated genes, we found that in 30 of 31 cases, the indel fell
either within an intergenic region lacking an ORF (29 cases)
or within an intron (two cases). In one case, a 24 bp
haplotype-specific indel (absent in the genome assembly)
resulted in a predicted haplotype-specific eight amino acid
insertion in a predicted gene product (eugene3.00141429).
However, as this short gene appears to encode only a
fragment of an ammonium transporter protein, and lacks
EST expression support (http://genome.jgi-psf.org/Poptr1_1/
Poptr1_1.home.html), it is questionable whether it is func-
tional. In summary, our data show that extensive haplotype-
specific polymorphism exists in poplar, ranging from SNPs
to indels of variable size, up to >10 kb. However, haplotype-
specific sequences were largely co-linear, and we found no
evidence for differences in gene content or order between
the two haplotypes in the regions we examined.
Discussion
The Populus trichocarpa genome represents that of an un-
domesticated and highly heterozygous plant species. We
Figure 6. Genetic maps of LG I, showing mapping of contig 8/846 SNPs.
Positions of LG I genetic markers are shown on the right, with distances in
centimorgans (cM) on the left. The mapped locations of two putative
alternative SNP alleles (SNP2_1 and SNP2_2) polymorphic between clones
T0068B19 and T0048O04 are shown.
Table 3 Comparison of haplotype content in the poplar genomeassembly with respect to the haplotype-specific restriction frag-ments represented in BACs T0068B19 and T0048O04
HindIII restriction fragment size (bp)
T0048O04 T0068B19 P. trichocarpa assembly90 90 90
211 211 2112878 2878 28781374 1374 13744369 2674 2674152 152 152
1384 803 1403– 985 –
105 105 10562 251 251
1897 826 8262327 3701 3701
Fragments shared in common between the two haplotypes areindicated in green; fragments specific to the haplotype representedby clone T0048O04 are indicated in blue; fragments specific to thehaplotype represented by clone T0068B19 are in red. The assemblycoordinates were determined using BES alignment coordinates forclone T0068B19. The analysis indicates that the assembled sequencein this region is a mosaic of the 2 haplotypes embodied in T0048O04and T0068B19. Note that the 1403 bp fragment in the assembly,labeled in grey, is a combination of the two haplotypes. It lacks theHindIII restriction site present in T0068B19 (thus reflecting thehaplotype represented in T0048O04) but contains a 24 bp insertionmissing in T0048O04 (thus reflecting the haplotype represented inT0068B19).
Physical mapping of the Populus genome 1071
ª 2007 The AuthorsJournal compilation ª 2007 Blackwell Publishing Ltd, The Plant Journal, (2007), 50, 1063–1078

have aligned the physical map contigs to the sequence
assembly, and integrated the physical and genetic maps
through SSR markers. This work illustrates the power of an
integrated approach to assembling a physical map that is
anchored to both a whole-genome assembly and a genetic
map. These represent complementary resources, each hav-
ing the ability to inform the others, and their integration
provides added utility to the research community. For
example, the BESs provided an essential link between the
physical map and the genome sequence. Through these, the
physical map aided long-range contiguity of the sequence
assembly and resolution of repetitive regions (Tuskan et al.,
2006). In turn, alignment of the physical map contigs to the
linkage groups and sequence scaffolds provided informa-
tion useful for improvement of the physical map assembly.
Physical map coverage and genome representation
The sum of the estimated sizes of the BAC contigs is
approximately 577 Mb. This is approximately 20% larger
than the current estimated genome size of 485 Mb, derived
from the sequence assembly. The difference in the map-
based estimate is probably due at least in part to unrecog-
nized overlap between the ends of map contigs, as has been
reported in the soybean physical map study (Wu et al.,
2004), which would result to some extent in an inflated size
estimate. However, a large contributing factor to the differ-
ence in genome size estimates is the existence of haplotype-
specific contigs in the BAC map. If we consider only a single
haplotype contig for each of the co-aligning contigs an-
chored to the genome sequence, then the overall genome
size estimate represented by the map is reduced to 478 Mb,
which is in very good agreement with the 485 Mb estimated
derived from the sequence assembly. However, it is also
possible, given the duplicated nature of the genome (Sterck
et al., 2005; Tuskan et al., 2006), that in some cases dis-
persed, duplicated sequences have been collapsed within
the sequence assembly. At present, 187 BAC contigs map to
multiple regions of the genome based on the BES align-
ments. The discrepancies between the physical map and the
sequence assembly will require further investigation to
elucidate the underlying reasons for the assembly differ-
ences, providing an excellent opportunity to understand the
structure of sequence duplications and the nature of haplo-
typic differences in this species.
The physical map provides good coverage of the
sequence assembly. Approximately 384 Mb (79%) of the
entire poplar sequence assembly and 295 Mb (96%) of
linkage group assemblies were anchored to the physical
map (Table 2). This is probably an underestimate as it is
based only on contiguous regions of aligned BESs. It does
not take into account the presence of any BAC clones lacking
sequence alignments that flank the aligned regions within
contigs, or map contigs that could not be anchored to the
sequence assembly. The number of anchoring clones per
aligned contig averaged 10 and ranged from 2 to 138. These
contigs varied in size, with the majority being above 200 kb
and some extending to over 1 Mb (Figure 2). These larger
contigs are extremely useful for long-range sequence integ-
ration, providing a framework on which to orientate
sequence scaffolds. However, it is important to note that
the physical map was derived from a single BAC library
constructed by HindIII partial digestion, and thus would not
contain regions of the genome where HindIII sites are
separated by distances larger than can be typically cloned
into a BAC vector. Based on size analysis of P. trichocarpa
genomic DNA digested to completion with HindIII (data not
shown), we estimate that as much as 10% of the genome
could be missing from the BAC library, and thus the physical
map would lack coverage for these regions of the genome
assembly.
In comparison to other plant physical maps, the number
of contigs in the poplar map is still large and requires further
resolution. The physical map of rice contains 458 contigs
Table 4 Summary of haplotype-specific indels examined for effects on predicted gene content
BAC pair1 FPC2Overlap(bp)3
No. predictedgenes4
No. indelsexamined
Indel sizerange5
Indel locationIndel effecton genes6Coding Intron Inter-gentic
T0068B19 T0048O04 Ctg 8 Ctg846 88,954 3 8 40–244 0 1 7 noneT0021J18 T0033M07 Ctg 160 Ctg 162 94,123 7 5 19–29 1 1 3 17
T0053A03 T0011N15 Ctg 836 101,155 13 11 24–32 0 0 11 noneT0017N13 T0065A01 Ctg 1158 38,020 2 7 40–81 0 0 7 none
1Sequenced haplotype-specific BAC clones, as described in text and Table S1.2BAC fingerprint contig number or numbers.3Overlap between the pair of haplotype-specific BAC clones.4Genes predicted in the corresponding region of the Populus genome assembly (http://genome.jgi-psf.org/Poptr1_1/Poptr1_1.home.html).5Size range of the indels investigated, in bp.6Number of genes with changes in structure or location that could be affected by an indel.7Eight amino acid insertion into predicted gene eugene3.00141429, annotated as an incomplete coding sequence and without EST expressionsupport (http://genome.jgi-psf.org/Poptr1_1/Poptr1_1.home.html).
1072 Colin T. Kelleher et al.
ª 2007 The AuthorsJournal compilation ª 2007 Blackwell Publishing Ltd, The Plant Journal, (2007), 50, 1063–1078

representing approximately 90% of the 430 Mb genome at
an estimated 20-fold coverage (Chen et al., 2002). For
Arabidopsis, a physical map consisting of 27 contigs
covered the majority of the 125 Mb genome (Mozo et al.,
1999). Rice and Arabidopsis have more homogenized
genomes due to domestication in the case of rice (Buckler
et al., 2001) and inbreeding in the case of Arabidopsis
(Bustamante et al., 2002). In contrast to this, the physical
mapping efforts in soybean are more comparable with those
in poplar, in terms of gross genome size and chromosome
number. The soybean genome is more complex than that of
rice or Arabidopsis, having a larger chromosome number
(soybean n = 20, poplar n = 19, rice n = 12, Arabidopsis
n = 5) and larger genome size (approximately 1115 Mb), and
being tetraploid (Wu et al., 2004). However, it is autogamous
and has been domesticated for approximately 3000 years.
These factors have combined to result in reduced haplotypic
diversity (Zhu et al., 2003). The soybean BAC- and BIBAC
(binary BAC)-based physical map consisted of 2905 contigs,
representing a 9.6-fold redundancy (Wu et al., 2004). How-
ever, this physical map did not include a sequence compar-
ison, which was possible with the poplar genome and which
facilitated an approximate 12% decrease in the contig
number. Considering the reduced diversity within soybean,
the poplar map compares well due to the larger haplotypic
diversity inherent in poplar as an obligate outbreeding
species.
Options for improving the P. trichocarpa physical map
include creation of additional BAC libraries using different
enzymes, as it has been shown that two-enzyme methods
outperform single-enzyme methods in simulations (Xu
et al., 2004), and optimization of library construction proto-
cols to obtain BACs with larger inserts.
Haplotype sequence diversity and effect on gene content
An unanticipated outcome of the alignment of the physical
map with the poplar genome sequence was the detection of
haplotype-specific map contigs, which resulted from high
levels of haplotype variation in some regions of the genome.
Analysis of the sequence differences between haplotype-
specific BAC clones suggests that haplotypes are charac-
terized by numerous small to large indel polymorphisms, in
addition to SNPs, raising the possibility of differences in the
repertoire of genes between haplotypes. Such differences
would not be apparent from the genome assembly because,
as illustrated in Table 3, the genome assembly represents a
mosaic of the two haplotypes.
In maize, detailed analysis of haplotype-specific DNA
sequences has revealed striking examples of non-co-linear-
ity in DNA sequence between haplotypes and, in some
cases, haplotype-specific gene complements. For example,
near the bz locus, Wang and Dooner (2006) observed
extensive DNA sequence non-co-linearity in eight maize
haplotypes as the result of massive differences in the
insertion sites and numbers of mobile DNA elements
surrounding and within eight genes in the region examined.
In another example, at a locus containing multiple z1C
genes, haplotype-specific differences in z1C gene number
and order were found in two haplotypes (Song and Messing,
2003). Finally, Brunner et al. (2005) observed extensive
breakdown of sequence co-linearity between two maize
haplotypes at four loci on different maize chromosomes.
This lack of co-linearity is largely caused by differential
insertion of long-terminal repeat retrotransposons in a
haplotype-specific manner, but, surprisingly, there were
also a number of haplotype-specific genes at three of the
four loci (i.e. genes that are present in one haplotype but
absent in the other).
Our data from the sequences of four pairs of BAC clones
representing over 320 kb of haplotype-specific DNA se-
quence in poplar allowed us to compare the extent and
consequences of haplotype-specific DNA polymorphisms in
this species. In contrast to maize, the pairs of poplar
haplotype sequences were largely co-linear, punctuated by
an assortment of small to large indels, indicating a lack of
large-scale sequence rearrangement in the haplotypes rel-
ative to each other. Our analysis of an 11 kb region specific
to one haplotype on LG I, but absent in the genome
assembly, failed to find support for expressed genes in this
region. Moreover, almost all haplotype-specific indels were
in intergenic regions where they have no impact on gene
content or order (Table 4). While small indels in coding
regions such as observed in one gene in haplotype-specific
contigs 160 and 162 (Table 4) may be relatively common in
the poplar genome (Tuskan et al., 2006), many of the larger
indels appeared in gene-poor regions (data not shown).
These data do not exclude the possibility of haplotype-
specific differences in gene content in poplar, but the fact
that no such differences were found in a total of 320 kb of
haplotype-specific sequence containing 25 annotated genes
at four loci suggests such differences may be relatively rare
or confined to certain regions of the poplar genome. Indeed,
extensive haplotype diversity, including haplotype-specific
differences in gene content appear to be present on LGXIX
(T.-M. Yin, G.A. Tuskan and S.P. DiFazio, unpublished data),
an interesting LG with relatively poor genome sequence
assembly (Tuskan et al., 2006) and physical map coverage
(Figure S1). However, based on our sampling of the poplar
genome, the extensive and widespread haplotype-specific
genome organization and gene content found in maize do
not appear to be general phenomena in angiosperms, and
may be related to extremely active families of mobile
elements in that species. Further analysis of haplotype
variation in poplar and other plants will provide more
definitive data on whether the variation we observed in
poplar is more typical of angiosperms. The large numbers of
apparently haplotype-specific BAC contigs revealed by the
Physical mapping of the Populus genome 1073
ª 2007 The AuthorsJournal compilation ª 2007 Blackwell Publishing Ltd, The Plant Journal, (2007), 50, 1063–1078

physical map present an opportunity for more detailed
analysis of the nature and functional consequences of
haplotype sequence diversity in Populus.
Integration of genetic and physical maps
A total of 122 SSRs developed from the BESs were mapped
onto the poplar genome assembly using the Nisqually-1
pedigree (Tuskan et al., 2006; T. Yin et al., unpublished). The
markers are spread across the linkage groups, and those
mapped initially were chosen to span each linkage group
relatively evenly (approximately 20–30 cM spacing) and also
to represent large physical map contigs. These SSRs were
used to map contigs onto genetic positions (Figure 1). Using
122 BES-derived SSR markers, a total of 22% of the LG
assemblies were covered by 119 contigs mapped to the
genetic map (Table 1). These markers enable a direct
association of genetic loci with physical map BAC clones.
They also provide a resource for comparative genomics in
the genus Populus and related species. Additional micro-
satellites and SNP markers are being designed based on
observed polymorphisms in the genome sequence, and
these will be used to complete the map-based genome
assembly (T. Yin et al., unpublished). Integration of the
physical and genetic maps, by mapping BES-derived SSRs
and genome assembly, also provides a genome-wide data
set of comparative genetic and physical distances across the
19 linkage groups, from which potential differences in
recombination rates can be inferred. These data will be
presented in detail elsewhere (T. Yin et al., unpublished).
Map utility
The framework of the physical map, the sequence assembly
and the genetic markers provide a considerable collection of
resources for poplar research. The current map already
provides a considerable resource in terms of genomic
interrogation. The combined integration of physical map,
genetic map and genome sequence will be of use in detailed
studies on QTLs for traits of interest in tree biology, such as
wood quality, biomass production, responses to environ-
mental cues, and responses to biotic and abiotic stresses
(Frewen et al., 2000; Tagu et al., 2005). Once QTLs of interest
have been mapped to intervals, use of the BES-derived
markers will allow identification of specific BACs in these
intervals, providing a source of cloned Populus genomic
DNA of known sequence location for functional studies on
selected candidate genes. As an example, we have used a
QTL map of poplar wood quality traits to identify markers in
regions of interest, and subsequently used the physical map
BAC clones to target these regions for further characteriza-
tion (C.T. Kelleher et al., unpublished data).
The Nisqually-1 physical map BAC clones also provide a
reference point for Populus genome organization. The
genus Populus contains 29 species, distributed among six
sections (Eckenwalder, 1996), and many of these species
have unique ecological adaptations (Cronk, 2005). While all
species contain 19 chromosomes, the extent to which small-
scale genome rearrangements or insertions/deletions occur
between species, perhaps contributing to changes in gene
complement and adaptation, is unknown. The Nisqually-1
physical map, combined with the genome sequence, will
serve as a reference for comparative studies on gene
synteny and genome structure within the genus, using
BAC libraries prepared from other Populus or related
species, by comparative BAC mapping and hybridization
strategies to the Nisqually-1 BAC contigs.
In summary, the physical map and other resources
available for poplar genomics should significantly aid the
advance of research into the biology of woody perennials,
and help establish this poplar as a model system for tree
biology. The complete fingerprint map is available for
download in FPC format from the Genome Sciences Centre
website (http://www.bcgsc.bc.ca/lab/mapping/data). The
map may also be viewed using Internet Contig Explorer
(iCE) (Fjell et al., 2003), a Java-based application that allows
viewing of FPC-based maps (http://www.bcgsc.ca/ice/), and
copies of the BAC library containing all clones may be
obtained by contacting the corresponding author (CJD).
Experimental procedures
BAC clone fingerprinting and map construction
The BAC library was constructed from Nisqually-1 genomic DNApartially digested with HindIII, and consisted of 48 384 BAC clones.The procedure for BAC library construction has been describedelsewhere (Stirling et al., 2001). BAC clones were fingerprinted byHindIII digestion and fragment separation on agarose gels (Marraet al., 1997; McPherson et al., 2001; Schein et al., 2004). Restrictionfragment identification, fragment mobility and size determinationwere performed automatically using BandLeader software (Fuhr-mann et al., 2003). Automated fingerprint map assembly was per-formed using FPC version 5.0.1 (Soderlund et al., 1997, 2000), withan initial assembly performed using default parameters and aSulston cut-off score of 1e-15 (Sulston et al., 1988).
Additional processing of the map contigs was achieved by acombination of manual review using tools within FPC and externalautomated tools. CORAL (Flibotte et al., 2004) is an automatedapplication for improving clone order within FPC-assembled con-tigs, and was applied to contigs containing £10 clones. The majorityof contig merging was achieved by the use of automated scripts.Multiple rounds of analysis were performed, with varying param-eters used to identify valid merges. Clone fingerprint comparisonswere performed only between clones at the ends of contigs, orbetween singleton clones (clones that did not assemble intocontigs) and clones at the ends of contigs. Fingerprint similaritieswere first calculated using the Sulston score (Sulston et al., 1988),and those falling below the set cut-off score for the round wereidentified as candidate merges. The candidate merges were furtherinterrogated for the number of unconfirmed fragments across themerge point, where an unconfirmed fragment is one that is present
1074 Colin T. Kelleher et al.
ª 2007 The AuthorsJournal compilation ª 2007 Blackwell Publishing Ltd, The Plant Journal, (2007), 50, 1063–1078

in a clone at a contig end, but is not present elsewhere in that contigend nor in the clones at the end of the candidate merging contig.Those candidate merges not exceeding the allowed number ofunconfirmed fragments for the round were considered valid mergesand the contigs were joined. The Sulston score cut-off and thepermitted number of unmatched fragments were varied for eachround, with the parameters balanced in order to avoid promiscuousmerges. Sulston score cut-offs varied from 9e-10 to 9e-6, andpermitted unconfirmed fragments varied from 0 to 3, with the latterparameter allowing for minor errors in BandLeader fragmentidentification. A single exceptional round of merging was per-formed in which very small contigs were merged internally to largercontigs only if all clones in the smaller contig matched a group ofneighboring clones in a larger contig, with a maximum Sulstonscore cut-off of 9.99e-10 and a maximum of two unconfirmedfragments. A copy of the BAC library containing all clones in thephysical map may be obtained by contacting the correspondingauthor (CJD).
Contig size estimation
To estimate contig sizes based on fingerprint data, an automatedalgorithm was used to compare the restriction fragments of over-lapping clone pairs in the canonical clone set for each contig.Canonical clones are the set of non-redundant overlapping clonesspanning a contig that each represent a unique complement ofrestriction fragments in their fingerprint, such that the remainingnon-canonical clones within the contig are subsumed by thecanonical clones (i.e. all the restriction fragments in the fingerprintof a non-canonical clone are completely represented in one of thecanonical clones). The unique fragments for each canonical clonewere identified, and their sizes were summed to estimate the overallsize of the contigs. Specifically, the algorithm performed the fol-lowing procedure for each contig: (i) sum the sizes of all the frag-ments in the left-most canonical clone in the contig to create acumulative size estimate; (ii) identify the next canonical cloneimmediately to the right and identify its unique fragments (anyfragments not shared with the two previous canonical clones to theleft or the next two canonical clones to the right), then add the sizesof these unique fragments to the cumulative size estimate; (iii) re-peat step 2 until all unique fragments in the canonical clones havebeen identified and summed to give a total size estimate for thecontig. Two fragments were considered the same if their calculatedstandard mobilities were within 10 mobility units of each other.
Genetic and physical map integration
A genetic map of the Nisqually-1 pedigree was constructed throughthe collaborative effort of Oak Ridge National Laboratory, Tennes-see, USA, and the Treenomix group at the University of BritishColumbia, Canada (T. Yin et al., unpublished). The pedigree wasfamily 545, an inter-specific F1 population obtained from a crossbetween P. trichocarpa (Nisqually-1 as mother) and P. deltoides L.(as father) (Stirling et al., 2001). The data obtained from the geneticmap were merged with another P. trichocarpa pedigree map, basedon family 13 (Yin et al., 2004). Young buds were collected and theDNA was isolated using Qiagen DNeasy plant mini kits (http://www.qiagen.com/). A total of 94 individuals were used for the AFLPanalysis and 87 for the SSR analysis. The markers from the geneticmap were used to integrate the physical map with the genetic map.SSR markers primarily developed from the BESs (http://www.ornl.gov/sci/ipgc/ssr_resource.htm) and those used in otherPopulus mapping studies (Cervera et al., 2001; van der Schoot et al.,
2000; Yin et al., 2004) were used by both laboratories. At theUniversity of British Columbia, additional dominant AFLP markers(Vos et al., 1995) were analyzed for the genetic mapping, and bothSSRs and AFLPs were visualized by addition of an M13 sequence onthe forward primer and subsequent addition of M13 IRD-labeledprimer (for details see Oetting et al., 1995).
For PCR amplification of SSR loci, 20 ng of total genomic DNAwas added to a 10 ll reaction volume of 1· Roche PCR buffer,250 lM dNTPs, 0.2 lM forward and reverse primers, 0.05 lM M13IRD-labeled primer and 1 U of AmpliTaq DNA polymerase (Roche;http://www.rochecanada.com). Reactions were carried out on anMJ Research PT-100 thermal cycler (http://www.bio-rad.com) withthe following program: 95�C for 4 min, followed by 30 cycles of 95�Cfor 1 min, 60�C for 30 sec and 72�C for 1 min, then a final extensionfor 4 min at 72�C. AFLP reactions involved a restriction digestion, apre-selective amplification and a final selective amplification step(Vos et al., 1995). A 30 ll restriction–ligation reaction was incubatedat 37�C for 4 h. The reaction contained 250 ng total genomic DNA ina reaction mix of buffer (giving final concentrations of 10 mM TrisHCL, 10 mM MgAc, 50 mM KAC and 5 mM DTT), 12 U EcoRI or PstIand 8 U Tru9I, 2.5 pmol EcoRI/PstI adaptor, 25 pmol Tru9I adaptor,0.15 mM ATP and 0.25 U of T4 DNA ligase (Invitrogen; http://www.invitrogen.com/). The restriction–ligation reactions were dilu-ted 1:10, and 5 ll of this reaction was used in a pre-selective PCRamplification together with 1· Roche PCR buffer, 200 lM dNTPs,0.15 lM EcoRI/PstI/Tru9I pre-selective primers and 1 U of AmpliTaqDNA polymerase (Roche). PCR amplification was performed in anMJ Research PT-100 thermal cycler with the following cycles: 94�Cfor 1 min, followed by 30 cycles of 94�C for 30 sec, 65�C for 30 sec,72�C for 1 min, and a final extension for 5 min at 72�C. Pre-selectivePCR product was diluted 1:40, and 5 ll were used in a 20 ll reactioncomprising 1· Roche PCR buffer, 400 lM dNTPs, 0.3 lM EcoRI/PstI/Tru9I selective primers and 1 U AmpliTaq DNA polymerase (Roche).Selective amplification reactions were the same as for the pre-selective amplification, except that M13 IRD-labeled primer wasadded to a concentration of 0.05 lM and a drop-down annealingtemperature was used, starting at 65�C and decreasing by 0.7�C foreach cycle until a final set of 22 cycles at an annealing temperatureof 56�C.
SSRs and AFLPs were analyzed on LI-COR 4300 DNA analyzers(http://www.licor.com) with 6% polyacrylamide gels, and on anABI3730 capillary sequencer (Applied Biosystems; http://www.appliedbiosystems.com). Images were processed using SagaMX
AFLP�, SagaGT (LI-COR Biosciences; http://www.licor.com) andanalyzed using JoinMap (Van Ooijen and Voorrips, 2001) andMAPMAKER to determine linkage groups (Lander et al., 1987).Details on the genetic mapping analysis will be presented else-where (T. Yin et al., unpublished). MapChart 2.1 was used to drawlinkage group diagrams (Voorrips, 2002).
A number of BES-derived SSRs (122) were used to positionphysical map contigs on the genetic map. In addition, the remainingSSRs were shown to be useful in integrating other LG in silico ontothe physical map by using BLAST hits from SSR primer sequencesagainst the BESs. The BLAST results were screened for e valuesbelow 1.0, and size ranges between 50 and 300 bp. Those thatpassed these criteria were used to illustrate the integration of thephysical and genetic maps.
BAC end sequencing and alignment of map contigs to
sequence assembly
The BAC DNA isolated for fingerprinting was also used to generateend sequence data for the clones. The protocol for BAC end
Physical mapping of the Populus genome 1075
ª 2007 The AuthorsJournal compilation ª 2007 Blackwell Publishing Ltd, The Plant Journal, (2007), 50, 1063–1078
sequencing reactions was provided by S. Zhao of the Institute forGenomic Research (Rockville, MD, USA). The primers used were)21 M13 forward (TGTAAAACGACGGCCAGT) and M13 reverse(CAGGAAACAGCTATGAC).
The data were collected on ABI Prism 3700 DNA analyzersequencing instruments. The trace data were processed by theprogram phred (Ewing and Green, 1998; Ewing et al., 1998), usingdefault parameters, and the sequence trimmed for quality and vectorsequences. Reads that contained <15 bp of sequence followingprocessing were removed from the data set. Average read lengthswere calculated from the quality length reported by phred for eachread. The BES traces are available from the trace archives at theNational Center for Biotechnology Information (NCBI) (Ti numbers1439871865–1439912628, 1439111083–1439151202, or query with‘species_code = ‘POPULUS TRICHOCARPA’’’).
Comparisons of BESs to the whole-genome shotgun assemblyscaffolds (JGI Populus trichocarpa genome assembly, version 1.0)were performed using BLAST (Altschul et al., 1990). Those align-ments satisfying the criteria of either (a) >99% identity ande-value < 10)50, or (b) >95% identity for >95% of the read lengthwith an alignment length >50 bp, were used to anchor fingerprintmap contigs to the sequence assembly. Where alignments for bothend sequences of a clone were available, the paired reads wererequired to have alignments with opposite orientation. Groups oftwo or more clones with overlapping end sequence alignmentswere used to map the contigs to the sequence. In cases wherecontigs mapped to multiple sequence regions, these were filtered asfollows. The region with the most clones aligning to it was accepted.The region with the next largest number of alignments was requiredto have at least three aligned clones, the next four, and so on. In thisway, some small contig loci that passed the initial two-cloneminimum were rejected because the presence of larger loci resultedin an increased minimum clone cut-off.
BAC insert sequencing, assembly and analysis
BAC clones T0021J18 and T0033M07 were sequenced using a ran-dom in vitro transposon insertion approach. BAC DNA was pre-pared as per the fingerprinting protocol described by Schein et al.(2004), and transposon libraries were generated using the TemplateGeneration System� I Kit (Finnzymes; http://www.finnzymes.fr),following the manufacturer’s recommended protocol for BACclones, and the Kan(R) Entranceposon (Finnzymes). BACs withinserted transposons were cultured and DNA-purified in a 96-wellformat (Schein et al., 2004). Sequencing reactions were assembledin 384-well clear optical reaction plates (Applied Biosystems; http://www.appliedbiosystems.com/) using a Biomek FX workstation(Beckman-Coulter; http://www.beckmancoulter.com) (Yang et al.,2005). To each 8 ll reaction (total volume), the following were ad-ded: 5 ll of purified BAC DNA, 0.7 ll of sequencing primer (5 pmol/ll, Invitrogen), 0.3 ll of Ultrapure water (Gibco; http://www.invitrogen.com) and 2 ll of BigDye v.3.1 ready reaction mix(Applied Biosystems). Sequence reads were performed on trans-posed BAC clones using primers SeqA2 (5¢-GAATTCTCTAGA-TGATCAGCGGC-3¢) and SeqB2 (5¢-CGAACTTTATTCGGTCGAA-AAGG-3¢). Cycling was performed on PTC-225 thermal cyclers (MJResearch) with parameters of 95�C for 2 sec, followed by 85 cyclesof 96�C for 30 sec, 56.6�C for 5 sec using SeqA2 primer or 56.0�C for5 sec using SeqB2 primer and 60�C for 3 min, followed by incuba-tion at 4�C. Reaction products were precipitated using 2 ll of125 mM EDTA (pH 8) and 18 ll of 95% ethanol per well, followed bycentrifugation at 2750 g for 30 min at 4�C. The supernatant wasdecanted by inverting the plate and firmly shaking liquid from thewells. Plates were left to air-dry for 15 min. Samples in each well
were then resuspended in 10 ll of Ultrapure water and analyzedusing a 3730XL DNA analyzer (Applied Biosystems).
Transposon-directed sequenced reads were base-called usingphred (Ewing and Green, 1998; Ewing et al., 1998). The base-calledreads were imported and checked for contamination againstEscherichia coli, vector and transposon sequences. BAC vectorand inserted Mu transposon sequences were removed, and theremaining sequences were assembled together using PHRAP(http://www.phrap.org/). After initial assemblies, CONSED (Gordonet al., 1998) was used to view the data to check for any possibleerrors and make appropriate corrections/edits. CONSED navigationtools were utilized to check for low-quality (phred quality below 30)consensus sequences and high-quality discrepancies (mismatchesof phred base quality of 20 and above between/among individualreads) in the assembled reads. All the repeat regions were manuallyassembled using single base pair mismatches and read pairsinformation. Mononucleotide and dinucleotide runs were sortedby making 4–5 bp overlapping joins between the read pairs. Forruns with not enough read pairs information to tilepath, the contigswere joined together by making minimum appropriate joins. All thefinished assemblies were re-examined if any misplaced high-qualityread pairs were found and fixed accordingly. Final confirmation ofthe finished assemblies was made by comparing their in silicoHindIII restriction enzyme digests to the respective experimentalrestriction enzyme digests, and any deviation was manually exam-ined and corrected
To correlate the sequence differences with the resulting finger-print differences, each pair of BAC sequences was first in silico-digested using the HindIII restriction enzyme motif, and theresulting fragments mapped to corresponding fragments in theirexperimental fingerprints, using a size tolerance of 10 bp. The twoclone sequences were then aligned against each other and againstthe corresponding region of the genome assembly (based on BESalignments) using Dotter software (Sonnhammer and Durbin,1995). The sources of variation in DNA sequences were identifiedand checked for existence in the corresponding genome assemblyregion. Potential effects of haplotype-specific indel polymorphismson gene order and content were investigated by comparing indelsand surrounding sequences to the poplar genome assembly andannotation (http://genome.jgi-psf.org/Poptr1_1/Poptr1_1.home.html).
Acknowledgements
This project was supported by Genome Canada, Genome BritishColumbia and the Province of British Columbia (Treenomix project)with funds to C.J.D., B.E.E., J.B. and K.R., and by a Natural Sciencesand Engineering Research Council of Canada (NSERC) DiscoveryGrant to C.J.D. We thank Scott Paper Inc. for maintenance of thefamily 545 material used for the Nisqually-1 genetic map. Fundingfor the Oak Ridge National Laboratory portion of this research wasprovided by the US Department of Energy, Office of Science,Biological and Environmental Research Carbon SequestrationProgram, the Basic Energy Sciences Program, and National ScienceFoundation grant 0421743 to G.A.T. Oak Ridge National Laboratoryis managed by UT-Battelle, for the US Department of Energy undercontract number DE-AC05-00OR22725. M.A.M., S.J.M.J. and R.A.H.are scholars of the Michael Smith Foundation for Health Research;J.B. is a Steacie Fellow of the Natural Sciences and EngineeringResearch Council of Canada.
Supplementary Material
The following supplementary material is available for this articleonline:
1076 Colin T. Kelleher et al.
ª 2007 The AuthorsJournal compilation ª 2007 Blackwell Publishing Ltd, The Plant Journal, (2007), 50, 1063–1078

Figure S1. Fingerprinted BAC clone and contig layout on thesequence assemblies of each of 19 Populus trichocarpa linkagegroups (LG) based on BES alignments to the genome sequence(http://mkweb.bcgsc.ca/poplar/supplementary/060515).Table S1 Summary of haplotype-specific DNA polymorphismsbased on BAC sequence comparisonsThis material is available as part of the online article from http://www.blackwell-synergy.com
References
Abbott, R.J. and Gomes, M.F. (1989) Population genetic-structureand outcrossing rate of Arabidopsis thaliana (L) Heynh. Heredity,62, 411–418.
Altschul, S.F., Gish, W., Miller, W., Myers, E.W. and Lipman, D.J.
(1990) Basic local alignment search tool. J. Mol. Biol. 215, 403–410.
Arimura, G., Huber, D.P.W. and Bohlmann, J. (2004) Forest tentcaterpillars (Malacosoma disstria) induce local and systemicdiurnal emissions of terpenoid volatiles in hybrid poplar (Popu-lus · trichocarpadeltoides): cDNA cloning, functional characteri-zation, and patterns of gene expression of ())-germacrene Dsynthase, PtdTPS1. Plant J. 37, 603–616.
Braatne, J.H., Rood, S.B. and Heilman, P.E. (1996) Life history,ecology, and conservation of riparian cottonwoods in NorthAmerica. In Biology of Populus and its Implications for Manage-ment and Conservation (Stettler, R.F., Bradshaw, Jr, H.D., Heil-man, P.E. and Hinckley, T.M., eds). Ottawa, Canada: NRCResearch Press, pp. 57–80.
Brunner, S., Fengler, K., Morgante, M., Tingey, S. and Rafalski, A.
(2005) Evolution of DNA sequence nonhomologies among maizeinbreds. Plant Cell, 17, 343–360.
Buckler, E.S., Thornsberry, J.M. and Kresovich, S. (2001) Moleculardiversity, structure and domestication of grasses. Genet. Res. 77,213–218.
Burns, R.M. and Honkala, B.H. (1990) Silvics of North America:1. Conifers; 2. Hardwoods. Agriculture Handbook 654.Washington DC: US Department of Agriculture, ForestService.
Bustamante, C.D., Nielsen, R., Sawyer, S.A., Olsen, K.M.,
Purugganan, M.D. and Hartl, D.L. (2002) The cost of inbreeding inArabidopsis. Nature, 416, 531–534.
Cervera, M., Storme, V., Ivens, B., Gusmao, J., Liu, B., Hostyn, V.,
Van Slycken, J., Van Montagu, M. and Boerjan, W. (2001) Densegenetic linkage maps of three Populus species (Populus delto-ides, P. nigra and P. trichocarpa) based on AFLP and microsat-ellite markers. Genetics, 158, 787–809.
Chen, M.S., Presting, G., Barbazuk, W.B. et al. (2002) An integratedphysical and genetic map of the rice genome. Plant Cell, 14, 537–545.
Cronk, Q.C.B. (2005) Plant eco-devo: the potential of poplar as amodel organism. New Phytol. 166, 39–48.
Eckenwalder, J.E. (1996) Systematics and evolution of Populus. InBiology of Populus and its Implications for Management andConservation (Stettler, R.F., Bradshaw, Jr, H.D., Heilman, P.E. andHinckley, T.M., eds). Ottawa, Canada: NRC Research Press), pp. 7–32.
Ewing, B. and Green, P. (1998) Base-calling of automated sequencertraces using phred. II. Error probabilities. Genome Res. 8, 186–194.
Ewing, B., Hillier, L., Wendl, M.C. and Green, P. (1998) Base-callingof automated sequencer traces using phred. I. Accuracy assess-ment. Genome Res. 8, 175–185.
Fang, Z., Cone, K., Sanchez-Villeda, H. et al. (2003) iMap: a data-base-driven utility to integrate and access the genetic and phys-ical maps of maize. Bioinformatics, 19, 2105–2111.
Farmer, J. R. E. (1996) The genecology of Populus. In Biology ofPopulus and its Implications for Management and Conservation(Stettler, R.F., Bradshaw, Jr, H.D., Heilman, P.E. and Hinckley,T.M., eds). Ottawa, Canada: NRC Research Press), pp. 33–50.
Fjell, C.D., Bosdet, I., Schein, J.E., Jones, S.J.M. and Marra, M.A.
(2003) Internet Contig Explorer (iCE) – a tool for visualizing clonefingerprint maps. Genome Res. 13, 1244–1249.
Flibotte, S., Chiu, R., Fjell, C., Krzywinski, M., Schein, J.E., Shin, H.
and Marra, M.A. (2004) Automated ordering of fingerprintedclones. Bioinformatics, 20, 1264–1271.
Frewen, B.E., Chen, T.H.H., Howe, G.T., Davis, J., Rohde, A.,
Boerjan, W. and Bradshaw, H.D. (2000) Quantitative trait loci andcandidate gene mapping of bud set and bud flush in Populus.Genetics, 154, 837–845.
Fuhrmann, D.R., Krzywinski, M.I., Chiu, R. et al. (2003) Software forautomated analysis of DNA fingerprinting gels. Genome Res. 13,940–953.
Gordon, D., Abajian, C. and Green, P. (1998) Consed: a graphical toolfor sequence finishing. Genome Res. 8, 195–202.
Gregory, S.G., Sekhon, M., Schein, J. et al. (2002) A physical map ofthe mouse genome. Nature, 418, 743–750.
Krzywinski, M., Wallis, J., Gosele, C. et al. (2004) Integrated andsequence-ordered BAC and YAC-based physical maps for the ratgenome. Genome Res. 14, 766–779.
Lander, E., Green, P., Abrahamson, J., Barlow, A., Daly, M., Lincoln,
S. and Newburg, L. (1987) MAPMAKER: an interactive computerpackage for constructing primary genetic linkage maps ofexperimental and natural populations. Genomics, 1, 174–181.
Marra, M.A., Kucaba, T.A., Dietrich, N.L., Green, E.D., Brownstein,
B., Wilson, R.K., McDonald, K.M., Hillier, L.W., McPherson, J.D.
and Waterston, R.H. (1997) High throughput fingerprint analysisof large-insert clones. Genome Res. 7, 1072–1084.
McPherson, J.D., Marra, M., Hillier, L. et al. (2001) A physical map ofthe human genome. Nature, 409, 934–941.
Mozo, T., Dewar, K., Dunn, P. et al. (1999) A complete BAC-basedphysical map of the Arabidopsis thaliana genome. Nat. Genet. 22,271–275.
Nelson, W.M., Bharti, A.K., Butler, E., Wei, F., Fuks, G., Kim, H.,
Wing, R.A., Messing, J. and Soderlund, C. (2005) Whole-genomevalidation of high-information-content fingerprinting. PlantPhysiol. 139, 27–38.
Oetting, W.S., Lee, H.K., Flanders, D.J., Wiesner, G.L., Sellers, T.A.
and King, R.A. (1995) Linkage analysis with multiplexed shorttandem repeat polymorphisms using infrared fluorescence andM13 tailed primers. Genomics, 30, 450–458.
Plomion, C., Leprovost, G. and Stokes, A. (2001) Wood formation intrees. Plant Physiol. 127, 1513–1523.
Ralph, S., Oddy, C., Cooper, D. et al. (2006) Genomics of hybridpoplar (Populus trichocarpa · deltoides) interacting with foresttent caterpillars (Malacosoma disstria): normalized and full-length cDNA libraries, expressed sequence tags, and a cDNAmicroarray for the study of insect-induced defences in poplar.Mol. Ecol. 15, 1275–1297.
Rieseberg, L.H., Whitton, J. and Gardner, K. (1999) Hybrid zones andthe genetic architecture of a barrier to gene flow between twosunflower species. Genetics, 152, 713–727.
Schein, J., Kucaba, T., Sekhon, M., Smailus, D., Waterston, R. and
Marra, M. (2004) High-throughput BAC fingerprinting. In BacterialArtificial Chromosomes. Volume 1: Library Construction, PhysicalMapping, and Sequencing (Zhao, S. and Stodolsky, M., eds).Humana Press, Totawa, NJ, pp. 143–156.
Physical mapping of the Populus genome 1077
ª 2007 The AuthorsJournal compilation ª 2007 Blackwell Publishing Ltd, The Plant Journal, (2007), 50, 1063–1078

van der Schoot, J., Pospiskova, M., Vosman, B. and Smulders, M.
(2000) Development and characterization of microsatellite mark-ers in black poplar (Populus nigra L.). Theor. Appl. Genet. 101,317–322.
Schrader, J., Nilsson, J., Mellerowicz, E., Berglund, A., Nilsson, P.,
Hertzberg, M. and Sandberg, G. (2004) A high-resolution tran-script profile across the wood-forming meristem of poplar iden-tifies potential regulators of cambial stem cell identity. Plant Cell,16, 2278–2292.
Soderlund, C., Longden, I. and Mott, R. (1997) FPC: a system forbuilding contigs from restriction fingerprinted clones. Comput.Appl. Biosci. 13, 523–535.
Soderlund, C., Humphray, S., Dunham, A. and French, L. (2000)Contigs built with fingerprints, markers, and FPCV4.7. GenomeRes. 10, 1772–1787.
Song, R. and Messing, J. (2003) Gene expression of a gene family inmaize based on noncollinear haplotypes. Proc. Natl Acad. Sci.USA, 100, 9055–9060.
Sonnhammer, E.L.L. and Durbin, R. (1995) A dot-matrix programwith dynamic threshold control suited for genomic DNA andprotein sequence analysis. Gene, 167, GC1–10.
Sterck, L., Rombauts, S., Jansson, S., Sterky, F., Rouze, P. and Van
de Peer, Y. (2005) EST data suggest that poplar is an ancientpolyploid. New Phytol. 167, 165–170.
Sterky, F., Regan, S., Karlsson, J. et al. (1998) Gene discovery in thewood-forming tissues of poplar: analysis of 5,692 expressedsequence tags. Proc. Natl Acad. Sci. USA, 95, 13330–13335.
Sterky, F., Bhalerao, R.R., Unneberg, P. et al. (2004) A Populus ESTresource for plant functional genomics. Proc. Natl Acad. Sci. USA,101, 13951–13956.
Stirling, B., Newcombe, G., Vrebalov, J., Bosdet, I. and Bradshaw,
H.D. (2001) Suppressed recombination around the MXC3 locus, amajor gene for resistance to poplar leaf rust. Theor. Appl. Genet.103, 1129–1137.
Strauss, S.H. and Martin, F.M. (2004) Poplar genomics comes ofage. New Phytol. 164, 1–4.
Sulston, J., Mallett, F., Staden, R., Durbin, R., Horsnell, T. and
Coulson, A. (1988) Software for genome mapping by finger-printing techniques. Comput. Appl. Biosci. 4, 125–132.
Tagu, D., Bastien, C., Faivre-Rampant, P., Garbaye, J., Vion, P.,
Villar, M. and Martin, F. (2005) Genetic analysis of phenotypicvariation for ectomycorrhiza formation in an interspecific F1poplar full-sib family. Mycorrhiza, 15, 87–91.
Taylor, G. (2002) Populus: Arabidopsis for forestry. Do we need amodel tree? Ann. Bot. 90, 681–689.
Tuskan, G.A., DiFazio, S.P. and Teichmann, T. (2004a) Poplargenomics is getting popular: the impact of the poplar genomeproject on tree research. Plant Biol. 6, 2–4.
Tuskan, G.A., Gunter, L.E., Yang, Z.M.K., Yin, T.M., Sewell, M.M.
and DiFazio, S.P. (2004b) Characterization of microsatellites re-vealed by genomic sequencing of Populus trichocarpa. Can. J.For. Res. 34, 85–93.
Tuskan, G.A., Difazio, S., Jansson, S. et al. (2006) The genome ofblack cottonwood, Populus trichocarpa (Torr. & Gray). Science,313, 1596–1604.
Van Ooijen, J. and Voorrips, R. (2001) JoinMap� 3.0, Software forthe Calculation of Genetic Linkage Maps. Wageningen, TheNetherlands: Plant Research International.
Voorrips, R.E. (2002) MapChart: software for the graphical presen-tation of linkage maps and QTLs. J. Hered. 93, 77–78.
Vos, P., Hogers, R., Bleeker, M. et al. (1995) AFLP – a new techniquefor DNA-fingerprinting. Nucleic Acids Res. 23, 4407–4414.
Wallis, J.W., Aerts, J., Groenen, M.A.M. et al. (2004) A physical mapof the chicken genome. Nature, 432, 761–764.
Wang, Q. and Dooner, H.K. (2006) Remarkable variation in maizegenome structure inferred from haplotype diversity at the bz lo-cus. Proc. Natl Acad. Sci. USA, 103, 17644–17649.
Wang, R.-L., Stec, A., Hey, J., Lukens, L. and Doebley, J. (1999) Thelimits of selection during maize domestication. Nature, 398, 236–239.
Wu, C.C., Sun, S.K., Nimmakayala, P., Santos, F.A., Meksem, K.,
Springman, R., Ding, K., Lightfoot, D.A. and Zhang, H.B. (2004) ABAC and BIBAC-based physical map of the soybean genome.Genome Res. 14, 319–326.
Xu, Z.Y., Sun, S.K., Covaleda, L., Ding, K., Zhang, A.M., Wu, C.C.,
Scheuring, C. and Zhang, H.B. (2004) Genome physical mappingwith large-insert bacterial clones by fingerprint analysis: meth-odologies, source clone genome coverage, and contig mapquality. Genomics, 84, 941–951.
Yang, G.S., Stott, J.M., Smailus, D., Barber, S.A., Balasundaram, M.,
Marra, M.A. and Holt, R.A. (2005) High-throughput sequencing: afailure mode analysis. BMC Genomics, 6, 2.
Yin, T.M., DiFazio, S.P., Gunter, L.E., Riemenschneider, D. and
Tuskan, G.A. (2004) Large-scale heterospecific segregation dis-tortion in Populus revealed by a dense genetic map. Theor. Appl.Genet. 109, 451–463.
Zhu, Y.L., Song, Q.J., Hyten, D.L., Van Tassell, C.P., Matukumalli,
L.K., Grimm, D.R., Hyatt, S.M., Fickus, E.W., Young, N.D. and
Cregan, P.B. (2003) Single-nucleotide polymorphisms in soybean.Genetics, 163, 1123–1134.
1078 Colin T. Kelleher et al.
ª 2007 The AuthorsJournal compilation ª 2007 Blackwell Publishing Ltd, The Plant Journal, (2007), 50, 1063–1078