Expression patterns of type II and III iodothyronine deiodinase genes in the liver of the goldlined...
11
ORIGINAL ARTICLE Biology Expression patterns of type II and III iodothyronine deiodinase genes in the liver of the goldlined spinefoot, Siganus guttatus Nina Wambiji • Yong-Ju Park • Ji-Gweon Park • Se-Jae Kim • Sung-Pyo Hur • Yuki Takeuchi • Akihiro Takemura Received: 17 November 2010 / Accepted: 23 January 2011 / Published online: 10 March 2011 Ó The Japanese Society of Fisheries Science 2011 Abstract Iodothyronine deiodinases play an important role in thyroid hormone regulation in vertebrates. The aim of this study was to clone type II (SgD2) and type III (SgD3) iodothyronine deiodinase cDNA from the goldlined spinefoot (Siganus guttatus) using 3 0 - and 5 0 -rapid ampli- fication of cDNA ends and then to assess their expression patterns in the liver under several experimental conditions by using quantitative real-time PCR. SgD2 (1013 bp) and SgD3 (1492 bp) contained open reading frames of 810 and 804 bp and encoded 270 and 269 amino acids, respec- tively. They were characterized by an in-frame TGA codon that was considered to be selenocysteine. An abundance of SgD2 and SgD3 mRNA was expressed in several tissues, with an increase at 1200 hours and a decrease at 2400 hours. Food deprivation suppressed the expression of SgD2, but not SgD3. Higher SgD2 and SgD3 mRNA levels in the liver were found in fish reared at 25°C than in those reared at 20 and 30°C. These results suggest that exoge- nous factors influence the mRNA levels of iodothyronine deiodinase genes in the liver and that transcription of the genes in certain tissues is partially regulated in a circadian manner. Keywords Cloning Day–night variations Food availability Rabbitfish Quantitative real-time PCR Temperature Introduction There are two types of thyroid hormones (THs), namely, 3,5,3 0 ,5 0 -tetraiodothyronine (T 4 ) and 3,5,3 0 -triiodothyro- nine (T 3 ), both of which play important roles in the phys- iological aspects of growth, development, and reproduction [1, 2]. T 3 is the potent and biologically active form of TH and is produced by the enzymatic outer-ring deiodination (ORD) of T 4 in extrathyroidal tissues. In contrast, the generation of 3,3 0 ,5 0 -triiodothyronine (reverse T 3 or rT 3 ), the inactive form of TH, is produced by inner-ring deio- dination (IRD) [3–5]. ORD and IRD are also active in the metabolic pathways that form the inactive compound 3,3 0 - diiodothyronine (T 2 ) from T 3 and rT 3 , respectively [2]. The deiodination processes that occur during ORD and IRD are considered to be tissue specific and to regulate intracellular TH availability and disposal [6]. Iodothyronine deiodin- ases, which are members of the selenoprotein family, are the enzymes responsible for TH deiodination [4, 7]. Three types of iodothyronine deiodinases have been identified in vertebrates [7]: type-I (D1) enzymes possess ORD and IRD activities, while type-II (D2) and type-III (D3) only have ORD and IRD activity, respectively [4, 8]. It appears that the expression patterns of iodothyronine deiodinases in respective organs are species specific and can vary in the same species depending on the organism’s physiological status [9]. N. Wambiji S.-P. Hur Y. Takeuchi A. Takemura (&) Department of Chemistry, Biology and Marine Sciences, Faculty of Science, University of the Ryukyus, Nishihara, Okinawa 903-0213, Japan e-mail: [email protected] J.-G. Park S.-J. Kim Department of Biology, Jeju National University, 66 Jejudaehakno, Jeju City, Jeju Special Self-Governing Province 690-756, Republic of Korea Y.-J. Park Marine and Environmental Research Institute, Jeju National University, 3288 Hamduk, Jocheon, Jeju Special Self-Governing Province 695-814, Republic of Korea 123 Fish Sci (2011) 77:301–311 DOI 10.1007/s12562-011-0330-2
-
Upload
independent -
Category
Documents
-
view
2 -
download
0
Transcript of Expression patterns of type II and III iodothyronine deiodinase genes in the liver of the goldlined...

ORIGINAL ARTICLE Biology
Expression patterns of type II and III iodothyronine deiodinasegenes in the liver of the goldlined spinefoot, Siganus guttatus
Nina Wambiji • Yong-Ju Park • Ji-Gweon Park •
Se-Jae Kim • Sung-Pyo Hur • Yuki Takeuchi •
Akihiro Takemura
Received: 17 November 2010 / Accepted: 23 January 2011 / Published online: 10 March 2011
� The Japanese Society of Fisheries Science 2011
Abstract Iodothyronine deiodinases play an important
role in thyroid hormone regulation in vertebrates. The aim
of this study was to clone type II (SgD2) and type III
(SgD3) iodothyronine deiodinase cDNA from the goldlined
spinefoot (Siganus guttatus) using 30- and 50-rapid ampli-
fication of cDNA ends and then to assess their expression
patterns in the liver under several experimental conditions
by using quantitative real-time PCR. SgD2 (1013 bp) and
SgD3 (1492 bp) contained open reading frames of 810 and
804 bp and encoded 270 and 269 amino acids, respec-
tively. They were characterized by an in-frame TGA codon
that was considered to be selenocysteine. An abundance of
SgD2 and SgD3 mRNA was expressed in several tissues,
with an increase at 1200 hours and a decrease at
2400 hours. Food deprivation suppressed the expression of
SgD2, but not SgD3. Higher SgD2 and SgD3 mRNA levels
in the liver were found in fish reared at 25�C than in those
reared at 20 and 30�C. These results suggest that exoge-
nous factors influence the mRNA levels of iodothyronine
deiodinase genes in the liver and that transcription of the
genes in certain tissues is partially regulated in a circadian
manner.
Keywords Cloning � Day–night variations � Food
availability � Rabbitfish � Quantitative real-time PCR �Temperature
Introduction
There are two types of thyroid hormones (THs), namely,
3,5,30,50-tetraiodothyronine (T4) and 3,5,30-triiodothyro-
nine (T3), both of which play important roles in the phys-
iological aspects of growth, development, and reproduction
[1, 2]. T3 is the potent and biologically active form of TH
and is produced by the enzymatic outer-ring deiodination
(ORD) of T4 in extrathyroidal tissues. In contrast, the
generation of 3,30,50-triiodothyronine (reverse T3 or rT3),
the inactive form of TH, is produced by inner-ring deio-
dination (IRD) [3–5]. ORD and IRD are also active in the
metabolic pathways that form the inactive compound 3,30-diiodothyronine (T2) from T3 and rT3, respectively [2]. The
deiodination processes that occur during ORD and IRD are
considered to be tissue specific and to regulate intracellular
TH availability and disposal [6]. Iodothyronine deiodin-
ases, which are members of the selenoprotein family, are
the enzymes responsible for TH deiodination [4, 7]. Three
types of iodothyronine deiodinases have been identified in
vertebrates [7]: type-I (D1) enzymes possess ORD and IRD
activities, while type-II (D2) and type-III (D3) only have
ORD and IRD activity, respectively [4, 8]. It appears that
the expression patterns of iodothyronine deiodinases in
respective organs are species specific and can vary in the
same species depending on the organism’s physiological
status [9].
N. Wambiji � S.-P. Hur � Y. Takeuchi � A. Takemura (&)
Department of Chemistry, Biology and Marine Sciences,
Faculty of Science, University of the Ryukyus, Nishihara,
Okinawa 903-0213, Japan
e-mail: [email protected]
J.-G. Park � S.-J. Kim
Department of Biology, Jeju National University,
66 Jejudaehakno, Jeju City, Jeju Special Self-Governing
Province 690-756, Republic of Korea
Y.-J. Park
Marine and Environmental Research Institute, Jeju National
University, 3288 Hamduk, Jocheon, Jeju Special Self-Governing
Province 695-814, Republic of Korea
123
Fish Sci (2011) 77:301–311
DOI 10.1007/s12562-011-0330-2

In certain teleost fishes, deiodination activities of TH
occur primarily in the liver [10, 11]. A deiodination assay
using radiolabeled iodine demonstrated high levels of
activity of low-Km T4ORD (the functional equivalent of D2)
in the liver of a large number of teleost fishes [6, 11–15].
Plasma T3 levels have been found to be highly correlated to
T4ORD activity in the liver of the Atlantic salmon Salmo
salar, suggesting that this organ is a major source of cir-
culating T3 in teleosts [16]. On the other hand, D3-like
activity has also been reported in the liver of salmonids
[17, 18], sturgeon Acipenser fulvescens [19], walleye
Sander vitreus [20], American plaice Hippoglossoides
platessoides [21], and Nile tilapia Oreochromis niloticus
[22]. Feeding Nile tilapia and rainbow trout Oncorhynchus
mykiss with T3-supplemented food resulted in an increase in
D3 activity in the liver and gills but not in the brain and
kidney [23–25], while rainbow trout immersed in a solution
supplemented with T4 showed induced D3 activity in the
brain, liver, and retina [26]. These findings for D2 and D3
indicate that alternations in hepatic iodothyronine deiodin-
ase activity impact on the TH-based status in certain
peripheral organs.
Acclimation to low temperature conditions was
observed to decrease D2 activity in the liver of the Atlantic
cod Gadus morhua [14]. The enzymatic activities of D2
and D3 in fish are also affected by nutritive and stress
conditions [27, 28], and D2 activity in the liver has been
shown to respond to sex steroids and pituitary hormones
[29–31]. These results demonstrate that the hepatic deio-
dination processes are directly or indirectly affected by
endogenous and exogenous factors [2]. To date, most
studies on THs in fish have focused on the effects of
environmental factors on deiodinase enzyme activities, and
few studies have employed molecular approaches to eval-
uate the effects of such factors on the expression of iodo-
thyronine deiodinase genes in fish, although those genes
have been fully cloned and characterized in Nile tilapia [3]
and rainbow trout [32]. The aim of the study reported here
was to assess the molecular characteristics of iodothyro-
nine deiodinases in the liver of the goldlined spinefoot
(formerly referred to as the golden rabbitfish or orange-
spotted spinefoot), Siganus guttatus, a common coral reefs
species and an important fish resource in Southeast Asian
countries. Since TH is closely related to reproductive and
nutritive conditions, understanding the status of D2 and D3
in the liver may lead to improved aquaculture technologies
for this species. We first cloned the cDNA for D2 and D3
from this species (SgD2 and SgD3, respectively). After
establishing an assay system to measure D2 and D3 mRNA
levels by using quantitative real-time PCR (qPCR), we
assessed day–night differences in SgD2 and SgD3 mRNA
abundance in several tissues, as well as the effects of food
deprivation and temperature on their expression in the
liver.
Materials and methods
Fish
Juvenile goldlined spinefoot with a body mass of
0.08–0.15 g were caught using small-mesh nets from the
mangrove estuary of the Teima River, Northern Okinawa,
Japan, during daytime, at low tide, around the time of the
new moon in July and August. They were reared under
natural photoperiodic conditions in holding tanks (capac-
ity 1 or 5 t) containing constantly flowing seawater at
ambient temperature at the Sesoko Station, Tropical
Biosphere Research Center, University of the Ryukyus,
Okinawa, Japan. The fish were fed daily at 1000 hours
with commercial pellets (EP1 and then EP2; Marubeni
Nisshin, Tokyo, Japan). Immature fish with a mean body
mass of 200 ± 0.5 g (age 1) and mature fish with a mean
body mass of 346 ± 0.5 g (age 3 and 4) were used in the
study.
All experiments were conducted in compliance with the
Animal Care and Use Committee guidelines of the Uni-
versity of the Ryukyus and with the regulations for the care
and use of laboratory animals in Japan.
Sample collections for molecular cloning and tissue
expression
The fish were transferred to outdoor polyethylene tanks
(capacity 300 l) containing running seawater and accli-
mated to the rearing conditions with a fixed food provi-
sion at 1000 hours for 1 week. The fish were taken from
the tanks at 1200 hours, anesthetized with 2-phenoxy-
ethanol (Kanto Chemical, Tokyo, Japan), and immediately
killed by decapitation. The whole brain was taken from
the mature fish (n = 3) for the molecular cloning of SgD2
and SgD3 cDNA. For the analysis of the tissue distribu-
tion of SgD2 and SgD3 mRNA, the whole brain, retina,
gills, liver, spleen, kidney, gonads, heart, and skin were
collected at 1200 hours (n = 7) and 2400 hours (n = 7)
from immature fish that were acclimated under the same
conditions. The samples were immediately immersed in
RNAlater (Applied Biosystems, Foster City, CA) at 4�C
and then stored at -20�C until further analysis. During
the dark period, samples were collected under a dim red
light. Since the day/night variations of both deiodinases
among the tissues were higher during the day than at
night, we subsequently collected all our samples at
1200 hours.
302 Fish Sci (2011) 77:301–311
123
Effects of food deprivation and temperature on gene
expression
For the food deprivation experiment, immature fish were
transferred to two polyethylene tanks (capacity 300 l)
containing running seawater at 25 ± 1.0�C under natural
photoperiodic conditions. The fish (n = 7) in one tank
were fed daily at 1000 hours with commercial pellets at 5%
of their body mass, while the fish (n = 7) in the other tank
were not fed after the initiation of the experiment. After
rearing under these conditions for 1 week, the fish from
each tank were anesthetized and sacrificed at 1200 hours.
After weighing, blood was collected from the caudal vein
using heparinized syringes and centrifuged at 10,000 g for
10 min at 4�C to obtain plasma samples that were stored at
-20�C until their glucose levels could be measured. The
liver was then taken from the body cavity and weighed.
Pieces of the liver were immersed in RNAlater at 4�C and
stored at -20�C until analysis. The hepatosomatic index
(HSI) was calculated using the following formula:
HSI = (liver mass/body mass) 9 100.
For the temperature experiment, immature fish (8 fish
per aquarium) were transferred to three glass aquaria
(capacity 60 l) with running seawater at 25�C, maintained
under LD = 12:12 by placing a fluorescent lamp (20 W)
above each aquarium that provided illumination at 1200 lx
(light intensity 2.23 W/m2), which was measured using a
quantum photoradiometer (model HD 9021, Delta OHM,
Padova, Italy). After acclimation for 1 week, the temper-
ature of each aquarium was gradually changed using a
temperature control system with a programmable set point
to 20�C (lowest in winter), 25�C (temperature during
spawning season), and 30�C (highest in summer). The fish
were fed with commercial pellets daily at 1000 hours at 5%
of their body mass. One week after rearing the fish under
these conditions, samples were collected as mentioned
above.
Measurement of glucose levels
Plasma glucose levels were determined using the Glucose
CII Test Wako kit (Wako Pure Chemical Industries, Osaka,
Japan) according to the manufacturer’s instructions.
Extraction of RNA and cDNA synthesis
Total RNA was extracted from the tissues using the Tri-
Pure Isolation Reagent (Roche Applied Science, Hague
Road, IN) according to the manufacturer’s instructions.
When necessary, the samples for qPCR were treated with
deoxyribonuclease (RT grade; Nippon Gene, Tokyo,
Japan) at 37�C for 15 min to avoid contamination with
genomic DNA. The amount of RNA was measured at
260/280 nm, and samples with an absorbance ratio (A260/
A280) of 1.8–2.0 were used for cDNA synthesis.
Complementary DNA (cDNA) was reverse-transcribed
from 0.5 lg of total RNA using the High Capacity cDNA
Reverse Transcription kit (Applied Biosystems) for qPCR
and molecular cloning according to the manufacturer’s
instructions. For cloning, the first strand cDNA was syn-
thesized from 1 lg of total RNA using PrimeScript 1st
strand cDNA Synthesis kit (Takara Bio, Otsu, Japan).
Cloning of the iodothyronine deiodinase genes
The SgD2 and SgD3 cDNA fragments were amplified
using degenerate oligonucleotide primers (SgD2-F2 and
SgD2-R1 for SgD2, and SgD3-F1 and SgD3-R2 for SgD3)
that were designed on the basis of the highly conserved
regions of the target genes using Primer3 software
(Whitehead Institute/Massachusetts Institute of Technol-
ogy, Boston, MA) (Table 1). Oligonucleotide primers were
designed on the basis of the D2 sequences of the tiger
pufferfish Takifugu rubripes (GenBank accession no.
AB360768), bastard halibut Paralichthys olivaceus
(AB362422), and mummichog Fundulus heteroclitus
(FHU70869), and on the basis of D3 sequences of the Nile
tilapia (Y11111), tiger pufferfish (AB360769), and bastard
halibut (AB362423) (Table 1). The PCR was performed in
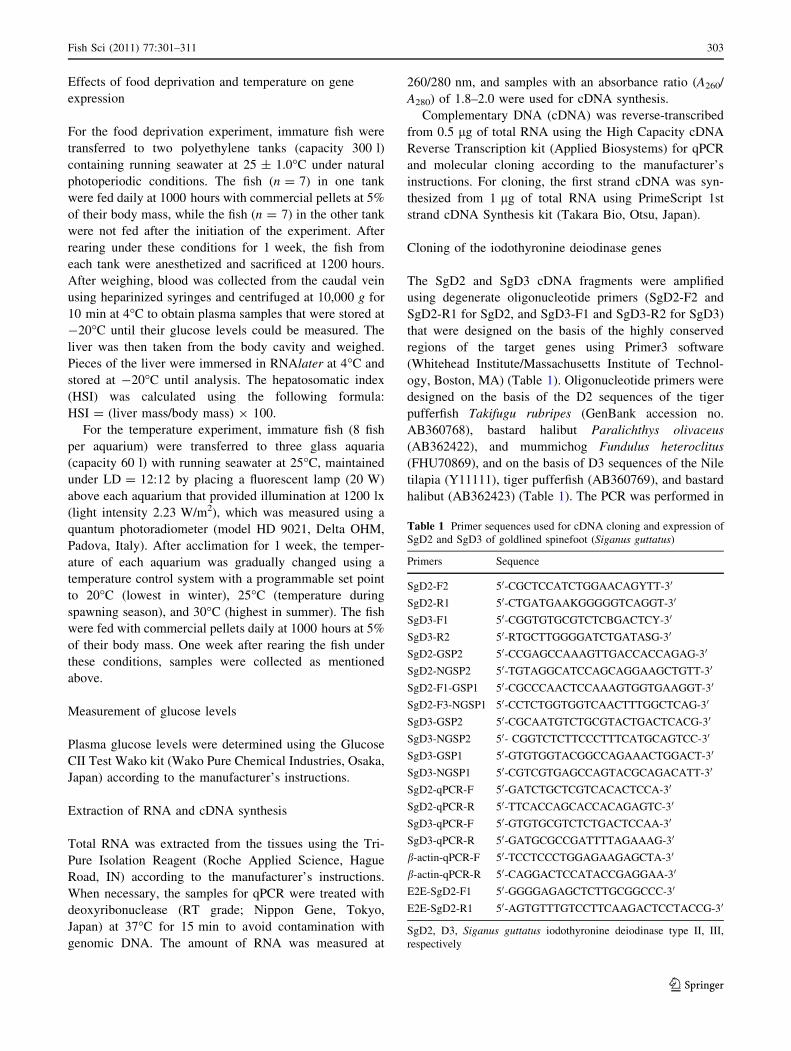
Table 1 Primer sequences used for cDNA cloning and expression of
SgD2 and SgD3 of goldlined spinefoot (Siganus guttatus)
Primers Sequence
SgD2-F2 50-CGCTCCATCTGGAACAGYTT-30
SgD2-R1 50-CTGATGAAKGGGGGTCAGGT-30
SgD3-F1 50-CGGTGTGCGTCTCBGACTCY-30
SgD3-R2 50-RTGCTTGGGGATCTGATASG-30
SgD2-GSP2 50-CCGAGCCAAAGTTGACCACCAGAG-30
SgD2-NGSP2 50-TGTAGGCATCCAGCAGGAAGCTGTT-30
SgD2-F1-GSP1 50-CGCCCAACTCCAAAGTGGTGAAGGT-30
SgD2-F3-NGSP1 50-CCTCTGGTGGTCAACTTTGGCTCAG-30
SgD3-GSP2 50-CGCAATGTCTGCGTACTGACTCACG-30
SgD3-NGSP2 50- CGGTCTCTTCCCTTTCATGCAGTCC-30
SgD3-GSP1 50-GTGTGGTACGGCCAGAAACTGGACT-30
SgD3-NGSP1 50-CGTCGTGAGCCAGTACGCAGACATT-30
SgD2-qPCR-F 50-GATCTGCTCGTCACACTCCA-30
SgD2-qPCR-R 50-TTCACCAGCACCACAGAGTC-30
SgD3-qPCR-F 50-GTGTGCGTCTCTGACTCCAA-30
SgD3-qPCR-R 50-GATGCGCCGATTTTAGAAAG-30
b-actin-qPCR-F 50-TCCTCCCTGGAGAAGAGCTA-30
b-actin-qPCR-R 50-CAGGACTCCATACCGAGGAA-30
E2E-SgD2-F1 50-GGGGAGAGCTCTTGCGGCCC-30
E2E-SgD2-R1 50-AGTGTTTGTCCTTCAAGACTCCTACCG-30
SgD2, D3, Siganus guttatus iodothyronine deiodinase type II, III,
respectively
Fish Sci (2011) 77:301–311 303
123

25 ll of sample with Go Taq Green Master Mix (Promega,
Madison, WI) under the following cycling conditions: 1
cycle of initial denaturation for 2 min at 94�C; 35 cycles of
denaturation at 94�C for 45 s, annealing at 58�C for 45 s,
and 72�C for 1 min. The PCR products were separated on a
1% agarose gel with an appropriate molecular weight
marker, stained with ethidium bromide, and visualized
under UV illumination (ATTO, Tokyo, Japan). When the
PCR products of the predicted sizes were obtained, these
were purified using the Wizard SV Gel and PCR Clean-up
System kit (Promega) and ligated. The purified products
(233 and 281 bp for SgD2 and SgD3, respectively) were
then cloned into the pGEM T-Easy Vector (Promega) and
sequenced.
Rapid amplification of cDNA ends (RACE) was carried
out using the SMART RACE cDNA Amplification kit
(Clontech Laboratories, Mountain View, CA) according to
the manufacturer’s instructions. On the basis of the
sequence of the partial cDNA fragments described above,
the specific primers and nested primers for the RACE of
SgD2 (SgD2-GSP2, SgD2-NGSP2, SgD2-F1-GSP1, and
SgD2-F3-NGSP1) and those for the RACE of SgD3
(SgD3-GSP2, SgD3-NGSP2, SgD3-GSP1, and SgD3-
NGSP1) were designed for the 50- and 30-ends, respectively
(Table 1). RACE reactions in the first PCR were performed
using the Universal Primer A Mix (UPM) and the gene-
specific primer in a three-step touchdown PCR program:
(1) 5 cycles of 94�C for 30 s and 72�C for 3 min; (2) 5
cycles of 94�C for 30 s, 70�C for 30 s, and 72�C for 3 min;
(3) 25 cycles of 94�C for 30 s, 68�C for 30 s, and 72�C for
3 min. Nested PCR was performed using the 20-fold
diluted first PCR products as a template with the Nested
Universal Primer A (NUP) and each gene-specific nested
primer at the following cycling conditions: 94�C for 2 min;
25 cycles of 94�C for 30 s, 68�C for 30 s, and 72�C for
2 min; a final step of 72�C for 3 min [33]. The cDNA
fragments amplified by RACE were cloned into the pGEM-
T Easy vector and then sequenced.
Sequence analysis
The nucleotide and deduced amino acid sequences were
analyzed using the BLAST program (http://ncbi.nlm.nih.
gov/BLAST). Multiple alignments for phylogenetic anal-
ysis were performed using the full-length deiodinase
sequences of several vertebrates by the ClustalW program
(http://www.ebi.ac.uk/clustalw).
Real-time quantitative PCR (qPCR)
The expression levels of SgD2 and SgD3 mRNA were
assessed using the CFX96 Real-Time System C1000
thermal cycler (Bio-Rad, Hercules, CA). The forward and
reverse primers for the qPCR (SgD2-qPCR-F and SgD2-
qPCR-R for SgD2; SgD3-qPCR-F and SgD3-qPCR-R for
SgD3; b-actin-qPCR-F and b-actin-qPCR-R for b-actin)
were designed as shown in Table 1. b-actin mRNA levels
in the same sample were determined using qPCR to nor-
malize the expression data [33]. The qPCR reaction mix-
ture (10 ll) contained 5 ll Express SYBR GreenER qPCR
Supermix Universal (Invitrogen, Carlsbad, CA), 0.3 lM
forward primer, 0.3 lM reverse primer, 2 ll cDNA tem-
plate, and 2.4 ll RNase-free water. The following PCR
cycling conditions were used: 95�C for 30 s; 40 cycles of
95�C for 5 s and 60�C for 34 s. To ensure the specificity of
the PCR amplicons, a melting curve analysis was carried
out by raising the temperature of the sample slowly from
60 to 95�C until the final step of the PCR. The expression
levels of SgD2, SgD3, and b-actin mRNA were measured
in triplicate. Data were normalized relative to the mean
expression level of each gene and analyzed using the
normalized gene expression [DDC(t)] method [34].
Statistical analysis
All data were expressed as the mean ± standard error of
the mean (SEM). Normality was tested using the Kol-
mogorov–Smirnov method. Student’s t test and the Mann–
Whitney U test were used to analyze the statistical differ-
ences between two sets of data. A one-way analysis of
variance (ANOVA) was performed for the temperature
experiment. Probabilities of P \ 0.05 and P \ 0.01 were
considered to be statistically significant.
Results
Cloning and properties of SgD2 and SgD3
The RACE analyses of SgD2 cDNA yielded a 1013 bp
fragment with an open reading frame (ORF) of 810 bp
(Fig. 1). The predicted amino acid sequence was 270 res-
idues long. The ORF was interrupted by an in-frame TGA
codon at position 591 that was likely to encode for sele-
nocysteine (Sec); however, the sequence did not contain a
SECIS element that has been reported to be responsible for
the incorporation of Sec into the protein during translation.
The SgD3 cDNA consisted of a 1492 bp fragment with an
ORF of 804 bp. The Sec residue was at position 504. The
predicted amino acid sequence of SgD3 was 269 residues
long (Fig. 2).
In terms of the amino acid sequence, SgD2 showed a
high similarity with D2 from several teleosts, such as the
gilthead seabream Sparus aurata (90%), bastard halibut
(85%), medaka Oryzias latipes (83%), and tiger pufferfish
(80%). It showed a moderately high similarity with D2
304 Fish Sci (2011) 77:301–311
123

from the rat Rattus norvegicus (69%) and chicken Gallus
gallus (70%). SgD3 also showed a high similarity with D2
from gilthead seabream and Nile tilapia (90%), Senegalese
sole Solea senegalensis (86%), bastard halibut (83%), and
Atlantic halibut Hippoglossus hippoglossus (79%) and had
equally high similarities with D2 from the cow Bos taurus
(67%) and chicken (72%) (data not shown).
Tissue distribution of iodothyronine deiodinase genes
The tissue distribution of SgD2 and SgD3 was examined at
1200 and 2400 hours using qPCR. SgD2 and SgD3 mRNA
were detected in all of the tissues tested. A comparison of
the expression of SgD2 mRNA in various tissues at
1200 hours revealed high expression in the liver, brain,
skin, and spleen (Fig. 3a). High levels of SgD3 mRNA
were observed in the liver, brain, retina, spleen, and skin
(Fig. 3b).
Day–night differences in the abundance of SgD2 and
SgD3 mRNA were observed. The expression levels of SgD2
in the liver, skin, brain, heart, and gonads were significantly
higher at 1200 hours than at 2400 hours. A significantly
higher expression of SgD3 mRNA during the daytime was
also observed in the liver, retina, brain, gills, heart, gonads,
and skin. Negligible levels of SgD2 mRNA were observed
in the gonads and heart, while the smallest amount of SgD3
mRNA was detected in the kidney followed by the gills and
the heart at 2400 hours (Fig. 3a, b).
Food deprivation
The effects of food deprivation on HSI and glucose were
examined at 1200 hours. Following food deprivation, HSI
and plasma glucose levels significantly decreased (Fig. 4a,
b) and glycogen levels in the liver dropped (data not
shown). The effects of food deprivation on SgD2 and SgD3
mRNA expression in the liver at 1200 hours are shown in
Fig. 5. Food deprivation significantly lowered the abun-
dance of SgD2 mRNA (P \ 0.05) (Fig. 5a), but not of
SgD3 (Fig. 5b).
Fig. 1 Nucleotide and deduced
amino acid sequence of the
Siganus guttatus iodothyronine
deiodinase type II (SgD2)
cDNA clone. The complete
mRNA spans 1013 bp with an
open reading frame (ORF) of
810 bp (270 amino acids). Secin bold Selenocysteine residue
at position 591. The start and
stop codons are indicated in
bold, with the stop codon
denoted by an asterisk
Fish Sci (2011) 77:301–311 305
123

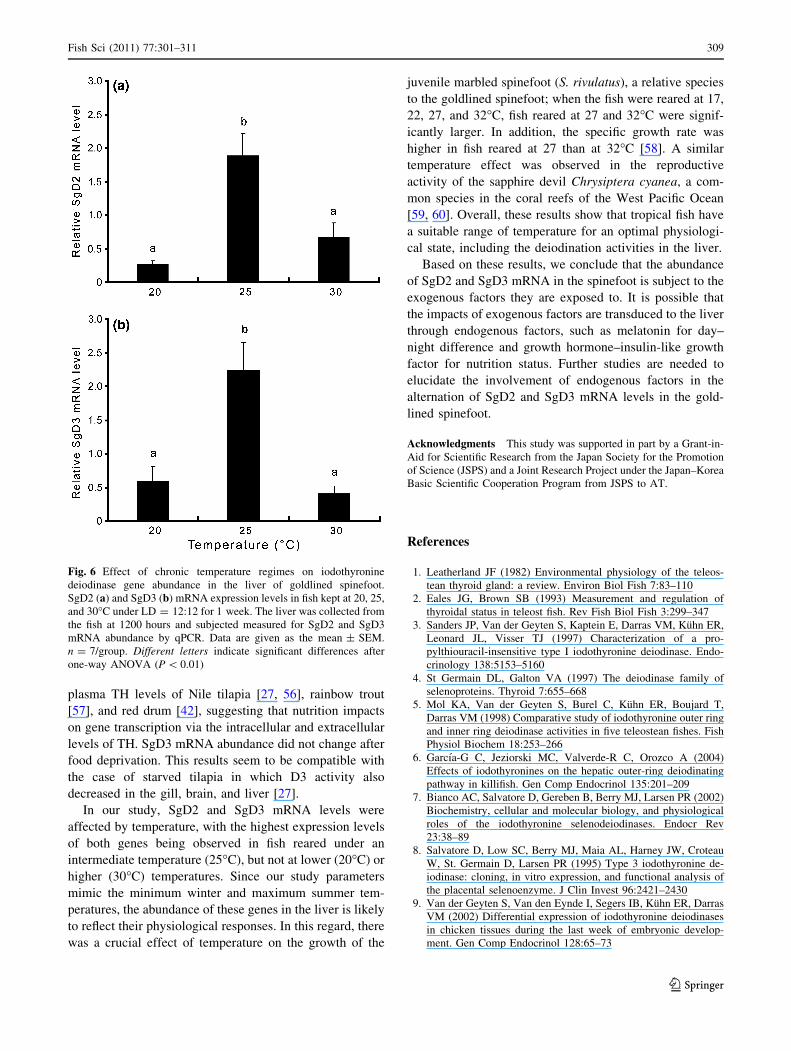
Temperature
Effects of SgD2 and SgD3 mRNA expression were
examined in the liver for the range of water temperatures
encountered in the habitats of the goldlined spinefoot
(Fig. 6). We observed that temperature significantly
affected the expression of SgD2 and SgD3 mRNA
(P \ 0.01). The levels of SgD2 transcription were signifi-
cantly higher (P \ 0.01) at 25�C than at 20 and 30�C
(Fig. 6a). A similar temperature effect was observed for
SgD3 mRNA levels (P \ 0.01) (Fig. 6b).
Discussion
The first step of this study was the cloning and character-
ization of cDNA encoding type II (SgD2) and type III
(SgD3) iodothyronine deiodinase of the goldlined spine-
foot, with the aim of evaluating the effects of food depri-
vation and temperature on SgD2 and SgD3 mRNA
abundance in the liver. The ORF of SgD2 and SgD3 con-
tained an in-frame TGA stop codon that is characterized by
the presence of selenocysteine. The incorporation of an
essential selenocysteine residue within the catalytic domain
requires the presence of a premature stop codon (TGA) in
the ORF and a SECIS element located in the 30 untrans-
lated region (UTR) of the cDNA [35]. We identified a
SECIS element in the 30 UTR of SgD3 located between
nucleotide positions 1267 and 1367, but we failed to
identify a SECIS element in SgD2 and may therefore have
sub-cloned a fragment without a 30 UTR and poly (A) sig-
nal in this study. The difficulty in obtaining such a frag-
ment may be partially attributable to the occurrence of long
introns; it has been reported in mammals that the 30 UTR of
D2 has long introns (8.1–8.5 kb) within two exons [36].
Similar incomplete sequences have been reported for D2 of
the Senegalese sole [37] and mummichog [38] and con-
sidered to be due to either the lack of an extended 30 UTR
(up to 7.5 kb in length) including the SECIS structure [39]
or the fragment being a splice variant [37]. The full
sequence of mummichog D2 cDNA was later cloned and a
SECIS element was found within the 4652 bp region with
an intron divided by a 4.8 kb exon [40].
SgD2 mRNA was highly expressed in the liver, skin,
brain, and spleen, and SgD3 mRNA was highly expressed
in the liver, retina, brain, and skin, although the expression
of both genes was, to some extent, detected in all of the
tissues tested. These results suggest that the organs and
Fig. 2 Nucleotide and deduced
amino acid sequence of the S.guttatus iodothyronine
deiodinase type III (SgD3)
sequence of the full-length
cDNA clone. The complete
mRNA spans 1492 bp with an
ORF of 804 bp (269 amino
acids). Sec in boldSelenocysteine residue at
position 504. The start and stop
codons are indicated in bold,
with the stop codon denoted by
an asterisk. The putative SECIS
element determined by the
SECISearch ver. 2.19 in the 30
untranslated region is
underlined. The
polyadenylation signal is in
italics and underlined
306 Fish Sci (2011) 77:301–311
123

tissues with a high expression of SgD2 and SgD3 play a
role in metabolism of thyroid hormones. Exceptionally
high SgD3 mRNA levels were detected in the retina, fol-
lowed by the brain. The transcription pattern of both genes
was different in the respective tissues, as has also been
observed in some mammals and birds [41, 48] and fishes
[20, 22] where the deiodinases were found to be regulated
in relation to growth and development, hormonal treat-
ment, thyroid status, pollution biomarkers, and food
availability. A simultaneous comparison of D2 and D3
mRNA levels has been carried out in walleye using reverse
transcription-PCR; D2 mRNA abundance in the liver was
significantly higher than in all other tissues, while D3
mRNA was highly expressed in the liver and whole eye,
followed by the brain, gills, and skin [20]. In terms of
deiodination activities, high levels of T4ORD and T4IRD
were observed in the liver and brain, respectively, of the
blue tilapia O. aureus [42], salmonids [43], and Atlantic
cod [14]. In rainbow trout under physiological conditions,
the predominant deiodinase pathways in the brain were
observed to autoregulate T3 levels through the degradation
of T4 and T3, while the liver generated T3 [12]. A positive
correlation between hepatic D2 activity and plasma T3
levels has been found in the Nile tilapia [27] and red drum
Sciaenops ocellatus [44]. This situation appears to vary
among vertebrates; D1 inactivation and D3 activation
coincidentally occur in the mammalian liver [45–47], while
the activation of hepatic D3 is one of the main factors
responsible for decreasing plasma T3 levels in chicken
[48].
To the best of our knowledge, daily variations of iodo-
thyronine deiodinase transcript levels have only been
reported in the late metamorphic stages of the Senegalese
sole [37]; D3 transcript levels in larval homogenates were
measured using qPCR and found to significantly increase
from Zeitgeber time (ZT) 7 to ZT12 and then decrease
from ZT12 to ZT24. The results of our study clearly show
that the abundance of SgD2 and SgD3 mRNA in several
tissues was higher at 1200 hours than at 2400 hours, sug-
gesting that TH levels fluctuate daily. In contrast to T4,
little or no daily variation in plasma T3 levels has been
reported in certain teleosts [49, 50]. However, the plasma
levels of total triiodothyronine (TT3) were found to
increase during the scotophase in juvenile Atlantic salmon
parr when they were reared under LD = 8:16 in the winter,
while in the spring the TT3 levels were higher in smolts,
but there was no daily rhythm. The opposite effect was
observed for total thyroxine in parrs and smolts [51]. Daily
Fig. 3 Tissue distribution of
iodothyronine deiodinase gene
abundance. a SgD2 and b SgD3
mRNA expression in goldlined
spinefoot kept under natural
conditions for 1 week and
sampled at 1200 hours (whitebars) and at 2400 hours (blackbars). Data are given as the
mean ± standard error of the
mean (SEM) (n = 7/group).
Asterisks significant differences
according to Student’s t test
(P \ 0.05)
Fish Sci (2011) 77:301–311 307
123

fluctuations of plasma T4 and T3 levels has also been
reported in juvenile red drum, with an increase during the
photophase in fish fed 1 h before the light were turned off,
dusk-fed fish, and dawn-fed fish kept under LD = 12:12 at
23�C [42]. Similar increases in plasma TH levels during
the photophase were observed in goldfish Carassius
auratus reared under LD = 12:12 [52] and in channel
catfish Ictalurus punctatus reared under a natural photo-
period in July [53]. A free-running circadian rhythm of
circulating T4 levels was also noted in the juvenile red
drum reared under constant photoperiod conditions with
and without feeding [54]. These findings imply that an
endogenous circadian clock regulates TH levels. Concur-
rent variations of T3 with T4 in certain teleost species may
mean that the activity of D2 and D3 is regulated by the
circadian system and that it influences the intercellular and
extracellular levels of TH. Our data may imply that mel-
atonin is directly or indirectly related to daily variations in
SgD2 and SgD3 mRNA in the liver because this hormone
increased during nighttime (peak at 2400 hours) and
decreased during daytime. In fact, the expression of SgD2
in the hypothalamus was down-regulated by melatonin
administration (Wambiji, Hur, Takeuchi, and Takemura
unpublished data). Similar effects of melatonin on the
expression of iodothyronine deiodinase genes may occur in
the liver.
Our results demonstrate that food deprivation lowered
plasma glucose and hepatic glycogen levels, similar to
results reported for channel catfish [55], suggesting that
stored nutrients in the liver are mobilized after food
deprivation. Concomitant with these metabolic changes,
the mRNA abundance of hepatic SgD2 decreased follow-
ing food deprivation. It was reported that hepatic D2
activity decreases after starvation, with concurrent increa-
ses in plasma T3 levels and hepatic D2 activity after re-
feeding [27]. Food deprivation was observed to lower the
Fig. 4 Effect of food deprivation on nutritive parameters of goldlined
spinefoot. Hepatosomatic index (a) and plasma glucose levels (b) in
fed and unfed fish (n = 7 per group) after a 1-week experimental
period. The liver was collected from the fish at 1200 hours. Data are
given as the mean ± SEM. Asterisks significant differences according
to Student’s t test (P \ 0.05)
Fig. 5 Effect of food deprivation on iodothyronine deiodinase gene
abundance in the liver of goldlined spinefoot. SgD2 (a) and SgD3
(b) mRNA expression levels in fed and unfed fish after a 1-week
experimental period. The liver was collected from the fish at
1200 hours and measured for SgD2 and SgD3 mRNA abundance by
qPCR. Data are given as the mean ± SEM (n = 7/group). Asteriskssignificant differences according to Student’s t test (P \ 0.05)
308 Fish Sci (2011) 77:301–311
123
plasma TH levels of Nile tilapia [27, 56], rainbow trout
[57], and red drum [42], suggesting that nutrition impacts
on gene transcription via the intracellular and extracellular
levels of TH. SgD3 mRNA abundance did not change after
food deprivation. This results seem to be compatible with
the case of starved tilapia in which D3 activity also
decreased in the gill, brain, and liver [27].
In our study, SgD2 and SgD3 mRNA levels were
affected by temperature, with the highest expression levels
of both genes being observed in fish reared under an
intermediate temperature (25�C), but not at lower (20�C) or
higher (30�C) temperatures. Since our study parameters
mimic the minimum winter and maximum summer tem-
peratures, the abundance of these genes in the liver is likely
to reflect their physiological responses. In this regard, there
was a crucial effect of temperature on the growth of the
juvenile marbled spinefoot (S. rivulatus), a relative species
to the goldlined spinefoot; when the fish were reared at 17,
22, 27, and 32�C, fish reared at 27 and 32�C were signif-
icantly larger. In addition, the specific growth rate was
higher in fish reared at 27 than at 32�C [58]. A similar
temperature effect was observed in the reproductive
activity of the sapphire devil Chrysiptera cyanea, a com-
mon species in the coral reefs of the West Pacific Ocean
[59, 60]. Overall, these results show that tropical fish have
a suitable range of temperature for an optimal physiologi-
cal state, including the deiodination activities in the liver.
Based on these results, we conclude that the abundance
of SgD2 and SgD3 mRNA in the spinefoot is subject to the
exogenous factors they are exposed to. It is possible that
the impacts of exogenous factors are transduced to the liver
through endogenous factors, such as melatonin for day–
night difference and growth hormone–insulin-like growth
factor for nutrition status. Further studies are needed to
elucidate the involvement of endogenous factors in the
alternation of SgD2 and SgD3 mRNA levels in the gold-
lined spinefoot.
Acknowledgments This study was supported in part by a Grant-in-
Aid for Scientific Research from the Japan Society for the Promotion
of Science (JSPS) and a Joint Research Project under the Japan–Korea
Basic Scientific Cooperation Program from JSPS to AT.
References
1. Leatherland JF (1982) Environmental physiology of the teleos-
tean thyroid gland: a review. Environ Biol Fish 7:83–110
2. Eales JG, Brown SB (1993) Measurement and regulation of
thyroidal status in teleost fish. Rev Fish Biol Fish 3:299–347
3. Sanders JP, Van der Geyten S, Kaptein E, Darras VM, Kuhn ER,
Leonard JL, Visser TJ (1997) Characterization of a pro-
pylthiouracil-insensitive type I iodothyronine deiodinase. Endo-
crinology 138:5153–5160
4. St Germain DL, Galton VA (1997) The deiodinase family of
selenoproteins. Thyroid 7:655–668
5. Mol KA, Van der Geyten S, Burel C, Kuhn ER, Boujard T,
Darras VM (1998) Comparative study of iodothyronine outer ring
and inner ring deiodinase activities in five teleostean fishes. Fish
Physiol Biochem 18:253–266
6. Garcıa-G C, Jeziorski MC, Valverde-R C, Orozco A (2004)
Effects of iodothyronines on the hepatic outer-ring deiodinating
pathway in killifish. Gen Comp Endocrinol 135:201–209
7. Bianco AC, Salvatore D, Gereben B, Berry MJ, Larsen PR (2002)
Biochemistry, cellular and molecular biology, and physiological
roles of the iodothyronine selenodeiodinases. Endocr Rev
23:38–89
8. Salvatore D, Low SC, Berry MJ, Maia AL, Harney JW, Croteau
W, St. Germain D, Larsen PR (1995) Type 3 iodothyronine de-
iodinase: cloning, in vitro expression, and functional analysis of
the placental selenoenzyme. J Clin Invest 96:2421–2430
9. Van der Geyten S, Van den Eynde I, Segers IB, Kuhn ER, Darras
VM (2002) Differential expression of iodothyronine deiodinases
in chicken tissues during the last week of embryonic develop-
ment. Gen Comp Endocrinol 128:65–73
Fig. 6 Effect of chronic temperature regimes on iodothyronine
deiodinase gene abundance in the liver of goldlined spinefoot.
SgD2 (a) and SgD3 (b) mRNA expression levels in fish kept at 20, 25,
and 30�C under LD = 12:12 for 1 week. The liver was collected from
the fish at 1200 hours and subjected measured for SgD2 and SgD3
mRNA abundance by qPCR. Data are given as the mean ± SEM.
n = 7/group. Different letters indicate significant differences after
one-way ANOVA (P \ 0.01)
Fish Sci (2011) 77:301–311 309
123

10. MacLatchy DL, Eales JG (1992) Properties of T4 50-deiodinating
systems in various tissues of the rainbow trout, Oncorhynchusmykiss. Gen Comp Endocrinol 86:313–322
11. Mol K, Kaptein E, Darras VM, de Greef WJ, Kuhn ER, Visser TJ
(1993) Different thyroid hormone-deiodinating enzymes in tilapia
(Oreochromis niloticus) liver and kidney. FEBS Lett 321:140–144
12. Frith SD, Eales JG (1996) Thyroid hormone deiodination path-
ways in brain and liver of rainbow trout, Oncorhynchus mykiss.
Gen Comp Endocrinol 101:323–332
13. Moore VanPutte CL, MacKenzie DS, Eales JG (2001) Charac-
terization of hepatic low-Km outer-ring deiodination in red drum
(Sciaenops ocellatus). Comp Biochem Physiol B 128:413–423
14. Cyr DG, Idler DR, Audet C, McLeese JM, Eales JG (1998)
Effects of long-term temperature acclimation on thyroid hormone
deiodinase function, plasma thyroid hormone levels, growth, and
reproductive status of male Atlantic cod, Gadus morhua. Gen
Comp Endocrinol 109:24–36
15. Orozco A, Linser P, Valverde-R C (2000) Kinetic characteriza-
tion of outer-ring deiodinase activity (ORD) in the liver, gill and
retina of the killifish Fundulus heteroclitus. Comp Biochem
Physiol B 126:283–290
16. Morin PP, Hara TJ, Eales JG (1993) Thyroid hormone deiodin-
ation in brain, liver, gill, heart and muscle of Atlantic salmon
(Salmo salar) during photoperiodically-induced parr-smolt
transformation. I. Outer- and inner-ring thyroxine deiodination.
Gen Comp Endocrinol 90:142–156
17. Johnston CE, Eales JG (1995) Effects of acclimation and assay
temperature on outer- and inner-ring thyroxine and 3, 5, 30-trii-odo-L-thyronine deiodination by liver microsomes of rainbow
trout, Oncorhynchus mykiss. J Exp Zool 272:426–434
18. Specker JL, Eales JG, Tagawa M, Tyler WA III (2000) Parr-
smolt transformation in Atlantic salmon: thyroid hormone deio-
dination in liver and brain and endocrine correlates of change in
rheotactic behavior. Can J Zool 78:696–705
19. Plohman JC, Dick TA, Eales JG (2002) Thyroid of lake sturgeon,
Acipenser fulvescens II. Deiodination properties, distribution, and
effects of diet, growth, and a T3 challenge. Gen Comp Endocrinol
125:56–66
20. Picard-Aitken M, Fournier H, Pariseau R, Marcogliese DJ, Cyr
DG (2007) Thyroid disruption in walleye (Sander vitreus)
exposed to environmental contaminants: cloning and use of
iodothyronine deiodinases as molecular biomarkers. Aquat Tox-
icol 83:200–211
21. Adams BA, Cyr DG, Eales JG (2000) Thyroid hormone deio-
dination in tissues of American plaice, Hippoglossoides plat-essoides: characterization and short-term responses to
polychlorinated biphenyls (PCBs) 77 and 126. Comp Biochem
Physiol C 127:367–378
22. Sanders JP, Van der Geyten S, Kaptein E, Darras VM, Kuhn ER,
Leonard JL, Visser TJ (1999) Cloning and characterization of
type III iodothyronine deiodinase from the fish Oreochromisniloticus. Endocrinology 140:3666–3673
23. Finnson KR, Eales JG (1999) Effect of T3 treatment and food
ration on hepatic deiodination and conjugation of thyroid hor-
mones in rainbow trout Oncorhynchus mykiss. Gen Comp
Endocrinol 115:379–386
24. Mol KA, Van der Geyten S, Kuhn ER, Darras VM (1999) Effects
of experimental hypo- and hyperthyroidism on iodothyronine
deiodinases in Nile tilapia, Oreochromis niloticus. Fish Physiol
Biochem 20:201–207
25. Van der Geyten S, Byamungu N, Reyns GE, Kuhn ER, Darras
VM (2005) Iodothyronine deiodinases and the control of plasma
and tissue thyroid hormone levels in hyperthyroid tilapia (Ore-ochromis niloticus). J Endocrinol 184:467–479
26. Plate EM, Adams BA, Allison WT, Martens G, Hawryshyn CW,
Eales JG (2002) The effects on thyroxine or a GnRH analogue on
thyroid hormone deiodination in the olfactory epithelium and retina
of rainbow trout, Oncorhynchus mykiss, and sockeye salmon, On-corhynchus mykiss nerka. Gen Comp Endocrinol 127:59–65
27. Van der Geyten S, Mol KA, Pluymers W, Kuhn ER, Darras VM
(1998) Changes in plasma T3 during fasting/refeeding in tilapia
(Oreochromis niloticus) are mainly regulated through changes in
hepatic type II iodothyronine deiodinase. Fish Physiol Biochem
19:135–143
28. Walpita CN, Grommen SVH, Darras VM, Van der Geyten S
(2007) The influence of stress on thyroid hormone production and
peripheral deiodination in the Nile tilapia Oreochromis niloticus.
Gen Comp Endocrinol 150:18–25
29. Cyr DG, Eales JG (1988) In vitro effects of thyroid hormones on
gonadotropin-induced estradiol-17b secretion by ovarian follicles
of rainbow trout, Salmo gairdneri. Gen Comp Endocrinol 69:80–87
30. MacLatchy DL, Eales JG (1988) Short-term treatment with tes-
tosterone increases plasma 3, 5, 30-triiodo-L-thyronine and hepatic
L-thyroxine 50-monodeiodinase levels in arctic charr, Salvelinusfontinalis. Gen Comp Endocrinol 71:10–16
31. MacLatchy DL, Eales JG (1990) Growth hormone stimulates
hepatic thyroxine 50-monodeiodinase activity and 3, 5, 30-triio-
dothyronine levels in rainbow trout (Salmo gairdneri). Gen Comp
Endocrinol 78:164–172
32. Sambroni E, Gutieres S, Cauty C, Guiguen Y, Breton B, Lareyre
JJ (2001) Type II iodothyronine deiodinase is preferentially
expressed in rainbow trout (Oncorhynchus mykiss) liver and
gonads. Mol Reprod Dev 60:338–350
33. Park YJ, Park JG, Hiyakawa N, Lee YD, Kim SJ, Takemura A
(2007) Diurnal and circadian regulation of a melatonin receptor,
MT1, in the golden rabbitfish, Siganus guttatus. Gen Comp
Endocrinol 150:253–262
34. Livak KJ, Schmittgen TD (2001) Analysis of relative gene
expression data using real-time quantitative PCR and the 2DDCT
method. Methods 25:402–408
35. Berry MJ, Banu L, Larsen PR (1991) Type I iodothyronine deio-
dinase is a selenocysteine-containing enzyme. Nature 349:438–440
36. Celi FS, Canettieri G, Yarnall DP, Burns DK, Andreoli M,
Schuldiner AR, Centanni M (1998) Genomic characterization of
the coding region of the human type II 50 deiodinase gene. Mol
Cell Endocrinol 141:49–52
37. Isorna E, Obregon MJ, Calvo RM, Vazquez R, Pendon C, Falcon
J, Munoz-Cueto JA (2009) Iodothyronine deiodinases and thyroid
hormone receptors regulation during flatfish (Solea senegalensis)
metamorphosis. J Exp Zool (Mol Dev Evol) 312B:231–246
38. Valverde-R C, Croteau W, LaFleur Jr GJ, Orozco A, St. Germain
DL (1997) Cloning and expression of a 50-iodothyronine deio-
dinase from the liver of Fundulus heteroclitus. Endocrinology
138:642–648
39. Davey JC, Schneider MJ, Becker KB, Galton VA (1999) Cloning
of a 5.8 kb cDNA for a type 2 deiodinase. Endocrinology
140:1022–1025
40. Orozco A, Jeziorski MC, Linser PJ, Greenberg RM, Valverde-R
C (2002) Cloning of the gene and complete cDNA encoding a
type 2 deiodinase in Fundulus heteroclitus. Gen Comp Endocri-
nol 128:162–167
41. Wagner MS, Morimoto R, Dora JM, Benneman A, Pavan R, Maia
AL (2003) Hypothyroidism induces type 2 iodothyronine deio-
dinase expression in mouse heart and testis. J Mol Endocrinol
31:541–550
42. Mol KA, Van der Geyten S, Darras VM, Visser TJ, Kuhn ER
(1997) Characterization of iodothyronine outer ring and inner
ring deiodinase activities in the blue tilapia, Oreochromis aureus.
Endocrinology 138:1787–1793
43. Eales JG, MacLatchy DL, Sweeting RM (1993) Thyroid hormone
deiodinase systems in salmonids, and their involvement in the
regulation of thyroidal status. Fish Physiol Biochem 11:313–321
310 Fish Sci (2011) 77:301–311
123

44. Leiner KA, Han GS, MacKenzie DS (2000) The effects of pho-
toperiod and feeding on the diurnal rhythm of circulating thyroid
hormones in the red drum, Sciaenops ocellatus. Gen Comp
Endocrinol 120:88–98
45. Chopra IJ (1980) Alterations in monodeiodination of iodothyro-
nines in the fasting rat: effects of reduced nonprotein sulfhydryl
groups and hypothyroidism. Metabolism 29:161–167
46. Chopra IJ, Wiersinga W, Frank H (1981) Alterations in hepatic
monodeiodination of iodothyronines in the diabetic rat. Life Sci
28:1765–1776
47. O’Mara BA, Dittrich W, Lauterio TJ, St Germain DL (1993)
Pretranslational regulation of type I 50-deiodinase by thyroid
hormones and in fasted and diabetic rats. Endocrinology
133:1715–1723
48. Darras VM, Mol KA, Van der Geyten S, Kuhn ER (1998) Control
of peripheral thyroid hormone levels by activating and inacti-
vating deiodinases. Ann NY Acad Sci 839:80–86
49. Gomez JM, Boujard T, Boeuf G, Solari A, Le Bail PY (1997)
Individual diurnal plasma profiles of thyroid hormones in rain-
bow trout (Oncorhynchus mykiss) in relation to cortisol, growth
hormone, and growth rate. Gen Comp Endocrinol 107:74–83
50. Leiner KA, MacKenzie DS (2003) Central regulation of thyroidal
status in a teleost fish: nutrient stimulation of T4 secretion and
negative feedback of T3. J Exp Zool 298A:32–43
51. Ebbesson LOE, Bjornsson BT, Ekstrom P, Stefansson SO (2008)
Daily endocrine profiles in parr and smolt Atlantic salmon. Comp
Biochem Physiol A 151:698–704
52. Spieler RE, Noeske TA (1981) Timing of a single daily meal and
diel variations of serum thyroxine, triiodothyronine and cortisol
in goldfish Carassius auratus. Life Sci 28:2939–2944
53. Loter TC, MacKenzie DS, McLeese J, Eales JG (2007) Seasonal
changes in channel catfish thyroid hormones reflect increased
magnitude of daily thyroid hormone cycles. Aquaculture
262:451–460
54. Leiner KA, MacKenzie DS (2001) The effects of photoperiod on
growth rate and circulating thyroid hormone levels in the red
drum, Sciaenops ocellatus: evidence for a free-running circadian
rhythm of T4 secretion. Comp Biochem Physiol A 130:141–149
55. Shoemaker CA, Klesius PH, Lim C, Yildirim M (2003) Feed
deprivation of channel catfish, Ictalurus punctatus (Rafinesque),
influences organosomatic indices, chemical composition and sus-
ceptibility to Flavobacterium columnare. J Fish Dis 26:553–561
56. Toguyeni A, Baroiller JF, Fostier A, Le Bail PY, Kuhn ER, Mol
KA, Fauconneau B (1996) Consequences of food restriction on
short-term growth variation and on plasma circulating hormones
in Oreochromis niloticus in relation to sex. Gen Comp Endocri-
nol 103:167–175
57. Flood CG, Eales JG (1983) Effects of starvation and refeeding on
plasma T4 and T3 levels and T4 deiodination in rainbow trout,
Salmo gairdneri. Can J Zool 61:1949–1953
58. Saoud IP, Mohanna C, Ghanawi J (2008) Effects of temperature
on survival and growth of juvenile spinefoot rabbitfish (Siganusrivulatus). Aquac Res 39:491–497
59. Bapary MAJ, Fainuulelei P, Takemura A (2009) Environmental
control of gonadal development in the tropical damselfish
Chrysiptera cyanea. Mar Biol Res 5:462–469
60. Bapary MAJ, Takemura A (2010) Effect of temperature and
photoperiod on the reproductive condition and performance of a
tropical damselfish Chrysiptera cyanea during different phases of
reproductive season. Fish Sci 76:769–776
Fish Sci (2011) 77:301–311 311
123