A Journey on the Skin Microbiome: Pitfalls and Opportunities
Upload
antarcticaCategory
view
3download
0
Exploring Pandora’s Box: Potential and Pitfalls of LowCoverage Genome Surveys for Evolutionary BiologyFlorian Leese1,2*, Philipp Brand1., Andrey Rozenberg1., Christoph Mayer4, Shobhit Agrawal3,
Johannes Dambach4, Lars Dietz1, Jana S. Doemel1, William P. Goodall-Copstake2, Christoph Held3,
Jennifer A. Jackson2, Kathrin P. Lampert1, Katrin Linse2, Jan N. Macher1, Jennifer Nolzen1,
Michael J. Raupach5, Nicole T. Rivera6, Christoph D. Schubart6, Sebastian Striewski1, Ralph Tollrian1,
Chester J. Sands2
1 Ruhr University Bochum, Department of Animal Ecology, Evolution and Biodiversity, Bochum, Germany, 2 British Antarctic Survey, High Cross, Madingley Road,
Cambridge, United Kingdom, 3 Alfred Wegener Institute for Polar and Marine Research, Functional Ecology, Bremerhaven, Germany, 4 Zoologisches Forschungsmuseum
Alexander Koenig, Bonn, Germany, 5 Senckenberg am Meer, German Center for Marine Biodiversity Research, Molecular Taxonomy Group, Wilhelmshaven, Germany,
6 University of Regensburg, Biologie 1, Department of Evolution, Behavior and Genetics, Regensburg, Germany
Abstract
High throughput sequencing technologies are revolutionizing genetic research. With this ‘‘rise of the machines’’, genomicsequences can be obtained even for unknown genomes within a short time and for reasonable costs. This has enabledevolutionary biologists studying genetically unexplored species to identify molecular markers or genomic regions of interest(e.g. micro- and minisatellites, mitochondrial and nuclear genes) by sequencing only a fraction of the genome. However,when using such datasets from non-model species, it is possible that DNA from non-target contaminant species such asbacteria, viruses, fungi, or other eukaryotic organisms may complicate the interpretation of the results. In this study weanalysed 14 genomic pyrosequencing libraries of aquatic non-model taxa from four major evolutionary lineages. Wequantified the amount of suitable micro- and minisatellites, mitochondrial genomes, known nuclear genes and transposableelements and searched for contamination from various sources using bioinformatic approaches. Our results show that in allsequence libraries with estimated coverage of about 0.02–25%, many appropriate micro- and minisatellites, mitochondrialgene sequences and nuclear genes from different KEGG (Kyoto Encyclopedia of Genes and Genomes) pathways could beidentified and characterized. These can serve as markers for phylogenetic and population genetic analyses. A central findingof our study is that several genomic libraries suffered from different biases owing to non-target DNA or mobile elements. Inparticular, viruses, bacteria or eukaryote endosymbionts contributed significantly (up to 10%) to some of the librariesanalysed. If not identified as such, genetic markers developed from high-throughput sequencing data for non-modelorganisms may bias evolutionary studies or fail completely in experimental tests. In conclusion, our study demonstrates theenormous potential of low-coverage genome survey sequences and suggests bioinformatic analysis workflows. The resultsalso advise a more sophisticated filtering for problematic sequences and non-target genome sequences prior to developingmarkers.
Citation: Leese F, Brand P, Rozenberg A, Mayer C, Agrawal S, et al. (2012) Exploring Pandora’s Box: Potential and Pitfalls of Low Coverage Genome Surveys forEvolutionary Biology. PLoS ONE 7(11): e49202. doi:10.1371/journal.pone.0049202
Editor: Ben J. Mans, Onderstepoort Veterinary Institute, South Africa
Received July 6, 2012; Accepted October 8, 2012; Published November 21, 2012
Copyright: ! 2012 Leese et al. This is an open-access article distributed under the terms of the Creative Commons Attribution License, which permitsunrestricted use, distribution, and reproduction in any medium, provided the original author and source are credited.
Funding: FL and CM were supported by German Research Foundation (DFG) grants LE 2323/2 and MA 3684/3 within the DFG priority programme (SPP) 1158. FLwas furthermore supported by a European Science Foundation ‘‘Frontiers of Speciation Research‘‘ exchange grant to Cambridge, UK. CJS was supported by anAntarctic Science Bursary grant. CDS and NTR were supported by DFG grants 1460/3, 1460/8, by Jurgen Heinze, and by a student scholarship of The CrustaceanSociety to NTR. KL and JJ were supported by Consortium Grant (NE/DO1249X/1) and the British Antarctic Survey Polar Science for Planet Earth Programme bothfunded by The Natural Environment Research Council. JD was supported by DFG grant RA 1688/2. SS was supported by a scheme to support specific activities ofdoctoral students of the rectorate of the Ruhr University Bochum. The funders had no role in study design, data collection and analysis, decision to publish, orpreparation of the manuscript.
Competing Interests: The authors have declared that no competing interests exist.
* E-mail: [email protected]
. These authors contributed equally to this work.
Introduction
Recent advances in high throughput sequencing technologieshave caused a paradigm shift in molecular evolutionary biology[1]. Whereas traditionally the analysis of many markers was acostly and tedious task and restricted mainly to genetic modelorganisms, it is now possible to screen large proportions ofpreviously unexplored genomes with high-throughput sequencingmethods almost as easily as known genomes. This hugely facilitates
ecological and evolutionary studies [2] and promises to overcomethe statistical pitfalls associated with still often-used single markerstudies (see [3] for discussion). With the ‘‘rise of the machines’’ [4],novel methodological possibilities are provided for addressingquestions at both micro- (e.g. [5,6]) and macroevolutionary levels(e.g. [7,8]). The basic principle common to both is that thegenomic regions identified for marker development and analysisshould be informative enough to answer the biological question
PLOS ONE | www.plosone.org 1 November 2012 | Volume 7 | Issue 11 | e49202

under study. For microevolutionary questions, genomic regionswith high variability at the population level are important [9],whereas in studies addressing old speciation events markers needto be less variable to avoid problematic homoplasious signals (e.g.[10]). For microevolutionary studies, microsatellites and minisa-tellites often represent the marker system of choice due to theirhigh variability [9,11,12]. Here, with high-throughput sequencing,the straightforward sequencing of enriched and non-enrichedlibraries on fractions of 454 plates can provide a good solutionwhen searching for microsatellite markers [13–16] (for a review see[4,17,18]).
For studies aiming to investigate recent divergence processesbetween species, mitochondrial genes were and still are often thefirst choice [19]. Most of the mitochondrial genes evolvecomparatively fast and have the advantage of being haploid andabundant in cells. If evolutionary events that date back manymillions of years are the central theme of a study, the analysis ofmore conservative (slow evolving) regions is appropriate to avoidtoo many multiple substitutions overwriting the meaningful signal.Typical regions for phylogenetic questions are the conserved coreregions of the nuclear multicopy rRNA genes [20].
With high-throughput sequencing, large sets of expressedsequence tags (ESTs) or specifically targeted nuclear genes canbe amplified and compared among taxa [7,8,21]. An interestingpoint in this respect is that with deep sequencing of nuclear ormitochondrial genomes it is not only the sequence variationbetween homologous loci that can be used as phylogeneticinformation, but also the genome morphology, i.e. the order andorganisation of the mitochondrial genes [22–24]. Mitochondrialgenome sequencing by traditional methods, such as primerwalking strategies or the use of conserved primers for long-rangePCR, are time-consuming and have a limited success rate whereashigh-throughput sequencing approaches can greatly facilitatedevelopment of complete or nearly complete mitochondrialgenomes [25–27].
In many published high-throughput sequencing studies, thesequence libraries are only partially explored, focussing on aparticular set (certain protein coding genes) or type (microsatellites)of markers and often neglect potential pitfalls of high-throughputdata. In particular, contamination of genomic libraries by bacteria,viruses or symbionts, by human material or cross-contamination isa well known problem (e.g. [28,29]). Such contamination can biassubsequent evolutionary analyses leading to erroneous conclusions(e.g. [30–32]). Therefore, the detection and removal of contam-inant sequences is important prior to downstream analysis.Bioinformatic tools that aid in the process of identifyingcontamination by heuristic comparisons of query sequencesagainst reference databases, such as BLAST [33], BLAST+ [34]and BLAT [35], or programs that map the new sequences againstreference genomes such as BWA [36], BWA-SW [37] or SSAHA[38], can further speed up and improve the process of identifyingand removing contaminant sequences from the genomic libraries(see [29] for a comparison of programs on metagenomic datasets).
The current study builds upon the first studies that havedocumented the potential of low coverage genome surveys, whichanalyse only a part of the whole genome, for evolutionaryinferences (e.g. [25,39]). With the goal of widening the scope oflow-coverage genome survey data, we explore their use not onlyfor one marker type, but for 1) micro- and minisatellites, 2)mitochondrial genes and genomes, and 3) for nuclear genes(protein-coding genes, rRNA genes, transposable elements).Moreover, we demonstrate that several mid- to small budget labscan tap into the potential of high-throughput sequencing bysharing costs and thus maximizing output. A central objective of
this study was to analyse the data for possible contamination byviruses, bacteria or endosymbionts. Our high-throughput librariesoriginate from genetic non-model species and may thus be morerepresentative of the majority of exploratory biological studies.Our results from 14 non-enriched genomic libraries show that low-coverage genome surveys of non-model organisms can yield manyinformative genetic markers besides microsatellites. However, wealso identify significant contributions of intragenomic, intra- andextracellular DNA contamination in several libraries that, if notsystematically identified and removed using bioinformatic tech-niques, can lead to erroneous conclusions about the evolutionaryprocesses under study.
Materials and Methods
Species investigatedWe analysed 14 genomic libraries of species from four different
animal phyla (1 cnidarian, 9 arthropods, 3 molluscs, 1 echino-derm, see Table 1). Furthermore, we also analysed two librariesenriched for microsatellites according to the protocol by Leese etal. [40] from the mollusc Lissarca notorcadensis and the asteroidechinoderm Odontaster validus (Table 1).
DNA extraction and sequencingFor DNA isolation, specimen tissue was extracted under clean
conditions in the lab to avoid contamination. For each genomiclibrary, DNA was extracted (see Supporting information S1) and5 mg of genomic DNA sent to Macrogen Inc. (Seoul, South Korea)for library preparation. Individually-tagged libraries were analysedon two full 454 plates on a GS-FLX sequencer (Roche) (Table 1).
AssemblyFrom the raw sequence files, FASTA, quality and trace
information files were extracted using the sff_extract v. 0.2.8python script [41]. Sequence tags of the reads were clipped. Theprocessed raw data were assembled using MIRA version 3.2.1.5[42] using the 454 default settings of the ‘‘de novo, genome,accurate, 454’’ mode with two modifications after several tests:The parameter AL:mrs was set to 85 (default 70), which is theminimum percentage similarity of two overlapping sequences to beassembled, The parameter AS:mrpc was set to 2, i.e. at least tworeads (and not five or more as usual in higher coverage situations)were needed to create a contig (see results for full explanation ofthe parameters). The MIRA assembler was chosen since it hasunique features such as chimera clipping, repeat masking and avery flexible algorithm that can be adjusted to the specific 454 low-coverage data. The quality of the assemblies was visually inspectedusing Geneious 5.4.6 [43]. To aid further analyses the contigs wereuploaded into a custom MySQL database (MySQL-server v.5.1.44) [44]. All of the filtering steps and the final datasetproduction were performed in the database using SQL-com-mands.
The Animal Genome Size Database [45] was used as a primaryresource to obtain genome sizes to compute approximate genomiccoverages for the libraries. We selected the closest relatives to ourtarget species from the database for comparison. Especially incases for which no closely related species were found in thedatabase, this approximation is to be treated with caution. For thegenome size estimates of the Antarctic krill (Euphausia superba) weused the recently published information on genome size rangespublished by Jeffrey [46].
Potential & Pitfalls of High Throughput Sequencing
PLOS ONE | www.plosone.org 2 November 2012 | Volume 7 | Issue 11 | e49202

Ta
ble
1.
Spec
ies
anal
ysed
inth
isst
ud
yan
dch
arac
teri
stic
so
fth
elib
rari
es.
Lib
rary
Ta
xo
no
my
Pla
teL
ibra
ryty
pe
Nu
mb
er
of
rea
ds
Av
era
ge
rea
dle
ng
th,
bp
Su
mo
fre
ad
len
gth
s,b
pN
um
be
ro
fco
nti
gs
Su
mo
fco
nti
gle
ng
ths,
bp
Av
era
ge
con
tig
len
gth
,b
p
Cn
ida
ria
Favi
afr
agum
(Esp
er)
An
tho
zoa:
Scle
ract
inia
1g
eno
mic
96,0
4037
6.6
34,0
55,4
4269
,405
27,5
20,2
2139
6.5
Art
hro
po
da
Aus
trop
alle
ne
corn
iger
a(M
ob
ius)
Pyc
no
go
nid
a1
gen
om
ic73
,557
293.
020
,396
,151
40,8
8313
,973
,404
341.
8
Col
osse
nde
ism
egal
onyx
Ho
ekP
ycn
og
on
ida
1g
eno
mic
100,
719
259.
425
,499
,956
57,4
2517
,539
,519
305.
4
Palle
nop
sis
pat
agon
ica
(Ho
ek)
Pyc
no
go
nid
a2
gen
om
ic13
4,84
632
5.5
41,7
41,6
2862
,753
25,3
78,9
0440
4.4
Uri
stes
adar
ei(W
alke
r)M
alac
ost
raca
:A
mp
hip
od
a1
gen
om
ic68
,047
211.
515
,482
,430
43,3
3610
,580
,572
244.
2
Eup
hau
sia
sup
erba
Dan
aM
alac
ost
raca
:Eu
ph
ausi
acea
1g
eno
mic
49,8
0224
7.6
12,0
98,8
1742
,256
10,8
68,4
7625
7.2
Nem
atoc
arci
nus
lan
ceop
esB
ate
Mal
aco
stra
ca:
Dec
apo
da
2g
eno
mic
168,
267
250.
343
,343
,686
79,7
4025
,343
,246
317.
8
Hya
sar
aneu
s(L
inn
aeu
s)M
alac
ost
raca
:D
ecap
od
a1
gen
om
ic17
5,09
824
4.8
44,8
90,1
3493
,050
28,0
37,4
5130
1.3
Met
opau
lias
dep
ress
usR
ath
bu
nM
alac
ost
raca
:D
ecap
od
a2
gen
om
ic18
6,89
026
5.5
55,1
52,7
4163
,040
26,1
86,2
7841
5.4
Seri
cost
oma
per
son
atum
(Kir
by
&Sp
ence
)H
exap
od
a:Tr
ich
op
tera
2g
eno
mic
253,
210
336.
378
,747
,514
139,
237
53,9
27,7
5538
7.3
Mo
llu
sca
Lep
etod
rilu
ssp
.n
ov.
Gas
tro
po
da:
Vet
igas
tro
po
da
2g
eno
mic
339,
640
330.
710
5,57
7,60
317
8,78
869
,304
,964
387.
6
Lim
atul
ah
odgs
oni
(Sm
ith
)B
ival
via:
Lim
oid
a2
gen
om
ic16
8,11
324
1.1
39,0
15,1
5910
5,80
128
,438
,377
268.
8
Arc
tica
isla
ndi
ca(L
inn
aeu
s)B
ival
via:
Ven
ero
ida
1g
eno
mic
71,3
8530
8.3
20,5
77,2
4454
,266
17,7
90,6
7132
7.8
Liss
arca
not
orca
den
sis
Mel
vill
&St
and
enB
ival
via:
Arc
oid
a1
enri
ched
205,
905
194.
746
,847
,086
84,4
9817
,059
,967
201.
9
Ech
ino
de
rma
ta
Odo
nta
ster
valid
usK
oeh
ler
Ast
ero
idea
1en
rich
ed18
3,16
620
0.5
39,3
11,1
7286
,280
17,9
72,4
8220
8.3
Gor
gon
ocep
hal
usch
ilen
sis
(Ph
ilip
pi)
Op
hiu
roid
ea1
gen
om
ic60
,181
330.
818
,452
,499
39,8
0914
,681
,395
368.
8
The
nu
mb
ero
fre
ads
and
nu
mb
ero
fM
bp
refe
rsto
the
un
asse
mb
led
raw
dat
a,w
her
eas
the
nu
mb
ero
fco
nti
gs
refe
rsto
the
nu
mb
ero
fu
niq
ue
seq
uen
ces
afte
ras
sem
bly
wit
hM
IRA
.d
oi:1
0.13
71/j
ou
rnal
.po
ne.
0049
202.
t001
Potential & Pitfalls of High Throughput Sequencing
PLOS ONE | www.plosone.org 3 November 2012 | Volume 7 | Issue 11 | e49202

Taxonomic and functional characterization of the contigsIn order to classify the contigs we performed a number of
BLAST searches with different strategies (see below) [33]. Theresults were parsed and uploaded into the MySQL-database. Weused the accession numbers from the BLAST hits to obtain the‘‘definition’’ and ‘‘description’’ sections of the correspondingsequences as well as the associated taxonomic information usingan in-house tool that retrieves this information automatically fromthe NCBI Entrez Utilities Web Service (see http://www.ncbi.nlm.nih.gov/entrez/query/static/esoap_help.html). These data werestored in the database and queried later for functional andtaxonomic assignment; summary statistics and inputs for subse-quent downstream processing were obtained.
For the purpose of taxonomic annotations, BLASTn searcheswith our sequences as queries against the whole nucleotidecollection of NCBI sequences were performed on local servers. Aconservative threshold e-value of #10212 was used. Only the besthits were collected and stored in the MySQL database. These datawere used to obtain information about non-eukaryotic sequencesand sequences derived from known mobile elements (see section‘‘transposable elements’’ below) and to produce ‘‘contamination-free’’ datasets in which these sequences were removed.
Tandem repeat analysisMicro- and minisatellites (1–6 basepairs (bp) and 7–50 bp motif
length, respectively) were searched for in all contamination-free(see below) contigs and single reads with a minimum length of100 bp. This tandem repeat search was performed using thesoftware Phobos 3.3.12 [47]. Since different studies used differentsoftware and search criteria to find tandem repeats (see [48] fordiscussion) we applied three different parameter settings tocompare the results with other studies. First, we used the searchparameters used in a recent comparative study on micro- andminisatellites [48] (Phobos parameter settings –searchModeimperfect -u 1 -U 6 -g -5 -m -5 -s 12). In order to design primersfor only the best loci, the results were filtered for 100% perfectmicrosatellites. Second, we applied the search criteria used bySantana et al. [15] to search for microsatellites (equivalent Phobosparameters –searchMode exact -u 1 -U 1 -s 11 for mononucleotiderepeats and –searchMode exact -u 2 -U 6 –minLength_b 5 -s 8 fordi- to hexanucleotide repeats). Third, we employed the searchparameters used by Abdelkrim et al. [13] and Gardner et al. [4](equivalent Phobos parameters –searchMode exact -u 2 -U 6 –minLength_b -s 8). With the exception of [48] these studies did notexplicitly search for minisatellites. In this study we searched forminisatellites in the range of 7–50 bp motifs with the Phobossettings -u 7 -U 50 -R 30 -m -5 -g -5 -s 12 [48].
Since the aim of the study was to detect tandem repeats thatcould be used as genetic markers we performed a search forappropriate primers annealing to the respective flanking regionswith Primer3 v. 2.3.4 [49]. The parameters were the default oneswith the following modifications: PRIMER_MAX_NS_AC-CEPTED = 1, PRIMER_PRODUCT_SIZE_RANGE = 100–300, PRIMER_PAIR_MAX_DIFF_TM = 8, PRIMER_MAX_-POLY_X = 4, PRIMER_NUM_RETURN = 3 and all tandemrepeats were masked with SEQUENCE_EXCLUDED_RE-GION. Further, all primer pairs were checked whether therespective regions had low complexity (‘‘cryptic simplicity’’). Thissimplicity test was performed with SIMPLE v. 5 [50,51]. Theparameters were as follows: sequence type ‘n’ (DNA/RNA), equalweights for mono- to tetranucleotide motifs, 50 random sequences,shuffle elements method, and (half-) window size of 4. From themaximum of three primer pairs queried we stored either the pairwithout signs of simplicity or just the best one if primers in all pairs
were significantly simple. Following the recommendation byMeglecz et al. [52] we made a final stringency filtering retainingonly single read contigs with appropriate primers. The Phobosoutput data as well as the designed primers were stored in theMySQL database. The respective tables were queried to outputtotal numbers and coverage of tandem repeats and numbers of lociwith potentially suitable primers.
Searching for mtDNAFor the identification of mitochondrial DNA (mtDNA), all
assembled contigs and single-read contigs of individual specieswere converted to a BLAST database (BLAST+ package version2.2.25+, [34]). Mitochondrial genome sequences of closely relatedspecies deposited in GenBank were used as queries for localBLASTn and tBLASTx searches against this BLAST database.
Contigs in the database that had BLAST hits with an e-value#10212 for a given query were assembled using Geneious version5.4.6 [43]. The resulting contigs were inspected manually asdescribed in [26]. Every scaffold was examined by BLASTsearches against GenBank, and proteins and rRNAs annotatedaccordingly. tRNAs were annotated using tRNAscan-SE 1.21 [53]and ARWEN 1.2 [54].
Searching for nuclear genesTo obtain functional information on nuclear-encoded proteins,
we analysed our data (the contamination-free dataset: see below)with aid of the KEGG Automatic Annotation Server (KAAS [55])(August 2012). We utilized the online version of KAAS with thesingle-directional best-hit method and default score thresholds.The results, i.e. the KEGG-Orthology assignments for individualcontigs, were uploaded into our database and the hits were furtherclassified according to the BRITE functional classification [56]retrieved via the public services provided by KEGG [57]. EachKEGG-Orthology record can potentially map to different BRITE-classes and this problem of inherent redundancy was resolved witha simple weighting system: each BRITE-class assigned to a contigwas given a score equal to the number of reads for the contigdivided by the number of pathways for that contig. BRITE-classesrelated to higher-level groups ‘‘Organismal Systems’’ and ‘‘Hu-man Diseases’’ as well as the class ‘‘Enzyme Families’’ wereignored when creating the frequency charts, since the functionalannotations were too imprecise for our data.
Furthermore, to obtain an independent estimate of the numberof contigs with high similarities to known proteins, BLASTxsearches against the Swiss-Prot database [58] were performed(October 5th, 2011) with a threshold e-value of #10212. Only thebest hits were collected and stored in the MySQL database. Thesedata were used to obtain information about non-eukaryoticsequences and sequences derived from known mobile elements(interspersed repeats) (see below) and to produce ‘‘contamination-free’’ datasets. Functional mapping of the BLASTx hits wasperformed with the aid of the KEGG-database (Kyoto Encyclo-pedia of Genes and Genomes, [57]). The database was accessedwith a PHP-written client as follows: A GI-number (NCBI’sGenInfo Identifier) of a matched sequence was mapped to theKEGG gene identification number with the aid of interfacefunctions (UniProt Mapping web-service) provided by the UniProtdatabase [59]. Using the KEGG web-service, the KEGG geneidentification number was assigned to its respective KEGG-Orthology identifier that was subsequently used to make functionalannotations according to the BRITE pathways functional classi-fication [56]. The annotation data were added to the sameMySQL database that stored the BLAST hits. This databaseserved as a source for final data analysis, comparison, and the
Potential & Pitfalls of High Throughput Sequencing
PLOS ONE | www.plosone.org 4 November 2012 | Volume 7 | Issue 11 | e49202

creation of the tables and figures. Each gene could potentially mapto different pathways and this problem of inherent redundancywas resolved with a simple weighting system: each pathwayassigned to a contig was given a score equal to the number of readsfor the contig divided by the number of pathways for that contig.Pathways related to higher-level groups ‘‘Organismal Systems’’and ‘‘Human Diseases’’ were ignored for the remainder of thisstudy.
Searching for rRNA genesrRNA genes in the contigs were identified by conducting
BLASTn searches on local computers against the nr Database ofNCBI and extracting the best 20 hits. Definition lines and taxoninformation for the hits were obtained as outlined above. rRNAgenes were detected in the MySQL database with a searchingquery for NCBI records explicitly containing one or more of theterms ‘‘rRNA; 18S; 28S; 5S; 5,8S; 5.8S; 23S; 25S; 17S; ribosomalRNA; rDNA; SSU; LSU; internal transcribed spacer; ITS1; ITS2;external transcribed spacer’’ in their descriptions.
Searching for transposable elementsSimilar to the searches for rRNA genes, potential transposable
elements in the contigs were identified by filtering the bestBLASTn hits (case insensitive) for the terms ‘‘transposon, retro-transposon, transposable element, interspersed element, inter-spersed repeated mobile element, SINE sequence, SINE Alu,SINE family, LINE family, LINE sequence, Alu repeat’’. Theterms ‘‘transposon’’ and ‘‘retroposon’’ were searched for in the‘‘species’’ name field. If one of the terms ‘‘flanking region’’,‘‘flank_region’’, ‘‘flanking end’’ occurred in the definition line, thehit was excluded from consideration.
Searching for contaminationViruses. To account for possible viral contamination,
BLASTx searches against the NCBI RefSeq Virus genomesProteins Database were performed (viral*.protein.faa.gz, accessdate 09.09.2011). To avoid possible false positives (i.e. hits againstloci similar to viral proteins, but not of viral origin) a veryconservative approach with a maximum e-value of 10260 waschosen.
In addition, we used the web version of the software DeconSeq[29] exploring the whole range of parameter combinations(coverage from 16 to 1006, identity from 60% to 100%). Bothparameters were incremented by steps of one, resulting in 4,099tested parameter combinations used to detect hits against virusesin the genomic library of Metopaulias depressus (data available onrequest).
Prokaryotic DNA. The data on prokaryotic contaminationwere obtained with the same BLASTn searches described in the‘‘Searching for protein-coding nuclear genes’’ section. Taxonomicinformation was used to find sequences of prokaryotic origin. SQLand custom PHP scripts were utilized to obtain summary statisticsconcerning the numbers of reads and contigs assigned to respectivegroups, frequency charts coloured according to respectiveprokaryotic phyla and lists of highly frequent bacterial species.Life-history characterization of bacteria for a chosen library ofAustropallene cornigera was performed manually through inspectionof the relevant literature (see Supporting information S7).
An overview of the methodological workflow is presented inFigure 1. The data for this study can be viewed at http://www.evoeco.de.
Results
Sequencing statistics/assemblyRead number per genomic library ranged from 49,802 in
Antarctic krill Euphausia superba to 339,640 in the vent limpetLepetodrilus sp. nov. The total number of base pairs for the clippedreads ranged from 12,098,817 (Euphausia superba) to 105,577,603(Lepetodrilus sp. nov., see Table 1). Average read lengths afterquality clipping ranged from 211.5 bp (highly repetitive genome ofthe amphipod Uristes adarei) to 376.6 bp for the genomic library ofthe coral Favia fragum. In the microsatellite-enriched and length-selected libraries the average lengths were shorter (194.7 bp and200.5 bp, for the bivalve Lissarca notorcadensis and the asteroidOdontaster validus, respectively). Even though approximately 5 mg ofDNA were used consistently for library preparation, variation inread numbers obtained for the tagged libraries on the plates washigh (Table 1) reflecting both the strong variation inherent in thetechnology (mainly library preparation) and differences in DNAquality.
Prior to producing the final assembly, we tested and compareddifferent assembly settings and adjusted parameters for the MIRAassembler. To accommodate for the low-coverage situation weadjusted parameters and found that increasing the AL:mrsparameter to 85, while using the accurate de novo genome assemblemode of the MIRA assembler, produced high quality andconservative results. Increasing the AL:mrs stringency parameterreflected a trade-off between the low-coverage situation on the onehand and a known increased percentage of wrong base calls atread ends using a 454 sequencing approach and allelic variabilityon the other hand. In addition, the AS:mrpc parameter was set to2, which means that at least two reads were needed to create acontig (see Material and Methods). The assembly resulted in agreat number of assembled contigs, but most of the readsremained single-read contigs (Supporting information S2).
We estimated coverage ranges for the genomic libraries by usinginformation on C-values from closely related organisms (depositedin the Animal Genome Size Database). Since in the case of our
Figure 1. Workflow showing the methodological approachfollowed in this study. In this study we used a MySQL database (*)for storing the contigs. Other database formats are possible or readscan also be stored locally without a specific database.doi:10.1371/journal.pone.0049202.g001
Potential & Pitfalls of High Throughput Sequencing
PLOS ONE | www.plosone.org 5 November 2012 | Volume 7 | Issue 11 | e49202
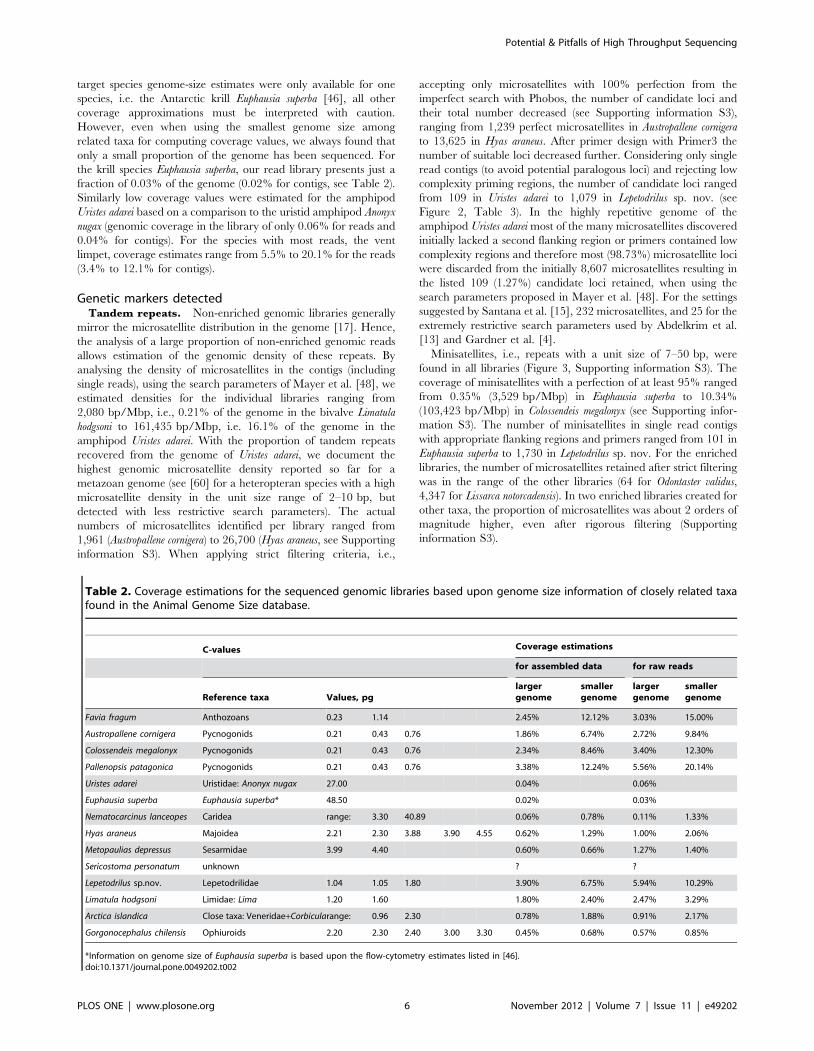
target species genome-size estimates were only available for onespecies, i.e. the Antarctic krill Euphausia superba [46], all othercoverage approximations must be interpreted with caution.However, even when using the smallest genome size amongrelated taxa for computing coverage values, we always found thatonly a small proportion of the genome has been sequenced. Forthe krill species Euphausia superba, our read library presents just afraction of 0.03% of the genome (0.02% for contigs, see Table 2).Similarly low coverage values were estimated for the amphipodUristes adarei based on a comparison to the uristid amphipod Anonyxnugax (genomic coverage in the library of only 0.06% for reads and0.04% for contigs). For the species with most reads, the ventlimpet, coverage estimates range from 5.5% to 20.1% for the reads(3.4% to 12.1% for contigs).
Genetic markers detectedTandem repeats. Non-enriched genomic libraries generally
mirror the microsatellite distribution in the genome [17]. Hence,the analysis of a large proportion of non-enriched genomic readsallows estimation of the genomic density of these repeats. Byanalysing the density of microsatellites in the contigs (includingsingle reads), using the search parameters of Mayer et al. [48], weestimated densities for the individual libraries ranging from2,080 bp/Mbp, i.e., 0.21% of the genome in the bivalve Limatulahodgsoni to 161,435 bp/Mbp, i.e. 16.1% of the genome in theamphipod Uristes adarei. With the proportion of tandem repeatsrecovered from the genome of Uristes adarei, we document thehighest genomic microsatellite density reported so far for ametazoan genome (see [60] for a heteropteran species with a highmicrosatellite density in the unit size range of 2–10 bp, butdetected with less restrictive search parameters). The actualnumbers of microsatellites identified per library ranged from1,961 (Austropallene cornigera) to 26,700 (Hyas araneus, see Supportinginformation S3). When applying strict filtering criteria, i.e.,
accepting only microsatellites with 100% perfection from theimperfect search with Phobos, the number of candidate loci andtheir total number decreased (see Supporting information S3),ranging from 1,239 perfect microsatellites in Austropallene cornigerato 13,625 in Hyas araneus. After primer design with Primer3 thenumber of suitable loci decreased further. Considering only singleread contigs (to avoid potential paralogous loci) and rejecting lowcomplexity priming regions, the number of candidate loci rangedfrom 109 in Uristes adarei to 1,079 in Lepetodrilus sp. nov. (seeFigure 2, Table 3). In the highly repetitive genome of theamphipod Uristes adarei most of the many microsatellites discoveredinitially lacked a second flanking region or primers contained lowcomplexity regions and therefore most (98.73%) microsatellite lociwere discarded from the initially 8,607 microsatellites resulting inthe listed 109 (1.27%) candidate loci retained, when using thesearch parameters proposed in Mayer et al. [48]. For the settingssuggested by Santana et al. [15], 232 microsatellites, and 25 for theextremely restrictive search parameters used by Abdelkrim et al.[13] and Gardner et al. [4].
Minisatellites, i.e., repeats with a unit size of 7–50 bp, werefound in all libraries (Figure 3, Supporting information S3). Thecoverage of minisatellites with a perfection of at least 95% rangedfrom 0.35% (3,529 bp/Mbp) in Euphausia superba to 10.34%(103,423 bp/Mbp) in Colossendeis megalonyx (see Supporting infor-mation S3). The number of minisatellites in single read contigswith appropriate flanking regions and primers ranged from 101 inEuphausia superba to 1,730 in Lepetodrilus sp. nov. For the enrichedlibraries, the number of microsatellites retained after strict filteringwas in the range of the other libraries (64 for Odontaster validus,4,347 for Lissarca notorcadensis). In two enriched libraries created forother taxa, the proportion of microsatellites was about 2 orders ofmagnitude higher, even after rigorous filtering (Supportinginformation S3).
Table 2. Coverage estimations for the sequenced genomic libraries based upon genome size information of closely related taxafound in the Animal Genome Size database.
C-values Coverage estimations
for assembled data for raw reads
Reference taxa Values, pglargergenome
smallergenome
largergenome
smallergenome
Favia fragum Anthozoans 0.23 1.14 2.45% 12.12% 3.03% 15.00%
Austropallene cornigera Pycnogonids 0.21 0.43 0.76 1.86% 6.74% 2.72% 9.84%
Colossendeis megalonyx Pycnogonids 0.21 0.43 0.76 2.34% 8.46% 3.40% 12.30%
Pallenopsis patagonica Pycnogonids 0.21 0.43 0.76 3.38% 12.24% 5.56% 20.14%
Uristes adarei Uristidae: Anonyx nugax 27.00 0.04% 0.06%
Euphausia superba Euphausia superba* 48.50 0.02% 0.03%
Nematocarcinus lanceopes Caridea range: 3.30 40.89 0.06% 0.78% 0.11% 1.33%
Hyas araneus Majoidea 2.21 2.30 3.88 3.90 4.55 0.62% 1.29% 1.00% 2.06%
Metopaulias depressus Sesarmidae 3.99 4.40 0.60% 0.66% 1.27% 1.40%
Sericostoma personatum unknown ? ?
Lepetodrilus sp.nov. Lepetodrilidae 1.04 1.05 1.80 3.90% 6.75% 5.94% 10.29%
Limatula hodgsoni Limidae: Lima 1.20 1.60 1.80% 2.40% 2.47% 3.29%
Arctica islandica Close taxa: Veneridae+Corbicularange: 0.96 2.30 0.78% 1.88% 0.91% 2.17%
Gorgonocephalus chilensis Ophiuroids 2.20 2.30 2.40 3.00 3.30 0.45% 0.68% 0.57% 0.85%
*Information on genome size of Euphausia superba is based upon the flow-cytometry estimates listed in [46].doi:10.1371/journal.pone.0049202.t002
Potential & Pitfalls of High Throughput Sequencing
PLOS ONE | www.plosone.org 6 November 2012 | Volume 7 | Issue 11 | e49202

Mitochondrial DNA markersAll 14 genomic libraries contained mitochondrial DNA
fragments (Figure 4). A significant positive correlation betweenthe number of contig bp of the assembly and the number ofmitochondrial bp found was detected (Spearman rank correlation:r = 0.6049, P = 0.0219, Figure 5). However, individual librarysuccess varied considerably and the number of recovered genesand tRNAs differed substantially. For the spider crab Hyas araneus,full or partial sequences of every mitochondrial gene including 22tRNAs were found (Figure 4). In the microsatellite-enrichedlibraries not a single mitochondrial read was found as expected(see Supporting information S4).
From the 454 data complete or nearly complete mitochondrialgenomes can be obtained by linking contigs via Sanger sequencing(see e.g. [26] for the Colossendeis megalonyx library).
Interestingly, in the case of the coral Favia fragum it was evenpossible to isolate not only the almost complete (15,718 bp)mitochondrial genome of the host but also a 1,663 bp fragment ofthe mitochondrial genome of its dinoflagellate symbiont Symbiodi-nium spp. (Supporting information S4).
The success of finding genes in a genetically uncharacterizedtaxon always depends on the availability and similarity of the data
that are available for comparison. As an example, no mitochon-drial hits were initially found for the genomic library ofGorgonocephalus chilensis. However, after the sequence of Astrospartusmediterraneus (GenBank Accession Number FN562580.1, [61]) wasdeposited in GenBank, 2,870 bp of mitochondrial contigs werefound in the tBLASTx searches against the NCBI database andcould therefore be classified as such.
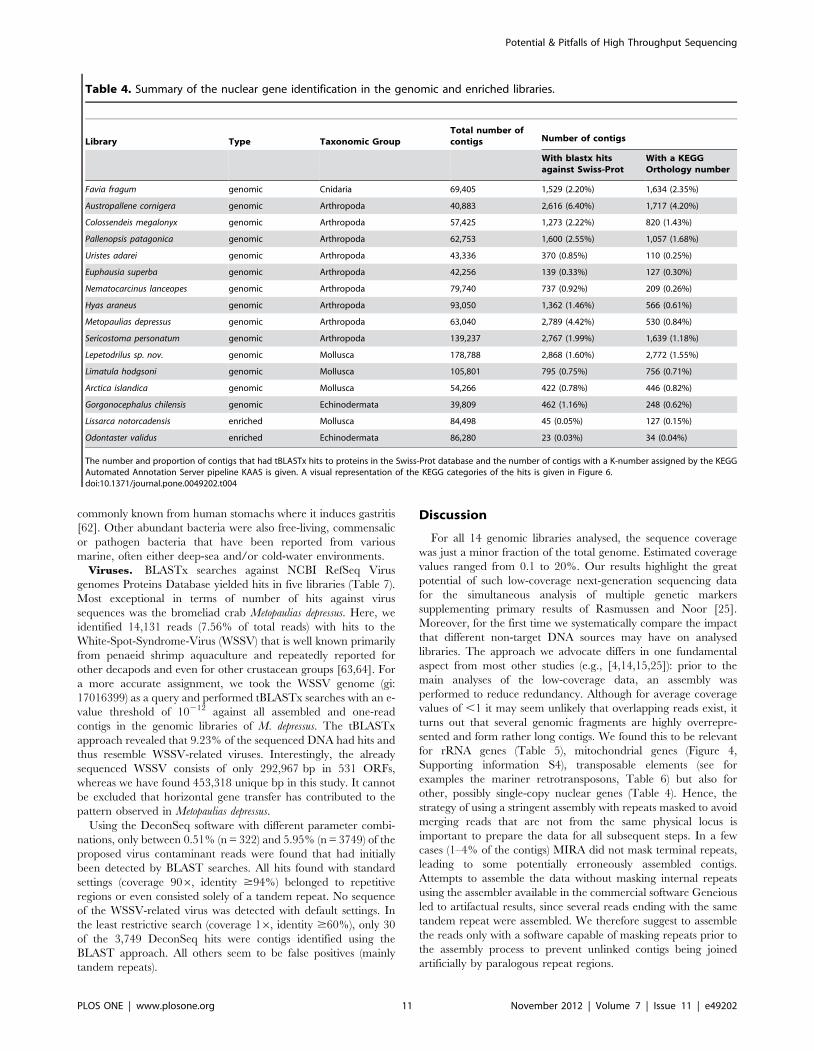
Nuclear DNA markersFunctional annotations performed with the KAAS pipeline
allowed us to identify sequences with similarities to knownproteins. The results showed that up to 2,772 contigs (forLepetodrilus sp. nov.) had hits to known or predicted protein genes(Table 4). As expected, the microsatellite-enriched libraries (i.e.from Lissarca and Odontaster) showed the lowest percentage ofidentifiable protein-coding genes. Among the 14 genomic librariesthe data obtained for the presumably more compact genomes (thecoral Favia fragum, pycnogonids and molluscs (except for Arcticaislandica)) showed higher values. A less sophisticated analysisutilizing BLASTx searches against the Swiss-Prot database showedcomparable amounts of protein-coding sequences in our data, but
Figure 2. Percentage of contigs with candidate microsatellites found in the non-enriched libraries with three different searchparameter settings. Search parameter settings were adapted from the three studies [4,15,48] and used in Phobos [47] runs. Numbers on top of thecolumns represent the total number of perfect microsatellites retained after restrictive filtering for quality criteria.doi:10.1371/journal.pone.0049202.g002
Potential & Pitfalls of High Throughput Sequencing
PLOS ONE | www.plosone.org 7 November 2012 | Volume 7 | Issue 11 | e49202
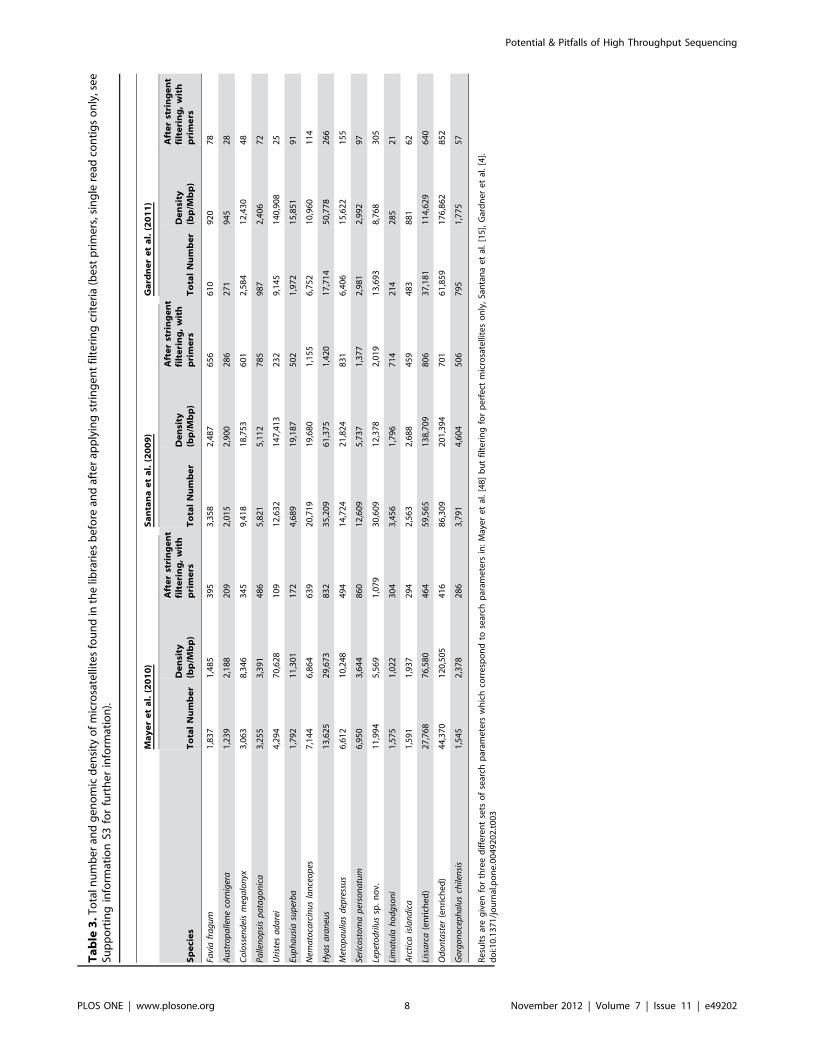
Ta
ble
3.T
ota
lnu
mb
eran
dg
eno
mic
den
sity
of
mic
rosa
telli
tes
fou
nd
inth
elib
rari
esb
efo
rean
daf
ter
app
lyin
gst
rin
gen
tfil
teri
ng
crit
eria
(bes
tp
rim
ers,
sin
gle
read
con
tig
so
nly
,see
Sup
po
rtin
gin
form
atio
nS3
for
furt
her
info
rmat
ion
).
Ma
ye
re
ta
l.(2
01
0)
Sa
nta
na
et
al.
(20
09
)G
ard
ne
re
ta
l.(2
01
1)
Sp
eci
es
To
tal
Nu
mb
er
De
nsi
ty(b
p/M
bp
)
Aft
er
stri
ng
en
tfi
lte
rin
g,
wit
hp
rim
ers
To
tal
Nu
mb
er
De
nsi
ty(b
p/M
bp
)
Aft
er
stri
ng
en
tfi
lte
rin
g,
wit
hp
rim
ers
To
tal
Nu
mb
er
De
nsi
ty(b
p/M
bp
)
Aft
er
stri
ng
en
tfi
lte
rin
g,
wit
hp
rim
ers
Favi
afr
agum
1,83
71,
485
395
3,35
82,
487
656
610
920
78
Aus
trop
alle
ne
corn
iger
a1,
239
2,18
820
92,
015
2,90
028
627
194
528
Col
osse
nde
ism
egal
onyx
3,06
38,
346
345
9,41
818
,753
601
2,58
412
,430
48
Palle
nop
sis
pat
agon
ica
3,25
53,
391
486
5,82
15,
112
785
987
2,40
672
Uri
stes
adar
ei4,
294
70,6
2810
912
,632
147,
413
232
9,14
514
0,90
825
Eup
hau
sia
sup
erba
1,79
211
,301
172
4,68
919
,187
502
1,97
215
,851
91
Nem
atoc
arci
nus
lan
ceop
es7,
144
6,86
463
920
,719
19,6
801,
155
6,75
210
,960
114
Hya
sar
aneu
s13
,625
29,6
7383
235
,209
61,3
751,
420
17,7
1450
,778
266
Met
opau
lias
dep
ress
us6,
612
10,2
4849
414
,724
21,8
2483
16,
406
15,6
2215
5
Seri
cost
oma
per
son
atum
6,95
03,
644
860
12,6
095,
737
1,37
72,
981
2,99
297
Lep
etod
rilu
ssp
.n
ov.
11,9
945,
569
1,07
930
,609
12,3
782,
019
13,6
938,
768
305
Lim
atul
ah
odgs
oni
1,57
51,
022
304
3,45
61,
796
714
214
285
21
Arc
tica
isla
ndi
ca1,
591
1,93
729
42,
563
2,68
845
948
388
162
Liss
arca
(en
rich
ed)
27,7
6876
,580
464
59,5
6513
8,70
980
637
,181
114,
629
640
Odo
nta
ster
(en
rich
ed)
44,3
7012
0,50
541
686
,309
201,
394
701
61,8
5917
6,86
285
2
Gor
gon
ocep
hal
usch
ilen
sis
1,54
52,
378
286
3,79
14,
604
506
795
1,77
557
Res
ult
sar
eg
iven
for
thre
ed
iffer
ent
sets
of
sear
chp
aram
eter
sw
hic
hco
rres
po
nd
tose
arch
par
amet
ers
in:
May
eret
al.
[48]
bu
tfil
teri
ng
for
per
fect
mic
rosa
telli
tes
on
ly,
San
tan
aet
al.
[15]
,G
ard
ner
etal
.[4
].d
oi:1
0.13
71/j
ou
rnal
.po
ne.
0049
202.
t003
Potential & Pitfalls of High Throughput Sequencing
PLOS ONE | www.plosone.org 8 November 2012 | Volume 7 | Issue 11 | e49202

overall lower than the values obtained with KAAS due to differentcandidate selection criteria.
Functional classes identified by KAAS in our libraries are verydiverse (Figure 6). For the genomes with large predicted sizes, inparticular Euphausia superba and Uristes adarei, few hits to knownprotein-coding genes were found. For the other genomes, up to1,903 hits to genes from the KEGG categories ‘‘GeneticInformation Processing’’, ‘‘Cellular Processes’’, ‘‘EnvironmentalInformation Processing’’ and ‘‘Metabolism’’ were obtained. Thisinformation could be important for a wide range of molecularstudies.
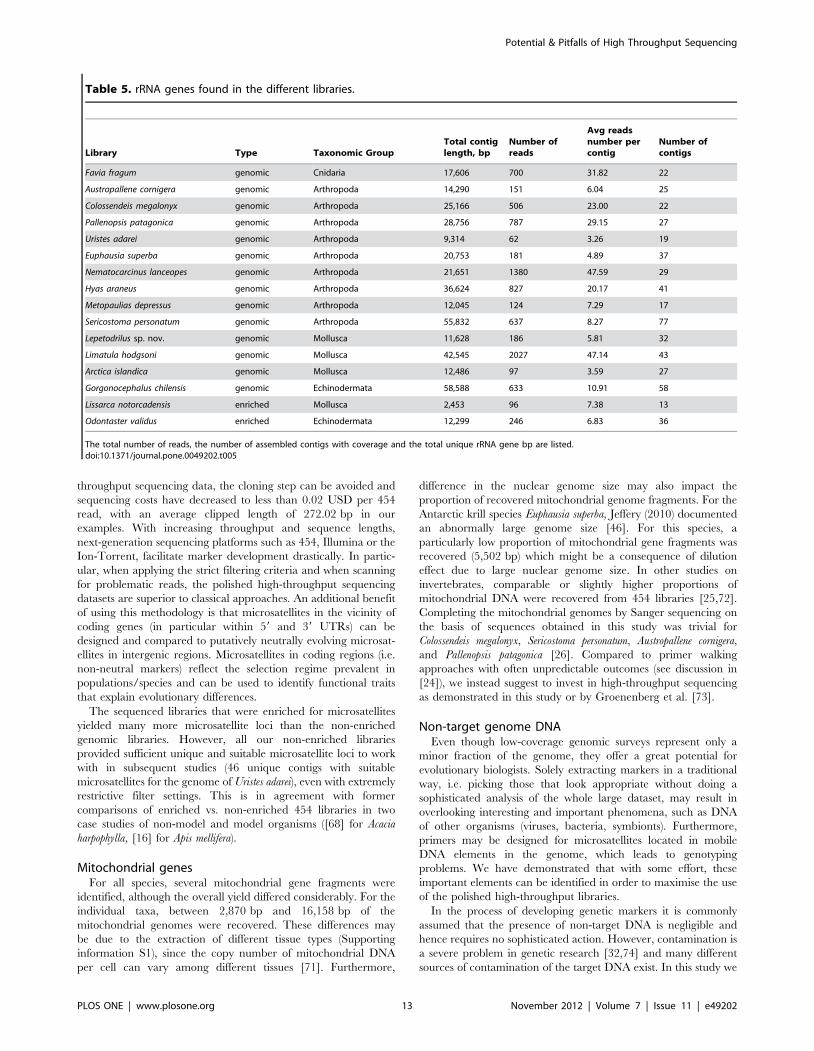
Ribosomal RNA genes. Ribosomal RNA (rRNA) geneswere detected with the aid of BLASTn searches against GenBankand various rRNA genes were identified in the genomic libraries(Table 5). The number of positive rRNA gene hits ranged from 62for Uristes adarei to 2,027 sequences for Limatula hodgsoni, adding upto a total contig length of 2,453 bp for Uristes adarei and 58,588 forthe 633 sequences detected for Gorgonocephalus chilensis.
Transposable elements. In the libraries of the threepycnogonids and the two decapod species Metopaulias depressusand Hyas araneus we found 5–81 reads (1–9 contigs) with matchesto known transposable elements (Table 6). In the genomic libraryof Sericostoma personatum, however, we found 1,895 reads (assembledto 243 contigs) with high similarity to insect mariner retro-
transposons. This reflects a proportion of 0.75% of the reads.However, all of the species analysed in this study have a greatphylogenetic distance from classical genetic model species withwell-annotated transposable elements (data not shown). All moreclosely related species are only poorly, if at all, geneticallycharacterized. Therefore, it is very likely that a major proportionof transposable elements in our genomic libraries went unnoticed.
Non-target organism DNAWe systematically searched for traces of DNA not belonging to
the organism under study. In particular, we searched for expectedsymbionts and for bacterial and viral contamination. For eachsection we will here highlight cases in which the contaminationwas particularly prominent.
Symbionts. From the coral Favia fragum, tissue was extractedthat contained a DNA mixture of the host Favia fragum and itssymbionts belonging to the dinoflagellate genus Symbiodinium.Therefore, the DNA could potentially include DNA of the nuclearand mitochondrial host genome, the nuclear and mitochondrialsymbiont genome, as well as the plastid genome of the symbiont.The results of the mitochondrial DNA marker detection revealed15,718 assembled bp of mitochondrial reads for the coral and1,663 bp for the symbiont (Supporting information S4).
Figure 3. Percentage of contigs with microsatellites or minisatellites found in the non-enriched genomic libraries. Search parameterswere according to Mayer et al. [48] used in Phobos [47]. For the analysis, repeats with a perfection greater or equal to 95% were retained. Thenumbers on top of the columns represent the total number found per library.doi:10.1371/journal.pone.0049202.g003
Potential & Pitfalls of High Throughput Sequencing
PLOS ONE | www.plosone.org 9 November 2012 | Volume 7 | Issue 11 | e49202

To explicitly distinguish between nuclear and plastid DNA ofhost and symbiont we performed BLASTn searches of all‘‘Faviinae’’ and ‘‘Dinoflagellata’’ sequences as well as the newlysequenced genome of the cnidarian Nematostella vectensis obtainedfrom GenBank (access date 24.09.2011; for exact search terms seeSupporting information S5) against the 77,440 F. fragum tissuecontigs (42,696,657 bp) as a database. We counted and assignedthe hits with an e-value not exceeding 10212 (Supportinginformation S5) resulting in 434 contigs with at least one hit. Ofall contigs 17 had matches to more than one of the genomes ofinterest. All these cases indicate erroneous annotations in thedatabase. In addition, ten contigs had only hits against plastidsequences, 14 contigs had exclusive hits against the dinoflagellategenome and 393 contigs had hits against coral DNA only.Together with the results from the mitochondrial DNA thesefindings indicate that even low-coverage genome surveys mayallow the identification of phylogenetically different genomeshidden within one organism.
Bacteria. Up to 1.57% of the reads (1.31% of the contigs) inthe libraries had highest similarity to bacterial DNA. Most hitswere found for the three analysed pycnogonid species Austropallenecornigera (n = 537), Colossendeis megalonyx (n = 170) and Pallenopsispatagonica (n = 54), but bacterial DNA was also recorded in the ventlimpet (n = 118, see Figure 7). Analysing the bacterial hits for thepycnogonid libraries showed that most had closest matches tovarious Gammaproteobacteria, whereas for the vent limpet thebacterial origin was very diverse (Figure 7, Supporting informationS6). The diversity of bacterial species reported by the searches washigh. For Austropallene cornigera, an Antarctic species, most of thehits were assigned to strains of Psychromonas ingrahamii, a cold-adapted species known from Arctic waters (Supporting informa-tion S7). Furthermore, our data revealed many reads with hits tovarious species of Shewanella, which are predominantly found indeep-sea habitats. Interestingly, 89 reads were assembled to onecontig that had the best match with Helicobacter pylori, a species
Figure 4. Overview over the different mitochondrial genesfound in the non-enriched libraries. The upper section indicatesfull (dark blue) and partial (bright blue) mitochondrial protein-coding orrRNA genes recovered. The pie chart indicates the proportion and totalnumber of tRNAs found. In the lower section the total contig lengths (inkb) of mitochondrial genes is shown.doi:10.1371/journal.pone.0049202.g004
Figure 5. Correlation between genomic library size (y-axis) and total length of mitochondrial genome recovered (x-axis). Asignificantly positive linear correlation (Pearson r = 0.6049, P = 0.0219) between the number of base pairs sequenced and the proportion of themitochondrial genome recovered was found.doi:10.1371/journal.pone.0049202.g005
Potential & Pitfalls of High Throughput Sequencing
PLOS ONE | www.plosone.org 10 November 2012 | Volume 7 | Issue 11 | e49202
commonly known from human stomachs where it induces gastritis[62]. Other abundant bacteria were also free-living, commensalicor pathogen bacteria that have been reported from variousmarine, often either deep-sea and/or cold-water environments.
Viruses. BLASTx searches against NCBI RefSeq Virusgenomes Proteins Database yielded hits in five libraries (Table 7).Most exceptional in terms of number of hits against virussequences was the bromeliad crab Metopaulias depressus. Here, weidentified 14,131 reads (7.56% of total reads) with hits to theWhite-Spot-Syndrome-Virus (WSSV) that is well known primarilyfrom penaeid shrimp aquaculture and repeatedly reported forother decapods and even for other crustacean groups [63,64]. Fora more accurate assignment, we took the WSSV genome (gi:17016399) as a query and performed tBLASTx searches with an e-value threshold of 10212 against all assembled and one-readcontigs in the genomic libraries of M. depressus. The tBLASTxapproach revealed that 9.23% of the sequenced DNA had hits andthus resemble WSSV-related viruses. Interestingly, the alreadysequenced WSSV consists of only 292,967 bp in 531 ORFs,whereas we have found 453,318 unique bp in this study. It cannotbe excluded that horizontal gene transfer has contributed to thepattern observed in Metopaulias depressus.
Using the DeconSeq software with different parameter combi-nations, only between 0.51% (n = 322) and 5.95% (n = 3749) of theproposed virus contaminant reads were found that had initiallybeen detected by BLAST searches. All hits found with standardsettings (coverage 906, identity $94%) belonged to repetitiveregions or even consisted solely of a tandem repeat. No sequenceof the WSSV-related virus was detected with default settings. Inthe least restrictive search (coverage 16, identity $60%), only 30of the 3,749 DeconSeq hits were contigs identified using theBLAST approach. All others seem to be false positives (mainlytandem repeats).
Discussion
For all 14 genomic libraries analysed, the sequence coveragewas just a minor fraction of the total genome. Estimated coveragevalues ranged from 0.1 to 20%. Our results highlight the greatpotential of such low-coverage next-generation sequencing datafor the simultaneous analysis of multiple genetic markerssupplementing primary results of Rasmussen and Noor [25].Moreover, for the first time we systematically compare the impactthat different non-target DNA sources may have on analysedlibraries. The approach we advocate differs in one fundamentalaspect from most other studies (e.g., [4,14,15,25]): prior to themain analyses of the low-coverage data, an assembly wasperformed to reduce redundancy. Although for average coveragevalues of ,1 it may seem unlikely that overlapping reads exist, itturns out that several genomic fragments are highly overrepre-sented and form rather long contigs. We found this to be relevantfor rRNA genes (Table 5), mitochondrial genes (Figure 4,Supporting information S4), transposable elements (see forexamples the mariner retrotransposons, Table 6) but also forother, possibly single-copy nuclear genes (Table 4). Hence, thestrategy of using a stringent assembly with repeats masked to avoidmerging reads that are not from the same physical locus isimportant to prepare the data for all subsequent steps. In a fewcases (1–4% of the contigs) MIRA did not mask terminal repeats,leading to some potentially erroneously assembled contigs.Attempts to assemble the data without masking internal repeatsusing the assembler available in the commercial software Geneiousled to artifactual results, since several reads ending with the sametandem repeat were assembled. We therefore suggest to assemblethe reads only with a software capable of masking repeats prior tothe assembly process to prevent unlinked contigs being joinedartificially by paralogous repeat regions.
Table 4. Summary of the nuclear gene identification in the genomic and enriched libraries.
Library Type Taxonomic GroupTotal number ofcontigs Number of contigs
With blastx hitsagainst Swiss-Prot
With a KEGGOrthology number
Favia fragum genomic Cnidaria 69,405 1,529 (2.20%) 1,634 (2.35%)
Austropallene cornigera genomic Arthropoda 40,883 2,616 (6.40%) 1,717 (4.20%)
Colossendeis megalonyx genomic Arthropoda 57,425 1,273 (2.22%) 820 (1.43%)
Pallenopsis patagonica genomic Arthropoda 62,753 1,600 (2.55%) 1,057 (1.68%)
Uristes adarei genomic Arthropoda 43,336 370 (0.85%) 110 (0.25%)
Euphausia superba genomic Arthropoda 42,256 139 (0.33%) 127 (0.30%)
Nematocarcinus lanceopes genomic Arthropoda 79,740 737 (0.92%) 209 (0.26%)
Hyas araneus genomic Arthropoda 93,050 1,362 (1.46%) 566 (0.61%)
Metopaulias depressus genomic Arthropoda 63,040 2,789 (4.42%) 530 (0.84%)
Sericostoma personatum genomic Arthropoda 139,237 2,767 (1.99%) 1,639 (1.18%)
Lepetodrilus sp. nov. genomic Mollusca 178,788 2,868 (1.60%) 2,772 (1.55%)
Limatula hodgsoni genomic Mollusca 105,801 795 (0.75%) 756 (0.71%)
Arctica islandica genomic Mollusca 54,266 422 (0.78%) 446 (0.82%)
Gorgonocephalus chilensis genomic Echinodermata 39,809 462 (1.16%) 248 (0.62%)
Lissarca notorcadensis enriched Mollusca 84,498 45 (0.05%) 127 (0.15%)
Odontaster validus enriched Echinodermata 86,280 23 (0.03%) 34 (0.04%)
The number and proportion of contigs that had tBLASTx hits to proteins in the Swiss-Prot database and the number of contigs with a K-number assigned by the KEGGAutomated Annotation Server pipeline KAAS is given. A visual representation of the KEGG categories of the hits is given in Figure 6.doi:10.1371/journal.pone.0049202.t004
Potential & Pitfalls of High Throughput Sequencing
PLOS ONE | www.plosone.org 11 November 2012 | Volume 7 | Issue 11 | e49202

For our study we used 454 pyrosequencing as the sequencingtechnique. This provides comparatively fewer but longer sequenc-es as compared to most other high-throughput technologies [65],in particular when comparing it to Illumina sequencers. Theadvantage of Illumina is that a much greater coverage can beobtained. The short reads have the drawback that microsatellitedevelopment is more difficult and homology searches are lessinformative. It has been demonstrated that the disadvantage ofshort reads can be compensated effectively by using paired-endIllumina sequences [66].
Tandem repeatsDifferent studies have used different search criteria for defining
microsatellites (see [48] for discussion). Hence, the computedtandem repeat contents are difficult to compare. In this study weused three different published sets of search parameters to detectmicrosatellites [13,15,48] and compared the results. Whereas mostrepeats were reported for the parameters used by Santana et al.[15], a much lower number was found when applying the ratherrestrictive criteria used by Abdelkrim et al. [13] and Gardner et al.[4].
Strict filtering criteria led to a decrease in obtained microsat-ellites mainly due to short read/contig lengths, which in turn led toabsent flanking regions (see also [13,14,67,68]). These strict
filtering criteria led to a significant dropout of candidate loci forthe three different search parameter settings (see Supportinginformation S3). The extremely strong decrease in the candidatemicrosatellites with suitable primers found in the Southern Oceanamphipod Uristes adarei (only 1.95% of the initially foundcandidates retained) was mainly due to microsatellites in thishighly repetitive genome, that were lacking a second flankingregions because of great repeat length.
Although the choice of appropriate search parameters stillremains a subject of controversial discussion, it is obvious that forall search parameter sets, even with very stringent filtering criteria(i.e. perfect microsatellites filtered from an imperfect Phobossearch, considering only single reads with appropriate flankingregions) the total number of reads containing suitable candidateloci was sufficient for many candidate microsatellites ranging from109 (2.53% of the microsatellite candidates) in Uristes adarei to1,085 (8.98%) in the vent limpet Lepetodrilus sp. nov. In general, formolecular ecological or population genetic studies on non-modelorganisms, microsatellites have usually been obtained by enrichinggenomic libraries, cloning and shotgun Sanger sequencing of thesefragments [69,70,40]. However, due to recurrent PCR amplifica-tions, the redundancy is often considerable and the number ofclones that can be sequenced is limited due to the involved costs(about 5 USD per plasmid prep and sequence read). For high-
Figure 6. Hits of nuclear genes against KEGG BRITE Ontology database using the KAAS pipeline for the 16 genomic libraries. Thenumber of hits is listed below the species name. Colours assigned according to the highest level of KEGG Orthology hierarchy (different organismal/cellular pathway groups/ecosystem processes).doi:10.1371/journal.pone.0049202.g006
Potential & Pitfalls of High Throughput Sequencing
PLOS ONE | www.plosone.org 12 November 2012 | Volume 7 | Issue 11 | e49202
throughput sequencing data, the cloning step can be avoided andsequencing costs have decreased to less than 0.02 USD per 454read, with an average clipped length of 272.02 bp in ourexamples. With increasing throughput and sequence lengths,next-generation sequencing platforms such as 454, Illumina or theIon-Torrent, facilitate marker development drastically. In partic-ular, when applying the strict filtering criteria and when scanningfor problematic reads, the polished high-throughput sequencingdatasets are superior to classical approaches. An additional benefitof using this methodology is that microsatellites in the vicinity ofcoding genes (in particular within 59 and 39 UTRs) can bedesigned and compared to putatively neutrally evolving microsat-ellites in intergenic regions. Microsatellites in coding regions (i.e.non-neutral markers) reflect the selection regime prevalent inpopulations/species and can be used to identify functional traitsthat explain evolutionary differences.
The sequenced libraries that were enriched for microsatellitesyielded many more microsatellite loci than the non-enrichedgenomic libraries. However, all our non-enriched librariesprovided sufficient unique and suitable microsatellite loci to workwith in subsequent studies (46 unique contigs with suitablemicrosatellites for the genome of Uristes adarei), even with extremelyrestrictive filter settings. This is in agreement with formercomparisons of enriched vs. non-enriched 454 libraries in twocase studies of non-model and model organisms ([68] for Acaciaharpophylla, [16] for Apis mellifera).
Mitochondrial genesFor all species, several mitochondrial gene fragments were
identified, although the overall yield differed considerably. For theindividual taxa, between 2,870 bp and 16,158 bp of themitochondrial genomes were recovered. These differences maybe due to the extraction of different tissue types (Supportinginformation S1), since the copy number of mitochondrial DNAper cell can vary among different tissues [71]. Furthermore,
difference in the nuclear genome size may also impact theproportion of recovered mitochondrial genome fragments. For theAntarctic krill species Euphausia superba, Jeffery (2010) documentedan abnormally large genome size [46]. For this species, aparticularly low proportion of mitochondrial gene fragments wasrecovered (5,502 bp) which might be a consequence of dilutioneffect due to large nuclear genome size. In other studies oninvertebrates, comparable or slightly higher proportions ofmitochondrial DNA were recovered from 454 libraries [25,72].Completing the mitochondrial genomes by Sanger sequencing onthe basis of sequences obtained in this study was trivial forColossendeis megalonyx, Sericostoma personatum, Austropallene cornigera,and Pallenopsis patagonica [26]. Compared to primer walkingapproaches with often unpredictable outcomes (see discussion in[24]), we instead suggest to invest in high-throughput sequencingas demonstrated in this study or by Groenenberg et al. [73].
Non-target genome DNAEven though low-coverage genomic surveys represent only a
minor fraction of the genome, they offer a great potential forevolutionary biologists. Solely extracting markers in a traditionalway, i.e. picking those that look appropriate without doing asophisticated analysis of the whole large dataset, may result inoverlooking interesting and important phenomena, such as DNAof other organisms (viruses, bacteria, symbionts). Furthermore,primers may be designed for microsatellites located in mobileDNA elements in the genome, which leads to genotypingproblems. We have demonstrated that with some effort, theseimportant elements can be identified in order to maximise the useof the polished high-throughput libraries.
In the process of developing genetic markers it is commonlyassumed that the presence of non-target DNA is negligible andhence requires no sophisticated action. However, contamination isa severe problem in genetic research [32,74] and many differentsources of contamination of the target DNA exist. In this study we
Table 5. rRNA genes found in the different libraries.
Library Type Taxonomic GroupTotal contiglength, bp
Number ofreads
Avg readsnumber percontig
Number ofcontigs
Favia fragum genomic Cnidaria 17,606 700 31.82 22
Austropallene cornigera genomic Arthropoda 14,290 151 6.04 25
Colossendeis megalonyx genomic Arthropoda 25,166 506 23.00 22
Pallenopsis patagonica genomic Arthropoda 28,756 787 29.15 27
Uristes adarei genomic Arthropoda 9,314 62 3.26 19
Euphausia superba genomic Arthropoda 20,753 181 4.89 37
Nematocarcinus lanceopes genomic Arthropoda 21,651 1380 47.59 29
Hyas araneus genomic Arthropoda 36,624 827 20.17 41
Metopaulias depressus genomic Arthropoda 12,045 124 7.29 17
Sericostoma personatum genomic Arthropoda 55,832 637 8.27 77
Lepetodrilus sp. nov. genomic Mollusca 11,628 186 5.81 32
Limatula hodgsoni genomic Mollusca 42,545 2027 47.14 43
Arctica islandica genomic Mollusca 12,486 97 3.59 27
Gorgonocephalus chilensis genomic Echinodermata 58,588 633 10.91 58
Lissarca notorcadensis enriched Mollusca 2,453 96 7.38 13
Odontaster validus enriched Echinodermata 12,299 246 6.83 36
The total number of reads, the number of assembled contigs with coverage and the total unique rRNA gene bp are listed.doi:10.1371/journal.pone.0049202.t005
Potential & Pitfalls of High Throughput Sequencing
PLOS ONE | www.plosone.org 13 November 2012 | Volume 7 | Issue 11 | e49202

Ta
ble
6.
Ch
arac
teri
stic
so
fco
nti
gs
wit
hh
om
olo
gy
tokn
ow
ntr
ansp
osa
ble
elem
ents
inth
elib
rari
es.
Lib
rary
Ty
pe
Ta
xo
no
mic
Gro
up
To
tal
con
tig
len
gth
(bp
)N
um
be
ro
fre
ad
sA
vg
rea
dn
um
be
rp
er
con
tig
Nu
mb
er
of
con
tig
sT
ota
lre
ad
len
gth
(bp
)M
ain
hit
s
Favi
afr
agum
gen
om
icC
nid
aria
00
00
0
Aus
trop
alle
ne
corn
iger
ag
eno
mic
Art
hro
po
da
5,95
581
10.1
820
,220
Ran
a(f
rog)
Tc1
Col
osse
nde
ism
egal
onyx
gen
om
icA
rth
rop
od
a97
85
5.0
11,
389
Xip
hop
hor
us(f
ish
)Re
x3-
retr
otra
nsp
oson
s
Palle
nop
sis
pat
agon
ica
gen
om
icA
rth
rop
od
a4,
875
262.
99
9,99
4Ra
na
(fro
g)
Tc1;
Lep
eop
hth
eiru
s(c
opep
od)
Tc3
Uri
stes
adar
eig
eno
mic
Art
hro
po
da
00
00
0
Eup
hau
sia
sup
erba
gen
om
icA
rth
rop
od
a0
00
00
Nem
atoc
arci
nus
lan
ceop
esg
eno
mic
Art
hro
po
da
00
00
0
Hya
sar
aneu
sg
eno
mic
Art
hro
po
da
2,70
733
16.5
211
,246
Gal
ath
eid
(dec
apo
ds)
Gal
Eatr
ansp
oso
n
Met
opau
lias
dep
ress
usg
eno
mic
Art
hro
po
da
1,76
57
2.3
33,
291
Lito
pen
aeus
(dec
apod
)n
on-L
TRre
trot
ran
spos
onI-
typ
e;in
sect
Mar
iner
-tra
nsp
oson
s
Seri
cost
oma
per
son
atum
gen
om
icA
rth
rop
od
a25
0,72
01,
895
7.8
243
642,
767
inse
ctM
arin
er-t
ran
spo
son
s
Lep
etod
rilu
ssp
.no
v.g
eno
mic
Mo
llusc
a0
00
00
Lim
atul
ah
odgs
oni
gen
om
icM
ollu
sca
00
00
0
Arc
tica
isla
ndi
cag
eno
mic
Mo
llusc
a0
00
00
Gor
gon
ocep
hal
usch
ilen
sis
gen
om
icEc
hin
od
erm
ata
00
00
0
Liss
arca
not
orca
den
sis
enri
ched
Mo
llusc
a0
00
00
Odo
nta
ster
valid
usen
rich
edEc
hin
od
erm
ata
00
00
0
do
i:10.
1371
/jo
urn
al.p
on
e.00
4920
2.t0
06
Potential & Pitfalls of High Throughput Sequencing
PLOS ONE | www.plosone.org 14 November 2012 | Volume 7 | Issue 11 | e49202

used a BLAST approach to quantify the (minimum) amount ofnon-target DNA in the analysed libraries. Other bioinformaticapproaches to detect contamination had been tested in phyloge-nomic studies and were found to be superior to BLAST in terms ofspeed [29]. In particular, approaches that align short reads againsta known reference sequence of the potential contaminants usingBurrows-Wheeler Transform (BWA) are described as powerful[36]. Using the software DeconSeq [29], which utilizes the BWA,we could only detect a small subset of the virus contaminant in ourlibrary of Metopaulias depressus, but found a huge number of falsepositive, repetitive hits. In contrast, the BLAST approachidentified 9.23% of the total number of reads as originating fromWSSV-related viruses and thus should be classified as acontamination. The comparatively low success of DeconSeqseems to be due to the low similarity of the virus found inMetopaulias depressus and the WSSV reference genome. Inexploratory studies on non-model organisms from weakly charac-terized habitats, as in our study, reference genomes for potentialcontaminants do not exist. Therefore, slower but more thoroughapproaches such as a combination of different BLAST searches, as
outlined above, can be superior over DeconSeq. Although slower,BLAST was able to identify the WSSV-related virus in theMetopaulias depressus. Our datasets may serve as a source for furtherbenchmark tests, similar to the study of Schmieder and Edwards[29].
Evidence for the presence of symbionts was obtained for thehard coral Favia fragum. Here, the tissue extracted from organismcan potentially contain five genomes 1) the nuclear genome of thecoral host Favia fragum, 2) the mitochondrial genome of the coralhost, 3) the nuclear genome of the symbiont Symbiodinium sp., 4) themitochondrial genome of the symbiont, and 5) the chloroplastgenome of the symbiont. This complex mixture of genomes isusually avoided in coral studies. Researchers use larval tissue (e.g.[75]) or sperm (e.g. [76]) to enrich the amount of host DNA andminimize the presence of symbiont and mitochondrial genomes.Our study, however, found that including the holobiont mightprovide a lot of additional data without necessarily reducing thelevel of information obtained from the target host species. Evenwithout enriching the extracted tissue for the host nuclear DNA,the majority of obtained reads/contigs belonged to the host
Figure 7. Bacterial hits found in four genomic libraries. Hits for the bacterial species are displayed next to the chart pie for species with $4%of the hits. For the three pycnogonid species, Gammaproteobacteria are predominant, whereas for the vent limpet Lepetodrilus sp. nov. differentbacterial groups were detected. The colours of the charts relate to the phyla/classes of Bacteria (see legend).doi:10.1371/journal.pone.0049202.g007
Potential & Pitfalls of High Throughput Sequencing
PLOS ONE | www.plosone.org 15 November 2012 | Volume 7 | Issue 11 | e49202

Ta
ble
7.
Ch
arac
teri
stic
so
fco
nti
gs
wit
hh
om
olo
gy
tovi
ral
pro
tein
seq
uen
ces
inth
elib
rari
es.
Lib
rary
Ty
pe
Ta
xo
no
mic
gro
up
To
tal
con
tig
len
gth
(bp
)N
um
be
ro
fre
ad
s
Av
gre
ad
nu
mb
er
pe
rco
nti
gN
um
be
ro
fco
nti
gs
To
tal
rea
dle
ng
th(b
p)
Be
sth
its
Favi
afr
agum
gen
om
icC
nid
aria
00
00
0
Aus
trop
alle
ne
corn
iger
ag
eno
mic
Art
hro
po
da
00
00
0
Col
osse
nde
ism
egal
onyx
gen
om
icA
rth
rop
od
a44
93
3.0
11,
073
Ente
rob
acte
ria
ph
age
lam
bd
a(t
ail
com
po
nen
t)
Palle
nop
sis
pat
agon
ica
gen
om
icA
rth
rop
od
a0
00
00
Uri
stes
adar
eig
eno
mic
Art
hro
po
da
00
00
0
Eup
hau
sia
sup
erba
gen
om
icA
rth
rop
od
a0
00
00
Nem
atoc
arci
nus
lan
ceop
esg
eno
mic
Art
hro
po
da
00
00
0
Hya
sar
aneu
sg
eno
mic
Art
hro
po
da
1,92
719
19.0
17,
747
Cot
esia
con
greg
ata
bra
covi
rus
(hyp
oth
etic
alp
rote
in)
Met
opau
lias
dep
ress
usg
eno
mic
Art
hro
po
da
447,
712
14,1
3114
7.2
965,
253,
117
Wh
ite
spo
tsy
nd
rom
ev
iru
s
Seri
cost
oma
per
son
atum
gen
om
icA
rth
rop
od
a8,
674
145
72.5
248
,174
Stra
wb
erry
vein
ban
din
gvi
rus
(ret
rotr
ansp
osa
se),
Vac
cin
iavi
rus
(rib
on
ucl
eoti
de
red
uct
ase)
Lep
etod
rilu
ssp
.no
v.g
eno
mic
Mo
llusc
a46
81
1.0
146
8Em
ilian
iah
uxle
yivi
rus
86(r
ibo
nu
cleo
sid
e-d
iph
osp
hat
ere
du
ctas
e)
Lim
atul
ah
odgs
oni
gen
om
icM
ollu
sca
00
00
0
Arc
tica
isla
ndi
cag
eno
mic
Mo
llusc
a0
00
00
Gor
gon
ocep
hal
usch
ilen
sis
gen
om
icEc
hin
od
erm
ata
00
00
0
Liss
arca
not
orca
den
sis
enri
ched
Mo
llusc
a0
00
00
Odo
nta
ster
valid
usen
rich
edEc
hin
od
erm
ata
00
00
0
do
i:10.
1371
/jo
urn
al.p
on
e.00
4920
2.t0
07
Potential & Pitfalls of High Throughput Sequencing
PLOS ONE | www.plosone.org 16 November 2012 | Volume 7 | Issue 11 | e49202

genome (Favia fragum). In addition, a very large proportion of theFavia mitochondrial genome could be assembled providingvaluable additional markers as well as a very good basis formitogenome completion using conventional Sanger sequencing.For the symbiont mitogenome, an important mitochondrialmarker (CO1) could be identified. Summarizing, we can concludethat the presence of several different genomes enhances theamount of information that can be obtained from low-coveragegenome surveys.
With respect to viral reads, we found several instances in whichthe amount of non-target DNA was considerably high with acontribution of up to 10% of the total number of sequenced basepairs in the library (as in Metopaulias depressus). Viruses are capableof infecting organisms from all evolutionary lineages and actuallydo so very frequently [77]. Hence, genomic traces of viruses, the‘‘virome’’, have been reported from genomic libraries, particularlyfrom sequenced model organisms and revealed a huge diversity(e.g. [78]).
We found that bacterial reads were present in a non-negligibleproportion in four of our libraries. Interestingly, three of theselibraries were from pycnogonids and one from a hydrothermalvent limpet. Pycnogonids have a special anatomy in that theirorgans are shifted mainly into their legs, due to their very smalltrunk. This, however, enhances the risk of including gut contentwithin the extracted DNA. Although we used only the tissue fromthe distal leg parts in Colossendeis, we had to grind whole legs forAustropallene and Pallenopsis to achieve the necessary amount ofDNA. Bacterial contamination, in particular in the latter twopycnogonids, very likely stems from ingested marine bacteria.Reads identified as bacterial contamination in the three pycno-gonids usually had the closest matches to Gammaproteobacteria,which are cold-water adapted prokaryotes. Although studies of themolecular diversity of bacterial communities in the SouthernOcean are in their infancy [79], preliminary data show that thebacterial species differ from those in other oceans and have typicaladaptations to the constantly cold marine environment. Speciesfound in pelagic bacterial culture collections from the SouthernOcean frequently belong to Gamma- or Alphaproteobacteria [79].This view is mostly consistent with the hits observed in our library.Interestingly, the number of different bacteria we found was highand only few redundant reads were found, further highlighting theenormous bacterial diversity. One highly redundant contig,composed of 89 single reads, had the best match against thegram-negative bacterium Helicobacter pylori. Although Helicobacterpylori is not only known from human intestines, but from differentaquatic habitats including marine habitats [80], the strongoverrepresentation of one fragment suggests that it may resultfrom a contamination of the library. The limpet Lepetodrilus sp.nov. grazes on bacterial films in the vent habitat. Thuscontamination by bacteria attached to the tissue processed is alikely explanation. Rogers et al. [81] investigated the bacterialcommunities in the vent habitat by 16S rDNA clone librarysequencing. They found a high proportion of Gammaproteoba-ceria, Alphaproteobacteria, Bacteroidetes and Deferribacterales.With the exception of the latter, these groups were alsorepresented in our identified hits. In addition, Epsilonproteobac-teria, in particular bacteria of the genus Arcobacter, were foundseveral times.
In principle, lateral gene transfer between symbiotic bacteriaand eukaryotic genomes could be a further explanation for thedata, since it may be more common than expected and may evenbe of functional importance in the course of evolution [82]. Amajor argument against this possible explanation is the fact thatmost of the closest hits in the bacteria were species that are free-
living. Although several libraries were not obviously affected bybacterial reads, the contribution of 1.57% in the library ofAustropallene advises caution and highlights the importance oftesting for contamination prior to subsequent analyses.
Cases of contamination by other eukaryotic species were rare,but present (e.g. the presence of a dragonfly sequence, althoughthis template was not extracted from any of the authors’laboratories). Clearly, such an unexpected contamination needsto be taken into account by active searching. This issue is furthercomplicated for eukaryotic symbionts. Here, successfully finding acertain non-target DNA depends on a homolog sequence beingdeposited in the database that is used for contamination screening.Consequently, an unknown proportion of the libraries mayoriginate from so called ‘‘dark matter’’ sequences of other speciesthat are not represented in the public databases.
Conclusions
Using examples from 14 low-coverage genomic 454 libraries,genetic markers for population genetic analyses as well as forphylogenetic studies or other biological disciplines were identifiedand characterised. We suggest a series of steps which are critical toavoid some of the problematic pitfalls of processing low coveragelibraries for evolutionary biology. We recommend an initialstringent assembly of the reads as a key step for reducingredundancy and increasing per locus information content, even inlow coverage surveys. Masking repeats prior to assembly isimportant to avoid merging unrelated reads that are united bysimilar repeat motifs. Prior to downstream analyses of sequencedata, it is important to validate the origin and identity ofsequences. Although for uncharacterized genomes little informa-tion on sequence identity is available in public databases, we havedemonstrated that a significant proportion of library reads were ofnon-target origin, using simple BLAST routines. If not excludedfrom the libraries prior to downstream analyses, such contaminantreads can lead to biased or even strongly misleading inferences ofevolutionary processes from the contaminated data.
Supporting Information
Supporting information S1 Information on samplingsites, tissue and DNA extraction protocols for thespecimens analysed in this study.(PDF)
Supporting information S2 Overview over the assemblyresults for the different genomic libraries. The number ofcontigs (y-axis, log-scale) with the respective number of readsincluded in the contig (x-axis). In all cases, single-read contigs(x = 1) represented the majority of contigs after assembly.(PDF)
Supporting information S3 Information on the micro-satellites found (total number, bp, density, filteredcandidate loci with primers). For the 95% perfectionanalyses we searched for imprefect microsatellites/minisatellitesand filtered out only those with a perfection equal or higher than95%.(XLS)
Supporting information S4 Overview over the differentmitochondrial genes found in the different libraries. An‘f’ indicates that the whole gene was found whereas ‘p’ indicatesthat only a part of the gene was found.(XLS)
Potential & Pitfalls of High Throughput Sequencing
PLOS ONE | www.plosone.org 17 November 2012 | Volume 7 | Issue 11 | e49202

Supporting information S5 Analysis of the contigs fromthe Favia fragum 454 library. The number of BLASTn hitsagainst either dinoflagellate (GenBank Taxon ID ‘‘Dinoflagellate’’NOT gene_in_plastid_chloroplast[PROP]), dinoflagellate plas-tome (GenBank Taxon ID ‘‘Dinoflagellate’’ AND gene_in_plas-tid_chloroplast[PROP]) or coral (GenBank Taxon ID ‘‘Faviinae’’and the Nematostella vectensis genome). The first 6 contigs had hitsfor both, nuclear and plastid dinoflagellate fragments. 11 contigshad hits for nuclear dinoflagellate and coral fragments. Forinformation on the mitochondrial genes found for the coral andthe symbiont see Supporting information S4.(XLS)
Supporting information S6 Taxonomic classification ofbacterial hits found within the three pycnogonids andthe vent limpet Lepetodrilus sp. nov. (see also Figure 7).(PDF)
Supporting information S7 Bacterial hits for Austropal-lene cornigera obtained with BLAST and respective
information on habitats. References are found in the secondworksheet (‘‘References’’).(XLS)
Acknowledgments
We thank Anna Eckart and Julia M. Vollmer for laboratory assistance.Sebastian Chevreux provided valuable hints on how to apply MIRA to thelow-coverage datasets. We greatly acknowledge the efforts of the ICEFISH2004, ANDEEP II, CEAMARC and ChEsSO cruise organisers. We thanktwo anonymous referees for helpful comments and suggestions on themanuscript.
Author Contributions
Conceived and designed the experiments: FL CJS. Performed theexperiments: CDS CH CJS FL KPL LD JD JJ JN JNM JSD MJR NTRSA SS. Analyzed the data: FL AR CJS CM PB. Contributed reagents/materials/analysis tools: AR CDS CH CJS CM FL KL KPL MJR RT.Wrote the paper: FL AR PB CM. Helped drafting the manuscript anddiscussed the data: CDS CJS JD JJ JSD KL KPL MJR RT SA WGC.Read and approved the final version of the manuscript: All authors.
References
1. Hudson M (2008) Sequencing breakthroughs for genomic ecology andevolutionary biology. Mol Ecol Resour 8: 3–17.
2. Ekblom R, Galindo J (2011) Applications of next generation sequencing inmolecular ecology of non-model organisms. Heredity 107: 1–15.
3. Brito P, Edwards S (2009) Multilocus phylogeography and phylogenetics usingsequence-based markers. Genetica 135: 439–455.
4. Gardner M, Fitch A, Bertozzi T, Lowe A (2011) Rise of the machines -recommendations for ecologists when using next generation sequencing formicrosatellite development. Mol Ecol Resour 11: 1093–1101.
5. Elshire R, Glaubitz J, Sun Q, Poland J, Kawamoto K, et al. (2011) A robust,simple genotyping-by-sequencing (GBS) approach for high diversity species.PLoS ONE 6: 19379.
6. Hohenlohe P, Bassham S, Etter P, Stiffler N, Johnson E, et al. (2010) Populationgenomics of parallel adaptation in threespine stickleback using sequenced RADtags. PLoS Genet 6: 1000862.
7. Meusemann K, von Reumont B, Simon S, Roeding F, Strauss S, et al. (2010) Aphylogenomic approach to resolve the arthropod tree of life. Mol Biol Evol 27:2451–2464.
8. Bybee S, Bracken-Grissom H, Haynes B, Hermansen R, Byers R, et al. (2011)Targeted Amplicon Sequencing (TAS): a scalable next-gen approach tomultilocus, multitaxa phylogenetics. Genome Biol Evol 3: 1312–1323.
9. Sunnucks P (2000) Efficient genetic markers for population biology. Trends EcolEvol 15: 199–203.
10. Wagele J, Mayer C (2007) Visualizing differences in phylogenetic informationcontent of alignments and distinction of three classes of long-branch effects.BMC Evol Biol 7: 147.
11. Goldstein D, Pollock D (1997) Launching microsatellites: a review of mutationprocesses and methods of phylogenetic interference. J Hered 88: 335–342.
12. Goldstein D, Schlotterer C (1999) Microsatellites: evolution and applications.New York, USA: Oxford University Press Inc. 352 p.
13. Abdelkrim J, Robertson B, Stanton J, Gemmell N (2009) Fast, cost-effectivedevelopment of species-specific microsatellite markers by genomic sequencing.Biotechniques 46: 185–192.
14. Castoe T, Poole A, Gu W, De Koning A, Daza J, et al. (2010) Rapididentification of thousands of copperhead snake (Agkistrodon contortrix) microsat-ellite loci from modest amounts of 454 shotgun genome sequence. Mol EcolResour 10: 341–347.
15. Santana Q, Coetzee M, Steenkamp E, Mlonyeni O, Hammond G, et al. (2009)Microsatellite discovery by deep sequencing of enriched genomic libraries.Biotechniques 46: 217–223.
16. Malausa T, Gilles A, Meglecz E, Blanquart H, Duthoy S, et al. (2011) High-throughput microsatellite isolation through 454 GS-FLX Titanium pyrose-quencing of enriched DNA libraries. Mol Ecol Resour 11: 638–644.
17. Martin J, Pech N, Meglecz E, Ferreira S, Costedoat C, et al. (2010)Representativeness of microsatellite distributions in genomes, as revealed by454 GS-FLX titanium pyrosequencing. BMC Genomics 11: 560.
18. Guichoux E, Lagache L, Wagner S, Chaumeil P, Leger P, et al. (2011) Currenttrends in microsatellite genotyping. Mol Ecol Resour 11: 591–611.
19. Avise J (2000) Phylogeography: the history and formation of species. Cambridge,MA: Harvard University Press. 453 p.
20. Hillis D, Dixon M (1991) Ribosomal DNA: molecular evolution andphylogenetic inference. Q Rev Biol 66: 411–453.
21. Dunn C, Hejnol A, Matus D, Pang K, Browne W, et al. (2008) Broadphylogenomic sampling improves resolution of the animal tree of life. Nature452: 745–749.
22. Gissi C, Iannelli F, Pesole G (2008) Evolution of the mitochondrial genome ofMetazoa as exemplified by comparison of congeneric species. Heredity 101:301–320.
23. Rota-Stabelli O, Kayal E, Gleeson D, Daub J, Boore J, et al. (2010) Ecdysozoanmitogenomics: evidence for a common origin of the legged invertebrates, thePanarthropoda. Genome Biol Evol 2: 425–440.
24. Kilpert F, Held C, Podsiadlowski L (2012) Multiple rearrangements inmitochondrial genomes of Isopoda and phylogenetic implications. MolPhylogenet Evol 64: 106–117.
25. Rasmussen D, Noor M (2009) What can you do with 0.16genome coverage? Acase study based on a genome survey of the scuttle fly Megaselia scalaris (Phoridae).BMC Genomics 10: 382.
26. Dietz L, Mayer C, Arango C, Leese F (2010) The mitochondrial genome ofColossendeis megalonyx supports a basal position of Colossendeidae within thePycnogonida. Mol Phyl Evol 58: 553–558.
27. Timmermans M, Dodsworth S, Culverwell C, Bocak L, Ahrens D, et al. (2010)Why barcode? High-throughput multiplex sequencing of mitochondrialgenomes for molecular systematics. Nucl Acids Res 38: e197.
28. Nederbragt A, Rounge T, Kausrud K, Jakobsen K (2010) Identification andquantification of genomic repeats and sample contamination in assemblies of454 pyrosequencing reads. Sequencing 2010: 782465.
29. Schmieder R, Edwards R (2011) Fast identification and removal of sequencecontamination from genomic and metagenomic datasets. PLoS ONE 6: e17288.
30. Bourlat S, Nielsen C, Lockyer A, Littlewood D, Telford M (2003) Xenoturbellais a deuterostome that eats molluscs. Nature 424: 925–928.
31. Philippe H, Brinkmann H, Lavrov D, Littlewood D, Manuel M, et al. (2011)Resolving difficult phylogenetic questions: why more sequences are not enough.PLoS Biology 9: e1000602.
32. Laurin-Lemay S, Brinkmann H, Philippe H (2012) Origin of land plantsrevisited in the light of sequence contamination and missing data. Curr Biol 22:R593–R594.
33. Altschul S, Madden T, Schaffer A, Zhang J, Zhang Z, et al. (1997) GappedBLAST and PSI-BLAST: a new generation of protein database searchprograms. Nucl Acids Res 25: 3389–3402.
34. Camacho C, Coulouris G, Avagyan V, Ma N, Papadopoulos J, et al. (2009)BLAST+: architecture and applications. BMC Bioinformatics 10: 421.
35. Kent W (2002) BLAT—the BLAST-like alignment tool. Genome Res 12: 656–664.
36. Li H, Durbin R (2009) Fast and accurate short read alignment with Burrows–Wheeler transform. Bioinformatics 25: 1754–1760.
37. Li H, Durbin R (2010) Fast and accurate long-read alignment with Burrows-Wheeler transform. Bioinformatics 26: 589–595.
38. Ning Z, Cox A, Mullikin J (2001) SSAHA: a fast search method for large DNAdatabases. Genome Res 11: 1725–1729.
39. Straub S, Fishbein M, Livshultz T, Foster Z, Parks M, et al. (2011) Building amodel: Developing genomic resources for common milkweed (Asclepias syriaca)with low coverage genome sequencing. BMC Genomics 12: 211.
40. Leese F, Mayer C, Held C (2008) Isolation of microsatellites from unknowngenomes using known genomes as enrichment templates. Limnol Oceanogr 6:412–426.
41. Blanca J, Chevreux B (2011) sff_extract. Website:http://bioinf.comav.upv.es/sff_extract, acceessed 2012 March 3rd.
42. Chevreux B (2005) MIRA: an automated genome and EST assembler. PhDthesis, Ruprecht-Karls University, Heidelberg, Germany. 161 p.
Potential & Pitfalls of High Throughput Sequencing
PLOS ONE | www.plosone.org 18 November 2012 | Volume 7 | Issue 11 | e49202

43. Drummond A, Ashton B, Buxton S, Cheung M, Cooper A, et al. (2011)Geneious v5.4.6. Website:http://www.geneious.com. Accessed 2011 October13th.
44. Widenius M, Axmark D, MySQL A (2002) MySQL Reference Manual:Documentation from the Source. O’Reilly Community Press. 802 p.
45. Gregory T, Nicol J, Tamm H, Kullman B, Kullman K, et al. (2007) Eukaryoticgenome size databases. Nucl Acids Res 35: D332–D338.
46. Jeffery N (2012) The first genome size estimates for six species of krill(Malacostraca, Euphausiidae): large genomes at the north and south poles. PolarBiol 35: 959–962.
47. Mayer C (2010) Phobos Version 3.3.12. A tandem repeat search program. 20 p.Available:http://www.rub.de/spezzoo/cm/cm_phobos.htm. Accessed 2011October 13th.
48. Mayer C, Leese F, Tollrian R (2010) Genome-wide analysis of tandem repeats inDaphnia pulex - a comparative approach. BMC Genomics 11: 277.
49. Rozen S, Skaletsky H (2000) Primer3 on the WWW for general users and forbiologist programmers. Methods Mol Biol 132: 365–386.
50. Hancock J, Armstrong J (1994) SIMPLE34: an improved and enhancedimplementation for VAX and Sun computers of the SIMPLE algorithm foranalysis of clustered repetitive motifs in nucleotide sequences. Comput ApplBiosci 10: 67–70.
51. Alba M, Laskowski R, Hancock J (2002) Detecting cryptically simple proteinsequences using the SIMPLE algorithm. Bioinformatics 18: 672–678.
52. Meglecz E, Costedoat C, Dubut V, Gilles A, Malausa T, et al. (2010) QDD: auser-friendly program to select microsatellite markers and design primers fromlarge sequencing projects. Bioinformatics 26: 403–404.
53. Schattner P, Brooks A, Lowe T (2005) The tRNAscan-SE, snoscan and snoGPSweb servers for the detection of tRNAs and snoRNAs. Nucl Acids Res 33:W686–W689.
54. Laslett D, Canback B (2008) ARWEN: a program to detect tRNA genes inmetazoan mitochondrial nucleotide sequences. Bioinformatics 24: 172–175.
55. Moriya Y, Itoh M, Okuda S, Yoshizawa A, Kanehisa M (2007) KAAS: anautomatic genome annotation and pathway reconstruction server. Nucl AcidsRes 35: W182–W185.
56. Kanehisa M, Goto S, Hattori M, Aoki-Kinoshita K, Itoh M, et al. (2006) Fromgenomics to chemical genomics: new developments in KEGG. Nucl Acids Res34: D354–D357.
57. Kanehisa M, Goto S, Kawashima S, Okuno Y, Hattori M (2004) The KEGGresource for deciphering the genome. Nucl Acids Res 32: D277–D280.
58. Boeckmann B, Bairoch A, Apweiler R, Blatter M, Estreicher A, et al. (2003) TheSWISS-PROT protein knowledgebase and its supplement TrEMBL in 2003.Nucl Acids Res 31: 365–370.
59. Bairoch A, Apweiler R, Wu C, Barker W, Boeckmann B, et al. (2005) Theuniversal protein resource (UniProt). Nucl Acids Res 33: D154–D159.
60. Perry J, Rowe L (2011) Rapid microsatellite development for water striders bynext-generation sequencing. J Hered 102: 125–129.
61. Perseke M, Bernhard D, Fritzsch G, Brummer F, Stadler P, et al. (2010)Mitochondrial genome evolution in Ophiuroidea, Echinoidea, and Holothur-oidea: Insights in phylogenetic relationships of Echinodermata. Mol PhylogenetEvol 56: 201–211.
62. Cover T, Blaser M (2009) Helicobacter pylori in health and disease. Gastroenter-ology 136: 1863–1873.
63. Hossain M, Chakraborty A, Joseph B, Otta S, Karunasagar I, et al. (2001)Detection of new hosts for white spot syndrome virus of shrimp using nestedpolymerase chain reaction. Aquaculture 198: 1–11.
64. Chen L, Lo C, Chiu Y, Chang C, Kou G (2000) Natural and experimentalinfection of white spot syndrome virus (WSSV) in benthic larvae of mud crabScylla serrata. Dis Aquat Organ 40: 157–161.
65. Glenn T (2011) Field guide to next-generation DNA sequencers. Mol EcolResour 11: 759–769.
66. Castoe T, Poole A, de Koning A, Jones K, Tomback D, et al. (2012) Rapidmicrosatellite identification from Illumina paired-end genomic sequencing intwo birds and a snake. PLoS ONE 7: e30953.
67. Csencsics D, Brodbeck S, Holderegger R (2010) Cost-effective, species-specificmicrosatellite development for the endangered Dwarf Bulrush (Typha minima)using next-generation sequencing technology. J Hered 101: 789–793.
68. Lepais O, Bacles C (2011) Comparison of random and SSR-enriched shotgunpyrosequencing for microsatellite discovery and single multiplex PCR optimi-zation in Acacia harpophylla F. Muell. ex Benth. Mol Ecol Resour 11: 711–724.
69. Zane L, Bargelloni L, Patarnello T (2002) Strategies for microsatellite isolation: areview. Mol Ecol 11: 1–16.
70. Glenn T, Schable N (2005) Isolating microsatellite DNA loci. Methods Enzymol395: 202–222.
71. Cavelier L, Johannisson A, Gyllensten U (2000) Analysis of mtDNA copynumber and composition of single mitochondrial particles using flow cytometryand PCR. Exp Cell Res 259: 79–85.
72. Feldmeyer B, Hoffmeier K, Pfenninger M (2010) The complete mitochondrialgenome of Radix balthica (Pulmonata, Basommatophora), obtained by lowcoverage shot gun next generation sequencing. Mol Phylogenet Evol 57: 1329–1333.
73. Groenenberg D, Pirovano W, Gittenberger E, Schilthuizen M (2012) Thecomplete mitogenome of Cylindrus obtusus (Helicidae, Ariantinae) using Illuminanext generation sequencing. BMC Genomics 13: 114.
74. Longo M, O’Neill M, O’Neill R (2011) Abundant human DNA contaminationidentified in non-primate genome databases. PLoS ONE 6: 16410.
75. Polato N, Vera J, Baums I (2011) Gene discovery in the threatened elkhorncoral: 454 sequencing of the Acropora palmata transcriptome. PLoS ONE 6:e28634.
76. Shinzato C, Shoguchi E, Kawashima T, Hamada M, Hisata K, et al. (2011)Using the Acropora digitifera genome to understand coral responses toenvironmental change. Nature 476: 320–323.
77. Edwards R, Rohwer F (2005) Viral metagenomics. Nat Rev Microbiol 3: 504–510.
78. Rooks D, Smith D, McDonald J, Woodward M, McCarthy A, et al. (2010) 454-pyrosequencing: a molecular battiscope for freshwater viral ecology. Genes 1:210–226.
79. Murray A, Grzymski J (2007) Diversity and genomics of Antarctic marine micro-organisms. Phil Trans R Soc B 362: 2259–2271.
80. Twing K, Kirchman D, Campbell B (2011) Temporal study of Helicobacter pyloripresence in coastal freshwater, estuary and marine waters. Water Res 45: 1897–1905.
81. Rogers A, Tyler P, Connelly D, Copley J, James R, et al. (2012) The discovery ofnew deep-sea hydrothermal vent communities in the Southern Ocean andimplications for biogeography. PLoS Biol 10: e1001234.
82. Hotopp J, Clark M, Oliveira D, Foster J, Fischer P, et al. (2007) Widespreadlateral gene transfer from intracellular bacteria to multicellular eukaryotes.Science 317: 1753–1756.
Potential & Pitfalls of High Throughput Sequencing
PLOS ONE | www.plosone.org 19 November 2012 | Volume 7 | Issue 11 | e49202
Copyright © 2022 FDOKUMEN