Exploration of the extension of two lava tubes, faults and dikes using very low...
19
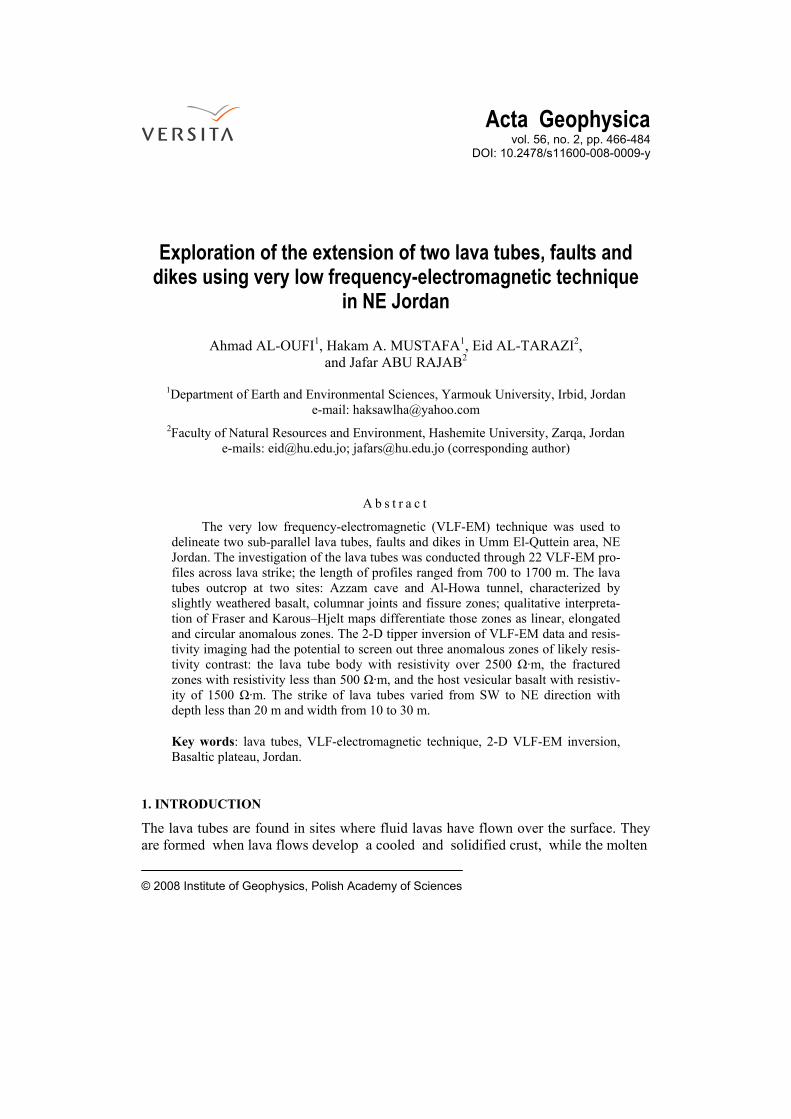
Acta Geophysica vol. 56, no. 2, pp. 466-484 DOI: 10.2478/s11600-008-0009-y © 2008 Institute of Geophysics, Polish Academy of Sciences Exploration of the extension of two lava tubes, faults and dikes using very low frequency-electromagnetic technique in NE Jordan Ahmad AL-OUFI 1 , Hakam A. MUSTAFA 1 , Eid AL-TARAZI 2 , and Jafar ABU RAJAB 2 1 Department of Earth and Environmental Sciences, Yarmouk University, Irbid, Jordan e-mail: [email protected] 2 Faculty of Natural Resources and Environment, Hashemite University, Zarqa, Jordan e-mails: [email protected]; [email protected] (corresponding author) Abstract The very low frequency-electromagnetic (VLF-EM) technique was used to delineate two sub-parallel lava tubes, faults and dikes in Umm El-Quttein area, NE Jordan. The investigation of the lava tubes was conducted through 22 VLF-EM pro- files across lava strike; the length of profiles ranged from 700 to 1700 m. The lava tubes outcrop at two sites: Azzam cave and Al-Howa tunnel, characterized by slightly weathered basalt, columnar joints and fissure zones; qualitative interpreta- tion of Fraser and Karous–Hjelt maps differentiate those zones as linear, elongated and circular anomalous zones. The 2-D tipper inversion of VLF-EM data and resis- tivity imaging had the potential to screen out three anomalous zones of likely resis- tivity contrast: the lava tube body with resistivity over 2500 Ω·m, the fractured zones with resistivity less than 500 Ω·m, and the host vesicular basalt with resistiv- ity of 1500 Ω·m. The strike of lava tubes varied from SW to NE direction with depth less than 20 m and width from 10 to 30 m. Key words: lava tubes, VLF-electromagnetic technique, 2-D VLF-EM inversion, Basaltic plateau, Jordan. 1. INTRODUCTION The lava tubes are found in sites where fluid lavas have flown over the surface. They are formed when lava flows develop a cooled and solidified crust, while the molten
Transcript of Exploration of the extension of two lava tubes, faults and dikes using very low...
Acta Geophysica vol. 56, no. 2, pp. 466-484
DOI: 10.2478/s11600-008-0009-y
© 2008 Institute of Geophysics, Polish Academy of Sciences
Exploration of the extension of two lava tubes, faults and dikes using very low frequency-electromagnetic technique
in NE Jordan
Ahmad AL-OUFI1, Hakam A. MUSTAFA1, Eid AL-TARAZI2, and Jafar ABU RAJAB2
1Department of Earth and Environmental Sciences, Yarmouk University, Irbid, Jordan e-mail: [email protected]
2Faculty of Natural Resources and Environment, Hashemite University, Zarqa, Jordan e-mails: [email protected]; [email protected] (corresponding author)
A b s t r a c t
The very low frequency-electromagnetic (VLF-EM) technique was used to delineate two sub-parallel lava tubes, faults and dikes in Umm El-Quttein area, NE Jordan. The investigation of the lava tubes was conducted through 22 VLF-EM pro-files across lava strike; the length of profiles ranged from 700 to 1700 m. The lava tubes outcrop at two sites: Azzam cave and Al-Howa tunnel, characterized by slightly weathered basalt, columnar joints and fissure zones; qualitative interpreta-tion of Fraser and Karous–Hjelt maps differentiate those zones as linear, elongated and circular anomalous zones. The 2-D tipper inversion of VLF-EM data and resis-tivity imaging had the potential to screen out three anomalous zones of likely resis-tivity contrast: the lava tube body with resistivity over 2500 Ω·m, the fractured zones with resistivity less than 500 Ω·m, and the host vesicular basalt with resistiv-ity of 1500 Ω·m. The strike of lava tubes varied from SW to NE direction with depth less than 20 m and width from 10 to 30 m.
Key words: lava tubes, VLF-electromagnetic technique, 2-D VLF-EM inversion, Basaltic plateau, Jordan.
1. INTRODUCTION
The lava tubes are found in sites where fluid lavas have flown over the surface. They are formed when lava flows develop a cooled and solidified crust, while the molten

EXTENSION OF TWO LAVA TUBES, FAULTS AND DIKES
467
lava continues to flow beneath the surface. When the supply of lava stops at the end of an eruption, lava in the tube system drains down slope and leaves partially empty con-duits beneath the ground (Waltham and Park 2002). They are very interesting features of basaltic lava flows, and have been recognized in many parts of the world, in the western USA, Hawaii the Canary Islands, Italy, Japan, Korea, Kenya, Saudi Arabia and Jordan. The longest known lava tube on Hawaii extends over 52 km (Greeley 1987). Locally, the longest known lava tube in Jordan is Beer Al-Hamam tunnel that extends for 445 m, and lies in the western part of Al- Bishriyya village (Al-Malabeh
Fig. 1. Geological map of the study area, showing the locations of the VLF-EM profiles as semi-rectangular grid shape.
A. AL-OUFI et al. 468
1993). Similarly, six lava tube caves have been discovered in Saudi Arabia on the Har-rat Kishb (Roobol et al. 2002).
In the Umm El-Quttein area of the northeastern parts of Jabal Quis volcano (Fig. 1), a number of structures have been identified as lava tubes. In the present study, two sites of lava tubes were selected for investigation using the VLF-EM tech-niques, namely the Azzam cave and Al-Howa tunnel. The Azzam cave is outcropped in the study area and is expected to be a continuation of the Al-Howa tunnel (Fig. 1). The Al-Howa tunnel outcrop is located in the northeastern part of Jabal Quis volcano, 1.5 km south of the Umm El-Quttein area. This tunnel is one of the best-developed examples in the area. Generally, the investigated area is located between the latitudes 32°16′36″ and 32°18′41″N and the longitudes 36°35′50′′ and 36°36′52′′E (Fig. 1).
The target of this study is to investigate the Azzam cave and Al-Howa tunnel, and their continuation as the last flows of the youngest eruptive phases, adjacent to Jabal Quis volcano, NE Jordan, utilizing VLF electromagnetic method (Fig. 1). Further-more, the extension of the major faults, namely Umm El-Quttein and Quis faults, and the crossed related dikes are considered.
2. VLF–EM THEORETICAL BACKGROUND The very low frequency electromagnetic (VLF-EM) method is a passive geomagnetic method using the radio signals in the frequency range of 15-30 kHz; it is considered as the best reconnaissance method among electromagnetic ones, and is extensively de-scribed in the literature (Paterson and Ronka 1971, Wright 1988, McNeill and Labson 1991). It was primarily applied for mineral exploration and related geological struc-tures (Saydam 1981) and further for detection of water contamination (Benson et al. 1997, Monterio Santos et al. 2006) and well adapted for water exploration related geo-logical structures (Sharma and Baranwal 2005, Monterio Santos et al. 2006, Sundara-rajan et al. 2007). The energy associated with VLF radiation is capable to provide EM wave at distance of thousands of miles from the transmitting stations to the point of measurements. This is because of its relatively low frequency waves that travel as guided waves between the ionosphere and the ground surface.
At this point, the total VLF-EM field is the sum of primary and secondary mag-netic and electric fields, the primary magnetic field being horizontal and oriented at right angle to the line connecting the observation point to the transmitting antenna (Wright 1988), However, the secondary field can be assumed to be arbitrarily ori-ented, the extremely long wave ensures very little attenuation along the path length. If the surface of the earth is considered to be a very perfect conductor, then the signal at the earth surface will be vertically oriented; consequently, the electrical properties of the ground affect the behavior of radio waves (McNeill and Labson 1991). Further-more, at a distance greater than several free-space wavelengths from the transmitter, the local VLF-EM field components can be regarded as vertically incident plane waves (Gharibi and Pedersen 1999).
EXTENSION OF TWO LAVA TUBES, FAULTS AND DIKES
469
A distinction has been made by Parasnis (1986) between VLF-EM prospecting methods monitoring the electric field component of EM wave (E mode) and those monitoring the magnetic components (H mode). The EM-16 is one of the first H mode VLF-EM instruments available.
A review of Paterson and Ronka (1971) concluded that the method is capable of exploration in nonconductive rocks at moderate depth, but is severely limited in con-ductive ground and it is not very sensitive to small resistivity changes in a resistive environment (Chouteau et al. 1996); accordingly, measuring the in-phase components in addition to the out-phase ones increases the accuracy of conductivity survey (Pel-lerin 2002).
In the presence of relatively conductive bodies, the signal emitted by the antenna primary field induces secondary currents in these bodies that in turn will generate sec-ondary field superimposed to the primary one.
The horizontal and vertical components of induced magnetic fields are measured; the real and imaginary anomalies are computed using the expression given by Saydam (1981):
( ) ( )2tan 2 2 / cos /1 /z x z xH H H Hα Φ⎡ ⎤= ± ∆ −⎣ ⎦ , (1)
21sin /( )z xe H H HΦ⎡ ⎤= ∆⎣ ⎦ , (2)
where α is the dip angle, e is the ellipticity, Hz and Hx are the amplitudes, the phase differences are ∆Φ = Φz – Φx , in which Φz is the phase of Hz, and Φx is the phase of Hx
, and H1 is the primary magnetic field, where
sin1 cosei
z xH H HΦ α α∆= + . (3)
The tangent of the tilt angle is a good approximation of the ratio of the real com-ponent (in-phase) of the vertical secondary magnetic field to the horizontal primary field; the ellipticity (out-phase) is a good approximation of the ratio of the quadrature component of the horizontal primary field (Paterson and Ronka 1971); these quantities are called: Real tan 100%α= ∗ , (4)
Imaginary 100%e= ∗ . (5)
3. GEOLOGICAL SETTING
The volcanism in the western part of the Arabian plate has occurred during Oligocene to recent time, and produced several prominent lava flows (called harrats in Arabic), one of which is Harrat Ash Shaam flow (Fig. 2). It is one of the largest alkali-olivine basaltic lava plateaux in the world, and covers an area of about 45,000 km2, that forms approximately 25% of the Arabian harrats (Al-Malabeh 1993). It is stretching over

A. AL-OUFI et al. 470
Fig. 2. The distribution of the Harrat Ash Shaam lava (modified after Barazangi 1983).
about 700 km in NW-SE direction from Syria through Jordan to Saudi Arabia and its parts in these countries are called Harrat Jabal El-Arab in Syria, Harrat El-Jabban in Jordan (11,400 km2), Harrat Al-Hammad and Harrat al Harrah in Saudi Arabia (15,000 km2) (Shah 1986, Al-Malabeh 1989, Otaki 1989) (Fig. 2).
The volcanic fields of Harrat El-Jabban comprise a series of sub-horizontal lava flows less than 25 m thick, numerous scoria cones, extensional faults, and large fissure eruptions that emanated from dikes that strike NW-SE and N-S forming elongated ridges (Guba and Mustafa 1988). The volcanic successions in Harrat El-Jabban are typically composed of pyroclastic rocks, built up chiefly of moderately scoriaceous ejecta, and are mostly of lapilli-size. These volcanoes are distributed in chains that mainly have NNW-SSE or NW-SE directions (Heimbach 1970).
The Umm El-Quttein area is covered by basaltic flows of about 80 km2 (Moffat 1988). The volcanic rocks are mainly composed of pyroclastics, particularly pressure ridges, scoria cones composed of spatter, bombs, lapilli-size scoria and lava flows from which at least one large lava tube has been formed (Fig. 1). Two groups are ex-posed in the study area, the Rimah Group (RH) and Al-Bishriyya Group (BY). Two petrotypes were determined within the study area, the Fahda Formation (FA) and the Hassan/Aritayn Formation (HN) of Harrat El-Jabban.
The basalt flows in the study area are of upper Pleistocene to Holocene age; K-Ar dates give the ages of (1.45-0.1 Ma) (Moffat 1988). The basalt rocks are mostly fresh and have suffered from slight alteration. The rocks have mineralogical assemblages typical for alkali basalts or basanite, with phenocrysts of an assemblage dominated by plagioclase, clinopyroxene, and olivine. In addition, considerable microphenocrysts of
EXTENSION OF TWO LAVA TUBES, FAULTS AND DIKES
471
opaque oxides minerals are found, scattered in a groundmass of olivine, clinopyrox-ene, plagioclase, oxides and glass (Khalil 1991, Al-Malabeh 1994).
4. SURVEY DESIGN AND ACQUISITION
Grid survey
For the purpose of this study, a grid survey work in the field was started by establish-ing profiles, and locating fixed stations on each profile. The baseline was established at southern to northern side of Jebal Quis toward N17°E direction, as parallel as possi-ble to the long axes of the lava tubes. A large survey grid was established in the study area of about 4.2×1.7 km. The survey lines were covered by twenty-two semi-parallel surveying profiles. The profiles cut through the extension of the lava tubes and struc-tural features in 107 direction. The surveying profiles have been separated from each other at a distance of 200 m, and the station interval is 10 m. The average maximum length of each profile ranges from 700 to 1700 m.
VLF-EM survey
The VLF-EM survey is conducted on 22 profiles across the axes of the lava tubes, from T-10 through T-30, and the T-Test profile (Fig. 1). Geonics EM16 instrument was used for the acquisition of polarized primary and induced magnetic fields, in which horizontal primary magnetic field is set perpendicular to the substantial lava strike. This instrument essentially measures the in-phase and out-phase components of the vertical component of the secondary magnetic field, in percentage at the selected frequency of 17.1 kHz of the UMS transmitter station.
5. THE VLF-EM LINEAR FILTERING AND MAPPING
The VLF-EM measured components structurally encompass different nonlinear and harmonic noise arising from different sources (i.e., power line, global lightening, VLF-EM transmitter, earthquake, dust storm and volcanic eruption (Yih Jeng et al. 2007). Therefore, before making VLF-EM data interpretable in 2-D it is essential to apply filtering techniques that will consecutively remove partially biased noise of arti-ficial and geological sources, to enhance the signal-to-noise ratio. The first common filter proposed by Fraser (1969), attenuates long wavelength signals by removing Ny-quist frequency of noise and transforms high gradients (zero crossed data) into peak for enhancing 2-D contouring.
Karous and Hjelt filter (1983) presented another linear filter with coefficients that generates equivalent current density distribution of induced magnetic field; it gener-ates the relative current density at different pseudo depths most likely of five times station interval.
Both filters provide a good preliminary outline of how the target can be resolved semiquantitavely. Ogilvy and Lee (1991) state that, the 2-D current density distribu-
A. AL-OUFI et al. 472
tion provides superior image of anomaly such as mineralized fractures and veins. Most VLF-EM profiles are stacked profiles as maps or pseudo-sections for tracing the anom-aly laterally and vertically. Due to the very powerful filter processing techniques and global, easy-to-use methods, many free online software’s are built for Fraser and Karous-Hjelt filtering of in-phase and out-phase data such as VLFMOD, EMIXVLF, RAMAG, KHFFILT, INV2DVLF, VLFPROS.
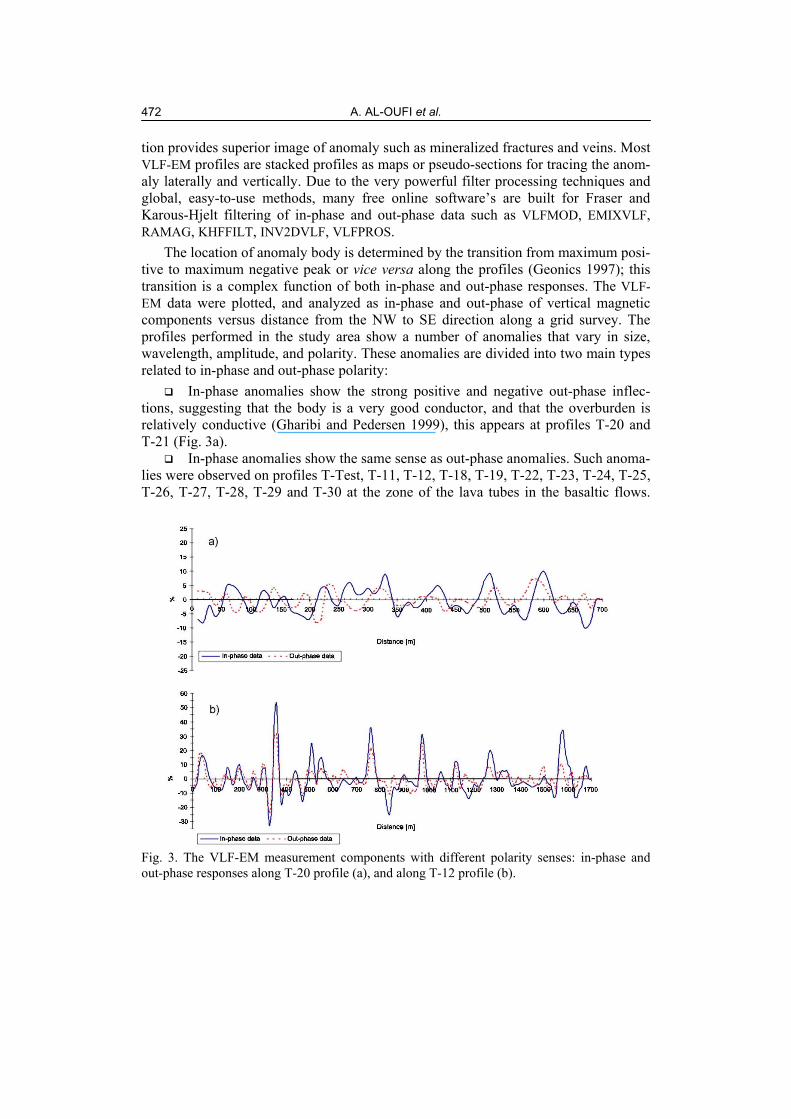
The location of anomaly body is determined by the transition from maximum posi-tive to maximum negative peak or vice versa along the profiles (Geonics 1997); this transition is a complex function of both in-phase and out-phase responses. The VLF-EM data were plotted, and analyzed as in-phase and out-phase of vertical magnetic components versus distance from the NW to SE direction along a grid survey. The profiles performed in the study area show a number of anomalies that vary in size, wavelength, amplitude, and polarity. These anomalies are divided into two main types related to in-phase and out-phase polarity:
In-phase anomalies show the strong positive and negative out-phase inflec-tions, suggesting that the body is a very good conductor, and that the overburden is relatively conductive (Gharibi and Pedersen 1999), this appears at profiles T-20 and T-21 (Fig. 3a).
In-phase anomalies show the same sense as out-phase anomalies. Such anoma-lies were observed on profiles T-Test, T-11, T-12, T-18, T-19, T-22, T-23, T-24, T-25, T-26, T-27, T-28, T-29 and T-30 at the zone of the lava tubes in the basaltic flows.
Fig. 3. The VLF-EM measurement components with different polarity senses: in-phase andout-phase responses along T-20 profile (a), and along T-12 profile (b).
EXTENSION OF TWO LAVA TUBES, FAULTS AND DIKES
473
Such anomalies are interpreted to be very poor conductors, and this may be because of the overburden sediments (Fig. 3b).
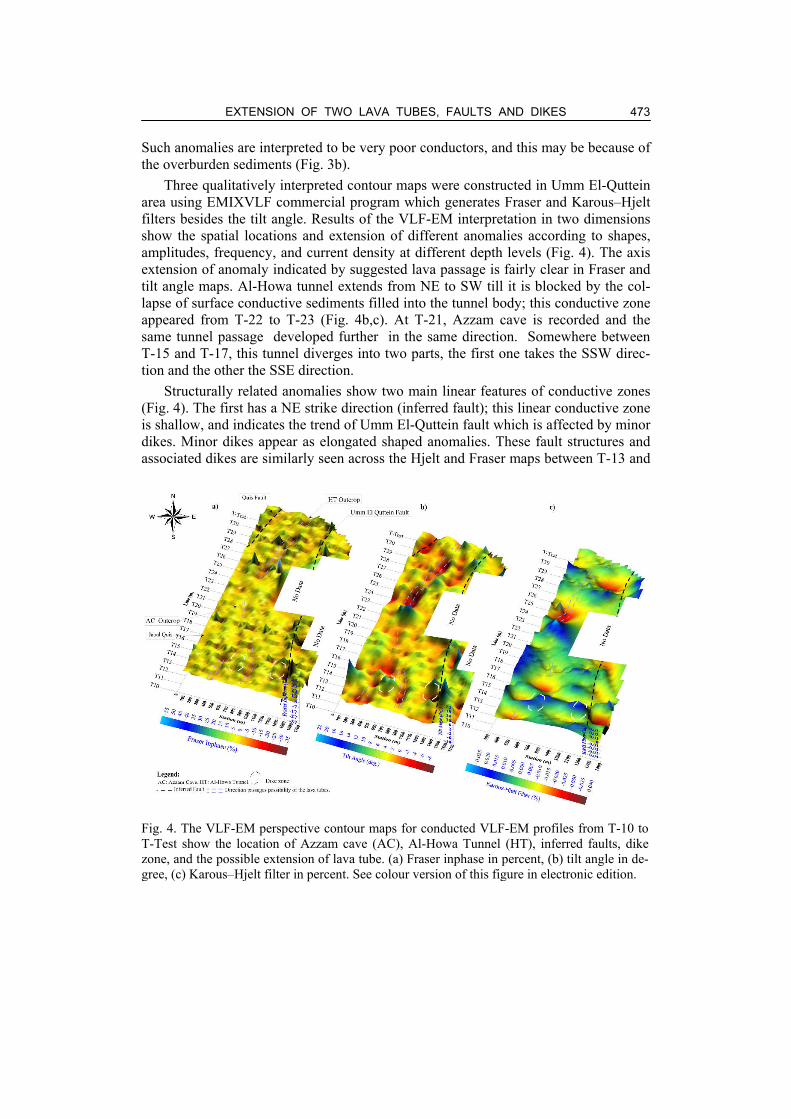
Three qualitatively interpreted contour maps were constructed in Umm El-Quttein area using EMIXVLF commercial program which generates Fraser and Karous–Hjelt filters besides the tilt angle. Results of the VLF-EM interpretation in two dimensions show the spatial locations and extension of different anomalies according to shapes, amplitudes, frequency, and current density at different depth levels (Fig. 4). The axis extension of anomaly indicated by suggested lava passage is fairly clear in Fraser and tilt angle maps. Al-Howa tunnel extends from NE to SW till it is blocked by the col-lapse of surface conductive sediments filled into the tunnel body; this conductive zone appeared from T-22 to T-23 (Fig. 4b,c). At T-21, Azzam cave is recorded and the same tunnel passage developed further in the same direction. Somewhere between T-15 and T-17, this tunnel diverges into two parts, the first one takes the SSW direc-tion and the other the SSE direction.
Structurally related anomalies show two main linear features of conductive zones (Fig. 4). The first has a NE strike direction (inferred fault); this linear conductive zone is shallow, and indicates the trend of Umm El-Quttein fault which is affected by minor dikes. Minor dikes appear as elongated shaped anomalies. These fault structures and associated dikes are similarly seen across the Hjelt and Fraser maps between T-13 and
Fig. 4. The VLF-EM perspective contour maps for conducted VLF-EM profiles from T-10 toT-Test show the location of Azzam cave (AC), Al-Howa Tunnel (HT), inferred faults, dikezone, and the possible extension of lava tube. (a) Fraser inphase in percent, (b) tilt angle in de-gree, (c) Karous–Hjelt filter in percent. See colour version of this figure in electronic edition.
A. AL-OUFI et al. 474
T-14 (Fig. 4a,c). The inferred Quis fault is also traced by Fraser map (Fig. 4a), it is re-corded from T-28 to T-test of the northwest direction of the study area by positive anomalies.
The literature related to the geological structure of Al-Hamidiyya area located 5 km south of the study area indicates that the faults and lineaments in the area have a NE-SW and NNW-SSE directions (Tarawneh 1996). These trends coincide with those shown by Quis and Umm El-Quttein faults. Accordingly, Quis and Umm El-Quttein faults are interpreted as shallow faults with major normal mechanism and minor strike-slip movements.
6. 2-D INVERSION OF VLF-EM DATA Owing to the low to moderate conductivity of the surface layer and underlying rocks, the incident energy is absorbed, and the amplitude of the waves decreases exponen-tially in traversing the conductors, due to absorption alone (Parasnis 1971). Therefore, the skin depth or effective depth of penetration of this method is fairly shallow to moderate, because of the inverse dependence upon frequency and conductivity (Sher-iff 1991).
The overburden resistivity at profile T-Test was measured by using the Syscal R1 resistivitymeter. The effective depth of penetration was determined and ranged between 21 to 116 m of corresponding 44 Ω·m over conductive overburden and 1400 Ω·m over basaltic flows as one goes from NW towards SE along T-test profile.
For several years, papers dealing with inversion approache of 1-D and 2-D EM plane wave have been published by many researchers (Kaikkonen and Sharma 1998, Gharibi and Pedersen 1999, Beamish 2000, Siripunvaraporn and Egbert 2000, Baran-wal et al. 2005, Monterio Santos et al. 2006). Of these, code developed by Monterio Santos et al. (2006), which concern the quantitative interpretation of single frequency VLF-EM. Assuming a 2-D subsurface resistivity distribution at different points of measurement sites, one can define a scalar tipper B given by Hz = B Hy , where Hz is the vertical induced magnetic field and Hy is the primary magnetic field.
The tipper quantity only exists over inhomogeneous layered earth which is origi-nated by the time lag between horizontal and vertical components of the magnetic field as a result of electromagnetic induction.
The program is based on forward solution using the finite-element method, and the inversion of data is done depending on regularized smoothness-constrained least-squared approach to fit resistivity response data to the inverted in-phase and out-phase secondary magnetic field input data. Accordingly, the regularized inverted VLF-EM tipper data are a good approximation of subsurface resistivity distribution with sensi-tivity constrains in both directions.
The adapted code was applied to all VLF-EM profiles, using host half-space resis-tivity of 1400 Ω·m; this value is the average background resistivity value for Fahda vesicular basalt formation and some superimposed lava sheets. The geological field
EXTENSION OF TWO LAVA TUBES, FAULTS AND DIKES
475
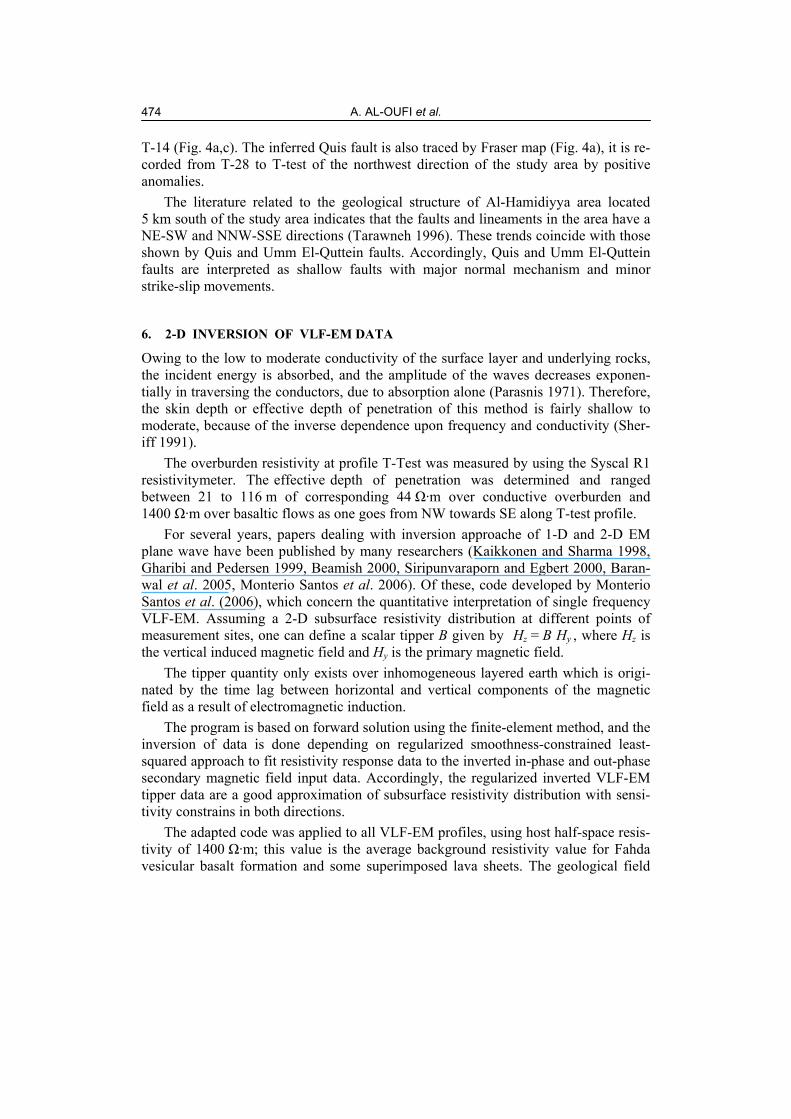
investigation shows a large amount of soil and alluvium deposits accumulated within lava tube through surface collapse features and other related fracture zones near lava tube. Those zones with highly fractured basalt besides faults and dikes provide a rea-sonable resistivity contrast from lava tube body. T-24 was selected as a representative profile for the others to make a 2-D inversion analysis. The inverted VLF-EM resistiv-ity section for T-24 provides a strong resistivity contrast among two anomalous zones within 1400 Ω·m half-space resistivity (Fig. 5). The first zone is likely to reflect lava
Fig. 5. The VLF-EM response along major anomaly of T-24 profile. (a) Observed and invertedin-phase and out-phase components; (b) 2-D resistivity model from inverted VLF-EM data;(c) Three different anomalies distinguished at the study area. Less than 500 Ω·m of highly frac-tured zone filled with conductive sediments; 1500 Ω·m is the Fahda vesicular basalt rock resis-tivity; more than 2500 is the resistivity of lava tube body. See colour version of this figure inelectronic edition.

A. AL-OUFI et al. 476
tube body of 30 m width with resistivity over 2500 Ω·m; the lava tube depth is recog-nized at depth less than 20 m. The second zone reflects a substantial low resistivity fracture zone less than 500 Ω·m and the depth less than 20 m; the resistivity ratio con-trast of lava tube and host rock to the fracture zone is close to 5:3:1; statistically, the observed and inverted VLF-EM data show a reasonable curve fitting with error equal to 2.7%; this value is based on absolute difference between the observed data and the inverted model response according to the following formula:
1/ 22
obsError % 1/ (observed data calculated data)N⎡ ⎤= −⎣ ⎦∑ , (6)
Nobs depicts the number of observed data.
Resistivity imaging and inverted VLF-EM data
Detecting and mapping of voids, caves or tunnels in the resistive environment using inductive electromagnetic methods is very complicated and was too difficult to many researchers. The problem becomes easier if the highly resistive target is filled with conductive materials and if there is a substantial resistivity contrast (Pellerin 2002, Oskooi and Pedersen 2006) or the host rocks are highly jointed and fractured with high resistivity contrast. Frequently the integration with other methods may solve the problem and reveal the target. Zlotnicki et al. (2006) used VLF-EM and SP method to recognize the superficial electrical resistive and conductive zones as well as the cavi-ties of an active volcano. Oskooi and Pedersen (2005) used both inverted resistivity models from VLF-EM and RMT methods to resolve lateral and vertical geometry of conductive clay lenses from underlying resistive sandstone followed by high basement layers. El-Behiry and Hanafy (2000) used seismic, GPR and resistivity methods to lo-cate sinkholes of active karsts. Sogade et al. (1999) conjugate the loop-loop electro-magnetic system with laboratory test for cave mapping.
One of the newest developments in recent years in electrical method is the use of 2-D electrical imaging surveys to map areas of sinkhole and geological caves; Fancsik and Nyari (1999) interpreted electrical data using deconvolution filtering for cavity detection; Roth et al. (1999) used multi-electrode resistivity on thin mantled karst in fractured carbonate bedrock.
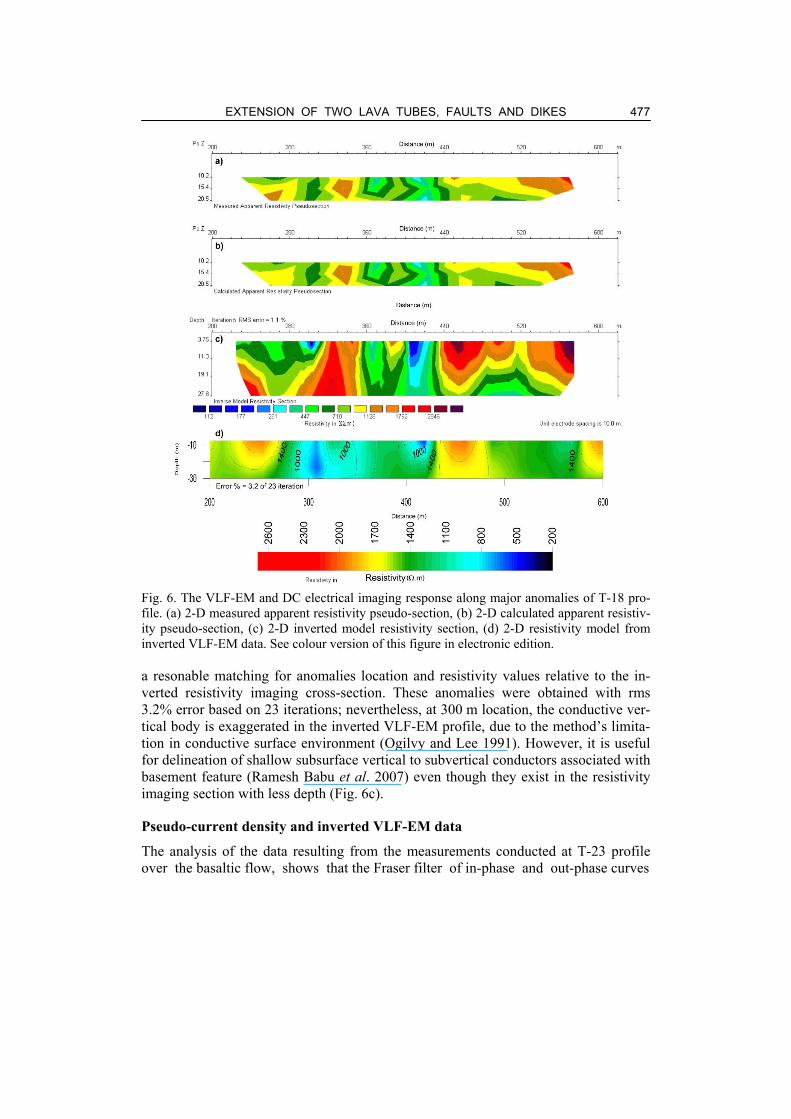
In order to show the validity of computed resistivity from inverted VLF-EM data, 2-D electrical imaging was tested for T-18 using Wenner array with electrode spacing of 10 m and profile of about 400 m length; the resistivity survey was conducted using Syscal R1 resistivitymeter. The profile extension thoroughly covers the probable lava tube position, the fractured host rock of vesicular basalt and fractured surface layer was filled with soil and alluvium sediment (Fig. 6a,b,c). The result of 2-D resistivity imaging is based on 5 iterations and rms is less than 1.1 (Fig. 6c), the inverted imaging model pinpoints the position of lava tube between 440 to 480 m with resistivity over 2200 Ω·m with the corresponding depth of less than 20 m. One interesting anomaly is found between 400 and 420 m, this conductive fractured zone reflects collapse near lava tube with soil and alluvium resistivity less than 300 Ω·m. Apparently, the in-verted VLF-EM data model for T-18 at the same horizontal spacing (Fig. 6d) shows
EXTENSION OF TWO LAVA TUBES, FAULTS AND DIKES
477
Fig. 6. The VLF-EM and DC electrical imaging response along major anomalies of T-18 pro-file. (a) 2-D measured apparent resistivity pseudo-section, (b) 2-D calculated apparent resistiv-ity pseudo-section, (c) 2-D inverted model resistivity section, (d) 2-D resistivity model from inverted VLF-EM data. See colour version of this figure in electronic edition.
a resonable matching for anomalies location and resistivity values relative to the in-verted resistivity imaging cross-section. These anomalies were obtained with rms 3.2% error based on 23 iterations; nevertheless, at 300 m location, the conductive ver-tical body is exaggerated in the inverted VLF-EM profile, due to the method’s limita-tion in conductive surface environment (Ogilvy and Lee 1991). However, it is useful for delineation of shallow subsurface vertical to subvertical conductors associated with basement feature (Ramesh Babu et al. 2007) even though they exist in the resistivity imaging section with less depth (Fig. 6c).
Pseudo-current density and inverted VLF-EM data
The analysis of the data resulting from the measurements conducted at T-23 profile over the basaltic flow, shows that the Fraser filter of in-phase and out-phase curves

A. AL-OUFI et al. 478
Fig. 7. The VLF-EM response along major anomalies of T-23. (a) Fraser filter and relative conductivity of in-phase and out-phase observed data, (b) 2-D resistivity model from inverted VLF-EM data, (c) Karous–Hjelt filter of in-phase and out-phase observed data. See colour ver-sion of this figure in electronic edition.
seems to follow the same sense, which suggests the highly resistive materials covered by fair conductive sediment. The aspect of these surface conductive anomalies reveal surface conductive sediments within subvertical fractured rocks (Fig. 7a). The inverted VLF-EM section (Fig. 7b) shows that these anomalies are characterized by resistivity less than 700 Ω·m. Furthermore, an exclusive high resistive body of more than 2500 Ω·m was found between 360 and 400 m, which indicates the existence of lava tube body. The depicted relative conductivity curve based on Relacon filter (McNeill
EXTENSION OF TWO LAVA TUBES, FAULTS AND DIKES
479
1991) decreases approaching the lava tube body and increases away from it; this fact reveals the highest resistivity body within half space host rock.
The inverted VLF-EM data and Hjelt current density pseudo-section (Fig. 7b,c) computed for T-18 support the reliability of measured and inverted VLF-EM data. The current density pseudo-section (Fig. 7c) provides a priori information regarding the number, size, depth of conductive and resistive bodies. A highly resistive body was recognized between 360 and 400 m with depth less than 20 m of negative current den-sity less than –0.12%. On the contrary, the low resistivity distributions merely reflect a high positive current density more than 0.12% (Fig. 7b) (Benson et al. 1997).
7. DISCUSSION AND CONCLUSIONS
This study reveals two sites of the lava tubes (Azzam cave and Al-Howa tunnel) which were investigated using VLF-EM technique in Umm El-Quttein area, NE Jor-dan. Each site of the lava tubes has unique characteristics with regard to the geophysi-cal parameters.
The VLF-EM contour maps are interpreted using tilt angle map and Fraser and Karous–Hjelt filter maps (Fig. 4). The near surface response of integrated filtered measurements recognized three zones of anomalies, according to their shapes, ampli-tudes, frequency, and current density at different depth levels.
The first linear anomalies correspond to faults structures appearing NW and SE of the study area and were interpreted as Quis and Umm el Quttein faults, respectively. The second circular to elongated anomalies corresponds to dike structures confirmed by Fraser. Tilt angle maps and field investigation (Fig. 4a,b).
The collapse of Al-Howa tunnel is characterized by less than –1% in-phase verti-cal magnetic component. This anomaly coincides with the tilt angle, and Karous–Hjelt filter maps (Fig. 4a,b,c). The extension of Al- Howa tunnel has relative spatial varia-tions and is characterized by less than –7% in-phase vertical magnetic component. These anomalies also coincide with a tilt angle, and Karous and Hjelt filter and indi-cate a clear continuation of the axis extension of Al-Howa tunnel in the NE-SW direc-tion.
The previously mentioned Karous and Hjelt pseudo-sections and VLF-EM filtered maps show that the axis of extension of Al-Howa tunnel was thoroughly affected by high-conductivity anomalies. These anomalies were interpreted as sediments depos-ited inside the tunnel flows across the profiles T-Test, T-30, T-29, T-28, T-22, T-23 and T-18 (Figs. 6 and 7). The collapse of Azzam cave is characterized by low (–4%) in-phase vertical magnetic component (see the middle map of Fig. 4a).
The quantitative interpretation of VLF-EM tipper data was applied to all profiles taking Fahda vesicular basalt as host rock with resistivity close to 1400 Ω·m. The VLF-EM data inverted into resistivity depth sections show low error misfit of less than 5%. They show some sort of consistency and compatibility with resistivity imag-ing (Fig. 6) and with Karous–Hjelt pseudo-section (Fig. 7).
A. AL-OUFI et al. 480
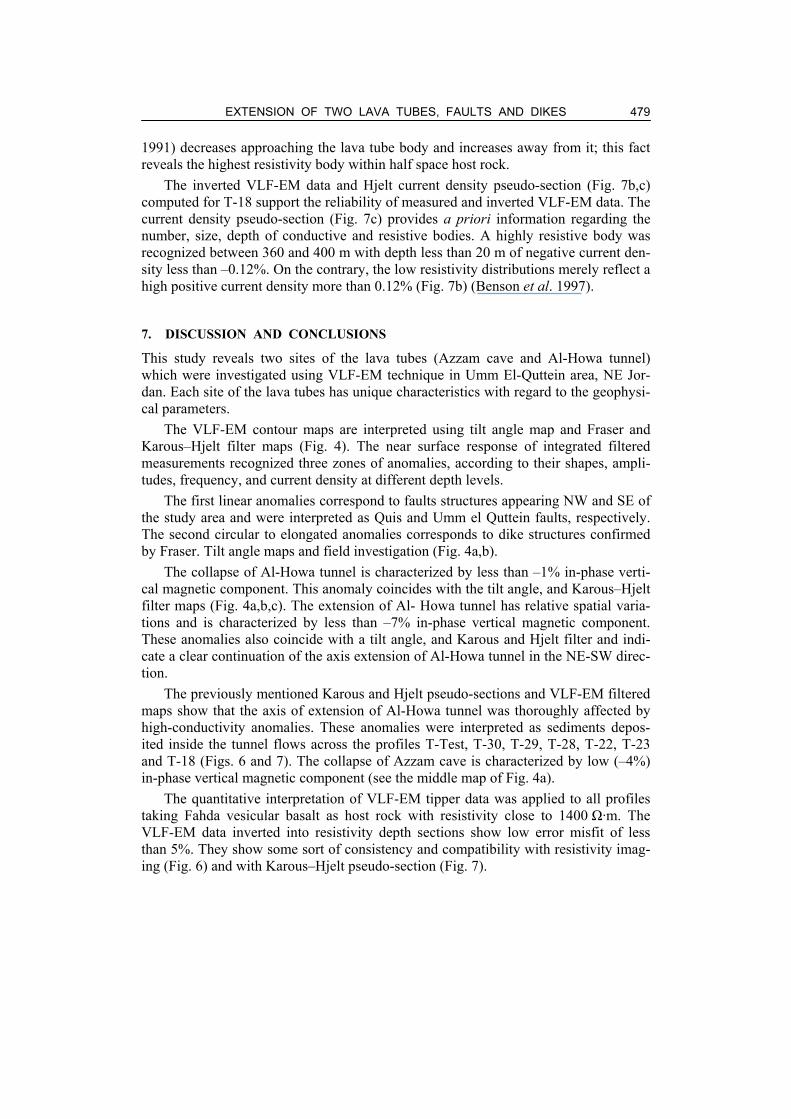
Fig. 8. The 2-D resistivity models obtained by the inversion of VLF-EM data. The selected profiles indicate the direction of lava tube (the resistivity ρ > 2500 Ω·m), fracture conductive zone (ρ < 500 Ω·m), and Fahda vesicular basalt (ρ = 1500 Ω·m). See colour version of this fig-ure in electronic edition.
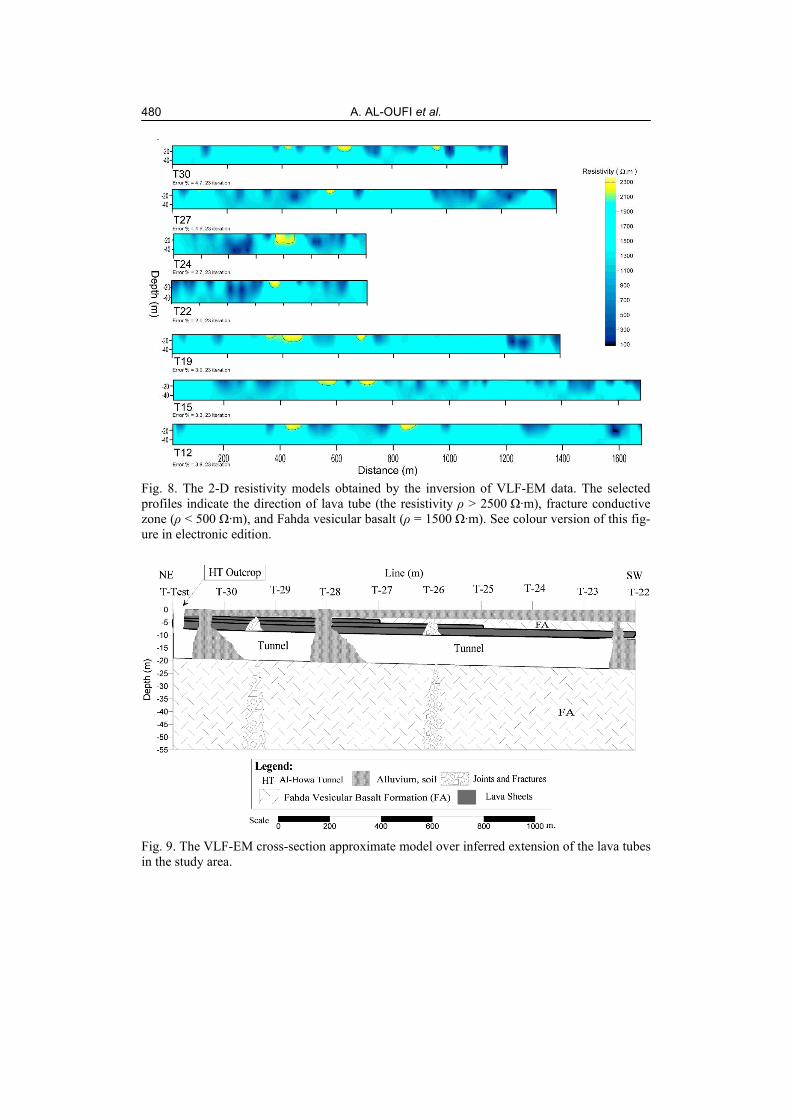
Fig. 9. The VLF-EM cross-section approximate model over inferred extension of the lava tubes in the study area.
EXTENSION OF TWO LAVA TUBES, FAULTS AND DIKES
481
Most inverted profiles screen out two different geological structures, the first is the lava tube with resistivity over 2500 Ω·m (Fig. 5). The result of stack inverted resistiv-ity sections had outlined the spatial extension of lava tube entirely (Fig. 8), with depth less than 20 m and the width varying from T-10 to T-Test. Somewhere between T-15 and T-17 (Figs. 4 and 8), the lava tube diverges into two routes striking to the SSW and SSE directions. The second structure is divided into two anomalies of conductive zones, the first one is close to lava tube anomalies with resistivity ρ less than 500 Ω·m. Those anomalies appear in most profiles as vertical to subvertical fractured zones of soil and conductive sediment (i.e., T-22 and T-24 of Fig. 8). The second conductive anomaly is farther away from the lava tube body, with resistivity less than 500 Ω·m. Both of them reflect faults and other fractured zones in the study area (i.e., at a dis-tance less than 200 m of T-30, which reveals Quis fault; the second fault is the Umm El Quttein fault between 1300 and 1400 m on T-12; see Fig. 8).
Also the result of the VLF-EM model in the Umm El-Quttein area obtained from field investigation and VLF-EM survey (Fig. 9) shows a detail approximated model over local anomalies that interrupted the continuation of lava tube within Fahda basalt. Furthermore, the resulting model shows evidences of surface collapses and fractured zones.
Acknowledgemen t . The authors are indebted to Yarmouk University for fund-ing this research (Project 2004/1) and for the Hashemite University for supplying the geophysical instruments. The field guide of Ahmad Al-Malabeh from the Hashemite University is highly appreciated for the help in proposing the continuation of the tun-nel. We extend our gratitude to the Associate Editor Klaus Spitzer and the two anony-mous referees for valuable comments and critical suggestions. We are grateful to Monterio Santos for providing the 2-D inversion code and unlimited assistance in processing and developing the code for long VLF-EM profiles.
R e f e r e n c e s
Al-Malabeh, A. (1989), The volcanic succession of Jebal Aritain volcano, NE Jordan: A field, petrographic and geochemical study, M.Sc. Thesis, Yarmouk University, Irbid-Jordan, 182 pp. (unpublished).
Al-Malabeh, A. (1993), The volcanology, mineralogy, and geochemistry of selected pyroclas-tic cones from NE Jordan and their evaluation for possible industrial applications, Ph.D. Thesis, Universitaett Erlangen, Nurnberg-Germany, 300 pp. (unpublished).
Al-Malabeh, A. (1994), Geochemistry of two volcanic cones from the intracontinental plateau basalt of Harra El Jabban, NE-Jordan, Geochem. J. 28, 517-540.
Baranwal, V.C., A. Franke, R.-U. Börner, K. Spitzer, and S.P Sharma (2005), 2D inversion for plane wave EM methods using an adaptive unstructured grid finite element approach, formulation, calculation of sensitivities and first results. In: Protokollband Kollo-quium Elektromagnetische Tiefenforschung, Haus Wohldenberg, Holle, ISSN 0946-7467, 164-172.

A. AL-OUFI et al. 482
Barazangi, M. (1983), A summary of the seimotectonics of the Arab region. In: K. Cidlinsky and M. Rouhban (eds.), Assessment and Mitigation of Earthquake Risk in the Arab Region, 43-58, UNESCO, France.
Beamish, D. (2000), Quantitative 2D VLF data interpretation, J. Appl. Geophys. 45, 33-47. Benson, A.K., K.L. Payne, and M.A. Stubben (1997), Mapping groundwater contamination us-
ing DC resistivity and VLF geophysical methods-a case study, Geophysics 62, 80-86. Chouteau, M., P. Zhang, and D. Chapellier (1996), Computation of apparent resistivity profiles
from VLF-EM data using linear filter, Geophys. Prospect. 44, 215-232. El-Behiry, M., and S. Hanafy (2000), Geophysical surveys to map the vertical extension of
sinkhole, a comparison study, Proc. SAGEEP 1999, Washington D.C., 341-350. Fancsik, T., and Z. Nyari (1999), Processing of geoelectric cavity detection data using decon-
volution filtering method, Proc. EAGE 61st Conf. Technical Exhibition, Helsinki, Finland.
Fraser, D.C. (1969), Contouring of VLF-EM data, Geophysics 34, 958-967. Geonics Ltd (1997), Operating Manual for EM 16VLF, Mississauga, Ontario, Canada. Gharibi, M., and L.B. Pedersen (1999), Transformation of VLF data into apparent resistivities
and phases, Geophysics 64, 1393-1402. Greeley, R. (1987), The role of lava tubes in Hawaiian volcanoes, US Geol. Surv. Prof. Pap.
1350, 2, 1589-1602. Guba, I., and H. Mustafa (1988), Structural control of young basaltic fissure eruptions in the
plateau basalt area of the Arabian Plate, Northeastern Jordan, J. Volcanol. Geoth. Res. 35, 319-334.
Heimbach, W. (1970), Zur Geologie Nordost-Jordaniens, Geol. Jahrb. 88, 265-288. Kaikkonen, P., and S.P. Sharma (1998), 2-D nonlinear joint inversion of VLF and VLF-R data
using simulated annealing, J. Appl. Geophys. 39, 155-176. Karous, M., and S.E. Hjelt (1983), Linear filtering of VLF dip-angle measurements, Geophys.
Prospect. 31, 782-794. Khalil, I. (1991), Geochemische und petrographische untersuchungen an Tertiaren bis Quarta-
ren kontinintalen intraplattenbassalten Nordost-Jordaien, Ph.D. Thesis, der Techni- schen Universitat Clausthal, Germany, 119 pp.
McNeill, J.D. (1991), Relacon. A VLF magnetic field “Relative Conductivity” Filter, TN-26, Geonic Ltd.
McNeill, J.D., and V.F. Labson (1991), Geological mapping using VLF radio fields. In: M.C. Nabighian (ed.), Geotechnical and Environmental Geophysics, Review and Tutorial, Society of Exploration, Tulsa, Vol. 1, 191-218.
Moffat, D.T. (1988), A volcanotectonic analysis of the Cenozoic continental basalts of northern Jordan; implications for hydrocarbon prospecting in the block B area, ERI Jordan EJ88-1, 73 pp.
Monteiro Santos, F.A., A. Mateus, J. Figueiras, and M.A. Gonçalves (2006), Mapping ground-water contamination around a landfill facility using the VLF-EM method – a case study, J. Appl. Geophys. 60, 115-125.
Ogilvy, R.D., and A.C. Lee (1991), Interpretation of VLF-EM in-phase data using current den-sity pseudo-sections, Geophys. Prospect. 39, 567-580.
EXTENSION OF TWO LAVA TUBES, FAULTS AND DIKES
483
Oskooi, B., and L.B. Pedersen (2005), Comparison between VLF and RMT methods. A com-bined tool for mapping conductivity changes in the sedimentary cover, J. Appl. Geo-phys. 57, 227-241.
Oskooi, B., and L.B. Pedersen (2006), Resolution of airborne VLF data, J. Appl. Geophys. 58, 158-175.
Otaki, M. (1989), Geology of Jebal Al-Arab, Syrian Geol. Mag. 4, 35-40 (in Arabic). Parasnis, D.S. (1986), Principles of Applied Geophysics, 4th ed., Chapman and Hall, London. Paterson, N.R., and V. Ronka (1971), Five years of surveying with the very low frequency-
electro magnetics method, Geoexploration 9, 7-26. Pellerin, L. (2002), Application of electrical and electromagnetic methods for environmental
and geotechnical investigations, Surv. Geophys. 23, 101-132. Ramesh Babu, V., Subhash Ram, and N. Sundararajan (2007), Modeling and inversion of mag-
netic and VLF-EM data with an application to basement fractures: A case study from Raigarh, India, Geophysics 72, 133-140.
Roobol, M.J., J.J. Pint, M.A. Al-Shanti, A.J. Al-Juaid, S.A. Al-Amoudi, and S. Pint, with the collaboration of A.M. Al-Eisa, F. Allam, G.S. Al-Sulaimani, and A.S. Banakhar (2002), Preliminary survey for lava-tube caves on Harrat Kishb, Kingdom of Saudi Arabia, Saudi Geological Survey Open-File Report SGS-OF-2002-3, 35 pp.
Roth, M., J. Mackey, and J. Nyquist (1999), A case study of the use of multi-electrode earth re-sistivity in thinly mantled karst, Proc. SAGEEP 1999, Okland, CA, 293-302.
Saydam, A.S. (1981), Very low-frequency electromagnetic interpretation using tilt angle and ellipticity measurements, Geophysics 46, 1594-1605.
Shah, S.M. (1986), Geology, petrography and geochemistry of the volcanic rocks of the Turyf-Wadi As-Sirhan area, northwestern Saudi Arabia, M.Sc. Thesis, University of Petro-leum and Minerals, Dept. Earth Sciences (Geology), Dharan, 145 pp. (unpublished).
Sharma, S.P, and V.C. Baranwal (2005), Delineation of groundwater bearing fracture zones in a hard rock area integrating very low frequency electromagnetic and resistivity data, J. Appl. Geophys. 57, 155-166.
Sheriff, R.E. (1991), Encyclopedic Dictionary of Exploration Geophysics, Soc. Exploration Geophys. (SEG), 376 pp.
Siripunvaraporn, W., and G. Egbert (2000), An efficient data-subsurface inversion method for 2-D magnetotelluric data, Geophysics 65, 791-803.
Sogade, J., Y. Vichabian, A. Vandiver, P. Reppert, and F. Morgan (1999), Electromagnetic cave-to-surface mapping system, Proc. SAGEEP 1999, Okland, CA, 481-486.
Sundararajan, N., M. Narasimhachary, G. Nandakumar, and Y. Srinivas (2007), VES and VLF an application to ground water exploration, Khammam, India, The Leading Edge, 708-716.
Tarawneh, K. (1996), The Geology of Al Hamidiyya (Al-Hababiyya) Area, Map Sheet No. 3354-11, NRA, Geol. Dir., Map. Div., Amman.
Waltham, A.C., and H.D. Park (2002), Road over lava tubes in Cheju Island, South Korea, Eng. Geol. 66, 53-64.
Wright, J.L. (1988), VLF interpretation manual, EDA Instrument, Toronto, Ontario, Canada.

A. AL-OUFI et al. 484
Yih Jeng, Ming-Juin Lin, Chih-Sung Chen, and Yu-Huai Wang (2007), Noise reduction and data recovery for a VLF-EM survey using a nonlinear decomposition method, Geo-physics 72, 223-235.
Zlotnicki, J., G. Vargemezis, A. Mille, F. Bruère, and G. Hammouya (2006), State of the hydrothermal activity of Soufrie` re of Guadeloupe volcano inferred by VLF surveys, J. Appl. Geophys. 58, 265-279.
Received 19 April 2007 Accepted 24 January 2008